Report - s3. · PDF fileElectricity Sale/Lease Proceeds Account ... Police Department –...
366
[P.P. 4 S O U T H A U S T R A L I A _____________________ Report of the Auditor-General for the Year ended 30 June 2000 ______________________________________________________________ Tabled in the House of Assembly and ordered to be published, 4 October 2000 ______________________________________________________________ Fourth Session, Forty-Ninth Parliament PART B Volume III By Authority: M. G. O’Callaghan, Government Printer, South Australia _____________________________________________ 2000
Transcript of Report - s3. · PDF fileElectricity Sale/Lease Proceeds Account ... Police Department –...
[P.P. 4
S O U T H A U S T R A L I A
_____________________
Report
of the
Auditor-General
for the
Year ended 30 June 2000
______________________________________________________________
Tabled in the House of Assembly and ordered to be published, 4 October 2000 ______________________________________________________________
Fourth Session, Forty-Ninth Parliament
PART B
Volume III
By Authority: M. G. O’Callaghan, Government Printer, South Australia _____________________________________________
2000


Report of the Auditor-General 1999-2000
TABLE OF CONTENTS TO VOLUMES I, II AND III
VOLUME I
Page
Accounts of Public Authorities................................................................................................................................ 1
MINISTER FOR GOVERNMENT ENTERPRISES; MINISTER FOR INFORMATION ECONOMY; MINISTER FOR ADMINISTRATIVE AND INFORMATION SERVICES; MINISTER FOR WORKPLACE RELATIONS
PORTFOLIO – ADMINISTRATIVE AND INFORMATION SERVICES ................................................................. 3
Department for Administrative and Information Services....................................................................................... 5
Industrial and Commercial Premises Corporation................................................................................................ 43
Land Management Corporation............................................................................................................................ 51
Lotteries Commission of South Australia ............................................................................................................. 69
South Australian Ports Corporation...................................................................................................................... 88
South Australian Totalizator Agency Board........................................................................................................ 101
South Australian Water Corporation................................................................................................................... 117
State Supply Board............................................................................................................................................. 142
MINISTER FOR EDUCATION AND CHILDREN’S SERVICES; MINISTER FOR EMPLOYMENT AND TRAINING; MINISTER FOR YOUTH
PORTFOLIO – EDUCATION, TRAINING AND EMPLOYMENT ...................................................................... 149
Construction Industry Training Board................................................................................................................. 151
Department of Education, Training and Employment ........................................................................................ 159
Flinders University of South Australia ................................................................................................................ 188
University of Adelaide......................................................................................................................................... 208
University of South Australia .............................................................................................................................. 235
MINISTER FOR ENVIRONMENT AND HERITAGE; MINISTER FOR RECREATION, SPORT AND RACING
PORTFOLIO – ENVIRONMENT AND HERITAGE ........................................................................................... 255
Department for Environment and Heritage......................................................................................................... 257

Report of the Auditor-General 1999-2000
TABLE OF CONTENTS TO VOLUMES I, II AND III
VOLUME I
Page MINISTER FOR HUMAN SERVICES; MINISTER FOR DISABILITY SERVICES; MINISTER FOR THE AGEING
PORTFOLIO – HUMAN SERVICES...................................................................................................................281
HomeStart Finance..............................................................................................................................................283
Department of Human Services ..........................................................................................................................299
Institute of Medical and Veterinary Science ........................................................................................................315
South Australian Aboriginal Housing Authority ...................................................................................................329
South Australian Community Housing Authority .................................................................................................341
South Australian Health Commission and Associated Activities.........................................................................354
South Australian Housing Trust...........................................................................................................................381
VOLUME II
MINISTER FOR INDUSTRY AND TRADE
PORTFOLIO – INDUSTRY AND TRADE...........................................................................................................403
Department of Industry and Trade ......................................................................................................................405
ATTORNEY-GENERAL; MINISTER FOR CONSUMER AFFAIRS; MINISTER FOR JUSTICE; MINISTER FOR POLICE, CORRECTIONAL SERVICES AND EMERGENCY SERVICES
PORTFOLIO – JUSTICE ....................................................................................................................................419
Department of Justice .........................................................................................................................................421
Attorney-General’s Department...........................................................................................................................423 Public Trustee Services ...................................................................................................................................450
Department for Correctional Services .................................................................................................................479 Justice Information System Services...............................................................................................................493
Country Fire Service Board .................................................................................................................................498
Courts Administration Authority...........................................................................................................................500
Emergency Services Administrative Unit ............................................................................................................515
Legal Services Commission ................................................................................................................................517
Police Department ...............................................................................................................................................527
SA St John Ambulance Service Inc.....................................................................................................................542
South Australian Metropolitan Fire Service.........................................................................................................556
South Australian Office of Financial Supervision ................................................................................................558
State Electoral Office...........................................................................................................................................564

Report of the Auditor-General 1999-2000
TABLE OF CONTENTS TO VOLUMES I, II AND III
VOLUME II
Page
PREMIER; MINISTER FOR MULTICULTURAL AFFAIRS; MINISTER FOR STATE DEVELOPMENT; MINISTER FOR TOURISM
PORTFOLIO – PREMIER AND CABINET ........................................................................................................ 571
Adelaide Convention Centre .............................................................................................................................. 573
Adelaide Entertainments Corporation ................................................................................................................ 586
Auditor-General’s Department............................................................................................................................ 595
Department of the Premier and Cabinet............................................................................................................. 602 Targeted Voluntary Separation Package (TVSP) Scheme............................................................................. 614 Government Workers Rehabilitation and Compensation Fund ...................................................................... 618
Seventh Australian Masters Games Corporation............................................................................................... 624
South Australian Motor Sport Board................................................................................................................... 631
South Australian Tourism Commission .............................................................................................................. 639
DEPUTY PREMIER; MINISTER ASSISTING THE DEPUTY PREMIER; MINISTER FOR MINERALS AND ENERGY; MINISTER FOR PRIMARY INDUSTRIES AND RESOURCES; MINISTER FOR REGIONAL
DEVELOPMENT
PORTFOLIO – PRIMARY INDUSTRIES AND RESOURCES .......................................................................... 651
Department of Primary Industries and Resources ............................................................................................. 653
MINISTER FOR TRANSPORT AND URBAN PLANNING; MINISTER FOR ABORIGINAL AFFAIRS; MINISTER FOR LOCAL GOVERNMENT; MINISTER FOR THE ARTS; MINISTER FOR THE STATUS OF WOMEN
PORTFOLIO – TRANSPORT, URBAN PLANNING AND THE ARTS ............................................................. 677
Adelaide Festival Corporation ............................................................................................................................ 679
Adelaide Festival Centre Trust ........................................................................................................................... 686
Art Gallery Board ................................................................................................................................................ 699
Department for Transport, Urban Planning and the Arts.................................................................................... 709
History Trust of South Australia.......................................................................................................................... 733
Libraries Board of South Australia...................................................................................................................... 742
Local Government Finance Authority of South Australia ................................................................................... 753
Museum Board ................................................................................................................................................... 766
Passenger Transport Board ............................................................................................................................... 774
South Australian Film Corporation ..................................................................................................................... 788
The State Opera of South Australia ................................................................................................................... 799
State Theatre Company of South Australia........................................................................................................ 808
TransAdelaide .................................................................................................................................................... 816
Report of the Auditor-General 1999-2000
TABLE OF CONTENTS TO VOLUMES I, II AND III
VOLUME III
Page
TREASURER
PORTFOLIO – TREASURY AND FINANCE......................................................................................................835
Electricity Reform and Sales Unit........................................................................................................................837 Electricity Sale/Lease Proceeds Account ........................................................................................................846
Electricity Supply Industry - Overview.................................................................................................................851 Introduction ......................................................................................................................................................851 RESI Corporation.............................................................................................................................................856 Flinders Coal Pty Ltd........................................................................................................................................875
Electricity Supply Industry - Distribution ..............................................................................................................877 RESI Utilities Pty Ltd........................................................................................................................................877 Distribution Lessor Corporation .......................................................................................................................880
Electricity Supply Industry - Generation ..............................................................................................................887 Introduction ......................................................................................................................................................887 Flinders Power Pty Ltd.....................................................................................................................................889 RESI OE Pty Ltd ..............................................................................................................................................902 RESI Syn Pty Ltd .............................................................................................................................................905 Terra Gas Trader Pty Ltd .................................................................................................................................908 Generation Lessor Corporation .......................................................................................................................917
Electricity Supply Industry - Retail.......................................................................................................................923 RESI Power Pty Ltd .........................................................................................................................................923
Electricity Supply Industry - Transmission ..........................................................................................................926 Transmission Lessor Corporation....................................................................................................................926
Motor Accident Commission................................................................................................................................943
Police Superannuation Scheme..........................................................................................................................965
South Australian Asset Management Corporation and Its Controlled Entities....................................................966
South Australian Finance Trust Limited ..............................................................................................................967
South Australian Government Captive Insurance Corporation (SAICORP) .......................................................975
South Australian Government Financing Authority .............................................................................................999
South Australian Superannuation Board...........................................................................................................1024 South Australian Superannuation Scheme....................................................................................................1027 Southern State Superannuation Scheme ......................................................................................................1041
Superannuation Funds Management Corporation of South Australia ..............................................................1050
Department of Treasury and Finance................................................................................................................1075

Report of the Auditor-General 1999-2000
TABLE OF CONTENTS TO VOLUMES I, II AND III
VOLUME III
Page
MINISTER FOR WATER RESOURCES
PORTFOLIO – WATER RESOURCES ........................................................................................................... 1097
Catchment Water Management Boards ........................................................................................................... 1099 Patawalonga Catchment Water Management Board ................................................................................... 1105 Torrens Catchment Water Management Board............................................................................................ 1111 Northern Adelaide and Barossa Catchment Water Management Board...................................................... 1117 Onkaparinga Catchment Water Management Board ................................................................................... 1123 South East Catchment Water Management Board ...................................................................................... 1129
Department for Water Resources..................................................................................................................... 1134
APPENDIX Treasurer’s Financial Statements (Statements A-K)

VOLUMES I, II AND III
REFERENCES TO MATTERS OF SIGNIFICANCE Issues of importance which are included in this Part of the Report include matters which arose during the course of audit which have been referred to senior agency management, and other matters which are of public interest. Those matters which are regarded as being more significant are listed below, together with a reference to the appropriate page number. That list is not exhaustive as many other issues are reported in Volumes I, II and III of Part B of this Report. Reference should also be made to Part A - Audit Overview which also contains comments on specific matters of importance and interest.
Agency Matter Page
Adelaide Festival Corporation – Operating Result.................................................................................. 680
Adelaide Festival Centre Trust – Operating Result.................................................................................. 689
Administrative and Information Services – Department for – Financial Management Framework.......................................................... 7 – Procurement Arrangements................................................................... 10 – Outsourcing of Warehouse Operations .................................................. 10 – Outsourcing of Building Maintenance Work ........................................... 12 – Land Ownership and Tenure System..................................................... 13 – Qualified Audit Opinion .......................................................................... 18 – EDS IT Infrastructure Contract............................................................... 19 – Government Radio Network Contract .................................................... 20
Attorney-General’s Department – Financial Management Framework...................................................... 425 – Emergency Services Levy ................................................................... 428 – Gaming Revenue................................................................................. 430 – Criminal Injuries Compensation Recoveries from Offenders............................................................ 449
Construction Industry Training Board – Commentary on Compliance with Legislation....................................... 152
Correctional Services – Department for – Renewal of Agreement for the Provision of Services for the Management and Operation of the Mount Gambier Prison .................. 481
Courts Administration Authority – Courts Case Management System ...................................................... 501
Education, Training and Employment – Department of – Capital Works Assistance Scheme ...................................................... 160 – School Administration System (EDSAS) .............................................. 162 – Qualified Audit Opinion ........................................................................ 163 – Costs Associated with the Protection and Restoration of School
Property............................................................................................... 165 – Partnerships 21 ................................................................................... 166 – DECStech 2001................................................................................... 169 – School Accounts.................................................................................. 172
Electricity Reform and Sales Unit – Operating Statement............................................................................ 839 – Asset Leases/Sales ............................................................................. 841
Electricity Supply Industry – Overview ............................................................................................. 851 – Proceeds to the Treasurer from the Disposal of Electricity
Businesses .......................................................................................... 855
Environment and Heritage — Department for – Financial Management Framework...................................................... 258 – Property, Plant and Equipment ............................................................ 260 – Land Services Group........................................................................... 262 – Sporting Stadium Management Arrangements..................................... 264 – Qualified Audit Opinion ........................................................................ 265
Flinders University of South Australia – Statutory Financial Statement Reporting.............................................. 189
HomeStart Finance – Review of Government Ownership (Scoping Review) .......................... 283 – HomeStart Profitability and Return to Government .............................. 285

Agency Matter Page
Human Services — Department of – Financial Management Framework...................................................... 300 – Advance Payments – Capital Program ................................................ 302
Industry and Trade – Department of – Financial Management Framework...................................................... 406
Justice Information System Services – Qualified Audit Opinion ........................................................................ 493
Lotteries Commission of South Australia – Review of Government Ownership......................................................... 70 – Casino Operations................................................................................. 76
Passenger Transport Board – Cost Recovery from Passengers ......................................................... 777
Police Department – Firearms Control System ..................................................................... 530
Premier and Cabinet – Department of the – Targeted Voluntary Separation Package (TVSP) Scheme ................... 614
Primary Industries and Resources – Department of – Rural Finance and Development Assistance to Primary Producers.................................................. 657
SA St John Ambulance Service Inc – Independent Review............................................................................ 547
South Australian Aboriginal Housing Authority – Approval of Remuneration for the Authority Chairperson ..................... 330
South Australian Community Housing Authority – Community Housing Organisation (CHO) Audited Financial Statements .......................................................................................... 343
South Australian Government Captive Insurance Corporation
– Operating Performance ....................................................................... 980
– Financial Position ................................................................................ 981
South Australian Government Financing Authority – Financial Performance and Financial Position.................................... 1003 – Sale/Lease of Electricity Corporations and Management of
Proceeds ........................................................................................... 1006 – Debt Management ............................................................................. 1007
South Australian Health Commission and Associated Activities
– Changes to the South Australian Health Commission Act 1976 ........... 355
– Insurance Arrangements...................................................................... 357 – Administration of the Food Act ............................................................. 359 – Accountability for Commission, Non-Commission and Trust
Funds in Health Units .......................................................................... 359 – Modbury Hospital Contracting Arrangements....................................... 360
South Australian Housing Trust – Public Housing – Rent Rebates ........................................................... 383 – Asset Management.............................................................................. 387
South Australian Motor Sport Board – Qualified Audit Report.......................................................................... 633
South Australian Ports Corporation – Review of Government Ownership......................................................... 88
South Australian Superannuation Board – Systems Developments ..................................................................... 1026
South Australian Superannuation Scheme – Liability for Accrued Benefits.............................................................. 1029
South Australian Totalizator Agency Board – Review of Government Ownership....................................................... 101 – Additional Distribution .......................................................................... 103
South Australian Water Corporation – Management of Major Contracts.......................................................... 121 – Community Service Obligations ........................................................... 124 – Contributions to Government ............................................................... 125
South East Catchment Water Management Board – Qualified Audit Opinion ...................................................................... 1102
Superannuation Funds Management Corporation of South Australia
– Funds under Management................................................................. 1053
– Investment Returns............................................................................ 1055
TransAdelaide – Joint Venture Agreement ..................................................................... 817 – Controlled Entities Operations ............................................................. 821
Transport, Urban Planning and the Arts – Department for – Non-Current Assets ............................................................................. 714
Treasury and Finance – Department of – Government Management Framework and Budget Reform ............... 1079 – Budgetary and Financial Management System.................................. 1080 – Whole-of-Government Reporting ....................................................... 1081 – Corporatisation, Commercialisation and Cost Reflective Pricing ........ 1082
Water Resources – Department for – Qualified Audit Opinion ...................................................................... 1136
835
TREASURER
PORTFOLIO – TREASURY AND FINANCE INTRODUCTION This section of this Part of the Report contains the financial statements of, and comments concerning, the operations of those agencies under the direction and control of the Treasurer. The agencies included herein relating to the portfolio of Treasury and Finance are: • Electricity Reform and Sales Unit • Electricity Supply Industry
Distribution Lessor Corporation Flinders Coal Pty Ltd Flinders Power Pty Ltd Generation Lessor Corporation RESI Corporation RESI OE Pty Ltd RESI Power Pty Ltd RESI Syn Pty Ltd RESI Utilities Pty Ltd Terra Gas Trader Pty Ltd Transmission Lessor Corporation
• Motor Accident Commission • Police Superannuation Scheme • South Australian Asset Management Corporation and Its Controlled Entities • South Australian Finance Trust Limited • South Australian Government Captive Insurance Corporation • South Australian Government Financing Authority • South Australian Superannuation Board
South Australian Superannuation Scheme Southern State Superannuation Scheme
• Superannuation Funds Management Corporation of South Australia • Treasury and Finance - Department of SUPPLEMENTARY REPORT There are also agencies whose financial statements have not been finalised or the audit has not been completed in time for inclusion in this Report. The financial statements for, and commentary on the operations of, the following agencies will be included in a Supplementary Report to be presented to Parliament later in this financial year. • Police Superannuation Scheme • South Australian Asset Management Corporation and Its Controlled Entities

836
837
ELECTRICITY REFORM AND SALES UNIT FUNCTIONAL RESPONSIBILITY AND STRUCTURE Cabinet has assigned responsibility for the reform and disposal of the State’s electricity assets to the Treasurer. For this purpose, and to assist in the management of the reform and disposal process, the Electricity Reform and Sales Unit (ERSU) was established as a division of the Department of Treasury and Finance. ERSU is headed by two Executive Directors with one being responsible for market and regulatory reform and the other for commercial and sale. The objectives of ERSU are to: • establish an efficient, competitive electricity industry in South Australia in the context of the National
Electricity and Competition Policy;
• establish an appropriate regulatory regime, which encourages competitive outcomes, protection for consumers and certainty for investors;
• advise on the appropriate restructuring of the electricity supply industry to maximise market efficiency and sale/lease value;
• organise the disposal process to ensure an orderly disposal of the State’s electricity assets subject to the passage of the necessary legislation;
• continue monitoring the financial and market positions of the electricity entities until their respective disposal.
Legislation The Electricity Corporation (Restructuring and Disposal) Act 1999 (the Act) was assented to on 1 July 1999. Section 13 of the Act provides for the disposal of the State’s major electricity assets, places limitations on the method of their disposal and permits the Government to proceed with the long term leasing of those assets. There is no restriction in the legislation as to the term of any such lease nor is there any requirement for Parliamentary approval of any extension of such a lease. Special Deposit Account A Special Deposit Account entitled, ‘Electricity Reform and Sales Operating Account’ was established in a previous year under section 8 of the Public Finance and Audit Act 1987. The current purpose of the account is:
… to record all the financial transactions of the Electricity Reform and Sales Unit, recurrent and capital expenditure on disposal of assets, revenue from various activities, injections of funds provided from the Consolidated Account, to make payments to the Electricity Sale/Lease Proceeds Account and to apply net or gross proceeds from a sale/lease agreement, sale or lease to repay the Government’s indebtedness or for other approved purposes.
Transactions relating to the operations of ERSU are processed through this Special Deposit Account. For the 1999-2000 financial year, ERSU operations were financed on a cash flow basis from part lease/sale proceeds received from the disposal of electricity assets. As a result, there was no need to make an appropriation from the Consolidated Account. In the previous financial year, operations were partly funded by a $15 million appropriation from the Consolidated Account. Transactions reflected in Special Deposit Accounts are processed by the Corporate Services Branch of the Department of Treasury and Finance. Commentary on the general financial controls and the computer information systems environment are detailed under the Department of Treasury and Finance section of this Report and are relevant to the overall operations of ERSU.
Electricity Reform and Sales Unit
838
CHANGES TO AGENCY ORGANISATIONAL STRUCTURE During the financial year, the Treasurer approved the creation of a new Special Deposit Account entitled the ‘Electricity Sale/Lease Proceeds Account’. The purpose of the account is:
… to receive proceeds of a sale/lease agreement, sale or lease under the Electricity Corporations (Restructuring and Disposal) Act 1999 and other funds as approved by the Treasurer, and to receive interest payments from other interest bearing accounts in which sale/lease agreement proceeds are placed, and to invest those monies and to apply those monies, and income from their investment, towards the retirement of State debt.
Although the Electricity Sale/Lease Proceeds Account is not directly controlled by ERSU, it is related to the electricity assets disposal process as ERSU is responsible for the management of the disposal process and the Treasurer determines the dissection of the proceeds between the two Special Deposit Accounts. ERSU receives part of the disposal proceeds which it uses to finance disposal costs and the operation of its Special Deposit Account and the Proceeds Account is used to receive the majority of the proceeds which are used exclusively to retire State debt. AUDIT MANDATE AND COVERAGE Audit Authority Subsection 31(1)(a) of the Public Finance and Audit Act 1987 (the Act) provides for the Auditor-General to audit the public accounts in respect of each financial year and under the Act, special deposit accounts are included as part of the public accounts. Scope of Audit The audit program covered all major financial systems relevant to ERSU in its capacity as a division of the Department of Treasury and Finance and was directed primarily towards obtaining sufficient evidence to enable an audit opinion to be formed with respect to the financial statements and internal control. During 1999-2000 specific areas of audit attention included:
• proceeds from the lease/sale of electricity assets and related transactions • income from the investment of funds of the two Special Deposit Accounts • payments made towards the retirement of State debt • disposal costs • payments to consultants and administration expenditure. The Auditor-General also has responsibilities in relation to reporting on the processes leading up to the making of long term leases for electricity assets. These matters will be separately reported to Parliament. Further commentary on the electricity asset disposals is also provided in Part A of this Report in the section entitled ‘Electricity Assets Disposals and the State’s Finances’. Audit Communications to Management During the year, a letter was sent to the Under-Treasurer concerning the purpose definition of the Electricity Reform and Sales Operating Account and income from the investment of the account. At that time, the purpose definition of the account only covered the recording of sale and not lease proceeds and the account was not interest bearing. The Electricity Corporations (Restructuring and Disposal) Act 1999 requires that lease/sale proceeds be paid into accounts at the Treasury and in particular subsection 21 (2) of that Act requires that any income from investment of monies paid into accounts at the Treasury must be applied for the purposes of retiring State debt. A reply was received to the matters raised and appropriate action was taken which involved the changing of the purpose of the account and the creation of the new Electricity Sale/Lease Proceeds Account which is interest bearing. The ERSU Operating Account became interest bearing from the date of receipt of lease/sale proceeds and interest earned by that account is credited to the Proceeds Account and all interest earned from the investment of funds is used to retire State debt.

Electricity Reform and Sales Unit
839
AUDIT FINDINGS AND COMMENTS Commentary on General Financial Controls The review of the internal control structure of ERSU concluded that an adequate system of internal control was in place and that transactions processed were subject to internal check, were duly authorised by an appropriate officer and that major financial transactions were supported by duly executed contracts or agreements. All lease/sale transactions that occurred were approved by Cabinet. CONTROLS OPINION As required by subsection 36(1)(a)(iii) of the Public Finance and Audit Act 1987, the audit of the Electricity Reform and Sales Unit included an assessment of the controls exercised in relation to the receipt, expenditure and investment of money, the acquisition and disposal of property and the incurring of liabilities. The assessment also considered whether those controls were consistent with the prescribed elements of the Financial Management Framework as required by Treasurer’s Instruction 2 ‘Financial Management Policies’. Audit formed the opinion that the controls exercised by the Electricity Reform and Sales Unit in relation to the receipt, expenditure and investment of money; the acquisition and disposal of property; and the incurring of liabilities, were sufficient to provide reasonable assurance that the financial transactions of the organisation were conducted properly and in accordance with the law. INTERPRETATION AND ANALYSIS OF FINANCIAL STATEMENTS Operating Statement Operating Expenses Operating expenses amounted to $85.3 million and included expenditure for consultants on an accruals basis of $55.2 million ($35.6 million). The following table sets out a summary of the consultancy services provided over two years: Consultancy Service 1999-2000 1998-99 Total $’000 $’000 $’000 Legal 29 692 17 162 46 854 Lead 12 805 6 937 19 742 Accounting 6 948 5 525 12 473 Other 5 785 5 947 11 732
55 230 35 571 90 801
The most significant of the expenditure for consultants was for legal work which included work on due diligence, data room management, disaggregation, Australian Competition and Consumer Commission (ACCC) issues, regulatory issues, vesting contracts, electricity pricing orders, codes and licences, legislative changes, contract negotiations, transaction documents, information memorandums, probity/bid evaluations, presentation to bidders, and legal advice. In addition, expenditure on consultants included a success fee paid to the lead and accounting consultants. Disposal costs totalled $22.2 million. Disposal costs included costs incurred by ERSU in the disposal of the assets with the main item of expenditure being the purchase of the fleet vehicles. Under the Business Sale Agreements, the Treasurer was obliged to purchase the fleet vehicles from the State vehicle lessor (Commonwealth Bank) and then transfer them to the respective new lessee/purchaser of the disposed electricity assets. In addition, disposal costs included the following: • $8.4 million on settlement of a claim in relation to the Vesting Compensation Deed;
• $1 million for EDS contract break costs to enable the Government to ‘break’ from the existing EDS agreement and allow the new Electricity Utilities to enter into agreements with EDS.
Electricity Reform and Sales Unit
840
Operating Revenues Operating revenues includes distributions from residual electricity entities of $79.6 million. Revenues associated with lease/sale proceeds belong to the residual electricity entities with the two Special Deposit Accounts merely holding the cash. When the residual electricity entities earn revenue, they account for revenue earned and distributions made. Such distribution are subsequently recorded in ERSU’s accounts. There is a timing difference between the receipt of the lease/sale proceeds and when distributions are brought to account. As a consequence, this Report has focused on cash proceeds received. For an explanation of the net cash proceeds received from assets leases refer to the table under the heading, ‘Further Commentary on Operations’, ‘Asset Leases/Sales’. Statement of Financial Position Due to the operating revenues associated with net part lease proceeds received, and the fact that expenditure on consultants fees includes a non-cash creditor component, this resulted in a substantial cash balance in the ERSU Operating Account which at 30 June 2000 stood at $47.1 million. This represents the major asset that ERSU has and is committed to the settlement of creditors and the completion of the disposal process. Statement of Cash Flows Net increase in cash was $23.5 million. The increase resulted as inflows from receipts of $22.2 million plus cash flows from investing activities which included part lease proceeds of $79.6 million were greater than total payments of $77.6 million. The most significant of the payments was for consultants fees of $48.2 million. FURTHER COMMENTARY ON OPERATIONS Assets for Disposal As discussed in the previous year’s Report, the State’s electricity businesses have been disaggregated into the following seven separate physical operating entities, the businesses of which or shares in which are subject to disposal: • ETSA Power Pty Ltd - Retailing • ETSA Utilities Pty Ltd - Distribution • Optima Energy Pty Ltd - Torrens Island Power Station • Synergen Pty Ltd - Port Lincoln, Snuggery, Dry Creek and Mintaro Power Stations • Terra Gas Trader Pty Ltd - A gas trader • Flinders Power Pty Ltd - Leigh Creek Coal Mine, Northern and Playford Power Stations • ETSA Transmission Corporation trading as ElectraNet SA - Transmission. The status of the disposal of the above assets is as follows: Completed: • ETSA Power Pty Ltd — Lease/sale agreements executed and proceeds settled • ETSA Utilities Pty Ltd — Lease/sale agreements executed and proceeds settled • Optima Energy Pty Ltd — Lease /sale agreements executed and proceeds settled • Synergen Pty Ltd — Lease /sale agreements executed and proceeds settled. In Progress: • Flinders Power Pty Ltd — Disposal decision announced by the Treasurer in August 2000. The cash
consideration is $313 million and is to be settled in September 2000. • Terra Gas Trader Pty Ltd — Final bids received and assessed, with no final disposal decision made.
• ElectraNet SA — At the final bid stage.
Electricity Reform and Sales Unit
841
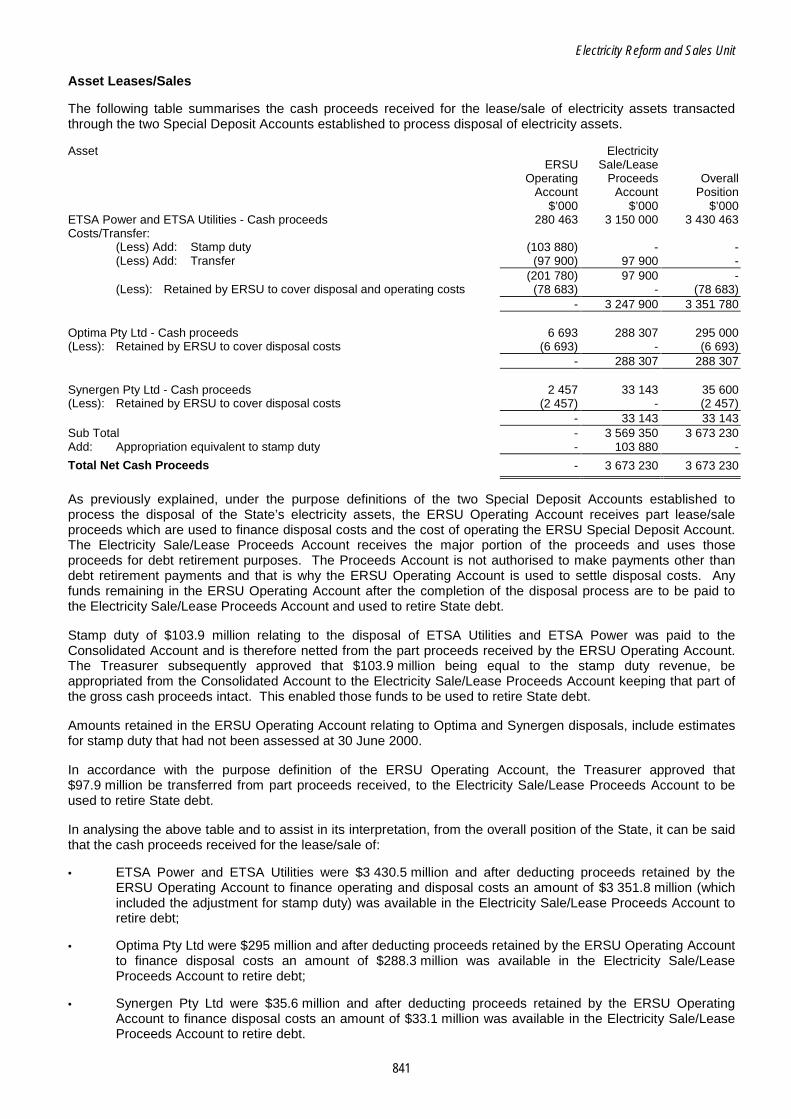
Asset Leases/Sales The following table summarises the cash proceeds received for the lease/sale of electricity assets transacted through the two Special Deposit Accounts established to process disposal of electricity assets. Asset Electricity ERSU Sale/Lease Operating Proceeds Overall Account Account Position $’000 $’000 $’000 ETSA Power and ETSA Utilities - Cash proceeds 280 463 3 150 000 3 430 463 Costs/Transfer:
(Less) Add: Stamp duty (103 880) - - (Less) Add: Transfer (97 900) 97 900 -
(201 780) 97 900 - (Less): Retained by ERSU to cover disposal and operating costs (78 683) - (78 683)
- 3 247 900 3 351 780 Optima Pty Ltd - Cash proceeds 6 693 288 307 295 000 (Less): Retained by ERSU to cover disposal costs (6 693) - (6 693) - 288 307 288 307 Synergen Pty Ltd - Cash proceeds 2 457 33 143 35 600 (Less): Retained by ERSU to cover disposal costs (2 457) - (2 457) - 33 143 33 143 Sub Total - 3 569 350 3 673 230 Add: Appropriation equivalent to stamp duty - 103 880 -
Total Net Cash Proceeds - 3 673 230 3 673 230
As previously explained, under the purpose definitions of the two Special Deposit Accounts established to process the disposal of the State’s electricity assets, the ERSU Operating Account receives part lease/sale proceeds which are used to finance disposal costs and the cost of operating the ERSU Special Deposit Account. The Electricity Sale/Lease Proceeds Account receives the major portion of the proceeds and uses those proceeds for debt retirement purposes. The Proceeds Account is not authorised to make payments other than debt retirement payments and that is why the ERSU Operating Account is used to settle disposal costs. Any funds remaining in the ERSU Operating Account after the completion of the disposal process are to be paid to the Electricity Sale/Lease Proceeds Account and used to retire State debt. Stamp duty of $103.9 million relating to the disposal of ETSA Utilities and ETSA Power was paid to the Consolidated Account and is therefore netted from the part proceeds received by the ERSU Operating Account. The Treasurer subsequently approved that $103.9 million being equal to the stamp duty revenue, be appropriated from the Consolidated Account to the Electricity Sale/Lease Proceeds Account keeping that part of the gross cash proceeds intact. This enabled those funds to be used to retire State debt. Amounts retained in the ERSU Operating Account relating to Optima and Synergen disposals, include estimates for stamp duty that had not been assessed at 30 June 2000. In accordance with the purpose definition of the ERSU Operating Account, the Treasurer approved that $97.9 million be transferred from part proceeds received, to the Electricity Sale/Lease Proceeds Account to be used to retire State debt. In analysing the above table and to assist in its interpretation, from the overall position of the State, it can be said that the cash proceeds received for the lease/sale of: • ETSA Power and ETSA Utilities were $3 430.5 million and after deducting proceeds retained by the
ERSU Operating Account to finance operating and disposal costs an amount of $3 351.8 million (which included the adjustment for stamp duty) was available in the Electricity Sale/Lease Proceeds Account to retire debt;
• Optima Pty Ltd were $295 million and after deducting proceeds retained by the ERSU Operating Account to finance disposal costs an amount of $288.3 million was available in the Electricity Sale/Lease Proceeds Account to retire debt;
• Synergen Pty Ltd were $35.6 million and after deducting proceeds retained by the ERSU Operating Account to finance disposal costs an amount of $33.1 million was available in the Electricity Sale/Lease Proceeds Account to retire debt.

Electricity Reform and Sales Unit
842
ELECTRICITY REFORM AND SALES OPERATING ACCOUNT
Operating Statement for the year ended 30 June 2000 2000 1999 Note $’000 $’000 OPERATING EXPENSES:
Accommodation expenses 1 878 401 Consultants fees 3 55 230 35 571 Administration expenses 4(a) 6 011 4 217 Disposal costs 4(b) 22 196 - Employee entitlements 7 5 Depreciation expenses 8 6
Total Operating Expenses 85 330 40 200 OPERATING REVENUES:
Distribution from electricity entities 5(a) 79 604 - Part proceeds from asset leases 5(b) 229 - Net proceeds from Pelican Point - 28 500 Contributions from electricity entities 5(c) 1 000 20 740 Proceeds from Optima 5(d) 13 000 - Sundry revenues 18 50
Total Operating Revenues 93 851 49 290 NET SURPLUS FROM OPERATIONS 10 8 521 9 090 REVENUES FROM GOVERNMENT:
Appropriation - 15 000 Total Revenues from Government - 15 000
INCREASE IN NET ASSETS RESULTING FROM OPERATIONS 8 8 521 24 090
Statement of Financial Position as at 30 June 2000 2000 1999 Note $’000 $’000 CURRENT ASSETS:
Cash 47 133 23 657 Receivables: Operating 3 - SA Gas market study 7 782 -
Total Current Assets 47 918 23 657 NON-CURRENT ASSETS:
Property, plant and equipment 21 18 Total Non-Current Assets 21 18 Total Assets 47 939 23 675
CURRENT LIABILITIES:
Creditors and accruals 6 17 729 1 986 Total Current Liabilities 17 729 1 986 Total Liabilities 17 729 1 986
NET ASSETS 30 210 21 689
EQUITY: Accumulated surplus 8 30 210 21 689
Contingent Obligations 9

Electricity Reform and Sales Unit
843
Statement of Cash Flows for the year ended 30 June 2000 2000 1999 Inflows Inflows (Outflows) (Outflows) CASH FLOWS FROM OPERATING ACTIVITIES: Note $’000 $’000 PAYMENTS:
Accommodation expenses (1 873) (386) Consultants fees (48 158) (38 891) Administration expenses (6 395) (3 766) Disposal costs (21 146) - Employee expenses (7) (5)
Total Payments (77 579) (43 048) RECEIPTS:
Sundry receipts 15 50 Contributions from electricity entities 1 000 20 740 Proceeds from Optima 13 000 - Part proceeds from lease of assets 5(b) 229 - Net proceeds from Pelican Point - 28 500 Stamp duty 8 000 -
Total Receipts 22 244 49 290
CASH FLOWS FROM GOVERNMENT: Appropriations - 15 000
Total Cash provided by Government - 15 000 Net Cash (used in) provided by Operating Activities 10 (55 335) 21 242
CASH FLOWS FROM INVESTING ACTIVITIES: Purchase of office equipment (11) (24) Part proceeds from lease of assets 5(b) 79 604 -
Net Cash provided by (used in) Investing Activities 79 593 (24) CASH FLOWS FROM FINANCING ACTIVITIES: SA Gas Market study 7 (782) - Net Cash used in Financing Activities (782) - NET INCREASE IN CASH HELD 23 476 21 218 CASH AT 1 JULY 23 657 2 439
CASH AT 30 JUNE 47 133 23 657
NOTES TO AND FORMING PART OF THE FINANCIAL STATEMENTS 1. Objectives
The Electricity Reform and Sales Operating Account encompasses the activities of the Electricity Reform and Sales Unit (ERSU), established by the Government to sell or lease its electricity utilities, ETSA Corporation and Optima Energy, in a process expected to take up to two years. The objectives of the Electricity Reform and Sales Unit are to:
• establish an efficient, competitive electricity industry in South Australia in the context of the National Electricity and
Competition Policy; • establish an appropriate regulatory regime, which encourages competitive outcomes, protection for consumers and
certainty for investors; • advise on the appropriate restructuring of the electricity supply industry to maximise market efficiency and sale/lease
value; • organise the sale process to ensure an orderly sale of the State’s electricity assets, subject to passage of the necessary
legislation; • continue monitoring the financial and market positions of the electricity entities until their respective lease/sales.
2. Summary of Significant Accounting Policies
(a) Basis of Accounting The accounts have been prepared in accordance with the Treasurer’s Instructions promulgated under the provisions of the Public Finance and Audit Act 1987, applicable Accounting Standards and applicable Urgent Issues Group Consensus Views. The accounts are prepared on the accrual basis and in accordance with conventional historic cost principles except where otherwise stated.
(b) The Reporting Entity
The financial report encompasses all activities transacted through an interest bearing Special Deposit Account entitled ‘Electricity Reform and Sales Operating Account’ (the Account). Interest earned by the ERSU Operating Account from the date of receipt of part lease/sale proceeds is calculated and credited to the associated Electricity Sale/Lease Proceeds Account and is used for the purpose of retiring State debt. The account is administered by, but not controlled by, the Department of Treasury and Finance.
The Department of Treasury and Finance provides staffing resources and administrative support to the Electricity Reform and Sales Unit. Treasury and Finance is reimbursed for the cost of staffing resources and administrative support from the Account.
The Account’s principal source of funds consists of: • part proceeds from asset leases and related transactions; • contributions from Electricity Entities.

Electricity Reform and Sales Unit
844
2. Summary of Significant Accounting Policies (continued) (c) Appropriations
Appropriations are recognised as revenue when the Unit obtains control over the assets comprising the contribution. Control over appropriation is normally obtained upon their receipt. For 1999-2000 no appropriation was made as operations were financed from part lease/sale proceeds received.
(d) Employee Entitlements The Department of Treasury and Finance provides staffing resources for the Electricity Reform and Sales process. The responsibility for employee entitlements rests with Treasury and Finance and a provision is not required to be established. The expenditure incurred in 1999-2000 reflects board fees paid for the Consumer Consultant Committee.
(e) Cash For the purposes of the Statement of Cash Flows, cash includes cash deposits which are readily convertible to cash on hand and which are used in the cash management function on a day to day basis.
(f) Lease/Sale Proceeds and Distributions from Electricity Entities Under the purpose definition of the Special Deposit Account, it authorises the receipt by the Operating Account of lease/sale proceeds and in particular the account receives part lease/sale proceeds and applies those proceeds to finance the disposal of assets and the operation of the Account. The bulk of the lease/sale proceeds are recorded in the Electricity Sale/Lease Proceeds Account and are used exclusively to retire State debt. The cash lease/sale proceeds are reflected in the Statement of Cash Flows. The revenue associated with the lease/sale proceeds belongs to the electricity entities, with the Account merely holding the cash. When those entities earn revenue, they bring revenue to account and make distributions. Distributions are split between the two Special Deposit Accounts with the bulk being recorded in the Electricity Sale/Lease Proceeds Account. The split for the current year allocated a distribution from electricity entities to the ERSU Operating Account to almost equal the cash lease/sale proceeds it received.
3. Consultants Fees 2000 1999 Number of Number of
Expenditure incurred on consultants fell within the following bands: Consultants Consultants $0 - $10 000 13 10 $10 001 - $50 000 8 7 $50 001 - $100 000 5 1 $100 001 - $150 000 - 1 $Over $150 000 14 14
40 33 The total expenditure incurred in 1999-2000 for the 40 (33) consultants was $55.2 million ($35.6 million) 4. Administration Expenses and Disposal Costs 2000 1999 (a) Administration Expenses: $’000 $’000
Reimbursement to the Department of Treasury and Finance for administrative support 4 248 3 478 Crown Solicitor’s legal costs 115 75 Other expenses 1 648 664
6 011 4 217
(b) Disposal Costs: ETSA: Directors completion fee 50 - Purchase of leased vehicles 11 637 - 11 687 - Optima: Directors completion fee 50 - Purchase of leased vehicles 513 - Retention fee 130 - 693 - Synergen: Directors completion fee 50 - Purchase of leased vehicles 243 - Retention fee 164 - 457 - Sub-Total 12 837 - AGL: Settlement of vesting compensation deed 8 359 - EDS: Contract break costs 1 000 - 22 196 -
5. Operating Revenues
(a) Distribution from Electricity Entities Represents distributions from electricity entities to 30 June 2000. Refer Note 2(f). 79 604 -

Electricity Reform and Sales Unit
845
5. Operating Revenues (continued) 2000 (b) Part Proceeds from Asset Leases ETSA Optima Synergen Total $’000 $’000 $’000 $’000 Part proceeds 280 463 6 693 2 457 289 613 Less: Stamp duty 103 880 6 000 2 000 111 880 Part proceeds net of stamp duty 176 583 693 457 177 733 Less: Transfer to proceeds account 97 900 - - 97 900
Net part proceeds from Asset Leases 78 683 693 457 79 833
Reconciled to the Statement of Cash Flows as follows:
Part proceeds - Operating activities 229 Part proceeds - Investing activities 79 604
Total 79 833 Stamp duty is payable to State Taxation and is therefore netted from the part proceeds received. In relation to the part
proceeds for the ETSA Power and Utilities lease/sale of $280.5 million, after payment of stamp duty of $103.9 million to State Taxation, the Treasurer approved that $103.9 million of stamp duty revenue be appropriated from the Consolidated Account to the Electricity Sale/Lease Proceeds Account. This enabled those funds to be used to retire State debt.
In accordance with the purpose definition of the Operating Account, the Treasurer approved that $97.9 million be
transferred from part proceeds received, to the Electricity Sale/Lease Proceeds account to be used to retire State debt. Net part proceeds reflects amounts authorised by the Treasurer, to be retained in the Operating Account from part
proceeds for the purpose of financing disposal and operating costs. In relation to the ETSA Power and Utilities lease/sale, the Treasurer authorised that $66 million be retained by ERSU in its Operating Account to finance its operating costs. This was necessary for 1999-2000 due to the fact that the Operating Account received no appropriation from the Consolidated Account to finance its operation. Any funds left in the Operating Account after completion of the disposal process are to be transferred to the Electricity Sale/Lease Proceeds Account and used to retire State debt.
(c) Contribution from Electricity Entities 2000 1999 $’000 $’000 Contributions from Electricity entities reflects the recovery of expenditure incurred 1 000 20 740 by ERSU for the reform and restructure of the State’s electricity assets. For 1999-2000 contributions reflect recovery of EDS contract break costs. (d) Proceed from Optima 13 000 - The Treasurer authorised that Optima Energy Pty Ltd repay its share holder loan and that ERSU receive part repayment. The funds were used to settle the Vesting Compensation Deed. 6. Creditors and Accruals
Lease agreement costs 9 050 - Consultants fees 8 376 1 304 Administered expenses 283 667 Accommodation expenses 20 15 Total Creditors and Accruals 17 729 1 986
7. Receivables - SA Gas Market Study
Included in the receivables is expenditure of $782 000 for transactions initially incurred by ERSU for the conduct of a gas market study. This has been classified in the Statement of Cash Flows as a financing activity as the expenditure was on behalf of an activity not directly related to the operating activities of ERSU. It is to be transferred to a new Special Deposit Account established in the 2000-01 financial year.
8. Accumulated Surplus 2000 1999 $’000 $’000
Balance at 1 July 21 689 (2 401) Increase in net assets resulting from operations 8 521 24 090
Balance at 30 June 30 210 21 689
9. Contingent Obligations
Under an agreement between National Power South Australia Investments Ltd and the Treasurer for Pelican Point, National Power is to undertake landscaping works and development of public amenities on certain leased land. The cost of these works is to be refunded to the lessee at the expiration of the initial five year term. The maximum exposure value of the contingent obligation at 30 June 2000 has been estimated at $300 000.
10. Reconciliation of Net Cash used in Operating Activities to Net Surplus from Operations 2000 1999
$’000 $’000 Net cash used in operating activities (55 335) 21 242 Cash flows from Government - (15 000) Add: Distribution from electricity entities - Investing activities 79 604 - Non-cash items:
Depreciation expense (8) (6) Change in operating assets and liabilities:
(Increase) Decrease in liabilities (15 743) 2 854 Increase in assets 3 -
Net Surplus from Operations 8 521 9 090

Electricity Reform and Sales Unit
846
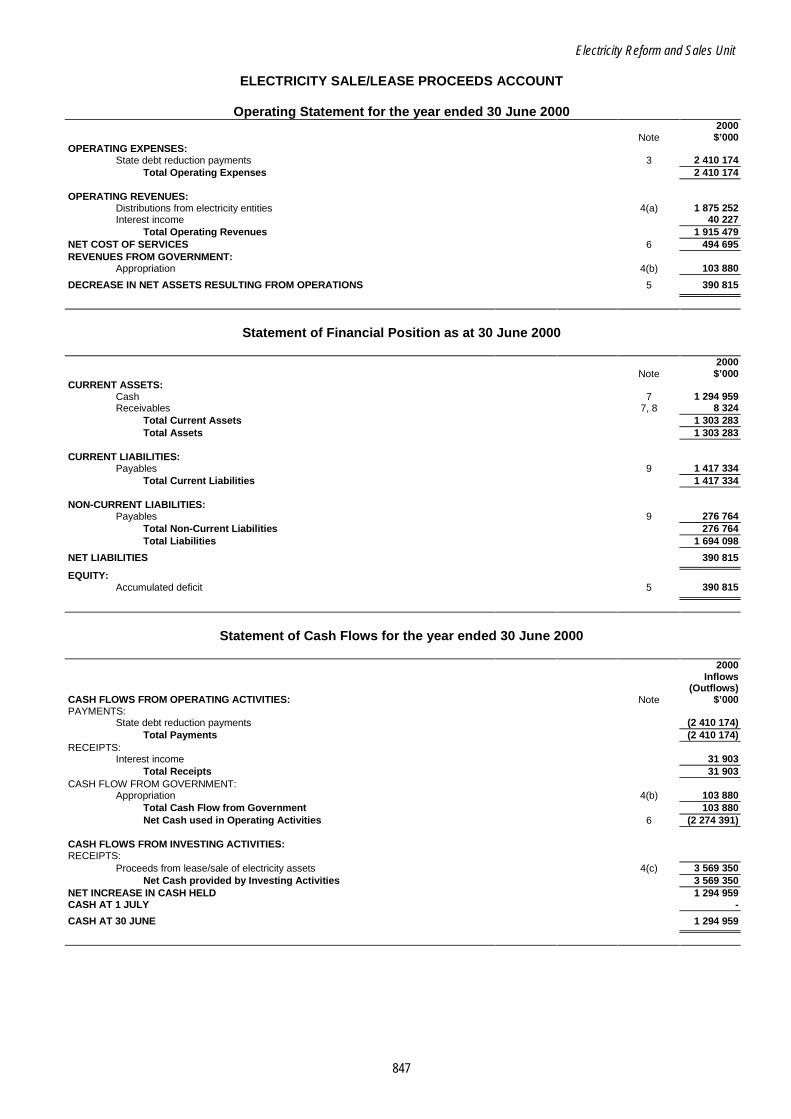
ELECTRICITY SALE/LEASE PROCEEDS ACCOUNT SIGNIFICANT FEATURES • The cash proceeds for the lease/sale of electricity assets after deducting proceeds retained by the ERSU
Operating Account were ETSA Power and ETSA Utilities $3 247.9 million, appropriation equivalent to stamp duty for ETSA Power and ETSA Utilities of $103.9 million, Optima Pty Ltd $288.3 million and Synergen Pty Ltd $33.1 million making a total of $3 673.2 million available for State debt retirement purposes.
• Interest income was $40.2 million.
• State debt reduction payments were $2 410.2 million and the cash balance available in the Special Deposit Account to make further debt reduction payments was $1 295 million.
INTERPRETATION AND ANALYSIS OF FINANCIAL STATEMENTS Operating Statement Operating Expenses In accordance with the purpose definition of the Electricity Sale/Lease Proceeds Account, all proceeds received in the Account from the sale or lease of the electricity assets and investment of funds are to be used to retire State debt. For the 1999-2000 financial year, a total of $2 410.2 million was paid to the South Australian Government Financing Authority towards State debt retirement purposes. Operating Revenues For an explanation of the proceeds from the lease/sale of electricity assets refer to the previous table under the heading ‘Further Commentary on Operations’ and Note 4 of the financial statements. Statement of Financial Position The major balance consists of the cash balance of the Special Deposit Account which at 30 June 2000 stood at $1 295 million and is available for future State debt retirement purposes.
Electricity Reform and Sales Unit
847
ELECTRICITY SALE/LEASE PROCEEDS ACCOUNT
Operating Statement for the year ended 30 June 2000 2000 Note $’000 OPERATING EXPENSES:
State debt reduction payments 3 2 410 174 Total Operating Expenses 2 410 174
OPERATING REVENUES:
Distributions from electricity entities 4(a) 1 875 252 Interest income 40 227
Total Operating Revenues 1 915 479 NET COST OF SERVICES 6 494 695 REVENUES FROM GOVERNMENT:
Appropriation 4(b) 103 880
DECREASE IN NET ASSETS RESULTING FROM OPERATIONS 5 390 815
Statement of Financial Position as at 30 June 2000
2000 Note $’000 CURRENT ASSETS:
Cash 7 1 294 959 Receivables 7, 8 8 324
Total Current Assets 1 303 283 Total Assets 1 303 283
CURRENT LIABILITIES:
Payables 9 1 417 334 Total Current Liabilities 1 417 334
NON-CURRENT LIABILITIES:
Payables 9 276 764 Total Non-Current Liabilities 276 764 Total Liabilities 1 694 098
NET LIABILITIES 390 815
EQUITY: Accumulated deficit 5 390 815
Statement of Cash Flows for the year ended 30 June 2000
2000 Inflows (Outflows) CASH FLOWS FROM OPERATING ACTIVITIES: Note $’000 PAYMENTS:
State debt reduction payments (2 410 174) Total Payments (2 410 174)
RECEIPTS: Interest income 31 903
Total Receipts 31 903 CASH FLOW FROM GOVERNMENT:
Appropriation 4(b) 103 880 Total Cash Flow from Government 103 880 Net Cash used in Operating Activities 6 (2 274 391)
CASH FLOWS FROM INVESTING ACTIVITIES: RECEIPTS:
Proceeds from lease/sale of electricity assets 4(c) 3 569 350 Net Cash provided by Investing Activities 3 569 350
NET INCREASE IN CASH HELD 1 294 959 CASH AT 1 JULY -
CASH AT 30 JUNE 1 294 959
Electricity Reform and Sales Unit
848
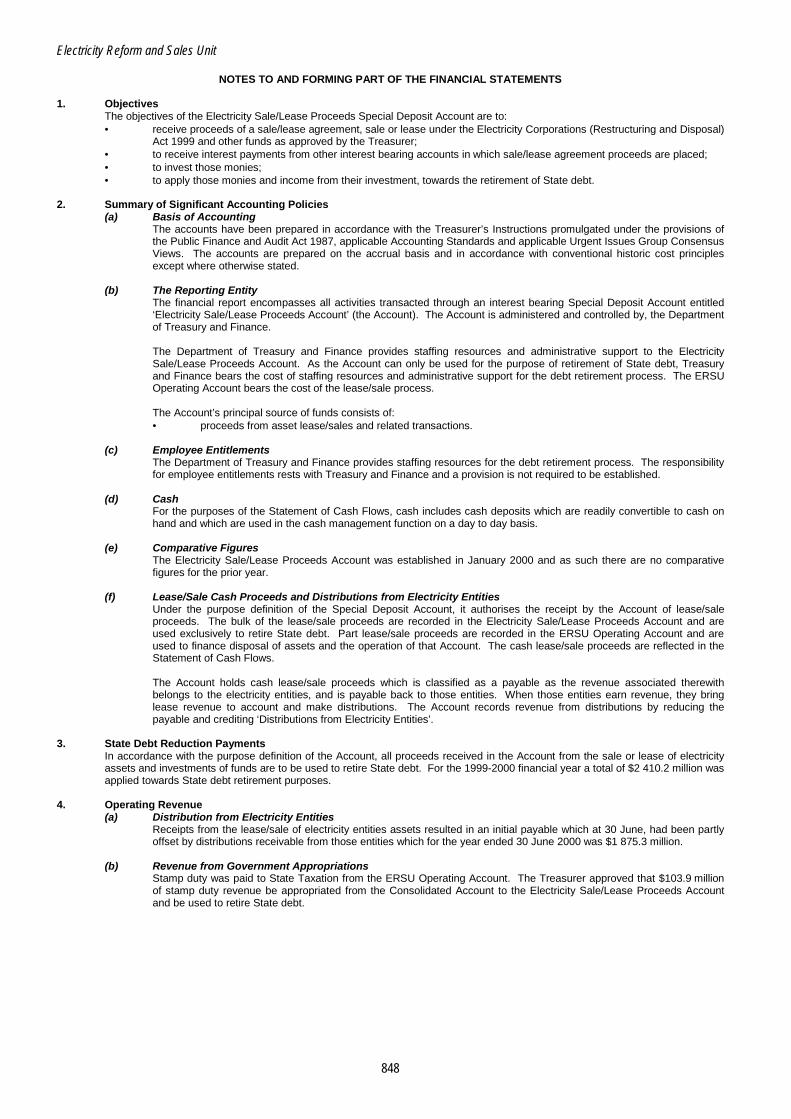
NOTES TO AND FORMING PART OF THE FINANCIAL STATEMENTS 1. Objectives The objectives of the Electricity Sale/Lease Proceeds Special Deposit Account are to:
• receive proceeds of a sale/lease agreement, sale or lease under the Electricity Corporations (Restructuring and Disposal) Act 1999 and other funds as approved by the Treasurer;
• to receive interest payments from other interest bearing accounts in which sale/lease agreement proceeds are placed; • to invest those monies; • to apply those monies and income from their investment, towards the retirement of State debt.
2. Summary of Significant Accounting Policies
(a) Basis of Accounting The accounts have been prepared in accordance with the Treasurer’s Instructions promulgated under the provisions of the Public Finance and Audit Act 1987, applicable Accounting Standards and applicable Urgent Issues Group Consensus Views. The accounts are prepared on the accrual basis and in accordance with conventional historic cost principles except where otherwise stated.
(b) The Reporting Entity
The financial report encompasses all activities transacted through an interest bearing Special Deposit Account entitled ‘Electricity Sale/Lease Proceeds Account’ (the Account). The Account is administered and controlled by, the Department of Treasury and Finance.
The Department of Treasury and Finance provides staffing resources and administrative support to the Electricity Sale/Lease Proceeds Account. As the Account can only be used for the purpose of retirement of State debt, Treasury and Finance bears the cost of staffing resources and administrative support for the debt retirement process. The ERSU Operating Account bears the cost of the lease/sale process.
The Account’s principal source of funds consists of: • proceeds from asset lease/sales and related transactions.
(c) Employee Entitlements
The Department of Treasury and Finance provides staffing resources for the debt retirement process. The responsibility for employee entitlements rests with Treasury and Finance and a provision is not required to be established.
(d) Cash For the purposes of the Statement of Cash Flows, cash includes cash deposits which are readily convertible to cash on hand and which are used in the cash management function on a day to day basis.
(e) Comparative Figures The Electricity Sale/Lease Proceeds Account was established in January 2000 and as such there are no comparative
figures for the prior year.
(f) Lease/Sale Cash Proceeds and Distributions from Electricity Entities Under the purpose definition of the Special Deposit Account, it authorises the receipt by the Account of lease/sale proceeds. The bulk of the lease/sale proceeds are recorded in the Electricity Sale/Lease Proceeds Account and are used exclusively to retire State debt. Part lease/sale proceeds are recorded in the ERSU Operating Account and are used to finance disposal of assets and the operation of that Account. The cash lease/sale proceeds are reflected in the Statement of Cash Flows. The Account holds cash lease/sale proceeds which is classified as a payable as the revenue associated therewith belongs to the electricity entities, and is payable back to those entities. When those entities earn revenue, they bring lease revenue to account and make distributions. The Account records revenue from distributions by reducing the payable and crediting ‘Distributions from Electricity Entities’.
3. State Debt Reduction Payments In accordance with the purpose definition of the Account, all proceeds received in the Account from the sale or lease of electricity assets and investments of funds are to be used to retire State debt. For the 1999-2000 financial year a total of $2 410.2 million was applied towards State debt retirement purposes.
4. Operating Revenue
(a) Distribution from Electricity Entities Receipts from the lease/sale of electricity entities assets resulted in an initial payable which at 30 June, had been partly offset by distributions receivable from those entities which for the year ended 30 June 2000 was $1 875.3 million.
(b) Revenue from Government Appropriations Stamp duty was paid to State Taxation from the ERSU Operating Account. The Treasurer approved that $103.9 million of stamp duty revenue be appropriated from the Consolidated Account to the Electricity Sale/Lease Proceeds Account and be used to retire State debt.
Electricity Reform and Sales Unit
849
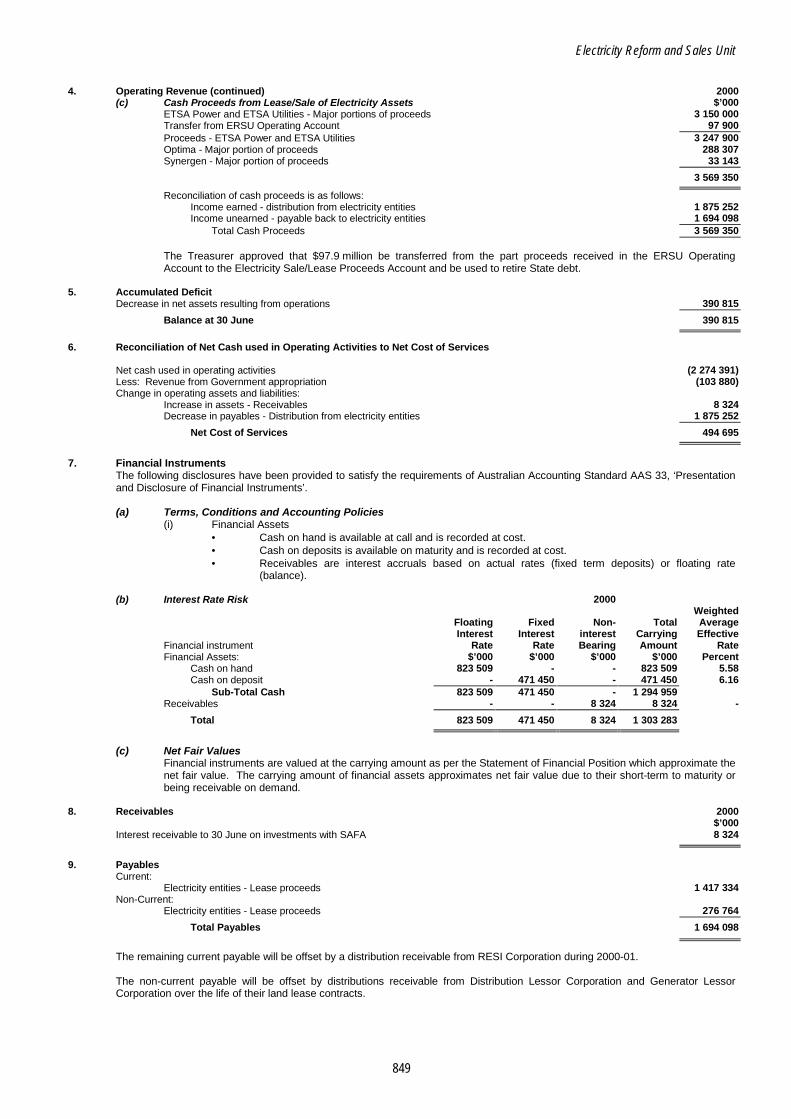
4. Operating Revenue (continued) 2000
(c) Cash Proceeds from Lease/Sale of Electricity Assets $’000 ETSA Power and ETSA Utilities - Major portions of proceeds 3 150 000 Transfer from ERSU Operating Account 97 900 Proceeds - ETSA Power and ETSA Utilities 3 247 900 Optima - Major portion of proceeds 288 307 Synergen - Major portion of proceeds 33 143
3 569 350
Reconciliation of cash proceeds is as follows: Income earned - distribution from electricity entities 1 875 252 Income unearned - payable back to electricity entities 1 694 098
Total Cash Proceeds 3 569 350
The Treasurer approved that $97.9 million be transferred from the part proceeds received in the ERSU Operating Account to the Electricity Sale/Lease Proceeds Account and be used to retire State debt.
5. Accumulated Deficit Decrease in net assets resulting from operations 390 815
Balance at 30 June 390 815
6. Reconciliation of Net Cash used in Operating Activities to Net Cost of Services
Net cash used in operating activities (2 274 391) Less: Revenue from Government appropriation (103 880) Change in operating assets and liabilities:
Increase in assets - Receivables 8 324 Decrease in payables - Distribution from electricity entities 1 875 252
Net Cost of Services 494 695
7. Financial Instruments
The following disclosures have been provided to satisfy the requirements of Australian Accounting Standard AAS 33, ‘Presentation and Disclosure of Financial Instruments’. (a) Terms, Conditions and Accounting Policies
(i) Financial Assets • Cash on hand is available at call and is recorded at cost. • Cash on deposits is available on maturity and is recorded at cost. • Receivables are interest accruals based on actual rates (fixed term deposits) or floating rate
(balance).
(b) Interest Rate Risk 2000 Weighted Floating Fixed Non- Total Average Interest Interest interest Carrying Effective
Financial instrument Rate Rate Bearing Amount Rate Financial Assets: $’000 $’000 $’000 $’000 Percent
Cash on hand 823 509 - - 823 509 5.58 Cash on deposit - 471 450 - 471 450 6.16
Sub-Total Cash 823 509 471 450 - 1 294 959 Receivables - - 8 324 8 324 -
Total 823 509 471 450 8 324 1 303 283
(c) Net Fair Values
Financial instruments are valued at the carrying amount as per the Statement of Financial Position which approximate the net fair value. The carrying amount of financial assets approximates net fair value due to their short-term to maturity or being receivable on demand.
8. Receivables 2000 $’000
Interest receivable to 30 June on investments with SAFA 8 324
9. Payables
Current: Electricity entities - Lease proceeds 1 417 334
Non-Current: Electricity entities - Lease proceeds 276 764
Total Payables 1 694 098
The remaining current payable will be offset by a distribution receivable from RESI Corporation during 2000-01. The non-current payable will be offset by distributions receivable from Distribution Lessor Corporation and Generator Lessor Corporation over the life of their land lease contracts.

Electricity Reform and Sales Unit
850
10. Post Balance Date Events - Status of Other Disposals Note 4(c) to the financial statements refers to the cash proceeds received for the disposal of ETSA Power and ETSA Utilities,
Optima and Synergen. In addition to the disposal of those electricity assets, the status of the remaining electricity assets subject to disposal is as follows:
• Flinders Power Pty Ltd - disposal decision announced by the Treasurer in August 2000.
Disposal proceeds comprise: $’million Cash consideration 313 Assumed superannuation liabilities 31 Future obligation to the Osborne co-generation contract 121
Total Economic Value 465
Cash consideration to be settled in September 2000.
• Terra Gas Trader Pty Ltd - final bids received and assessed, with no final decision made as to disposal.
• ElectraNet SA - at the final bid stage.
851
ELECTRICITY SUPPLY INDUSTRY - OVERVIEW
INTRODUCTION STRUCTURE OF THIS SECTION OF THE REPORT The electricity supply industry is comprised of a number of discrete functions, namely: • Distribution • Generation • Retail • Transmission. To provide an understanding, and to assist with readability, this section of the Report has been structured in the abovementioned sequence with an Overview provided to indicate the evolution of the entities that have made up the electricity supply industry in South Australia. Discussion and comment is included under the relevant function for the main entities existing at 30 June 2000. CHANGES TO AGENCY ORGANISATIONAL STRUCTURES In February 1998 the South Australian Government announced its intention to sell its electricity assets and, at the same time, proposed reforms for the South Australian electricity supply industry, including the restructure of the existing government-owned electricity businesses. To facilitate both the completion of the reform process, and prepare the State’s electricity supply industry assets for a potential sale, on 30 June 1998 the Government announced plans for the restructure of the State’s electricity supply industry. This included the ’disaggregation’ of the electricity businesses, including: • subdivision of the generation function into three competing businesses; • creation of a company to manage the existing gas contracts and to trade in gas; • establishing the transmission function as an autonomous trading entity; • establishing the distribution and retail functions as separate subsidiary entities. In October 1998 the Treasurer approved the establishment of seven Corporations Law companies as subsidiaries under section 23 of the Public Corporations Act 1993. While these companies were created as subsidiaries of public corporations, the Minister issued a Direction pursuant to section 6 of the Public Corporations Act 1993 that required the parent corporations ‘... not to exercise any power of direction ... so as to create or maintain an impediment to the autonomous trading activities’ of the subsidiaries. In June 1999, the Electricity Corporations (Restructuring and Disposal) Act 1999 was passed by Parliament allowing the long-term lease of the State's distribution, generation, retail and transmission assets.

Electricity Supply Industry
852
The structure of the electricity supply industry entities as at 1 July 1999 was as follows:
ETSA Power Corporation
ETSA Energy Corporation
ETSA Transmission Corporation
(t/a ElectraNet SA)
ETSA Corporation
ETSA Capital Pty Ltd
Transmission Leasing Pty
Ltd
ETSA Utilities Pty Ltd
ETSA Power Pty Ltd
ETSA Power Corporation (Victoria) Pty
Ltd
SA Generation Corporation
Flinders Power Pty Ltd
Optima Energy Pty Ltd
Synergen Pty Ltd
Terra Gas Trader Pty Ltd
Treasurer
CHANGES TO ORGANISATIONAL STRUCTURES AND FUNCTIONS IN 1999-2000 During 1999-2000 further changes in the organisational structures and functions of the government-owned electricity entities took place. Significant events were as follows: July 1999 ETSA Capital (No 2) Pty Ltd, Distribution Lessor Corporation and Generation Lessor
Corporation were established as subsidiaries of the Treasurer. Shares held by ETSA Capital Pty Ltd in its subsidiaries (ETSA Utilities Pty Ltd and ETSA Power Pty Ltd) were transferred to ETSA Capital (No 2) Pty Ltd.
December 1999 Assets, including those defined as prescribed electricity distribution assets by the Electricity Corporations (Restructuring and Disposal) Act 1999, were transferred from ETSA Utilities Pty Ltd to Distribution Lessor Corporation. Prescribed distribution assets held by Distribution Lessor Corporation were leased to external parties. Assets (net of liabilities) of both ETSA Utilities Pty Ltd and ETSA Power Pty Ltd were sold. ETSA Power Corporation (Victoria) Pty Ltd was sold.
February 2000 All references to ‘ETSA’ in the names of government owned electricity businesses were changed to ‘RESI’. The name of ETSA Transmission Corporation was changed to Transmission Lessor Corporation.
Electricity Supply Industry
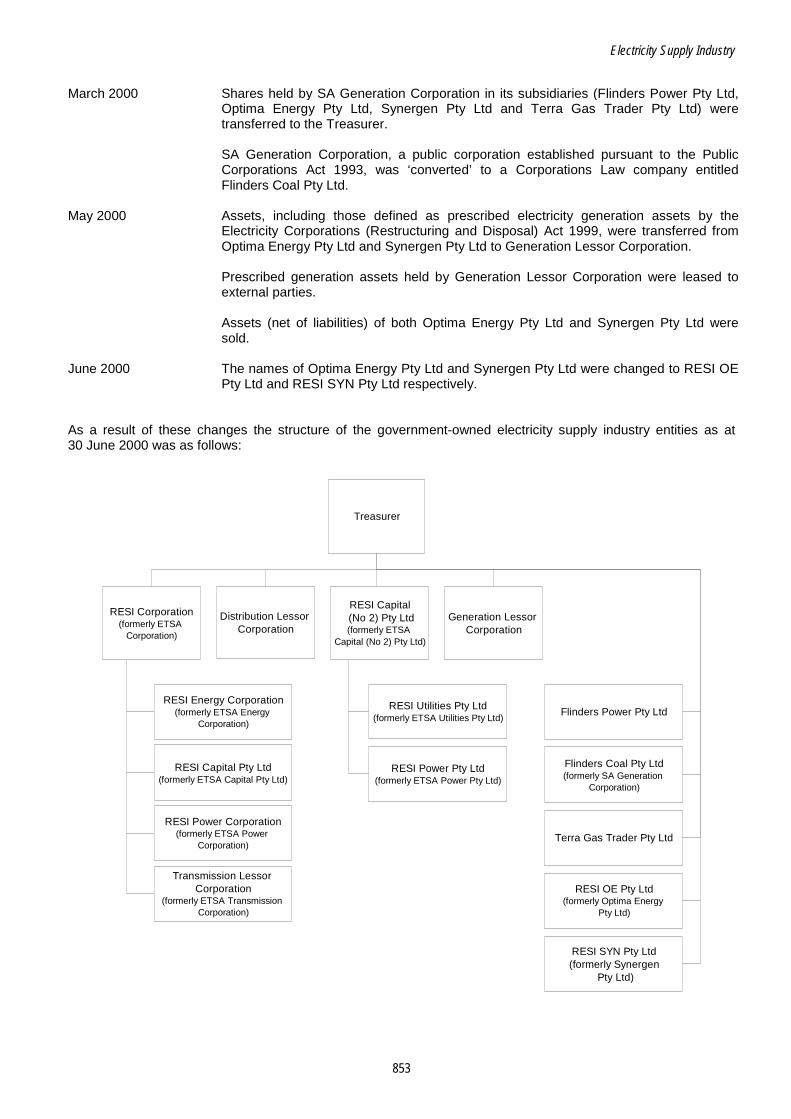
853
March 2000 Shares held by SA Generation Corporation in its subsidiaries (Flinders Power Pty Ltd,
Optima Energy Pty Ltd, Synergen Pty Ltd and Terra Gas Trader Pty Ltd) were transferred to the Treasurer. SA Generation Corporation, a public corporation established pursuant to the Public Corporations Act 1993, was ‘converted’ to a Corporations Law company entitled Flinders Coal Pty Ltd.
May 2000 Assets, including those defined as prescribed electricity generation assets by the Electricity Corporations (Restructuring and Disposal) Act 1999, were transferred from Optima Energy Pty Ltd and Synergen Pty Ltd to Generation Lessor Corporation. Prescribed generation assets held by Generation Lessor Corporation were leased to external parties. Assets (net of liabilities) of both Optima Energy Pty Ltd and Synergen Pty Ltd were sold.
June 2000 The names of Optima Energy Pty Ltd and Synergen Pty Ltd were changed to RESI OE Pty Ltd and RESI SYN Pty Ltd respectively.
As a result of these changes the structure of the government-owned electricity supply industry entities as at 30 June 2000 was as follows:
Treasurer
RESI Corporation (formerly ETSA
Corporation)
Distribution Lessor Corporation
RESI Capital (No 2) Pty Ltd (formerly ETSA
Capital (No 2) Pty Ltd)
Generation Lessor Corporation
RESI Power Corporation (formerly ETSA Power
Corporation)
RESI Energy Corporation (formerly ETSA Energy
Corporation)
Transmission Lessor Corporation
(formerly ETSA Transmission Corporation)
RESI Capital Pty Ltd (formerly ETSA Capital Pty Ltd)
Terra Gas Trader Pty Ltd
Flinders Power Pty Ltd
RESI OE Pty Ltd (formerly Optima Energy
Pty Ltd)
Flinders Coal Pty Ltd (formerly SA Generation
Corporation)
RESI SYN Pty Ltd (formerly Synergen
Pty Ltd)
RESI Utilities Pty Ltd (formerly ETSA Utilities Pty Ltd)
RESI Power Pty Ltd (formerly ETSA Power Pty Ltd)
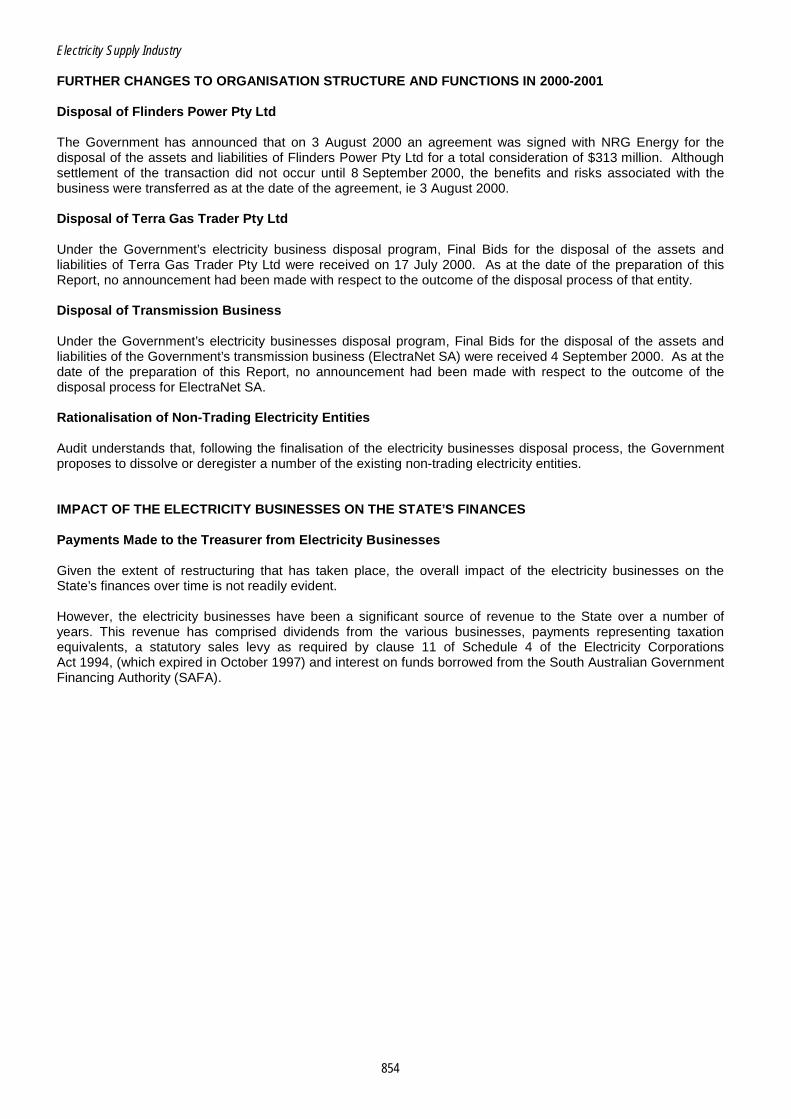
Electricity Supply Industry
854
FURTHER CHANGES TO ORGANISATION STRUCTURE AND FUNCTIONS IN 2000-2001 Disposal of Flinders Power Pty Ltd The Government has announced that on 3 August 2000 an agreement was signed with NRG Energy for the disposal of the assets and liabilities of Flinders Power Pty Ltd for a total consideration of $313 million. Although settlement of the transaction did not occur until 8 September 2000, the benefits and risks associated with the business were transferred as at the date of the agreement, ie 3 August 2000. Disposal of Terra Gas Trader Pty Ltd Under the Government’s electricity business disposal program, Final Bids for the disposal of the assets and liabilities of Terra Gas Trader Pty Ltd were received on 17 July 2000. As at the date of the preparation of this Report, no announcement had been made with respect to the outcome of the disposal process of that entity. Disposal of Transmission Business Under the Government’s electricity businesses disposal program, Final Bids for the disposal of the assets and liabilities of the Government’s transmission business (ElectraNet SA) were received 4 September 2000. As at the date of the preparation of this Report, no announcement had been made with respect to the outcome of the disposal process for ElectraNet SA. Rationalisation of Non-Trading Electricity Entities Audit understands that, following the finalisation of the electricity businesses disposal process, the Government proposes to dissolve or deregister a number of the existing non-trading electricity entities. IMPACT OF THE ELECTRICITY BUSINESSES ON THE STATE’S FINANCES Payments Made to the Treasurer from Electricity Businesses Given the extent of restructuring that has taken place, the overall impact of the electricity businesses on the State’s finances over time is not readily evident. However, the electricity businesses have been a significant source of revenue to the State over a number of years. This revenue has comprised dividends from the various businesses, payments representing taxation equivalents, a statutory sales levy as required by clause 11 of Schedule 4 of the Electricity Corporations Act 1994, (which expired in October 1997) and interest on funds borrowed from the South Australian Government Financing Authority (SAFA).
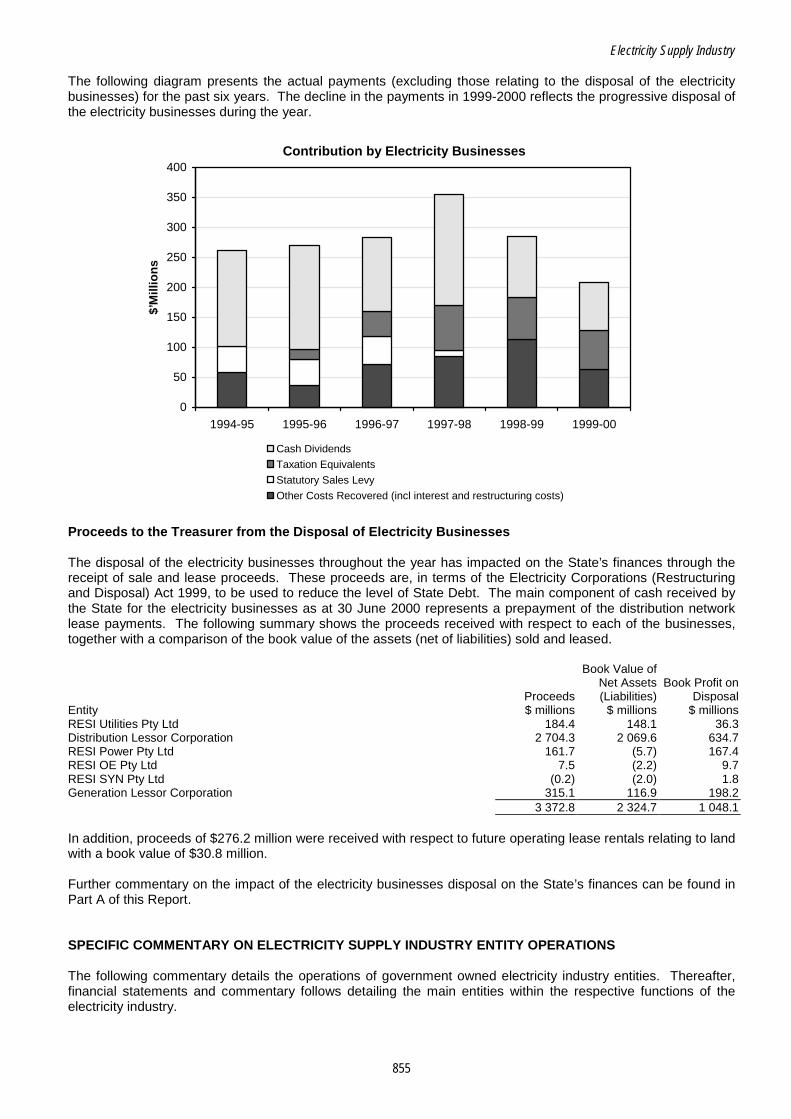
Electricity Supply Industry
855
The following diagram presents the actual payments (excluding those relating to the disposal of the electricity businesses) for the past six years. The decline in the payments in 1999-2000 reflects the progressive disposal of the electricity businesses during the year.
Contribution by Electricity Businesses
0
50
100
150
200
250
300
350
400
1994-95 1995-96 1996-97 1997-98 1998-99 1999-00
$’M
illio
ns
Cash Dividends
Taxation Equivalents
Statutory Sales Levy
Other Costs Recovered (incl interest and restructuring costs)
Proceeds to the Treasurer from the Disposal of Electricity Businesses The disposal of the electricity businesses throughout the year has impacted on the State’s finances through the receipt of sale and lease proceeds. These proceeds are, in terms of the Electricity Corporations (Restructuring and Disposal) Act 1999, to be used to reduce the level of State Debt. The main component of cash received by the State for the electricity businesses as at 30 June 2000 represents a prepayment of the distribution network lease payments. The following summary shows the proceeds received with respect to each of the businesses, together with a comparison of the book value of the assets (net of liabilities) sold and leased. Book Value of Net Assets Book Profit on Proceeds (Liabilities) Disposal Entity $ millions $ millions $ millions RESI Utilities Pty Ltd 184.4 148.1 36.3 Distribution Lessor Corporation 2 704.3 2 069.6 634.7 RESI Power Pty Ltd 161.7 (5.7) 167.4 RESI OE Pty Ltd 7.5 (2.2) 9.7 RESI SYN Pty Ltd (0.2) (2.0) 1.8 Generation Lessor Corporation 315.1 116.9 198.2 3 372.8 2 324.7 1 048.1 In addition, proceeds of $276.2 million were received with respect to future operating lease rentals relating to land with a book value of $30.8 million. Further commentary on the impact of the electricity businesses disposal on the State’s finances can be found in Part A of this Report. SPECIFIC COMMENTARY ON ELECTRICITY SUPPLY INDUSTRY ENTITY OPERATIONS The following commentary details the operations of government owned electricity industry entities. Thereafter, financial statements and commentary follows detailing the main entities within the respective functions of the electricity industry.
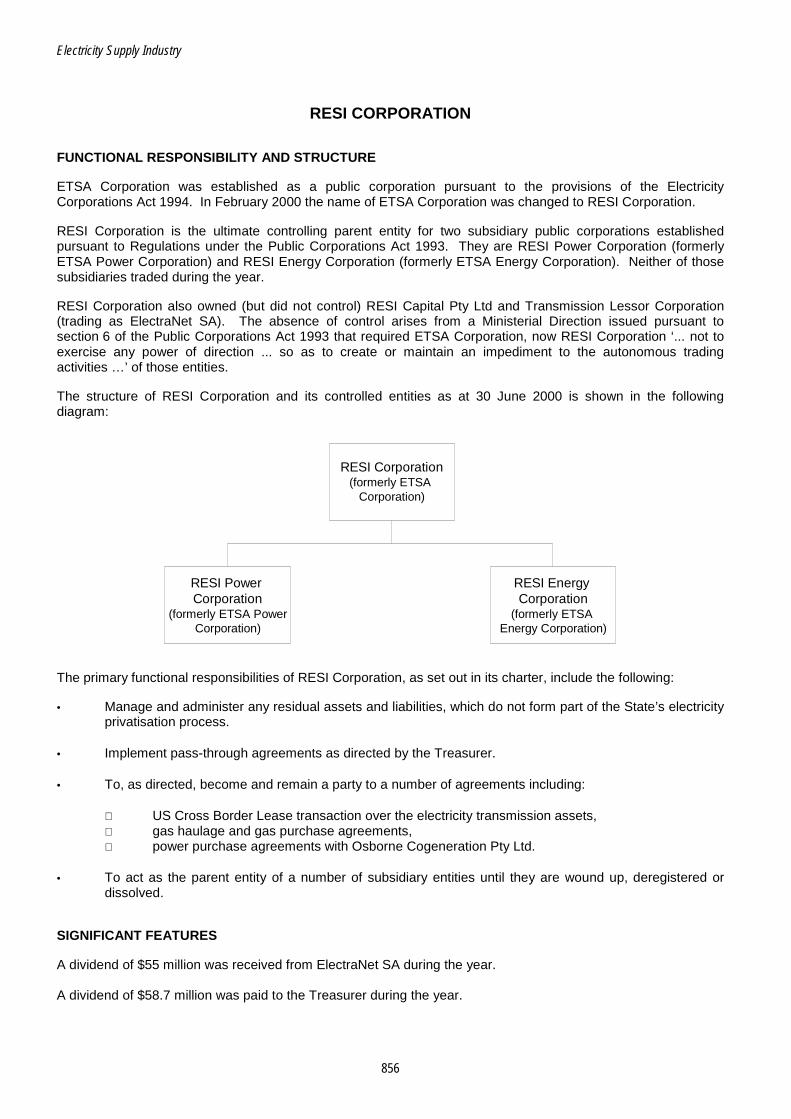
Electricity Supply Industry
856
RESI CORPORATION FUNCTIONAL RESPONSIBILITY AND STRUCTURE ETSA Corporation was established as a public corporation pursuant to the provisions of the Electricity Corporations Act 1994. In February 2000 the name of ETSA Corporation was changed to RESI Corporation. RESI Corporation is the ultimate controlling parent entity for two subsidiary public corporations established pursuant to Regulations under the Public Corporations Act 1993. They are RESI Power Corporation (formerly ETSA Power Corporation) and RESI Energy Corporation (formerly ETSA Energy Corporation). Neither of those subsidiaries traded during the year. RESI Corporation also owned (but did not control) RESI Capital Pty Ltd and Transmission Lessor Corporation (trading as ElectraNet SA). The absence of control arises from a Ministerial Direction issued pursuant to section 6 of the Public Corporations Act 1993 that required ETSA Corporation, now RESI Corporation ‘... not to exercise any power of direction ... so as to create or maintain an impediment to the autonomous trading activities …’ of those entities. The structure of RESI Corporation and its controlled entities as at 30 June 2000 is shown in the following diagram:
RESI Corporation (formerly ETSA
Corporation)
RESI Power Corporation
(formerly ETSA Power Corporation)
RESI Energy Corporation
(formerly ETSA Energy Corporation)
The primary functional responsibilities of RESI Corporation, as set out in its charter, include the following: • Manage and administer any residual assets and liabilities, which do not form part of the State’s electricity
privatisation process.
• Implement pass-through agreements as directed by the Treasurer.
• To, as directed, become and remain a party to a number of agreements including:
US Cross Border Lease transaction over the electricity transmission assets, gas haulage and gas purchase agreements, power purchase agreements with Osborne Cogeneration Pty Ltd.
• To act as the parent entity of a number of subsidiary entities until they are wound up, deregistered or dissolved.
SIGNIFICANT FEATURES A dividend of $55 million was received from ElectraNet SA during the year. A dividend of $58.7 million was paid to the Treasurer during the year.
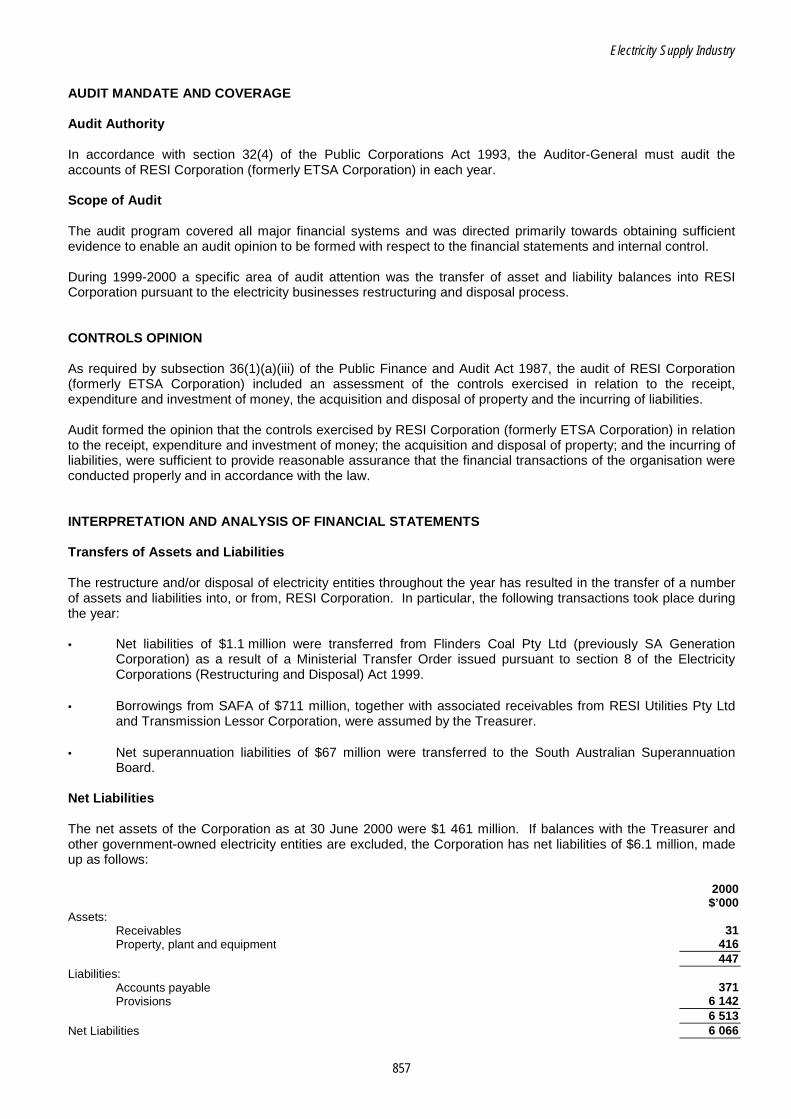
Electricity Supply Industry
857
AUDIT MANDATE AND COVERAGE Audit Authority In accordance with section 32(4) of the Public Corporations Act 1993, the Auditor-General must audit the accounts of RESI Corporation (formerly ETSA Corporation) in each year. Scope of Audit The audit program covered all major financial systems and was directed primarily towards obtaining sufficient evidence to enable an audit opinion to be formed with respect to the financial statements and internal control. During 1999-2000 a specific area of audit attention was the transfer of asset and liability balances into RESI Corporation pursuant to the electricity businesses restructuring and disposal process. CONTROLS OPINION As required by subsection 36(1)(a)(iii) of the Public Finance and Audit Act 1987, the audit of RESI Corporation (formerly ETSA Corporation) included an assessment of the controls exercised in relation to the receipt, expenditure and investment of money, the acquisition and disposal of property and the incurring of liabilities. Audit formed the opinion that the controls exercised by RESI Corporation (formerly ETSA Corporation) in relation to the receipt, expenditure and investment of money; the acquisition and disposal of property; and the incurring of liabilities, were sufficient to provide reasonable assurance that the financial transactions of the organisation were conducted properly and in accordance with the law. INTERPRETATION AND ANALYSIS OF FINANCIAL STATEMENTS Transfers of Assets and Liabilities The restructure and/or disposal of electricity entities throughout the year has resulted in the transfer of a number of assets and liabilities into, or from, RESI Corporation. In particular, the following transactions took place during the year: • Net liabilities of $1.1 million were transferred from Flinders Coal Pty Ltd (previously SA Generation
Corporation) as a result of a Ministerial Transfer Order issued pursuant to section 8 of the Electricity Corporations (Restructuring and Disposal) Act 1999.
• Borrowings from SAFA of $711 million, together with associated receivables from RESI Utilities Pty Ltd and Transmission Lessor Corporation, were assumed by the Treasurer.
• Net superannuation liabilities of $67 million were transferred to the South Australian Superannuation Board.
Net Liabilities The net assets of the Corporation as at 30 June 2000 were $1 461 million. If balances with the Treasurer and other government-owned electricity entities are excluded, the Corporation has net liabilities of $6.1 million, made up as follows: 2000 $’000 Assets:
Receivables 31 Property, plant and equipment 416
447 Liabilities:
Accounts payable 371 Provisions 6 142
6 513 Net Liabilities 6 066
Electricity Supply Industry
858
Provisions Provisions of $6.1 million are made up as follows: 2000 $’000 Cost for disposal of contaminated materials 138 Demolition and site restoration costs associated with land at Port Lincoln and Osborne 1 724 Claims relating to self insured risks 3 113 Retirement benefits for Directors and ex-employees 1 167 6 142

Electricity Supply Industry
859
Profit and Loss Statement for the year ended 30 June 2000 Consolidated Parent Entity 2000 1999 2000 1999 Note $’000 $’000 $’000 $’000 OPERATING REVENUES:
Other revenue 2 114 911 195 200 114 911 195 200 Total Operating Revenues 114 911 195 200 114 911 195 200
OPERATING EXPENSES:
Operations and services 3 415 602 415 602 Depreciation and amortisation 4 3 3 3 3
Total Operating Expenses 418 605 418 605 EARNINGS BEFORE INCOME TAX 114 493 194 595 114 493 194 595 Borrowing costs 5 65 675 91 205 65 675 91 205 OPERATING PROFIT BEFORE ABNORMAL ITEMS AND INCOME TAX 48 818 103 390 48 818 103 390 Profit on abnormal items before income tax 6 7 630 93 7 630 93 OPERATING PROFIT BEFORE INCOME TAX 56 448 103 483 56 448 103 483 Income tax expense (benefit) attributable to operating profit 7 - (11 591) - (11 591) OPERATING PROFIT AFTER INCOME TAX 56 448 115 074 56 448 115 074 Profit (loss) on extraordinary items 8 - (102 904) - (35 736) OPERATING PROFIT AND EXTRAORDINARY ITEMS AFTER INCOME TAX 56 448 12 170 56 448 79 338 Retained profits at 1 July 40 635 138 345 17 673 48 215 Aggregate of amounts transferred from reserves 17 123 001 - 123 001 - TOTAL AVAILABLE FOR APPROPRIATION 220 084 150 515 197 122 127 553 Dividend paid or provided for 9 58 700 109 880 58 700 109 880
RETAINED PROFITS AT 30 JUNE 161 384 40 635 138 422 17 673
Balance Sheet as at 30 June 2000 Consolidated Parent Entity 2000 1999 2000 1999 Note $’000 $’000 $’000 $’000 CURRENT ASSETS:
Cash and deposits 10 13 995 - 13 995 - Receivables 11 1 429 819 110 699 1 429 819 110 699
Total Current Assets 1 443 814 110 699 1 443 814 110 699 NON-CURRENT ASSETS:
Receivables 11 - 2 214 396 - 2 214 396 Investments 12 142 346 142 346 503 175 503 175 Property, plant and equipment 13 416 419 416 419
Total Non-Current Assets 142 762 2 357 161 503 591 2 717 990 Total Assets 1 586 576 2 467 860 1 947 405 2 828 689
CURRENT LIABILITIES:
Accounts payable 14 371 48 010 371 48 010 Borrowings 15 46 777 99 749 46 777 99 749 Provisions 16 2 104 24 876 2 104 24 876
Total Current Liabilities 49 252 172 635 49 252 172 635 NON-CURRENT LIABILITIES:
Accounts payable 14 71 902 83 875 1 455 693 1 467 666 Borrowings 15 - 678 915 - 678 915 Provisions 16 4 038 68 799 4 038 68 799
Total Non-Current Liabilities 75 940 831 589 1 459 731 2 215 380 Total Liabilities 125 192 1 004 224 1 508 983 2 388 015
Net Assets 1 461 384 1 463 636 438 422 440 674
EQUITY:
Share capital 17 300 000 300 000 300 000 300 000 Reserves 17 1 000 000 1 123 001 - 123 001 Retained profits 161 384 40 635 138 422 17 673
TOTAL EQUITY 1 461 384 1 463 636 438 422 440 674
Contingent Liabilities 26 Commitments 20, 27
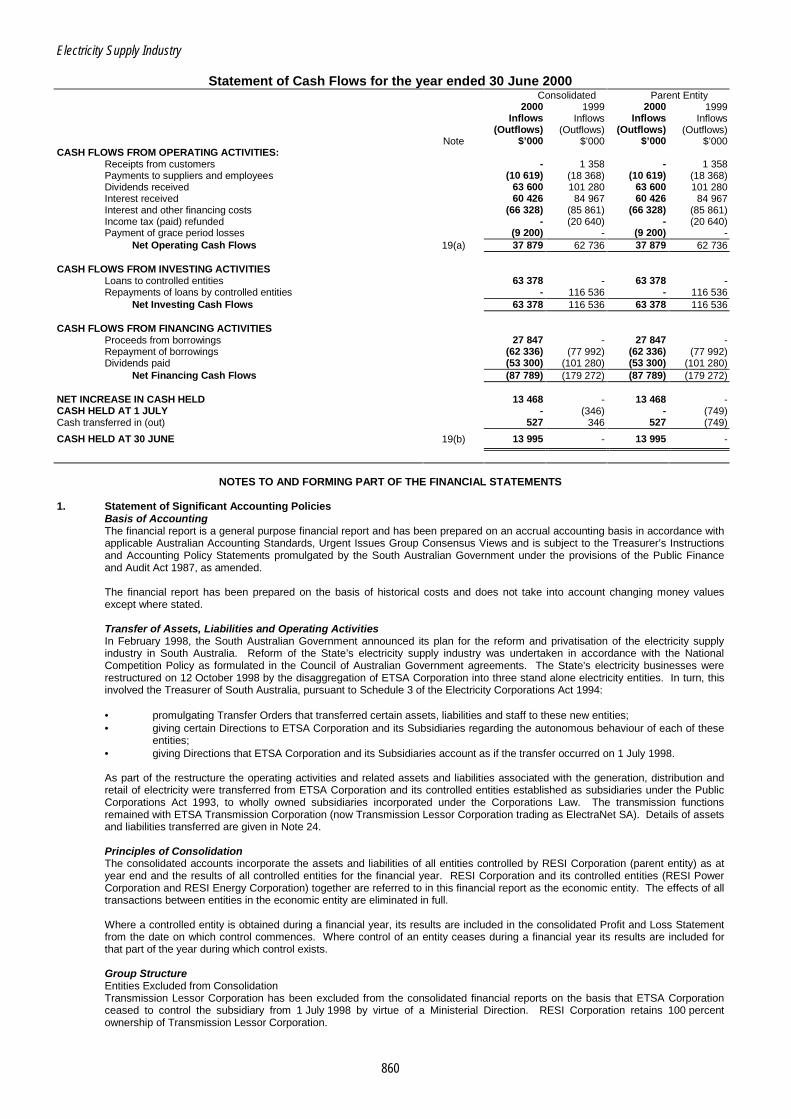
Electricity Supply Industry
860
Statement of Cash Flows for the year ended 30 June 2000 Consolidated Parent Entity 2000 1999 2000 1999 Inflows Inflows Inflows Inflows (Outflows) (Outflows) (Outflows) (Outflows) Note $’000 $’000 $’000 $’000 CASH FLOWS FROM OPERATING ACTIVITIES:
Receipts from customers - 1 358 - 1 358 Payments to suppliers and employees (10 619) (18 368) (10 619) (18 368) Dividends received 63 600 101 280 63 600 101 280 Interest received 60 426 84 967 60 426 84 967 Interest and other financing costs (66 328) (85 861) (66 328) (85 861) Income tax (paid) refunded - (20 640) - (20 640) Payment of grace period losses (9 200) - (9 200) -
Net Operating Cash Flows 19(a) 37 879 62 736 37 879 62 736 CASH FLOWS FROM INVESTING ACTIVITIES
Loans to controlled entities 63 378 - 63 378 - Repayments of loans by controlled entities - 116 536 - 116 536
Net Investing Cash Flows 63 378 116 536 63 378 116 536 CASH FLOWS FROM FINANCING ACTIVITIES
Proceeds from borrowings 27 847 - 27 847 - Repayment of borrowings (62 336) (77 992) (62 336) (77 992) Dividends paid (53 300) (101 280) (53 300) (101 280)
Net Financing Cash Flows (87 789) (179 272) (87 789) (179 272) NET INCREASE IN CASH HELD 13 468 - 13 468 - CASH HELD AT 1 JULY - (346) - (749) Cash transferred in (out) 527 346 527 (749)
CASH HELD AT 30 JUNE 19(b) 13 995 - 13 995 -
NOTES TO AND FORMING PART OF THE FINANCIAL STATEMENTS 1. Statement of Significant Accounting Policies
Basis of Accounting The financial report is a general purpose financial report and has been prepared on an accrual accounting basis in accordance with applicable Australian Accounting Standards, Urgent Issues Group Consensus Views and is subject to the Treasurer’s Instructions and Accounting Policy Statements promulgated by the South Australian Government under the provisions of the Public Finance and Audit Act 1987, as amended.
The financial report has been prepared on the basis of historical costs and does not take into account changing money values except where stated.
Transfer of Assets, Liabilities and Operating Activities In February 1998, the South Australian Government announced its plan for the reform and privatisation of the electricity supply industry in South Australia. Reform of the State’s electricity supply industry was undertaken in accordance with the National Competition Policy as formulated in the Council of Australian Government agreements. The State’s electricity businesses were restructured on 12 October 1998 by the disaggregation of ETSA Corporation into three stand alone electricity entities. In turn, this involved the Treasurer of South Australia, pursuant to Schedule 3 of the Electricity Corporations Act 1994: • promulgating Transfer Orders that transferred certain assets, liabilities and staff to these new entities; • giving certain Directions to ETSA Corporation and its Subsidiaries regarding the autonomous behaviour of each of these
entities; • giving Directions that ETSA Corporation and its Subsidiaries account as if the transfer occurred on 1 July 1998. As part of the restructure the operating activities and related assets and liabilities associated with the generation, distribution and retail of electricity were transferred from ETSA Corporation and its controlled entities established as subsidiaries under the Public Corporations Act 1993, to wholly owned subsidiaries incorporated under the Corporations Law. The transmission functions remained with ETSA Transmission Corporation (now Transmission Lessor Corporation trading as ElectraNet SA). Details of assets and liabilities transferred are given in Note 24.
Principles of Consolidation The consolidated accounts incorporate the assets and liabilities of all entities controlled by RESI Corporation (parent entity) as at year end and the results of all controlled entities for the financial year. RESI Corporation and its controlled entities (RESI Power Corporation and RESI Energy Corporation) together are referred to in this financial report as the economic entity. The effects of all transactions between entities in the economic entity are eliminated in full.
Where a controlled entity is obtained during a financial year, its results are included in the consolidated Profit and Loss Statement from the date on which control commences. Where control of an entity ceases during a financial year its results are included for that part of the year during which control exists.
Group Structure Entities Excluded from Consolidation Transmission Lessor Corporation has been excluded from the consolidated financial reports on the basis that ETSA Corporation ceased to control the subsidiary from 1 July 1998 by virtue of a Ministerial Direction. RESI Corporation retains 100 percent ownership of Transmission Lessor Corporation.
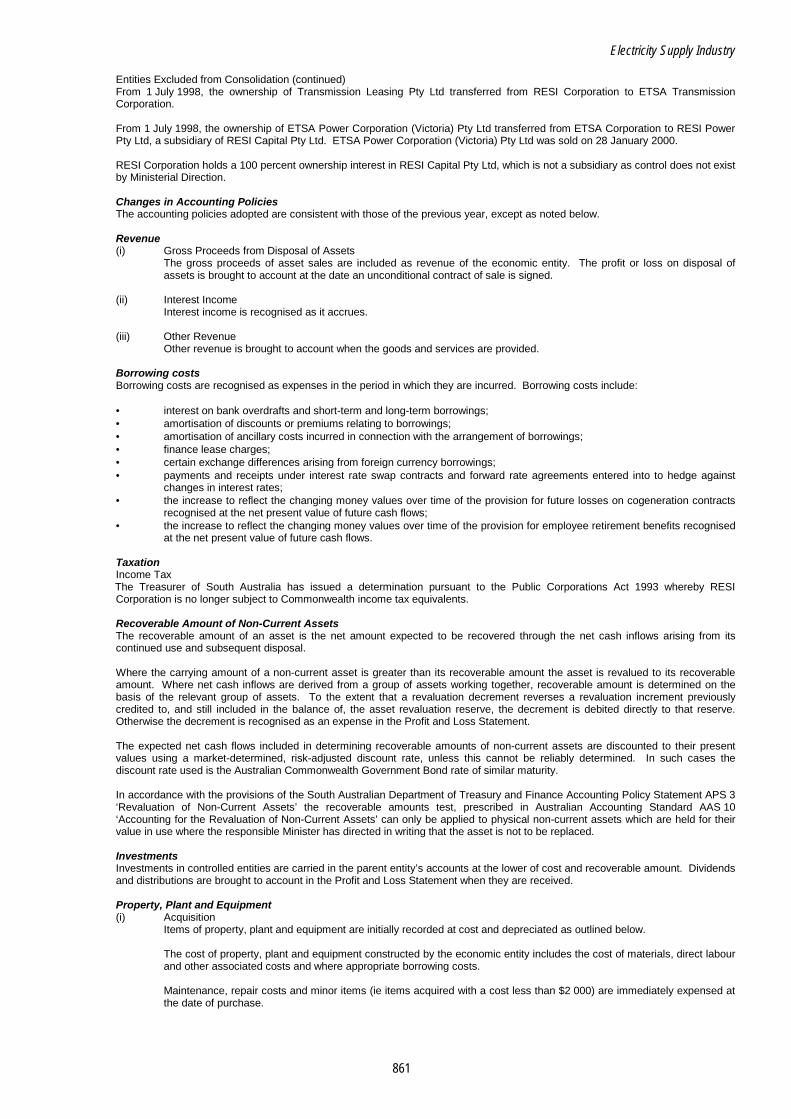
Electricity Supply Industry
861
Entities Excluded from Consolidation (continued) From 1 July 1998, the ownership of Transmission Leasing Pty Ltd transferred from RESI Corporation to ETSA Transmission Corporation.
From 1 July 1998, the ownership of ETSA Power Corporation (Victoria) Pty Ltd transferred from ETSA Corporation to RESI Power Pty Ltd, a subsidiary of RESI Capital Pty Ltd. ETSA Power Corporation (Victoria) Pty Ltd was sold on 28 January 2000.
RESI Corporation holds a 100 percent ownership interest in RESI Capital Pty Ltd, which is not a subsidiary as control does not exist by Ministerial Direction.
Changes in Accounting Policies The accounting policies adopted are consistent with those of the previous year, except as noted below.
Revenue (i) Gross Proceeds from Disposal of Assets
The gross proceeds of asset sales are included as revenue of the economic entity. The profit or loss on disposal of assets is brought to account at the date an unconditional contract of sale is signed.
(ii) Interest Income
Interest income is recognised as it accrues.
(iii) Other Revenue Other revenue is brought to account when the goods and services are provided.
Borrowing costs Borrowing costs are recognised as expenses in the period in which they are incurred. Borrowing costs include:
• interest on bank overdrafts and short-term and long-term borrowings; • amortisation of discounts or premiums relating to borrowings; • amortisation of ancillary costs incurred in connection with the arrangement of borrowings; • finance lease charges; • certain exchange differences arising from foreign currency borrowings; • payments and receipts under interest rate swap contracts and forward rate agreements entered into to hedge against
changes in interest rates; • the increase to reflect the changing money values over time of the provision for future losses on cogeneration contracts
recognised at the net present value of future cash flows; • the increase to reflect the changing money values over time of the provision for employee retirement benefits recognised
at the net present value of future cash flows.
Taxation Income Tax The Treasurer of South Australia has issued a determination pursuant to the Public Corporations Act 1993 whereby RESI Corporation is no longer subject to Commonwealth income tax equivalents.
Recoverable Amount of Non-Current Assets The recoverable amount of an asset is the net amount expected to be recovered through the net cash inflows arising from its continued use and subsequent disposal.
Where the carrying amount of a non-current asset is greater than its recoverable amount the asset is revalued to its recoverable amount. Where net cash inflows are derived from a group of assets working together, recoverable amount is determined on the basis of the relevant group of assets. To the extent that a revaluation decrement reverses a revaluation increment previously credited to, and still included in the balance of, the asset revaluation reserve, the decrement is debited directly to that reserve. Otherwise the decrement is recognised as an expense in the Profit and Loss Statement.
The expected net cash flows included in determining recoverable amounts of non-current assets are discounted to their present values using a market-determined, risk-adjusted discount rate, unless this cannot be reliably determined. In such cases the discount rate used is the Australian Commonwealth Government Bond rate of similar maturity.
In accordance with the provisions of the South Australian Department of Treasury and Finance Accounting Policy Statement APS 3 ‘Revaluation of Non-Current Assets’ the recoverable amounts test, prescribed in Australian Accounting Standard AAS 10 ‘Accounting for the Revaluation of Non-Current Assets’ can only be applied to physical non-current assets which are held for their value in use where the responsible Minister has directed in writing that the asset is not to be replaced.
Investments Investments in controlled entities are carried in the parent entity’s accounts at the lower of cost and recoverable amount. Dividends and distributions are brought to account in the Profit and Loss Statement when they are received.
Property, Plant and Equipment (i) Acquisition
Items of property, plant and equipment are initially recorded at cost and depreciated as outlined below. The cost of property, plant and equipment constructed by the economic entity includes the cost of materials, direct labour and other associated costs and where appropriate borrowing costs.
Maintenance, repair costs and minor items (ie items acquired with a cost less than $2 000) are immediately expensed at the date of purchase.
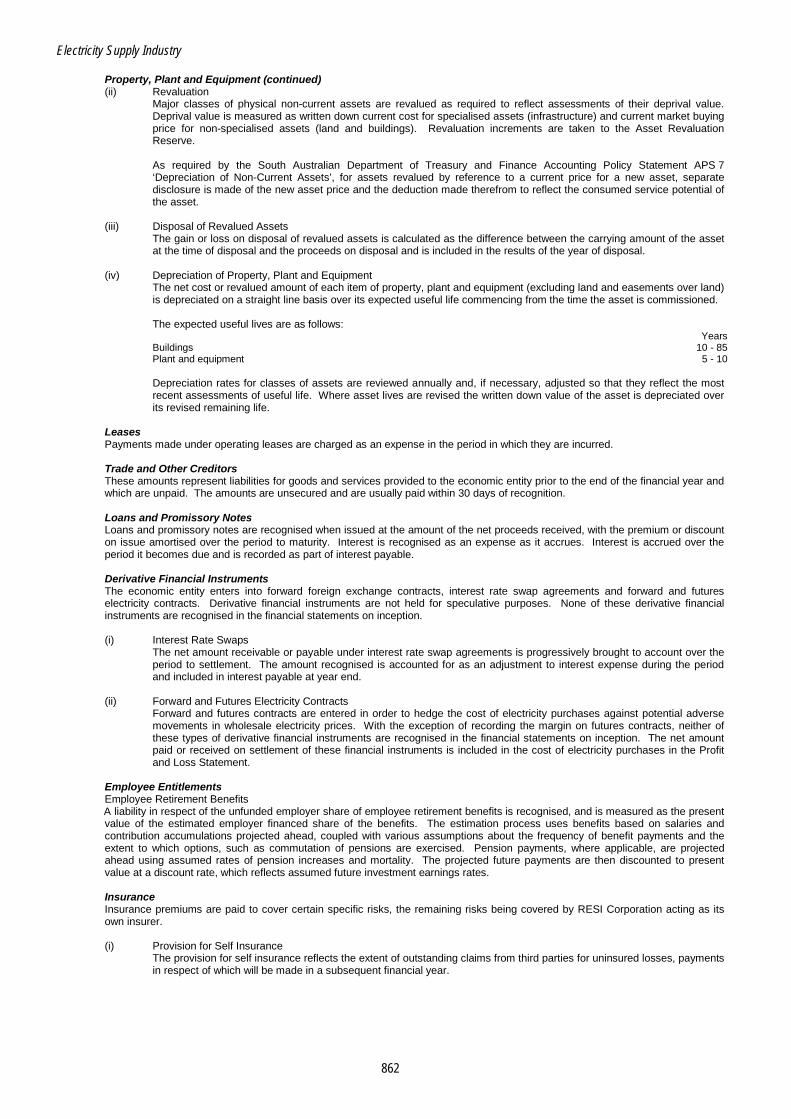
Electricity Supply Industry
862
Property, Plant and Equipment (continued) (ii) Revaluation
Major classes of physical non-current assets are revalued as required to reflect assessments of their deprival value. Deprival value is measured as written down current cost for specialised assets (infrastructure) and current market buying price for non-specialised assets (land and buildings). Revaluation increments are taken to the Asset Revaluation Reserve.
As required by the South Australian Department of Treasury and Finance Accounting Policy Statement APS 7 ‘Depreciation of Non-Current Assets’, for assets revalued by reference to a current price for a new asset, separate disclosure is made of the new asset price and the deduction made therefrom to reflect the consumed service potential of the asset.
(iii) Disposal of Revalued Assets
The gain or loss on disposal of revalued assets is calculated as the difference between the carrying amount of the asset at the time of disposal and the proceeds on disposal and is included in the results of the year of disposal.
(iv) Depreciation of Property, Plant and Equipment
The net cost or revalued amount of each item of property, plant and equipment (excluding land and easements over land) is depreciated on a straight line basis over its expected useful life commencing from the time the asset is commissioned.
The expected useful lives are as follows:
Years Buildings 10 - 85 Plant and equipment 5 - 10
Depreciation rates for classes of assets are reviewed annually and, if necessary, adjusted so that they reflect the most recent assessments of useful life. Where asset lives are revised the written down value of the asset is depreciated over its revised remaining life.
Leases Payments made under operating leases are charged as an expense in the period in which they are incurred.
Trade and Other Creditors These amounts represent liabilities for goods and services provided to the economic entity prior to the end of the financial year and which are unpaid. The amounts are unsecured and are usually paid within 30 days of recognition.
Loans and Promissory Notes Loans and promissory notes are recognised when issued at the amount of the net proceeds received, with the premium or discount on issue amortised over the period to maturity. Interest is recognised as an expense as it accrues. Interest is accrued over the period it becomes due and is recorded as part of interest payable.
Derivative Financial Instruments The economic entity enters into forward foreign exchange contracts, interest rate swap agreements and forward and futures electricity contracts. Derivative financial instruments are not held for speculative purposes. None of these derivative financial instruments are recognised in the financial statements on inception.
(i) Interest Rate Swaps
The net amount receivable or payable under interest rate swap agreements is progressively brought to account over the period to settlement. The amount recognised is accounted for as an adjustment to interest expense during the period and included in interest payable at year end.
(ii) Forward and Futures Electricity Contracts
Forward and futures contracts are entered in order to hedge the cost of electricity purchases against potential adverse movements in wholesale electricity prices. With the exception of recording the margin on futures contracts, neither of these types of derivative financial instruments are recognised in the financial statements on inception. The net amount paid or received on settlement of these financial instruments is included in the cost of electricity purchases in the Profit and Loss Statement.
Employee Entitlements Employee Retirement Benefits A liability in respect of the unfunded employer share of employee retirement benefits is recognised, and is measured as the present value of the estimated employer financed share of the benefits. The estimation process uses benefits based on salaries and contribution accumulations projected ahead, coupled with various assumptions about the frequency of benefit payments and the extent to which options, such as commutation of pensions are exercised. Pension payments, where applicable, are projected ahead using assumed rates of pension increases and mortality. The projected future payments are then discounted to present value at a discount rate, which reflects assumed future investment earnings rates.
Insurance Insurance premiums are paid to cover certain specific risks, the remaining risks being covered by RESI Corporation acting as its own insurer.
(i) Provision for Self Insurance
The provision for self insurance reflects the extent of outstanding claims from third parties for uninsured losses, payments in respect of which will be made in a subsequent financial year.
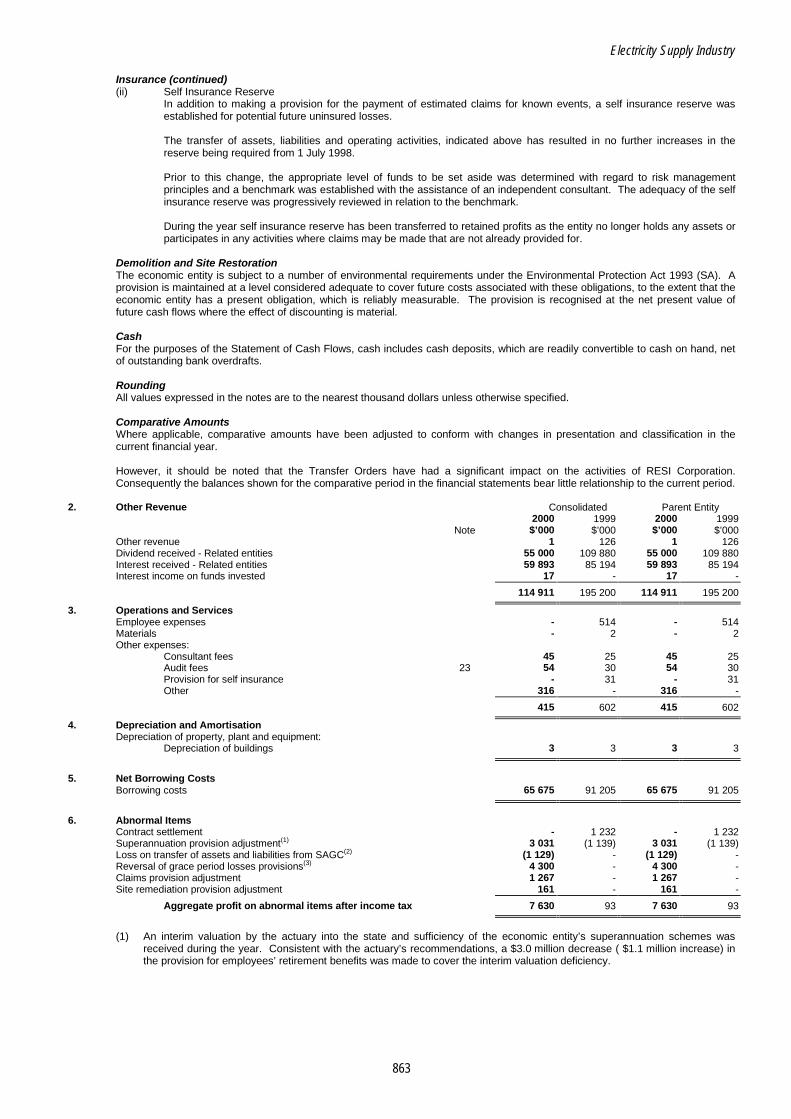
Electricity Supply Industry
863
Insurance (continued) (ii) Self Insurance Reserve
In addition to making a provision for the payment of estimated claims for known events, a self insurance reserve was established for potential future uninsured losses.
The transfer of assets, liabilities and operating activities, indicated above has resulted in no further increases in the reserve being required from 1 July 1998.
Prior to this change, the appropriate level of funds to be set aside was determined with regard to risk management principles and a benchmark was established with the assistance of an independent consultant. The adequacy of the self insurance reserve was progressively reviewed in relation to the benchmark.
During the year self insurance reserve has been transferred to retained profits as the entity no longer holds any assets or participates in any activities where claims may be made that are not already provided for.
Demolition and Site Restoration The economic entity is subject to a number of environmental requirements under the Environmental Protection Act 1993 (SA). A provision is maintained at a level considered adequate to cover future costs associated with these obligations, to the extent that the economic entity has a present obligation, which is reliably measurable. The provision is recognised at the net present value of future cash flows where the effect of discounting is material.
Cash For the purposes of the Statement of Cash Flows, cash includes cash deposits, which are readily convertible to cash on hand, net of outstanding bank overdrafts.
Rounding All values expressed in the notes are to the nearest thousand dollars unless otherwise specified.
Comparative Amounts Where applicable, comparative amounts have been adjusted to conform with changes in presentation and classification in the current financial year.
However, it should be noted that the Transfer Orders have had a significant impact on the activities of RESI Corporation. Consequently the balances shown for the comparative period in the financial statements bear little relationship to the current period.
2. Other Revenue Consolidated Parent Entity 2000 1999 2000 1999 Note $’000 $’000 $’000 $’000
Other revenue 1 126 1 126 Dividend received - Related entities 55 000 109 880 55 000 109 880 Interest received - Related entities 59 893 85 194 59 893 85 194 Interest income on funds invested 17 - 17 -
114 911 195 200 114 911 195 200
3. Operations and Services Employee expenses - 514 - 514 Materials - 2 - 2 Other expenses:
Consultant fees 45 25 45 25 Audit fees 23 54 30 54 30 Provision for self insurance - 31 - 31 Other 316 - 316 -
415 602 415 602
4. Depreciation and Amortisation Depreciation of property, plant and equipment:
Depreciation of buildings 3 3 3 3
5. Net Borrowing Costs
Borrowing costs 65 675 91 205 65 675 91 205
6. Abnormal Items
Contract settlement - 1 232 - 1 232 Superannuation provision adjustment(1) 3 031 (1 139) 3 031 (1 139) Loss on transfer of assets and liabilities from SAGC(2) (1 129) - (1 129) - Reversal of grace period losses provisions(3) 4 300 - 4 300 - Claims provision adjustment 1 267 - 1 267 - Site remediation provision adjustment 161 - 161 -
Aggregate profit on abnormal items after income tax 7 630 93 7 630 93
(1) An interim valuation by the actuary into the state and sufficiency of the economic entity’s superannuation schemes was
received during the year. Consistent with the actuary’s recommendations, a $3.0 million decrease ( $1.1 million increase) in the provision for employees’ retirement benefits was made to cover the interim valuation deficiency.

Electricity Supply Industry
864
6. Abnormal Items (continued) In March 2000 the Treasurer of the state of South Australia transferred the majority of the superannuation provisions in
relation to unfunded superannuation liabilities for former employees of the electricity industry to the South Australian Superannuation Scheme, pursuant to the new Schedule 1B of the Superannuation Act 1988. RESI Corporation still remains liable for the unfunded portions of superannuation in relation to the remaining Directors of RESI Corporation and SA Generation Corporation and a small number of ex-employees who are now employed by the Department of Primary Industries and Resources. Abnormal item for the year ended 30 June 2000 represents the provisions written back after the transfer to the South Australian Superannuation Scheme and the remaining provisions in relation to existing Directors and ex-employees.
(2) RESI Corporation received net liabilities of $1.1 million from SA Generation Corporation at no consideration on
23 March 2000. This transfer comprised $0.5 million cash, $0.7 million loans receivable, $1.6 million superannuation liability and a $0.7 million provision for site demolition.
(3) Grace period loss provision represents anticipated losses on retail electricity sales to certain customers. The provision was
transferred to ETSA Power Pty Ltd in the prior financial year at a consideration equal to book value. This was reflected through non trade amounts receivable from other entities. The abnormal item reflects a reassessment of the provision and is also reflected as an adjustment to non trade amounts receivable from other entities.
7. Income Tax Expense
The aggregate amount of income tax attributable to the financial year Consolidated Parent Entity differs from the amount calculated on the operating profit and 2000 1999 2000 1999 extraordinary items. The difference are reconciled as follows: Note $’000 $’000 $’000 $’000
Operating profit before income tax - 103 483 - 103 483 Extraordinary items before income tax 8 - (102 904) - (35 736) Operating profit before income tax - 579 - 67 747
Prima facie tax calculated at 36 percent(1) - - - - Extraordinary tax effect accounting adjustment - (11 948) - (11 948)
- (11 948) - (11 948) Over provision in previous year - 357 - 357 Income tax expense (benefit) attributable to operating profit and extraordinary items - (11 591) - (11 591) Income tax expense (benefit) attributable to:
Operation profit(1) - - - - Income tax expense adjustment for the prior year(2) - 357 - 357 Extraordinary items 8 - (11 948) - (11 948)
- (11 591) - (11 591) (1) Income Tax Expense Attributable to the Current Year’s Operating Profit
The Treasurer of South Australia has issued a determination pursuant to the Public Corporations Act 1993 whereby RESI Corporation, RESI Power Corporation and RESI Energy Corporation are no longer subject to Commonwealth income tax equivalents.
(2) Income Tax Expense Adjustment for the Prior Year
RESI Corporation and controlled entities have lodged their final tax returns, which relate to the year ended 30 June 1998. Adjustments relating to these tax returns have been brought to account as income tax expense in the prior period.
8. Extraordinary Items Consolidated Parent Entity
(a) Extraordinary Items arising from the Ministerial Transfer Orders 2000 1999 2000 1999 effective 1 July 1998 as detailed in Note 24 $’000 $’000 $’000 $’000 Transfer of assets to Terra Gas Trader Pty Ltd for no consideration - (37 722) - (37 722) Applicable income tax - - - - - (37 722) - (37 722) Provision for contract losses - (20 954) - (20 954) Applicable income tax - 2 683 - 2 683 - (18 271) - (18 271) Restructuring provision - (37 271) - (37 271) Applicable income tax - 9 265 - 9 265 - (28 006) - (28 006) Write-back of arbitration provision - 7 389 - 7 389 Applicable income tax - - - -
- 7 389 - 7 389 Write-off of future income tax benefit upon change in tax status to a non-taxpaying entity - (33 748) - (33 748) Applicable income tax - - - - - (33 748) - (33 748) Gain on transfer of assets - 86 570 - 86 570 Applicable income tax - - - -
- 86 570 - 86 570 (b) Other Extraordinary Items
Adjustment due to cessation of control of group entities - (67 168) - - Applicable income tax - - - -
- (67 168) - - Aggregate extraordinary items before income tax - (102 904) - (35 736) Aggregate income tax effect - 11 948 - 11 948 Aggregate extraordinary items after income tax - (90 956) - (23 788)
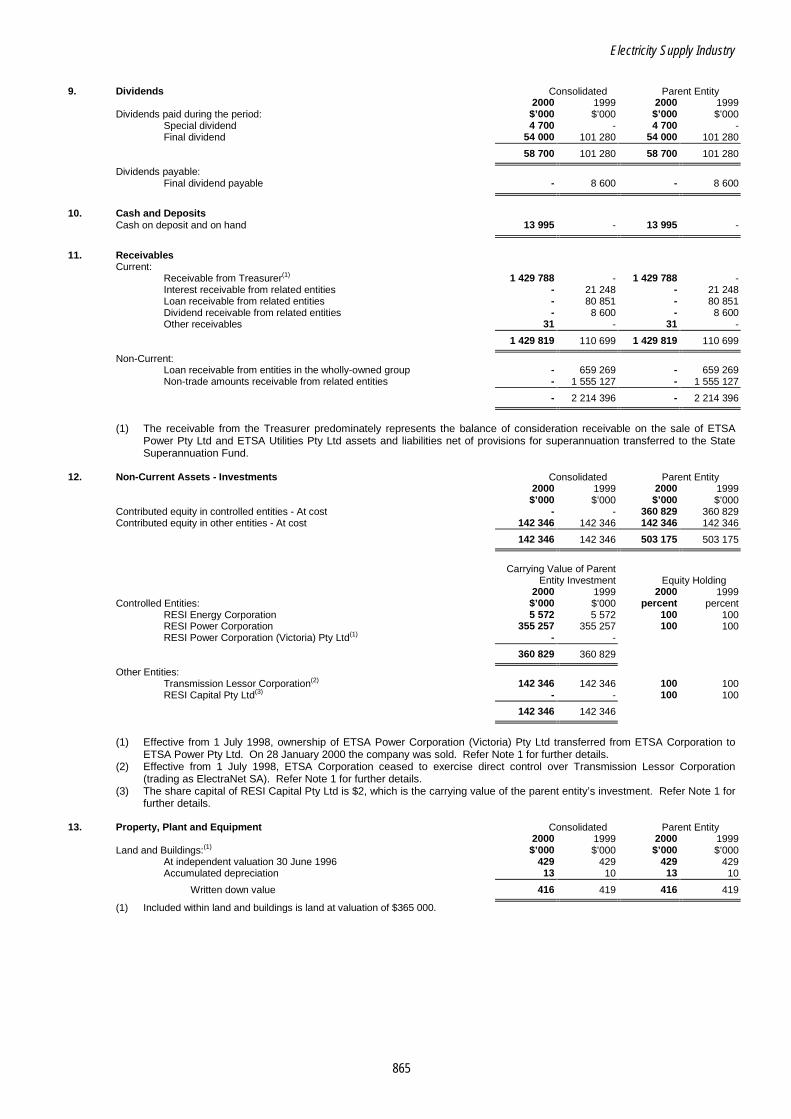
Electricity Supply Industry
865
9. Dividends Consolidated Parent Entity 2000 1999 2000 1999
Dividends paid during the period: $’000 $’000 $’000 $’000 Special dividend 4 700 - 4 700 - Final dividend 54 000 101 280 54 000 101 280
58 700 101 280 58 700 101 280
Dividends payable: Final dividend payable - 8 600 - 8 600
10. Cash and Deposits
Cash on deposit and on hand 13 995 - 13 995 -
11. Receivables
Current: Receivable from Treasurer(1) 1 429 788 - 1 429 788 - Interest receivable from related entities - 21 248 - 21 248 Loan receivable from related entities - 80 851 - 80 851 Dividend receivable from related entities - 8 600 - 8 600 Other receivables 31 - 31 -
1 429 819 110 699 1 429 819 110 699
Non-Current: Loan receivable from entities in the wholly-owned group - 659 269 - 659 269 Non-trade amounts receivable from related entities - 1 555 127 - 1 555 127
- 2 214 396 - 2 214 396
(1) The receivable from the Treasurer predominately represents the balance of consideration receivable on the sale of ETSA
Power Pty Ltd and ETSA Utilities Pty Ltd assets and liabilities net of provisions for superannuation transferred to the State Superannuation Fund.
12. Non-Current Assets - Investments Consolidated Parent Entity
2000 1999 2000 1999 $’000 $’000 $’000 $’000
Contributed equity in controlled entities - At cost - - 360 829 360 829 Contributed equity in other entities - At cost 142 346 142 346 142 346 142 346
142 346 142 346 503 175 503 175
Carrying Value of Parent Entity Investment Equity Holding 2000 1999 2000 1999
Controlled Entities: $’000 $’000 percent percent RESI Energy Corporation 5 572 5 572 100 100 RESI Power Corporation 355 257 355 257 100 100 RESI Power Corporation (Victoria) Pty Ltd(1) - -
360 829 360 829
Other Entities: Transmission Lessor Corporation(2) 142 346 142 346 100 100 RESI Capital Pty Ltd(3) - - 100 100
142 346 142 346
(1) Effective from 1 July 1998, ownership of ETSA Power Corporation (Victoria) Pty Ltd transferred from ETSA Corporation to
ETSA Power Pty Ltd. On 28 January 2000 the company was sold. Refer Note 1 for further details. (2) Effective from 1 July 1998, ETSA Corporation ceased to exercise direct control over Transmission Lessor Corporation
(trading as ElectraNet SA). Refer Note 1 for further details. (3) The share capital of RESI Capital Pty Ltd is $2, which is the carrying value of the parent entity’s investment. Refer Note 1 for
further details. 13. Property, Plant and Equipment Consolidated Parent Entity 2000 1999 2000 1999
Land and Buildings:(1) $’000 $’000 $’000 $’000 At independent valuation 30 June 1996 429 429 429 429 Accumulated depreciation 13 10 13 10
Written down value 416 419 416 419
(1) Included within land and buildings is land at valuation of $365 000.

Electricity Supply Industry
866
14. Liabilities - Accounts Payable Consolidated Parent Entity
2000 1999 2000 1999 Current: $’000 $’000 $’000 $’000
Trade creditors 129 506 129 506 Other creditors 242 - 242 - Interest payable - 21 320 - 21 320 Non-trade amounts payable - 26 184 - 26 184
371 48 010 371 48 010
Non-Current: Non-trade amounts payable(1) 71 902 83 875 1 455 693 1 467 666
(1) Non-trade amounts payable represents the net transfer consideration outstanding from Transmission Lessor Corporation,
Flinders Power Pty Ltd and RESI SYN Pty Ltd. 15. Borrowings and Financing Arrangements
(a) Borrowings Current:
Loan payable to related entities - Unsecured - 19 645 - 19 645 Loans from South Australian Government Financing Authority - Unsecured 46 777 46 145 46 777 46 145 Promissory notes - Unsecured - 33 959 - 33 959
46 777 99 749 46 777 99 749
Non-Current:
Loans from South Australian Government Financing Authority - Unsecured - 651 770 - 651 770 Promissory notes - Unsecured - 27 145 - 27 145
- 678 915 - 678 915
(b) Maturity Analysis of Borrowings by Currency Australian dollar:
No later than one year 46 777 99 749 46 777 99 749 Later than one year and not later than two years - 269 152 - 269 152 Later than two years and not later than five years - 295 951 - 295 951 Later than five years - 113 812 - 113 812
46 777 778 664 46 777 778 664
(c) Financing Arrangements Access was available at balance date to the following lines of credit:
Total facilities: Bank overdraft - - - - South Australian Government Financing Authority 76 777 697 915 46 777 697 915
76 777 697 915 46 777 697 915 Used at balance date:
Bank overdraft - - - - South Australian Government Financing Authority 46 777 697 915 46 777 697 915
46 777 697 915 46 777 697 915 Unused at balance date
Bank overdraft - - - - South Australian Government Financing Authority 30 000 - - -
30 000 - - -
The liabilities of RESI Corporation are guaranteed by the Treasurer of South Australia under the Public Corporations Act 1993, as amended.
16. Provisions
Provisions are classified in the Balance Sheet as: Current:
Environmental 138 - 138 - Employees’ retirement benefits - 15 000 - 15 000 Dividend - 8 600 - 8 600 Demolition and site restoration 1 724 943 1 724 943 Claims 242 333 242 333
2 104 24 876 2 104 24 876
Non-Current: Employees’ retirement benefits 1 167 66 329 1 167 66 329 Claims 2 871 1 526 2 871 1 526 Demolition and site restoration - 944 - 944
4 038 68 799 4 038 68 799 6 142 93 675 6 142 93 675
17. Capital and Reserves
Reserves: Asset revaluation 1 000 000 1 022 830 - 23 001 Asset realisation - 171 - - Self insurance - 100 000 - 100 000
1 000 000 1 123 001 - 123 001
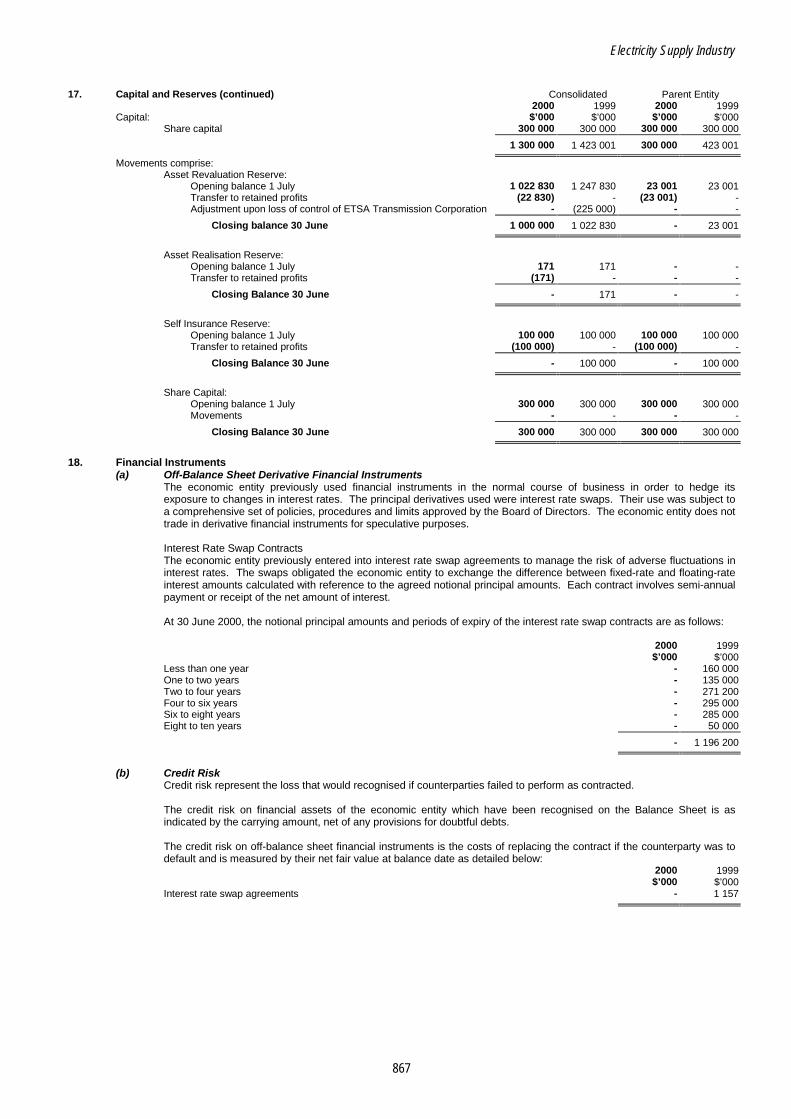
Electricity Supply Industry
867
17. Capital and Reserves (continued) Consolidated Parent Entity
2000 1999 2000 1999 Capital: $’000 $’000 $’000 $’000
Share capital 300 000 300 000 300 000 300 000 1 300 000 1 423 001 300 000 423 001
Movements comprise: Asset Revaluation Reserve:
Opening balance 1 July 1 022 830 1 247 830 23 001 23 001 Transfer to retained profits (22 830) - (23 001) - Adjustment upon loss of control of ETSA Transmission Corporation - (225 000) - -
Closing balance 30 June 1 000 000 1 022 830 - 23 001
Asset Realisation Reserve:
Opening balance 1 July 171 171 - - Transfer to retained profits (171) - - -
Closing Balance 30 June - 171 - -
Self Insurance Reserve:
Opening balance 1 July 100 000 100 000 100 000 100 000 Transfer to retained profits (100 000) - (100 000) -
Closing Balance 30 June - 100 000 - 100 000
Share Capital:
Opening balance 1 July 300 000 300 000 300 000 300 000 Movements - - - -
Closing Balance 30 June 300 000 300 000 300 000 300 000
18. Financial Instruments
(a) Off-Balance Sheet Derivative Financial Instruments The economic entity previously used financial instruments in the normal course of business in order to hedge its exposure to changes in interest rates. The principal derivatives used were interest rate swaps. Their use was subject to a comprehensive set of policies, procedures and limits approved by the Board of Directors. The economic entity does not trade in derivative financial instruments for speculative purposes. Interest Rate Swap Contracts The economic entity previously entered into interest rate swap agreements to manage the risk of adverse fluctuations in interest rates. The swaps obligated the economic entity to exchange the difference between fixed-rate and floating-rate interest amounts calculated with reference to the agreed notional principal amounts. Each contract involves semi-annual payment or receipt of the net amount of interest. At 30 June 2000, the notional principal amounts and periods of expiry of the interest rate swap contracts are as follows:
2000 1999 $’000 $’000
Less than one year - 160 000 One to two years - 135 000 Two to four years - 271 200 Four to six years - 295 000 Six to eight years - 285 000 Eight to ten years - 50 000
- 1 196 200
(b) Credit Risk
Credit risk represent the loss that would recognised if counterparties failed to perform as contracted. The credit risk on financial assets of the economic entity which have been recognised on the Balance Sheet is as indicated by the carrying amount, net of any provisions for doubtful debts. The credit risk on off-balance sheet financial instruments is the costs of replacing the contract if the counterparty was to default and is measured by their net fair value at balance date as detailed below:
2000 1999 $’000 $’000
Interest rate swap agreements - 1 157

Electricity Supply Industry
868
18. Financial Instruments (continued) (c) Interest Rate Risk Exposure
The economic entity’s exposure to interest rate risk and the effective weighted average interest rate for each class of financial assets and financial liabilities is set out below.
2000 Weighted Floating Fixed interest Maturing in Non- Average Interest 1 year 1 to 5 Over Interest 2000 Interest Rate or less years 5 years Bearing Total Rate
Financial Assets: $’000 $’000 $’000 $’000 $’000 $’000 Percent Cash and deposits 13 995 - - - - 13 995 5.58 Receivable from Treasurer - - - - 1 429 819 1 429 819 -
13 995 - - - 1 429 819 1 443 814 Financial Liabilities:
Loans from SAFA 46 777 - - - - 46 777 6.18 Other payables - - - - 72 273 72 273 -
46 777 - - - 72 273 119 050 Net Financial Assets (Liabilities) (32 782) - - - 1 357 546 1 324 764
1999 Weighted Floating Fixed interest Maturing in Non- Average Interest 1 year 1 to 5 Over Interest 1999 Interest Rate or less years 5 years Bearing Total Rate
Financial Assets: $’000 $’000 $’000 $’000 $’000 $’000 Percent Loans receivable from entities in the wholly owned group 740 120 - - - - 740 120 7.43 Interest receivable from entities in the wholly owned group - - - - 21 248 21 248 - Dividend receivable - - - - 8 600 8 600 - Non trade amounts receivable from entities in the wholly owned group - - - - 1 555 127 1 555 127 -
740 120 - - - 1 584 975 2 325 095 Financial Liabilities:
Loans from SAFA 253 265 17 247 313 591 113 812 - 697 915 7.43 Other borrowings 19 645 - - - - 19 645 7.43 Trade creditors - - - - 506 506 - Interest payable - - - - 21 320 21 320 - Other payables - - - - 110 059 110 059 - Dividend payable - - - - 8 600 8 600 - Promissory notes - 33 959 27 145 - - 61 104 12.20 Interest rate swaps* (593 800) (20 000) 183 800 430 000 - - 2.23
(320 890) 31 206 524 536 543 812 140 485 919 149 Net Financial Assets (Liabilities) 1 061 010 (31 206) (524 536) (543 812) 1 444 490 1 405 946 * Notional principal amounts. Reconciliation of Net Financial Assets to Net Assets 2000 1999
$’000 $’000 Net financial assets (liabilities) as above 1 324 764 1 405 946 Non-financial assets and liabilities:
Investments 142 346 142 346 Property, plant and equipment 416 419 Provisions (6 142) (85 075)
Net assets per Balance Sheet 1 461 384 1 463 636
(d) Net Fair Value of Financial Assets and Liabilities 2000 1999 Carrying Net Fair Carrying Net Fair
On-Balance Sheet Amount Value Amount Value Financial Assets: $’000 $’000 $’000 $’000
Cash and deposits 13 995 13 995 - - Receivable from Treasurer 1 429 788 1 429 788 - - Other receivables 31 31 - - Loans receivable from entities in the wholly owned group - - 740 120 740 120 Interest receivable from entities in the wholly owned group - - 21 248 21 248 Dividend receivable - - 8 600 8 600 Non trade amounts receivable from entities in the wholly owned group - - 1 555 127 1 55 127
1 443 814 1 443 814 2 325 095 2 325 095
Financial Liabilities: Loans from SAFA 46 777 46 777 697 915 697 915 Trade creditors - - 506 506 Other borrowings - - 19 645 19 645 Interest payable - - 21 320 21 320 Other payables 72 273 72 273 110 059 110 059 Dividend payable - - 8 600 8 600 Promissory notes - - 61 104 61 104
119 050 119 050 919 149 919 149
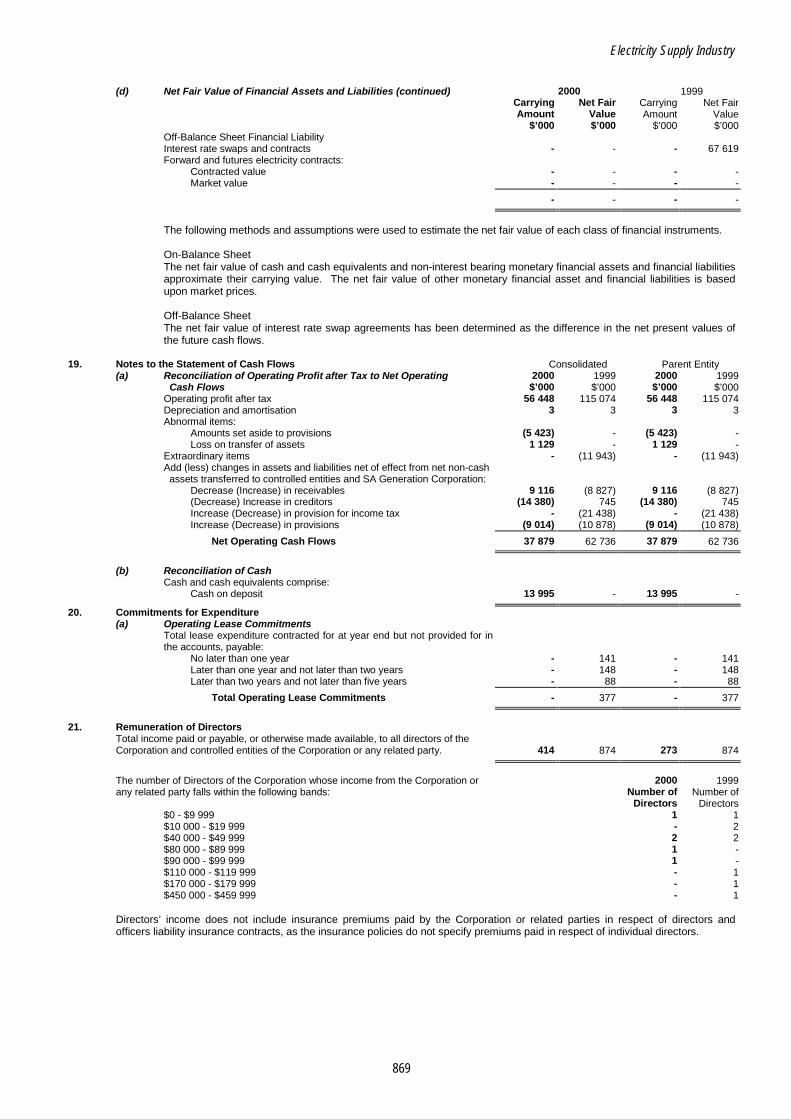
Electricity Supply Industry
869
(d) Net Fair Value of Financial Assets and Liabilities (continued) 2000 1999
Carrying Net Fair Carrying Net Fair Amount Value Amount Value $’000 $’000 $’000 $’000 Off-Balance Sheet Financial Liability Interest rate swaps and contracts - - - 67 619 Forward and futures electricity contracts:
Contracted value - - - - Market value - - - -
- - - -
The following methods and assumptions were used to estimate the net fair value of each class of financial instruments. On-Balance Sheet The net fair value of cash and cash equivalents and non-interest bearing monetary financial assets and financial liabilities approximate their carrying value. The net fair value of other monetary financial asset and financial liabilities is based upon market prices. Off-Balance Sheet The net fair value of interest rate swap agreements has been determined as the difference in the net present values of the future cash flows.
19. Notes to the Statement of Cash Flows Consolidated Parent Entity (a) Reconciliation of Operating Profit after Tax to Net Operating 2000 1999 2000 1999
Cash Flows $’000 $’000 $’000 $’000 Operating profit after tax 56 448 115 074 56 448 115 074 Depreciation and amortisation 3 3 3 3 Abnormal items:
Amounts set aside to provisions (5 423) - (5 423) - Loss on transfer of assets 1 129 - 1 129 -
Extraordinary items - (11 943) - (11 943) Add (less) changes in assets and liabilities net of effect from net non-cash assets transferred to controlled entities and SA Generation Corporation:
Decrease (Increase) in receivables 9 116 (8 827) 9 116 (8 827) (Decrease) Increase in creditors (14 380) 745 (14 380) 745 Increase (Decrease) in provision for income tax - (21 438) - (21 438) Increase (Decrease) in provisions (9 014) (10 878) (9 014) (10 878)
Net Operating Cash Flows 37 879 62 736 37 879 62 736
(b) Reconciliation of Cash
Cash and cash equivalents comprise: Cash on deposit 13 995 - 13 995 -
20. Commitments for Expenditure (a) Operating Lease Commitments
Total lease expenditure contracted for at year end but not provided for in the accounts, payable:
No later than one year - 141 - 141 Later than one year and not later than two years - 148 - 148 Later than two years and not later than five years - 88 - 88
Total Operating Lease Commitments - 377 - 377
21. Remuneration of Directors
Total income paid or payable, or otherwise made available, to all directors of the Corporation and controlled entities of the Corporation or any related party. 414 874 273 874
The number of Directors of the Corporation whose income from the Corporation or 2000 1999 any related party falls within the following bands: Number of Number of
Directors Directors $0 - $9 999 1 1 $10 000 - $19 999 - 2 $40 000 - $49 999 2 2 $80 000 - $89 999 1 - $90 000 - $99 999 1 - $110 000 - $119 999 - 1 $170 000 - $179 999 - 1 $450 000 - $459 999 - 1
Directors’ income does not include insurance premiums paid by the Corporation or related parties in respect of directors and officers liability insurance contracts, as the insurance policies do not specify premiums paid in respect of individual directors.

Electricity Supply Industry
870
22. Remuneration of Employees Consolidated Parent Entity
The aggregate remuneration received or receivable from the Corporation or related 2000 1999 2000 1999 parties by employees, including those on contract whose total income $’000 $’000 $’000 $’000 exceeds $100 000. - 451 - 451
Number of employees whose total remuneration received or due and receivable 2000 1999 2000 1999 from the Corporation or related parties in relation to the financial year falls within Number of Number of Number of Number of the following bands: Employees Employees Employees Employees
$450 000 - $459 999 - 1 - 1 Employees’ income does not include insurance premiums paid by the Corporation or related parties in respect of directors and officers liability insurance contracts, as the insurance policies do not specify premiums paid in respect of individual employees.
23. Auditor’s Remuneration Consolidated Parent Entity 2000 1999 2000 1999 Amounts received or due and receivable by the auditors for auditing the accounts of: $’000 $’000 $’000 $’000
Parent entity 28 30 28 30 Controlled entities 8 - 8 - Other entities 18 - 18 -
54 30 54 30
24. Transfer of Assets and Liabilities
By way of Ministerial Transfer Orders, dated 12 October 1998, 30 July 1999 and 27 August 1999, made by the Treasurer of South Australia pursuant to schedule 3 of the Electricity Corporations Act 1994 and sections 8 and 13 of the Electricity Corporations (Restructuring and Disposal) Act 1999, the operating activities and related assets and liabilities associated with the generation, distribution and retail of electricity were transferred from ETSA Corporation and its controlled entities to the entities detailed below: (a) ETSA Utilities Pty Ltd 1 July 1998
Current Assets: $’000 Cash and deposits (1 112) Receivables 105 390 Inventories 9 170 Other 17 173
Total Current Assets 130 621
Non-Current Assets: Property, plant and equipment 2 240 503 Other 31 053
Total Non-Current Assets 2 271 556 Total Assets 2 402 177
Current Liabilities:
Accounts payable 47 020 Provisions 51 355
Total Current Liabilities 98 375
Non-Current Liabilities: Non-trade accounts payable - ETSA Corporation 1 534 318 Borrowings 659 625 Provisions 109 859
Total Non-Current Liabilities 2 303 802 Total Liabilities 2 402 177
Net Assets -
Equity: Capital - Reserves -
Total Equity -
(b) ETSA Power Pty Ltd
Current Assets: Cash and deposits 762 Receivables 134 328 Other 6 689
Total Current Assets 141 779
Non-Current Assets: Non-trade accounts receivable - ETSA Corporation 13 500 Property, plant and equipment 6 982 Other 28 185
Total Non-Current Assets 48 667 Total Assets 190 446
Current Liabilities:
Accounts payable 140 670 Provisions 13 379
Total Current Liabilities 154 049
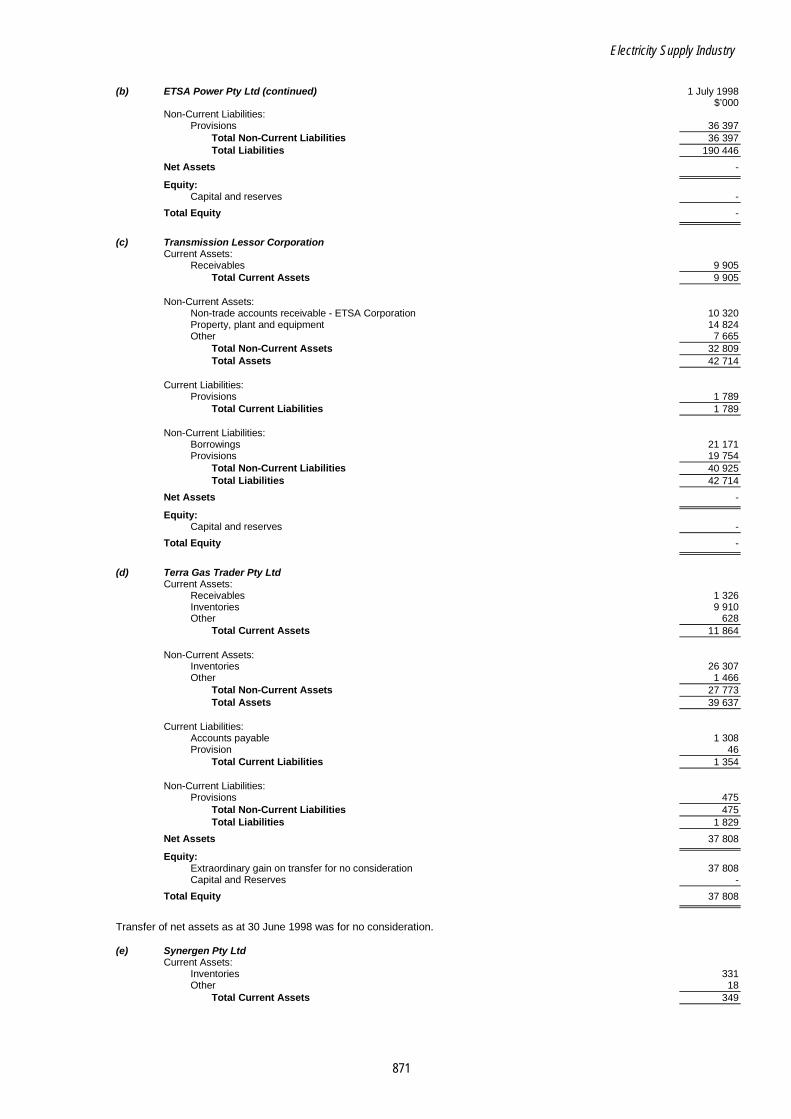
Electricity Supply Industry
871
(b) ETSA Power Pty Ltd (continued) 1 July 1998
$’000 Non-Current Liabilities:
Provisions 36 397 Total Non-Current Liabilities 36 397 Total Liabilities 190 446
Net Assets -
Equity: Capital and reserves -
Total Equity -
(c) Transmission Lessor Corporation
Current Assets: Receivables 9 905
Total Current Assets 9 905
Non-Current Assets: Non-trade accounts receivable - ETSA Corporation 10 320 Property, plant and equipment 14 824 Other 7 665
Total Non-Current Assets 32 809 Total Assets 42 714
Current Liabilities:
Provisions 1 789 Total Current Liabilities 1 789
Non-Current Liabilities:
Borrowings 21 171 Provisions 19 754
Total Non-Current Liabilities 40 925 Total Liabilities 42 714
Net Assets -
Equity: Capital and reserves -
Total Equity -
(d) Terra Gas Trader Pty Ltd
Current Assets: Receivables 1 326 Inventories 9 910 Other 628
Total Current Assets 11 864
Non-Current Assets: Inventories 26 307 Other 1 466
Total Non-Current Assets 27 773 Total Assets 39 637
Current Liabilities:
Accounts payable 1 308 Provision 46
Total Current Liabilities 1 354
Non-Current Liabilities: Provisions 475
Total Non-Current Liabilities 475 Total Liabilities 1 829
Net Assets 37 808
Equity: Extraordinary gain on transfer for no consideration 37 808 Capital and Reserves -
Total Equity 37 808
Transfer of net assets as at 30 June 1998 was for no consideration. (e) Synergen Pty Ltd
Current Assets: Inventories 331 Other 18
Total Current Assets 349
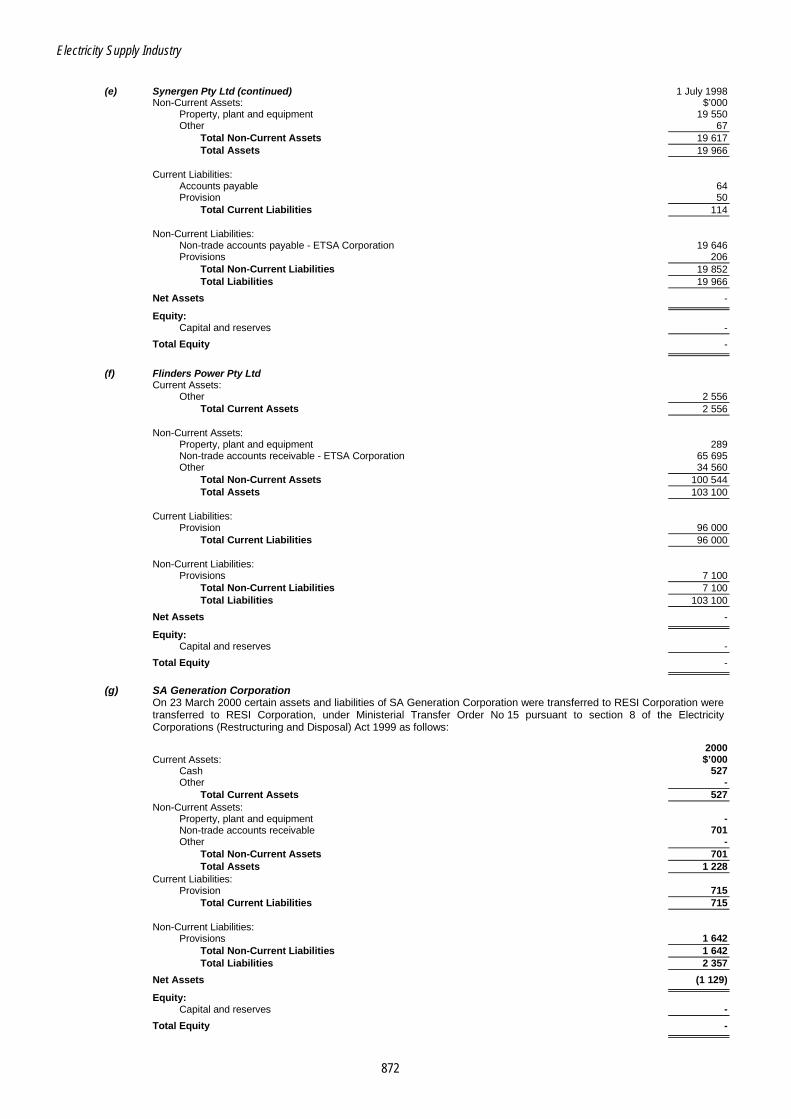
Electricity Supply Industry
872
(e) Synergen Pty Ltd (continued) 1 July 1998
Non-Current Assets: $’000 Property, plant and equipment 19 550 Other 67
Total Non-Current Assets 19 617 Total Assets 19 966
Current Liabilities:
Accounts payable 64 Provision 50
Total Current Liabilities 114
Non-Current Liabilities: Non-trade accounts payable - ETSA Corporation 19 646 Provisions 206
Total Non-Current Liabilities 19 852 Total Liabilities 19 966
Net Assets -
Equity: Capital and reserves -
Total Equity -
(f) Flinders Power Pty Ltd
Current Assets: Other 2 556
Total Current Assets 2 556
Non-Current Assets: Property, plant and equipment 289 Non-trade accounts receivable - ETSA Corporation 65 695 Other 34 560
Total Non-Current Assets 100 544 Total Assets 103 100
Current Liabilities:
Provision 96 000 Total Current Liabilities 96 000
Non-Current Liabilities:
Provisions 7 100 Total Non-Current Liabilities 7 100 Total Liabilities 103 100
Net Assets -
Equity: Capital and reserves -
Total Equity -
(g) SA Generation Corporation On 23 March 2000 certain assets and liabilities of SA Generation Corporation were transferred to RESI Corporation were
transferred to RESI Corporation, under Ministerial Transfer Order No 15 pursuant to section 8 of the Electricity Corporations (Restructuring and Disposal) Act 1999 as follows:
2000 Current Assets: $’000
Cash 527 Other -
Total Current Assets 527 Non-Current Assets:
Property, plant and equipment - Non-trade accounts receivable 701 Other -
Total Non-Current Assets 701 Total Assets 1 228
Current Liabilities: Provision 715
Total Current Liabilities 715
Non-Current Liabilities: Provisions 1 642
Total Non-Current Liabilities 1 642 Total Liabilities 2 357
Net Assets (1 129)
Equity: Capital and reserves -
Total Equity -
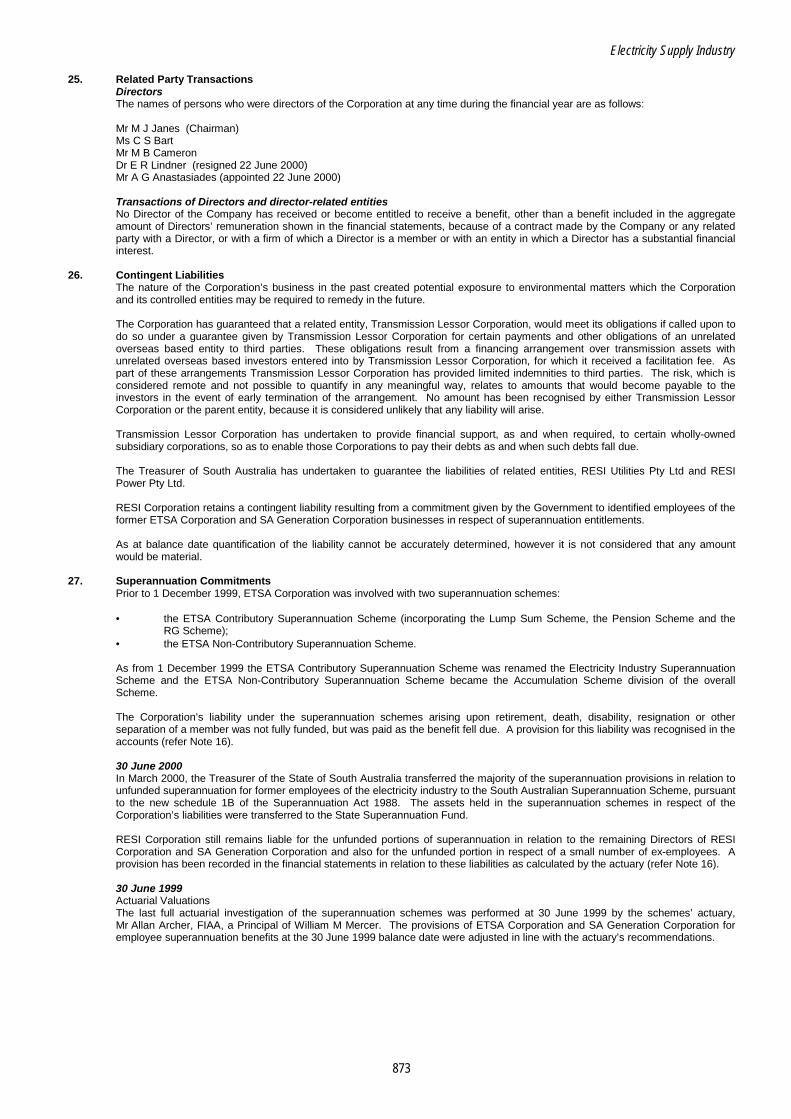
Electricity Supply Industry
873
25. Related Party Transactions Directors The names of persons who were directors of the Corporation at any time during the financial year are as follows:
Mr M J Janes (Chairman) Ms C S Bart Mr M B Cameron Dr E R Lindner (resigned 22 June 2000) Mr A G Anastasiades (appointed 22 June 2000)
Transactions of Directors and director-related entities No Director of the Company has received or become entitled to receive a benefit, other than a benefit included in the aggregate amount of Directors’ remuneration shown in the financial statements, because of a contract made by the Company or any related party with a Director, or with a firm of which a Director is a member or with an entity in which a Director has a substantial financial interest.
26. Contingent Liabilities
The nature of the Corporation’s business in the past created potential exposure to environmental matters which the Corporation and its controlled entities may be required to remedy in the future.
The Corporation has guaranteed that a related entity, Transmission Lessor Corporation, would meet its obligations if called upon to do so under a guarantee given by Transmission Lessor Corporation for certain payments and other obligations of an unrelated overseas based entity to third parties. These obligations result from a financing arrangement over transmission assets with unrelated overseas based investors entered into by Transmission Lessor Corporation, for which it received a facilitation fee. As part of these arrangements Transmission Lessor Corporation has provided limited indemnities to third parties. The risk, which is considered remote and not possible to quantify in any meaningful way, relates to amounts that would become payable to the investors in the event of early termination of the arrangement. No amount has been recognised by either Transmission Lessor Corporation or the parent entity, because it is considered unlikely that any liability will arise.
Transmission Lessor Corporation has undertaken to provide financial support, as and when required, to certain wholly-owned subsidiary corporations, so as to enable those Corporations to pay their debts as and when such debts fall due.
The Treasurer of South Australia has undertaken to guarantee the liabilities of related entities, RESI Utilities Pty Ltd and RESI Power Pty Ltd.
RESI Corporation retains a contingent liability resulting from a commitment given by the Government to identified employees of the former ETSA Corporation and SA Generation Corporation businesses in respect of superannuation entitlements.
As at balance date quantification of the liability cannot be accurately determined, however it is not considered that any amount would be material.
27. Superannuation Commitments
Prior to 1 December 1999, ETSA Corporation was involved with two superannuation schemes:
• the ETSA Contributory Superannuation Scheme (incorporating the Lump Sum Scheme, the Pension Scheme and the RG Scheme);
• the ETSA Non-Contributory Superannuation Scheme.
As from 1 December 1999 the ETSA Contributory Superannuation Scheme was renamed the Electricity Industry Superannuation Scheme and the ETSA Non-Contributory Superannuation Scheme became the Accumulation Scheme division of the overall Scheme.
The Corporation’s liability under the superannuation schemes arising upon retirement, death, disability, resignation or other separation of a member was not fully funded, but was paid as the benefit fell due. A provision for this liability was recognised in the accounts (refer Note 16).
30 June 2000 In March 2000, the Treasurer of the State of South Australia transferred the majority of the superannuation provisions in relation to unfunded superannuation for former employees of the electricity industry to the South Australian Superannuation Scheme, pursuant to the new schedule 1B of the Superannuation Act 1988. The assets held in the superannuation schemes in respect of the Corporation’s liabilities were transferred to the State Superannuation Fund.
RESI Corporation still remains liable for the unfunded portions of superannuation in relation to the remaining Directors of RESI Corporation and SA Generation Corporation and also for the unfunded portion in respect of a small number of ex-employees. A provision has been recorded in the financial statements in relation to these liabilities as calculated by the actuary (refer Note 16).
30 June 1999 Actuarial Valuations The last full actuarial investigation of the superannuation schemes was performed at 30 June 1999 by the schemes’ actuary, Mr Allan Archer, FIAA, a Principal of William M Mercer. The provisions of ETSA Corporation and SA Generation Corporation for employee superannuation benefits at the 30 June 1999 balance date were adjusted in line with the actuary’s recommendations.

Electricity Supply Industry
874
27. Superannuation Commitments (continued) The actuarial valuations of the superannuation liabilities of the corporations as at 30 June 1999 were as follows: SA
ETSA Generation Corporation Corporation
Contributory Scheme: $’000 $’000 Lump sum 351 247 Pension 123 668 1 258
Less: Assets 48 100 - RG Scheme 715 - Non-Contributory Scheme 4 725 149
Total 81 359 1 654
28. Events Subsequent to Balance Date
No event has arisen since the year end that would be likely to materially affect the operations or the state of affairs of the corporation.
29. Likely Developments
Following confirmation that they are no longer required, RESI Power Corporation and RESI Energy Corporation will be dissolved.
Following confirmation that it will no longer be required RESI Capital Pty Ltd will be deregistered. The investments of the Corporation (refer Note 12) shall be realised within the short term. 30. Segment Information
The entity and its controlled entities hold residual assets and liabilities on behalf of the Treasurer of South Australia as part of the privatisation of the South Australian electricity industry.
Electricity Supply Industry
875
FLINDERS COAL PTY LTD FUNCTIONAL RESPONSIBILITY AND STRUCTURE SA Generation Corporation was established on 1 January 1997 pursuant to the Electricity Corporations (Generation Corporation) Amendment Act 1996. During 1998-1999 the operations of SA Generation Corporation (SAGC) were disaggregated into a number of subsidiary corporations (Flinders Power Pty Ltd, Optima Energy Pty Ltd, Synergen Pty Ltd and Terra Gas Trader Pty Ltd). The SA Generation Corporation did not retain effective control over those companies due to a Ministerial Direction issued pursuant to section 6 of the Public Corporations Act 1993 that required SAGC ‘… not to exercise any power of direction … so as to create or maintain an impediment to the autonomous trading activities …’ of its subsidiaries. In March 2000 the shares held by SAGC in its subsidiaries were transferred to the Treasurer. Further, pursuant to a Ministerial Transfer Order, the assets and liabilities of SAGC were transferred to RESI Corporation and the Treasurer of South Australia. Following those transfers SAGC was ‘converted’ to a Corporations Law company entitled Flinders Coal Pty Ltd. The primary function of Flinders Coal Pty Ltd was to hold the right to mine coal at the Leigh Creek coal mine site. AUDIT MANDATE AND COVERAGE Audit Authority In accordance with section 31 of the Public Finance and Audit Act 1987 and subclause 13(3) of the Schedule to the Public Corporations Act 1993 the Auditor-General must in respect of each financial year, audit the accounts and financial statements of Flinders Coal Pty Ltd. Scope of Audit Work undertaken included a review of the accounting treatment for the transfer of assets and liabilities to RESI Corporation and the Treasurer. CONTROLS OPINION As required by subsection 36(1)(a)(iii) of the Public Finance and Audit Act 1987, the audit of Flinders Coal Pty Ltd (formerly SA Generation Corporation) included an assessment of the controls exercised in relation to the receipt, expenditure and investment of money, the acquisition and disposal of property and the incurring of liabilities. Audit formed the opinion that the controls exercised by Flinders Coal Pty Ltd (formerly SA Generation Corporation) in relation to the receipt, expenditure and investment of money; the acquisition and disposal of property; and the incurring of liabilities, were sufficient to provide reasonable assurance that the financial transactions of the organisation were conducted properly and in accordance with the law. INTERPRETATION AND ANALYSIS OF FINANCIAL STATEMENTS Transfer of Assets and Liabilities to RESI Corporation and the Treasurer During the year Ministerial Transfer Orders were made by the Treasurer pursuant to the Electricity Corporations (Restructuring and Disposal) Act 1999. These Orders transferred the following assets and liabilities, at their book value, from SAGC to RESI Corporation and the Treasurer.

Electricity Supply Industry
876
RESI Corporation Treasurer Total $’000 $’000 $’000 Current Assets:
Cash 527 - 527 Non-Current Assets:
Loans receivable 701 259 341 260 042 Total Assets 1 228 259 341 260 569 Liabilities:
Provisions 2 357 - 2 357 Loan payable - 670 670
Total Liabilities 2 357 670 3 027 Net Assets (1 129) 258 671 257 542 Capital - 50 000 50 000 Reserves:
Asset revaluation - 158 522 158 522 Self insurance - 62 000 62 000
Retained profits (1 129) (11 851) (12 980) (1 129) 258 671 257 542 Financial Performance of Flinders Coal Pty Ltd (formerly SA Generation Corporation) The results of operations for the year ended 30 June 2000 for Flinders Coal Pty Ltd (formerly SA Generation Corporation) are set out below. Abridged Financial Statement
Profit and Loss Statement for the year ended 30 June 2000 2000 $’000 REVENUES - EXPENSES 1 025 OPERATING PROFIT (LOSS) BEFORE ABNORMAL ITEMS (1 025) Abnormal items 9 434 OPERATING PROFIT 8 409 Retained profits (losses) at 1 July (20 260) (11 851) Transfer of accumulated losses to the Treasurer 11 851
RETAINED PROFIT (LOSS) -
Flinders Coal Pty Ltd (formerly SA Generation Corporation) had no assets or liabilities as at 30 June 2000.
Electricity Supply Industry
877
ELECTRICITY SUPPLY INDUSTRY - DISTRIBUTION
RESI UTILITIES PTY LTD FUNCTIONAL RESPONSIBILITY AND STRUCTURE ETSA Utilities Pty Ltd (ETSA Utilities) was incorporated under the Corporations Law in May 1998 as a subsidiary of ETSA Capital Pty Ltd. In July 1999 the shares in ETSA Utilities were transferred, as a result of a Ministerial Transfer Order issued pursuant to the Electricity Corporations Act 1994, to ETSA Capital (No.2) Pty Ltd, a subsidiary of the Treasurer. On 3 February 2000 the name of ETSA Utilities was changed to RESI Utilities Pty Ltd (RESI Utilities). The primary function of ETSA Utilities was to operate and manage the electricity distribution network in South Australia. CHANGES TO AGENCY ORGANISATIONAL STRUCTURE On 12 December 1999, the South Australian Treasurer signed an agreement with Cheung Kong Infrastructure Holdings (CKI) and Hong Kong Electric International Limited (HEI) for the disposal of the assets and liabilities of ETSA Utilities. Although settlement of that transaction did not take place until 28 January 2000, the benefits and risks associated with the business were transferred as at the date of the agreement, ie 12 December 1999. To give effect to this agreement: • assets with a book value of $2.1 billion, including prescribed electricity distribution assets as defined by
the Electricity Corporations (Restructuring and Disposal) Act 1999, were transferred to the public corporation entitled Distribution Lessor Corporation. The prescribed electricity distribution assets were subsequently leased to CKI and HEI;
• non-prescribed assets (net of liabilities) were sold to CKI and HEI. Further commentary on these transactions is included below under the heading Interpretation and Analysis of Financial Statements. SIGNIFICANT FEATURES Total proceeds received from the disposal of non-prescribed assets was $184.4 million. Accounting profit on disposal of ETSA Utilities’ non-prescribed assets was $36.3 million. Dividends paid for the year were $131.8 million. AUDIT MANDATE AND COVERAGE Audit Authority In accordance with section 31 of the Public Finance and Audit Act 1987 and subclause 13(3) of the Schedule to the Public Corporations Act 1993 the Auditor-General may at any time, and must in respect of each financial year, audit the accounts and financial statements of RESI Utilities Pty Ltd (formerly ETSA Utilities Pty Ltd).

Electricity Supply Industry
878
Scope of Audit The audit program covered all major financial systems and was directed primarily towards obtaining sufficient evidence to enable an audit opinion to be formed with respect to the financial statements and internal control. This was particularly the case for the early part of the financial year when ETSA Utilities operated the electricity distribution business. During 1999-2000 a specific area of audit attention was the accounting for the restructure and disposal of the assets and liabilities of ETSA Utilities. Audit Communications to Management Following the completion of the interim audit, an audit management letter was forwarded to the Chief Executive Officer of ETSA Utilities, with copies provided to the: • Chairman of the ETSA Utilities Board Audit Committee; • Manager, Internal Audit, ETSA Utilities. A satisfactory response was received for all matters raised. CONTROLS OPINION As required by subsection 36(1)(a)(iii) of the Public Finance and Audit Act 1987, the audit of the RESI Utilities Pty Ltd (formerly ETSA Utilities Pty Ltd) included an assessment of the controls exercised in relation to the receipt, expenditure and investment of money, the acquisition and disposal of property and the incurring of liabilities. Audit formed the opinion that the controls exercised by the RESI Utilities Pty Ltd (formerly ETSA Utilities Pty Ltd) in relation to the receipt, expenditure and investment of money; the acquisition and disposal of property; and the incurring of liabilities, were sufficient to provide reasonable assurance that the financial transactions of the organisation were conducted properly and in accordance with the law. INTERPRETATION AND ANALYSIS OF FINANCIAL STATEMENTS Transfer of Assets to Distribution Lessor Corporation During the year Ministerial Transfer Orders were made by the Treasurer pursuant to the Electricity Corporations (Restructuring and Disposal) Act 1999. These Orders transferred the following assets, at their book value, from ETSA Utilities to Distribution Lessor Corporation. 2000 $’000 Prescribed electricity distribution network assets 2 069 581 Prescribed network land 26 493 Non-prescribed land and buildings (Angle Park) 6 330
2 102 404
Further commentary on the subsequent lease of the prescribed assets to CKI and HEI is included later in this Report under the heading Distribution Lessor Corporation.
Electricity Supply Industry
879
Disposal of Non-Prescribed Assets and Liabilities During the year assets (net of liabilities) of ETSA Utilities were sold to CKI and HEI. The assets (net of liabilities) sold reflected their values as at 12 December 1999, and were as follows: 2000 Assets: $’000 $’000
Receivables 107 120 Inventories 7 640 Property, plant and equipment 132 339 Other 43 419
290 518 Liabilities:
Creditors and accruals 29 928 Provisions 111 229 Other 1 233
142 390 Net assets 148 128 Proceeds from disposal 184 404
Profit on Disposal of Non-Prescribed Distribution Assets 36 276
Abridged Financial Statement The result of operations for the year ended 30 June 2000 for RESI Utilities (formerly ETSA Utilities) is set out below. The result reflects both the period during which ETSA Utilities operated the electricity distribution network, together with the impact of the transfer or sale of assets and liabilities.
Profit and Loss Statement for the year ended 30 June 2000 2000 $’000 REVENUES 257 506 EXPENSES 157 136 EARNINGS BEFORE INTEREST AND TAX 100 370 Net financing charges 50 670 OPERATING PROFIT BEFORE ABNORMAL ITEMS AND INCOME TAX 49 700 Abnormal items 45 OPERATING PROFIT BEFORE INCOME TAX 49 745 Income tax (10 188) OPERATING PROFIT AFTER INCOME TAX 59 933 Extraordinary items 36 276 OPERATING PROFIT AND EXTRAORDINARY ITEMS AFTER INCOME TAX 96 209 Retained profits at 1 July 15 537 Transfer from reserves 20 006 TOTAL AVAILABLE FOR APPROPRIATION 131 752 Dividends paid or provided for 131 752
RETAINED PROFITS AT 30 JUNE -
The Company did not have any assets or liabilities as at 30 June 2000.
Electricity Supply Industry
880
DISTRIBUTION LESSOR CORPORATION FUNCTIONAL RESPONSIBILITY AND STRUCTURE Distribution Lessor Corporation (DLC) was established as a subsidiary of the Treasurer in July 1999 pursuant to the Public Corporations (Distribution Lessor Corporation) Regulations 1999. The functions of DLC include being the lessor under a lease granted in respect of certain prescribed assets transferred to DLC pursuant to the Electricity Corporations (Restructuring and Disposal) Act 1999. SIGNIFICANT FEATURES Prescribed electricity distribution assets of $2.1 billion were transferred from ETSA Utilities Pty Ltd (ETSA Utilities). Prepaid rentals from the lease of the prescribed electricity distribution assets to external parties were $3.0 billion. A dividend of $633 million was paid to the Treasurer. AUDIT MANDATE AND COVERAGE Audit Authority In accordance with section 31 of the Public Finance and Audit Act 1987 and subclause 13(3) of the Schedule to the Public Corporations Act 1993 the Auditor-General may at any time, and must in respect of each financial year, audit the accounts and financial statements of the Distribution Lessor Corporation. Scope of Audit The audit program was directed primarily towards obtaining sufficient evidence to enable an audit opinion to be formed with respect to the financial statements and internal control. During 1999-2000 a specific area of audit attention was the accounting for the transfer and lease of the prescribed electricity distribution assets. CONTROLS OPINION As required by subsection 36(1)(a)(iii) of the Public Finance and Audit Act 1987, the audit of the Distribution Lessor Corporation included an assessment of the controls exercised in relation to the receipt, expenditure and investment of money, the acquisition and disposal of property and the incurring of liabilities. Audit formed the opinion that the controls exercised by the Distribution Lessor Corporation in relation to the receipt, expenditure and investment of money; the acquisition and disposal of property; and the incurring of liabilities, were sufficient to provide reasonable assurance that the financial transactions of the organisation were conducted properly and in accordance with the law. INTERPRETATION AND ANALYSIS OF FINANCIAL STATEMENTS Transfer and Lease of Electricity Distribution Assets On 12 December 1999, the South Australian Treasurer signed an agreement with Cheung Kong Infrastructure Holdings (CKI) and Hong Kong Electric International Limited (HEI) for the disposal of the assets and liabilities of ETSA Utilities. Although settlement of that transaction did not take place until 28 January 2000, the benefits and risks associated with the business were transferred as at the date of the agreement, ie 12 December 1999.
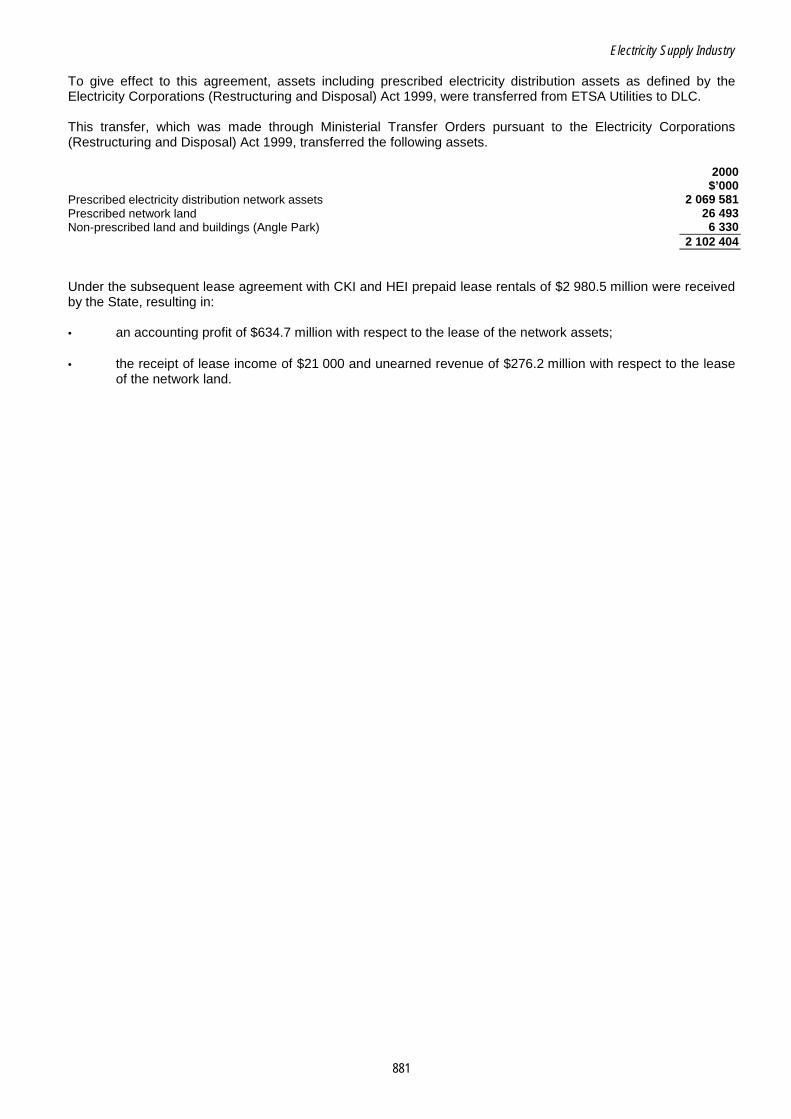
Electricity Supply Industry
881
To give effect to this agreement, assets including prescribed electricity distribution assets as defined by the Electricity Corporations (Restructuring and Disposal) Act 1999, were transferred from ETSA Utilities to DLC. This transfer, which was made through Ministerial Transfer Orders pursuant to the Electricity Corporations (Restructuring and Disposal) Act 1999, transferred the following assets. 2000 $’000 Prescribed electricity distribution network assets 2 069 581 Prescribed network land 26 493 Non-prescribed land and buildings (Angle Park) 6 330 2 102 404 Under the subsequent lease agreement with CKI and HEI prepaid lease rentals of $2 980.5 million were received by the State, resulting in: • an accounting profit of $634.7 million with respect to the lease of the network assets;
• the receipt of lease income of $21 000 and unearned revenue of $276.2 million with respect to the lease of the network land.
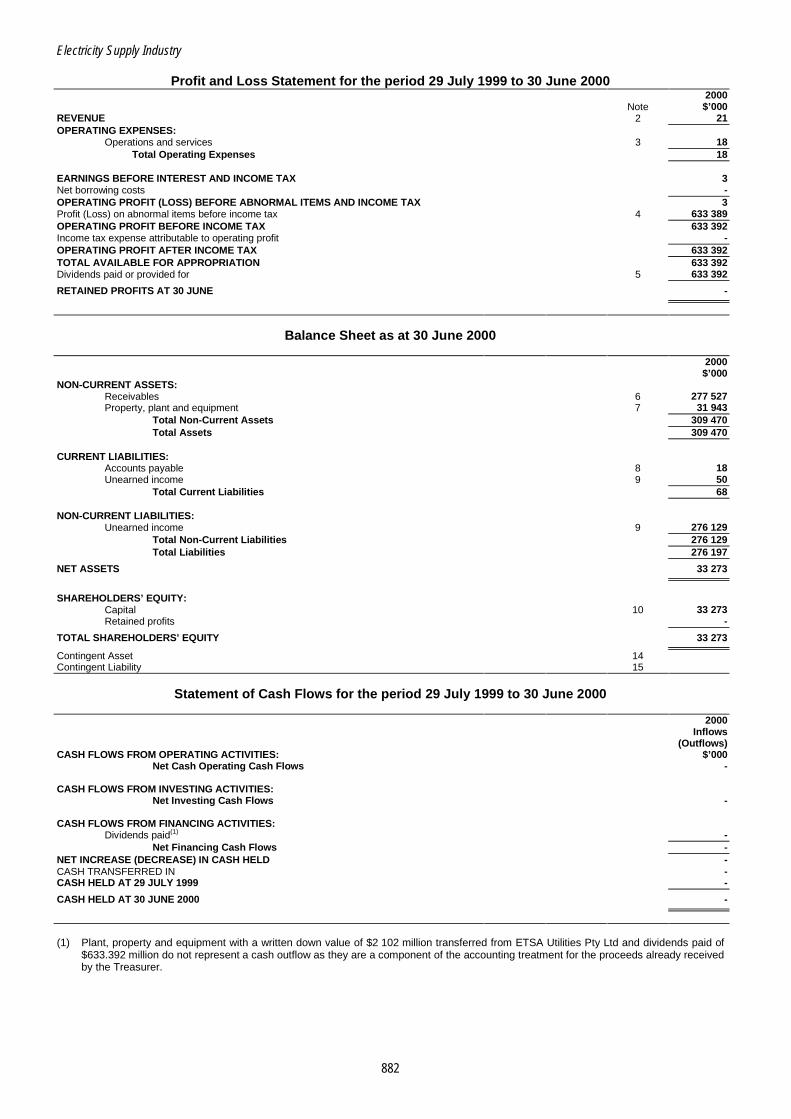
Electricity Supply Industry
882
Profit and Loss Statement for the period 29 July 1999 to 30 June 2000 2000 Note $’000 REVENUE 2 21 OPERATING EXPENSES:
Operations and services 3 18 Total Operating Expenses 18
EARNINGS BEFORE INTEREST AND INCOME TAX 3 Net borrowing costs - OPERATING PROFIT (LOSS) BEFORE ABNORMAL ITEMS AND INCOME TAX 3 Profit (Loss) on abnormal items before income tax 4 633 389 OPERATING PROFIT BEFORE INCOME TAX 633 392 Income tax expense attributable to operating profit - OPERATING PROFIT AFTER INCOME TAX 633 392 TOTAL AVAILABLE FOR APPROPRIATION 633 392 Dividends paid or provided for 5 633 392
RETAINED PROFITS AT 30 JUNE -
Balance Sheet as at 30 June 2000 2000 $’000 NON-CURRENT ASSETS:
Receivables 6 277 527 Property, plant and equipment 7 31 943
Total Non-Current Assets 309 470 Total Assets 309 470
CURRENT LIABILITIES:
Accounts payable 8 18 Unearned income 9 50
Total Current Liabilities 68 NON-CURRENT LIABILITIES:
Unearned income 9 276 129 Total Non-Current Liabilities 276 129 Total Liabilities 276 197
NET ASSETS 33 273
SHAREHOLDERS’ EQUITY:
Capital 10 33 273 Retained profits -
TOTAL SHAREHOLDERS’ EQUITY 33 273
Contingent Asset 14 Contingent Liability 15
Statement of Cash Flows for the period 29 July 1999 to 30 June 2000 2000 Inflows (Outflows) CASH FLOWS FROM OPERATING ACTIVITIES: $’000
Net Cash Operating Cash Flows - CASH FLOWS FROM INVESTING ACTIVITIES:
Net Investing Cash Flows - CASH FLOWS FROM FINANCING ACTIVITIES:
Dividends paid(1) - Net Financing Cash Flows -
NET INCREASE (DECREASE) IN CASH HELD - CASH TRANSFERRED IN - CASH HELD AT 29 JULY 1999 -
CASH HELD AT 30 JUNE 2000 -
(1) Plant, property and equipment with a written down value of $2 102 million transferred from ETSA Utilities Pty Ltd and dividends paid of
$633.392 million do not represent a cash outflow as they are a component of the accounting treatment for the proceeds already received by the Treasurer.
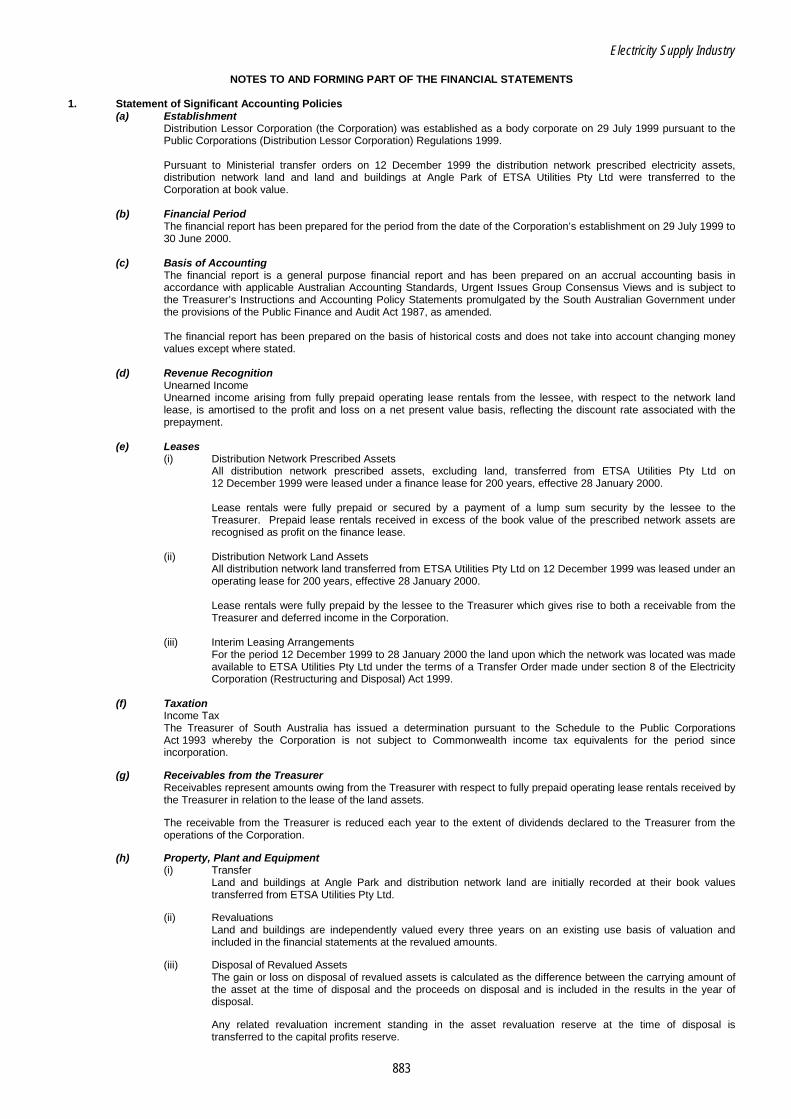
Electricity Supply Industry
883
NOTES TO AND FORMING PART OF THE FINANCIAL STATEMENTS 1. Statement of Significant Accounting Policies (a) Establishment Distribution Lessor Corporation (the Corporation) was established as a body corporate on 29 July 1999 pursuant to the
Public Corporations (Distribution Lessor Corporation) Regulations 1999. Pursuant to Ministerial transfer orders on 12 December 1999 the distribution network prescribed electricity assets,
distribution network land and land and buildings at Angle Park of ETSA Utilities Pty Ltd were transferred to the Corporation at book value.
(b) Financial Period The financial report has been prepared for the period from the date of the Corporation’s establishment on 29 July 1999 to
30 June 2000. (c) Basis of Accounting The financial report is a general purpose financial report and has been prepared on an accrual accounting basis in
accordance with applicable Australian Accounting Standards, Urgent Issues Group Consensus Views and is subject to the Treasurer’s Instructions and Accounting Policy Statements promulgated by the South Australian Government under the provisions of the Public Finance and Audit Act 1987, as amended.
The financial report has been prepared on the basis of historical costs and does not take into account changing money
values except where stated. (d) Revenue Recognition Unearned Income Unearned income arising from fully prepaid operating lease rentals from the lessee, with respect to the network land
lease, is amortised to the profit and loss on a net present value basis, reflecting the discount rate associated with the prepayment.
(e) Leases (i) Distribution Network Prescribed Assets All distribution network prescribed assets, excluding land, transferred from ETSA Utilities Pty Ltd on
12 December 1999 were leased under a finance lease for 200 years, effective 28 January 2000. Lease rentals were fully prepaid or secured by a payment of a lump sum security by the lessee to the
Treasurer. Prepaid lease rentals received in excess of the book value of the prescribed network assets are recognised as profit on the finance lease.
(ii) Distribution Network Land Assets All distribution network land transferred from ETSA Utilities Pty Ltd on 12 December 1999 was leased under an
operating lease for 200 years, effective 28 January 2000. Lease rentals were fully prepaid by the lessee to the Treasurer which gives rise to both a receivable from the
Treasurer and deferred income in the Corporation. (iii) Interim Leasing Arrangements For the period 12 December 1999 to 28 January 2000 the land upon which the network was located was made
available to ETSA Utilities Pty Ltd under the terms of a Transfer Order made under section 8 of the Electricity Corporation (Restructuring and Disposal) Act 1999.
(f) Taxation Income Tax The Treasurer of South Australia has issued a determination pursuant to the Schedule to the Public Corporations
Act 1993 whereby the Corporation is not subject to Commonwealth income tax equivalents for the period since incorporation.
(g) Receivables from the Treasurer Receivables represent amounts owing from the Treasurer with respect to fully prepaid operating lease rentals received by
the Treasurer in relation to the lease of the land assets. The receivable from the Treasurer is reduced each year to the extent of dividends declared to the Treasurer from the
operations of the Corporation. (h) Property, Plant and Equipment (i) Transfer Land and buildings at Angle Park and distribution network land are initially recorded at their book values
transferred from ETSA Utilities Pty Ltd. (ii) Revaluations Land and buildings are independently valued every three years on an existing use basis of valuation and
included in the financial statements at the revalued amounts. (iii) Disposal of Revalued Assets The gain or loss on disposal of revalued assets is calculated as the difference between the carrying amount of
the asset at the time of disposal and the proceeds on disposal and is included in the results in the year of disposal.
Any related revaluation increment standing in the asset revaluation reserve at the time of disposal is
transferred to the capital profits reserve.
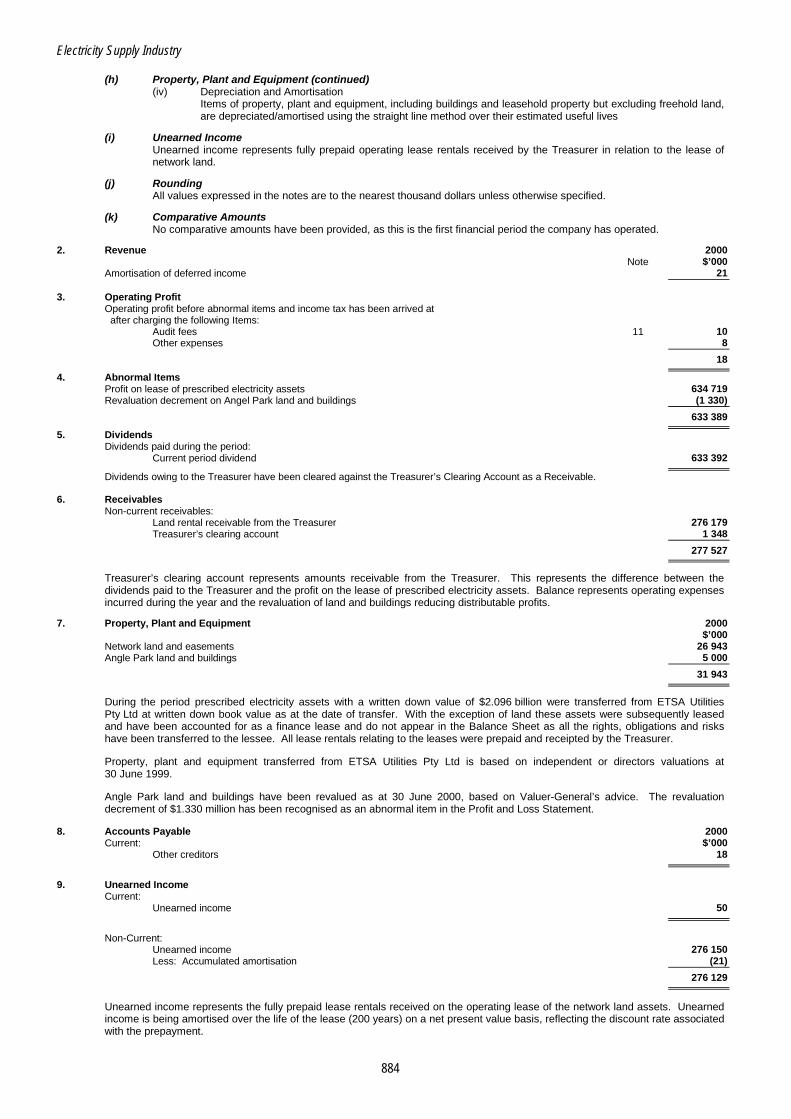
Electricity Supply Industry
884
(h) Property, Plant and Equipment (continued) (iv) Depreciation and Amortisation Items of property, plant and equipment, including buildings and leasehold property but excluding freehold land,
are depreciated/amortised using the straight line method over their estimated useful lives (i) Unearned Income Unearned income represents fully prepaid operating lease rentals received by the Treasurer in relation to the lease of
network land.
(j) Rounding All values expressed in the notes are to the nearest thousand dollars unless otherwise specified. (k) Comparative Amounts No comparative amounts have been provided, as this is the first financial period the company has operated. 2. Revenue 2000 Note $’000 Amortisation of deferred income 21 3. Operating Profit Operating profit before abnormal items and income tax has been arrived at after charging the following Items: Audit fees 11 10 Other expenses 8
18
4. Abnormal Items Profit on lease of prescribed electricity assets 634 719 Revaluation decrement on Angel Park land and buildings (1 330)
633 389
5. Dividends Dividends paid during the period: Current period dividend 633 392
Dividends owing to the Treasurer have been cleared against the Treasurer’s Clearing Account as a Receivable. 6. Receivables Non-current receivables: Land rental receivable from the Treasurer 276 179 Treasurer’s clearing account 1 348
277 527
Treasurer’s clearing account represents amounts receivable from the Treasurer. This represents the difference between the dividends paid to the Treasurer and the profit on the lease of prescribed electricity assets. Balance represents operating expenses incurred during the year and the revaluation of land and buildings reducing distributable profits.
7. Property, Plant and Equipment 2000 $’000 Network land and easements 26 943 Angle Park land and buildings 5 000
31 943
During the period prescribed electricity assets with a written down value of $2.096 billion were transferred from ETSA Utilities
Pty Ltd at written down book value as at the date of transfer. With the exception of land these assets were subsequently leased and have been accounted for as a finance lease and do not appear in the Balance Sheet as all the rights, obligations and risks have been transferred to the lessee. All lease rentals relating to the leases were prepaid and receipted by the Treasurer.
Property, plant and equipment transferred from ETSA Utilities Pty Ltd is based on independent or directors valuations at
30 June 1999. Angle Park land and buildings have been revalued as at 30 June 2000, based on Valuer-General’s advice. The revaluation
decrement of $1.330 million has been recognised as an abnormal item in the Profit and Loss Statement. 8. Accounts Payable 2000 Current: $’000 Other creditors 18
9. Unearned Income Current: Unearned income 50
Non-Current: Unearned income 276 150 Less: Accumulated amortisation (21)
276 129
Unearned income represents the fully prepaid lease rentals received on the operating lease of the network land assets. Unearned
income is being amortised over the life of the lease (200 years) on a net present value basis, reflecting the discount rate associated with the prepayment.
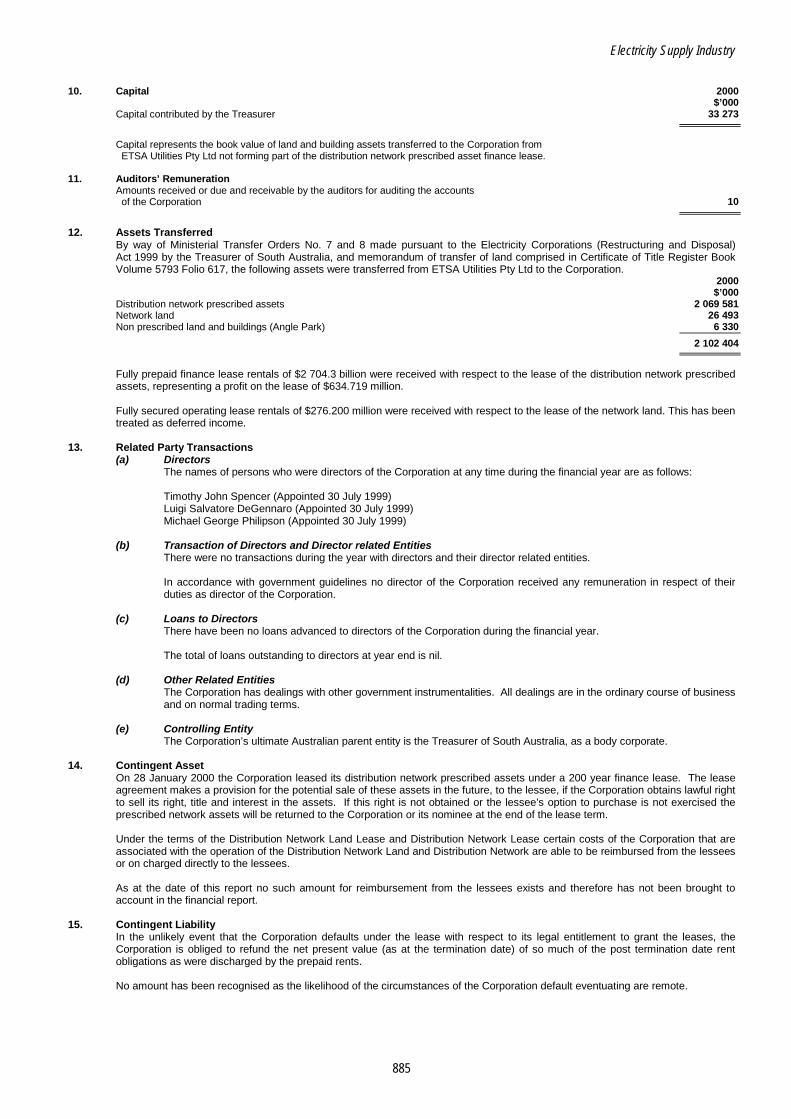
Electricity Supply Industry
885
10. Capital 2000 $’000 Capital contributed by the Treasurer 33 273
Capital represents the book value of land and building assets transferred to the Corporation from ETSA Utilities Pty Ltd not forming part of the distribution network prescribed asset finance lease. 11. Auditors’ Remuneration Amounts received or due and receivable by the auditors for auditing the accounts of the Corporation 10
12. Assets Transferred By way of Ministerial Transfer Orders No. 7 and 8 made pursuant to the Electricity Corporations (Restructuring and Disposal)
Act 1999 by the Treasurer of South Australia, and memorandum of transfer of land comprised in Certificate of Title Register Book Volume 5793 Folio 617, the following assets were transferred from ETSA Utilities Pty Ltd to the Corporation.
2000 $’000 Distribution network prescribed assets 2 069 581 Network land 26 493 Non prescribed land and buildings (Angle Park) 6 330
2 102 404
Fully prepaid finance lease rentals of $2 704.3 billion were received with respect to the lease of the distribution network prescribed
assets, representing a profit on the lease of $634.719 million. Fully secured operating lease rentals of $276.200 million were received with respect to the lease of the network land. This has been
treated as deferred income. 13. Related Party Transactions (a) Directors The names of persons who were directors of the Corporation at any time during the financial year are as follows: Timothy John Spencer (Appointed 30 July 1999) Luigi Salvatore DeGennaro (Appointed 30 July 1999) Michael George Philipson (Appointed 30 July 1999) (b) Transaction of Directors and Director related Entities There were no transactions during the year with directors and their director related entities. In accordance with government guidelines no director of the Corporation received any remuneration in respect of their
duties as director of the Corporation. (c) Loans to Directors There have been no loans advanced to directors of the Corporation during the financial year. The total of loans outstanding to directors at year end is nil. (d) Other Related Entities The Corporation has dealings with other government instrumentalities. All dealings are in the ordinary course of business
and on normal trading terms.
(e) Controlling Entity The Corporation’s ultimate Australian parent entity is the Treasurer of South Australia, as a body corporate.
14. Contingent Asset On 28 January 2000 the Corporation leased its distribution network prescribed assets under a 200 year finance lease. The lease
agreement makes a provision for the potential sale of these assets in the future, to the lessee, if the Corporation obtains lawful right to sell its right, title and interest in the assets. If this right is not obtained or the lessee’s option to purchase is not exercised the prescribed network assets will be returned to the Corporation or its nominee at the end of the lease term.
Under the terms of the Distribution Network Land Lease and Distribution Network Lease certain costs of the Corporation that are
associated with the operation of the Distribution Network Land and Distribution Network are able to be reimbursed from the lessees or on charged directly to the lessees.
As at the date of this report no such amount for reimbursement from the lessees exists and therefore has not been brought to
account in the financial report. 15. Contingent Liability In the unlikely event that the Corporation defaults under the lease with respect to its legal entitlement to grant the leases, the
Corporation is obliged to refund the net present value (as at the termination date) of so much of the post termination date rent obligations as were discharged by the prepaid rents.
No amount has been recognised as the likelihood of the circumstances of the Corporation default eventuating are remote.
Electricity Supply Industry
886
15. Contingent Liability (continued) Under the terms of the distribution network leases the lessee can elect to own new assets constructed during the term of the lease which qualify as ‘qualifying assets’ or ‘geographical extensions’. Qualifying assets are a discrete replacement, modification, alteration, addition or renewal to the network which is outside the ordinary course of maintenance, modification, alteration or renewal and, at the time effected, cost greater than a ‘Qualifying Threshold’ of $2 million. Geographical extensions are extensions beyond the outer extremities of the distribution network as at the date the lease becomes effective.
If the Corporation so elects at the end of the lease geographical extensions and, automatically, qualifying assets, will be transferred
and vested in the Corporation or a body nominated by the Corporation for a price equal to the regulatory value of the qualifying assets/geographical extensions as at the lease end date.
16. Segment Information The entity operates as lessor of electricity distribution assets in South Australia. 17. Events subsequent to Balance Date No event has arisen since 30 June 2000 that would be likely to materially affect the operations or the state of affairs of the
Corporation. 18. Economic Dependency The Corporation is an instrumentality of the Crown under the Crown Proceedings Act 1992. Accordingly, where a final judgement is
given against it, it may be directed by the Governor to satisfy that judgement. Such a direction constitutes sufficient authority for the appropriation of the money necessary to satisfy the judgement from the General Revenue of the State of South Australia or from the funds of the Corporation. To this extent the Corporation has the benefit of an implicit guarantee from the State.

Electricity Supply Industry
887
ELECTRICITY SUPPLY INDUSTRY - GENERATION
INTRODUCTION CHANGES TO AGENCY ORGANISATIONAL STRUCTURE Prior to 1998-99, the government-owned electricity generation operations were consolidated in the one business, SA Generation Corporation (trading as Optima Energy). As part of the electricity supply industry reform process, and to prepare the State’s electricity assets for disposal, the Government subdivided the generation function into three competing businesses and created a company to manage the existing gas contracts and to trade in gas. DESCRIPTION OF OPERATIONS As a result of the above changes the electricity generation businesses of the Government became: • Flinders Power Pty Ltd — which operated the brown coal fired power stations at Port Augusta with a
capacity of 760 MW. The company also operated a coal field at Leigh Creek and owned the railway line linking the coal field with the power stations.
• Optima Energy Pty Ltd (now RESI OE Pty Ltd) — which operated the gas fired power station at Torrens Island with a capacity of 1280 MW. The power station can also operate using oil as the fuel for generation.
• Synergen Pty Ltd (now RESI SYN Pty Ltd) — which operated gas turbine generators at four locations with a total capacity of 359 MW.
In addition, Terra Gas Trader Pty Ltd managed gas contracts originating in the South Australian and South West Queensland Cooper Basins. Shares in each of these companies were held by SA Generation Corporation. CHANGES TO AGENCY ORGANISATIONAL STRUCTURES IN 1999-2000 In July 1999 Generation Lessor Corporation was established as a subsidiary of the Treasurer to be the lessor of the prescribed electricity generation assets disposed of. In March 2000 shares held by SA Generation Corporation in the four companies were transferred to the Treasurer. In addition, as part of the Government’s disposal of the electricity businesses the following changes have taken place since 1 July 1999: • On 4 May 2000 the South Australian Treasurer signed an agreement with TXU Electricity Ltd (TXU) for
the disposal of the assets and liabilities of Optima Energy Pty Ltd. Although settlement of the transaction did not take place until 6 June 2000, the benefits and risks associated with the business were transferred as at the date of the agreement ie 4 May 2000.
• On 11 May 2000 the South Australian Treasurer signed an agreement with National Power Australia Pty Ltd (National Power) for the disposal of the assets and liabilities of Synergen Pty Ltd. Although settlement of the transaction did not take place until 6 June 2000, the benefits and risks associated with the business were transferred as at the date of the agreement ie 11 May 2000.
Electricity Supply Industry
888
• The Government has announced that on 3 August 2000 an agreement was signed with NRG Energy for the disposal of the assets and liabilities of Flinders Power Pty Ltd. Although settlement of the transaction did not occur until 8 September 2000, the benefits and risks associated with the business were transferred as at the date of the agreement, ie 3 August 2000.
• Under the Government’s electricity businesses disposal program, Final Bids for the disposal of Terra Gas Trader Pty Ltd were received on 17 July 2000. As at the date of the preparation of this Report, no announcement had been made with respect to the outcome of the disposal process of that entity.
SPECIFIC COMMENTARY ON GENERATION OPERATIONS The following commentary details the operations of: • Flinders Power Pty Ltd • RESI OE Pty Ltd (formerly Optima Energy Pty Ltd) • RESI SYN Pty Ltd (formerly Synergen Pty Ltd) • Terra Gas Trader Pty Ltd • Generation Lessor Corporation.
Electricity Supply Industry
889
FLINDERS POWER PTY LTD FUNCTIONAL RESPONSIBILITY AND STRUCTURE Flinders Power Pty Ltd (Flinders Power) was incorporated under the Corporations Law in May 1998. On the restructure of the State’s electricity businesses in October 1998 assets, liabilities and staff were transferred to the Company. For financial statement purposes the transfers were deemed to have taken place from 1 July 1998. Pursuant to a Ministerial Transfer Order, dated 23 March 2000, the shares in Flinders Power Pty Ltd held by the SA Generation Corporation were transferred to the Treasurer as a body corporate. DESCRIPTION OF OBJECTIVES Under the Company’s charter the nature and scope of its operations include the: • generation, supply and sale of electricity from Northern Power Station and Playford Station; • ownership and operation of the Leigh Creek Coal Mine and Railway; • management of the contract to purchase electricity from the CUBE Co-generation Contract. CHANGES TO AGENCY ORGANISATIONAL STRUCTURE IN 2000-2001 Disposal of Assets and Liabilities of the Business The Government has announced that on 3 August 2000 an agreement was signed with NRG Energy for the disposal of the assets and liabilities of Flinders Power Pty Ltd. Although settlement of the transaction did not occur until the 8 September 2000, the benefits and risk associated with the business were transferred as at the date of the agreement, ie 3 August 2000. As a result of the agreement: • Prescribed generation assets, together with the Leigh Creek township and the Leigh Creek to Port
Augusta railway line, were transferred to Generation Lessor Corporation.
• Non-prescribed assets (net of liabilities) were sold to the new owners. SIGNIFICANT FEATURES Sales of energy for the year were $280.9 million, an increase of $82.5 million and comprised $240.1 million from the generation of electricity and $40.8 million from the sale of gas. Operating profit before income tax increased by $14.5 million to $28 million. There was a repayment of borrowings of $20 million. AUDIT MANDATE AND COVERAGE Audit Authority In accordance with section 31 of the Public Finance and Audit Act 1987 and subclause 13(3) of the Schedule to the Public Corporations Act 1993 the Auditor-General may at any time, and must in respect of each financial year, audit the accounts and financial statements of Flinders Power Pty Ltd.
Electricity Supply Industry
890
Scope of Audit The audit program covered all major financial systems and was directed primarily towards obtaining sufficient evidence to enable an audit opinion to be formed with respect to the financial statements and internal controls. During 1999-2000 specific areas of audit attention included: • Testing of controls and a sample of transactions in relation to the completeness, accuracy, timeliness
and recording of revenue and expenditure in relation to the co-generation contract.
• Review of controls and reporting mechanisms established to ensure compliance with the Electricity Trading Risk Management Framework.
• Testing of controls and a sample of transactions in relation to the completeness, accuracy, timeliness and recording of revenue and associated charges from electricity contracts and electricity pool sales.
Audit Communications to Management As components of the audit were completed, Audit provided management letters detailing the findings and recommendations arising from that work. The letters were forwarded to the Chief Executive Officer with copies provided to the: • Chairman, Board of Directors Flinders Power; • Manager, Internal Audit, Flinders Power. Satisfactory replies were received to all Audit management letters. AUDIT FINDINGS AND COMMENTS Commentary on General Financial Controls Work undertaken by Audit during the course of the year indicated that Flinders Power had maintained a sound internal control environment. In particular there are a number of strategic initiatives which underpin this environment, including:
• an Internal Audit function which reports directly to the Board of Directors;
• management representations made to Directors of Flinders Power, providing a tool for the Directors to assess the level of the internal controls. These representations include matters relating to legal compliance, and other matters supporting the integrity and fairness of presentation of information conveyed within the financial statements. These representations contained a strong focus with respect to key account reconciliations and the physical verification and valuation of assets.
In addition, Audit was invited to attend selected Board meetings to discuss matters relating to the audit of the Company. Future Losses on Co-Generation Contracts Over the past few years negotiations have occurred with other parties to establish a ‘co-generation’ plant, whereby steam is provided for a production process and electricity provided to the South Australian electricity grid. As a result, contracts were signed whereby the Government would sell gas and buy electricity at a fixed price on the commencement of the co-generation plant. The rules of the National Electricity Market require electricity from generators with a capacity of more than 30 MW (which includes the co-generation plant) to be sold into the ‘pool’. As the costs of electricity purchased at a fixed contract price from the co-generation plant operator may be more than what can expected to be recovered from the sale of the electricity into the pool, there is potential for ‘losses’ to be incurred. As a result, a provision for future co-generation contract losses is recognised in the financial statements of Flinders Power.

Electricity Supply Industry
891
A review of the provision as at 30 June 2000 has resulted in the provision decreasing by $13.1 million to $116.9 million. Electricity Risk Management The introduction of the National Electricity Market (NEM) led to significant changes in the risk facing all electricity generators. An example of this is the large fluctuations in the prices of the electricity pool into which the generators are required to sell their electricity. To manage these risks Flinders Power has established an electricity risk management policy and framework designed to ensure the activities reflect the targets and strategies of the Board. The policy identifies a number of specific risks and details responsibility for their management. Implementation of the policy includes a Management Committee to oversee the Flinders Power’s electricity trading risks. CONTROLS OPINION As required by subsection 36(1)(a)(iii) of the Public Finance and Audit Act 1987, the audit of Flinders Power Pty Ltd included an assessment of the controls exercised in relation to the receipt, expenditure and investment of money, the acquisition and disposal of property and the incurring of liabilities. Audit formed the opinion that the controls exercised by Flinders Power Pty Ltd in relation to the receipt, expenditure and investment of money; the acquisition and disposal of property; and the incurring of liabilities, were sufficient to provide reasonable assurance that the financial transactions of the organisation were conducted properly and in accordance with the law. INTERPRETATION AND ANALYSIS OF FINANCIAL STATEMENTS Profit and Loss Statement Revenue from operating activities increased by $83.6 million (42 percent) and operations and services expenditure increased by $70.5 million (42 percent) due to: • increased production at the Northern and Playford Power Stations;
• the full year impact of the co-generation contract. Balance Sheet Current liabilities for accounts payable decreased by $13.5 million due mainly to a significant accrual for capital purchases in the previous year.
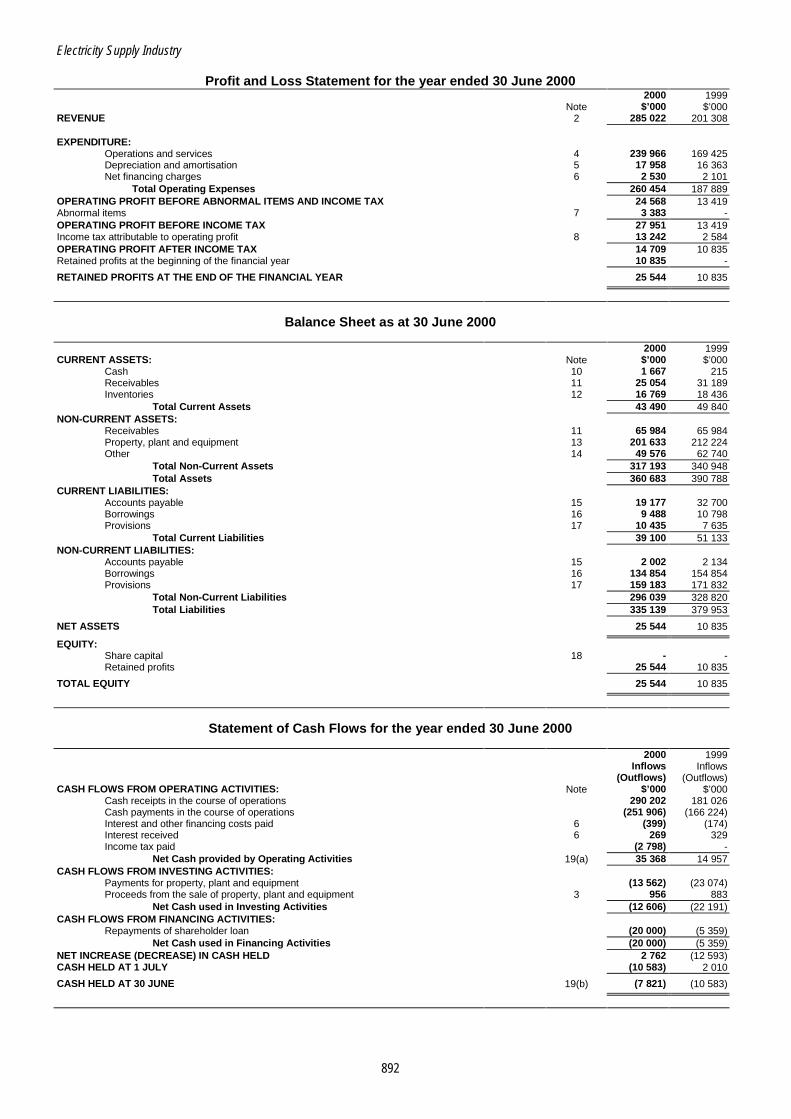
Electricity Supply Industry
892
Profit and Loss Statement for the year ended 30 June 2000 2000 1999 Note $’000 $’000 REVENUE 2 285 022 201 308 EXPENDITURE:
Operations and services 4 239 966 169 425 Depreciation and amortisation 5 17 958 16 363 Net financing charges 6 2 530 2 101
Total Operating Expenses 260 454 187 889 OPERATING PROFIT BEFORE ABNORMAL ITEMS AND INCOME TAX 24 568 13 419 Abnormal items 7 3 383 - OPERATING PROFIT BEFORE INCOME TAX 27 951 13 419 Income tax attributable to operating profit 8 13 242 2 584 OPERATING PROFIT AFTER INCOME TAX 14 709 10 835 Retained profits at the beginning of the financial year 10 835 -
RETAINED PROFITS AT THE END OF THE FINANCIAL YEAR 25 544 10 835
Balance Sheet as at 30 June 2000 2000 1999 CURRENT ASSETS: Note $’000 $’000
Cash 10 1 667 215 Receivables 11 25 054 31 189 Inventories 12 16 769 18 436
Total Current Assets 43 490 49 840 NON-CURRENT ASSETS:
Receivables 11 65 984 65 984 Property, plant and equipment 13 201 633 212 224 Other 14 49 576 62 740
Total Non-Current Assets 317 193 340 948 Total Assets 360 683 390 788
CURRENT LIABILITIES: Accounts payable 15 19 177 32 700 Borrowings 16 9 488 10 798 Provisions 17 10 435 7 635
Total Current Liabilities 39 100 51 133 NON-CURRENT LIABILITIES:
Accounts payable 15 2 002 2 134 Borrowings 16 134 854 154 854 Provisions 17 159 183 171 832
Total Non-Current Liabilities 296 039 328 820 Total Liabilities 335 139 379 953
NET ASSETS 25 544 10 835
EQUITY: Share capital 18 - - Retained profits 25 544 10 835
TOTAL EQUITY 25 544 10 835
Statement of Cash Flows for the year ended 30 June 2000 2000 1999 Inflows Inflows (Outflows) (Outflows) CASH FLOWS FROM OPERATING ACTIVITIES: Note $’000 $’000
Cash receipts in the course of operations 290 202 181 026 Cash payments in the course of operations (251 906) (166 224) Interest and other financing costs paid 6 (399) (174) Interest received 6 269 329 Income tax paid (2 798) -
Net Cash provided by Operating Activities 19(a) 35 368 14 957 CASH FLOWS FROM INVESTING ACTIVITIES:
Payments for property, plant and equipment (13 562) (23 074) Proceeds from the sale of property, plant and equipment 3 956 883
Net Cash used in Investing Activities (12 606) (22 191) CASH FLOWS FROM FINANCING ACTIVITIES:
Repayments of shareholder loan (20 000) (5 359) Net Cash used in Financing Activities (20 000) (5 359)
NET INCREASE (DECREASE) IN CASH HELD 2 762 (12 593) CASH HELD AT 1 JULY (10 583) 2 010
CASH HELD AT 30 JUNE 19(b) (7 821) (10 583)
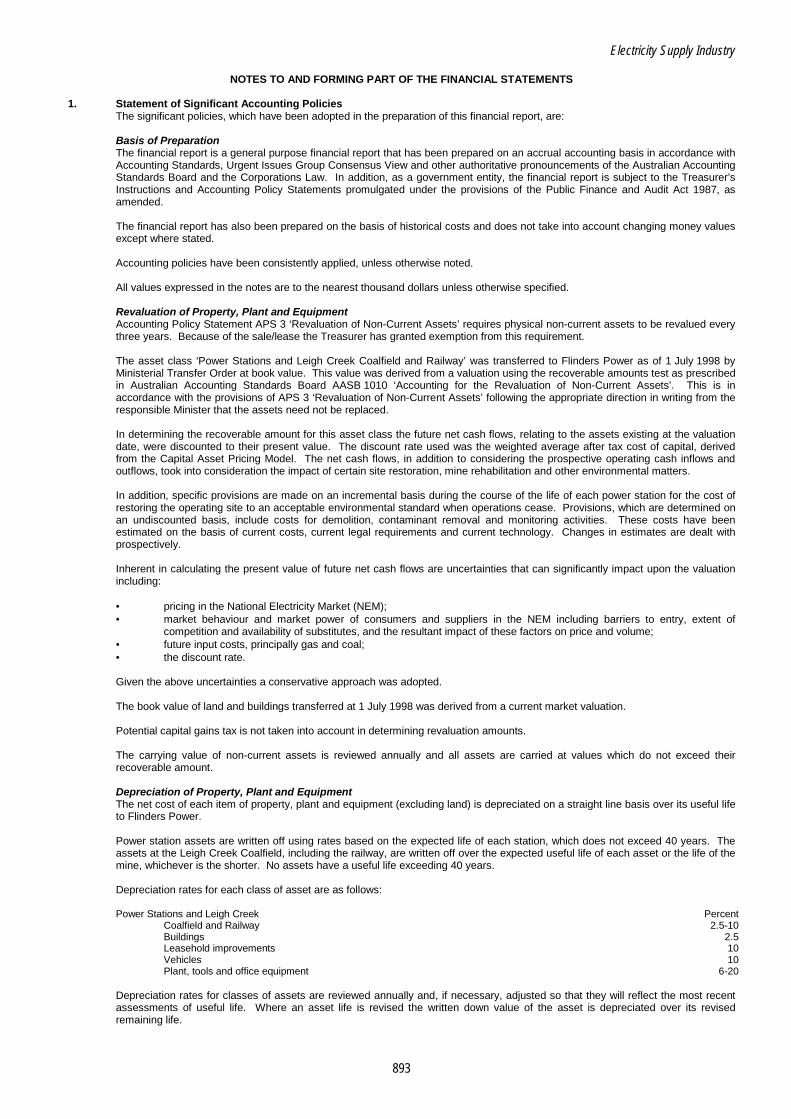
Electricity Supply Industry
893
NOTES TO AND FORMING PART OF THE FINANCIAL STATEMENTS 1. Statement of Significant Accounting Policies
The significant policies, which have been adopted in the preparation of this financial report, are:
Basis of Preparation The financial report is a general purpose financial report that has been prepared on an accrual accounting basis in accordance with Accounting Standards, Urgent Issues Group Consensus View and other authoritative pronouncements of the Australian Accounting Standards Board and the Corporations Law. In addition, as a government entity, the financial report is subject to the Treasurer’s Instructions and Accounting Policy Statements promulgated under the provisions of the Public Finance and Audit Act 1987, as amended.
The financial report has also been prepared on the basis of historical costs and does not take into account changing money values except where stated.
Accounting policies have been consistently applied, unless otherwise noted.
All values expressed in the notes are to the nearest thousand dollars unless otherwise specified.
Revaluation of Property, Plant and Equipment Accounting Policy Statement APS 3 ‘Revaluation of Non-Current Assets’ requires physical non-current assets to be revalued every three years. Because of the sale/lease the Treasurer has granted exemption from this requirement.
The asset class ‘Power Stations and Leigh Creek Coalfield and Railway’ was transferred to Flinders Power as of 1 July 1998 by Ministerial Transfer Order at book value. This value was derived from a valuation using the recoverable amounts test as prescribed in Australian Accounting Standards Board AASB 1010 ‘Accounting for the Revaluation of Non-Current Assets’. This is in accordance with the provisions of APS 3 ‘Revaluation of Non-Current Assets’ following the appropriate direction in writing from the responsible Minister that the assets need not be replaced.
In determining the recoverable amount for this asset class the future net cash flows, relating to the assets existing at the valuation date, were discounted to their present value. The discount rate used was the weighted average after tax cost of capital, derived from the Capital Asset Pricing Model. The net cash flows, in addition to considering the prospective operating cash inflows and outflows, took into consideration the impact of certain site restoration, mine rehabilitation and other environmental matters.
In addition, specific provisions are made on an incremental basis during the course of the life of each power station for the cost of restoring the operating site to an acceptable environmental standard when operations cease. Provisions, which are determined on an undiscounted basis, include costs for demolition, contaminant removal and monitoring activities. These costs have been estimated on the basis of current costs, current legal requirements and current technology. Changes in estimates are dealt with prospectively.
Inherent in calculating the present value of future net cash flows are uncertainties that can significantly impact upon the valuation including:
• pricing in the National Electricity Market (NEM); • market behaviour and market power of consumers and suppliers in the NEM including barriers to entry, extent of
competition and availability of substitutes, and the resultant impact of these factors on price and volume; • future input costs, principally gas and coal; • the discount rate.
Given the above uncertainties a conservative approach was adopted.
The book value of land and buildings transferred at 1 July 1998 was derived from a current market valuation.
Potential capital gains tax is not taken into account in determining revaluation amounts.
The carrying value of non-current assets is reviewed annually and all assets are carried at values which do not exceed their recoverable amount.
Depreciation of Property, Plant and Equipment The net cost of each item of property, plant and equipment (excluding land) is depreciated on a straight line basis over its useful life to Flinders Power.
Power station assets are written off using rates based on the expected life of each station, which does not exceed 40 years. The assets at the Leigh Creek Coalfield, including the railway, are written off over the expected useful life of each asset or the life of the mine, whichever is the shorter. No assets have a useful life exceeding 40 years.
Depreciation rates for each class of asset are as follows:
Power Stations and Leigh Creek Percent
Coalfield and Railway 2.5-10 Buildings 2.5 Leasehold improvements 10 Vehicles 10 Plant, tools and office equipment 6-20
Depreciation rates for classes of assets are reviewed annually and, if necessary, adjusted so that they will reflect the most recent assessments of useful life. Where an asset life is revised the written down value of the asset is depreciated over its revised remaining life.

Electricity Supply Industry
894
1. Statement of Significant Accounting Policies (continued) Leases Assets under finance leases are recorded at their historical cost or revalued amount under the appropriate asset class within property, plant and equipment. Amortisation and finance charges on assets under finance leases are charged as an operating expense.
Payments made under operating leases are charged as an expense in the periods in which they are incurred.
Cash For the purposes of the Statement of Cash Flows, cash includes cash on hand and at bank net of borrowings with the South Australian Government Financing Authority.
Net Financing Charges This item includes all costs and income associated with financing arrangements with external organisations and interest accrued to the provision for employee retirement benefits.
Employee Entitlements Employee entitlements, including incentive payments, reflect those entitlements accrued as a result of service provided by employees up to the reporting date. All salaries, wages, bonus payments, annual leave, long service leave and retirement benefits expected to be settled within twelve months of the year end are measured at their nominal amounts based on current remuneration rates. Other employee entitlements payable later than one year have been measured at the present value of the estimated future cash outflows to be made for those entitlements. Related on-costs have also been provided for in respect of incentive payments, annual leave and long service leave.
Superannuation Contributions are made principally to the Electricity Industry Superannuation Scheme, details of which are set out in Note 27.
Insurance Flinders Power effects insurance by payment of premiums to cover certain specified risks, the remaining risks are covered by Flinders Power acting as its own insurer. Self-insured risks include Workers Compensation and other minor risks such as Fidelity Guarantee and motor risk.
Flinders Power retains a significant deductible on its Property and Liability risks and funds losses that fall within these deductibles from operating income.
The provision for self insurance comprises claims which have been reported but not yet paid, and an estimate of claims incurred but not reported.
The overall position of the provision is reviewed annually by specialist internal management and periodically by external consultants.
Revenue Income from all sources is recognised as revenue when the product or service is provided. Interest received on funds invested is recognised when it accrues and is included separately in Net Financing Charges.
Inventories Inventories are valued at the lower of cost and net realisable value. Coal stocks are valued on an average cost basis and include direct material, labour, transportation costs and other fixed and variable overhead costs directly related to production. Other inventory is valued on a weighted average cost basis. A provision for inventory writedown is raised to cover the estimated value of excess and obsolete inventory.
Mine Restoration Costs At balance date a provision for mine restoration costs, resulting from activities to date, is not required because of the practice of performing restoration, to the extent obligated, progressively over the life of the mine as production occurs. The associated costs are contained in a mine plan which has been submitted and approved by the Department of Primary Industries and Resources.
Tax Equivalent Regime (TER) Flinders Power was required to pay to the Department of Treasury and Finance amounts determined to be equivalent to the amounts that would be payable by Flinders Power if it was a tax paying entity and taxed as a company under the Income Tax Assessment Acts 1936 and 1997.
Accordingly, income tax expense is calculated on operating profit adjusted for permanent differences between taxable and accounting income. The tax effect of timing differences, which arise from items being brought to account in different periods for income tax and accounting purposes, is normally carried forward in the balance sheet as a future income tax benefit or a provision for deferred income tax.
Under clause 12 of the Schedule to the Public Corporations Act 1993, the Treasurer has determined that Flinders Power is not liable to pay any rates (other than rates payable to a council) duties, taxes and imposts for the period from 1 April 2000 to 31 March 2001. Consequently income tax expense has only been calculated for the period 1 July 1999 to 31 March 2000.
Future income tax benefits relating to timing differences are not brought to account unless the realisation of the asset is assured beyond reasonable doubt.
Future income tax benefits relating to tax losses are not brought to account unless their realisation is virtually certain.
Future Contract Losses Expected financial losses on individual commercial contracts are recognised as the present value of future cash flows. The discounted rate used was the weighted average after tax cost of capital.
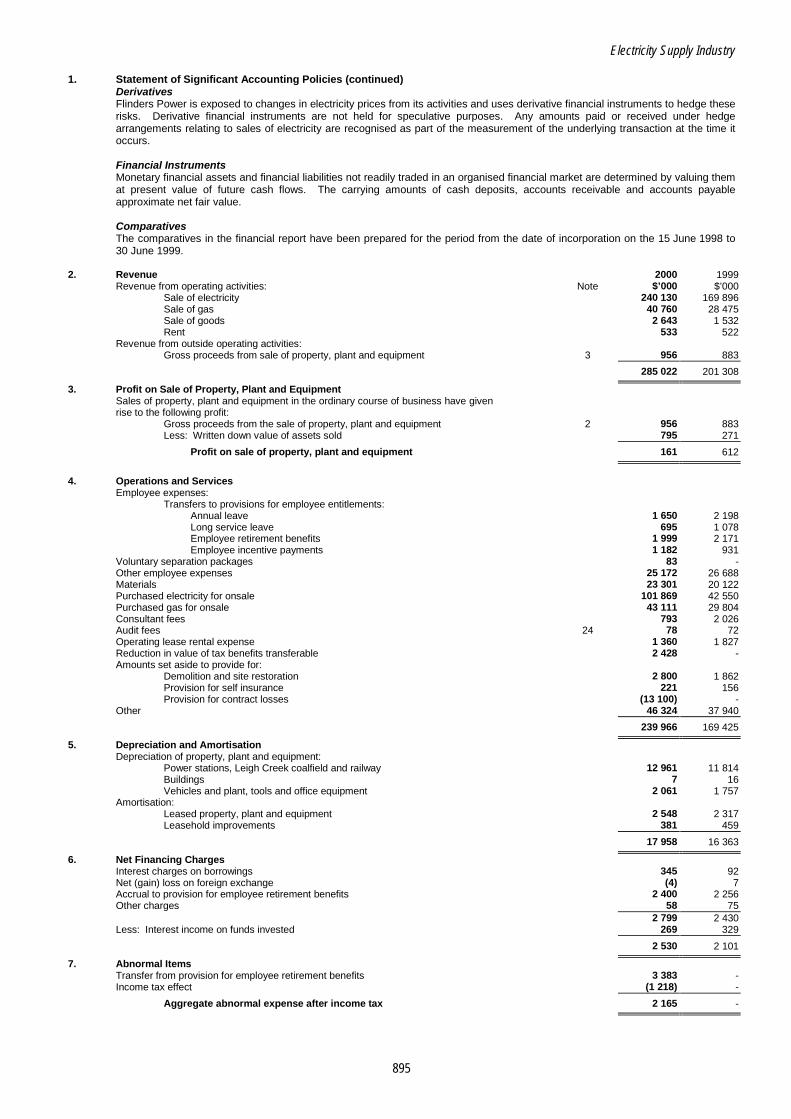
Electricity Supply Industry
895
1. Statement of Significant Accounting Policies (continued) Derivatives Flinders Power is exposed to changes in electricity prices from its activities and uses derivative financial instruments to hedge these risks. Derivative financial instruments are not held for speculative purposes. Any amounts paid or received under hedge arrangements relating to sales of electricity are recognised as part of the measurement of the underlying transaction at the time it occurs.
Financial Instruments Monetary financial assets and financial liabilities not readily traded in an organised financial market are determined by valuing them at present value of future cash flows. The carrying amounts of cash deposits, accounts receivable and accounts payable approximate net fair value.
Comparatives The comparatives in the financial report have been prepared for the period from the date of incorporation on the 15 June 1998 to 30 June 1999.
2. Revenue 2000 1999 Revenue from operating activities: Note $’000 $’000
Sale of electricity 240 130 169 896 Sale of gas 40 760 28 475 Sale of goods 2 643 1 532 Rent 533 522
Revenue from outside operating activities: Gross proceeds from sale of property, plant and equipment 3 956 883
285 022 201 308
3. Profit on Sale of Property, Plant and Equipment Sales of property, plant and equipment in the ordinary course of business have given rise to the following profit:
Gross proceeds from the sale of property, plant and equipment 2 956 883 Less: Written down value of assets sold 795 271
Profit on sale of property, plant and equipment 161 612
4. Operations and Services
Employee expenses: Transfers to provisions for employee entitlements:
Annual leave 1 650 2 198 Long service leave 695 1 078 Employee retirement benefits 1 999 2 171 Employee incentive payments 1 182 931
Voluntary separation packages 83 - Other employee expenses 25 172 26 688 Materials 23 301 20 122 Purchased electricity for onsale 101 869 42 550 Purchased gas for onsale 43 111 29 804 Consultant fees 793 2 026 Audit fees 24 78 72 Operating lease rental expense 1 360 1 827 Reduction in value of tax benefits transferable 2 428 - Amounts set aside to provide for:
Demolition and site restoration 2 800 1 862 Provision for self insurance 221 156 Provision for contract losses (13 100) -
Other 46 324 37 940 239 966 169 425
5. Depreciation and Amortisation Depreciation of property, plant and equipment:
Power stations, Leigh Creek coalfield and railway 12 961 11 814 Buildings 7 16 Vehicles and plant, tools and office equipment 2 061 1 757
Amortisation: Leased property, plant and equipment 2 548 2 317 Leasehold improvements 381 459
17 958 16 363
6. Net Financing Charges Interest charges on borrowings 345 92 Net (gain) loss on foreign exchange (4) 7 Accrual to provision for employee retirement benefits 2 400 2 256 Other charges 58 75
2 799 2 430 Less: Interest income on funds invested 269 329
2 530 2 101
7. Abnormal Items Transfer from provision for employee retirement benefits 3 383 - Income tax effect (1 218) -
Aggregate abnormal expense after income tax 2 165 -
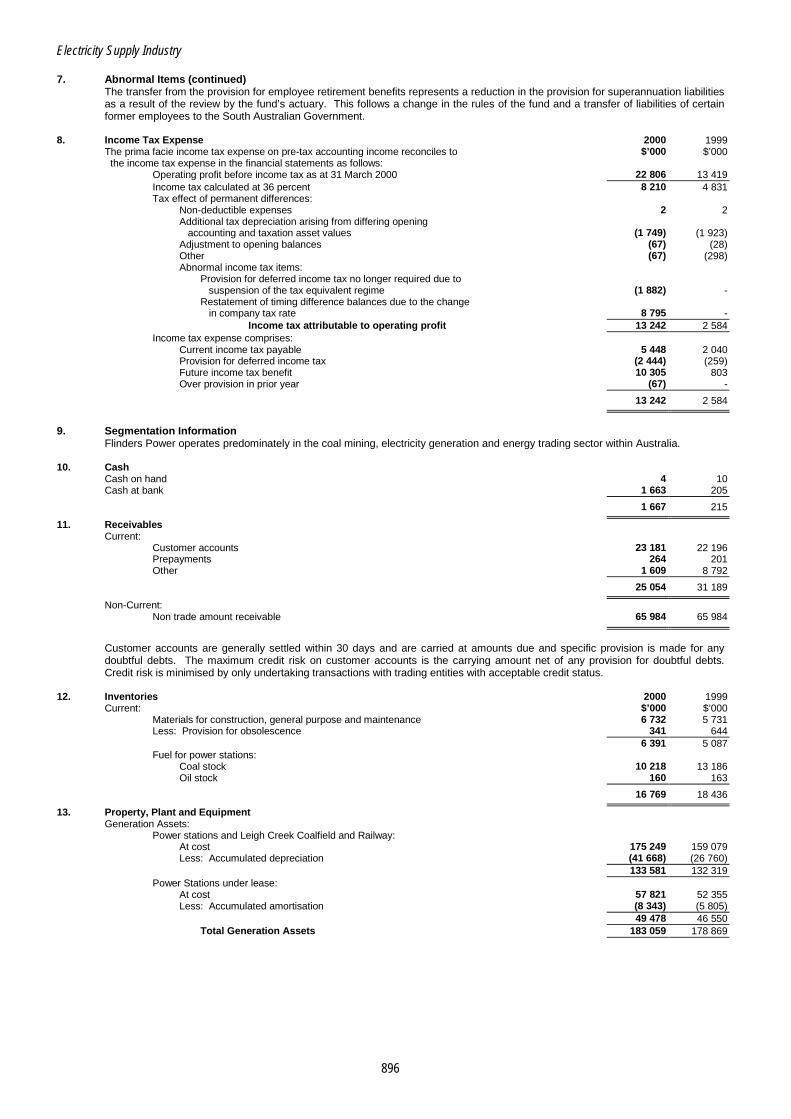
Electricity Supply Industry
896
7. Abnormal Items (continued) The transfer from the provision for employee retirement benefits represents a reduction in the provision for superannuation liabilities as a result of the review by the fund’s actuary. This follows a change in the rules of the fund and a transfer of liabilities of certain former employees to the South Australian Government.
8. Income Tax Expense 2000 1999 The prima facie income tax expense on pre-tax accounting income reconciles to $’000 $’000 the income tax expense in the financial statements as follows:
Operating profit before income tax as at 31 March 2000 22 806 13 419 Income tax calculated at 36 percent 8 210 4 831 Tax effect of permanent differences:
Non-deductible expenses 2 2 Additional tax depreciation arising from differing opening accounting and taxation asset values (1 749) (1 923) Adjustment to opening balances (67) (28) Other (67) (298) Abnormal income tax items:
Provision for deferred income tax no longer required due to suspension of the tax equivalent regime (1 882) - Restatement of timing difference balances due to the change in company tax rate 8 795 -
Income tax attributable to operating profit 13 242 2 584 Income tax expense comprises:
Current income tax payable 5 448 2 040 Provision for deferred income tax (2 444) (259) Future income tax benefit 10 305 803 Over provision in prior year (67) -
13 242 2 584
9. Segmentation Information
Flinders Power operates predominately in the coal mining, electricity generation and energy trading sector within Australia.
10. Cash Cash on hand 4 10 Cash at bank 1 663 205
1 667 215
11. Receivables Current:
Customer accounts 23 181 22 196 Prepayments 264 201 Other 1 609 8 792
25 054 31 189
Non-Current: Non trade amount receivable 65 984 65 984
Customer accounts are generally settled within 30 days and are carried at amounts due and specific provision is made for any doubtful debts. The maximum credit risk on customer accounts is the carrying amount net of any provision for doubtful debts. Credit risk is minimised by only undertaking transactions with trading entities with acceptable credit status.
12. Inventories 2000 1999 Current: $’000 $’000
Materials for construction, general purpose and maintenance 6 732 5 731 Less: Provision for obsolescence 341 644
6 391 5 087 Fuel for power stations:
Coal stock 10 218 13 186 Oil stock 160 163
16 769 18 436
13. Property, Plant and Equipment Generation Assets:
Power stations and Leigh Creek Coalfield and Railway: At cost 175 249 159 079 Less: Accumulated depreciation (41 668) (26 760)
133 581 132 319 Power Stations under lease:
At cost 57 821 52 355 Less: Accumulated amortisation (8 343) (5 805)
49 478 46 550 Total Generation Assets 183 059 178 869
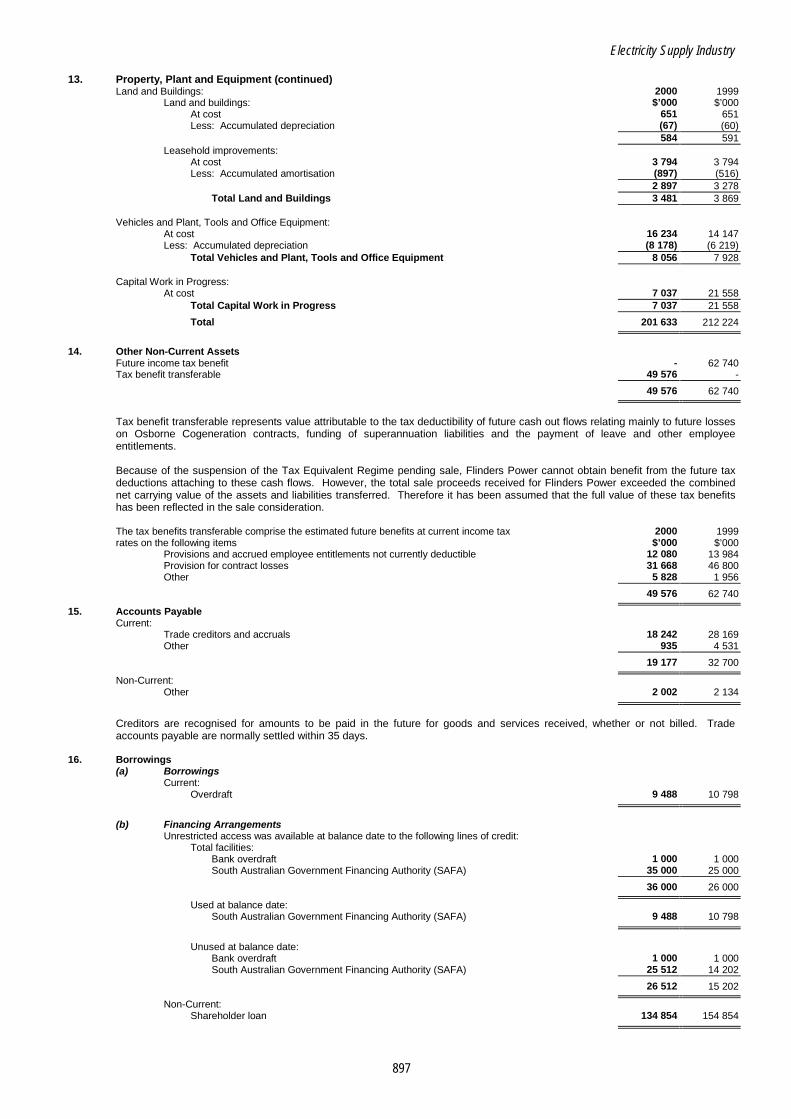
Electricity Supply Industry
897
13. Property, Plant and Equipment (continued) Land and Buildings: 2000 1999
Land and buildings: $’000 $’000 At cost 651 651 Less: Accumulated depreciation (67) (60)
584 591 Leasehold improvements:
At cost 3 794 3 794 Less: Accumulated amortisation (897) (516)
2 897 3 278 Total Land and Buildings 3 481 3 869
Vehicles and Plant, Tools and Office Equipment:
At cost 16 234 14 147 Less: Accumulated depreciation (8 178) (6 219)
Total Vehicles and Plant, Tools and Office Equipment 8 056 7 928
Capital Work in Progress: At cost 7 037 21 558
Total Capital Work in Progress 7 037 21 558
Total 201 633 212 224
14. Other Non-Current Assets
Future income tax benefit - 62 740 Tax benefit transferable 49 576 -
49 576 62 740
Tax benefit transferable represents value attributable to the tax deductibility of future cash out flows relating mainly to future losses on Osborne Cogeneration contracts, funding of superannuation liabilities and the payment of leave and other employee entitlements. Because of the suspension of the Tax Equivalent Regime pending sale, Flinders Power cannot obtain benefit from the future tax deductions attaching to these cash flows. However, the total sale proceeds received for Flinders Power exceeded the combined net carrying value of the assets and liabilities transferred. Therefore it has been assumed that the full value of these tax benefits has been reflected in the sale consideration. The tax benefits transferable comprise the estimated future benefits at current income tax 2000 1999 rates on the following items $’000 $’000
Provisions and accrued employee entitlements not currently deductible 12 080 13 984 Provision for contract losses 31 668 46 800 Other 5 828 1 956
49 576 62 740
15. Accounts Payable Current:
Trade creditors and accruals 18 242 28 169 Other 935 4 531
19 177 32 700
Non-Current: Other 2 002 2 134
Creditors are recognised for amounts to be paid in the future for goods and services received, whether or not billed. Trade accounts payable are normally settled within 35 days.
16. Borrowings (a) Borrowings
Current: Overdraft 9 488 10 798
(b) Financing Arrangements
Unrestricted access was available at balance date to the following lines of credit: Total facilities:
Bank overdraft 1 000 1 000 South Australian Government Financing Authority (SAFA) 35 000 25 000
36 000 26 000
Used at balance date: South Australian Government Financing Authority (SAFA) 9 488 10 798
Unused at balance date:
Bank overdraft 1 000 1 000 South Australian Government Financing Authority (SAFA) 25 512 14 202
26 512 15 202
Non-Current: Shareholder loan 134 854 154 854
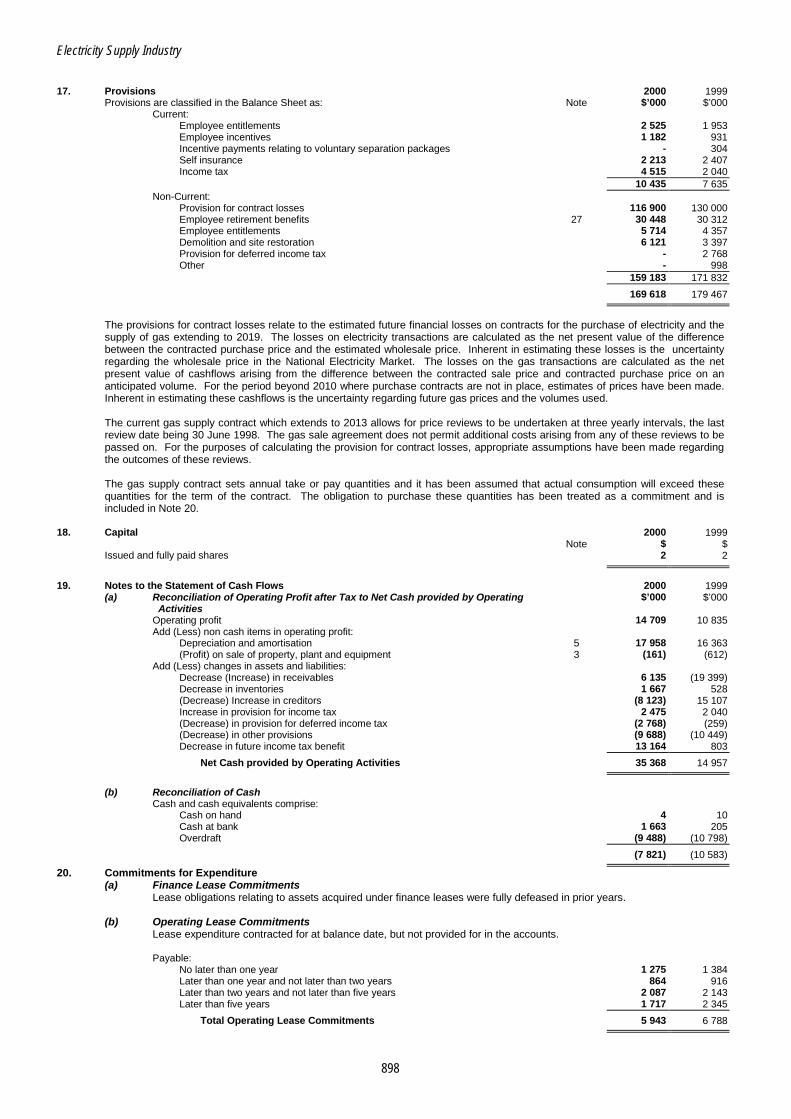
Electricity Supply Industry
898
17. Provisions 2000 1999
Provisions are classified in the Balance Sheet as: Note $’000 $’000 Current:
Employee entitlements 2 525 1 953 Employee incentives 1 182 931 Incentive payments relating to voluntary separation packages - 304 Self insurance 2 213 2 407 Income tax 4 515 2 040
10 435 7 635 Non-Current:
Provision for contract losses 116 900 130 000 Employee retirement benefits 27 30 448 30 312 Employee entitlements 5 714 4 357 Demolition and site restoration 6 121 3 397 Provision for deferred income tax - 2 768 Other - 998
159 183 171 832 169 618 179 467
The provisions for contract losses relate to the estimated future financial losses on contracts for the purchase of electricity and the supply of gas extending to 2019. The losses on electricity transactions are calculated as the net present value of the difference between the contracted purchase price and the estimated wholesale price. Inherent in estimating these losses is the uncertainty regarding the wholesale price in the National Electricity Market. The losses on the gas transactions are calculated as the net present value of cashflows arising from the difference between the contracted sale price and contracted purchase price on an anticipated volume. For the period beyond 2010 where purchase contracts are not in place, estimates of prices have been made. Inherent in estimating these cashflows is the uncertainty regarding future gas prices and the volumes used. The current gas supply contract which extends to 2013 allows for price reviews to be undertaken at three yearly intervals, the last review date being 30 June 1998. The gas sale agreement does not permit additional costs arising from any of these reviews to be passed on. For the purposes of calculating the provision for contract losses, appropriate assumptions have been made regarding the outcomes of these reviews. The gas supply contract sets annual take or pay quantities and it has been assumed that actual consumption will exceed these quantities for the term of the contract. The obligation to purchase these quantities has been treated as a commitment and is included in Note 20.
18. Capital 2000 1999 Note $ $
Issued and fully paid shares 2 2
19. Notes to the Statement of Cash Flows 2000 1999
(a) Reconciliation of Operating Profit after Tax to Net Cash provided by Operating Activities
$’000 $’000
Operating profit 14 709 10 835 Add (Less) non cash items in operating profit:
Depreciation and amortisation 5 17 958 16 363 (Profit) on sale of property, plant and equipment 3 (161) (612)
Add (Less) changes in assets and liabilities: Decrease (Increase) in receivables 6 135 (19 399) Decrease in inventories 1 667 528 (Decrease) Increase in creditors (8 123) 15 107 Increase in provision for income tax 2 475 2 040 (Decrease) in provision for deferred income tax (2 768) (259) (Decrease) in other provisions (9 688) (10 449) Decrease in future income tax benefit 13 164 803
Net Cash provided by Operating Activities 35 368 14 957
(b) Reconciliation of Cash
Cash and cash equivalents comprise: Cash on hand 4 10 Cash at bank 1 663 205 Overdraft (9 488) (10 798)
(7 821) (10 583)
20. Commitments for Expenditure (a) Finance Lease Commitments
Lease obligations relating to assets acquired under finance leases were fully defeased in prior years.
(b) Operating Lease Commitments Lease expenditure contracted for at balance date, but not provided for in the accounts. Payable:
No later than one year 1 275 1 384 Later than one year and not later than two years 864 916 Later than two years and not later than five years 2 087 2 143 Later than five years 1 717 2 345
Total Operating Lease Commitments 5 943 6 788

Electricity Supply Industry
899
(b) Operating Lease Commitments (continued) Flinders Power has a building lease the term of which is 10 years from January 1998 with two rights of renewal of five years each. Rental reviews for CPI adjustments are carried out every second anniversary and a market review on the fifth anniversary. Flinders Power has car leases which range from one to three years. Rentals are subject to annual review and there are no options for renewal or purchase at the end of these leases.
(c) Capital Commitments 2000 1999
Other expenditure contracted for at balance date, but not provided for in the accounts. $’000 $’000 Payable:
No later than one year 2 950 2 300
Total Capital Commitments 2 950 2 300
(d) Other Expenditure Commitments
Other expenditure contracted for at balance date, but not provided for in the accounts. Payable:
No later than one year 52 875 44 622 Later than one year and not later than two years 51 489 44 836 Later than two years and not later than five years 154 212 136 043 Later than five years 264 196 323 672
Total Other Commitments 522 772 549 173
21. Financial Instruments
(a) Derivatives As at 30 June 2000 Flinders Power was a party to vesting and other contracts which call for payments being the difference between the contracted price and the pool price. The value of these contracts fluctuates according to future assessments of pool prices. As at 30 June 2000 these contracts were assessed as having a net fair value of ($13 million) (negative fair value $3 million). These contracts are not readily traded on organised markets in standard form and have been valued on the basis of cash flows arising from differences between the contract price and expected pool prices taking into account expected levels of demand. The duration of these contracts varies with none exceeding a term of five years from 30 June 2000. The cash flows have not been discounted. As of 30 June 2000 Flinders Power was party to contracts for the purchase of electricity and the supply of gas (refer Note 17). As at 30 June 2000 the present value of the losses arising from these contracts was calculated, using current assessments as $116.9 million ($130 million). These have been fully provided for. However, inherent in these calculations are assumptions regarding future National Electricity Market wholesale prices, gas purchase prices and gas volumes consumed.
(b) Interest Rate Risk Exposure Flinders Power’s exposure to interest rate risk and the average interest rate for each class of financial assets and liabilities are as follows: Receivables and amounts payable to suppliers and employees and the shareholder loan are non interest bearing.
2000 1999 Percent Percent Cash and deposits carry an average floating interest rate of 4.35 4.80 Borrowings and overdrafts carry an average floating interest rate of 6.68 5.40
22. Remuneration of Directors 2000 1999 $’000 $’000
Aggregate remuneration received or due and receivable by directors of Flinders Power 355 243
2000 1999 Number of directors of Flinders Power whose total remuneration for the year falls Number of Number of within the following bands: Directors Directors
$0 - $9 999 1 *1 $10 000 - $19 999 - 1 $20 000 - $29 999 1 - $30 000 - $39 999 1 - $40 000 - $49 999 - 1 $80 000 - $89 999 1 - $180 000 - $189 999 - 1 $220 000 - $229 999 1 -
* This director was paid by the SA Generation Corporation.
23. Remuneration of Employees 2000 1999
Aggregate remuneration received or due and receivable by employees, including $’000 $’000 those on contract, whose total for the year exceeds $100 000 4 022 2 740

Electricity Supply Industry
900
23. Remuneration of Employees (continued) 2000 1999
Number of employees whose total remuneration for the year falls within Number of Number of the following bands: Employees Employees
$100 000 - $109 999 9 5 $110 000 - $119 999 9 6 $120 000 - $129 999 4 3 $130 000 - $139 999 4 3 $140 000 - $149 999 - 3 $150 000 - $159 999 3 1 $160 000 - $169 999 2 - $180 000 - $189 999 - 1 $220 000 - $229 999 1 -
During the year one employee left as a result of a Voluntary Separation Package. The total amount paid to this employee by the company consisted of $83 000 relating to separation packages and $14 000 comprising accrued annual entitlements for annual leave, long service leave and superannuation.
24. Auditors’ Remuneration 2000 1999 $’000 $’000
Amounts received or due and receivable by the auditors for auditing the accounts 78 72
25. Related Party Transactions
Directors The names of persons who were directors of Flinders Power at any time during the period are as follows:
Mr Richard William Thomson Mr Clive Little Mr Robert Arthur Althoff Ms Yvonne Sneddon (appointed 12th October 1999) Mr Ronald Morgan (resigned 24th September 1999)
Transactions of directors and director-related entities. Information on the remuneration of directors is disclosed in Note 22.
The chairman of the company, Mr Richard Thomson, has an interest in the firm Beasley Industries Pty Limited which supplied materials to the company in the ordinary course of business.
There have been no other transactions between Flinders Power and the directors or director-related entities during the period.
26. Contingent Liabilities
Environmental legislation and community expectations are changing rapidly and future obligations arising from such changes could involve Flinders Power in remedial work, including expenditure which is capital in nature. To the extent that potential future liabilities can be identified and it is likely that expenditure will need to be incurred, appropriate provisions have been made.
An application has been made to the Australian Competition and Consumer Commission by a counterparty to vary the terms and conditions of certain revenue contracts. The outcome of this application may require some revenues in the year ended 30 June 2000 to be restated. The company does not consider the application will succeed and therefore the directors are of the opinion that no provision is required.
27. Superannuation Commitments
The majority of the employees of the company are members of the Electricity Industry Superannuation Scheme (the Scheme). Liabilities arise to the company as an employer as a result of these memberships.
The Scheme is managed by the Electricity Industry Superannuation Board, a separate legal entity which is independent from the company, operating pursuant to the Electricity Corporations Act 1994 (as amended in the reporting period by the Electricity Corporations (Restructuring & Disposal) Act 1999).
On 1 December 1999 the two superannuation schemes which the Company previously contributed towards (the ETSA Contributory Superannuation Scheme and the ETSA Non-Contributory Superannuation Scheme) became Divisions of the Electricity Industry Superannuation Scheme.
The Company’s liabilities under the Scheme arising upon retirement or resignation of members are not progressively funded, but are paid as the benefits fall due. A provision for these liabilities has been recognised in the accounts.
The Company makes contributions to the Scheme towards the cost of insurance which covers the benefits payable to a member arising upon disability or death.
The Scheme comprises four major Divisions: Divisions 2, 3, 4 and 5. All Divisions apart from Division 5 are closed to new members.
Members contribute to the Divisions at varying percentages of their income on either a post-tax or salary sacrifice basis.
Retirement benefits under Division 2 comprise the member contributions, fund earnings and a defined benefit component. Resignation and redundancy benefits comprise the member contributions, fund earnings and an employer multiple (of approximately two) of the sum of these.

Electricity Supply Industry
901
27. Superannuation Commitments (continued) Retirement benefits under Division 3 are primarily in the form of pensions based on member contributions, period of membership and final salary. Benefits may be commuted to a lump sum on retirement. Benefits paid on redundancy comprise the member contributions, fund earnings and an employer multiple (of two) of the sum of these.
Retirement benefits under Division 4 comprise the member contributions, interest and a component payable by Flinders Power equal to 2 1/3 times the sum of the members’ contributions plus interest.
Division 5 operates as an unfunded defined contribution scheme. Employer support is provided at a level such that no Superannuation Guarantee Charge liability arises. Options for additional employee contributions (pre or post tax) are available.
An actuarial assessment of the predecessor Schemes was carried out by Mr A Archer, FIAA, Principal of William M Mercer Pty Ltd as at 30 June 1999. This assessment was updated after the changes to the Scheme outlined above. The provision made by the company in the accounts is based on these actuarial assessments.
Additionally, the company contributes towards various defined contribution superannuation schemes for certain employees, at levels at or above that required to ensure no Superannuation Guarantee Charge liabilities arise.
28. Environmental Regulation and Improvement Plans
Flinders Power internally reports environmental performance and has set zero non-compliance events as its key environmental performance standard.
A non-compliance event represents any event which: • constitutes a breach of licence conditions; • is an emission which breaches legislative requirements, or • is a spill or incident which causes or has the potential to cause material environmental harm.
Such events are reported to the Environmental Protection Agency (EPA).
Northern Power Station Northern Power Station has an exemption from the application of clause 4(4) of schedule 1 of the Environment Protection (Air Quality) Policy 1994, in relation to emissions of oxides of nitrogen in excess of 700mg/m3 of residual gases. This exemption was granted after detailed examination of a range of factors including environmental and environmental health considerations with respect to ground level concentrations of oxides of nitrogen.
The exemption requires submission of an Environmental Improvement Plan which includes consideration of oxides of nitrogen measurement and controls during the licence period to 2008.
Ongoing work during 1999-2000 has resulted in the commissioning of new oxides of nitrogen monitoring equipment at Northern Power Station, and confirmation of operational controls to ensure that the exemption levels are not breached under normal operating conditions. Further work considering both Playford and Northern Power station operations, has confirmed that ground level concentrations are within accepted environmental and health levels.
Playford Power Station Playford Power Station has an exemption from the application of clause 4(1) and clause 1 of Schedule 1 of the Environment Protection (Air Quality ) Policy 1994. This provides for short duration excursions from the application of the particulate emission criteria.
This exemption was granted until 2004 after presentation of detailed information which confirmed that the ground level concentrations of particulates meet National Environment Protection measures (NEPM) for Ambient Air Quality for the protection of human health and the environment. The exemption required the production of an Environmental Improvement Plan (EIP) acceptable to the EPA. This plan, which considers options for further improvement of Playford emissions, particularly on start-up, was submitted to the EPA as required together with further submissions on Playford’s future operation or decommissioning beyond 2004.
As with oxides of nitrogen considerations from Northern Power Station (above), a key issue in managing oxides of nitrogen from Playford has been to ensure that acceptable environmental and health levels are maintained at all times at ground level.
29. Events Subsequent to Balance Date Pursuant to the Electricity Corporations (Restructuring and Disposal) Act 1999 certain assets and liabilities with a net book value at balance date of $109 million were sold or leased for a total consideration of $313 million on 3 August 2000.

Electricity Supply Industry
902
RESI OE PTY LTD FUNCTIONAL RESPONSIBILITY AND STRUCTURE Optima Energy Pty Ltd (Optima Energy) was incorporated under the Corporations Law in August 1998. On the restructure of the State’s electricity businesses in October 1998 assets, liabilities and staff were transferred to the Company. For financial statement purposes the transfers were deemed to have taken place from 1 July 1998. Pursuant to a Ministerial Transfer Order dated 23 March 2000, the shares in Optima Energy Pty Ltd held by SA Generation Corporation were transferred to the Treasurer as a body corporate. On 7 June 2000 Optima Energy Pty Ltd was renamed RESI OE Pty Ltd (RESI OE). Optima Energy’s primary function was to generate, supply and sell electricity from the following generation facilities: • Torrens Island Power Station A • Torrens Island Power Station B CHANGES TO AGENCY ORGANISATIONAL STRUCTURE FROM JULY 1999 On 4 May 2000 the South Australian Treasurer signed an agreement with TXU Electricity Ltd (TXU) for the disposal of the assets and liabilities of Optima Energy. Although settlement of the transaction did not take place until 6 June 2000, the benefits and risks associated with the business were transferred as at the date of the agreement ie 4 May 2000. To give effect to this agreement: • Assets with a written down book value of $102.6 million, including prescribed electricity generation assets
as defined by the Electricity Corporations (Restructuring and Disposal) Act 1999, were transferred to Generation Lessor Corporation. This Corporation, a public corporation subsidiary of the Treasurer, was established on the 29 July 1999 pursuant to the Public Corporations (Generator Lessor Corporation) Regulations 1999 (SA). The prescribed assets were subsequently leased to TXU.
• Non-prescribed assets (net of liabilities) were sold to TXU. SIGNIFICANT FEATURES Total proceeds received from the disposal of non-prescribed assets was $7.5 million. Accounting profit on disposal of Optima Energy’s non-prescribed assets was $9.7 million. Operating Profit before income tax increased by $7.3 million to $17.5 million. Dividends paid for the year were $43.2 million. AUDIT MANDATE AND COVERAGE Audit Authority In accordance with section 31 of the Public Finance and Audit Act 1987 and subclause 13(3) of the Schedule to the Public Corporations Act 1993 the Auditor-General may at any time, and must in respect of each financial year, audit the accounts and financial statements of RESI OE Pty Ltd (formerly Optima Energy Pty Ltd).
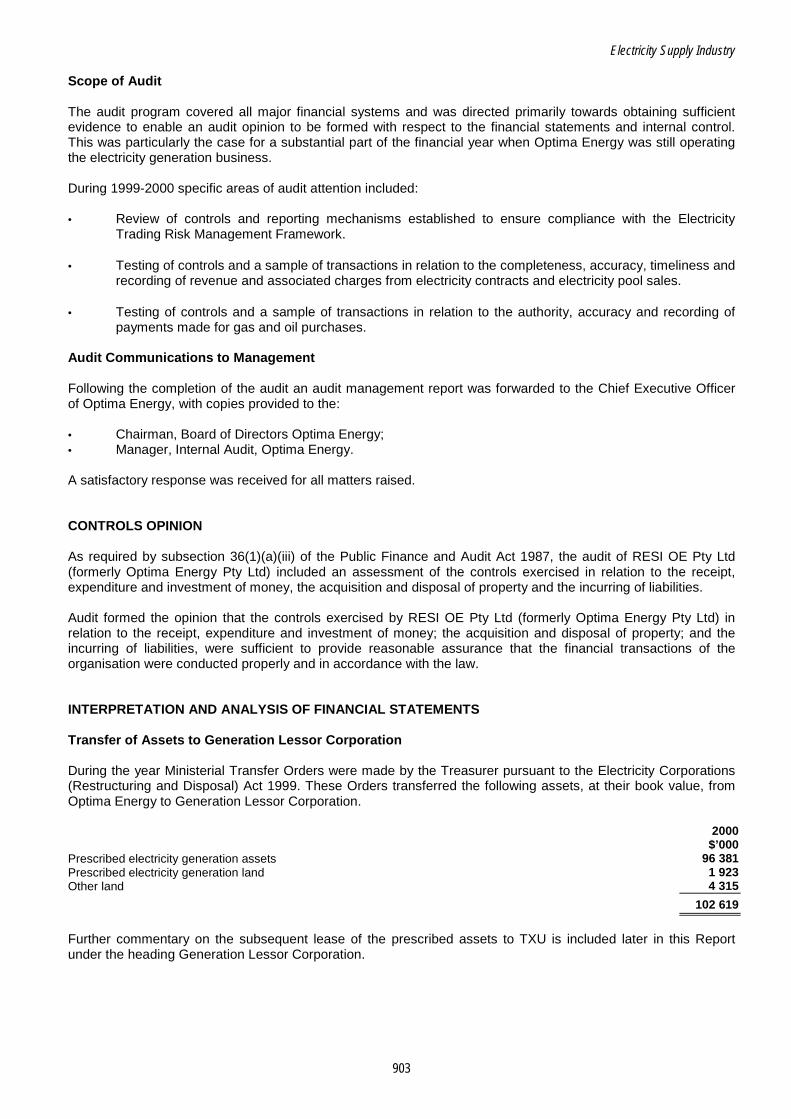
Electricity Supply Industry
903
Scope of Audit The audit program covered all major financial systems and was directed primarily towards obtaining sufficient evidence to enable an audit opinion to be formed with respect to the financial statements and internal control. This was particularly the case for a substantial part of the financial year when Optima Energy was still operating the electricity generation business. During 1999-2000 specific areas of audit attention included: • Review of controls and reporting mechanisms established to ensure compliance with the Electricity
Trading Risk Management Framework.
• Testing of controls and a sample of transactions in relation to the completeness, accuracy, timeliness and recording of revenue and associated charges from electricity contracts and electricity pool sales.
• Testing of controls and a sample of transactions in relation to the authority, accuracy and recording of payments made for gas and oil purchases.
Audit Communications to Management Following the completion of the audit an audit management report was forwarded to the Chief Executive Officer of Optima Energy, with copies provided to the: • Chairman, Board of Directors Optima Energy; • Manager, Internal Audit, Optima Energy. A satisfactory response was received for all matters raised. CONTROLS OPINION As required by subsection 36(1)(a)(iii) of the Public Finance and Audit Act 1987, the audit of RESI OE Pty Ltd (formerly Optima Energy Pty Ltd) included an assessment of the controls exercised in relation to the receipt, expenditure and investment of money, the acquisition and disposal of property and the incurring of liabilities. Audit formed the opinion that the controls exercised by RESI OE Pty Ltd (formerly Optima Energy Pty Ltd) in relation to the receipt, expenditure and investment of money; the acquisition and disposal of property; and the incurring of liabilities, were sufficient to provide reasonable assurance that the financial transactions of the organisation were conducted properly and in accordance with the law. INTERPRETATION AND ANALYSIS OF FINANCIAL STATEMENTS Transfer of Assets to Generation Lessor Corporation During the year Ministerial Transfer Orders were made by the Treasurer pursuant to the Electricity Corporations (Restructuring and Disposal) Act 1999. These Orders transferred the following assets, at their book value, from Optima Energy to Generation Lessor Corporation. 2000 $’000 Prescribed electricity generation assets 96 381 Prescribed electricity generation land 1 923 Other land 4 315 102 619
Further commentary on the subsequent lease of the prescribed assets to TXU is included later in this Report under the heading Generation Lessor Corporation.
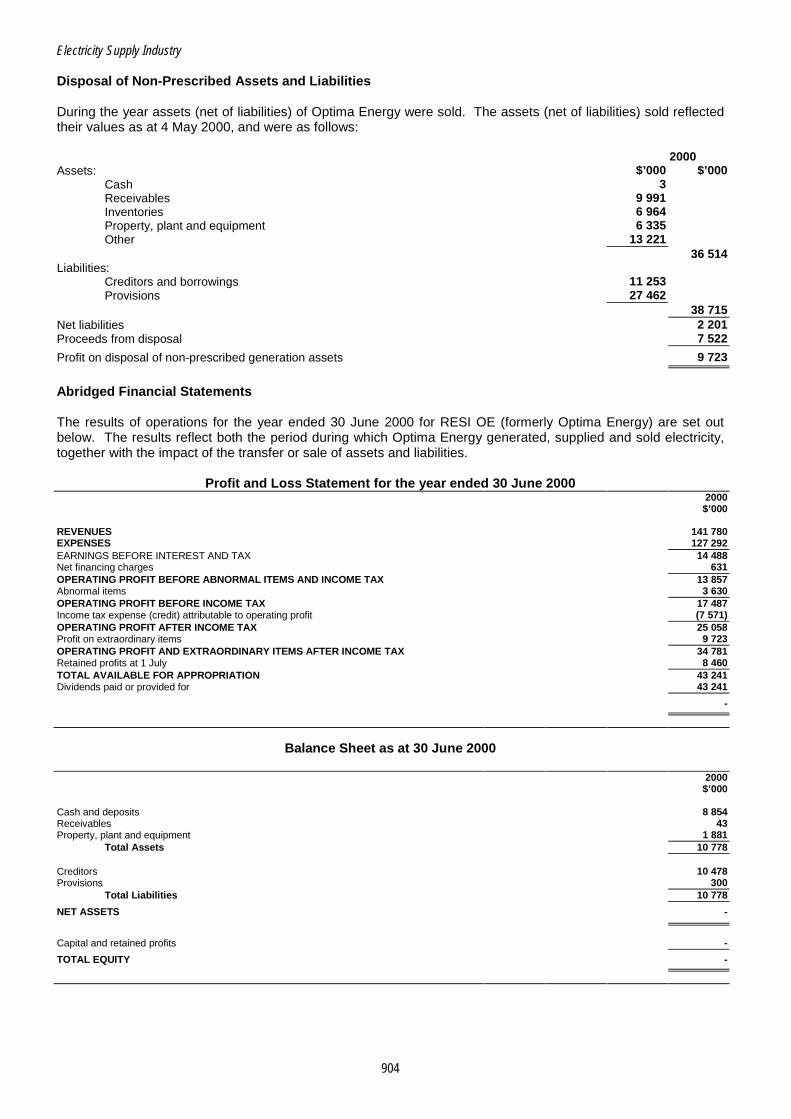
Electricity Supply Industry
904
Disposal of Non-Prescribed Assets and Liabilities During the year assets (net of liabilities) of Optima Energy were sold. The assets (net of liabilities) sold reflected their values as at 4 May 2000, and were as follows: 2000 Assets: $’000 $’000
Cash 3 Receivables 9 991 Inventories 6 964 Property, plant and equipment 6 335 Other 13 221
36 514 Liabilities:
Creditors and borrowings 11 253 Provisions 27 462
38 715 Net liabilities 2 201 Proceeds from disposal 7 522
Profit on disposal of non-prescribed generation assets 9 723
Abridged Financial Statements The results of operations for the year ended 30 June 2000 for RESI OE (formerly Optima Energy) are set out below. The results reflect both the period during which Optima Energy generated, supplied and sold electricity, together with the impact of the transfer or sale of assets and liabilities.
Profit and Loss Statement for the year ended 30 June 2000 2000 $’000 REVENUES 141 780 EXPENSES 127 292 EARNINGS BEFORE INTEREST AND TAX 14 488 Net financing charges 631 OPERATING PROFIT BEFORE ABNORMAL ITEMS AND INCOME TAX 13 857 Abnormal items 3 630 OPERATING PROFIT BEFORE INCOME TAX 17 487 Income tax expense (credit) attributable to operating profit (7 571) OPERATING PROFIT AFTER INCOME TAX 25 058 Profit on extraordinary items 9 723 OPERATING PROFIT AND EXTRAORDINARY ITEMS AFTER INCOME TAX 34 781 Retained profits at 1 July 8 460 TOTAL AVAILABLE FOR APPROPRIATION 43 241 Dividends paid or provided for 43 241
-
Balance Sheet as at 30 June 2000
2000 $’000 Cash and deposits 8 854 Receivables 43 Property, plant and equipment 1 881
Total Assets 10 778 Creditors 10 478 Provisions 300
Total Liabilities 10 778
NET ASSETS -
Capital and retained profits -
TOTAL EQUITY -
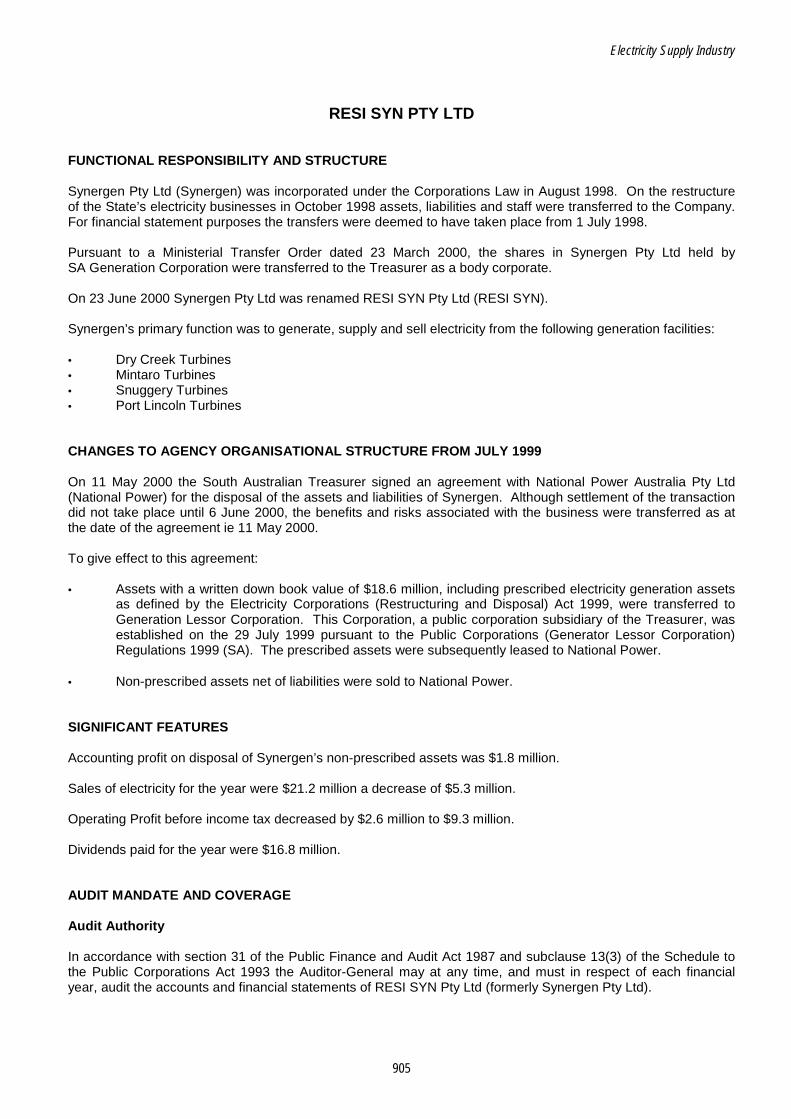
Electricity Supply Industry
905
RESI SYN PTY LTD FUNCTIONAL RESPONSIBILITY AND STRUCTURE Synergen Pty Ltd (Synergen) was incorporated under the Corporations Law in August 1998. On the restructure of the State’s electricity businesses in October 1998 assets, liabilities and staff were transferred to the Company. For financial statement purposes the transfers were deemed to have taken place from 1 July 1998. Pursuant to a Ministerial Transfer Order dated 23 March 2000, the shares in Synergen Pty Ltd held by SA Generation Corporation were transferred to the Treasurer as a body corporate. On 23 June 2000 Synergen Pty Ltd was renamed RESI SYN Pty Ltd (RESI SYN). Synergen’s primary function was to generate, supply and sell electricity from the following generation facilities: • Dry Creek Turbines • Mintaro Turbines • Snuggery Turbines • Port Lincoln Turbines CHANGES TO AGENCY ORGANISATIONAL STRUCTURE FROM JULY 1999 On 11 May 2000 the South Australian Treasurer signed an agreement with National Power Australia Pty Ltd (National Power) for the disposal of the assets and liabilities of Synergen. Although settlement of the transaction did not take place until 6 June 2000, the benefits and risks associated with the business were transferred as at the date of the agreement ie 11 May 2000. To give effect to this agreement: • Assets with a written down book value of $18.6 million, including prescribed electricity generation assets
as defined by the Electricity Corporations (Restructuring and Disposal) Act 1999, were transferred to Generation Lessor Corporation. This Corporation, a public corporation subsidiary of the Treasurer, was established on the 29 July 1999 pursuant to the Public Corporations (Generator Lessor Corporation) Regulations 1999 (SA). The prescribed assets were subsequently leased to National Power.
• Non-prescribed assets net of liabilities were sold to National Power. SIGNIFICANT FEATURES Accounting profit on disposal of Synergen’s non-prescribed assets was $1.8 million. Sales of electricity for the year were $21.2 million a decrease of $5.3 million. Operating Profit before income tax decreased by $2.6 million to $9.3 million. Dividends paid for the year were $16.8 million. AUDIT MANDATE AND COVERAGE Audit Authority In accordance with section 31 of the Public Finance and Audit Act 1987 and subclause 13(3) of the Schedule to the Public Corporations Act 1993 the Auditor-General may at any time, and must in respect of each financial year, audit the accounts and financial statements of RESI SYN Pty Ltd (formerly Synergen Pty Ltd).
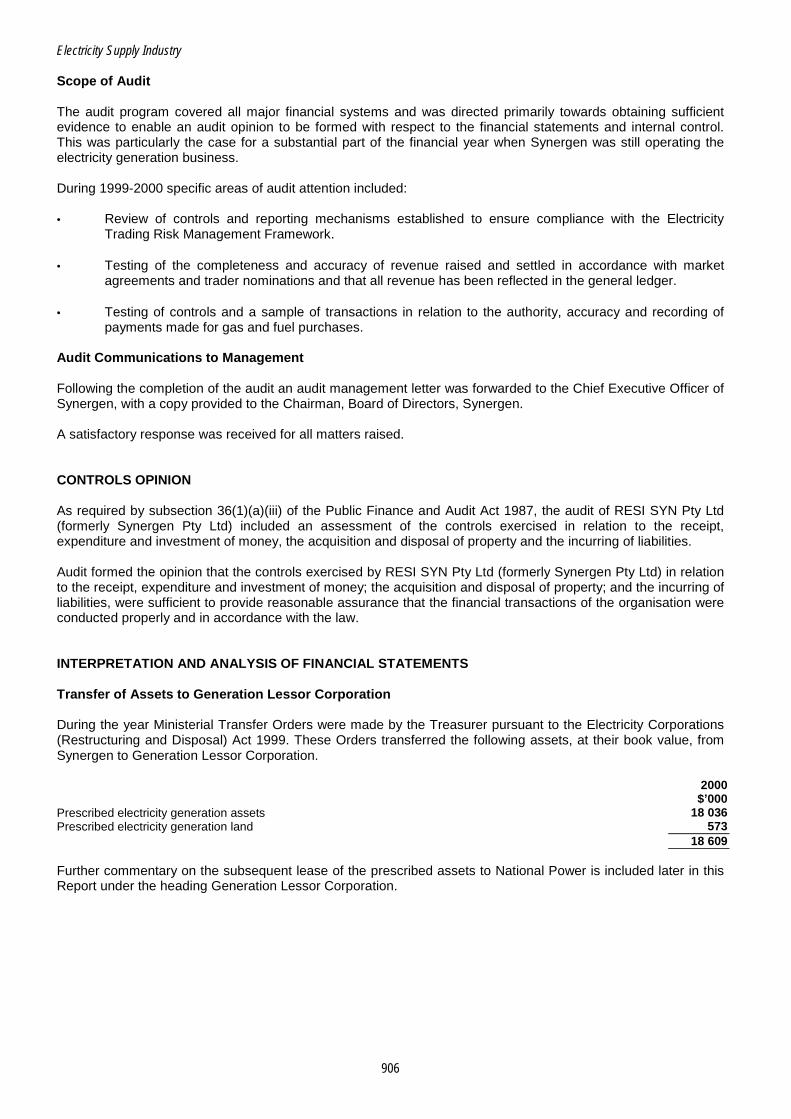
Electricity Supply Industry
906
Scope of Audit The audit program covered all major financial systems and was directed primarily towards obtaining sufficient evidence to enable an audit opinion to be formed with respect to the financial statements and internal control. This was particularly the case for a substantial part of the financial year when Synergen was still operating the electricity generation business. During 1999-2000 specific areas of audit attention included: • Review of controls and reporting mechanisms established to ensure compliance with the Electricity
Trading Risk Management Framework.
• Testing of the completeness and accuracy of revenue raised and settled in accordance with market agreements and trader nominations and that all revenue has been reflected in the general ledger.
• Testing of controls and a sample of transactions in relation to the authority, accuracy and recording of payments made for gas and fuel purchases.
Audit Communications to Management Following the completion of the audit an audit management letter was forwarded to the Chief Executive Officer of Synergen, with a copy provided to the Chairman, Board of Directors, Synergen. A satisfactory response was received for all matters raised. CONTROLS OPINION As required by subsection 36(1)(a)(iii) of the Public Finance and Audit Act 1987, the audit of RESI SYN Pty Ltd (formerly Synergen Pty Ltd) included an assessment of the controls exercised in relation to the receipt, expenditure and investment of money, the acquisition and disposal of property and the incurring of liabilities. Audit formed the opinion that the controls exercised by RESI SYN Pty Ltd (formerly Synergen Pty Ltd) in relation to the receipt, expenditure and investment of money; the acquisition and disposal of property; and the incurring of liabilities, were sufficient to provide reasonable assurance that the financial transactions of the organisation were conducted properly and in accordance with the law. INTERPRETATION AND ANALYSIS OF FINANCIAL STATEMENTS Transfer of Assets to Generation Lessor Corporation During the year Ministerial Transfer Orders were made by the Treasurer pursuant to the Electricity Corporations (Restructuring and Disposal) Act 1999. These Orders transferred the following assets, at their book value, from Synergen to Generation Lessor Corporation. 2000 $’000 Prescribed electricity generation assets 18 036 Prescribed electricity generation land 573 18 609 Further commentary on the subsequent lease of the prescribed assets to National Power is included later in this Report under the heading Generation Lessor Corporation.

Electricity Supply Industry
907
Disposal of Non-Prescribed Assets and Liabilities During the year assets (net of liabilities) of Synergen were sold. The assets (net of liabilities) sold reflected their values as at 11 May 2000, and were as follows: 2000 $’000 $’000 Assets:
Cash 1 Receivables 1 761 Inventories 548 Property, plant and equipment 375 Other 2 106
4 791 Liabilities:
Creditors and borrowings 851 Provisions 6 003
6 854 Net liabilities 2 063 Proceeds from disposal (243) Profit on disposal of non-prescribed generation assets 1 820 Abridged Financial Statements The results of operations for the year 30 June 2000 for RESI SYN Pty Ltd (formerly Synergen Pty Ltd) are set out below. The results reflect both the period during which Synergen generated, supplied and sold electricity, together with the impact of the transfer or sale of assets and liabilities.
Profit and Loss Statement for the year ended 30 June 2000 2000 $’000 REVENUES 22 690 EXPENSES 13 872 EARNINGS BEFORE INTEREST AND TAX 8 818 Net financing charges 314 OPERATING PROFIT BEFORE ABNORMAL ITEMS AND INCOME TAX 8 504 Abnormal items 773 OPERATING PROFIT BEFORE INCOME TAX 9 277 Income tax attributable to operating profit 1 906 OPERATING PROFIT AFTER INCOME TAX 7 371 Profit on extraordinary items 1 820 OPERATING PROFIT AND EXTRAORDINARY ITEMS AFTER INCOME TAX 9 191 Retained profits at the beginning of the year 7 621 TOTAL AVAILABLE FOR APPROPRIATION 16 812 Dividends paid or provided for 16 812
RETAINED PROFITS AT 30 JUNE -
Balance Sheet as at 30 June 2000
2000 $’000 Cash and deposits 3 359 Receivables 2 240
Total Assets 5 599 Creditors 5 599
Total Liabilities 5 599
NET ASSETS -
Capital and retained profits -
TOTAL EQUITY -

Electricity Supply Industry
908
TERRA GAS TRADER PTY LTD FUNCTIONAL RESPONSIBILITY AND STRUCTURE Terra Gas Trader Pty Ltd (Terra Gas Trader) was incorporated under the Corporations Law in June 1998. On the restructure of the State’s electricity businesses in October 1998 assets, liabilities and staff were transferred to the Company. For financial statement purposes the transfers were deemed to have taken place from 1 July 1998. Pursuant to a Ministerial Transfer Order dated 23 March 2000, the shares in Terra Gas Trader held by SA Generation Corporation were transferred to the Treasurer as a body corporate. CHANGES TO AGENCY ORGANISATIONAL STRUCTURE IN 2000-2001 Disposal of Assets and Liabilities of the Business Under the Government’s electricity business disposal program, Final Bids for the disposal of Terra Gas Trader were received 17 July 2000. As at the date of the preparation of this Report, no announcement had been made with respect to the outcome of the disposal process for Terra Gas Trader. DESCRIPTION OF OBJECTIVES The nature and scope of operations as set out in the Charter of Terra Gas Trader include: • the acquisition, haulage, storage and supply of petroleum products; • trading in the energy market by buying or selling petroleum products; • trading in petroleum haulage rights; • trading in financial instruments or derivatives that relate to petroleum and electricity. SIGNIFICANT FEATURE A dividend of $18 million (nil) was paid during the year. AUDIT MANDATE AND COVERAGE Audit Authority In accordance with section 31 of the Public Finance and Audit Act 1987 and subclause 13(3) of the Schedule to the Public Corporations Act 1993 the Auditor-General may at any time, and must in respect of each financial year, audit the accounts and financial statements of Terra Gas Trader Pty Ltd. Scope of Audit The audit program covered all major financial systems and was directed primarily towards obtaining sufficient evidence to enable an audit opinion to be formed with respect to the financial statements and internal controls. The scope of the audit included the review of controls over the revenues and payments associated with Terra Gas Trader’s gas transactions. Audit Communications to Management Following the completion of the audit a management letter was forwarded to the Chief Executive Officer of the company detailing findings and recommendations arising from that work. Copies of the letter were provided to the: • Chairman, Board of Directors, Terra Gas Trader; • Manager, Internal Audit, Terra Gas Trader. A satisfactory response was received for all matters raised.

Electricity Supply Industry
909
AUDIT FINDINGS AND COMMENTS Commentary on General Financial Controls Work undertaken by Audit during the course of the year indicated that the company had maintained a sound internal control environment. In particular there are a number of strategic initiatives which underpin this environment, including: • regular Board meetings during the year provided a forum to oversee the financial reporting, auditing and
legal compliance processes in relation to the company. Representatives of the Auditor-General were invited to attend selected Board meetings to discuss matters relating to the audit of the company;
• an Internal Audit function which reports directly to the Board of Directors. Banked Gas Banked Gas is the value of inventory held due to ‘take or pay’ contractual arrangements. ‘Take or pay’ contracts are an arrangement whereby the purchaser pays for gas at an agreed minimum quantity each year. If at the end of the year the minimum amount of gas has not been taken, the company has the right in future periods to take the shortfall. As at 30 June 2000 the book value of banked gas was $19.3 million ($26.9 million) representing the quantities banked and the value of its estimated recovery. The decrease in banked gas during the year was due mainly to gas sales above the minimum contractual purchasing quantities allowing Terra Gas Trader to ‘take’ a portion of the banked gas. CONTROLS OPINION As required by subsection 36(1)(a)(iii) of the Public Finance and Audit Act 1987, the audit of Terra Gas Trader Pty Ltd included an assessment of the controls exercised in relation to the receipt, expenditure and investment of money, the acquisition and disposal of property and the incurring of liabilities. Audit formed the opinion that the controls exercised by Terra Gas Trader Pty Ltd in relation to the receipt, expenditure and investment of money; the acquisition and disposal of property; and the incurring of liabilities were sufficient to provide reasonable assurance that the financial transactions of the organisation were conducted properly and in accordance with the law.
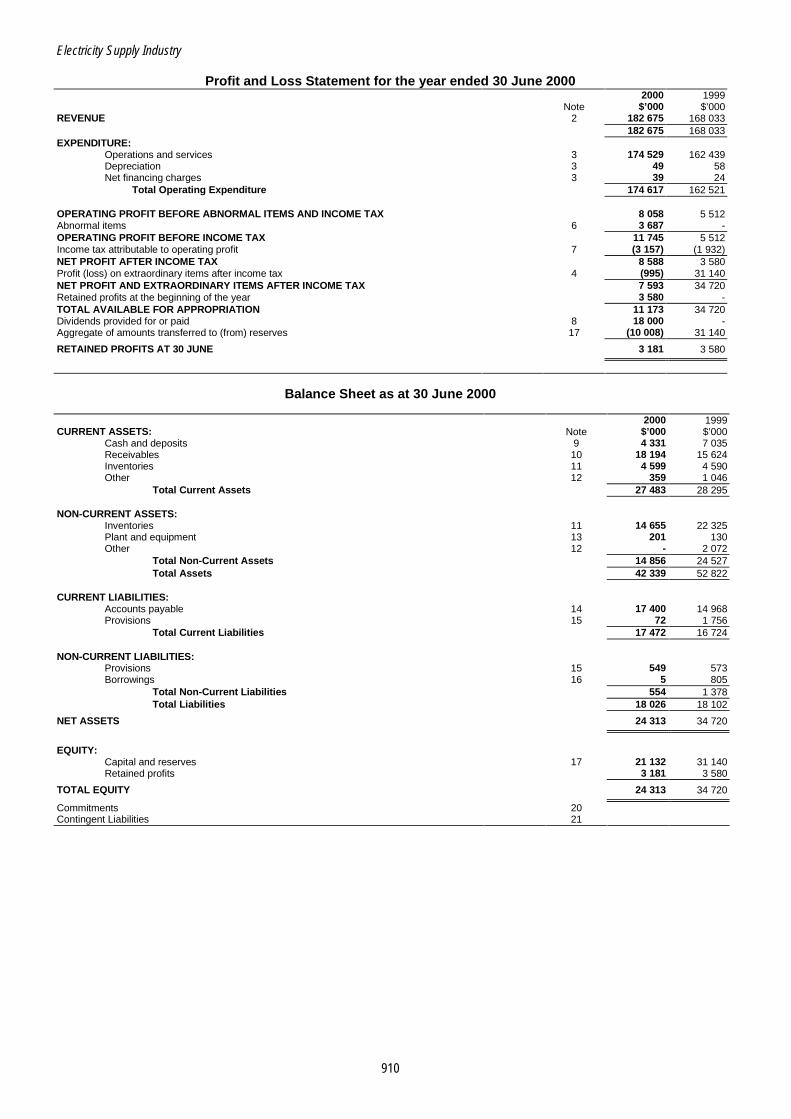
Electricity Supply Industry
910
Profit and Loss Statement for the year ended 30 June 2000 2000 1999 Note $’000 $’000 REVENUE 2 182 675 168 033 182 675 168 033 EXPENDITURE:
Operations and services 3 174 529 162 439 Depreciation 3 49 58 Net financing charges 3 39 24
Total Operating Expenditure 174 617 162 521 OPERATING PROFIT BEFORE ABNORMAL ITEMS AND INCOME TAX 8 058 5 512 Abnormal items 6 3 687 - OPERATING PROFIT BEFORE INCOME TAX 11 745 5 512 Income tax attributable to operating profit 7 (3 157) (1 932) NET PROFIT AFTER INCOME TAX 8 588 3 580 Profit (loss) on extraordinary items after income tax 4 (995) 31 140 NET PROFIT AND EXTRAORDINARY ITEMS AFTER INCOME TAX 7 593 34 720 Retained profits at the beginning of the year 3 580 - TOTAL AVAILABLE FOR APPROPRIATION 11 173 34 720 Dividends provided for or paid 8 18 000 - Aggregate of amounts transferred to (from) reserves 17 (10 008) 31 140
RETAINED PROFITS AT 30 JUNE 3 181 3 580
Balance Sheet as at 30 June 2000 2000 1999 CURRENT ASSETS: Note $’000 $’000
Cash and deposits 9 4 331 7 035 Receivables 10 18 194 15 624 Inventories 11 4 599 4 590 Other 12 359 1 046
Total Current Assets 27 483 28 295 NON-CURRENT ASSETS:
Inventories 11 14 655 22 325 Plant and equipment 13 201 130 Other 12 - 2 072
Total Non-Current Assets 14 856 24 527 Total Assets 42 339 52 822
CURRENT LIABILITIES:
Accounts payable 14 17 400 14 968 Provisions 15 72 1 756
Total Current Liabilities 17 472 16 724 NON-CURRENT LIABILITIES:
Provisions 15 549 573 Borrowings 16 5 805
Total Non-Current Liabilities 554 1 378 Total Liabilities 18 026 18 102
NET ASSETS 24 313 34 720
EQUITY:
Capital and reserves 17 21 132 31 140 Retained profits 3 181 3 580
TOTAL EQUITY 24 313 34 720
Commitments 20 Contingent Liabilities 21
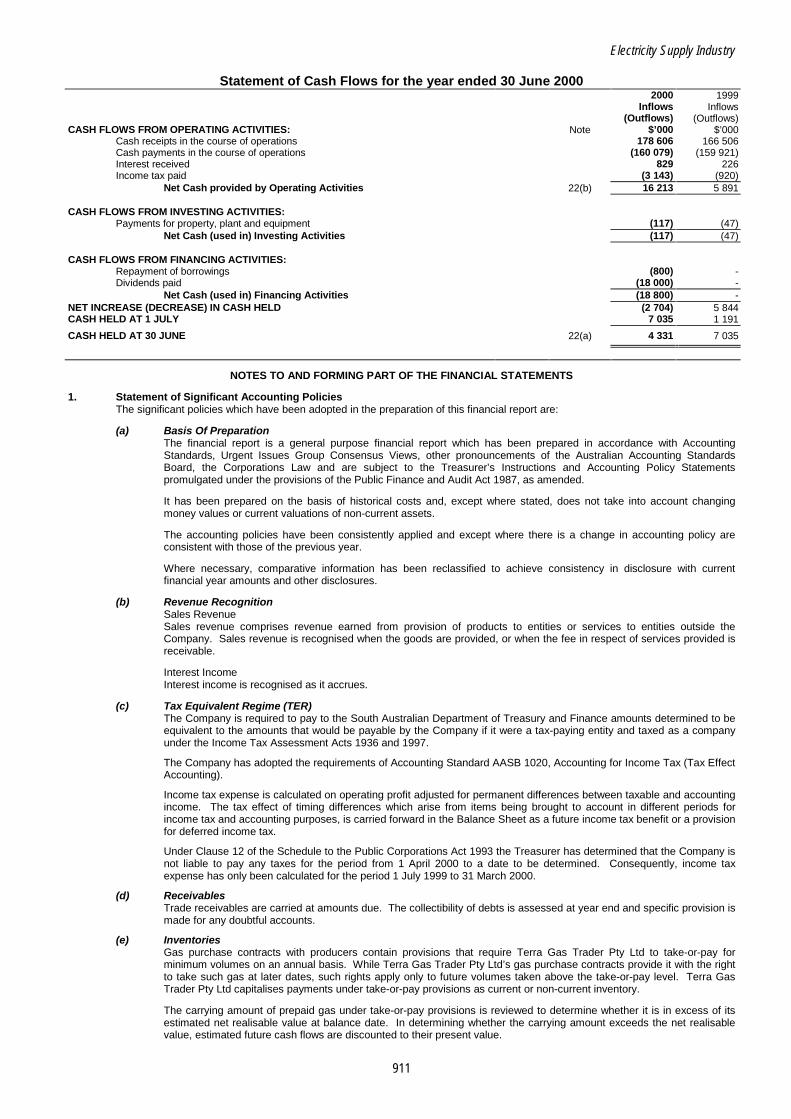
Electricity Supply Industry
911
Statement of Cash Flows for the year ended 30 June 2000 2000 1999 Inflows Inflows (Outflows) (Outflows) CASH FLOWS FROM OPERATING ACTIVITIES: Note $’000 $’000
Cash receipts in the course of operations 178 606 166 506 Cash payments in the course of operations (160 079) (159 921) Interest received 829 226 Income tax paid (3 143) (920)
Net Cash provided by Operating Activities 22(b) 16 213 5 891 CASH FLOWS FROM INVESTING ACTIVITIES:
Payments for property, plant and equipment (117) (47) Net Cash (used in) Investing Activities (117) (47)
CASH FLOWS FROM FINANCING ACTIVITIES:
Repayment of borrowings (800) - Dividends paid (18 000) -
Net Cash (used in) Financing Activities (18 800) - NET INCREASE (DECREASE) IN CASH HELD (2 704) 5 844 CASH HELD AT 1 JULY 7 035 1 191
CASH HELD AT 30 JUNE 22(a) 4 331 7 035
NOTES TO AND FORMING PART OF THE FINANCIAL STATEMENTS 1. Statement of Significant Accounting Policies
The significant policies which have been adopted in the preparation of this financial report are:
(a) Basis Of Preparation The financial report is a general purpose financial report which has been prepared in accordance with Accounting Standards, Urgent Issues Group Consensus Views, other pronouncements of the Australian Accounting Standards Board, the Corporations Law and are subject to the Treasurer’s Instructions and Accounting Policy Statements promulgated under the provisions of the Public Finance and Audit Act 1987, as amended.
It has been prepared on the basis of historical costs and, except where stated, does not take into account changing money values or current valuations of non-current assets.
The accounting policies have been consistently applied and except where there is a change in accounting policy are consistent with those of the previous year.
Where necessary, comparative information has been reclassified to achieve consistency in disclosure with current financial year amounts and other disclosures.
(b) Revenue Recognition
Sales Revenue Sales revenue comprises revenue earned from provision of products to entities or services to entities outside the Company. Sales revenue is recognised when the goods are provided, or when the fee in respect of services provided is receivable. Interest Income Interest income is recognised as it accrues.
(c) Tax Equivalent Regime (TER)
The Company is required to pay to the South Australian Department of Treasury and Finance amounts determined to be equivalent to the amounts that would be payable by the Company if it were a tax-paying entity and taxed as a company under the Income Tax Assessment Acts 1936 and 1997.
The Company has adopted the requirements of Accounting Standard AASB 1020, Accounting for Income Tax (Tax Effect Accounting).
Income tax expense is calculated on operating profit adjusted for permanent differences between taxable and accounting income. The tax effect of timing differences which arise from items being brought to account in different periods for income tax and accounting purposes, is carried forward in the Balance Sheet as a future income tax benefit or a provision for deferred income tax.
Under Clause 12 of the Schedule to the Public Corporations Act 1993 the Treasurer has determined that the Company is not liable to pay any taxes for the period from 1 April 2000 to a date to be determined. Consequently, income tax expense has only been calculated for the period 1 July 1999 to 31 March 2000.
(d) Receivables Trade receivables are carried at amounts due. The collectibility of debts is assessed at year end and specific provision is made for any doubtful accounts.
(e) Inventories Gas purchase contracts with producers contain provisions that require Terra Gas Trader Pty Ltd to take-or-pay for minimum volumes on an annual basis. While Terra Gas Trader Pty Ltd’s gas purchase contracts provide it with the right to take such gas at later dates, such rights apply only to future volumes taken above the take-or-pay level. Terra Gas Trader Pty Ltd capitalises payments under take-or-pay provisions as current or non-current inventory.
The carrying amount of prepaid gas under take-or-pay provisions is reviewed to determine whether it is in excess of its estimated net realisable value at balance date. In determining whether the carrying amount exceeds the net realisable value, estimated future cash flows are discounted to their present value.
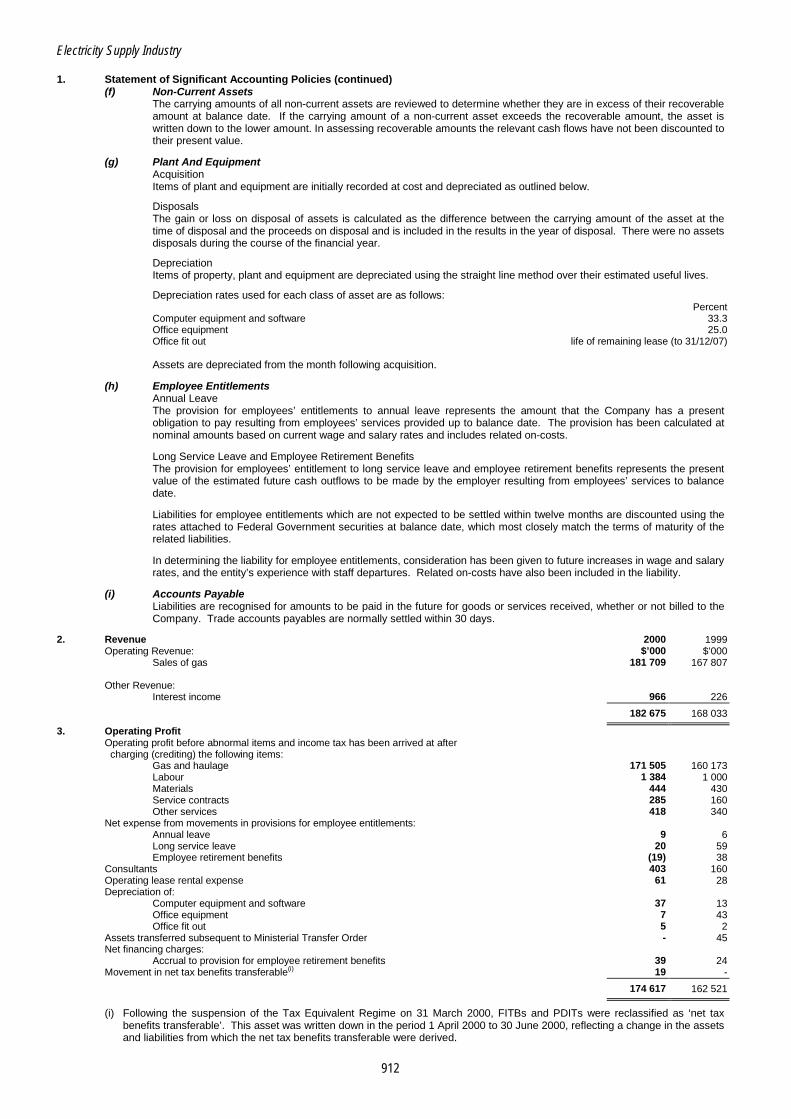
Electricity Supply Industry
912
1. Statement of Significant Accounting Policies (continued) (f) Non-Current Assets
The carrying amounts of all non-current assets are reviewed to determine whether they are in excess of their recoverable amount at balance date. If the carrying amount of a non-current asset exceeds the recoverable amount, the asset is written down to the lower amount. In assessing recoverable amounts the relevant cash flows have not been discounted to their present value.
(g) Plant And Equipment
Acquisition Items of plant and equipment are initially recorded at cost and depreciated as outlined below.
Disposals The gain or loss on disposal of assets is calculated as the difference between the carrying amount of the asset at the time of disposal and the proceeds on disposal and is included in the results in the year of disposal. There were no assets disposals during the course of the financial year.
Depreciation Items of property, plant and equipment are depreciated using the straight line method over their estimated useful lives.
Depreciation rates used for each class of asset are as follows: Percent Computer equipment and software 33.3 Office equipment 25.0 Office fit out life of remaining lease (to 31/12/07)
Assets are depreciated from the month following acquisition.
(h) Employee Entitlements
Annual Leave The provision for employees’ entitlements to annual leave represents the amount that the Company has a present obligation to pay resulting from employees’ services provided up to balance date. The provision has been calculated at nominal amounts based on current wage and salary rates and includes related on-costs.
Long Service Leave and Employee Retirement Benefits The provision for employees’ entitlement to long service leave and employee retirement benefits represents the present value of the estimated future cash outflows to be made by the employer resulting from employees’ services to balance date. Liabilities for employee entitlements which are not expected to be settled within twelve months are discounted using the rates attached to Federal Government securities at balance date, which most closely match the terms of maturity of the related liabilities.
In determining the liability for employee entitlements, consideration has been given to future increases in wage and salary rates, and the entity’s experience with staff departures. Related on-costs have also been included in the liability.
(i) Accounts Payable Liabilities are recognised for amounts to be paid in the future for goods or services received, whether or not billed to the Company. Trade accounts payables are normally settled within 30 days.
2. Revenue 2000 1999
Operating Revenue: $’000 $’000 Sales of gas 181 709 167 807
Other Revenue:
Interest income 966 226
182 675 168 033
3. Operating Profit Operating profit before abnormal items and income tax has been arrived at after charging (crediting) the following items:
Gas and haulage 171 505 160 173 Labour 1 384 1 000 Materials 444 430 Service contracts 285 160 Other services 418 340
Net expense from movements in provisions for employee entitlements: Annual leave 9 6 Long service leave 20 59 Employee retirement benefits (19) 38
Consultants 403 160 Operating lease rental expense 61 28 Depreciation of:
Computer equipment and software 37 13 Office equipment 7 43 Office fit out 5 2
Assets transferred subsequent to Ministerial Transfer Order - 45 Net financing charges:
Accrual to provision for employee retirement benefits 39 24 Movement in net tax benefits transferable(i) 19 -
174 617 162 521
(i) Following the suspension of the Tax Equivalent Regime on 31 March 2000, FITBs and PDITs were reclassified as ‘net tax benefits transferable’. This asset was written down in the period 1 April 2000 to 30 June 2000, reflecting a change in the assets and liabilities from which the net tax benefits transferable were derived.

Electricity Supply Industry
913
4. Extraordinary Items 2000 1999 $’000 $’000
Transfer order - 31 140 Write off of non-transferable tax benefit (995) - Income tax effect - -
(995) 31 140
5. Auditors Remuneration Audit services:
Auditors of the Company 30 000 30 000
30 000 30 000
6. Abnormal Items Profit on realisation of banked gas 3 687 -
7. Taxation
Income Tax Expense: Prima facie income tax expense calculated at 36 percent on the operating profit to 31.3.00 3 606 1 984
Tax effect of permanent differences: Excess tax amortisation arising from different opening balances (648) (59) Other 10 7
Prior year adjustment (7) - Restatement of tax balances due to change in company tax rate 196 -
Income Tax Expense on Operating Profit 3 157 1 932 Income tax expense attributable to operating profit is made up of:
Current income tax payable 2 296 1 741 Provision for deferred income tax 17 3 Future income tax benefits 844 188
8. Dividends
Dividends provided for or paid 18 000 -
9. Cash and Deposits
Cash at bank 85 (23) Cash deposited with the South Australian Government Financing Authority (SAFA) 4 246 7 058
4 331 7 035
10. Receivables Trade receivables 18 194 15 624
18 194 15 624
11. Inventories Current 4 599 4 590 Non-current 14 655 22 325
19 254 26 915
12. Other Assets Current:
Prepayments 224 154 Accrued income - 892 Net tax benefits transferable(1) 135 -
359 1 046
(1) Net tax benefits transferable represents value attributable to the tax deductibility of future cash outflows (relating mainly
to employee provisions), net of negative value attributable to the tax assessability of future economic benefits.
2000 1999 Non-Current: $’000 $’000
Future income tax benefits - 2 072
- 2 072
13. Plant and Equipment Computer equipment and software - At cost 198 77 Accumulated depreciation (55) (34) Office equipment - At cost 25 49 Accumulated depreciation (12) (5) Office fit out - At cost 53 45 Accumulated depreciation (8) (2)
201 130
14. Accounts Payable Trade creditors 17 211 14 675 Accruals 189 293
17 400 14 968

Electricity Supply Industry
914
15. Provisions 2000 1999 Current: $’000 $’000
Employee entitlements: Annual leave 72 64
Provision for income tax - 823 Provision for disaggregation - 4 Deferred income - 865
72 1 756
Non-Current: Employee entitlements:
Long service leave 82 61 Employee retirement benefits 467 447 Deferred income tax - 65
549 573
16. Borrowings Shareholder loan - Non-interest bearing and payable on demand 5 805
17. Capital and Reserves
Capital - - Reserves 21 132 31 140
21 132 31 140 Movements during the year General Reserve:
Balance at the beginning of the year 31 140 - Add: Transfer from (to) retained profits (10 008) 31 140
Balance at 30 June 21 132 31 140
The transfer from the General Reserve equalled the cash benefits realised from the net assets transferred on 12 October 1999 from
ETSA to the Company, which therefore became distributable. 18. Financing Arrangements
The Company has access to the following lines of credit: Bank overdraft 1 000 1 000 South Australian Government Financing Authority (SAFA) 20 000 20 000
Total Facilities Available 21 000 21 000 Facilities utilised at balance date - - Facilities not utilised at balance date 21 000 21 000
19. Additional Financial Instruments Disclosure
(a) Interest Rate Risk The entity’s exposure to interest rate risk and the effective weighted average interest rate for each class of financial assets and liabilities are as follows:
Cash - weighted average interest rate of 6.1 percent Receivables - non interest bearing (unless paid late) Creditors - non interest bearing (unless paid late) Employee entitlements - weighted average interest rate of 6 percent (discount rate) Shareholder loan - non interest bearing
(b) Credit Risk Exposure
Credit risk represents the loss that would be recognised if counterparties failed to perform as contracted. Credit risk is largely managed through contractual terms that: require prompt payment; charge interest on late payments, and: provide protection for deteriorating creditworthiness of counterparties.
The company is materially exposed to individual customers and the electricity generation class of customers.
(c) Commodity Price Risk Commodity price risks arise as a result of triennial gas price reviews that can be called by either the seller or purchaser. The next review is due on 1 July 2002. Details of price review clauses are commercially sensitive and the Directors believe it is inappropriate to disclose this information.
(d) Net Fair Values Of Financial Assets And Liabilities Monetary financial assets and financial liabilities not readily traded in an organised financial market are determined by valuing them at the present value of contractual future cash flows on amounts due from customers (reduced for expected credit losses) or due to suppliers. Cash flows are discounted using standard valuation techniques at the applicable market yield having regard to the timing of the cash flows. The carrying amounts of trade debtors, other debtors, bank overdrafts, accounts payable and employee entitlements approximate net fair value.
20. Commitments 2000 1999
Natural Gas $’000 $’000 Contracted but not provided for and payable:
Not later than one year 126 365 122 250 Later than one year but not later than five years 478 945 508 632 Later than five years 389 385 482 597
994 695 1 113 479
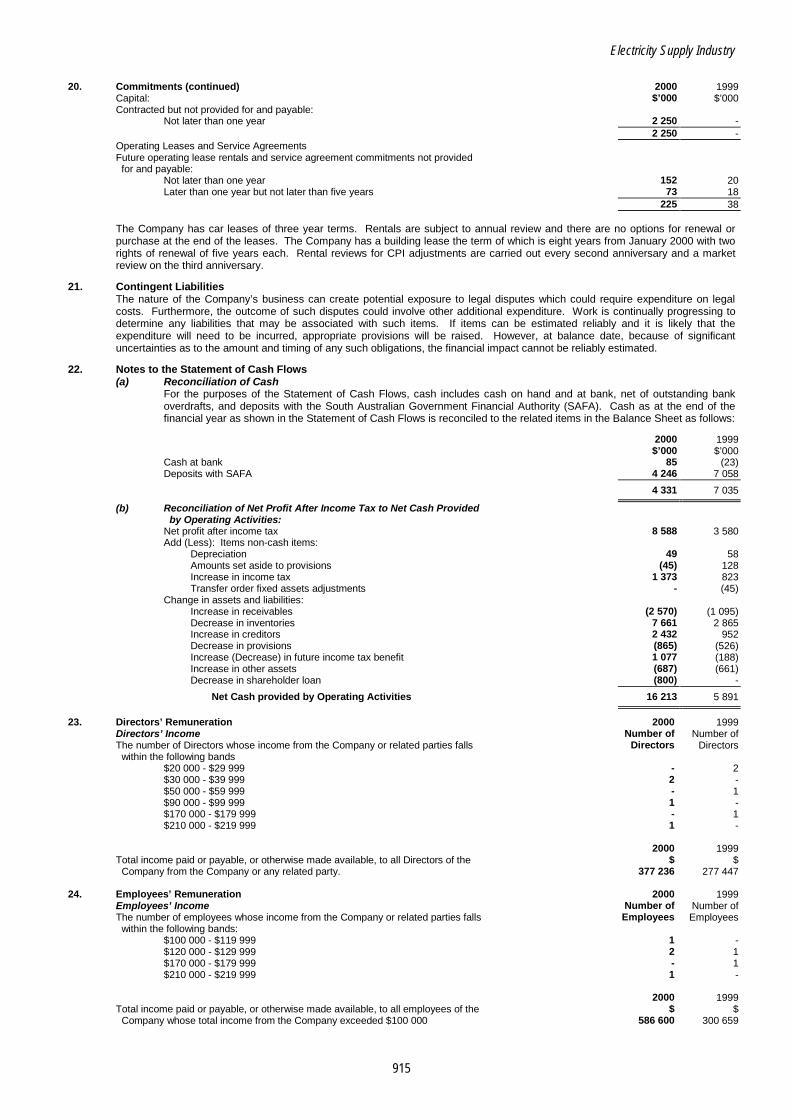
Electricity Supply Industry
915
20. Commitments (continued) 2000 1999 Capital: $’000 $’000 Contracted but not provided for and payable:
Not later than one year 2 250 - 2 250 -
Operating Leases and Service Agreements Future operating lease rentals and service agreement commitments not provided for and payable:
Not later than one year 152 20 Later than one year but not later than five years 73 18
225 38 The Company has car leases of three year terms. Rentals are subject to annual review and there are no options for renewal or
purchase at the end of the leases. The Company has a building lease the term of which is eight years from January 2000 with two rights of renewal of five years each. Rental reviews for CPI adjustments are carried out every second anniversary and a market review on the third anniversary.
21. Contingent Liabilities
The nature of the Company’s business can create potential exposure to legal disputes which could require expenditure on legal costs. Furthermore, the outcome of such disputes could involve other additional expenditure. Work is continually progressing to determine any liabilities that may be associated with such items. If items can be estimated reliably and it is likely that the expenditure will need to be incurred, appropriate provisions will be raised. However, at balance date, because of significant uncertainties as to the amount and timing of any such obligations, the financial impact cannot be reliably estimated.
22. Notes to the Statement of Cash Flows
(a) Reconciliation of Cash For the purposes of the Statement of Cash Flows, cash includes cash on hand and at bank, net of outstanding bank overdrafts, and deposits with the South Australian Government Financial Authority (SAFA). Cash as at the end of the financial year as shown in the Statement of Cash Flows is reconciled to the related items in the Balance Sheet as follows:
2000 1999 $’000 $’000
Cash at bank 85 (23) Deposits with SAFA 4 246 7 058
4 331 7 035
(b) Reconciliation of Net Profit After Income Tax to Net Cash Provided by Operating Activities: Net profit after income tax 8 588 3 580 Add (Less): Items non-cash items:
Depreciation 49 58 Amounts set aside to provisions (45) 128 Increase in income tax 1 373 823 Transfer order fixed assets adjustments - (45)
Change in assets and liabilities: Increase in receivables (2 570) (1 095) Decrease in inventories 7 661 2 865 Increase in creditors 2 432 952 Decrease in provisions (865) (526) Increase (Decrease) in future income tax benefit 1 077 (188) Increase in other assets (687) (661) Decrease in shareholder loan (800) -
Net Cash provided by Operating Activities 16 213 5 891
23. Directors’ Remuneration 2000 1999 Directors’ Income Number of Number of The number of Directors whose income from the Company or related parties falls Directors Directors within the following bands
$20 000 - $29 999 - 2 $30 000 - $39 999 2 - $50 000 - $59 999 - 1 $90 000 - $99 999 1 - $170 000 - $179 999 - 1 $210 000 - $219 999 1 -
2000 1999
Total income paid or payable, or otherwise made available, to all Directors of the $ $ Company from the Company or any related party. 377 236 277 447
24. Employees’ Remuneration 2000 1999
Employees’ Income Number of Number of The number of employees whose income from the Company or related parties falls Employees Employees within the following bands:
$100 000 - $119 999 1 - $120 000 - $129 999 2 1 $170 000 - $179 999 - 1 $210 000 - $219 999 1 -
2000 1999 Total income paid or payable, or otherwise made available, to all employees of the $ $ Company whose total income from the Company exceeded $100 000 586 600 300 659

Electricity Supply Industry
916
25. Related Parties Directors The names of each person holding the position of Director of Terra Gas Trader Pty Ltd during the financial year are as follows: Mr D Curry, Mr AP Dodman, Mr J B FitzGerald and Mr N Taylor. Details of Directors’ remuneration are set out in Note 23. Apart from the details disclosed in this note, no Director has entered into a material contract with the entity since the beginning of the financial year and there were no material contracts involving Directors’ interests subsisting at year end. Ultimate Holding Corporation The Treasurer of South Australia.
26. Economic Dependency
Significant volumes of gas are supplied to Terra Gas Trader Pty Ltd by the Natural Gas Authority of South Australia, which receives this gas from the Cooper Basin and South West Queensland gas producers. Terra Gas Trader Pty Ltd is dependent upon Epic Energy South Australia Pty Ltd for access to natural gas pipelines through contracted haulage arrangements. Significant sales of gas are made by Terra Gas Trader Pty Ltd through long term contracts with Flinders Power Pty Ltd, TXU Electricity Limited and National Power Synergen Pty Ltd. Terra Gas Trader Pty Ltd also has a gas sales contract with National Power South Australia Investments Ltd for gas supplies to the Pelican Point Power Station, when constructed.
27. Events Subsequent to Balance Date
Prior to year end the South Australian Government commenced a process of selling the gas trading business undertaken by the company. A sale had not been consummated at the date of this Report.
28. Superannuation Commitments
The majority of the employees of the Company are members of the Electricity Industry Superannuation Scheme (the Scheme). Liabilities arise to the Company as an employer as a result of these memberships. Additionally, the Company contributes towards various other defined contribution superannuation schemes for certain employees and directors, at levels at or above that required to ensure no Superannuation Guarantee Charge liabilities arise. The Scheme is managed by the Electricity Industry Superannuation Board, a separate legal entity which is independent from the Company, operating pursuant to the Electricity Corporation Act 1994 (as amended in the reporting period by the Electricity Corporations (Restructuring & Disposal) Act 1999). On 1 December 1999 the two superannuation schemes which the Company previously contributed towards (the ETSA Contributory Superannuation Scheme and the ETSA Non-contributory Superannuation Scheme) became Divisions of the Electricity Industry Superannuation Scheme. The Company’s liability under the Scheme arising upon retirement or resignation of members is not progressively funded, but is paid as the benefits fall due. A provision for this liability has been recognised in the accounts. The Company makes contributions to the Scheme towards the cost of insurance which covers the benefits payable to a member arising upon disability or death. The Scheme comprises four major Divisions: Divisions 2, 3, 4 and 5. All Divisions apart from Division 5 are closed to new members. Members contribute to the Divisions at varying percentages of their income on either a post-tax or salary sacrifice basis. Retirement benefits under Division 2 comprise the member contributions, fund earnings and a defined benefit component. Resignation/redundancy benefits may be taken in various ways but typically comprise the member contributions, fund earnings and an employer multiple of the sum of these (of approximately two times). Retirement benefits under Division 3 are primarily in the form of pensions based on member contributions, period of membership and final salary. Benefits may be commuted to a lump sum on retirement. Benefits paid on redundancy comprise the member contributions, fund earnings and an employer multiple of the sum of these (of 2ò times). No employees of the Company are members of Division 4. Division 5 operates as an unfunded defined contribution scheme. Employer support is provided at a level such that no Superannuation Guarantee Charge liabilities arise. Options for additional employee contributions (pre or post tax) are available. An actuarial assessment of the predecessor Schemes was carried out by Mr A Archer FIAA, Principal of William M Mercer Pty Ltd, as at 30 June 1999. This assessment was updated after the changes to the Scheme outlined above. The provision made by the Company in its accounts has been based on these actuarial assessments.

Electricity Supply Industry
917
GENERATION LESSOR CORPORATION FUNCTIONAL RESPONSIBILITY AND STRUCTURE Generation Lessor Corporation (GLC) was established as a subsidiary of the Treasurer in July 1999 pursuant to the Public Corporations (Generation Lessor Corporation) Regulations 1999. The functions of GLC include being the lessor under a lease granted in respect of certain prescribed assets transferred to GLC pursuant to the Electricity Corporations (Restructuring and Disposal) Act 1999. SIGNIFICANT FEATURES Prescribed electricity generation assets of $121.2 million were transferred from Optima Energy Pty Ltd (Optima Energy) and Synergen Pty Ltd (Synergen). Prepaid rentals from the lease of the prescribed electricity generation assets to external parties were $315.1 million. A dividend of $198.2 million was paid to the Treasurer. AUDIT MANDATE AND COVERAGE Audit Authority In accordance with section 31 of the Public Finance and Audit Act 1987 and subclause 13(3) of the Schedule to the Public Corporations Act 1993, the Auditor-General may at any time, and must in respect of each financial year, audit the accounts and financial statements of the Generation Lessor Corporation. Scope of Audit The audit program was directed primarily towards obtaining sufficient evidence to enable an audit opinion to be formed with respect to the financial statements and internal control. During 1999-2000 a specific area of audit attention was the accounting for the transfer and lease of the prescribed electricity generation assets. CONTROLS OPINION As required by subsection 36(1)(a)(iii) of the Public Finance and Audit Act 1987, the audit of Generation Lessor Corporation included an assessment of the controls exercised in relation to the receipt, expenditure and investment of money, the acquisition and disposal of property and the incurring of liabilities. Audit formed the opinion that the controls exercised by Generation Lessor Corporation in relation to the receipt, expenditure and investment of money; the acquisition and disposal of property; and the incurring of liabilities, were sufficient to provide reasonable assurance that the financial transactions of the organisation were conducted properly and in accordance with the law. INTERPRETATION AND ANALYSIS OF FINANCIAL STATEMENTS Transfer and Lease of Electricity Generation Assets On 4 May 2000 and 11 May 2000, the South Australian Treasurer signed an agreement with external parties for the lease and transfer of the assets and liabilities of Optima Energy and Synergen respectively. Although settlement of these transactions did not take place until 6 June 2000, the benefits and risks associated with the businesses were transferred as at the date of the agreement, ie 4 May 2000 for Optima Energy and 11 May 2000 for Synergen.
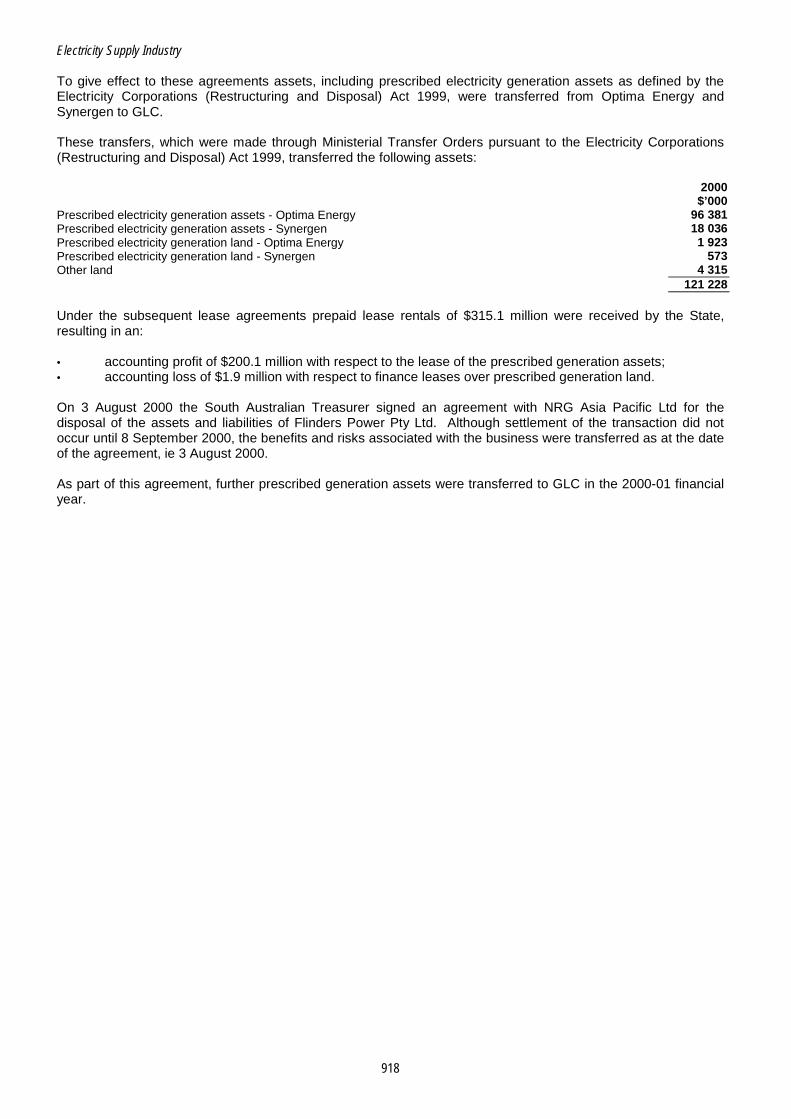
Electricity Supply Industry
918
To give effect to these agreements assets, including prescribed electricity generation assets as defined by the Electricity Corporations (Restructuring and Disposal) Act 1999, were transferred from Optima Energy and Synergen to GLC. These transfers, which were made through Ministerial Transfer Orders pursuant to the Electricity Corporations (Restructuring and Disposal) Act 1999, transferred the following assets: 2000 $’000 Prescribed electricity generation assets - Optima Energy 96 381 Prescribed electricity generation assets - Synergen 18 036 Prescribed electricity generation land - Optima Energy 1 923 Prescribed electricity generation land - Synergen 573 Other land 4 315 121 228 Under the subsequent lease agreements prepaid lease rentals of $315.1 million were received by the State, resulting in an: • accounting profit of $200.1 million with respect to the lease of the prescribed generation assets; • accounting loss of $1.9 million with respect to finance leases over prescribed generation land. On 3 August 2000 the South Australian Treasurer signed an agreement with NRG Asia Pacific Ltd for the disposal of the assets and liabilities of Flinders Power Pty Ltd. Although settlement of the transaction did not occur until 8 September 2000, the benefits and risks associated with the business were transferred as at the date of the agreement, ie 3 August 2000. As part of this agreement, further prescribed generation assets were transferred to GLC in the 2000-01 financial year.
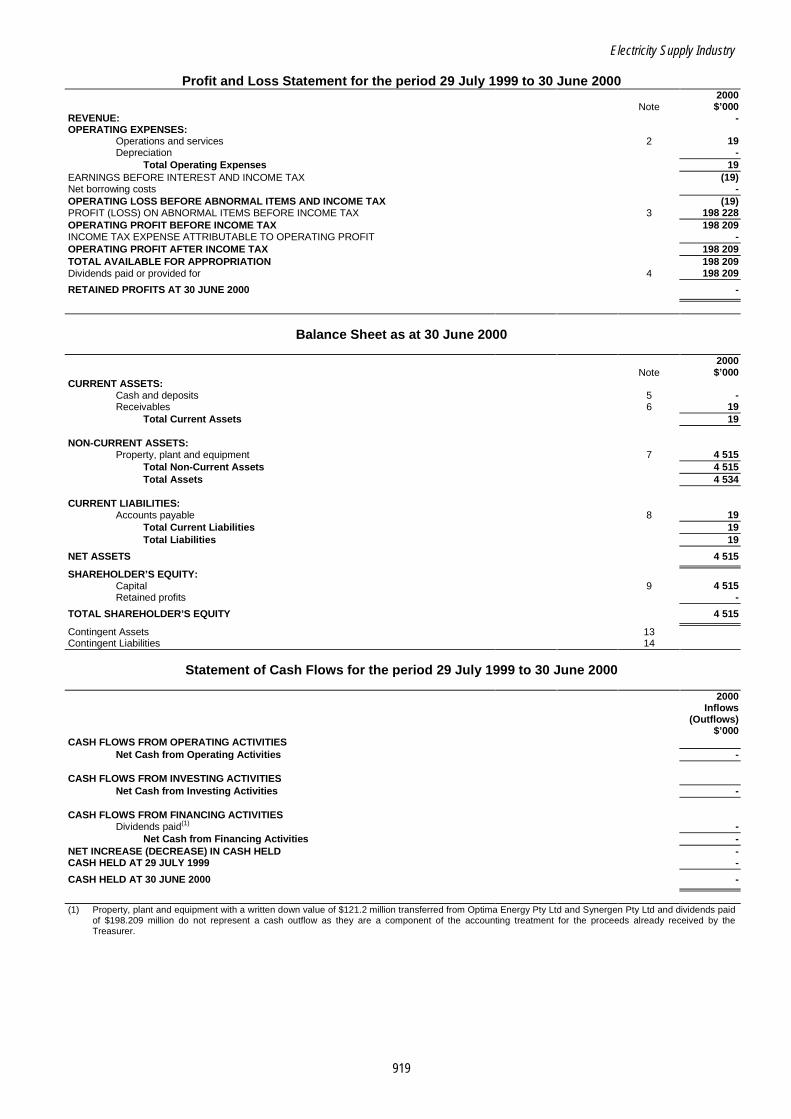
Electricity Supply Industry
919
Profit and Loss Statement for the period 29 July 1999 to 30 June 2000 2000 Note $’000 REVENUE: - OPERATING EXPENSES:
Operations and services 2 19 Depreciation -
Total Operating Expenses 19 EARNINGS BEFORE INTEREST AND INCOME TAX (19) Net borrowing costs - OPERATING LOSS BEFORE ABNORMAL ITEMS AND INCOME TAX (19) PROFIT (LOSS) ON ABNORMAL ITEMS BEFORE INCOME TAX 3 198 228 OPERATING PROFIT BEFORE INCOME TAX 198 209 INCOME TAX EXPENSE ATTRIBUTABLE TO OPERATING PROFIT - OPERATING PROFIT AFTER INCOME TAX 198 209 TOTAL AVAILABLE FOR APPROPRIATION 198 209 Dividends paid or provided for 4 198 209
RETAINED PROFITS AT 30 JUNE 2000 -
Balance Sheet as at 30 June 2000 2000 Note $’000 CURRENT ASSETS:
Cash and deposits 5 - Receivables 6 19
Total Current Assets 19 NON-CURRENT ASSETS:
Property, plant and equipment 7 4 515 Total Non-Current Assets 4 515 Total Assets 4 534
CURRENT LIABILITIES:
Accounts payable 8 19 Total Current Liabilities 19 Total Liabilities 19
NET ASSETS 4 515
SHAREHOLDER’S EQUITY: Capital 9 4 515 Retained profits -
TOTAL SHAREHOLDER’S EQUITY 4 515
Contingent Assets 13 Contingent Liabilities 14
Statement of Cash Flows for the period 29 July 1999 to 30 June 2000 2000 Inflows (Outflows) $’000 CASH FLOWS FROM OPERATING ACTIVITIES
Net Cash from Operating Activities - CASH FLOWS FROM INVESTING ACTIVITIES
Net Cash from Investing Activities - CASH FLOWS FROM FINANCING ACTIVITIES
Dividends paid(1) - Net Cash from Financing Activities -
NET INCREASE (DECREASE) IN CASH HELD - CASH HELD AT 29 JULY 1999 -
CASH HELD AT 30 JUNE 2000 -
(1) Property, plant and equipment with a written down value of $121.2 million transferred from Optima Energy Pty Ltd and Synergen Pty Ltd and dividends paid
of $198.209 million do not represent a cash outflow as they are a component of the accounting treatment for the proceeds already received by the Treasurer.

Electricity Supply Industry
920
NOTES TO AND FORMING PART OF THE FINANCIAL REPORT 1. Statement of Significant Accounting Policies
Establishment Generation Lessor Corporation (the Corporation) was established as a body corporate on 29 July 1999 pursuant to the Public Corporations (Generation Lessor Corporation) Regulations 1999 (SA). Pursuant to Ministerial Transfer Orders effective, on 6 June 2000 all the electricity generation prescribed assets and specified electricity generation land of Optima Energy Pty Ltd and Synergen Pty Ltd were transferred to the Corporation, at the book value as at 4 May 2000 and 11 May 2000 respectively.
Financial Period The financial report has been prepared for the period from the date of the Corporation’s establishment on 29 July 1999 to 30 June 2000.
Basis of Accounting The financial report is a general purpose financial report and was prepared on an accrual accounting basis in accordance with applicable Australian Accounting Standards, Urgent Issues Group Consensus Views and is subject to the Treasurer’s Instructions and Accounting Policy Statements promulgated by the South Australian Government under the provisions of the Public Finance and Audit Act 1987, as amended. The financial report has been prepared on the basis of historical costs and does not take into account changing money values except where stated.
Revenue Recognition Leases (i) Prescribed Electricity Generation Assets
All prescribed electricity generation assets and prescribed electricity generation land assets, transferred from Synergen Pty Ltd and Optima Energy Pty Ltd on 6 June 2000 were leased under finance leases for 100 years, effective 6 June 2000. Lease rentals were fully prepaid by each lessee to the Treasurer. Prepaid lease rentals received in excess of the book value of the prescribed electricity generation assets are recognised as profit on the finance lease.
(ii) Other Land Assets
Other land transferred from Optima Energy Pty Ltd on 6 June 2000 was leased under an operating lease for 100 years effective 6 June 2000.
Taxation Income Tax The Treasurer of South Australia has issued a determination pursuant to the Schedule to the Public Corporations Act 1993 whereby the Corporation is not subject to Commonwealth income tax equivalents for the period since incorporation.
Receivables Receivable from the Treasurer Receivables represent amounts owing from the Treasurer with respect to operating expenses incurred by the Corporation.
The receivable from the Treasurer is reduced each year to the extent of dividends declared to the Treasurer from the operations of the Corporation.
Property, Plant and Equipment Transfer Land and plant and equipment, including buildings and leasehold property, transferred from Synergen Pty Ltd and Optima Energy Pty Ltd have been initially recorded at book values.
Revaluations Land and buildings are independently valued every three years on an existing use basis of valuation and included in the financial statements at the revalued amounts. Disposal of Revalued Assets The gain or loss on disposal of revalued assets is calculated as the difference between the carrying amount of the asset at the time of disposal and the proceeds on disposal and is included in the results in the year of disposal. Any related revaluation increment standing in the asset revaluation reserve at the time of disposal is transferred to the capital profits reserve.
Depreciation and Amortisation Items of property, plant and equipment, including buildings and leasehold property but excluding freehold land, are depreciated/amortised using the straight line method over their estimated useful lives.
Rounding All values expressed in the Notes are to the nearest thousand dollars unless otherwise specified.
Comparative amounts No comparative amounts have been provided, as this is the first financial period the Corporation has operated.

Electricity Supply Industry
921
2. Operations and Services 2000 Note $’000
Audit fees 10 10 Other 9
19
3. Abnormal Items Profit on lease of electricity generation prescribed assets 198 228
4. Dividends
Dividends paid during the period: Current period dividend 198 209
Dividends owing to the Treasurer have been settled against the Treasurer’s Clearing Account as a receivable. 5. Cash and deposits
Cash and deposits on hand -
-
6. Receivables Current Receivables:
Receivable from the Treasurer 19
7. Property, Plant and Equipment
Non-generation land and easements leased 4 315 Non-generation land and buildings not leased 200
4 515
During the period prescribed electricity generation assets with a written down value of $114.4 million and prescribed electricity land assets with at written down value of $2.5 million (refer Note 11) were transferred from Optima Energy Pty Ltd and Synergen Pty Ltd at written down value as at the respective date of transfer. These assets were subsequently leased and have been accounted for as finance leases and do not appear in the Balance Sheet as all the rights, obligations and risks have been transferred to the lessees.
8. Current Accounts Payable 2000
$’000 Trade creditors 19
9. Capital
Capital contribution by the Treasurer 7 011
Capital represents the book value of land assets subject to operating leases transferred to the Corporation from Optima Energy Pty Ltd and purchased from the Commonwealth of Australia not forming part of the electricity generation prescribed asset finance lease.
10. Auditors’ Remuneration 2000 $’000
Amounts received or due and receivable by the auditors for auditing the financial report of the Corporation 10 11. Assets Transferred
By way of Ministerial Transfer Orders No 18, 19, 20 and 21 made pursuant to the Electricity Corporation (Restructuring and Disposal) Act 1999, by the Treasurer of South Australia, the following assets were transferred from Optima Energy Pty Ltd and Synergen Pty Ltd to the Corporation.
2000 Optima Energy Synergen Pty Ltd Pty Ltd Total $’000 $’000 $’000
Electricity generation prescribed assets 96 381 18 036 114 417 Generation land 1 923 573 2 496 Other land 4 315 - 4 315
102 619 18 609 121 228
Fully prepaid finance lease rentals of $314.5 million were received with respect to the lease of the electricity generation prescribed assets, resulting in a profit on the leases of $200.1 million.
Fully prepaid finance lease rentals of $0.6 million were received with respect to the lease of electricity generation land, resulting in a loss on the leases of $1.9 million.
Other land transferred from Optima Energy Pty Ltd is subject to an operating lease.
12. Related Party Transactions Directors The names of persons who were directors of Generation Lessor Corporation at any time during the financial year are as follows: Timothy John Spencer (Appointed 30 July 1999) Luigi Salvatore De Gennaro (Appointed 30 July 1999) Michael George Philipson (Appointed 30 July 1999)
Electricity Supply Industry
922
12. Related Party Transactions (continued) Transaction of Directors and Director-Related Entities There were no transactions during the year with directors or director related entities. In accordance with Government guidelines no director of the Corporation received any remuneration in respect of their duties as director of the Corporation.
Loans to Directors There have been no loans advanced to directors of the Corporation during the financial year. Total of loans outstanding at year end is nil.
Other Related Entities The Corporation has dealings with other Government instrumentalities. All dealings are in the ordinary course of business and on normal commercial trading terms.
Controlling Entity The Corporation’s ultimate Australian parent entity is the Treasurer of the State of South Australia, as a body corporate.
13. Contingent Asset
Under the terms of the Generating Plant and Unit Leases and the Land Leases certain costs of the Corporation that are associated with the operation of the generation plants and units and generation land are able to be reimbursed from the lessees or on charged directly to the lessees. As at the date of this report no such amount for reimbursement from the lessees exists and therefore has not been brought to account in the financial report.
14. Contingent Liability
In the unlikely event that the Corporation defaults under the lease with respect to its legal entitlement to grant the leases, the Corporation is obliged to refund the net present value (as at the termination date) of so much of the post termination date rent obligations as were discharged by the prepaid rents. No amount has been recognised as the likelihood of the circumstances of the Corporation defaulting is remote.
Torrens Island Quarantine Station On 19 May 2000 settlement of the purchase from the Commonwealth of Australia of the Torrens Island Quarantine Station was completed. Whilst it is intended that the Corporation be the temporary holder of the quarantine station there are management issues associated with the purchase. These relate to the presence of hazardous materials (including asbestos, soil contamination and chemicals) as well as building and grounds maintenance. There have been a number of reports undertaken in relation to these issues. One of the recent reports was undertaken by DASCEM Holdings Pty Ltd, who were engaged by the Commonwealth of Australia to undertake specified remediation in the period from December 1999 to February 2000. Their report confirms that specified remediation works have been completed to address existing contamination. Future remediation will be the responsibility of the Corporation, however, as at 30 June 2000 this amount is not accurately quantifiable.
15. Segment Information
The entity operates as lessor of electricity generation assets in South Australia. 16. Events Subsequent to Balance Date
The State is currently in the process of completing the sale/lease of the net assets of Flinders Power Pty Ltd. Upon completion of this transaction, the prescribed electricity generating assets and the electricity generation land assets will be transferred to the Corporation and then subsequently leased from the Corporation to the successful bidder. Other than the matter discussed above, no event has arisen since 30 June 2000 that would be likely to materially affect the operations or the state of affairs of the Corporation.
17. Economic Dependency
The Corporation is an instrumentality of the Crown under the Crown Proceedings Act 1992. Accordingly where a final judgement is given against it, it may be directed by the Governor to satisfy that judgement. Such a direction constitutes sufficient authority for the appropriation of the money necessary to satisfy the judgement from the General Revenue of the State of South Australia or from the funds of the Corporation. To this extent the Corporation has the benefit of an implicit guarantee from the State.
Electricity Supply Industry
923
ELECTRICITY SUPPLY INDUSTRY - RETAIL
RESI POWER PTY LTD FUNCTIONAL RESPONSIBILITY AND STRUCTURE ETSA Power Pty Ltd (ETSA Power) was incorporated under the Corporations Law in June 1998 as a subsidiary of ETSA Capital Pty Ltd. In July 1999 the shares in ETSA Power were transferred, as a result of a Ministerial Transfer Order issued pursuant to the Electricity Corporations Act 1994, to ETSA Capital (No.2) Pty Ltd, a subsidiary of the Treasurer. On 3 February 2000 the name of ETSA Power was changed to RESI Power Pty Ltd (RESI Power). During the year ETSA Power’s primary function was to retail electricity. CHANGES TO AGENCY ORGANISATIONAL STRUCTURE On 12th December 1999, the South Australian Treasurer signed an agreement with Cheung Kong Infrastructure Holdings (CKI) and Hong Kong Electric International Limited (HEI) for the sale of non-prescribed retail assets (net of liabilities) of ETSA Power. Although settlement of the transaction did not occur until 28th January 2000, the benefits and risks associated with the business were transferred as at the date of the agreement, ie 12 December 1999. These non-prescribed assets and liabilities of ETSA Power were subsequently on-sold by CKI and HEI to Australian Gas Light (AGL) Pty Ltd in January 2000, which resulted in an additional payment being made to the Treasurer as provided for under the Electricity Retail Business Sale Agreement. SIGNIFICANT FEATURES Total proceeds received from the sale of non-prescribed assets (net of liabilities) was $161.7 million. Accounting profit on sale of ETSA Power’s non-prescribed assets (net of liabilities) was $167.4 million. Final dividend paid for the year was $188 million. AUDIT MANDATE AND COVERAGE Audit Authority In accordance with section 31 of the Public Finance and Audit Act 1987 and subclause 13(3) of the Schedule to the Public Corporations Act 1993 the Auditor-General may at any time, and must in respect of each financial year, audit the accounts and financial statements of RESI Power Pty Ltd (formerly ETSA Power Pty Ltd). Scope of Audit The audit program covered all major financial systems and was directed primarily towards obtaining sufficient evidence to enable an audit opinion to be formed with respect to the financial statements and internal control. This was particularly the case for the early part of the financial year when ETSA Power operated as an electricity retail business. During 1999-2000 a specific area of audit attention was the accounting for the restructure and disposal of the assets and liabilities of ETSA Power.

Electricity Supply Industry
924
Audit Communications to Management Following the completion of the audit a management letter was addressed to the Chief Executive Officer of ETSA Power, with copies provided to the: • Chairman, ETSA Power Board Audit Committee; • Manager, Internal Audit, ETSA Power. A satisfactory response was received for all matters raised. CONTROLS OPINION As required by subsection 36(1)(a)(iii) of the Public Finance and Audit Act 1987, the audit of RESI Power Pty Ltd (formerly ETSA Power Pty Ltd) included an assessment of the controls exercised in relation to the receipt, expenditure and investment of money, the acquisition and disposal of property and the incurring of liabilities. Audit formed the opinion that the controls exercised by RESI Power Pty Ltd (formerly ETSA Power Pty Ltd) in relation to the receipt, expenditure and investment of money; the acquisition and disposal of property; and the incurring of liabilities, were sufficient to provide reasonable assurance that the financial transactions of the organisation were conducted properly and in accordance with the law. INTERPRETATION AND ANALYSIS OF FINANCIAL STATEMENTS Disposal of Non-Prescribed Assets and Liabilities During the year assets (net of liabilities) of ETSA Power were sold to CKI and HEI. The assets (net of liabilities) sold reflected their values as at 12 December 1999, and were as follows: 2000 $’000 $’000 Assets:
Cash and deposits 1 035 Receivables 231 358 Property, plant and equipment 6 545 Other 13 897
252 835 Liabilities:
Creditors and accounts 222 222 Provisions 36 339 258 561
Net Assets (Liabilities) (5 726) Proceeds from disposal 161 679 Profit on disposal of non-prescribed distribution assets 167 405 In addition, the following payments were made by the State to the new owners as a result of conditions in the sale agreements: • Outage Compensation ($5.6 million) as a result of market events that occurred prior to the transfer of the
business to the new owners.
• Vesting Compensation Deed payments ($8.4 million) relating to differences between forecast and actual electricity demands for a period following the sale of the electricity retail business.

Electricity Supply Industry
925
Abridged Financial Statement The result of operations for the year ended 30 June 2000 for RESI Power (formerly ETSA Power) is set out below. The result reflects both the period during which ETSA Power operated the electricity retail business, together with the impact of the sale of assets (net of liabilities).
Profit and Loss Statement for the year ended 30 June 2000 2000 $’000 REVENUES 476 078 EXPENSES 471 091 EARNINGS BEFORE INTEREST AND TAX 4 987 Net financing charges 667 OPERATING PROFIT BEFORE ABNORMAL ITEMS AND INCOME TAX 4 320 Abnormal items (923) OPERATING PROFIT BEFORE INCOME TAX 3 397 Income tax 1 953 OPERATING PROFIT AFTER INCOME TAX 1 444 Extraordinary items 167 405 OPERATING PROFIT AND EXTRAORDINARY ITEMS AFTER INCOME TAX 168 849 Retained profits at 1 July 18 660 TOTAL AVAILABLE FOR APPROPRIATION 187 509 Dividends paid or provided for 187 509
RETAINED PROFITS AT 30 JUNE -
The company did not have any assets or liabilities as at 30 June 2000.
Electricity Supply Industry
926
ELECTRICITY SUPPLY INDUSTRY - TRANSMISSION
TRANSMISSION LESSOR CORPORATION FUNCTIONAL RESPONSIBILITY AND STRUCTURE ETSA Transmission Corporation (trading as ElectraNet SA) was incorporated in 1995 by regulation under the Public Corporations Act 1993 as a subsidiary of ETSA Corporation (now RESI Corporation). During 1999-2000 the name of ETSA Transmission Corporation was changed to Transmission Lessor Corporation in readiness for leasing its prescribed assets which is expected to occur in 2000-01. Although RESI Corporation is the ultimate holding corporation in terms of the Public Corporations Act 1993, ElectraNet SA has been established as an autonomous trading entity, which in substance cannot be directed by RESI Corporation without the approval of the Treasurer (refer to prior commentary under Electricity Supply Industry - Overview). ElectraNet SA has a subsidiary entitled Transmission Leasing Pty Ltd which is a participant in a cross border lease of transmission assets. Description of Objectives The charter for ElectraNet SA limits the nature and scope of its operations mainly to performing electricity transmission and system control functions. CHANGES TO AGENCY ORGANISATIONAL STRUCTURE IN 2000-01 Under the Government’s electricity businesses disposal program, Final Bids for the sale and lease of the assets and liabilities of the Government’s transmission business (ElectraNet SA) were received on 4 September 2000. As at the date of the preparation of this Report, no announcement had been made with respect to the outcome of the disposal process for ElectraNet SA. SIGNIFICANT FEATURES Revenue from network charges increased by 6.5 percent to $127 million. Operating profit before abnormal items and income tax increased by 21.1 percent to $54 million. Dividends paid for the year were $55 million an increase of $32.5 million over those paid in 1998-99. Property, plant and equipment had a written down book value of $708 million as at 30 June 2000. AUDIT MANDATE AND COVERAGE Audit Authority In accordance with section 31 of the Public Finance and Audit Act 1987 and subclause 13(3) of the Schedule to the Public Corporations Act 1993 the Auditor-General may at any time, and must in respect of each financial year, audit the accounts and financial statements of Transmission Lessor Corporation (formerly ETSA Transmission Corporation). Scope of Audit The audit program covered all major financial systems and was directed primarily towards obtaining sufficient evidence to enable an audit opinion to be formed with respect to the financial statements and internal control. During 1999-2000 specific areas of audit attention included the testing of controls and a sample of transactions in relation to the completeness, accuracy, timeliness and recording of revenue for network charges.

Electricity Supply Industry
927
Audit Communications to Management Following the completion of the audit an audit management letter was forwarded to the Chief Executive Officer, with copies provided to the: • Chairman, ElectraNet SA Board Audit Committee; • Manager, Compliance, ElectraNet SA. A satisfactory response was received to all matters raised. AUDIT FINDINGS AND COMMENTS Commentary on General Financial Controls Work undertaken by Audit during the course of the year indicated that ElectraNet SA had maintained a sound internal control environment. In particular there are a number of strategic initiatives which underpin this environment, including: • a Board Audit Committee which met regularly during the year and provided a forum to oversee the
financial reporting, auditing and legal compliance processes in relation to ElectraNet SA. Representatives of the Auditor-General attended meetings of the Committee as observers;
• an Internal Audit function which reports directly to the Board Audit Committee;
• management representations to Directors of ElectraNet SA through a Directors’ Questionnaire, which provides a tool for the Directors to assess the level of internal controls. These representations included matters relating to legal compliance, and other matters supporting the integrity and fairness of presentation of information conveyed within the financial statements.
CONTROLS OPINION As required by subsection 36(1)(a)(iii) of the Public Finance and Audit Act 1987, the audit of Transmission Lessor Corporation (formerly ETSA Transmission Corporation) included an assessment of the controls exercised in relation to the receipt, expenditure and investment of money, the acquisition and disposal of property and the incurring of liabilities. Audit formed the opinion that the controls exercised by Transmission Lessor Corporation (formerly ETSA Transmission Corporation) in relation to the receipt, expenditure and investment of money; the acquisition and disposal of property; and the incurring of liabilities, were sufficient to provide reasonable assurance that the financial transactions of the organisation were conducted properly and in accordance with the law. INTERPRETATION AND ANALYSIS OF FINANCIAL STATEMENTS Rate of Return on Assets The rate of return on network assets (before interest and tax) was 10.1 percent (9.3 percent). The increase in the rate of return resulted from a three percent increase in network assets with an accompanying 12.3 percent increase in earnings before interest and income tax. Debt to Equity Ratio The debt to equity ratio of ElectraNet SA at 30 June 2000 was 50 percent (37 percent). The increase was due mainly to an increase in capital expenditure and a reduction in retained profits as a result of an increase of $32.5 million in the dividend paid.
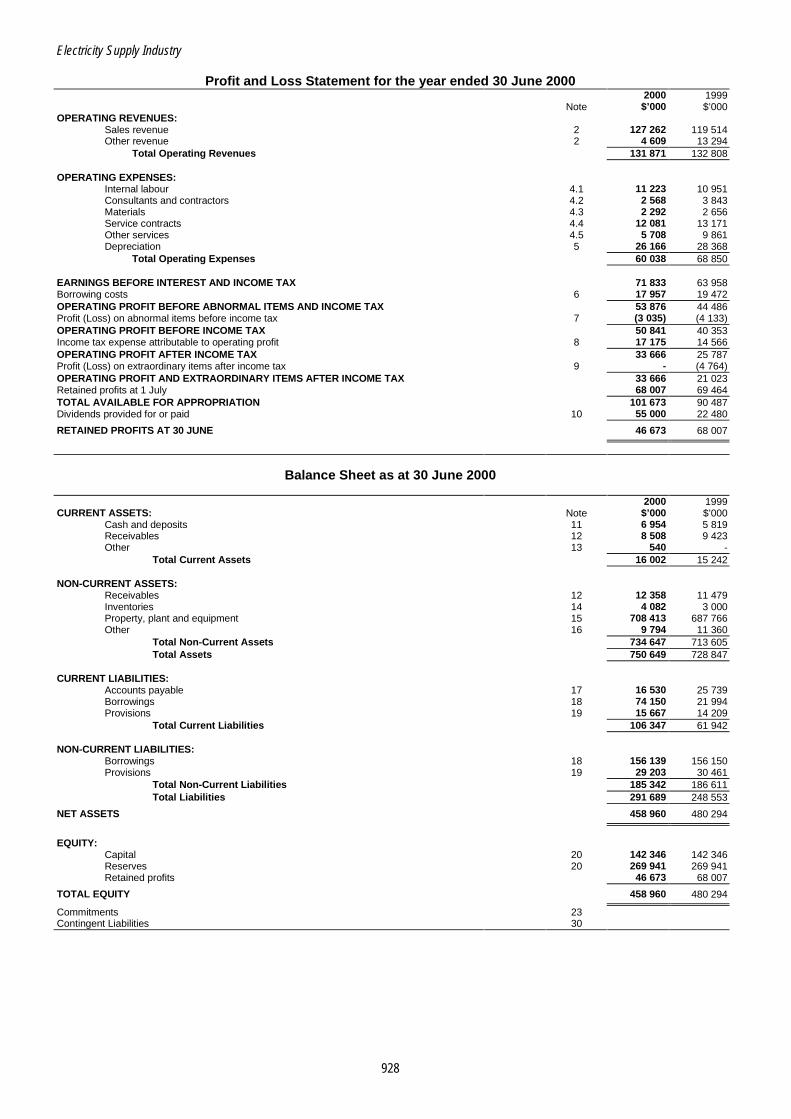
Electricity Supply Industry
928
Profit and Loss Statement for the year ended 30 June 2000 2000 1999 Note $’000 $’000 OPERATING REVENUES:
Sales revenue 2 127 262 119 514 Other revenue 2 4 609 13 294
Total Operating Revenues 131 871 132 808 OPERATING EXPENSES:
Internal labour 4.1 11 223 10 951 Consultants and contractors 4.2 2 568 3 843 Materials 4.3 2 292 2 656 Service contracts 4.4 12 081 13 171 Other services 4.5 5 708 9 861 Depreciation 5 26 166 28 368
Total Operating Expenses 60 038 68 850 EARNINGS BEFORE INTEREST AND INCOME TAX 71 833 63 958 Borrowing costs 6 17 957 19 472 OPERATING PROFIT BEFORE ABNORMAL ITEMS AND INCOME TAX 53 876 44 486 Profit (Loss) on abnormal items before income tax 7 (3 035) (4 133) OPERATING PROFIT BEFORE INCOME TAX 50 841 40 353 Income tax expense attributable to operating profit 8 17 175 14 566 OPERATING PROFIT AFTER INCOME TAX 33 666 25 787 Profit (Loss) on extraordinary items after income tax 9 - (4 764) OPERATING PROFIT AND EXTRAORDINARY ITEMS AFTER INCOME TAX 33 666 21 023 Retained profits at 1 July 68 007 69 464 TOTAL AVAILABLE FOR APPROPRIATION 101 673 90 487 Dividends provided for or paid 10 55 000 22 480
RETAINED PROFITS AT 30 JUNE 46 673 68 007
Balance Sheet as at 30 June 2000 2000 1999 CURRENT ASSETS: Note $’000 $’000
Cash and deposits 11 6 954 5 819 Receivables 12 8 508 9 423 Other 13 540 -
Total Current Assets 16 002 15 242 NON-CURRENT ASSETS:
Receivables 12 12 358 11 479 Inventories 14 4 082 3 000 Property, plant and equipment 15 708 413 687 766 Other 16 9 794 11 360
Total Non-Current Assets 734 647 713 605 Total Assets 750 649 728 847
CURRENT LIABILITIES:
Accounts payable 17 16 530 25 739 Borrowings 18 74 150 21 994 Provisions 19 15 667 14 209
Total Current Liabilities 106 347 61 942 NON-CURRENT LIABILITIES:
Borrowings 18 156 139 156 150 Provisions 19 29 203 30 461
Total Non-Current Liabilities 185 342 186 611 Total Liabilities 291 689 248 553
NET ASSETS 458 960 480 294
EQUITY:
Capital 20 142 346 142 346 Reserves 20 269 941 269 941 Retained profits 46 673 68 007
TOTAL EQUITY 458 960 480 294
Commitments 23 Contingent Liabilities 30

Electricity Supply Industry
929
Statement of Cash Flows for the year ended 30 June 2000 2000 1999 Inflows Inflows (Outflows) (Outflows) CASH FLOWS FROM OPERATING ACTIVITIES: Note $’000 $’000
Receipts from customers 132 393 132 619 Payments to suppliers and employees (50 178) (38 156) Interest received 757 457 Borrowing costs (17 778) (15 187) Income tax paid (13 717) (15 546)
Net Cash provided by Operating Activities 22(a) 51 477 64 187 CASH FLOWS FROM INVESTING ACTIVITIES:
Payments for property, plant and equipment (48 621) (17 987) Net Cash used in Investing Activities (48 621) (17 987)
CASH FLOWS FROM FINANCING ACTIVITIES:
Proceeds from borrowings 65 730 - Repayment of borrowings (14 335) (24 265) Dividends paid (55 000) (22 480)
Net Cash used in Financing Activities (3 605) (46 745) NET INCREASE IN CASH HELD (749) (545) CASH HELD AT 1 JULY (541) 4
CASH HELD AT 30 JUNE 22(b) (1 290) (541)
NOTES TO AND FORMING PART OF THE FINANCIAL STATEMENTS 1. Statement of Significant Accounting Policies
Basis of Accounting This financial report is a general purpose financial report, which has been prepared on an accrual accounting basis. The accounting policies utilised are in accordance with the recognition and measurement aspects of all Statements of Accounting Concepts, applicable Australian Accounting Standards and Urgent Issues Group Consensus Views, and is subject to the Treasurer’s Instructions and Accounting Policy Statements promulgated under the provisions of the Public Finance and Audit Act 1987, as amended. The financial report has been prepared on the basis of historical costs and does not take into account changing money values except where stated. The financial report covers the period from 1 July 1999 to 30 June 2000 and, except where noted, the accounting policies are consistent with the 30 June 1999 accounts. As part of the sale/lease process ETSA Transmission Corporation (trading as ElectraNet SA) changed its name to Transmission Lessor Corporation on 20 January 2000 by way of Ministerial Transfer Order. Revenue Recognition (i) Network Revenue
Network revenue represents revenue earned from the transmission of electricity. Network revenue is recorded when the services are provided.
(ii) Gross Proceeds from Disposal of Assets The gross proceeds of asset sales are included as revenue of ElectraNet SA. The profit or loss on disposal of assets is brought to account at the date an unconditional contract of sale is signed.
(iii) Interest Income Interest income is recognised as it accrues.
(iv) Other Revenue Other operating revenue is brought to account as it is earned and is recognised when the goods and services are provided.
Borrowing costs Borrowing costs are recognised as expenses in the period in which they are incurred, unless they relate to qualifying assets. Qualifying assets are assets that take more than 12 months to get ready for their intended use or sale. Where funds are borrowed generally, borrowing costs are capitalised to qualifying assets using an annual indicative 12 month borrowing rate provided by the South Australian Government Financing Authority. Taxation (i) Income Tax
ElectraNet SA is required to pay to the South Australian Department of Treasury and Finance amounts determined to be equivalent to the amounts that would be payable if it was a tax paying entity and taxed as a company under the Income Tax Assessment Act 1997 of the Commonwealth. The Treasurer of South Australia may make modifications to the application of the Commonwealth tax laws and direct that the equivalent tax liabilities and the nature of the payments to be made may be varied from the requirements that would be imposed by the strict application of the Commonwealth tax laws.

Electricity Supply Industry
930
(i) Income Tax (continued) Tax effect accounting procedures are followed whereby the income tax expense in the profit and loss statement is matched with the accounting profit after allowing for permanent differences. The future tax benefit relating to tax losses is not carried forward as an asset unless the benefit is virtually certain of realisation. Income tax on cumulative timing differences is set aside to the deferred income tax or the future income tax benefit accounts at the rates which are expected to apply when those timing differences reverse.
(ii) Capital Gains Tax Capital gains tax is brought to account in the Profit and Loss Statement in the period in which an asset is sold.
(iii) Ralph Committee The committee engaged by the Federal Treasurer to review Australia’s business taxation system released its report to the public on 21 September 1999. The Government has stated that it will implement a majority of the recommendations made by the committee to reform Australia’s business taxation system. One such measure adopted by the government is the reduction of the company tax rate from 36 percent to 30 percent. This will be implemented in two stages: a reduction to 34 percent from 1 July 2000 (or applicable substituted accounting period), and a reduction to 30 percent from 1 July 2001 (or applicable substituted accounting period). The proposed changes in tax rates have been adopted in the financial statements.
Foreign Currency Translation (i) Transactions
Foreign currency transactions are initially translated into Australian currency at the rate of exchange at the date of the transaction. At year end amounts payable and receivable in foreign currencies are translated to Australian currency at rates of exchange current at that date. Resulting exchange differences are brought to account in determining the profit and loss for the year.
(ii) Specific Commitments Hedging is undertaken in order to avoid or minimise possible adverse financial effects or movements in exchange rates. Gains or costs arising upon entry into a hedging transaction intended to hedge the purchase or sale of goods or services, together with subsequent exchange gains or losses resulting from those transactions are deferred up to the date of the purchase or sale and included in the measurement of the purchase or sale. In the case of hedges of monetary items, exchange gains or losses are brought to account in the financial year in which the exchange rates change. Gains or costs arising at the time of entering into such hedging transactions are brought to account in the Profit and Loss Statement over the lives of the hedges. If the hedging transaction is terminated prior to its maturity date and the hedged transaction is still expected to occur, deferral of any gains and losses that arose prior to termination continues and those gains and losses are included in the measurement of the hedged transaction. In those circumstances where a hedging transaction is terminated prior to maturity because the hedged transaction is no longer expected to occur, and previously deferred gains and losses are recognised in the Profit and Loss Statement on the date of termination.
(iii) General Commitments Exchange gains or losses on other hedge transactions are brought to account in the Profit and Loss Statement in the financial year in which the exchange rates change. Gains or costs arising on entry into hedges of general commitments are brought to account at the time of entry into the hedges and are amortised over the lives of the hedges.
Inventories Inventories are valued at the lower of cost and net realisable value. Costs have been assigned to inventory on a weighted average cost basis. A provision for inventory write-down is raised to cover the estimated value of excess and obsolete inventory. Recoverable Amount of Non-Current Assets The recoverable amount of an asset is the net amount expected to be recoverable through the net cash inflows arising from its continued use and subsequent disposal. Where the carrying amount of a non-current asset is greater than its recoverable amount the asset is revalued to its recoverable amount. Where net cash inflows are derived from a group of assets working together, recoverable amount is determined on the basis of the relevant group of assets. To the extent that a revaluation decrement reverses a revaluation increment previously credited to, and still included in the balance of, the Asset Revaluation Reserve, the decrement is debited directly to that reserve. Otherwise the decrement is recognised as an expense in the Profit and Loss Statement. The expected net cash flows included in determining recoverable amounts of non-current assets are discounted to their present values using a market determined, risk adjusted discount rate, unless this cannot be reliably determined. In such cases the discount rate used is the Australian Commonwealth Government Bond rate of similar maturity.
In accordance with the provisions of the South Australian Department of Treasury and Finance Accounting Policy Statement APS 3 ‘Revaluation of Non-Current Assets’ the recoverable amounts test, prescribed in Australian Accounting Standard AAS 10 ‘Accounting for the Revaluation of Non-Current Assets’ can only be applied to physical non-current assets which are held for their value in use where the responsible Minister has directed in writing that the asset is not to be replaced. Property, Plant and Equipment (i) Acquisition
Items of property, plant and equipment are initially recorded at cost and depreciated as outlined below. The cost of property, plant and equipment constructed by ElectraNet SA includes the cost of materials, direct labour and other associated costs and where appropriate borrowing costs. Maintenance, repair costs and minor items (ie items acquired with a cost less than two thousand dollars) are immediately expensed at the date of purchase.

Electricity Supply Industry
931
Property, Plant and Equipment (continued) (ii) Revaluation
Major classes of physical non-currents assets are revalued at least once every three years to reflect assessments of their deprival value. Deprival value is measured as written down current cost. Revaluation increments are taken to the Asset Revaluation Reserve. As required by the South Australian Department of Treasury and Finance Accounting Policy Statement APS 7 ‘Depreciation of Non-Current Assets’, for assets revalued by reference to a current price for a new asset, separate disclosure is made of the new asset price and the deduction made therefrom to reflect the consumed service potential of the asset. Potential capital gains tax is not taken into account in determining revaluation amounts unless there is an intention to sell the assets concerned.
(iii) Disposal of Revalued Assets
The gain or loss on disposal of revalued assets is calculated as the difference between the carrying amount of the asset at the time of disposal and the proceeds on disposal and is included in the results of the year of disposal.
(iv) Depreciation of Property, Plant and Equipment
The net cost or revalued amount of each item of Property, Plant and Equipment (excluding land and easements over land) is depreciated on a straight line basis over its expected useful life commencing from the time the asset is commissioned. The expected useful lives are as follows: Years
Transmission system - Line 55 Transmission system - Substation 10 - 55 Transmission system - OCS 5 - 10 Transmission system - Telecommunication 15 - 55 Plant, tools and office equipment 5 - 10 Buildings 30
Depreciation rates for classes of assets are reviewed annually and, if necessary, adjusted so that they reflect the most recent assessments of useful life. Where asset lives are revised the written down value of the asset is depreciated over its revised remaining life.
Leases Payments made under operating leases are charged as an expense in the periods in which they are incurred.
Trade and Other Creditors These amounts represent liabilities for goods and services provided to ElectraNet SA prior to the end of the financial year and which are unpaid. The amounts are unsecured and are usually paid within 30 days of recognition.
Year 2000 Modification Costs Costs relating to the modification of computer software and devices utilising microprocessors for Year 2000 compatibility are charged as expenses when incurred.
Borrowings Borrowings are recognised when issued at the amount of the net proceeds received. Interest is recognised as an expense on an effective yield basis. Interest is accrued over the period it becomes due and is recorded as part of interest payable.
Forward Foreign Exchange Contracts The accounting for forward foreign exchange contracts is in accordance with the accounting policy note on foreign currency translation.
Employee Entitlements (i) Annual Leave
A liability for annual leave is recognised and measured as the amount unpaid at year-end at current pay rates including all on-costs in respect of employees’ services up to that date.
(ii) Long Service Leave
A liability for long service leave is recognised, and is measured as the present value of expected future payments to be made in respect of services provided by employees up to year end. Consideration is given to expected future wage and salary levels, experience of employee departures and periods of service. Expected future payments, including all on-costs, are discounted using interest rates on Australian Commonwealth Government Bond Rate with terms to maturity that match, as closely as possible, the estimated future cash outflows.
Employee Retirement Benefits A liability in respect of the unfunded employer share of employee retirement benefits is recognised, and is measured as the present value of the estimated employer financed share of the benefits. The estimation process uses benefits based on salaries and contribution accumulations projected ahead, coupled with various assumptions about the frequency of benefit payments and the extent to which options, such as commutation of pensions are exercised. Pension payments, where applicable, are projected ahead using assumed rates of pension increases and mortality. The projected future payments are then discounted to present value at a discount rate that reflects assumed future investment earnings rates.
Loans Loans are recognised when issued at the amount of the net proceeds received. Interest is recognised as an expense as it accrues. Interest is accrued over the period it becomes due and is recorded as part of interest payable.
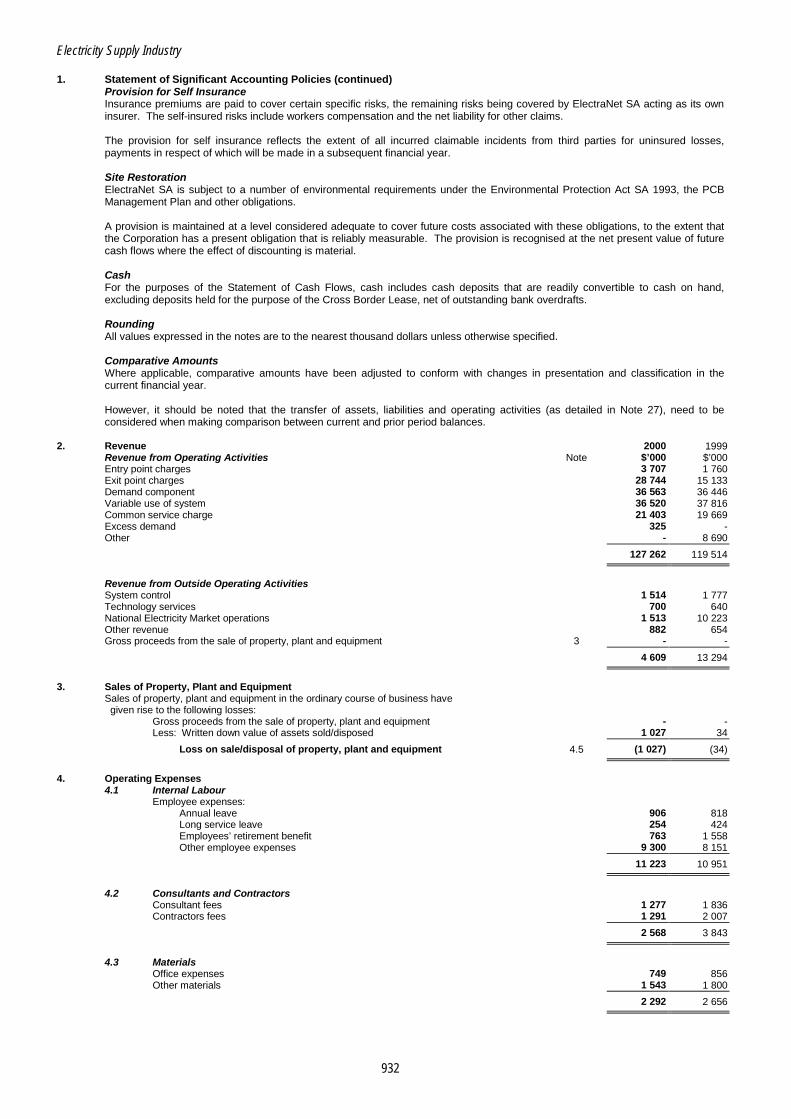
Electricity Supply Industry
932
1. Statement of Significant Accounting Policies (continued) Provision for Self Insurance Insurance premiums are paid to cover certain specific risks, the remaining risks being covered by ElectraNet SA acting as its own insurer. The self-insured risks include workers compensation and the net liability for other claims.
The provision for self insurance reflects the extent of all incurred claimable incidents from third parties for uninsured losses, payments in respect of which will be made in a subsequent financial year.
Site Restoration ElectraNet SA is subject to a number of environmental requirements under the Environmental Protection Act SA 1993, the PCB Management Plan and other obligations.
A provision is maintained at a level considered adequate to cover future costs associated with these obligations, to the extent that the Corporation has a present obligation that is reliably measurable. The provision is recognised at the net present value of future cash flows where the effect of discounting is material.
Cash For the purposes of the Statement of Cash Flows, cash includes cash deposits that are readily convertible to cash on hand, excluding deposits held for the purpose of the Cross Border Lease, net of outstanding bank overdrafts.
Rounding All values expressed in the notes are to the nearest thousand dollars unless otherwise specified.
Comparative Amounts Where applicable, comparative amounts have been adjusted to conform with changes in presentation and classification in the current financial year.
However, it should be noted that the transfer of assets, liabilities and operating activities (as detailed in Note 27), need to be considered when making comparison between current and prior period balances.
2. Revenue 2000 1999
Revenue from Operating Activities Note $’000 $’000 Entry point charges 3 707 1 760 Exit point charges 28 744 15 133 Demand component 36 563 36 446 Variable use of system 36 520 37 816 Common service charge 21 403 19 669 Excess demand 325 - Other - 8 690
127 262 119 514
Revenue from Outside Operating Activities System control 1 514 1 777 Technology services 700 640 National Electricity Market operations 1 513 10 223 Other revenue 882 654 Gross proceeds from the sale of property, plant and equipment 3 - -
4 609 13 294
3. Sales of Property, Plant and Equipment
Sales of property, plant and equipment in the ordinary course of business have given rise to the following losses:
Gross proceeds from the sale of property, plant and equipment - - Less: Written down value of assets sold/disposed 1 027 34
Loss on sale/disposal of property, plant and equipment 4.5 (1 027) (34)
4. Operating Expenses
4.1 Internal Labour Employee expenses:
Annual leave 906 818 Long service leave 254 424 Employees’ retirement benefit 763 1 558 Other employee expenses 9 300 8 151
11 223 10 951
4.2 Consultants and Contractors
Consultant fees 1 277 1 836 Contractors fees 1 291 2 007
2 568 3 843
4.3 Materials
Office expenses 749 856 Other materials 1 543 1 800
2 292 2 656
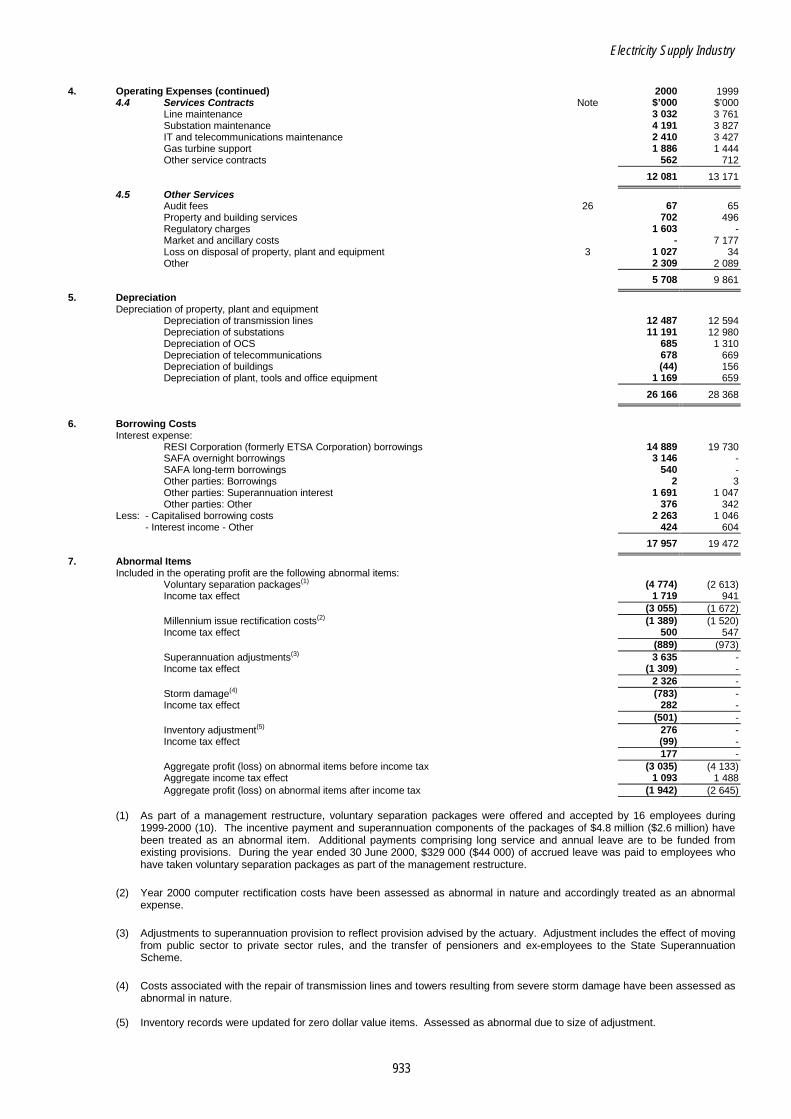
Electricity Supply Industry
933
4. Operating Expenses (continued) 2000 1999
4.4 Services Contracts Note $’000 $’000 Line maintenance 3 032 3 761 Substation maintenance 4 191 3 827 IT and telecommunications maintenance 2 410 3 427 Gas turbine support 1 886 1 444 Other service contracts 562 712
12 081 13 171
4.5 Other Services Audit fees 26 67 65 Property and building services 702 496 Regulatory charges 1 603 - Market and ancillary costs - 7 177 Loss on disposal of property, plant and equipment 3 1 027 34 Other 2 309 2 089
5 708 9 861
5. Depreciation Depreciation of property, plant and equipment
Depreciation of transmission lines 12 487 12 594 Depreciation of substations 11 191 12 980 Depreciation of OCS 685 1 310 Depreciation of telecommunications 678 669 Depreciation of buildings (44) 156 Depreciation of plant, tools and office equipment 1 169 659
26 166 28 368
6. Borrowing Costs
Interest expense: RESI Corporation (formerly ETSA Corporation) borrowings 14 889 19 730 SAFA overnight borrowings 3 146 - SAFA long-term borrowings 540 - Other parties: Borrowings 2 3 Other parties: Superannuation interest 1 691 1 047 Other parties: Other 376 342
Less: - Capitalised borrowing costs 2 263 1 046 - Interest income - Other 424 604
17 957 19 472
7. Abnormal Items Included in the operating profit are the following abnormal items:
Voluntary separation packages(1) (4 774) (2 613) Income tax effect 1 719 941
(3 055) (1 672) Millennium issue rectification costs(2) (1 389) (1 520) Income tax effect 500 547
(889) (973) Superannuation adjustments(3) 3 635 - Income tax effect (1 309) - 2 326 - Storm damage(4) (783) - Income tax effect 282 -
(501) - Inventory adjustment(5) 276 - Income tax effect (99) -
177 - Aggregate profit (loss) on abnormal items before income tax (3 035) (4 133) Aggregate income tax effect 1 093 1 488 Aggregate profit (loss) on abnormal items after income tax (1 942) (2 645)
(1) As part of a management restructure, voluntary separation packages were offered and accepted by 16 employees during
1999-2000 (10). The incentive payment and superannuation components of the packages of $4.8 million ($2.6 million) have been treated as an abnormal item. Additional payments comprising long service and annual leave are to be funded from existing provisions. During the year ended 30 June 2000, $329 000 ($44 000) of accrued leave was paid to employees who have taken voluntary separation packages as part of the management restructure.
(2) Year 2000 computer rectification costs have been assessed as abnormal in nature and accordingly treated as an abnormal expense.
(3) Adjustments to superannuation provision to reflect provision advised by the actuary. Adjustment includes the effect of moving from public sector to private sector rules, and the transfer of pensioners and ex-employees to the State Superannuation Scheme.
(4) Costs associated with the repair of transmission lines and towers resulting from severe storm damage have been assessed as abnormal in nature.
(5) Inventory records were updated for zero dollar value items. Assessed as abnormal due to size of adjustment.
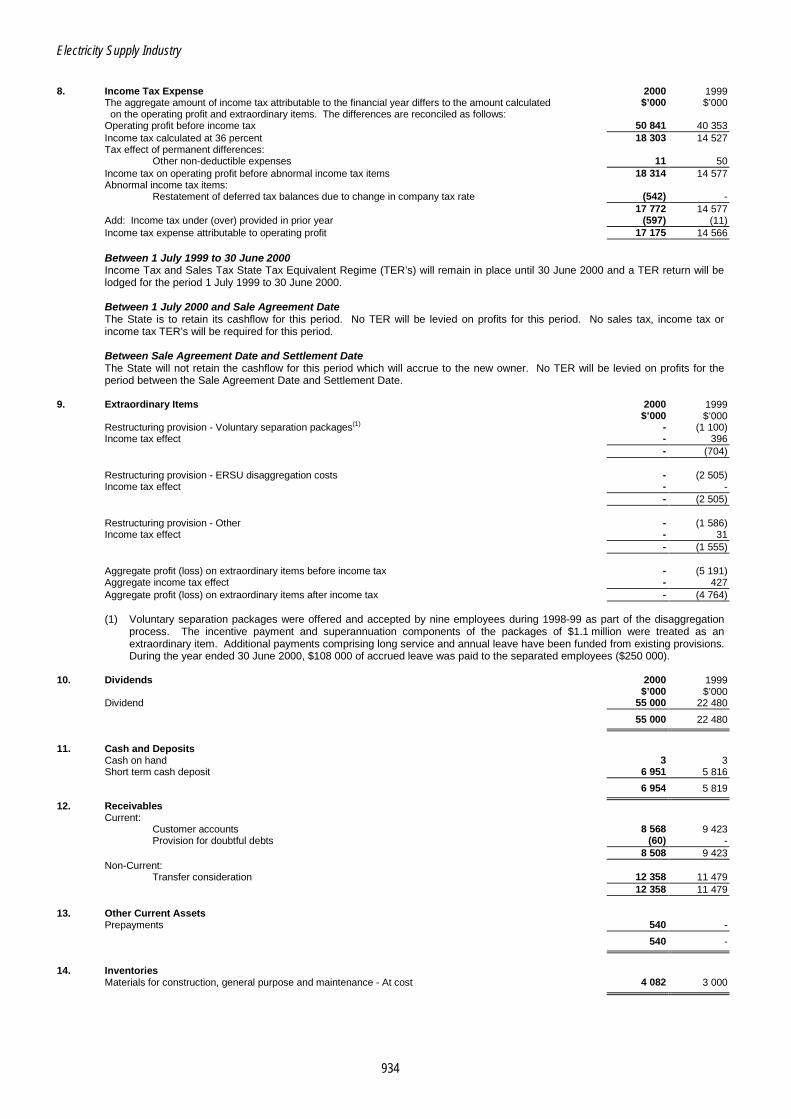
Electricity Supply Industry
934
8. Income Tax Expense 2000 1999
The aggregate amount of income tax attributable to the financial year differs to the amount calculated $’000 $’000 on the operating profit and extraordinary items. The differences are reconciled as follows: Operating profit before income tax 50 841 40 353 Income tax calculated at 36 percent 18 303 14 527 Tax effect of permanent differences:
Other non-deductible expenses 11 50 Income tax on operating profit before abnormal income tax items 18 314 14 577 Abnormal income tax items:
Restatement of deferred tax balances due to change in company tax rate (542) - 17 772 14 577 Add: Income tax under (over) provided in prior year (597) (11) Income tax expense attributable to operating profit 17 175 14 566
Between 1 July 1999 to 30 June 2000 Income Tax and Sales Tax State Tax Equivalent Regime (TER’s) will remain in place until 30 June 2000 and a TER return will be lodged for the period 1 July 1999 to 30 June 2000. Between 1 July 2000 and Sale Agreement Date The State is to retain its cashflow for this period. No TER will be levied on profits for this period. No sales tax, income tax or income tax TER’s will be required for this period. Between Sale Agreement Date and Settlement Date The State will not retain the cashflow for this period which will accrue to the new owner. No TER will be levied on profits for the period between the Sale Agreement Date and Settlement Date.
9. Extraordinary Items 2000 1999 $’000 $’000
Restructuring provision - Voluntary separation packages(1) - (1 100) Income tax effect - 396
- (704)
Restructuring provision - ERSU disaggregation costs - (2 505) Income tax effect - -
- (2 505)
Restructuring provision - Other - (1 586) Income tax effect - 31
- (1 555)
Aggregate profit (loss) on extraordinary items before income tax - (5 191) Aggregate income tax effect - 427 Aggregate profit (loss) on extraordinary items after income tax - (4 764)
(1) Voluntary separation packages were offered and accepted by nine employees during 1998-99 as part of the disaggregation
process. The incentive payment and superannuation components of the packages of $1.1 million were treated as an extraordinary item. Additional payments comprising long service and annual leave have been funded from existing provisions. During the year ended 30 June 2000, $108 000 of accrued leave was paid to the separated employees ($250 000).
10. Dividends 2000 1999 $’000 $’000
Dividend 55 000 22 480
55 000 22 480
11. Cash and Deposits
Cash on hand 3 3 Short term cash deposit 6 951 5 816
6 954 5 819
12. Receivables Current:
Customer accounts 8 568 9 423 Provision for doubtful debts (60) -
8 508 9 423 Non-Current:
Transfer consideration 12 358 11 479 12 358 11 479 13. Other Current Assets
Prepayments 540 -
540 -
14. Inventories
Materials for construction, general purpose and maintenance - At cost 4 082 3 000

Electricity Supply Industry
935
15. Property, Plant and Equipment Cost or Accumulated Written Down Valuation Depreciation Value 2000 1999 2000 1999 2000 1999
Transmission system - Lines: $’000 $’000 $’000 $’000 $’000 $’000 At independent valuation 1 July 1998(1) 660 304 661 000 307 660 295 584 352 644 365 416 At cost 16 787 661 85 10 16 702 651
677 091 661 661 307 745 295 594 369 346 366 067 Transmission system - Substations:
At independent valuation 1 July 1998(1)(2) 526 931 515 931 288 218 267 470 238 713 248 461 At cost 66 593 28 118 1 900 476 64 693 27 642
593 524 544 049 290 118 267 946 303 406 276 103 Transmission system - OCS:
At independent valuation 1 July 1998(1) 7 000 6 891 1 947 1 255 5 053 5 636 At cost 554 396 48 56 506 340
7 554 7 287 1 995 1 311 5 559 5 976 Transmission system - Telecommunications:
At independent valuation 1 July 1998(1) 8 000 10 000 3 111 4 554 4 889 5 446 At cost 2 291 1 787 234 114 2 057 1 673
10 291 11 787 3 345 4 668 6 946 7 119 Total Transmission System:
At independent valuation 1 July 1998(1) 1 202 235 1 193 822 600 936 568 863 601 299 624 959 At cost 86 225 30 962 2 267 656 83 958 30 306
1 288 460 1 224 784 603 203 569 519 685 257 655 265 Land and Buildings:
Easements 3 075 3 075 - - 3 075 3 075 Land 2 694 2 690 - - 2 694 2 690 Buildings 1 819 1 999 121 330 1 698 1 669
7 588 7 764 121 330 7 467 7 434 Other Property, Plant and Equipment:
Plant and tools 2 160 2 254 1 130 991 1 030 1 263 IT assets 4 841 2 853 1 869 1 136 2 972 1 717 Furniture and fittings 522 190 132 85 390 105 Office equipment 348 371 240 188 108 183
7 871 5 668 3 371 2 400 4 500 3 268 Capital Work in Progress - At cost:
Transmission system 5 251 15 738 - - 5 251 15 738 Other 5 938 6 061 - - 5 938 6 061
Total 1 315 108 1 260 015 606 695 572 249 708 413 687 766
(1) The independent valuation performed at 1 July 1998 was made in accordance with a policy of regular revaluations and was on
the basis of deprival value. Further details of the policy and basis of revaluations can be found in Note 1 to the financial statements. As required by APS 7 ‘Depreciation of Non-Current Assets’, separate disclosure is made of the current replacement price of a new asset (under the heading ‘Cost or Valuation’) and the consumed service potential of the existing asset (under the heading ‘Accumulated Depreciation’). The independent valuation was performed by Sinclair Knight Merz Pty Ltd (SKM).
(2) The increase in cost and accumulated depreciation arose due to the finalisation of the independent Asset Valuation report by SKM, which occurred after the 30 June 1999 financial statements were completed.
16. Other Non-Current Assets 2000 1999 $’000 $’000
Further income tax benefit (FITB) 9 794 11 360 9 794 11 360
Future income tax benefit balances have been carried forward on the assumption that they will be realised. The privatisation process creates some uncertainty over the realisation of the FITBs. However it is expected that the privatisation structure will enable the FITBs to be realised. The FITB is comprised of:
2000 1999 $’000 $’000
Annual leave 397 440 Long service leave 947 1 169 Superannuation 5 555 6 957 Interest payable 2 062 1 760 Disaggregation and restructure 546 442 Site restoration 70 74 Doubtful debts 20 - Other 197 518
9 794 11 360
17. Accounts Payable Trade creditors 10 466 20 851 Interest payable 6 064 4 888
16 530 25 739
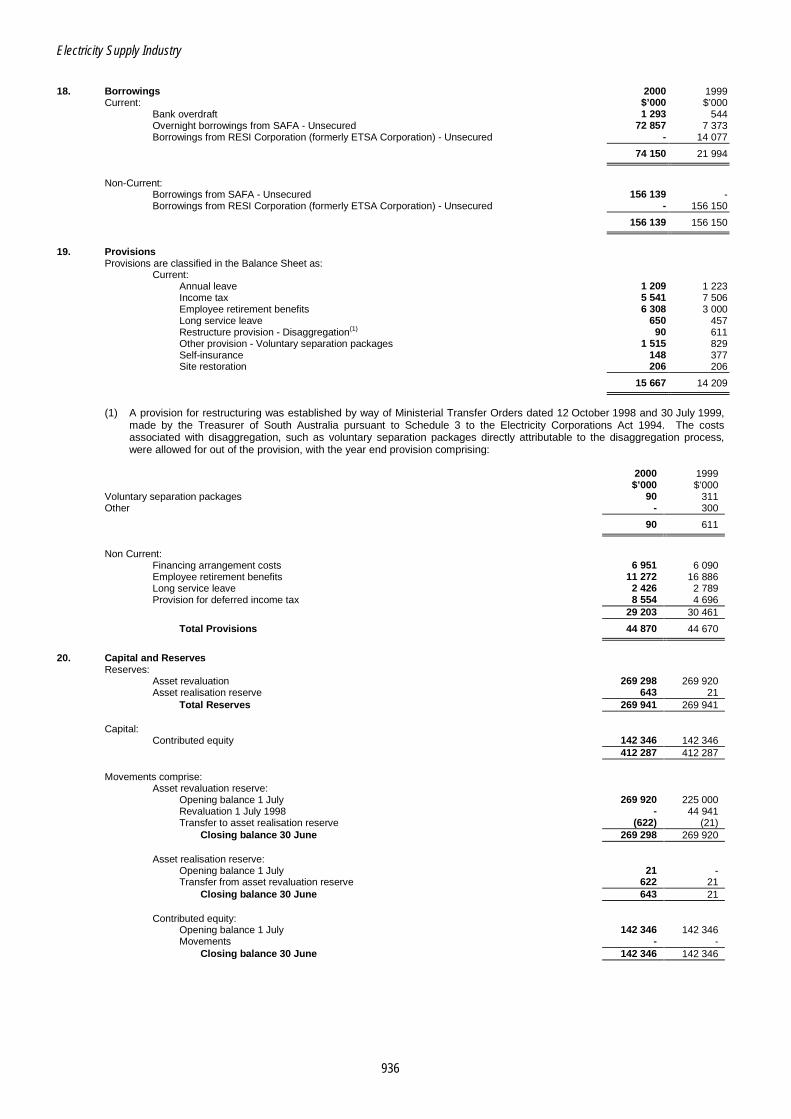
Electricity Supply Industry
936
18. Borrowings 2000 1999
Current: $’000 $’000 Bank overdraft 1 293 544 Overnight borrowings from SAFA - Unsecured 72 857 7 373 Borrowings from RESI Corporation (formerly ETSA Corporation) - Unsecured - 14 077
74 150 21 994
Non-Current:
Borrowings from SAFA - Unsecured 156 139 - Borrowings from RESI Corporation (formerly ETSA Corporation) - Unsecured - 156 150
156 139 156 150
19. Provisions
Provisions are classified in the Balance Sheet as: Current:
Annual leave 1 209 1 223 Income tax 5 541 7 506 Employee retirement benefits 6 308 3 000 Long service leave 650 457 Restructure provision - Disaggregation(1) 90 611 Other provision - Voluntary separation packages 1 515 829 Self-insurance 148 377 Site restoration 206 206
15 667 14 209
(1) A provision for restructuring was established by way of Ministerial Transfer Orders dated 12 October 1998 and 30 July 1999,
made by the Treasurer of South Australia pursuant to Schedule 3 to the Electricity Corporations Act 1994. The costs associated with disaggregation, such as voluntary separation packages directly attributable to the disaggregation process, were allowed for out of the provision, with the year end provision comprising:
2000 1999 $’000 $’000
Voluntary separation packages 90 311 Other - 300
90 611
Non Current:
Financing arrangement costs 6 951 6 090 Employee retirement benefits 11 272 16 886 Long service leave 2 426 2 789 Provision for deferred income tax 8 554 4 696
29 203 30 461
Total Provisions 44 870 44 670
20. Capital and Reserves
Reserves: Asset revaluation 269 298 269 920 Asset realisation reserve 643 21
Total Reserves 269 941 269 941
Capital: Contributed equity 142 346 142 346
412 287 412 287
Movements comprise: Asset revaluation reserve:
Opening balance 1 July 269 920 225 000 Revaluation 1 July 1998 - 44 941 Transfer to asset realisation reserve (622) (21)
Closing balance 30 June 269 298 269 920
Asset realisation reserve: Opening balance 1 July 21 - Transfer from asset revaluation reserve 622 21
Closing balance 30 June 643 21
Contributed equity: Opening balance 1 July 142 346 142 346 Movements - -
Closing balance 30 June 142 346 142 346

Electricity Supply Industry
937
21. Financial Instruments (a) Off-Balance Sheet Derivative Financial Instruments
ElectraNet SA has not entered into any derivative financial instruments in its own right. However, ElectraNet SA’s portion of the debt portfolio inherited from RESI Corporation (formerly ETSA Corporation) included exposure to interest rate swaps. The South Australian Government Financing Authority (SAFA) was under Treasurer’s Directions to manage these interest rate swaps on behalf of ElectraNet SA up to 22 May 2000, when the loan portfolio was consolidated into a single loan with no derivatives.
(b) Credit Risk Credit risk represents the loss that would be recognised if counterparties failed to perform as contracted. The credit risk on financial assets of ElectraNet SA which have been recognised on the Balance Sheet is as indicated by the carrying amount, net of any provisions of doubtful debts.
(c) Financing Facilities 2000 1999
ElectraNet SA has access to the following lines of credit: $’000 $’000 Total facilities available:
Bank overdrafts 1 500 1 500 RESI Corporation (formerly ETSA Corporation) - 170 227 SAFA - long term debt 156 139 - SAFA - overnight facility 86 065 50 469
243 704 222 196 Facilities utilised at balance date:
Bank overdrafts 1 293 544 RESI Corporation (formerly ETSA Corporation) - 170 227 SAFA - long term debt 156 139 - SAFA - overnight facility 72 857 7 373 230 289 178 144
Facilities not utilised at balance date: Bank overdrafts 207 956 RESI Corporation (formerly ETSA Corporation) - - SAFA - long term debt - - SAFA - overnight facility 13 208 43 096 13 415 44 052
Bank Overdrafts Interest on bank overdrafts is charged at prevailing market rates. The weighted average interest rate for overdrafts as at 30 June 2000 is 8.07 percent (7.95 percent). RESI Corporation (formerly ETSA Corporation) ElectraNet SA inherited a share of the RESI Corporation debt portfolio upon disaggregation of the RESI Corporation entities by way of a loan facility from RESI Corporation that mirrored 23 percent of RESI Corporation’s debt to third parties. This loan facility was transferred by way of Transfer Order to the SA Government Financing Authority on 7 April 2000. SA Government Financing Authority (SAFA) - Consolidated Borrowing On 7 April 2000, ElectraNet SA’s borrowings from ETSA Corporation were transferred to the SA Government Financing Authority by way of Transfer Order. The total debt was consolidated into a single loan from 22 May 2000. The SA Government Financing Authority is under Treasurer’s Directions to manage this debt portfolio on behalf of ElectraNet SA. No new funding is available under this facility. SAFA - Overnight Borrowings In accordance with the Ministerial Transfer Order dated 12 October 1998 and as amended on 30 July 1999, ElectraNet SA has access to borrowings under a short term credit facility with SAFA. From 20 June 2000, the facility limit was increased by Ministerial approval from $40 million to $55 million, plus amounts required to repay the SAFA consolidated borrowing. Drawdowns from this facility as at 30 June 2000 represent short term borrowings. The weighted average interest rate for overnight borrowings as at 30 June 2000 is 6.00 percent (5.43 percent).
(d) Interest Rate Risk Exposures
ElectraNet SA’s exposure to interest rate risk and the effective weighted average interest rate for each class of financial assets and financial liabilities is set out below.
2000 Weighted Floating Fixed Interest Maturing In Non- Average Interest 1 year 1 to 5 over Interest Interest Rate or less years 5 years Bearing Total Rate
Financial Assets: $’000 $’000 $’000 $’000 $’000 $’000 Percent Cash on hand - - - - 3 3 - Other receivables - - - - 20 866 20 866 - Cash deposits - 6 951 - - - 6 951 5.60
- 6 951 - - 20 869 27 820 Financial Liabilities:
Trade creditors - - - - 10 466 10 466 - Interest payable - - - - 6 064 6 064 - Bank overdraft 1 293 - - - - 1 293 8.07 Overnight facility - SAFA 72 857 - - - - 72 857 6.00 Borrowings - SAFA - - - 156 139 - 156 139 10.04
74 150 - - 156 139 16 530 246 819 Net Financial Assets (Liabilities) (74 150) 6 951 - (156 139) 4 339 (218 999)

Electricity Supply Industry
938
(d) Interest Rate Risk Exposures (continued) 1999 Weighted Floating Fixed Interest Maturing In Non- Average Interest 1 year 1 to 5 over Interest Interest Rate or less years 5 years Bearing Total Rate
Financial Assets: $’000 $’000 $’000 $’000 $’000 $’000 Percent Cash on hand - - - - 3 3 - Other receivables - - - - 20 902 20 902 - Cash deposits - 5 816 - - - 5 816 5.45
- 5 816 - - 20 905 26 721 Financial Liabilities:
Trade creditors - - - - 20 851 20 851 - Interest payable - - - - 4 888 4 888 - Bank overdraft 544 - - - - 544 7.95 Overnight facility - SAFA 7 373 - - - - 7 373 5.43 Borrowings - RESI 53 904 11 777 78 369 26 177 - 170 227 7.82 Interest rate swap - RESI (136 574) (4 600) 42 274 98 900 - - 2.23
(74 753) 7 177 120 643 125 077 25 739 203 883 Net Financial Assets (Liabilities) 74 753 (1 361) (120 643) (125 077) (4 834) (177 162)
Reconciliation of Net Financial Assets to Net Assets 2000 1999
$’000 $’000 Net financial assets (liabilities) as above (218 999) (177 162) Non-financial assets and liabilities:
Inventories 4 082 3 000 Other assets 10 334 11 360 Property, plant and equipment 708 413 687 766 Provisions (44 870) (44 670)
Net Assets per Balance Sheet 458 960 480 294
(e) Net Fair Value of Financial Assets and Liabilities 2000 2000
The carrying amounts and net fair values of financial assets and liabilities at Carrying Net Fair 30 June 2000 are as follows: Amount Value On-Balance Sheet: $’000 $’000
Financial Assets: Cash on hand 3 3 Other receivables 20 866 20 866 Cash deposits 6 951 6 951
27 820 27 820 Financial Liabilities:
Trade creditors 10 466 10 466 Interest payable 6 064 6 064 Bank overdraft 1 293 1 293 Overnight facility - SAFA 72 857 72 857 Borrowings - SAFA 156 139 180 361
246 819 271 041 Off-Balance Sheet Financial Liability:
Interest rate swaps - -
The following methods and assumptions were used to estimate the net fair value of each class of financial instrument. On-Balance Sheet The net fair value of cash and cash equivalents and non-interest bearing monetary financial assets and financial liabilities approximates their carrying value. The net fair value of other monetary financial assets and financial liabilities is based upon market prices, and has been provided by the South Australian Government Financing Authority. Off-Balance Sheet The net fair values of interest rate swap agreements has been determined as the difference in the net present values of the future cash flows, and has been provided by the South Australian Government Financing Authority.

Electricity Supply Industry
939
22. Notes to the Statement of Cash Flows 2000 1999
(a) Reconciliation of Operating Profit and Extraordinary Items after Income Tax Note $’000 $’000 to Net Cash provided by Operating Activities Operating profit and extraordinary items after income tax 33 666 21 023 Add (Less): Non-cash items in operating profit:
Depreciation 26 166 28 369 Losses on disposal of property, plant and equipment 1 027 34
Add (Less): Changes in assets and liabilities net of effects from net non-cash assets transferred from RESI Corporation (formerly ETSA Corporation):
Increase in cash deposits (1 135) (23) Increase in prepayments (540) - Decrease (Increase) in receivables 522 (189) Increase in inventories (806) (170) Decrease (Increase) in future income tax benefit 1 565 (1 027) Increase in doubtful debts provision 60 - (Decrease) Increase in trade creditors (9 242) 8 182 Increase in accrued interest payable 1 176 4 888 Increase in employee entitlement provisions - Interest accrual 1 691 1 047 (Decrease) Increase in employee entitlement provisions (4 404) 2 301 (Decrease) Increase in provisions other (521) 666 Increase (Decrease) in provision for financing arrangement costs 861 (127) Decrease in provision for income tax (1 965) (5 007) Increase in deferred income tax 3 859 4 626 Abnormal superannuation adjustment (226) - Abnormal inventory adjustment (277) - Tax effect on extraordinary items - (427) Asset realisation transfer - 21
Net Cash provided by Operating Activities 51 477 64 187
(b) Reconciliation of Cash
Cash and cash equivalents comprise: Cash on hand 3 3 Bank overdraft (1 293) (544)
(1 290) (541)
(c) Non-Cash Financing and Investing Activities
Net non-cash assets transferred from RESI Corporation 27 - 44 941
23. Commitments for Expenditure
(a) Operating Lease Commitments Total lease expenditure contracted for at year end but not provided for in the accounts payable:
No later than one year 3 161 202 Later than one year and not later than two years 3 503 131 Later than two years and not later than five years 5 811 106 Later than five years 418 -
Total Operating Lease Commitments 12 893 439
ElectraNet SA is committed to expenditure on rental properties under lease and gas turbine charges under contract. The expenditure is accounted for as incurred. Payments made under the gas turbine contract comprise a base amount plus movements in the Consumer Price Index.
(b) Capital Commitments
The capital expenditure contracted for at year end but not provided for in the accounts payable:
No later than one year 7 773 13 066 Later than one year and not later than two years - - Later than two years and not later than five years - - Later than five years - -
Total Capital Commitments 7 773 13 066
24. Remuneration of Directors 2000 1999
Income paid or payable, or otherwise made available, to Directors of ElectraNet SA from $ $ ElectraNet SA or any related parties. 373 104 295 013
2000 1999 Number of Number of
Number of Directors of ElectraNet SA whose total income falls within the following bands: Directors Directors $20 000 - $29 999 - 2 $30 000 - $39 999 2 - $60 000 - $69 999 - 1 $80 000 - $89 999 1 - $180 000 - $189 999 - 1 $230 000 - $239 999 1 -
Directors’ income does not include insurance premiums paid by ElectraNet SA or related parties in respect of directors and officers liability insurance contracts, as the insurance policies do not specify premiums paid in respect of individual Directors.

Electricity Supply Industry
940
25. Remuneration of Employees 2000 1999
The aggregate remuneration received or receivable from ElectraNet SA or related parties by $ $ employees, including those on contract, whose total income exceeds $100 000. 3 997 633 2 651 027
2000 1999
Number of employees whose total remuneration received or due and receivable from Number of Number of ElectraNet SA or related parties in relation to the financial year falls within the following bands: Employees Employees
$100 000 - $109 999 4 - $110 000 - $119 999 2 *2 $120 000 - $129 999 1 3 $130 000 - $139 999 *6 2 $140 000 - $149 999 1 1 $150 000 - $159 999 2 *2 $160 000 - $169 999 *1 - $170 000 - $179 999 *1 - $180 000 - $189 999 *1 1 $210 000 - $219 999 *2 - $220 000 - $229 999 *1 *2 $230 000 - $239 999 1 - $250 000 - $259 999 *1 - $260 000 - $269 999 *1 - $320 000 - $329 999 - *1 $370 000 - $379 999 - *1
Employees’ income does not include insurance premiums paid by ElectraNet SA or related parties in respect of directors and officers liability insurance contracts, as the insurance policies do not specify premiums paid in respect of individual employees. * The above remuneration details include payment of separation packages plus payouts of accrued annual leave and long service
leave entitlements to eleven employees who retired during the year (6). 26. Auditors’ Remuneration 2000 1999
Amounts received or due and receivable by the auditors for: $’000 $’000 Auditing the accounts 67 65
67 65
27. Assets and Liabilities Transferred
On 1 July 1998 the operating activities and related assets and liabilities associated with the transmission of electricity were transferred from RESI Corporation (formerly ETSA Corporation) and its controlled entities to ElectraNet SA by way of Ministerial Transfer Order, dated 12 October 1998, made by the Treasurer of South Australia pursuant to Schedule 3 to the Electricity Corporations Act 1994, and an amendment order dated 30 July 1999. Some adjustments were processed during the current financial year to reflect the finalisation of the Transfer Order requirements. The assets and liabilities transferred are detailed below:
From RESI Corporation and Its Controlled Entities 1999 Movements 2000
Assets: $’000 $’000 $’000 Receivables - TUOS 9 905 - 9 905 Receivables(1) 11 479 879 12 358 Property, plant and equipment 13 664 (879) 12 785 Other 7 665 - 7 665
Total Assets 42 713 - 42 713
Liabilities: Employee provisions 21 007 - 21 007 Other provisions 536 - 536 Borrowings 21 170 - 21 170
Total Liabilities 42 713 - 42 713
Net Assets - - -
(1) The consideration receivable by ElectraNet SA for the net assets transferred from RESI Corporation and its controlled entities
is in the form of a non-trade receivable. The receivable is reflected in the Balance Sheet as a non-current receivable. The movement in the balances of receivables and property, plant and equipment reflects adjustments processed during the year ended 30 June 2000.
28. Superannuation Commitments
Electricity Industry Superannuation Scheme This scheme comprises four major sub-schemes: the Lump Sum Scheme, the Pension Scheme, the RG Scheme and the Accumulation Scheme. The first three of these sub-schemes are closed to new members. Prior to 1 December 1999, the Electricity Industry Superannuation Scheme was called the ‘ETSA Contributory Superannuation Scheme’, and it included three sub-schemes, viz the Lump Sum Scheme, the Pension Scheme and the RG Scheme. The fourth sub-scheme, the Accumulation Scheme, was, prior to 1 December 1999, known as the ‘ETSA Non-Contributory Superannuation Scheme’. Employees contribute at varying percentages of gross income. Retirement benefits under the Lump Sum Scheme comprise member contributions plus interest and employer provided defined benefit components.
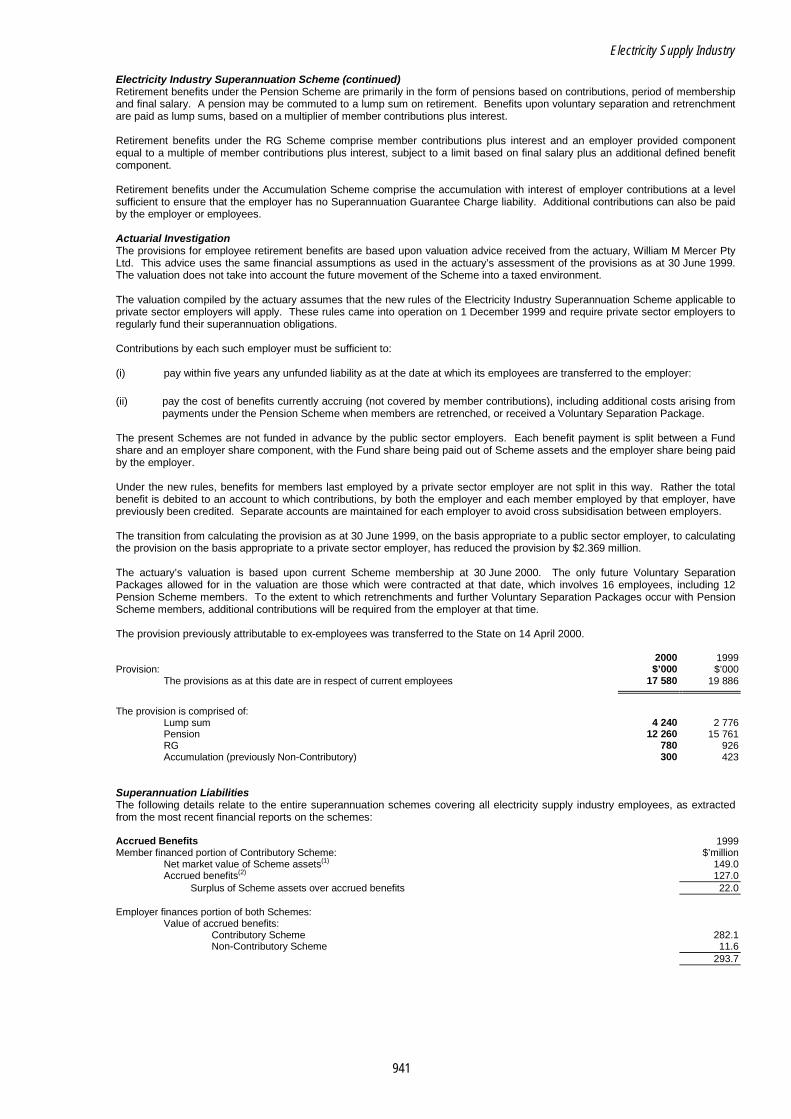
Electricity Supply Industry
941
Electricity Industry Superannuation Scheme (continued) Retirement benefits under the Pension Scheme are primarily in the form of pensions based on contributions, period of membership and final salary. A pension may be commuted to a lump sum on retirement. Benefits upon voluntary separation and retrenchment are paid as lump sums, based on a multiplier of member contributions plus interest. Retirement benefits under the RG Scheme comprise member contributions plus interest and an employer provided component equal to a multiple of member contributions plus interest, subject to a limit based on final salary plus an additional defined benefit component. Retirement benefits under the Accumulation Scheme comprise the accumulation with interest of employer contributions at a level sufficient to ensure that the employer has no Superannuation Guarantee Charge liability. Additional contributions can also be paid by the employer or employees. Actuarial Investigation The provisions for employee retirement benefits are based upon valuation advice received from the actuary, William M Mercer Pty Ltd. This advice uses the same financial assumptions as used in the actuary’s assessment of the provisions as at 30 June 1999. The valuation does not take into account the future movement of the Scheme into a taxed environment. The valuation compiled by the actuary assumes that the new rules of the Electricity Industry Superannuation Scheme applicable to private sector employers will apply. These rules came into operation on 1 December 1999 and require private sector employers to regularly fund their superannuation obligations. Contributions by each such employer must be sufficient to: (i) pay within five years any unfunded liability as at the date at which its employees are transferred to the employer:
(ii) pay the cost of benefits currently accruing (not covered by member contributions), including additional costs arising from payments under the Pension Scheme when members are retrenched, or received a Voluntary Separation Package.
The present Schemes are not funded in advance by the public sector employers. Each benefit payment is split between a Fund share and an employer share component, with the Fund share being paid out of Scheme assets and the employer share being paid by the employer. Under the new rules, benefits for members last employed by a private sector employer are not split in this way. Rather the total benefit is debited to an account to which contributions, by both the employer and each member employed by that employer, have previously been credited. Separate accounts are maintained for each employer to avoid cross subsidisation between employers. The transition from calculating the provision as at 30 June 1999, on the basis appropriate to a public sector employer, to calculating the provision on the basis appropriate to a private sector employer, has reduced the provision by $2.369 million. The actuary’s valuation is based upon current Scheme membership at 30 June 2000. The only future Voluntary Separation Packages allowed for in the valuation are those which were contracted at that date, which involves 16 employees, including 12 Pension Scheme members. To the extent to which retrenchments and further Voluntary Separation Packages occur with Pension Scheme members, additional contributions will be required from the employer at that time. The provision previously attributable to ex-employees was transferred to the State on 14 April 2000.
2000 1999
Provision: $’000 $’000 The provisions as at this date are in respect of current employees 17 580 19 886
The provision is comprised of:
Lump sum 4 240 2 776 Pension 12 260 15 761 RG 780 926 Accumulation (previously Non-Contributory) 300 423
Superannuation Liabilities The following details relate to the entire superannuation schemes covering all electricity supply industry employees, as extracted from the most recent financial reports on the schemes:
Accrued Benefits 1999 Member financed portion of Contributory Scheme: $’million
Net market value of Scheme assets(1) 149.0 Accrued benefits(2) 127.0
Surplus of Scheme assets over accrued benefits 22.0
Employer finances portion of both Schemes: Value of accrued benefits:
Contributory Scheme 282.1 Non-Contributory Scheme 11.6
293.7
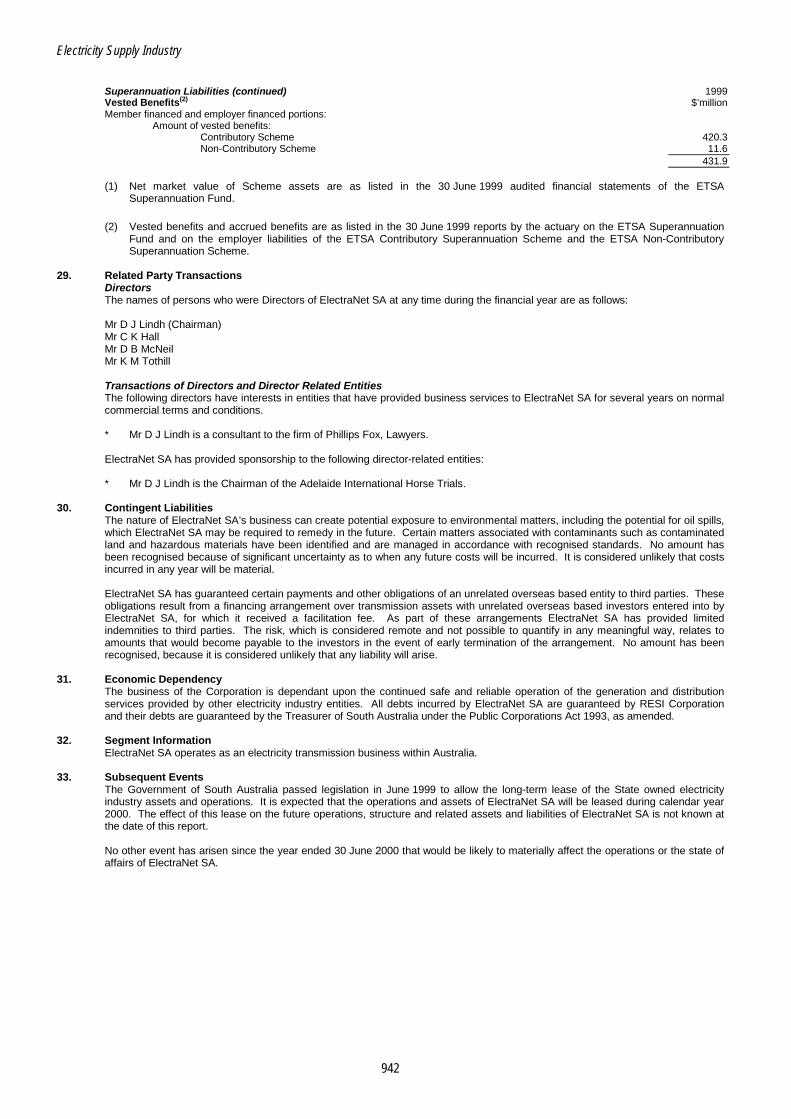
Electricity Supply Industry
942
Superannuation Liabilities (continued) 1999 Vested Benefits(2) $’million Member financed and employer financed portions:
Amount of vested benefits: Contributory Scheme 420.3 Non-Contributory Scheme 11.6
431.9 (1) Net market value of Scheme assets are as listed in the 30 June 1999 audited financial statements of the ETSA
Superannuation Fund.
(2) Vested benefits and accrued benefits are as listed in the 30 June 1999 reports by the actuary on the ETSA Superannuation Fund and on the employer liabilities of the ETSA Contributory Superannuation Scheme and the ETSA Non-Contributory Superannuation Scheme.
29. Related Party Transactions
Directors The names of persons who were Directors of ElectraNet SA at any time during the financial year are as follows: Mr D J Lindh (Chairman) Mr C K Hall Mr D B McNeil Mr K M Tothill
Transactions of Directors and Director Related Entities The following directors have interests in entities that have provided business services to ElectraNet SA for several years on normal commercial terms and conditions.
* Mr D J Lindh is a consultant to the firm of Phillips Fox, Lawyers.
ElectraNet SA has provided sponsorship to the following director-related entities: * Mr D J Lindh is the Chairman of the Adelaide International Horse Trials.
30. Contingent Liabilities
The nature of ElectraNet SA’s business can create potential exposure to environmental matters, including the potential for oil spills, which ElectraNet SA may be required to remedy in the future. Certain matters associated with contaminants such as contaminated land and hazardous materials have been identified and are managed in accordance with recognised standards. No amount has been recognised because of significant uncertainty as to when any future costs will be incurred. It is considered unlikely that costs incurred in any year will be material.
ElectraNet SA has guaranteed certain payments and other obligations of an unrelated overseas based entity to third parties. These obligations result from a financing arrangement over transmission assets with unrelated overseas based investors entered into by ElectraNet SA, for which it received a facilitation fee. As part of these arrangements ElectraNet SA has provided limited indemnities to third parties. The risk, which is considered remote and not possible to quantify in any meaningful way, relates to amounts that would become payable to the investors in the event of early termination of the arrangement. No amount has been recognised, because it is considered unlikely that any liability will arise.
31. Economic Dependency
The business of the Corporation is dependant upon the continued safe and reliable operation of the generation and distribution services provided by other electricity industry entities. All debts incurred by ElectraNet SA are guaranteed by RESI Corporation and their debts are guaranteed by the Treasurer of South Australia under the Public Corporations Act 1993, as amended.
32. Segment Information
ElectraNet SA operates as an electricity transmission business within Australia. 33. Subsequent Events
The Government of South Australia passed legislation in June 1999 to allow the long-term lease of the State owned electricity industry assets and operations. It is expected that the operations and assets of ElectraNet SA will be leased during calendar year 2000. The effect of this lease on the future operations, structure and related assets and liabilities of ElectraNet SA is not known at the date of this report.
No other event has arisen since the year ended 30 June 2000 that would be likely to materially affect the operations or the state of affairs of ElectraNet SA.

943
MOTOR ACCIDENT COMMISSION FUNCTIONAL RESPONSIBILITY AND STRUCTURE The Motor Accident Commission (the Commission) operates in accordance with the Motor Accident Commission Act 1992 (formerly the State Government Insurance Commission Act 1992). Pursuant to section 18 of the Motor Accident Commission Act 1992, the Commission’s Charter, which the Minister must prepare in consultation with the Commission, may limit the functions or powers of the Commission. The Charter specifies that the Commission is empowered to undertake the following classes of insurance: • compulsory third party (CTP) insurance (in accordance with the Motor Vehicles Act 1959);
• mortgage insurance, credit risk insurance, credit enhancements, and guarantees and residual value insurance;
• financial risk insurance. The latter two classes of insurance are in ‘run-off’ mode. In addition, the Commission is responsible for the management and finalisation of the ‘Old Act, Workers Compensation Fund’, transferred to the Commission in accordance with the SGIC (Sale) Act 1995. This Fund relates to unresolved claims from workers compensation policies issued under subsection 118(g) of the Workers Compensation Act 1971 (now repealed). The functional structure of the Commission, excluding the controlled entities, is as follows:
Motor Accident Commission
CTP InsuranceDiscontinued/
Other Operations
Includes:
- CTP Claims - CTP Investments
Includes:
- Inwards Re-insurance - Mortgage Guarantee - Residual Value Insurance - Credit Risk - Other Investments - Old Act Workers Compensation Fund
With the exception of the CTP insurance business, no new policies were underwritten by the Commission for all other insurance activities. These activities are in ‘run-off’ mode and will cease once the Commission’s obligations under the existing policies have expired or have been settled. The administration and management of the claims and investments of the CTP insurance business have been contracted to SGIC General Insurance Limited and Legal and General Financial Services Limited respectively. Refer to Note 19 to the financial statements for further information.

Motor Accident Commission
944
Subsidiary Companies and Joint Ventures During the year, the Commission controlled the following company and joint venture: • Southern Group Insurance Corporation Limited — a trustee company. See Note 20 to the financial
statements for further details on the controlled entities.
• The Commission also has a 25 percent interest in a partnership agreement with the former South Australian Timber Corporation called Scrimber whose principal activity was the development of synthetic timber products (refer Note 22).
SIGNIFICANT FEATURES Consolidated Operations • Operating profit after Abnormal Items and Income Tax was $18.5 million ($24.8 million loss). • A dividend of $10 million (nil) is payable to the South Australian Government. CTP Operations • Operating profit after Abnormal Items and Income Tax was $17 million ($26 million loss).
• Premium revenue increased by $20.5 million to $257.7 million due mainly to premium increases effective 1 July 1999 and 28 October 1999.
• An increase of $50.8 million in the gross provision for outstanding claims as a result of actuarial assessment (refer Note 1(e) and 15).
• A decrease in actual investment revenue of $16.3 million mainly as a result of a reduction in rental income.
• An unrealised gain of $32 million in the market value of investments (an unrealised loss of $4.4 million). AUDIT MANDATE AND COVERAGE Audit Authority Subsection 28(3) of the Motor Accident Commission Act 1992 provides for the Auditor-General to audit the accounts and financial statements of the Commission in respect of each financial year. Scope of Audit The audit program covered all major financial systems of the Commission and was directed primarily at obtaining sufficient evidence to enable an audit opinion to be formed on the Commission’s financial statements. The following aspects of financial activities were included in the audit program: • investment assets • investment income • accounts payable • receivables • claims payable • premiums • management agreements (CTP) • provisions for outstanding claims • actuarial assessments • reinsurance and other recoveries.
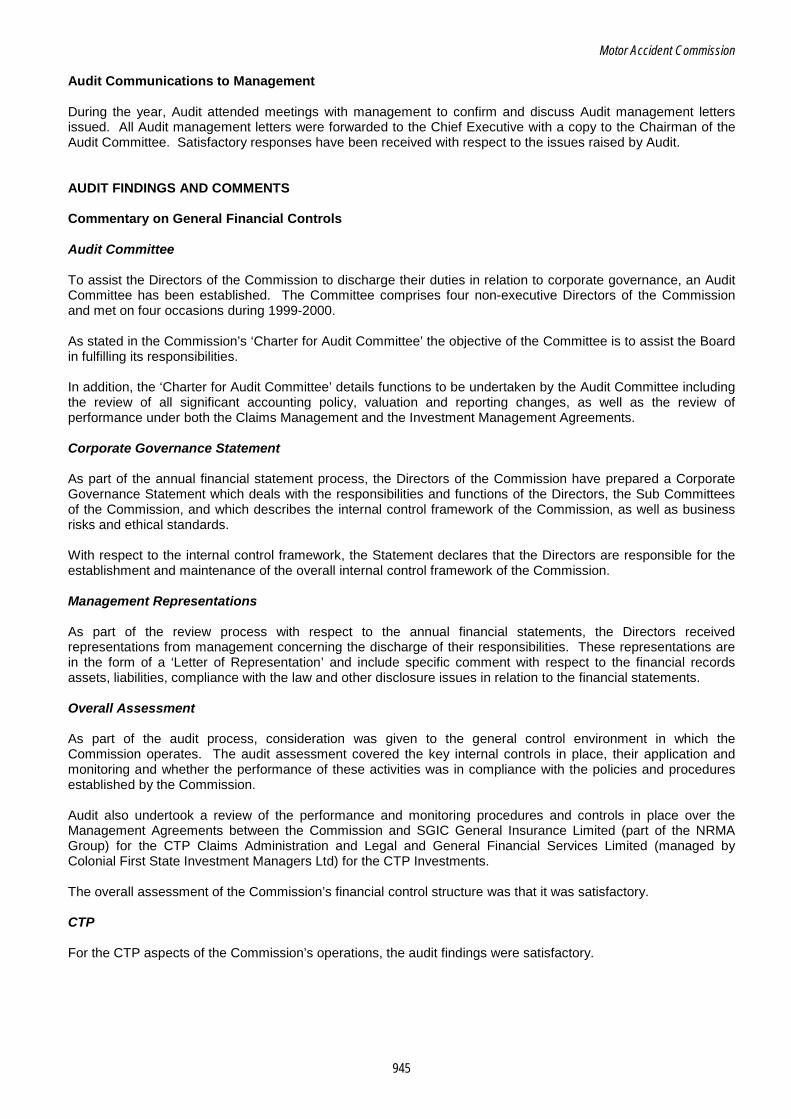
Motor Accident Commission
945
Audit Communications to Management During the year, Audit attended meetings with management to confirm and discuss Audit management letters issued. All Audit management letters were forwarded to the Chief Executive with a copy to the Chairman of the Audit Committee. Satisfactory responses have been received with respect to the issues raised by Audit. AUDIT FINDINGS AND COMMENTS Commentary on General Financial Controls Audit Committee To assist the Directors of the Commission to discharge their duties in relation to corporate governance, an Audit Committee has been established. The Committee comprises four non-executive Directors of the Commission and met on four occasions during 1999-2000. As stated in the Commission’s ‘Charter for Audit Committee’ the objective of the Committee is to assist the Board in fulfilling its responsibilities. In addition, the ‘Charter for Audit Committee’ details functions to be undertaken by the Audit Committee including the review of all significant accounting policy, valuation and reporting changes, as well as the review of performance under both the Claims Management and the Investment Management Agreements. Corporate Governance Statement As part of the annual financial statement process, the Directors of the Commission have prepared a Corporate Governance Statement which deals with the responsibilities and functions of the Directors, the Sub Committees of the Commission, and which describes the internal control framework of the Commission, as well as business risks and ethical standards. With respect to the internal control framework, the Statement declares that the Directors are responsible for the establishment and maintenance of the overall internal control framework of the Commission. Management Representations As part of the review process with respect to the annual financial statements, the Directors received representations from management concerning the discharge of their responsibilities. These representations are in the form of a ‘Letter of Representation’ and include specific comment with respect to the financial records assets, liabilities, compliance with the law and other disclosure issues in relation to the financial statements. Overall Assessment As part of the audit process, consideration was given to the general control environment in which the Commission operates. The audit assessment covered the key internal controls in place, their application and monitoring and whether the performance of these activities was in compliance with the policies and procedures established by the Commission. Audit also undertook a review of the performance and monitoring procedures and controls in place over the Management Agreements between the Commission and SGIC General Insurance Limited (part of the NRMA Group) for the CTP Claims Administration and Legal and General Financial Services Limited (managed by Colonial First State Investment Managers Ltd) for the CTP Investments. The overall assessment of the Commission’s financial control structure was that it was satisfactory. CTP For the CTP aspects of the Commission’s operations, the audit findings were satisfactory.
Motor Accident Commission
946
An Audit review directed towards establishing whether adequate procedures were in place to monitor the performance under the Claims Management and Investment Management Agreements between the Commission and the appointed managers was also undertaken. The Audit review noted that the reports received from both the claims and the investment managers were both regular and consistent with the requirements of the respective Management Agreements. Other The results of the audit in relation to the non-CTP aspects of the Commission’s operations were satisfactory. Commentary on Computer Information Systems (CIS) Environment The audit review of the Commission’s CIS environment was focused on the procedures and controls surrounding the CTP related systems. In addition, there was an overall assessment of the controls over access to the systems and security of program changes. The overall assessment was that the CIS control environment was satisfactory. CONTROLS OPINION As required by subsection 36(1)(a)(iii) of the Public Finance and Audit Act 1987, the audit of the Motor Accident Commission included an assessment of the controls exercised in relation to the receipt, expenditure and investment of money, the acquisition and disposal of property and the incurring of liabilities. Audit formed the opinion that the controls exercised by the Motor Accident Commission in relation to the receipt, expenditure and investment of money; the acquisition and disposal of property; and the incurring of liabilities, were sufficient to provide reasonable assurance that the financial transactions of the organisation were conducted properly and in accordance with the law. INTERPRETATION AND ANALYSIS OF FINANCIAL STATEMENTS Format of the Financial Statements The Commission, in preparing financial statements in accordance with the Act and Charter, must comply with a range of legislative requirements, including the requirement to report as if it were a listed public company. (Note 1 to the financial statements provides details of the basis upon which the statements have been prepared). In addition to preparing the financial statements of the Commission and the consolidated economic entity, separate financial statements are required for the CTP Fund. Consolidated Operating Result As reflected in Note 2 to the financial statements, the operating profit consists of two inter-related components: • Underwriting result - this is determined as premium revenue less claims expense (after the cost and
recoveries associated with reinsuring a portion of the insurance portfolio’s risk with a third party) and other underwriting costs.
• Investment revenue - this includes amounts received, together with realised and unrealised gains and losses.
In 2000 there was an underwriting loss before abnormal items of $58.9 million ($61.1 million) but there was a profit before income tax and abnormal items of $31.2 million ($7.8 million). This result was achieved with a net investment revenue of $58.2 million ($76.1 million) and an increase in market value of investments of $31.9 million (a decrease of $7.2 million).
Motor Accident Commission
947
Underwriting Operations CTP Operations The underwriting result for the CTP Fund was an underwriting loss before abnormal items of $58.7 million ($61.6 million). This loss was predominantly due to an increase in net claims expense of $12.3 million and an increase in other underwriting expenses of $5.4 million. The approved increase in premiums, effective July 1999 and October 1999, was the predominant reason for the increase in premium revenue of $20.5 million. The following table illustrates key indicators for CTP insurance over the past four years.
Claim Loss and Total Expense Rations - CTP Insurance
1999-2000 1998-99 1997-98 1996-97 Percent Percent Percent Percent Claim Loss Ratio 104.5 108.4 108.1 114.5 Total Expense Ratio 18.4 17.7 17.5 18.2 Underwriting Ratio 122.9 126.1 125.6 132.7 The claims loss ratio represents net claims incurred divided by net premiums earned, the total expense ratio represents underwriting expenses divided by net premiums earned, and the underwriting ratio represents the sum of the two rates. Investment Operations The investment operations and the associated investment income of an insurance organisation are an inseparable part of its operations, and are as important as the underwriting operations. Inherent in the profit planning of an insurance organisation and the pricing of insurance products is an assumption about the use of funds available for investment and an estimated return on those funds. During the year investment revenue for the Commission totalled $61.2 million ($79.4 million). Insurers formulate an investment strategy to complement their insurance business. Funds are invested so that income on investments, together with maturities, meets the ongoing cash flow needs of the organisation. As part of this process, insurers need to consider the underlying operational risks when determining the investment mix. Losses as a result of sales of investments during the year amounted to $3.4 million (profit of $7.1 million). This was off set by an unrealised market movement profit of $31.9 million (loss of $7.2 million). Market Value Accounting As stated in Note 1 to the financial statements, investments, other than those in controlled entities, are valued at net market value (ie net of the expected costs of disposal). Changes in the net market values of investments at the balance date from their net market values at the previous balance date (or cost of acquisition, if acquired during the financial year) are recognised as revenue or expense in the profit and loss account. This accounting policy, required by Australian Accounting Standards Board AASB 1023 ‘Financial Reporting of General Insurance Activities’ and known as ‘market value accounting’, means the Commission’s investment revenue comprises both realised income (such as dividends, interest, rental from properties etc) and unrealised market value movements. (Note 3 to the financial statements refers to this matter). Market movements can be subject to great fluctuations when comparing the market value on a year by year basis. By way of an example, over the last three years market movements for the CTP Fund have resulted in unrealised losses of $8.3 million being reflected through the profit and loss account in 1997-98, unrealised losses of $4.4 million in 1998-99 and unrealised profits of $32 million in 1999-2000. Overall, the Commission recorded an unrealised market movement profit of $31.9 million for 1999-2000 (loss of $7.2 million). Given such fluctuations, it is important to emphasise that any gains and losses recognised in the Commission’s financial statements for the investments held at reporting date are unrealised. Until such time as the investments are sold, no gain or loss is actually received or incurred by the Commission. In the intervening period, market fluctuations may result in a change in the market value of those investments which could either offset, or contribute to, the unrealised gains and losses previously recognised. In addition, even if an investment is recognised as having incurred an unrealised loss for reporting purposes, the underlying investment may well continue to generate income for the Commission; fixed interest securities provide an example of this.
Motor Accident Commission
948
In assessing the operating revenue, the unrealised profits or losses from the Commission’s investments and their contribution to the operating result need to be considered. (As required by the Accounting Standard this is reflected in Note 3 to the financial statements). Controlled Entity Operations The contribution to the Commission’s consolidated profit by the controlled entity is highlighted in Note 20 to the financial statements. Statement of Cash Flows For the CTP Fund, proceeds from the sale of investments decreased by $160.8 million while payments for investments increased by $31.4 million. These movements were the main contributors to net cash used in operating activities decreasing to $99.5 million. FURTHER COMMENTARY ON OPERATIONS CTP - Management Agreements General The Commission has entered into contracts with SGIC General Insurance Limited and Legal and General Financial Services Limited for the management of the CTP claims and investment activities respectively. Claims Management Agreement SGIC General Insurance Limited, as the manager of CTP claims, provides a claims management service that ‘would be reasonably expected of an insurer and subject to the requirements of the Commission’. As described in Note 19 to the financial statements, the fee for the provision of this service is based on a ‘base fee’ indexed by the Consumer Price Index. The management fee for 1999-2000 amounted to $13.9 million ($13.8 million). In addition, under specified conditions, the manager is also entitled to an incentive fee of a percentage of the net underwriting result. The agreement also specifies performance criteria and the reporting requirements to the Commission. Investment Management Agreement The Investment Management Agreement is with Legal and General Financial Services Limited (LGFS). Due to the takeover of LGFS by the Colonial Group, the agreement is now managed by Colonial First State Investment Managers Ltd (CFSIM). Responsibility for the performance of CFSIM remains with LGFS. The Investment Management Agreement provides for the manager to provide ‘skilled investment advice and manage the investment of the portfolio in accordance with the mandate’. The mandate of the investment manager specifies the terms and conditions for the management of the portfolio and outlines: • authorised investments and requirements; • investment objectives, limits and target benchmarks; • performance and the evaluation of performance. During 1999-2000 the Commission paid $3 million ($3.3 million) for the management of the investment portfolio.

Motor Accident Commission
949
MOTOR ACCIDENT COMMISSION AND CONTROLLED ENTITIES
Profit and Loss Account for the year ended 30 June 2000 CTP Consolidated Commission 2000 1999 2000 1999 2000 1999 Note $’000 $’000 $’000 $’000 $’000 $’000 OPERATING REVENUE 3 351 607 311 452 353 646 312 772 353 646 312 848
OPERATING PROFIT BEFORE ABNORMAL ITEMS AND INCOME TAX 2 29 321 6 095 31 205 7 838 31 153 7 960 Abnormal items before income tax 6 - (46 800) - (46 800) - (46 800) OPERATING PROFIT (LOSS) AFTER ABNORMAL ITEMS AND BEFORE INCOME TAX 29 321 (40 705) 31 205 (38 962) 31 153 (38 840) Income tax (expense) benefit attributable to operating profit (loss) and abnormal items 7 (12 093) 14 684 (12 736) 14 115 (12 734) 14 115 OPERATING PROFIT (LOSS) AFTER ABNORMAL ITEMS AND INCOME TAX 17 228 (26 021) 18 469 (24 847) 18 419 (24 725) RETAINED PROFIT AT 1 JULY 71 112 97 133 91 013 115 860 91 125 115 850 TOTAL AVAILABLE FOR APPROPRIATION 88 340 71 112 109 482 91 013 109 544 91 125 Dividend payable to South Australian Government 25 - - 10 000 - 10 000 -
RETAINED PROFIT AT 30 JUNE 88 340 71 112 99 482 91 013 99 544 91 125
Balance Sheet as at 30 June 2000 CTP Consolidated Commission 2000 1999 2000 1999 2000 1999 CURRENT ASSETS: Note $’000 $’000 $’000 $’000 $’000 $’000
Cash 5 829 5 305 12 171 24 820 12 025 24 792 Receivables 8 29 669 5 021 29 819 5 286 29 885 5 232 Reinsurance and other recoveries receivable 9 2 985 3 485 2 985 3 485 2 985 3 485 Investments 10 167 987 226 064 187 861 230 424 187 981 230 544 Other 11 9 716 9 191 9 716 9 193 9 716 9 193
Total Current Assets 216 186 249 066 242 552 273 208 242 592 273 246 NON-CURRENT ASSETS:
Receivables 8 - - 2 109 2 177 2 109 2 177 Reinsurance and other recoveries receivable 9 9 082 11 307 9 082 11 307 9 082 11 307 Investments 10 943 111 792 080 947 019 797 732 947 039 797 752 Property, plant and equipment 12 - - 152 159 152 159 Future income tax benefit 7 24 667 29 196 25 957 31 024 25 957 31 024
Total Non-Current Assets 976 860 832 583 984 319 842 399 984 339 842 419 Total Assets 1 193 046 1 081 649 1 226 871 1 115 607 1 226 931 1 115 665
CURRENT LIABILITIES:
Accounts payable 13 44 079 6 009 43 777 5 858 43 775 5 804 Borrowings 14 - - - 1 351 - 1 351 Unearned premium 90 306 92 551 90 306 92 551 90 306 92 551 Outstanding claims 15 256 489 234 298 258 322 236 161 258 322 236 161 Provisions 16 - - 10 063 47 10 063 47
Total Current Liabilities 390 874 332 858 402 468 335 968 402 466 335 914 NON-CURRENT LIABILITIES:
Outstanding claims 15 697 776 669 187 708 413 679 784 708 413 679 784 Deferred income tax 7 16 056 8 492 16 508 8 842 16 508 8 842
Total Non-Current Liabilities 713 832 677 679 724 921 688 626 724 921 688 626 Total Liabilities 1 104 706 1 010 537 1 127 389 1 024 594 1 127 387 1 024 540
NET ASSETS 88 340 71 112 99 482 91 013 99 544 91 125
EQUITY: Retained profit 88 340 71 112 99 482 91 013 99 544 91 125
TOTAL EQUITY 88 340 71 112 99 482 91 013 99 544 91 125
Contingent Liabilities 27

Motor Accident Commission
950
Statement of Cash Flows for the year ended 30 June 2000 CTP Consolidated Commission 2000 1999 2000 1999 2000 1999 Inflows Inflows Inflows Inflows Inflows Inflows (Outflows) (Outflows) (Outflows) (Outflows) (Outflows) (Outflows) CASH FLOWS FROM OPERATING ACTIVITIES: Note $’000 $’000 $’000 $’000 $’000 $’000
Cash receipts in the course of operations 270 857 248 490 270 998 248 535 270 875 248 528 Cash payments in the course of operations (271 926) (232 982) (273 128) (234 552) (273 120) (234 466) Proceeds from sale of investments 944 767 1 105 571 944 885 1 106 579 944 885 1 106 579 Payments for investments (1 100 602) (1 069 158) (1 101 505) (1 069 158) (1 101 505) (1 069 158) Income taxes paid - (5 212) - (6 532) - (6 532) Dividends received 4 871 4 438 5 458 6 833 5 458 6 833 Interest and other investment income 52 545 61 530 54 217 63 177 54 214 63 175
Net Cash (used in) provided by Operating Activities 26 (99 488) 112 677 (99 075) 114 882 (99 193) 114 959
CASH FLOWS FROM INVESTING ACTIVITIES:
Repayment of loans by other persons - - 3 194 325 3 194 325 Repayments of loans by controlled entities - - - - - 43 Loans to controlled entities - - - - - (70) Payment for property, plant and equipment - - (8) (6) (8) (6)
Net Cash provided by Investing Activities - - 3 186 319 3 186 292
CASH FLOWS FROM FINANCING ACTIVITIES:
Payment of loans - - (1 351) - (1 351) - Dividends paid - - - (3 468) - (3 468)
Net Cash used in Financing Activities - - (1 351) (3 468) (1 351) (3 468)
NET (DECREASE) INCREASE IN CASH HELD (99 488) 112 677 (97 240) 111 733 (97 358) 111 783 CASH AT 1 JULY 130 490 17 813 150 005 38 272 149 977 38 194
CASH AT 30 JUNE 1(q), 26 31 002 130 490 52 765 150 005 52 619 149 977
NOTES TO AND FORMING PART OF THE FINANCIAL STATEMENTS 1. Statement of Significant Accounting Policies
(a) Basis of Accounting The financial statements are a general purpose financial report which has been prepared in accordance with applicable Accounting Standards, the Corporations Law, relevant Treasurer’s Instructions issued under the Public Finance and Audit Act 1987, and other mandatory professional requirements (Urgent Issues Group Consensus Views). They have been prepared on the basis of historical costs and except where stated, do not take into account changing money values or current valuations of non-current assets. These accounting policies have been consistently applied by each entity in the economic entity and, except where there is a change in accounting policy are consistent with those of the previous year.
(b) Principles of Consolidation The consolidated accounts incorporate the results and the assets and liabilities of all entities which, in terms of Australian Accounting Standards Board AASB 1024 ‘Consolidated Accounts’, are controlled by the entity as at 30 June 2000. The Motor Accident Commission (MAC) and its controlled entities together are referred to in this financial report as the economic entity. The balances and effects of transactions between controlled entities included in the consolidated accounts have been eliminated. Outside equity interests in the results and equity of controlled entities are shown separately in the consolidated accounts. Where an entity either began or ceased to be controlled during the year, the results are included only from the date control commenced or up to the date control ceased. The entities controlled by MAC are listed in Note 20.
(c) Premium Revenue The earned portion of premiums received and receivable is recognised as revenue. Premium is treated as earned from the date of attachment of risk. Unearned premium is determined by apportioning the premiums written prior to year end on a daily pro-rate basis.
(d) Outwards Reinsurance Premium paid to reinsurers is recognised as an expense in accordance with the pattern of reinsurance service received. Accordingly, a portion of outwards reinsurance is treated at balance date as a prepayment.
(e) Claims (i) Short-Term Claims
Claims expense and a liability for outstanding claims are recognised in respect of direct and inwards reinsurance business. The liability covers claims reported but not yet paid, incurred but not reported claims (IBNR), the anticipated direct and indirect costs of settling those claims and estimated reinsurance and other insurance recoveries. Claims outstanding are based on average or individual claim file estimates, with IBNRs and settlement costs calculated using statistics from past experience and trends.

Motor Accident Commission
951
(i) Short-Term Claims (continued) In the inwards reinsurance, general and business insurance and financial risk businesses, delays occur in the notification of information normally used in the calculation of claims provisions. The Directors, having due consideration for the nature of the risks involved and any material event that would adversely affect the operating results, have provided an amount for claims in the accounts that is sufficient to cover known events and at the same time assist to build up prudential reserves.
(ii) Long-Term Claims The liability for outstanding claims which take longer to settle such as CTP and Employer’s Liability is measured as the present value of the expected future payments. These payments are estimated on the basis of the ultimate cost of settling claims, which is affected by factors arising during the period to settlement such as normal and superimposed inflation. The expected future payments are discounted to present value at balance date and a margin for prudence is included to provide sufficient confidence that the provision is adequate.
(iii) Abnormal Claims Costs An abnormal item was raised in the 1998-99 financial statements in recognition of the effect of the Federal Government’s tax reform (A New Tax System) on the outstanding claims provision. This was based on independent actuarial advice as at 30 June 2000 (refer Note 6).
(f) Reinsurance and Other Recoveries Receivable Reinsurance and other recoveries receivable on paid claims, reported claims not yet paid and IBNRs are recognised as revenue. Recoveries receivable used in the calculation of claims provisions are brought to account where they can be reliably measured. Recoveries receivable are assessed in a manner similar to the assessment of outstanding claims.
(g) Collection Charges Costs incurred in obtaining and recording policies of insurance are recognised as collection charges and have been brought to account during the financial year as they do not represent a future benefit.
(h) Other Charges A liability for other charges is recognised on business written to balance date. Levies and charges payable by MAC were expensed on the same basis as the recognition of premium revenue, with the portion relating to unearned premium being recorded as a prepayment.
(i) Receivables (i) Trade Debtors
Trade debtors principally relate to premiums collected by Transport SA (Registration and Licensing Section) an agent of MAC, not yet passed over to the CTP Fund. The settlement of these amounts occurs within seven working days.
(ii) Investment Debtors Investment debtors consists of securities for which contracts for sale had been completed but for which settlement had not been received at balance date together with interest, dividends and rental due on other investments. The collectability of debts is assessed at balance date and specific provision is made for any doubtful debts.
(j) Foreign Currency Transactions Foreign currency transactions are translated at the rates of exchange ruling at the date of the transactions. Amounts in foreign currencies at balance date have been translated at the spot rate of exchange ruling on the close of trading on that date. Exchange differences relating to amounts payable and receivable in foreign currencies are brought to account as exchange gains or losses in the Profit and Loss Account in the financial year in which the exchange rates change.
(k) Investments Investments, other than investments in controlled entities, are valued at net fair value, ie net of the expected costs of disposal. Changes in the net fair values of investments at balance date from their net fair values at the previous balance date (or cost of acquisition, if acquired during the financial year) are recognised as revenue or expense in the Profit and Loss Account. Net fair value for each category is established as follows: (i) Properties
All properties were valued at independent valuations as at 30 June 2000. All independent valuations have been prepared in accordance with guidelines issued by the Australian Securities and Investment Commission which embrace the definition of market value established by the Australian Property Institute Incorporated. The definition provides that market value is the estimated amount for which an asset should exchange on the date of valuation between a willing buyer and a willing seller in an arms length transaction after proper marketing wherein the parties had each acted knowledgeably, prudently and without compulsion. In accordance with the provision of Australian Accounting Standards Board AASB 1023 ‘Financial Reporting of General Insurance Activities’, properties are treated as integral to the general insurance activities of the entity. As such they are classified as investment properties and are not depreciated.
(ii) Listed Equities and Securities By market quotations as at 30 June 2000.

Motor Accident Commission
952
(k) Investments (continued) (iii) Other Investments
Other investments are valued based on current economic conditions, market interest rates and the latest available information on the investments as considered appropriate by the Directors. In respect of significant controlled entities, valuations are reviewed to support the carrying amount.
(iv) Net Investment Income Fees and discounts are amortised over the period to which they relate. Interest and dividends are taken to income on an earned basis. Investment income is reported after deducting costs and expenses relating to management, operation and maintenance of the investment portfolio.
(l) Employee Entitlements A liability for employee entitlements has been accrued at 30 June 2000. Wages, Salaries, Annual Leave, Long Service Leave and Sick Leave The provisions for employee entitlements to wages, salaries, annual leave and long service leave at 30 June 2000 represent the amount which MAC has a present obligation to pay resulting from employees’ services provided up to that date. The provision has been calculated at nominal amounts based on current wage and salary rates and includes related on-costs. No provision was made for sick leave as entitlements do not vest.
(m) Income Tax Tax effect accounting procedures are followed whereby the income tax expense in the Profit and Loss Account is matched with the accounting profit (after allowing for permanent differences). The future tax benefit relating to tax losses is not carried forward as an asset unless the benefit can be regarded as being virtually certain of realisation. Income tax on net cumulative timing differences is set aside to the deferred income tax and future income tax benefit accounts at the rates which are expected to apply when those timing differences reverse. Under section 23 of the MAC Act 1992, the entity is liable to pay to the Treasurer, for the credit of the Consolidated Account, such amounts as the Treasurer from time to time determines to be equivalent to income tax and any other taxes or imposts that the entity does not pay to the Commonwealth but would be liable to pay under the law of the Commonwealth if it were constituted and organised in such manner as a public company or group of public companies. (i) Controlled Entities
Controlled entities forming part of the consolidated result are subject to the regulations and provisions of the Income Tax Assessment Act 1936, and as such are required to remit, where payable, taxation to the Federal Taxation Authorities.
(ii) Other Tax and Charges The entity is a registered entity for GST purposes and, effective 1 July 2000, will collect and remit GST in the normal course of business. GST collected on premiums paid in advance as at 30 June 2000 has been recognised as a liability in the accounts. Whilst the entity is an exempt body under the Sales Tax (Exemptions and Classifications) Act 1992, it is assessed the equivalent of sales tax payable on goods and remits this amount to the Department of Treasury and Finance. This Act was repealed effective 1 July 2000 as part of the Federal Government’s tax reform package. Other taxes such as stamp duty are remitted in the normal course of business to the respective authorities.
(n) Property, Plant and Equipment
Plant and equipment, furniture, fixtures and fittings and computing equipment are depreciated over their estimated useful lives using the reducing balance method of depreciation. The rates of depreciation are detailed below. Land and buildings are treated as investments and are consequently not subject to depreciation.
Asset Class Depreciation
Rate Percent
Plant and equipment 20.0 Furniture and fittings 20.0 Building fitout 2.5 Computing equipment 40.0
(o) Accounts Payable
Liabilities are recognised for amounts to be paid in the future for goods and services received, whether or not billed to MAC or the economic entity. Trade accounts payable are normally settled within 30 days.
(p) Dividends In accordance with section 26 of the MAC Act 1992, the Treasurer, after consultation with the Board, may direct MAC to pay to the Treasurer a part of any surplus in respect of a financial year.
(q) Cash For purposes of the Statement of Cash Flows, cash includes cash on hand and at bank and short term deposits at call, net of bank overdrafts.
(r) Derivatives The economic entity’s activities expose it to changes in interest rates, foreign exchange rates and general consumer prices. It is also exposed to credit, liquidity and cash flow risks from its operations.

Motor Accident Commission
953
(r) Derivatives (continued) It is economic entity policy to consider derivative financial instruments to hedge cash flows subject to interest rate, foreign exchange rate and general consumer price risks. Derivative financial instruments designated as hedges are accounted for on the same basis as the underlying exposure.
(s) Comparatives Where necessary, comparative information has been reclassified to achieve consistency in disclosure with current financial year amounts and other disclosures. Where Accounting Standards have been applied for the first time, comparative information is not available.
2. Operating Profit CTP Consolidated Commission 2000 1999 2000 1999 2000 1999 Note $’000 $’000 $’000 $’000 $’000 $’000
Premium revenue 3 257 681 237 222 257 687 237 220 257 687 237 220 Outward reinsurance expense (1 681) (1 716) (1 681) (1 716) (1 681) (1 716)
Net Premium 256 000 235 506 256 006 235 504 256 006 235 504 Claims expense 4 270 440 258 555 270 062 257 558 270 062 257 558 Reinsurance and other recoveries 3 (2 856) (3 268) (2 873) (3 306) (2 873) (3 306)
Net Claims* 6,18 267 584 255 287 267 189 254 252 267 189 254 252 Other underwriting expenses 5 47 168 41 775 47 753 42 303 47 753 42 303
Underwriting loss before Abnormal Items 58 752 61 556 58 936 61 051 58 936 61 051 Investment revenue 3 59 076 75 403 61 218 79 353 61 218 79 353 Other revenue 3 - - 1 60 1 136 Investment management fee (2 997) (3 311) (2 997) (3 311) (2 997) (3 311)
Net Investment Revenue 56 079 72 092 58 222 76 102 58 222 76 178 Contribution from non-insurance controlled entities - - 52 (46) - - Operating Profit (Loss) Before Market Value Movement and Abnormal Items (2 673) 10 536 (662) 15 005 (714) 15 127 Investment market value movement (AASB 1023)
3 31 994 (4 441) 31 867 (7 167) 31 867 (7 167)
Operating Profit before Income Tax and Abnormal Items 29 321 6 095 31 205 7 838 31 153 7 960
Operating profit before income tax and abnormal items is arrived at after crediting and charging the following specific items: Credits:
Interest received/receivable: Other persons and/or corporations 51 609 58 912 53 112 58 912 53 112 58 912
Dividends received/receivable: Other persons and/or corporations 8 458 6 703 9 045 6 703 9 045 6 703
Charges: Amounts set aside for provision of
Employee entitlements - - (16) (21) (16) (21) Bad and doubtful debts (70) (64) (70) (64) (70) (64)
Depreciation and amortisation of plant and equipment - - (19) (17) (19) (17)
* Net claims are reconciled to net claims incurred (Note 18) less pre-tax abnormal claims costs (Note 6).
3. Operating Revenue
Premium Revenue: Direct 257 681 237 222 257 681 237 222 257 681 237 222 Inward reinsurance - - 6 (2) 6 (2)
257 681 237 222 257 687 237 220 257 687 237 220 Reinsurance and Other Recoveries:
Reinsurance 312 7 312 7 312 7 Other 2 544 3 261 2 561 3 299 2 561 3 299
2 856 3 268 2 873 3 306 2 873 3 306 Investment Revenue:
Dividends 8 458 6 703 9 045 9 098 9 045 9 098 Interest 51 609 58 912 53 112 60 467 53 112 60 467 Rentals 2 399 2 704 2 399 2 704 2 399 2 704 Profit - Investments realised (3 390) 7 084 (3 338) 7 084 (3 338) 7 084
59 076 75 403 61 218 79 353 61 218 79 353 Investment Market Value Movement (AASB 1023):
Fixed interest 13 703 (14 895) 13 703 (14 895) 13 703 (14 895) Equities 15 906 10 286 15 779 7 560 15 779 7 560 Properties 1 529 423 1 529 423 1 529 423 Futures 856 (255) 856 (255) 856 (255)
31 994 (4 441) 31 867 (7 167) 31 867 (7 167) Other Revenue:
Foreign exchange gains (losses) - - (1) 75 (1) 75 Other revenue - - 2 15 2 61
- - 1 60 1 136
Total Operating Revenue 351 607 311 452 353 646 312 772 353 646 312 848
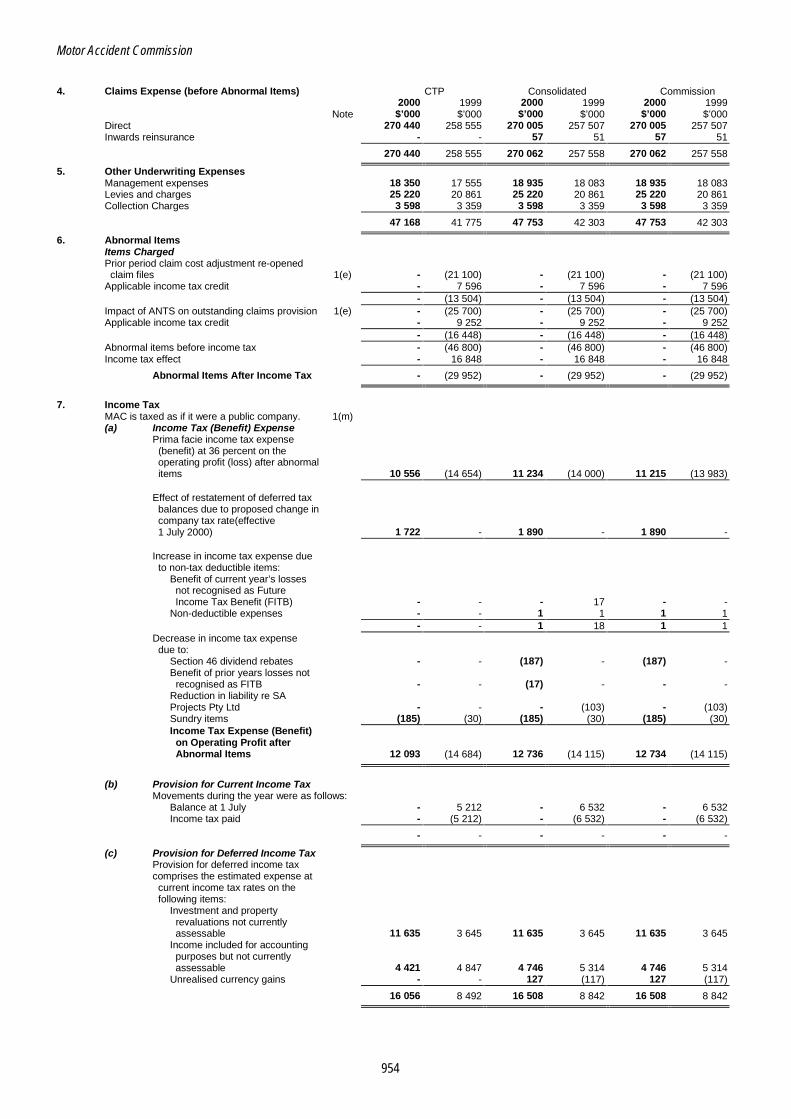
Motor Accident Commission
954
4. Claims Expense (before Abnormal Items) CTP Consolidated Commission 2000 1999 2000 1999 2000 1999 Note $’000 $’000 $’000 $’000 $’000 $’000
Direct 270 440 258 555 270 005 257 507 270 005 257 507 Inwards reinsurance - - 57 51 57 51
270 440 258 555 270 062 257 558 270 062 257 558
5. Other Underwriting Expenses Management expenses 18 350 17 555 18 935 18 083 18 935 18 083 Levies and charges 25 220 20 861 25 220 20 861 25 220 20 861 Collection Charges 3 598 3 359 3 598 3 359 3 598 3 359
47 168 41 775 47 753 42 303 47 753 42 303
6. Abnormal Items Items Charged Prior period claim cost adjustment re-opened claim files 1(e) - (21 100) - (21 100) - (21 100) Applicable income tax credit - 7 596 - 7 596 - 7 596
- (13 504) - (13 504) - (13 504) Impact of ANTS on outstanding claims provision 1(e) - (25 700) - (25 700) - (25 700) Applicable income tax credit - 9 252 - 9 252 - 9 252 - (16 448) - (16 448) - (16 448) Abnormal items before income tax - (46 800) - (46 800) - (46 800) Income tax effect - 16 848 - 16 848 - 16 848
Abnormal Items After Income Tax - (29 952) - (29 952) - (29 952)
7. Income Tax
MAC is taxed as if it were a public company. 1(m) (a) Income Tax (Benefit) Expense
Prima facie income tax expense (benefit) at 36 percent on the operating profit (loss) after abnormal items 10 556 (14 654) 11 234 (14 000) 11 215 (13 983) Effect of restatement of deferred tax balances due to proposed change in company tax rate(effective 1 July 2000) 1 722 - 1 890 - 1 890 - Increase in income tax expense due to non-tax deductible items:
Benefit of current year’s losses not recognised as Future Income Tax Benefit (FITB) - - - 17 - - Non-deductible expenses - - 1 1 1 1
- - 1 18 1 1 Decrease in income tax expense due to:
Section 46 dividend rebates - - (187) - (187) - Benefit of prior years losses not recognised as FITB - - (17) - - - Reduction in liability re SA Projects Pty Ltd - - - (103) - (103) Sundry items (185) (30) (185) (30) (185) (30) Income Tax Expense (Benefit) on Operating Profit after Abnormal Items 12 093 (14 684) 12 736 (14 115) 12 734 (14 115)
(b) Provision for Current Income Tax
Movements during the year were as follows: Balance at 1 July - 5 212 - 6 532 - 6 532 Income tax paid - (5 212) - (6 532) - (6 532)
- - - - - -
(c) Provision for Deferred Income Tax Provision for deferred income tax comprises the estimated expense at current income tax rates on the following items:
Investment and property revaluations not currently assessable 11 635 3 645 11 635 3 645 11 635 3 645 Income included for accounting purposes but not currently assessable 4 421 4 847 4 746 5 314 4 746 5 314 Unrealised currency gains - - 127 (117) 127 (117)
16 056 8 492 16 508 8 842 16 508 8 842
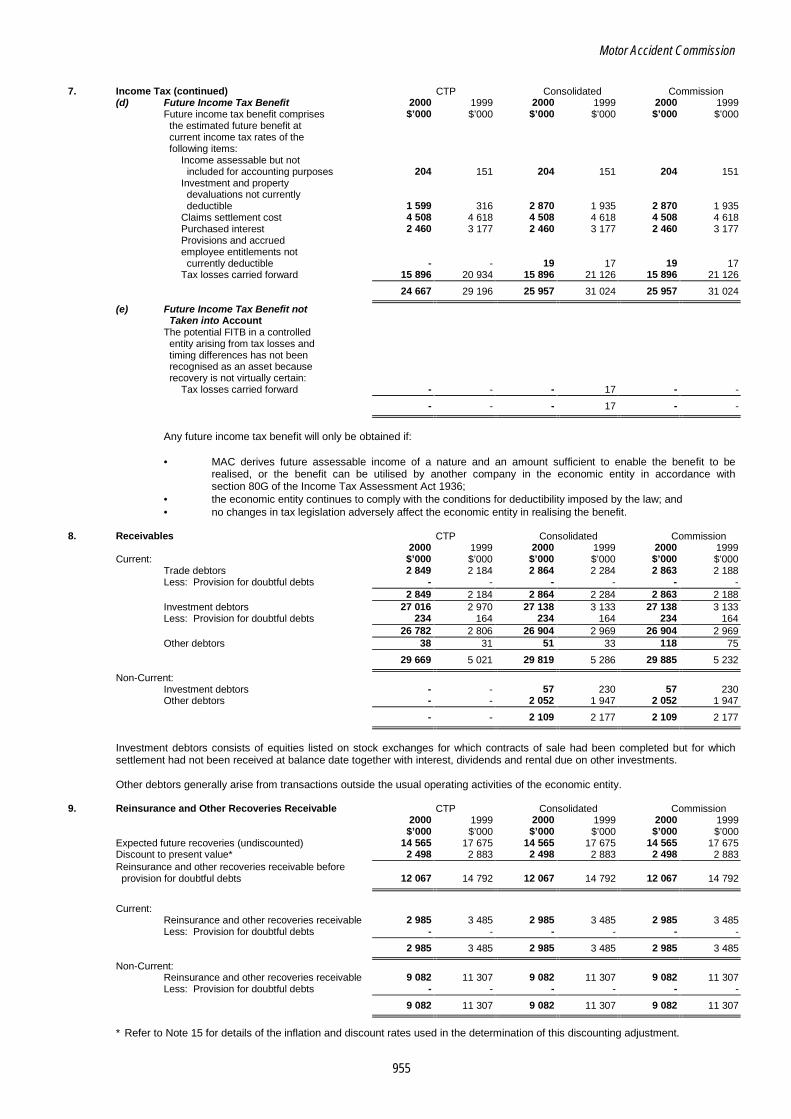
Motor Accident Commission
955
7. Income Tax (continued) CTP Consolidated Commission (d) Future Income Tax Benefit 2000 1999 2000 1999 2000 1999
Future income tax benefit comprises $’000 $’000 $’000 $’000 $’000 $’000 the estimated future benefit at current income tax rates of the following items:
Income assessable but not included for accounting purposes 204 151 204 151 204 151 Investment and property devaluations not currently deductible 1 599 316 2 870 1 935 2 870 1 935 Claims settlement cost 4 508 4 618 4 508 4 618 4 508 4 618 Purchased interest 2 460 3 177 2 460 3 177 2 460 3 177 Provisions and accrued employee entitlements not currently deductible - - 19 17 19 17 Tax losses carried forward 15 896 20 934 15 896 21 126 15 896 21 126
24 667 29 196 25 957 31 024 25 957 31 024
(e) Future Income Tax Benefit not Taken into Account The potential FITB in a controlled entity arising from tax losses and timing differences has not been recognised as an asset because recovery is not virtually certain:
Tax losses carried forward - - - 17 - -
- - - 17 - -
Any future income tax benefit will only be obtained if:
• MAC derives future assessable income of a nature and an amount sufficient to enable the benefit to be
realised, or the benefit can be utilised by another company in the economic entity in accordance with section 80G of the Income Tax Assessment Act 1936;
• the economic entity continues to comply with the conditions for deductibility imposed by the law; and • no changes in tax legislation adversely affect the economic entity in realising the benefit.
8. Receivables CTP Consolidated Commission 2000 1999 2000 1999 2000 1999
Current: $’000 $’000 $’000 $’000 $’000 $’000 Trade debtors 2 849 2 184 2 864 2 284 2 863 2 188 Less: Provision for doubtful debts - - - - - -
2 849 2 184 2 864 2 284 2 863 2 188 Investment debtors 27 016 2 970 27 138 3 133 27 138 3 133 Less: Provision for doubtful debts 234 164 234 164 234 164
26 782 2 806 26 904 2 969 26 904 2 969 Other debtors 38 31 51 33 118 75
29 669 5 021 29 819 5 286 29 885 5 232
Non-Current: Investment debtors - - 57 230 57 230 Other debtors - - 2 052 1 947 2 052 1 947
- - 2 109 2 177 2 109 2 177
Investment debtors consists of equities listed on stock exchanges for which contracts of sale had been completed but for which settlement had not been received at balance date together with interest, dividends and rental due on other investments.
Other debtors generally arise from transactions outside the usual operating activities of the economic entity.
9. Reinsurance and Other Recoveries Receivable CTP Consolidated Commission 2000 1999 2000 1999 2000 1999 $’000 $’000 $’000 $’000 $’000 $’000
Expected future recoveries (undiscounted) 14 565 17 675 14 565 17 675 14 565 17 675 Discount to present value* 2 498 2 883 2 498 2 883 2 498 2 883 Reinsurance and other recoveries receivable before provision for doubtful debts 12 067 14 792 12 067 14 792 12 067 14 792
Current:
Reinsurance and other recoveries receivable 2 985 3 485 2 985 3 485 2 985 3 485 Less: Provision for doubtful debts - - - - - -
2 985 3 485 2 985 3 485 2 985 3 485
Non-Current: Reinsurance and other recoveries receivable 9 082 11 307 9 082 11 307 9 082 11 307 Less: Provision for doubtful debts - - - - - -
9 082 11 307 9 082 11 307 9 082 11 307
* Refer to Note 15 for details of the inflation and discount rates used in the determination of this discounting adjustment.

Motor Accident Commission
956
10. Investments CTP Consolidated Commission
Current: 2000 1999 2000 1999 2000 1999 Fixed Interest: $’000 $’000 $’000 $’000 $’000 $’000
Deposits at call 25 173 125 185 40 594 125 185 40 594 125 185 Bank bills 22 839 - 22 839 - 22 839 - Foreign currency - - 4 453 4 200 4 453 4 200 Floating rate notes 10 152 - 10 152 - 10 152 - Government securities 33 137 33 308 33 137 33 308 33 137 33 308 Corporate debentures 40 684 36 060 40 684 36 060 40 684 36 060 Loans to controlled entities - - - - 120 120
Equities: Unlisted - - - 160 - 160 Futures 36 002 31 511 36 002 31 511 36 002 31 511
Total Current Investments 167 987 226 064 187 861 230 424 187 981 230 544
Non-Current: Fixed Interest:
Government securities 332 058 271 869 332 058 271 869 332 058 271 869 Corporate debentures 254 633 209 459 254 633 209 459 254 633 209 459 Commercial mortgages 3 949 4 177 4 684 7 591 4 684 7 591 International fixed interest - 25 602 - 25 602 - 25 602 Floating rate notes 20 281 - 20 281 - 20 281 - Capital indexed bonds 54 973 49 978 54 973 49 978 54 973 49 978
Equities: Listed on stock exchange 172 772 151 427 174 782 151 427 174 782 151 427 Unlisted - - 1 163 2 238 1 183 2 258
International equities 45 243 14 550 45 243 14 550 45 243 14 550 Property:
Independent valuation/certificate 29 425 40 153 29 425 40 153 29 425 40 153 Domestic listed property trust 29 777 24 865 29 777 24 865 29 777 24 865
Total Non-Current Investments 943 111 792 080 947 019 797 732 947 039 797 752
Total Investments 1 111 098 1 018 144 1 134 880 1 028 156 1 135 020 1 028 296
Property Valuations Independent valuations as at 30 June 2000, have been determined by: M J Schuh Certified Practising Valuer, AAPI P J McBurnie Certified Practising Valuer, AAPI R Aschberger Certified Practising Valuer, AAPI
All valuations for properties are made in accordance with the policy set out in Note 1(k)(i). 11. Other Current Assets CTP Consolidated Commission 2000 1999 2000 1999 2000 1999 $’000 $’000 $’000 $’000 $’000 $’000 Prepayments 9 716 9 191 9 716 9 193 9 716 9 193
12. Property, Plant and Equipment
Furniture and fittings, office equipment, and other assets - At cost - - 138 138 138 138 Less: Accumulated depreciation - - 13 9 13 9
- - 125 129 125 129 Plant and equipment - - 22 22 22 22 Less: Accumulated depreciation - - 11 8 11 8
- - 11 14 11 14 Computing equipment - - 50 42 50 42 Less: Accumulated depreciation - - 34 26 34 26
- - 16 16 16 16
Total Property, Plant and Equipment - - 152 159 152 159
13. Accounts Payable
Current Liabilities: Trade creditors - - 175 179 173 125 Investment creditors 29 701 2 240 29 701 2 240 29 701 2 240 Other creditors and accruals 13 901 3 439 13 901 3 439 13 901 3 439 Due to related parties 477 330 - - - -
44 079 6 009 43 777 5 858 43 775 5 804
14. Borrowings Current Borrowings:
Secured - - - 1 351 - 1 351
The entity is entitled to a return of money invested in an unlisted equity fund as a result of a sale of one of the businesses in the fund. As the final effective sale proceeds amount was dependent on the expiry of certain warranties given to the purchaser of the business, the fund made a form of provisional distribution of the proceeds by way of an interest free loan to investors, disclosed above as Borrowings - Secured. This transaction was finalised on 29 December 1999 and the loan was extinguished accordingly (refer Note 27).

Motor Accident Commission
957
15. Outstanding Claims CTP Consolidated Commission 2000 1999 2000 1999 2000 1999
(a) Expected future claims payments $’000 $’000 $’000 $’000 $’000 $’000 (undiscounted) 1 131 596 1 050 199 1 144 821 1 063 839 1 144 821 1 063 839 Discount to present value 177 331 146 714 178 086 147 894 178 086 147 894
Liability for outstanding claims 954 265 903 485 966 735 915 945 966 735 915 945
Current 256 489 234 298 258 322 236 161 258 322 236 161 Non-Current 697 776 669 187 708 413 679 784 708 413 679 784
(b) The following average inflation (normal CTP Consolidated Commission
and superimposed) rates and discount 2000 1999 2000 1999 2000 1999 rates were used in the measurement of Percent Percent Percent Percent Percent Percent outstanding claims:
For the succeeding year: Inflation rate 7.0 6.5 7.0 6.5 7.0 6.5 Discount rate 6.2 5.5 6.2 5.5 6.2 5.5
For subsequent years: Inflation rate 7.0 6.5 7.0 6.5 7.0 6.5 Discount rate 6.2 5.5 6.2 5.5 6.2 5.5
(c) The weighted average expected term to CTP Consolidated Commission
settlement of the outstanding claims 2000 1999 2000 1999 2000 1999 from the balance date is estimated to be: 3.0 years 3.0 years 3.0 years 3.0 years 3.0 years 3.0 years
The method of calculating outstanding claims is set out in detail in Note 1(e). Claims provision as at 30 June 2000 for the Compulsory Third Party Fund, Mortgage Guarantee Insurance and Workers Compensation have been reviewed by Mr L C Brett B.Sc, FIA, FIAA and Mr B A Watson B.Sc, FIAA of Brett & Watson Pty Ltd. For the Compulsory Third Party Fund, Mortgage Guarantee Insurance and Workers Compensation the Directors have adopted the central estimate as determined by the actuary and applied the recommended prudential margin. Inwards (overseas) Reinsurance has been reviewed by Mr I Brown B.A(Ec) of Run Off Resources Pty Ltd. For Inwards Reinsurance the Directors have adopted the report as prepared by the reinsurance expert.
16. Provisions CTP Consolidated Commission 2000 1999 2000 1999 2000 1999
Current Liabilities: $’000 $’000 $’000 $’000 $’000 $’000 State tax - Other - - 12 12 12 12 Provision for dividend payable - - 10 000 - 10 000 - Employee entitlements - - 51 35 51 35
- - 10 063 47 10 063 47
17. Additional Financial Instrument Disclosures
(1) Derivative Financial Instruments Options
The economic entity may enter into options that give it the right but not the obligation to purchase or sell specified securities and financial instruments. Options are entered into as a hedge against market risk. As at balance date there were no options held. Net Fair Values The net fair values of the economic entity’s derivative financial instruments which are traded on organised markets at balance date are those disclosed under ‘Interest Rate Risk’. All exchange traded financial instruments are carried at net fair value.
(2) Foreign Exchange Risk The economic entity enters into forward exchange contracts to hedge certain claims liabilities denominated in foreign currencies (principally United States dollars and Great Britain pounds). The terms of these commitments are rarely more than one month. It is economic entity policy to enter into forward foreign exchange contracts to hedge a proportion of foreign currency purchases and sales expected in each month. The amount of anticipated future purchases and sales are forecast in light of current conditions in foreign exchange markets, and information from insurers. As at 30 June 2000 the economic entity held no open forward foreign exchange contracts however it did hold physical foreign currency deposits as a hedge against liabilities denominated in foreign currencies.

Motor Accident Commission
958
17. Additional Financial Instrument Disclosures (3) Interest Rate Risk
The economic entity’s exposure to interest rate risk, repricing maturities and the weighted average effective interest rates on financial assets and financial liabilities at balance date is set out below:
2000 Consolidated* Floating Fixed Interest Rate Maturities Non-
Interest 1 year Over Interest 2000 Rate or less 1-5 years 5 years Bearing Total Financial Assets: $’000 $’000 $’000 $’000 $’000 $’000
Cash 52 765 - - - - 52 765 Debtors - - 2 052 - 29 876 31 928 Bonds - 33 137 320 155 11 903 - 365 195 Corporate bonds - 40 684 244 753 9 880 - 295 317 Floating rate notes - 10 152 - 20 281 - 30 433 Indexed annuities - - - 3 949 - 3 949 Capital indexed bonds - - - 54 973 - 54 973 Non-callable deposits and promissory notes - 22 839 - - - 22 839 Foreign currency - 4 453 - - - 4 453 Commercial mortgages - - 735 - - 735 Shares and other equity instruments - - - - 250 965 250 965 Futures 35 511 - - - 934 36 445 Property - - - - 29 425 29 425
Total Financial Assets 88 276 111 265 567 695 100 986 311 200 1 179 422
Weighted average interest rate percent 5.76 6.20 6.33 10.40
Financial Liabilities: Creditors - - - - 43 777 43 777 Futures - - - - 443 443
Total Financial Liabilities - - - - 44 220 44 220 Net Financial Assets (Liabilities) 88 276 111 265 567 695 100 986 266 980 1 135 202
* In accordance with Australian Accounting Standards Board AASB 1033 ‘Presentation and Disclosure of Financial
Instruments’, consolidated disclosure is provided only.
1999 Consolidated* Floating Fixed Interest Rate Maturities Non-
Interest 1 year Over Interest 1999 Rate or less 1-5 years 5 years Bearing Total Financial Assets: $’000 $’000 $’000 $’000 $’000 $’000
Cash 150 005 - - - - 150 005 Debtors - - 1 947 - 5 516 7 463 Bonds - 33 308 271 869 - - 305 177 Corporate bonds - 36 060 165 199 44 260 - 245 519 Floating rate notes - - 25 602 - - 25 602 Indexed annuity - - - 4 177 - 4 177 Capital indexed bonds - - - 49 978 - 49 978 Foreign currency - 4 200 - - - 4 200 Commercial mortgages - - 3 414 - - 3 414 Shares and other equity instruments - - - - 193 240 193 240 Futures 28 316 - - - 3 195 31 511 Property - - - - 40 153 40 153
Total Financial Assets 178 321 73 568 468 031 98 415 242 104 1 060 439
Weighted average interest rate percent 4.86 4.91 5.71 5.16 - -
Financial Liabilities: Creditors - - - - 5 858 5 858 Borrowings - - - - 1 351 1 351
Total Financial Liabilities - - - - 7 209 7 209 Net Financial Assets (Liabilities) 178 321 73 568 468 031 98 415 234 895 1 053 230
* In accordance with Australian Accounting Standards Board AASB 1033 ‘Presentation and Disclosure of Financial
Instruments’, consolidated disclosure is provided only.
(4) Credit Risk Exposures Credit risk represents the loss that would be recognised if counterparties failed to perform as contracted. On-Balance Sheet Financial Instruments The carrying amounts of financial assets included in the Balance Sheet represent the economic entity’s maximum exposure to credit risk to these assets. Where counterparties have a right to set-off and intend to settle on a net basis, this set-off has been reflected in the financial statements in accordance with accounting standards. The economic entity minimises concentrations of credit risk by undertaking transactions with a large number of counterparties. The economic entity is not materially exposed to any individual counterparty.
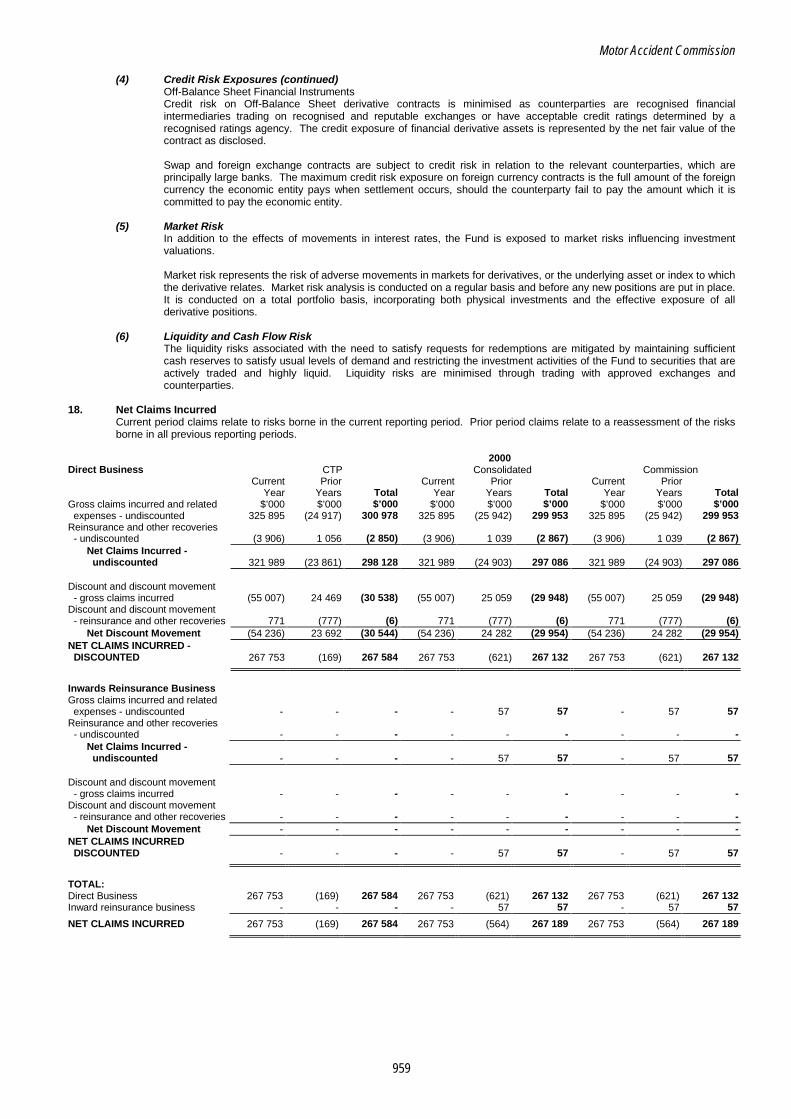
Motor Accident Commission
959
(4) Credit Risk Exposures (continued) Off-Balance Sheet Financial Instruments Credit risk on Off-Balance Sheet derivative contracts is minimised as counterparties are recognised financial intermediaries trading on recognised and reputable exchanges or have acceptable credit ratings determined by a recognised ratings agency. The credit exposure of financial derivative assets is represented by the net fair value of the contract as disclosed. Swap and foreign exchange contracts are subject to credit risk in relation to the relevant counterparties, which are principally large banks. The maximum credit risk exposure on foreign currency contracts is the full amount of the foreign currency the economic entity pays when settlement occurs, should the counterparty fail to pay the amount which it is committed to pay the economic entity.
(5) Market Risk In addition to the effects of movements in interest rates, the Fund is exposed to market risks influencing investment valuations. Market risk represents the risk of adverse movements in markets for derivatives, or the underlying asset or index to which the derivative relates. Market risk analysis is conducted on a regular basis and before any new positions are put in place. It is conducted on a total portfolio basis, incorporating both physical investments and the effective exposure of all derivative positions.
(6) Liquidity and Cash Flow Risk The liquidity risks associated with the need to satisfy requests for redemptions are mitigated by maintaining sufficient cash reserves to satisfy usual levels of demand and restricting the investment activities of the Fund to securities that are actively traded and highly liquid. Liquidity risks are minimised through trading with approved exchanges and counterparties.
18. Net Claims Incurred Current period claims relate to risks borne in the current reporting period. Prior period claims relate to a reassessment of the risks borne in all previous reporting periods.
2000 Direct Business CTP Consolidated Commission Current Prior Current Prior Current Prior Year Years Total Year Years Total Year Years Total Gross claims incurred and related $’000 $’000 $’000 $’000 $’000 $’000 $’000 $’000 $’000 expenses - undiscounted 325 895 (24 917) 300 978 325 895 (25 942) 299 953 325 895 (25 942) 299 953 Reinsurance and other recoveries - undiscounted (3 906) 1 056 (2 850) (3 906) 1 039 (2 867) (3 906) 1 039 (2 867)
Net Claims Incurred - undiscounted 321 989 (23 861) 298 128 321 989 (24 903) 297 086 321 989 (24 903) 297 086
Discount and discount movement - gross claims incurred (55 007) 24 469 (30 538) (55 007) 25 059 (29 948) (55 007) 25 059 (29 948) Discount and discount movement - reinsurance and other recoveries 771 (777) (6) 771 (777) (6) 771 (777) (6)
Net Discount Movement (54 236) 23 692 (30 544) (54 236) 24 282 (29 954) (54 236) 24 282 (29 954) NET CLAIMS INCURRED - DISCOUNTED 267 753 (169) 267 584 267 753 (621) 267 132 267 753 (621) 267 132
Inwards Reinsurance Business Gross claims incurred and related expenses - undiscounted - - - - 57 57 - 57 57 Reinsurance and other recoveries - undiscounted - - - - - - - - -
Net Claims Incurred - undiscounted - - - - 57 57 - 57 57
Discount and discount movement - gross claims incurred - - - - - - - - - Discount and discount movement - reinsurance and other recoveries - - - - - - - - -
Net Discount Movement - - - - - - - - - NET CLAIMS INCURRED DISCOUNTED - - - - 57 57 - 57 57
TOTAL: Direct Business 267 753 (169) 267 584 267 753 (621) 267 132 267 753 (621) 267 132 Inward reinsurance business - - - - 57 57 - 57 57
NET CLAIMS INCURRED 267 753 (169) 267 584 267 753 (564) 267 189 267 753 (564) 267 189

Motor Accident Commission
960
1999 Direct Business CTP Consolidated Commission Current Prior Current Prior Current Prior Year Years Total Year Years Total Year Years Total Gross claims incurred and related $’000 $’000 $’000 $’000 $’000 $’000 $’000 $’000 $’000 expenses - undiscounted 283 826 45 478 329 304 283 826 44 325 328 151 283 826 44 325 328 151 Reinsurance and other recoveries - undiscounted (3 529) (198) (3 727) (3 529) (236) (3 765) (3 529) (236) (3 765)
Net Claims Incurred - Undiscounted 280 297 45 280 325 577 280 297 44 089 324 386 280 297 44 089 324 386
Discount and discount movement gross claims incurred (43 669) 19 720 (23 949) (43 669) 19 825 (23 844) (43 669) 19 825 (23 844) Discount and discount movement - reinsurance and other recoveries 619 (160) 459 619 (160) 459 619 (160) 459
Net Discount Movement (43 050) 19 560 (23 490) (43 050) 19 665 (23 385) (43 050) 19 665 (23 385) NET CLAIMS INCURRED - DISCOUNTED 237 247 64 840 302 087 237 247 63 754 301 001 237 247 63 754 301 001
Inwards Reinsurance Business Gross claims incurred and related expenses -undiscounted - - - - 51 51 - 51 51 Reinsurance and other recoveries - undiscounted - - - - - - - - -
Net Claims Incurred -- Undiscounted - - - - 51 51 - 51 51
Discount and discount movement gross claims incurred - - - - - - - - - Discount and discount movement - reinsurance and other recoveries - - - - - - - - -
Net Discount Movement - - - - - - - - - NET CLAIMS INCURRED - DISCOUNTED - - - - 51 51 - 51 51
TOTAL: Direct Business 237 247 64 840 302 087 237 247 63 754 301 001 237 247 63 754 301 001 Inward reinsurance business - - - - 51 51 - 51 51
NET CLAIMS INCURRED 237 247 64 840 302 087 237 247 63 805 301 052 237 247 63 805 301 052
19. Commitments
Pursuant to a Claims Management Agreement, MAC contracted SGIC General Insurance Limited to manage the operations of the Fund for a period of at least three years, commencing 1 July 1995. A new Agreement has been entered into for a maximum period of a further three years commencing 1 July 1998. A base management fee is payable each year (adjusted by CPI) to SGIC General Insurance Limited until the contract concludes. SGIC General Insurance Limited is part of the NRMA Group. MAC has also entered into an Investment Management Agreement with Legal and General Financial Services Limited (LGFS), whereby LGFS is to manage the investment portfolio of the Fund. As a result of the recent takeover of LGFS by the Colonial Group, the investment management has been sub-contracted to Colonial First State Investment Managers Ltd (CFSIM). CFSIM is part of the Commonwealth Bank of Australia Group. LGFS remain responsible for the performance of CFSFM.
20. Investment in Controlled Entities Investment of Principal Commission Contribution to Activity Entity Interest At Cost Consolidated Profit 2000 1999 2000 1999 2000 1999 Percent Percent $’000 $’000 $’000 $’000
MAC 18 419 (24 725) Controlled Entities:
Southern Group Insurance Corporation Limited Trustee 100 100 20 20 50 (48) SGIC Pty Ltd Dissolved - - - - - -
Bouvet Pty Ltd Dissolved - - - - - 2 SA Projects Pty Ltd Dissolved - - - - - -
Consolidation eliminations and adjustments - - - - - (76)
Consolidated after tax profit 18 496 (24 847)
All controlled entities are incorporated in Australia. Acquisition of Controlled Entity None. Disposal of Controlled Entities SGIC Pty Ltd, Bouvet Pty Ltd and SA Projects Ltd were dissolved on 6 May 1999.
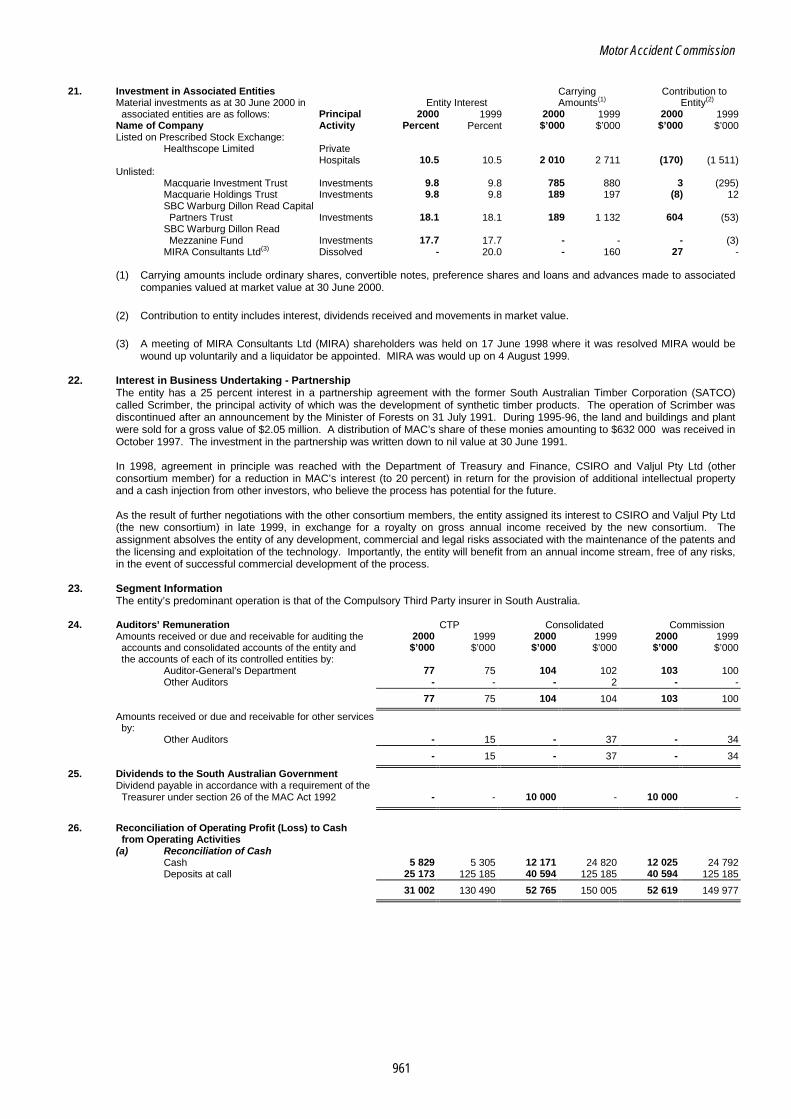
Motor Accident Commission
961
21. Investment in Associated Entities Carrying Contribution to
Material investments as at 30 June 2000 in Entity Interest Amounts(1) Entity(2) associated entities are as follows: Principal 2000 1999 2000 1999 2000 1999 Name of Company Activity Percent Percent $’000 $’000 $’000 $’000 Listed on Prescribed Stock Exchange:
Healthscope Limited Private Hospitals 10.5 10.5 2 010 2 711 (170) (1 511)
Unlisted: Macquarie Investment Trust Investments 9.8 9.8 785 880 3 (295) Macquarie Holdings Trust Investments 9.8 9.8 189 197 (8) 12 SBC Warburg Dillon Read Capital Partners Trust Investments 18.1 18.1 189 1 132 604 (53) SBC Warburg Dillon Read Mezzanine Fund Investments 17.7 17.7 - - - (3) MIRA Consultants Ltd(3) Dissolved - 20.0 - 160 27 -
(1) Carrying amounts include ordinary shares, convertible notes, preference shares and loans and advances made to associated
companies valued at market value at 30 June 2000.
(2) Contribution to entity includes interest, dividends received and movements in market value.
(3) A meeting of MIRA Consultants Ltd (MIRA) shareholders was held on 17 June 1998 where it was resolved MIRA would be wound up voluntarily and a liquidator be appointed. MIRA was would up on 4 August 1999.
22. Interest in Business Undertaking - Partnership
The entity has a 25 percent interest in a partnership agreement with the former South Australian Timber Corporation (SATCO) called Scrimber, the principal activity of which was the development of synthetic timber products. The operation of Scrimber was discontinued after an announcement by the Minister of Forests on 31 July 1991. During 1995-96, the land and buildings and plant were sold for a gross value of $2.05 million. A distribution of MAC’s share of these monies amounting to $632 000 was received in October 1997. The investment in the partnership was written down to nil value at 30 June 1991. In 1998, agreement in principle was reached with the Department of Treasury and Finance, CSIRO and Valjul Pty Ltd (other consortium member) for a reduction in MAC’s interest (to 20 percent) in return for the provision of additional intellectual property and a cash injection from other investors, who believe the process has potential for the future. As the result of further negotiations with the other consortium members, the entity assigned its interest to CSIRO and Valjul Pty Ltd (the new consortium) in late 1999, in exchange for a royalty on gross annual income received by the new consortium. The assignment absolves the entity of any development, commercial and legal risks associated with the maintenance of the patents and the licensing and exploitation of the technology. Importantly, the entity will benefit from an annual income stream, free of any risks, in the event of successful commercial development of the process.
23. Segment Information The entity’s predominant operation is that of the Compulsory Third Party insurer in South Australia.
24. Auditors’ Remuneration CTP Consolidated Commission Amounts received or due and receivable for auditing the 2000 1999 2000 1999 2000 1999 accounts and consolidated accounts of the entity and $’000 $’000 $’000 $’000 $’000 $’000 the accounts of each of its controlled entities by:
Auditor-General’s Department 77 75 104 102 103 100 Other Auditors - - - 2 - -
77 75 104 104 103 100
Amounts received or due and receivable for other services by:
Other Auditors - 15 - 37 - 34
- 15 - 37 - 34
25. Dividends to the South Australian Government Dividend payable in accordance with a requirement of the Treasurer under section 26 of the MAC Act 1992 - - 10 000 - 10 000 -
26. Reconciliation of Operating Profit (Loss) to Cash
from Operating Activities (a) Reconciliation of Cash
Cash 5 829 5 305 12 171 24 820 12 025 24 792 Deposits at call 25 173 125 185 40 594 125 185 40 594 125 185
31 002 130 490 52 765 150 005 52 619 149 977
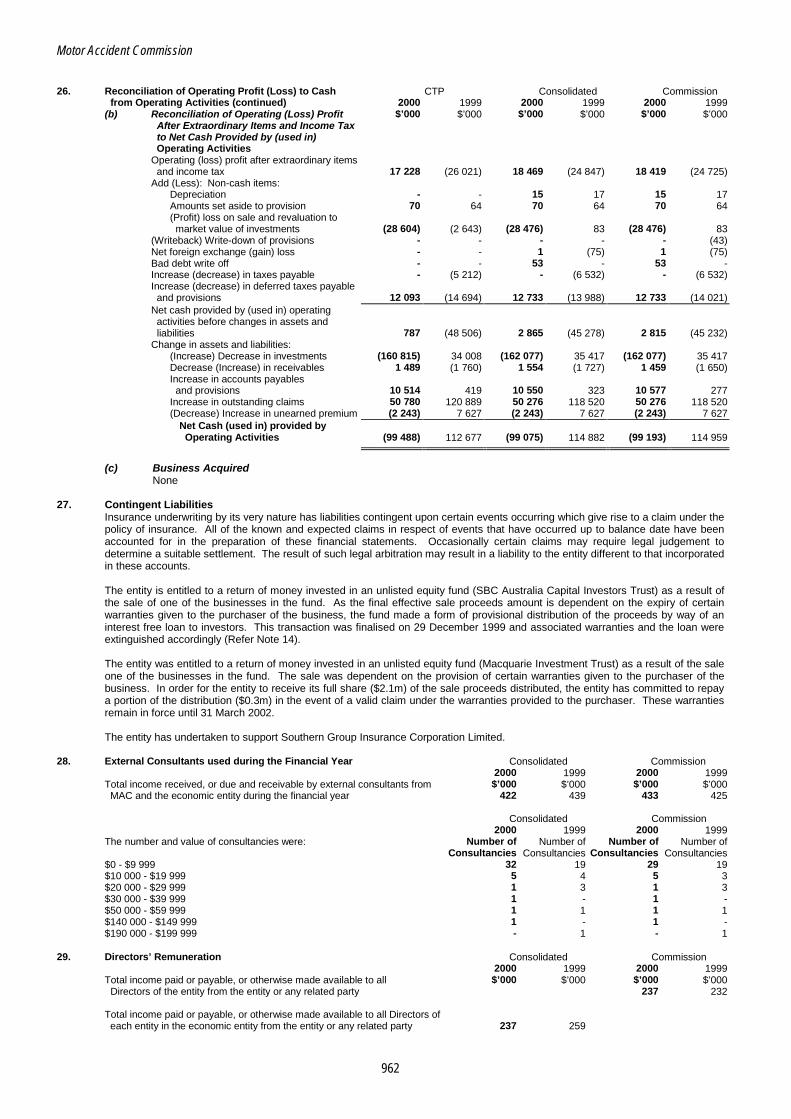
Motor Accident Commission
962
26. Reconciliation of Operating Profit (Loss) to Cash CTP Consolidated Commission
from Operating Activities (continued) 2000 1999 2000 1999 2000 1999 (b) Reconciliation of Operating (Loss) Profit $’000 $’000 $’000 $’000 $’000 $’000
After Extraordinary Items and Income Tax to Net Cash Provided by (used in) Operating Activities Operating (loss) profit after extraordinary items and income tax 17 228 (26 021) 18 469 (24 847) 18 419 (24 725) Add (Less): Non-cash items:
Depreciation - - 15 17 15 17 Amounts set aside to provision 70 64 70 64 70 64 (Profit) loss on sale and revaluation to market value of investments (28 604) (2 643) (28 476) 83 (28 476) 83
(Writeback) Write-down of provisions - - - - - (43) Net foreign exchange (gain) loss - - 1 (75) 1 (75) Bad debt write off - - 53 - 53 - Increase (decrease) in taxes payable - (5 212) - (6 532) - (6 532) Increase (decrease) in deferred taxes payable and provisions 12 093 (14 694) 12 733 (13 988) 12 733 (14 021) Net cash provided by (used in) operating activities before changes in assets and liabilities 787 (48 506) 2 865 (45 278) 2 815 (45 232) Change in assets and liabilities:
(Increase) Decrease in investments (160 815) 34 008 (162 077) 35 417 (162 077) 35 417 Decrease (Increase) in receivables 1 489 (1 760) 1 554 (1 727) 1 459 (1 650) Increase in accounts payables and provisions 10 514 419 10 550 323 10 577 277 Increase in outstanding claims 50 780 120 889 50 276 118 520 50 276 118 520 (Decrease) Increase in unearned premium (2 243) 7 627 (2 243) 7 627 (2 243) 7 627
Net Cash (used in) provided by Operating Activities (99 488) 112 677 (99 075) 114 882 (99 193) 114 959
(c) Business Acquired
None
27. Contingent Liabilities Insurance underwriting by its very nature has liabilities contingent upon certain events occurring which give rise to a claim under the policy of insurance. All of the known and expected claims in respect of events that have occurred up to balance date have been accounted for in the preparation of these financial statements. Occasionally certain claims may require legal judgement to determine a suitable settlement. The result of such legal arbitration may result in a liability to the entity different to that incorporated in these accounts. The entity is entitled to a return of money invested in an unlisted equity fund (SBC Australia Capital Investors Trust) as a result of the sale of one of the businesses in the fund. As the final effective sale proceeds amount is dependent on the expiry of certain warranties given to the purchaser of the business, the fund made a form of provisional distribution of the proceeds by way of an interest free loan to investors. This transaction was finalised on 29 December 1999 and associated warranties and the loan were extinguished accordingly (Refer Note 14). The entity was entitled to a return of money invested in an unlisted equity fund (Macquarie Investment Trust) as a result of the sale one of the businesses in the fund. The sale was dependent on the provision of certain warranties given to the purchaser of the business. In order for the entity to receive its full share ($2.1m) of the sale proceeds distributed, the entity has committed to repay a portion of the distribution ($0.3m) in the event of a valid claim under the warranties provided to the purchaser. These warranties remain in force until 31 March 2002. The entity has undertaken to support Southern Group Insurance Corporation Limited.
28. External Consultants used during the Financial Year Consolidated Commission 2000 1999 2000 1999
Total income received, or due and receivable by external consultants from $’000 $’000 $’000 $’000 MAC and the economic entity during the financial year 422 439 433 425
Consolidated Commission 2000 1999 2000 1999
The number and value of consultancies were: Number of Number of Number of Number of Consultancies Consultancies Consultancies Consultancies $0 - $9 999 32 19 29 19 $10 000 - $19 999 5 4 5 3 $20 000 - $29 999 1 3 1 3 $30 000 - $39 999 1 - 1 - $50 000 - $59 999 1 1 1 1 $140 000 - $149 999 1 - 1 - $190 000 - $199 999 - 1 - 1
29. Directors’ Remuneration Consolidated Commission 2000 1999 2000 1999
Total income paid or payable, or otherwise made available to all $’000 $’000 $’000 $’000 Directors of the entity from the entity or any related party 237 232
Total income paid or payable, or otherwise made available to all Directors of each entity in the economic entity from the entity or any related party 237 259
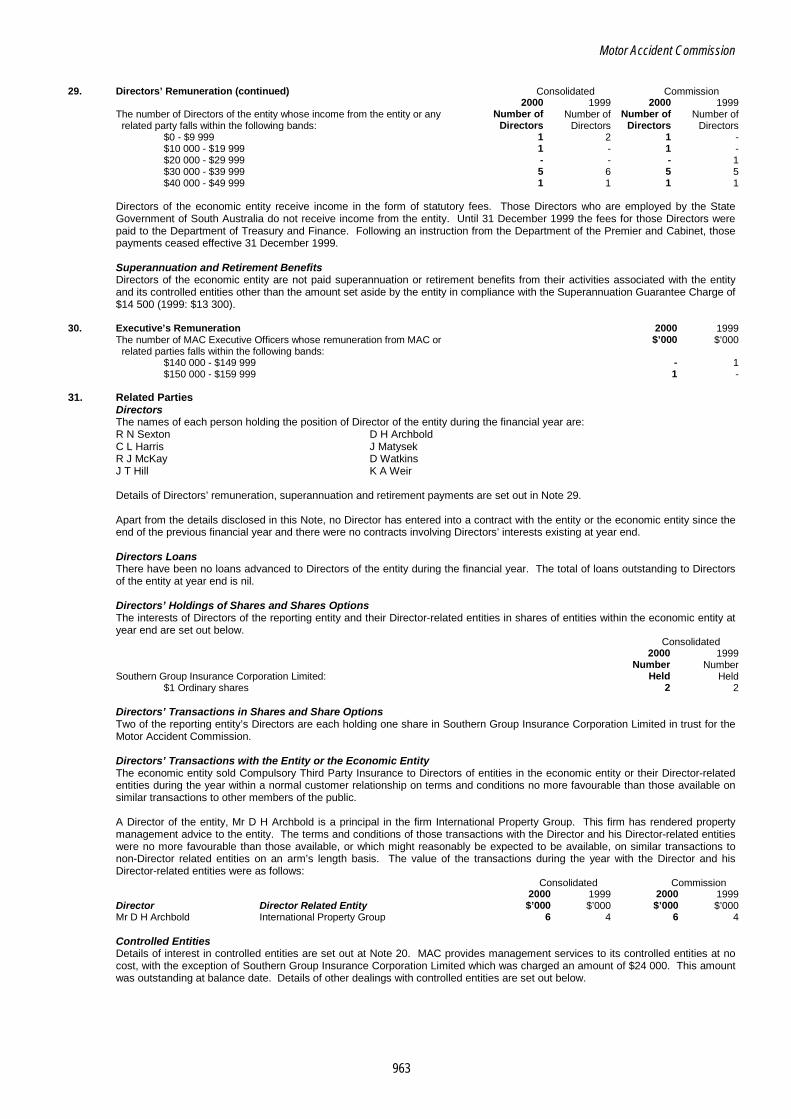
Motor Accident Commission
963
29. Directors’ Remuneration (continued) Consolidated Commission 2000 1999 2000 1999
The number of Directors of the entity whose income from the entity or any Number of Number of Number of Number of related party falls within the following bands: Directors Directors Directors Directors
$0 - $9 999 1 2 1 - $10 000 - $19 999 1 - 1 - $20 000 - $29 999 - - - 1 $30 000 - $39 999 5 6 5 5 $40 000 - $49 999 1 1 1 1
Directors of the economic entity receive income in the form of statutory fees. Those Directors who are employed by the State Government of South Australia do not receive income from the entity. Until 31 December 1999 the fees for those Directors were paid to the Department of Treasury and Finance. Following an instruction from the Department of the Premier and Cabinet, those payments ceased effective 31 December 1999.
Superannuation and Retirement Benefits Directors of the economic entity are not paid superannuation or retirement benefits from their activities associated with the entity and its controlled entities other than the amount set aside by the entity in compliance with the Superannuation Guarantee Charge of $14 500 (1999: $13 300).
30. Executive’s Remuneration 2000 1999
The number of MAC Executive Officers whose remuneration from MAC or $’000 $’000 related parties falls within the following bands:
$140 000 - $149 999 - 1 $150 000 - $159 999 1 -
31. Related Parties
Directors The names of each person holding the position of Director of the entity during the financial year are: R N Sexton D H Archbold C L Harris J Matysek R J McKay D Watkins J T Hill K A Weir Details of Directors’ remuneration, superannuation and retirement payments are set out in Note 29. Apart from the details disclosed in this Note, no Director has entered into a contract with the entity or the economic entity since the end of the previous financial year and there were no contracts involving Directors’ interests existing at year end. Directors Loans There have been no loans advanced to Directors of the entity during the financial year. The total of loans outstanding to Directors of the entity at year end is nil. Directors’ Holdings of Shares and Shares Options The interests of Directors of the reporting entity and their Director-related entities in shares of entities within the economic entity at year end are set out below.
Consolidated 2000 1999 Number Number Southern Group Insurance Corporation Limited: Held Held
$1 Ordinary shares 2 2 Directors’ Transactions in Shares and Share Options
Two of the reporting entity’s Directors are each holding one share in Southern Group Insurance Corporation Limited in trust for the Motor Accident Commission. Directors’ Transactions with the Entity or the Economic Entity The economic entity sold Compulsory Third Party Insurance to Directors of entities in the economic entity or their Director-related entities during the year within a normal customer relationship on terms and conditions no more favourable than those available on similar transactions to other members of the public. A Director of the entity, Mr D H Archbold is a principal in the firm International Property Group. This firm has rendered property management advice to the entity. The terms and conditions of those transactions with the Director and his Director-related entities were no more favourable than those available, or which might reasonably be expected to be available, on similar transactions to non-Director related entities on an arm’s length basis. The value of the transactions during the year with the Director and his Director-related entities were as follows:
Consolidated Commission 2000 1999 2000 1999
Director Director Related Entity $’000 $’000 $’000 $’000 Mr D H Archbold International Property Group 6 4 6 4
Controlled Entities Details of interest in controlled entities are set out at Note 20. MAC provides management services to its controlled entities at no cost, with the exception of Southern Group Insurance Corporation Limited which was charged an amount of $24 000. This amount was outstanding at balance date. Details of other dealings with controlled entities are set out below.
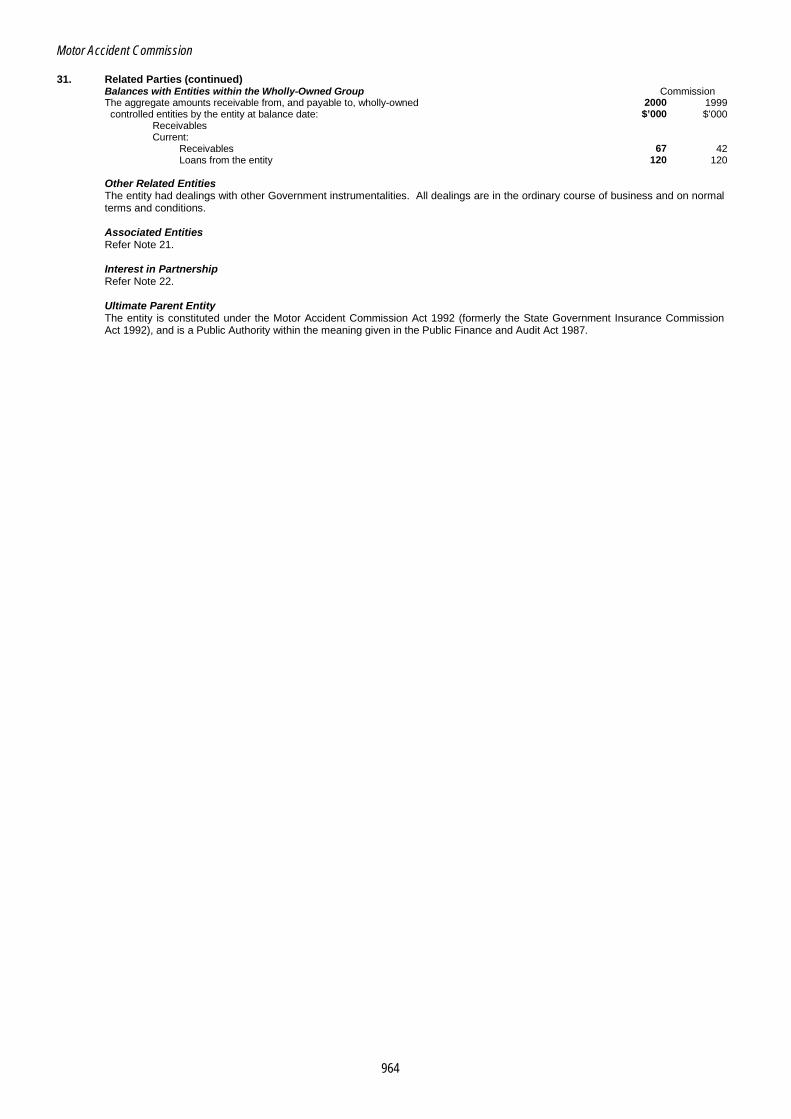
Motor Accident Commission
964
31. Related Parties (continued) Balances with Entities within the Wholly-Owned Group Commission The aggregate amounts receivable from, and payable to, wholly-owned 2000 1999 controlled entities by the entity at balance date: $’000 $’000
Receivables Current:
Receivables 67 42 Loans from the entity 120 120
Other Related Entities The entity had dealings with other Government instrumentalities. All dealings are in the ordinary course of business and on normal terms and conditions. Associated Entities Refer Note 21. Interest in Partnership Refer Note 22. Ultimate Parent Entity The entity is constituted under the Motor Accident Commission Act 1992 (formerly the State Government Insurance Commission Act 1992), and is a Public Authority within the meaning given in the Public Finance and Audit Act 1987.

965
POLICE SUPERANNUATION SCHEME FUNCTIONAL RESPONSIBILITY The Police Superannuation Board (the Board), established under the Police Superannuation Act 1990, is responsible for the collection of contributions from members of the Police Superannuation Scheme (the Scheme) and for the payment of superannuation benefits to members and members’ families. The main financial administration arrangements that apply in relation to the Scheme involve: • The Police Superannuation Fund (the Fund) — The Fund, established under the Police Superannuation
Act 1990, records as income to the Fund, members’ contributions and revenue derived from investment of those monies, and also records as payments from the Fund, the employee share of benefit payments and administration costs.
The Fund is comprised of two divisions, namely, an Old Scheme Division which provides pension benefits with a lump sum option and a New (Lump Sum) Scheme Division which provides lump sum benefits.
The investment management responsibility for the Fund is vested with the Superannuation Funds Management Corporation of South Australia (Funds SA) under the Police Superannuation Act 1990.
• The Police Superannuation Scheme Contribution Account (Employer Contribution Account) was established in 1994-95 to record employer contributions on behalf of the police officers and cadets. The employer share of the benefits paid and administration costs is met from the Employer Contribution Account. Monies deposited into the account are invested and managed by Funds SA but do not form part of the Fund.
Police officers and cadets who commenced employment on or before 31 May 1990 are members of the Old Scheme Division. Those police officers and cadets who commenced employment on or after 1 June 1990 are members of the New Scheme Division. The New Scheme Division was formally closed to new members through amendments to the Police Superannuation Act 1990 in October 1994. From 1 July 1995 police officers and cadets who commenced employment became members of the Southern State Superannuation Scheme which is administered by the South Australian Superannuation Board. STATUS OF FINANCIAL STATEMENTS The Board was unable to finalise its financial statements for the year ended 30 June 2000 in sufficient time to enable the audit to be completed at the date of finalisation of this Report. The audited financial statements of the Board for the year ended 30 June 2000 will be included in a Supplementary Audit Report to Parliament.
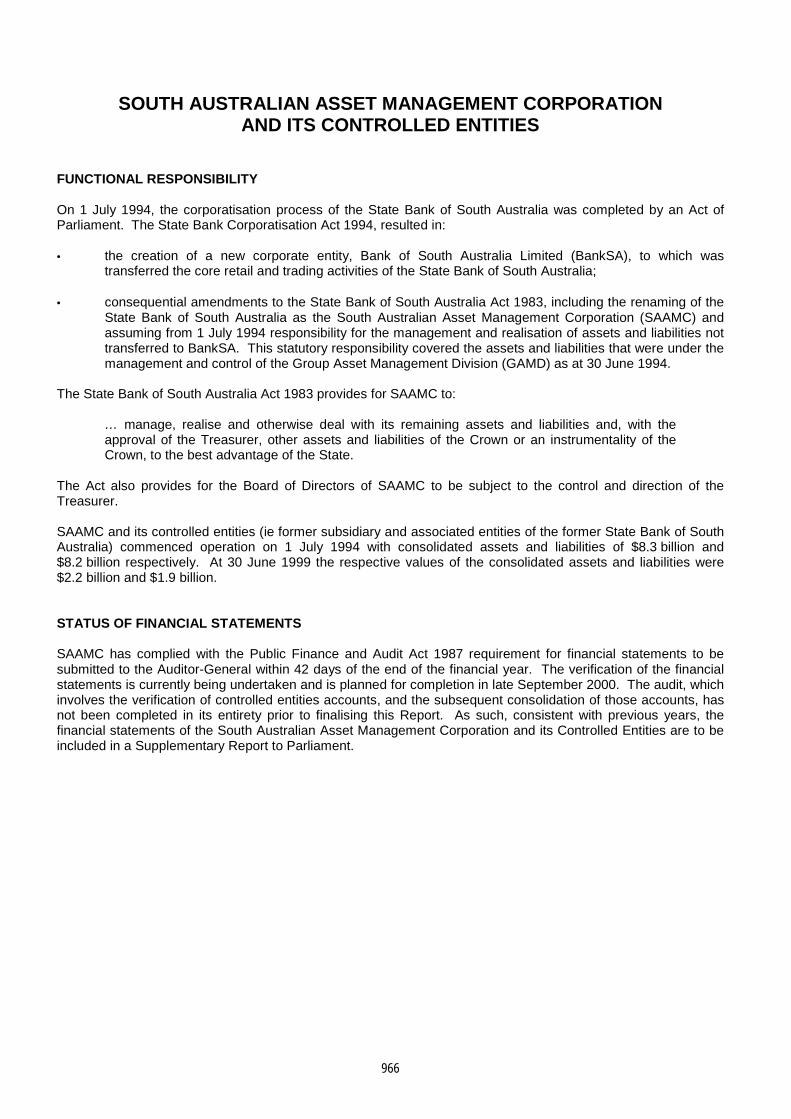
966
SOUTH AUSTRALIAN ASSET MANAGEMENT CORPORATION AND ITS CONTROLLED ENTITIES
FUNCTIONAL RESPONSIBILITY On 1 July 1994, the corporatisation process of the State Bank of South Australia was completed by an Act of Parliament. The State Bank Corporatisation Act 1994, resulted in: • the creation of a new corporate entity, Bank of South Australia Limited (BankSA), to which was
transferred the core retail and trading activities of the State Bank of South Australia;
• consequential amendments to the State Bank of South Australia Act 1983, including the renaming of the State Bank of South Australia as the South Australian Asset Management Corporation (SAAMC) and assuming from 1 July 1994 responsibility for the management and realisation of assets and liabilities not transferred to BankSA. This statutory responsibility covered the assets and liabilities that were under the management and control of the Group Asset Management Division (GAMD) as at 30 June 1994.
The State Bank of South Australia Act 1983 provides for SAAMC to:
… manage, realise and otherwise deal with its remaining assets and liabilities and, with the approval of the Treasurer, other assets and liabilities of the Crown or an instrumentality of the Crown, to the best advantage of the State.
The Act also provides for the Board of Directors of SAAMC to be subject to the control and direction of the Treasurer. SAAMC and its controlled entities (ie former subsidiary and associated entities of the former State Bank of South Australia) commenced operation on 1 July 1994 with consolidated assets and liabilities of $8.3 billion and $8.2 billion respectively. At 30 June 1999 the respective values of the consolidated assets and liabilities were $2.2 billion and $1.9 billion. STATUS OF FINANCIAL STATEMENTS SAAMC has complied with the Public Finance and Audit Act 1987 requirement for financial statements to be submitted to the Auditor-General within 42 days of the end of the financial year. The verification of the financial statements is currently being undertaken and is planned for completion in late September 2000. The audit, which involves the verification of controlled entities accounts, and the subsequent consolidation of those accounts, has not been completed in its entirety prior to finalising this Report. As such, consistent with previous years, the financial statements of the South Australian Asset Management Corporation and its Controlled Entities are to be included in a Supplementary Report to Parliament.
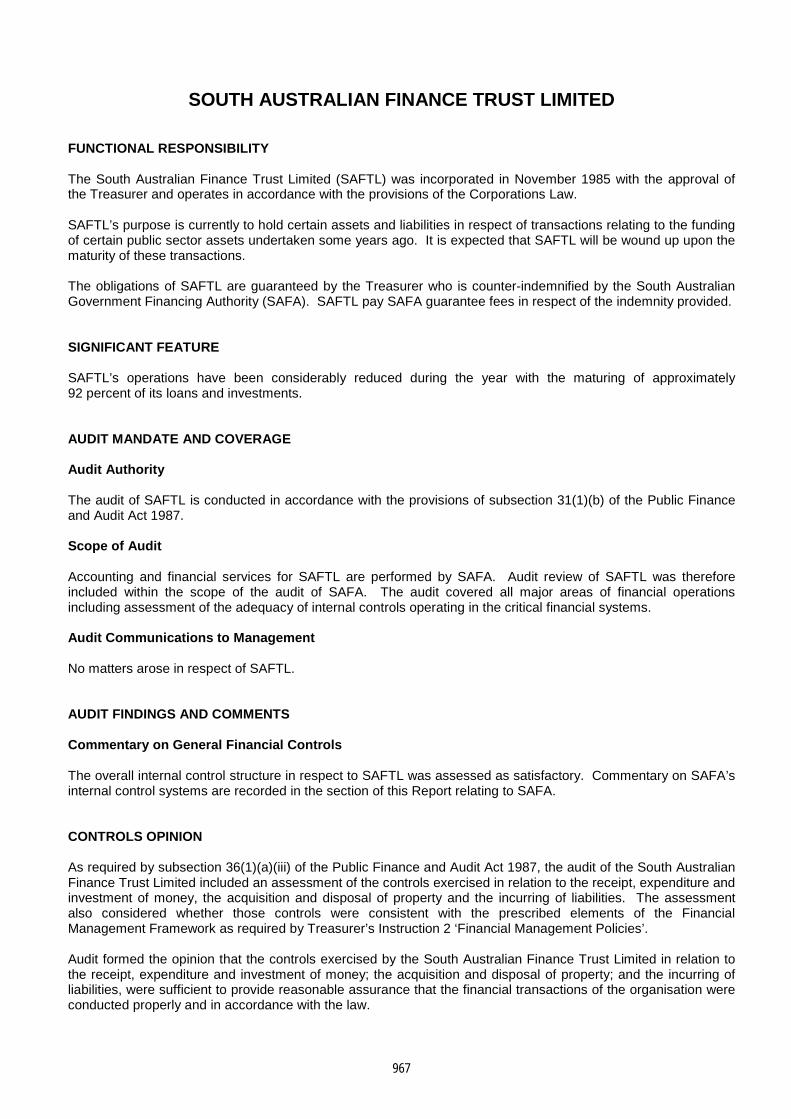
967
SOUTH AUSTRALIAN FINANCE TRUST LIMITED FUNCTIONAL RESPONSIBILITY The South Australian Finance Trust Limited (SAFTL) was incorporated in November 1985 with the approval of the Treasurer and operates in accordance with the provisions of the Corporations Law. SAFTL’s purpose is currently to hold certain assets and liabilities in respect of transactions relating to the funding of certain public sector assets undertaken some years ago. It is expected that SAFTL will be wound up upon the maturity of these transactions. The obligations of SAFTL are guaranteed by the Treasurer who is counter-indemnified by the South Australian Government Financing Authority (SAFA). SAFTL pay SAFA guarantee fees in respect of the indemnity provided. SIGNIFICANT FEATURE SAFTL’s operations have been considerably reduced during the year with the maturing of approximately 92 percent of its loans and investments. AUDIT MANDATE AND COVERAGE Audit Authority The audit of SAFTL is conducted in accordance with the provisions of subsection 31(1)(b) of the Public Finance and Audit Act 1987. Scope of Audit Accounting and financial services for SAFTL are performed by SAFA. Audit review of SAFTL was therefore included within the scope of the audit of SAFA. The audit covered all major areas of financial operations including assessment of the adequacy of internal controls operating in the critical financial systems. Audit Communications to Management No matters arose in respect of SAFTL. AUDIT FINDINGS AND COMMENTS Commentary on General Financial Controls The overall internal control structure in respect to SAFTL was assessed as satisfactory. Commentary on SAFA’s internal control systems are recorded in the section of this Report relating to SAFA. CONTROLS OPINION As required by subsection 36(1)(a)(iii) of the Public Finance and Audit Act 1987, the audit of the South Australian Finance Trust Limited included an assessment of the controls exercised in relation to the receipt, expenditure and investment of money, the acquisition and disposal of property and the incurring of liabilities. The assessment also considered whether those controls were consistent with the prescribed elements of the Financial Management Framework as required by Treasurer’s Instruction 2 ‘Financial Management Policies’. Audit formed the opinion that the controls exercised by the South Australian Finance Trust Limited in relation to the receipt, expenditure and investment of money; the acquisition and disposal of property; and the incurring of liabilities, were sufficient to provide reasonable assurance that the financial transactions of the organisation were conducted properly and in accordance with the law.

SA Finance Trust Limited
968
INTERPRETATION AND ANALYSIS OF FINANCIAL STATEMENTS There was a reduction in the SAFTL’s Balance Sheet with both total assets and total liabilities decreasing by $132.2 million (approximately 92 percent). The reduction primarily reflects the maturing of certain investments and borrowings with SAFA during the 1999-2000 year. Reference to Note 12 to the financial statements suggests that SAFTL would be in a position to be wound up within the 2000-01 financial year.

SA Finance Trust Limited
969
Operating Statement for the year ended 30 June 2000 2000 1999 Note $’000 $’000 INCOME:
Interest on: Loans 3 341 8 983 Investments 1 132 2 897
Total Income 4 473 11 880 LESS EXPENDITURE:
Interest on borrowings 4 319 11 560 Administration and fees 107 189
Total Expenditure 4 426 11 749 OPERATING PROFIT BEFORE INCOME TAX 47 131 Income tax expense 4 17 47 OPERATING PROFIT AFTER INCOME TAX 30 84 RETAINED PROFITS AT 1 JULY 1 122 1 038
RETAINED PROFITS AT 30 JUNE 1 152 1 122
Balance Sheet as at 30 June 2000
2000 1999 Note $’000 $’000 CURRENT ASSETS:
Interest paid in advance - 683 Interest accrued on loans and investments 3 735 147 Loans 2 - 102 783 Investments 3 7 648 39 980
Total Current Assets 11 383 143 593 Total Assets 11 383 143 593
CURRENT LIABILITIES:
Creditors 55 52 Interest received in advance - 2 919 Interest accrued on borrowings 27 720 Provisions 4 18 50 Borrowings 5 10 131 138 730
Total Current Liabilities 10 231 142 471 Total Liabilities 10 231 142 471
NET ASSETS 1 152 1 122
SHAREHOLDERS’ EQUITY:
Share capital 6 0 0 Retained profits 1 152 1 122
TOTAL SHAREHOLDERS’ EQUITY 1 152 1 122
Statement of Cash Flows for the year ended 30 June 2000 2000 1999 Inflows Inflows (Outflows) (Outflows) CASH FLOWS FROM OPERATING ACTIVITIES: $’000 $’000
Interest on loans 531 8 866 Interest on investments 503 2 005 Interest on borrowings (3 486) (11 632) Income tax paid (47) (40) Administration fees (105) (195)
Net Cash used in Operating Activities (2 604) (996)
CASH FLOWS FROM INVESTING ACTIVITIES: Repayments of loans 106 384 5 963 Proceeds from sale of investments 54 410 159 962 Loan advances (7 303) (4 845) Payments for purchase of investments (23 337) (119 295)
Net Cash provided by Investing Activities 130 154 41 785 CASH FLOWS FROM FINANCING ACTIVITIES:
Proceeds from new borrowings 25 193 173 022 Repayments of borrowings (154 638) (213 657)
Net Cash used in Financing Activities (129 445) (40 635) NET (DECREASE) INCREASE IN CASH HELD (1 895) 154 CASH AT 1 JULY 1 895 1 741
CASH AT 30 JUNE - 1 895
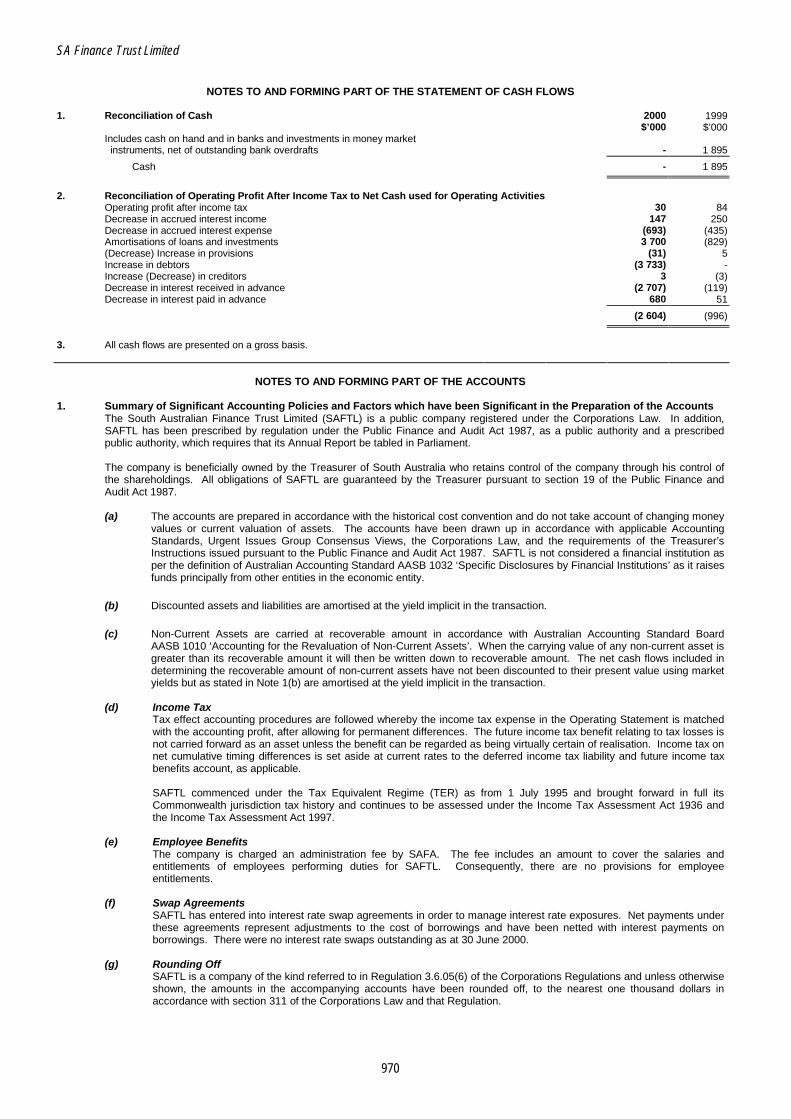
SA Finance Trust Limited
970
NOTES TO AND FORMING PART OF THE STATEMENT OF CASH FLOWS
1. Reconciliation of Cash 2000 1999 $’000 $’000
Includes cash on hand and in banks and investments in money market instruments, net of outstanding bank overdrafts - 1 895
Cash - 1 895
2. Reconciliation of Operating Profit After Income Tax to Net Cash used for Operating Activities
Operating profit after income tax 30 84 Decrease in accrued interest income 147 250 Decrease in accrued interest expense (693) (435) Amortisations of loans and investments 3 700 (829) (Decrease) Increase in provisions (31) 5 Increase in debtors (3 733) - Increase (Decrease) in creditors 3 (3) Decrease in interest received in advance (2 707) (119) Decrease in interest paid in advance 680 51
(2 604) (996)
3. All cash flows are presented on a gross basis.
NOTES TO AND FORMING PART OF THE ACCOUNTS 1. Summary of Significant Accounting Policies and Factors which have been Significant in the Preparation of the Accounts
The South Australian Finance Trust Limited (SAFTL) is a public company registered under the Corporations Law. In addition, SAFTL has been prescribed by regulation under the Public Finance and Audit Act 1987, as a public authority and a prescribed public authority, which requires that its Annual Report be tabled in Parliament. The company is beneficially owned by the Treasurer of South Australia who retains control of the company through his control of the shareholdings. All obligations of SAFTL are guaranteed by the Treasurer pursuant to section 19 of the Public Finance and Audit Act 1987. (a) The accounts are prepared in accordance with the historical cost convention and do not take account of changing money
values or current valuation of assets. The accounts have been drawn up in accordance with applicable Accounting Standards, Urgent Issues Group Consensus Views, the Corporations Law, and the requirements of the Treasurer’s Instructions issued pursuant to the Public Finance and Audit Act 1987. SAFTL is not considered a financial institution as per the definition of Australian Accounting Standard AASB 1032 ‘Specific Disclosures by Financial Institutions’ as it raises funds principally from other entities in the economic entity.
(b) Discounted assets and liabilities are amortised at the yield implicit in the transaction.
(c) Non-Current Assets are carried at recoverable amount in accordance with Australian Accounting Standard Board AASB 1010 ‘Accounting for the Revaluation of Non-Current Assets’. When the carrying value of any non-current asset is greater than its recoverable amount it will then be written down to recoverable amount. The net cash flows included in determining the recoverable amount of non-current assets have not been discounted to their present value using market yields but as stated in Note 1(b) are amortised at the yield implicit in the transaction.
(d) Income Tax
Tax effect accounting procedures are followed whereby the income tax expense in the Operating Statement is matched with the accounting profit, after allowing for permanent differences. The future income tax benefit relating to tax losses is not carried forward as an asset unless the benefit can be regarded as being virtually certain of realisation. Income tax on net cumulative timing differences is set aside at current rates to the deferred income tax liability and future income tax benefits account, as applicable.
SAFTL commenced under the Tax Equivalent Regime (TER) as from 1 July 1995 and brought forward in full its Commonwealth jurisdiction tax history and continues to be assessed under the Income Tax Assessment Act 1936 and the Income Tax Assessment Act 1997.
(e) Employee Benefits
The company is charged an administration fee by SAFA. The fee includes an amount to cover the salaries and entitlements of employees performing duties for SAFTL. Consequently, there are no provisions for employee entitlements.
(f) Swap Agreements
SAFTL has entered into interest rate swap agreements in order to manage interest rate exposures. Net payments under these agreements represent adjustments to the cost of borrowings and have been netted with interest payments on borrowings. There were no interest rate swaps outstanding as at 30 June 2000.
(g) Rounding Off
SAFTL is a company of the kind referred to in Regulation 3.6.05(6) of the Corporations Regulations and unless otherwise shown, the amounts in the accompanying accounts have been rounded off, to the nearest one thousand dollars in accordance with section 311 of the Corporations Law and that Regulation.

SA Finance Trust Limited
971
2. Loans 2000 1999
Current: $’000 $’000 Loans to companies - 102 783
Total Loans - 102 783
3. Investments
Current: Deposits - 1 895 Bills of exchange 7 648 38 095
Total Investment 7 648 39 980
(a) Investment in a Corporation not being a Subsidiary
SABT Pty Ltd One ordinary ‘A’ class share of $1 representing 50 percent of the issued and paid-up capital of SABT is held by SAFTL. The profit of SABT Pty Ltd for the period was nil, hence no contribution was made to SAFTL. SABT Pty Ltd repaid a loan of $56.8 million to SAFTL during 1999-2000. As at 30 June 2000, SAFTL has no outstanding transactions with SABT Pty Ltd. SABT will be wound up during 2000-01.
4. Provisions 2000 1999
Income tax $’000 $’000 The prima facie tax payable on operations is calculated as follows:
Operating profit before income tax 47 131
Income tax expense attributable to operation profit (at 36 percent) 17 47 Tax effect of timing differences (1) (1) Prepaid income tax - - Provision for tax payable 16 46 Other 2 4
Total Provisions 18 50
5. Borrowings
Current: Borrowings from SAFA 10 131 92 576 Promissory notes - 46 154
Total Borrowings 10 131 138 730
6. Share Capital
Authorised ordinary shares 100 000 of $1 each 100 100
Issued ordinary shares 5 of $1 each 0 0
7. Auditor’s Remuneration
Amounts paid to the auditors for auditing the accounts of the Company 2 3
8. Segment Reporting
The Company predominantly operates in one geographical segment, Australia, and its activities are confined to the holding of certain assets and liabilities in respect of transactions relating to the funding of public sector assets undertaken several years ago.
9. Remuneration of Directors Directors of SAFTL receive no remuneration from the Company.
10. Remuneration of Executives The Company does not directly employ any executives. Instead, it pays an administration fee to SAFA to cover, inter alia, the remuneration of SAFA employees who perform duties for SAFTL.
11. Indemnity Fee In consideration of certain undertakings given by the company and of guarantee fees payable to SAFA, it has been agreed that SAFA will pay a fee to the company in respect of six-monthly accounting periods where it is shown that income of SAFTL is insufficient to meet aggregate borrowing costs and expenses properly incurred in the normal course of business. The amount of the fee is not less than an amount certified in writing by the Directors as being the deficiency between income and such costs and expenses in the relevant accounting period. There was no fee payable in 1999-2000.
12. Receivables and Payable Maturity Analysis The maturity table published below must be interpreted with regard to SAFTL’s activities and the basis on which the table has been prepared. SAFTL is primarily dealing in financial instruments, but is not a financial institution. The table reflects the recorded maturity of the assets and liabilities but does not depict the liquidity of those assets and liabilities. This liquidity allows SAFTL to manage its affairs in a manner which ensures it will always be in a position to meet its obligations.
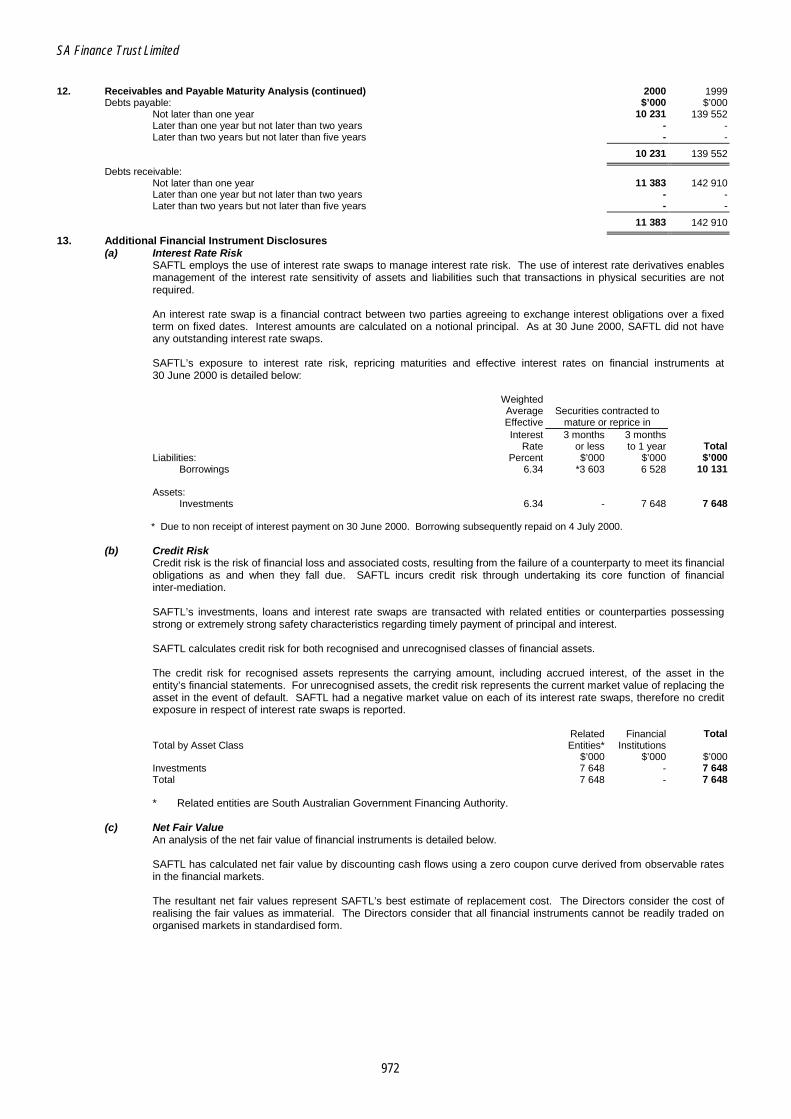
SA Finance Trust Limited
972
12. Receivables and Payable Maturity Analysis (continued) 2000 1999
Debts payable: $’000 $’000 Not later than one year 10 231 139 552 Later than one year but not later than two years - - Later than two years but not later than five years - -
10 231 139 552
Debts receivable: Not later than one year 11 383 142 910 Later than one year but not later than two years - - Later than two years but not later than five years - -
11 383 142 910
13. Additional Financial Instrument Disclosures (a) Interest Rate Risk
SAFTL employs the use of interest rate swaps to manage interest rate risk. The use of interest rate derivatives enables management of the interest rate sensitivity of assets and liabilities such that transactions in physical securities are not required. An interest rate swap is a financial contract between two parties agreeing to exchange interest obligations over a fixed term on fixed dates. Interest amounts are calculated on a notional principal. As at 30 June 2000, SAFTL did not have any outstanding interest rate swaps. SAFTL’s exposure to interest rate risk, repricing maturities and effective interest rates on financial instruments at 30 June 2000 is detailed below:
Weighted Average Securities contracted to Effective mature or reprice in Interest 3 months 3 months Rate or less to 1 year Total
Liabilities: Percent $’000 $’000 $’000 Borrowings 6.34 *3 603 6 528 10 131
Assets:
Investments 6.34 - 7 648 7 648 * Due to non receipt of interest payment on 30 June 2000. Borrowing subsequently repaid on 4 July 2000.
(b) Credit Risk Credit risk is the risk of financial loss and associated costs, resulting from the failure of a counterparty to meet its financial obligations as and when they fall due. SAFTL incurs credit risk through undertaking its core function of financial inter-mediation. SAFTL’s investments, loans and interest rate swaps are transacted with related entities or counterparties possessing strong or extremely strong safety characteristics regarding timely payment of principal and interest. SAFTL calculates credit risk for both recognised and unrecognised classes of financial assets. The credit risk for recognised assets represents the carrying amount, including accrued interest, of the asset in the entity’s financial statements. For unrecognised assets, the credit risk represents the current market value of replacing the asset in the event of default. SAFTL had a negative market value on each of its interest rate swaps, therefore no credit exposure in respect of interest rate swaps is reported.
Related Financial Total
Total by Asset Class Entities* Institutions $’000 $’000 $’000
Investments 7 648 - 7 648 Total 7 648 - 7 648
* Related entities are South Australian Government Financing Authority.
(c) Net Fair Value An analysis of the net fair value of financial instruments is detailed below. SAFTL has calculated net fair value by discounting cash flows using a zero coupon curve derived from observable rates in the financial markets. The resultant net fair values represent SAFTL’s best estimate of replacement cost. The Directors consider the cost of realising the fair values as immaterial. The Directors consider that all financial instruments cannot be readily traded on organised markets in standardised form.
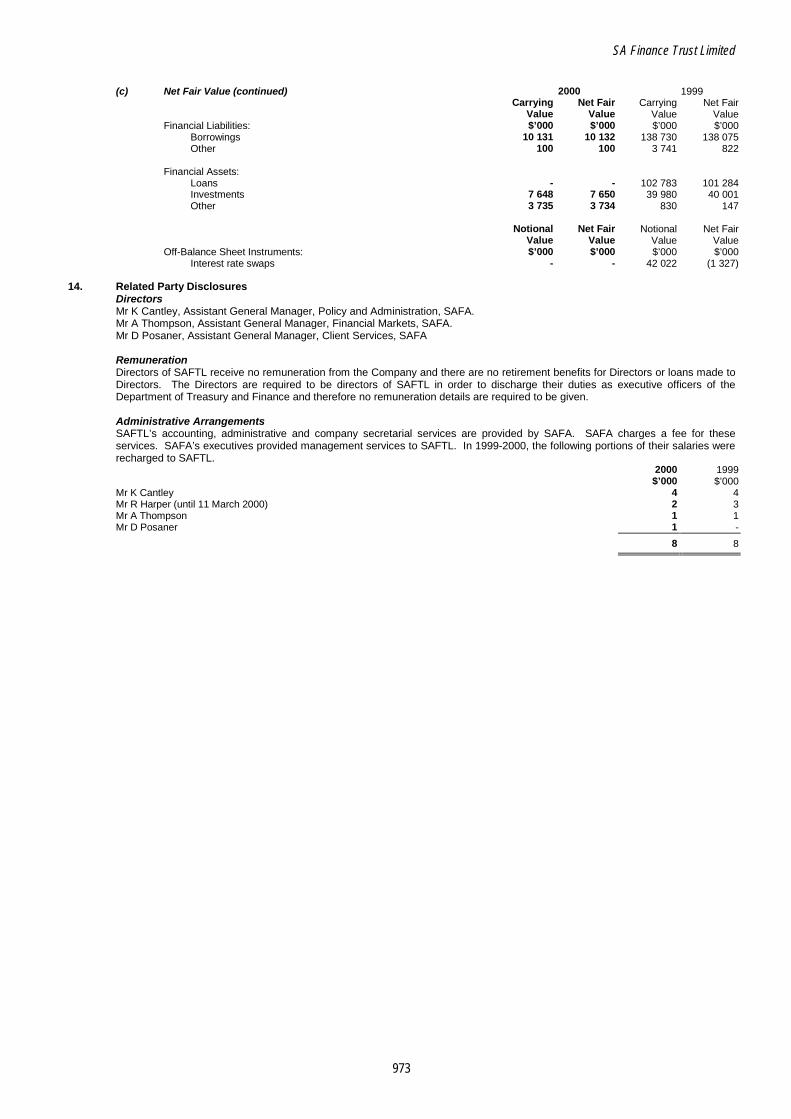
SA Finance Trust Limited
973
(c) Net Fair Value (continued) 2000 1999
Carrying Net Fair Carrying Net Fair Value Value Value Value
Financial Liabilities: $’000 $’000 $’000 $’000 Borrowings 10 131 10 132 138 730 138 075 Other 100 100 3 741 822
Financial Assets:
Loans - - 102 783 101 284 Investments 7 648 7 650 39 980 40 001 Other 3 735 3 734 830 147
Notional Net Fair Notional Net Fair Value Value Value Value
Off-Balance Sheet Instruments: $’000 $’000 $’000 $’000 Interest rate swaps - - 42 022 (1 327)
14. Related Party Disclosures
Directors Mr K Cantley, Assistant General Manager, Policy and Administration, SAFA. Mr A Thompson, Assistant General Manager, Financial Markets, SAFA. Mr D Posaner, Assistant General Manager, Client Services, SAFA Remuneration Directors of SAFTL receive no remuneration from the Company and there are no retirement benefits for Directors or loans made to Directors. The Directors are required to be directors of SAFTL in order to discharge their duties as executive officers of the Department of Treasury and Finance and therefore no remuneration details are required to be given. Administrative Arrangements SAFTL’s accounting, administrative and company secretarial services are provided by SAFA. SAFA charges a fee for these services. SAFA’s executives provided management services to SAFTL. In 1999-2000, the following portions of their salaries were recharged to SAFTL.
2000 1999 $’000 $’000
Mr K Cantley 4 4 Mr R Harper (until 11 March 2000) 2 3 Mr A Thompson 1 1 Mr D Posaner 1 -
8 8
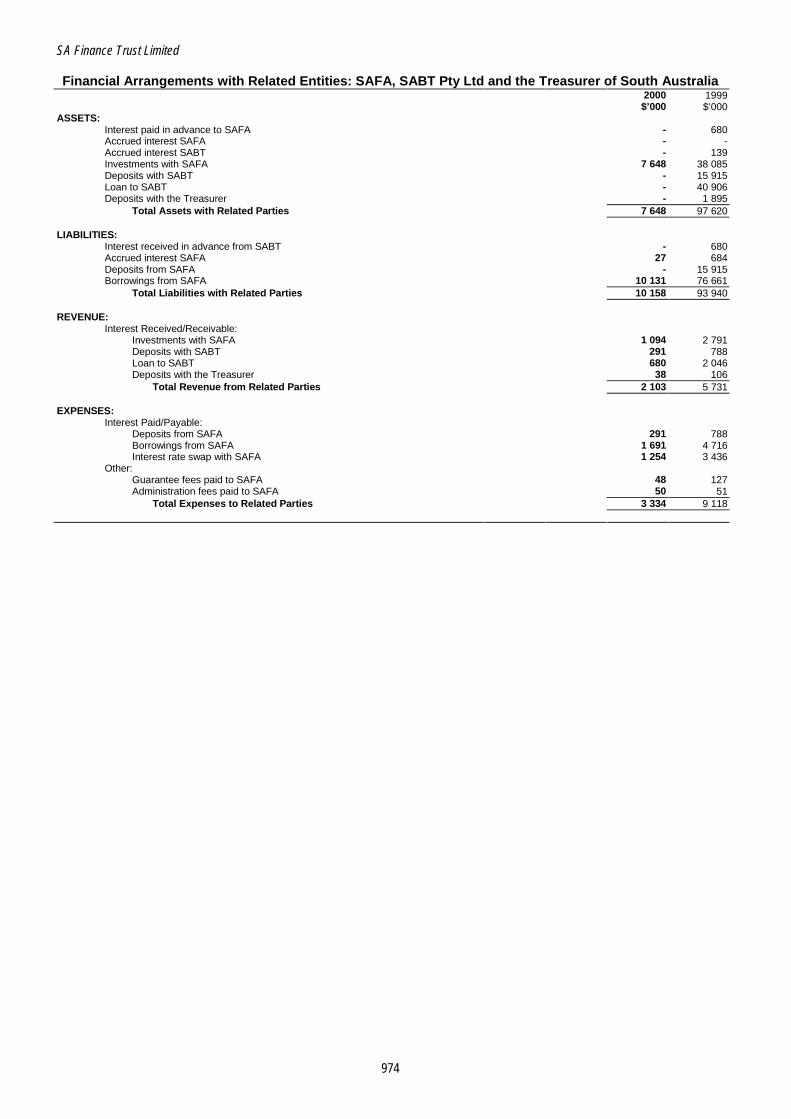
SA Finance Trust Limited
974
Financial Arrangements with Related Entities: SAFA, SABT Pty Ltd and the Treasurer of South Australia 2000 1999 $’000 $’000 ASSETS:
Interest paid in advance to SAFA - 680 Accrued interest SAFA - - Accrued interest SABT - 139 Investments with SAFA 7 648 38 085 Deposits with SABT - 15 915 Loan to SABT - 40 906 Deposits with the Treasurer - 1 895
Total Assets with Related Parties 7 648 97 620 LIABILITIES:
Interest received in advance from SABT - 680 Accrued interest SAFA 27 684 Deposits from SAFA - 15 915 Borrowings from SAFA 10 131 76 661
Total Liabilities with Related Parties 10 158 93 940 REVENUE:
Interest Received/Receivable: Investments with SAFA 1 094 2 791 Deposits with SABT 291 788 Loan to SABT 680 2 046 Deposits with the Treasurer 38 106
Total Revenue from Related Parties 2 103 5 731 EXPENSES:
Interest Paid/Payable: Deposits from SAFA 291 788 Borrowings from SAFA 1 691 4 716 Interest rate swap with SAFA 1 254 3 436
Other: Guarantee fees paid to SAFA 48 127 Administration fees paid to SAFA 50 51
Total Expenses to Related Parties 3 334 9 118

975
SOUTH AUSTRALIAN GOVERNMENT CAPTIVE INSURANCE CORPORATION (SAICORP)
FUNCTIONAL RESPONSIBILITY The South Australian Government Captive Insurance Corporation (SAICORP) is a subsidiary corporation of the Treasurer, established pursuant to Regulations under the Public Corporations Act 1993, and provides a formal structure for the administration of the Government’s insurance and risk management arrangements. It is governed by a Board which consists of seven members, who are appointed by the Treasurer, as responsible Minister. The Corporation is subject to the control and direction of the Treasurer, as its Minister, and administratively forms a separate branch within the Department of Treasury and Finance:
Treasurer
SAICORP Board
General Manager
Finance and Administration
Risk Management
UnderwritingClaims
Management
Deputy General Manager
SAICORP’s function is primarily to undertake and carry on in South Australia and elsewhere the business of insurers, reinsurers and co-insurers of all or any risks of the Crown and to provide advice to the Crown on issues relating to the insurance and management of risks of the Crown. In carrying out this function, SAICORP, among other things, undertakes the following key activities and programs: Agency Agreements All government departments and statutory authorities, unless exempted by the Treasurer, are insured with SAICORP. An Agency Agreement sets out the cover provided and the level of excess (deductible) required to be met by the agency prior to the loss being met by SAICORP. The premium charged is based on risk factors and risk management practices in place at agencies. Catastrophe Reinsurance The State Government is fundamentally a self-insurer. However, to protect the State’s finances against a very large loss or claim or a series of large losses or claims, a catastrophe reinsurance program is placed in the international insurance market through SAICORP. The program covers a 12 month period commencing 1 October each year. The premium expense relating to the 1999-2000 financial year was $6.3 million.

SA Government Captive Insurance Corporation
976
Overall, the structure of SAICORP’s catastrophe insurance arrangements can be depicted as follows:
$1M $5,000 $3M/$1M $1M $3M/$1M
$15M - $15M$20M
(indexed) $15M
$600M$500M
$350M
$150M $150M
$1M
$15M
$100M
Each & Every Event Retention (Agency and/or SAICORP)
Aggregate Annual Retention
(SAICORP*)
Catastrophe Program Cover (Reinsurance)
Industrial Special Risks
Aviation Liability
Public &Products
Liability
Medical Malpractice
Professional Indemnity
and Directors
and Officers Liability
Forestry Growing Timber
* Except Forestry Growing Timber, where the retention is held by Forestry SA
Risk Management Advice SAICORP provides whole-of-government risk advice to the Government and directly to agencies. This is achieved through various means, including: • publishing a periodic newsletter and other risk management resource material, such as the Risk
Management and Insurance Manual and a Workbook for Managing Risk;
• providing limited sponsorship funding to agencies for risk management initiatives;
• active representation on various insurance and risk management associations;
• coordinating meetings of the Government Risk Management Forums and the Government Risk Management Coordinators Network;
• contributing to the development of whole-of-government policies on risk (eg liability capping within government contracts);
• providing ad hoc advice as required (eg reviewing government contracts, sitting on agency risk management committees, etc).
Treasurer’s Indemnity Pursuant to section 19 of the Public Finance and Audit Act 1987, the Treasurer has indemnified SAICORP to the extent necessary to satisfy all its liabilities which arise out of the carrying out of its functions in accordance with the Public Corporations (Treasurer) Regulations 1994.
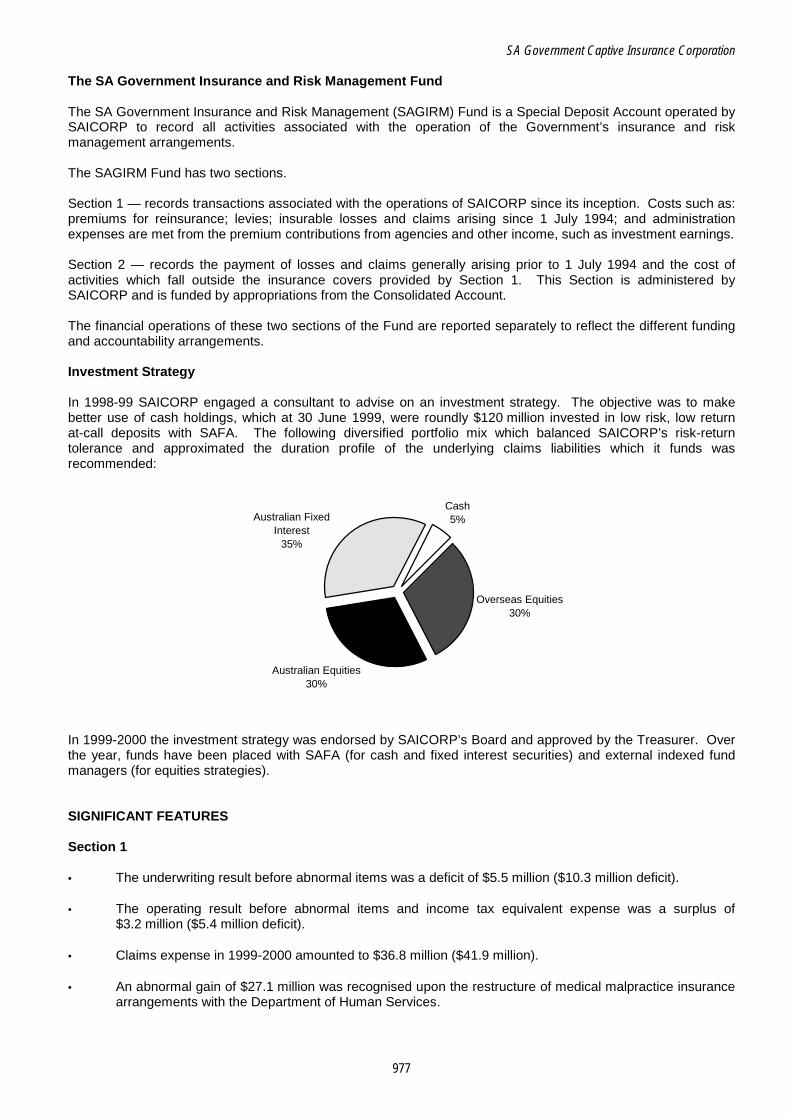
SA Government Captive Insurance Corporation
977
The SA Government Insurance and Risk Management Fund The SA Government Insurance and Risk Management (SAGIRM) Fund is a Special Deposit Account operated by SAICORP to record all activities associated with the operation of the Government’s insurance and risk management arrangements. The SAGIRM Fund has two sections. Section 1 — records transactions associated with the operations of SAICORP since its inception. Costs such as: premiums for reinsurance; levies; insurable losses and claims arising since 1 July 1994; and administration expenses are met from the premium contributions from agencies and other income, such as investment earnings. Section 2 — records the payment of losses and claims generally arising prior to 1 July 1994 and the cost of activities which fall outside the insurance covers provided by Section 1. This Section is administered by SAICORP and is funded by appropriations from the Consolidated Account. The financial operations of these two sections of the Fund are reported separately to reflect the different funding and accountability arrangements. Investment Strategy In 1998-99 SAICORP engaged a consultant to advise on an investment strategy. The objective was to make better use of cash holdings, which at 30 June 1999, were roundly $120 million invested in low risk, low return at-call deposits with SAFA. The following diversified portfolio mix which balanced SAICORP’s risk-return tolerance and approximated the duration profile of the underlying claims liabilities which it funds was recommended:
Australian Equities30%
Cash5%Australian Fixed
Interest35%
Overseas Equities30%
In 1999-2000 the investment strategy was endorsed by SAICORP’s Board and approved by the Treasurer. Over the year, funds have been placed with SAFA (for cash and fixed interest securities) and external indexed fund managers (for equities strategies). SIGNIFICANT FEATURES Section 1 • The underwriting result before abnormal items was a deficit of $5.5 million ($10.3 million deficit).
• The operating result before abnormal items and income tax equivalent expense was a surplus of $3.2 million ($5.4 million deficit).
• Claims expense in 1999-2000 amounted to $36.8 million ($41.9 million).
• An abnormal gain of $27.1 million was recognised upon the restructure of medical malpractice insurance arrangements with the Department of Human Services.

SA Government Captive Insurance Corporation
978
Section 2 • Claims expense in 1999-2000 amounted to $6.7 million ($15.7 million) before abnormals.
• An abnormal gain of $25.5 million was recognised following a major downwards revision of some significant outstanding liability estimates.
AUDIT MANDATE AND COVERAGE Audit Authority Subsection 13(3) of the Schedule to the Public Corporations Act 1993 specifically provides that the Auditor-General may at any time and, must in respect of each financial year, audit the accounts and financial statements of SAICORP. Scope of Audit The audit program covered all major financial systems and was directed primarily towards obtaining sufficient evidence to enable an audit opinion to be formed with respect to the financial statements and internal controls for both Section 1 and 2 of the SAGIRM Fund. During 1999-2000 specific areas of audit attention included: • Revenue raising, receipting and receivables • Claims management and settlement • Non claims expenditure, including reinsurance activities • General ledger, including journals and end-of-month reconciliations • Budgetary control and management reporting • General computer systems controls • Investment strategy. Certain accounting and financial services for SAICORP are performed by the Corporate Services Branch of the Department of Treasury and Finance (DTF). These aspects of the audit of SAICORP were therefore included within the scope of the audit of DTF. The audit covered all major areas of financial operations including assessment of the adequacy of internal controls operating in the critical financial systems. Audit Communications to Management During the year Audit communicated findings and issues to the General Manager. Also, as the SAICORP General Manager is a member of the DTF Executive Management Group and its Audit Committee, all correspondence was forwarded to the Director, Risk Management and Performance Review (DTF). Comments on material issues referred to management are contained in ‘Audit Findings and Comments’ hereunder. AUDIT FINDINGS AND COMMENTS Absence of Corporate Policies and Procedures The matter of absence of corporate policies and procedures was raised by both internal and external audit over successive years. While some work had commenced in 1998-99, the task remained largely incomplete as at 30 June 2000. SAICORP’s Response SAICORP acknowledged the need for policies and procedures and aims to have the task completed by December 2000.
SA Government Captive Insurance Corporation
979
Liability Capping in Government Contracts SAICORP has, over the past few years, been working with other government agencies (eg Crown Law) in developing revised policies for liability capping clauses in government contracts. Audit noted that, while government contracts had grown considerably in both nature and complexity over the past few years, the original policy which has proved impractical, has not yet been revised. SAICORP’s Response As a means of mitigating the risk arising from current arrangements, Agency Agreements have been amended, requiring them to advise SAICORP of any additional risks accepted pursuant to contractual limitations of liability, indemnities and similar provisions. Concurrently, SAICORP has been assisting the Department for Administrative and Information Services in finalising a proposal for a new government policy. Corporate Governance Corporate governance can be defined as the processes by which organisations are directed, controlled and held to account. In the case of corporations and subsidiaries formed under the Public Corporations Act 1993 (the Act), strict legislative requirements form the basis of the agency’s corporate governance framework. For subsidiary corporations formed under model regulations to the Act (approved by Cabinet in 1996), these requirements include the need to prepare a charter and performance statement, establish an Audit Committee and have in place monitoring and reporting mechanisms. SAICORP’s establishing regulations under the Act were drafted prior to the advent of the model regulations and hence do not incorporate the key corporate governance arrangements outlined above. Audit highlighted that this situation potentially creates an ambiguous context within which SAICORP’s Board may discharge its obligations. It was suggested that SAICORP, while not legally required to do so, voluntarily implement similar corporate governance mechanisms as apply to stand-alone corporations and other subsidiary corporations under the Act. SAICORP’s Response Management advised that the SAICORP Board, in August 2000, endorsed a proposal to form a Board sub-committee to develop a corporate governance framework, which will include a charter, corporate governance statement, performance agreement and service level agreement. CONTROLS OPINION As required by subsection 36(1)(a)(iii) of the Public Finance and Audit Act 1987, the audit of the South Australian Government Captive Insurance Corporation included an assessment of the controls exercised in relation to the receipt, expenditure and investment of money, the acquisition and disposal of property and the incurring of liabilities. Audit formed the opinion that the controls exercised by the South Australian Government Captive Insurance Corporation in relation to the receipt, expenditure and investment of money; the acquisition and disposal of property; and the incurring of liabilities, were sufficient to provide reasonable assurance that the financial transactions of the organisation were conducted properly and in accordance with the law. INTERPRETATION AND ANALYSIS OF FINANCIAL STATEMENTS Section 1 Section 1 of the SAGIRM Fund operates on a largely commercial basis, although neither the Treasurer, as responsible Minister, nor the Board, have stipulated specific earnings or return targets nor is a return specifically factored into SAICORP’s premium pricing structure.

SA Government Captive Insurance Corporation
980
Operating Performance
Claims Incurred Ratios (a)
0
50
100
150
200
250
300
1996 1997 1998 1999 2000
Rat
io(%
)
Claims Incurred Ratio (Medical Malpractice only)
Claims Incurred Ratio (Excluding Medical Malpractice)
Claims Incurred Ratio
(a) The claims incurred ratio is determined as claims expense divided by premium revenue. The claims incurred ratio gives an indication of the incurred claims experience by financial year. While the ratio is shown on a financial year basis, each year’s claims incurred expense represents both the risks borne in the current reporting period and the reassessment of risks borne in all previous reporting periods (which were not already factored into those reporting periods’ provisions for claims incurred but not reported and claims incurred but not enough reported). This principle is reflected in Note 16 ‘Net Claims Incurred’ to the financial statements. Accordingly, in interpreting the ratio the focus should be on trends over time rather than the experience of a single reporting period. Since 1999 the ratio has exceeded 100 percent meaning that claims incurred exceeded premium revenues. Even when the effect of reinsurance expense and related recoveries revenues are taken into account, the adjusted ratio (net claims incurred ratio) remains in excess of 100 percent for the 1999 and 2000 financial years. The table also shows, for financial years 1998 and onwards, a breakdown between the medical malpractice and other classes of insurance. The ratio for medical malpractice shows a loss situation for all three years, with a significantly better (and improving) performance for the remaining insurance classes. As a means of addressing this issue, SAICORP, as at 1 July 1999, restructured its medical malpractice insurance arrangements with the Department of Human Services (DHS). The restructure increased DHS’ deductible amount from $50 000 to $1 million and was backdated to 1 July 1994 (the effective date of inception of SAICORP). This resulted in a refund of $11.0 million, together with a net claims liability transfer of $38.1 million from SAICORP to DHS. The restructure shifted financial responsibility for medical malpractice claims up to $1 million from SAICORP to DHS. The effect of the restructure is shown in the financial statements as an abnormal item gain. However, even with the medical malpractice restructure, the claims incurred ratio for this insurance class continues to be poor and consequently SAICORP’s financial performance continues to be dependant upon the positive results from other classes of insurance. While SAICORP continues to play an active monitoring and advisory role with respect to all medical malpractice claims (ie including those below the $1 million DHS deductible), it is clear that, looking forward, this insurance class will continue to pose a challenge to both SAICORP and DHS.

SA Government Captive Insurance Corporation
981
Financial Position
Financial Ratios
0
20
40
60
80
100
120
140
160
1996 1997 1998 1999 2000
Rat
io(%
)
Claims Incurred Ratio (claims expense/premium revenue)
Invested assets to outstanding claims ratio
SAICORP has maintained a relatively stable ratio of invested assets to claims liability over the years, except for 1999. With the restructure of medical malpractice arrangements, the 2000 ratio has been restored to pre-1999 levels. The graph also shows the relationship between the claims incurred ratio and the invested assets to outstanding claims ratio. With a high claims incurred ratio, SAICORP needs to maximise its return on invested assets. Accordingly, an investment strategy was implemented in 1999-2000 which returned investment revenue of $9.3 million, compared to $5.5 million in 1998-99. Claims Outstanding In 1999 there was a significant increase in the claims outstanding liability, as measured by actuarial analysis. The increase was attributed principally to changes in claims estimates and actuarial assumptions for the medical malpractice insurance class. In 2000 the claims outstanding liability decreased by 9.7 percent, due mainly to the restructure of medical malpractice insurance arrangements with DHS, as referred to in the commentary above. Reserving Levels Following advice from its actuaries, the Board approved a free reserve target of $30 million. Free reserves, otherwise known as the solvency margin, are represented by net assets in SAICORP’s Statement of Financial Position and serve as protection against the possibility of one or more abnormally large claims being incurred in any one year. In 1999-2000 SAICORP for the first time achieved its reserve target, due largely to the restructure of medical malpractice insurance arrangements with DHS. Duration Matching Due to the implementation of its investment strategy in 1999-2000, SAICORP achieved a better match between its current and non-current assets and liabilities with the aim, over the long run, of earning a higher return on its investment holdings. Section 2 The net cost of Section 2 operations are essentially funded from the Consolidated Account. The negative net asset position reflects this arrangement, whereby major increases (decreases) to recurrent appropriations revenue will reflect significant changes in cash flows rather than the accrued claims expense incurred. In 1999-2000 the claims expense (excluding the effect of the abnormal item) decreased. An abnormal gain of $25.5 million was reported in 1999-2000 due to a downwards re-estimation of significant claims as a result of more accurate information becoming available over time.

SA Government Captive Insurance Corporation
982
SOUTH AUSTRALIAN GOVERNMENT CAPTIVE INSURANCE CORPORATION SECTION 1
Operating Statement for the year ended 30 June 2000
2000 1999 Note $’000 $’000
Operating revenue 3 49 404 48 102
OPERATING RESULT BEFORE ABNORMAL ITEMS AND INCOME TAX 2 3 218 (5 375) Abnormal items before income tax 6 27 146 (2 051) OPERATING RESULT AFTER ABNORMALS AND BEFORE INCOME TAX 30 364 (7 426) Income tax attributable to operating result and abnormals 7 (7 979) (279) OPERATING RESULT AFTER ABNORMALS AND INCOME TAX 22 385 (7 705) RETAINED SURPLUS AT 1 JULY 13 159 20 864
RETAINED SURPLUS AT 30 JUNE 35 544 13 159
Statement of Financial Position as at 30 June 2000 2000 1999 Note $’000 $’000 CURRENT ASSETS:
Cash 23 9 647 120 417 Receivables 8, 15 39 1 594 Investments 24 50 611 - Other 10 5 750 5 027
Total Current Assets 66 047 127 038 NON-CURRENT ASSETS:
Reinsurance and other recoveries receivable 9 10 268 4 717 Investments 24 74 588 -
Total Non-Current Assets 84 856 4 717 Total Assets 150 903 131 755
CURRENT LIABILITIES:
Creditors 11, 15 81 342 Unearned premium 3 418 3 299 Outstanding claims 13 22 043 20 306 Provision for income tax 7 7 979 - Other 12 288 252
Total Current Liabilities 33 809 24 199 NON-CURRENT LIABILITIES:
Outstanding claims 13 81 550 94 397 Total Non-Current Liabilities 81 550 94 397 Total Liabilities 115 359 118 596
NET ASSETS 35 544 13 159
EQUITY:
Retained surplus 13 159 20 864 Operating result for the period 22 385 (7 705)
TOTAL EQUITY 35 544 13 159
Commitments 17 Contingent Liabilities 25

SA Government Captive Insurance Corporation
983
Statement of Cash Flows for the year ended 30 June 2000 2000 1999 Inflows Inflows (Outflows) (Outflows) Note $’000 $’000 CASH FLOWS FROM OPERATING ACTIVITIES:
Premiums received 32 641 36 824 Commercial insurance placements received 2 594 684 Claim recoveries received 32 - Brokerage revenue received 1 057 1 054 Lead reinsurer fee received 152 - Interest received 4 601 5 460 Distributions from equity funds 1 294 - Deductibles collected 740 143 Other revenues 9 12 Abnormal item paid 6 (11 025) - Outwards reinsurance paid (6 258) (6 449) Commercial insurance placements paid (2 821) (727) Claims paid (5 452) (4 302) Indirect claim settlements costs paid - (191) Prepayments paid 1(p) (3 664) (3 550) Other underwriting and general administration expenses paid (3 303) (4 872)
Net cash provided by Operating Activities 23 10 597 24 086 CASH FLOWS FROM INVESTING ACTIVITIES:
Proceeds from maturing term deposits 72 757 - Payments for purchase of equity fund investments (73 294) - Payments for investment in indexed bond fund (48 073) - Payments for purchase of term deposit (72 757) -
Net cash used in Investing Activities (121 367) - NET (DECREASE) INCREASE IN CASH HELD (110 770) 24 086 Adjustment for the effect of exchange rate changes on the balances of cash held in foreign currency - (163) CASH AT 1 JULY 120 417 96 494
CASH AT 30 JUNE 1(n),23 9 647 120 417
NOTES TO AND FORMING PART OF THE GENERAL PURPOSE FINANCIAL STATEMENTS 1. Statements of Significant Accounting Policies
The significant policies which have been adopted in the preparation of this financial report are: (a) Objectives, Funding and Basis of Accounting
The South Australian Government Captive Insurance Corporation (‘SAICORP’ or ‘the Corporation’) is established as a subsidiary of the Treasurer by the Public Corporations (Treasurer) Regulations 1994, which were gazetted and came into effect on 29 September 1994.
The Corporation has been proclaimed to be a semi-government authority for the purposes of the Public Finance and Audit Act 1987 and the Treasurer has indemnified the Corporation ‘to the extent necessary to satisfy all the liabilities which arise out of the carrying out of its functions in accordance with the Public Corporations (Treasurer) Regulations 1994’.
This financial report encompasses all activities transacted through Section 1 of the interest bearing Special Deposit Account entitled ‘South Australian Government Insurance and Risk Management Fund’ (the SAGIRM Fund). The purpose of the SAGIRM Fund is to record receipts and payments associated with the operations of the Government’s insurance and risk management program.
Section 1 of the SAGIRM Fund reflects the normal commercial insurance activities of SAICORP, established to carry on the business of insuring, reinsuring and/or co-insuring the risks of the Crown.
SAICORPs objectives are to: • efficiently and effectively administer the Government’s insurance and risk management arrangements; • insure the risks of the Crown; • provide advice on the management of risks of the Crown.
The principal source of funds for Section 1 consists of monies received from agencies for insurance cover provided in relation to the current financial year.
SAICORP is also responsible for the administration of Section 2 of the SAGIRM Fund, from which are met claim payments in respect of incidents which occurred prior to 1 July 1994, claim payments in respect of uninsurable risks and any other payments which fall outside the insurance cover provided under Section 1.
Given the different funding and governance arrangements of Section 1 and Section 2, the principles of Australian Accounting Standard AAS 24 ‘Consolidated Financial Reports’ cannot be applied. Therefore two separate financial reports are prepared to discharge SAICORP's legislative disclosure obligations.

SA Government Captive Insurance Corporation
984
(a) Objectives, Funding and Basis of Accounting (continued) The financial report is a general purpose financial report which, in accordance with section 13 of the Schedule to the Public Corporations Act 1993, has been prepared in accordance with applicable Accounting Standards, relevant Treasurer’s Instructions issued under the Public Finance and Audit Act 1987, and other mandatory professional requirements (Urgent Issues Group Consensus Views). The financial statements have been prepared on the basis of historical costs and, except where stated, do not take into account changing money values or current valuations of non-current assets.
These accounting policies have been consistently applied by the Corporation throughout the financial year and, except where there is a change in accounting policy, are consistent with those of the previous year.
(b) Premium Revenue
The earned portion of premiums received and receivable, is recognised as revenue. Premium is treated as earned from the date of attachment of risk and is recognised evenly over the policy or indemnity period which is considered to closely approximate the pattern of risks underwritten. Unearned premium is determined by apportioning the premiums written prior to year-end on a daily pro-rata basis.
All South Australian Government agencies are required to insure with SAICORP unless exempted by the Treasurer. In those circumstances where SAICORP considers it more appropriate for a government agency to insure directly with another commercial insurance organisation, SAICORP will arrange for such insurance and will recover the insurance premium from the agency concerned. For the purposes of the financial statements, these arrangements are referred to as commercial insurance placements.
SAICORP does not accept any inwards reinsurance premiums.
(c) Outwards Reinsurance
Premium ceded to reinsurers is recognised as an expense in accordance with the pattern of reinsurance service received. Accordingly, a portion of outwards reinsurance premium is treated at balance date as a prepayment.
An amount totalling $6.279 million ($6.298 million) was expensed for cover provided under the Government’s catastrophe reinsurance program. This program has been devised to safeguard the State’s finances against a very large loss or claim, or a series of large losses or claims in any year under the Government’s insurance and risk management arrangements.
(d) Claims
Claims expense and liabilities for outstanding claims are recognised in respect of incidents incurred. The liabilities include claims incurred but not paid, claims incurred but not reported, claims incurred but not enough reported and the anticipated costs of settling those claims. In addition, SAICORP has recognised a prudential margin of 20 percent of its outstanding claims liabilities.
The claims liabilities are measured as the present values of the expected future payments. In the calculation of present values, a discount rate of 6.3 percent per annum (6.5 percent per annum) and an inflation rate (normal and superimposed) of 7 percent per annum (6.5 percent per annum) have been assumed.
Claims incurred but not paid and claims settlement costs that can be directly attributed to particular claims are assessed by reviewing individual claim files. In respect of incurred but not reported claims, SAICORP has employed the ‘Net Written Premium’ method modified to allow for claims incurred but not enough reported.
Indirect claims settlement costs are those claims settlement costs that cannot be directly allocated to a specific claim and have been estimated at 5 percent (5 percent) of the outstanding claims liabilities.
The above methodologies were originally adopted by SAICORP because there was insufficient historical data to perform a portfolio analysis to derive a statistical methodology for the calculation of claims liabilities. Brett & Watson Pty Ltd Consulting Actuaries were engaged to consider the continued appropriateness of the above methodologies and to recommend appropriate discount and inflation rates and prudential margins to be used. Brett & Watson’s endorsement was provided and their recommended rates and margins were adopted.
(e) Reinsurance and Other Recoveries Receivable
Reinsurance and other recoveries receivable on paid claims, reported claims not yet paid and claims incurred but not enough reported are recognised as revenue. Recoveries receivable used in the calculation of claims provisions are brought to account where they can be reliably measured. Recoveries receivable are assessed in a manner similar to the assessment of outstanding claims and are recognised as assets, totalling $10.268 million ($4.717 million).
(f) Acquisition Costs
Costs incurred in obtaining and recording policies of insurance are recognised as acquisition costs. The acquisition costs have been brought to account during the financial year as they do not represent a future benefit.
Most covers provided by SAICORP are on a financial year basis.
(g) Fire Services Levies and Stamp Duties
Amounts collected in lieu of stamp duties are included in premiums and on-paid to the Consolidated Account. A liability for these payments is recognised on business written to the reporting date.
Since the inception of the new Emergency Services Levy arrangements in 1999-2000 SAICORP no longer collects amounts in lieu of fire services levies. Any such amounts collected relate to years prior to 1999-2000.
SA Government Captive Insurance Corporation
985
1. Statements of Significant Accounting Policies (continued) (h) Receivables
(i) Premium Debtors Principally relates to amounts owing from government agencies.
(ii) Investment Debtors
Principally relates to interest earned but yet to be received on cash balances.
(iii) Other Debtors Principally relates to agency deductibles.
(i) Investments
Investment Strategy SAICORP has an investment strategy that was implemented for the first time in 1999-2000 and comprises a mix of cash, Australian fixed interest, Australian equities and overseas equities. The cash and fixed interest investments are managed by SAFA, while external fund managers are used to manage the Australian and overseas equity investments.
Valuation of Investments SAICORP ‘s investments are integral to its insurance activities. In accordance with Australian Accounting Standard AAS 26 ‘Financial Reporting of General Insurance Activities’ investments are reported at market value, net of material expected costs of disposal.
Investment Revenues Investment revenue is brought to account on an accrual basis and includes unrealised gains/(losses) arising from movements in market values of the underlying investments.
(j) Income Tax and Other Taxes
Effective 1 July 1995, pursuant to Treasurer’s Instruction 22, a tax equivalent regime applies to the normal commercial activities of SAICORP.
Pursuant to section 12 of the Schedule to the Public Corporations Act 1993, the Corporation is liable to pay to the Treasurer, for the credit of the Consolidated Account, such amounts as the Treasurer from time to time determines to be equivalent to income tax and any other taxes or imposts that the Corporation does not pay to the Commonwealth but would be liable to pay under the law of the Commonwealth if it were constituted and organised in such a manner as a public company or group of public companies carrying on the business carried on by the subsidiary.
In accordance with Treasurer’s Instruction 22, the Corporation is required to apply the accounting profits method for the calculation of income tax equivalent. Under this method, the Income Tax Assessment Act 1936 corporate tax rate (36 percent) is applied to the operating result after all abnormal and extraordinary items, to determine the Corporation’s tax equivalent payable. In addition, the approval of the Department of Treasury and Finance has been given for the Corporation to carry forward losses of previous years. Future income tax benefits relating to tax losses are not carried forward as an asset unless the benefit can be regarded as being virtually certain of realisation.
While the Corporation was an exempt body under the Sales Tax (Exemptions and Classification) Act 1992, it was previously assessed the equivalent of sales tax payable on goods and remitted this amount to the Department of Treasury and Finance. The Corporation is also assessed the equivalents of financial institutions duty and bank accounts debit tax. Other taxes such as stamp duty are remitted in the normal course of business to the respective authorities.
Department of Treasury and Finance directives were received for transitional arrangements to pay GST on compliant tax invoices prior to the introduction of the new tax system on 1 July 2000.
(k) Employee Entitlements
Officers of the Corporation are employees of the Department of Treasury and Finance. There are no direct employees of the Corporation. Consequently provisions for employee entitlements to wages, salaries, annual leave and long service leave at 30 June 2000 are reflected in the financial report of the Department of Treasury and Finance.
(l) Computer System Development Costs
The Corporation treats the costs associated with the implementation of its claims and risk management system as an asset. The cost has now been fully amortised.
(m) Creditors
Liabilities are recognised for amounts to be paid in the future for goods and services received, whether or not billed to the Corporation. Trade creditors are normally settled within 30 days.
(n) Cash
All day to day operating activities are transacted through an interest bearing Special Deposit Account (the SAGIRM Fund). These funds are invested with the South Australian Government Financing Authority (SAFA), and currently earn an interest rate determined by reference to the SAFA overnight borrowing rate (less a 0.5 percent banking fee). Accordingly, funds in the Special Deposit Account are classified as cash held. Interest earned from the SAGIRM Fund is apportioned between Sections 1 and 2.
Interest earned on the cash balances held are taken to income on an earned basis and reflected as investment income. Investment income is reported after deducting costs and expenses relating to its management.
For the purposes of the Statement of Cash Flows, cash includes deposits which are readily convertible to cash on hand and which are used in the cash management function on a day to day basis. This includes both the SAGIRM Fund and the cash management component of the investment strategy which is invested in the SAFA Cash Management Fund.

SA Government Captive Insurance Corporation
986
1. Statements of Significant Accounting Policies (continued) (o) Relationship with the Department of Treasury and Finance
The SAICORP Board has entered into an arrangement with the Department of Treasury and Finance to cover the use of staff, assets and accommodation to provide the services required by the Board. The Board reimburses Treasury for any payments made by Treasury on behalf of the Board relating to the provision of services to the Board, including payments for the salaries and on costs of all employees of SAICORP. These are apportioned between Section 1 and Section 2. Amounts expensed in 2000 totalled $1.764 million ($1.274 million) apportioned between Section 1 $1.409 million ($949 000) and Section 2 $355 000 ($325 000).
(p) Motor Vehicle Insurance On 10 May 1996 the Commonwealth Bank of Australia (CBA) through South Australia Fleet Lease Arranger Pty Ltd, acquired ownership of the South Australian Government’s light motor vehicle fleet. Pursuant to a Master Lease Agreement, the fleet was leased back to the South Australian Government and is managed by the Department for Administrative and Information Services, Fleet SA.
As part of this arrangement the vehicles are insured with the Corporation, and for this cover, the CBA paid to the Corporation an annual premium of $3.663 million including $316 000 GST, ($3.550 million), of which $3.152 million was unearned as at 30 June 2000. To meet the costs of the fleet insurance risks, the Corporation paid to Fleet SA the premium received from the CBA. Pursuant to this arrangement, for the period ending 30 June 2000 Fleet SA has expensed $2.939 million ($3.419 million). For the purposes of this financial statement, $2.939 million ($3.419 million) has been recognised as an expense, $4.167 million ($3.443 million) has been recognised as a prepayment.
(q) Foreign Currency
Transactions Foreign currency transactions are translated at the rates of exchange ruling at the date of the transactions. Amounts in foreign currencies at balance date have been translated at the mid rate of exchange ruling on the close of trading on that date.
Exchange differences relating to amounts payable and receivable in foreign currency are brought to account as exchange gains or losses in the Operating Statement in the financial year in which the exchange rates change. As these exchange gains or losses relate to settlement of an insurance claim, in accordance with the accounting standards, they have been classified as a claim expense.
As at balance date no foreign exchange exposure to Section 1 of the SAGIRM Fund existed.
(r) Derivatives The Corporation’s activities expose it to changes in interest rates, foreign exchange rates and general consumer prices. It is also exposed to credit, liquidity and cash flow risks from its operations.
It is Corporation policy to consider derivative financial instruments to hedge cash flows subject to interest rate, foreign exchange rate and general consumer price risks. The Corporation uses forward foreign exchange contracts to hedge its foreign exchange risks. Derivative financial instruments are not held for speculative purposes.
Derivative financial instruments designated as hedges are accounted for on the same basis as the underlying exposure.
(s) Comparatives Where necessary, comparative information has been reclassified to achieve consistency in disclosure with current financial year amounts and other disclosures.
2. Operating Result 2000 1999 Note $’000 $’000
Premium revenue 3 31 937 36 816 Outwards reinsurance expense (6 459) (6 460)
Net Premium Revenue 25 478 30 356 Claims expense 4 (36 789) (41 927) Reinsurance and other recoveries 3 6 980 4 732
Net Claims Incurred 16 (29 809) (37 195) Brokerage revenue 3 1 195 1 044 Net commercial insurance placement (62) (27) Other underwriting expenses 5 (2 336) (4 462)
Underwriting Result before Abnormal Items (5 534) (10 284) Investment revenue 3 9 251 5 498 Other revenue 10 12 General and administration expenses (509) (601)
Operating Result before Abnormal Items and Income Tax 3 218 (5 375)
3. Operating Revenue Premium revenue:
Direct 31 937 36 816 Reinsurance and other recoveries:
Reinsurance 6 980 4 732 Investment revenue:
Interest 4 156 5 498 Unrealised gains/(losses) on investments 3 832 - Distributions - equity investments 1 294 -
Brokerage revenue 1 195 1 044 Other revenue 10 12
Total Operating Revenue 49 404 48 102
Brokerage revenue from the insurance market in respect of the catastrophe reinsurance program was $1.106 million ($0.992 million).
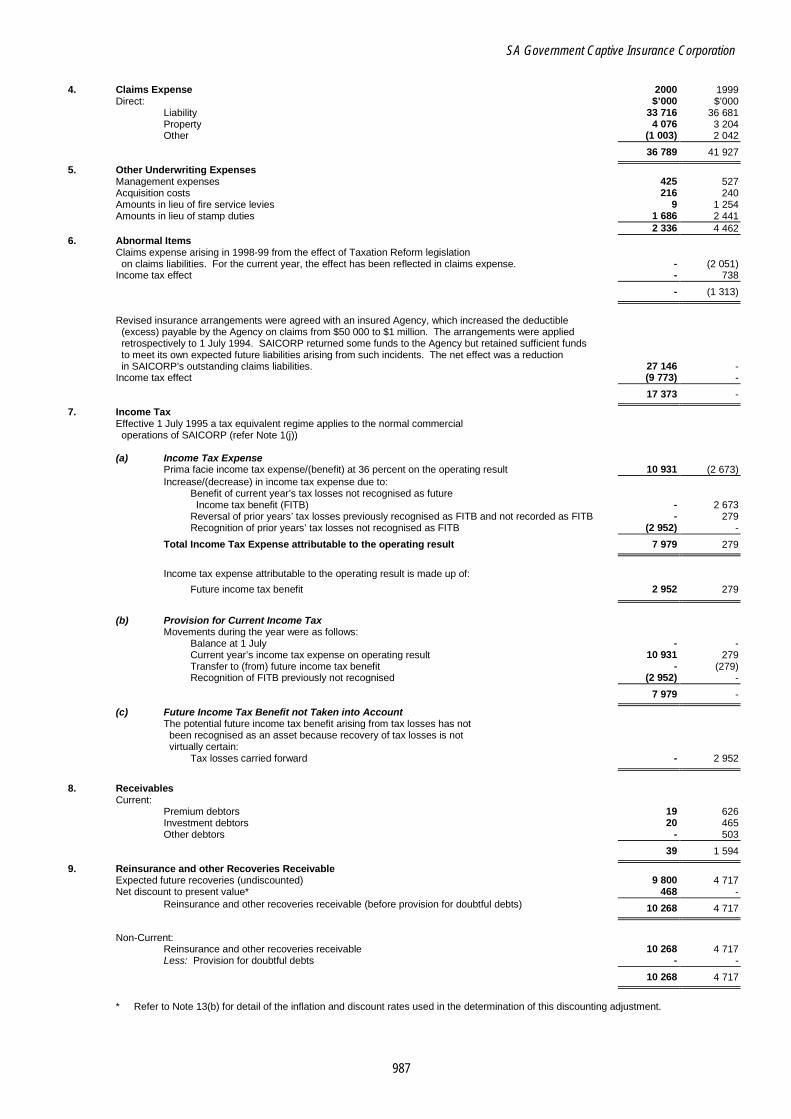
SA Government Captive Insurance Corporation
987
4. Claims Expense 2000 1999
Direct: $’000 $’000 Liability 33 716 36 681 Property 4 076 3 204 Other (1 003) 2 042
36 789 41 927
5. Other Underwriting Expenses Management expenses 425 527 Acquisition costs 216 240 Amounts in lieu of fire service levies 9 1 254 Amounts in lieu of stamp duties 1 686 2 441
2 336 4 462 6. Abnormal Items
Claims expense arising in 1998-99 from the effect of Taxation Reform legislation on claims liabilities. For the current year, the effect has been reflected in claims expense. - (2 051) Income tax effect - 738
- (1 313)
Revised insurance arrangements were agreed with an insured Agency, which increased the deductible (excess) payable by the Agency on claims from $50 000 to $1 million. The arrangements were applied retrospectively to 1 July 1994. SAICORP returned some funds to the Agency but retained sufficient funds to meet its own expected future liabilities arising from such incidents. The net effect was a reduction in SAICORP’s outstanding claims liabilities. 27 146 -
Income tax effect (9 773) - 17 373 -
7. Income Tax Effective 1 July 1995 a tax equivalent regime applies to the normal commercial operations of SAICORP (refer Note 1(j))
(a) Income Tax Expense
Prima facie income tax expense/(benefit) at 36 percent on the operating result 10 931 (2 673) Increase/(decrease) in income tax expense due to:
Benefit of current year’s tax losses not recognised as future Income tax benefit (FITB) - 2 673 Reversal of prior years’ tax losses previously recognised as FITB and not recorded as FITB - 279 Recognition of prior years’ tax losses not recognised as FITB (2 952) -
Total Income Tax Expense attributable to the operating result 7 979 279
Income tax expense attributable to the operating result is made up of:
Future income tax benefit 2 952 279
(b) Provision for Current Income Tax
Movements during the year were as follows: Balance at 1 July - - Current year’s income tax expense on operating result 10 931 279 Transfer to (from) future income tax benefit - (279) Recognition of FITB previously not recognised (2 952) -
7 979 -
(c) Future Income Tax Benefit not Taken into Account The potential future income tax benefit arising from tax losses has not been recognised as an asset because recovery of tax losses is not virtually certain:
Tax losses carried forward - 2 952
8. Receivables
Current: Premium debtors 19 626 Investment debtors 20 465 Other debtors - 503
39 1 594
9. Reinsurance and other Recoveries Receivable Expected future recoveries (undiscounted) 9 800 4 717 Net discount to present value* 468 -
Reinsurance and other recoveries receivable (before provision for doubtful debts) 10 268 4 717
Non-Current:
Reinsurance and other recoveries receivable 10 268 4 717 Less: Provision for doubtful debts - -
10 268 4 717
* Refer to Note 13(b) for detail of the inflation and discount rates used in the determination of this discounting adjustment.
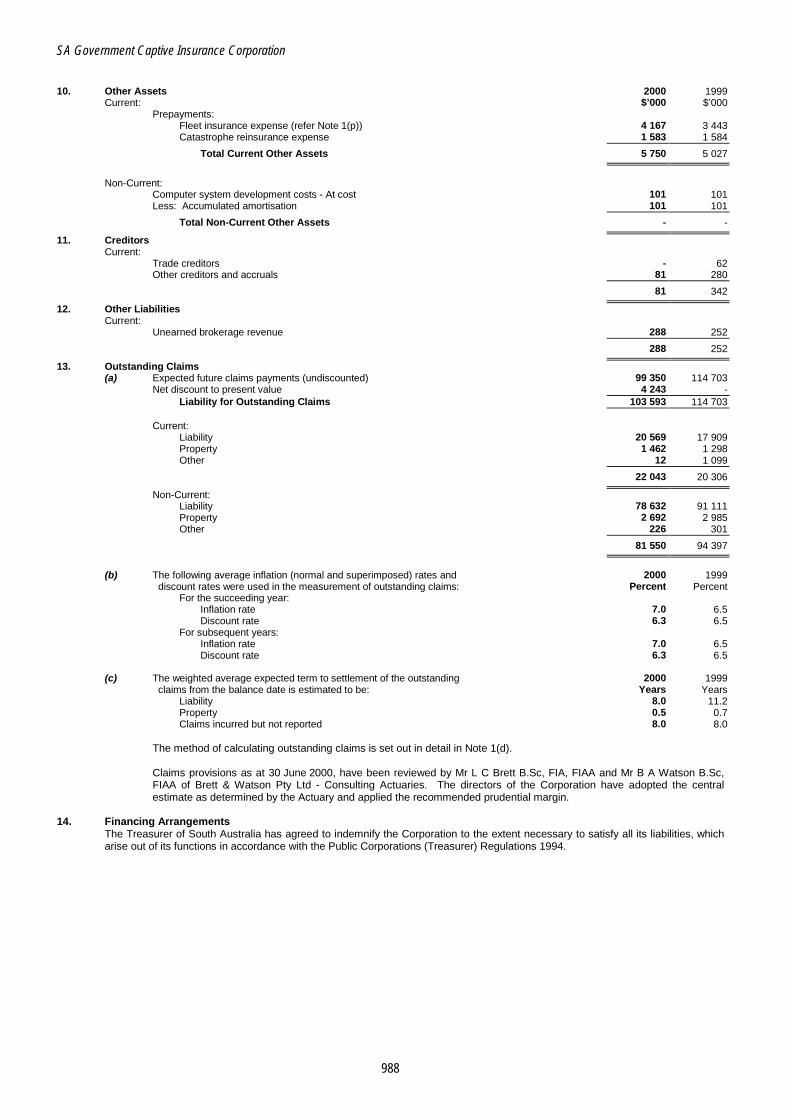
SA Government Captive Insurance Corporation
988
10. Other Assets 2000 1999
Current: $’000 $’000 Prepayments:
Fleet insurance expense (refer Note 1(p)) 4 167 3 443 Catastrophe reinsurance expense 1 583 1 584
Total Current Other Assets 5 750 5 027
Non-Current:
Computer system development costs - At cost 101 101 Less: Accumulated amortisation 101 101
Total Non-Current Other Assets - -
11. Creditors Current:
Trade creditors - 62 Other creditors and accruals 81 280
81 342
12. Other Liabilities Current: Unearned brokerage revenue 288 252
288 252
13. Outstanding Claims (a) Expected future claims payments (undiscounted) 99 350 114 703
Net discount to present value 4 243 - Liability for Outstanding Claims 103 593 114 703
Current:
Liability 20 569 17 909 Property 1 462 1 298 Other 12 1 099
22 043 20 306
Non-Current: Liability 78 632 91 111 Property 2 692 2 985 Other 226 301
81 550 94 397
(b) The following average inflation (normal and superimposed) rates and 2000 1999
discount rates were used in the measurement of outstanding claims: Percent Percent For the succeeding year:
Inflation rate 7.0 6.5 Discount rate 6.3 6.5
For subsequent years: Inflation rate 7.0 6.5 Discount rate 6.3 6.5
(c) The weighted average expected term to settlement of the outstanding 2000 1999
claims from the balance date is estimated to be: Years Years Liability 8.0 11.2 Property 0.5 0.7 Claims incurred but not reported 8.0 8.0
The method of calculating outstanding claims is set out in detail in Note 1(d).
Claims provisions as at 30 June 2000, have been reviewed by Mr L C Brett B.Sc, FIA, FIAA and Mr B A Watson B.Sc, FIAA of Brett & Watson Pty Ltd - Consulting Actuaries. The directors of the Corporation have adopted the central estimate as determined by the Actuary and applied the recommended prudential margin.
14. Financing Arrangements
The Treasurer of South Australia has agreed to indemnify the Corporation to the extent necessary to satisfy all its liabilities, which arise out of its functions in accordance with the Public Corporations (Treasurer) Regulations 1994.
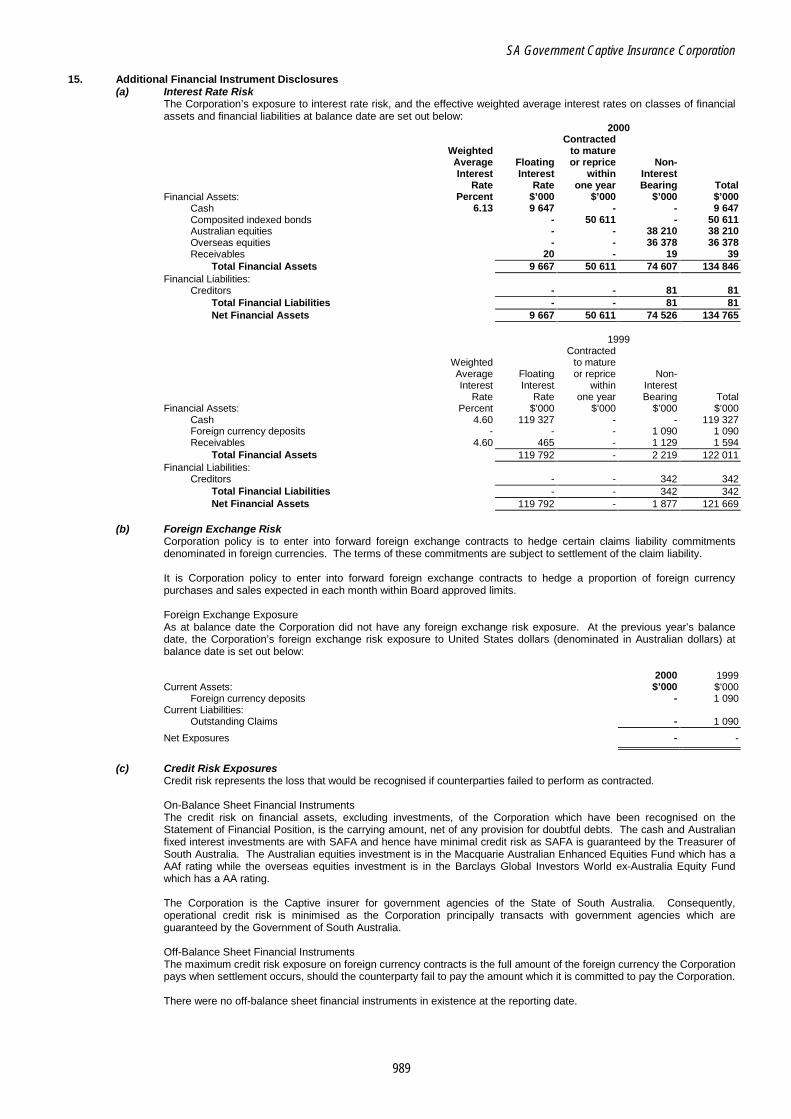
SA Government Captive Insurance Corporation
989
15. Additional Financial Instrument Disclosures (a) Interest Rate Risk
The Corporation’s exposure to interest rate risk, and the effective weighted average interest rates on classes of financial assets and financial liabilities at balance date are set out below:
2000 Contracted Weighted to mature Average Floating or reprice Non- Interest Interest within Interest
Rate Rate one year Bearing Total Financial Assets: Percent $’000 $’000 $’000 $’000
Cash 6.13 9 647 - - 9 647 Composited indexed bonds - 50 611 - 50 611 Australian equities - - 38 210 38 210 Overseas equities - - 36 378 36 378 Receivables 20 - 19 39
Total Financial Assets 9 667 50 611 74 607 134 846 Financial Liabilities:
Creditors - - 81 81 Total Financial Liabilities - - 81 81 Net Financial Assets 9 667 50 611 74 526 134 765
1999
Contracted Weighted to mature Average Floating or reprice Non- Interest Interest within Interest
Rate Rate one year Bearing Total Financial Assets: Percent $’000 $’000 $’000 $’000
Cash 4.60 119 327 - - 119 327 Foreign currency deposits - - - 1 090 1 090 Receivables 4.60 465 - 1 129 1 594
Total Financial Assets 119 792 - 2 219 122 011 Financial Liabilities:
Creditors - - 342 342 Total Financial Liabilities - - 342 342 Net Financial Assets 119 792 - 1 877 121 669
(b) Foreign Exchange Risk
Corporation policy is to enter into forward foreign exchange contracts to hedge certain claims liability commitments denominated in foreign currencies. The terms of these commitments are subject to settlement of the claim liability. It is Corporation policy to enter into forward foreign exchange contracts to hedge a proportion of foreign currency purchases and sales expected in each month within Board approved limits. Foreign Exchange Exposure As at balance date the Corporation did not have any foreign exchange risk exposure. At the previous year’s balance date, the Corporation’s foreign exchange risk exposure to United States dollars (denominated in Australian dollars) at balance date is set out below:
2000 1999 Current Assets: $’000 $’000
Foreign currency deposits - 1 090 Current Liabilities:
Outstanding Claims - 1 090
Net Exposures - -
(c) Credit Risk Exposures
Credit risk represents the loss that would be recognised if counterparties failed to perform as contracted. On-Balance Sheet Financial Instruments The credit risk on financial assets, excluding investments, of the Corporation which have been recognised on the Statement of Financial Position, is the carrying amount, net of any provision for doubtful debts. The cash and Australian fixed interest investments are with SAFA and hence have minimal credit risk as SAFA is guaranteed by the Treasurer of South Australia. The Australian equities investment is in the Macquarie Australian Enhanced Equities Fund which has a AAf rating while the overseas equities investment is in the Barclays Global Investors World ex-Australia Equity Fund which has a AA rating. The Corporation is the Captive insurer for government agencies of the State of South Australia. Consequently, operational credit risk is minimised as the Corporation principally transacts with government agencies which are guaranteed by the Government of South Australia. Off-Balance Sheet Financial Instruments The maximum credit risk exposure on foreign currency contracts is the full amount of the foreign currency the Corporation pays when settlement occurs, should the counterparty fail to pay the amount which it is committed to pay the Corporation. There were no off-balance sheet financial instruments in existence at the reporting date.
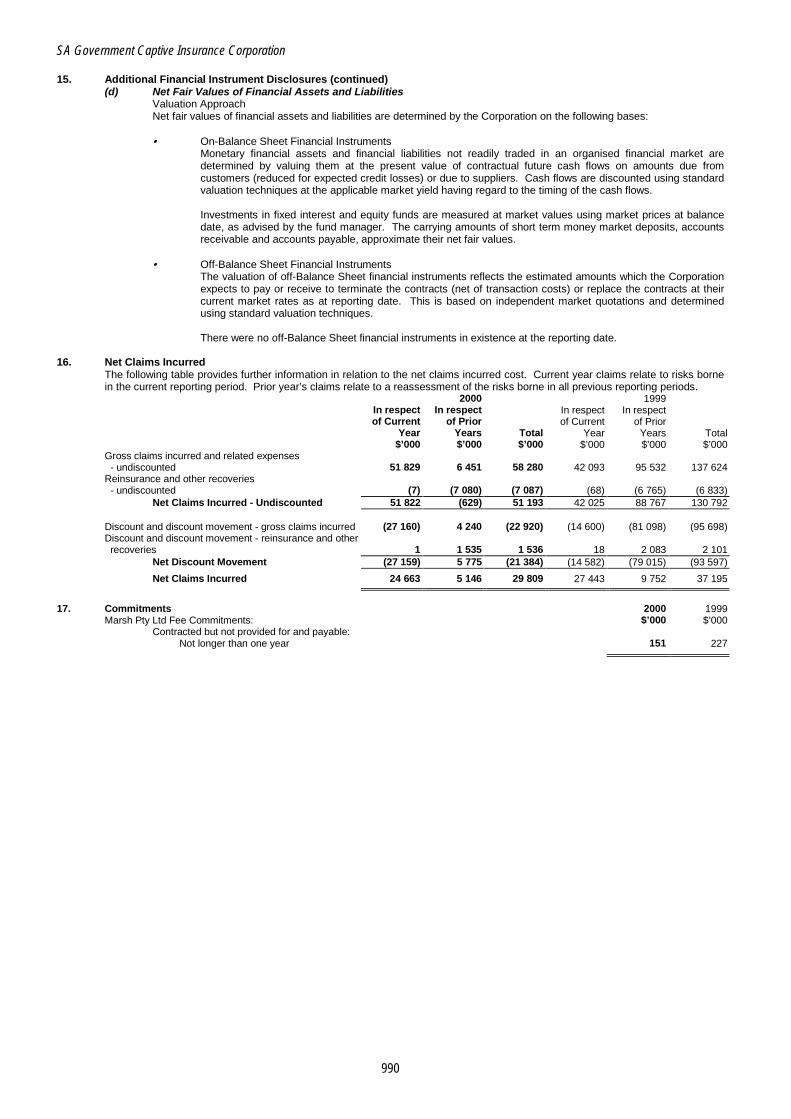
SA Government Captive Insurance Corporation
990
15. Additional Financial Instrument Disclosures (continued) (d) Net Fair Values of Financial Assets and Liabilities
Valuation Approach Net fair values of financial assets and liabilities are determined by the Corporation on the following bases: • On-Balance Sheet Financial Instruments
Monetary financial assets and financial liabilities not readily traded in an organised financial market are determined by valuing them at the present value of contractual future cash flows on amounts due from customers (reduced for expected credit losses) or due to suppliers. Cash flows are discounted using standard valuation techniques at the applicable market yield having regard to the timing of the cash flows. Investments in fixed interest and equity funds are measured at market values using market prices at balance date, as advised by the fund manager. The carrying amounts of short term money market deposits, accounts receivable and accounts payable, approximate their net fair values.
• Off-Balance Sheet Financial Instruments The valuation of off-Balance Sheet financial instruments reflects the estimated amounts which the Corporation expects to pay or receive to terminate the contracts (net of transaction costs) or replace the contracts at their current market rates as at reporting date. This is based on independent market quotations and determined using standard valuation techniques. There were no off-Balance Sheet financial instruments in existence at the reporting date.
16. Net Claims Incurred The following table provides further information in relation to the net claims incurred cost. Current year claims relate to risks borne in the current reporting period. Prior year’s claims relate to a reassessment of the risks borne in all previous reporting periods.
2000 1999 In respect In respect In respect In respect of Current of Prior of Current of Prior Year Years Total Year Years Total $’000 $’000 $’000 $’000 $’000 $’000
Gross claims incurred and related expenses - undiscounted 51 829 6 451 58 280 42 093 95 532 137 624 Reinsurance and other recoveries - undiscounted (7) (7 080) (7 087) (68) (6 765) (6 833)
Net Claims Incurred - Undiscounted 51 822 (629) 51 193 42 025 88 767 130 792
Discount and discount movement - gross claims incurred (27 160) 4 240 (22 920) (14 600) (81 098) (95 698) Discount and discount movement - reinsurance and other recoveries 1 1 535 1 536 18 2 083 2 101
Net Discount Movement (27 159) 5 775 (21 384) (14 582) (79 015) (93 597)
Net Claims Incurred 24 663 5 146 29 809 27 443 9 752 37 195
17. Commitments 2000 1999
Marsh Pty Ltd Fee Commitments: $’000 $’000 Contracted but not provided for and payable:
Not longer than one year 151 227

SA Government Captive Insurance Corporation
991
18. Segment Information The Corporation’s predominant operation is that of underwriting the following types of general insurance to South Australian Government agencies: • Industrial special risks and business interruption • Directors and officers liability • Public and products liability • Motor vehicle • Professional indemnity • Aviation liability • Medical malpractice • Forestry standing timber
The majority of risks which the Corporation insures will arise within the one geographic segment, namely, the State of South Australia. Analysis of the underwriting result by the major lines of insurance business are:
Professional Indemnity Industrial Special Risks Public and and Directors and and Business Interruption Products Liability Medical Malpractice Officers Liability Other Total 2000 1999 2000 1999 2000 1999 2000 1999 2000 1999 2000 1999 $’000 $’000 $’000 $’000 $’000 $’000 $’000 $’000 $’000 $’000 $’000 $’000
Premium revenue 6 346 7 309 4 428 4 509 12 174 15 598 1 518 1 691 7 471 7 709 31 937 36 816 Outwards reinsurance expense (1 799) (1 890) (929) (928) (2 362) (2 362) - - (1 369) (1 280) (6 459) (6 460)
Net premium revenue 4 547 5 419 3 499 3 581 9 812 13 236 1 518 1 691 6 102 6 429 25 478 30 356 Claims expense (196) (225) (187) (1 238) (33 871) (32 515) 377 (2 802) (2 912) (5 147) (36 789) (41 927) Reinsurance and other recoveries 23 - 2 - 6 955 4 732 - - - - 6 980 4 732
Net claims incurred (173) (225) (185) (1 238) (26 916) (27 783) 377 (2 802) (2 912) (5 147) (29 809) (37 195) Brokerage revenue 395 362 169 151 333 289 21 - 277 242 1 195 1 044 Net commercial insurance placement - - - - - - - - (62) (27) (62) (27) Other underwriting expenses - - - - - - - - (2 336) (4 462) (2 336) (4 462)
Underwriting result before abnormal items 4 769 5 556 3 483 2 494 (16 771) (14 258) 1 916 (1 111) 1 069 (2 965) (5 534) (10 284) Liabilities:
Outstanding claims 1 696 2 387 8 880 9 347 79 310 85 508 10 390 13 844 3 317 3 617 103 593 114 703

SA Government Captive Insurance Corporation
992
19. Auditor’s Remuneration 2000 1999
Amounts received or due and receivable for auditing the accounts of the Corporation by: $’000 $’000 Auditor-General’s Department 30 35
No other services were provided by the auditors of the Corporation.
20. Directors’ Remuneration 2000 1999
Directors’ Income Number of Number of The number of directors of the Corporation whose income from the Corporation Directors Directors falls within the following bands:
$0 - $9 999 7 7 2000 1999
Total income paid or payable, or otherwise made available, to all directors of the $’000 $’000 Corporation from the Corporation 18 19
Directors of the Corporation receive income in the form of statutory fees. The Chairman and one other Director who are employed by the State Government of South Australia, do not receive income from the Corporation.
Superannuation and Retirement Benefits Directors of the Corporation are not paid superannuation or retirement benefits for their activities associated with the Corporation, other than the amount set aside by the Corporation in compliance with the Superannuation Guarantee charge.
21. Employee Remuneration
As stated in Note 1(k), officers of the Corporation are employees of the Department of Treasury and Finance. Consequently there are no direct employees of the Corporation.
22. Related Parties
Directors The names of each person holding the position of director of the Corporation during the financial year are:
Mr J T Hill (Chairman) Ms A D Howe Ms R J Batt Ms C J Majoribanks Mr L R Foster Mr J L Potter Mr L C Holmes
Details of the Directors’ remuneration, superannuation and retirement benefits are set out in Note 20.
Apart from the details disclosed in this note, no director has entered into a contract with the Corporation since the end of the previous financial year and there were no contracts involving directors’ interest existing at the reporting date
Loans to Directors There have been no loans advanced to directors of the Corporation during the financial year. The total of loans outstanding to directors of the Corporation at year end was nil.
Directors Transactions with the Corporation There were no transactions during the year with directors and their director-related entities.
Other Related Entities The Corporation has dealings with other government instrumentalities. All dealings are in the ordinary course of business and on normal commercial terms and conditions.
Ultimate Parent Entity The Corporation is constituted under the Public Corporations (Treasury) Regulations 1994, as a Subsidiary of the Treasurer of South Australia, and is a semi-government authority for the purpose of the Public Finance and Audit Act 1987.
23. Notes to the Statement of Cash Flows 2000 1999
Reconciliation of Cash: $’000 $’000 Cash balances held in deposit account 530 119 327 Cash management fund held with SAFA 9 117 - Foreign currency deposit - 1 090
9 647 120 417 Reconciliation of operating result after income tax to net cash provided by operating activities:
Operating result after income tax 22 385 (7 705) Non-cash items:
Unrealised gains on investments (3 832) - Amortisation - 49
Increase (Decrease) in income tax payable 7 979 279 Foreign exchange movement - 163
Net Cash provided by Operating Activities before Changes in Assets and Liabilities 26 532 (7 214)
Change in assets and liabilities: Decrease (Increase) in receivables 1 555 (632) Decrease (Increase) in other assets (723) (126) Decrease (Increase) in reinsurance recoveries (5 551) (4 717) (Decrease) Increase in creditors (261) 218 (Decrease) Increase in outstanding claims (11 110) 36 466 (Decrease) Increase in unearned premium 119 91 (Decrease) Increase in other liabilities 36 -
Net Cash provided by Operating Activities 10 597 24 086
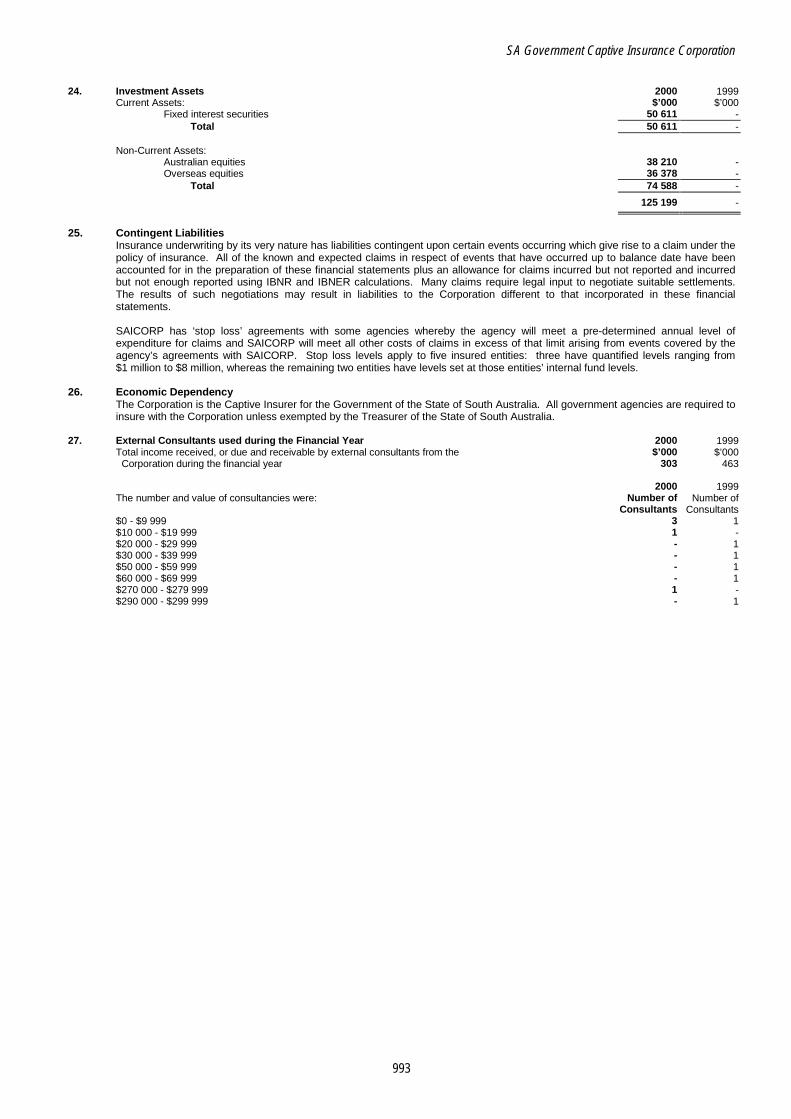
SA Government Captive Insurance Corporation
993
24. Investment Assets 2000 1999
Current Assets: $’000 $’000 Fixed interest securities 50 611 -
Total 50 611 -
Non-Current Assets: Australian equities 38 210 - Overseas equities 36 378 -
Total 74 588 -
125 199 -
25. Contingent Liabilities
Insurance underwriting by its very nature has liabilities contingent upon certain events occurring which give rise to a claim under the policy of insurance. All of the known and expected claims in respect of events that have occurred up to balance date have been accounted for in the preparation of these financial statements plus an allowance for claims incurred but not reported and incurred but not enough reported using IBNR and IBNER calculations. Many claims require legal input to negotiate suitable settlements. The results of such negotiations may result in liabilities to the Corporation different to that incorporated in these financial statements. SAICORP has ‘stop loss’ agreements with some agencies whereby the agency will meet a pre-determined annual level of expenditure for claims and SAICORP will meet all other costs of claims in excess of that limit arising from events covered by the agency’s agreements with SAICORP. Stop loss levels apply to five insured entities: three have quantified levels ranging from $1 million to $8 million, whereas the remaining two entities have levels set at those entities’ internal fund levels.
26. Economic Dependency The Corporation is the Captive Insurer for the Government of the State of South Australia. All government agencies are required to insure with the Corporation unless exempted by the Treasurer of the State of South Australia.
27. External Consultants used during the Financial Year 2000 1999
Total income received, or due and receivable by external consultants from the $’000 $’000 Corporation during the financial year 303 463
2000 1999
The number and value of consultancies were: Number of Number of Consultants Consultants
$0 - $9 999 3 1 $10 000 - $19 999 1 - $20 000 - $29 999 - 1 $30 000 - $39 999 - 1 $50 000 - $59 999 - 1 $60 000 - $69 999 - 1 $270 000 - $279 999 1 - $290 000 - $299 999 - 1
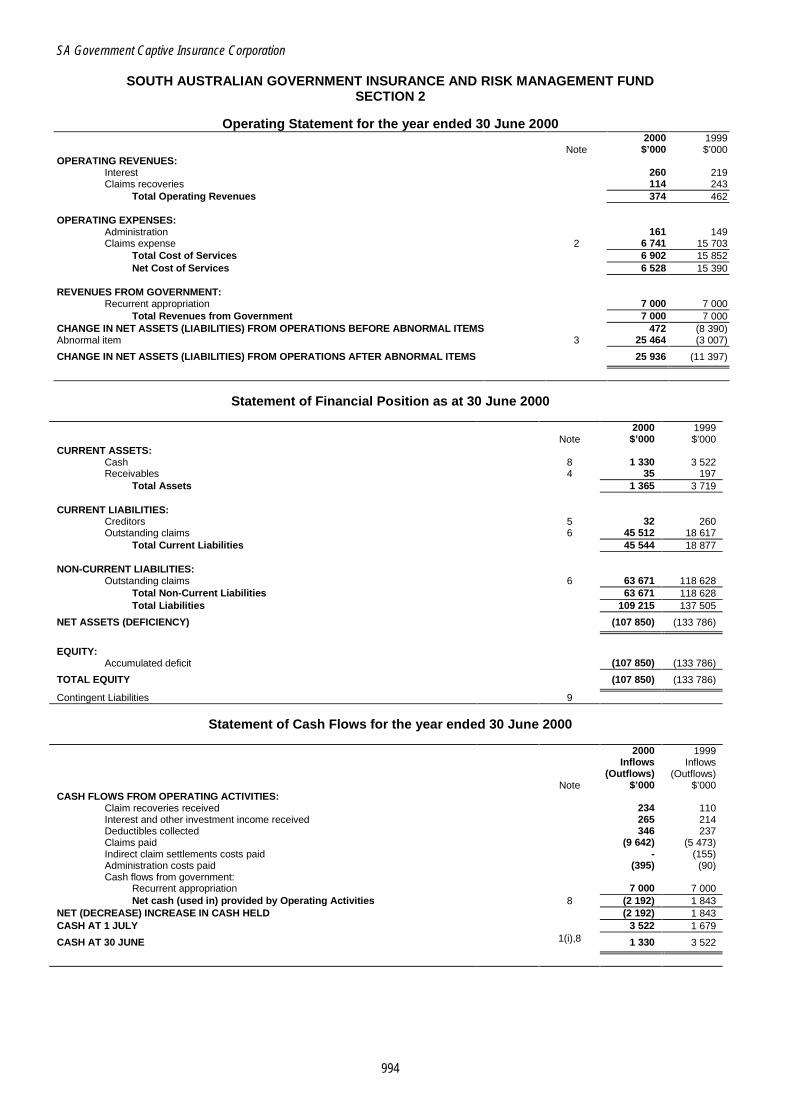
SA Government Captive Insurance Corporation
994
SOUTH AUSTRALIAN GOVERNMENT INSURANCE AND RISK MANAGEMENT FUND SECTION 2
Operating Statement for the year ended 30 June 2000
2000 1999 Note $’000 $’000 OPERATING REVENUES:
Interest 260 219 Claims recoveries 114 243
Total Operating Revenues 374 462 OPERATING EXPENSES:
Administration 161 149 Claims expense 2 6 741 15 703
Total Cost of Services 6 902 15 852 Net Cost of Services 6 528 15 390
REVENUES FROM GOVERNMENT:
Recurrent appropriation 7 000 7 000 Total Revenues from Government 7 000 7 000
CHANGE IN NET ASSETS (LIABILITIES) FROM OPERATIONS BEFORE ABNORMAL ITEMS 472 (8 390) Abnormal item 3 25 464 (3 007)
CHANGE IN NET ASSETS (LIABILITIES) FROM OPERATIONS AFTER ABNORMAL ITEMS 25 936 (11 397)
Statement of Financial Position as at 30 June 2000 2000 1999 Note $’000 $’000 CURRENT ASSETS:
Cash 8 1 330 3 522 Receivables 4 35 197
Total Assets 1 365 3 719 CURRENT LIABILITIES:
Creditors 5 32 260 Outstanding claims 6 45 512 18 617
Total Current Liabilities 45 544 18 877 NON-CURRENT LIABILITIES:
Outstanding claims 6 63 671 118 628 Total Non-Current Liabilities 63 671 118 628 Total Liabilities 109 215 137 505
NET ASSETS (DEFICIENCY) (107 850) (133 786)
EQUITY:
Accumulated deficit (107 850) (133 786)
TOTAL EQUITY (107 850) (133 786)
Contingent Liabilities 9
Statement of Cash Flows for the year ended 30 June 2000 2000 1999 Inflows Inflows (Outflows) (Outflows) Note $’000 $’000 CASH FLOWS FROM OPERATING ACTIVITIES:
Claim recoveries received 234 110 Interest and other investment income received 265 214 Deductibles collected 346 237 Claims paid (9 642) (5 473) Indirect claim settlements costs paid - (155) Administration costs paid (395) (90) Cash flows from government:
Recurrent appropriation 7 000 7 000 Net cash (used in) provided by Operating Activities 8 (2 192) 1 843
NET (DECREASE) INCREASE IN CASH HELD (2 192) 1 843 CASH AT 1 JULY 3 522 1 679
CASH AT 30 JUNE 1(i),8 1 330 3 522

SA Government Captive Insurance Corporation
995
NOTES TO AND FORMING PART OF THE GENERAL PURPOSE FINANCIAL STATEMENTS
1. Statement of Significant Accounting Policies
The significant policies which have been adopted in the preparation of this financial report are: (a) Objectives, Funding and Basis of Accounting
The South Australian Government Captive Insurance Corporation (‘SAICORP’ or ‘Corporation’) is established as a subsidiary of the Treasurer by the Public Corporations (Treasurer) Regulations 1994, which were gazetted and came into effect on 29 September 1994. The Corporation has been proclaimed to be a semi-government authority for the purposes of the Public Finance and Audit Act 1987 and the Treasurer has indemnified the Corporation ‘to the extent necessary to satisfy all the liabilities which arise out of the carrying out of its functions in accordance with the Public Corporations (Treasurer) Regulations 1994’. This financial report encompasses all activities transacted through Section 2 of the interest bearing Special Deposit Account entitled ‘South Australian Government Insurance and Risk Management Fund’ (the SAGIRM Fund). The purpose of the SAGIRM Fund is to record receipts and payments associated with the operations of the Government’s insurance and risk management program. Section 1 of the SAGIRM Fund reflects the normal commercial insurance activities of SAICORP, established to carry on the business of insuring, reinsuring and/or co-insuring the risks of the Crown. SAICORP's objectives are to: • efficiently and effectively administer the Government’s insurance and risk management arrangements; • insure the risks of the Crown; • provide advice on the management of risks of the Crown.
The principal source of funds for Section 1 consists of monies received from agencies for insurance cover provided in relation to the current financial year. SAICORP is also responsible for the administration of Section 2 of the SAGIRM Fund, from which are met claim payments in respect of incidents which occurred prior to 1 July 1994, claim payments in respect of uninsurable risks and any other payments which fall outside the insurance cover provided under Section 1. Section 2 of the SAGIRM Fund is funded by draw-downs from the Consolidated Account of the South Australian Government. Given the different funding and governance arrangements of Section 1 and Section 2, the principles of Australian Accounting Standard AAS 24 ‘Consolidated Financial Reports’ can not be applied. Therefore two separate financial reports are prepared to discharge SAICORP's legislative disclosure obligations. The financial report is a general purpose financial report which has been prepared in accordance with applicable Accounting Standards, relevant Treasurer’s Instructions issued under the Public Finance and Audit Act 1987, and other mandatory professional requirements (Urgent Issues Group Consensus Views). The financial statements have been prepared on the basis of historical costs and except where stated, do not take into account changing money values or current valuations of non-current assets. These accounting policies have been consistently applied by the Corporation throughout the financial year and, except where there is a change in accounting policy are consistent with those of the previous year.
(b) Appropriations Recurrent appropriations are recognised as revenues in the period in which SAICORP gains control of the appropriated funds. They are credited to the SAGIRM Fund from the Treasurer’s other payments line entitled ‘Fire Damage & Insurance Costs’.
(c) Claims Claims expense and liabilities for outstanding claims are recognised in respect of incidents arising. The liabilities include claims incurred but not paid and the anticipated costs of settling those claims. In addition, SAICORP has recognised a prudential margin of 25 percent of its outstanding claims liabilities. The claims liabilities are measured as the present values of the expected future payments. In the calculation of present values, a discount rate of 6.3 percent per annum (6 percent per annum) and an inflation rate (normal and superimposed) of 7 percent per annum (6.5 percent per annum) have been assumed. Claims incurred but not paid and claims settlement costs that can be directly attributed to particular claims are assessed by reviewing individual claim files. Indirect claims settlement costs are those claims settlement costs that cannot be directly allocated to a specific claim and have been estimated at 5 percent of the outstanding non-current claims liabilities (5 percent) plus $250 000 ($250 000) in respect of current outstanding claims. Brett & Watson Pty Ltd Consulting Actuaries were engaged to consider the continued appropriateness of the above methodologies and to recommend appropriate discount and inflation rates and prudential margins to be used. Brett & Watson’s endorsement was provided and their recommended rates and margins were adopted.
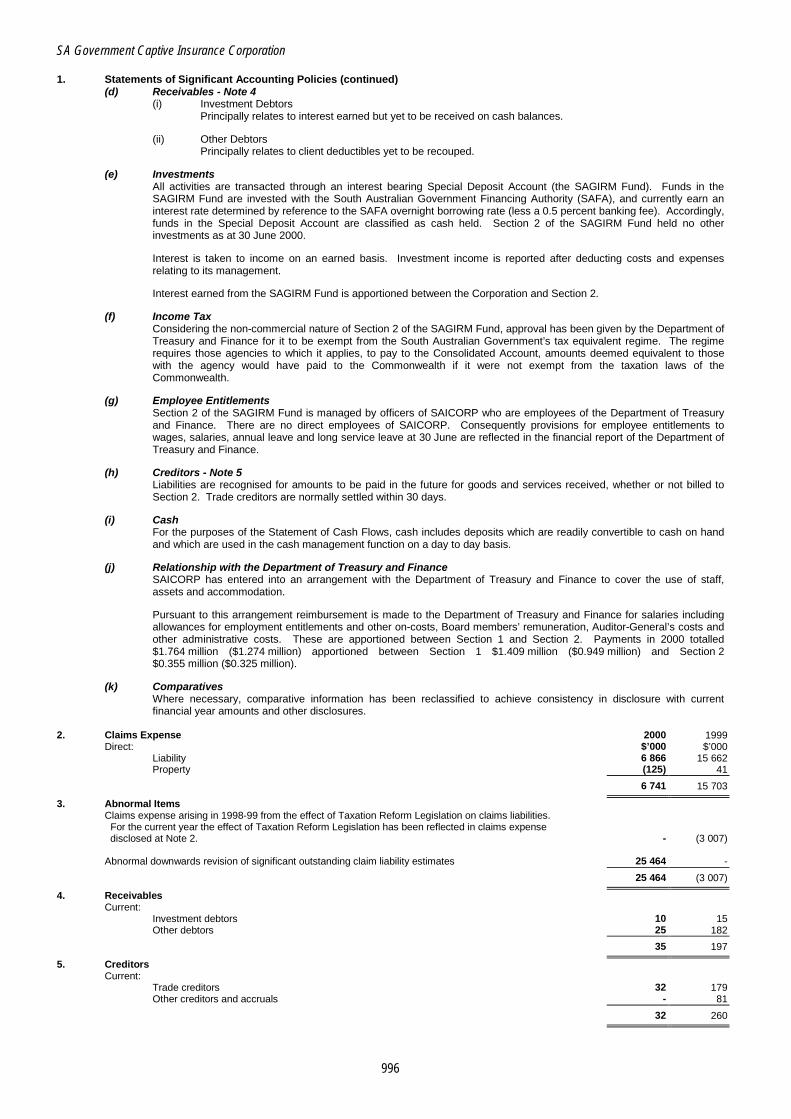
SA Government Captive Insurance Corporation
996
1. Statements of Significant Accounting Policies (continued) (d) Receivables - Note 4
(i) Investment Debtors Principally relates to interest earned but yet to be received on cash balances.
(ii) Other Debtors Principally relates to client deductibles yet to be recouped.
(e) Investments All activities are transacted through an interest bearing Special Deposit Account (the SAGIRM Fund). Funds in the SAGIRM Fund are invested with the South Australian Government Financing Authority (SAFA), and currently earn an interest rate determined by reference to the SAFA overnight borrowing rate (less a 0.5 percent banking fee). Accordingly, funds in the Special Deposit Account are classified as cash held. Section 2 of the SAGIRM Fund held no other investments as at 30 June 2000. Interest is taken to income on an earned basis. Investment income is reported after deducting costs and expenses relating to its management. Interest earned from the SAGIRM Fund is apportioned between the Corporation and Section 2.
(f) Income Tax Considering the non-commercial nature of Section 2 of the SAGIRM Fund, approval has been given by the Department of Treasury and Finance for it to be exempt from the South Australian Government’s tax equivalent regime. The regime requires those agencies to which it applies, to pay to the Consolidated Account, amounts deemed equivalent to those with the agency would have paid to the Commonwealth if it were not exempt from the taxation laws of the Commonwealth.
(g) Employee Entitlements Section 2 of the SAGIRM Fund is managed by officers of SAICORP who are employees of the Department of Treasury and Finance. There are no direct employees of SAICORP. Consequently provisions for employee entitlements to wages, salaries, annual leave and long service leave at 30 June are reflected in the financial report of the Department of Treasury and Finance.
(h) Creditors - Note 5 Liabilities are recognised for amounts to be paid in the future for goods and services received, whether or not billed to Section 2. Trade creditors are normally settled within 30 days.
(i) Cash For the purposes of the Statement of Cash Flows, cash includes deposits which are readily convertible to cash on hand and which are used in the cash management function on a day to day basis.
(j) Relationship with the Department of Treasury and Finance SAICORP has entered into an arrangement with the Department of Treasury and Finance to cover the use of staff, assets and accommodation. Pursuant to this arrangement reimbursement is made to the Department of Treasury and Finance for salaries including allowances for employment entitlements and other on-costs, Board members’ remuneration, Auditor-General’s costs and other administrative costs. These are apportioned between Section 1 and Section 2. Payments in 2000 totalled $1.764 million ($1.274 million) apportioned between Section 1 $1.409 million ($0.949 million) and Section 2 $0.355 million ($0.325 million).
(k) Comparatives Where necessary, comparative information has been reclassified to achieve consistency in disclosure with current financial year amounts and other disclosures.
2. Claims Expense 2000 1999
Direct: $’000 $’000 Liability 6 866 15 662 Property (125) 41
6 741 15 703
3. Abnormal Items Claims expense arising in 1998-99 from the effect of Taxation Reform Legislation on claims liabilities.
For the current year the effect of Taxation Reform Legislation has been reflected in claims expense disclosed at Note 2. - (3 007)
Abnormal downwards revision of significant outstanding claim liability estimates 25 464 - 25 464 (3 007)
4. Receivables Current:
Investment debtors 10 15 Other debtors 25 182
35 197
5. Creditors Current:
Trade creditors 32 179 Other creditors and accruals - 81
32 260
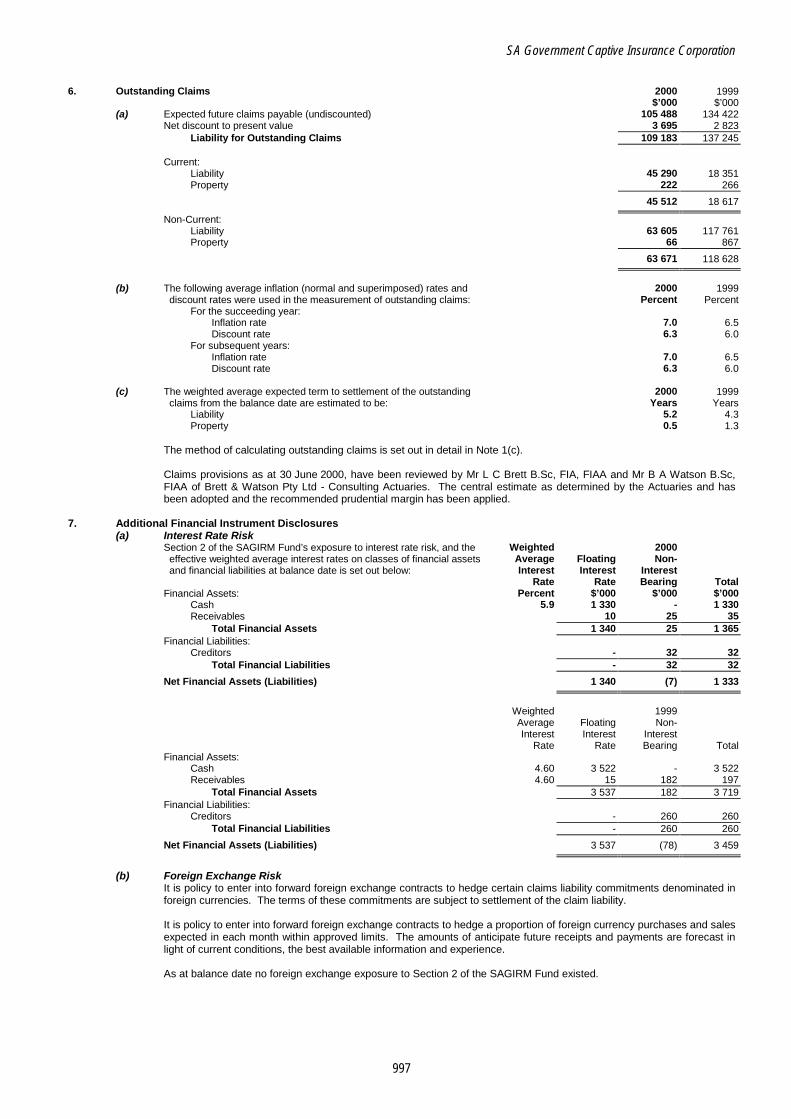
SA Government Captive Insurance Corporation
997
6. Outstanding Claims 2000 1999 $’000 $’000
(a) Expected future claims payable (undiscounted) 105 488 134 422 Net discount to present value 3 695 2 823
Liability for Outstanding Claims 109 183 137 245
Current: Liability 45 290 18 351 Property 222 266
45 512 18 617
Non-Current: Liability 63 605 117 761 Property 66 867
63 671 118 628
(b) The following average inflation (normal and superimposed) rates and 2000 1999
discount rates were used in the measurement of outstanding claims: Percent Percent For the succeeding year:
Inflation rate 7.0 6.5 Discount rate 6.3 6.0
For subsequent years: Inflation rate 7.0 6.5 Discount rate 6.3 6.0
(c) The weighted average expected term to settlement of the outstanding 2000 1999
claims from the balance date are estimated to be: Years Years Liability 5.2 4.3 Property 0.5 1.3
The method of calculating outstanding claims is set out in detail in Note 1(c). Claims provisions as at 30 June 2000, have been reviewed by Mr L C Brett B.Sc, FIA, FIAA and Mr B A Watson B.Sc, FIAA of Brett & Watson Pty Ltd - Consulting Actuaries. The central estimate as determined by the Actuaries and has been adopted and the recommended prudential margin has been applied.
7. Additional Financial Instrument Disclosures (a) Interest Rate Risk
Section 2 of the SAGIRM Fund’s exposure to interest rate risk, and the Weighted 2000 effective weighted average interest rates on classes of financial assets Average Floating Non- and financial liabilities at balance date is set out below: Interest Interest Interest Rate Rate Bearing Total Financial Assets: Percent $’000 $’000 $’000
Cash 5.9 1 330 - 1 330 Receivables 10 25 35
Total Financial Assets 1 340 25 1 365 Financial Liabilities:
Creditors - 32 32 Total Financial Liabilities - 32 32
Net Financial Assets (Liabilities) 1 340 (7) 1 333
Weighted 1999 Average Floating Non- Interest Interest Interest
Rate Rate Bearing Total Financial Assets:
Cash 4.60 3 522 - 3 522 Receivables 4.60 15 182 197
Total Financial Assets 3 537 182 3 719 Financial Liabilities:
Creditors - 260 260 Total Financial Liabilities - 260 260
Net Financial Assets (Liabilities) 3 537 (78) 3 459
(b) Foreign Exchange Risk
It is policy to enter into forward foreign exchange contracts to hedge certain claims liability commitments denominated in foreign currencies. The terms of these commitments are subject to settlement of the claim liability. It is policy to enter into forward foreign exchange contracts to hedge a proportion of foreign currency purchases and sales expected in each month within approved limits. The amounts of anticipate future receipts and payments are forecast in light of current conditions, the best available information and experience. As at balance date no foreign exchange exposure to Section 2 of the SAGIRM Fund existed.
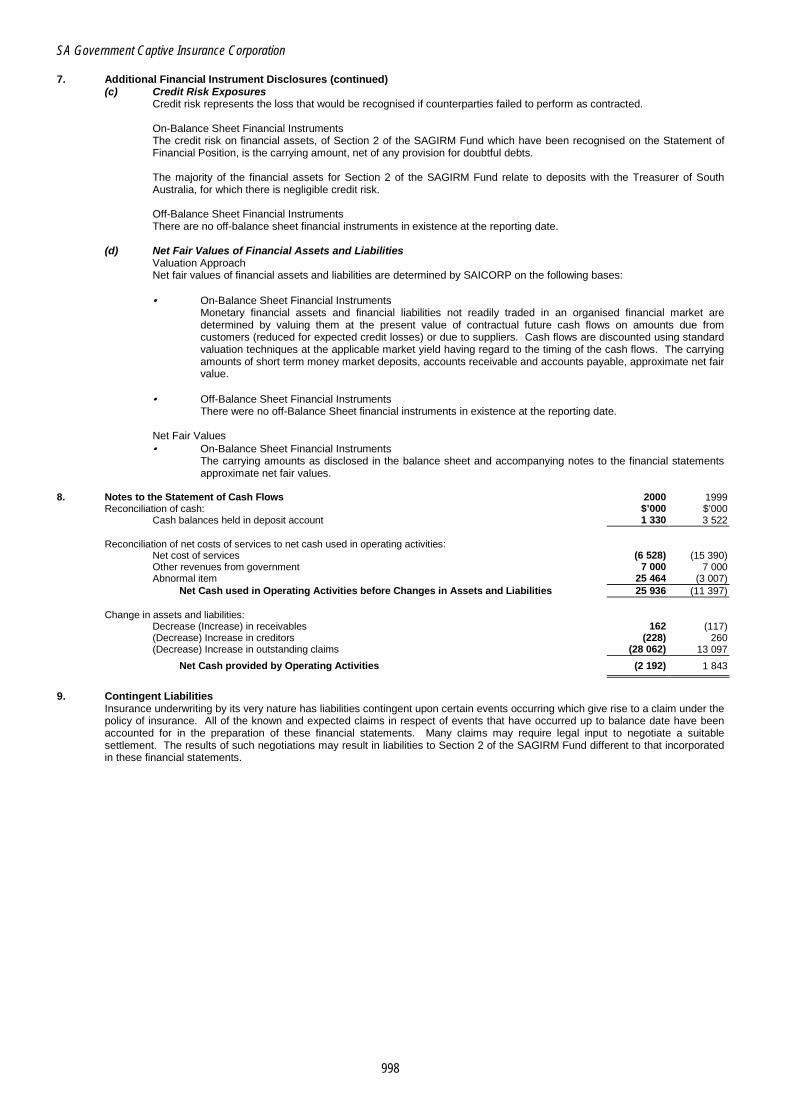
SA Government Captive Insurance Corporation
998
7. Additional Financial Instrument Disclosures (continued) (c) Credit Risk Exposures
Credit risk represents the loss that would be recognised if counterparties failed to perform as contracted. On-Balance Sheet Financial Instruments The credit risk on financial assets, of Section 2 of the SAGIRM Fund which have been recognised on the Statement of Financial Position, is the carrying amount, net of any provision for doubtful debts. The majority of the financial assets for Section 2 of the SAGIRM Fund relate to deposits with the Treasurer of South Australia, for which there is negligible credit risk. Off-Balance Sheet Financial Instruments There are no off-balance sheet financial instruments in existence at the reporting date.
(d) Net Fair Values of Financial Assets and Liabilities Valuation Approach Net fair values of financial assets and liabilities are determined by SAICORP on the following bases: • On-Balance Sheet Financial Instruments
Monetary financial assets and financial liabilities not readily traded in an organised financial market are determined by valuing them at the present value of contractual future cash flows on amounts due from customers (reduced for expected credit losses) or due to suppliers. Cash flows are discounted using standard valuation techniques at the applicable market yield having regard to the timing of the cash flows. The carrying amounts of short term money market deposits, accounts receivable and accounts payable, approximate net fair value.
• Off-Balance Sheet Financial Instruments There were no off-Balance Sheet financial instruments in existence at the reporting date.
Net Fair Values • On-Balance Sheet Financial Instruments
The carrying amounts as disclosed in the balance sheet and accompanying notes to the financial statements approximate net fair values.
8. Notes to the Statement of Cash Flows 2000 1999
Reconciliation of cash: $’000 $’000 Cash balances held in deposit account 1 330 3 522
Reconciliation of net costs of services to net cash used in operating activities:
Net cost of services (6 528) (15 390) Other revenues from government 7 000 7 000 Abnormal item 25 464 (3 007)
Net Cash used in Operating Activities before Changes in Assets and Liabilities 25 936 (11 397)
Change in assets and liabilities: Decrease (Increase) in receivables 162 (117) (Decrease) Increase in creditors (228) 260 (Decrease) Increase in outstanding claims (28 062) 13 097
Net Cash provided by Operating Activities (2 192) 1 843
9. Contingent Liabilities
Insurance underwriting by its very nature has liabilities contingent upon certain events occurring which give rise to a claim under the policy of insurance. All of the known and expected claims in respect of events that have occurred up to balance date have been accounted for in the preparation of these financial statements. Many claims may require legal input to negotiate a suitable settlement. The results of such negotiations may result in liabilities to Section 2 of the SAGIRM Fund different to that incorporated in these financial statements.
999
SOUTH AUSTRALIAN GOVERNMENT FINANCING AUTHORITY FUNCTIONAL RESPONSIBILITY AND STRUCTURE The South Australian Government Financing Authority (SAFA), a body corporate, was established in 1983 by proclamation of the Government Financing Authority Act 1982 (the Act). Since its inception SAFA has acted as the central borrowing authority for the Government and almost all semi-government authorities in South Australia. SAFA’s role within the South Australian public sector is fund raising, debt management, cash management and investment services. SAFA is responsible for managing the majority of the State’s debt and for the implementation of the Government’s Debt Management Policy as determined by the Treasurer of South Australia. SAFA’s functions and powers are set out in the Act, subsections 11(1) and (2). Broadly, SAFA’s functions are to develop and implement borrowing and investment programs for the benefit of semi-government authorities and to engage in other financial activities as are determined by the Treasurer to be in the interests of the State (subsection 11(1)). With the Treasurer’s approval, SAFA is able to exercise wide powers in the pursuit of these functions (subsection 11(2)). Pursuant to section 15 of the Act, liabilities of SAFA are guaranteed by the Treasurer. Advisory Board The Government Financing Authority (Authority and Advisory Board) Amendment Act 1995 was proclaimed in 1995. The Act provides that SAFA is constituted of the Under Treasurer (effectively assuming the role of the previous SAFA Board) and establishes the South Australian Government Financing Advisory Board. The Advisory Board comprises up to six members one of whom is the Under Treasurer, who is also Presiding Member. The function of the Advisory Board is to provide advice relating to the exercise by SAFA of its powers, functions and duties. The Act provides that the Under Treasurer may request advice from the Advisory Board and consider any advice given. The Advisory Board may proffer advice, as it sees fit to the Treasurer or the Authority. The Annual Report of SAFA must include details of any advice of the Advisory Board that the Treasurer or the Authority has decided not to follow and the Treasurer’s or Authority’s reason for that decision.

SA Government Financing Authority
1000
Structure The following diagram reflects the relationship between the Treasurer of South Australia, SAFA and SAFA’s controlled entities as at 30 June 2000.
TREASURER OF SOUTH AUSTRALIA
South Australian Finance Trust Limited (SAFTL)
South Australian Finance Limited (SAFL)
South Australian Government Financing
Authority (SAFA)
SABT Pty Ltd (SABT)
South Australian Investments (SAI)
South Australian Finance (Hong Kong) Limited
(SAF(HK)L)
South Australian Finance Trust
(Hong Kong) (SAFT(HK))
50% interest
United Kingdom Resident Companies
Hong Kong Resident Company
Trustee of
50% Interest held by Macquarie Bank Ltd
Palantir Pty Ltd
CHANGES TO ORGANISATIONAL STRUCTURE A notable change, reflected in the above organisational structure, relates to Palantir Pty Ltd. The nature of the transactions which have led SAFA to wholly own Palantir Pty Ltd are complex but ultimately reflect the means by which a prior financing arrangement was terminated by SAFA on maturity. Essentially, in September 1988 the South Australian Health Commission (SAHC), Noarlunga Health Services Incorporated (NHS) and SAFA entered into a structured financing transaction to fund the construction of the Noarlunga Hospital complex, which included both public and private hospitals. Palantir Pty Ltd (Palantir) was a special purpose company, owned by another private company that entered into a Head Lease agreement with the SAHC for the hospital complex. SAFA was granted a Share Option to purchase the entire shareholding for a nominal fixed price of $2. This provided the mechanism by which the State could maintain control over Palantir and the means by which SAFA could terminate the financing arrangement on its maturity. In 1991, as a consequence of financial difficulties experienced by other parties to the abovementioned structured financing arrangement, there had to be modifications to existing managerial and operational agreements (namely, the Management Agreement, the sub-lease, the Head-lease and SAFA’s share option). All rights under these revised agreements and options expired on 15 June 2000, with no further rights of renewal. Negotiations between the Department of Human Services (previously SAHC) to find a suitable licensee to take over the operations of Noarlunga Hospital are ongoing as this could not be finalised by the date the agreements and options expired. Consequently, SAFA was required to exercise its option to acquire the shares in Palantir Pty Ltd in order to protect the State’s interest in the Noarlunga Private Hospital. Nevertheless, it is envisaged that SAFA’s acquisition is only an interim measure. During this period the Department of Human Services has transferred all the risks and benefits of ownership from SAFA to itself and the risks and benefits of operations from Palantir to NHS. The accounts do not reflect the financial results or financial position of Palantir Pty Ltd which is considered of no value to SAFA, given that it is not exposed to the risks and benefits of the enterprise of Palantir Pty Ltd. Consequently, residual revenue and expenses, assets and liabilities are considered immaterial both in nature and to SAFA’s operations and are not disclosed or consolidated. Note 26 to the financial statements refers.
SA Government Financing Authority
1001
SIGNIFICANT FEATURES Since late 1993-94, SAFA has been reducing the size of its balance sheet and eliminating non-core activities. This has involved reductions in its capital base, the wind down of affiliated entities’ activities and a reduction in the size of the assets and liabilities held. During 1999-2000, as a consequence of receiving proceeds from the disposal of ETSA Corporation and associated entities, SAFA continued to significantly reduce its operating activities. SAFA’s unconsolidated operations: • The operating surplus before income tax was $34 million, a decrease of only $1 million from the previous
year.
• As a consequence of receiving additional funds for management from the disposal of electricity assets, net cash applied in investment activity increased by $1.6 billion from the previous year.
• Net cash applied to the reduction in borrowings amounted to $1.3 billion (increase in borrowings of $89 million last year).
• SAFA paid $22 million to the Consolidated Account pursuant to the tax equivalent regime. This reflects payment of $10 million for the 1998-99 year and $12 million for 1999-2000.
• The amount available for distribution was $227 million ($206 million). Consistent with last year, no distribution was made to the Treasurer of South Australia.
Consolidated operations: • Assets decreased by $1.5 billion to $13.9 billion.
• Liabilities decreased by $1.5 billion to $13.6 billion. AUDIT MANDATE AND COVERAGE Audit Authority Subsection 25(2) of the Government Financing Authority Act 1982 specifically provides for the Auditor-General to audit the accounts of the Authority in respect of each financial year. Scope of Audit The audit program covered all major financial systems and was directed primarily towards obtaining sufficient evidence to enable an audit opinion to be formed with respect to the financial statements and internal control. The audit plan encompassed the operations of SAFA and its controlled entities. The South Australian Finance Trust Limited (SAFTL) and SABT Pty Ltd were also audited by the Auditor-General (refer also to the section of this Report entitled SAFTL). Other controlled entities are audited by private accounting firms. The audit planning process took into account the involvement of the internal auditors and also took account of the involvement of the external auditors of the controlled entities.
SA Government Financing Authority
1002
The continued development of the internal compliance function, was significant to the carriage of internal audit work and formed an important part of the internal audit strategy for 1999-2000. In addition to work assigned to Internal Audit, SAFA maintained a Compliance Officer function with a general compliance program that was undertaken on a progressive basis throughout the year. Areas covered collaboratively by both functions included, deal and settlement testing; credit risk; and funding and liquidity risk. Areas subject to audit attention were: • operating policies and risk management • borrowings • investments • financial reporting systems and reconciliations including risk implementation • management reporting • debt management operations, including ETSA disposal proceeds • financial accounting and reporting In accordance with Auditing Standard AUS604 ‘Using the Work of Another Auditor’, the work of the Internal Auditor and the findings arising from that work have been reviewed and tested by Audit as an element of the assessment of the internal control environment of SAFA. The extensive coverage and findings of Internal Audit in respect of internal controls contributed significantly to Audit forming the internal control opinion expressed in this Report. Audit Communications to Management In July 2000, Audit forwarded a letter for management consideration. The letter discussed both matters concerning internal control and further improving the basis upon which SAFA prepares and discloses financial information. Matters arising from the review of the internal control environment were considered to be of low risk to SAFA, but nonetheless worthy of management consideration. In general, the review indicated a satisfactory position. Audit also undertook a high-level review of the current basis for internal and external financial reporting by SAFA and compared this against international better practices, other State central borrowing authorities and financial institutions. Overall, the conclusions indicated that SAFA compared favourably against benchmarked comparisons. The review recognised that Australian Accounting Standards currently do not prescribe the basis of accounting to be adopted by financial institutions. In view, however, of trends both interstate and overseas for accounting on a current value (mark-to-market) basis rather than historical cost, SAFA was asked to formally consider its strategy for financial reporting from a risk perspective. That is, should such a move be externally imposed on SAFA by changes in the regulatory environment it would require a significant resource and logistical effort, which it should begin to plan for now. Department Response The response from SAFA was positive, indicating that it would address the matters of internal control as well as progress the issues concerning financial reporting as a primary objective. In relation to financial reporting, the need to undertake such a review has been earmarked within SAFA’s Business Plan and received endorsement by SAFA’s Advisory Board. AUDIT FINDINGS AND COMMENTS Commentary on General Financial Controls Internal Audit Internal Audit had submitted the following reports during the year: • Quarterly Report - September 1999 (presented December 1999) • Quarterly Report - December 1999 (presented March 2000) • Quarterly Report - March 2000 (presented June 2000) • Integrity of Advance Risk Module - March 2000.

SA Government Financing Authority
1003
At the time of this Report, the June Quarter’s report was not available for presentation, however, follow-up with the Internal Auditor indicated that there were no significant matters that would alter their general opinion of the satisfactory internal control position. Further, the Internal Audit Summary of issues outstanding as at the end of March 2000 revealed a satisfactory response by management in resolving issues identified by Internal Audit. In respect of the Advanced Risk Management Module of the Treasury Management System, Internal Audit conclusions were that SAFA’s interest rate risk management practices and valuation methodologies are consistent with best practice used in similar organisations. CONTROLS OPINION As required by subsection 36(1)(a)(iii) of the Public Finance and Audit Act 1987, the audit of the South Australian Government Financing Authority included an assessment of the controls exercised in relation to the receipt, expenditure and investment of money, the acquisition and disposal of property and the incurring of liabilities. The assessment also considered whether those controls were consistent with the prescribed elements of the Financial Management Framework as required by Treasurer’s Instruction 2 ‘Financial Management Policies’. Audit formed the opinion that the controls exercised by the South Australian Government Financing Authority in relation to the receipt, expenditure and investment of money; the acquisition and disposal of property; and the incurring of liabilities, were sufficient to provide reasonable assurance that the financial transactions of the organisation were conducted properly and in accordance with the law. INTERPRETATION AND ANALYSIS OF FINANCIAL STATEMENTS SAFA’s Business As the public sector’s central borrowing authority, SAFA is responsible for raising funding for the majority of government agencies, lending predominantly and directly to the Treasurer of South Australia. The cost of borrowed funds is passed onto SAFA’s clients through the interest rates charged. SAFA’s operating surplus for 1999-2000 is significantly derived from the return on its retained surplus. However, SAFA does generate surpluses by lending borrowed funds at a small margin. SAFA’s Capital SAFA has experienced a significant decrease in capital since 1993-94. At 30 June 2000, SAFA’s capital reserves were represented solely by its Retained Surplus, which stood at $227 million ($206 million). This corresponds with the aim of making SAFA’s primary objects of managing the public sector debt and associated interest cost, more transparent. This compared with the contrasting position where an augmented capital base in prior years may have distorted SAFA’s underlying performance. The Retained Surplus provides SAFA with a buffer against risks arising from the management of its operations. The question as to what is an appropriate level of retained surplus for SAFA, so as to satisfy notions of capital adequacy, is difficult to reliably estimate. In the absence of a detailed analysis, including an evaluation of the balance sheets of other central borrowing authorities and related key assumptions, it is difficult to suggest a desired level. Clearly, the notion of capital adequacy impacts on the prudence of any future decisions to distribute dividends, as well as liquidity considerations. During 1999-2000, no such distributions were approved. Financial Performance and Financial Position The following commentary aims to provide an understanding of the main trends and movements in SAFA’s financial results and position over 1999-2000. It is noted that the trends over recent years, while maintained, are lessening in impact as SAFA’s operations are more closely aligned with its primary function.
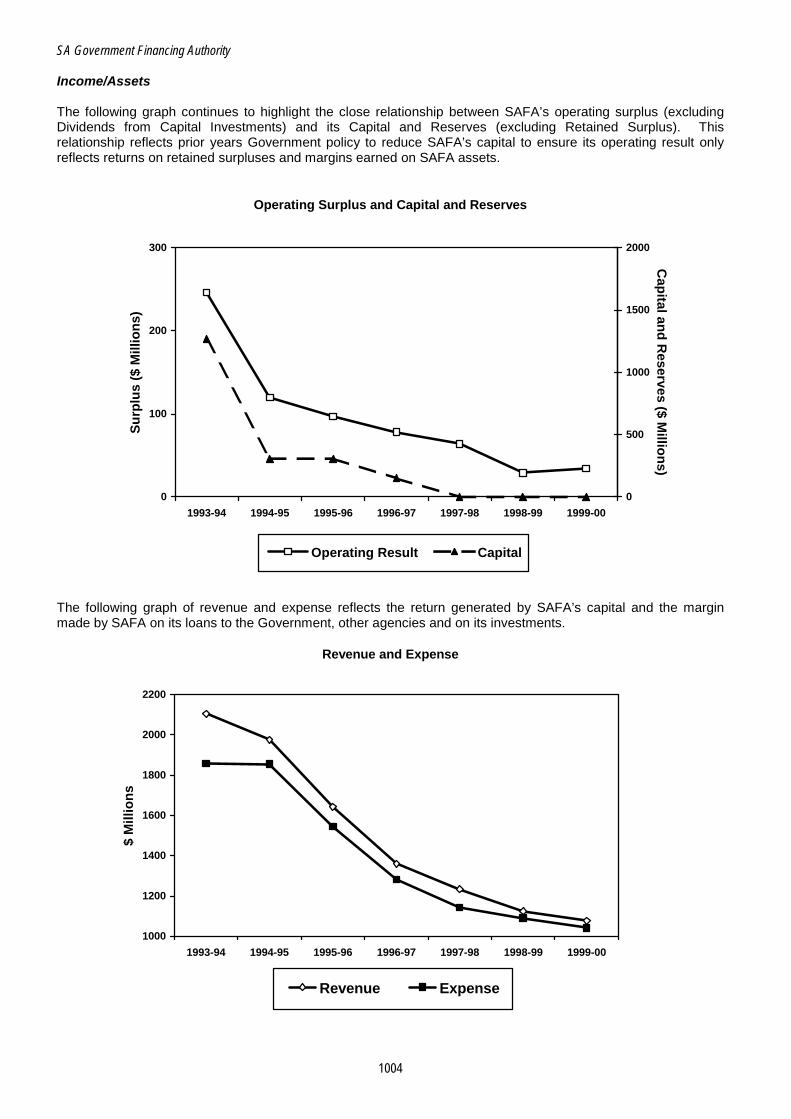
SA Government Financing Authority
1004
Income/Assets The following graph continues to highlight the close relationship between SAFA’s operating surplus (excluding Dividends from Capital Investments) and its Capital and Reserves (excluding Retained Surplus). This relationship reflects prior years Government policy to reduce SAFA’s capital to ensure its operating result only reflects returns on retained surpluses and margins earned on SAFA assets.
Operating Surplus and Capital and Reserves
0
100
200
300
1993-94 1994-95 1995-96 1996-97 1997-98 1998-99 1999-00
Su
rplu
s ($
Mill
ion
s)
0
500
1000
1500
2000
Cap
ital and
Reserves ($ M
illion
s)
Operating Result Capital
The following graph of revenue and expense reflects the return generated by SAFA’s capital and the margin made by SAFA on its loans to the Government, other agencies and on its investments.
Revenue and Expense
1000
1200
1400
1600
1800
2000
2200
1993-94 1994-95 1995-96 1996-97 1997-98 1998-99 1999-00
$ M
illio
ns
Revenue Expense
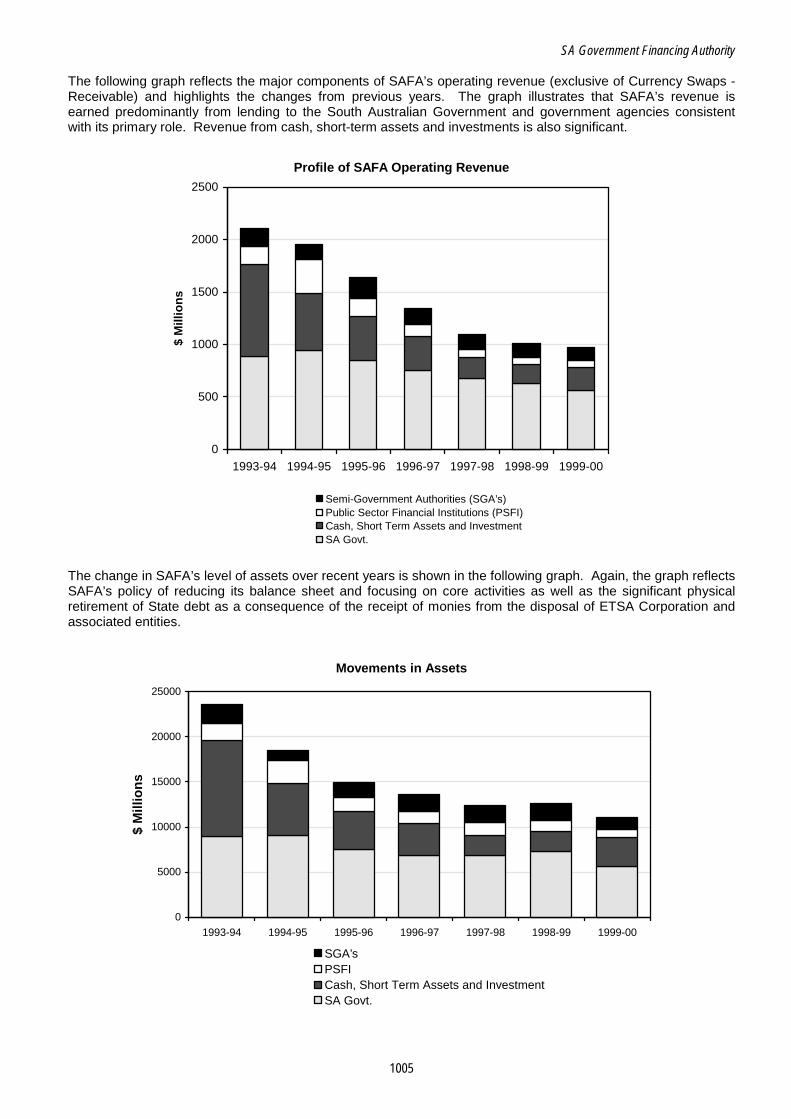
SA Government Financing Authority
1005
The following graph reflects the major components of SAFA’s operating revenue (exclusive of Currency Swaps - Receivable) and highlights the changes from previous years. The graph illustrates that SAFA’s revenue is earned predominantly from lending to the South Australian Government and government agencies consistent with its primary role. Revenue from cash, short-term assets and investments is also significant.
Profile of SAFA Operating Revenue
0
500
1000
1500
2000
2500
1993-94 1994-95 1995-96 1996-97 1997-98 1998-99 1999-00
$ M
illio
ns
Semi-Government Authorities (SGA’s)Public Sector Financial Institutions (PSFI)Cash, Short Term Assets and InvestmentSA Govt.
The change in SAFA’s level of assets over recent years is shown in the following graph. Again, the graph reflects SAFA’s policy of reducing its balance sheet and focusing on core activities as well as the significant physical retirement of State debt as a consequence of the receipt of monies from the disposal of ETSA Corporation and associated entities.
Movements in Assets
0
5000
10000
15000
20000
25000
1993-94 1994-95 1995-96 1996-97 1997-98 1998-99 1999-00
$ M
illio
ns
SGA’sPSFICash, Short Term Assets and InvestmentSA Govt.

SA Government Financing Authority
1006
Explanation of Variations Major reasons for the decrease in revenue and in total assets are as follows: Loans to South Australian Government Interest revenue from loans to the SA Government decreased by $62 million ($47.6 million), approximately 10 percent. The majority of loans to the South Australian Government incur interest at CPSIR ($5 738 million out of $5 854 million as at 30 June 2000). There was a decline in the CPSIR during the year from 8.78 percent to 8.55 percent. The average level of loan balances remained relatively constant throughout the year, despite the reduction in loans to South Australian Government from $7 248 million to $5 854 million. Investments Interest revenue from investments on a consolidated basis decreased by $23.4 million, approximately 13 percent. This decrease principally reflects a decline in returns achieved, with the average interest rate on investments decreasing from 9.07 percent to 8.96 percent. Additionally, there was also a decrease in the average balance of investments of $278 million. Cash and Short Term Assets In contrast to the movement in other assets, the average value of cash and short term assets increased by $1 060 million. This increase predominantly reflects the receipt of additional monies from the disposal of ETSA Corporation and associated entities for application towards the physical retirement of State debt. FURTHER COMMENTARY ON OPERATIONS The Common Public Sector Interest Rate As is apparent from the previous text, a major proportion of funding provided by SAFA is at a common rate referred to as the Common Public Sector Interest Rate (CPSIR). The CPSIR is the quarterly charge out rate reflecting SAFA’s average costs of borrowings sourced from domestic and international financial markets plus a margin to cover administration expenses. The average annual CPSIR for 1999-2000 was 8.55 percent (8.78 percent). The only borrower of CPSIR funding during 1999-2000 was the Treasurer of South Australia. It is important to note that the objectives underlying the debt management policy of the Government, in effect, determine the CPSIR. SAFA attempt to manage debt such that the cost of borrowings remains stable compared with market rates and provides for the minimisation of the cost of debt. The main reasons why at times the CPSIR remains higher than market rates stem from the fact that the portfolio includes borrowings undertaken in the past when rates were higher than those of today, and that proceeds from the sale of assets are used, in line with SAFA’s policy, to retire debt approximating current rates. The Sale/Lease of Electricity Corporations and Management Proceeds In my Report last year, I commented on the fact that SAFA has for some time been preparing itself for the sale of electricity corporations and how it will seek to optimise the impact of this process through debt retirement and the orderly transfer of the assets. In mid 1999, the Government achieved passage of the Electricity Corporations (Restructure and Disposal) Act 1999 which provided for the disposal of the State’s electricity assets. Further commentary in relation to this is made in Part A of this Report in the section entitled ‘Electricity Assets Disposals and the State’s Finances’. In January 2000, the first in a series of lease payments were received by the Treasurer as a consequence of the disposal process. Specifically, on the 28 January 2000, SAFA received funds from the Treasurer amounting to $3.7 billion. Interest paid by SAFA from the period of first receipt to 30 June 2000, through investment of these funds, amounted to $31.9 million.
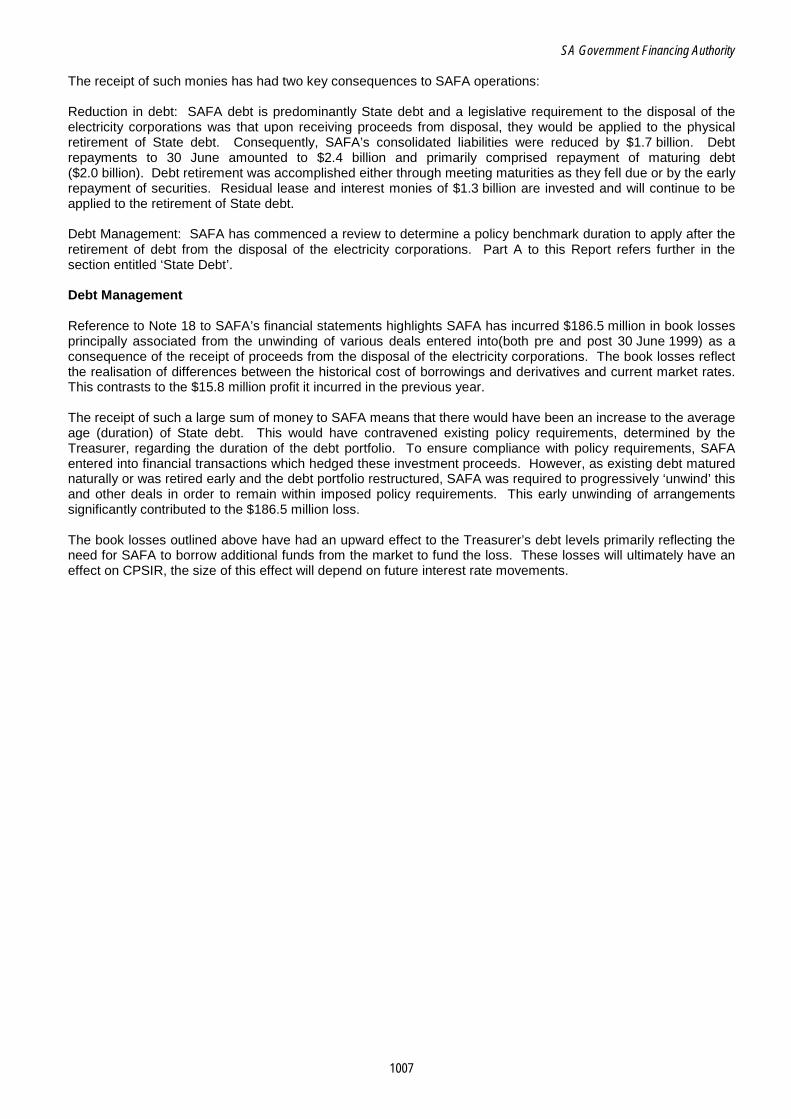
SA Government Financing Authority
1007
The receipt of such monies has had two key consequences to SAFA operations: Reduction in debt: SAFA debt is predominantly State debt and a legislative requirement to the disposal of the electricity corporations was that upon receiving proceeds from disposal, they would be applied to the physical retirement of State debt. Consequently, SAFA’s consolidated liabilities were reduced by $1.7 billion. Debt repayments to 30 June amounted to $2.4 billion and primarily comprised repayment of maturing debt ($2.0 billion). Debt retirement was accomplished either through meeting maturities as they fell due or by the early repayment of securities. Residual lease and interest monies of $1.3 billion are invested and will continue to be applied to the retirement of State debt. Debt Management: SAFA has commenced a review to determine a policy benchmark duration to apply after the retirement of debt from the disposal of the electricity corporations. Part A to this Report refers further in the section entitled ‘State Debt’. Debt Management Reference to Note 18 to SAFA’s financial statements highlights SAFA has incurred $186.5 million in book losses principally associated from the unwinding of various deals entered into(both pre and post 30 June 1999) as a consequence of the receipt of proceeds from the disposal of the electricity corporations. The book losses reflect the realisation of differences between the historical cost of borrowings and derivatives and current market rates. This contrasts to the $15.8 million profit it incurred in the previous year. The receipt of such a large sum of money to SAFA means that there would have been an increase to the average age (duration) of State debt. This would have contravened existing policy requirements, determined by the Treasurer, regarding the duration of the debt portfolio. To ensure compliance with policy requirements, SAFA entered into financial transactions which hedged these investment proceeds. However, as existing debt matured naturally or was retired early and the debt portfolio restructured, SAFA was required to progressively ‘unwind’ this and other deals in order to remain within imposed policy requirements. This early unwinding of arrangements significantly contributed to the $186.5 million loss. The book losses outlined above have had an upward effect to the Treasurer’s debt levels primarily reflecting the need for SAFA to borrow additional funds from the market to fund the loss. These losses will ultimately have an effect on CPSIR, the size of this effect will depend on future interest rate movements.
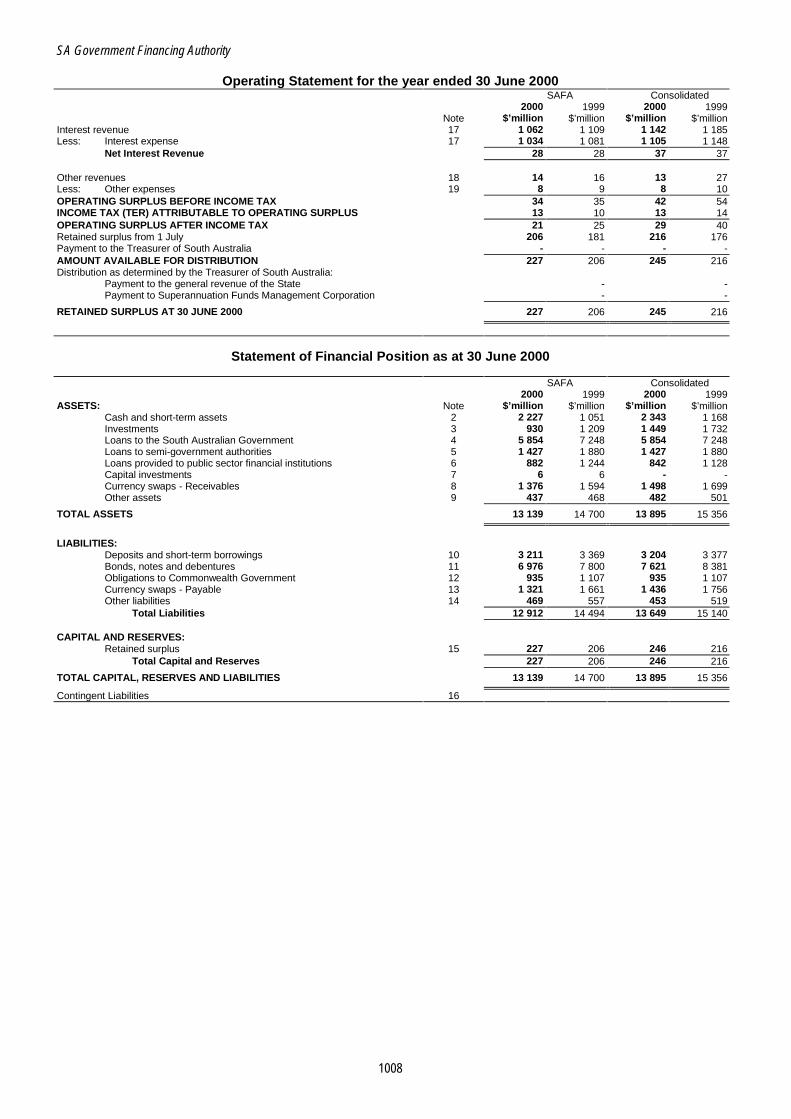
SA Government Financing Authority
1008
Operating Statement for the year ended 30 June 2000 SAFA Consolidated 2000 1999 2000 1999 Note $’million $’million $’million $’million Interest revenue 17 1 062 1 109 1 142 1 185 Less: Interest expense 17 1 034 1 081 1 105 1 148
Net Interest Revenue 28 28 37 37 Other revenues 18 14 16 13 27 Less: Other expenses 19 8 9 8 10 OPERATING SURPLUS BEFORE INCOME TAX 34 35 42 54 INCOME TAX (TER) ATTRIBUTABLE TO OPERATING SURPLUS 13 10 13 14 OPERATING SURPLUS AFTER INCOME TAX 21 25 29 40 Retained surplus from 1 July 206 181 216 176 Payment to the Treasurer of South Australia - - - - AMOUNT AVAILABLE FOR DISTRIBUTION 227 206 245 216 Distribution as determined by the Treasurer of South Australia:
Payment to the general revenue of the State - - Payment to Superannuation Funds Management Corporation - -
RETAINED SURPLUS AT 30 JUNE 2000 227 206 245 216
Statement of Financial Position as at 30 June 2000
SAFA Consolidated 2000 1999 2000 1999 ASSETS: Note $’million $’million $’million $’million
Cash and short-term assets 2 2 227 1 051 2 343 1 168 Investments 3 930 1 209 1 449 1 732 Loans to the South Australian Government 4 5 854 7 248 5 854 7 248 Loans to semi-government authorities 5 1 427 1 880 1 427 1 880 Loans provided to public sector financial institutions 6 882 1 244 842 1 128 Capital investments 7 6 6 - - Currency swaps - Receivables 8 1 376 1 594 1 498 1 699 Other assets 9 437 468 482 501
TOTAL ASSETS 13 139 14 700 13 895 15 356
LIABILITIES:
Deposits and short-term borrowings 10 3 211 3 369 3 204 3 377 Bonds, notes and debentures 11 6 976 7 800 7 621 8 381 Obligations to Commonwealth Government 12 935 1 107 935 1 107 Currency swaps - Payable 13 1 321 1 661 1 436 1 756 Other liabilities 14 469 557 453 519
Total Liabilities 12 912 14 494 13 649 15 140 CAPITAL AND RESERVES:
Retained surplus 15 227 206 246 216 Total Capital and Reserves 227 206 246 216
TOTAL CAPITAL, RESERVES AND LIABILITIES 13 139 14 700 13 895 15 356
Contingent Liabilities 16

SA Government Financing Authority
1009
Statement of Cash Flows for the year ended 30 June 2000 SAFA Consolidated 2000 1999 2000 1999 Inflows Inflows Inflows Inflows (Outflows) (Outflows) (Outflows) (Outflows) CASH FLOWS FROM OPERATING ACTIVITIES: Note $’million $’million $’million $’million PROCEEDS FROM:
Interest and dividends received on loans and capital 785 824 783 825 Interest received on investments 255 195 278 204 Other income 192 12 190 10
PAYMENTS FOR:
Interest paid on borrowings (956) (849) (965) (862) Administration fees paid (8) (14) (9) (15) TER income tax paid (22) (8) (23) (9)
Net Cash provided by Operating Activities 20 246 160 254 153 CASH FLOWS FROM INVESTING ACTIVITIES:
Net proceeds from loans 2397 181 2 419 149 Purchase of investments (11 426) (5 483) (11 671) (5 632) Proceeds from investments 10 532 5 207 10 772 5 354
Net Cash provided by (used in) Investing Activities 1 503 (95) 1 520 (129) CASH FLOWS FROM FINANCING ACTIVITIES:
Repayment of obligations to Commonwealth Government (172) (16) (172) (16) Repayment of borrowings (1 317) 89 (1 344) 130 Distribution to SA government - - - -
Net Cash (used in) provided by Financing Activities (1 489) 73 (1 516) 114 NET INCREASE IN CASH HELD 260 138 258 138 CASH AT 1 JULY 169 33 177 42 EFFECT OF EXCHANGE RATE CHANGES - (2) 1 (3)
CASH AT 30 JUNE 20 429 169 436 177
NOTES TO AND FORMING PART OF THE FINANCIAL STATEMENTS 1. Statement of Accounting Policies
(a) Principal Accounting Policies In the financial statements, the South Australian Government Financing Authority, the ‘Parent Entity’, is referred to as ‘SAFA’ and the ‘Economic Entity’, consists of SAFA and all entities in which it has control. The consolidated accounts comprise the accounts of the Economic Entity.
The financial statements have been prepared in accordance with the Accounting Standards of the Australian Society of Certified Practising Accountants and the Institute of Chartered Accountants in Australia (Accounting Standards), Urgent Issues Group Consensus Views and the requirements of the Treasurer’s Instructions relating to financial reporting by statutory authorities which are issued pursuant to the South Australian Public Finance and Audit Act 1987.
(b) Principles of Consolidation
The consolidated financial statements of the Economic Entity include the accounts of SAFA, being the parent entity, and its affiliated entities listed in Note 27. Where entities have been acquired or sold during the year, their operating results have been included from the date of acquisition or to the date of disposal. All material balances and transactions between members of the Economic Entity have been eliminated on consolidation.
(c) Historical Cost Convention
The historical cost convention has been adopted and unless otherwise stated, the amounts presented in the statement of financial position do not reflect realisable values of assets and liabilities or changes in the purchasing power of money.
(d) Foreign Currency Translation
Foreign currency assets and liabilities are brought into the financial statements at the exchange rate applying at 30 June 2000. Revenue and expense items are translated at the exchange rate current at the date at which those items were recognised in the financial statements. Revaluation of foreign currency assets and liabilities are recognised as unrealised gains or losses and are brought to account in the Operating Statement.
Forward foreign exchange contracts are translated at the exchange rate applying at 30 June 2000. Resulting exchange differences are recognised in the Operating Statement.
(e) Employee Benefits
All officers engaged on SAFA business are employees of the South Australian Department of Treasury and Finance (Treasury). SAFA pays a fee to Treasury for services rendered, including staffing resources. The responsibility to provide for employer contributions to superannuation benefits rests with Treasury and for this reason SAFA is not required to establish a provision. Long service leave liabilities are met by Treasury as they fall due. The controlled entities comprising the Economic Entity do not have any employees.
(f) Recognition of Gains and Losses
Gains and losses result from the early termination of assets, liabilities and derivative transactions, the daily mark-to-market revaluation of financial futures and the realised gains and losses resulting from forward rate agreements. These gains and losses are recognised immediately in the Operating Statement. Where the transaction relates to the management of liabilities on behalf of the Treasurer of South Australia, SAFA recoups the gain or loss by making an adjustment to the Treasurer’s debt level.
SA Government Financing Authority
1010
1. Statement of Accounting Policies (continued) (g) Tax Equivalent Disclosure
SAFA and its controlled entities came under a Tax Equivalent Regime (TER) as from 1 July 1995 and are taxed (at 36 percent) using the Accounting Profits Tax Model. SAFA receives a credit against it TER liability for any income tax paid directly or by its controlled entities in Australia or in other jurisdictions.
South Australian Finance Trust Limited (SAFTL) a SAFA related entity, which previously came under the Commonwealth income tax jurisdiction commenced under the TER as from 1 July 1995 and is assessed under a Substantive Tax Model which adopts as its basis the Income Tax Assessment Act 1936 and the Income Tax Assessment Act 1997.
(h) Derivative Instruments
The Economic Entity utilises derivative instruments in fund raising, debt management and client activities. They are used to convert funding costs, facilitate diversification of funding sources, reconfigure interest rate risk profiles and to manage foreign currency exposures.
The specific policies applying to derivative instruments are detailed below:
Currency Swaps - Recorded in the Statement of Financial Position on a gross basis and translated at the exchange rate applying at 30 June 2000. Resulting exchange differences are recognised in the Operating Statement. Interest receipts and interest payments are accrued on a gross basis in other assets and other liabilities respectively in the Statement of Financial Position and classified as interest revenue and interest expense in the Operating Statement.
Interest Rate Swaps - Accounted for on an historic cost basis with interest receipts and interest payments accrued on a gross basis in other assets and other liabilities respectively in the Statement of Financial Position and classified as net interest expense against Bonds, Notes and Debentures in the Operating Statement.
Financial Futures and Exchange Traded Interest Rate Option Contracts - Marked to market daily and the resultant change in value is recognised directly in the Operating Statement.
Forward Rate Agreements - Realised gains or losses are recognised directly in the Operating Statement.
Forward Foreign Exchange Contract - Translated at the exchange rate applying at 30 June 2000. Resulting exchange differences are recognised in the Operating Statement.
(i) Investments
Investments are assets originating outside the South Australian public sector, which are purchased with the intent to be held until maturity. Such assets may, however, be sold prior to maturity in response to various factors including changes in interest rates and funding requirements of the South Australian public sector.
Investments are recorded at cost with the cost adjusted for the amortisation of premiums and accretion of discounts until maturity. The cost of securities sold is calculated on a closest yield basis of identification.
The Economic Entity does not hold investments for trading purposes.
(j) Loans and Advances
Loans and advances are recognised at recoverable amount, after assessing required provisions for impairment. The Treasurer of South Australia guarantees all loans and advances to South Australian Public Sector entities with the exception of the loan to Funds SA Subsidiary Holding Corporation. The loan portfolio is reviewed regularly and an impairment of a loan would be recognised when there is reasonable doubt that not all the principal and interest can be collected in accordance with the terms of the relevant agreement. There are no impaired loans as at 30 June 2000.
(k) Repurchase Agreements
Securities sold under an agreement to repurchase are retained within the investment category. Liability accounts are used to record the obligation to repurchase. The difference between the sale and repurchase price represents the interest expense and is recognised in the Operating Statement over the term of the repurchase agreement.
(l) Bonds, Notes and Debentures
Funds are raised through various instruments including bonds, notes and debentures. These instruments are recorded at historical cost and the effective historic cost of the transaction is recognised in the Operating Statement on an accrual basis.
(m) Other Assets and Liabilities
Other assets, including debtors, prepayments and accruals, and other liabilities, including creditors, expense accruals and provisions, are all stated at cost.
(n) Maturity of Assets and Liabilities
The maturity classification of the assets and liabilities is determined by the length of time from the date of the financial statements 30 June 2000, to the contractual repayment date of the individual assets and liabilities.
(o) Average Balances
The average balances presented in Note 17 have been calculated on a daily balance with the average rate resulting from a simple calculation of average balance and interest.
(p) Comparatives
The comparative amounts for the previous year have been reclassified to facilitate comparison with changes in presentation in the current year.
(q) Rounding
Unless otherwise indicated, all amounts have been rounded to the nearest million Australian dollars.

SA Government Financing Authority
1011
2. Cash and Short-term Assets SAFA Consolidated 2000 1999 2000 1999
Carrying Value: $’million $’million $’million $’million Cash at bank 16.4 19.1 24.1 27.2 Short-term money market deposits 413.1 150.2 413.1 150.2 Bank securities - 35.0 - 35.0 Negotiable discount securities 1 797.8 846.9 1 906.1 955.1
2 227.3 1 051.2 2 343.3 1 167.5
Net Fair Value: Cash at bank 16.4 19.1 24.1 27.2 Short-term money market deposits 413.1 150.2 413.1 150.2 Bank securities - 35.1 - 35.1 Negotiable discount securities 1 798.0 846.9 1 906.1 955.0
2 227.5 1 051.3 2 343.3 1 167.5
Maturity Analysis of Cash and Liquid Assets: At call 429.5 169.3 437.2 177.4 Due in less than three months 993.6 518.8 999.5 533.9 Longer than three and not longer than 12 months 804.2 363.1 906.6 456.2 Longer than one and not longer than five years - - - - Longer than five years - - - -
2 227.3 1 051.2 2 343.3 1 167.5
3. Investments Carrying Value:
Semi-government securities(1) 362.4 412.4 362.4 412.4 Commonwealth Government guaranteed securities(1) 255.5 373.9 255.5 373.9 Local government securities 33.2 46.9 33.2 46.9 Indexed securities(1) 93.1 93.0 93.1 93.0 Mortgage backed securities 10.7 16.2 10.7 16.2 Corporate securities and loans 175.0 266.2 693.8 789.6
929.9 1 208.6 1 448.7 1 732.0
Net Fair Value: Semi-government securities(1) 360.0 394.1 360.0 394.1 Commonwealth Government guaranteed securities(1) 252.7 360.4 252.7 360.4 Local government securities 47.7 68.0 47.7 68.0 Indexed securities(1) 93.0 96.0 93.0 96.0 Mortgage backed securities 11.9 18.1 11.9 18.1 Corporate securities and loans 176.4 272.3 710.5 836.7
941.7 1 208.9 1 475.8 1 773.3
Maturity Analysis of Investment Securities: At call - - - - Due in less than three months 0.4 0.9 0.4 0.9 Longer than three and not longer than 12 months 120.9 164.4 639.7 282.9 Longer than one and not longer than five years 212.0 349.6 212.0 754.5 Longer than five years 596.6 693.7 596.6 693.7
929.9 1 208.6 1 448.7 1 732.0
(1) The carrying amount of these investments have not been reduced to their net fair value as it is considered that their full
carrying amount will be recovered. 4. Loans to the South Australian Government
Carrying Value: Loans to SA Government at CPSIR 5 737.8 7 121.9 5 737.8 7 121.9 Loans to SA Government at market 116.0 126.3 116.0 126.3
5 853.8 7 248.2 5 853.8 7 248.2
Net Fair Value:
Loans to SA Government at CPSIR 5 932.9 7 517.8 5 932.9 7 517.8 Loans to SA Government at market 130.3 143.2 130.3 143.2
6 063.2 7 661.0 6 063.2 7 661.0
Maturity Analysis of Loans to SA Government:
At call 8.7 8.7 8.7 8.7 Due in less than three months 11.8 0.3 11.8 0.3 Longer than three and not longer than 12 months - 27.6 - 27.6 Longer than one and not longer than five years 25.8 32.1 25.8 32.1 Longer than five years 5 807.5 7 179.5 5 807.5 7 179.5
5 853.8 7 248.2 5 853.8 7 248.2
The Common Public Sector Interest Rate (CPSIR) is the charging mechanism through which the Government allocates the net interest cost paid on debt owing to the external financial market within the South Australian public sector. The CPSIR is the rate charged on the majority of the South Australian Government’s debt with SAFA. The CPSIR is set by the Treasurer on a quarterly basis and interest is payable by public sector entities to the Treasurer and by the Treasurer to SAFA.
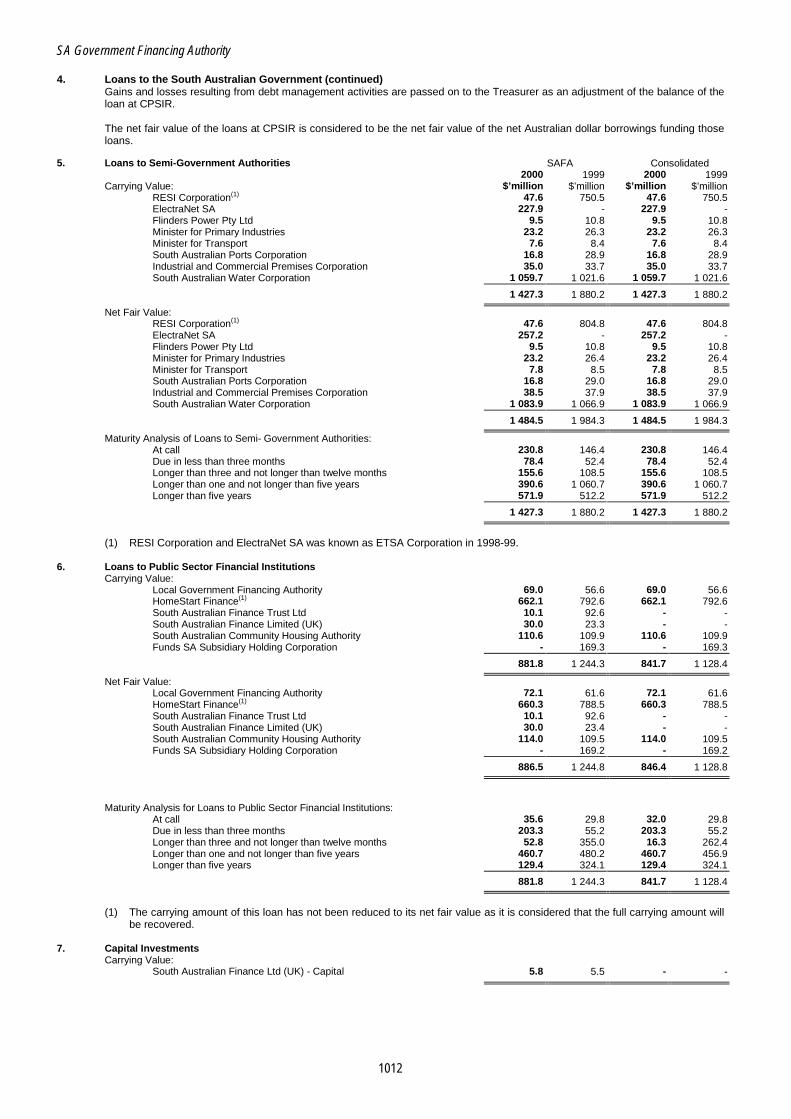
SA Government Financing Authority
1012
4. Loans to the South Australian Government (continued) Gains and losses resulting from debt management activities are passed on to the Treasurer as an adjustment of the balance of the loan at CPSIR.
The net fair value of the loans at CPSIR is considered to be the net fair value of the net Australian dollar borrowings funding those loans.
5. Loans to Semi-Government Authorities SAFA Consolidated 2000 1999 2000 1999
Carrying Value: $’million $’million $’million $’million RESI Corporation(1) 47.6 750.5 47.6 750.5 ElectraNet SA 227.9 - 227.9 - Flinders Power Pty Ltd 9.5 10.8 9.5 10.8 Minister for Primary Industries 23.2 26.3 23.2 26.3 Minister for Transport 7.6 8.4 7.6 8.4 South Australian Ports Corporation 16.8 28.9 16.8 28.9 Industrial and Commercial Premises Corporation 35.0 33.7 35.0 33.7 South Australian Water Corporation 1 059.7 1 021.6 1 059.7 1 021.6
1 427.3 1 880.2 1 427.3 1 880.2
Net Fair Value: RESI Corporation(1) 47.6 804.8 47.6 804.8 ElectraNet SA 257.2 - 257.2 - Flinders Power Pty Ltd 9.5 10.8 9.5 10.8 Minister for Primary Industries 23.2 26.4 23.2 26.4 Minister for Transport 7.8 8.5 7.8 8.5 South Australian Ports Corporation 16.8 29.0 16.8 29.0 Industrial and Commercial Premises Corporation 38.5 37.9 38.5 37.9 South Australian Water Corporation 1 083.9 1 066.9 1 083.9 1 066.9
1 484.5 1 984.3 1 484.5 1 984.3
Maturity Analysis of Loans to Semi- Government Authorities: At call 230.8 146.4 230.8 146.4 Due in less than three months 78.4 52.4 78.4 52.4 Longer than three and not longer than twelve months 155.6 108.5 155.6 108.5 Longer than one and not longer than five years 390.6 1 060.7 390.6 1 060.7 Longer than five years 571.9 512.2 571.9 512.2
1 427.3 1 880.2 1 427.3 1 880.2
(1) RESI Corporation and ElectraNet SA was known as ETSA Corporation in 1998-99.
6. Loans to Public Sector Financial Institutions
Carrying Value: Local Government Financing Authority 69.0 56.6 69.0 56.6 HomeStart Finance(1) 662.1 792.6 662.1 792.6 South Australian Finance Trust Ltd 10.1 92.6 - - South Australian Finance Limited (UK) 30.0 23.3 - - South Australian Community Housing Authority 110.6 109.9 110.6 109.9 Funds SA Subsidiary Holding Corporation - 169.3 - 169.3
881.8 1 244.3 841.7 1 128.4
Net Fair Value: Local Government Financing Authority 72.1 61.6 72.1 61.6 HomeStart Finance(1) 660.3 788.5 660.3 788.5 South Australian Finance Trust Ltd 10.1 92.6 - - South Australian Finance Limited (UK) 30.0 23.4 - - South Australian Community Housing Authority 114.0 109.5 114.0 109.5 Funds SA Subsidiary Holding Corporation - 169.2 - 169.2
886.5 1 244.8 846.4 1 128.8
Maturity Analysis for Loans to Public Sector Financial Institutions:
At call 35.6 29.8 32.0 29.8 Due in less than three months 203.3 55.2 203.3 55.2 Longer than three and not longer than twelve months 52.8 355.0 16.3 262.4 Longer than one and not longer than five years 460.7 480.2 460.7 456.9 Longer than five years 129.4 324.1 129.4 324.1
881.8 1 244.3 841.7 1 128.4
(1) The carrying amount of this loan has not been reduced to its net fair value as it is considered that the full carrying amount will
be recovered. 7. Capital Investments
Carrying Value: South Australian Finance Ltd (UK) - Capital 5.8 5.5 - -
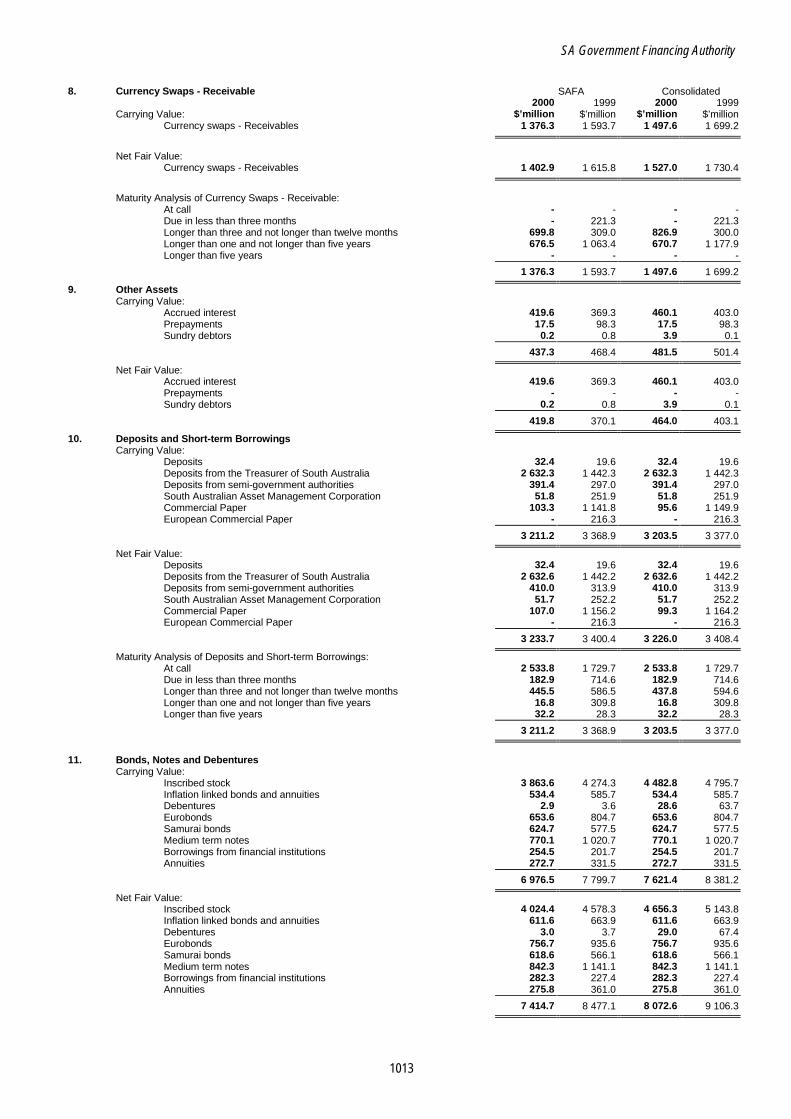
SA Government Financing Authority
1013
8. Currency Swaps - Receivable SAFA Consolidated 2000 1999 2000 1999 Carrying Value: $’million $’million $’million $’million
Currency swaps - Receivables 1 376.3 1 593.7 1 497.6 1 699.2
Net Fair Value:
Currency swaps - Receivables 1 402.9 1 615.8 1 527.0 1 730.4
Maturity Analysis of Currency Swaps - Receivable:
At call - - - - Due in less than three months - 221.3 - 221.3 Longer than three and not longer than twelve months 699.8 309.0 826.9 300.0 Longer than one and not longer than five years 676.5 1 063.4 670.7 1 177.9 Longer than five years - - - -
1 376.3 1 593.7 1 497.6 1 699.2
9. Other Assets Carrying Value:
Accrued interest 419.6 369.3 460.1 403.0 Prepayments 17.5 98.3 17.5 98.3 Sundry debtors 0.2 0.8 3.9 0.1
437.3 468.4 481.5 501.4
Net Fair Value: Accrued interest 419.6 369.3 460.1 403.0 Prepayments - - - - Sundry debtors 0.2 0.8 3.9 0.1
419.8 370.1 464.0 403.1
10. Deposits and Short-term Borrowings Carrying Value:
Deposits 32.4 19.6 32.4 19.6 Deposits from the Treasurer of South Australia 2 632.3 1 442.3 2 632.3 1 442.3 Deposits from semi-government authorities 391.4 297.0 391.4 297.0 South Australian Asset Management Corporation 51.8 251.9 51.8 251.9 Commercial Paper 103.3 1 141.8 95.6 1 149.9 European Commercial Paper - 216.3 - 216.3
3 211.2 3 368.9 3 203.5 3 377.0
Net Fair Value: Deposits 32.4 19.6 32.4 19.6 Deposits from the Treasurer of South Australia 2 632.6 1 442.2 2 632.6 1 442.2 Deposits from semi-government authorities 410.0 313.9 410.0 313.9 South Australian Asset Management Corporation 51.7 252.2 51.7 252.2 Commercial Paper 107.0 1 156.2 99.3 1 164.2 European Commercial Paper - 216.3 - 216.3
3 233.7 3 400.4 3 226.0 3 408.4
Maturity Analysis of Deposits and Short-term Borrowings: At call 2 533.8 1 729.7 2 533.8 1 729.7 Due in less than three months 182.9 714.6 182.9 714.6 Longer than three and not longer than twelve months 445.5 586.5 437.8 594.6 Longer than one and not longer than five years 16.8 309.8 16.8 309.8 Longer than five years 32.2 28.3 32.2 28.3
3 211.2 3 368.9 3 203.5 3 377.0
11. Bonds, Notes and Debentures
Carrying Value: Inscribed stock 3 863.6 4 274.3 4 482.8 4 795.7 Inflation linked bonds and annuities 534.4 585.7 534.4 585.7 Debentures 2.9 3.6 28.6 63.7 Eurobonds 653.6 804.7 653.6 804.7 Samurai bonds 624.7 577.5 624.7 577.5 Medium term notes 770.1 1 020.7 770.1 1 020.7 Borrowings from financial institutions 254.5 201.7 254.5 201.7 Annuities 272.7 331.5 272.7 331.5
6 976.5 7 799.7 7 621.4 8 381.2
Net Fair Value: Inscribed stock 4 024.4 4 578.3 4 656.3 5 143.8 Inflation linked bonds and annuities 611.6 663.9 611.6 663.9 Debentures 3.0 3.7 29.0 67.4 Eurobonds 756.7 935.6 756.7 935.6 Samurai bonds 618.6 566.1 618.6 566.1 Medium term notes 842.3 1 141.1 842.3 1 141.1 Borrowings from financial institutions 282.3 227.4 282.3 227.4 Annuities 275.8 361.0 275.8 361.0
7 414.7 8 477.1 8 072.6 9 106.3

SA Government Financing Authority
1014
11. Bonds, Notes and Debentures (continued) SAFA Consolidated
Maturity Analysis of Bonds, Notes and Debentures: 2000 1999 2000 1999 $’million $’million $’million $’million At call - - - - Due in less than three months 353.5 116.2 353.5 116.2 Longer than three and not longer than twelve months 2 165.0 293.2 2 784.2 329.9 Longer than one and not longer than five years 2 434.3 5 872.9 2 460.0 6 417.7 Longer than five years 2 023.7 1 517.4 2 023.7 1 517.4
6 976.5 7 799.7 7 621.4 8 381.2
12. Obligations to Commonwealth Government Carrying Value:
Obligations to the Commonwealth Government 935.2 1 107.4 935.2 1 107.4
Net Fair Value:
Obligations to the Commonwealth Government 761.2 929.9 761.2 929.9
Maturity Analysis of Obligations to the Commonwealth Government:
At call - - - - Due in less than three months 74.2 111.3 74.2 111.3 Longer than three and not longer than twelve months 5.2 50.2 5.2 50.2 Longer than one and not longer than five years 75.0 154.0 75.0 154.0 Longer than five years 780.8 791.9 780.8 791.9
935.2 1 107.4 935.2 1 107.4
13. Currency Swaps - Payable Carrying Value:
Currency swaps - Payable 1 320.5 1 661.1 1 435.5 1 756.3
Net Fair Value:
Currency swaps - Payable 1 324.1 1 666.7 1 438.8 1 761.9
Maturity Analysis of currency swaps - Payable:
At call - - - - Due in less than three months 0.5 210.9 0.5 210.9 Longer than three and not longer than twelve months 725.5 279.7 846.3 270.8 Longer than one and not longer than five years 594.5 1 170.5 588.7 1 274.6 Longer than five years - - - -
1 320.5 1 661.1 1 435.5 1 756.3
14. Other Liabilities Carrying Value:
Accrued interest 417.6 449.3 398.3 404.5 Interest received in advance 2.6 6.8 2.6 9.0 Income tax liability - 9.1 3.0 13.2 Provisions 29.6 59.0 29.6 59.0 Sundry creditors 19.2 33.2 19.4 33.3
469.0 557.4 452.9 519.0
Net Fair Value: Accrued interest 417.6 449.3 398.3 404.5 Interest received in advance - - - - Income tax liability - 9.1 3.0 13.2 Provisions 29.6 59.0 29.6 59.0 Sundry creditors 19.2 33.2 19.4 33.3
466.4 550.6 450.3 510.0
15. Retained Surplus
Balance at 1 July 205.5 181.0 216.3 176.1 Add: Transfer from Operating Statement 21.9 24.5 29.2 40.2 Less: Prior year end distribution - - - -
227.4 205.5 245.5 216.3
The Treasurer of South Australia determined that there would be no distribution from SAFA for 1999-2000 16. Contingent Liabilities
SAFA, the Parent Entity, has guaranteed the financial obligations of its subsidiary entities in the United Kingdom and Hong Kong. The guarantees have been given in consideration for guarantee fees and in each instance SAFA has secured a first charge over the assets of those companies which comprise high credit status securities. SAFA has provided an indemnity to SAFTL for the aggregate borrowing costs and expenses properly incurred in the normal course of business, where it is shown that income of SAFTL is insufficient. Management does not consider this indemnity will be invoked.
Other indemnities provided by SAFA have been primarily provided to third parties involved, either directly or indirectly, in financing arrangements with SAFA, other statutory authorities and financial institutions of the State and relate to financial advantages which are expected to be available to those parties or to preserve existing financial advantages. No indemnities have been given for income tax aspects of any financing arrangement undertaken since July 1988.
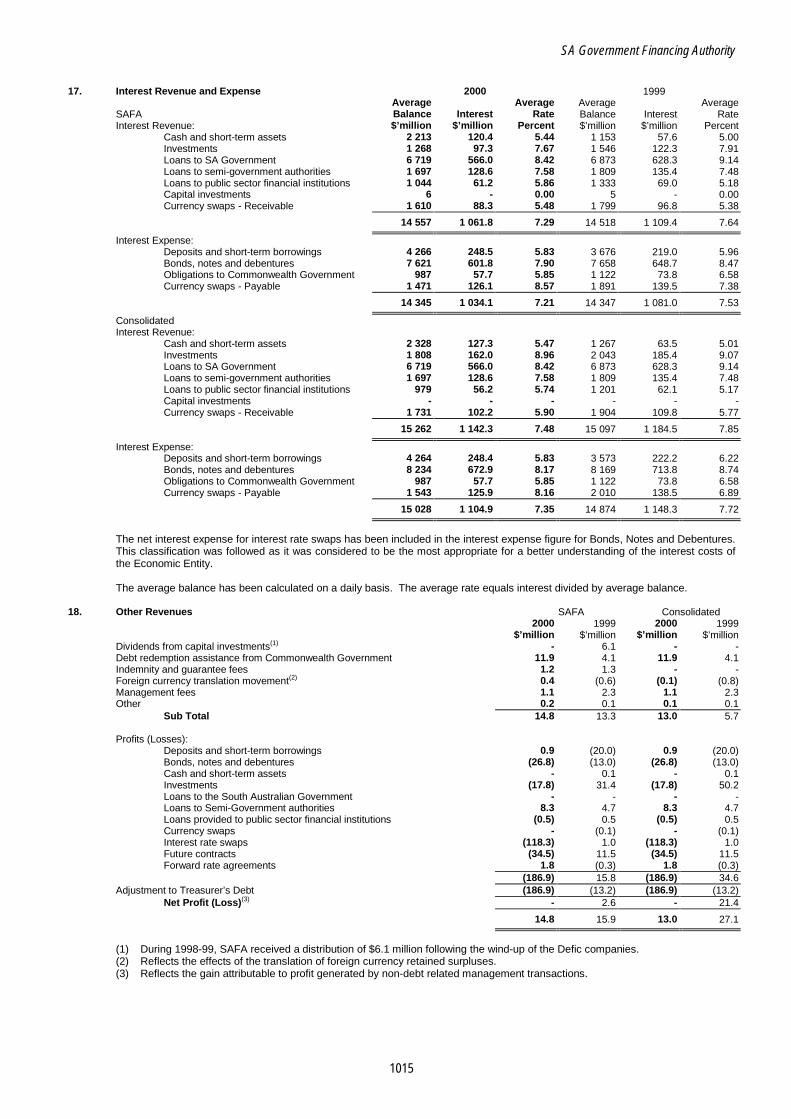
SA Government Financing Authority
1015
17. Interest Revenue and Expense 2000 1999 Average Average Average Average
SAFA Balance Interest Rate Balance Interest Rate Interest Revenue: $’million $’million Percent $’million $’million Percent
Cash and short-term assets 2 213 120.4 5.44 1 153 57.6 5.00 Investments 1 268 97.3 7.67 1 546 122.3 7.91 Loans to SA Government 6 719 566.0 8.42 6 873 628.3 9.14 Loans to semi-government authorities 1 697 128.6 7.58 1 809 135.4 7.48 Loans to public sector financial institutions 1 044 61.2 5.86 1 333 69.0 5.18 Capital investments 6 - 0.00 5 - 0.00 Currency swaps - Receivable 1 610 88.3 5.48 1 799 96.8 5.38
14 557 1 061.8 7.29 14 518 1 109.4 7.64
Interest Expense: Deposits and short-term borrowings 4 266 248.5 5.83 3 676 219.0 5.96 Bonds, notes and debentures 7 621 601.8 7.90 7 658 648.7 8.47 Obligations to Commonwealth Government 987 57.7 5.85 1 122 73.8 6.58 Currency swaps - Payable 1 471 126.1 8.57 1 891 139.5 7.38
14 345 1 034.1 7.21 14 347 1 081.0 7.53
Consolidated Interest Revenue:
Cash and short-term assets 2 328 127.3 5.47 1 267 63.5 5.01 Investments 1 808 162.0 8.96 2 043 185.4 9.07 Loans to SA Government 6 719 566.0 8.42 6 873 628.3 9.14 Loans to semi-government authorities 1 697 128.6 7.58 1 809 135.4 7.48 Loans to public sector financial institutions 979 56.2 5.74 1 201 62.1 5.17 Capital investments - - - - - - Currency swaps - Receivable 1 731 102.2 5.90 1 904 109.8 5.77
15 262 1 142.3 7.48 15 097 1 184.5 7.85
Interest Expense: Deposits and short-term borrowings 4 264 248.4 5.83 3 573 222.2 6.22 Bonds, notes and debentures 8 234 672.9 8.17 8 169 713.8 8.74 Obligations to Commonwealth Government 987 57.7 5.85 1 122 73.8 6.58 Currency swaps - Payable 1 543 125.9 8.16 2 010 138.5 6.89
15 028 1 104.9 7.35 14 874 1 148.3 7.72
The net interest expense for interest rate swaps has been included in the interest expense figure for Bonds, Notes and Debentures. This classification was followed as it was considered to be the most appropriate for a better understanding of the interest costs of the Economic Entity.
The average balance has been calculated on a daily basis. The average rate equals interest divided by average balance.
18. Other Revenues SAFA Consolidated 2000 1999 2000 1999 $’million $’million $’million $’million
Dividends from capital investments(1) - 6.1 - - Debt redemption assistance from Commonwealth Government 11.9 4.1 11.9 4.1 Indemnity and guarantee fees 1.2 1.3 - - Foreign currency translation movement(2) 0.4 (0.6) (0.1) (0.8) Management fees 1.1 2.3 1.1 2.3 Other 0.2 0.1 0.1 0.1
Sub Total 14.8 13.3 13.0 5.7
Profits (Losses): Deposits and short-term borrowings 0.9 (20.0) 0.9 (20.0) Bonds, notes and debentures (26.8) (13.0) (26.8) (13.0) Cash and short-term assets - 0.1 - 0.1 Investments (17.8) 31.4 (17.8) 50.2 Loans to the South Australian Government - - - - Loans to Semi-Government authorities 8.3 4.7 8.3 4.7 Loans provided to public sector financial institutions (0.5) 0.5 (0.5) 0.5 Currency swaps - (0.1) - (0.1) Interest rate swaps (118.3) 1.0 (118.3) 1.0 Future contracts (34.5) 11.5 (34.5) 11.5 Forward rate agreements 1.8 (0.3) 1.8 (0.3)
(186.9) 15.8 (186.9) 34.6 Adjustment to Treasurer’s Debt (186.9) (13.2) (186.9) (13.2)
Net Profit (Loss)(3) - 2.6 - 21.4
14.8 15.9 13.0 27.1
(1) During 1998-99, SAFA received a distribution of $6.1 million following the wind-up of the Defic companies. (2) Reflects the effects of the translation of foreign currency retained surpluses. (3) Reflects the gain attributable to profit generated by non-debt related management transactions.

SA Government Financing Authority
1016
19. Other Expenses SAFA Consolidated 2000 1999 2000 1999 $’million $’million $’million $’million
General administration, salaries and related payments 5.1 5.3 5.1 5.3 Financial Institution’s Duty 1.0 1.7 1.4 1.7 Fees 2.2 2.2 2.2 2.8
8.3 9.2 8.7 9.8
20. Cash Flow Information (a) Reconciliation of Cash
Includes cash on hand and in banks and investments in money market instruments, net of outstanding bank overdrafts 429 169 436 177
(b) Reconciliation of Net Cash provided by Operating Activities to
Operating Surplus after Income Tax Operating surplus after income tax 22 25 29 40 (Increase) Decrease accrued interest income (31) - (32) (5) Increase accrued interest expense 23 130 17 79 Amortisations 231 124 247 147 (Increase) Decrease debtors 1 (1) (3) (2) Decrease creditors (4) (27) (5) (17) (Decrease) Increase in interest received in advance (64) 6 (66) 8 Decrease (Increase) in interest paid in advance 67 (97) 67 (97) FX movement 1 - - -
Net Cash provided by Operating Activities 246 160 254 153
(c) Non-Cash Financing and Investing Activities
During 1999-2000, $186.9 million was adjusted against the Treasurer’s debt for book gains and losses arising from debt management activity.
21. Additional Financial Instrument Disclosures Interest Rate Risk The Economic Entity uses interest rate futures contracts, interest rate swaps, interest rate options and forward rate agreements to manage interest rate risk. The use of interest rate derivatives enables the management of the volatility of the portfolio of debt and assets without requiring transactions in physical securities. (i) Interest Rate Futures Contracts
A futures contract is an obligation to buy or sell an underlying commodity or financial instrument of a standardised amount and quantity at a specified future date with the price being set by an open auction system at the time when the contract is made. The futures contracts principally transacted by SAFA are 90 day bank bill futures contracts and 3 year and 10 year bond futures contracts traded on the Sydney Futures Exchange. The Economic Entity utilises futures contracts to manage interest rate exposures on a specific transaction or portfolio of transactions. Futures contracts are closed out on or before maturity and physical delivery of the underlying instrument does not occur. As at 30 June 2000, open interest rate futures positions represented a total notional principal of $1 155 million.
(ii) Interest Rate Swaps An interest rate swap is a financial contract between two parties agreeing to exchange interest obligations over a fixed term on fixed dates. Interest amounts are calculated on a notional principal. The Economic Entity utilises interest rate swaps to manage interest rate exposures on a specific transaction or portfolio of transactions. Contracts principally involve the payment or receipt of interest payments on a quarterly or semi annual basis. As at 30 June 2000, the notional value of interest rate swaps totalled $10 883 million.
(iii) Exchange Traded Interest Rate Options An interest rate option is a contract between two parties where one party grants to the other party (in consideration for a premium payment) the right, but not the obligation, to receive a payment equal to the amount by which an interest rate differs to a specific strike rate. As at 30 June 2000, there were no outstanding interest rate option contracts.
(iv) Forward Rate Agreements (FRAs) A forward rate agreement is a contractual agreement between two parties to lock in a preset interest rate on an agreed notional principal for a given period of time commencing at a specific future date. The Economic Entity utilises forward rate agreements to manage interest rate exposures on a specific transaction or portfolio of transactions. The notional value of forward rate agreements as at 30 June 2000 is $2 497 million.
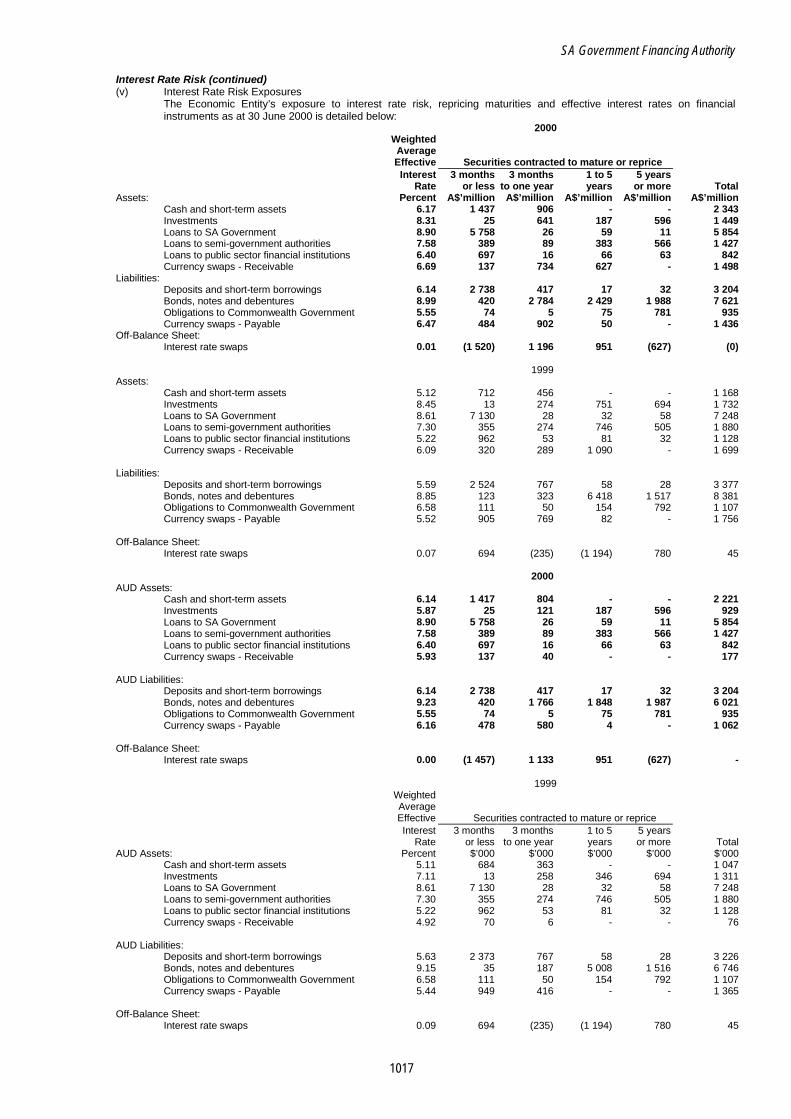
SA Government Financing Authority
1017
Interest Rate Risk (continued) (v) Interest Rate Risk Exposures
The Economic Entity’s exposure to interest rate risk, repricing maturities and effective interest rates on financial instruments as at 30 June 2000 is detailed below:
2000 Weighted Average Effective Securities contracted to mature or reprice Interest 3 months 3 months 1 to 5 5 years Rate or less to one year years or more Total
Assets: Percent A$’million A$’million A$’million A$’million A$’million Cash and short-term assets 6.17 1 437 906 - - 2 343 Investments 8.31 25 641 187 596 1 449 Loans to SA Government 8.90 5 758 26 59 11 5 854 Loans to semi-government authorities 7.58 389 89 383 566 1 427 Loans to public sector financial institutions 6.40 697 16 66 63 842 Currency swaps - Receivable 6.69 137 734 627 - 1 498
Liabilities: Deposits and short-term borrowings 6.14 2 738 417 17 32 3 204 Bonds, notes and debentures 8.99 420 2 784 2 429 1 988 7 621 Obligations to Commonwealth Government 5.55 74 5 75 781 935 Currency swaps - Payable 6.47 484 902 50 - 1 436
Off-Balance Sheet: Interest rate swaps 0.01 (1 520) 1 196 951 (627) (0)
1999 Assets:
Cash and short-term assets 5.12 712 456 - - 1 168 Investments 8.45 13 274 751 694 1 732 Loans to SA Government 8.61 7 130 28 32 58 7 248 Loans to semi-government authorities 7.30 355 274 746 505 1 880 Loans to public sector financial institutions 5.22 962 53 81 32 1 128 Currency swaps - Receivable 6.09 320 289 1 090 - 1 699
Liabilities:
Deposits and short-term borrowings 5.59 2 524 767 58 28 3 377 Bonds, notes and debentures 8.85 123 323 6 418 1 517 8 381 Obligations to Commonwealth Government 6.58 111 50 154 792 1 107 Currency swaps - Payable 5.52 905 769 82 - 1 756
Off-Balance Sheet:
Interest rate swaps 0.07 694 (235) (1 194) 780 45
2000 AUD Assets:
Cash and short-term assets 6.14 1 417 804 - - 2 221 Investments 5.87 25 121 187 596 929 Loans to SA Government 8.90 5 758 26 59 11 5 854 Loans to semi-government authorities 7.58 389 89 383 566 1 427 Loans to public sector financial institutions 6.40 697 16 66 63 842 Currency swaps - Receivable 5.93 137 40 - - 177
AUD Liabilities:
Deposits and short-term borrowings 6.14 2 738 417 17 32 3 204 Bonds, notes and debentures 9.23 420 1 766 1 848 1 987 6 021 Obligations to Commonwealth Government 5.55 74 5 75 781 935 Currency swaps - Payable 6.16 478 580 4 - 1 062
Off-Balance Sheet:
Interest rate swaps 0.00 (1 457) 1 133 951 (627) -
1999 Weighted Average Effective Securities contracted to mature or reprice Interest 3 months 3 months 1 to 5 5 years
Rate or less to one year years or more Total AUD Assets: Percent $’000 $’000 $’000 $’000 $’000
Cash and short-term assets 5.11 684 363 - - 1 047 Investments 7.11 13 258 346 694 1 311 Loans to SA Government 8.61 7 130 28 32 58 7 248 Loans to semi-government authorities 7.30 355 274 746 505 1 880 Loans to public sector financial institutions 5.22 962 53 81 32 1 128 Currency swaps - Receivable 4.92 70 6 - - 76
AUD Liabilities: Deposits and short-term borrowings 5.63 2 373 767 58 28 3 226 Bonds, notes and debentures 9.15 35 187 5 008 1 516 6 746 Obligations to Commonwealth Government 6.58 111 50 154 792 1 107 Currency swaps - Payable 5.44 949 416 - - 1 365
Off-Balance Sheet:
Interest rate swaps 0.09 694 (235) (1 194) 780 45

SA Government Financing Authority
1018
Interest Rate Risk (continued) 2000
Weighted Average Effective Securities contracted to mature or reprice Interest 3 months 3 months 1 to 5 5 years Rate or less to one year years or more Total
Non-AUD Assets: Percent A$’million A$’million A$’million A$’million A$’million Cash and short-term assets 6.77 20 102 - - 122 Investments 12.69 - 520 - - 520 Loans to SA Government - - - - - - Loans to semi-government authorities - - - - - - Loans to public sector financial institutions - - - - - - Currency swaps - Receivable 6.78 - 694 627 - 1 321
Non-AUD Liabilities:
Deposits and short-term borrowings - - - - - - Bonds, notes and debentures 8.04 - 1 018 581 1 1 600 Obligations to Commonwealth Government - - - - - - Currency swaps - Payable 6.82 6 322 46 - 374
Off-Balance Sheet:
Interest rate swaps 0.01 (63) 63 - - (0)
Non-AUD Assets: 1999 Cash and short-term assets 5.23 28 93 - - 121 Investments 12.63 - 16 405 - 421 Loans to SA Government - - - - - - Loans to semi-government authorities - - - - - - Loans to public sector financial institutions - - - - - - Currency swaps - Receivable 6.14 250 283 1 090 - 1 623
Non-AUD Liabilities:
Deposits and short-term borrowings 4.84 151 - - - 151 Bonds, notes and debentures 7.58 88 136 1 410 1 1 635 Obligations to Commonwealth Government - - - - - - Currency swaps - Payable 5.84 (44) 353 82 - 391
Off-Balance Sheet:
Interest rate swaps 0.04 - 0 - - 0
Foreign Exchange Risk The Economic Entity has a policy of avoiding foreign currency risk and has limits in place to protect against movements in foreign currency exchange rates.
(i) Currency Swaps
A cross currency swap is a financial contract between two parties agreeing to exchange interest obligations in two different currencies over a fixed term on fixed dates. Interest amounts are calculated on currency principals which are usually exchanged at the start of the transaction.
The Economic Entity utilises cross currency swaps to eliminate foreign currency exposures associated with foreign currency borrowings.
(ii) Foreign Exchange and Forward Exchange Contracts
A foreign exchange contract is an agreement between two parties to buy and sell one currency against another currency either on a spot basis or a specified future date.
The Economic Entity utilised foreign exchange contracts (spot and forward) to manage foreign exchange risk associated with foreign currency borrowings and to manage exposures arising from the Foreign Exchange Hedging Service provided to South Australian Public Sector Agencies and to hedge profits from overseas subsidiaries.
The Economic Entity has entered into forward foreign exchange contracts to hedge exposures arising from the Foreign Exchange Hedging Service provided to public sector clients. These transactions totalled $19.9 million in face value as at 30 June 2000.
(iii) Currency Exposures The following table summarises the Economic Entity’s exposure to exchange risk. The value to be received under the currency contracts is designed to hedge the exposure to the net foreign currency liabilities.
USD GBP JPY EUR CAD
Less than one year: A$’million A$’million A$’million A$’million A$’million Net foreign currency liabilities 135.1 (69.9) (398.6) 0.1 - Currency Swaps (671.1) 127.1 398.6 - - Net Forward Exchange Contracts 546.8 (47.1) - - -
NET 10.8 10.1 - 0.1 - Greater than one year: Net foreign currency liabilities - (1.3) (480.8) - (102.4) Currency Swaps - - 480.8 - 102.5 Net Forward Exchange Contracts - - - - -
NET - (1.3) - - 0.1
TOTAL NET 10.8 8.8 - 0.1 0.1

SA Government Financing Authority
1019
21. Additional Financial Instrument Disclosures (continued) Credit Risk Credit risk is the risk of financial loss and associated costs, resulting from the failure of a counterparty to meet its financial obligations as and when they fall due. The Economic Entity incurs credit risk through undertaking its core functions of fundraising, debt management and liquidity management. The Economic Entity’s dealings in physical securities and other financial contracts, including derivatives, are transacted only with counterparties possessing strong to extremely strong safety characteristics regarding timely payment of principal and interest. To minimise the potential for credit loss, the Economic Entity complies with stringent credit guidelines. The guidelines are designed to promote diversification of credit risk amongst counterparties while limiting exposure only to highly rated institutions worldwide. The credit guidelines do not apply to loans to South Australian Government Entities. No credit losses were incurred by the Economic Entity over the reporting period, as a consequence of the Economic Entity’s prudent and conservative credit risk policy and management practices. The Economic Entity calculates credit risk for both recognised and unrecognised classes of financial assets. The maximum credit risk for recognised assets excluding cross currency swaps represents the book value of the asset in the Economic Entity’s financial statements. For unrecognised assets and cross currency swaps, the maximum credit risk represents the current market value. Credit risk amounts do not take into account netting or the right of set-off between instruments of similar or different classes. An analysis of credit risk exposure by country, counterparty class, asset class and credit rating as at 30 June 2000 is detailed below.
1999-2000 Rating AAA AA+ AA AA- A+ A A- NR Total
Asset Class $’million $’million $’million $’million $’million $’million $’million $’million $’million Loans/investments 1 625 190 153 1 743 115 91 41 8 446 12 404 Currency swaps 40 44 13 43 51 - - 11 202 Interest rate swaps 34 9 64 144 5 16 - 37 309 FRAs 5 - - - - - - - 5 FX contracts - - - - - - - 1 1
Total 1 704 243 230 1 930 171 107 41 8 495 12 921
1998-99 Rating AAA AA+ AA AA- A+ A A- NR Total
Asset Class $’million $’million $’million $’million $’million $’million $’million $’million $’million Loans/investments 1 585 136 926 325 145 128 47 10 711 14 003 Currency swaps 10 30 14 66 41 1 - 5 167 Interest rate swaps 59 85 139 194 5 54 - 12 548 FRAs 11 - - - - - - - 11 FX contracts - - - - - - - 1 1
Total 1 665 251 1 079 585 191 183 47 10 729 14 730
NR represents no rating and is predominantly loans to the South Australian Government.

SA Government Financing Authority
1020
21. Additional Financial Instrument Disclosures (continued) Consolidation 1999-2000 Counterparty Class Asset Class Country United United Australia Canada France Germany Japan Netherlands Switzerland Kingdom States *(AA+) (AA+) (AAA) (AAA) (AAA) (AAA) (AAA) (AAA) (AAA) Total $’million $’million $’million $’million $’million $’million $’million $’million $’million $’million South Australian Loans/Investments 8 785 - - - - - - - - 8 785 Government Currency swaps 12 - - - - - - - - 12 Interest rate swaps 36 - - - - - - - - 36 FRAs 0 - - - - - - - - 0 FX contracts 1 - - - - - - - - 1 Sub Total 8 834 - - - - - - - - 8 834 Commonwealth/ Loans/Investments 1 036 - - - - - - - - 1 036 State Government Currency swaps 14 - - - - - - - - 14 Interest rate swaps 34 - - - - - - - - 34 FRAs 5 - - - - - - - - 5 FX contracts - - - - - - - - - - Sub Total 1 089 - - - - - - - - 1 089 Banks Loans/Investments 785 60 214 340 - 43 217 711 175 2 545 Currency swaps 38 2 - 2 51 2 53 - 3 151 Interest rate swaps 90 4 15 8 - 2 29 67 24 239 FRAs 0 - - - - - - - - 0 FX contracts 0 - - 0 - 0 - - - 0 Sub Total 913 66 229 350 51 47 299 778 202 2 935 Corporate/Other Loans/Investments 37 - - - - - - 1 0 38 Currency swaps - - - - - - - 25 - 25 Interest rate swaps - - - - - - - - - - FRAs - - - - - - - - - - FX contracts - - - - - - - - - - Sub Total 37 - - - - - - 26 - 63
TOTAL BY COUNTRY 10 873 66 229 350 51 47 299 804 202 12 921
Total by Asset Loans/Investments 10 643 60 214 340 - 43 217 712 175 12 404 Class Currency swaps 64 2 - 2 51 2 53 25 3 202 Interest rate swaps 160 4 15 8 - 2 29 67 24 309 FRAs 5 - - - - - - - - 5 FX contracts 1 - - 0 - 0 - - - 1
TOTAL BY COUNTRY 10 873 66 229 350 51 47 299 804 202 12 921
SAFA’s credit guidelines also permit SAFA to undertake credit exposure transactions with counter-parties from New Zealand, Norway and Singapore. As at 30 June 2000, SAFA did not have any credit exposure to these countries. * Standard and Poor’s long term foreign currency credit rating.

SA Government Financing Authority
1021
21. Additional Financial Instrument Disclosures (continued) Consolidation 1998-99 Counterparty Class Asset Class Country New United United Australia Canada France Germany Japan Netherlands Zealand Switzerland Kingdom States *(AA+) (AA+) (AAA) (AAA) (AAA) (AAA) (AAA) (AAA) (AAA) (AAA) $’million $’million $’million $’million $’million $’million $’million $’million $’million $’million $’million Total South Australian Loans/Investments 10 503 - - - - - - - - - 10 503 Government Currency swaps 6 - - - - - - - - - 6 Interest rate swaps 11 - - - - - - - - - 11 FRAs 0 - - - - - - - - - 0 FX contracts 1 - - - - - - - - - 1 Sub Total 10 521 - - - - - - - - - 10 521 - Commonwealth/ Loans/Investments 1 633 - - - - - - - - - 1 633 State Government Currency swaps 8 - - - - - - - - - 8 Interest rate swaps 34 - - - - - - - - - 34 FRAs 11 - - - - - - - - - 11 FX contracts - - - - - - - - - - - Sub Total 1 686 - - - - - - - - 1 686 Banks Loans/Investments 643 20 110 220 - - 15 - 592 6 1 606 Currency swaps 6 39 2 1 39 1 - 39 - 24 151 Interest rate swaps 244 9 11 28 - 9 - 91 12 63 467 FRAs 0 - - - - - - - - - 0 FX contracts - - - 0 - - - - - - 0 Sub Total 893 68 123 249 39 10 15 130 604 93 2 224 Corporate/Other Loans/Investments 191 - 20 - - - - 50 - - 261 Currency swaps - - - - - - - - 2 - 2 Interest rate swaps 0 - 10 - - - - 6 20 - 36 FRAs - - - - - - - - - - - FX contracts - - - - - - - - - - - Sub Total 191 - 30 - - - - 56 22 - 299
TOTAL BY COUNTRY 13 291 68 153 249 39 10 15 186 626 93 14 730
Total by Asset Loans/Investments 12 970 20 130 220 - - 15 50 592 6 14 003 Class Currency swaps 20 39 2 1 39 1 - 39 2 24 167 Interest rate swaps 289 9 21 28 - 9 - 97 32 63 548 FRAs 11 - - - - - - - - - 11 FX contracts 1 - - - - - - - - - 1
TOTAL BY COUNTRY 13 291 68 153 249 39 10 15 186 626 93 14 730
* Standard and Poor’s long term foreign currency credit rating.
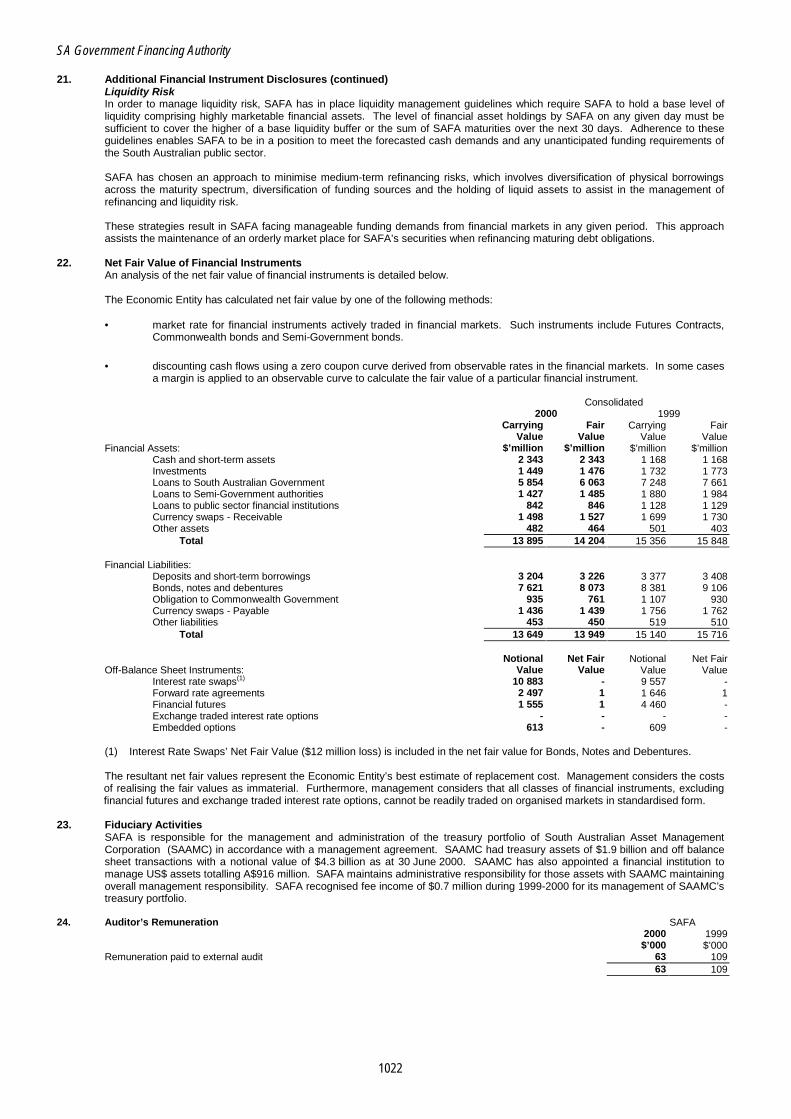
SA Government Financing Authority
1022
21. Additional Financial Instrument Disclosures (continued) Liquidity Risk In order to manage liquidity risk, SAFA has in place liquidity management guidelines which require SAFA to hold a base level of liquidity comprising highly marketable financial assets. The level of financial asset holdings by SAFA on any given day must be sufficient to cover the higher of a base liquidity buffer or the sum of SAFA maturities over the next 30 days. Adherence to these guidelines enables SAFA to be in a position to meet the forecasted cash demands and any unanticipated funding requirements of the South Australian public sector. SAFA has chosen an approach to minimise medium-term refinancing risks, which involves diversification of physical borrowings across the maturity spectrum, diversification of funding sources and the holding of liquid assets to assist in the management of refinancing and liquidity risk. These strategies result in SAFA facing manageable funding demands from financial markets in any given period. This approach assists the maintenance of an orderly market place for SAFA’s securities when refinancing maturing debt obligations.
22. Net Fair Value of Financial Instruments An analysis of the net fair value of financial instruments is detailed below. The Economic Entity has calculated net fair value by one of the following methods: • market rate for financial instruments actively traded in financial markets. Such instruments include Futures Contracts,
Commonwealth bonds and Semi-Government bonds.
• discounting cash flows using a zero coupon curve derived from observable rates in the financial markets. In some cases a margin is applied to an observable curve to calculate the fair value of a particular financial instrument.
Consolidated 2000 1999 Carrying Fair Carrying Fair Value Value Value Value
Financial Assets: $’million $’million $’million $’million Cash and short-term assets 2 343 2 343 1 168 1 168 Investments 1 449 1 476 1 732 1 773 Loans to South Australian Government 5 854 6 063 7 248 7 661 Loans to Semi-Government authorities 1 427 1 485 1 880 1 984 Loans to public sector financial institutions 842 846 1 128 1 129 Currency swaps - Receivable 1 498 1 527 1 699 1 730 Other assets 482 464 501 403
Total 13 895 14 204 15 356 15 848
Financial Liabilities: Deposits and short-term borrowings 3 204 3 226 3 377 3 408 Bonds, notes and debentures 7 621 8 073 8 381 9 106 Obligation to Commonwealth Government 935 761 1 107 930 Currency swaps - Payable 1 436 1 439 1 756 1 762 Other liabilities 453 450 519 510
Total 13 649 13 949 15 140 15 716 Notional Net Fair Notional Net Fair
Off-Balance Sheet Instruments: Value Value Value Value Interest rate swaps(1) 10 883 - 9 557 - Forward rate agreements 2 497 1 1 646 1 Financial futures 1 555 1 4 460 - Exchange traded interest rate options - - - - Embedded options 613 - 609 -
(1) Interest Rate Swaps’ Net Fair Value ($12 million loss) is included in the net fair value for Bonds, Notes and Debentures. The resultant net fair values represent the Economic Entity’s best estimate of replacement cost. Management considers the costs of realising the fair values as immaterial. Furthermore, management considers that all classes of financial instruments, excluding financial futures and exchange traded interest rate options, cannot be readily traded on organised markets in standardised form.
23. Fiduciary Activities SAFA is responsible for the management and administration of the treasury portfolio of South Australian Asset Management Corporation (SAAMC) in accordance with a management agreement. SAAMC had treasury assets of $1.9 billion and off balance sheet transactions with a notional value of $4.3 billion as at 30 June 2000. SAAMC has also appointed a financial institution to manage US$ assets totalling A$916 million. SAFA maintains administrative responsibility for those assets with SAAMC maintaining overall management responsibility. SAFA recognised fee income of $0.7 million during 1999-2000 for its management of SAAMC’s treasury portfolio.
24. Auditor’s Remuneration SAFA 2000 1999 $’000 $’000
Remuneration paid to external audit 63 109 63 109

SA Government Financing Authority
1023
25. Remuneration of SAFA Advisory Board Members SAFA 2000 1999 Number of Number of
Remuneration: Members Members $1 - $10 000 1 1 $10 001- $20 000 - 3 $20 001 - $30 000 3 -
4 4
The Advisory Board as at 30 June 2000 comprised six members:
Mr J Wright (Presiding Member) Mr B Brownjohn Ms S Filby Mr M Doyle Ms A McLeary Ms Y Sneddon The fees paid to Advisory Board Members are set by Executive Council in accordance with approved procedures. Those members who are permanently employed under the Public Sector Management Act 1995 or on similar terms, are not entitled to fees. During 1999-2000 only four members were entitled to receive the approved fee. The total remuneration payable to those members was $75 200 ($38 000).
26. Financial Position of Controlled Entities 2000 Operating Profit Total Total Place of After Tax Assets Liabilities
Incorporation $’million $’million $’million South Australian Finance Trust Limited(2) Aust 0 11 10 South Australian Finance (Hong Kong) Limited(2) HK 0 1 0 South Australian Finance Trust (Hong Kong)(2) HK 1 37 32 South Australian Finance Limited(1) UK 7 792 773 SABT Pty Limited Aust - - -
Palantir Pty Limited(3) Aust - - - (1) The South Australian Finance Limited provides consolidated financial information including a dormant subsidiary South
Australian Investments. (2) Zero represents balances less than $500 000. (3) SAFA acquired the shares, $2, in Palantir Pty Limited on 15 June 2000. Palantir Pty Limited is of no value and will be wound
up in 2000-01.
27. Related Party Transactions South Australian Asset Management Corporation Related party transactions with the South Australian Asset Management Corporation are disclosed in Note 10 of the Statement of Financial Position. Interest expense relating to the borrowings from SAAMC for 1999-2000 totalled $13.6 million.

1024
SOUTH AUSTRALIAN SUPERANNUATION BOARD FUNCTIONAL RESPONSIBILITY AND STRUCTURE The South Australian Superannuation Board (the Board) is a body corporate established pursuant to subsection 6(2) of the Superannuation Act 1988 (the Act). Pursuant to subsection 8(1) of the Act, the Board consists of a presiding member appointed by the Governor, two members elected by the contributors and two members appointed by the Governor on the Minister’s nomination. The Board is responsible for the administration of two separate superannuation schemes:
The functions and responsibilities in relation to each scheme are established by separate Acts of Parliament as follows. South Australia Superannuation Scheme The Superannuation Act 1988 (the Act) provides for the establishment of an employer sponsored voluntary superannuation scheme to provide superannuation benefits for persons employed by the Government of South Australia and other prescribed persons, and makes provisions for families of such persons. The Act does not apply to Members of Parliament, the judiciary or police officers who are provided for under separate legislation. Pursuant to subsection 7(1) of the Act, the Board is responsible to the Minister for all aspects of the administration of the Superannuation Act except the management and investment of the South Australia Superannuation Fund (the Fund). The South Australian Superannuation Scheme has the following components: • Old Scheme Division — This relates to the provision of pension based benefits; • New Scheme Division — This relates to the provision of lump sum benefits. In addition, Employer Contribution Accounts have been established to record the employer contributions towards their share of the emerging liability for benefit payments in relation to the Scheme. The Superannuation Funds Management Corporation of South Australia, operating under the business name of Funds SA, a body corporate, has statutory responsibility for the investment and management of the Fund. This Fund comprises the contributions of employees and income derived from investment of those funds, less the Fund portion of benefits payable and administration expenses. Funds SA also invests and manages the employer contributions on behalf of the Board.
South Australian Superannuation Board
South Australian Superannuation
Scheme
Southern State Superannuation
Scheme
South Australian Superannuation Fund
Employer Contribution Accounts
Southern State Superannuation Fund
Southern State Superannuation
(Employers) Fund
SA Superannuation Board
1025
Both the Old Scheme and the New Scheme Divisions were closed to new membership in May 1986 and June 1994, respectively. Consequently, the South Australian Superannuation Scheme is now a ‘closed’ scheme, having been replaced by the Southern State Superannuation Scheme effective 1 July 1995 (refer hereunder for further details). Southern State Superannuation Scheme The Southern State Superannuation Act 1994 (Triple S Act) originally established the Southern State Superannuation Scheme (Triple S Scheme) to provide an employer sponsored contributory superannuation scheme for persons employed in the public sector. The Triple S Scheme replaced the South Australian Superannuation Scheme as the Government sponsored scheme available to public sector employees. The Triple S Scheme is now both a contributory and non-contributory superannuation scheme as, effective 1 July 1998, the Southern State Superannuation (Merger of Schemes) Amendment Act 1998 merged the schemes established under the Triple S Act and the Superannuation (Benefit Scheme) Act 1992 (SBS Act). At that time, all members of the State Superannuation Benefit Scheme (SSBS) were effectively transferred into the Triple S Scheme and the SSBS ceased to exist. The SSBS became operational on 1 July 1992, pursuant to the SBS Act. The scheme provided employer benefits for public sector employees who were not actively contributing to an employer sponsored superannuation scheme, in order to satisfy the minimum level required under the Commonwealth Government’s Superannuation Guarantee (Administration) Act 1992. Employees were not able to make their own contributions to the SSBS. The Triple S Act charges the Board with responsibility for the maintenance of: • accounts in the name of all members of the Triple S Scheme;
• proper accounts in respect of each financial year relating to the receipt of member contributions and payments to members.
The Southern State Superannuation Fund (Triple S Fund) is established pursuant to the Triple S Act. The Triple S Fund comprises the contributions of employees and rollovers from other superannuation funds or schemes to the Triple S Scheme and income derived from investments of those funds, less the Fund portion of benefits paid. Funds SA is responsible for the investment and management of the Triple S Fund. The Triple S Act also establishes the Southern State Superannuation (Employers) Fund (Triple SE Fund), which comprises employer contributions (including those transferred from the SSBS) and rollovers from other superannuation funds or schemes to the Triple S Scheme and income derived from investment of those funds less the Fund portion of benefits paid and administration expenses. The Triple SE Fund is also managed and invested by Funds SA. Service Provision Arrangements The Board utilises the services of the Department of Treasury and Finance - Superannuation Office (Super SA) in carrying out its functions. The Superannuation Office maintains individual member records, processes contributions and determines and processes benefit payments. The Board has a service level contract with the Department of Treasury and Finance for the provision of superannuation administration services. The contract includes performance standards for services, management reporting requirements and internal control requirements. For further information in relation to the investment and management of superannuation monies reference should be made to comments under ‘Superannuation Funds Management Corporation of South Australia’ elsewhere in Part B of this Report.
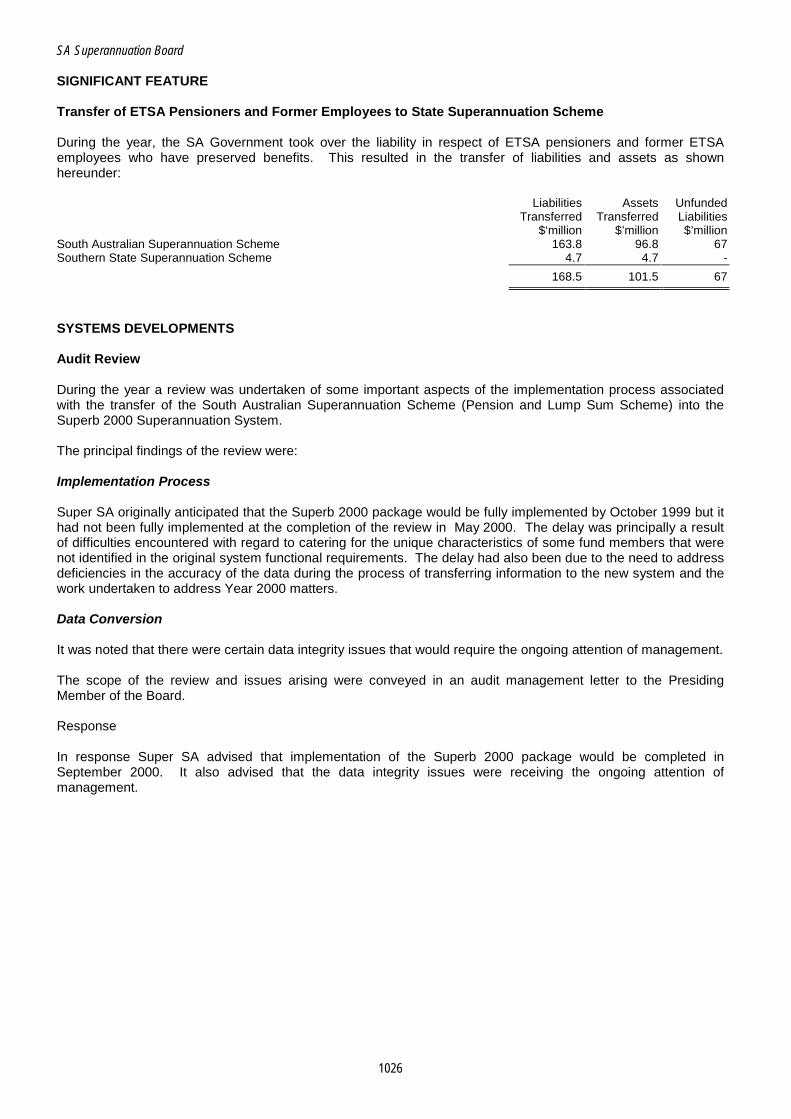
SA Superannuation Board
1026
SIGNIFICANT FEATURE Transfer of ETSA Pensioners and Former Employees to State Superannuation Scheme During the year, the SA Government took over the liability in respect of ETSA pensioners and former ETSA employees who have preserved benefits. This resulted in the transfer of liabilities and assets as shown hereunder: Liabilities Assets Unfunded Transferred Transferred Liabilities $‘million $’million $’million South Australian Superannuation Scheme 163.8 96.8 67 Southern State Superannuation Scheme 4.7 4.7 -
168.5 101.5 67
SYSTEMS DEVELOPMENTS Audit Review During the year a review was undertaken of some important aspects of the implementation process associated with the transfer of the South Australian Superannuation Scheme (Pension and Lump Sum Scheme) into the Superb 2000 Superannuation System. The principal findings of the review were: Implementation Process Super SA originally anticipated that the Superb 2000 package would be fully implemented by October 1999 but it had not been fully implemented at the completion of the review in May 2000. The delay was principally a result of difficulties encountered with regard to catering for the unique characteristics of some fund members that were not identified in the original system functional requirements. The delay had also been due to the need to address deficiencies in the accuracy of the data during the process of transferring information to the new system and the work undertaken to address Year 2000 matters. Data Conversion It was noted that there were certain data integrity issues that would require the ongoing attention of management. The scope of the review and issues arising were conveyed in an audit management letter to the Presiding Member of the Board. Response In response Super SA advised that implementation of the Superb 2000 package would be completed in September 2000. It also advised that the data integrity issues were receiving the ongoing attention of management.

SA Superannuation Board
1027
SOUTH AUSTRALIAN SUPERANNUATION SCHEME SIGNIFICANT FEATURES • The estimated liability for accrued benefits as at 30 June 2000 was $6.8 billion ($6.4 billion) for which net
assets of $3 billion ($2.3 billion) were available to pay benefits.
• Contribution revenue increased by $191 million to $526 million. This was due principally to an increase of $88 million in the amount received in respect of past service liability funding and an increase of $107 million in transfers from other schemes. The increase in transfers from other schemes was due principally to the South Australian Government taking on the liability in respect of ETSA pensioners and former ETSA employees who have preserved benefits. For further comment in respect to this matter refer to South Australian Superannuation Board elsewhere in Part B of this Report.
AUDIT MANDATE AND COVERAGE Audit Authority Subsection 20AB(2) of the Superannuation Act 1988 provides for the Auditor-General to audit, in respect of each financial year, the accounts kept by the Board of receipts and payments relating to the payment of benefits under the Act. Scope of Audit The audit program covered all major financial systems and was directed primarily towards obtaining sufficient evidence to enable an audit opinion to be formed with respect to the financial statements and internal control. During 1999-2000 specific areas of audit attention included: • receipting and banking of employer and employee contributions • processing of contributions data • maintenance of member accounts • benefit payments • liability for accrued benefits. The audit did not include a review of the investment and management activities undertaken by Funds SA in respect of the assets of the Fund and Employer Contribution Accounts; these areas were reviewed in the course of the audit of Funds SA. Audit Communications to Management Issues arising from the audit of the Scheme will be the subject of a letter to be forwarded to the Presiding Member, South Australian Superannuation Board in October 2000. Further comments relating to these issues are contained in ‘Audit Findings and Comments’ hereunder. AUDIT FINDINGS AND COMMENTS Commentary on General Financial Controls The review of the specific auditable areas of coverage involved an assessment of the adequacy of accounting, record keeping and control, and the test verification of financial transactions processed and recorded during the year. The review identified a number of instances where internal control procedures either required improvement or were not applied consistently over the year. Notwithstanding, substantive testing of transactions processed did not reveal any material errors in the sample tested.

SA Superannuation Board
1028
CONTROLS OPINION As required by subsection 36(1)(a)(iii) of the Public Finance and Audit Act 1987, the audit of the South Australian Superannuation Scheme included an assessment of the controls exercised in relation to the receipt, expenditure and investment of money, the acquisition and disposal of property and the incurring of liabilities. The assessment also considered whether those controls were consistent with the prescribed elements of the Financial Management Framework as required by Treasurer’s Instruction 2 ‘Financial Management Policies’. Audit formed the opinion that the controls exercised by the South Australian Superannuation Scheme in relation to the receipt, expenditure and investment of money; the acquisition and disposal of property; and the incurring of liabilities, were sufficient to provide reasonable assurance that the financial transactions of the organisation were conducted properly and in accordance with the law. INTERPRETATION AND ANALYSIS OF FINANCIAL STATEMENTS Funding of Benefit Payments Benefit payments are funded from a number of sources. Benefits paid by funding source are depicted in the following pie chart.
Employer Contribution Accounts
12%
Public Authorities6%
Commonwealth Government
12%
SA Government Employer Account
53%
SA Superannuation Fund17%
The Fund portion of a benefit is fully funded. Member contributions are deposited with Funds SA and on payment of a benefit, a proportion of the amount is charged against the Fund. The amount charged is determined by legislation and regulation. There are numerous arrangements covering the funding of the employer liability for accrued superannuation benefits. Depending on the employer’s arrangement with the Board they may either make provisions for superannuation liabilities in their own accounts and pay for benefits as they emerge; they may contribute fortnightly to Employer Contribution Accounts managed by Funds SA, in this way funding their accruing liability; or they may make cash contributions to the Treasurer, who in turn forwards these monies to Funds SA. In addition, the Commonwealth Government meets an agreed portion of benefits payable where the employer portion relates to former State Government (railways) employees. Note 1(d) to the Financial Statements provides details of the various funding arrangements.
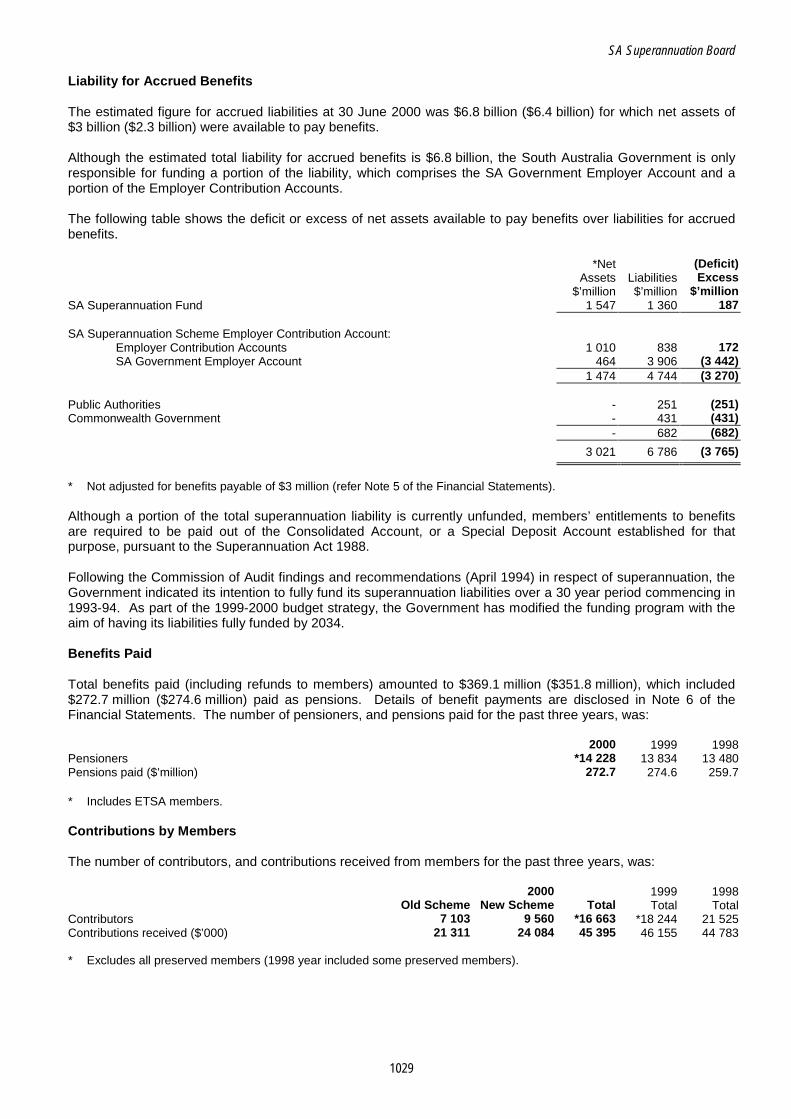
SA Superannuation Board
1029
Liability for Accrued Benefits The estimated figure for accrued liabilities at 30 June 2000 was $6.8 billion ($6.4 billion) for which net assets of $3 billion ($2.3 billion) were available to pay benefits. Although the estimated total liability for accrued benefits is $6.8 billion, the South Australia Government is only responsible for funding a portion of the liability, which comprises the SA Government Employer Account and a portion of the Employer Contribution Accounts. The following table shows the deficit or excess of net assets available to pay benefits over liabilities for accrued benefits. *Net (Deficit) Assets Liabilities Excess $’million $’million $’million SA Superannuation Fund 1 547 1 360 187 SA Superannuation Scheme Employer Contribution Account:
Employer Contribution Accounts 1 010 838 172 SA Government Employer Account 464 3 906 (3 442)
1 474 4 744 (3 270) Public Authorities - 251 (251) Commonwealth Government - 431 (431) - 682 (682) 3 021 6 786 (3 765)
* Not adjusted for benefits payable of $3 million (refer Note 5 of the Financial Statements). Although a portion of the total superannuation liability is currently unfunded, members’ entitlements to benefits are required to be paid out of the Consolidated Account, or a Special Deposit Account established for that purpose, pursuant to the Superannuation Act 1988. Following the Commission of Audit findings and recommendations (April 1994) in respect of superannuation, the Government indicated its intention to fully fund its superannuation liabilities over a 30 year period commencing in 1993-94. As part of the 1999-2000 budget strategy, the Government has modified the funding program with the aim of having its liabilities fully funded by 2034. Benefits Paid Total benefits paid (including refunds to members) amounted to $369.1 million ($351.8 million), which included $272.7 million ($274.6 million) paid as pensions. Details of benefit payments are disclosed in Note 6 of the Financial Statements. The number of pensioners, and pensions paid for the past three years, was: 2000 1999 1998 Pensioners *14 228 13 834 13 480 Pensions paid ($’million) 272.7 274.6 259.7 * Includes ETSA members. Contributions by Members The number of contributors, and contributions received from members for the past three years, was: 2000 1999 1998 Old Scheme New Scheme Total Total Total Contributors 7 103 9 560 *16 663 *18 244 21 525 Contributions received ($’000) 21 311 24 084 45 395 46 155 44 783 * Excludes all preserved members (1998 year included some preserved members).

SA Superannuation Board
1030
Operating Statement for the year ended 30 June 2000 2000 1999 Note $’000 $’000 $’000 INVESTMENT REVENUE: 2(b) Index linked bonds - 12 310 Property - 10 862 Adelaide Plaza - 8 266 Australian equities - 99 862 International equities - 64 880 Fixed interest - 4 197 Cash - 3 392 Net investment revenue 484 858 484 858 203 769 CONTRIBUTION REVENUE: Contribution for past service liability 1(d)(i) 228 895 146 618 Contributions by employers 128 446 138 209 Transfers from other schemes 123 434 3 688 Contributions by members 45 395 46 155 Refunds of overpaid contributions (218) (139) 525 952 334 531 OTHER REVENUE 19 64 432 68 056 DIRECT INVESTMENT EXPENSE 2(b) - (1 338) ADMINISTRATION EXPENSE 4 (3 698) (4 222) BENEFITS EXPENSE 8 (762 513) (898 443)
OPERATING RESULT FOR THE PERIOD 309 031 (297 647)
Statement of Financial Position as at 30 June 2000 2000 1999 Note $’000 $’000 $’000 INVESTMENTS: 10 Index linked bonds 348 072 261 993 Property 238 820 187 766 Adelaide Plaza 96 860 9 408 Australian equities 976 475 743 538 International equities 1 064 280 745 677 Fixed interest 150 871 205 265 Cash 45 835 76 343 2 921 213 2 229 990 FIXED ASSETS 58 154 OTHER ASSETS: Cash and deposits at Treasury 12 110 910 242 642 Cash and deposits at Treasury - Funds SA 32 397 Contributions receivable 3 3 256 4 407 Interest, dividends and rent due 917 298 Prepaid expenses 56 57 ETSA transfer value 20 41 - Administration fees paid in advance - 503 Other income receivable 18 12 061 3 618 Sundry debtors 18 893 7 128 166 251 929 Total Assets 3 049 437 2 482 073 CURRENT LIABILITIES: Prepaid employer contributions - 126 300 Rent paid in advance 811 978 Benefits payable 2(f) 2 987 - Sundry creditors and provisions 13 3 133 13 823 Provisions for PAYE tax payable 14 2 275 63 9 206 141 164 NON-CURRENT LIABILITIES: Loan and finance facilities 22 445 22 567 Total Liabilities 31 651 163 731 NET ASSETS AVAILABLE TO PAY BENEFITS 5,17 3 017 786 2 318 342 Less: LIABILITY FOR ACCRUED BENEFITS 8 6 785 600 6 392 200
EXCESS OF LIABILITIES OVER NET ASSETS (3 767 814) (4 073 858)
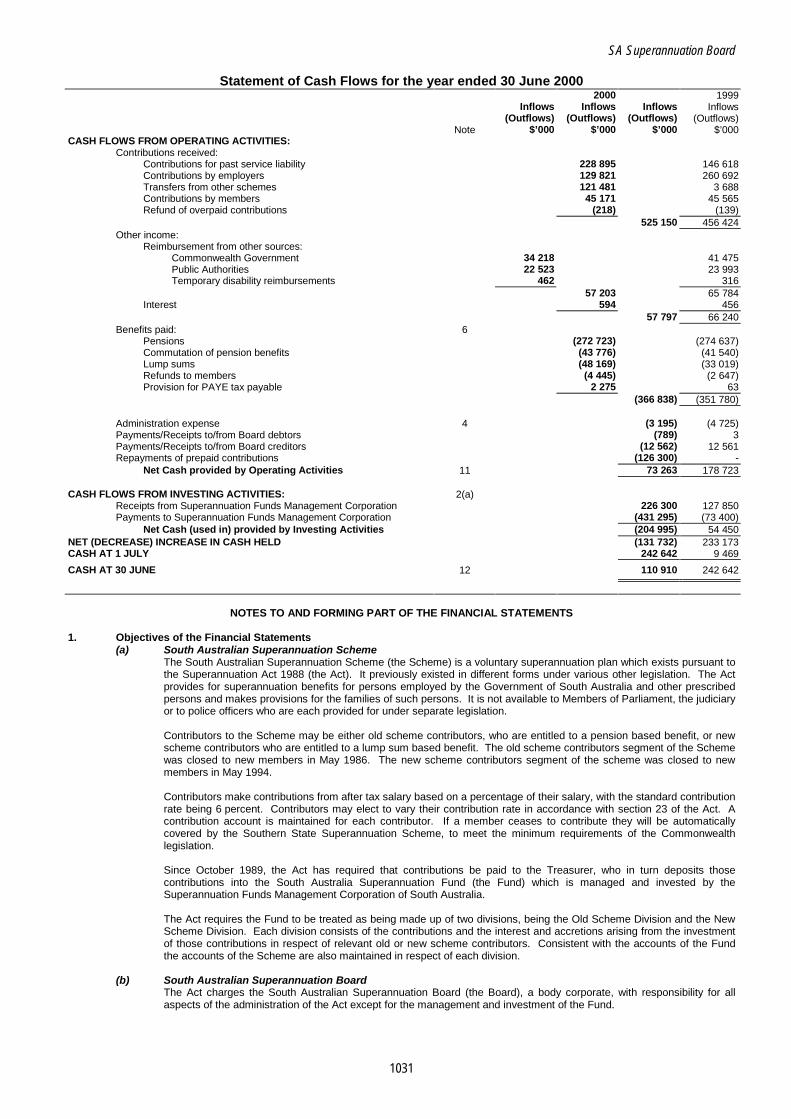
SA Superannuation Board
1031
Statement of Cash Flows for the year ended 30 June 2000 2000 1999 Inflows Inflows Inflows Inflows (Outflows) (Outflows) (Outflows) (Outflows) Note $’000 $’000 $’000 $’000 CASH FLOWS FROM OPERATING ACTIVITIES: Contributions received: Contributions for past service liability 228 895 146 618 Contributions by employers 129 821 260 692 Transfers from other schemes 121 481 3 688 Contributions by members 45 171 45 565 Refund of overpaid contributions (218) (139) 525 150 456 424 Other income: Reimbursement from other sources: Commonwealth Government 34 218 41 475 Public Authorities 22 523 23 993 Temporary disability reimbursements 462 316 57 203 65 784 Interest 594 456 57 797 66 240 Benefits paid: 6 Pensions (272 723) (274 637) Commutation of pension benefits (43 776) (41 540) Lump sums (48 169) (33 019) Refunds to members (4 445) (2 647) Provision for PAYE tax payable 2 275 63 (366 838) (351 780) Administration expense 4 (3 195) (4 725) Payments/Receipts to/from Board debtors (789) 3 Payments/Receipts to/from Board creditors (12 562) 12 561 Repayments of prepaid contributions (126 300) - Net Cash provided by Operating Activities 11 73 263 178 723 CASH FLOWS FROM INVESTING ACTIVITIES: 2(a) Receipts from Superannuation Funds Management Corporation 226 300 127 850 Payments to Superannuation Funds Management Corporation (431 295) (73 400) Net Cash (used in) provided by Investing Activities (204 995) 54 450 NET (DECREASE) INCREASE IN CASH HELD (131 732) 233 173 CASH AT 1 JULY 242 642 9 469
CASH AT 30 JUNE 12 110 910 242 642
NOTES TO AND FORMING PART OF THE FINANCIAL STATEMENTS 1. Objectives of the Financial Statements
(a) South Australian Superannuation Scheme The South Australian Superannuation Scheme (the Scheme) is a voluntary superannuation plan which exists pursuant to the Superannuation Act 1988 (the Act). It previously existed in different forms under various other legislation. The Act provides for superannuation benefits for persons employed by the Government of South Australia and other prescribed persons and makes provisions for the families of such persons. It is not available to Members of Parliament, the judiciary or to police officers who are each provided for under separate legislation. Contributors to the Scheme may be either old scheme contributors, who are entitled to a pension based benefit, or new scheme contributors who are entitled to a lump sum based benefit. The old scheme contributors segment of the Scheme was closed to new members in May 1986. The new scheme contributors segment of the scheme was closed to new members in May 1994. Contributors make contributions from after tax salary based on a percentage of their salary, with the standard contribution rate being 6 percent. Contributors may elect to vary their contribution rate in accordance with section 23 of the Act. A contribution account is maintained for each contributor. If a member ceases to contribute they will be automatically covered by the Southern State Superannuation Scheme, to meet the minimum requirements of the Commonwealth legislation. Since October 1989, the Act has required that contributions be paid to the Treasurer, who in turn deposits those contributions into the South Australia Superannuation Fund (the Fund) which is managed and invested by the Superannuation Funds Management Corporation of South Australia. The Act requires the Fund to be treated as being made up of two divisions, being the Old Scheme Division and the New Scheme Division. Each division consists of the contributions and the interest and accretions arising from the investment of those contributions in respect of relevant old or new scheme contributors. Consistent with the accounts of the Fund the accounts of the Scheme are also maintained in respect of each division.
(b) South Australian Superannuation Board The Act charges the South Australian Superannuation Board (the Board), a body corporate, with responsibility for all aspects of the administration of the Act except for the management and investment of the Fund.

SA Superannuation Board
1032
(b) South Australian Superannuation Board (continued) Under the terms of the Act, the Board is required to determine rates of return to be credited to each division of the Fund, with those rates being credited to each contribution account at the end of the financial year. In determining the rate to be applied, the Act requires that the Board have regard to the net rate of return achieved by the Superannuation Funds Management Corporation of South Australia for each division of the Fund, and also the desirability of reducing undue fluctuations in the rate of return on contribution accounts. In considering these factors in the past the Board has applied crediting rates which were different from the actual earnings rates. For the Old Scheme Division, the Board distributes all investment earnings and there is no income equalisation reserve. For the New Scheme Division, the Board does have a reserving policy and the income equalisation reserve forms part of the net assets available to pay benefits of the new scheme.
(c) Superannuation Funds Management Corporation of South Australia The Superannuation Funds Management Corporation of South Australia (Funds SA), a body corporate, was established for the purpose of managing and investing the accounts of various public sector superannuation schemes. Funds SA is responsible for the management and investment of the Fund and the SA Superannuation Scheme Contribution Account. For further information on the investment of the Fund and the SA Superannuation Scheme Employer Contribution Account, reference should be made to the financial statements of Funds SA. The investment assets, liabilities, income and expense contained in these financial statements are related to the investment activities of Funds SA.
(d) Funding Arrangements Under section 20B of the Act, any payment made to a contributor must be made out of the Consolidated Account, (which is then appropriated to the necessary extent) or a Special Deposit Account established for that purpose. The Treasurer may subsequently reimburse the Consolidated Account or Special Deposit Account from the Fund the proportion of any such payment charged against the contributor’s contribution account. The prescribed proportion of that payment or benefit payments to be charged to the old scheme contributor’s accounts is set out in the Regulations of the Act. During the year ended 30 June 2000 payments were made from a Special Deposit Account. The Treasurer may also seek reimbursement of the employer portion of any such payments from certain employer bodies under agreements made between the Treasurer and/or the Board and those employer bodies. The employer portion of benefits is met from the ‘South Australian Superannuation Scheme Contribution Account’ (the Account) established by the Treasurer to record employer superannuation contributions. The employer portion of payments may be in relation to State Government Departments, Statutory Authorities and former State Government employees now employed by the Commonwealth Government. Funding for the employer portion of payments met from the Account is from monies deposited under arrangements with respective employers. Monies deposited in the Account are invested and managed by Funds SA but do not form part of the Fund. The Treasurer seeks reimbursement from the Account balances as benefits are paid. The arrangement with employers are: (i) State Government Departments
State Government Departments pay fortnightly employer contributions to the Treasurer for their emerging superannuation liabilities which are deposited by the Treasurer into the Account. Since 30 June 1994 the Government has commenced a process of funding its accrued past service superannuation liabilities. During the year ended 30 June 2000 the Government transferred $227.3 million ($145 million) to the Account to meet liabilities in respect of the Scheme. The Government will continue to pay contributions to the Account to meet the accrued past service liability so that the liability will be fully funded by 30 June 2034. Where a payment relates to a temporary disability benefit, the Treasurer seeks reimbursement from the Account in the first instance and simultaneously seeks reimbursement of the Account directly from the Government Department as the benefit is paid.
(ii) Statutory Authorities Where the employer proportion of a payment relates to Statutory Authorities, three different funding arrangements exist. These arrangements are made by the Board, which has entered into agreements with individual authorities pursuant to section 5 of the Act. The terms agreed in any such arrangements must be approved by the Minister. The three arrangements are: • State Government Liability for Statutory Authorities
These authorities have made arrangements with the Board to fund their emerging superannuation liabilities by making regular payments, based on actuarial assessment, to the Treasurer. These monies are deposited in an Employer Contribution Account. In addition, the Government has commenced a process of funding the past service superannuation liability for these authorities as outlined in Note 1(d)(i).
• Employer Contribution Accounts Certain public sector employers have made arrangements with the Board to fund their superannuation liabilities by making regular payments to the Treasurer based on an actuarial assessment. The Treasurer deposits these monies in the Account into what are referred to as Employer Contribution Accounts. The Treasurer seeks reimbursement from the Employer Contribution Account balances as benefits are paid. During the year ended 30 June 1995 the South Australia Housing Trust commenced a 30 year program of funding its accrued superannuation liabilities. An amount of $1.6 million ($1.6 million) was received during 1999-2000 representing accrued past service superannuation liabilities.
SA Superannuation Board
1033
(ii) Statutory Authorities (continued) • Public Authorities Accounts (Universities)
Some public authorities make provisions in their own accounts for their future superannuation liabilities and no balances are maintained in the Employer Contribution Account. The Treasurer seeks reimbursement from the Account in the first instance and simultaneously seeks reimbursement directly from these authorities as benefits are paid.
(iii) Commonwealth Government The Commonwealth Government meets an agreed portion of benefits payable where the employer proportion of a payment relates to former State Government (railways) employees. The Commonwealth contribution is made pursuant to the Rail Transfer Agreement between the Commonwealth and State Governments. No balances are maintained in the Account for this purpose and the Treasurer seeks reimbursement directly from the Commonwealth Government as benefits are paid.
The liability for future benefits is funded to the extent of benefits to be reimbursed from the Fund, Employer Contribution Accounts and the Public Authorities Accounts referred to in Note 1(d)(ii) above. The liability for future benefits is only partially funded in respect of benefits to be reimbursed from State Government Departments and the State Government liability for Statutory Authorities. The net assets figure shown in these statements represents the amount available to meet these future benefits.
2. Summary of Significant Accounting Policies (a) Basis of Accounting
The Financial Statements have been drawn up, to the extent practicable, in accordance with Australian Accounting Standard AAS 25 ‘Financial Reporting by Superannuation Plans’ and with Treasurer’s Instructions issued pursuant to the Public Finance and Audit Act 1987. Funds SA operates a unitised investment portfolio utilising a number of asset class funds, each of which holds assets of a different category. The Scheme holds an interest in the asset class funds by way of notional ‘units’, as determined by Funds SA, rather than holding assets directly. As funds of the Scheme are regularly subscribed to and redeemed from the asset class funds, in line with the Scheme’s cash flow requirements, it is not possible to accurately determine the separate contribution by realised and unrealised gains to the Scheme’s income. For this reason, unrealised gains are not separately identified as required by AAS 25 and the Statement of Cash Flows only reflects a net result for cash flows from investing activities. For information regarding the manner in which Funds SA operates its investment portfolio, and the contributions that realised and unrealised gains make to Funds SA’s total investment returns, reference should be made to the financial statements of Funds SA.
(b) Changes in Accounting Policy For the year ended 30 June 2000, these statements have been prepared on an accrual basis for all items. Funds SA are unable to provide a breakdown of investment revenue by asset class and accordingly an investment revenue figure net of direct investment expense has been reported.
(c) Basis of Valuations The basis of valuation of assets is summarised below. These assets are all held by Funds SA, and the valuation techniques listed are those employed by Funds SA. Valuations are net of estimated disposal transaction costs, where material. (i) Index Linked Bonds
The index linked bonds portfolio comprises two subsectors: • Internally Managed
These investments, the returns of which are linked to movements in either the Consumer Price Index (CPI), or Average Weekly Earnings (AWE), have been valued using the discounted cash flow method. The valuation as at 30 June 2000 was performed by an independent valuer, Macquarie Bank Limited.
• Externally Managed The externally managed portfolio is invested and managed by an independent professional manager. The custodian appointed to hold the assets has valued the portfolio using market prices applicable at balance date.
(ii) Property The property portfolio consists of four subsectors: • Directly Held Properties
Valuations of directly held properties have been carried out by independent licensed property valuers other than as indicated in Note 8 to the financial statements of Funds SA.
• Directly Held Listed Property Trusts Investments in directly held listed property trusts have been valued using market prices applicable at the balance date.
• Externally Managed Listed Property Trusts The externally managed listed property trust portfolio is invested and managed by two independent professional managers. The custodian appointed to hold the assets has valued the portfolios using market prices applicable at the balance date.
• Externally Managed Unlisted Property Vehicles Investments in externally managed unlisted property vehicles have been valued in accordance with the exit valuations supplied by the managers.
SA Superannuation Board
1034
(c) Basis of Valuations (continued) (iii) Australian Equities
The Australian Equities portfolio comprises two subsectors: • Listed Australian Equities
The listed Australian Equities portfolio is invested and managed by independent professional managers. The custodian appointed to hold the assets has valued the portfolio using market prices applicable at the balance date.
• Private Equity The private equity portfolio comprises holdings in a number of externally managed specialist funds together with internally managed assets. The externally managed specialist funds have been valued by the managers in accordance with the Australian Venture Capital Association Limited (AVCAL) guidelines. Internally managed assets have been valued by the Directors of Funds SA, either in accordance with market prices applicable at balance date, or having regard to market conditions and the current and expected future performance of the investments.
(iv) International Equities The International Equities portfolio is invested and managed by independent professional managers. Discretely managed portfolios have been valued by the custodian appointed to hold the assets using market prices applicable at the balance date. Investments in pooled International vehicles and private equity funds have been valued in accordance with the exit valuations supplied by the managers. Currency conversions have been made at the spot market mid rates applying at the balance date where applicable.
(v) Adelaide Plaza The Adelaide Plaza Fund comprises Funds SA’s investment in the Funds SA Subsidiary Holding Corporation, a wholly owned subsidiary of Funds SA (refer Note 11 of the Funds SA Financial Statements). The Funds SA Subsidiary Holding Corporation’s remaining investments at 30 June comprise the units in the Riverside Office Trust (the owner and operator of the Riverside Office building, North Terrace), the shares in Riverside Office Pty Ltd (the trustee company for the Riverside Office Trust) and cash. Funds SA’s investment in the Adelaide Plaza Fund has been valued by the Directors of Funds SA having regard to 30 June 2000 consolidated management accounts of the Funds SA Subsidiary Holding Corporation.
(vi) Fixed Interest The Fixed Interest portfolio is invested and managed by independent professional managers. The custodian appointed to hold the assets has valued the portfolio using market prices applicable at the balance date.
(vii) Cash Deposits at call and other deposits of very short term duration have been valued on the basis of principal plus accrued interest. Bank bills have been valued using market rates applicable at the balance date.
(viii) Fixed Assets Fixed Assets are shown at cost less accumulated depreciation. Depreciation is calculated over the estimated useful lives of the assets, using straight line and diminishing value methods. The Directors are of the opinion that this provides a reasonable estimate of market value.
(ix) Other Assets and Liabilities These items have been assessed, and the Directors of Funds SA are of the opinion that for most items book values provide a reasonable estimate of their market values. Where material items are not likely to be realised within a short period following the balance date, the book values of these items have been discounted back to the balance date using market related interest rates.
(d) Accounting for Leases Incentives received on entering into operating leases are recognised as liabilities. Lease payments are allocated
between rental expense and reduction of the liability on a straight line basis. The allocation of lease rental payments in this manner ensures that the rental expense is recognised on a basis which is representative of the pattern of benefits derived from the leased asset.
(e) Operation of Investment Portfolio
Funds SA operates a pooled investment portfolio utilising a number of sector funds, each of which holds assets of a different category. The sector funds are:
• Index linked bonds • Property • Australian equities • International equities • Fixed interest • Cash
Funds SA also operates a multi-layered notional unitisation structure to facilitate the administration of different investment
strategies applying to the various public sector superannuation funds/schemes.(1) Each public sector superannuation fund/scheme holds units in an investment product, which in turn holds units in each of
the sector funds according to the target strategic asset allocation for the investment product. Units are issued and redeemed monthly at unit prices determined by the net market value of underlying investments.
The interest which each public sector superannuation fund/scheme holds in the unitised investment portfolio is disclosed
in each fund’s/scheme’s Statement of Net Assets Under Management in Note 20 of the Funds SA Financial Statements. Each fund’s/scheme’s allocation of total net investment income is disclosed in Note 5(b) and in each fund’s/scheme’s Statement of Changes in Net Assets in Note 20 of the Funds SA Financial Statements.

SA Superannuation Board
1035
(e) Operation of Investment Portfolio (continued) In addition to the foregoing sector funds, another sector fund titled the ‘Adelaide Plaza Fund’ was established in 1995 to
hold Funds SA’s investment in the Adelaide Casino, Hyatt Hotel and Riverside Office building. At 30 June, the units in this sector fund were held exclusively by three ‘government risk’ client schemes; the SA Superannuation Employer Contribution Account, the Police Superannuation Scheme Employer Contribution Account and the Police Occupational Superannuation Scheme.
(1) From 1 July 1999, Funds SA implemented a range of investment strategies (or ‘products’) to cater for the
introduction of member investment choice offered to members of the Southern State Superannuation Scheme. Funds SA therefore manages five separate investment products distinguished by differing strategic asset allocations. The products are:
• Growth • Balanced • Conservative • Cash • Defined benefit
The first four products are available to members of the Southern State Superannuation Scheme whereas the fifth product, Defined Benefit, is applied to the rest of the public sector superannuation funds managed by Funds SA. Reference should be made to Funds SA’s annual report for the strategic asset allocations applying to each of the investment products.
(f) Comparative Figures
Certain 1999 comparative figures have been adjusted to reflect consistency with the current year disclosure. 1999 figures have been used where available. Additional notes have been included in the 2000 year to provide a greater detail of the numbers disclosed in the statements. Prior year comparatives were not available for the additional notes. A figure for benefits payable has also been incorporated for the first time in the 2000 year.
3. Contributions Receivable 2000 1999 $’000 $’000 Contributions by members 814 590 Contributions by employers 2 442 3 817
3 256 4 407
Contributions receivable have decreased in the 1999-2000 year as Super SA has been actively following up agencies to ensure the timely remittance of contributions.
4. Administration
Costs of administering the Scheme comprise those costs incurred by Funds SA in administering the investment activities of the Fund and the Employer Contribution Account, and those costs incurred by the Board in administering the Scheme. Administration costs incurred by the Board in administering the Scheme are met in the first instance from the Department of Treasury and Finance Operating Account. The cost is recovered in two components: • Subsection 17(7) of the Act requires that the Fund meet a prescribed portion of these costs, currently 30 percent. • 70 percent of costs were deducted from the employer contributions received during the year.
The administration cost met by the Scheme is as follows: 2000 Old New Scheme Scheme Total Division Division 2000 1999 $’000 $’000 $’000 $’000 Actual cost of administration 1 912 1 786 3 698 4 222 Administration cost charged to the Fund (30 percent) 574 536 1 110 1 266 Administration cost deducted from employer contributions 1 338 1 250 2 588 2 956 5. Net Assets available to Pay Benefits
Net assets available to pay benefits consist of the combined balances of the South Australia Superannuation Fund and the SA Superannuation Scheme Employer Contribution Account. Movements in the balance of these accounts are detailed below:
(a) South Australian Superannuation Fund 2000 Old New Scheme Scheme Total Division Division 2000 1999 $’000 $’000 $’000 $’000 Funds held at 1 July 1 040 744 256 778 1 297 522 1 198 181 Add: Contributions 21 311 24 084 45 395 46 155 Transfers from other schemes 50 233 483 50 716 2 812 Refunds of overpaid contributions (209) (9) (218) (139) Investment income(i) 176 039 44 777 220 816 113 329 Other income 50 39 89 73 247 424 69 374 316 798 162 230 Less: Net benefits paid(ii) 54 372 12 112 66 484 61 623 Administration costs 623 615 1 238 1 266 54 995 12 727 67 722 62 889 Funds held at 30 June 1 233 173 313 425 1 546 598 1 297 522
(i) Shown net of direct investment expenses. (ii) Refer to Note 6.

SA Superannuation Board
1036
5. Net Assets available to Pay Benefits (continued) 2000 1999 (b) SA Superannuation Scheme Employer Contribution Account $’000 $’000 $’000 Funds held at 1 July 1 020 820 871 208 Add: Employer contributions: State Government Departments 89 748 97 885 Transfers from other schemes 72 717 876 Statutory Authorities(i) 38 698 40 324 Contribution for past service liability(ii) 228 895 146 618 430 058 285 703
Investment income(iii) 86 000 - Investment income(iv) 178 042 89 102 Other income 64 343 67 983 758 443 442 788 Less: Benefits paid:(v) Old Scheme contributors 275 200 269 682 New Scheme contributors 27 428 20 538 Administration expenses 2 460 2 956 305 088 293 176 Funds held at 30 June 1 474 175 1 020 820 Less: Benefits payable(vi) 2 987 -
Total Net Assets 3 017 786 2 318 342
(i) Refer to Note 1(d)(ii). (ii) The recent actuarial review suggested that the employer contribution rates could be reduced. This excess of
contributions has been allocated to the past service liability. (iii) The premium from the sale of the Casino complex by Funds SA will provide $86 million of the Government’s
scheduled contribution from the State Budget (refer budget papers page 2.2). (iv) Shown net of direct investment expenses. (v) Refer to Note 6. (vi) Refer to Note 2(f).
6. Benefit Payments
The SA Superannuation Scheme Employer Contribution Account recovers monies from the relevant agencies for the total benefits paid on account of Public Authorities, Commonwealth Government and various agencies for Temporary Disability Pensions.
2000 1999 Old New Old New Scheme Scheme Scheme Scheme Pensions: Division Division Total Division Division Total Funded from: $’000 $’000 $’000 $’000 $’000 $’000 SA Superannuation Fund 43 043 92 43 135 43 857 95 43 952
SA Superannuation Scheme Employer Contribution Account:
Employer contribution accounts 20 197 451 20 648 15 569 470 16 039 Public authorities 19 946 1 19 947 20 244 23 20 267 Commonwealth Government 36 093 - 36 093 38 414 - 38 414 Various agencies for Temporary Disability Pensions - - - 160 156 316 SA Government employer account 152 591 309 152 900 155 408 241 155 649 Gross Scheme Costs 271 870 853 272 723 273 652 985 274 637 Commutations: Funded from: SA Superannuation Fund 7 285 - 7 285 6 298 - 6 298 SA Superannuation Scheme Employer Contribution Account: Employer contribution accounts 6 579 - 6 579 3 685 - 3 685 Public authorities 1 556 - 1 556 3 041 - 3 041 Commonwealth Government 4 875 - 4 875 4 751 - 4 751 SA Government employer account 23 481 - 23 481 23 765 - 23 765 Gross Scheme Costs 43 776 - 43 776 41 540 - 41 540 Lump Sums: New Scheme: Funded from: SA Superannuation Fund - 10 524 10 524 - 7 954 7 954 SA Superannuation Scheme Employer Contribution Account: Employer contribution accounts - 9 378 9 378 - 6 817 6 817 Public authorities - 568 568 - 199 199 SA Government employer account - 15 130 15 130 - 12 352 12 352 Gross Scheme Costs - 35 600 35 600 - 27 322 27 322
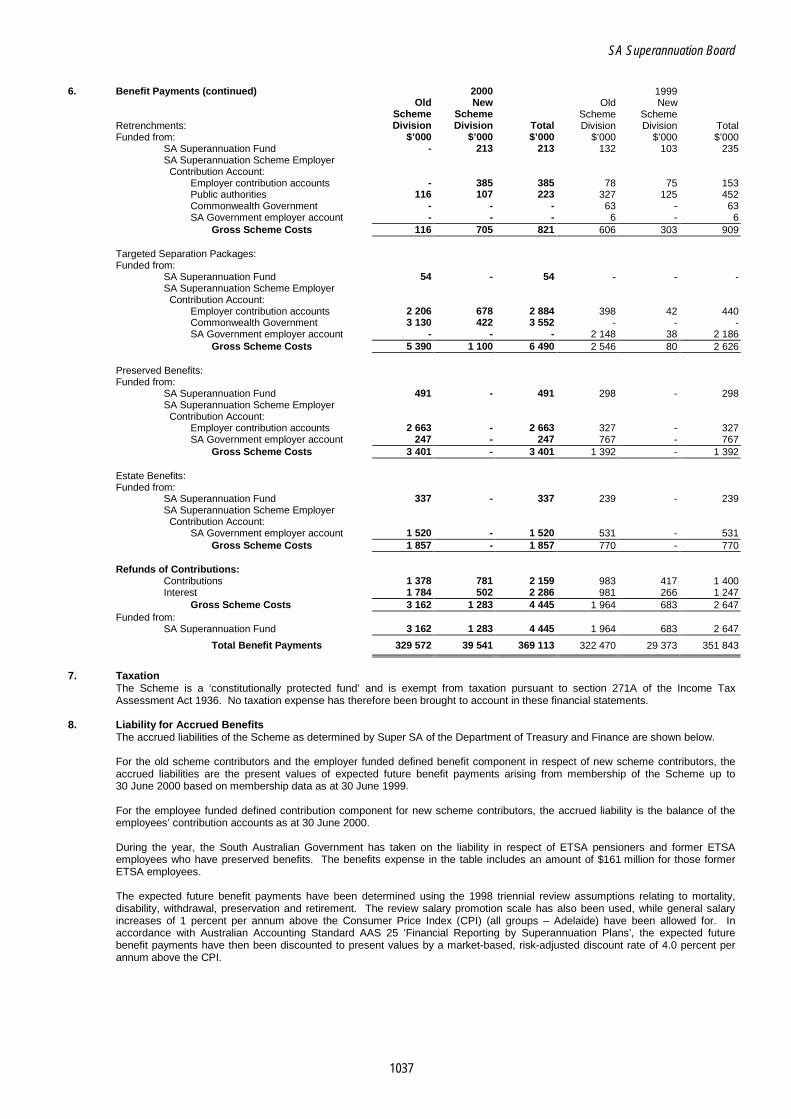
SA Superannuation Board
1037
6. Benefit Payments (continued) 2000 1999 Old New Old New Scheme Scheme Scheme Scheme Retrenchments: Division Division Total Division Division Total Funded from: $’000 $’000 $’000 $’000 $’000 $’000 SA Superannuation Fund - 213 213 132 103 235 SA Superannuation Scheme Employer Contribution Account: Employer contribution accounts - 385 385 78 75 153 Public authorities 116 107 223 327 125 452 Commonwealth Government - - - 63 - 63 SA Government employer account - - - 6 - 6 Gross Scheme Costs 116 705 821 606 303 909 Targeted Separation Packages: Funded from: SA Superannuation Fund 54 - 54 - - - SA Superannuation Scheme Employer Contribution Account: Employer contribution accounts 2 206 678 2 884 398 42 440 Commonwealth Government 3 130 422 3 552 - - - SA Government employer account - - - 2 148 38 2 186 Gross Scheme Costs 5 390 1 100 6 490 2 546 80 2 626 Preserved Benefits: Funded from: SA Superannuation Fund 491 - 491 298 - 298 SA Superannuation Scheme Employer Contribution Account: Employer contribution accounts 2 663 - 2 663 327 - 327 SA Government employer account 247 - 247 767 - 767 Gross Scheme Costs 3 401 - 3 401 1 392 - 1 392 Estate Benefits: Funded from: SA Superannuation Fund 337 - 337 239 - 239 SA Superannuation Scheme Employer Contribution Account: SA Government employer account 1 520 - 1 520 531 - 531 Gross Scheme Costs 1 857 - 1 857 770 - 770 Refunds of Contributions: Contributions 1 378 781 2 159 983 417 1 400 Interest 1 784 502 2 286 981 266 1 247 Gross Scheme Costs 3 162 1 283 4 445 1 964 683 2 647 Funded from: SA Superannuation Fund 3 162 1 283 4 445 1 964 683 2 647
Total Benefit Payments 329 572 39 541 369 113 322 470 29 373 351 843
7. Taxation
The Scheme is a ‘constitutionally protected fund’ and is exempt from taxation pursuant to section 271A of the Income Tax Assessment Act 1936. No taxation expense has therefore been brought to account in these financial statements.
8. Liability for Accrued Benefits
The accrued liabilities of the Scheme as determined by Super SA of the Department of Treasury and Finance are shown below.
For the old scheme contributors and the employer funded defined benefit component in respect of new scheme contributors, the accrued liabilities are the present values of expected future benefit payments arising from membership of the Scheme up to 30 June 2000 based on membership data as at 30 June 1999.
For the employee funded defined contribution component for new scheme contributors, the accrued liability is the balance of the employees’ contribution accounts as at 30 June 2000. During the year, the South Australian Government has taken on the liability in respect of ETSA pensioners and former ETSA employees who have preserved benefits. The benefits expense in the table includes an amount of $161 million for those former ETSA employees.
The expected future benefit payments have been determined using the 1998 triennial review assumptions relating to mortality, disability, withdrawal, preservation and retirement. The review salary promotion scale has also been used, while general salary increases of 1 percent per annum above the Consumer Price Index (CPI) (all groups – Adelaide) have been allowed for. In accordance with Australian Accounting Standard AAS 25 ‘Financial Reporting by Superannuation Plans’, the expected future benefit payments have then been discounted to present values by a market-based, risk-adjusted discount rate of 4.0 percent per annum above the CPI.

SA Superannuation Board
1038
8. Liability for Accrued Benefits (continued) 2000 1999 Old New Old New Scheme Scheme Scheme Scheme Division Division Total Division Division Total Changes in the liability for accrued benefits: $’000 $’000 $’000 $’000 $’000 $’000 Liability for accrued benefits at 1 July 5 690 400 701 800 6 392 200 5 257 700 587 900 5 845 600 Add: Benefits expense 616 472 146 041 762 513 755 170 143 273 898 443 Less: Benefits paid(I) 329 572 39 541 369 113 322 470 29 373 351 843
Liability for Accrued Benefits at 30 June 5 977 300 808 300 6 785 600 5 690 400 701 800 6 392 200
Represented by: SA Superannuation Fund 1 046 200 313 400 1 359 600 974 900 255 700 1 230 600 SA Superannuation Scheme Employer Contribution Account: Employer contribution accounts 647 400 190 200 837 600 629 100 167 100 796 200 SA Government employer account 3 610 200 296 100 3 906 300 3 424 300 271 300 3 695 600 Public authorities 242 300 8 600 250 900 223 100 7 700 230 800 Commonwealth Government 431 200 - 431 200 439 000 - 439 000
Total 5 977 300 808 300 6 785 600 5 690 400 701 800 6 392 200
(i) Refer to Note 6.
Although the total liability for accrued benefits shown above is $6.8 billion, the SA Government is only responsible for funding a portion of the liability, which comprises the SA Government Employer Account and a portion of the Employer Contribution Accounts. For further details refer to Note 1(d).
Pursuant to the Act, actuarial review of the Scheme must be conducted on a three yearly basis to address, inter alia, the ability of the Fund to meet its current and future liabilities. The last review was carried out as at 30 June 1998 by Mr Laurie Brett, Fellow of the Institute of Actuaries of Australia. His report, dated 21 May 1999, to the Minister was be tabled in Parliament on 28 September 1999. These reviews take account of assets held, future contributions to be received from members and future benefits to be paid by the Fund. In contrast, the purpose of the accrued liability calculations, which are made annually, is to estimate the value of future payments that can be attributed to service up to the date of the calculation. There is no direct relationship between the liability figures determined by those two assessments.
9. Vested Benefits
Vested benefits are benefits which are not conditional upon continued membership of the Scheme (or any factor other than resignation from the Scheme) and include benefits which contributors would be entitled to receive on termination of their Scheme membership.
When contributors resign they have two options in the Pension Scheme (Old Scheme Division) and three options in the Lump Sum Scheme (New Scheme Division). Firstly, they can elect to take a cash refund of their own contributions, accumulated with interest, but with no employer money added. Secondly, they can elect to take a fully vested, preserved benefit which will be based on their full accrued entitlement at the date of resignation and will be increased during preservation in line with increases in the CPI. In addition, Lump Sum Scheme members can transfer their benefit to another scheme where the employer benefit is equal to twice the member balance (at standard rates) plus a productivity component.
The vested benefits shown below assume that all resignation benefits will be taken in the form of preserved benefits. The value of vested benefits has been calculated using the same actuarial and economic assumptions as for the calculation of accrued benefits.
As for accrued benefits, vested benefits have been calculated as at 30 June 1999 based on actual data and then an estimate has been made for the vested benefits as at 30 June 2000.
2000 1999 Old New Old New Scheme Scheme Scheme Scheme Division Division Total Division Division Total $’000 $’000 $’000 $’000 $’000 $’000 SA Superannuation Fund 1 009 000 313 400 1 322 400 929 600 255 700 1 185 300 SA Superannuation Scheme Employer Contribution Account: Employer contribution accounts 612 700 188 000 800 700 588 600 163 700 752 300 SA Government employer account 3 485 000 296 300 3 781 300 3 265 400 265 500 3 530 900 Public authorities 238 300 8 600 246 900 218 300 7 600 225 900 Commonwealth Government 431 100 - 431 100 438 700 - 438 700
Total 5 776 100 806 300 6 582 400 5 440 600 692 500 6 133 100
10. Summary of Investment Holdings 2000 Fund-Old Fund-New Scheme
The interests of the Fund and the South Australian Superannuation Scheme Scheme Scheme ontribution Contributions Account in the unitised investment portfolio of Funds SA Division Division Accounts Total are as follows: $’000 $’000 $’000 $’000 Index linked bonds 153 223 38 860 155 989 348 072 Property 105 130 26 663 107 027 238 820 Adelaide Plaza - - 96 860 96 860 Australian equities 429 848 109 018 437 609 976 475 International equities 468 501 118 821 476 958 1 064 280 Fixed interest 66 414 16 844 67 613 150 871 Cash 20 177 5 117 20 541 45 835
Total 1 243 293 315 323 1 362 597 2 921 213

SA Superannuation Board
1039
11. Reconciliation of Net Cash provided by Operating Activities to Operating Result 2000 1999 $’000 $’000 Operating result 309 031 (297 647) Benefits expense 762 513 898 443 Benefits paid (369 113) (351 780) Funds reinvested with Funds SA(i) (484 858) (202 431) Increase in other income receivable (8 443) (1 816) (Increase) Decrease in Board debtors(i) (891) 3 (Decrease) Increase in prepaid employer contributions (126 300) 126 300 Decrease (Increase) in administration fees paid in advance 503 (503) Decrease (Increase) in contributions receivable 1 151 (4 407) (Decrease) Increase in Board creditors(i) (10 289) 12 561 Transfers from other funds (41) -
Net Cash provided by Operating Activities 73 263 178 723
(i) Represents the debtors and creditors of the South Australian Superannuation Board only. Those debtors and creditors
resulting from investment activities of Funds SA are implicit in the funds reinvested.
12. Reconciliation of Cash For the purpose of the Statement of Cash Flows, cash includes cash on hand and deposits with the Department of Treasury and Finance. Cash at the end of the reporting period as shown in the Statement of Cash Flows is reconciled to the related item in the Statement of Financial Position as follows:
2000 1999 $’000 $’000
Cash and deposits at Treasury 110 910 242 642
13. Summary of Sundry Creditors and Provisions 2000 $’000 Refund of contributions paid to WorkCover 41 Consultancy fees payable 23 Pension re banks to be repaid to members 25 Funds SA sundry creditors 3 044
3 133
The figure reported in 1999 was higher because it incorporated the University 3 percent productivity contribution of approximately $12 million.
14. Provision for Tax Payable
The provision for tax payable represents tax due on benefit payments made in June 2000 which has not been remitted to the Commissioner of Taxation as at 30 June 2000. This amount was forwarded to the Commissioner of Taxation early in the 2000-01 financial year.
15. Guaranteed Benefits Contributors’ benefit entitlements are specified by the Superannuation Act 1988.
16. Additional Financial Instrument Disclosures The specific disclosure requirements of Australian Accounting Standard AAS 33, ‘Presentation and Disclosure of Financial
Instruments’ are fully set out in the Notes to the Financial Statements of Funds SA and have not been repeated in this financial report.
17. Reconciliation of Net Assets available to Pay Benefits 2000 $’000 Opening net assets available to pay benefits 2 318 342 Add: Benefits expense 762 513 Less: Benefits paid/payable 372 100 Add: Operating result for the period 309 031
Closing Value of Net Assets available to Pay Benefits 3 017 786
18. Summary of Other Income Receivable and Sundry Debtors 2000 Other Income receivable: $’000
Transfer of University 3 percent monies from Triple S 1 912 ANR & STA invoices 8 149 Universities 2 000
12 061
The figures reported for the 2000 year are higher than those disclosed in 1999 as the ANR and STA invoice amounts for May and June were not received until early July 2000.
Sundry Debtors: Leave without pay invoices 69 Rollovers to be transferred from Triple S 571
Temporary disability debtors 104 Refund from Taxation Office 115 Other 34
893
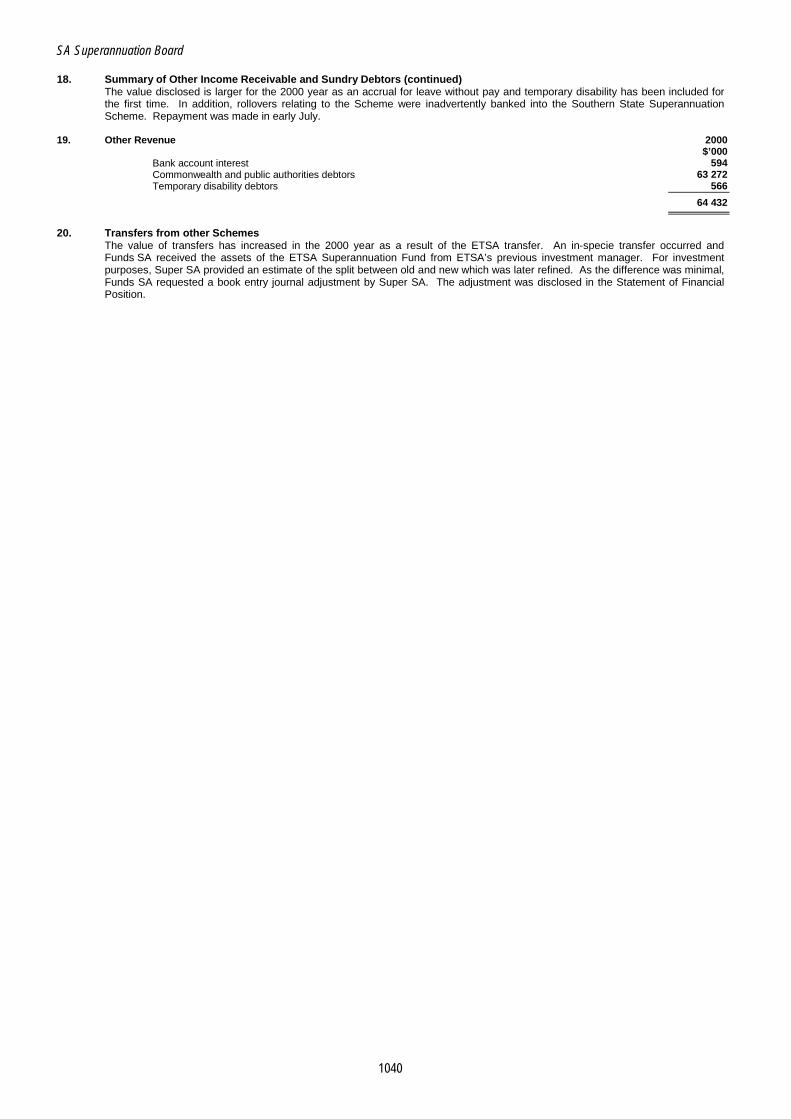
SA Superannuation Board
1040
18. Summary of Other Income Receivable and Sundry Debtors (continued) The value disclosed is larger for the 2000 year as an accrual for leave without pay and temporary disability has been included for the first time. In addition, rollovers relating to the Scheme were inadvertently banked into the Southern State Superannuation Scheme. Repayment was made in early July.
19. Other Revenue 2000 $’000 Bank account interest 594 Commonwealth and public authorities debtors 63 272 Temporary disability debtors 566
64 432
20. Transfers from other Schemes
The value of transfers has increased in the 2000 year as a result of the ETSA transfer. An in-specie transfer occurred and Funds SA received the assets of the ETSA Superannuation Fund from ETSA’s previous investment manager. For investment purposes, Super SA provided an estimate of the split between old and new which was later refined. As the difference was minimal, Funds SA requested a book entry journal adjustment by Super SA. The adjustment was disclosed in the Statement of Financial Position.

SA Superannuation Board
1041
SOUTHERN STATE SUPERANNUATION SCHEME SIGNIFICANT FEATURES • Contribution revenue increased by $30.4 million to $188.9 million. • Investment revenue increased by $91 million to $190.4 million. AUDIT MANDATE AND COVERAGE Audit Authority Section 8 of the Southern State Superannuation Act 1994 provides for the Auditor-General to audit the accounts and financial statements of the Southern State Superannuation Scheme in respect of each financial year. Scope of Audit The audit program covered all major financial systems and was directed primarily towards obtaining sufficient evidence to enable an audit opinion to be formed with respect to the financial statements and internal control. During 1999-2000 specific areas of audit attention included: • receipting and banking of employer and employee contributions • processing of contributions data to the system • completeness and accuracy of interest amounts credited to member accounts • maintenance of member accounts • benefit payments • liability for accrued benefits. The audit did not include a review of the investment and management activities undertaken by Funds SA in respect of the assets of the Scheme; these areas were reviewed in the course of the audit of Funds SA. Audit Communications to Management Issues arising from the audit of the Scheme will be the subject of a letter to be forwarded to the presiding Member, South Australian Superannuation Board in October 2000. Further comments relating to these issues are contained in ‘Audit Findings and Comments’ hereunder. AUDIT FINDINGS AND COMMENTS Commentary on General Financial Controls The review of the specific auditable areas of coverage included an assessment of the adequacy of accounting, record keeping and control, and the test verification of financial transactions processed and recorded during the year. The review identified some instances where internal control procedures either required improvement or were not applied consistently over the year. Notwithstanding, substantive testing of transactions processed did not reveal any material errors in the sample tested. CONTROLS OPINION As required by subsection 36(1)(a)(iii) of the Public Finance and Audit Act 1987, the audit of the Southern State Superannuation Scheme included an assessment of the controls exercised in relation to the receipt, expenditure and investment of money, the acquisition and disposal of property and the incurring of liabilities. The assessment also considered whether those controls were consistent with the prescribed elements of the Financial Management Framework as required by Treasurer’s Instruction 2 ‘Financial Management Policies’.

SA Superannuation Board
1042
Audit formed the opinion that the controls exercised by the Southern State Superannuation Scheme in relation to the receipt, expenditure and investment of money; the acquisition and disposal of property; and the incurring of liabilities, were sufficient to provide reasonable assurance that the financial transactions of the organisation were conducted properly and in accordance with the law. INTERPRETATION AND ANALYSIS OF FINANCIAL STATEMENTS Statement of Financial Position Total Assets The total assets of the Scheme increased by $324.2 million to $1 492.7 million. As the Scheme is still in its infancy (fifth full year of operation), contribution revenue significantly exceeds benefit payments made. Consequently it is reasonable to expect the asset base to increase by a significant amount as more funds become available for investment.

SA Superannuation Board
1043
Operating Statement for the year ended 30 June 2000 2000 1999 Note $’000 $’000 $’000 INVESTMENT REVENUE: 2(b)
Indexed linked bonds - 5 769 Property - 5 067 Australian equities - 49 962 International equities - 34 873 Fixed interest - 1 810 Cash - 1 851 Net investment revenue 190 370 -
190 370 99 332 CONTRIBUTION REVENUE:
Contributions by members 20 820 11 949 Refund of overpaid contributions (19) (13) Contributions by employers 147 948 135 103 Rollovers from other schemes 20 128 11 412
188 877 158 451 OTHER REVENUE 410 311 DIRECT INVESTMENT EXPENSE - (642) ADMINISTRATION EXPENSE 5 (4 151) (4 627)
BENEFITS ACCRUED AS A RESULT OF OPERATIONS 8 375 506 252 825
Statement of Financial Position as at 30 June 2000 2000 1999 Note $’000 $’000 $’000 INVESTMENTS:
Indexed linked bonds 136 800 136 408 Property 109 487 97 762 Australian equities 456 177 387 128 International equities 488 266 388 241 Fixed interest 267 257 106 872 Cash 24 199 44 558
1 482 186 1 160 969 FIXED ASSETS 31 - OTHER ASSETS:
Cash and deposits at Treasury 12 7 214 2 710 Cash and deposits at Treasury - Funds SA 17 232 Contributions receivable 3 2 748 4 403 Interest, dividends and rent due 429 155 Sundry debtors 77 4 Prepaid expenses 26 30
10 511 7 534 Total Assets 1 492 728 1 168 503
CURRENT LIABILITIES:
Rent paid in advance 319 509 Benefits payable 133 - Sundry creditors and provisions 3 686 676 Provision for PAYE tax payable 13 65 30 Administration fees payable 5 - 773
4 203 1 988 NON-CURRENT LIABILITIES:
Loan and finance facilities 10 290 11 754 Total Liabilities 14 493 13 742
NET ASSETS AVAILABLE TO PAY BENEFITS 4,16 1 478 235 1 154 761
REPRESENTED BY: LIABILITY FOR ACCRUED BENEFITS: 8
Not yet allocated - 32 978 Allocated to members’ accounts 1 435 786 1 118 972 1 435 786 1 151 950
RESERVES: Administration and investment reserve 9 1 222 2 811 Future service benefit reserve 6 41 227 -
1 478 235 1 154 761

SA Superannuation Board
1044
Statement of Cash Flows for the year ended 30 June 2000 2000 1999 Inflows Inflows Inflows (Outflows) (Outflows) (Outflows) Note $’000 $’000 $’000 CASH FLOWS FROM OPERATING ACTIVITIES:
Contributions received: Contributions by members 20 774 11 843 Refund of overpaid contributions (19) (13) Contributions by employers 149 649 134 492 Rollovers from other schemes 20 128 11 412 190 532 157 734
Other income received 410 311 Benefits paid:
Retirement (14 009) (9 566) Resignation (32 244) (21 940) Retrenchment (330) - Invalidity - Balance of account (1 397) (927) Invalidity - Future service benefit 6 (997) (1 169) Death - Balance of account (1 545) (786) Death - Future service benefit 6 (1 378) (1 066) Provision for PAYE tax payable 35 30
(51 865) (35 424) Past service liability funding transfer - (21 400) Receipts/payments to/from sundry debtors/creditors 2 383 24 Administration expense 5 (4 924) (4 143)
Net Cash provided by Operating Activities 11 136 536 97 102 CASH FLOWS FROM INVESTING ACTIVITIES: 2(a)
Receipts from Superannuation Funds Management Corporation 20 003 35 252 Payments to Superannuation Funds Management Corporation (152 035) (135 752)
Net Cash used in Investing Activities (132 032) (100 500) NET INCREASE (DECREASE) IN CASH HELD 4 504 (3 398) CASH AT 1 JULY 2 710 6 108
CASH AT 30 JUNE 12 7 214 2 710
NOTES TO AND FORMING PART OF THE FINANCIAL STATEMENTS 1. Objectives of the Financial Statements
(a) Southern State Superannuation Scheme The Southern State Superannuation Scheme (the Scheme) is both a contributory and non-contributory superannuation scheme established pursuant to the Southern State Superannuation Act 1994 (the Act). The Scheme, commonly referred to as the Triple S Scheme, commenced from 1 July 1995 for contributory members only. Effective 1 July 1998, the Southern State Superannuation (Merger of Schemes) Amendment Act 1998 merged the schemes established under the Southern State Superannuation Act 1994 and the Superannuation (Benefit Scheme) Act 1992. At that time, all members of the State Superannuation Benefit Scheme were effectively transferred into the Southern State Superannuation Scheme and the State Superannuation Benefit Scheme ceased to exist. Members can elect to make contributions to the Southern State Superannuation Scheme based on a percentage of their salary ranging from 1 percent to 10 percent, under section 25 of the Act. A member of the police force must contribute at a rate of at least 4.5 percent of salary. A separate contribution account is maintained for each member. Member contributions are deposited by the Treasurer into the Southern State Superannuation Fund (the Fund) which is managed and invested by Funds SA. An employer is required to pay contributions to the Treasurer under section 26 of the Act. The employer contributes 7 percent (7 percent in 1998-99) of salary where the member has elected to contribute less than 4.5 percent of salary. Where the member has elected to contribute 4.5 percent or more of salary, the employer must contribute at a rate of 9 percent. A separate employer contribution account is maintained for each member. Employer contributions are deposited by the Treasurer into the Southern State Superannuation (Employers) Fund (the Employers Fund) which is managed and invested by Funds SA. Benefits, represented by the balances of member accounts, are available for employees who retire, resign, are retrenched or die and for those who terminate their employment because of invalidity. In addition, the Scheme provides a minimum insurance component for invalidity and death benefits (called a basic future service benefit), a disability pension and a supplementary future service benefit at the election of the member. The balance of individual member entitlements will be provided on annual statements forwarded to each member.
(b) South Australian Superannuation Board The purpose of this statement is to discharge the responsibilities of the South Australian Superannuation Board (the Board) under section 13 of the Act to keep accounts of receipts and payments. The Act charges the Board with responsibility for all aspects of the administration of the Act except for the management and investment of the Fund and the Employers Fund. The Act also provides the Board with the necessary powers to administer the Scheme. The Board determines a rate of return to be credited to member accounts pursuant to section 11 of the Act. In determining the rate the Board should consider the net rate of return achieved by the investment of the Fund and the desirability of reducing undue fluctuations in returns.
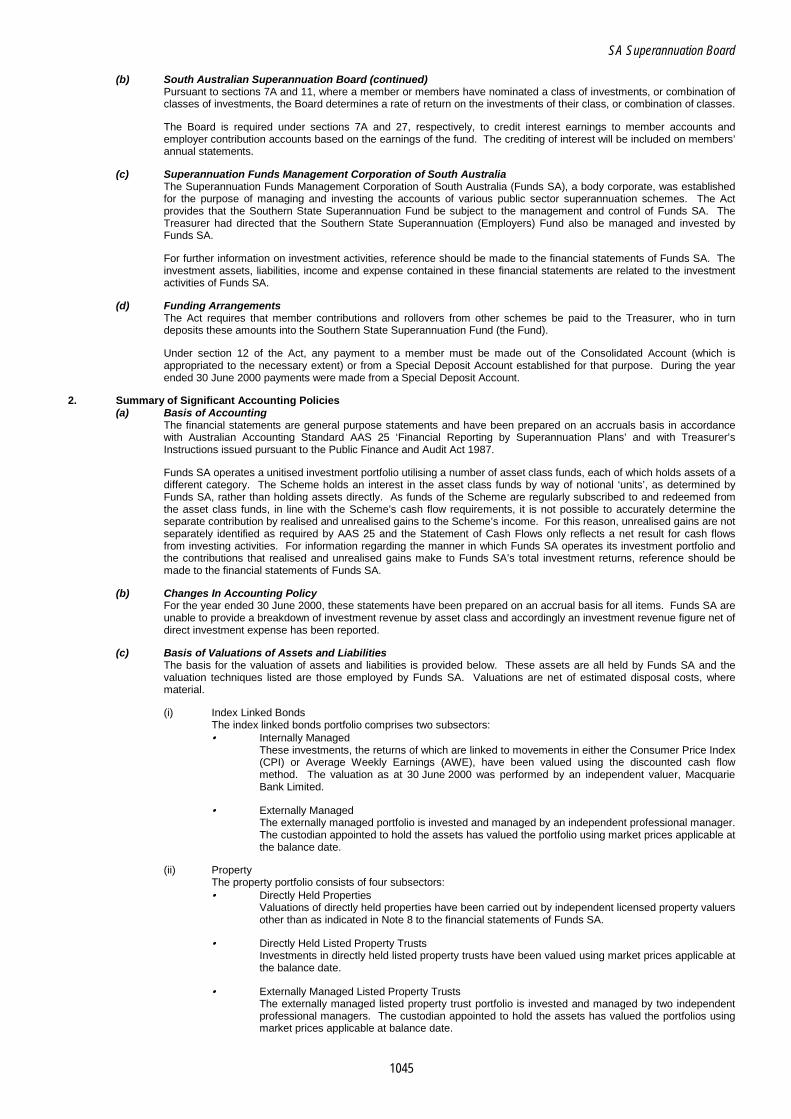
SA Superannuation Board
1045
(b) South Australian Superannuation Board (continued) Pursuant to sections 7A and 11, where a member or members have nominated a class of investments, or combination of classes of investments, the Board determines a rate of return on the investments of their class, or combination of classes.
The Board is required under sections 7A and 27, respectively, to credit interest earnings to member accounts and employer contribution accounts based on the earnings of the fund. The crediting of interest will be included on members’ annual statements.
(c) Superannuation Funds Management Corporation of South Australia
The Superannuation Funds Management Corporation of South Australia (Funds SA), a body corporate, was established for the purpose of managing and investing the accounts of various public sector superannuation schemes. The Act provides that the Southern State Superannuation Fund be subject to the management and control of Funds SA. The Treasurer had directed that the Southern State Superannuation (Employers) Fund also be managed and invested by Funds SA.
For further information on investment activities, reference should be made to the financial statements of Funds SA. The investment assets, liabilities, income and expense contained in these financial statements are related to the investment activities of Funds SA.
(d) Funding Arrangements
The Act requires that member contributions and rollovers from other schemes be paid to the Treasurer, who in turn deposits these amounts into the Southern State Superannuation Fund (the Fund).
Under section 12 of the Act, any payment to a member must be made out of the Consolidated Account (which is appropriated to the necessary extent) or from a Special Deposit Account established for that purpose. During the year ended 30 June 2000 payments were made from a Special Deposit Account.
2. Summary of Significant Accounting Policies
(a) Basis of Accounting The financial statements are general purpose statements and have been prepared on an accruals basis in accordance with Australian Accounting Standard AAS 25 ‘Financial Reporting by Superannuation Plans’ and with Treasurer’s Instructions issued pursuant to the Public Finance and Audit Act 1987.
Funds SA operates a unitised investment portfolio utilising a number of asset class funds, each of which holds assets of a different category. The Scheme holds an interest in the asset class funds by way of notional ‘units’, as determined by Funds SA, rather than holding assets directly. As funds of the Scheme are regularly subscribed to and redeemed from the asset class funds, in line with the Scheme’s cash flow requirements, it is not possible to accurately determine the separate contribution by realised and unrealised gains to the Scheme’s income. For this reason, unrealised gains are not separately identified as required by AAS 25 and the Statement of Cash Flows only reflects a net result for cash flows from investing activities. For information regarding the manner in which Funds SA operates its investment portfolio and the contributions that realised and unrealised gains make to Funds SA’s total investment returns, reference should be made to the financial statements of Funds SA.
(b) Changes In Accounting Policy
For the year ended 30 June 2000, these statements have been prepared on an accrual basis for all items. Funds SA are unable to provide a breakdown of investment revenue by asset class and accordingly an investment revenue figure net of direct investment expense has been reported.
(c) Basis of Valuations of Assets and Liabilities
The basis for the valuation of assets and liabilities is provided below. These assets are all held by Funds SA and the valuation techniques listed are those employed by Funds SA. Valuations are net of estimated disposal costs, where material.
(i) Index Linked Bonds
The index linked bonds portfolio comprises two subsectors: • Internally Managed
These investments, the returns of which are linked to movements in either the Consumer Price Index (CPI) or Average Weekly Earnings (AWE), have been valued using the discounted cash flow method. The valuation as at 30 June 2000 was performed by an independent valuer, Macquarie Bank Limited.
• Externally Managed
The externally managed portfolio is invested and managed by an independent professional manager. The custodian appointed to hold the assets has valued the portfolio using market prices applicable at the balance date.
(ii) Property
The property portfolio consists of four subsectors: • Directly Held Properties
Valuations of directly held properties have been carried out by independent licensed property valuers other than as indicated in Note 8 to the financial statements of Funds SA.
• Directly Held Listed Property Trusts
Investments in directly held listed property trusts have been valued using market prices applicable at the balance date.
• Externally Managed Listed Property Trusts The externally managed listed property trust portfolio is invested and managed by two independent professional managers. The custodian appointed to hold the assets has valued the portfolios using market prices applicable at balance date.

SA Superannuation Board
1046
(ii) Property (continued) • Externally Managed Unlisted Property Vehicles
Investments in externally managed unlisted property vehicles have been valued in accordance with the exit valuations supplied by the managers.
(iii) Australian Equities
The Australian Equities portfolio comprises two subsectors: • Listed Australian Equities
The listed Australian Equities portfolio is invested and managed by independent professional managers. The custodian appointed to hold the assets has valued the portfolio using market prices applicable at the balance date.
• Private Equity The private equity portfolio comprises holdings in a number of externally managed specialist funds together with internally managed assets. The externally managed specialist funds have been valued by the managers in accordance with the Australian Venture Capital Association Limited (AVCAL) guidelines. Internally managed assets have been valued by the Directors of Funds SA, either in accordance with market prices applicable at balance date, or having regard to market conditions and the current and expected future performance of the investments.
(iv) International Equities
The International Equities portfolio is invested and managed by independent professional managers. Discretely managed portfolios have been valued by the custodian appointed to hold the assets using market prices applicable at the balance date. Investments in pooled international vehicles and private equity funds have been valued in accordance with the exit valuations supplied by the managers. Currency conversions have been made at the spot market mid rates applying at the balance date where applicable.
(v) Fixed Interest The Fixed Interest portfolio is invested and managed by independent professional managers. The custodian appointed to hold the assets has valued the portfolio using market prices applicable at the balance date.
(vi) Cash Deposits at call and other deposits of very short term duration have been valued on the basis of principal plus accrued interest. Bank bills have been valued using market rates applicable at the balance date.
(vii) Fixed Assets Fixed Assets are shown at cost less accumulated depreciation. Depreciation is calculated over the estimated useful lives of the assets, using straight line and diminishing value methods. The Directors of Funds SA are of the opinion that this provides a reasonable estimate of market value.
(viii) Other Assets and Liabilities These items have been assessed and the Directors of Funds SA are of the opinion that for most items book values provide a reasonable estimate of their market values. Where material items are not likely to be realised within a short period following the balance date, the book values of these items have been discounted back to the balance date using market related interest rates.
(d) Accounting for Leases Incentives received on entering into operating leases are recognised as liabilities. Lease payments are allocated
between rental expense and reduction of the liability on a straight-line basis. The allocation of lease rental payments in this manner ensures that the rental expense is recognised on a basis which is representative of the pattern of benefits derived from the leased asset.
(e) Operation of Investment Portfolio Funds SA operates a pooled investment portfolio utilising a number of sector funds, each of which holds assets of a
different category. The sector funds are:
• Index linked bonds • Property • Australian equities • International equities • Fixed interest • Cash
Funds SA also operates a multi-layered notional unitisation structure to facilitate the administration of different investment
strategies applying to the various public sector superannuation funds/schemes.(1) Each public sector superannuation fund/scheme holds units in an investment product, which in turn holds units in each of
the sector funds according to the target strategic asset allocation for the investment product. Units are issued and redeemed monthly at unit prices determined by the net market value of underlying investments.
The interest which each public sector superannuation fund/scheme holds in the unitised investment portfolio is disclosed
in each fund’s/scheme’s Statement of Net Assets Under Management in Note 20 of the Funds SA Financial Statements. Each fund’s allocation of total net investment income is disclosed in Note 5(b) and in each fund’s/scheme’s Statement of Changes in Net Assets in Note 20 of the Funds SA Financial Statements.
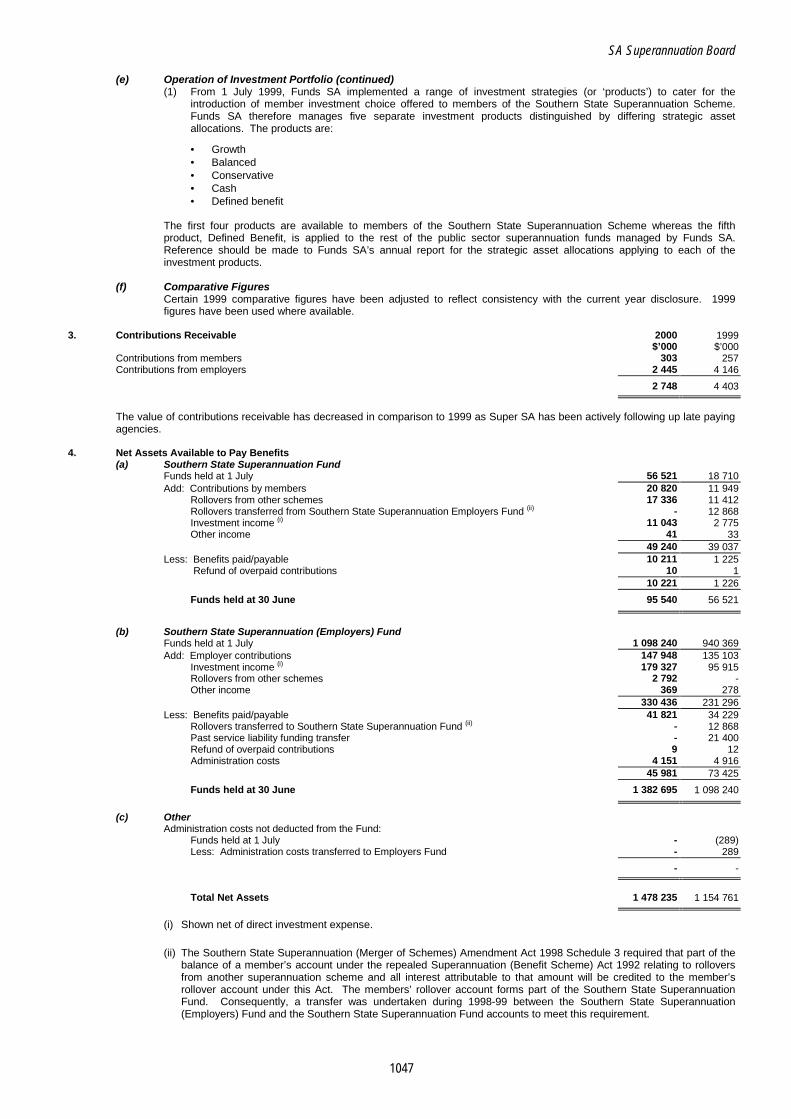
SA Superannuation Board
1047
(e) Operation of Investment Portfolio (continued) (1) From 1 July 1999, Funds SA implemented a range of investment strategies (or ‘products’) to cater for the
introduction of member investment choice offered to members of the Southern State Superannuation Scheme. Funds SA therefore manages five separate investment products distinguished by differing strategic asset allocations. The products are:
• Growth • Balanced • Conservative • Cash • Defined benefit
The first four products are available to members of the Southern State Superannuation Scheme whereas the fifth product, Defined Benefit, is applied to the rest of the public sector superannuation funds managed by Funds SA. Reference should be made to Funds SA’s annual report for the strategic asset allocations applying to each of the investment products.
(f) Comparative Figures
Certain 1999 comparative figures have been adjusted to reflect consistency with the current year disclosure. 1999 figures have been used where available.
3. Contributions Receivable 2000 1999 $’000 $’000 Contributions from members 303 257 Contributions from employers 2 445 4 146
2 748 4 403
The value of contributions receivable has decreased in comparison to 1999 as Super SA has been actively following up late paying agencies.
4. Net Assets Available to Pay Benefits (a) Southern State Superannuation Fund Funds held at 1 July 56 521 18 710 Add: Contributions by members 20 820 11 949 Rollovers from other schemes 17 336 11 412 Rollovers transferred from Southern State Superannuation Employers Fund (ii) - 12 868 Investment income (i) 11 043 2 775 Other income 41 33 49 240 39 037 Less: Benefits paid/payable 10 211 1 225 Refund of overpaid contributions 10 1 10 221 1 226
Funds held at 30 June 95 540 56 521
(b) Southern State Superannuation (Employers) Fund Funds held at 1 July 1 098 240 940 369 Add: Employer contributions 147 948 135 103 Investment income (i) 179 327 95 915 Rollovers from other schemes 2 792 - Other income 369 278 330 436 231 296 Less: Benefits paid/payable 41 821 34 229 Rollovers transferred to Southern State Superannuation Fund (ii) - 12 868 Past service liability funding transfer - 21 400 Refund of overpaid contributions 9 12 Administration costs 4 151 4 916 45 981 73 425
Funds held at 30 June 1 382 695 1 098 240
(c) Other Administration costs not deducted from the Fund: Funds held at 1 July - (289) Less: Administration costs transferred to Employers Fund - 289 - -
Total Net Assets 1 478 235 1 154 761
(i) Shown net of direct investment expense.
(ii) The Southern State Superannuation (Merger of Schemes) Amendment Act 1998 Schedule 3 required that part of the balance of a member’s account under the repealed Superannuation (Benefit Scheme) Act 1992 relating to rollovers from another superannuation scheme and all interest attributable to that amount will be credited to the member’s rollover account under this Act. The members’ rollover account forms part of the Southern State Superannuation Fund. Consequently, a transfer was undertaken during 1998-99 between the Southern State Superannuation (Employers) Fund and the Southern State Superannuation Fund accounts to meet this requirement.
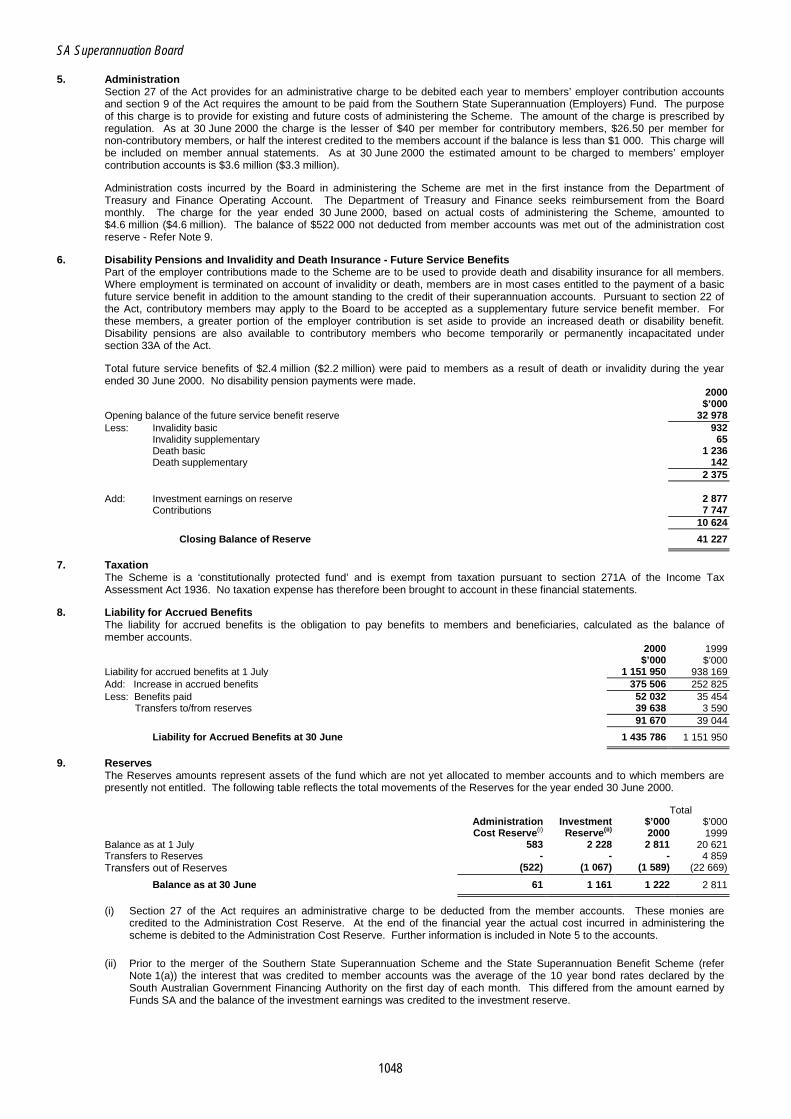
SA Superannuation Board
1048
5. Administration Section 27 of the Act provides for an administrative charge to be debited each year to members’ employer contribution accounts and section 9 of the Act requires the amount to be paid from the Southern State Superannuation (Employers) Fund. The purpose of this charge is to provide for existing and future costs of administering the Scheme. The amount of the charge is prescribed by regulation. As at 30 June 2000 the charge is the lesser of $40 per member for contributory members, $26.50 per member for non-contributory members, or half the interest credited to the members account if the balance is less than $1 000. This charge will be included on member annual statements. As at 30 June 2000 the estimated amount to be charged to members’ employer contribution accounts is $3.6 million ($3.3 million). Administration costs incurred by the Board in administering the Scheme are met in the first instance from the Department of Treasury and Finance Operating Account. The Department of Treasury and Finance seeks reimbursement from the Board monthly. The charge for the year ended 30 June 2000, based on actual costs of administering the Scheme, amounted to $4.6 million ($4.6 million). The balance of $522 000 not deducted from member accounts was met out of the administration cost reserve - Refer Note 9.
6. Disability Pensions and Invalidity and Death Insurance - Future Service Benefits Part of the employer contributions made to the Scheme are to be used to provide death and disability insurance for all members. Where employment is terminated on account of invalidity or death, members are in most cases entitled to the payment of a basic future service benefit in addition to the amount standing to the credit of their superannuation accounts. Pursuant to section 22 of the Act, contributory members may apply to the Board to be accepted as a supplementary future service benefit member. For these members, a greater portion of the employer contribution is set aside to provide an increased death or disability benefit. Disability pensions are also available to contributory members who become temporarily or permanently incapacitated under section 33A of the Act. Total future service benefits of $2.4 million ($2.2 million) were paid to members as a result of death or invalidity during the year ended 30 June 2000. No disability pension payments were made.
2000 $’000 Opening balance of the future service benefit reserve 32 978 Less: Invalidity basic 932 Invalidity supplementary 65 Death basic 1 236 Death supplementary 142 2 375 Add: Investment earnings on reserve 2 877 Contributions 7 747 10 624
Closing Balance of Reserve 41 227
7. Taxation The Scheme is a ‘constitutionally protected fund’ and is exempt from taxation pursuant to section 271A of the Income Tax Assessment Act 1936. No taxation expense has therefore been brought to account in these financial statements.
8. Liability for Accrued Benefits The liability for accrued benefits is the obligation to pay benefits to members and beneficiaries, calculated as the balance of member accounts.
2000 1999 $’000 $’000
Liability for accrued benefits at 1 July 1 151 950 938 169 Add: Increase in accrued benefits 375 506 252 825 Less: Benefits paid 52 032 35 454
Transfers to/from reserves 39 638 3 590 91 670 39 044
Liability for Accrued Benefits at 30 June 1 435 786 1 151 950
9. Reserves The Reserves amounts represent assets of the fund which are not yet allocated to member accounts and to which members are presently not entitled. The following table reflects the total movements of the Reserves for the year ended 30 June 2000.
Total Administration Investment $’000 $’000 Cost Reserve(i) Reserve(ii) 2000 1999
Balance as at 1 July 583 2 228 2 811 20 621 Transfers to Reserves - - - 4 859 Transfers out of Reserves (522) (1 067) (1 589) (22 669)
Balance as at 30 June 61 1 161 1 222 2 811
(i) Section 27 of the Act requires an administrative charge to be deducted from the member accounts. These monies are credited to the Administration Cost Reserve. At the end of the financial year the actual cost incurred in administering the scheme is debited to the Administration Cost Reserve. Further information is included in Note 5 to the accounts.
(ii) Prior to the merger of the Southern State Superannuation Scheme and the State Superannuation Benefit Scheme (refer Note 1(a)) the interest that was credited to member accounts was the average of the 10 year bond rates declared by the South Australian Government Financing Authority on the first day of each month. This differed from the amount earned by Funds SA and the balance of the investment earnings was credited to the investment reserve.

SA Superannuation Board
1049
10. Vested Benefits Vested Benefits are benefits which are not conditional upon continued membership of the Scheme, or any other factor other than resignation from the plan. Vested Benefits include benefits which members are entitled to receive had they terminated their membership as at the reporting date.
2000 1999 $’000 $’000
Vested Benefits 1 435 786 1 118 972
The figure reported has been determined prior to the final allocation of investment earnings to members accounts. Formal allocation of earnings to members accounts may result in an immaterial difference (due to rounding) and will be carried forward to the next financial year as an unallocated value.
11. Reconciliation of Net Cash provided by Operating Activities to Benefits Accrued from Operations 2000 1999
$’000 $’000 Benefits accrued as a result of operations 375 506 252 825 Benefits paid (51 900) (35 454) Decrease (Increase) in contributions receivable 1 655 (717) Funds reinvested with Funds SA (190 370) (98 690) Increase in board creditors 2 418 54 (Decrease) Increase in administration fees payable (773) 484 Past service funding liability transfer - (21 400)
Net Cash provided by Operating Activities 136 536 97 102
12. Reconciliation of Cash
For the purpose of the Statement of Cash Flows, cash includes cash on hand and deposits with the Department of Treasury and Finance. Cash at the end of the reporting period as shown in the Statement of Cash Flows is reconciled to the related item in the Statement of Financial Position as follows:
2000 1999 $’000 $’000 Cash and deposits at Treasury 7 214 2 710
13. Provision for Tax Payable The provision for tax payable represents tax due on benefit payments made in June 2000 which had not been remitted to the Commissioner of Taxation as at 30 June 2000. This amount was forwarded to the Commissioner of Taxation early in the 2000-01 financial year.
14. Guaranteed Benefits Benefit entitlements are specified by the Southern State Superannuation Act 1994.
15. Additional Financial Instrument Disclosures The specific disclosure requirements of Australian Accounting Standard AAS 33, ‘Presentation and Disclosure of Financial Instruments’ are fully set out in the Notes to the financial statements of Funds SA and have not been repeated in this financial report.
16. Reconciliation of Net Assets Available to Pay Benefits 2000 $’000 Opening value 1 154 761 Add: Benefits accrued as a result of operations 375 506 Less: Benefits paid/payable 52 032
Closing Value 1 478 235

1050
SUPERANNUATION FUNDS MANAGEMENT CORPORATION OF SOUTH AUSTRALIA
FUNCTIONAL RESPONSIBILITY Establishment The Superannuation Funds Management Corporation of South Australia (operating under the business name Funds SA) is a statutory authority established pursuant to the Superannuation Funds Management Corporation of South Australia Act 1995 (the Act). The Act provides for a Board of Directors consisting of at least five but no more than seven members, to be established as the governing body of Funds SA. The Board of Directors consisted of seven members at 30 June 2000. Functions and Powers The functions of Funds SA, as detailed in section 5 of the Act are: • to invest and manage the public sector superannuation funds pursuant to strategies formulated by
Funds SA;
• such other functions as are assigned to Funds SA by this Act or any other Act. Section 7 of the Act further provides that the objective of Funds SA in performing its functions is to achieve the highest return possible on investment of the public sector superannuation funds while having proper regard for: • the need to maintain the risks relating to investment at an acceptable level; • the need for liquidity in the funds; • such other matters as are prescribed by regulation. Funds SA has, by virtue of the Act, broad powers in relation to the investment of public sector superannuation funds. Funds SA however, cannot borrow money or obtain any other form of financial accommodation unless authorised to do so by the Regulations or by the Minister. In addition, the Regulations under the Act impose restrictions on the investment of public sector superannuation funds as follows: • Funds SA must not invest the public sector superannuation funds in property outside Australia or in real
property outside the State, unless the Minister has authorised the investment specifically or by reference to the class of investment to which it belongs.
• Funds SA must not enter into derivative transactions (eg futures contracts, forward contracts, swaps etc), unless the contract or dealing has been authorised by the Minister specifically or by reference to the class of contracts or dealings to which it belongs.
Audit Committee The Act specifically requires Funds SA to establish an Audit Committee. The Committee comprises three Board members operating within the framework of an Audit Committee Charter. Public Sector Superannuation Funds The various public sector superannuation funds, as defined under the Act, and managed by Funds SA, are identified in Note 1 to the financial statements. Administrative Arrangements Funds SA is, however, not responsible for the administration of any of the public sector superannuation funds. The South Australian Superannuation Board is responsible for all aspects of the administration (ie contributions and benefits) of the South Australian Superannuation Fund, Southern State Superannuation Fund and the associated Employer Contribution Accounts.
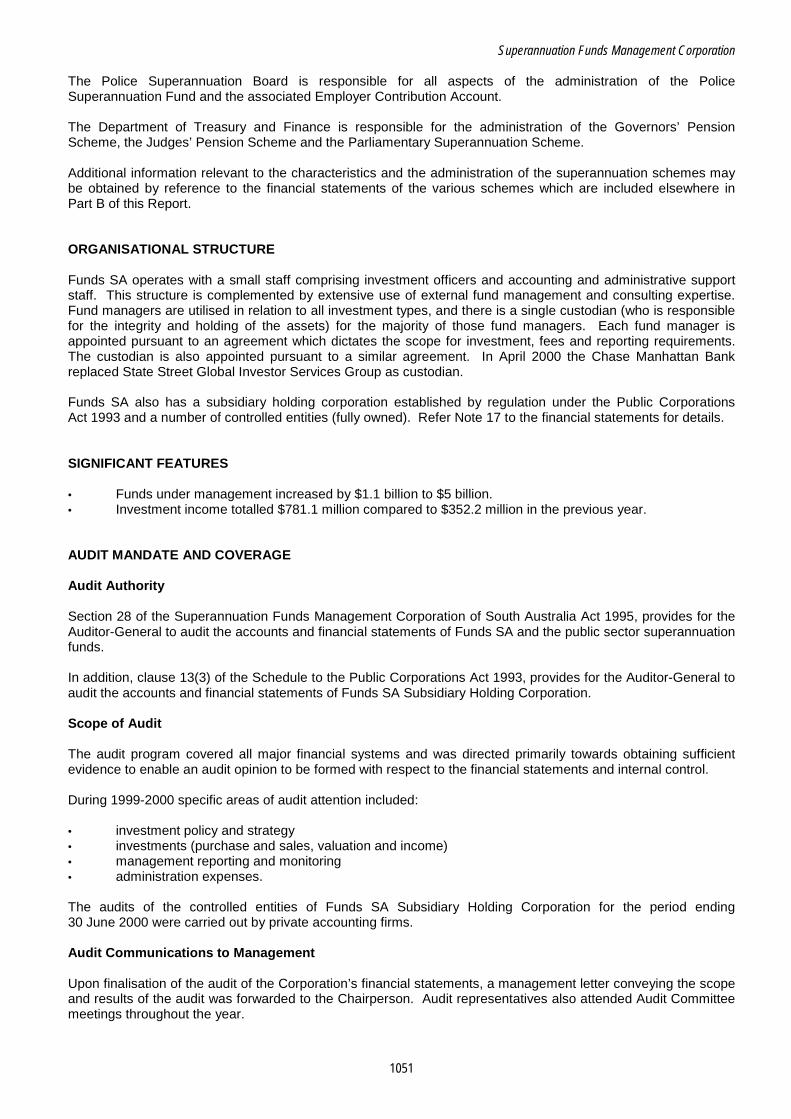
Superannuation Funds Management Corporation
1051
The Police Superannuation Board is responsible for all aspects of the administration of the Police Superannuation Fund and the associated Employer Contribution Account. The Department of Treasury and Finance is responsible for the administration of the Governors’ Pension Scheme, the Judges’ Pension Scheme and the Parliamentary Superannuation Scheme. Additional information relevant to the characteristics and the administration of the superannuation schemes may be obtained by reference to the financial statements of the various schemes which are included elsewhere in Part B of this Report. ORGANISATIONAL STRUCTURE Funds SA operates with a small staff comprising investment officers and accounting and administrative support staff. This structure is complemented by extensive use of external fund management and consulting expertise. Fund managers are utilised in relation to all investment types, and there is a single custodian (who is responsible for the integrity and holding of the assets) for the majority of those fund managers. Each fund manager is appointed pursuant to an agreement which dictates the scope for investment, fees and reporting requirements. The custodian is also appointed pursuant to a similar agreement. In April 2000 the Chase Manhattan Bank replaced State Street Global Investor Services Group as custodian. Funds SA also has a subsidiary holding corporation established by regulation under the Public Corporations Act 1993 and a number of controlled entities (fully owned). Refer Note 17 to the financial statements for details. SIGNIFICANT FEATURES • Funds under management increased by $1.1 billion to $5 billion. • Investment income totalled $781.1 million compared to $352.2 million in the previous year. AUDIT MANDATE AND COVERAGE Audit Authority Section 28 of the Superannuation Funds Management Corporation of South Australia Act 1995, provides for the Auditor-General to audit the accounts and financial statements of Funds SA and the public sector superannuation funds. In addition, clause 13(3) of the Schedule to the Public Corporations Act 1993, provides for the Auditor-General to audit the accounts and financial statements of Funds SA Subsidiary Holding Corporation. Scope of Audit The audit program covered all major financial systems and was directed primarily towards obtaining sufficient evidence to enable an audit opinion to be formed with respect to the financial statements and internal control. During 1999-2000 specific areas of audit attention included: • investment policy and strategy • investments (purchase and sales, valuation and income) • management reporting and monitoring • administration expenses. The audits of the controlled entities of Funds SA Subsidiary Holding Corporation for the period ending 30 June 2000 were carried out by private accounting firms. Audit Communications to Management Upon finalisation of the audit of the Corporation’s financial statements, a management letter conveying the scope and results of the audit was forwarded to the Chairperson. Audit representatives also attended Audit Committee meetings throughout the year.
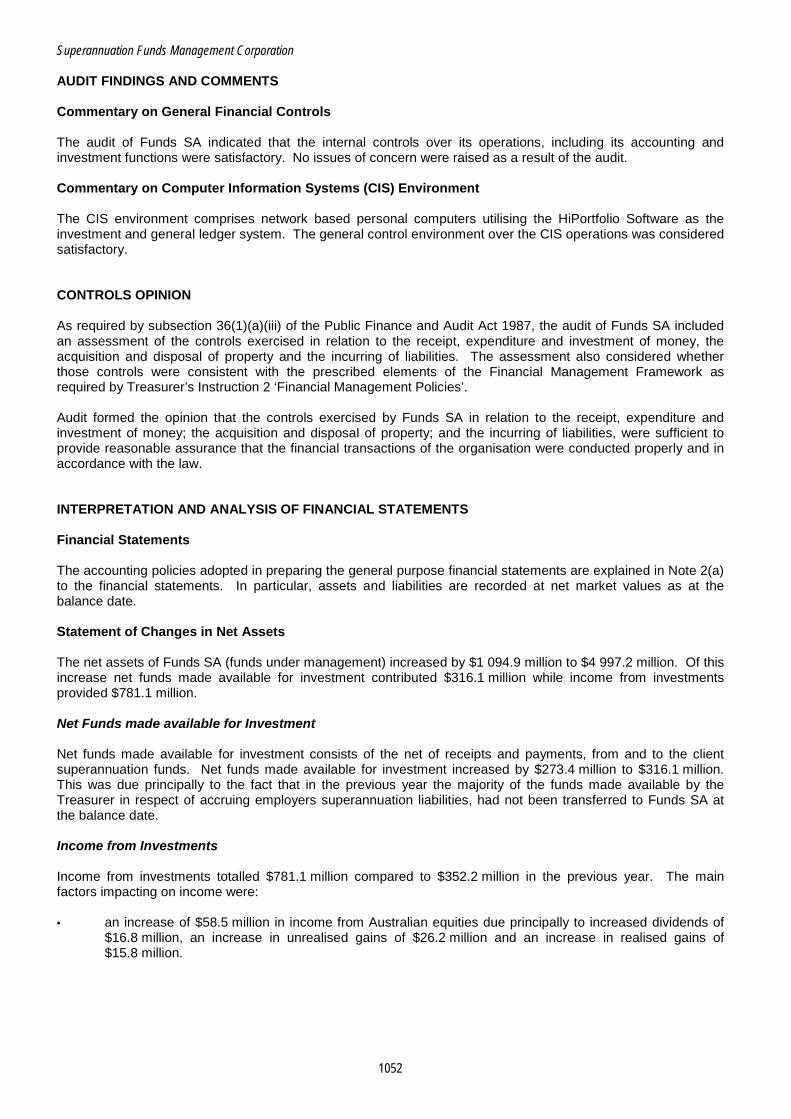
Superannuation Funds Management Corporation
1052
AUDIT FINDINGS AND COMMENTS Commentary on General Financial Controls The audit of Funds SA indicated that the internal controls over its operations, including its accounting and investment functions were satisfactory. No issues of concern were raised as a result of the audit. Commentary on Computer Information Systems (CIS) Environment The CIS environment comprises network based personal computers utilising the HiPortfolio Software as the investment and general ledger system. The general control environment over the CIS operations was considered satisfactory. CONTROLS OPINION As required by subsection 36(1)(a)(iii) of the Public Finance and Audit Act 1987, the audit of Funds SA included an assessment of the controls exercised in relation to the receipt, expenditure and investment of money, the acquisition and disposal of property and the incurring of liabilities. The assessment also considered whether those controls were consistent with the prescribed elements of the Financial Management Framework as required by Treasurer’s Instruction 2 ‘Financial Management Policies’. Audit formed the opinion that the controls exercised by Funds SA in relation to the receipt, expenditure and investment of money; the acquisition and disposal of property; and the incurring of liabilities, were sufficient to provide reasonable assurance that the financial transactions of the organisation were conducted properly and in accordance with the law. INTERPRETATION AND ANALYSIS OF FINANCIAL STATEMENTS Financial Statements The accounting policies adopted in preparing the general purpose financial statements are explained in Note 2(a) to the financial statements. In particular, assets and liabilities are recorded at net market values as at the balance date. Statement of Changes in Net Assets The net assets of Funds SA (funds under management) increased by $1 094.9 million to $4 997.2 million. Of this increase net funds made available for investment contributed $316.1 million while income from investments provided $781.1 million. Net Funds made available for Investment Net funds made available for investment consists of the net of receipts and payments, from and to the client superannuation funds. Net funds made available for investment increased by $273.4 million to $316.1 million. This was due principally to the fact that in the previous year the majority of the funds made available by the Treasurer in respect of accruing employers superannuation liabilities, had not been transferred to Funds SA at the balance date. Income from Investments Income from investments totalled $781.1 million compared to $352.2 million in the previous year. The main factors impacting on income were: • an increase of $58.5 million in income from Australian equities due principally to increased dividends of
$16.8 million, an increase in unrealised gains of $26.2 million and an increase in realised gains of $15.8 million.

Superannuation Funds Management Corporation
1053
• an increase of $213.2 million in income from International equities due principally to an increase in unrealised gains of $195.4 million and an increase in realised gains of $112.7 million offset by a movement in the currency hedge of $95.8 million representing a realised expense of $71.7 million compared with realised income of $24.1 million in the previous year.
• an increase in income from the Adelaide Plaza Fund of $90.6 million due principally to an increase in realised gains of $92.8 million mainly as a result of the sale of FSASER Hotel Pty Ltd and Adelaide Casino Pty Ltd.
Funds Under Management As a result of the decision by the Government to move to full funding of the public sector superannuation liability, the introduction of new superannuation products and as a result of investment earnings, Funds SA has experienced rapid growth in total funds under management in recent years as illustrated in the following chart.
Growth in Funds Under Management
0
500
1000
1500
2000
2500
3000
3500
4000
4500
5000
Jun-96 Jun-97 Jun-98 Jun-99 Jun-00
($)
Mill
ion
s
Investment Policy/Strategy Investment Classes Funds SA is an investment organisation with broad powers and as indicated $5 billion of funds under management. These funds are represented predominantly by six investment classes and the level of holdings for each of these investments at 30 June 1999 and 30 June 2000 is illustrated in the following chart.
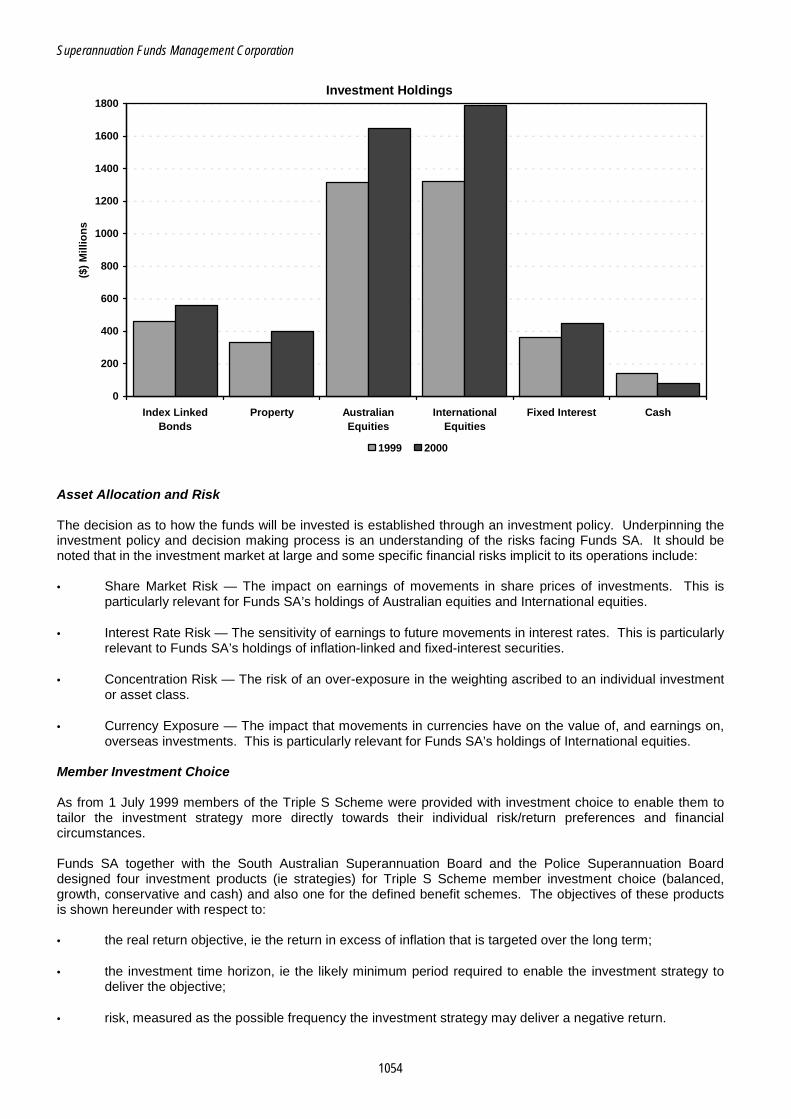
Superannuation Funds Management Corporation
1054
Investment Holdings
0
200
400
600
800
1000
1200
1400
1600
1800
Index LinkedBonds
Property AustralianEquities
InternationalEquities
Fixed Interest Cash
($)
Mill
ion
s
1999 2000
Asset Allocation and Risk The decision as to how the funds will be invested is established through an investment policy. Underpinning the investment policy and decision making process is an understanding of the risks facing Funds SA. It should be noted that in the investment market at large and some specific financial risks implicit to its operations include: • Share Market Risk — The impact on earnings of movements in share prices of investments. This is
particularly relevant for Funds SA’s holdings of Australian equities and International equities.
• Interest Rate Risk — The sensitivity of earnings to future movements in interest rates. This is particularly relevant to Funds SA’s holdings of inflation-linked and fixed-interest securities.
• Concentration Risk — The risk of an over-exposure in the weighting ascribed to an individual investment or asset class.
• Currency Exposure — The impact that movements in currencies have on the value of, and earnings on, overseas investments. This is particularly relevant for Funds SA’s holdings of International equities.
Member Investment Choice As from 1 July 1999 members of the Triple S Scheme were provided with investment choice to enable them to tailor the investment strategy more directly towards their individual risk/return preferences and financial circumstances. Funds SA together with the South Australian Superannuation Board and the Police Superannuation Board designed four investment products (ie strategies) for Triple S Scheme member investment choice (balanced, growth, conservative and cash) and also one for the defined benefit schemes. The objectives of these products is shown hereunder with respect to: • the real return objective, ie the return in excess of inflation that is targeted over the long term;
• the investment time horizon, ie the likely minimum period required to enable the investment strategy to deliver the objective;
• risk, measured as the possible frequency the investment strategy may deliver a negative return.

Superannuation Funds Management Corporation
1055
Defined Benefit Balanced Growth Conservative Cash Product Objectives:
Real return objective 5.8 percent 5.4 percent 6.2 percent 4.3 percent 2.2 percent Investment time horizon 10 years 6 years 10 years 2 years Less than 1 year Possibility of negative return 1 year in 4 1 year in 4 2 years in 7 1 year in 5 Nil Total funds at 30 June 2000 ($’million) 3 526.3 1 443.7 26.4 0.7 0.1
Strategic Asset Allocation and the Actual Position Reference should be made to Funds SA’s annual report for the strategic asset allocations applying to each of the investment products. A comparison of the target asset allocation for each of the five products compared to the actual position at 30 June 2000 revealed that all variances were less than 1 percent, which is well within the rebalancing ranges around the strategic target, ie a rebalancing policy has been adopted by Funds SA to ensure the efficient maintenance of the asset allocation within an acceptable tolerance around the strategic target. Investment Returns Funds SA values its investments at net market value, in accordance with the requirements of Australian Accounting Standard AAS 25 ‘Financial Reporting by Superannuation Plans’. Any increases or decreases in the market value are brought to account through the Statement of Changes in Net Assets. As such the value of the investments under management has a direct impact upon the level of income earned by Funds SA in any one year. Funds SA has established performance benchmarks for each asset class as follows: Asset Class Performance Benchmark Australian Equities All Ordinaries Accumulation Index then Standard and Poor/ASX 300
Accumulation Index from April 2000. International Equities Tailored benchmark incorporating specific subsectors and hedge ratios. Property Mercer Australian Unlisted Property Index and ASX. Listed Property Trust Accumulation Index. Inflation Linked UBS Warburg Australia Inflation Linked Bond Index. Fixed Interest UBS Warburg Australia Composite Bond Index. Cash UBS Warburg Australia Bank Bill Index. Funds SA’s objective is to exceed the relevant benchmark in each asset class. Return Performance by Asset Class The return performance of each of the six distinct asset classes, against their relevant benchmark, for the 1999-2000 financial year, is depicted in the following chart:
0%
5%
10%
15%
20%
25%
Ind
ex L
inke
dB
on
ds
Pro
per
ty
Au
stra
lian
Eq
uit
ies
Inte
rnat
ion
alE
qu
itie
s
Fix
ed In
tere
st
Cas
h
Actual Return Benchmark Return

Superannuation Funds Management Corporation
1056
Return Performance by Product The return performance of each of the distinct products (excluding ‘cash’), against their relevant benchmark, for the 1999-2000 financial year is depicted in the following chart:
0%
5%
10%
15%
20%
25%
Def
ined
Ben
efit
Bal
ance
d
Gro
wth
Co
nse
rvat
ive
Actual Return Benchmark Return
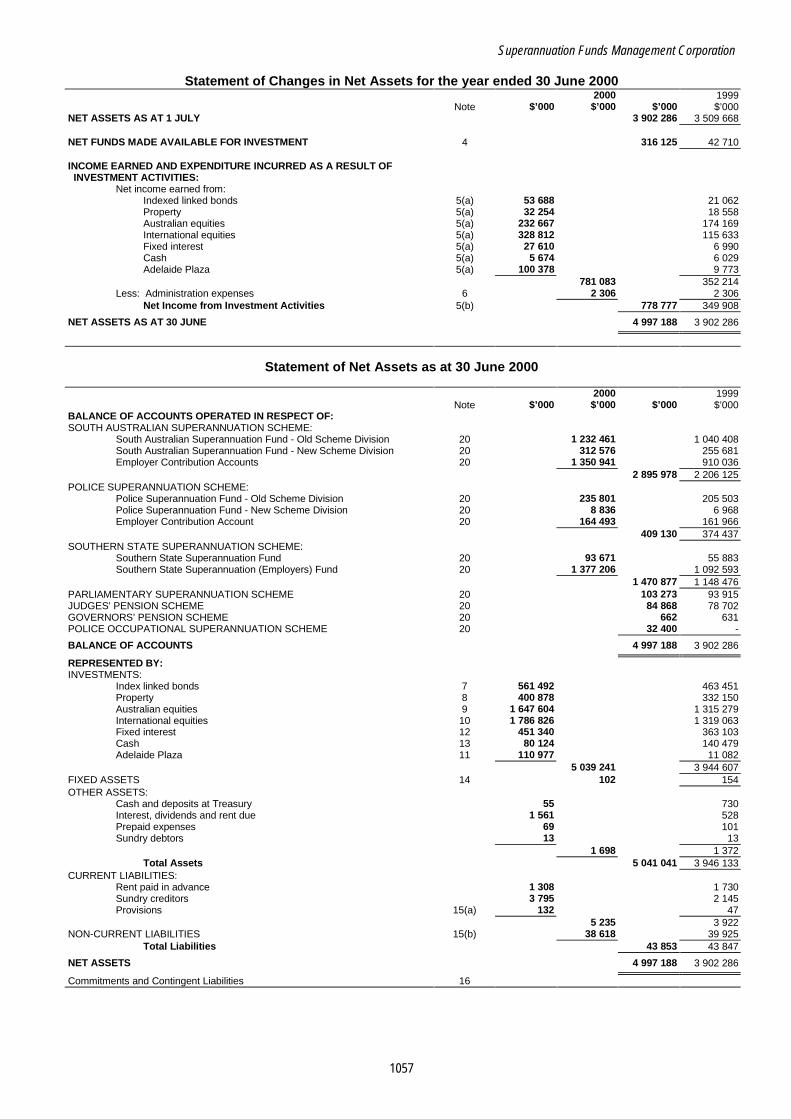
Superannuation Funds Management Corporation
1057
Statement of Changes in Net Assets for the year ended 30 June 2000 2000 1999 Note $’000 $’000 $’000 $’000 NET ASSETS AS AT 1 JULY 3 902 286 3 509 668 NET FUNDS MADE AVAILABLE FOR INVESTMENT 4 316 125 42 710 INCOME EARNED AND EXPENDITURE INCURRED AS A RESULT OF INVESTMENT ACTIVITIES: Net income earned from: Indexed linked bonds 5(a) 53 688 21 062 Property 5(a) 32 254 18 558 Australian equities 5(a) 232 667 174 169 International equities 5(a) 328 812 115 633 Fixed interest 5(a) 27 610 6 990 Cash 5(a) 5 674 6 029 Adelaide Plaza 5(a) 100 378 9 773 781 083 352 214 Less: Administration expenses 6 2 306 2 306 Net Income from Investment Activities 5(b) 778 777 349 908
NET ASSETS AS AT 30 JUNE 4 997 188 3 902 286
Statement of Net Assets as at 30 June 2000 2000 1999 Note $’000 $’000 $’000 $’000 BALANCE OF ACCOUNTS OPERATED IN RESPECT OF: SOUTH AUSTRALIAN SUPERANNUATION SCHEME: South Australian Superannuation Fund - Old Scheme Division 20 1 232 461 1 040 408 South Australian Superannuation Fund - New Scheme Division 20 312 576 255 681 Employer Contribution Accounts 20 1 350 941 910 036 2 895 978 2 206 125 POLICE SUPERANNUATION SCHEME: Police Superannuation Fund - Old Scheme Division 20 235 801 205 503 Police Superannuation Fund - New Scheme Division 20 8 836 6 968 Employer Contribution Account 20 164 493 161 966 409 130 374 437 SOUTHERN STATE SUPERANNUATION SCHEME: Southern State Superannuation Fund 20 93 671 55 883 Southern State Superannuation (Employers) Fund 20 1 377 206 1 092 593 1 470 877 1 148 476 PARLIAMENTARY SUPERANNUATION SCHEME 20 103 273 93 915 JUDGES’ PENSION SCHEME 20 84 868 78 702 GOVERNORS’ PENSION SCHEME 20 662 631 POLICE OCCUPATIONAL SUPERANNUATION SCHEME 20 32 400 -
BALANCE OF ACCOUNTS 4 997 188 3 902 286
REPRESENTED BY: INVESTMENTS: Index linked bonds 7 561 492 463 451 Property 8 400 878 332 150 Australian equities 9 1 647 604 1 315 279 International equities 10 1 786 826 1 319 063 Fixed interest 12 451 340 363 103 Cash 13 80 124 140 479 Adelaide Plaza 11 110 977 11 082 5 039 241 3 944 607 FIXED ASSETS 14 102 154 OTHER ASSETS: Cash and deposits at Treasury 55 730 Interest, dividends and rent due 1 561 528 Prepaid expenses 69 101 Sundry debtors 13 13 1 698 1 372 Total Assets 5 041 041 3 946 133 CURRENT LIABILITIES: Rent paid in advance 1 308 1 730 Sundry creditors 3 795 2 145 Provisions 15(a) 132 47 5 235 3 922 NON-CURRENT LIABILITIES 15(b) 38 618 39 925 Total Liabilities 43 853 43 847
NET ASSETS 4 997 188 3 902 286
Commitments and Contingent Liabilities 16

Superannuation Funds Management Corporation
1058
Statement of Cash Flows for the year ended 30 June 2000 2000 1999 Inflows Inflows Inflows Inflows (Outflows) (Outflows) (Outflows) (Outflows) Note $’000 $’000 $’000 $’000 CASH FLOWS FROM OPERATING ACTIVITIES: Net cash flows from: Index linked bonds 23 202 22 108 Property 431 3 063 Australian equities 7 267 305 International equities (38 152) (45 648) Fixed interest (583) (485) Cash 5 960 5 728 Adelaide Plaza 1 199 (655) Administration (2 163) (2 132)
Net Cash used in Operating Activities 18(b) (2 839) (17 716) CASH FLOWS FROM INVESTING ACTIVITIES: Purchase of investments: Index linked bonds (72 349) - Property (45 262) (64 112) Australian equities (110 138) (6 017) International equities (395 431) (2 873) Fixed interest (60 000) (84 000) Adelaide Plaza - (1 250) Fixed assets (33) (125) (683 213) (158 377) Sale of investments: Index linked bonds 4 636 48 334 Property 6 679 48 027 Australian equities 1 976 6 124 International equities 295 892 1 Fixed assets 5 13 309 188 102 499 Net Cash used in Investing Activities (374 025) (55 878) CASH FLOWS FROM FINANCING ACTIVITIES: Receipts 620 923 221 117 Payments (304 798) (178 407) Net Cash provided by Financing Activities 4 316 125 42 710 NET DECREASE IN CASH HELD (60 739) (30 884) CASH AS AT 1 JULY 140 389 171 273
CASH AS AT 30 JUNE 18(a) 79 650 140 389
NOTES TO AND FORMING PART OF THE FINANCIAL STATEMENTS 1. Format of the Financial Statements
Superannuation Funds Management Corporation of South Australia (Funds SA) is established under the Superannuation Funds Management Corporation of South Australia Act 1995 (the Act). Funds SA is responsible for the investment and management of the public sector superannuation funds pursuant to strategies formulated by Funds SA. The public sector superannuation funds (the funds) are defined under the Act as: • the South Australian Superannuation Fund • the Police Superannuation Fund • the Southern State Superannuation Fund • the employer contributions made pursuant to section 5 of the Superannuation Act 1988 where the arrangement requires
contributions to be invested and managed by Funds SA (commonly referred to as section 5 accounts) • funds determined by the Minister to be public sector superannuation funds.
The purpose of the financial statements is to discharge Funds SA’s reporting obligations in respect of its financial affairs under subsection 26(1) of the Act, and in respect of each of the client funds, as required by subsection 26(2) of the Act. Funds SA’s investment activities are reported on in the Statement of Changes in Net Assets, Statement of Net Assets and Statement of Cash Flows. Statements of Changes in Net Assets and Statements of Net Assets Under Management in respect of each client fund are reported upon in Note 20 to these financial statements as required by subsection 26(2) of the Act. As at 30 June 2000, Funds SA managed the following client funds: • South Australian Superannuation Scheme:
South Australian Superannuation Fund (Old Scheme Division) South Australian Superannuation Fund (New Scheme Division) South Australian Superannuation Scheme - Employer Contribution Accounts.
• Police Superannuation Scheme: Police Superannuation Fund (Old Scheme Division) Police Superannuation Fund (New Scheme Division) Police Superannuation Scheme - Employer Contribution Account.
Superannuation Funds Management Corporation
1059
1. Format of the Financial Statements (continued) • Southern State Superannuation Scheme:
Southern State Superannuation Fund Southern State Superannuation (Employers) Fund.
• Parliamentary Superannuation Scheme • Judges’ Pension Scheme • Governors’ Pension Scheme • Police Occupational Superannuation Scheme.(1)
(1) On 30 June 2000, the Treasurer, pursuant to subsection 3(3) of the Act, determined the Police Occupational Superannuation
Scheme to be a public sector superannuation fund. As a consequence, this Scheme, has come within the management and investment of Funds SA. Prior to this determination, the funds of the Police Occupational Superannuation Scheme were invested as part of the funds of the Police Superannuation Scheme - Employer Contribution Accounts. For the purposes of these financial statements, the Police Occupational Superannuation Scheme has been reported on separately in Note 20 ‘Financial Information of Funds under Management; as required by subsection 26(2) of the Act.
Funds SA is not responsible for the administration of the superannuation schemes associated with the public sector superannuation funds. All scheme administration activities are undertaken by the Superannuation Boards established by scheme legislation, or by the Department of Treasury and Finance. Consequently, the financial statements of Funds SA report only on the investment activities of the public sector superannuation funds under management. For information on the nature and overall operations of the various superannuation schemes, reference should be made to annual reports and financial statements prepared by the responsible Superannuation Boards and/or the Department of Treasury and Finance.
2. Statement of Accounting Policies (a) Basis of Accounting
The financial statements are general purpose statements and have been prepared on an accruals basis in accordance with Australian Accounting Standards, Urgent Issues Group Consensus Views, Treasurer’s Instruction 19 ‘Financial Reporting’ and Department of Treasury and Finance Accounting Policy Statements issued pursuant to the Public Finance and Audit Act 1987, except as provided below. The financial statements of Funds SA, although not recording the administration activities of the public sector funds, are prepared in accordance with the principles of Australian Accounting Standard AAS 25 ‘Financial Reporting by Superannuation Plans’ where relevant. The Directors believe that this policy best discloses the financial status of the funds under management and the performance of Funds SA in fulfilling its management and investment responsibilities. It also provides consistency with the financial statements of the relevant superannuation schemes associated with the public sector superannuation funds. Consequently, assets and liabilities are recorded at net market values as at the balance date, and realised and unrealised gains or losses are brought to account in the Statement of Changes in Net Assets. As investments are revalued to their respective net market values at balance date, depreciation and amortisation are not provided for in these financial statements. Funds SA utilises the consolidation method of accounting. Assets and liabilities of Funds SA’s controlled entities have been consolidated into the financial statements at their net market values. The effects of transactions between entities in the economic entity are eliminated in full. Financial information in respect of the parent entity separate to that of the economic entity has not been provided as the application of market value reporting concepts results in the parent entity’s financial statements fully reflecting the economic activities of controlled entities. It is believed that disclosure of the parent entity’s results separately to those of the economic entity would not provide information which would add value to users of the financial statements.
(b) Basis of Valuations of Assets and Liabilities The basis for the valuation of assets is summarised below. Valuations are net of estimated disposal costs, where material. (i) Index Linked Bonds
The Index Linked portfolio comprises two subsectors: • Internally Managed
These investments (the returns of which are linked to movements in either the Consumer Price Index (CPI) or Average Weekly Earning (AWE), have been valued using the discounted cash flow method. The valuation as at 30 June 2000 was performed by an independent valuer, Macquarie Bank Limited.
• Externally Managed
The externally managed portfolio is invested and managed by an external manager. The custodian appointed to hold the assets has valued the portfolio using market prices applicable at the balance date.
(ii) Property
The property portfolio comprises four subsectors: • Directly Held Properties
Valuation of directly held properties have been carried out by independent licensed property valuers, other than as indicated in Note 8.
• Directly Held Listed Property Trusts Investments in directly held listed property trusts have been valued using market prices applicable at the balance date.

Superannuation Funds Management Corporation
1060
(ii) Property (continued) • Externally Managed Listed Property Trust
The externally managed listed property trust portfolio is invested and managed by two managers. The custodian appointed to hold the assets has valued the portfolios using market prices applicable at the balance date.
• Externally Managed Unlisted Property Vehicles Investments in externally managed unlisted property vehicles have been valued in accordance with the exit valuations supplied by the managers.
(iii) Australian Equities The Australian Equities portfolio comprises two subsectors: • Listed Australian Equities
The listed Australian equities portfolio is invested and managed by external managers. The custodian appointed to hold the assets has valued the portfolio using market prices applicable at the balance date.
• Private Equity The private equity portfolio comprises holdings in a number of externally managed specialist funds together with internally managed assets. The externally managed specialise funds have been valued by the managers in accordance with the Australian Venture Capital Association Limited (AVCAL) guidelines. Internally managed assets have been valued by Directors, either in accordance with market prices applicable at balance date, or having regard to market conditions and the current and expected future performance of the investments.
(iv) International Equities The international equities portfolio is invested and managed by external managers. Discretely managed portfolios have been valued by the custodian appointed to hold the assets using market prices applicable at the balance date. Investments in pooled international vehicles and private equity funds have been valued in accordance with the exit valuations supplied by the managers. Currency conversions have been made at the spot market mid rates applicable at the balance date where applicable.
(v) Adelaide Plaza The Adelaide Plaza Fund comprises Fund SA’s investment in the Funds SA Subsidiary Holding Corporation, a wholly owned subsidiary of Funds SA (refer Note 11). The Funds SA Subsidiary Holding Corporation’s remaining investments at 30 June comprise the units in the Riverside Office Trust (the owner and operator of the Riverside Office Building, North Terrace), the shares in Riverside Office Pty Ltd (the trustee company for the Riverside Office Trust) and cash. Funds SA’s investment in the Adelaide Plaza Fund has been valued by the Directors having regard to 30 June 2000 consolidated management accounts of the Funds SA Subsidiary Holding Corporation.
(vi) Fixed Interest The Fixed Interest portfolio is invested and managed by external managers. The custodian appointed to hold the assets has valued the portfolio using market prices applicable at the balance date.
(vii) Cash Deposits at call and other deposits of very short term duration have been valued on the basis of principal plus accrued interest. Bank bills have been valued using market rates applicable at the balance date.
(viii) Fixed Assets Fixed assets are shown at cost less accumulated depreciation. Depreciation is calculated over the estimated useful lives of the assets, using straight line and diminishing value methods. The Directors are of the opinion that this provides a reasonable estimate of market value.
(ix) Other Assets and Liabilities These items have been assessed and the Directors are of the opinion that for most items, book values provide a reasonable estimate of their market values. Where material items are not likely to be realised within a short period following the balance date, the book values of these items have been discounted back to the balance date using relevant market interest rates applying on balance date.
(c) Taxation All of the public sector superannuation funds under the management of Funds SA are exempt from federal income tax by virtue that they are declared as ‘constitutionally protected funds’ under the Regulations of the Income Tax Assessment Act 1936. Consequently, no income tax expense has been brought to account in these financial statements.
(d) Accounting for Leases Incentives received on entering into operating leases are recognised as liabilities. Lease payments are allocated between rental expense and reduction of the liability on a straight-line basis. The allocation of lease rental payments in this manner ensures that the rental expense is recognised on a basis which is representative of the benefits derived from the leased asset.
Superannuation Funds Management Corporation
1061
3. Operation of Investment Portfolio Funds SA operates a pooled investment portfolio utilising a number of sector funds, each of which holds assets of a different category. The sectors funds are: • Index linked bonds • Property • Australian equities • International equities • Fixed interest • Cash. Funds SA also operates a multi-layered notional unitisation structure to facilitate the administration of different investment strategies applying to the various public sector superannuation funds. From 1 July 1999, Funds SA implemented a range of investment strategies (or ‘products’) to cater for the introduction of member investment choice offered to members of the Southern State Superannuation Scheme. Funds SA therefore manages five separate investment products distinguished by differing strategic asset allocations. The products are:
• Growth • Balanced • Conservative • Cash • Defined Benefit.
The first four products are available to members of the Southern State Superannuation Scheme whereas the fifth product, Defined Benefit, is applied to the remainder of the public sector superannuation funds managed by Funds SA. Reference should be made to Funds SA’s annual report for the strategic asset allocations applying to each of the investment products.
Each public sector superannuation fund holds units in a product, which in turn holds units in each of the sector funds according to the target strategic asset allocation for the investment product. Units are issued and redeemed monthly at unit prices determined by the net market value of underlying investments. The interest which each public sector superannuation fund holds in the unitised investment portfolio is disclosed in each fund’s Statement of Net Assets Under Management in Note 20. Each fund’s allocation of total net investment income is disclosed in Note 5(b) and in each fund’s Statement of Changes in Net Assets in Note 20. In addition to the foregoing sector funds, another sector fund titled the ‘Adelaide Plaza Fund’ was established in 1995 to hold Funds SA’s investment in the Adelaide Casino, Hyatt Hotel and Riverside Office building. At 30 June, the units in this sector fund were held exclusively by three ‘government risk’ funds: the SA Superannuation Scheme Employer Contribution Accounts, the Police Superannuation Scheme Employer Contribution Account and the Police Occupational Superannuation Scheme.
4. Net Funds made available for Investment The receipts below represent the total of monies received by Funds SA from the public sector superannuation funds for investment, and payments represent the total of monies redeemed by the funds to meet scheme payments.
2000 1999 South Australian Superannuation Scheme: $’000 $’000 Receipts 431 295 73 400 Less: Payments 226 300 132 897 204 995 (59 497) Police Superannuation Scheme: Receipts 4 475 9 750 Less: Payments 44 425 5 481 (39 950) 4 269 Southern State Superannuation Scheme: Receipts 152 035 135 752 Less: Payments 20 003 35 852 132 032 99 900 Parliamentary Superannuation Scheme: Receipts 692 980 Less: Payments 7 020 2 700 (6 328) (1 720) Judges’ Pension Scheme: Receipts 26 1 150 Less: Payments 6 980 1 410 (6 954) (260) Governors’ Pension Scheme: Receipts - 85 Less: Payments 70 67 (70) 18 Police Occupational Superannuation Scheme: Receipts 32 400 - Less: Payments - - 32 400 - 316 125 42 710

Superannuation Funds Management Corporation
1062
5. Investment Income (a) Composition of Investment Income 2000 1999 Details of income earned from investment activities is provided below: $’000 $’000 Indexed Linked Bonds: Net income received or receivable:
Rent 11 402 11 344 Interest 16 306 14 270
Interest capitalised 13 905 3 028 41 613 28 642
Less: Expenses 402 423 41 211 28 219 Net appreciation (depreciation) of assets 10 830 (8 944) Excess (shortfall) of realisations over market values previously taken 1 647 1 787 53 688 21 062 Property: Net income received or receivable:
Rent 6 452 10 218 Interest 94 135
Dividends 15 285 12 741 21 831 23 094
Less: Expenses 4 705 6 157 17 126 16 937 Net appreciation (depreciation) of assets 14 010 (3 244) Excess (shortfall) of realisations over market values previously taken 1 118 4 865 32 254 18 558 Australian Equities: Net income received or receivable:
Dividends 64 740 47 945 Interest 2 306 1 808 67 046 49 753
Less: Expenses 3 378 2 613 63 668 47 140 Net appreciation (depreciation) of assets 111 855 85 637 Excess (shortfall) of realisations over market values previously taken 57 144 41 392 232 667 174 169 International Equities: Net income received or receivable:
Dividends 9 098 5 729 Interest 742 276 9 840 6 005
Less: Expenses 6 438 3 454 3 402 2 551 Net appreciation (depreciation) of assets 286 405 90 978 Realised net income (expense) from currency hedge strategy (71 723) 24 098 218 084 117 627
Excess (shortfall) of realisations over market values previously taken 110 728 (1 994) 328 812 115 633 Fixed Interest: Net income received or receivable: Interest 23 475 17 185 23 475 17 185
Less: Expenses 670 488 22 805 16 697 Net appreciation (depreciation) of assets 5 186 (7 533) Excess (shortfall) of realisations over market values previously taken (381) (2 174) 27 610 6 990 Cash: Net income received or receivable: Interest 5 599 5 321 5 599 5 321
Less: Expenses 1 - 5 598 5 321 Net appreciation (depreciation) of assets 529 820 Excess (shortfall) of realisations over market values previously taken (453) (112) 5 674 6 029 Adelaide Plaza: Net income received or receivable:
Dividends 1 572 - 1 572 -
Less: Expenses 918 51 654 (51) Net appreciation (depreciation) of assets 6 895 9 824 Excess (shortfall) of realisations over market values previously taken 92 829 - 100 378 9 773 781 083 352 214
Under certain index linked bond investments, payments received during any year may vary from the amount of income accruing in respect of that year. The difference, which represents capitalised interest, is applied to adjust the outstanding principal of the investment. Income arising from this source has been identified in this note as ‘Interest Capitalised’.
Superannuation Funds Management Corporation
1063
(a) Composition of Investment Income (continued) Net appreciation (depreciation) of assets represents unrealised gains (losses), over either cost for those investments acquired during the period, or over market value at the commencement of the period for those investments acquired prior to the commencement of the period. With respect to international equities, the net appreciation (depreciation) of assets is offset by either the expense or income realised during the financial year due to the implementation of Funds SA’s currency management strategy. Excess (shortfall) of realisations over market values previously taken represents realised gains (losses) over either cost for those investments which had been acquired and disposed of within the financial period, or over market values previously brought to account where the investments disposed of were held at the commencement of the period.
(b) Allocation of Net Investment Income 2000 1999 The allocation of net investment income to each client fund managed by Funds SA is as follows: $’000 $’000
South Australian Superannuation Scheme: South Australian Superannuation Fund - Old Scheme Division 176 039 91 490 - New Scheme Division 44 777 21 839 Employer Contribution Accounts 264 042 89 102 Police Superannuation Scheme: Police Superannuation Fund - Old Scheme Division 34 348 17 921 - New Scheme Division 1 243 600 Employer Contribution Account 39 052 15 078 Southern State Superannuation Scheme: Southern State Superannuation Fund 11 042 2 775 Southern State Superannuation (Employers) Fund 179 327 95 916 Parliamentary Superannuation Scheme 15 686 8 257 Judges’ Pension Scheme 13 120 6 867 Governors’ Pension Scheme 101 63
778 777 349 908
Subscriptions and redemptions are regularly made from unitised sector funds in line with each fund’s cash flow requirements. It is therefore not possible to determine accurately the separate contribution of realised and unrealised gains to each fund’s share of net investment income.
6. Administration Expenses (a) General
Investment administration expenses incurred by Funds SA totalling $2.306 million ($2.306 million) have been charged against the sector funds under management. This cost is recorded in the Statement of Changes in Net Assets.
(b) Directors’ Remuneration Directors’ remuneration includes fees, superannuation and other benefits. Directors’ fees for the 1999-2000 year were set by the Governor of South Australia. Directors who are State public sector employees do not receive fees for their Funds SA directorship. Directors’ fees include fees paid with respect to members’ representation on both the Funds SA Board and the boards of associated controlled entities.
2000 1999 Total Fees Number of Number of Directors Directors
$0 - $10 000 1 - $10 001 - $20 000 1 - $20 001 - $30 000 1 3 $30 001 - $40 000 1 1 $50 001 - $60 000 1 1 $60 001 - $70 000 - 1
$70 001 - $80 000 1 - $100 001 - $110 000 1 -
The aggregate remuneration of Directors was $308 000 ($227 000).
(c) Executives’ Remuneration Remuneration, including salary, bonuses, superannuation and other benefits, of Funds SA officers which exceeds the disclosure threshold required by Accounting Policy Statement APS 13 ‘Form and Content of General Purpose Financial Reports’ is as follows:
2000 1999 Total Remuneration Number of Number of Officers Officers $100 001 - $110 000 1 1
$130 001 - $140 000 1 - $150 001 - $160 000 1 -
$210 001 - $220 000 - 1
The aggregate remuneration of executives exceeding the disclosure threshold was $395 000 ($315 000).
(d) Employee Entitlements The administration expenses incurred by Funds SA include recognition of the liabilities associated with employee entitlements of Funds SA officers resulting from service up to the balance date. Employee entitlement liabilities have been calculated at nominal values based upon salary rates existing at the balance date and include related on-costs. Liabilities for unpaid salaries, annual leave and long service leave have been recognised. Sick leave entitlements are non-vesting and have not been recognised as a liability.

Superannuation Funds Management Corporation
1064
(d) Employee Entitlements (continued) The liability for long service leave is calculated using a shorthand method of estimation in accordance with the provisions of the Australian Accounting Standard AAS 30 ‘Accounting for Employee Entitlements’. Long service leave liability is based upon recognition of entitlement after five years service. Superannuation liabilities recognised in the Statement of Net Asset represents employer contributions due but not yet paid as at the balance date. Funds SA Directors and officers are either members of the South Australian Superannuation Scheme, Southern State Superannuation Scheme or private superannuation funds. Funds SA makes periodic payments to these superannuation funds. These payments extinguish any future liability for superannuation for all employees and directors. In 1999-2000, the periodic amounts paid, or due and payable, to the South Australian Superannuation Scheme and the Southern State Superannuation Scheme totalled $74 000 ($54 000). In 1999-2000, the periodic amounts paid, or due and payable, to private superannuation funds totalled $20 000 ($41 000).
2000 Non- Total The employee entitlements recognised as liabilities as at Current Current 2000 1999 30 June comprise: $’000 $’000 $’000 $’000
Salaries and wages 54 - 54 (6) Annual leave 45 - 45 51 Long service leave 1 165 166 118 Superannuation 14 - 14 1
114 165 279 164
(e) Auditors’ Remuneration 2000 1999 Amounts received, or due and receivable, by the auditors are: $’000 $’000 Auditor-General’s Department: Auditing the financial statements of Funds SA and certain controlled entities 76 73 Bird Cameron Partners (Sydney): Auditing the accounts of Pipetch Pty Ltd and the SILT Trust 4 4 Other services 1 1 81 78
(f) Fees paid to Consultants Fees paid or payable to consultants for services not related to the management of specific investments amounted to $154 000 ($80 000), and are included as part of the administration expenses of Funds SA. Funds SA also makes payments for services provided in relation to the acquisition, ongoing management and disposal of investments. These payments are incurred in the normal course of business, and have been either capitalised or expensed within the sector funds to which they relate.
7. Indexed Linked Bonds 2000 1999 Index linked bonds held by subsector at the balance date comprise: Net Market Net Market Value Value $’000 $’000 Internally managed investments 400 221 385 175 Externally managed investments 161 271 78 276 561 492 463 451
As at 30 June, the composition of each subsector is as follows: Internally Managed: Omni Midland Pty Ltd Loan
Babcock and Brown Lease Management Services Pty Ltd Loan Obtala Pty Ltd Loan Government Computing Centre, Glenside, SA SA Housing Trust Leaseholds, various locations, SA Sir Samuel Way Building, Victoria Square, Adelaide, SA Roma Mitchell Building, North Terrace, Adelaide, SA Shell Australian Service Station Leases - Various locations(1) Blue Mountains Sewage Transfer Scheme, NSW (2)
Externally Managed: Credit Suisse Asset Management (Australia) Limited
(1) The leases provide for Funds SA to receive rental payments adjusted annually by the greater of inflation or an agreed percentage amount. The market valuation of these arrangements also incorporates the present value of the property residual, this being determined as the unimproved land value at lease expiry.
(2) The market value of the Blue Mountains Sewage Transfer Scheme represents the present value of a stream of cash flows arising from a serious of bonds, indexed to the Average Weekly Earnings, under a contract with the Sydney Water Board to transfer sewage from the Blue Mountains to the Winmalee Sewage Treatment Plant.
8. Property 2000 1999 Property interest held by subsector at balance date comprise: Net Market Net Market Value Value $’000 $’000
Directly held properties and listed property trusts 42 661 50 404 Externally managed listed property trusts 228 446 162 799 Externally managed unlisted property vehicles 129 771 118 947
400 878 332 150
Superannuation Funds Management Corporation
1065
8. Property (continued) As at 30 June, the composition of each subsector is as follows:
Directly held Properties: Australian Taxation Office, 200 Collins Street, Hobart, Tasmania Net present value of lease residual, Department of Land Administration Offices, Midland, Western Australia
Directly held Listed Property Trusts: AMP Industrial Property Trust
Externally Managed Listed Property Trusts: Rothschild Australia Asset Management Limited(1) Paladin Australian Limited(1)
Externally Managed Unlisted Property Vehicles: AMP Life Limited Private Property Syndicate Lend Lease Real Estate Partners
(1) Both Rothschild Australia Asset Management Ltd and Paladin Australia Ltd each manage a listed properties securities mandate on Funds SA’s behalf. They have been given discretion as to the timing of entry into markets, which means from time to time they may hold some cash rather than listed property securities.
The Australian Taxation Office, Hobart has been the subject of a redirection of the rental stream arising from a long term lease. The value of this property has been determined by the Directors having regard to the nature of the arrangements currently in force over the property, and anticipated market conditions at the expiration of these arrangements. The residual value of the property, $1.14 million, has been valued by Colliers Jardine. The offsetting non-current liability is reported in Note 15(b). The value of a future interest in the lease residual associated with the Department of Land Administration Offices, Midland has been determined by the Directors using the discounted cash flow method.
9. Australian Equities
(a) Externally Managed Funds SA uses professional fund managers to manage its externally managed Australian equities portfolio. Each manager has been given a mandate to invest in discretely held portfolios of listed Australian equities, but for market timing purposes, they may also hold some cash from time to time. Assets under management are held by The Chase Manhattan Bank as custodian.
The nature of mandates given to investment managers and the value of 2000 1999 the individual portfolios as at 30 June comprise: Net Market Net Market Value Value Index Enhanced Mandate: $’000 $’000 Macquarie Investment Management Ltd 452 942 394 794 Active Broad Market Mandate: County Australia Investment Management Ltd - 287 969 Credit Suisse Asset Management (Australia) Ltd 395 441 - Perpetual Asset Management Ltd 424 779 313 973 Balanced Equity Management Pty Ltd 313 906 257 966 1 587 068 1 254 702
(b) Private Equity This item comprises investments mainly in unlisted companies and managed trust funds. Such investments may take the form of equity interests, loans, or a combination of both.
Private equity interests held by subsector at balance date comprise: Listed equities 3 917 4 842 Unlisted equities 4 375 5 279 Managed funds 52 244 50 456 60 536 60 577
Total Australian Equities 1 647 604 1 315 279
As at 30 June, the composition of each subsector is as follows:
Listed Equities: Grand Hotel Group
Unlisted Equities:
Australian Leather Holdings Ltd Monsafe Pty Ltd Western Aerospace Ltd
Managed Funds:
Arrow Development Fund (Rothschilds) Australian Mezzanine Investment #2 Trust Hambro-Grantham Development Trust Macquarie Investment #2 Trust AMP Business Development Fund #2 Catalyst Fourth Management Buyout Fund Castle Harlan Australian Mezzanine Partners No 1A Trust Business Equity Fund
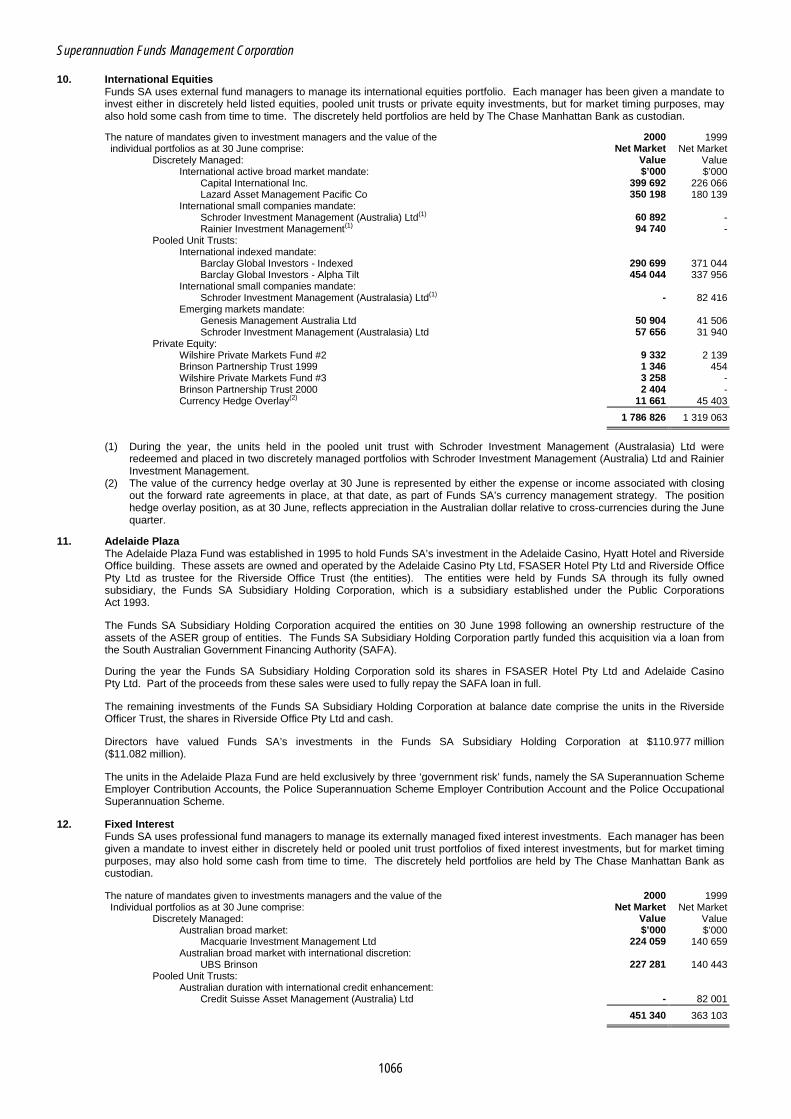
Superannuation Funds Management Corporation
1066
10. International Equities Funds SA uses external fund managers to manage its international equities portfolio. Each manager has been given a mandate to invest either in discretely held listed equities, pooled unit trusts or private equity investments, but for market timing purposes, may also hold some cash from time to time. The discretely held portfolios are held by The Chase Manhattan Bank as custodian.
The nature of mandates given to investment managers and the value of the 2000 1999 individual portfolios as at 30 June comprise: Net Market Net Market
Discretely Managed: Value Value International active broad market mandate: $’000 $’000 Capital International Inc. 399 692 226 066 Lazard Asset Management Pacific Co 350 198 180 139
International small companies mandate: Schroder Investment Management (Australia) Ltd(1) 60 892 - Rainier Investment Management(1) 94 740 -
Pooled Unit Trusts: International indexed mandate: Barclay Global Investors - Indexed 290 699 371 044 Barclay Global Investors - Alpha Tilt 454 044 337 956 International small companies mandate: Schroder Investment Management (Australasia) Ltd(1) - 82 416 Emerging markets mandate: Genesis Management Australia Ltd 50 904 41 506 Schroder Investment Management (Australasia) Ltd 57 656 31 940 Private Equity: Wilshire Private Markets Fund #2 9 332 2 139 Brinson Partnership Trust 1999 1 346 454
Wilshire Private Markets Fund #3 3 258 - Brinson Partnership Trust 2000 2 404 -
Currency Hedge Overlay(2) 11 661 45 403 1 786 826 1 319 063
(1) During the year, the units held in the pooled unit trust with Schroder Investment Management (Australasia) Ltd were
redeemed and placed in two discretely managed portfolios with Schroder Investment Management (Australia) Ltd and Rainier Investment Management.
(2) The value of the currency hedge overlay at 30 June is represented by either the expense or income associated with closing out the forward rate agreements in place, at that date, as part of Funds SA’s currency management strategy. The position hedge overlay position, as at 30 June, reflects appreciation in the Australian dollar relative to cross-currencies during the June quarter.
11. Adelaide Plaza
The Adelaide Plaza Fund was established in 1995 to hold Funds SA’s investment in the Adelaide Casino, Hyatt Hotel and Riverside Office building. These assets are owned and operated by the Adelaide Casino Pty Ltd, FSASER Hotel Pty Ltd and Riverside Office Pty Ltd as trustee for the Riverside Office Trust (the entities). The entities were held by Funds SA through its fully owned subsidiary, the Funds SA Subsidiary Holding Corporation, which is a subsidiary established under the Public Corporations Act 1993.
The Funds SA Subsidiary Holding Corporation acquired the entities on 30 June 1998 following an ownership restructure of the assets of the ASER group of entities. The Funds SA Subsidiary Holding Corporation partly funded this acquisition via a loan from the South Australian Government Financing Authority (SAFA).
During the year the Funds SA Subsidiary Holding Corporation sold its shares in FSASER Hotel Pty Ltd and Adelaide Casino Pty Ltd. Part of the proceeds from these sales were used to fully repay the SAFA loan in full.
The remaining investments of the Funds SA Subsidiary Holding Corporation at balance date comprise the units in the Riverside Officer Trust, the shares in Riverside Office Pty Ltd and cash.
Directors have valued Funds SA’s investments in the Funds SA Subsidiary Holding Corporation at $110.977 million ($11.082 million).
The units in the Adelaide Plaza Fund are held exclusively by three ‘government risk’ funds, namely the SA Superannuation Scheme Employer Contribution Accounts, the Police Superannuation Scheme Employer Contribution Account and the Police Occupational Superannuation Scheme.
12. Fixed Interest
Funds SA uses professional fund managers to manage its externally managed fixed interest investments. Each manager has been given a mandate to invest either in discretely held or pooled unit trust portfolios of fixed interest investments, but for market timing purposes, may also hold some cash from time to time. The discretely held portfolios are held by The Chase Manhattan Bank as custodian.
The nature of mandates given to investments managers and the value of the 2000 1999 Individual portfolios as at 30 June comprise: Net Market Net Market
Discretely Managed: Value Value Australian broad market: $’000 $’000 Macquarie Investment Management Ltd 224 059 140 659 Australian broad market with international discretion: UBS Brinson 227 281 140 443 Pooled Unit Trusts: Australian duration with international credit enhancement: Credit Suisse Asset Management (Australia) Ltd - 82 001 451 340 363 103

Superannuation Funds Management Corporation
1067
13. Cash 2000 1999 Net Market Net Market Value Value The cash fund comprised the following investments as at 30 June: $’000 $’000 11am and term deposits 16 595 3 200 Bank bills 63 529 137 279 80 124 140 479
14. Fixed Assets Fixed assets comprise fixtures, fittings, plant and equipment. Movements in this account are summarised below: Fixed assets (At cost) at 1 July 868 750 Add: Purchases 27 132 895 882 Less: Disposals (At cost) 127 13 Fixed assets (At cost) at 30 June 768 869 Less: Accumulated depreciation 666 715 102 154
15. Liabilities (a) Current Provisions Current provisions as at balance date comprise: Provision for employee entitlements 114 47
Lease incentive 18 - 132 47
(b) Non-Current Provisions Non-Current liabilities as at balance date comprise: Provision for employee entitlements 165 117 Bank bill facility(1) 37 675 39 808
Other 715 - Lease incentive 63 -
38 618 39 925
(1) The future income stream arising from the long term lease to the Australian Taxation Office (ATO) of the whole of a
Hobart office property has been redirected to a syndicate of international banks. The redirection was in the form of a concurrent lease of the property to the banks under which the banks received the right to the rental and fixed outgoings payments made by the ATO. The concurrent lease requires the banks to make rental payments to Funds SA equal in value to the payments receivable from the ATO. As part of the transaction, the banks provided a bank bill facility to Funds SA. Under a set-off agreement, the rental payments due to Funds SA under the concurrent lease are applied by the banks to service the bill facility. The amounts outstanding under the facility are predetermined and are capable of being fully serviced and repaid from the concurrent lease rentals.
16. Commitments and Contingent Liabilities
(a) Capital Commitments On 30 June, Funds SA had commitments associated with future capital calls on private equity investments entered into before that date, other than transactions which have been provided for in the financial statements as unsettled purchases of investments. The commitments are as follows, with no allowance having been made for the time value of money:
2000 1999 $’000 $’000 Not later than one year 31 463 19 196 Later than one year but not later than two years 27 729 19 196 Later than two years 20 516 - 79 708 38 392
(b) Contingent Liabilities Contingent liabilities take the form of contested claims of third parties and the granting of a number of put options, and are as follows:
2000 Nature of Contingent Liability: $’million Australian Taxation Office, Bankstown, NSW 35.0 Australian Taxation Office, Wollongong, NSW 8.0 43.0
Funds SA has granted a put option in relation to a $35 million debt facility in respect of premises for the Australian Taxation Office in Bankstown, NSW. If exercised, Funds SA would acquire loan assets secured against developed properties. This put option may be exercised in May 2002. Funds SA has also granted a put option with an exercise price of $8 million in respect of an office property located in Wollongong, NSW, also occupied by the Australian Taxation Office. If exercised, Funds SA would acquire the property. This put option may be exercised in January 2004. Directors consider that, as at 30 June 2000, exercise of the options will be unlikely as forecasted valuations are higher than the respective exercise prices. Should any of the put options be exercised, the impact of Funds SA’s net worth will be limited to the amount by which the property value falls below the exercise price. At balance date an outstanding legal claim for damages existed with respect to a former tenant of a sold property. The claim is being disputed by Funds SA and consequently the outcome and any financial consequences are uncertain at this time.
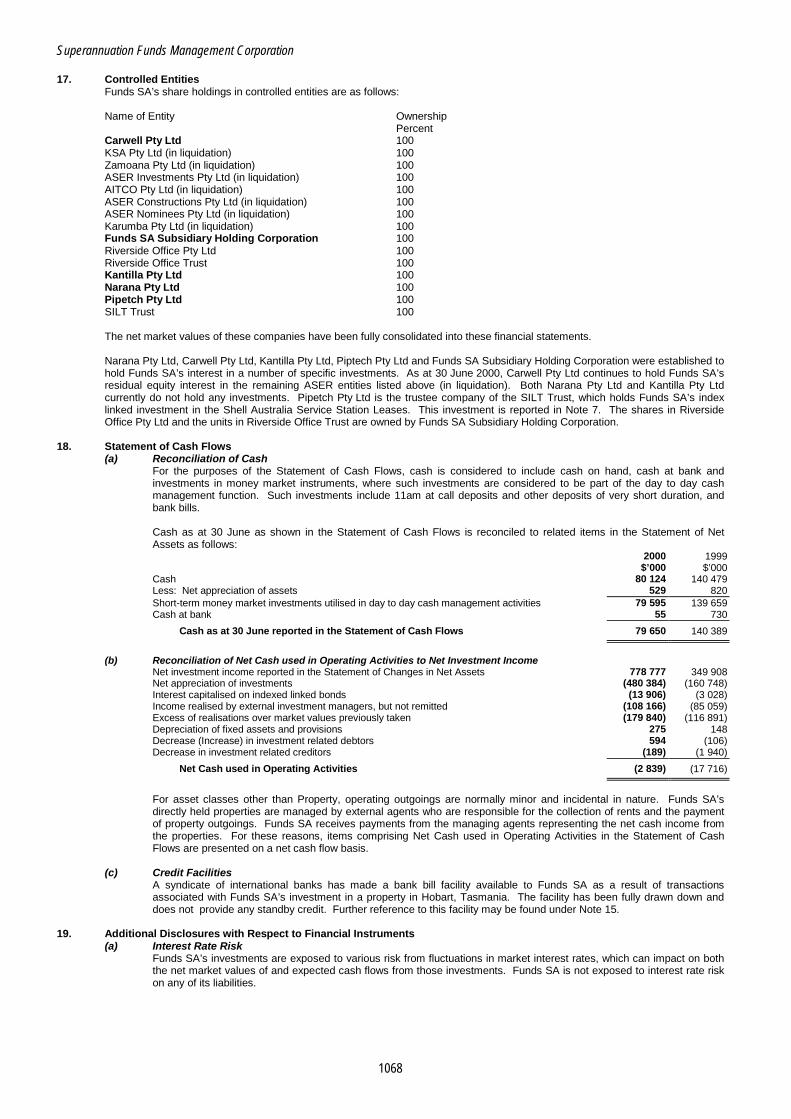
Superannuation Funds Management Corporation
1068
17. Controlled Entities Funds SA’s share holdings in controlled entities are as follows: Name of Entity Ownership Percent Carwell Pty Ltd 100 KSA Pty Ltd (in liquidation) 100 Zamoana Pty Ltd (in liquidation) 100 ASER Investments Pty Ltd (in liquidation) 100 AITCO Pty Ltd (in liquidation) 100 ASER Constructions Pty Ltd (in liquidation) 100 ASER Nominees Pty Ltd (in liquidation) 100 Karumba Pty Ltd (in liquidation) 100 Funds SA Subsidiary Holding Corporation 100 Riverside Office Pty Ltd 100 Riverside Office Trust 100 Kantilla Pty Ltd 100 Narana Pty Ltd 100 Pipetch Pty Ltd 100 SILT Trust 100 The net market values of these companies have been fully consolidated into these financial statements. Narana Pty Ltd, Carwell Pty Ltd, Kantilla Pty Ltd, Piptech Pty Ltd and Funds SA Subsidiary Holding Corporation were established to hold Funds SA’s interest in a number of specific investments. As at 30 June 2000, Carwell Pty Ltd continues to hold Funds SA’s residual equity interest in the remaining ASER entities listed above (in liquidation). Both Narana Pty Ltd and Kantilla Pty Ltd currently do not hold any investments. Pipetch Pty Ltd is the trustee company of the SILT Trust, which holds Funds SA’s index linked investment in the Shell Australia Service Station Leases. This investment is reported in Note 7. The shares in Riverside Office Pty Ltd and the units in Riverside Office Trust are owned by Funds SA Subsidiary Holding Corporation.
18. Statement of Cash Flows (a) Reconciliation of Cash
For the purposes of the Statement of Cash Flows, cash is considered to include cash on hand, cash at bank and investments in money market instruments, where such investments are considered to be part of the day to day cash management function. Such investments include 11am at call deposits and other deposits of very short duration, and bank bills. Cash as at 30 June as shown in the Statement of Cash Flows is reconciled to related items in the Statement of Net Assets as follows:
2000 1999 $’000 $’000 Cash 80 124 140 479 Less: Net appreciation of assets 529 820 Short-term money market investments utilised in day to day cash management activities 79 595 139 659 Cash at bank 55 730
Cash as at 30 June reported in the Statement of Cash Flows 79 650 140 389
(b) Reconciliation of Net Cash used in Operating Activities to Net Investment Income Net investment income reported in the Statement of Changes in Net Assets 778 777 349 908 Net appreciation of investments (480 384) (160 748) Interest capitalised on indexed linked bonds (13 906) (3 028) Income realised by external investment managers, but not remitted (108 166) (85 059) Excess of realisations over market values previously taken (179 840) (116 891) Depreciation of fixed assets and provisions 275 148 Decrease (Increase) in investment related debtors 594 (106) Decrease in investment related creditors (189) (1 940)
Net Cash used in Operating Activities (2 839) (17 716)
For asset classes other than Property, operating outgoings are normally minor and incidental in nature. Funds SA’s directly held properties are managed by external agents who are responsible for the collection of rents and the payment of property outgoings. Funds SA receives payments from the managing agents representing the net cash income from the properties. For these reasons, items comprising Net Cash used in Operating Activities in the Statement of Cash Flows are presented on a net cash flow basis.
(c) Credit Facilities
A syndicate of international banks has made a bank bill facility available to Funds SA as a result of transactions associated with Funds SA’s investment in a property in Hobart, Tasmania. The facility has been fully drawn down and does not provide any standby credit. Further reference to this facility may be found under Note 15.
19. Additional Disclosures with Respect to Financial Instruments (a) Interest Rate Risk
Funds SA’s investments are exposed to various risk from fluctuations in market interest rates, which can impact on both the net market values of and expected cash flows from those investments. Funds SA is not exposed to interest rate risk on any of its liabilities.
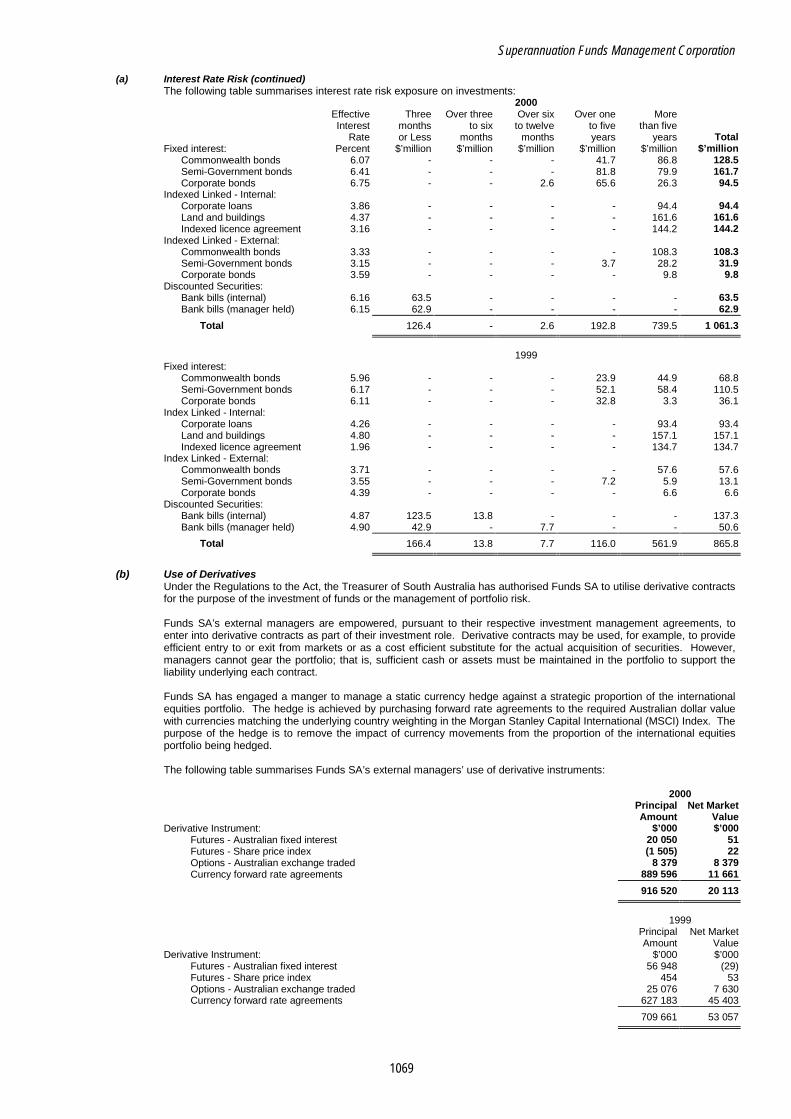
Superannuation Funds Management Corporation
1069
(a) Interest Rate Risk (continued) The following table summarises interest rate risk exposure on investments:
2000 Effective Three Over three Over six Over one More Interest months to six to twelve to five than five Rate or Less months months years years Total
Fixed interest: Percent $’million $’million $’million $’million $’million $’million Commonwealth bonds 6.07 - - - 41.7 86.8 128.5 Semi-Government bonds 6.41 - - - 81.8 79.9 161.7 Corporate bonds 6.75 - - 2.6 65.6 26.3 94.5 Indexed Linked - Internal: Corporate loans 3.86 - - - - 94.4 94.4 Land and buildings 4.37 - - - - 161.6 161.6 Indexed licence agreement 3.16 - - - - 144.2 144.2 Indexed Linked - External: Commonwealth bonds 3.33 - - - - 108.3 108.3 Semi-Government bonds 3.15 - - - 3.7 28.2 31.9 Corporate bonds 3.59 - - - - 9.8 9.8 Discounted Securities: Bank bills (internal) 6.16 63.5 - - - - 63.5 Bank bills (manager held) 6.15 62.9 - - - - 62.9
Total 126.4 - 2.6 192.8 739.5 1 061.3
1999
Fixed interest: Commonwealth bonds 5.96 - - - 23.9 44.9 68.8 Semi-Government bonds 6.17 - - - 52.1 58.4 110.5 Corporate bonds 6.11 - - - 32.8 3.3 36.1 Index Linked - Internal: Corporate loans 4.26 - - - - 93.4 93.4 Land and buildings 4.80 - - - - 157.1 157.1 Indexed licence agreement 1.96 - - - - 134.7 134.7 Index Linked - External: Commonwealth bonds 3.71 - - - - 57.6 57.6 Semi-Government bonds 3.55 - - - 7.2 5.9 13.1 Corporate bonds 4.39 - - - - 6.6 6.6 Discounted Securities: Bank bills (internal) 4.87 123.5 13.8 - - - 137.3 Bank bills (manager held) 4.90 42.9 - 7.7 - - 50.6
Total 166.4 13.8 7.7 116.0 561.9 865.8
(b) Use of Derivatives
Under the Regulations to the Act, the Treasurer of South Australia has authorised Funds SA to utilise derivative contracts for the purpose of the investment of funds or the management of portfolio risk. Funds SA’s external managers are empowered, pursuant to their respective investment management agreements, to enter into derivative contracts as part of their investment role. Derivative contracts may be used, for example, to provide efficient entry to or exit from markets or as a cost efficient substitute for the actual acquisition of securities. However, managers cannot gear the portfolio; that is, sufficient cash or assets must be maintained in the portfolio to support the liability underlying each contract. Funds SA has engaged a manger to manage a static currency hedge against a strategic proportion of the international equities portfolio. The hedge is achieved by purchasing forward rate agreements to the required Australian dollar value with currencies matching the underlying country weighting in the Morgan Stanley Capital International (MSCI) Index. The purpose of the hedge is to remove the impact of currency movements from the proportion of the international equities portfolio being hedged. The following table summarises Funds SA’s external managers’ use of derivative instruments:
2000 Principal Net Market Amount Value Derivative Instrument: $’000 $’000
Futures - Australian fixed interest 20 050 51 Futures - Share price index (1 505) 22 Options - Australian exchange traded 8 379 8 379 Currency forward rate agreements 889 596 11 661
916 520 20 113
1999 Principal Net Market Amount Value Derivative Instrument: $’000 $’000
Futures - Australian fixed interest 56 948 (29) Futures - Share price index 454 53 Options - Australian exchange traded 25 076 7 630 Currency forward rate agreements 627 183 45 403
709 661 53 057
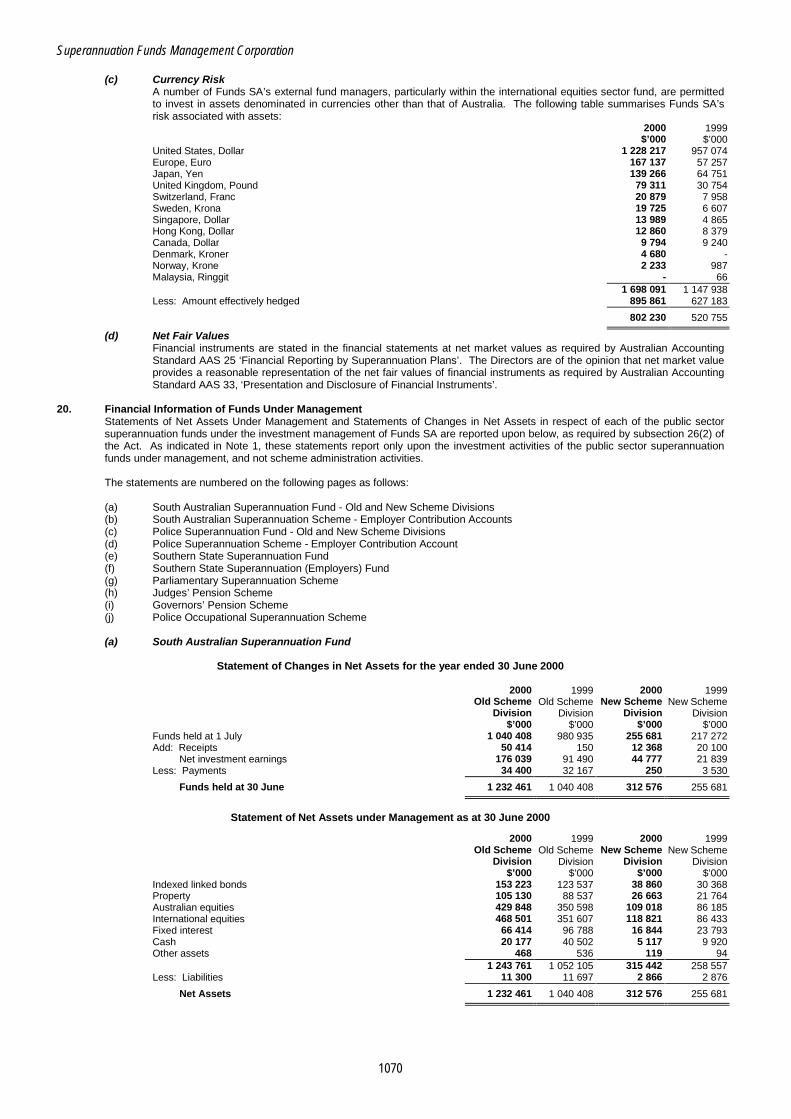
Superannuation Funds Management Corporation
1070
(c) Currency Risk A number of Funds SA’s external fund managers, particularly within the international equities sector fund, are permitted
to invest in assets denominated in currencies other than that of Australia. The following table summarises Funds SA’s risk associated with assets:
2000 1999 $’000 $’000 United States, Dollar 1 228 217 957 074 Europe, Euro 167 137 57 257 Japan, Yen 139 266 64 751 United Kingdom, Pound 79 311 30 754 Switzerland, Franc 20 879 7 958 Sweden, Krona 19 725 6 607 Singapore, Dollar 13 989 4 865 Hong Kong, Dollar 12 860 8 379 Canada, Dollar 9 794 9 240 Denmark, Kroner 4 680 - Norway, Krone 2 233 987 Malaysia, Ringgit - 66 1 698 091 1 147 938 Less: Amount effectively hedged 895 861 627 183
802 230 520 755
(d) Net Fair Values Financial instruments are stated in the financial statements at net market values as required by Australian Accounting Standard AAS 25 ‘Financial Reporting by Superannuation Plans’. The Directors are of the opinion that net market value provides a reasonable representation of the net fair values of financial instruments as required by Australian Accounting Standard AAS 33, ‘Presentation and Disclosure of Financial Instruments’.
20. Financial Information of Funds Under Management
Statements of Net Assets Under Management and Statements of Changes in Net Assets in respect of each of the public sector superannuation funds under the investment management of Funds SA are reported upon below, as required by subsection 26(2) of the Act. As indicated in Note 1, these statements report only upon the investment activities of the public sector superannuation funds under management, and not scheme administration activities. The statements are numbered on the following pages as follows: (a) South Australian Superannuation Fund - Old and New Scheme Divisions (b) South Australian Superannuation Scheme - Employer Contribution Accounts (c) Police Superannuation Fund - Old and New Scheme Divisions (d) Police Superannuation Scheme - Employer Contribution Account (e) Southern State Superannuation Fund (f) Southern State Superannuation (Employers) Fund (g) Parliamentary Superannuation Scheme (h) Judges’ Pension Scheme (i) Governors’ Pension Scheme (j) Police Occupational Superannuation Scheme
(a) South Australian Superannuation Fund
Statement of Changes in Net Assets for the year ended 30 June 2000
2000 1999 2000 1999 Old Scheme Old Scheme New Scheme New Scheme Division Division Division Division $’000 $’000 $’000 $’000 Funds held at 1 July 1 040 408 980 935 255 681 217 272 Add: Receipts 50 414 150 12 368 20 100 Net investment earnings 176 039 91 490 44 777 21 839 Less: Payments 34 400 32 167 250 3 530
Funds held at 30 June 1 232 461 1 040 408 312 576 255 681
Statement of Net Assets under Management as at 30 June 2000
2000 1999 2000 1999 Old Scheme Old Scheme New Scheme New Scheme Division Division Division Division $’000 $’000 $’000 $’000 Indexed linked bonds 153 223 123 537 38 860 30 368 Property 105 130 88 537 26 663 21 764 Australian equities 429 848 350 598 109 018 86 185 International equities 468 501 351 607 118 821 86 433 Fixed interest 66 414 96 788 16 844 23 793 Cash 20 177 40 502 5 117 9 920 Other assets 468 536 119 94 1 243 761 1 052 105 315 442 258 557 Less: Liabilities 11 300 11 697 2 866 2 876
Net Assets 1 232 461 1 040 408 312 576 255 681

Superannuation Funds Management Corporation
1071
(b) South Australian Superannuation Scheme - Employer Contribution Accounts
Statement of Changes in Net Assets for the year ended 30 June 2000 2000 1999 $’000 $’000 Funds held at 1 July 910 036 864 984 Add: Receipts 368 513 53 150 Net investment earnings 264 042 89 102 Less: Payments 191 650 97 200
Funds held at 30 June 1 350 941 910 036
Statement of Net Assets under Management as at 30 June 2000
2000 1999 $’000 $’000 Indexed linked bonds 155 989 108 088 Property 107 027 77 465 Australian equities 437 609 306 755 International equities 476 958 307 637 Fixed interest 67 613 84 684 Cash 20 541 25 921 Adelaide Plaza 96 860 9 408 Other assets 477 283 1 363 074 920 241 Less: Liabilities 12 133 10 205
Net Assets 1 350 941 910 036
(c) Police Superannuation Fund
Statement of Changes in Net Assets for the year ended 30 June 2000
2000 1999 2000 1999 Old Scheme Old Scheme New Scheme New Scheme Division Division Division Division $’000 $’000 $’000 $’000 Funds held at 1 July 205 503 189 548 6 968 5 683 Add: Receipts 350 1 025 650 1 375 Net investment earnings 34 348 17 921 1 243 600 Less: Payments 4 400 2 991 25 690
Funds held at 30 June 235 801 205 503 8 836 6 968
Statement of Net Assets under Management as at 30 June 2000
2000 1999 2000 1999 Old Scheme Old Scheme New Scheme New Scheme Division Division Division Division $’000 $’000 $’000 $’000 Indexed linked bonds 29 315 24 408 1 099 827 Property 20 114 17 494 754 593 Australian equities 82 241 69 271 3 082 2 349 International equities 89 636 69 470 3 359 2 356 Fixed interest 12 707 19 123 476 648 Cash 3 860 7 973 144 270 Other assets 90 75 3 3 237 963 207 814 8 917 7 046 Less: Liabilities 2 162 2 311 81 78
Net Assets 235 801 205 503 8 836 6 968
(d) Police Superannuation Scheme - Employer Contribution Account
Statement of Changes in Net Assets for the year ended 30 June 2000
2000 1999 $’000 $’000 Funds held at 1 July 161 966 141 338 Add: Receipts 3 475 7 350 Net investment earnings 39 052 15 078 Less: Payments 40 000 1 800
Funds held at 30 June 164 493 161 966

Superannuation Funds Management Corporation
1072
(d) Police Superannuation Scheme - Employer Contribution Account (continued)
Statement of Net Assets under Management as at 30 June 2000 2000 1999 $’000 $’000 Indexed linked bonds 18 993 19 237 Property 13 032 13 788 Australian equities 53 284 54 595 International equities 58 075 54 753 Fixed interest 8 233 15 072 Cash 2 501 4 613 Adelaide Plaza 11 794 1 674 Other assets 58 50 165 970 163 782 Less: Liabilities 1 477 1 816
Net Assets 164 493 161 966
(e) Southern State Superannuation Fund
Statement of Changes in Net Assets for the year ended 30 June 2000
2000 1999 $’000 $’000 Funds held at 1 July 55 883 18 556 Add: Receipts 32 509 35 152 Net investment earnings 11 042 2 775 Less: Payments 5 763 600
Funds held at 30 June 93 671 55 883
Statement of Net Assets under Management as at 30 June 2000
2000 1999 $’000 $’000 Indexed linked bonds 8 224 6 637 Property 7 044 4 757 Australian equities 29 582 18 837 International equities 31 834 18 891 Fixed interest 16 140 5 201 Cash 1 573 2 168 Other assets 33 21 94 430 56 512 Less: Liabilities 759 629
Net Assets 93 671 55 883
(f) Southern State Superannuation (Employers) Fund
Statement of Changes in Net Assets for the year ended 30 June 2000
2000 1999 $’000 $’000 Funds held at 1 July 1 092 593 931 329 Add: Receipts 119 526 100 600 Net investment earnings 179 327 95 916 Less: Payments 14 240 35 252
Funds held at 30 June 1 377 206 1 092 593
Statement of Net Assets under Management as at 30 June 2000
2000 1999 $’000 $’000 Indexed linked bonds 128 576 129 771 Property 102 443 93 005 Australian equities 426 595 368 291 International equities 456 432 369 350 Fixed interest 251 117 101 672 Cash 22 626 42 390 Other assets 470 401 1 388 259 1 104 880 Less: Liabilities 11 053 12 287
Net Assets 1 377 206 1 092 593
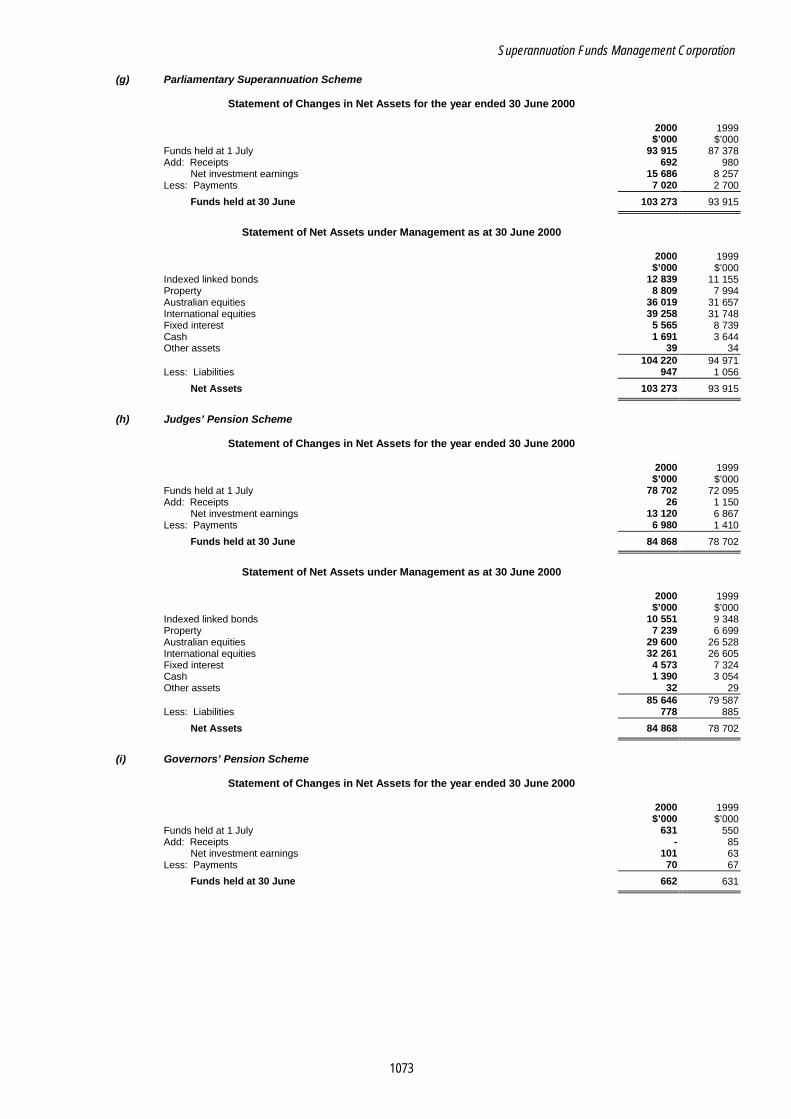
Superannuation Funds Management Corporation
1073
(g) Parliamentary Superannuation Scheme
Statement of Changes in Net Assets for the year ended 30 June 2000 2000 1999 $’000 $’000 Funds held at 1 July 93 915 87 378 Add: Receipts 692 980 Net investment earnings 15 686 8 257 Less: Payments 7 020 2 700
Funds held at 30 June 103 273 93 915
Statement of Net Assets under Management as at 30 June 2000
2000 1999 $’000 $’000 Indexed linked bonds 12 839 11 155 Property 8 809 7 994 Australian equities 36 019 31 657 International equities 39 258 31 748 Fixed interest 5 565 8 739 Cash 1 691 3 644 Other assets 39 34 104 220 94 971 Less: Liabilities 947 1 056
Net Assets 103 273 93 915
(h) Judges’ Pension Scheme
Statement of Changes in Net Assets for the year ended 30 June 2000
2000 1999 $’000 $’000 Funds held at 1 July 78 702 72 095 Add: Receipts 26 1 150 Net investment earnings 13 120 6 867 Less: Payments 6 980 1 410
Funds held at 30 June 84 868 78 702
Statement of Net Assets under Management as at 30 June 2000
2000 1999 $’000 $’000 Indexed linked bonds 10 551 9 348 Property 7 239 6 699 Australian equities 29 600 26 528 International equities 32 261 26 605 Fixed interest 4 573 7 324 Cash 1 390 3 054 Other assets 32 29 85 646 79 587 Less: Liabilities 778 885
Net Assets 84 868 78 702
(i) Governors’ Pension Scheme
Statement of Changes in Net Assets for the year ended 30 June 2000
2000 1999 $’000 $’000 Funds held at 1 July 631 550 Add: Receipts - 85 Net investment earnings 101 63 Less: Payments 70 67
Funds held at 30 June 662 631
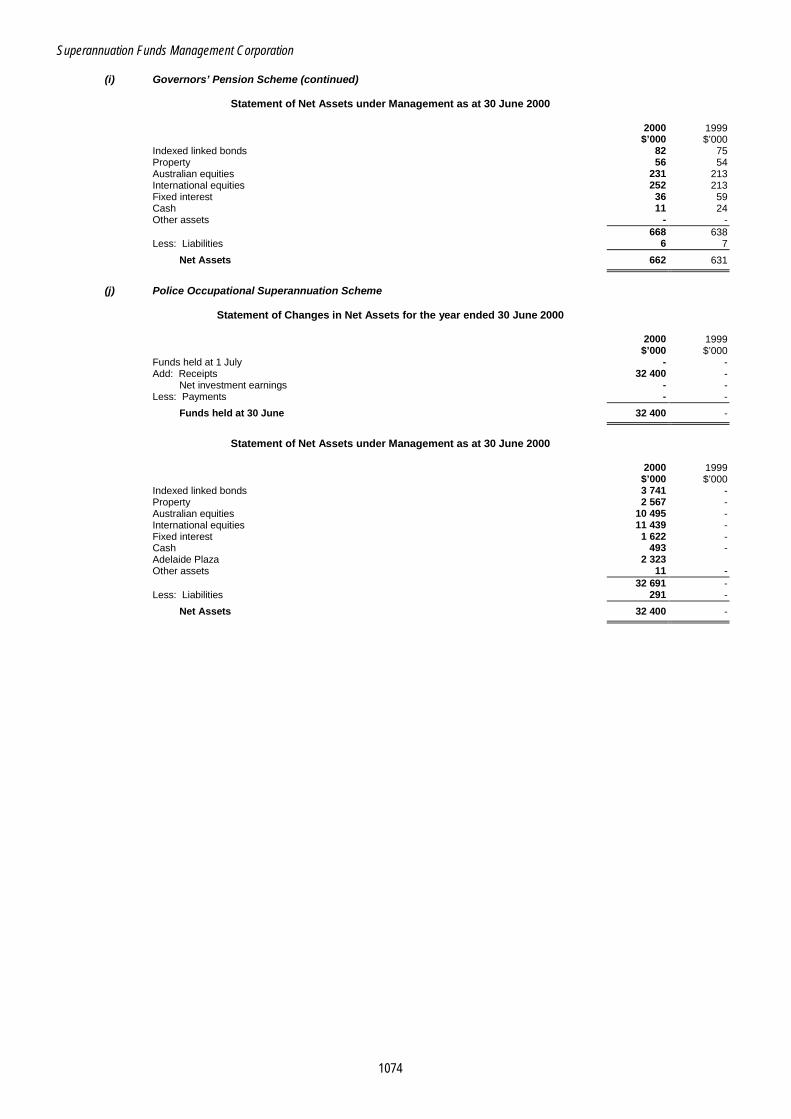
Superannuation Funds Management Corporation
1074
(i) Governors’ Pension Scheme (continued)
Statement of Net Assets under Management as at 30 June 2000 2000 1999 $’000 $’000 Indexed linked bonds 82 75 Property 56 54 Australian equities 231 213 International equities 252 213 Fixed interest 36 59 Cash 11 24 Other assets - - 668 638 Less: Liabilities 6 7
Net Assets 662 631
(j) Police Occupational Superannuation Scheme
Statement of Changes in Net Assets for the year ended 30 June 2000
2000 1999 $’000 $’000 Funds held at 1 July - - Add: Receipts 32 400 - Net investment earnings - - Less: Payments - -
Funds held at 30 June 32 400 -
Statement of Net Assets under Management as at 30 June 2000
2000 1999 $’000 $’000 Indexed linked bonds 3 741 - Property 2 567 - Australian equities 10 495 - International equities 11 439 - Fixed interest 1 622 - Cash 493 -
Adelaide Plaza 2 323 Other assets 11 - 32 691 - Less: Liabilities 291 -
Net Assets 32 400 -
1075
DEPARTMENT OF TREASURY AND FINANCE FUNCTIONAL RESPONSIBILITY AND STRUCTURE The Department is an Administrative Unit established under the Public Sector Management Act 1995. Purpose The Government, through the Treasurer and the Department of Treasury and Finance, undertakes a number of distinct roles including: • setting economic and fiscal policy at the whole-of-government level;
• purchasing goods and services on behalf of taxpayers, whether produced by government providers or by private sector providers;
• owning a range of agencies and enterprises which in turn are providers of a wide variety of goods and services;
• providing a whole range of direct whole-of-government services including asset and liability management, collection of taxes, and insurance and superannuation administration.
In turn the Department is a major service provider by: • collecting tax revenue and implementing taxation legislation through Revenue SA;
• raising and managing the State’s debt funding through the South Australian Government Financing Authority (SAFA)
• administering public sector superannuation through the State Superannuation Office;
• managing and insuring Government risk through the South Australia Government Captive Insurance Corporation (SAICORP).
The Department administers but does not control certain funds on behalf of the Treasurer. These funds are not recorded in the Department’s Operating Statement or Statement of Financial Position, as the Department does not have any discretion to deploy the resources for achievement of its own objectives. Further details are provided in the Schedule of Administered Expenses and Revenues and Note 22 ‘Other Administered Accounts’ appearing in the Department’s financial statements.

Treasury and Finance
1076
Economic Entity and Operational Structure of the Department of Treasury and Finance The organisational structure of the Department and its relationship to the Treasurer and Under Treasurer is reflected in the following diagram:
Treasurer
Under Treasurer
Department of Treasury and
Finance
Risk Management and Performance
Review
State Super Office
SAICORP
SAFA
Economics BranchCorporate Services
Revenue SA Finance Branch
A description of the functions and responsibilities of the respective branches, as they relate to Output Classes, is set out in Note 4 to the Department’s financial statements. CHANGES TO AGENCY ORGANISATIONAL STRUCTURE During the year the Department completed a significant restructure of its organisational and operating structure. This restructure process involved the commitment of significant resources and capitalised on the opportunity to review all systems and processes as a consequence of the introduction of the Goods and Services Taxation legislation. The diagram above highlights the current organisation structure of the Department. In comparing structures between Report years, it is most notable that Finance Branch has undergone significant realignment to achieve the objectives outlined within their Business Plan 2000-01. In particular, Finance Branch now represents the amalgamation of three previously distinct branches, being Financial Management Branch, State Enterprises and Budget Branch. All areas were considered to contribute to the broad aims of the new branch which are to provide strategic whole-of-government services to support government decision making about fiscal strategy, resource allocation and investment and financial resource management. SIGNIFICANT FEATURES • Total Operating Expenses increased by $10.1 million to $58.8 million. • Total Operating Revenues increased by $8.3 million to $32.2 million. • Cash increased by $9.7 million to $16.9 million.

Treasury and Finance
1077
AUDIT MANDATE AND COVERAGE Audit Authority Subsection 31(1)(b) of the Public Finance and Audit Act 1987 provides for the Auditor-General to audit the accounts of the Department in respect of each financial year. Scope of Audit The audit program covered all major financial systems and was directed primarily towards obtaining sufficient evidence to enable an audit opinion to be formed with respect to the financial statements and internal control. The scope of audit and audit approach reflected the dichotomy in the nature of the Department’s operations. The audit addressed those auditable areas which related to the coverage of the Department as an administrative unit and reporting entity in its own right and its role in furnishing the requisite financial information to ensure compliance with the Public Finance and Audit Act 1987. It also covered those areas where the Department assumes a position of influence and direction across the wider public sector and facilitates change processes, flowing from various policies and directives issued by the Treasurer. As a result of this dichotomous aspect of the Department’s operations Audit appraises and monitors wider developments sourced from Department activities/initiatives. This is reflected in such areas as budget reform and whole-of-government financial reporting. Comment on some of these areas appears elsewhere in this section and also in Part A of this Report. As discussed, the Department underwent significant organisational restructure as well as progressed the development and modification of a number of systems in order to further enhance their revised approach to service delivery. Of significant influence to the nature and extent of audit testing during the year was a consultancy in the Corporate Services branch — GST Systems & Process Improvement Project. The project report contained a number of recommendations for systems and process improvement, not only stemming from the introduction of the GST but in relation to improving general processes surrounding the systems themselves. A formal report was prepared in December 1999. Notwithstanding the potential improvement which may emanate from implementation of the recommendations highlighted in that report, there remained a requirement for Audit to review, assess and provide comment as to the adequacy of the internal control environment which operated for the financial year. Audits financial attestation procedures and review of internal controls were extended to the level required to satisfy the audit opinions expressed in respect of the financial statements and controls. An outline of the major areas of audit coverage under the relevant Department branch/responsibility area is provided hereunder: Corporate Services • Expenditure (including purchasing, payment of accounts and salaries and related payments) • GST Implementation - Including whole-of-government perspective • Contract Management • Non-current assets • Revenue/debtors • Payments made under the Treasurer’s line of the Treasurer’s Statement • Central Accounting System • Accounting and financial management reporting • Information services. Finance Branch • Budgetary reform • Budgetary analysis • Whole-of-government reporting • Prudential Debt Management.
Treasury and Finance
1078
Economic • Tax Equivalent Regime. Revenue SA • Financial accounting and recording systems • Emergency Services Levy collection system • IT systems environment. Insurance Services Further commentary in respect of these activities is included in the section of Part B of this Report covering the South Australian Government Captive Insurance Corporation (SAICORP). Superannuation Services • Superannuation policy advice • Administration of superannuation schemes. Further commentary in respect of these activities is included in the section of Part B of this Report covering State Super Office. Electricity Reform and Sales Unit Further commentary in respect of these activities is included in the section of Part B of this Report relating to the unit. Special Deposit Accounts Administered • Financial accounting and reporting Public Finance and Audit Act 1987 • Compliance with appropriate legislation, Treasurer’s Instructions and the accounting standards
promulgated by the professional accounting bodies.
• Verification of the form and content of the Treasurer’s Statements. Refer to the Appendix to Volume III of Part B of this Report.
Audit Communications to Management During the year various letters communicating issues arising from the audit process were forwarded to the Department. The main issues related to public sector financial reporting, debt management and general financial controls. Satisfactory responses were received. Further details relating to general financial controls are contained in ‘Audit Findings and Comments’ and are categorised under the relevant branches and areas of operation. AUDIT FINDINGS AND COMMENTS Commentary on General Financial Controls The overall internal control structure of the Department was assessed as satisfactory. Some instances of lapses in established controls were noted and audit suggestions were made to address those matters as the underlying principles were considered important. The following outlines some of the more salient issues. Audit’s review also included attention to the matter of the Department’s application of the principles of the Financial Management Framework (FMF), which took effect from 1 July 1998. Audit was satisfied that the Department had implemented the core principles, notwithstanding that there were areas of policy development that still required further attention.
Treasury and Finance
1079
Some of the key features that demonstrate the Department’s commitment include: • the development of a corporate governance framework;
• the development of a risk management plan;
• the evaluation of key sub-committees of the Executive Management Group/(EMG) including the Risk Management and Audit Committee;
• progress in development of key policies (eg Corporate IT). Finance Branch Government Management Framework and Budget Reform During 1999-2000, Audit conducted a review into the progress and status of the Government Management Framework (GMF) and Budget Reform agendas. This review follows on from previous work and commentary in my Report over the last two years. This year’s review, however, represented the first time a management letter had been forwarded to the Under Treasurer for formal consideration of the issues raised. In previous years, Audit findings have been reported directly to Parliament in Part A of this Report. Whilst the review was predominantly undertaken through the Department of Treasury and Finance (DTF), Audit considered it was relevant to also receive formal consideration from the Department of the Premier and Cabinet (DPC). This approach recognised that a number of issues raised as a consequence of the audit review transcended beyond just DTF responsibility and mandate, taking on a much wider whole-of-government perspective to financial, budgetary and managerial responsibility and control. Of particular importance, Audit felt that the future role of DTF would be important to optimising the extent to which the initial reform agendas would permeate through to government agencies day-to-day management and operating practices. Audit sought to determine the role DTF should or will take in respect of a number of the reform agendas previously pursued, by the now defunct, GMF Board. During 1999-2000, Audit understood that responsibility for progressing the aims of the GMF passed to the Senior Management Council and central agencies (DPC and DTF). Budget Reform comprised the key, if not sole, initiative of the GMF, that was sponsored centrally. As I commented in my last Report, Audit considered key gaps remained between what had been achieved to date with Budget Reform and the ultimate deliverables and aims of the GMF. In general terms, the key themes and findings from our review can be summarised as follows. Further commentary in relation to this area is made within Part A of this Report under ‘Public Governance: The Government Management Framework and the Budget Process’: • Audit concluded that Government agencies and their constituents, generally would benefit from the
implementation of the GMF (and Budget Reform) agendas reviewed. In my past Reports to Parliament I have commented on the progress with those agendas and where I saw risks to the achievement of the benefits of the agendas. Importantly, it is perceived that there is a high degree of interdependence between critical elements of the reform agenda such that a breakdown in one area could have important ramifications for the approach as a whole - completing the accountability chain was therefore a particular Audit focus.
• Audit understood that DTF and DPC (independently and/or collaboratively) had an important role in leading and inspiring the adoption of various aspects of the reform agendas. The audit findings sought to highlight a range of areas that Audit considered needed to be addressed in order to fulfil that role. In many instances, DTF has a mandate to support a directive approach if necessary. Clearly, however, DTF does not control all aspects of the issues raised. In such areas, in the absence of changing the mandated processes, further emphasis/persistence by DTF and DPC toward influencing change was considered the only course.

Treasury and Finance
1080
Budgetary and Financial Management System (BFMS) My Report last year included commentary on the outcomes from an Audit review of phase one in the development of the BFMS project and its key deliverables. The BFMS is regarded as an integral system to the operations of the Department, has a budgeted estimated cost of $2.9 million (including capital of $2.5 million) and is anticipated to be implemented by way of a staged approach over a three year period. The review identified that a: • risk management strategy, in accordance with the Department’s Risk Management Approach be
developed for future phases of the project. An integrated approach be taken with respect to documentation pertaining to the risk assessment and risk management processes;
• post-project evaluation be undertaken at the end of each of the major project milestones to assess any implications arising from the remainder of the project.
Departmental response to the issues raised was positive in all respects. A follow-up and review of the second phase of the project was undertaken during the year. The approach to this component of the review was principally to ascertain whether the BFMS project was adequately planned and managed so as to achieve specified outputs (objectives) within time and cost constraints. The review took into account the work performed and audit findings from 1998-99 and the interrelationships with the Finance Branch restructure and GMF(Budget Reform initiatives). The review was conducted against the Government’s compliance framework for the management of information technology and systems development projects, internal DTF policies and procedures and better practice principles. Again, Audit noted that some fundamental project management practices were not in place and that their adoption for future development of this and other IT projects would generally be expected to assist in project direction, implementation and management. In particular, Audit outlined that there would have been benefit in: • ensuring that projects had a well developed and integrated business case; analysing project cost and
benefits, timeframes, evaluation alternatives, risk and sensitivity analyses etc;
• ensuring that projects took on a corporate perspective by reporting key milestone progress to the DTF IT Steering Committee rather than only the existing specific project steering committee;
• ensuring sufficient stakeholder involvement is engaged throughout the process;
• that full project costing and budgeting be employed to reflect the total resources employed in IT and system development projects.
Departmental Response The Department acknowledged that a project of this size would normally have a documented business case, however, it thought that the most appropriate risk strategy for implementation of the 1999-2000 budget was to simply revert to a tested and proven solution. In addition, it considered that further agency consultation on the project would continue as the project evolves. In respect of corporate reporting on IT matters, it was considered that the specific Budget and Financial Management Steering committee established for the BFMS implementation would report to the DTF (corporate) IT Steering Committee for time to time on progress. In regard to the interpretation of the issues concerning project costing, budgeting and accounting, the Department has suggested that project costing reflects the nature of work being undertaken by staff and the source of funding, so the project stays within funding limits. In Audit’s view this does not meet the concerns raised with the Department regarding the need to reflect fully the system project costs in budget submissions, reporting and monitoring documentation.
Treasury and Finance
1081
Finance Branch Restructure As highlighted under Changes to Agency Organisation Structure, Finance Branch underwent significant organisational restructure during the year in order to more appropriately align its functions to the delivery of the objectives outlined within their Business Plan 2000-01. In reviewing the progress with the delivery of GMF and Budget Reform agendas it was considered appropriate that the audit review consider both the branch restructure and process re-engineering concepts adopted because of the impact that such changes would have on whole-of-government initiatives sponsored through the Department. In this context, the review highlighted that: • there may have been benefit in preparing a formal business case document for the Business Process
Re-engineering (BPR) and the Finance Branch restructure. This would also provide a document for presentation to EMG for consideration of the wider impacts that such a process would take and set the context for the implementation program;
• there was a need to have integrated some key outcome measures for both the BPR and branch restructure so that the degree of success to which such a change has contributed could have been measured;
• there may have been benefit from applying more discipline in ensuring that the impacts and risks were appropriately identified and addressed for all projects (ie budgetary systems development, GMF and budget reform) operating concurrently with the DTF, BPR and Branch restructure. This would have necessitated an analysis of all processes, including prospective processes, within the branch;
• both the strategic and detail levels of implementing GMF and Budget Reform have created risk for the overall achievement of the aims of those agendas.
Departmental Response The Department considered it had taken an appropriate degree of planning and reporting in relation to their restructure and re-engineering project. DTF contended that, the fact some processes were carried out through meetings, staff consultations and other daily management processes meant that the documentation did not fully reflect the extent or range of activities undertaken. In respect of performance measurement, the Department suggested that there were very clear ideas of which areas of performance were expected to improve as a result of the process. The fact that these are areas were not typically capable of objective measurement reflects the nature of outputs. Whole-of-Government Reporting Currently, the Treasurer and Under Treasurer are responsible for preparation of the whole-of-government financial statements. During the year, on their behalf, the Department of Treasury and Finance formally prepared and presented a complete set of whole-of-government financial statements in accordance with Australian Accounting Standards AAS 31 ‘Financial Reporting by Governments’. These financial statements were for the period ending 30 June 1999. The whole-of-government financial statements are regarded as an essential component of the various information presented on the State’s finances and financial position and are considered useful to management, governing bodies and other users for making and evaluating decisions about the allocation of scarce resources. However, as was commented in my Report last year, there is currently no legislative requirement for the preparation, audit or presentation of the whole-of-government financial statements. Until such time as relevant legislative provisions are passed that will provide for the audit of these statements, I am unable to issue a formal Independent Audit Report containing an audit opinion. Nevertheless, despite the absence of a mandate to issue a formal audit report in respect of such information, it was considered valuable and within the ambit of wider public expectation that such financial information should be required to carry some form of independent commentary regarding their credibility and validity. Consequently, a management letter was forwarded to the Department of Treasury and Finance with a view to providing an
Treasury and Finance
1082
indication of the important financial reporting considerations that would need to be addressed in order to receive an unqualified independent audit report should prospective legislative changes require the need to provide such an audit opinion. These include: • the whole-of-government financial statements have excluded certain entities that Audit consider should
have been included;
• limitations on the scope of our audit process as a consequence of unaudited health data being used to form part of the consolidation process;
• uncertainty as to the carrying values ascribed to plantation forests;
• uncertainty in provisions brought to account for contract losses. Departmental Response The Department’s response was positive and advised that in respect of the absent legislative mandate for audit by the Auditor-General, amendments to the Public Finance and Audit Act 1987 have been scheduled. Further, the Department indicated that it would endeavour to find solutions to all other potential qualification issues. Corporatisation, Commercialisation and Cost Reflective Pricing Past Reports have commented on the areas of corporatisation and commercialisation, primarily in respect of adoption of competitive neutrality principles within the context of corporate and public governance. In last year’s Report I commented on the Department’s recent initiative to review the Public Corporations Act 1993 and its application, as this is the accepted model for corporatisation in South Australia. Public Corporations Act 1993 (PCA) During the year Audit undertook a follow-up review with respect to the major initiatives and associated timetable being progressed by the Department with respect to these areas. The review noted that there remained unresolved issues with respect to the application of the PCA following a review undertaken during 1998-99 which identified: • Lack of systematic and consistent application of PCA across Government.
• Inadequate mechanisms for monitoring subsidiary corporations performance and compliance with PCA requirements.
• Inconsistent quality of Charters and Performance Statements across agencies operating under the PCA.
• Absence of an appropriate monitoring framework for those agencies operating under the PCA whose operations are not predominantly commercial.
• Instances where agencies had not submitted draft Cabinet submissions for the establishment of subsidiaries under the PCA to the Treasurer and Prudential Management Group.
All issues raised concerns regarding the Government’s exposure to business risks associated with Government Business Units (GBUs). Cost Reflective Pricing (CRP) The implications of competitive neutrality principles is achieved not only by application of the PCA but also through implementation of CRP. Audit noted that three GBUs had been identified for implementation of CRP principles during the year, but as the time of writing to the Department, no such CRP Model had yet been developed.
Treasury and Finance
1083
Roles and Responsibilities Audit noted that with respect to the corporatisation and commercialisation issues, following a review of documentation within the 1999-2000 Budget Papers, DAIS appeared to have an interest with respect to Government Business Unit’s (GBUs) in that one of their output strategies for the Government Business Group (GBG) was: • to review ownership options for GBUs; • establish a GBU performance monitoring and improvement framework. Audit therefore sought clarification to ensure the GBG and Finance Branch have clearly delineated and co-ordinated their respective roles and responsibilities in this area. Departmental Response PCA Review and Application The Department indicated that it has since finished development of a database with baseline information about each entity covered by the PCA and the responsibilities of the Treasurer and Minister shareholder under the PCA. Cost Reflective Pricing The Department referred to progress which had been already made in output costing and pricing by the Budget Reforms and State Enterprises areas of Budget Branch, however, reiterated the importance to continue building upon this work. This commitment was further supported by the creation of a specialist Pricing Position to co-ordinate and monitor this work. Further, Finance Branch intends to co-ordinate its activities with the inter-agency National Competition Policy Reference Group and the Office of Government Enterprises to develop detailed procedures for Government Business Enterprises to follow when implementing the CRP Model. Competitive Neutrality Model As a consequence of a Departmental review, recent approval had been received from Cabinet for the gazettal of more than a dozen business activities to be included in the category two list of ‘other significant business activities’. The Department is preparing a plan for implementation of Competitive Neutrality principles Roles and Responsibilities The Department indicated that it recognised the potential for overlap of activities to occur and have since held discussions to ensuring each agency has a clear understanding of their key functions and objectives, in particular, recognising that each entity has a separate but complementary roles. Debt and Asset Management Refer to commentary in Part A of this Report in the section ‘State Debt’. Corporate Services Corporate Information Technology (IT) Structure and Operations In my Report last year, I commented on the structures and processes at a corporate level governing the planning, monitoring and reporting of Information Technology (IT) activities within the Corporate Services area of the Department. As discussed earlier, the Department has undergone significant restructuring during the year. Part of this process was to amalgamate the previous separate functions of administration and information services, which is now managed within corporate services under the ambit of responsibility of the newly appointed Director, Corporate Information. As a consequence of the audit review in this area over the past two years, the positive approach to Audit comments in the past and the recent restructuring of the division, the review this year was limited to a preliminary follow-up of the progress made to date. It is intended to undertake a more comprehensive review upon the settling of organisational changes. In particular, in relation to outstanding matters raised in prior years, the following observations were made:

Treasury and Finance
1084
Corporate IT Strategic Plan The absence of a comprehensive and well structured Corporate IT Strategic Plan was the subject of comment last year. In particular, the absence of a formal planning document which included risk level appraisals, clear alignment with the Department’s business plans; a definition of core systems; and consistent format and structure with respect to tactical and operational planning in relation to systems identified. In response to audit findings the Department indicated that a review and redevelopment of this document was a priority responsibility of the IT Steering Committee. In May this year the Department finalised the preparation of its ‘Information and Communication Services (ICS) Strategic Directions Plan: 2000-03’. This plan is a high level document that served to articulate the approach to Information and Communication Services management throughout the Department. It is intended to link this document to other key management plans throughout the agency and in particular the Corporate ICS Action Plan. However, it will be the Business Unit ICS plans that will drive ICS development actions at a discrete level. Corporate IT Policies and Procedures The issue regarding the structure and basis for approval and communication of corporate IT policies and procedures were the subject of Audit comment over the past two years. The IT Steering Committee has seen the development and approval of some 21 policies: including matters concerning Asset Management, Audit, Contracts, Data Management, Information Technology, Internet, Security. The IT Steering Committee is an advisory committee to the Executive Management Group and the Under Treasurer. Recording and Accounting for Non-Current Assets The Department’s historical difficulty in dealing with the appropriate recording, accounting and reporting of non-current asset information has been the subject of much commentary in past Reports. In particular, the absence of appropriate internal control mechanisms over the Fixed Asset Register and the resulting recording and accounting for non-current assets has significantly contributed to delays and difficulties in the completion of the year-end audit. It is pleasing to report that significant attention and resources have been directed towards improving the general stewardship controls over departmental assets during the year. In particular, Audit noted that the Department had finalised an accounting policy with respect to the capitalisation of IT systems development costs. This is particularly important to the Department in view of certain branches that have considerable investment in IT assets (ie Revenue SA). Notwithstanding this policy development, concerns remain over the absence of sufficient work to begin identification and capitalisation of such assets; both to be consistent with their own accounting policy as well as more completely reflecting the total expenditure invested in such assets within the Department. It is intended to undertake a more comprehensive review of IT development, management, recording and accounting in the 2000-01 financial year. RevenueSA During the year Audit undertook a review of the RevenueSA internal control environment and application of system controls over: • administration of State taxation and levies • Commonwealth Replacement Grants for Business Franchise Fees • compliance and recovery operations • cash receipting and banking • management reporting and budgetary control. In particular, Audit included an in-depth review of the Emergency Services Levy - Fixed Property (ESL) system, comprising review and assessment of the system environment and processing controls as well as certain aspects of systems project management.

Treasury and Finance
1085
The results indicated that while the overall system in internal controls were satisfactory, there were a number of issues which warranted further action by management. The more salient of these issues relate to the need to: • evidence the undertaking of key reconciliations associated with the collection and banking of Land Tax
and ESL revenue;
• complete the Debtor Management functionality of the ESL system in order to improve collection of outstanding debts;
• undertake a review of ESL over-payments on a more regular and timely basis. The Department’s response was positive indicating that since the audit review it had completed or commenced revision to procedures and system modifications and development. Risk Management and Performance Review Internal Audit During the year Internal Audit continued to provide services to the Department and its associated branches. The work performed by Internal Audit is predominantly sourced from external providers and findings emanating from their reviews are reported to the Under Treasurer and Risk Management and Audit Committee. All reports were the subject of formal management responses. Reviews conducted during the year by Internal Audit, specifically relating to the Department included: • GST Implementation • Contingent Liabilities • Financial Management Framework. Audit reviewed the relevant reports and correspondence from the Department, noting actions taken or otherwise proposed by the Department to address issues raised. In accordance with Auditing Standard AUS 602 ‘Using the Work of Another Auditor’ for selected areas of operation, Audit reviewed detailed working papers supporting Internal Audit coverage, where there was a prospect that Audit may rely on the work performed by Internal Audit in determining the extent and nature of Audit procedures to be adopted. CONTROLS OPINION As required by subsection 36(1)(a)(iii) of the Public Finance and Audit Act 1987, the audit of the Department of Treasury and Finance included an assessment of the controls exercised in relation to the receipt, expenditure and investment of money, the acquisition and disposal of property and the incurring of liabilities. The assessment also considered whether those controls were consistent with the prescribed elements of the Financial Management Framework as required by Treasurer’s Instruction 2 ‘Financial Management Policies’. Audit formed the opinion that the controls exercised by the Department of Treasury and Finance in relation to the receipt, expenditure and investment of money; the acquisition and disposal of property; and the incurring of liabilities, were sufficient to provide reasonable assurance that the financial transactions of the organisation were conducted properly and in accordance with the law. INTERPRETATION AND ANALYSIS OF FINANCIAL STATEMENTS Operating Expenses Total operating expenses increased by 21 percent or $10.1 million. The main reason for the increase can be attributed to increased Employee costs of $4.6 million and an increase in Administration and other expenses of $5.0 million. In both instances, the increased costs have principally reflected the additional employees and administrative activity associated with the first full year operations of the Emergency Services (Fixed Property) Levy Unit by Revenue SA. In addition, as a consequence of the restructure of the Department, within Finance Branch was the formation of a new Business Development Unit which also contributed to the increased costs.

Treasury and Finance
1086
Operating Revenues Operating Revenues increased by $8.2 million from the previous year to $32.2 million. Reference to Note 9(a), highlights that the reason for the increase can be attributed to the Emergency Services Levy where the Administration costs are recovered from the Attorney-General’s Department.

Treasury and Finance
1087
Operating Statement for the year ended 30 June 2000 2000 1999 OPERATING EXPENSES: Note $’000 $’000
Employee costs 5(a) 31 041 26 380 Administration and other expenses 19 208 14 256 Accommodation and service costs 5 147 4 436 Depreciation 6 2 325 1 675 Net decrement arising from the revaluation of assets 7 - 903 Payments to consultants 8 1 082 1 072
Total Operating Expenses 58 803 48 722 OPERATING REVENUES:
User charges and fees 9(a) 29 979 22 744 Interest 527 250 Other sundry revenues 9(b) 1 740 1 002
Total Operating Revenues 32 246 23 996 NET COST OF SERVICES 26 557 24 726 REVENUES FROM GOVERNMENT:
Appropriation 33 056 28 570 Total Revenues from Government 33 056 28 570
INCREASE IN NET ASSETS RESULTING FROM OPERATIONS BEFORE ABNORMAL ITEMS 6 499 3 844 Abnormal items 10 - 2 033
INCREASE IN NET ASSETS RESULTING FROM OPERATIONS 6 499 1 811
Statement of Financial Position as at 30 June 2000 2000 1999 CURRENT ASSETS: Note $’000 $’000
Cash 11 16 925 7 228 Receivables 11, 12 1 364 2 597 Other 13 328 869
Total Current Assets 18 617 10 694 NON-CURRENT ASSETS:
Property, plant and equipment 14 6 350 6 518 Total Non-Current Assets 6 350 6 518 Total Assets 24 966 17 212
CURRENT LIABILITIES: Creditors and accruals 11, 15 3 468 3 357 Provision for employee entitlements 5(b) 2 125 1 661
Total Current Liabilities 5 593 5 018 NON-CURRENT LIABILITIES:
Imprest account 11 7 7 Creditors and accruals 11, 15 604 531 Provision for employee entitlements 5(b) 5 016 4 408
Total Non-Current Liabilities 5 627 4 946 Total Liabilities 11 220 9 964
NET ASSETS 13 747 7 248
EQUITY: Accumulated surplus 16 13 747 7 248
TOTAL EQUITY 13 747 7 248
Commitments for Expenditure and Contingent Liabilities 17

Treasury and Finance
1088
Statement of Cash Flows for the year ended 30 June 2000 2000 1999 Inflows Inflows CASH FLOWS FROM OPERATING ACTIVITIES: (Outflows) (Outflows) PAYMENTS: Note $’000 $’000
Employee costs (29 560) (26 011) Administration and other expenses (18 830) (15 278) Accommodation and service costs (4 969) (4 650) Payments to consultants (1 145) (1 128)
Total Payments (54 504) (47 067) RECEIPTS:
User charges and fees 31 256 21 771 Interest 470 258 Other sundry revenues 1 740 781
Total Receipts 33 466 22 810 CASH FLOWS FROM GOVERNMENT:
Appropriation 33 056 28 570 Total Cash Flows from Government 33 056 28 570 Net Cash provided by Operating Activities 18 12 018 4 313
CASH FLOWS FROM INVESTING ACTIVITIES:
Purchase of property, plant and equipment 8 (2 321) (2 576) Net Cash used in Investing Activities (2 321) (2 576)
CASH FLOWS FROM FINANCING ACTIVITIES:
Repayment of borrowings - (13) Net Cash used in Financing Activities - (13)
NET INCREASE IN CASH HELD 9 697 1 724 CASH AT 1 JULY 7 228 5 504
CASH AT 30 JUNE 16 925 7 228
Output Class Schedule of Department’s Expenses and Revenues for the year ended 30 June 2000 Total
Output (Note 4) 1.1 1.2 1.3 2.1 2.2 2.3 2.4 2.5 2000 1999 $’000 $’000 $’000 $’000 $’000 $’000 $’000 $’000 $’000 $’000 EXPENSES:
Employee costs 1 006 6 842 1 506 11 372 3 455 4 269 833 1 758 31 041 26 380 Administration and other expenses 281 3 046 1 600 9 171 1 463 2 587 399 661 19 208 14 256 Accommodation and service costs 163 914 1 073 1 881 363 472 135 146 5 147 4 436 Depreciation 27 352 34 606 403 875 11 17 2 325 1 675 Net decrement (increment) arising from revaluation - - - - - - - - - 903 Payments to consultants 76 449 97 391 18 36 - 15 1 082 1 072
Total 1 553 11 603 4 310 23 421 5 702 8 239 1 378 2 597 58 803 48 722 REVENUES:
User charges and fees 11 1 782 4 248 9 033 4 858 7 178 1 280 1 589 29 979 22 744 Interest 24 144 - 342 - - - 17 527 250 Other sundry revenue 30 728 - 547 100 299 18 18 1 740 1 002 Appropriation 1 128 9 849 - 21 405 - 10 - 664 33 056 28 570
Total 1 193 12 503 4 248 31 327 4 958 7 487 1 298 2 288 65 302 52 566 INCREASE (DECREASE) IN NET ASSETS RESULTING FROM OPERATIONS BEFORE ABNORMAL ITEMS (360) 900 (62) 7 906 (744) (752) (80) (309) 6 499 3 844 Abnormal items - - - - - - - - - 2 033 INCREASE (DECREASE) IN NET ASSETS RESULTING FROM OPERATIONS AFTER ABNORMAL ITEMS (360) 900 (62) 7 906 (744) (752) (80) (309) 6 499 1 811
The allocations to outputs are indicative and are based on broad costing methodologies. In particular, appropriations were not developed on the basis of outputs for 1999-00 and have been allocated on a broad basis.
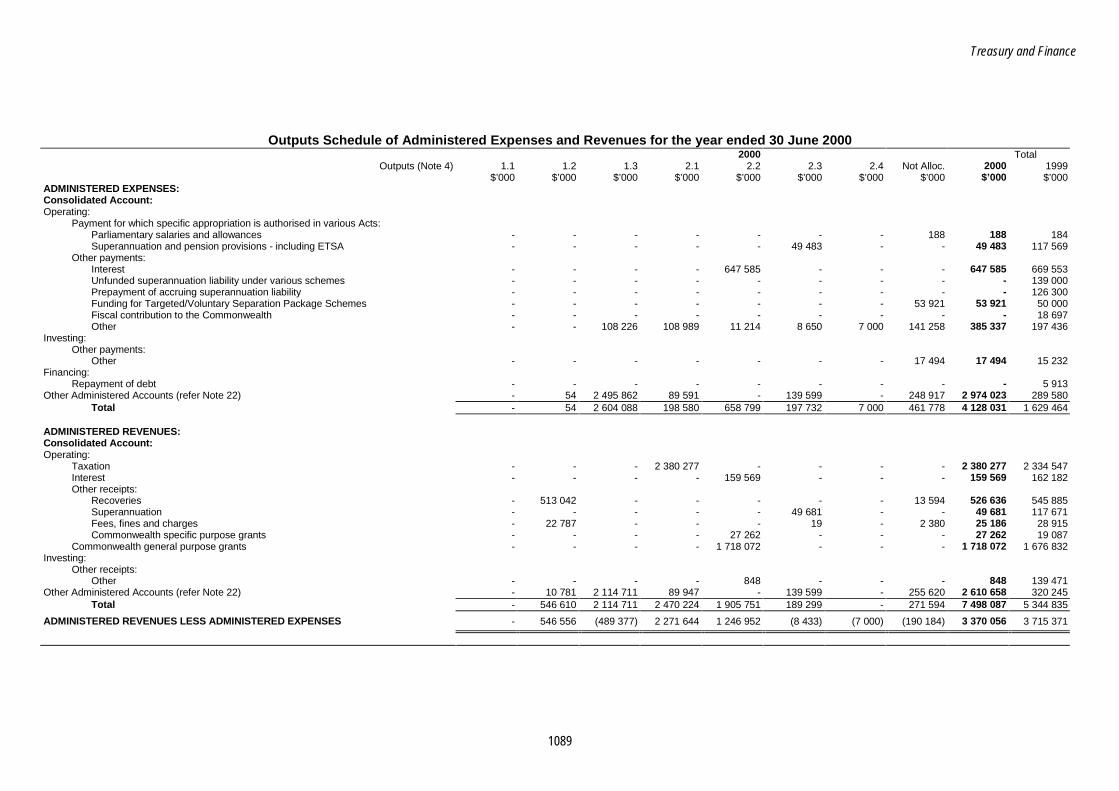
Treasury and Finance
1089
Outputs Schedule of Administered Expenses and Revenues for the year ended 30 June 2000 2000 Total
Outputs (Note 4) 1.1 1.2 1.3 2.1 2.2 2.3 2.4 Not Alloc. 2000 1999 $’000 $’000 $’000 $’000 $’000 $’000 $’000 $’000 $’000 $’000
ADMINISTERED EXPENSES: Consolidated Account: Operating:
Payment for which specific appropriation is authorised in various Acts: Parliamentary salaries and allowances - - - - - - - 188 188 184 Superannuation and pension provisions - including ETSA - - - - - 49 483 - - 49 483 117 569
Other payments: Interest - - - - 647 585 - - - 647 585 669 553 Unfunded superannuation liability under various schemes - - - - - - - - - 139 000 Prepayment of accruing superannuation liability - - - - - - - - - 126 300 Funding for Targeted/Voluntary Separation Package Schemes - - - - - - - 53 921 53 921 50 000 Fiscal contribution to the Commonwealth - - - - - - - - - 18 697 Other - - 108 226 108 989 11 214 8 650 7 000 141 258 385 337 197 436
Investing: Other payments:
Other - - - - - - - 17 494 17 494 15 232 Financing:
Repayment of debt - - - - - - - - - 5 913 Other Administered Accounts (refer Note 22) - 54 2 495 862 89 591 - 139 599 - 248 917 2 974 023 289 580 Total - 54 2 604 088 198 580 658 799 197 732 7 000 461 778 4 128 031 1 629 464 ADMINISTERED REVENUES: Consolidated Account: Operating:
Taxation - - - 2 380 277 - - - - 2 380 277 2 334 547 Interest - - - - 159 569 - - - 159 569 162 182 Other receipts:
Recoveries - 513 042 - - - - - 13 594 526 636 545 885 Superannuation - - - - - 49 681 - - 49 681 117 671 Fees, fines and charges - 22 787 - - - 19 - 2 380 25 186 28 915 Commonwealth specific purpose grants - - - - 27 262 - - - 27 262 19 087
Commonwealth general purpose grants - - - - 1 718 072 - - - 1 718 072 1 676 832 Investing:
Other receipts: Other - - - - 848 - - - 848 139 471
Other Administered Accounts (refer Note 22) - 10 781 2 114 711 89 947 - 139 599 - 255 620 2 610 658 320 245 Total - 546 610 2 114 711 2 470 224 1 905 751 189 299 - 271 594 7 498 087 5 344 835
ADMINISTERED REVENUES LESS ADMINISTERED EXPENSES - 546 556 (489 377) 2 271 644 1 246 952 (8 433) (7 000) (190 184) 3 370 056 3 715 371

Treasury and Finance
1090
NOTES TO AND FORMING PART OF THE FINANCIAL STATEMENTS 1. Departmental Objectives
The Department of Treasury and Finance aims to contribute to three major Outcomes. Associated with each Outcome are a series of Objectives to which the Department makes a significant or sole contribution.
The Outcomes and associated Objectives are as follows:
Improved State Economic Performance • Establish medium to long term economic and fiscal policy to lift the State’s economic performance and strengthen the
State’s finances. • Ensure revenue is raised in an equitable manner, with least cost to economic efficiency, and in ways which are
competitive with other jurisdictions and supportive of economic development. • Ensure a fair and equitable share of Commonwealth funding for the State.
Strengthened State Finances • Ensure sustainable outlays in aggregate over the long term, with no borrowings to meet current expenditure needs. • Maintain and improve the Government’s net worth over time while minimising risk exposure. • Achieve the lowest possible economic cost of outstanding debt consistent with agreed risk tolerances.
Improved Services • Ensure client needs are integrated into the delivery of services. • Ensure sustainable quality superannuation services are available to all public sector employees. • Ensure comprehensive insurance protection of the State’s finances and assets.
To achieve these objectives, Treasury and Finance delivers a number of Outputs for the Government. The Output information is summarised in Note 4.
2. Summary of Significant Accounting Policies
(a) Financial Reporting Framework The financial report is a general purpose financial report.
(b) Basis of Accounting
The accounts have been prepared in accordance with the Treasurer’s Instructions and Accounting Policy Statements promulgated under the provisions of the Public Finance and Audit Act 1987, applicable Australian Accounting Standards and Urgent Issues Group Consensus Views. The accounts are prepared on the accrual basis and in accordance with conventional historical cost principles except where stated.
(c) The Reporting Entity
The financial report encompasses all activities transacted through an interest bearing Special Deposit Account entitled ‘Department of Treasury and Finance Operating Account’ and all other Funds through which the Department controls resources to carry out its functions. The Department’s principal source of funds consists of monies appropriated by Parliament.
Administered Resources The Department administers but does not control, certain resources on behalf of the South Australia Government. It is accountable for the transactions involving those administered resources, but does not have the discretion to deploy the resources for achievement of the Department’s objectives. For these resources, the Department acts only on behalf of the South Australian Government. Administered resources are reported on an accrual basis with the exception of items processed through the Consolidated Account, which are on a cash basis.
Transactions and balances relating to these administered resources are not recognised as Departmental revenues and expenses but are disclosed in the applicable outputs schedules.
(d) User Charges and Fees
User charges and fees controlled by the Department are recognised as revenues. User charges and fees are controlled by the Department where they can be deployed for the achievement of Departmental objectives. Such amounts are not required to be paid to the Consolidated Account or other Funds not controlled by the Department.
User charges and fees collected by the Department but not controlled by it are not recognised as revenues, but are reported as administered revenues in the Outputs Schedule of Administered Expenses and Revenues. Such amounts are required to be paid to the Consolidated Account or other Funds not controlled by the Department.
(e) Appropriations
Appropriations, whether recurrent, capital, special or other, are recognised as revenues when the Department obtains control over the assets comprising the contributions. Control over appropriations is normally obtained upon their receipt.
(f) Non-Current Assets
All non-current assets controlled by the Department are reported in the Statement of Financial Position. The cost method of accounting is used for the initial recording of all acquisitions of assets controlled by the Department. Cost is determined as the fair value of the assets given as consideration plus costs incidental to the acquisition. System development costs are capitalised once all costs associated with the development of the system have been incurred and the system is ready for its intended use.
Assets acquired at no cost, or for nominal consideration, are initially recognised as assets and revenues at their fair value at the date of acquisition.
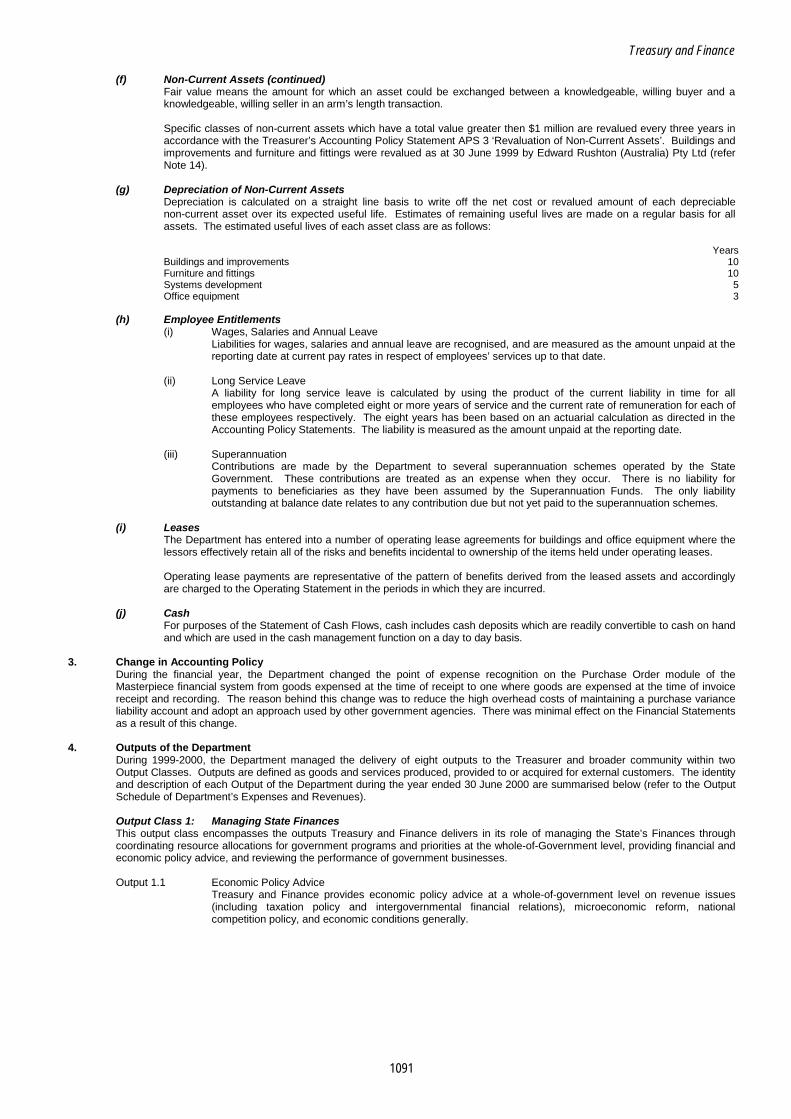
Treasury and Finance
1091
(f) Non-Current Assets (continued) Fair value means the amount for which an asset could be exchanged between a knowledgeable, willing buyer and a knowledgeable, willing seller in an arm’s length transaction.
Specific classes of non-current assets which have a total value greater then $1 million are revalued every three years in accordance with the Treasurer’s Accounting Policy Statement APS 3 ‘Revaluation of Non-Current Assets’. Buildings and improvements and furniture and fittings were revalued as at 30 June 1999 by Edward Rushton (Australia) Pty Ltd (refer Note 14).
(g) Depreciation of Non-Current Assets Depreciation is calculated on a straight line basis to write off the net cost or revalued amount of each depreciable non-current asset over its expected useful life. Estimates of remaining useful lives are made on a regular basis for all assets. The estimated useful lives of each asset class are as follows:
Years Buildings and improvements 10 Furniture and fittings 10 Systems development 5 Office equipment 3
(h) Employee Entitlements
(i) Wages, Salaries and Annual Leave Liabilities for wages, salaries and annual leave are recognised, and are measured as the amount unpaid at the reporting date at current pay rates in respect of employees’ services up to that date.
(ii) Long Service Leave A liability for long service leave is calculated by using the product of the current liability in time for all employees who have completed eight or more years of service and the current rate of remuneration for each of these employees respectively. The eight years has been based on an actuarial calculation as directed in the Accounting Policy Statements. The liability is measured as the amount unpaid at the reporting date.
(iii) Superannuation Contributions are made by the Department to several superannuation schemes operated by the State Government. These contributions are treated as an expense when they occur. There is no liability for payments to beneficiaries as they have been assumed by the Superannuation Funds. The only liability outstanding at balance date relates to any contribution due but not yet paid to the superannuation schemes.
(i) Leases The Department has entered into a number of operating lease agreements for buildings and office equipment where the lessors effectively retain all of the risks and benefits incidental to ownership of the items held under operating leases. Operating lease payments are representative of the pattern of benefits derived from the leased assets and accordingly are charged to the Operating Statement in the periods in which they are incurred.
(j) Cash For purposes of the Statement of Cash Flows, cash includes cash deposits which are readily convertible to cash on hand and which are used in the cash management function on a day to day basis.
3. Change in Accounting Policy During the financial year, the Department changed the point of expense recognition on the Purchase Order module of the Masterpiece financial system from goods expensed at the time of receipt to one where goods are expensed at the time of invoice receipt and recording. The reason behind this change was to reduce the high overhead costs of maintaining a purchase variance liability account and adopt an approach used by other government agencies. There was minimal effect on the Financial Statements as a result of this change.
4. Outputs of the Department During 1999-2000, the Department managed the delivery of eight outputs to the Treasurer and broader community within two Output Classes. Outputs are defined as goods and services produced, provided to or acquired for external customers. The identity and description of each Output of the Department during the year ended 30 June 2000 are summarised below (refer to the Output Schedule of Department’s Expenses and Revenues). Output Class 1: Managing State Finances This output class encompasses the outputs Treasury and Finance delivers in its role of managing the State’s Finances through coordinating resource allocations for government programs and priorities at the whole-of-Government level, providing financial and economic policy advice, and reviewing the performance of government businesses. Output 1.1 Economic Policy Advice
Treasury and Finance provides economic policy advice at a whole-of-government level on revenue issues (including taxation policy and intergovernmental financial relations), microeconomic reform, national competition policy, and economic conditions generally.

Treasury and Finance
1092
Output Class 1: Managing State Finances (continued) Output 1.2: Budget and Financial Management
Treasury and Finance has a central role in managing the State Government finances through the annual Budget Process and the provision of advice on a range of financial and commercial matters relating to government entities. This output includes: management of the State Budget process; provision of policy advice to government on whole-of-government budgetary and financial issues including financial risk management; monitoring and reporting of financial performance; providing commercial advice to government on its consolidated financial position; advice to government on budgetary and structural reform; and facilitation of best practice financial management reforms.
Output 1.3: Electricity Reform
Treasury and Finance undertakes asset reviews and sales with the objectives on minimising business risk and maximising return to the Government, implementing microeconomic reform and achieving ongoing debt reduction. This output covers the implementation of the Government’s objectives for electricity market reforms and asset sales in the context of the national electricity market and the National Competition Policy.
Output Class 2: Financial Service Provision This output class encompasses the outputs Treasury and Finance delivers in its role of providing a range of services to the Government and broader community including asset and liability management, collection of state taxes, and insurance and superannuation administration. Output 2.1: Revenue Collection and Management
The Department, through RevenueSA, provides policy advice on taxation issues and the management of taxation legislation, revenue systems and compliance functions to enable the Government to raise revenue using its taxation powers. This output covers the provision of an efficient and effective tax revenue service that is fair and equitable to maximise its value to the Government and taxpayers.
Output 2.2: Financing Services The Department through the South Australian Government Financing Authority, manages the existing stock of government liabilities and provides certainty of funding to the State. This allows the funding of acquisitions of capital goods necessary for the production of a wide range of public goods and services. This output also covers the provision of cash management and financial risk management advisory services to public organisations.
Output 2.3: Superannuation Services The South Australian Superannuation Board is the statutory body responsible for administering the major superannuation schemes for public sector employees. As a branch of Treasury and Finance, the State Superannuation Office delivers this output by administering the schemes for the Board, under a service level agreement, as well as the superannuation arrangements for parliamentarians, judges and governors. The output also covers the provision of superannuation policy and legislative advice to the Board, the Under Treasurer and the Treasurer.
Output 2.4: Insurance Services The Department is a provider of insurance to other government agencies through the South Australian Government Captive Insurance Corporation (SAICORP). SAICORP insures and reinsures government risks, and provides advice to the Government on issues relating to the insurance and management of those risks. This output ensures the protection of the State’s finances from very large property losses or liability claims at competitive and stable premiums.
Output 2.5: Business Support Services The Department provides a number of specialist services to the Government and external clients. These services include corporate services to clients external to the Department. This output also includes the provision of support staff to, and the management of, the Treasurer’s Office.
Not Allocated Certain items administered by the Department are not allocated to outputs.
5. Employee Entitlements 2000 1999
(a) Employee Costs $’000 $’000 Wages and salaries 24 462 20 850 Superannuation and payroll tax expenses 4 544 3 984 Annual and long service leave expenses 1 072 788 Board fees(1) 127 89 Other employee related expenses 836 669
31 041 26 380
(1) Represents fees paid for member to the SA Superannuation Board, SA Government Financing Authority Advisory
Board and the Board of Directors of SAICORP.
(b) Employee Entitlement Liabilities Current Liabilities:
Annual leave 1 794 1 252 Long service leave 331 409
2 125 1 661
Non-Current Liability:
Long service leave 5 016 4 408

Treasury and Finance
1093
6. Depreciation 2000 1999
Depreciation was charged in respect of: $’000 $’000 Buildings and improvements 6 45 Furniture and fittings 351 467 Office equipment 156 143 Systems development 1 812 1 020
2 325 1 675
7. Net Decrement arising from the Revaluation of Assets
Net decrement: Buildings and improvement - 190 Furniture and fittings - 713
- 903
8. Payments to Consultants 2000 1999
Payments to consultants fell within the following bands: Number of Number of Consultants Consultants
$0 - $10 000 30 23 $10 001 - $50 000 16 26 $50 001 - $100 000 6 5 $200 001 - $250 000 - 1 Over $250 000 1 1
The total payments to the 58 (56) consultants engaged was $1.082 million ($2.066 million). Of this amount $1.082 million ($1.072 million) was met from operating expenses and $nil ($0.994 million) was capitalised.
9. Revenues from Operations 2000 1999
(a) User charges and fees comprised: $’000 $’000 Recoveries from:
Agencies for the provision of Corporate Services 1 578 1 604 South Australian Government Captive Insurance Corporation 1 280 1 315 South Australian Government Financing Authority 4 859 5 555 Superannuation schemes 7 178 8 877 Electricity Reform and Sales Unit Operating Account 4 248 3 478 Emergency services levy 8 300 - Other recoveries for services 2 105 1 524
Land Agents - Enquiry fees 431 391
29 979 22 744
(b) Other sundry revenues comprised: Reimbursement for TVSPs paid 178 - Reimbursement for workers compensation claims 77 127 Other sundry items 1 485 875
1 740 1 002
10. Abnormal Items
The Abnormal Item in 1999 represents the expense which resulted from the retirement of non-current assets with a cost base for depreciation between $2 000 and $5 000 following a change in accounting policy increasing the capitalisation limit. The following reflects the financial effect of the Abnormal Item:
2000 1999 $’000 $’000
Non-Current Assets - Increase in capitalisation limit - 2 033
11. Financial Instruments
The following disclosures have been provided to satisfy the requirements of Australian Accounting Standard AAS 33 ‘Presentation and Disclosure of Financial Instruments’.
(a) Terms, Conditions and Accounting Policies
(i) Financial Assets • Cash on hand is available at call and is recorded at cost. • Receivables are raised for all goods and services provided for which payment has not been received.
Receivables are normally settled within 60 days.
(ii) Financial Liabilities • The imprest account is repayable to the Treasurer and is recorded at the value of the monies
received. • Creditors and accruals are raised for all amounts billed or ordered but unpaid. • Sundry creditors are normally settled within 30 days.
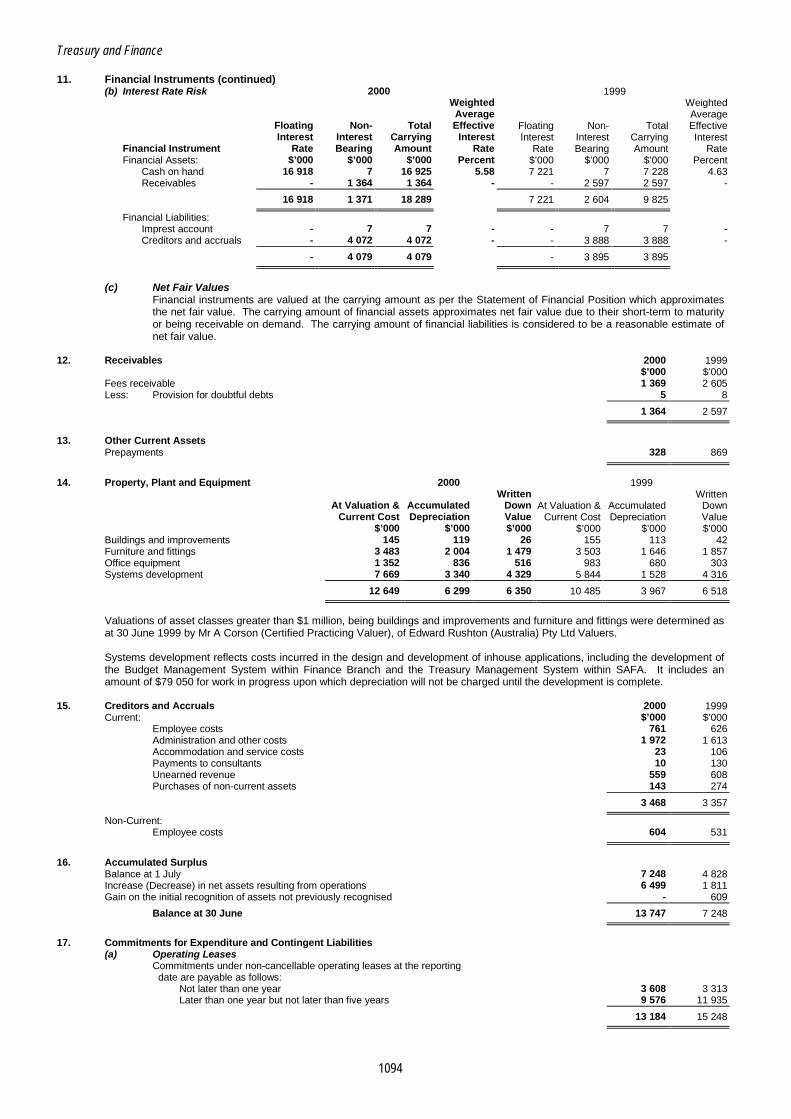
Treasury and Finance
1094
11. Financial Instruments (continued) (b) Interest Rate Risk 2000 1999
Weighted Weighted Average Average Floating Non- Total Effective Floating Non- Total Effective Interest Interest Carrying Interest Interest Interest Carrying Interest
Financial Instrument Rate Bearing Amount Rate Rate Bearing Amount Rate Financial Assets: $’000 $’000 $’000 Percent $’000 $’000 $’000 Percent
Cash on hand 16 918 7 16 925 5.58 7 221 7 7 228 4.63 Receivables - 1 364 1 364 - - 2 597 2 597 -
16 918 1 371 18 289 7 221 2 604 9 825
Financial Liabilities: Imprest account - 7 7 - - 7 7 - Creditors and accruals - 4 072 4 072 - - 3 888 3 888 -
- 4 079 4 079 - 3 895 3 895
(c) Net Fair Values
Financial instruments are valued at the carrying amount as per the Statement of Financial Position which approximates the net fair value. The carrying amount of financial assets approximates net fair value due to their short-term to maturity or being receivable on demand. The carrying amount of financial liabilities is considered to be a reasonable estimate of net fair value.
12. Receivables 2000 1999 $’000 $’000
Fees receivable 1 369 2 605 Less: Provision for doubtful debts 5 8
1 364 2 597
13. Other Current Assets
Prepayments 328 869
14. Property, Plant and Equipment 2000 1999 Written Written At Valuation & Accumulated Down At Valuation & Accumulated Down Current Cost Depreciation Value Current Cost Depreciation Value $’000 $’000 $’000 $’000 $’000 $’000
Buildings and improvements 145 119 26 155 113 42 Furniture and fittings 3 483 2 004 1 479 3 503 1 646 1 857 Office equipment 1 352 836 516 983 680 303 Systems development 7 669 3 340 4 329 5 844 1 528 4 316
12 649 6 299 6 350 10 485 3 967 6 518
Valuations of asset classes greater than $1 million, being buildings and improvements and furniture and fittings were determined as at 30 June 1999 by Mr A Corson (Certified Practicing Valuer), of Edward Rushton (Australia) Pty Ltd Valuers. Systems development reflects costs incurred in the design and development of inhouse applications, including the development of the Budget Management System within Finance Branch and the Treasury Management System within SAFA. It includes an amount of $79 050 for work in progress upon which depreciation will not be charged until the development is complete.
15. Creditors and Accruals 2000 1999 Current: $’000 $’000
Employee costs 761 626 Administration and other costs 1 972 1 613 Accommodation and service costs 23 106 Payments to consultants 10 130 Unearned revenue 559 608 Purchases of non-current assets 143 274
3 468 3 357
Non-Current: Employee costs 604 531
16. Accumulated Surplus
Balance at 1 July 7 248 4 828 Increase (Decrease) in net assets resulting from operations 6 499 1 811 Gain on the initial recognition of assets not previously recognised - 609
Balance at 30 June 13 747 7 248
17. Commitments for Expenditure and Contingent Liabilities
(a) Operating Leases Commitments under non-cancellable operating leases at the reporting date are payable as follows:
Not later than one year 3 608 3 313 Later than one year but not later than five years 9 576 11 935
13 184 15 248

Treasury and Finance
1095
17. Commitments for Expenditure and Contingent Liabilities (continued) 2000 1999
(b) Capital Commitments $’000 $’000 Capital expenditure contracted for at the reporting date but not recognised in the financial report as liabilities:
Office equipment 300 1 695 These expenditures are payable:
Not later than one year 300 1 395 Later than one year but not later than five years - 300
300 1 695
(c) Contingent Liabilities The Department is not aware of any contingent liabilities or claims against the Department not accounted for in the Financial Statements
18. Reconciliation of Net Cash provided by Operating Activities to Net Cost of Service
Net cash provided by operating activities 12 018 4 313 Cash flows from government (33 056) (28 570) Non-cash items:
Depreciation expense (2 325) (1 675) Loss on disposal of fixed assets (43) - Decrement arising from revaluation of assets - (903)
Change in operating assets and liabilities: (Decrease) Increase in receivables (1 233) 1 660 (Decrease) Increase in prepayments (542) 500 (Increase) Decrease in creditors and accruals (305) 773 Increase in provision for employee entitlements (1 071) (824)
Net Cost of Services (26 557) (24 726)
19. Remuneration of Employees 2000 1999
The number of employees whose total employment cost was over $100 000 fell Number of Number of within the following bands: Employees Employees
$100 000 - $109 999 16 11 $110 000 - $119 999 5 5 $120 000 - $129 999 2 4 $130 000 - $139 999 3 1 $140 000 - $149 999 1 1 $150 000 - $159 999 5 - $160 000 - $169 999 - 2 $180 000 - $189 999 1 1 $190 000 - $199 999 1 - $210 000 - $219 999 - 1
34 26
Includes all employees who received remuneration of $100 000 or more during the year. The total remuneration received by these employees for the year was $4.199 million ($3.215 million).
20. Remuneration of Auditors 2000 1999
Amounts received or due and receivable by the auditors with respect to the audit $’000 $’000 of the Department are:
Treasury and Finance 319 307
21. Targeted/Voluntary Separation Package (TVSPs) Schemes 2000 1999 Number of Number of
Employees Employees Number of employees paid TVSPs 3 -
2000 1999
Amount paid to these employees: $’000 $’000 TVSP 178 - Accrued annual and long service leave 72 -
250 -
Amount recovered from the targeted/voluntary separation package schemes special deposit account 178 -
These amounts are included in the financial statement.
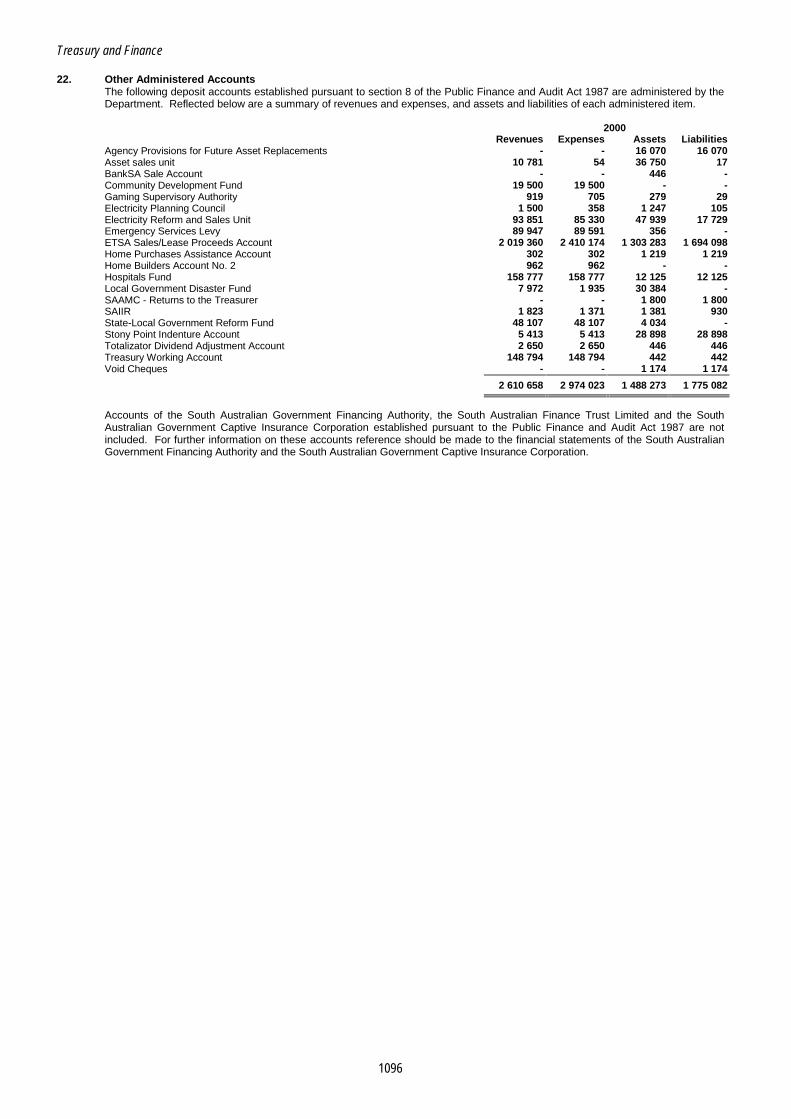
Treasury and Finance
1096
22. Other Administered Accounts The following deposit accounts established pursuant to section 8 of the Public Finance and Audit Act 1987 are administered by the Department. Reflected below are a summary of revenues and expenses, and assets and liabilities of each administered item.
2000 Revenues Expenses Assets Liabilities
Agency Provisions for Future Asset Replacements - - 16 070 16 070 Asset sales unit 10 781 54 36 750 17 BankSA Sale Account - - 446 - Community Development Fund 19 500 19 500 - - Gaming Supervisory Authority 919 705 279 29 Electricity Planning Council 1 500 358 1 247 105 Electricity Reform and Sales Unit 93 851 85 330 47 939 17 729 Emergency Services Levy 89 947 89 591 356 - ETSA Sales/Lease Proceeds Account 2 019 360 2 410 174 1 303 283 1 694 098 Home Purchases Assistance Account 302 302 1 219 1 219 Home Builders Account No. 2 962 962 - - Hospitals Fund 158 777 158 777 12 125 12 125 Local Government Disaster Fund 7 972 1 935 30 384 - SAAMC - Returns to the Treasurer - - 1 800 1 800 SAIIR 1 823 1 371 1 381 930 State-Local Government Reform Fund 48 107 48 107 4 034 - Stony Point Indenture Account 5 413 5 413 28 898 28 898 Totalizator Dividend Adjustment Account 2 650 2 650 446 446 Treasury Working Account 148 794 148 794 442 442 Void Cheques - - 1 174 1 174
2 610 658 2 974 023 1 488 273 1 775 082
Accounts of the South Australian Government Financing Authority, the South Australian Finance Trust Limited and the South Australian Government Captive Insurance Corporation established pursuant to the Public Finance and Audit Act 1987 are not included. For further information on these accounts reference should be made to the financial statements of the South Australian Government Financing Authority and the South Australian Government Captive Insurance Corporation.

1097
MINISTER FOR WATER RESOURCES
PORTFOLIO – WATER RESOURCES INTRODUCTION This section of this Part of the Report contains the financial statements of, and comments concerning, the operations of those agencies under the direction and control of the Minister for Water Resources. The agencies included herein relating to the portfolio of portfolio of Water Resources are: • Catchment Water Management Boards
Patawalonga Catchment Water Management Board Torrens Catchment Water Management Board Northern Adelaide and Barossa Catchment Water Management Board Onkaparinga Catchment Water Management Board River Murray Catchment Water Management Board South East Catchment Water Management Board
• Water Resources - Department for

1098
1099
CATCHMENT WATER MANAGEMENT BOARDS FUNCTIONAL RESPONSIBILITY AND STRUCTURE The objective of the Water Resources Act 1997 (the Act) is to establish a system for the use and management of the water resources of the State:
(a) that ensures that the use and management of those resources sustain the physical, economic and social well being of the people of the State and facilitate the economic development of the State while –
(i) ensuring that those resources are able to meet the reasonably foreseeable
needs of future generations;
(ii) protecting the ecosystems (including their biological diversity) that depend on those resources;
(b) that, by requiring the use of caution and other safeguards, reduces to a minimum the
detrimental effects of that use and management.
As part of that system, the Act provides for the establishment of Catchment Water Management Boards, whose functions include: • preparing and implementing catchment water management plans;
• providing advice to the Minister for Water Resources (the Minister) and councils in relation to the management of water resources in the Board’s area;
• promoting public awareness of the importance of the proper management of water resources in the Board’s area.
Each Board is a separate body corporate and an instrumentality of the Crown, and is subject to the control and direction by the Minister. The Act requires each Board to prepare a draft catchment water management plan in relation to the water resources of it’s catchment area. The Act then requires the Minister to adopt the plan upon consultation with various bodies including: • the Board;
• each of the constituent councils;
• the Local Government Association;
• the South Australian Water Corporation where the Corporation discharges water into a watercourse or lake catchment area of the Board.
In relation to the implementation of catchment water management plans, contributions are made towards the costs of the Board’s operations in the form of levies on: • water licences to take water from prescribed water courses, and/or; • rateable land in the area of the Board.

Catchment Water Management Boards
1100
Establishment of Boards As at 30 June 2000, seven Catchment Water Management Boards have been established for the following catchment areas: • Patawalonga • Torrens • River Murray • Northern Adelaide and Barossa • Onkaparinga • South East • Arid Areas Structure
Minister
Water Resources Act 1997
Patawalonga Catchment Water
Management Board
Torrens Catchment Water
Management Board
Onkaparinga Catchment Water
Management Board
River Murray Catchment Water
Management Board
South East Catchment Water
Management Board
Northern Adelaide and Barossa
Catchment Water Management
Board
Arid Areas Catchment Water
Management Board
For the purpose of administrative support and cost effectiveness, the Patawalonga Catchment Water Management Board and the Torrens Catchment Water Management Board have agreed to share common office accommodation and administrative support systems. These Boards also provide financial services support to the Northern Adelaide and Barossa Catchment Water Management Board. Each Board proclaimed under the Act is a separate reporting entity, as a consequence, separate accounts are required for each Board. The financial statements of five of the seven Boards (ie Patawalonga, Torrens, Northern Adelaide and Barossa, Onkaparinga and the South East) have been included in this Report. The Arid Areas Catchment Water Management Board has not prepared financial statements as the Board was only established in May 2000 and consequently will commence reporting on its operations in 2000-01. Commentary for all Boards audited in 1999-2000 is provided under the heading ‘Audit Findings and Comments’. River Murray Catchment Water Management Board - Status of Financial Statements The financial statements of the River Murray Catchment Water Management Board have not been included in this Report to allow, at the election of the Board, Audit to review certain work performed by the Department for Water Resources that is relevant to the Board’s audit opinion. The financial statements will be included in my Supplementary Report to Parliament. AUDIT MANDATE AND COVERAGE Audit Authority Section 74(2) of the Water Resources Act 1997 specifically provides for the Auditor-General to audit the accounts and financial statements of each Board established under the Act in respect of each financial year.

Catchment Water Management Boards
1101
Scope of Audit The audit program for the Catchment Water Management Boards covered all major financial systems and was directed primarily towards obtaining sufficient evidence to enable an audit opinion to be formed with respect to the financial statements and internal control. During 1999-2000 specific areas of audit attention included: • expenditure, including accounts payable and salaries and wages • investments • revenues, receipts and debtors • general ledger maintenance • financial reporting • computer access controls. Audit Communications to Management Management letters communicating the results of the audit were forwarded to either the Presiding Member or the Chief Executive Officer of the respective Boards. Satisfactory responses were received with respect to the issues raised. AUDIT FINDINGS AND COMMENTS South East Catchment Water Management Board Internal Control Environment The Board is a relatively young organisation and is in the early stages of developing its management, control and accounting procedures and processes. Audit review revealed a number of areas where the financial aspects of the Board’s operations could be improved, particularly in relation to the adequacy of internal controls and the level of documented accounting policies and procedures (further commentary is provided below). Audit suggested that the Board give due consideration to the requirements of the Treasurer’s Instructions and the prescribed principles set out in the Department of Treasury and Finance’s Financial Management Framework when developing its policies, procedures and internal control environment. In response, the Board advised that it will use the Financial Management Framework and the Treasurer’s Instructions in the development of its policies, procedures and internal controls. Water Based Levies A major source of the Board’s revenue is Water Based Levies, which are collected from licensed water holders in accordance with the Water Resources Act 1997. These levies are initially raised, collected and reported through the Water Licensing System operated by the Department for Water Resources (previously the Department for Environment, Heritage and Aboriginal Affairs). During 1998-99, the audit review revealed a number of control weaknesses within the Water Licensing System and associated management processes used to raise, collect and report Water Based Levies. These control weaknesses inhibited the reporting of reliable financial information on levies due and receivable by the Board, which resulted in the qualification of the Board’s 1998-99 financial statements. Audit review during 1999-2000 focussed on following-up the weaknesses identified in the previous year’s audit. Audit review revealed that the Department for Water Resources instigated certain remedial action to address the control and system weaknesses identified by Audit. These efforts included undertaking an internal audit of water licences and reconciling all revenue raised for the 1999-2000 financial year back to validated licence data. In regard to the internal audit, the review was not completed within sufficient time to enable Audit to appropriately assess the work undertaken at the time of this Report. Consequently, the Board’s financial statements have been qualified with respect to revenue and accounts receivable. Further commentary with respect to the limitations that resulted in this qualification is included under the Department for Water Resources section of this Report.

Catchment Water Management Boards
1102
Other Audit Findings and Comments In addition to the matters raised above Audit made observations relating to: • establishing, documenting and approving policies and procedures relating to the tendering of contracts
and the procurement of goods and services;
• the consistency and level of financial management information reported to the Board;
• checking, authorisation and reconciliation procedures relating to various payroll processes;
• the maintenance of information to support the nature and amount of general ledger journals;
• inconsistencies associated with the raising of Land Based Levies;
• authorisation procedures for accounts payable transactions;
• corporate credit card procedures;
• consecutiveness/completeness of the raising of sundry revenue invoices;
• the documentation of debtor follow-up policies and procedures. The Board advised that the suggestions made in relation to the matters raised by Audit would be implemented. Extract from Independent Audit Report
Qualification Water Based Levies due and payable under the Water Resources Act 1997 were initially collected and reported through systems operated by the Department for Water Resources (formerly the Department for Environment, Heritage and Aboriginal Affairs) for remitting to the Board. These systems have limitations with respect to the recording and accuracy of transactions. The Department for Water Resources has undertaken corrective action to address these limitations. At the time of this Report that work was not completed in sufficient time to be assessed by Audit. Due to the unresolved limitations within the systems utilised in relation to Water Based Levies, I am unable to form an opinion on the completeness of revenue and the related accounts receivable balance reported for such levies.
Qualified Audit Opinion
In my opinion, except for the effect on the financial report of the matter referred to in the qualification paragraph, the financial report presents fairly in accordance with the Treasurer’s Instructions promulgated under the provisions of the Public Finance and Audit Act 1987, applicable Australian Accounting Standards and other mandatory professional reporting requirements, the financial position of the South East Catchment Water Management Board as at 30 June 2000, the results of its operations and its cash flows for the year then ended.
River Murray Catchment Water Management Board Internal Control Environment During 1998-99 Audit observed a number of areas where the financial aspects of the Board’s operations could be improved. Most of Audit’s observations related to the adequacy of internal control mechanisms and the level of documented policies and procedures. This year’s audit review revealed that the Board had made some progress with respect to improving certain aspects of its financial management practices and internal control systems. It was considered, however, that there were a number of areas where there was still scope to improve aspects of the Board’s financial operations and internal controls. For instance, the Board had established and approved a Policies and Procedures Manual, however, it was noted that a number of the policies and procedures established were yet to be incorporated into daily practice.

Catchment Water Management Boards
1103
Water Based Levies The findings documented under the South East Catchment Water Management Board also apply to the River Murray Catchment Water Management Board. In relation to the internal audit, the review is expected to be completed in November 2000. At the Board’s election, Audit will undertake a review and assessment of the work performed and associated outcomes once the internal audit has been completed as this work is relevant to the 1999-2000 audit opinion. Further commentary with respect to these control weaknesses is included under the Department for Water Resources section of this Report. Other Audit Findings and Comments In addition to the matters raised above, Audit made observations relating to the: • level of documentation relating to the evaluation, approval and monitoring of projects; • documenting of accounting policies and procedures; • level of information reported to the Board; • maintenance of information to support the nature and amount of general ledger journals; • level of checking over various payroll processes; • acknowledgement of receipt of goods and authorisation of accounts payable transactions; • use of corporate credit cards. The Board advised that the suggestions made in relation to the matters raised above would be implemented. Other Catchment Water Management Boards The audit of the specific areas of financial activity revealed a generally satisfactory standard of accounting, record keeping and internal control. Commentary on Computer Information Systems (CIS) Environment The Boards utilise a small network of personal computers. The audit included a review of the general control environment over these networks and it was concluded that the standard of control was satisfactory. CONTROLS OPINION As required by subsection 36(1)(a)(iii) of the Public Finance and Audit Act 1987, the audit of the Boards included an assessment of the controls exercised in relation to the receipt, expenditure and investment of money, the acquisition and disposal of property and the incurring of liabilities. The assessment also considered whether those controls were consistent with the prescribed elements of the Financial Management Framework as required by Treasurer’s Instruction 2 ‘Financial Management Policies’. Audit formed the opinion that the controls exercised by the Boards in relation to the receipt, expenditure and investment of money; the acquisition and disposal of property; and the incurring of liabilities, except for the matters outlined under ‘Audit Findings and Comments’, were sufficient to provide reasonable assurance that the financial transactions of the organisation were conducted properly and in accordance with the law. INTERPRETATION AND ANALYSIS OF FINANCIAL STATEMENTS Patawalonga Catchment Water Management Board Expenditure Total expenditure decreased by $1.2 million mainly as a result of the completion of the Warraparinga Wetlands during 1998-99.

Catchment Water Management Boards
1104
Northern Adelaide and Barossa Catchment Water Management Board Expenditure Total expenditure increased by $2.5 million. The increased expenditure reflects the implementation of a number of large on-ground works projects including stream rehabilitation and wetland development along Dry Creek, Little Para River and Smith Creek. The Board also acted as project manager for an irrigation water meter replacement program on the Northern Adelaide Plains. Onkaparinga Catchment Water Management Board Expenditure Program expenditures in 2000 were $1.3 million higher than in 1999. Increases were reflected in all program areas with the completion of draft catchment and water allocation plans, additional community involvement grants and the commencement of important on-ground works in the catchment area. South East Catchment Water Management Board Income Total operating revenue increased by $269 000 due mainly to the fact that in 1999-2000 Land Based Levies were raised and received from constituent councils for the first time.

Catchment Water Management Boards
1105
PATAWALONGA CATCHMENT WATER MANAGEMENT BOARD
Operating Statement for the year ended 30 June 2000 2000 1999 INCOME: Note $’000 $’000 Council contributions 2 191 2 148 Interest received 78 70 Grants 330 453 Other income 19 175 Total Income 2 618 2 846 EXPENDITURE: Board and Administration: Salaries and related payments 2.2 109 105 Administration expenses 174 147 Total Board and Administration 283 252 Catchment Plan Programs: Catchment works 899 2 257 Planning 338 296 Community education and involvement 587 494 Total Catchment Plan Programs 1 824 3 047 Total Expenditure 2 107 3 299 OPERATING SURPLUS (DEFICIT) 511 (453)
ACCUMULATED FUNDS AT 30 JUNE 4 111 3 600
Statement of Financial Position as at 30 June 2000 2000 1999 CURRENT ASSETS: Note $’000 $’000 Cash 1 887 1 681 Receivables and prepayments 2.6, 3 140 25 Total Current Assets 2 027 1 706 NON-CURRENT ASSETS: Property, plant and equipment and infrastructure assets 4 2 139 2 064 Work in progress 27 13 Total Non-Current Assets 2 166 2 077 Total Assets 4 193 3 783 CURRENT LIABILITIES: Creditors and accrued expenses 2.7, 5 52 160 Provision - Annual leave 6.1 19 14 Total Current Liabilities 71 174 NON-CURRENT LIABILITIES: Provision - Long service leave 6.2 11 9 Total Non-Current Liabilities 11 9 Total Liabilities 82 183
NET ASSETS 13 4 111 3 600
ACCUMULATED FUNDS: Accumulated funds at 1 July 3 600 4 053 Operating surplus (deficit) 511 (453)
TOTAL ACCUMULATED FUNDS 4 111 3 600
Commitments 7
Statement of Cash Flows for year ended 30 June 2000 2000 1999 Inflows Inflows CASH FLOWS FROM OPERATING ACTIVITIES: (Outflows) (Outflows) Inflows: Note $’000 $’000 Council contributions 2 191 2 148 Interest received 75 72 Grants received 217 436 Other Income 19 175 Outflows: Payments to suppliers, service providers and employees (2 097) (3 105) Net Cash provided by (used in) Operating Activities 12.2 405 (274) CASH FLOWS FROM INVESTING ACTIVITIES: Outflows: Payments for plant and equipment and infrastructure assets (199) (73) Net Cash used in Investing Activities (199) (73) NET INCREASE (DECREASE) IN CASH HELD 206 (347) CASH AT 1 JULY 1 681 2 028
CASH AT 30 JUNE 1 887 1 681

Catchment Water Management Boards Patawalonga Catchment Water Management Board
1106
NOTES TO AND FORMING PART OF THE FINANCIAL STATEMENTS 1. General 1.1 Establishment of the Board
The Patawalonga Catchment Water Management Board (the Board) commenced operation under the Catchment Water Management Act 1995, on 7 May 1995. The Water Resources Act 1997, came into operation on 2 July 1997. This Act subsumed the Catchment Water Management Act 1995 and several other Acts to provide for the management of the State’s water resources. The Act provides for the continuation of the Catchment Water Management Boards established under the Catchment Water Management Act 1995. All of the provisions affecting preparation of the financial statements have been retained in the new legislation. The Board commenced operation under an Initial Plan provided by the Minister for Environment and Heritage. A Catchment Water Management Plan was developed and adopted by the Board in April 1997. This Plan covers proposed activities and programs for the five financial years 1997-98 to 2001-02 inclusive. In accordance with the requirements of the Water Resources Act 1997 a Catchment Plan Annual Review was conducted during 1999-2000. The review amended projected income and expenditure for the year 2000-01 to 2002-03 and was adopted by the Minister for Environment and Heritage.
1.2 Functions of the Board The functions of the Board are: • to prepare a comprehensive Catchment Water Management plan;
• ensure removal of solid or dissolved impurities from all catchment water within the Patawalonga catchment;
• ensure protection of all watercourses, channels and lakes and their ecosystems, within the Patawalonga catchment from degradation by pollutants and exotic plants and animals, and reversal of such degradation where it has occurred;
• determine financial or any other form of assistance to constituent councils, persons carrying on business, community groups or any other persons in an activity in the catchment area that will improve the quality of the catchment water;
• facilitate education of members of the public in relation to the management of catchment water and of catchments.
1.3 Sources of Funding
In accordance with the provisions of the Water Resources Act 1997, the Board received contributions from councils within the proclaimed catchment area. The amount to be contributed by councils was based upon the estimated expenditure of the Board (as contained in the Revised Initial Plan) for the financial year, less the amount of any other funds available to the Board. Councils are required to impose a separate levy on rateable land in the catchment areas of the Board in order to recover the contributions made to the Board. Contributions payable by certain Councils to the Board have been reduced by the amount of rebates or remissions granted by Councils in accordance with section 136 of the Water Resources Act 1997 and Division 5 of Part 1 of the Local Government Act 1999.
1.4 Income Recognition Contributions from constituent councils are recognised as income following determination of the share of each council by the Minister and publication of those amounts in the Government Gazette. Contributions are required to be paid on a quarterly basis to the Board. Interest income is recognised on a proportional basis taking into account the interest rates applicable to the financial assets. Income from grants is recognised following completion of formal documentation between the grantor and the Board. Other income is recognised when the service has been performed. All income relates to the operating activities of the Board.
2. Statement of Significant Accounting Policies 2.1 General
The following is a summary of the significant accounting policies adopted by the Board in the preparation of the Accounts. The general purpose Financial Statements have been prepared in accordance with appropriate Australian Accounting Standards, Treasurer’s Instructions promulgated under the provision of the Public Finance and Audit Act 1987 and the requirements of the Water Resources Act 1997. The accrual accounting basis has been used for the preparation of the Financial Statements whereby items are brought to account as they are earned or incurred and included in the statements for the accounting periods to which they relate. The accounts are prepared on the basis of historical cost and are not adjusted to take account of changing money values or current valuations of non-current assets unless otherwise disclosed in these Notes.

Catchment Water Management Boards
Patawalonga Catchment Water Management Board
1107
2. Statement of Significant Accounting Policies (continued) 2.2 Allocation of Administrative Overheads to Programs
Where appropriate, salaries and overheads have been distributed to a Catchment Plan Program to accurately reflect the cost of these activities. Administration overheads were apportioned on a 50/50 basis between the Patawalonga and Torrens Boards since their establishment. The Torrens Catchment Area was extended to incorporate the remaining parts of the Cities of Port Adelaide Enfield, Charles Sturt and Prospect in May 1998. A shift in the allocation percentages (40/60, Patawalonga and Torrens Boards respectively) commencing 1998-99, was made to reflect the additional activities required of the Torrens programs. The formula used was based upon ratios of levy revenue generated by each Board.
2.3 Non-Current Assets Transfer of Assets No non-current assets were transferred to or received from third parties during the year.
Depreciation Depreciation is provided on a straight line basis to write off the net cost or revalued amount of all property, plant and equipment and infrastructure assets and is calculated to allocate the value of the assets against revenue over their estimated useful lives. Estimates of remaining useful lives are made on a regular basis for all assets, with annual assessments for major items. The expected useful lives are as follows:
Years Display equipment 3 Computer equipment 5 Electrical office plant and equipment 8 Office furniture and fittings 20 Catchment water infrastructure assets 25 Assets costing less than $300 have been included in expenditure in the year of acquisition. 2.4 Employee Entitlements Employer Superannuation
The Board contributed $16 000 ($17 000) in superannuation in respect of its employees for the financial year.
Annual Leave Provision has been made for the unused component of annual leave at balance date. The provision is calculated at nominal amounts based on current salary rates. On-costs have been included in the provision in accordance with Australian Accounting Standard AAS 30 ‘Accounting for Employee Entitlements’.
Sick Leave No provision has been made for sick leave. Sick leave taken by employees is considered to be taken from the current year’s accrual, no liability is to be recognised.
Long Service Leave
The benchmark used for determining long service leave is eight years in accordance with Accounting Policy Statement APS 9 ‘Employee Entitlements’ issued by the Department of Treasury and Finance. The provision includes entitlements for one employee in recognition of prior service with other government departments. On-costs have been included in the component of long service leave that will be taken as leave (55 percent of the liability at June 2000) rather than a lump sum. This calculation is based upon an average percentage supplied by the Department of Treasury and Finance for long service leave that will be taken as a lump sum (45 percent).
2.5 Leases The Board has no financial leases. The Board has entered into operating lease agreements for premises and computer equipment where the lessors effectively retain all of the risks and benefits incidental to ownership of the items held under the operating leases. Lease payments are included as expenditure in equal instalments over the accounting periods covered by the lease terms. Total expenditure on operating leases in 1999-2000 was $21 000 ($23 000).
2.6 Receivables Income receivable on investment of surplus funds is accrued in accordance with the terms and conditions applicable to funds held at Department of Treasury and Finance in a Section 21 Deposit Account.
2.7 Trade and Other Creditors Trade Creditors These amounts represent liabilities for goods and services provided to the Board prior to the end of the financial year and which are unpaid. The amounts are unsecured and are usually paid within 30 days of recognition. Payables and Accrued Expenses These amounts represent unpaid board fees, salaries and direct overheads at balance date.
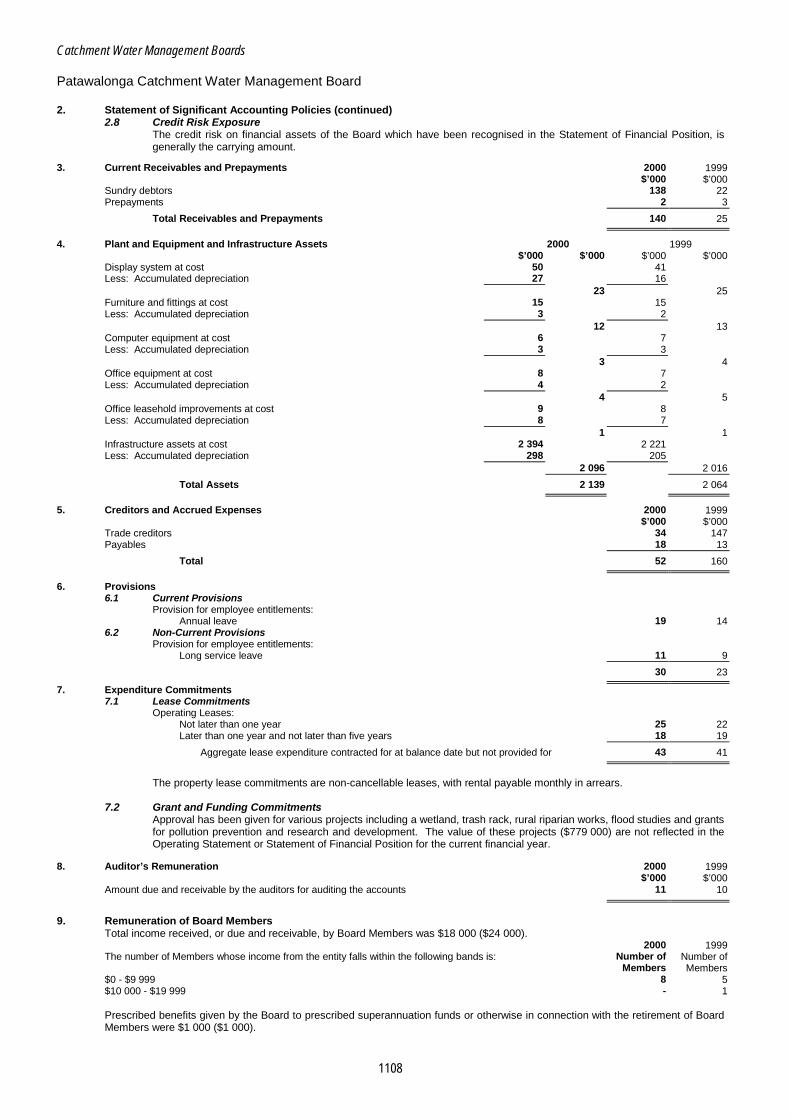
Catchment Water Management Boards Patawalonga Catchment Water Management Board
1108
2. Statement of Significant Accounting Policies (continued) 2.8 Credit Risk Exposure
The credit risk on financial assets of the Board which have been recognised in the Statement of Financial Position, is generally the carrying amount.
3. Current Receivables and Prepayments 2000 1999 $’000 $’000 Sundry debtors 138 22 Prepayments 2 3
Total Receivables and Prepayments 140 25
4. Plant and Equipment and Infrastructure Assets 2000 1999 $’000 $’000 $’000 $’000 Display system at cost 50 41 Less: Accumulated depreciation 27 16 23 25 Furniture and fittings at cost 15 15 Less: Accumulated depreciation 3 2 12 13 Computer equipment at cost 6 7 Less: Accumulated depreciation 3 3 3 4 Office equipment at cost 8 7 Less: Accumulated depreciation 4 2 4 5 Office leasehold improvements at cost 9 8 Less: Accumulated depreciation 8 7 1 1 Infrastructure assets at cost 2 394 2 221 Less: Accumulated depreciation 298 205 2 096 2 016
Total Assets 2 139 2 064
5. Creditors and Accrued Expenses 2000 1999 $’000 $’000 Trade creditors 34 147 Payables 18 13
Total 52 160
6. Provisions 6.1 Current Provisions Provision for employee entitlements: Annual leave 19 14 6.2 Non-Current Provisions Provision for employee entitlements: Long service leave 11 9
30 23
7. Expenditure Commitments 7.1 Lease Commitments Operating Leases: Not later than one year 25 22 Later than one year and not later than five years 18 19
Aggregate lease expenditure contracted for at balance date but not provided for 43 41
The property lease commitments are non-cancellable leases, with rental payable monthly in arrears.
7.2 Grant and Funding Commitments
Approval has been given for various projects including a wetland, trash rack, rural riparian works, flood studies and grants for pollution prevention and research and development. The value of these projects ($779 000) are not reflected in the Operating Statement or Statement of Financial Position for the current financial year.
8. Auditor’s Remuneration 2000 1999 $’000 $’000 Amount due and receivable by the auditors for auditing the accounts 11 10
9. Remuneration of Board Members
Total income received, or due and receivable, by Board Members was $18 000 ($24 000). 2000 1999 The number of Members whose income from the entity falls within the following bands is: Number of Number of Members Members $0 - $9 999 8 5 $10 000 - $19 999 - 1
Prescribed benefits given by the Board to prescribed superannuation funds or otherwise in connection with the retirement of Board Members were $1 000 ($1 000).
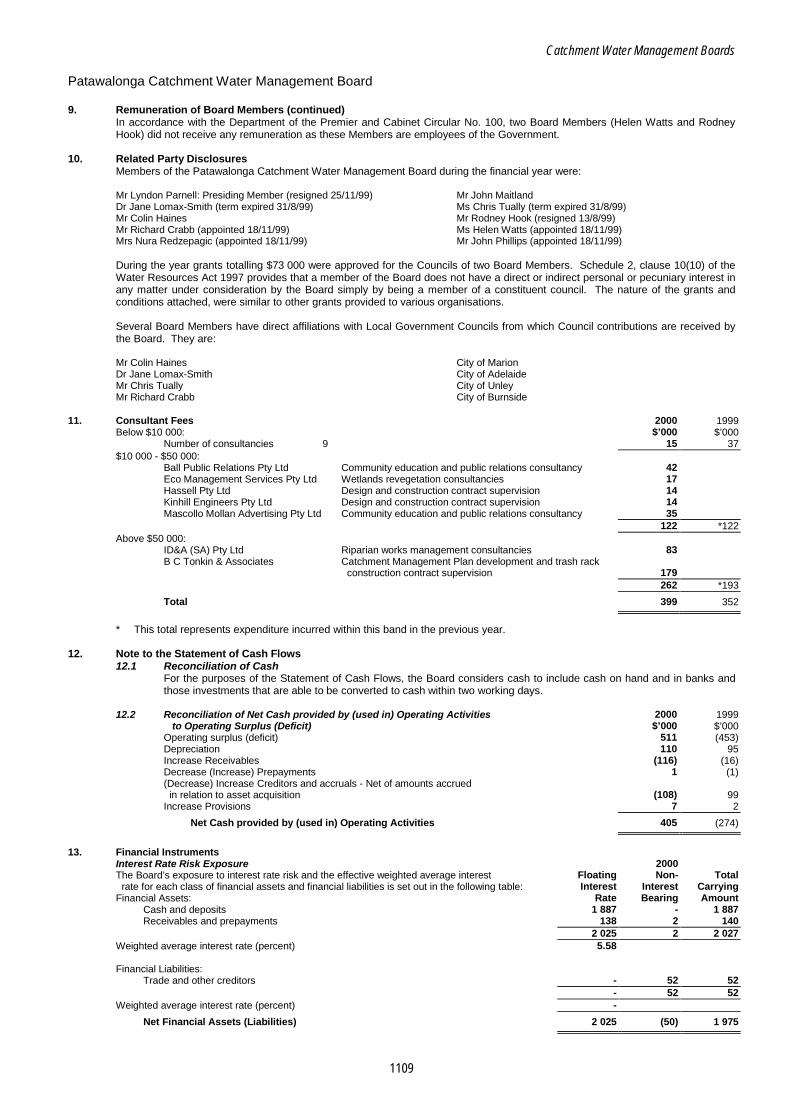
Catchment Water Management Boards
Patawalonga Catchment Water Management Board
1109
9. Remuneration of Board Members (continued) In accordance with the Department of the Premier and Cabinet Circular No. 100, two Board Members (Helen Watts and Rodney Hook) did not receive any remuneration as these Members are employees of the Government.
10. Related Party Disclosures Members of the Patawalonga Catchment Water Management Board during the financial year were: Mr Lyndon Parnell: Presiding Member (resigned 25/11/99) Mr John Maitland Dr Jane Lomax-Smith (term expired 31/8/99) Ms Chris Tually (term expired 31/8/99) Mr Colin Haines Mr Rodney Hook (resigned 13/8/99) Mr Richard Crabb (appointed 18/11/99) Ms Helen Watts (appointed 18/11/99) Mrs Nura Redzepagic (appointed 18/11/99) Mr John Phillips (appointed 18/11/99) During the year grants totalling $73 000 were approved for the Councils of two Board Members. Schedule 2, clause 10(10) of the Water Resources Act 1997 provides that a member of the Board does not have a direct or indirect personal or pecuniary interest in any matter under consideration by the Board simply by being a member of a constituent council. The nature of the grants and conditions attached, were similar to other grants provided to various organisations. Several Board Members have direct affiliations with Local Government Councils from which Council contributions are received by the Board. They are: Mr Colin Haines City of Marion Dr Jane Lomax-Smith City of Adelaide Mr Chris Tually City of Unley Mr Richard Crabb City of Burnside
11. Consultant Fees 2000 1999 Below $10 000: $’000 $’000 Number of consultancies 9 15 37 $10 000 - $50 000: Ball Public Relations Pty Ltd Community education and public relations consultancy 42 Eco Management Services Pty Ltd Wetlands revegetation consultancies 17 Hassell Pty Ltd Design and construction contract supervision 14 Kinhill Engineers Pty Ltd Design and construction contract supervision 14 Mascollo Mollan Advertising Pty Ltd Community education and public relations consultancy 35 122 *122 Above $50 000: ID&A (SA) Pty Ltd Riparian works management consultancies 83 B C Tonkin & Associates Catchment Management Plan development and trash rack construction contract supervision
179
262 *193
Total 399 352
* This total represents expenditure incurred within this band in the previous year. 12. Note to the Statement of Cash Flows
12.1 Reconciliation of Cash For the purposes of the Statement of Cash Flows, the Board considers cash to include cash on hand and in banks and those investments that are able to be converted to cash within two working days.
12.2 Reconciliation of Net Cash provided by (used in) Operating Activities 2000 1999
to Operating Surplus (Deficit) $’000 $’000 Operating surplus (deficit) 511 (453) Depreciation 110 95 Increase Receivables (116) (16) Decrease (Increase) Prepayments 1 (1) (Decrease) Increase Creditors and accruals - Net of amounts accrued in relation to asset acquisition (108) 99 Increase Provisions 7 2
Net Cash provided by (used in) Operating Activities 405 (274)
13. Financial Instruments Interest Rate Risk Exposure 2000 The Board’s exposure to interest rate risk and the effective weighted average interest Floating Non- Total rate for each class of financial assets and financial liabilities is set out in the following table: Interest Interest Carrying Financial Assets: Rate Bearing Amount Cash and deposits 1 887 - 1 887 Receivables and prepayments 138 2 140 2 025 2 2 027 Weighted average interest rate (percent) 5.58 Financial Liabilities: Trade and other creditors - 52 52 - 52 52 Weighted average interest rate (percent) -
Net Financial Assets (Liabilities) 2 025 (50) 1 975

Catchment Water Management Boards Patawalonga Catchment Water Management Board
1110
13. Financial Instruments (continued) 1999 Interest Rate Risk Exposure Floating Non- Total The Board’s exposure to interest rate risk and the effective weighted average interest Interest Interest Carrying rate for each class of financial assets and financial liabilities is set out in the following table: Rate Bearing Amount Financial Assets: $’000 $’000 $’000 Cash and deposits 1 681 - 1 681 Receivables and prepayments 15 20 25 1 686 20 1 706 Weighted average interest rate (percent) 4.95
Financial Liabilities: Trade and other creditors - 160 160 - 160 160 Weighted average interest rate (percent) -
Net Financial Assets (Liabilities) 1 686 140 1 546
Reconciliation of Net Financial Assets to Net Assets 2000 1999 $’000 $’000 Net financial assets as above 1 975 1 546 Non-financial assets and liabilities: Property, plant and equipment 2 166 2 077 Provisions (30) (23)
Net Assets per Statement of Financial Position 4 111 3 600
Net Fair Value of Financial Assets and Liabilities - On-Statement of Financial Position The net fair value of cash and equivalents and non-interest bearing monetary financial assets and financial liabilities of the Board approximates their carrying value.
The carrying amounts and net fair values of financial assets and liabilities 2000 1999 at balance date are: Carrying Net Fair Carrying Net Fair On-Statement of Financial Position Financial Instruments Amount Value Amount Value Financial Assets: $’000 $’000 $’000 $’000 Cash and deposits 1 887 1 887 1 681 1 681 Receivables 140 140 25 25 Financial Liabilities: Trade and other creditors (52) (52) (160) (160)
1 975 1 975 1 546 1 546
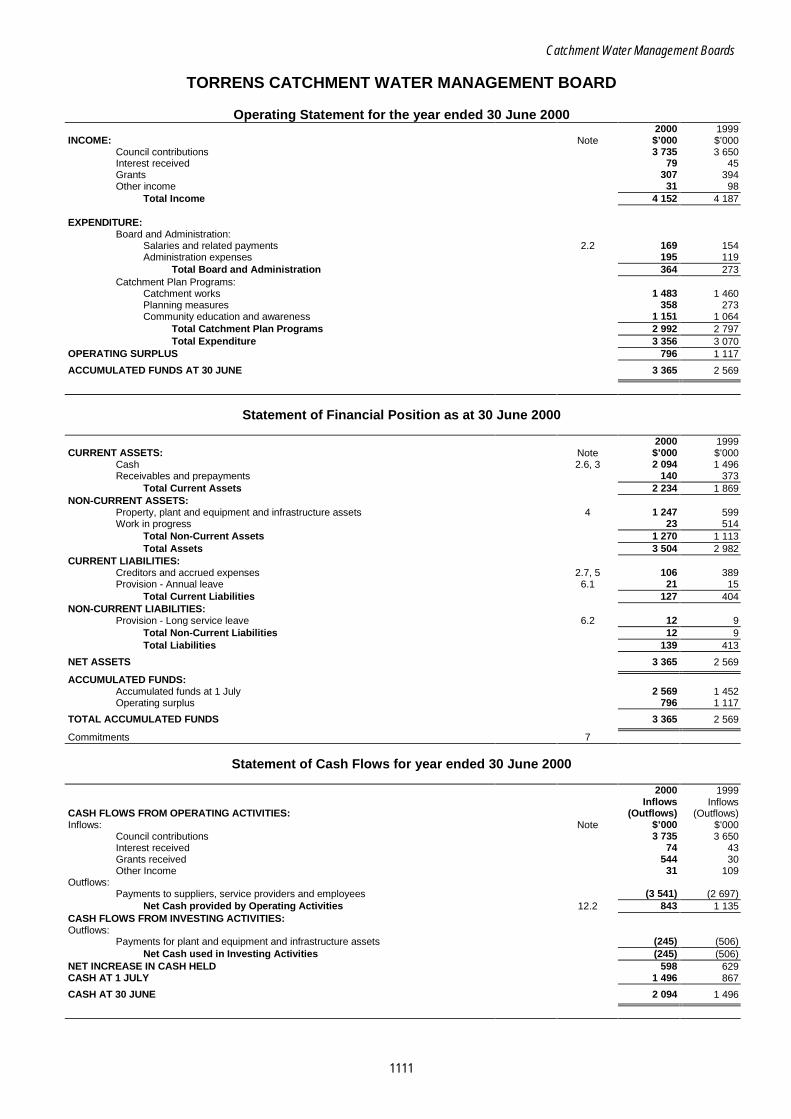
Catchment Water Management Boards
1111
TORRENS CATCHMENT WATER MANAGEMENT BOARD
Operating Statement for the year ended 30 June 2000 2000 1999 INCOME: Note $’000 $’000 Council contributions 3 735 3 650 Interest received 79 45 Grants 307 394 Other income 31 98 Total Income 4 152 4 187 EXPENDITURE: Board and Administration: Salaries and related payments 2.2 169 154 Administration expenses 195 119 Total Board and Administration 364 273 Catchment Plan Programs: Catchment works 1 483 1 460 Planning measures 358 273 Community education and awareness 1 151 1 064 Total Catchment Plan Programs 2 992 2 797 Total Expenditure 3 356 3 070 OPERATING SURPLUS 796 1 117
ACCUMULATED FUNDS AT 30 JUNE 3 365 2 569
Statement of Financial Position as at 30 June 2000 2000 1999 CURRENT ASSETS: Note $’000 $’000 Cash 2.6, 3 2 094 1 496 Receivables and prepayments 140 373 Total Current Assets 2 234 1 869 NON-CURRENT ASSETS: Property, plant and equipment and infrastructure assets 4 1 247 599 Work in progress 23 514 Total Non-Current Assets 1 270 1 113 Total Assets 3 504 2 982 CURRENT LIABILITIES: Creditors and accrued expenses 2.7, 5 106 389 Provision - Annual leave 6.1 21 15 Total Current Liabilities 127 404 NON-CURRENT LIABILITIES: Provision - Long service leave 6.2 12 9 Total Non-Current Liabilities 12 9 Total Liabilities 139 413
NET ASSETS 3 365 2 569
ACCUMULATED FUNDS: Accumulated funds at 1 July 2 569 1 452 Operating surplus 796 1 117
TOTAL ACCUMULATED FUNDS 3 365 2 569
Commitments 7
Statement of Cash Flows for year ended 30 June 2000 2000 1999 Inflows Inflows CASH FLOWS FROM OPERATING ACTIVITIES: (Outflows) (Outflows) Inflows: Note $’000 $’000 Council contributions 3 735 3 650 Interest received 74 43 Grants received 544 30 Other Income 31 109 Outflows: Payments to suppliers, service providers and employees (3 541) (2 697) Net Cash provided by Operating Activities 12.2 843 1 135 CASH FLOWS FROM INVESTING ACTIVITIES: Outflows: Payments for plant and equipment and infrastructure assets (245) (506) Net Cash used in Investing Activities (245) (506) NET INCREASE IN CASH HELD 598 629 CASH AT 1 JULY 1 496 867
CASH AT 30 JUNE 2 094 1 496

Catchment Water Management Boards Torrens Catchment Water Management Board
1112
NOTES TO AND FORMING PART OF THE FINANCIAL STATEMENTS 1. General 1.1 Establishment of the Board
The Torrens Catchment Water Management Board (the Board) commenced operation under the Catchment Water Management Act 1995, on 7 May 1995. The Water Resources Act 1997, came into operation on 2 July 1997. This Act subsumed the Catchment Water Management Act 1995 and several other Acts to provide for the management of the State’s water resources. The Act provides for the continuation of the Catchment Water Management Boards established under the Catchment Water Management Act 1995. All of the provisions affecting preparation of the financial statements have been retained in the new legislation. The Board commenced operation under an Initial Plan provided by the Minister for Environment and Heritage. A Catchment Water Management Plan was developed and adopted by the Board in April 1997. This Plan covers proposed activities and programs for the five financial years 1997-98 to 2001-02 inclusive. In accordance with the requirements of the Water Resources Act 1997 a Catchment Plan Annual Review was conducted during 1999-2000. The review amended projected income and expenditure for the years 2000-01 to 2002-03 and was adopted by the Minister for Environment and Heritage.
1.2 Functions of the Board The functions of the Board are: • to prepare a comprehensive Catchment Water Management plan;
• ensure removal of solid or dissolved impurities from all catchment water within the Torrens catchment;
• ensure protection of all watercourses, channels and lakes and their ecosystems, within the Torrens catchment from, degradation by pollutants and exotic plants and animals, and reversal of such degradation where it has occurred;
• determine financial or any other form of assistance to constituent councils, persons carrying on business, community groups or any other persons in an activity in the catchment area that will improve the quality of the catchment water;
• facilitate education of members of the public in relation to the management of catchment water and of catchments.
1.3 Sources of Funding
In accordance with the provisions of the Water Resources Act 1997, the Board received contributions from councils within the proclaimed catchment area. The amount to be contributed by councils was based upon the estimated expenditure of the Board (as contained in the Revised Initial Plan) for the financial year, less the amount of any other funds available to the Board. Councils are required to impose a separate levy on rateable land in the catchment areas of the Board in order to recover the contributions made to the Board. Contributions payable by certain Councils to the Board have been reduced by the amount of rebates or remissions granted by Councils in accordance with section 136 of the Water Resources Act 1997 and Division 5 of Part 1 of the Local Government Act 1999
1.4 Income Recognition Contributions from constituent councils are recognised as income following determination of the share of each council by the Minister and publication of those amounts in the Government Gazette. Contributions are required to be paid on a quarterly basis to the Board. Interest income is recognised on a proportional basis taking into account the interest rates applicable to the financial assets. Income from grants is recognised following completion of formal documentation between the grantor and the Board. Other income is recognised when the service has been performed. All income relates to the operating activities of the Board.
2. Statement of Significant Accounting Policies 2.1 General
The following is a summary of the significant accounting policies adopted by the Board in the preparation of the Accounts. The general purpose Financial Statements have been prepared in accordance with appropriate Australian Accounting Standards, Treasurer’s Instructions promulgated under the provision of the Public Finance and Audit Act 1987 and the requirements of the Water Resources Act 1997. The accrual accounting basis has been used for the preparation of the Financial Statements whereby items are brought to account as they are earned or incurred and included in the statements for the accounting periods to which they relate. The accounts are prepared on the basis of historical cost and are not adjusted to take account of changing money values or current valuations of non-current assets unless otherwise disclosed in these Notes.

Catchment Water Management Boards
Torrens Catchment Water Management Board
1113
2. Statement of Significant Accounting Policies (continued) 2.2 Allocation of Administrative Overheads to Programs
Where appropriate, salaries and overheads have been distributed to a Catchment Plan Program to accurately reflect the cost of these activities. Administration overheads were apportioned on a 50/50 basis between the Patawalonga and Torrens Boards since their establishment. The Torrens Catchment Area was extended to incorporate the remaining parts of the Cities of Port Adelaide Enfield, Charles Sturt and Prospect in May 1998. A shift in the allocation percentages (40/60, Patawalonga and Torrens Boards respectively) commencing 1998-99, was made to reflect the additional activities required of the Torrens programs. The formula used was based upon ratios of levy revenue generated by each Board.
2.3 Non-Current Assets Transfer of Assets No non-current assets were transferred to or received from third parties during the year.
Depreciation Depreciation is provided on a straight line basis to write off the net cost or revalued amount of all property, plant and equipment and infrastructure assets, and is calculated to allocate the value of the assets against revenue over their estimated useful lives. Estimates of remaining useful lives are made on a regular basis for all assets, with annual assessments for major items. The expected useful lives are as follows:
Years Display equipment 3 Computer equipment 5 Electrical office plant and equipment 8 Office furniture and fittings 20 Catchment water infrastructure assets 25 Assets costing less than $300 have been included in expenditure in the year of acquisition. 2.4 Employee Entitlements Employer Superannuation
The Board contributed $24 000 ($25 000) in superannuation in respect of its employees for the financial year.
Annual Leave Provision has been made for the unused component of annual leave at balance date. The provision is calculated at nominal amounts based on current salary rates. On-costs have been included in the provision in accordance with Australian Accounting Standard AAS 30 ‘Accounting for Employee Entitlements’.
Sick Leave No provision has been made for sick leave. Sick leave taken by employees is considered to be taken from the current year’s accrual, no liability is to be recognised.
Long Service Leave
The benchmark used for determining long service leave is eight years in accordance with Accounting Policy Statement APS 9 ‘Employee Entitlements’ issued by the Department of Treasury and Finance. The provision includes entitlements for one employee in recognition of prior service with other government departments. On-costs have been included in the component of long service leave that will be taken as leave (55 percent of the liability at June 2000) rather than a lump sum. This calculation is based upon an average percentage supplied by the Department of Treasury and Finance for long service leave that will be taken as a lump sum (45 percent).
2.5 Leases The Board has no financial leases. The Board has entered into operating lease agreements for premises and computer equipment where the lessors effectively retain all of the risks and benefits incidental to ownership of the items held under the operating leases. Lease payments are included as expenditure in equal instalments over the accounting periods covered by the lease terms. Total expenditure on operating leases in 1999-2000 was $32 000 ($28 000).
2.6 Receivables Income receivable on investment of surplus funds is accrued in accordance with the terms and conditions applicable to funds held at Department of Treasury and Finance in a Section 21 Deposit Account.
2.7 Trade and Other Creditors Trade Creditors These amounts represent liabilities for goods and services provided to the Board prior to the end of the financial year and which are unpaid. The amounts are unsecured and are usually paid within 30 days of recognition. Payables and Accrued Expenses These amounts represent unpaid board fees, salaries and direct overheads at balance date.

Catchment Water Management Boards Torrens Catchment Water Management Board
1114
2. Statement of Significant Accounting Policies (continued) 2.8 Credit Risk Exposure
The credit risk on financial assets of the Board which have been recognised in the Statement of Financial Position, is generally the carrying amount.
3. Current Receivables and Prepayments 2000 1999 $’000 $’000 Sundry debtors 137 368 Prepayments 3 5
Total Receivables and Prepayments 140 373
4. Plant and Equipment and Infrastructure Assets 2000 1999 $’000 $’000 $’000 $’000 Display system at cost 55 41 Less: Accumulated depreciation 36 24 19 17 Furniture and fittings at cost 16 15 Less: Accumulated depreciation 4 3 12 12 Computer equipment at cost 6 8 Less: Accumulated depreciation 4 5 2 3 Office equipment at cost 8 8 Less: Accumulated depreciation 4 3 4 5 Office leasehold improvements at cost 9 8 Less: Accumulated depreciation 9 7 - 1 Infrastructure assets at cost 1 298 608 Less: Accumulated depreciation 88 47 1 210 561
Total Assets 1 247 599
5. Creditors and Accrued Expenses 2000 1999 $’000 $’000 Trade creditors 92 374 Payables 14 10 Accrued salaries and wages - 5
Total 106 389
6. Provisions 6.1 Current Provisions Provision for employee entitlements: Annual leave 21 15 6.2 Non-Current Provisions Provision for employee entitlements: Long service leave 12 9
33 24
7. Expenditure Commitments 7.1 Lease Commitments Operating Leases: Not later than one year 38 32 Later than one year and not later than five years 26 29
Aggregate lease expenditure contracted for at balance date but not provided for 64 61
The property lease commitments are non-cancellable leases, with rental payable monthly in arrears.
7.2 Grant and Funding Commitments Approvals have been given for various projects including wetlands, trash racks, rural riparian works, flood studies and grants for pollution prevention and research and development. The value of these projects ($1 203 000) is not reflected in the Operating Statement or Statement of Financial Position for the current financial year.
8. Auditor’s Remuneration 2000 1999 $’000 $’000 Amount due and receivable by the auditors for auditing the accounts 11 10
9. Remuneration of Board Members
Total income received, or due and receivable, by Board Members was $35 000 ($35 000).
The number of Members whose income from the entity falls within the following bands is: 2000 1999 Number of Number of Members Members $0 - $9 999 7 7 $20 000 - $29 999 1 1

Catchment Water Management Boards
Torrens Catchment Water Management Board
1115
9. Remuneration of Board Members (continued) Prescribed benefits given by the Board to prescribed superannuation funds or otherwise in connection with the retirement of Board Members were $2 000 ($2 000). In accordance with Department of the Premier and Cabinet Circular No. 100, one Board Member (Cathryn Hamilton) did not received any remuneration as that Member is an employee of the Government.
10. Related Party Disclosures Members of the Torrens Catchment Water Management Board during the financial year were: Mr Jay Hogan: Presiding Member Mr Peter Koukourou Ms Penny Paton Mr John Mundy (term expired 31/8/99) Ms Valerie Bonython Mr Peter Cooper Mr Harry Wierda Mr Geoff Thomas Ms Cathryn Hamilton (appointed 14/10/99) During the year grants totalling $313 000 were approved for the Councils of two Board Members. Schedule 2, clause 10(10) of the Water Resources Act 1997 provides that a member of the Board does not have a direct or indirect personal or pecuniary interest in any matter under consideration by the Board simply by being a member of a constituent council. The nature of the grants and conditions attached, were similar to other grants provided to various organisations. Several Board Members have direct affiliations with Local Government Councils from which Council contributions are received by the Board. They are: Ms Valerie Bonython Adelaide Hills Council Mr Harry Wierda City of Port Adelaide Enfield
11. Consultant Fees 2000 1999 Below $10 000: $’000 $’000 Number of consultancies 9 37 30 $10 000 - $50 000: Crown Solicitor’s Office Legal services 16 Hassell Pty Ltd Design and construction contract supervision 23
Kinhill Pty Ltd Gross pollutant trap investigations and project management 40 Woodward-Clyde Pty Ltd Gross pollutant traps investigations and contract management 14 93 *141 Above $50 000:
Arup Stokes Consulting Pty Ltd Algal bloom action plan consultation 84 Ball Public Relations Pty Ltd Community education and public relations consultancy 60 ID & A (SA) Pty Ltd Riparian works and wetlands contract management 90
Mascollo Mollan Advertising Pty Ltd Community education and public relations consultancy 63 Primary Industries and Resources Pesticide use in Mount Lofty Ranges watershed 81 Tonkin BC & Associates Pty Ltd Catchment Management Plan development and trash rack
construction contract supervision
142
520 *167
Total 650 338
* This total represents expenditure incurred within this band in the previous financial year.
12. Note to the Statement of Cash Flows
12.1 Reconciliation of Cash For the purposes of the Statement of Cash Flows, the Board considers cash to include cash on hand and in banks and those investments that are able to be converted to cash within two working days.
12.2 Reconciliation of Net Cash provided by Operating Activities 2000 1999 to Operating Surplus $’000 $’000
Operating surplus 796 1 117 Depreciation 64 47
Carrying amount of asset 38 - Decrease (Increase) - Receivables 231 (353) Decrease (Increase) - Prepayments 2 (3) (Decrease) Increase - Creditors and accruals - Net of amounts accrued in relation to asset acquisition (297) 324 Increase - Provisions 9 3
Net Cash provided by Operating Activities 843 1 135

Catchment Water Management Boards Torrens Catchment Water Management Board
1116
13. Financial Instruments 2000 Interest Rate Risk Exposure Floating Non- Total The Board’s exposure to interest rate risk and the effective weighted average interest Interest Interest Carrying rate for each class of financial assets and financial liabilities is set out in the following table: Rate Bearing Amount
Financial Assets: $’000 $’000 $’000 Cash and deposits 2 094 - 2 094 Receivables and prepayments 137 3 140
2 231 3 2 234 Weighted average interest rate (percent) 5.58 Financial Liabilities: Trade and other creditors - 106 106
- 106 106 Weighted average interest rate (percent) -
Net Financial Assets (Liabilities) 2 231 (103) 2 128
Interest Rate Risk Exposure 1999 The Board’s exposure to interest rate risk and the effective weighted average interest Floating Non- Total rate for each class of financial assets and financial liabilities is set out in the following table: Interest Interest Carrying Rate Bearing Amount Financial Assets: $’000 $’000 $’000 Cash and deposits 1 496 - 1 496 Receivables and prepayments 368 5 373 1 864 5 1 869 Weighted average interest rate (percent) 4.95
Financial Liabilities: Trade and other creditors - 389 389 - 389 389 Weighted average interest rate (percent) -
Net Financial Assets (Liabilities) 1 864 (384) 1 480
Reconciliation of Net Financial Assets to Net Assets 2000 1999 $’000 $’000 Net financial assets as above 2 128 1 480 Non-financial assets and liabilities: Property, plant and equipment 1 270 1 113 Provisions (33) (24)
Net Assets per Statement of Financial Position 3 365 2 569
Net Fair Value of Financial Assets and Liabilities - On-Statement of Financial Position The net fair value of cash and equivalents and non-interest bearing monetary financial assets and financial liabilities of the Board approximates their carrying value.
The carrying amounts and net fair values of financial assets and liabilities 2000 1999 at balance date are: Carrying Net Fair Carrying Net Fair On-Statement of Financial Position Financial Instruments Amount Value Amount Value Financial Assets: $’000 $’000 $’000 $’000 Cash and deposits 2 094 2 094 1 496 1 496 Receivables 140 140 373 373 Financial Liabilities: Trade and other creditors (106) (106) (389) (389)
2 128 2 128 1 480 1 480

Catchment Water Management Boards
1117
NORTHERN ADELAIDE AND BAROSSA CATCHMENT WATER MANAGEMENT BOARD
Operating Statement for the year ended 30 June 2000 2000 1999 INCOME: Note $’000 $’000 Council contributions 1 700 1 688 Prescribed area levies 395 142 Interest received 63 23 Grants 164 446 Other income 567 9 Total Income 2 889 2 308 EXPENDITURE: Board and Administration: Salaries and related payments 2.2 146 139 Administration expenses 107 96 Total Board and Administration 253 235 Catchment Plan Programs: Catchment works 1 989 162 Planning 676 326 Community education 643 364 Total Catchment Plan Programs 3 308 852 Total Expenditure 3 561 1 087 OPERATING (DEFICIT) SURPLUS (672) 1 221
ACCUMULATED FUNDS AT 30 JUNE 663 1 335
Statement of Financial Position as at 30 June 2000 2000 1999 CURRENT ASSETS: Note $’000 $’000 Cash 570 1 258 Receivables and prepayments 2.6, 3 157 100 Total Current Assets 727 1 358 NON-CURRENT ASSETS: Property, plant and equipment and infrastructure assets 4 51 59 Total Non-Current Assets 51 59 Total Assets 778 1 417 CURRENT LIABILITIES: Creditors and accrued expenses 2.7, 5 102 78 Provisions - Annual leave 6.1 13 4 Total Current Liabilities 115 82 Total Liabilities 115 82
NET ASSETS 13 663 1 335
ACCUMULATED FUNDS: Accumulated funds at 1 July 1 335 114 Operating (deficit) surplus (672) 1 221
TOTAL ACCUMULATED FUNDS 663 1 335
Commitments 7
Statement of Cash Flows for year ended 30 June 2000 2000 1999 Inflows Inflows CASH FLOWS FROM OPERATING ACTIVITIES: (Outflows) (Outflows) Inflows: Note $’000 $’000 Council contributions 1 694 1 688 Prescribed area levies 341 142 Interest received 62 19 Grants received 167 351 Other income 567 17 Outflows: Payments to suppliers, service providers and employees (3 518) (1 029) Net Cash (used in) provided by Operating Activities 12.2 (687) 1 188 CASH FLOWS FROM INVESTING ACTIVITIES: Outflows: Payments for plant and equipment and infrastructure assets (1) (10) Net Cash used in Investing Activities (1) (10) NET (DECREASE) INCREASE IN CASH HELD (688) 1 178 CASH AT 1 JULY 1 258 80
CASH AT 30 JUNE 570 1 258

Catchment Water Management Boards Northern Adelaide and Barossa Catchment Water Management Board
1118
NOTES TO AND FORMING PART OF THE FINANCIAL STATEMENTS 1. General 1.1 Establishment of the Board
The Northern Adelaide and Barossa Catchment Water Management Board (the Board) commenced operation under the Water Resources Act 1997 on 24 December 1997. The Water Resources Act 1997, came into operation on 2 July 1997 and provides for management and sustainable use of the State’s water resources. The Board commenced operation under an Initial Catchment Water Management Plan adopted by the Minister for Environment and Heritage on 20 March 1998. In accordance with the requirements of the Water Resources Act 1997 an Annual Review was conducted during 1999-2000. The review amended projected income and expenditure for the years 2000-01 to 2002-03 and was adopted by the Minister for Environment and Heritage.
1.2 Functions of the Board • To prepare a comprehensive Catchment Water Management Plan.
• Provision of advice to the Minister for Water Resources and constituent councils regarding water resources management in the Board’s area.
• Promotion of public awareness of the importance of proper management and sustainable use of the water resources within the Board’s area.
• Other functions as are assigned to the Board under the Act or any other Act. 1.3 Sources of Funding
In accordance with the provisions of the Water Resources Act 1997, the Board received contributions from councils within the proclaimed catchment area. The amount to be contributed by councils was based upon the estimated expenditure of the Board (as contained in the Initial Plan) for the financial year, less the amount of any other funds available to the Board. Councils are required to impose a separate levy on rateable land in the catchment areas of the Board in order to recover the contributions made to the Board. Contributions payable by certain Councils to the Board have been reduced by the amount of rebates or remissions granted by Councils in accordance with section 136 of the Water Resources Act 1997 and Division 5 of Part 1 of the Local Government Act 1999. In accordance with the provisions of the Act, a water-based levy was declared in the Government Gazette on 10 June 1999. The levy is set at the following rate according to whether the allocation is based on volumetric basis or an irrigation equivalent basis where the water allocation on the licence specified: • as an annual volume in kilolitres for the Northern Adelaide Plains prescribed area, 0.5 cents per kilolitre on use
and 0.5 cents per kilolitre on application; • as an annual volume in kilolitres for the Barossa prescribed area, 1.0 cent per kilolitre on allocation or in
Irrigation Equivalents, $10 or $50 per hectare Irrigation Equivalent (IE) or part thereof, depending on crop type.
The levy is collected by the Department for Water Resources and forwarded to the Board.
1.4 Income Recognition Contributions from constituent councils and levies in relation to the taking of water are recognised as income following determination of the share of each council or declaration of the water based levy by the Minister and publication of those amounts in the Government Gazette. Interest income is recognised on a proportional basis taking into account the interest rates applicable to the financial assets. Income from grants is recognised following completion of formal documentation between the grantor and the Board. Other income is recognised when the service has been performed. All income relates to the operating activities of the Board.
2. Statement of Significant Accounting Policies 2.1 General
The following is a summary of the significant accounting policies adopted by the Board in the preparation of the Accounts. The general purpose Financial Statements have been prepared in accordance with appropriate Australian Accounting Standards, Treasurer’s Instructions promulgated under the provision of the Public Finance and Audit Act 1987 and the requirements of the Water Resources Act 1997. The accrual accounting basis has been used for the preparation of the Financial Statements whereby items are brought to account as they are earned or incurred and included in the statements for the accounting periods to which they relate.
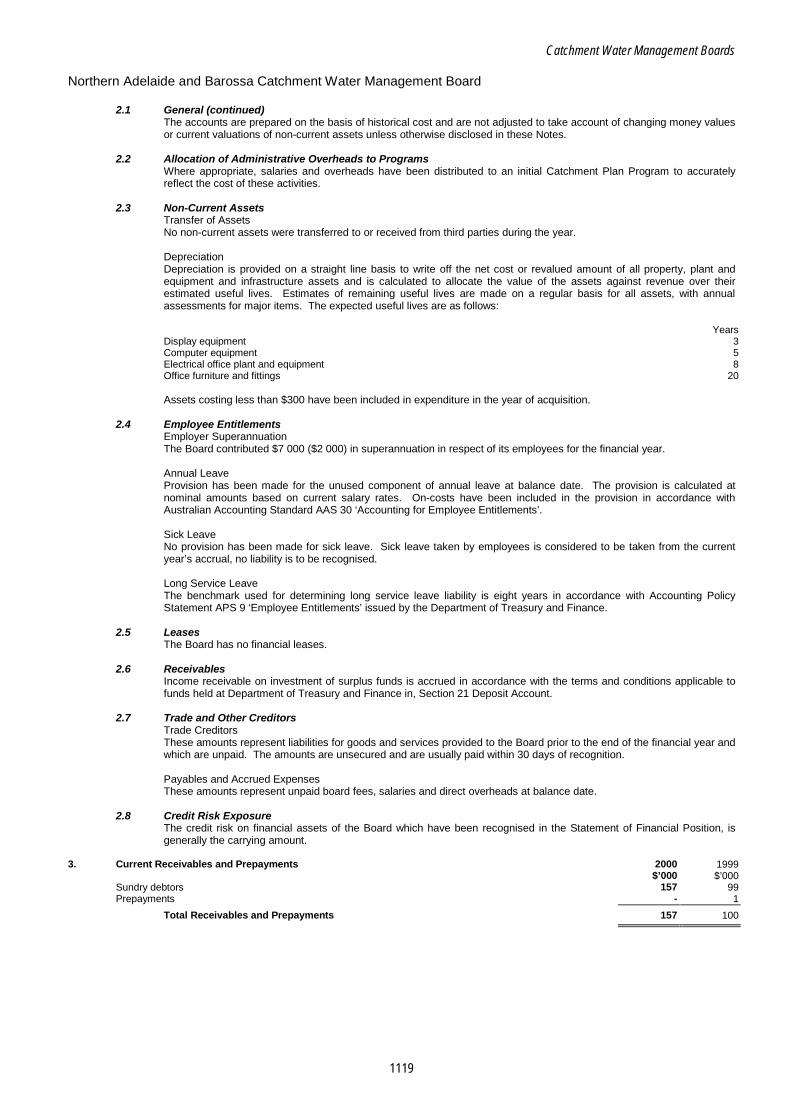
Catchment Water Management Boards
Northern Adelaide and Barossa Catchment Water Management Board
1119
2.1 General (continued) The accounts are prepared on the basis of historical cost and are not adjusted to take account of changing money values or current valuations of non-current assets unless otherwise disclosed in these Notes.
2.2 Allocation of Administrative Overheads to Programs
Where appropriate, salaries and overheads have been distributed to an initial Catchment Plan Program to accurately reflect the cost of these activities.
2.3 Non-Current Assets Transfer of Assets No non-current assets were transferred to or received from third parties during the year.
Depreciation Depreciation is provided on a straight line basis to write off the net cost or revalued amount of all property, plant and equipment and infrastructure assets and is calculated to allocate the value of the assets against revenue over their estimated useful lives. Estimates of remaining useful lives are made on a regular basis for all assets, with annual assessments for major items. The expected useful lives are as follows:
Years Display equipment 3 Computer equipment 5 Electrical office plant and equipment 8 Office furniture and fittings 20 Assets costing less than $300 have been included in expenditure in the year of acquisition. 2.4 Employee Entitlements Employer Superannuation
The Board contributed $7 000 ($2 000) in superannuation in respect of its employees for the financial year.
Annual Leave Provision has been made for the unused component of annual leave at balance date. The provision is calculated at nominal amounts based on current salary rates. On-costs have been included in the provision in accordance with Australian Accounting Standard AAS 30 ‘Accounting for Employee Entitlements’.
Sick Leave No provision has been made for sick leave. Sick leave taken by employees is considered to be taken from the current year’s accrual, no liability is to be recognised.
Long Service Leave
The benchmark used for determining long service leave liability is eight years in accordance with Accounting Policy Statement APS 9 ‘Employee Entitlements’ issued by the Department of Treasury and Finance.
2.5 Leases The Board has no financial leases.
2.6 Receivables Income receivable on investment of surplus funds is accrued in accordance with the terms and conditions applicable to funds held at Department of Treasury and Finance in, Section 21 Deposit Account.
2.7 Trade and Other Creditors Trade Creditors These amounts represent liabilities for goods and services provided to the Board prior to the end of the financial year and which are unpaid. The amounts are unsecured and are usually paid within 30 days of recognition. Payables and Accrued Expenses These amounts represent unpaid board fees, salaries and direct overheads at balance date.
2.8 Credit Risk Exposure The credit risk on financial assets of the Board which have been recognised in the Statement of Financial Position, is generally the carrying amount.
3. Current Receivables and Prepayments 2000 1999 $’000 $’000 Sundry debtors 157 99 Prepayments - 1
Total Receivables and Prepayments 157 100

Catchment Water Management Boards Northern Adelaide and Barossa Catchment Water Management Board
1120
4. Plant and Equipment and Infrastructure Assets 2000 1999 $’000 $’000 $’000 $’000 Display system at cost 3 3 Less: Accumulated depreciation 1 1 2 2 Furniture and fittings at cost 17 17 Less: Accumulated depreciation 2 1 15 16 Computer equipment at cost 19 18 Less: Accumulated depreciation 7 3 12 15 Office equipment at cost 14 12 Less: Accumulated depreciation 3 1 11 11 Office leasehold improvements at cost 20 20 Less: Accumulated depreciation 9 5 11 15
Total Assets 51 59
5. Creditors and Accrued Expenses 2000 1999 $’000 $’000 Trade creditors 97 25 Payables 5 2 Accrued salaries and wages - 51
Total 102 78
6. Provisions 6.1 Current Provisions Provision for employee entitlements: Annual leave 13 4
7. Expenditure Commitments 7.1 Lease Commitments Operating Leases: Not later than one year 18 18 Later than one year and not later than five years 36 50
Aggregate lease expenditure contracted for at balance date but not provided for 54 68
The property lease commitments are non-cancellable leases, with rental payable monthly in arrears.
7.2 Grant and Funding Commitments
Several projects in the form of contracts and grants have been committed at 30 June 2000. The total commitment is $259 000 for projects including watercourse management, pollution prevention grants to Councils, irrigation best practice and best practice in pesticide use. This amount is not reflected in the Operating Statement or Statement of Financial Position for the current financial year.
8. Auditor’s Remuneration 2000 1999 $’000 $’000 Amount due and receivable by the auditors for auditing the accounts 11 10
9. Remuneration of Board Members
Total income received, or due and receivable, by Board Members was $50 000 ($43 000). The number of Members whose income from the entity falls within the following bands is: 2000 1999 Number of Number of Members Members $0 - $9 999 8 8 $20 000 - $29 999 1 1
Board Members Hains and Jackson were employed by constituent councils and elected to have their remuneration paid directly to those councils. Prescribed benefits given by the Board to prescribed superannuation funds or otherwise in connection with the retirement of Board Members were $2 000 ($3 000). In accordance with the Department of the Premier and Cabinet Circular No. 100, two Board Members (Don Bursill and Pam Chapman) did not receive any remuneration as those Members are employees of the Government.
10. Related Party Disclosures Members of the Northern Adelaide and Barossa Catchment Water Management Board during the financial year were: Mr Peter Wall: Presiding Member Mr Stephen Hains Dr Bruce Eastick Mr Tim Jackson Prof. Don Bursill (term ended 24/12/99) Mrs Pat Harbison Mr Nick Pezzaniti Mrs Lesley Purdom Mrs Pam Chapman Mr Ross Dawkins (term started 27/1/00)
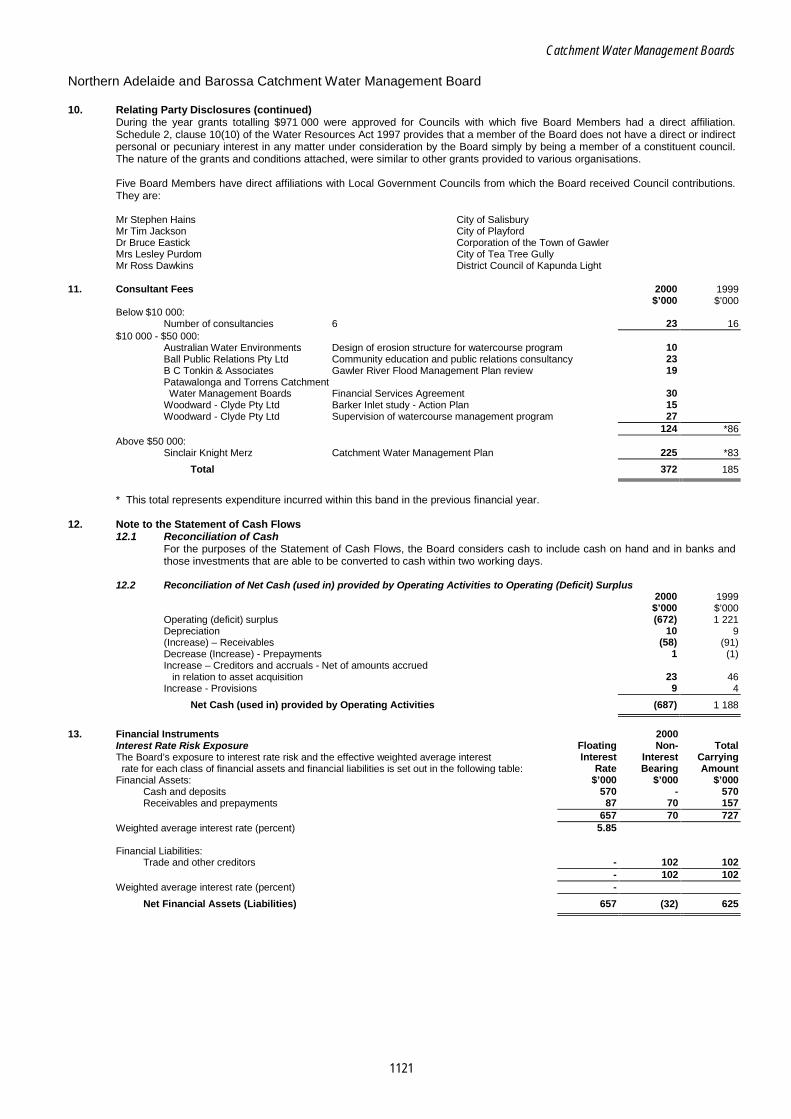
Catchment Water Management Boards
Northern Adelaide and Barossa Catchment Water Management Board
1121
10. Relating Party Disclosures (continued) During the year grants totalling $971 000 were approved for Councils with which five Board Members had a direct affiliation. Schedule 2, clause 10(10) of the Water Resources Act 1997 provides that a member of the Board does not have a direct or indirect personal or pecuniary interest in any matter under consideration by the Board simply by being a member of a constituent council. The nature of the grants and conditions attached, were similar to other grants provided to various organisations. Five Board Members have direct affiliations with Local Government Councils from which the Board received Council contributions. They are: Mr Stephen Hains City of Salisbury Mr Tim Jackson City of Playford Dr Bruce Eastick Corporation of the Town of Gawler Mrs Lesley Purdom City of Tea Tree Gully Mr Ross Dawkins District Council of Kapunda Light
11. Consultant Fees 2000 1999 $’000 $’000 Below $10 000: Number of consultancies 6 23 16 $10 000 - $50 000:
Australian Water Environments Design of erosion structure for watercourse program 10 Ball Public Relations Pty Ltd Community education and public relations consultancy 23 B C Tonkin & Associates Gawler River Flood Management Plan review 19 Patawalonga and Torrens Catchment Water Management Boards Financial Services Agreement
30
Woodward - Clyde Pty Ltd Barker Inlet study - Action Plan 15 Woodward - Clyde Pty Ltd Supervision of watercourse management program 27
124 *86 Above $50 000: Sinclair Knight Merz Catchment Water Management Plan 225 *83
Total 372 185
* This total represents expenditure incurred within this band in the previous financial year. 12. Note to the Statement of Cash Flows
12.1 Reconciliation of Cash For the purposes of the Statement of Cash Flows, the Board considers cash to include cash on hand and in banks and those investments that are able to be converted to cash within two working days.
12.2 Reconciliation of Net Cash (used in) provided by Operating Activities to Operating (Deficit) Surplus 2000 1999 $’000 $’000 Operating (deficit) surplus (672) 1 221 Depreciation 10 9 (Increase) – Receivables (58) (91) Decrease (Increase) - Prepayments 1 (1) Increase – Creditors and accruals - Net of amounts accrued in relation to asset acquisition 23 46 Increase - Provisions 9 4
Net Cash (used in) provided by Operating Activities (687) 1 188
13. Financial Instruments 2000 Interest Rate Risk Exposure Floating Non- Total The Board’s exposure to interest rate risk and the effective weighted average interest Interest Interest Carrying rate for each class of financial assets and financial liabilities is set out in the following table: Rate Bearing Amount Financial Assets: $’000 $’000 $’000 Cash and deposits 570 - 570 Receivables and prepayments 87 70 157 657 70 727 Weighted average interest rate (percent) 5.85 Financial Liabilities: Trade and other creditors - 102 102 - 102 102 Weighted average interest rate (percent) -
Net Financial Assets (Liabilities) 657 (32) 625

Catchment Water Management Boards Northern Adelaide and Barossa Catchment Water Management Board
1122
Interest Rate Risk Exposure (continued) 1999 The Board’s exposure to interest rate risk and the effective weighted average interest rate Floating Non- Total for each class of financial assets and financial liabilities is set out in the following table: Interest Interest Carrying Rate Bearing Amount Financial Assets: $’000 $’000 $’000 Cash and deposits 1 258 - 1 258 Receivables and prepayments 4 96 100 1 262 96 1 358 Weighted average interest rate (percent) 4.95
Financial Liabilities: Trade and other creditors - 78 78 - 78 78 Weighted average interest rate (percent) -
Net Financial Assets 1 262 18 1 280
Reconciliation of Net Financial Assets to Net Assets 2000 1999 $’000 $’000 Net financial assets as above 625 1 280 Non-financial assets and liabilities: Property, plant and equipment 51 59 Provisions (13) (4)
Net Assets per Statement of Financial Position 663 1 335
Net Fair Value of Financial Assets and Liabilities - On-Statement of Financial Position The net fair value of cash and equivalents and non-interest bearing monetary financial assets and financial liabilities of the Board approximates their carrying value.
The carrying amounts and net fair values of financial assets and liabilities 2000 1999 at balance date are: Carrying Net Fair Carrying Net Fair On-Statement of Financial Position Financial Instruments Amount Value Amount Value Financial Assets: $’000 $’000 $’000 $’000 Cash and deposits 570 570 1 258 1 258 Receivables 157 157 100 100 Financial Liabilities: Trade and other creditors (102) (102) (78) (78)
625 625 1 280 1 280

Catchment Water Management Boards
1123
ONKAPARINGA CATCHMENT WATER MANAGEMENT BOARD
Operating Statement for the year ended 30 June 2000 2000 1999 INCOME: Note $’000 $’000 Council contributions 2 040 2 062 Interest received 63 26 Grants 370 285 Other income 1 1 Total Income 2 474 2 374 EXPENDITURE: Board and Administration:
Board remuneration and expenses 51 56 Salaries and related payments 122 78 Office expenses 114 108 Total Board and Administration 287 242 Initial Catchment Plan Programs: Catchment works 1 042 404 Planning 743 291 Community education and involvement 449 270 Total Catchment Plan Programs 2 234 965 Total Expenditure 2 521 1 207 OPERATING (DEFICIT) SURPLUS (47) 1 167
ACCUMULATED FUNDS AT 30 JUNE 1 249 1 296
Statement of Financial Position as at 30 June 2000 2000 1999 CURRENT ASSETS: Note $’000 $’000 Cash 1 240 1 209 Receivables and prepayments 2.6, 3 175 157 Total Current Assets 1 415 1 366 NON-CURRENT ASSETS: Property, plant and equipment and infrastructure assets 4 92 69 Total Non-Current Assets 92 69 Total Assets 1 507 1 435 CURRENT LIABILITIES: Creditors and accrued expenses 2.7, 5 251 130 Provisions - Annual leave 6.1 7 9 Total Current Liabilities 258 139 Total Liabilities 258 139
NET ASSETS 13 1 249 1 296
ACCUMULATED FUNDS: Accumulated funds at 1 July 1 296 129 Operating (deficit) surplus (47) 1 167
TOTAL ACCUMULATED FUNDS 1 249 1 296
Commitments 7
Statement of Cash Flows for year ended 30 June 2000 2000 1999 Inflows Inflows CASH FLOWS FROM OPERATING ACTIVITIES: (Outflows) (Outflows) Inflows: Note $’000 $’000 Council contributions 2 040 2 062 Interest received 61 23 Grants received 355 133 Other income 1 24 Outflows: Payments to suppliers, service providers and employees (2 383) (1 084) Net Cash provided by Operating Activities 12.2 74 1 158 CASH FLOWS FROM INVESTING ACTIVITIES: Outflows: Payments for plant and equipment and infrastructure assets (43) (29) Net Cash used in Investing Activities (43) (29) NET INCREASE IN CASH HELD 31 1 129 CASH AT 1 JULY 1 209 80
CASH AT 30 JUNE 1 240 1 209

Catchment Water Management Boards Onkaparinga Catchment Water Management Board
1124
NOTES TO AND FORMING PART OF THE FINANCIAL STATEMENTS 1. General 1.1 Establishment of the Board
The Onkaparinga Catchment Water Management Board (the Board) commenced operation under the Water Resources Act 1997 on 24 December 1997. The Water Resources Act 1997, came into operation on 2 July 1997 and provides for management and sustainable use of the State’s water resources. The Board commenced operation under an Initial Catchment Water Management Plan approved by the Minister for Environment and Heritage on 20 March 1998. In accordance with the requirements of the Water Resources Act 1997 an Annual Review was conducted during 1999-2000. The review amended projected income and expenditure for the years 2000-01 to 2002-03 and was adopted by the Minister for Water Resources on 9 May 2000.
1.2 Functions of the Board • To prepare a comprehensive Catchment Water Management Plan.
• Provision of advice to the Minister for Water Resources and constituent councils regarding water resources management in the Board’s area.
• Promotion of public awareness of the importance of proper management and sustainable use of the water resources within the Board’s area.
• Other functions as are assigned to the Board under the Act or any other Act. 1.3 Sources of Funding
In accordance with the provisions of the Water Resources Act 1997, the Board received contributions from councils within the proclaimed catchment area. The amount contributed by councils was based upon the estimated expenditure of the Board (as contained in the 1998-99 Annual Review) for the financial year, less the amount of any other funds available to the Board. Councils are required to impose a separate levy on rateable land in the catchment areas of the Board in order to recover the contributions made to the Board. Catchment levies are exempt from the Goods and Services Tax introduced by the Commonwealth Government on 1 July 2000. Contributions payable by constituent Councils to the Board have been reduced by the amount of rebates or remissions granted by Councils in accordance with section 136 of the Water Resources Act 1997 and Division 5 of Part 1 of the Local Government Act 1999.
1.4 Income Recognition Contributions from constituent councils are recognised as income following determination of the share of each council by the Minister and publication of those amounts in the Government Gazette. Contributions are required to be paid on a quarterly basis to the Board. Interest income is recognised on a proportional basis taking into account the interest rates applicable to the financial assets. Income from grants is recognised following completion of formal documentation between the grantor and the Board. Other income is recognised when the service has been performed. All income relates to the operating activities of the Board.
2. Statement of Significant Accounting Policies 2.1 General
The following is a summary of the significant accounting policies adopted by the Board in the preparation of the Accounts. The general purpose Financial Statements have been prepared in accordance with appropriate Australian Accounting Standards, Treasurer’s Instructions promulgated under the provision of the Public Finance and Audit Act 1987 and the requirements of the Water Resources Act 1997. Operating costs for the year have been allocated to programs designated in the initial Catchment Plan. Costs for 1998-99 have been similarly classified for comparative purposes. The Financial Statements have been prepared on an accrual basis whereby items are brought to account as they are earned or incurred and included in the statements for the accounting periods to which they relate. The accounts are prepared on the basis of historical cost and are not adjusted to take account of changing money values or current valuations of non-current assets unless otherwise disclosed in these Notes.
2.2 Allocation of Administrative Overheads to Programs
Where appropriate, salaries and overheads have been distributed to a Catchment Plan Program to accurately reflect the cost of these activities.
2.3 Non-Current Assets Transfer of Assets No non-current assets were transferred to or received from third parties during the year.
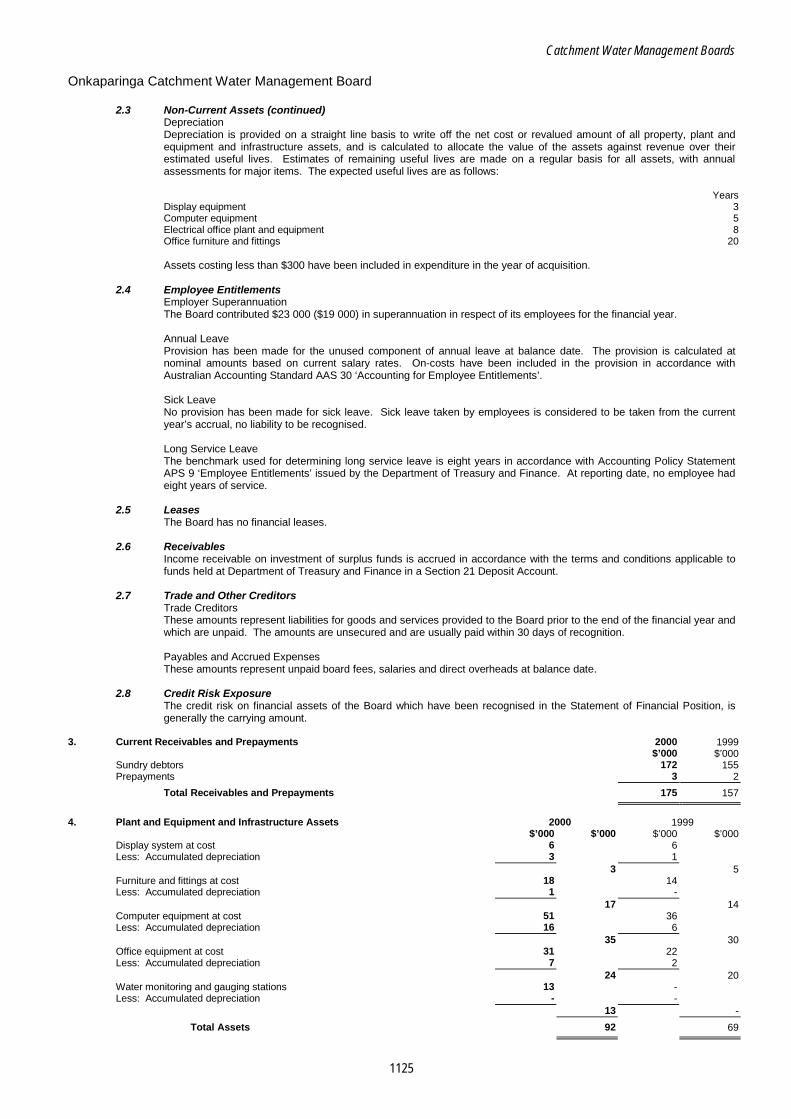
Catchment Water Management Boards Onkaparinga Catchment Water Management Board
1125
2.3 Non-Current Assets (continued) Depreciation Depreciation is provided on a straight line basis to write off the net cost or revalued amount of all property, plant and equipment and infrastructure assets, and is calculated to allocate the value of the assets against revenue over their estimated useful lives. Estimates of remaining useful lives are made on a regular basis for all assets, with annual assessments for major items. The expected useful lives are as follows:
Years Display equipment 3 Computer equipment 5 Electrical office plant and equipment 8 Office furniture and fittings 20 Assets costing less than $300 have been included in expenditure in the year of acquisition. 2.4 Employee Entitlements Employer Superannuation
The Board contributed $23 000 ($19 000) in superannuation in respect of its employees for the financial year.
Annual Leave Provision has been made for the unused component of annual leave at balance date. The provision is calculated at nominal amounts based on current salary rates. On-costs have been included in the provision in accordance with Australian Accounting Standard AAS 30 ‘Accounting for Employee Entitlements’.
Sick Leave No provision has been made for sick leave. Sick leave taken by employees is considered to be taken from the current year’s accrual, no liability to be recognised.
Long Service Leave
The benchmark used for determining long service leave is eight years in accordance with Accounting Policy Statement APS 9 ‘Employee Entitlements’ issued by the Department of Treasury and Finance. At reporting date, no employee had eight years of service.
2.5 Leases The Board has no financial leases.
2.6 Receivables Income receivable on investment of surplus funds is accrued in accordance with the terms and conditions applicable to funds held at Department of Treasury and Finance in a Section 21 Deposit Account.
2.7 Trade and Other Creditors Trade Creditors These amounts represent liabilities for goods and services provided to the Board prior to the end of the financial year and which are unpaid. The amounts are unsecured and are usually paid within 30 days of recognition. Payables and Accrued Expenses These amounts represent unpaid board fees, salaries and direct overheads at balance date.
2.8 Credit Risk Exposure The credit risk on financial assets of the Board which have been recognised in the Statement of Financial Position, is generally the carrying amount.
3. Current Receivables and Prepayments 2000 1999 $’000 $’000 Sundry debtors 172 155 Prepayments 3 2
Total Receivables and Prepayments 175 157
4. Plant and Equipment and Infrastructure Assets 2000 1999 $’000 $’000 $’000 $’000 Display system at cost 6 6 Less: Accumulated depreciation 3 1 3 5 Furniture and fittings at cost 18 14 Less: Accumulated depreciation 1 - 17 14 Computer equipment at cost 51 36 Less: Accumulated depreciation 16 6 35 30 Office equipment at cost 31 22 Less: Accumulated depreciation 7 2 24 20 Water monitoring and gauging stations 13 - Less: Accumulated depreciation - - 13 -
Total Assets 92 69
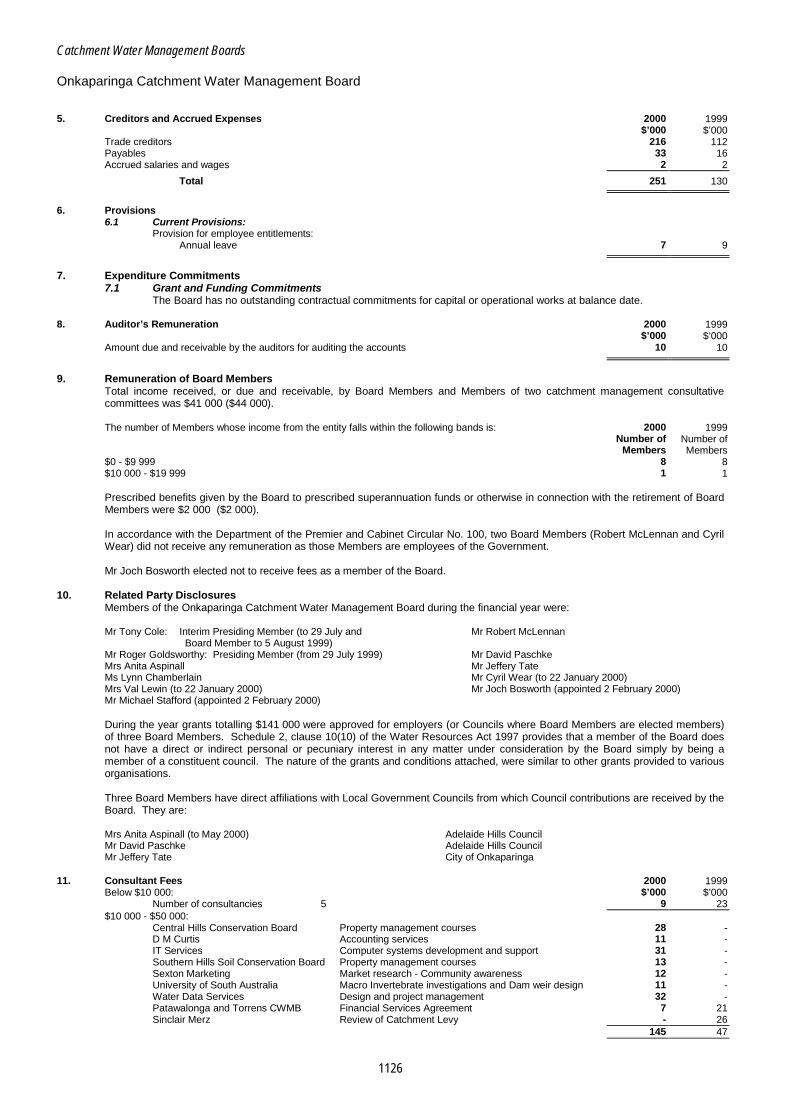
Catchment Water Management Boards Onkaparinga Catchment Water Management Board
1126
5. Creditors and Accrued Expenses 2000 1999 $’000 $’000 Trade creditors 216 112 Payables 33 16 Accrued salaries and wages 2 2
Total 251 130
6. Provisions 6.1 Current Provisions: Provision for employee entitlements: Annual leave 7 9
7. Expenditure Commitments
7.1 Grant and Funding Commitments The Board has no outstanding contractual commitments for capital or operational works at balance date.
8. Auditor’s Remuneration 2000 1999 $’000 $’000 Amount due and receivable by the auditors for auditing the accounts 10 10
9. Remuneration of Board Members
Total income received, or due and receivable, by Board Members and Members of two catchment management consultative committees was $41 000 ($44 000).
The number of Members whose income from the entity falls within the following bands is: 2000 1999 Number of Number of Members Members $0 - $9 999 8 8 $10 000 - $19 999 1 1
Prescribed benefits given by the Board to prescribed superannuation funds or otherwise in connection with the retirement of Board Members were $2 000 ($2 000). In accordance with the Department of the Premier and Cabinet Circular No. 100, two Board Members (Robert McLennan and Cyril Wear) did not receive any remuneration as those Members are employees of the Government. Mr Joch Bosworth elected not to receive fees as a member of the Board.
10. Related Party Disclosures Members of the Onkaparinga Catchment Water Management Board during the financial year were: Mr Tony Cole: Interim Presiding Member (to 29 July and Mr Robert McLennan Board Member to 5 August 1999) Mr Roger Goldsworthy: Presiding Member (from 29 July 1999) Mr David Paschke Mrs Anita Aspinall Mr Jeffery Tate Ms Lynn Chamberlain Mr Cyril Wear (to 22 January 2000) Mrs Val Lewin (to 22 January 2000) Mr Joch Bosworth (appointed 2 February 2000) Mr Michael Stafford (appointed 2 February 2000) During the year grants totalling $141 000 were approved for employers (or Councils where Board Members are elected members) of three Board Members. Schedule 2, clause 10(10) of the Water Resources Act 1997 provides that a member of the Board does not have a direct or indirect personal or pecuniary interest in any matter under consideration by the Board simply by being a member of a constituent council. The nature of the grants and conditions attached, were similar to other grants provided to various organisations. Three Board Members have direct affiliations with Local Government Councils from which Council contributions are received by the Board. They are: Mrs Anita Aspinall (to May 2000) Adelaide Hills Council Mr David Paschke Adelaide Hills Council Mr Jeffery Tate City of Onkaparinga
11. Consultant Fees 2000 1999 Below $10 000: $’000 $’000 Number of consultancies 5 9 23 $10 000 - $50 000:
Central Hills Conservation Board Property management courses 28 - D M Curtis Accounting services 11 - IT Services Computer systems development and support 31 - Southern Hills Soil Conservation Board Property management courses 13 - Sexton Marketing Market research - Community awareness 12 - University of South Australia Macro Invertebrate investigations and Dam weir design 11 - Water Data Services Design and project management 32 -
Patawalonga and Torrens CWMB Financial Services Agreement 7 21 Sinclair Merz Review of Catchment Levy - 26 145 47

Catchment Water Management Boards Onkaparinga Catchment Water Management Board
1127
11. Consultant Fees (continued) 2000 1999 Above $50 000: $’000 $’000
AGC Woodward Clyde Water allocation plan and other investigations 132 - Eco Management Services Bio-diversity management plans development 86 -
ID & A (SA) Pty Ltd Watercourse management plans and works program 121 147 PPK Consultants Catchment water management plan development 171 45
510 192
Total 664 262
12. Note to the Statement of Cash Flows
12.1 Reconciliation of Cash For the purposes of the Statement of Cash Flows, the Board considers cash to include cash on hand and in banks and those investments that are able to be converted to cash within two working days.
12.2 Reconciliation of Net Cash provided by Operating Activities to
Operating (Deficit) Surplus Operating (deficit) surplus (47) 1 167 Depreciation 19 7 (Increase) – Receivables (20) (132) Decrease (Increase) - Prepayments 2 (2) Increase – Creditors and accruals - Net of amounts accrued in relation to asset acquisition 122 109 (Decrease) Increase - Provisions (2) 9
Net Cash provided by Operating Activities 74 1 158
13. Financial Instruments 2000 Interest Rate Risk Exposure Floating Non- Total The Board’s exposure to interest rate risk and the effective weighted average interest rate Interest Interest Carrying for each class of financial assets and financial liabilities is set out in the following table: Rate Bearing Amount Financial Assets: $’000 $’000 $’000 Cash and deposits 1 240 - 1 240 Receivables and prepayments 5 170 175 1 245 170 1 415 Weighted average interest rate (percent) 5.58 Financial Liabilities: Trade and other creditors - 251 251 - 251 251 Weighted average interest rate (percent) -
Net Financial Assets (Liabilities) 1 245 (81) 1 164
1999 Floating Non- Total Interest Interest Carrying Rate Bearing Amount Financial Assets: $’000 $’000 $’000 Cash and deposits 1 209 - 1 209 Receivables and prepayments 3 154 157 1 212 154 1 366 Weighted average interest rate (percent) 4.95
Financial Liabilities: Trade and other creditors - 130 130 - 130 130 Weighted average interest rate (percent) -
Net Financial Assets 1 212 24 1 236
Reconciliation of Net Financial Assets to Net Assets 2000 1999 $’000 $’000 Net financial assets as above 1 164 1 236 Non-financial assets and liabilities: Property, plant and equipment 92 69 Provisions (7) (9)
Net Assets per Statement of Financial Position 1 249 1 296

Catchment Water Management Boards Onkaparinga Catchment Water Management Board
1128
13. Financial Instruments (continued) Net Fair Value of Financial Assets and Liabilities - On-Statement of Financial Position The net fair value of cash and equivalents and non-interest bearing monetary financial assets and financial liabilities of the Board approximates their carrying value.
The carrying amounts and net fair values of financial assets and liabilities 2000 1999 at balance date are: Carrying Net Fair Carrying Net Fair On-Statement of Financial Position Financial Instruments Amount Value Amount Value Financial Assets: $’000 $’000 $’000 $’000 Cash and deposits 1 240 1 240 1 209 1 209 Receivables 175 175 157 157 Financial Liabilities: Trade and other creditors (251) (251) (130) (130)
1 164 1 164 1 236 1 236

Catchment Water Management Boards
1129
SOUTH EAST CATCHMENT WATER MANAGEMENT BOARD
Operating Statement for the year ended 30 June 2000 2000 1999 OPERATING REVENUES: Note $’000 $’000 Fees and charges 4 960 661 Interest revenue 5 35 10 Other revenue 6 19 74 Total Operating Revenue 1 014 745 OPERATING EXPENSES: Employee entitlements and other employee related expenses 219 133 Goods and services 7 513 218 Depreciation 8 12 4 Total Operating Expenses 744 355 OPERATING SURPLUS BEFORE ABNORMAL ITEM 270 390 Less: Abnormal item 21 16 -
OPERATING SURPLUS RESULTING FROM OPERATIONS 16 254 390
Statement of Financial Position as at 30 June 2000 2000 1999 CURRENT ASSETS: Note $’000 $’000 Cash on hand and on deposit 9 924 581 Receivables 10 68 27 Total Current Assets 992 608 NON-CURRENT ASSETS: Property, plant and equipment 11 33 53 Total Non-Current Assets 33 53 Total Assets 1 025 661 CURRENT LIABILITIES:
Deposit from Mid South East Irrigators Association 12 258 - Creditors and accrued expenses 13 112 266 Employee entitlements and other employee related provisions 14 11 5 Total Current Liabilities 381 271 Total Liabilities 381 271
NET ASSETS 644 390
EQUITY: Accumulated surplus 16 644 390
TOTAL EQUITY 644 390
Expenditure Commitments 15
Statement of Cash Flows for year ended 30 June 2000 2000 1999 Inflows Inflows (Outflows) (Outflows) CASH FLOWS FROM OPERATING ACTIVITIES: Note $’000 $’000 Payments: Employee entitlements and other employee related expenses (336) (92) Goods and services (544) (45) Receipts: Fees and charges 884 636 Interest revenue 33 8 Other revenue 56 74 Deposit from Mid South East Irrigators Association 258 - Net Cash provided by Operating Activities 17 351 581 CASH FLOWS FROM INVESTING ACTIVITIES: Purchase of plant and equipment (8) -
Net Cash used in Investing Activities (8) - NET INCREASE IN CASH HELD 343 581 CASH AT 1 JULY 581 -
CASH AT 30 JUNE 9 924 581
NOTES TO AND FORMING PART OF THE FINANCIAL STATEMENTS 1. Objectives and Funding
(a) Establishment of Board The South East Catchment Water Management Board was established under section 53 of the Water Resources Act 1997 on 15 May 1998. The Board’s Initial Plan was approved by the Minister for Environment and Heritage and passed through Parliament in April 1999. The Initial Plan will remain in effect until such time as a comprehensive plan has been completed or the Initial Plan is revised.

Catchment Water Management Boards South East Catchment Water Management Board
1130
1. Objectives and Funding (continued) (b) Functions of the Board
The functions of the Board are to: • prepare and implement a Catchment Water Management Plan; • provide advice to the Minister for Environment and Heritage and constituent councils regarding water resource
management in the Board’s area; • promote public awareness of the importance of proper management and sustainable use of the water
resources within the Board’s area.
(c) Financial Arrangements A water based levy raises approximately 70 percent of total income. It is set at the following rate according to whether the allocation is based on a volumetric basis or an irrigation equivalent basis where the water allocation on the licence is specified:
• as an annual volume in megalitres, $1.50 per megalitre. • in Irrigation Equivalents (IE), $7.50 per hectare IE or part thereof. Approximately 30 percent of income is raised by council contributions. The Councils are required by the Water Resources Act 1997 to impose a separate levy on rateable land in the catchment areas of the Board in order to recover the contributions made to the Board. Contributions payable by the Councils have been reduced by the amount of rebates and remissions granted by Councils in accordance with section 138 of the Water Resources Act 1997. The financial activities of the Board are primarily conducted through a Deposit Account with the Department of Treasury and Finance pursuant to section 21 of the Public Finance and Audit Act 1987.
2. Significant Accounting Policies (a) Basis of Accounting
The financial statement is a general purpose financial report, and has been prepared in accordance with Statements of Accounting Concepts, Australian Accounting Standards, Treasurer’s Instructions and Accounting Policy Statements issued by the Department of Treasury and Finance and the requirements of the Water Resources Act 1997. The financial report has been prepared on the accrual basis of accounting. Accordingly revenues are recognised when they are earned or when the Board obtains control over them, rather than when they are received and expenses are recognised when they are incurred, rather than when they are paid. Some revenues are recognised when cash is received because only at this time can the Board be certain about the amounts to be collected. These revenues include items such as grants. The financial report has been prepared in accordance with the historical cost convention.
(b) Property, Plant and Equipment Assets have been recognised at cost and included in the Statement of Financial Position. Minor items of plant and equipment with an individual value of less than $1 000 are expensed in the Operating Statement at the time they are acquired. This represents an increase from the $500 capitalisation limit adopted by the Board in 1998-99. Note 21 details the expense due to the retirement of non-current assets resulting from the adoption of the higher capitalisation limit.
(c) Depreciation All items of property, plant and equipment have a limited useful life and are systematically depreciated in a manner which reflects the consumption of service potential. The depreciation rates are reviewed annually.
The expected useful life is as follows: Years Computing equipment 3 Office plant and equipment 3-5 Office furniture and fittings 10
Depreciation is provided on a straight line basis on all plant and equipment over $1 000.
(d) Repairs and Maintenance Repairs and maintenance costs are expensed as incurred.
(e) Income Recognition All revenue is recorded in the Operating Statement. Grants, donations and other contributions are recognised as revenues when the Board obtains control over the assets comprising the contributions. Control over such revenues is normally obtained upon their receipt.
(f) Receivables Receivables in respect of fees and charges are recorded at their recoverable amount. At the end of each reporting period these receivable balances are reviewed and a provision is raised in respect of any balance where recoverability is considered doubtful. Bad debts are written off in the period in which they are identified.
(g) Superannuation
The Board made contributions of $28 000 to Employer Contribution Accounts administered by the South Australian Superannuation Board, in respect of future superannuation liabilities.
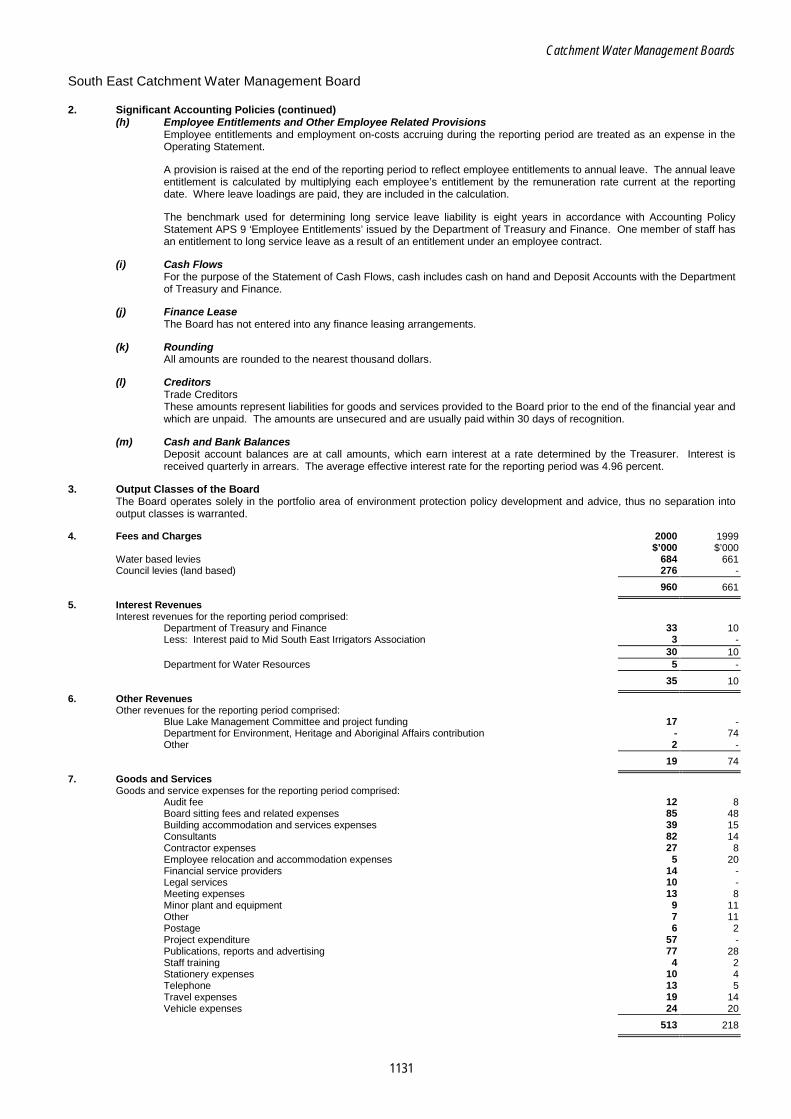
Catchment Water Management Boards South East Catchment Water Management Board
1131
2. Significant Accounting Policies (continued) (h) Employee Entitlements and Other Employee Related Provisions
Employee entitlements and employment on-costs accruing during the reporting period are treated as an expense in the Operating Statement. A provision is raised at the end of the reporting period to reflect employee entitlements to annual leave. The annual leave entitlement is calculated by multiplying each employee’s entitlement by the remuneration rate current at the reporting date. Where leave loadings are paid, they are included in the calculation. The benchmark used for determining long service leave liability is eight years in accordance with Accounting Policy Statement APS 9 ‘Employee Entitlements’ issued by the Department of Treasury and Finance. One member of staff has an entitlement to long service leave as a result of an entitlement under an employee contract.
(i) Cash Flows For the purpose of the Statement of Cash Flows, cash includes cash on hand and Deposit Accounts with the Department of Treasury and Finance.
(j) Finance Lease The Board has not entered into any finance leasing arrangements.
(k) Rounding All amounts are rounded to the nearest thousand dollars.
(l) Creditors Trade Creditors
These amounts represent liabilities for goods and services provided to the Board prior to the end of the financial year and which are unpaid. The amounts are unsecured and are usually paid within 30 days of recognition.
(m) Cash and Bank Balances Deposit account balances are at call amounts, which earn interest at a rate determined by the Treasurer. Interest is received quarterly in arrears. The average effective interest rate for the reporting period was 4.96 percent.
3. Output Classes of the Board The Board operates solely in the portfolio area of environment protection policy development and advice, thus no separation into output classes is warranted.
4. Fees and Charges 2000 1999 $’000 $’000 Water based levies 684 661
Council levies (land based) 276 -
960 661
5. Interest Revenues Interest revenues for the reporting period comprised: Department of Treasury and Finance 33 10
Less: Interest paid to Mid South East Irrigators Association 3 - 30 10 Department for Water Resources 5 -
35 10
6. Other Revenues Other revenues for the reporting period comprised:
Blue Lake Management Committee and project funding 17 - Department for Environment, Heritage and Aboriginal Affairs contribution - 74 Other 2 -
19 74
7. Goods and Services Goods and service expenses for the reporting period comprised: Audit fee 12 8 Board sitting fees and related expenses 85 48 Building accommodation and services expenses 39 15 Consultants 82 14 Contractor expenses 27 8 Employee relocation and accommodation expenses 5 20
Financial service providers 14 - Legal services 10 -
Meeting expenses 13 8 Minor plant and equipment 9 11 Other 7 11 Postage 6 2
Project expenditure 57 - Publications, reports and advertising 77 28 Staff training 4 2 Stationery expenses 10 4 Telephone 13 5 Travel expenses 19 14 Vehicle expenses 24 20
513 218

Catchment Water Management Boards South East Catchment Water Management Board
1132
8. Depreciation Expenses 2000 1999 $’000 $’000 Computing equipment 10 3
Furniture and fittings 1 - Plant and equipment 1 1
12 4
9. Cash on Hand and on Deposit Deposit Account with the Department of Treasury and Finance 924 581
The balance includes funds held on behalf of the Mid South East Irrigators Association (refer Note 12).
10. Receivables
Council levies (land based) 43 - Water based levies 16 22 Sundry receivables 5 3 Accrued interest 4 2
68 27
11. Property, Plant and Equipment Computing equipment - At cost 38 32
Less: Accumulated depreciation 12 3 26 29
Furniture and fittings - At cost 5 19 Less: Accumulated depreciation 1 -
4 19 Plant and equipment - At cost 5 6 Less: Accumulated depreciation 2 1
3 5 Total Assets At Cost 48 57 Less: Accumulated depreciation 15 4
33 53
12. Mid South East Irrigators Association
Interest bearing deposit 258 -
The Board holds funds on behalf of the Mid South East Irrigators Association to assist them implement a program to rehabilitate degraded confined aquifers for wells. The Board has accepted this deposit on the basis that these monies will be disbursed in accordance with the instructions of the Mid South East Irrigators Association. Interest is paid at the same rate as received by the Board.
13. Creditors and Accrued Expenses 2000 1999 Current: $’000 $’000 Creditors 86 251 Accrued expenses 14 11 Accrued salaries and wages 12 4
112 266
14. Employee Entitlements and Other Employee Related Provisions Annual leave 10 5
Long service leave 1 -
11 5
15. Expenditure Commitments Commitments under Non-Cancellable Operating Lease at the reporting date are payable as follows: Payable: Not later than one year 15 18 Later than one year and not later than five years 13 56 Later than five years - -
28 74
These operating lease commitments are not recognised in the financial report as liabilities.
The property leases are non-cancellable leases, with rental payments monthly in arrears. Contingent rental provisions within the lease agreement allow for increase in payments in line with general inflation.
16. Equity Accumulated Surplus
Equity represents the residual interest in the Board’s net assets. The South 2000 1999 Australian Government holds the equity interest in the Board on behalf of the $’000 $’000 community.
Balance at 1 July 390 - Operating surplus for the period 254 390
Balance at 30 June 644 390

Catchment Water Management Boards South East Catchment Water Management Board
1133
17. Reconciliation of Net Cash Provided by Operating Activities to Operating Surplus 2000 1999 $’000 $’000 Operating surplus 254 390 Depreciation 12 4
Retirement of non-current assets 16 - Movements in assets and liabilities: (Decrease) Increase in creditors and accrued expenses (154) 209 Increase in employee entitlements 6 5 Increase in receivables (41) (27)
Deposit from Mid South East Irrigators Association 258 -
Net Cash provided by Operating Activities 351 581
18. Remuneration of Board Members 2000 1999 Remuneration paid or payable to Board members in respect of the reporting period Number of Number of fell within the following bands: Board Board Members Members $1 - $10 000 11 7 $20 001 - $30 000 1 1
Total remuneration paid or payable to these members was $58 000 ($48 000). 19. Consultant Fees 2000 1999 Number of Number of Consultants Consultants $1 - $10 000 3 6
$10 000 - $50 000 1 - Over $50 000 1 -
20. Auditor’s Remuneration 2000 1999
$’000 $’000 Amounts due and receivable for auditing the accounts 12 8
21. Abnormal Item
The abnormal item comprises the expense, which has resulted from the retirement of non-current assets with a cost base of depreciation between $500 and $1 000. Non-current asset - Adoption of higher capitalisation rate 16 -
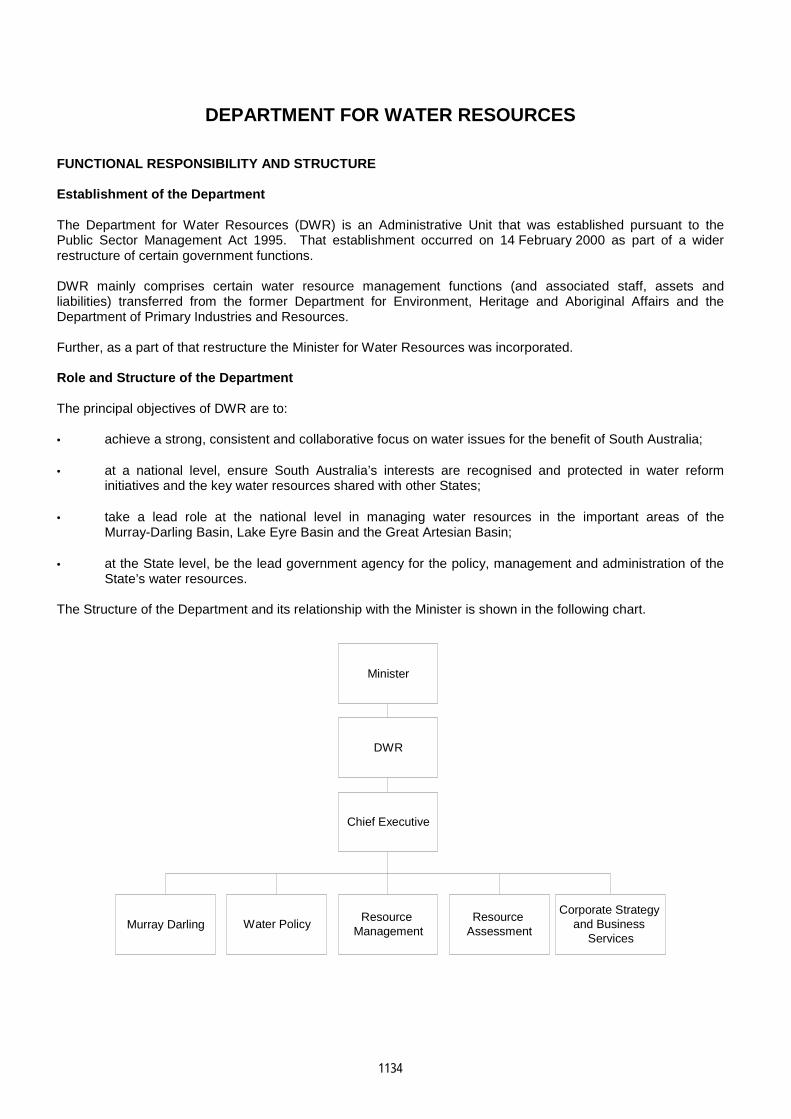
1134
DEPARTMENT FOR WATER RESOURCES FUNCTIONAL RESPONSIBILITY AND STRUCTURE Establishment of the Department The Department for Water Resources (DWR) is an Administrative Unit that was established pursuant to the Public Sector Management Act 1995. That establishment occurred on 14 February 2000 as part of a wider restructure of certain government functions. DWR mainly comprises certain water resource management functions (and associated staff, assets and liabilities) transferred from the former Department for Environment, Heritage and Aboriginal Affairs and the Department of Primary Industries and Resources. Further, as a part of that restructure the Minister for Water Resources was incorporated. Role and Structure of the Department The principal objectives of DWR are to: • achieve a strong, consistent and collaborative focus on water issues for the benefit of South Australia;
• at a national level, ensure South Australia’s interests are recognised and protected in water reform initiatives and the key water resources shared with other States;
• take a lead role at the national level in managing water resources in the important areas of the Murray-Darling Basin, Lake Eyre Basin and the Great Artesian Basin;
• at the State level, be the lead government agency for the policy, management and administration of the State’s water resources.
The Structure of the Department and its relationship with the Minister is shown in the following chart.
Minister
DWR
Chief Executive
Resource Management
Water PolicyMurray DarlingResource
Assessment
Corporate Strategy and Business
Services

Water Resources
1135
SIGNIFICANT FEATURE The net cost of services for the period 1 March 2000 to 30 June 2000 was $8 million and the Department received an appropriation of $10 million. AUDIT MANDATE AND COVERAGE Audit Authority Subsection 31(1)(b) of the Public Finance and Audit Act 1987 provides for the Auditor-General to audit the accounts of DWR in respect of each year. Scope of Audit The audit program covered all major financial areas of activity and was directed primarily towards obtaining sufficient evidence to enable an audit opinion to be formed with respect to the financial statements and internal control. DWR is reliant on other agencies to provide important administrative services such as payment of salaries and wages, accounts payable, asset recording and maintaining a general ledger. The major agencies providing these services are the Department for Environment and Heritage and the Department of Primary Industries and Resources. As a part of the conduct of audits for those agencies, consideration was given to the activities of DWR with the view of forming an opinion with respect to the financial statements and internal control. During 1999-2000 specific areas of audit attention, at DWR and the agencies providing administrative services to DWR, included: • accounts payable • salaries and wages • revenue raising and receipting • property, plant and equipment • general ledger. Audit Communications to Management During the year a letter communicating the issues arising from the audit was forwarded to the Chief Executive. Details relating to the main issue contained in that letter are outlined in ‘Audit Findings and Comments’ hereafter. AUDIT FINDINGS AND COMMENTS Commentary on General Financial Controls As explained, DWR is reliant on the Department for Environment and Heritage and the Department of Primary Industries and Resources to provide important administrative services. Commentary regarding the general financial controls has been included in this Report under those respective agencies. No matters arose from those audits that were significant to DWR. Water Licensing System The Water Licensing System is used to record and manage licences and permits (and the conditions attached to these) issued in relation to the taking of water from prescribed watercourses. In addition, the Water Licensing System is used for the raising of water based levies that have been declared by the Minister in accordance with the Water Resources Act 1997. Where water based levies relate to a Catchment Water Management Board, DWR provides the Board with revenue raising, invoicing, collection and related administrative services. Previous years’ audits of the Department for Environment, Heritage and Aboriginal Affairs have revealed a number of fundamental control weaknesses in the Water Licensing System and associated management systems that raised concern in relation to the reporting of reliable financial information relating to water based levies. These control weaknesses resulted in a qualified audit opinion being issued on the financial statements of those Catchment Water Management Boards where water based levy revenues were material.
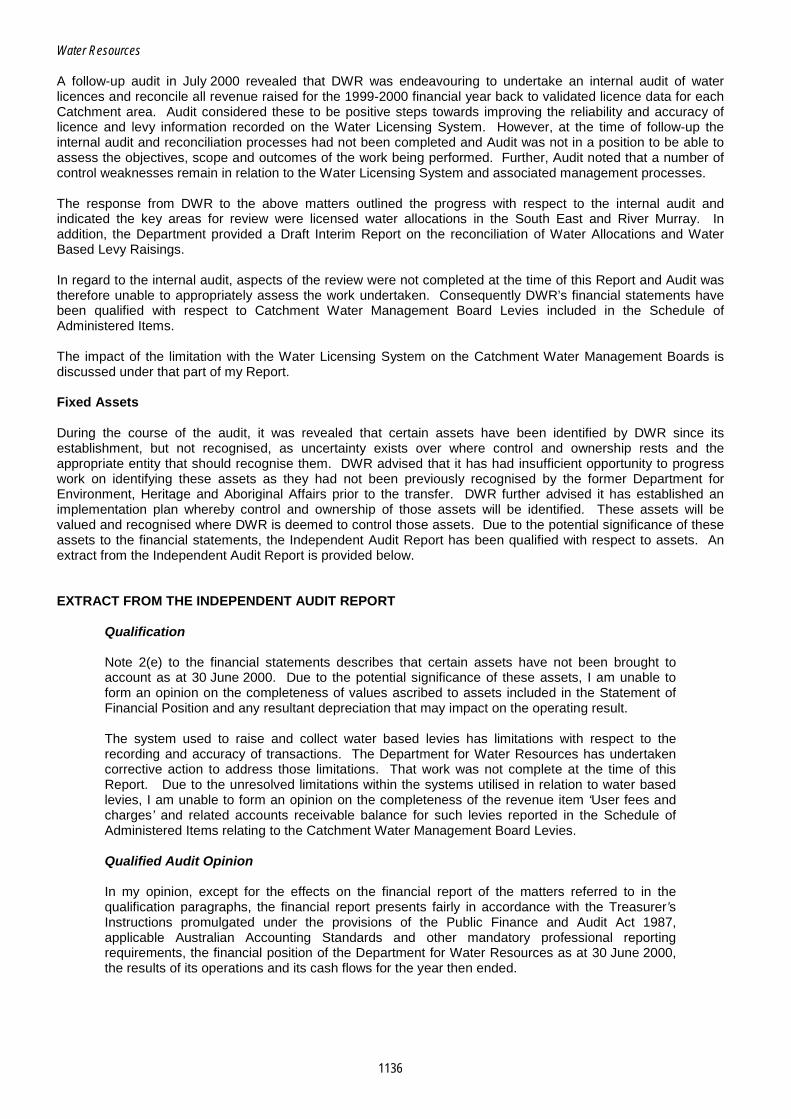
Water Resources
1136
A follow-up audit in July 2000 revealed that DWR was endeavouring to undertake an internal audit of water licences and reconcile all revenue raised for the 1999-2000 financial year back to validated licence data for each Catchment area. Audit considered these to be positive steps towards improving the reliability and accuracy of licence and levy information recorded on the Water Licensing System. However, at the time of follow-up the internal audit and reconciliation processes had not been completed and Audit was not in a position to be able to assess the objectives, scope and outcomes of the work being performed. Further, Audit noted that a number of control weaknesses remain in relation to the Water Licensing System and associated management processes. The response from DWR to the above matters outlined the progress with respect to the internal audit and indicated the key areas for review were licensed water allocations in the South East and River Murray. In addition, the Department provided a Draft Interim Report on the reconciliation of Water Allocations and Water Based Levy Raisings. In regard to the internal audit, aspects of the review were not completed at the time of this Report and Audit was therefore unable to appropriately assess the work undertaken. Consequently DWR’s financial statements have been qualified with respect to Catchment Water Management Board Levies included in the Schedule of Administered Items. The impact of the limitation with the Water Licensing System on the Catchment Water Management Boards is discussed under that part of my Report. Fixed Assets During the course of the audit, it was revealed that certain assets have been identified by DWR since its establishment, but not recognised, as uncertainty exists over where control and ownership rests and the appropriate entity that should recognise them. DWR advised that it has had insufficient opportunity to progress work on identifying these assets as they had not been previously recognised by the former Department for Environment, Heritage and Aboriginal Affairs prior to the transfer. DWR further advised it has established an implementation plan whereby control and ownership of those assets will be identified. These assets will be valued and recognised where DWR is deemed to control those assets. Due to the potential significance of these assets to the financial statements, the Independent Audit Report has been qualified with respect to assets. An extract from the Independent Audit Report is provided below. EXTRACT FROM THE INDEPENDENT AUDIT REPORT
Qualification Note 2(e) to the financial statements describes that certain assets have not been brought to account as at 30 June 2000. Due to the potential significance of these assets, I am unable to form an opinion on the completeness of values ascribed to assets included in the Statement of Financial Position and any resultant depreciation that may impact on the operating result. The system used to raise and collect water based levies has limitations with respect to the recording and accuracy of transactions. The Department for Water Resources has undertaken corrective action to address those limitations. That work was not complete at the time of this Report. Due to the unresolved limitations within the systems utilised in relation to water based levies, I am unable to form an opinion on the completeness of the revenue item ‘User fees and charges’ and related accounts receivable balance for such levies reported in the Schedule of Administered Items relating to the Catchment Water Management Board Levies. Qualified Audit Opinion In my opinion, except for the effects on the financial report of the matters referred to in the qualification paragraphs, the financial report presents fairly in accordance with the Treasurer’s Instructions promulgated under the provisions of the Public Finance and Audit Act 1987, applicable Australian Accounting Standards and other mandatory professional reporting requirements, the financial position of the Department for Water Resources as at 30 June 2000, the results of its operations and its cash flows for the year then ended.

Water Resources
1137
CONTROLS OPINION As required by subsection 36(1)(a)(iii) of the Public Finance and Audit Act 1987, the audit of the Department for Water Resources included an assessment of the controls exercised in relation to the receipt, expenditure and investment of money, the acquisition and disposal of property and the incurring of liabilities. The assessment also considered whether those controls were consistent with the prescribed elements of the Financial Management Framework as required by Treasurer’s Instruction 2 ‘Financial Management Policies’. Audit formed the opinion that the controls exercised by the Department for Water Resources in relation to the receipt, expenditure and investment of money; the acquisition and disposal of property; and the incurring of liabilities, except for the matters outlined under ‘Audit Findings and Comments’, were sufficient to provide reasonable assurance that the financial transactions of the organisation were conducted properly and in accordance with the law.
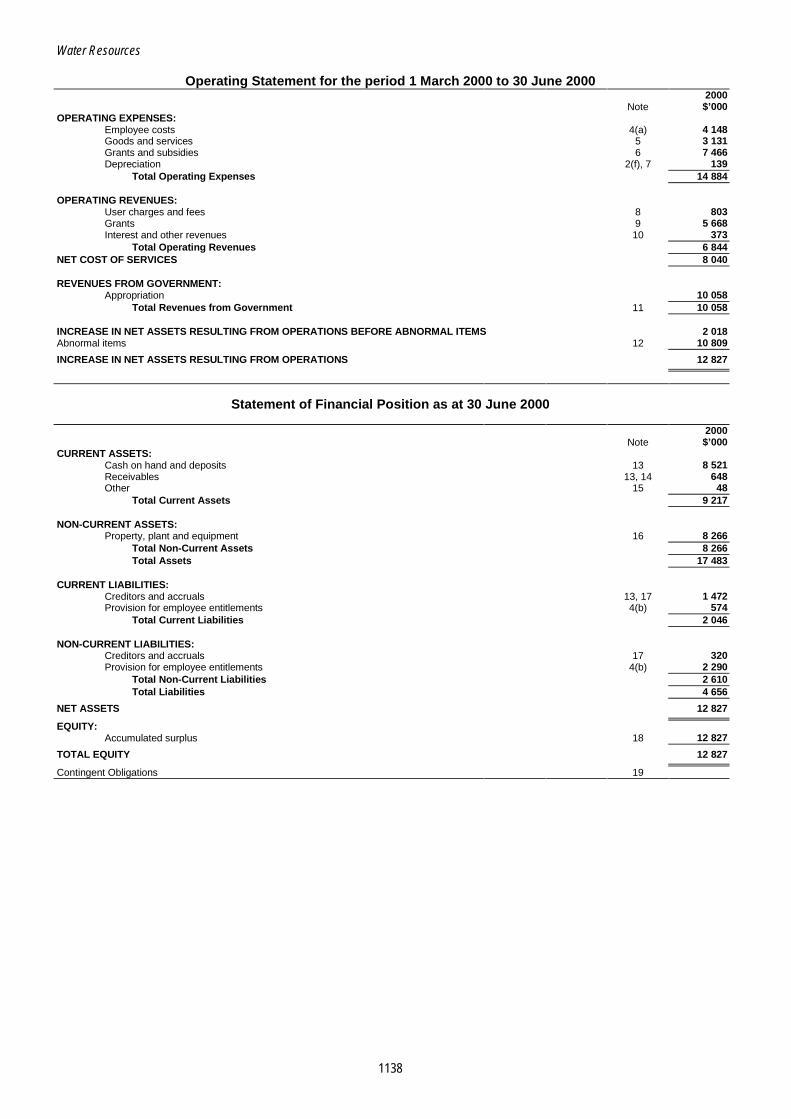
Water Resources
1138
Operating Statement for the period 1 March 2000 to 30 June 2000 2000 Note $’000 OPERATING EXPENSES:
Employee costs 4(a) 4 148 Goods and services 5 3 131 Grants and subsidies 6 7 466 Depreciation 2(f), 7 139
Total Operating Expenses 14 884 OPERATING REVENUES:
User charges and fees 8 803 Grants 9 5 668 Interest and other revenues 10 373
Total Operating Revenues 6 844 NET COST OF SERVICES 8 040 REVENUES FROM GOVERNMENT:
Appropriation 10 058 Total Revenues from Government 11 10 058
INCREASE IN NET ASSETS RESULTING FROM OPERATIONS BEFORE ABNORMAL ITEMS 2 018 Abnormal items 12 10 809
INCREASE IN NET ASSETS RESULTING FROM OPERATIONS 12 827
Statement of Financial Position as at 30 June 2000 2000 Note $’000 CURRENT ASSETS:
Cash on hand and deposits 13 8 521 Receivables 13, 14 648 Other 15 48
Total Current Assets 9 217 NON-CURRENT ASSETS:
Property, plant and equipment 16 8 266 Total Non-Current Assets 8 266 Total Assets 17 483
CURRENT LIABILITIES:
Creditors and accruals 13, 17 1 472 Provision for employee entitlements 4(b) 574
Total Current Liabilities 2 046 NON-CURRENT LIABILITIES:
Creditors and accruals 17 320 Provision for employee entitlements 4(b) 2 290
Total Non-Current Liabilities 2 610 Total Liabilities 4 656
NET ASSETS 12 827
EQUITY: Accumulated surplus 18 12 827
TOTAL EQUITY 12 827
Contingent Obligations 19

Water Resources
1139
Statement of Cash Flows for the period 1 March 2000 to 30 June 2000 2000 Inflows (Outflows) CASH FLOWS FROM OPERATING ACTIVITIES: Note $’000 PAYMENTS:
Employee costs (3 513) Goods and services (2 327) Grants and subsidies (7 466)
Total Payments (13 306) RECEIPTS:
User charges and fees 1 006 Grants 5 668 Interest and other receipts 341
Total Receipts 7 015 CASH FLOWS FROM GOVERNMENT:
Appropriation 10 058 Total Cash Flows from Government 10 058 Net Cash provided by Operating Activities 20 3 767
CASH FLOWS FROM INVESTING ACTIVITIES: PAYMENTS:
Property, plant and equipment (83) Net Cash used in Investing Activities (83)
NET INCREASE IN CASH HELD 3 684 CASH AT 1 MARCH 2000 4 837
CASH AT 30 JUNE 2000 8 521
Output Class Schedule of Departmental Operating Expenses and Revenues for the period 1 March 2000 to 30 June 2000
Water Coordination Resources and Advice Management 2000 1 2 Total
Output Class (Note 3) $’000 $’000 $’000 EXPENSES:
Employee costs 197 3 951 4 148 Goods and services 149 2 982 3 131 Grants and subsidies 355 7 111 7 466 Depreciation 7 132 139
708 14 176 14 884 REVENUES:
User charges and fees 38 765 803 Grants 269 5 399 5 668 Interest and other revenues 18 355 373 Appropriation 478 9 580 10 058
803 16 099 16 902 INCREASE IN NET ASSETS RESULTING FROM OPERATIONS BEFORE ABNORMAL ITEMS 95 1 923 2 018 Abnormal items 514 10 295 10 809
INCREASE IN NET ASSETS RESULTING FROM OPERATIONS AFTER ABNORMAL ITEMS 609 12 218 12 827
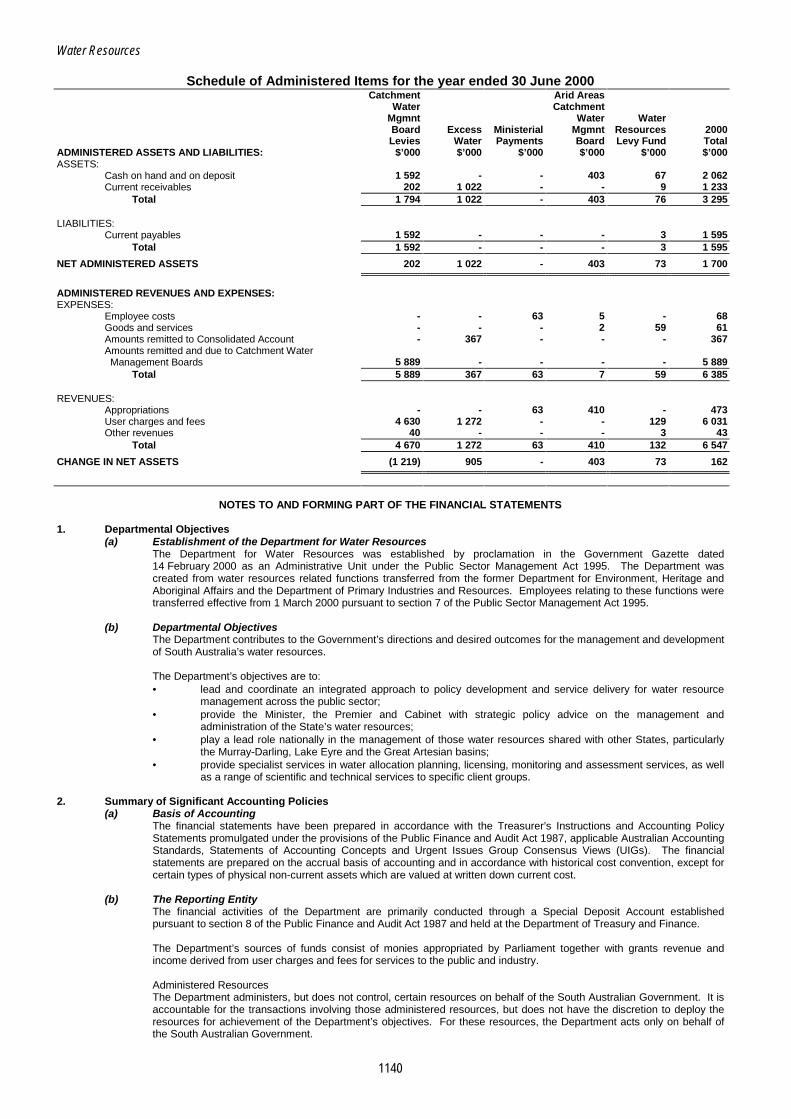
Water Resources
1140
Schedule of Administered Items for the year ended 30 June 2000 Catchment Arid Areas Water Catchment Mgmnt Water Water Board Excess Ministerial Mgmnt Resources 2000 Levies Water Payments Board Levy Fund Total ADMINISTERED ASSETS AND LIABILITIES: $’000 $’000 $’000 $’000 $’000 $’000 ASSETS:
Cash on hand and on deposit 1 592 - - 403 67 2 062 Current receivables 202 1 022 - - 9 1 233
Total 1 794 1 022 - 403 76 3 295 LIABILITIES:
Current payables 1 592 - - - 3 1 595 Total 1 592 - - - 3 1 595
NET ADMINISTERED ASSETS 202 1 022 - 403 73 1 700
ADMINISTERED REVENUES AND EXPENSES: EXPENSES:
Employee costs - - 63 5 - 68 Goods and services - - - 2 59 61 Amounts remitted to Consolidated Account - 367 - - - 367 Amounts remitted and due to Catchment Water Management Boards 5 889 - - - - 5 889
Total 5 889 367 63 7 59 6 385 REVENUES:
Appropriations - - 63 410 - 473 User charges and fees 4 630 1 272 - - 129 6 031 Other revenues 40 - - - 3 43
Total 4 670 1 272 63 410 132 6 547
CHANGE IN NET ASSETS (1 219) 905 - 403 73 162
NOTES TO AND FORMING PART OF THE FINANCIAL STATEMENTS 1. Departmental Objectives
(a) Establishment of the Department for Water Resources The Department for Water Resources was established by proclamation in the Government Gazette dated 14 February 2000 as an Administrative Unit under the Public Sector Management Act 1995. The Department was created from water resources related functions transferred from the former Department for Environment, Heritage and Aboriginal Affairs and the Department of Primary Industries and Resources. Employees relating to these functions were transferred effective from 1 March 2000 pursuant to section 7 of the Public Sector Management Act 1995.
(b) Departmental Objectives The Department contributes to the Government’s directions and desired outcomes for the management and development of South Australia’s water resources. The Department’s objectives are to: • lead and coordinate an integrated approach to policy development and service delivery for water resource
management across the public sector; • provide the Minister, the Premier and Cabinet with strategic policy advice on the management and
administration of the State’s water resources; • play a lead role nationally in the management of those water resources shared with other States, particularly
the Murray-Darling, Lake Eyre and the Great Artesian basins; • provide specialist services in water allocation planning, licensing, monitoring and assessment services, as well
as a range of scientific and technical services to specific client groups. 2. Summary of Significant Accounting Policies
(a) Basis of Accounting The financial statements have been prepared in accordance with the Treasurer’s Instructions and Accounting Policy Statements promulgated under the provisions of the Public Finance and Audit Act 1987, applicable Australian Accounting Standards, Statements of Accounting Concepts and Urgent Issues Group Consensus Views (UIGs). The financial statements are prepared on the accrual basis of accounting and in accordance with historical cost convention, except for certain types of physical non-current assets which are valued at written down current cost.
(b) The Reporting Entity The financial activities of the Department are primarily conducted through a Special Deposit Account established pursuant to section 8 of the Public Finance and Audit Act 1987 and held at the Department of Treasury and Finance. The Department’s sources of funds consist of monies appropriated by Parliament together with grants revenue and income derived from user charges and fees for services to the public and industry. Administered Resources The Department administers, but does not control, certain resources on behalf of the South Australian Government. It is accountable for the transactions involving those administered resources, but does not have the discretion to deploy the resources for achievement of the Department’s objectives. For these resources, the Department acts only on behalf of the South Australian Government.

Water Resources
1141
(b) The Reporting Entity (continued) Transactions and balances relating to administered resources are not recognised as Departmental assets, liabilities, revenues or expenses, but are disclosed separately in the Schedule of Administered Items. The administered resources reported in these financial statements have been reported for the full year as the restructuring of government departments, which brought about the establishment of the Department for Water Resources, did not have any affect on their financial activities.
(c) User Charges and Fees User charges and fees controlled by the Department are recognised as revenues. User charges and fees are controlled by the Department where they can be deployed for the achievement of Departmental objectives. User charges and fees collected by the Department but not controlled by it are not recognised as revenues, but are reported as administered revenues in the Schedule of Administered Items. Such amounts are paid to the Consolidated Account or other Funds not controlled by the Department.
(d) Appropriations Appropriation, whether operating, investing or other, is recognised as revenue when the Department obtains control over the assets comprising the contributions. Control over appropriation is normally obtained upon receipt.
(e) Non-Current Assets The Statement of Financial Position includes those non-current assets where identification, ownership, control and valuations can be reliably determined. Certain assets have been identified but not recognised by the Department as uncertainty exists over where control and ownership of these assets rests and the appropriate entity that should recognise them. It was on this basis that these assets were not previously recognised by the former Department for Environment, Heritage and Aboriginal Affairs, prior to the establishment of the Department for Water Resources. An implementation plan has been established whereby control and ownership will be identified and the assets will be valued and recognised where the Department is deemed to control those assets. The Department has adopted an asset capitalisation limit of $5 000. This represents an increase from the $2 000 capitalisation limit adopted by the Department for Environment and Heritage and the Department of Primary Industries and Resources for those assets transferred to the Department when it was established as part of the 14 February 2000 agency restructuring. The purpose of adopting a higher amount is aimed at providing a more appropriate representation of the Department’s assets, in particular IT assets, in the face of changing technology and usage patterns. A higher limit more accurately reflects the benefits to be derived from the assets whilst also allowing for opportunities for the evaluation of alternative approaches to the acquisition of low value assets. The capitalisation amount is within the limitations set by Accounting Policy Statement APS 2 ‘Asset Recognition’. Items transferred to the Department as part of the 14 February 2000 agency restructuring at a cost below $5 000 have been expensed in the current reporting period. Note 12 on Abnormal Items details the expense due to the retirement of non-current assets which resulted from the adoption of a higher capitalisation limit. All items of property, plant and equipment controlled by the Department have been brought to account at current cost, with assets other than land, being reduced to reflect the portion of economic benefits that had been consumed since the asset was acquired, ie ‘depreciated current cost’. Current cost has been determined using deprival value methodology, whereby assets are valued at the replacement cost of procuring assets with similar functions and which provide comparable future service potential. The Department has adopted a policy of performing revaluations of property, plant and equipment at intervals not exceeding three years in accordance with Accounting Policy Statement APS 3 ‘Revaluation of Non-Current Assets’. Land and Buildings Land and buildings have been independently valued by Valcorp Pty Ltd as at 30 June 1999. Borehole Network The borehole network utilised for groundwater measurement, was independently valued by Valcorp Pty Ltd as at 30 June 1999 on the basis of deprival value and recorded at replacement cost less accumulated depreciation. Hydrometric Gauging Stations The hydrometric gauging stations utilised to measure and control salinity have been included at officer’s valuation. Waste Disposal Stations The houseboat waste disposal stations were independently valued by Valcorp Pty Ltd as at 30 June 1999. Plant and Equipment Plant and equipment are brought to account at cost or at officer’s valuation for initial recognition purposes. Items with an individual value of less than $5 000 are expensed in the Operating Statement at the time they are acquired.
(f) Depreciation All items of property, plant and equipment, with the exception of land, have a limited useful life and are systematically depreciated in a manner that reflects the consumption of service potential. The depreciation rates are reviewed annually. No depreciation is applied to capital work in progress, as this asset category consists of unfinished projects that have not been commissioned into service. Assets are subject to straight line depreciation over the following periods:
Years Buildings 50 Borehole Network 30 Hydrometric Gauging Stations 4 - 213 Waste Disposal Station 50 Plant and equipment 3 - 30

Water Resources
1142
2. Summary of Significant Accounting Policies (continued) (g) Employee Entitlements
(i) Wages, Salaries and Annual Leave Liabilities for wages, salaries and annual leave are recognised, and are measured as the amount unpaid at the reporting date at current pay rates in respect of employees’ services up to that date. A provision for accrued salaries and wages was not required as the last pay period concluded on 30 June 2000.
(ii) Sick Leave No provision has been made for sick leave as entitlements are non-vesting and it is considered that sick leave is taken from the current year’s entitlement.
(iii) Long Service Leave A liability for long service leave is calculated by using the product of the current liability for all employees who have completed eight or more years of service and the current rate of remuneration for each of these employees respectively. The eight years has been based on an actuarial calculation as directed in Accounting Policy Statements. The liability is measured as the amount unpaid at the reporting date. Related on-costs of payroll tax and superannuation are recorded under the item Creditors and Accruals.
(iv) Superannuation Contributions are made by the Department to several superannuation schemes operated by the South Australian Government. These contributions are treated as an expense when they occur. There is no liability for payments to beneficiaries as they have been assumed by the superannuation schemes. The only liability outstanding at balance date relates to any contribution due but not yet paid to the superannuation schemes.
(h) Leases The Department has not entered into any non-cancellable operating lease agreements for property, plant and equipment. The Department does, however, rent properties on a monthly basis from the Department for Environment and Heritage and the Department of Primary Industries and Resources. Operating lease payments are representative of the pattern of benefits derived from the leased assets and are accordingly charged to the Operating Statement in the periods in which they are incurred. The Department has not entered into any finance leases.
(i) Provision for Doubtful Debts The provision for doubtful debts has been calculated as 1 percent of all receivables, together with an allowance for specific debts that are unlikely to be collected.
(j) Cash For the purposes of the Statement of Cash Flows, cash includes cash deposits which are readily convertible to cash on hand and which are used in the cash management function on a day to day basis.
(k) Comparative Figures The general purpose Financial Statement is the first produced by the Department for Water Resources. Comparative information is therefore not available for the Operating Statement, Statement of Financial Position or Statement of Cash Flows.
(l) Rounding All amounts are rounded to the nearest thousand dollars.
3. Output Classes of the Department The Department has specified two major classes of outputs that it delivers to the community and the Minister for Water Resources. Outputs are defined as goods and services produced, provided to or acquired for external customers. The identity and description of each major output class and output of the Department are summarised below (refer to the Output Class Schedule of Departmental Operating Expenses and Revenues). In this first year of operations the allocation of expenses and revenues to output class has been calculated on a broad percentage basis. Output Class 1: Coordination and Advice
The coordination of whole-of-government initiatives or services as well as policy advice and development for and on behalf of the Minister for Water Resources. Output 1.1: Policy Advice
Strategic and technical policy advice and development for and on behalf of the Minister for Water Resources on the sustainable management and development of water resources at the State, inter-government, regional and catchment levels.
Output Class 2: Water Resources Management The provision of a range of water resource management services including resource planning and management; the administration of the Water Resources Act 1997; water licensing; and the assessment, monitoring and evaluation of water resources. Output 2.1: Resource Planning and Management Services
Plans and strategies for water resources management, water allocation and salinity management. Resources planning advice and assistance to relevant authorities (eg catchment water management boards and planning committees, South Eastern Water Conservation and Drainage Board). Development and management of River Murray remediation projects. Regional management of water resources through the Riverland, South East, Northern and Eyre Peninsula offices.

Water Resources
1143
Output Class 2: Water Resources Management (continued) Output 2.2: Resource Monitoring and Assessment Services
Oversight, monitoring and analysis of the state and condition of South Australia’s water resources and sustainable levels of water use. Technical advice and data for the Water Resources Council, catchment water management boards and water resources planning committees, government agencies, the water management and development sectors, search and academic institutions. Increased community awareness of the importance of managing the State’s water resources.
Output 2.3: Licensing and Compliance Services Administration of the Water Resources Act 1997 and other water management legislation including specification and issue of licenses, permits and authorisations for water property rights. On-going review of community awareness of, and compliance with, the provisions of this legislation and where necessary, enforcement of legislative requirements.
4. Employee Entitlements 2000
(a) Employee Costs $’000 Wages, salaries and other employee related expenses 3 522 Superannuation 288 Annual and long service leave expenses 338
4 148
(b) Employee Entitlements Liability Current Liability:
Long service leave 47 Annual leave 527
574
Non-Current Liability: Long service leave 2 290
5. Goods and Services Goods and service expenses for the reporting period comprised:
Accommodation and service expenses 467 Contractor expenses 692 Consultancies 258 Computer expenses 158 Equipment repairs and maintenance 165 Materials and consumables 268 Minor plant and equipment purchases 201 Travel and accommodation 258 Vehicle operating expenses 165 Other 499
3 131
6. Grants and Subsidies Grants and subsidies for the reporting period comprised:
Murray Darling 2001 grants 2 749 Transfer to Murray Darling Basin Commission 2 720 Catchment Management Subsidy Scheme 1 844 Miscellaneous grants 153
7 466
7. Depreciation Depreciation expenses for the reporting period were charged in respect of:
Building improvements 1 Borehole network 60 Hydrometric gauging stations 13 Waste disposal stations 20 Plant and equipment 45
139
8. User Charges and Fees User charges and fees for the reporting period comprised:
Fees, levies and licences 802 Sale of goods and services 1
803
9. Grants Grant revenue for the reporting period comprised:
Commonwealth contributions 739 Contributions received - Catchment Management Subsidy Scheme 2 570 Contributions received - Murray Darling 2001 Program 2 221 Sundry grants and contributions received 138
5 668
10. Interest and Other Revenues Interest and other revenues for the reporting period comprised:
Salaries and wage expenses recouped 130 Interest income 169 Other revenue 74
373

Water Resources
1144
11. Recurrent Appropriation 2000
$’000 Department for Water Resources 839 Appropriation as a result of restructuring:
Department for Environment and Heritage 8 422 Department of Primary Industries and Resources 797
Recurrent Appropriation 10 058
12. Abnormal Income
(a) Revenues from Restructuring Net assets transferred to the Department:
Cash 4 837 Receivables 823 Other current assets 63 Property, plant and equipment 8 546
14 269 Net liabilities assumed by the Department:
Creditors and accruals 829 Provision for employee entitlements 2 526
3 355
Revenue from Restructuring 10 914
(b) Retirement of Non-Current Assets
The abnormal item also comprises the expense that has resulted from the retirement of non-current assets with a cost base for depreciation between $2 000 and $5 000 (refer Note 2(f)). The following reflects the financial effect of the abnormal item:
2000 $’000
Non-Current Assets - Adoption of higher capitalisation limit 243
(c) Recognition of Non-Current Assets
The abnormal item also comprises the revenue that has resulted from the first time recognition of non-current assets. Water meters acquired for the Northern Adelaide Plains water meter replacement program, together with the cost of installation, have been recognised for the first time. The following reflects the financial effect of the abnormal item:
2000
$’000 Non-Current Assets - First time recognition 138
13. Financial Instruments
The following disclosures have been provided in accordance with the requirements of Australian Accounting Standard AAS 33, ‘Presentation and Disclosure of Financial Instruments’:
(a) Terms, Conditions and Accounting Policies
(i) Financial Assets • Cash on hand and deposits are available at call and are recorded at cost. • Receivables are raised for all goods and services provided for which payment has not been received.
Receivables are normally settled within 60 days.
(ii) Financial Liabilities • Trade creditors are raised for all amounts billed or ordered but unpaid. Trade creditors are normally
settled within 30 days.
(b) Interest Rate Risk 2000 Weighted
Average Floating Non- Total Effective Interest Interest Carrying Interest
Financial Instrument Rate Bearing Amount Rate Financial Assets: $’000 $’000 $’000 Percent
Cash on hand and deposits 8 521 - 8 521 5.58 Receivables - 648 648 -
8 521 648 9 169 Financial Liabilities:
Trade creditors - 1 029 1 029 - - 1 029 1 029
(c) Net Fair Values Financial instruments are valued at the carrying amount as per the Statement of Financial Position which approximates the net fair value. The carrying amount of financial assets approximates net fair value due to their short term to maturity or being receivable on demand. The carrying amount of financial liabilities is considered to be a reasonable estimate of net fair value.
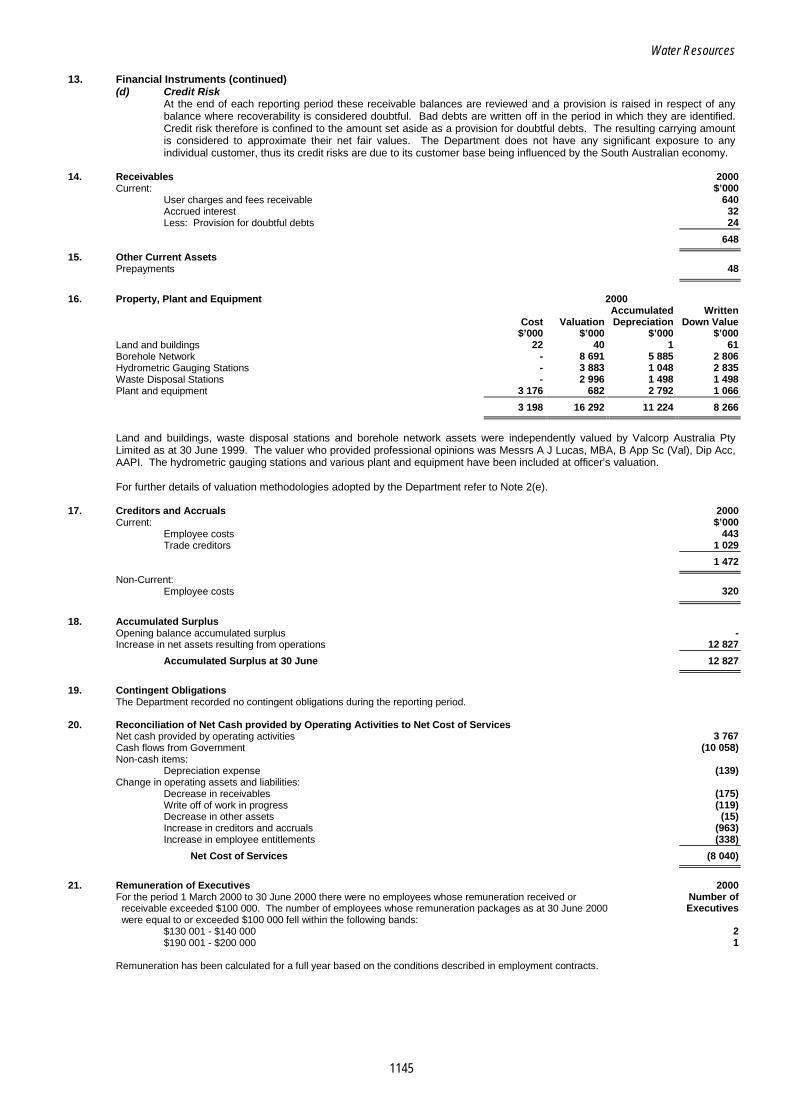
Water Resources
1145
13. Financial Instruments (continued) (d) Credit Risk At the end of each reporting period these receivable balances are reviewed and a provision is raised in respect of any
balance where recoverability is considered doubtful. Bad debts are written off in the period in which they are identified. Credit risk therefore is confined to the amount set aside as a provision for doubtful debts. The resulting carrying amount is considered to approximate their net fair values. The Department does not have any significant exposure to any individual customer, thus its credit risks are due to its customer base being influenced by the South Australian economy.
14. Receivables 2000
Current: $’000 User charges and fees receivable 640 Accrued interest 32 Less: Provision for doubtful debts 24
648
15. Other Current Assets Prepayments 48
16. Property, Plant and Equipment 2000 Accumulated Written Cost Valuation Depreciation Down Value $’000 $’000 $’000 $’000
Land and buildings 22 40 1 61 Borehole Network - 8 691 5 885 2 806 Hydrometric Gauging Stations - 3 883 1 048 2 835 Waste Disposal Stations - 2 996 1 498 1 498 Plant and equipment 3 176 682 2 792 1 066
3 198 16 292 11 224 8 266
Land and buildings, waste disposal stations and borehole network assets were independently valued by Valcorp Australia Pty
Limited as at 30 June 1999. The valuer who provided professional opinions was Messrs A J Lucas, MBA, B App Sc (Val), Dip Acc, AAPI. The hydrometric gauging stations and various plant and equipment have been included at officer’s valuation.
For further details of valuation methodologies adopted by the Department refer to Note 2(e).
17. Creditors and Accruals 2000
Current: $’000 Employee costs 443 Trade creditors 1 029
1 472
Non-Current: Employee costs 320
18. Accumulated Surplus
Opening balance accumulated surplus - Increase in net assets resulting from operations 12 827
Accumulated Surplus at 30 June 12 827
19. Contingent Obligations
The Department recorded no contingent obligations during the reporting period. 20. Reconciliation of Net Cash provided by Operating Activities to Net Cost of Services
Net cash provided by operating activities 3 767 Cash flows from Government (10 058) Non-cash items:
Depreciation expense (139) Change in operating assets and liabilities:
Decrease in receivables (175) Write off of work in progress (119) Decrease in other assets (15) Increase in creditors and accruals (963) Increase in employee entitlements (338)
Net Cost of Services (8 040)
21. Remuneration of Executives 2000
For the period 1 March 2000 to 30 June 2000 there were no employees whose remuneration received or Number of receivable exceeded $100 000. The number of employees whose remuneration packages as at 30 June 2000 Executives were equal to or exceeded $100 000 fell within the following bands:
$130 001 - $140 000 2 $190 001 - $200 000 1
Remuneration has been calculated for a full year based on the conditions described in employment contracts.

Water Resources
1146
22. Payments to Consultants 2000
Payments to consultants fell within the following bands: Number of Consultants
$0 - $10 000 12 $10 001 - $50 000 6 $50 001 and above 1
The total value of consultancies for the reporting period was $258 000.
23. Remuneration of Auditors
Audit fees accrued for the year ended 30 June 2000 are $25 000. 24. Targeted Voluntary Separation Package (TVSPs) Scheme
No employees were paid TVSPs during the period 1 March 2000 and 30 June 2000. 25. Restrictions on Contributions Received 2000
The Department received contributions from various funding sources, as detailed below, expressly Unspent for the purposes of undertaking specific projects. As at 30 June 2000, $2 915 000 of those Amount contributions, which have been recognised as revenues in the Operating Statement, are yet to be $’000 spent in the manner specified by the contributors.
Commonwealth contributions 1 531 Contributions received - Murray Darling 2001 Program 1 384
2 915
1
APPENDIX TO
AUDITOR-GENERAL’S
ANNUAL REPORT
TREASURER’S
FINANCIAL STATEMENTS
(Pursuant to section 22 of the Public Finance and Audit Act, 1987)
1999-2000
PAGE A— STATEMENT OF THE ESTIMATED AND ACTUAL RECEIPTS TO AND PAYMENTS FROM THE CONSOLIDATED ACCOUNT..................................................................................................................... 2 B— SUMMARY OF MOVEMENTS OF FUNDS OF THE TREASURER............................................................................10 C— FUNDS OF THE TREASURER.....................................................................................................................................11 D— ABSTRACT OF CONSOLIDATED ACCOUNT RECEIPTS AND PAYMENTS FOR OPERATING ACTIVITIES.............................................................................................................................................12 E— ORGANISATIONS (OTHER THAN THE SOUTH AUSTRALIAN GOVERNMENT FINANCING AUTHORITY) WITH WHICH THE TREASURER INVESTED FUNDS........................................................................13 F— SPECIAL DEPOSIT ACCOUNTS—BALANCES..........................................................................................................14 F(1)— SPECIAL DEPOSIT ACCOUNTS—PURPOSES .........................................................................................................16 F(2)— SPECIAL DEPOSIT ACCOUNTS OPENED DURING THE YEAR..............................................................................24 G— DEPOSITS LODGED WITH THE TREASURER..........................................................................................................25 H— IMPREST ACCOUNTS..................................................................................................................................................28 I— INDEBTEDNESS OF THE TREASURER.....................................................................................................................29 J— FINANCIAL RELATIONSHIPS AND TRANSACTIONS BETWEEN THE TREASURER AND THE SOUTH AUSTRALIAN GOVERNMENT FINANCING AUTHORITY ...................................................................31 K— STATEMENT OF APPROPRIATION AUTHORITIES— GOVERNOR’S APPROPRIATION FUND .....................................................................................................33 TRANSFERS AUTHORISED PURSUANT TO SECTION 13 OF THE PUBLIC FINANCE AND AUDIT ACT ............................................................................................................................................34 REDUCTIONS AUTHORISED PURSUANT TO SECTION 14 OF THE PUBLIC FINANCE AND AUDIT ACT ............................................................................................................................................34 APPROPRIATION AUTHORITIES FOR ACTUAL PAYMENTS FROM THE CONSOLIDATED ACCOUNT ........................................................................................................................34
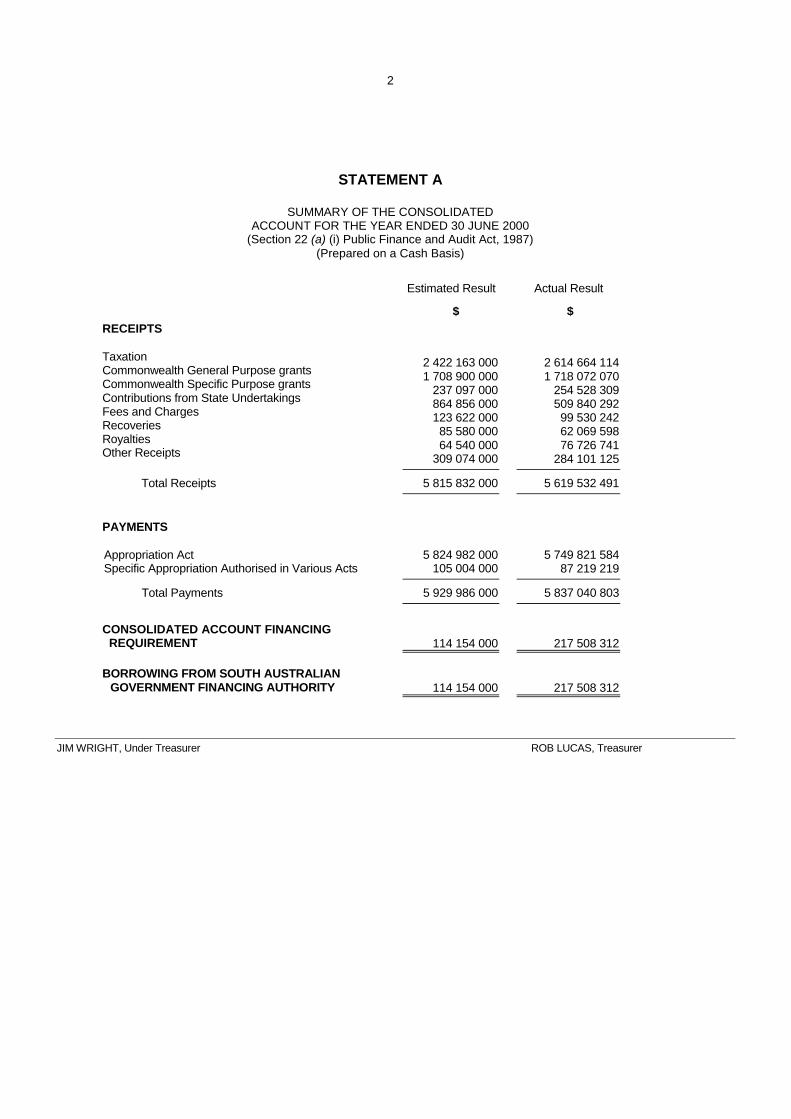
2
STATEMENT A
SUMMARY OF THE CONSOLIDATED ACCOUNT FOR THE YEAR ENDED 30 JUNE 2000
(Section 22 (a) (i) Public Finance and Audit Act, 1987) (Prepared on a Cash Basis)
Estimated Result Actual Result
$ $ RECEIPTS Taxation Commonwealth General Purpose grants Commonwealth Specific Purpose grants Contributions from State Undertakings Fees and Charges Recoveries Royalties Other Receipts
2 422 163 000 1 708 900 000
237 097 000 864 856 000 123 622 000 85 580 000 64 540 000
309 074 000
2 614 664 114 1 718 072 070
254 528 309 509 840 292 99 530 242 62 069 598 76 726 741
284 101 125
Total Receipts 5 815 832 000 5 619 532 491
PAYMENTS Appropriation Act Specific Appropriation Authorised in Various Acts
5 824 982 000 105 004 000
5 749 821 584 87 219 219
Total Payments 5 929 986 000 5 837 040 803
CONSOLIDATED ACCOUNT FINANCING REQUIREMENT
114 154 000
217 508 312
BORROWING FROM SOUTH AUSTRALIAN
GOVERNMENT FINANCING AUTHORITY
114 154 000
217 508 312 JIM WRIGHT, Under Treasurer ROB LUCAS, Treasurer

3
STATEMENT A COMPARATIVE STATEMENT OF THE ESTIMATED AND ACTUAL RECEIPTS
TO THE CONSOLIDATED ACCOUNT OF THE GOVERNMENT OF SOUTH AUSTRALIA FOR THE YEAR ENDED 30 JUNE 2000
(Section 22 (a) (i) Public Finance and Audit Act, 1987) (Prepared on a Cash Basis)
Estimated Receipts for 1999-2000
Actual Receipts for 1999-2000
RECEIPTS $ $
TAXATION Payroll Tax........................................................................................................................................... 684 300 000 702 463 784 Stamp Duties ....................................................................................................................................... 574 500 000 749 027 004 Commonwealth Replacement Grants for Business Franchise Fees................................................... 572 000 000 574 209 909 Land Tax ............................................................................................................................................ 143 500 000 133 278 581 Financial Institutions Duty.................................................................................................................... 88 900 000 90 520 821 Debits Tax............................................................................................................................................ 59 300 000 58 715 945 Gas Levy ............................................................................................................................................ 4 800 000 4 809 831 Gaming Machines Tax......................................................................................................................... 201 900 000 209 987 980 Business Franchises and Levies ......................................................................................................... — 18 996 Contribution from Lotteries Commission.............................................................................................. 54 272 000 53 802 739 Contribution from Casino Operations .................................................................................................. 19 900 000 19 570 380 Contribution from South Australian Totalizator Agency Board ........................................................... 15 591 000 14 775 978 Contribution from On-course Totalizators, Bookmakers and Small Lotteries ...................................... 3 000 000 3 053 954 Recoup from Recreation and Sport Fund............................................................................................ 200 000 428 212
Total Taxation Receipts................................................................... 2 422 163 000 2 614 664 114
COMMONWEALTH GENERAL PURPOSE GRANTS
Competition Grants.............................................................................................................................. 34 300 000 34 453 404 Financial Assistance Grants ................................................................................................................ 1 674 600 000 1 683 618 666
Total Commonwealth General Purpose Grants................................ 1 708 900 000 1 718 072 070
COMMONWEALTH SPECIFIC PURPOSE GRANTS
Companies Code-Fees........................................................................................................................ 10 635 000 10 107 537 Legal Aid ............................................................................................................................................ 8 962 000 8 962 000 Native Title Legislation-Administration................................................................................................. 450 000 — Concessions to pensioners and others................................................................................................ 15 486 000 15 356 900 Debt Redemption Assistance .............................................................................................................. 10 970 000 10 963 814 Housing Interest Assistance ................................................................................................................ 940 000 940 500 Airport Recovery .................................................................................................................................. 20 000 000 — Non-Government Schools ................................................................................................................... 162 733 000 197 705 701 Non-Government Schools— National Equity Program Scheme.......................................................... 2 614 000 5 639 614 School Language and Literacy—Community Languages in Ethnic Schools....................................... 446 000 517 908 Special Education—Intervention Support ............................................................................................ 3 861 000 4 334 335
Total Commonwealth Specific Purpose Grants ................................ 237 097 000 254 528 309
CONTRIBUTIONS FROM STATE UNDERTAKINGS
Adelaide Convention Centre— Income Tax Equivalent.................................................................................................................... — 676 328 Wholesale Sales Tax Equivalent..................................................................................................... — 364 949 Adelaide Entertainments Corporation— Dividend .......................................................................................................................................... 600 000 — Administrative and Information Services (excluding SAGERP)— Dividend .......................................................................................................................................... 18 168 000 22 564 500 Income Tax Equivalent.................................................................................................................... 1 641 000 — Local Government Rate Equivalent ................................................................................................ 688 000 635 948 Wholesale Sales Tax Equivalent .................................................................................................... 20 000 — Administrative and Information Services (FleetSA in respect of leased vehicles)— Wholesale Sales Tax Equivalent..................................................................................................... 2 700 000 1 007 514 Austraining Pty Ltd— Income Tax Equivalent.................................................................................................................... 140 000 254 179 Austrics— Wholesale Sales Tax equivalent ..................................................................................................... 5 000 4 460

4
STATEMENT A�continued
COMPARATIVE STATEMENT OF THE ESTIMATED AND ACTUAL RECEIPTS TO THE CONSOLIDATED ACCOUNT, 1999-2000 continued
Estimated Receipts for 1999-2000
Actual Receipts for 1999-2000
RECEIPTS-continued $ $
CONTRIBUTIONS FROM STATE UNDERTAKINGS continued ElectraNet SA— Income Tax Equivalent.................................................................................................................... 12 500 000 13 716 788 Wholesale Sales Tax Equivalent..................................................................................................... 200 000 177 202 Flinders Power Pty Ltd— Income Tax Equivalent.................................................................................................................... — 2 798 286 Wholesale Sales Tax Equivalent..................................................................................................... 100 000 135 770 Forestry SA— Dividend .......................................................................................................................................... 18 073 000 14 060 983 Income Tax Equivalent.................................................................................................................... 13 128 000 10 193 989 Local Government Rate Equivalent ................................................................................................ 1 000 805 Wholesale Sales Tax Equivalent..................................................................................................... 150 000 196 115 Funds SA (and subsidiaries)— Local Government Rate Equivalent ................................................................................................ 55 000 144 460 Wholesale Sales Tax equivalent ..................................................................................................... 11 000 13 720 Hills Transit— Income Tax Equivalent.................................................................................................................... — 225 516 Wholesale Sales Tax Equivalent..................................................................................................... 25 000 56 851 HomeStart Finance— Income Tax Equivalent.................................................................................................................... 2 167 000 2 392 301 Wholesale Sales Tax Equivalent..................................................................................................... 31 000 59 144 Industrial and Commercial Premises Corporation— Dividend — 150 141 Income Tax Equivalent.................................................................................................................... 83 000 — Land Management Corporation— Dividend .......................................................................................................................................... 1 766 000 4 628 000 Income Tax Equivalent.................................................................................................................... 1 657 000 2 978 821 Local Government Rate Equivalent ................................................................................................ 105 000 101 302 Wholesale Sales Tax Equivalent..................................................................................................... 20 000 23 935 Lotteries Commission— Income Tax Equivalent.................................................................................................................... 30 978 000 30 261 239 Local Government Rate Equivalent ................................................................................................ 31 000 — Wholesale Sales Tax Equivalent..................................................................................................... 1 565 000 1 374 764 Motor Accident Commission— Dividend .......................................................................................................................................... 10 000 000 — Police Security Services— Income Tax Equivalent.................................................................................................................... 96 000 44 320 Wholesale Sales Tax Equivalent..................................................................................................... 16 000 35 993 Public Trustee Office— Dividend .......................................................................................................................................... 1 500 000 1 500 000 Income Tax Equivalent.................................................................................................................... 1 003 000 1 362 718 Local Government Rate Equivalent ................................................................................................ 22 000 24 299 Wholesale Sales Tax Equivalent..................................................................................................... 85 000 68 674 RESI Corporation (formerly ETSA Corporation)— Dividend .......................................................................................................................................... 167 400 000 67 300 000 Wholesale Sales Tax Equivalent .................................................................................................... — 16 667 RESI OE Pty Ltd (formerly Optima Energy Pty Ltd)— Wholesale Sales Tax Equivalent..................................................................................................... 100 000 22 050 RESI Power Pty Ltd (formerly ETSA Power Pty Ltd)— Income Tax Equivalent.................................................................................................................... 4 400 000 5 481 678 Wholesale Sales Tax Equivalent..................................................................................................... 200 000 66 668 RESI SYN Pty Ltd (formerly Synergen Pty Ltd)— Income Tax Equivalent.................................................................................................................... 3 300 000 5 891 942 Wholesale Sales Tax Equivalent..................................................................................................... — 2 494 RESI Utilities Pty Ltd (formerly ETSA Utilities Pty Ltd)— Dividend .......................................................................................................................................... — — Income Tax Equivalent.................................................................................................................... 51 800 000 33 600 108 Wholesale Sales Tax Equivalent..................................................................................................... 5 400 000 1 671 453 SAGRIC International Pty Ltd— Dividend .......................................................................................................................................... 900 000 900 000 Income Tax Equivalent.................................................................................................................... 740 000 731 542 Wholesale Sales Tax Equivalent..................................................................................................... 50 000 6 567

5
STATEMENT A�continued
COMPARATIVE STATEMENT OF THE ESTIMATED AND ACTUAL RECEIPTS TO THE CONSOLIDATED ACCOUNT, 1999-2000 continued
Estimated Receipts for 1999-2000
Actual Receipts for 1999-2000
RECEIPTS-continued $ $
CONTRIBUTIONS FROM STATE UNDERTAKINGS continued South Australian Asset Management Corporation— Dividend .......................................................................................................................................... 200 619 000 — South Australian Government Captive Insurance Corporation— Income Tax Equivalent.................................................................................................................... 3 628 000 — Payments in lieu of other taxes ....................................................................................................... 4 490 000 1 695 112 Wholesale Sales Tax Equivalent..................................................................................................... 10 000 3 415 South Australian Government Employee Residential Properties— Income Tax Equivalent.................................................................................................................... 288 000 — Wholesale Sales Tax Equivalent..................................................................................................... 48 000 — South Australian Government Financing Authority— Dividend .......................................................................................................................................... 39 040 000 — Income Tax Equivalent.................................................................................................................... 13 960 000 21 546 558 Wholesale Sales Tax Equivalent..................................................................................................... 17 000 27 541 South Australian Housing Trust— Income Tax Equivalent.................................................................................................................... 246 000 518 500 Wholesale Sales Tax Equivalent..................................................................................................... 492 000 492 000 South Australian Ports Corporation— Dividend .......................................................................................................................................... 3 652 000 5 307 000 Income Tax Equivalent.................................................................................................................... 4 538 000 5 017 904 Local Government Rate Equivalent ................................................................................................ 130 000 117 629 Wholesale Sales Tax Equivalent..................................................................................................... 150 000 131 768 South Australian Totalizator Agency Board— Income tax equivalent ..................................................................................................................... 6 743 000 6 567 101 South Australian Water Corporation— Dividend .......................................................................................................................................... 159 900 000 175 200 000 Income Tax Equivalent.................................................................................................................... 56 900 000 34 580 000 Local Government Rate Equivalent ................................................................................................ 900 000 843 209 Wholesale Sales Tax Equivalent..................................................................................................... 2 800 000 3 149 630 Terra Gas Trader Pty Ltd— Dividend .......................................................................................................................................... — 18 000 000 Income Tax Equivalent.................................................................................................................... 1 900 000 3 143 069 Wholesale Sales Tax Equivalent..................................................................................................... — 909 TransAdelaide— Dividend .......................................................................................................................................... — 1 155 000 Local Government Rate Equivalent ................................................................................................ 79 000 33 140 Wholesale Sales Tax Equivalent..................................................................................................... 800 000 530 217 Transport, Urban Planning and the Arts— Dividend .......................................................................................................................................... 8 256 000 3 532 169 Local Government Rate Equivalent ................................................................................................ 82 000 — Wholesale Sales Tax equivalent ..................................................................................................... 1 195 000 182 552 West Beach Trust— Income Tax Equivalent.................................................................................................................... 238 000 — Wholesale Sales Tax Equivalent..................................................................................................... 135 000 140 686
Total Contributions from State Undertakings .................................... 864 856 000 509 840 292
FEES AND CHARGES Auditor-General’s Department___Fees for audit and other sundry receipts.......................................... 8 235 000 8 390 681 Court fees ............................................................................................................................................ 11 743 000 9 492 431 Court fines............................................................................................................................................ 25 186 000 12 640 024 Emergency Services—Ambulance Licence Renewal.......................................................................... — 720 Environment and Heritage................................................................................................................... — 9 117 Environment Protection Agency—Excess Water Charges.................................................................. 400 000 367 773 Guarantee Fees................................................................................................................................... 25 162 000 22 787 086 Infringement notice schemes—Expiation fees..................................................................................... 48 468 000 42 379 932 Legislature—Sale of publications ........................................................................................................ 548 000 15 968 Probate fees ........................................................................................................................................ 2 381 000 2 224 921 Sale of evidence/transcripts___ Non-State Government agencies........................................................ 918 000 961 441 Sale of evidence/transcripts___ State Government agencies................................................................ 357 000 235 204 Sale of Government Gazette ............................................................................................................... 200 000 3 537
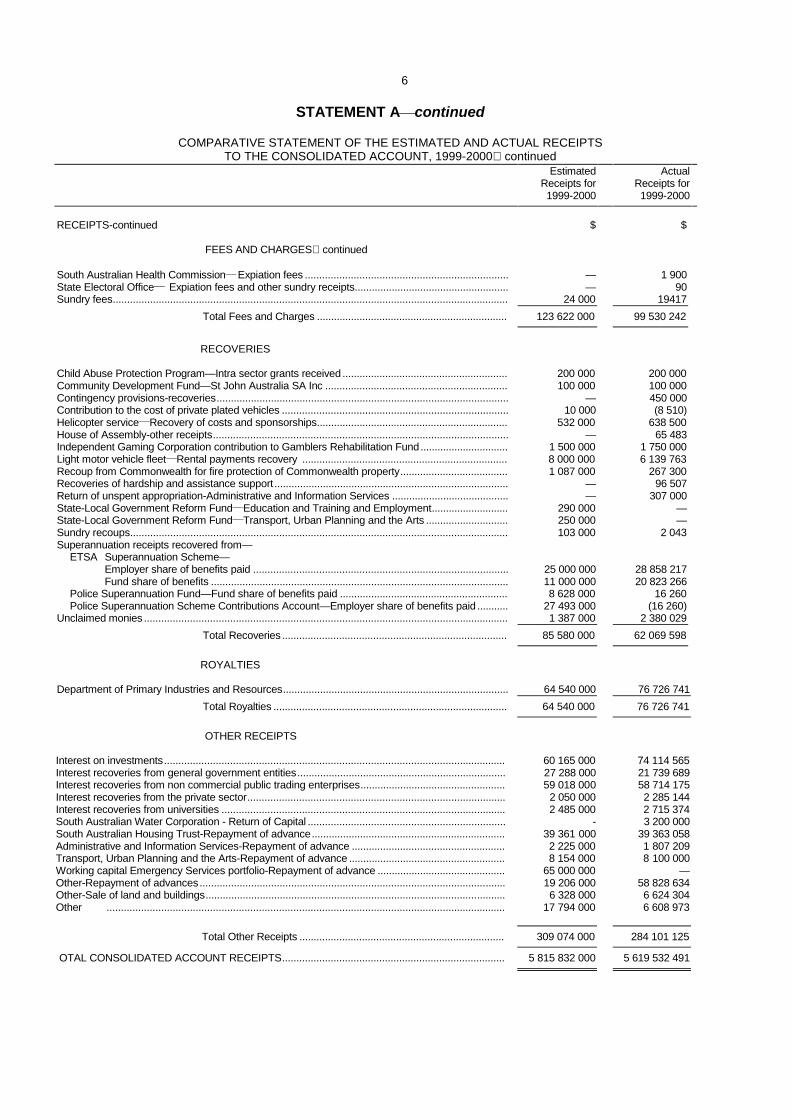
6
STATEMENT A�continued
COMPARATIVE STATEMENT OF THE ESTIMATED AND ACTUAL RECEIPTS TO THE CONSOLIDATED ACCOUNT, 1999-2000 continued
Estimated Receipts for 1999-2000
Actual Receipts for 1999-2000
RECEIPTS-continued $ $
FEES AND CHARGES continued South Australian Health Commission___ Expiation fees ....................................................................... — 1 900 State Electoral Office___ Expiation fees and other sundry receipts...................................................... — 90 Sundry fees.......................................................................................................................................... 24 000 19417
Total Fees and Charges ................................................................... 123 622 000 99 530 242
RECOVERIES Child Abuse Protection Program—Intra sector grants received .......................................................... 200 000 200 000 Community Development Fund—St John Australia SA Inc ................................................................ 100 000 100 000 Contingency provisions-recoveries...................................................................................................... — 450 000 Contribution to the cost of private plated vehicles ............................................................................... 10 000 (8 510) Helicopter service___Recovery of costs and sponsorships................................................................... 532 000 638 500 House of Assembly-other receipts....................................................................................................... — 65 483 Independent Gaming Corporation contribution to Gamblers Rehabilitation Fund............................... 1 500 000 1 750 000 Light motor vehicle fleet___Rental payments recovery ........................................................................ 8 000 000 6 139 763 Recoup from Commonwealth for fire protection of Commonwealth property...................................... 1 087 000 267 300 Recoveries of hardship and assistance support.................................................................................. — 96 507 Return of unspent appropriation-Administrative and Information Services ......................................... — 307 000 State-Local Government Reform Fund___Education and Training and Employment........................... 290 000 — State-Local Government Reform Fund___Transport, Urban Planning and the Arts ............................. 250 000 — Sundry recoups.................................................................................................................................... 103 000 2 043 Superannuation receipts recovered from— ETSA Superannuation Scheme— Employer share of benefits paid ......................................................................................... 25 000 000 28 858 217 Fund share of benefits ........................................................................................................ 11 000 000 20 823 266 Police Superannuation Fund—Fund share of benefits paid ........................................................... 8 628 000 16 260 Police Superannuation Scheme Contributions Account—Employer share of benefits paid ........... 27 493 000 (16 260) Unclaimed monies ............................................................................................................................... 1 387 000 2 380 029
Total Recoveries............................................................................... 85 580 000 62 069 598
ROYALTIES Department of Primary Industries and Resources............................................................................... 64 540 000 76 726 741
Total Royalties .................................................................................. 64 540 000 76 726 741
OTHER RECEIPTS Interest on investments....................................................................................................................... 60 165 000 74 114 565 Interest recoveries from general government entities......................................................................... 27 288 000 21 739 689 Interest recoveries from non commercial public trading enterprises................................................... 59 018 000 58 714 175 Interest recoveries from the private sector.......................................................................................... 2 050 000 2 285 144 Interest recoveries from universities ................................................................................................... 2 485 000 2 715 374 South Australian Water Corporation - Return of Capital ..................................................................... - 3 200 000 South Australian Housing Trust-Repayment of advance.................................................................... 39 361 000 39 363 058 Administrative and Information Services-Repayment of advance ...................................................... 2 225 000 1 807 209 Transport, Urban Planning and the Arts-Repayment of advance ....................................................... 8 154 000 8 100 000 Working capital Emergency Services portfolio-Repayment of advance ............................................. 65 000 000 — Other-Repayment of advances........................................................................................................... 19 206 000 58 828 634 Other-Sale of land and buildings......................................................................................................... 6 328 000 6 624 304 Other ........................................................................................................................................... 17 794 000 6 608 973
Total Other Receipts ........................................................................ 309 074 000 284 101 125
OTAL CONSOLIDATED ACCOUNT RECEIPTS.............................................................................. 5 815 832 000 5 619 532 491
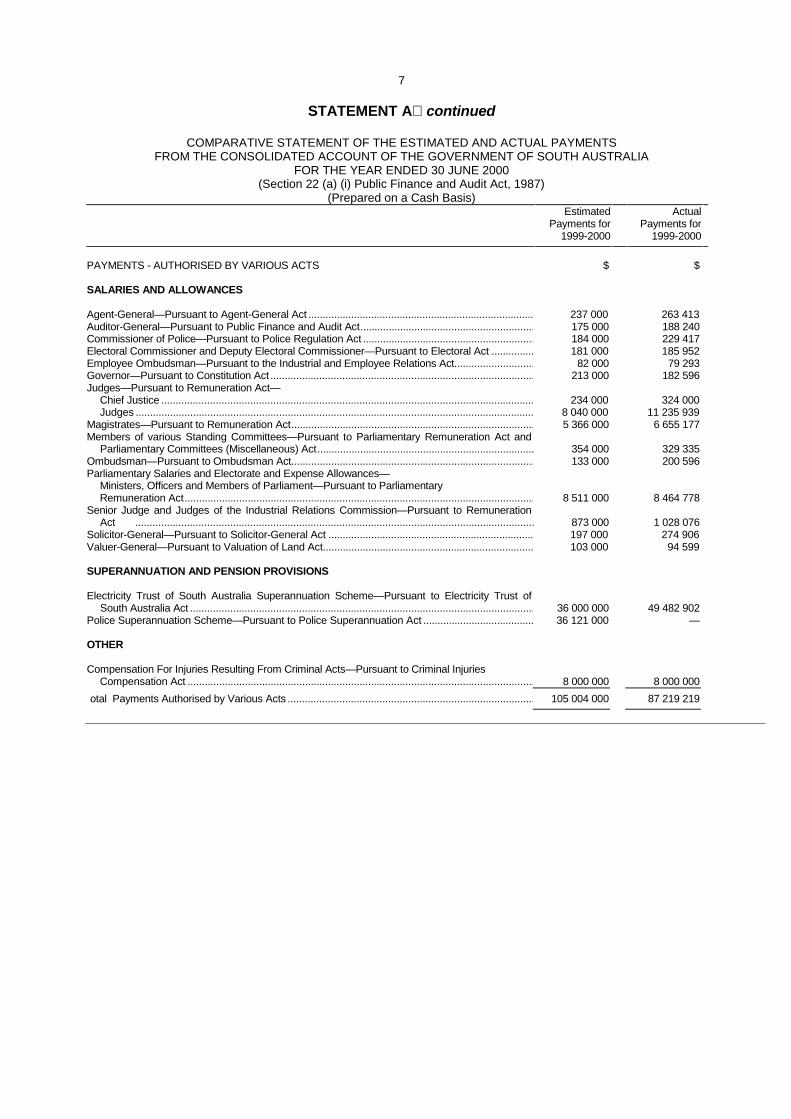
7
STATEMENT A continued
COMPARATIVE STATEMENT OF THE ESTIMATED AND ACTUAL PAYMENTS FROM THE CONSOLIDATED ACCOUNT OF THE GOVERNMENT OF SOUTH AUSTRALIA
FOR THE YEAR ENDED 30 JUNE 2000 (Section 22 (a) (i) Public Finance and Audit Act, 1987)
(Prepared on a Cash Basis) Estimated
Payments for 1999-2000
Actual Payments for
1999-2000
PAYMENTS - AUTHORISED BY VARIOUS ACTS
$ $
SALARIES AND ALLOWANCES Agent-General—Pursuant to Agent-General Act ............................................................................... 237 000 263 413 Auditor-General—Pursuant to Public Finance and Audit Act............................................................. 175 000 188 240 Commissioner of Police—Pursuant to Police Regulation Act ............................................................ 184 000 229 417 Electoral Commissioner and Deputy Electoral Commissioner—Pursuant to Electoral Act ............... 181 000 185 952 Employee Ombudsman—Pursuant to the Industrial and Employee Relations Act............................ 82 000 79 293 Governor—Pursuant to Constitution Act ............................................................................................ 213 000 182 596 Judges—Pursuant to Remuneration Act— Chief Justice .................................................................................................................................. 234 000 324 000 Judges ........................................................................................................................................... 8 040 000 11 235 939 Magistrates—Pursuant to Remuneration Act..................................................................................... 5 366 000 6 655 177 Members of various Standing Committees—Pursuant to Parliamentary Remuneration Act and
Parliamentary Committees (Miscellaneous) Act............................................................................
354 000
329 335
Ombudsman—Pursuant to Ombudsman Act..................................................................................... 133 000 200 596 Parliamentary Salaries and Electorate and Expense Allowances— Ministers, Officers and Members of Parliament—Pursuant to Parliamentary Remuneration Act..........................................................................................................................
8 511 000
8 464 778
Senior Judge and Judges of the Industrial Relations Commission—Pursuant to Remuneration Act ...........................................................................................................................................
873 000
1 028 076
Solicitor-General—Pursuant to Solicitor-General Act ........................................................................ 197 000 274 906 Valuer-General—Pursuant to Valuation of Land Act.......................................................................... 103 000 94 599 SUPERANNUATION AND PENSION PROVISIONS Electricity Trust of South Australia Superannuation Scheme—Pursuant to Electricity Trust of
South Australia Act ........................................................................................................................
36 000 000
49 482 902
Police Superannuation Scheme—Pursuant to Police Superannuation Act ....................................... 36 121 000 — OTHER Compensation For Injuries Resulting From Criminal Acts—Pursuant to Criminal Injuries Compensation Act .........................................................................................................................
8 000 000
8 000 000
otal Payments Authorised by Various Acts ...................................................................................... 105 004 000 87 219 219
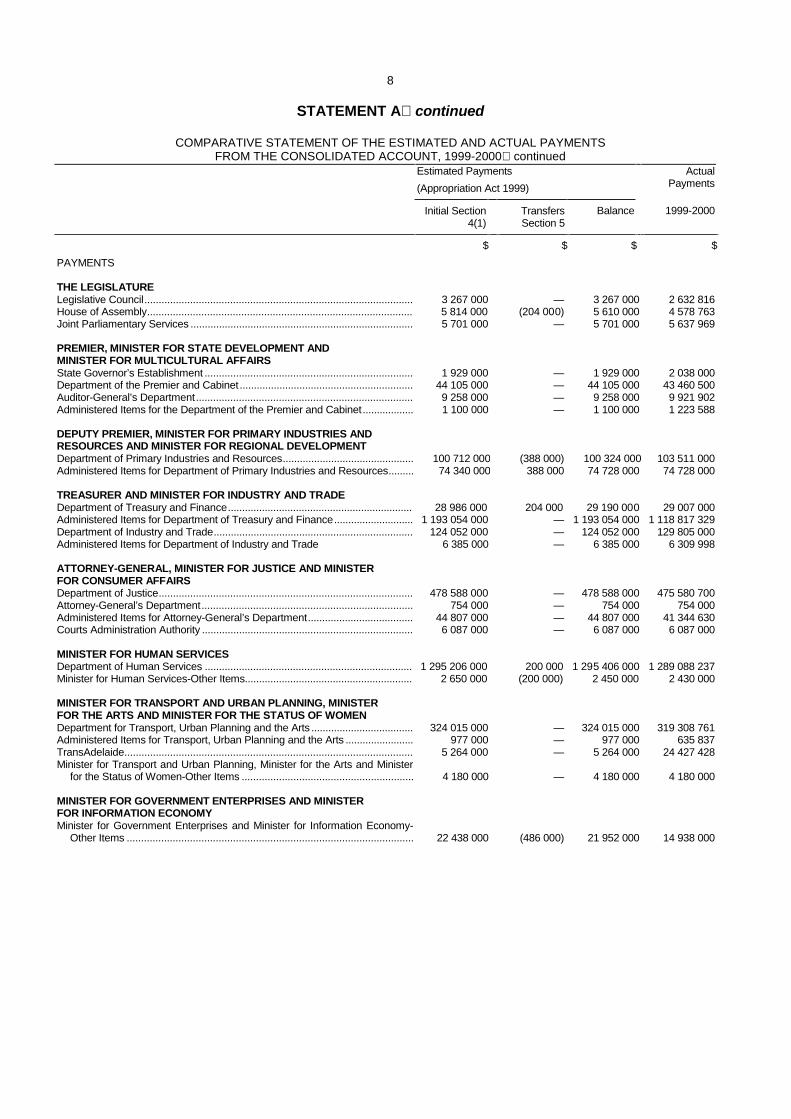
8
STATEMENT A continued
COMPARATIVE STATEMENT OF THE ESTIMATED AND ACTUAL PAYMENTS FROM THE CONSOLIDATED ACCOUNT, 1999-2000 continued
Estimated Payments
(Appropriation Act 1999) Actual
Payments
Initial Section 4(1)
Transfers Section 5
Balance 1999-2000
$ $ $ $
PAYMENTS THE LEGISLATURE Legislative Council.............................................................................................. 3 267 000 — 3 267 000 2 632 816 House of Assembly............................................................................................. 5 814 000 (204 000) 5 610 000 4 578 763 Joint Parliamentary Services .............................................................................. 5 701 000 — 5 701 000 5 637 969 PREMIER, MINISTER FOR STATE DEVELOPMENT AND MINISTER FOR MULTICULTURAL AFFAIRS State Governor’s Establishment ......................................................................... 1 929 000 — 1 929 000 2 038 000 Department of the Premier and Cabinet............................................................. 44 105 000 — 44 105 000 43 460 500 Auditor-General’s Department............................................................................ 9 258 000 — 9 258 000 9 921 902 Administered Items for the Department of the Premier and Cabinet.................. 1 100 000 — 1 100 000 1 223 588 DEPUTY PREMIER, MINISTER FOR PRIMARY INDUSTRIES AND RESOURCES AND MINISTER FOR REGIONAL DEVELOPMENT Department of Primary Industries and Resources.............................................. 100 712 000 (388 000) 100 324 000 103 511 000 Administered Items for Department of Primary Industries and Resources......... 74 340 000 388 000 74 728 000 74 728 000 TREASURER AND MINISTER FOR INDUSTRY AND TRADE Department of Treasury and Finance................................................................. 28 986 000 204 000 29 190 000 29 007 000 Administered Items for Department of Treasury and Finance............................ 1 193 054 000 — 1 193 054 000 1 118 817 329 Department of Industry and Trade...................................................................... 124 052 000 — 124 052 000 129 805 000 Administered Items for Department of Industry and Trade 6 385 000 — 6 385 000 6 309 998 ATTORNEY-GENERAL, MINISTER FOR JUSTICE AND MINISTER FOR CONSUMER AFFAIRS Department of Justice......................................................................................... 478 588 000 — 478 588 000 475 580 700 Attorney-General’s Department.......................................................................... 754 000 — 754 000 754 000 Administered Items for Attorney-General’s Department..................................... 44 807 000 — 44 807 000 41 344 630 Courts Administration Authority .......................................................................... 6 087 000 — 6 087 000 6 087 000 MINISTER FOR HUMAN SERVICES Department of Human Services ......................................................................... 1 295 206 000 200 000 1 295 406 000 1 289 088 237 Minister for Human Services-Other Items........................................................... 2 650 000 (200 000) 2 450 000 2 430 000 MINISTER FOR TRANSPORT AND URBAN PLANNING, MINISTER FOR THE ARTS AND MINISTER FOR THE STATUS OF WOMEN Department for Transport, Urban Planning and the Arts .................................... 324 015 000 — 324 015 000 319 308 761 Administered Items for Transport, Urban Planning and the Arts ........................ 977 000 — 977 000 635 837 TransAdelaide..................................................................................................... 5 264 000 — 5 264 000 24 427 428 Minister for Transport and Urban Planning, Minister for the Arts and Minister
for the Status of Women-Other Items ............................................................
4 180 000
—
4 180 000
4 180 000 MINISTER FOR GOVERNMENT ENTERPRISES AND MINISTER FOR INFORMATION ECONOMY Minister for Government Enterprises and Minister for Information Economy-
Other Items ....................................................................................................
22 438 000
(486 000)
21 952 000
14 938 000
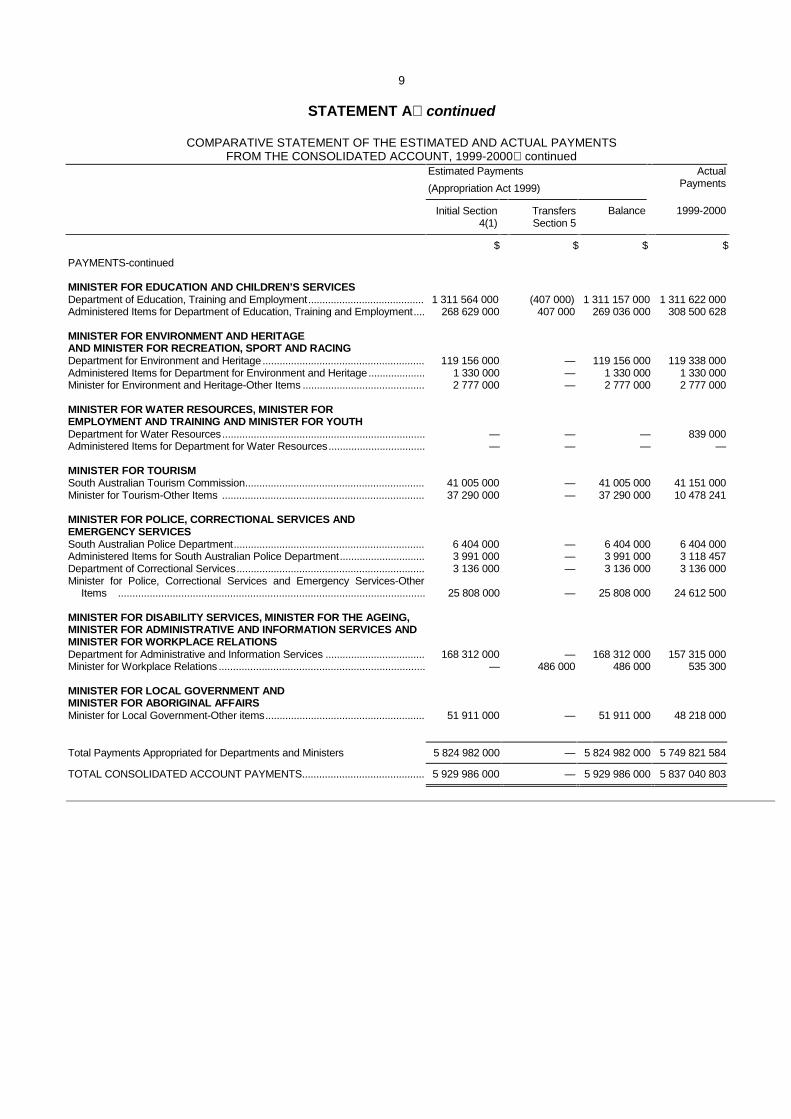
9
STATEMENT A continued
COMPARATIVE STATEMENT OF THE ESTIMATED AND ACTUAL PAYMENTS FROM THE CONSOLIDATED ACCOUNT, 1999-2000 continued
Estimated Payments
(Appropriation Act 1999) Actual
Payments
Initial Section 4(1)
Transfers Section 5
Balance 1999-2000
$ $ $ $
PAYMENTS-continued MINISTER FOR EDUCATION AND CHILDREN’S SERVICES Department of Education, Training and Employment......................................... 1 311 564 000 (407 000) 1 311 157 000 1 311 622 000 Administered Items for Department of Education, Training and Employment.... 268 629 000 407 000 269 036 000 308 500 628 MINISTER FOR ENVIRONMENT AND HERITAGE AND MINISTER FOR RECREATION, SPORT AND RACING Department for Environment and Heritage......................................................... 119 156 000 — 119 156 000 119 338 000 Administered Items for Department for Environment and Heritage.................... 1 330 000 — 1 330 000 1 330 000 Minister for Environment and Heritage-Other Items ........................................... 2 777 000 — 2 777 000 2 777 000 MINISTER FOR WATER RESOURCES, MINISTER FOR EMPLOYMENT AND TRAINING AND MINISTER FOR YOUTH Department for Water Resources....................................................................... — — — 839 000 Administered Items for Department for Water Resources.................................. — — — — MINISTER FOR TOURISM South Australian Tourism Commission............................................................... 41 005 000 — 41 005 000 41 151 000 Minister for Tourism-Other Items ....................................................................... 37 290 000 — 37 290 000 10 478 241 MINISTER FOR POLICE, CORRECTIONAL SERVICES AND EMERGENCY SERVICES South Australian Police Department................................................................... 6 404 000 — 6 404 000 6 404 000 Administered Items for South Australian Police Department.............................. 3 991 000 — 3 991 000 3 118 457 Department of Correctional Services.................................................................. 3 136 000 — 3 136 000 3 136 000 Minister for Police, Correctional Services and Emergency Services-Other
Items ...........................................................................................................
25 808 000
—
25 808 000
24 612 500 MINISTER FOR DISABILITY SERVICES, MINISTER FOR THE AGEING, MINISTER FOR ADMINISTRATIVE AND INFORMATION SERVICES AND MINISTER FOR WORKPLACE RELATIONS Department for Administrative and Information Services ................................... 168 312 000 — 168 312 000 157 315 000 Minister for Workplace Relations ........................................................................ — 486 000 486 000 535 300 MINISTER FOR LOCAL GOVERNMENT AND MINISTER FOR ABORIGINAL AFFAIRS Minister for Local Government-Other items........................................................ 51 911 000 — 51 911 000 48 218 000
Total Payments Appropriated for Departments and Ministers 5 824 982 000 — 5 824 982 000 5 749 821 584
TOTAL CONSOLIDATED ACCOUNT PAYMENTS........................................... 5 929 986 000 — 5 929 986 000 5 837 040 803

10
STATEMENT B
SUMMARY OF MOVEMENTS OF FUNDS OF THE TREASURER DURING THE YEAR ENDED 30 JUNE 2000
(Section 22 (a) (ii) Public Finance and Audit Act, 1987) (Prepared on a Cash Basis)
1999-2000 1998-99
$’000 $’000 SOURCE OF FUNDS Consolidated Account Receipts Taxation ....................................................................................................................................................... 2 614 664 2 334 546 Commonwealth General Purpose Grants................................................................................................. 1 718 072 1 676 832 Commonwealth Specific Purpose Grants ................................................................................................. 254 529 230 122 Contributions from State Undertakings........................................................................................................ 509 840 536 290 Fees and Charges ....................................................................................................................................... 99 530 104 001 Recoveries................................................................................................................................................... 62 070 132 170 Royalties ...................................................................................................................................................... 76 727 58 681 Other Receipts............................................................................................................................................. 284 101 314 358 Total Receipts ................................................................................................................................................... 5 619 533 5 387 000 Borrowing from the South Australian Government Financing Authority (a) ....................................................... 217 508 400 457 Increase in balance of Special Deposit Accounts ............................................................................................. 1 041 869 355 247 Increase in balance of Deposits lodged with the Treasurer .............................................................................. 194 644 46 652 Decrease in balance of Imprest Accounts......................................................................................................... — 73
7 073 554 6 189 429
APPLICATION OF FUNDS Consolidated Account Payments ...................................................................................................................... 5 837 041 5 787 457 Increase in deposits by the Treasurer with SAFA............................................................................................. 1 189 557 303 357 Increase in deposits by the Treasurer with LGFA............................................................................................. 5 800 6 900 Increase in cash at bank ................................................................................................................................... 22 000 51 068 Decrease in the value of cheques drawn but not presented............................................................................. 19 156 40 647
7 073 554 6 189 429
(a) As reported in Statement A and J, the deficit on Consolidated Account for 1999-2000 was met by borrowings from the South Australian Government Financing Authority of that amount.
JIM WRIGHT, Under Treasurer ROB LUCAS, Treasurer

11
STATEMENT C
FUNDS OF THE TREASURER AS AT 30 JUNE 2000 (Section 22 (a) (xiv) Public Finance and Audit Act, 1987)
1999-2000
$’000
1998-99
$’000
BALANCE OF FUNDS CONSOLIDATED ACCOUNT See Statement A.......................................................................... — — SPECIAL DEPOSIT ACCOUNT BALANCES See Statement F.................................................. 2 308 220 1 266 351 DEPOSITS LODGED WITH THE TREASURER See Statement G ............................................ 630 822 436 178 CHEQUES DRAWN BUT NOT PRESENTED................................................................................ 41 570 60 726
2 980 612 1 763 255
REPRESENTED BY CASH AT BANK.............................................................................................................................. 317 778 295 778 DEPOSITS WITH SOUTH AUSTRALIAN GOVERNMENT FINANCING AUTHORITY—See Statement J ..................................................................................................
2 631 848
1 442 291
DEPOSITS WITH LOCAL GOVERNMENT FINANCE AUTHORITY OF SA See Statement E ......................................................................................................................
29 300
23 500
DEPARTMENTAL IMPREST ACCOUNTS See Statement H ..................................................... 1 686 1 686
2 980 612 1 763 255
JIM WRIGHT, Under Treasurer ROB LUCAS, Treasurer
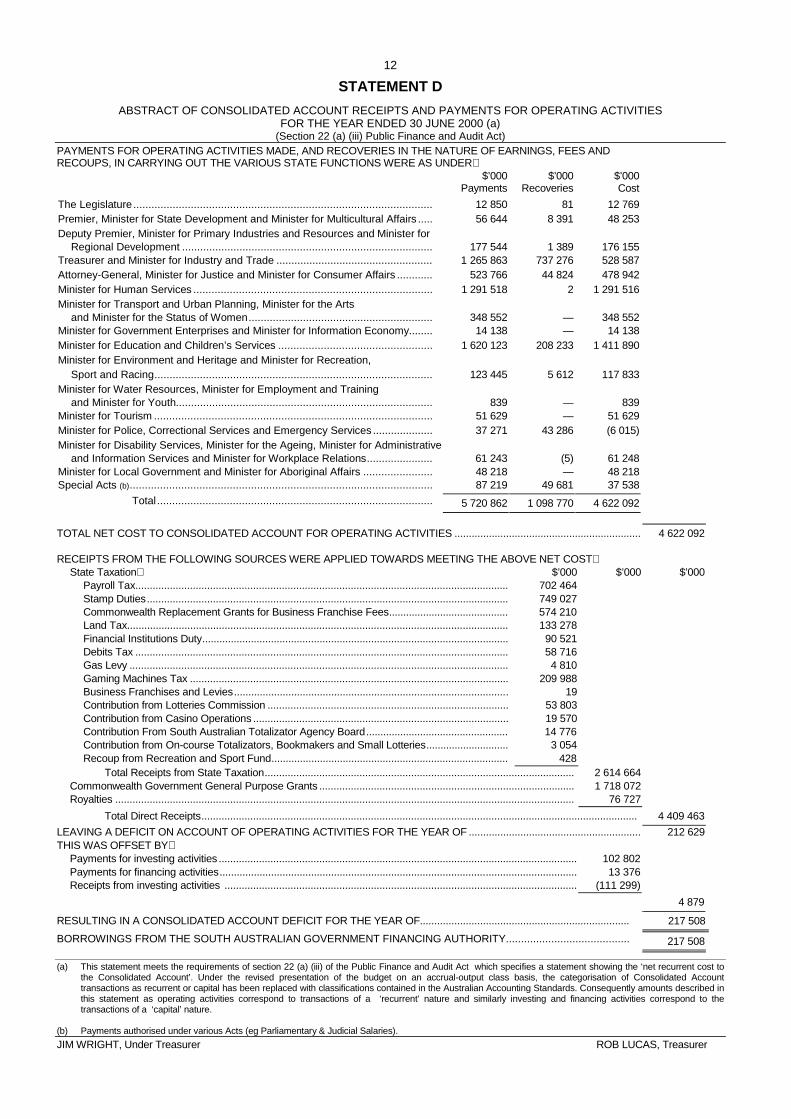
12
STATEMENT D
ABSTRACT OF CONSOLIDATED ACCOUNT RECEIPTS AND PAYMENTS FOR OPERATING ACTIVITIES FOR THE YEAR ENDED 30 JUNE 2000 (a)
(Section 22 (a) (iii) Public Finance and Audit Act) PAYMENTS FOR OPERATING ACTIVITIES MADE, AND RECOVERIES IN THE NATURE OF EARNINGS, FEES AND RECOUPS, IN CARRYING OUT THE VARIOUS STATE FUNCTIONS WERE AS UNDER $’000
Payments $’000
Recoveries $’000 Cost
The Legislature ................................................................................................... 12 850 81 12 769 Premier, Minister for State Development and Minister for Multicultural Affairs ..... 56 644 8 391 48 253 Deputy Premier, Minister for Primary Industries and Resources and Minister for Regional Development ................................................................................... 177 544 1 389 176 155 Treasurer and Minister for Industry and Trade .................................................... 1 265 863 737 276 528 587 Attorney-General, Minister for Justice and Minister for Consumer Affairs ............ 523 766 44 824 478 942 Minister for Human Services ............................................................................... 1 291 518 2 1 291 516 Minister for Transport and Urban Planning, Minister for the Arts and Minister for the Status of Women............................................................. 348 552 — 348 552 Minister for Government Enterprises and Minister for Information Economy........ 14 138 — 14 138 Minister for Education and Children’s Services ................................................... 1 620 123 208 233 1 411 890 Minister for Environment and Heritage and Minister for Recreation, Sport and Racing............................................................................................ 123 445 5 612 117 833 Minister for Water Resources, Minister for Employment and Training and Minister for Youth..................................................................................... 839 — 839 Minister for Tourism ............................................................................................ 51 629 — 51 629 Minister for Police, Correctional Services and Emergency Services .................... 37 271 43 286 (6 015) Minister for Disability Services, Minister for the Ageing, Minister for Administrative and Information Services and Minister for Workplace Relations...................... 61 243 (5) 61 248 Minister for Local Government and Minister for Aboriginal Affairs ....................... 48 218 — 48 218 Special Acts (b).................................................................................................... 87 219 49 681 37 538
Total........................................................................................... 5 720 862 1 098 770 4 622 092
TOTAL NET COST TO CONSOLIDATED ACCOUNT FOR OPERATING ACTIVITIES ................................................................. 4 622 092
RECEIPTS FROM THE FOLLOWING SOURCES WERE APPLIED TOWARDS MEETING THE ABOVE NET COST State Taxation $’000 $’000 $’000 Payroll Tax.................................................................................................................................. 702 464 Stamp Duties.............................................................................................................................. 749 027 Commonwealth Replacement Grants for Business Franchise Fees.......................................... 574 210 Land Tax..................................................................................................................................... 133 278 Financial Institutions Duty........................................................................................................... 90 521 Debits Tax .................................................................................................................................. 58 716 Gas Levy .................................................................................................................................... 4 810 Gaming Machines Tax ............................................................................................................... 209 988 Business Franchises and Levies................................................................................................ 19 Contribution from Lotteries Commission .................................................................................... 53 803 Contribution from Casino Operations ......................................................................................... 19 570 Contribution From South Australian Totalizator Agency Board.................................................. 14 776 Contribution from On-course Totalizators, Bookmakers and Small Lotteries............................. 3 054 Recoup from Recreation and Sport Fund................................................................................... 428 Total Receipts from State Taxation............................................................................................................ 2 614 664 Commonwealth Government General Purpose Grants ......................................................................................... 1 718 072 Royalties ................................................................................................................................................................ 76 727
Total Direct Receipts........................................................................................................................................................ 4 409 463
LEAVING A DEFICIT ON ACCOUNT OF OPERATING ACTIVITIES FOR THE YEAR OF ............................................................ 212 629 THIS WAS OFFSET BY Payments for investing activities ............................................................................................................................. 102 802 Payments for financing activities............................................................................................................................. 13 376 Receipts from investing activities ........................................................................................................................... (111 299) 4 879
RESULTING IN A CONSOLIDATED ACCOUNT DEFICIT FOR THE YEAR OF......................................................................... 217 508
BORROWINGS FROM THE SOUTH AUSTRALIAN GOVERNMENT FINANCING AUTHORITY......................................... 217 508
(a) This statement meets the requirements of section 22 (a) (iii) of the Public Finance and Audit Act which specifies a statement showing the ‘net recurrent cost to the Consolidated Account’. Under the revised presentation of the budget on an accrual-output class basis, the categorisation of Consolidated Account transactions as recurrent or capital has been replaced with classifications contained in the Australian Accounting Standards. Consequently amounts described in this statement as operating activities correspond to transactions of a ‘recurrent’ nature and similarly investing and financing activities correspond to the transactions of a ‘capital’ nature.
(b) Payments authorised under various Acts (eg Parliamentary & Judicial Salaries).
JIM WRIGHT, Under Treasurer ROB LUCAS, Treasurer
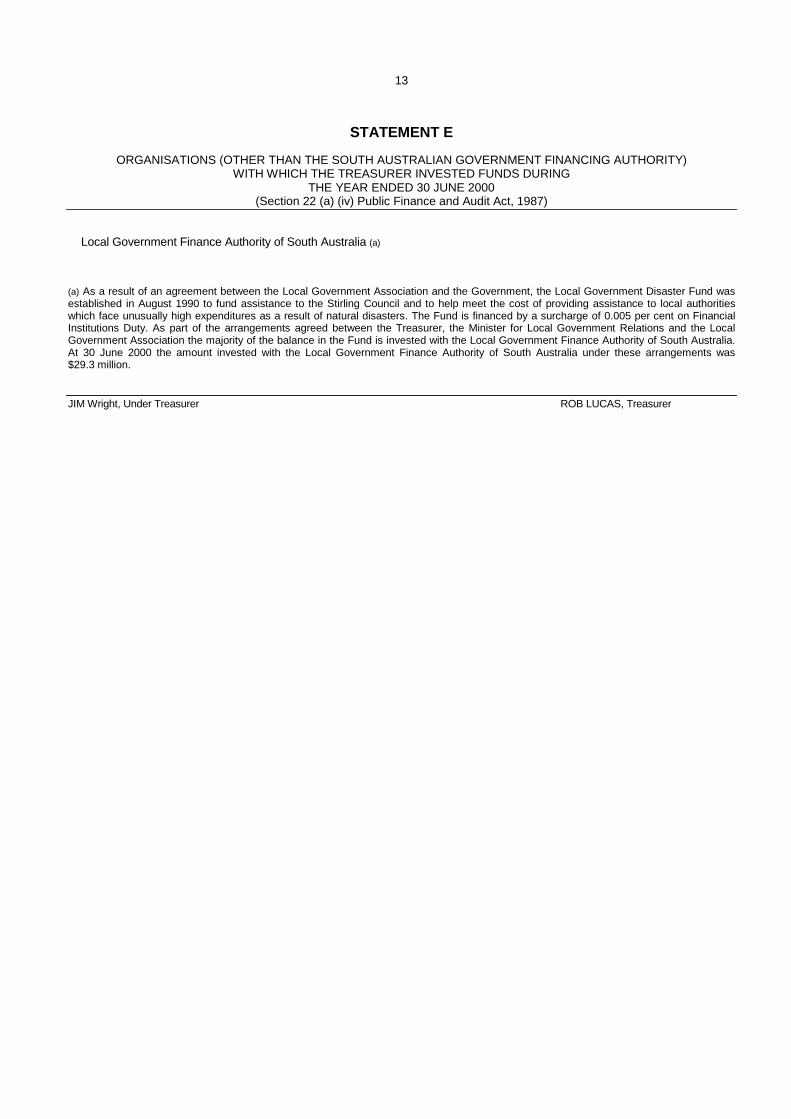
13
STATEMENT E
ORGANISATIONS (OTHER THAN THE SOUTH AUSTRALIAN GOVERNMENT FINANCING AUTHORITY) WITH WHICH THE TREASURER INVESTED FUNDS DURING
THE YEAR ENDED 30 JUNE 2000 (Section 22 (a) (iv) Public Finance and Audit Act, 1987)
Local Government Finance Authority of South Australia (a) (a) As a result of an agreement between the Local Government Association and the Government, the Local Government Disaster Fund was established in August 1990 to fund assistance to the Stirling Council and to help meet the cost of providing assistance to local authorities which face unusually high expenditures as a result of natural disasters. The Fund is financed by a surcharge of 0.005 per cent on Financial Institutions Duty. As part of the arrangements agreed between the Treasurer, the Minister for Local Government Relations and the Local Government Association the majority of the balance in the Fund is invested with the Local Government Finance Authority of South Australia. At 30 June 2000 the amount invested with the Local Government Finance Authority of South Australia under these arrangements was $29.3 million. JIM Wright, Under Treasurer ROB LUCAS, Treasurer
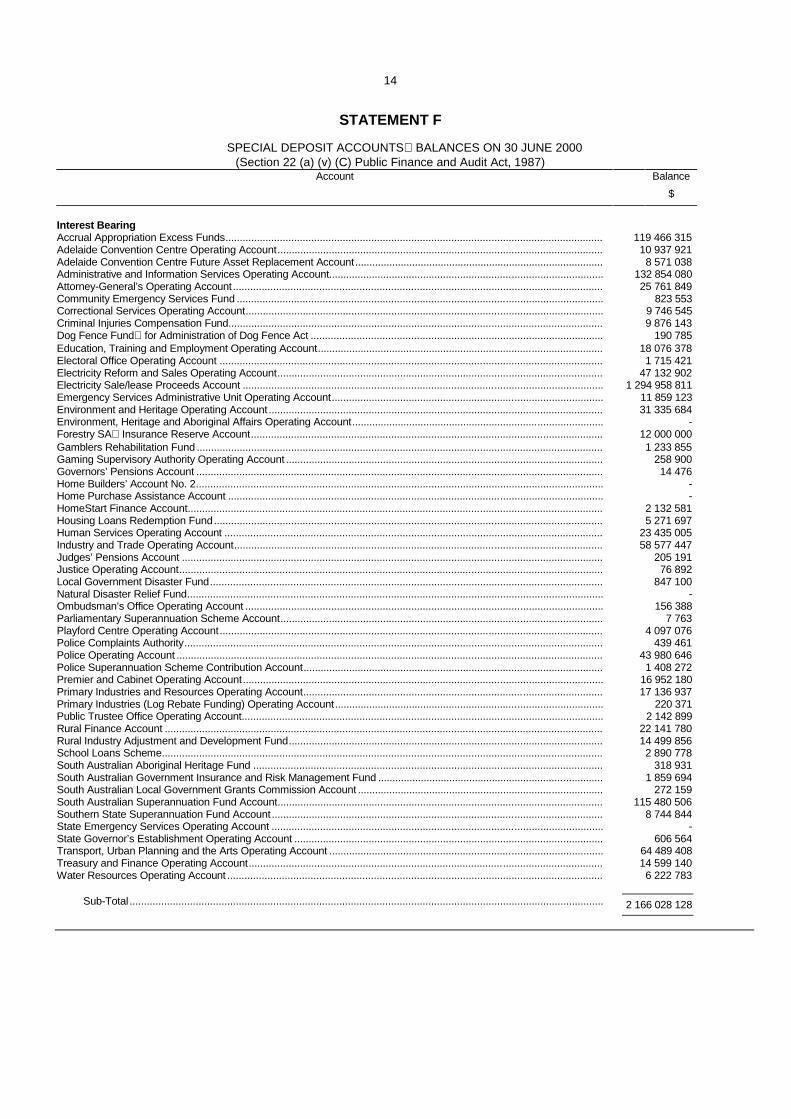
14
STATEMENT F
SPECIAL DEPOSIT ACCOUNTS BALANCES ON 30 JUNE 2000 (Section 22 (a) (v) (C) Public Finance and Audit Act, 1987)
Account Balance
$
Interest Bearing� Accrual Appropriation Excess Funds.................................................................................................................................... 119 466 315 Adelaide Convention Centre Operating Account.................................................................................................................. 10 937 921 Adelaide Convention Centre Future Asset Replacement Account....................................................................................... 8 571 038 Administrative and Information Services Operating Account................................................................................................ 132 854 080 Attorney-General’s Operating Account................................................................................................................................. 25 761 849 Community Emergency Services Fund ................................................................................................................................ 823 553 Correctional Services Operating Account............................................................................................................................. 9 746 545 Criminal Injuries Compensation Fund................................................................................................................................... 9 876 143 Dog Fence Fund for Administration of Dog Fence Act ...................................................................................................... 190 785 Education, Training and Employment Operating Account.................................................................................................... 18 076 378 Electoral Office Operating Account ...................................................................................................................................... 1 715 421 Electricity Reform and Sales Operating Account.................................................................................................................. 47 132 902 Electricity Sale/lease Proceeds Account .............................................................................................................................. 1 294 958 811 Emergency Services Administrative Unit Operating Account............................................................................................... 11 859 123 Environment and Heritage Operating Account ..................................................................................................................... 31 335 684 Environment, Heritage and Aboriginal Affairs Operating Account........................................................................................ - Forestry SA Insurance Reserve Account........................................................................................................................... 12 000 000 Gamblers Rehabilitation Fund .............................................................................................................................................. 1 233 855 Gaming Supervisory Authority Operating Account ............................................................................................................... 258 900 Governors’ Pensions Account .............................................................................................................................................. 14 476 Home Builders’ Account No. 2.............................................................................................................................................. - Home Purchase Assistance Account ................................................................................................................................... - HomeStart Finance Account................................................................................................................................................. 2 132 581 Housing Loans Redemption Fund........................................................................................................................................ 5 271 697 Human Services Operating Account .................................................................................................................................... 23 435 005 Industry and Trade Operating Account................................................................................................................................. 58 577 447 Judges’ Pensions Account ................................................................................................................................................... 205 191 Justice Operating Account.................................................................................................................................................... 76 892 Local Government Disaster Fund......................................................................................................................................... 847 100 Natural Disaster Relief Fund................................................................................................................................................. - Ombudsman’s Office Operating Account ............................................................................................................................. 156 388 Parliamentary Superannuation Scheme Account................................................................................................................. 7 763 Playford Centre Operating Account...................................................................................................................................... 4 097 076 Police Complaints Authority.................................................................................................................................................. 439 461 Police Operating Account ..................................................................................................................................................... 43 980 646 Police Superannuation Scheme Contribution Account......................................................................................................... 1 408 272 Premier and Cabinet Operating Account.............................................................................................................................. 16 952 180 Primary Industries and Resources Operating Account......................................................................................................... 17 136 937 Primary Industries (Log Rebate Funding) Operating Account.............................................................................................. 220 371 Public Trustee Office Operating Account.............................................................................................................................. 2 142 899 Rural Finance Account ......................................................................................................................................................... 22 141 780 Rural Industry Adjustment and Development Fund.............................................................................................................. 14 499 856 School Loans Scheme.......................................................................................................................................................... 2 890 778 South Australian Aboriginal Heritage Fund .......................................................................................................................... 318 931 South Australian Government Insurance and Risk Management Fund ............................................................................... 1 859 694 South Australian Local Government Grants Commission Account ...................................................................................... 272 159 South Australian Superannuation Fund Account.................................................................................................................. 115 480 506 Southern State Superannuation Fund Account.................................................................................................................... 8 744 844 State Emergency Services Operating Account .................................................................................................................... - State Governor’s Establishment Operating Account ............................................................................................................ 606 564 Transport, Urban Planning and the Arts Operating Account ................................................................................................ 64 489 408 Treasury and Finance Operating Account............................................................................................................................ 14 599 140 Water Resources Operating Account ................................................................................................................................... 6 222 783 Sub-Total ..................................................................................................................................................................... 2 166 028 128

15
STATEMENT F�continued
SPECIAL DEPOSIT ACCOUNTS BALANCES ON 30 JUNE 2000 (Section 22 (a) (v) (C) Public Finance and Audit Act, 1987)
Account Balance $
Non-interest bearing� Agency Provisions for Future Asset Replacements.............................................................................................................. 7 496 348 Asset Sales Operating Account ............................................................................................................................................ 36 750 172 BankSA Sale Account........................................................................................................................................................... 445 859 Charitable and Social Welfare Fund..................................................................................................................................... 1 469 614 Commonwealth Mirror Taxes on Commonwealth Places Revenue Account ....................................................................... - Dingo Control Fund............................................................................................................................................................... 30 514 Egg Industry Deregulation Account ...................................................................................................................................... 465 785 Firearms Acquisition / Compensation Account..................................................................................................................... 274 225 Firearms Acquisition/Disposal - Full-Time Firearms Dealers................................................................................................ 380 919 Government Workers Rehabilitation and Compensation Fund ............................................................................................ 6 171 816 Highways Fund..................................................................................................................................................................... 29 574 313 Hospitals Fund...................................................................................................................................................................... - Industry Development Fund.................................................................................................................................................. - Interregional Settlements Residues Account........................................................................................................................ 517 694 Local Government Disaster Fund......................................................................................................................................... 29 300 000 Motor Vehicles Clearing Account....................................................................................................................................... 13 841 846 Office for Government Enterprises Asset Sales Operating Account .................................................................................... 53 398 SAAMC - Returns to Treasurer............................................................................................................................................. 1 799 990 Sale of Government Land and Property ............................................................................................................................... 4 329 421 South Australian Electricity Supply Industry Planning Council Operating Account ........................................................... 1 192 526 South Australian Independent Industry Regulator Operating Account ................................................................................. 1 203 107 Sport and Recreation Fund................................................................................................................................................... 1 937 072 State Local Government Reform Fund .............................................................................................................................. 4 034 000 Stony Point (Liquids Project) Indenture Account .................................................................................................................. - Targeted/Voluntary Separation Package Schemes.............................................................................................................. - Totalizator Dividends Adjustment Account ........................................................................................................................... 203 118 Treasury Working Account................................................................................................................................................. 719 822 Sub-Total ..................................................................................................................................................................... 142 191 559
Total Special Deposit Accounts................................................................................................................................... 2 308 219 687
JIM WRIGHT, Under Treasurer ROB LUCAS, Treasurer

16
STATEMENT F (1)
SPECIAL DEPOSIT ACCOUNTS IN OPERATION ON 30 JUNE 2000 (Section 22 (a) (v) (B) Public Finance and Audit Act, 1987)
Account Purpose
Accrual Appropriation Excess Funds .......................... To record all receipts and payments associated with surplus cash
balances generated in agencies by the shift to accrual appropriations.
Adelaide Convention Centre Future Asset Replacement Account .................................................
To record all receipts and payments associated with surplus cash balances generated by the Adelaide Convention Centre for future asset replacement.
Adelaide Convention Centre Operating Account........ To record receipts and disbursements relating to the operation of the Adelaide Convention Centre and borrowings by the Minister of Tourism.
Administrative and Information Services Operating Account ......................................................................
To record all the activities of the Department (including those formerly carried on by the Department for State Government Services, and the Department of Information Technology Services, and the Department of Primary industries (Forestry), and the Land Titles Office component of the Department of Environment and Natural Resources, and the Industrial Relations Programs and Services component of the Department for Industrial Affairs, and the Registration and Licensing component of the Department of Transport) including recurrent and capital expenditures, revenue from various activities, injections of funds provided from the Consolidated Account and borrowings.
Agency Provisions for Future Asset Replacements.... To record all receipts and payments associated with surplus cash balances generated within agencies for future asset replacements.
Asset Sales Operating Account .................................. To record all of the financial transactions of the Asset Sales Unit including expenses incurred by the Asset Management Task Force prior to 31 March 1997 not yet brought to account, recurrent and capital expenditure on disposal of assets, revenue from various activities, injections of funds provided from the Consolidated Account and to apply net proceeds from asset sales to repay the Government’s indebtedness to SAFA or for other approved purposes.
Attorney-General’s Operating Account ....................... To record all of the activities of the Department (including those carried on by the Attorney-General’s and Public and Consumer Affairs components of the former Department of Justice) including recurrent and capital expenditures, revenue from various activities, injections of funds provided from the Consolidated Account and borrowings.
BankSA Sale Account ................................................. To record all of the activities of the BankSA Sale Task Force including recurrent and capital expenditures, revenue from various activities, injections of funds provided from the Consolidated Account and to apply proceeds from asset sales to the repayment of the Government’s indebtedness to SAFA.
Charitable and Social Welfare Fund ........................... To record receipts and disbursements associated with the Gaming Machines (Miscellaneous) Amendment Bill 1996 relating to supporting the work of not-for-profit charities and community based social welfare organisations.

17
STATEMENT F (1)�continued
SPECIAL DEPOSIT ACCOUNTS IN OPERATION ON 30 JUNE 2000 continued (Section 22 (a) (v) (B) Public Finance and Audit Act, 1987)
Account Purpose
Commonwealth Mirror Taxes on Commonwealth Places Revenue Account............................................
To receive amounts that are levied pursuant to the Commonwealth Places (Mirror Taxes) Act 1998 of the Commonwealth as contemplated by the arrangements entered into by the State and the Commonwealth pursuant to that Act and to the Commonwealth Places (Mirror Taxes Administration) Act 1999 of the State, and to deal with those amounts as contemplated by those Acts and arrangements.
Community Emergency Services Fund...................... To record all of the activities of the Community Emergency Services Fund as outlined in Parts 3 and 4 of the Emergency Services Funding Act, 1998 and any amendments as approved by Parliament.
Correctional Services Operating Account................... To record all the activities of the Department (including those carried on by the Correctional Services component of the former Department of Justice and those formerly carried on by the Justice Information System Division within the Office of Information Technology) including recurrent and capital expenditures, revenue from various activities, injections of funds provided from the Consolidated Account and borrowings.
Criminal Injuries Compensation Fund ........................ To provide for the receipt of fines, levies and recoveries from offenders and for payment of compensation/costs to victims of crime and any other payments approved by the Attorney-General as being in the interests of victims of crime.
Dingo Control Fund..................................................... To record rates paid by landholders inside and outside the State’s dog fence and to provide payments for the destruction of dingoes and any other purpose relating to the control of dingoes.
Dog Fence Fund for administration of Dog Fence Act ......................................................................
To record receipts and disbursements relating to the operation of the Dog Fence Board.
Education, Training and Employment Operating Account ......................................................................
To record all of the activities of the Department (including those formerly carried on by the Department for Education and Children’s Services, and the Department of Education, Training and Employment, and the Information Technology Workforce Strategy Office) including recurrent and capital expenditures, revenue for various activities, injections of funds provided from the Consolidated Account and borrowings.
Egg Industry Deregulation Account ............................ To facilitate all transactions associated with or resulting from deregulation of the Egg Industry and the winding up of the SA Egg Board.
Electoral Office Operating Account............................. To record all of the activities of the Office and those formerly carried on by the Electoral Department including recurrent and capital expenditures, revenue from various activities, injections of funds provided from the Consolidated Account and borrowings.

18
STATEMENT F (1)�continued
SPECIAL DEPOSIT ACCOUNTS IN OPERATION ON 30 JUNE 2000 continued (Section 22 (a) (v) (B) Public Finance and Audit Act, 1987)
Account Purpose
Electricity Reform and Sales Operating Account........ To record all of the financial transactions of the Electricity Reform
and Sales Unit, recurrent and capital expenditure on disposal of assets, revenue from various activities, injections of funds provided from the Consolidated Account, to make payments to the Electricity Sale/Lease Proceeds Account and to apply net or gross proceeds from a sale/lease agreement, sale or lease to repay the Government’s indebtedness or for other approved purposes.
Electricity Sale/Lease Proceeds Account ................... To receive proceeds of a sale/lease agreement, sale or lease under the Electricity Corporations (Restructuring and Disposal) Act 1999 and other funds as approved by the Treasurer, and to receive interest payments from other interest bearing accounts in which sale/lease agreement proceeds are placed, and to invest those monies and to apply those monies, and income from their investment, towards the retirement of State debt.
Emergency Services Administrative Unit Operating Account ......................................................................
To record all of the activities of the Emergency Services Administrative Unit (including those formerly carried on by the Country Fire Service, SA Metropolitan Fire Service and State Emergency Service SA) including operating, investing and financing activities, transfer and receipt of funds from/to other special deposit accounts, revenue from various activities, injection of funds provided from the Consolidated Account and borrowings.
Environment and Heritage Operating Account ........... To record all of the activities of the Department (including those formally carried on by the Department for Environment, Heritage and Aboriginal Affairs other than the Division of State Aboriginal Affairs and the Office of Recreation and Sport within the Department of Industry and Trade) including recurrent and capital expenditures, revenue from various activities, injections of funds provided from the Consolidated Account and borrowings.
Environment, Heritage and Aboriginal Affairs Operating Account.......................................................
To record all of the activities of the Department including recurrent and capital expenditures, revenue from various activities, injections of funds provided from the Consolidated Account and borrowings, and to make payments to the Department for Transport, Urban Planning and the Arts and the Department for Water Resources.
Firearms Acquisition/Compensation Account ............. To record receipts and disbursements relating to the purchase of firearms from members of the public.
Firearms Acquisition/Disposal - Full-Time Firearms Dealers ......................................................................
To record receipts and disbursements relating to the operation of firearms and disposal.
ForestrySA Insurance Reserve Account .................. To record receipts and payments associated with the self-insurance of ForestrySA’s growing timber assets.
Gamblers Rehabilitation Fund..................................... To record receipts and disbursements relating to programs for the rehabilitation of addicted gamblers, for counselling such gamblers and their families and for the development of early intervention strategies.
Gaming Supervisory Operating Account..................... To record all the activities of the Authority including recurrent and capital expenditures, revenue from various activities, injections of funds provided from the Consolidated Account and borrowings.

19
STATEMENT F (1)�continued
SPECIAL DEPOSIT ACCOUNTS IN OPERATION ON 30 JUNE 2000 continued (Section 22 (a) (v) (B) Public Finance and Audit Act, 1987)
Account Purpose
Government Workers Rehabilitation and Compensation Fund....................................................
To provide for the funding of rehabilitation programs and payment of workers compensation benefits for Government workers in accordance with current workers compensation legislation and in respect of claims for damages at common law for injury or disease suffered as a result of work.
Governors’ Pensions Account .................................... To record receipts and payments for the Governors’ Pensions scheme.
Highways Fund ........................................................... To record all transactions associated with the Highways Act including the receipt of State and Commonwealth funds and expenditure on the construction and maintenance of roads and bridges.
Home Builders’ Account No. 2.................................... Established in 1971 to facilitate the recording of transactions associated with the administration of welfare housing funds provided by the State during 1971-72 and 1972-73 in terms of the Housing Grants Administration Act.
Home Purchase Assistance Account ......................... Established in 1978 to facilitate the recording of transactions associated with the administration of welfare housing loans under Housing Agreements between the Commonwealth and the State.
HomeStart Finance Account....................................... To provide for the administration of loans under the Home Ownership Made Easy and HomeStart schemes, including the administration of borrowings required to fund the scheme.
Hospitals Fund ............................................................ To record receipts from the State Lotteries Commission, Totalizator Agency Board and from Stamp Duty on Third Party Insurance policies to be used for the purpose of maintenance, development and improvement of public hospitals, to refund unclaimed dividends from unauthorised Racing Clubs and to make payments to the Racing Clubs and Trotting Clubs for a share of tax on winning bets made with book-makers.
Housing Loans Redemption Fund.............................. Established under the Housing Loans Redemption Fund Act (1962) to control amounts received in respect of a low cost insurance scheme established by the South Australian Government which is administered through various lending authorities.
Human Services Operating Account .......................... To record all of the activities of the Department (including those formerly carried on by the Department for Family and Community Services, and the Department of Housing and Urban Development other than the Planning Division) including recurrent and capital expenditures, revenue from various activities, injections of funds provided from the Consolidated Account and borrowings.
Industry and Trade Operating Account....................... To record all of the activities of the Department including recurrent and capital expenditures, revenue from various activities, injections of funds provided from the Consolidated Account and borrowings, and to make payments to the department for Transport, Urban Planning and the Arts and the Department for Environment and Heritage.
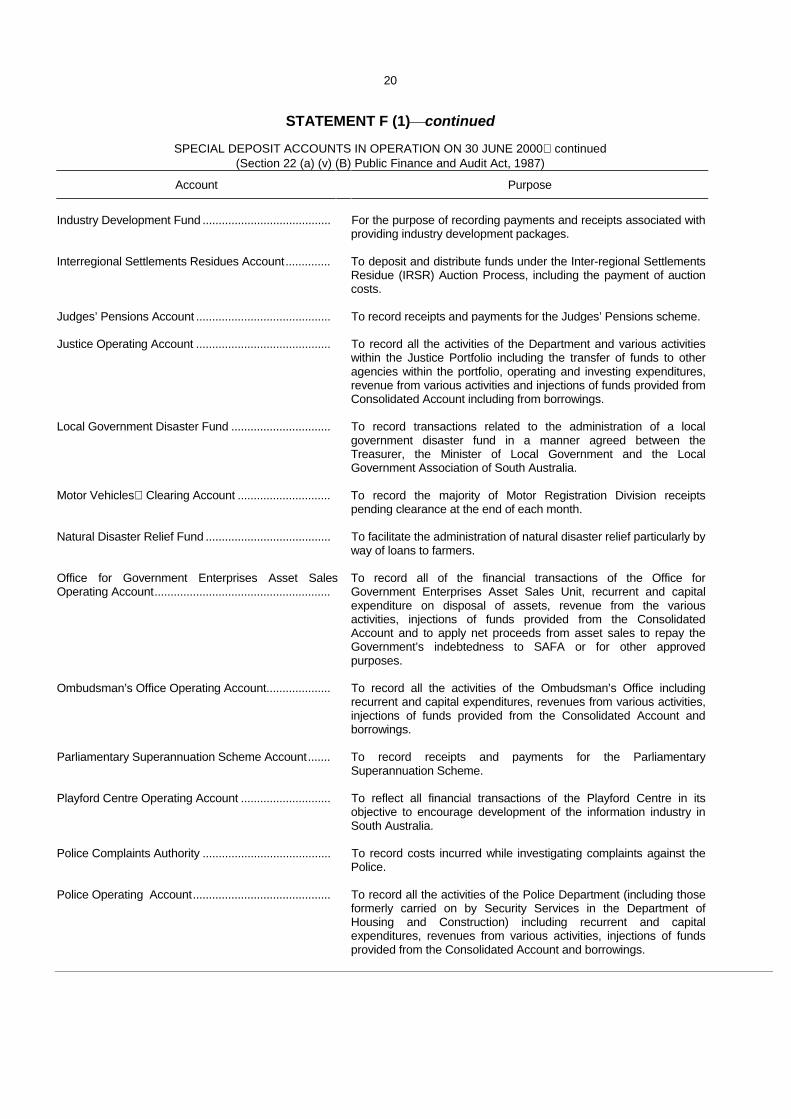
20
STATEMENT F (1)�continued
SPECIAL DEPOSIT ACCOUNTS IN OPERATION ON 30 JUNE 2000 continued (Section 22 (a) (v) (B) Public Finance and Audit Act, 1987)
Account Purpose
Industry Development Fund ........................................ For the purpose of recording payments and receipts associated with
providing industry development packages.
Interregional Settlements Residues Account.............. To deposit and distribute funds under the Inter-regional Settlements Residue (IRSR) Auction Process, including the payment of auction costs.
Judges’ Pensions Account .......................................... To record receipts and payments for the Judges’ Pensions scheme.
Justice Operating Account .......................................... To record all the activities of the Department and various activities within the Justice Portfolio including the transfer of funds to other agencies within the portfolio, operating and investing expenditures, revenue from various activities and injections of funds provided from Consolidated Account including from borrowings.
Local Government Disaster Fund ............................... To record transactions related to the administration of a local government disaster fund in a manner agreed between the Treasurer, the Minister of Local Government and the Local Government Association of South Australia.
Motor Vehicles Clearing Account ............................. To record the majority of Motor Registration Division receipts pending clearance at the end of each month.
Natural Disaster Relief Fund ....................................... To facilitate the administration of natural disaster relief particularly by way of loans to farmers.
Office for Government Enterprises Asset Sales Operating Account.......................................................
To record all of the financial transactions of the Office for Government Enterprises Asset Sales Unit, recurrent and capital expenditure on disposal of assets, revenue from the various activities, injections of funds provided from the Consolidated Account and to apply net proceeds from asset sales to repay the Government’s indebtedness to SAFA or for other approved purposes.
Ombudsman’s Office Operating Account.................... To record all the activities of the Ombudsman’s Office including recurrent and capital expenditures, revenues from various activities, injections of funds provided from the Consolidated Account and borrowings.
Parliamentary Superannuation Scheme Account....... To record receipts and payments for the Parliamentary Superannuation Scheme.
Playford Centre Operating Account ............................ To reflect all financial transactions of the Playford Centre in its objective to encourage development of the information industry in South Australia.
Police Complaints Authority ........................................ To record costs incurred while investigating complaints against the Police.
Police Operating Account........................................... To record all the activities of the Police Department (including those formerly carried on by Security Services in the Department of Housing and Construction) including recurrent and capital expenditures, revenues from various activities, injections of funds provided from the Consolidated Account and borrowings.

21
STATEMENT F (1)�continued
SPECIAL DEPOSIT ACCOUNTS IN OPERATION ON 30 JUNE 2000 continued (Section 22 (a) (v) (B) Public Finance and Audit Act, 1987)
Account Purpose
Police Superannuation Scheme Contribution Account ......................................................................
To record receipts and payments for the Police Superannuation Scheme.
Premier and Cabinet Operating Account.................... To record all the activities of the Department (including those formerly carried on by the Division of Public Sector Reform within the former Office of Government Management, the Office for the Commissioner for Public Employment, the Office of Multicultural and Ethnic Affairs, the Economic Development Policy component of the Economic Development Authority, and the Policy component of the Department for Industrial Affairs) including recurrent and capital expenditures, revenue from various activities, injections of funds provided from the Consolidated Account, borrowings and to make payments to the Department of Treasury and Finance.
Primary Industries (Log Rebate Funding) Operating Account ......................................................................
To record the receipt and the disbursement of rebates as per the agreement for the sale of Forwood Products and Mount Burr Mill.
Primary Industries and Resources Operating Account ......................................................................
To record all of the activities of the Department including recurrent and capital expenditures, revenue from various activities, injections of funds provided from the Consolidated Account and borrowings, and to make payments to the Department for Water Resources.
Public Trustee Office Operating Account ................... To record all the business and other activities of the Public Trustee Office including recurrent and capital expenditures, revenue raised from commercial activities, injections of funds provided from the Consolidated Account and borrowings.
Rural Finance Account ................................................ To provide for the administration of separate funds covering
· the agreement between the Commonwealth and the States relating to:
rural reconstruction entered into on 4 June 1971 rural assistance entered into on 1 January 1977 rural assistance entered into on 1 July 1985 rural assistance entered into on 1 January 1989 rural assistance entered into on 1 January 1993 Marginal Dairy Farms and Dairy Adjustment; · loans under the Commercial Rural Loans Scheme; · loans made to producer Co-operatives and borrowings required
to fund the scheme; to facilitate the Minister for Primary Industries becoming a unit holder in rural property trusts set up by the State Bank of South Australia to assist farmers on Eyre Peninsula and to make payments to the Rural Industry Adjustment and Development Fund and to make payments from profits on the Commercial Rural Loans Scheme to the Primary Industries Operating Account.
Rural Industry Adjustment and Development Fund.... To record receipts and payments authorised by the Rural Industry Adjustment and Development Act 1985.
SAAMC Returns to Treasurer .................................. To receive proceeds from the repatriation of SAAMC capital and/or surplus funds of SAAMC and to apply such proceeds to the repayment of the Government’s indebtedness.

22
STATEMENT F (1)�continued
SPECIAL DEPOSIT ACCOUNTS IN OPERATION ON 30 JUNE 2000 continued (Section 22 (a) (v) (B) Public Finance and Audit Act, 1987)
Account Purpose
Sale of Government Land and Property ..................... To record all receipts and payments associated with the sale of
Crown lands and other Government land and property.
School Loans Scheme ................................................ To administer loans to Schools.
South Australian Aboriginal Heritage Fund................. To receive funds from the Commonwealth, State and other sources for application towards the protection and preservation of Aboriginal heritage.
South Australian Electricity Supply Industry Planning Council Operating Account..........................................
To record all financial transactions for the South Australian Electricity Supply Industry Planning Council.
South Australian Government Insurance and Risk Management Fund ......................................................
To record receipts and payments associated with the operation of the Government’s insurance and risk management program.
South Australian Independent Industry Regulator Operating Account.......................................................
To record all financial transactions for the South Australian Independent Industry Regulator including receipt of license fees and to make payments to the Technical Regulator and the Electricity Supply Industry Planning Council.
South Australian Local Government Grants Commission Account...................................................
To record all transactions associated with the South Australian Local Government Grants Commission Act including the receipt and payment of Commonwealth funds and expenditure on the administration of the Act.
South Australian Superannuation Fund Account........ To record receipts and payments in respect of the South Australian Superannuation Fund.
Southern State Superannuation Fund Account .......... To record receipts and payments in respect of the Southern State Superannuation Fund.
Sport and Recreation Fund ......................................... To record receipts and disbursements associated with the Gaming Machines (Miscellaneous) Amendment Bill 1996 relating to the provision of financial assistance to sporting and recreational organisations.
State Emergency Services Operating Account........... To record all the activities of the organisation including recurrent and capital expenditures, revenue from various activities, injection of funds provided from Consolidated Account and borrowings.
State Governor’s Establishment Operating Account. . To record all the activities of the Establishment including recurrent and capital expenditures, revenue from various activities, injections of funds provided from the Consolidated Account and borrowings.
State Local Government Reform Fund..................... To administer and fund particular functions/programs nominated by the State Government for negotiation with Local Government.
Stony Point (Liquids Project) Indenture Account ........ To facilitate financial dealings between the Government and the Cooper Basin Producers.
Targeted/Voluntary Separation Package Scheme...... To administer the costs associated with the Targeted/Voluntary Separation Package Scheme.

23
STATEMENT F (1)�continued
SPECIAL DEPOSIT ACCOUNTS IN OPERATION ON 30 JUNE 2000 continued (Section 22 (a) (v) (B) Public Finance and Audit Act, 1987)
Account Purpose
Totalizator Dividends Adjustment Account................. Established under the provisions of the Racing Act (1976) to collect
from the Totalizator Agency Board fractions from the calculation of dividends which are then transferred to the Hospitals Fund.
Transport, Urban Planing and the Arts Operating Account ......................................................................
To record all of the activities of the Department (including those formerly carried on by the Department for the Arts and Cultural Development and the Department of Transport other than Registration and Licensing, and the Department of Recreation and Sport other than Sport Facilities and Industry Development) including recurrent and capital expenditures, revenue from various activities, injections of funds provided from the Consolidated Account and borrowings.
Treasury and Finance Operating Account.................. To record all the activities of the Department (including those formerly carried on by the Corporate Services Division within the Department of the Premier and Cabinet) including recurrent and capital expenditures, revenue from various activities, injections of funds provided from the Consolidated Account and borrowings.
Treasury Working Account....................................... To hold charges incurred by the Agent-General in London for semi-Government and non-Government bodies, to record receipts and payments for small lotteries, to record certain receipts and payments arising from various superannuation arrangements, to record certain interest receipts and payments, to effect accounting adjustments and transfers and to hold amounts in suspense pending determination of appropriate treatment.
Water Resources Operating Account......................... To record all of the activities of the Department (including those water related activities formally carried on by the Department of Primary Industries and Resources and the Department for Environment and Heritage) including recurrent and capital expenditures, revenue from the Consolidated Account and borrowings.
JIM WRIGHT, Under Treasurer ROB LUCAS, Treasurer
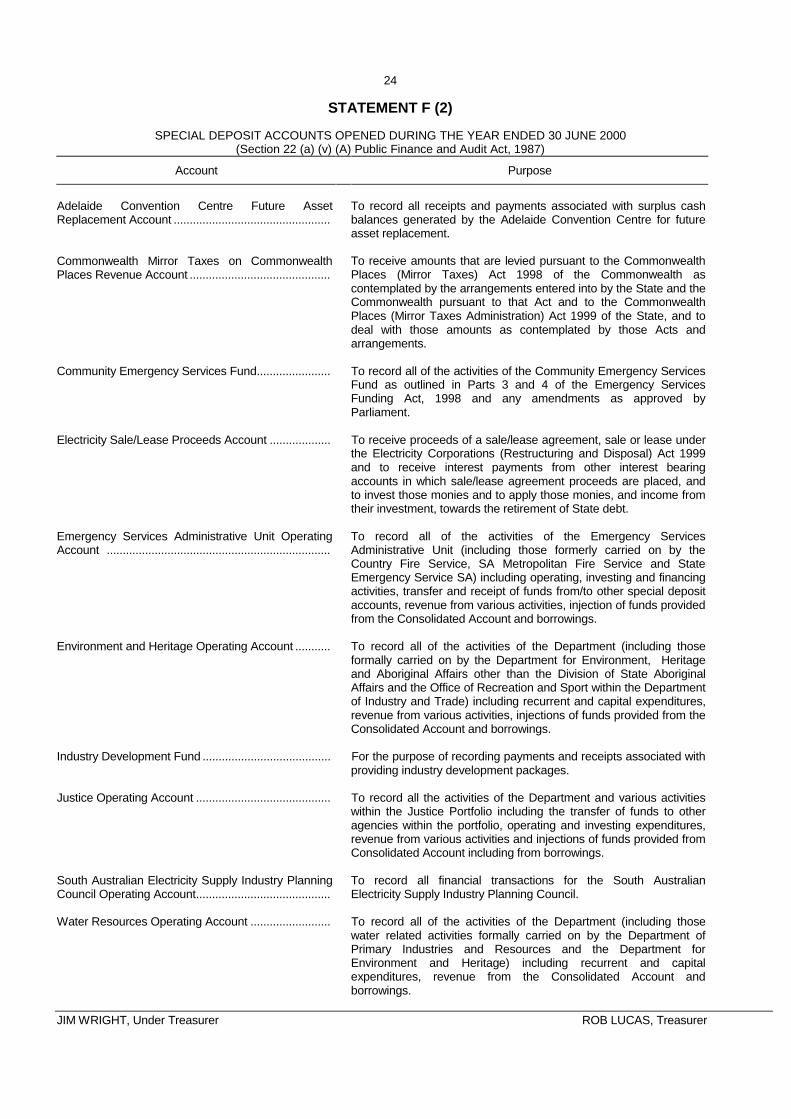
24
STATEMENT F (2)
SPECIAL DEPOSIT ACCOUNTS OPENED DURING THE YEAR ENDED 30 JUNE 2000 (Section 22 (a) (v) (A) Public Finance and Audit Act, 1987)
Account Purpose
Adelaide Convention Centre Future Asset Replacement Account .................................................
To record all receipts and payments associated with surplus cash balances generated by the Adelaide Convention Centre for future asset replacement.
Commonwealth Mirror Taxes on Commonwealth Places Revenue Account ............................................
To receive amounts that are levied pursuant to the Commonwealth Places (Mirror Taxes) Act 1998 of the Commonwealth as contemplated by the arrangements entered into by the State and the Commonwealth pursuant to that Act and to the Commonwealth Places (Mirror Taxes Administration) Act 1999 of the State, and to deal with those amounts as contemplated by those Acts and arrangements.
Community Emergency Services Fund....................... To record all of the activities of the Community Emergency Services Fund as outlined in Parts 3 and 4 of the Emergency Services Funding Act, 1998 and any amendments as approved by Parliament.
Electricity Sale/Lease Proceeds Account ................... To receive proceeds of a sale/lease agreement, sale or lease under the Electricity Corporations (Restructuring and Disposal) Act 1999 and to receive interest payments from other interest bearing accounts in which sale/lease agreement proceeds are placed, and to invest those monies and to apply those monies, and income from their investment, towards the retirement of State debt.
Emergency Services Administrative Unit Operating Account ......................................................................
To record all of the activities of the Emergency Services Administrative Unit (including those formerly carried on by the Country Fire Service, SA Metropolitan Fire Service and State Emergency Service SA) including operating, investing and financing activities, transfer and receipt of funds from/to other special deposit accounts, revenue from various activities, injection of funds provided from the Consolidated Account and borrowings.
Environment and Heritage Operating Account ........... To record all of the activities of the Department (including those formally carried on by the Department for Environment, Heritage and Aboriginal Affairs other than the Division of State Aboriginal Affairs and the Office of Recreation and Sport within the Department of Industry and Trade) including recurrent and capital expenditures, revenue from various activities, injections of funds provided from the Consolidated Account and borrowings.
Industry Development Fund ........................................ For the purpose of recording payments and receipts associated with providing industry development packages.
Justice Operating Account .......................................... To record all the activities of the Department and various activities within the Justice Portfolio including the transfer of funds to other agencies within the portfolio, operating and investing expenditures, revenue from various activities and injections of funds provided from Consolidated Account including from borrowings.
South Australian Electricity Supply Industry Planning Council Operating Account..........................................
To record all financial transactions for the South Australian Electricity Supply Industry Planning Council.
Water Resources Operating Account ......................... To record all of the activities of the Department (including those water related activities formally carried on by the Department of Primary Industries and Resources and the Department for Environment and Heritage) including recurrent and capital expenditures, revenue from the Consolidated Account and borrowings.
JIM WRIGHT, Under Treasurer ROB LUCAS, Treasurer

25
STATEMENT G
DEPOSITS LODGED WITH THE TREASURER BALANCES ON 30 JUNE 2000 (Section 22 (a) (vi) Public Finance and Audit Act, 1987)
The balances listed below represent amounts held by the Treasurer (pursuant to Section 21 of the Public Finance and Audit Act) on behalf of various bodies.
$
Interest bearing� Adelaide Festival Trust Fund ................................................................................................................................................ 5 280 Agents Indemnity Fund......................................................................................................................................................... 669 321 Art Gallery Board Bequests Account .................................................................................................................................... 4 231 444 Basketball Association of South Australia ............................................................................................................................ 9 200 Beekeeper’s Compensation Fund ........................................................................................................................................ 3 216 Boating Administration Working Account.......................................................................................................................... 254 841 Botanic Gardens Board Endowment and Commercial Fund................................................................................................ 1 707 467 Carrick Hill Trust ................................................................................................................................................................... 24 037 Cattle Compensation Fund................................................................................................................................................... 2 794 483 Central Linen Service Sale Account................................................................................................................................... 845 537 Construction Industry Fund................................................................................................................................................... - Cooperative Research Centre for Molecular Plant Breeding................................................................................................ 483 334 Country Fire Services Workers Compensation Fund ........................................................................................................... 3 660 Courts Administration Authority ............................................................................................................................................ 16 137 661 Credit Unions Contingency Fund.......................................................................................................................................... - Crown Solicitor’s Trust Account............................................................................................................................................ 1 265 870 Daniel Livingston Scholarship............................................................................................................................................... 23 183 Deer Keepers’ Compensation Fund ..................................................................................................................................... 94 635 District Court Suitors’ Fund................................................................................................................................................... 485 702 Dried Fruits Board................................................................................................................................................................. 101 330 Education Department Scholarships and Prizes................................................................................................................ 97 720 Employment and Technical and Further Education College Council Funds...................................................................... 1 013 314 Employment and Technical and Further Education Scholarships and Prizes ................................................................... 2 717 Environment Protection Fund ............................................................................................................................................... 1 225 196 ETSA Employer Fund (ETSA Contributory Scheme) ........................................................................................................... 84 103 ETSA Superannuation Fund................................................................................................................................................. 6 843 527 Fire Equipment Services Operating Account........................................................................................................................ 318 832 Fisheries Research and Development Corporation Proactive Fund .................................................................................... - Grains Industry Levy Fund.................................................................................................................................................... 3 947 Gulf St Vincent Prawn Fishery Voluntary Contributions ....................................................................................................... 1 267 977 Hills Transit ........................................................................................................................................................................... 338 059 History Trust of South Australia ............................................................................................................................................ 307 585 Industrial & Commercial Premises Corporation.................................................................................................................... 559 390 Institute of Medical and Veterinary Science.......................................................................................................................... 18 239 994 Land Technologies Alliance Fund......................................................................................................................................... 164 834 Legal Practitioners Act.......................................................................................................................................................... 546 808 Libraries Board of South Australia ........................................................................................................................................ 5 746 878 Local Government Taxation Equivalents Fund..................................................................................................................... 1 883 526 Land Management Corporation............................................................................................................................................ 67 999 701 Motor Accident Commission Account................................................................................................................................... 6 197 824 Museum Board Bequests Account..................................................................................................................................... 2 686 763 National Parks General Reserves Account .......................................................................................................................... 3 668 638 Native Vegetation Fund ........................................................................................................................................................ 734 301 Northern Adelaide and Barossa Catchment Water Management Board.............................................................................. 766 419 Office of Catchment Water Management Boards’ ................................................................................................................ 4 122 616 Onkaparinga Catchment Water Management Board ........................................................................................................... 1 370 873 Outback Areas Community Development Fund ................................................................................................................... 574 106 Passenger Transport Board.................................................................................................................................................. 21 749 301 Passenger Transport Research and Development Fund .................................................................................................... 2 075 142 Phylloxera and Grape Industry Fund ................................................................................................................................... 186 621 Pitjantjatjara Council Replacement of Plant Account......................................................................................................... 97 608 Planning and Development Fund ......................................................................................................................................... 7 005 017 Pleuro Pneumonia Fund....................................................................................................................................................... 72 882 Police Superannuation Fund ................................................................................................................................................ 987 428
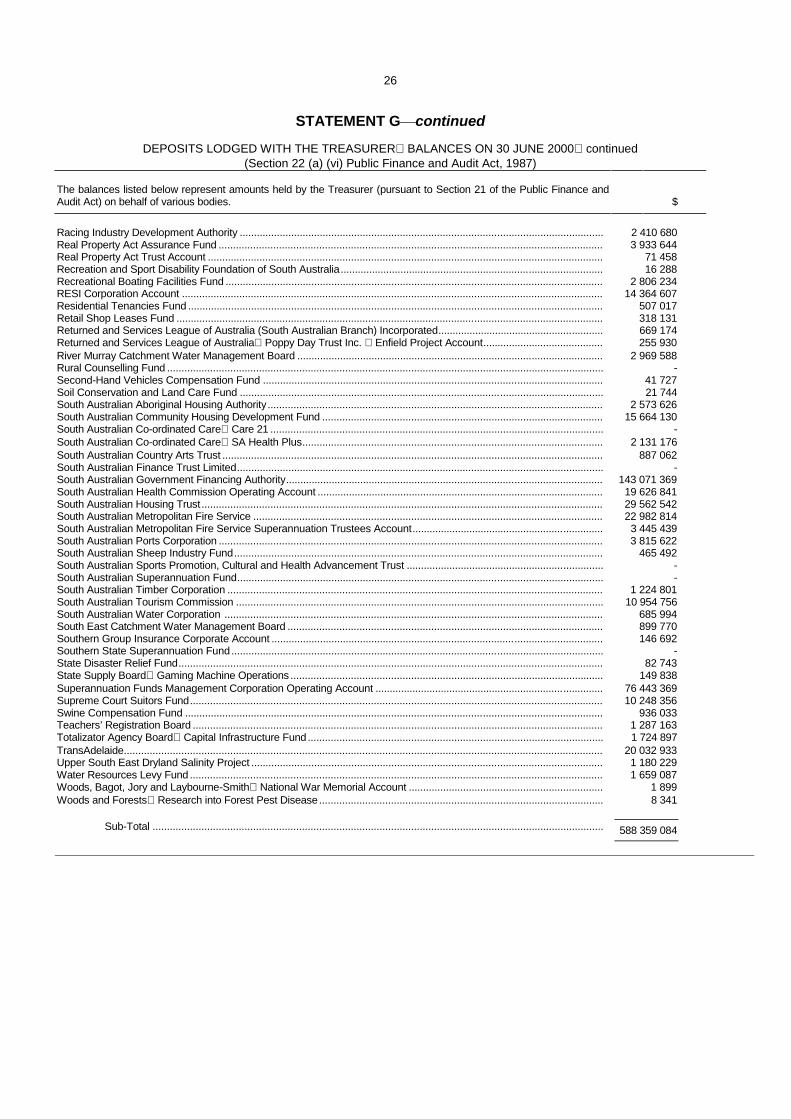
26
STATEMENT G�continued
DEPOSITS LODGED WITH THE TREASURER BALANCES ON 30 JUNE 2000 continued (Section 22 (a) (vi) Public Finance and Audit Act, 1987)
The balances listed below represent amounts held by the Treasurer (pursuant to Section 21 of the Public Finance and Audit Act) on behalf of various bodies.
$
Racing Industry Development Authority ............................................................................................................................... 2 410 680 Real Property Act Assurance Fund ...................................................................................................................................... 3 933 644 Real Property Act Trust Account .......................................................................................................................................... 71 458 Recreation and Sport Disability Foundation of South Australia............................................................................................ 16 288 Recreational Boating Facilities Fund .................................................................................................................................... 2 806 234 RESI Corporation Account ................................................................................................................................................... 14 364 607 Residential Tenancies Fund ................................................................................................................................................. 507 017 Retail Shop Leases Fund ..................................................................................................................................................... 318 131 Returned and Services League of Australia (South Australian Branch) Incorporated.......................................................... 669 174 Returned and Services League of Australia Poppy Day Trust Inc. Enfield Project Account.......................................... 255 930 River Murray Catchment Water Management Board ........................................................................................................... 2 969 588 Rural Counselling Fund ........................................................................................................................................................ - Second-Hand Vehicles Compensation Fund ....................................................................................................................... 41 727 Soil Conservation and Land Care Fund ............................................................................................................................... 21 744 South Australian Aboriginal Housing Authority..................................................................................................................... 2 573 626 South Australian Community Housing Development Fund .................................................................................................. 15 664 130 South Australian Co-ordinated Care Care 21 .................................................................................................................... - South Australian Co-ordinated Care SA Health Plus......................................................................................................... 2 131 176 South Australian Country Arts Trust ..................................................................................................................................... 887 062 South Australian Finance Trust Limited................................................................................................................................ - South Australian Government Financing Authority............................................................................................................... 143 071 369 South Australian Health Commission Operating Account .................................................................................................... 19 626 841 South Australian Housing Trust............................................................................................................................................ 29 562 542 South Australian Metropolitan Fire Service .......................................................................................................................... 22 982 814 South Australian Metropolitan Fire Service Superannuation Trustees Account................................................................... 3 445 439 South Australian Ports Corporation ...................................................................................................................................... 3 815 622 South Australian Sheep Industry Fund................................................................................................................................. 465 492 South Australian Sports Promotion, Cultural and Health Advancement Trust ..................................................................... - South Australian Superannuation Fund................................................................................................................................ - South Australian Timber Corporation ................................................................................................................................... 1 224 801 South Australian Tourism Commission ................................................................................................................................ 10 954 756 South Australian Water Corporation .................................................................................................................................... 685 994 South East Catchment Water Management Board .............................................................................................................. 899 770 Southern Group Insurance Corporate Account .................................................................................................................... 146 692 Southern State Superannuation Fund.................................................................................................................................. - State Disaster Relief Fund.................................................................................................................................................... 82 743 State Supply Board Gaming Machine Operations ............................................................................................................. 149 838 Superannuation Funds Management Corporation Operating Account ................................................................................ 76 443 369 Supreme Court Suitors Fund................................................................................................................................................ 10 248 356 Swine Compensation Fund .................................................................................................................................................. 936 033 Teachers’ Registration Board ............................................................................................................................................... 1 287 163 Totalizator Agency Board Capital Infrastructure Fund....................................................................................................... 1 724 897 TransAdelaide....................................................................................................................................................................... 20 032 933 Upper South East Dryland Salinity Project ........................................................................................................................... 1 180 229 Water Resources Levy Fund ................................................................................................................................................ 1 659 087 Woods, Bagot, Jory and Laybourne-Smith National War Memorial Account .................................................................... 1 899 Woods and Forests Research into Forest Pest Disease................................................................................................... 8 341 Sub-Total ............................................................................................................................................................. 588 359 084
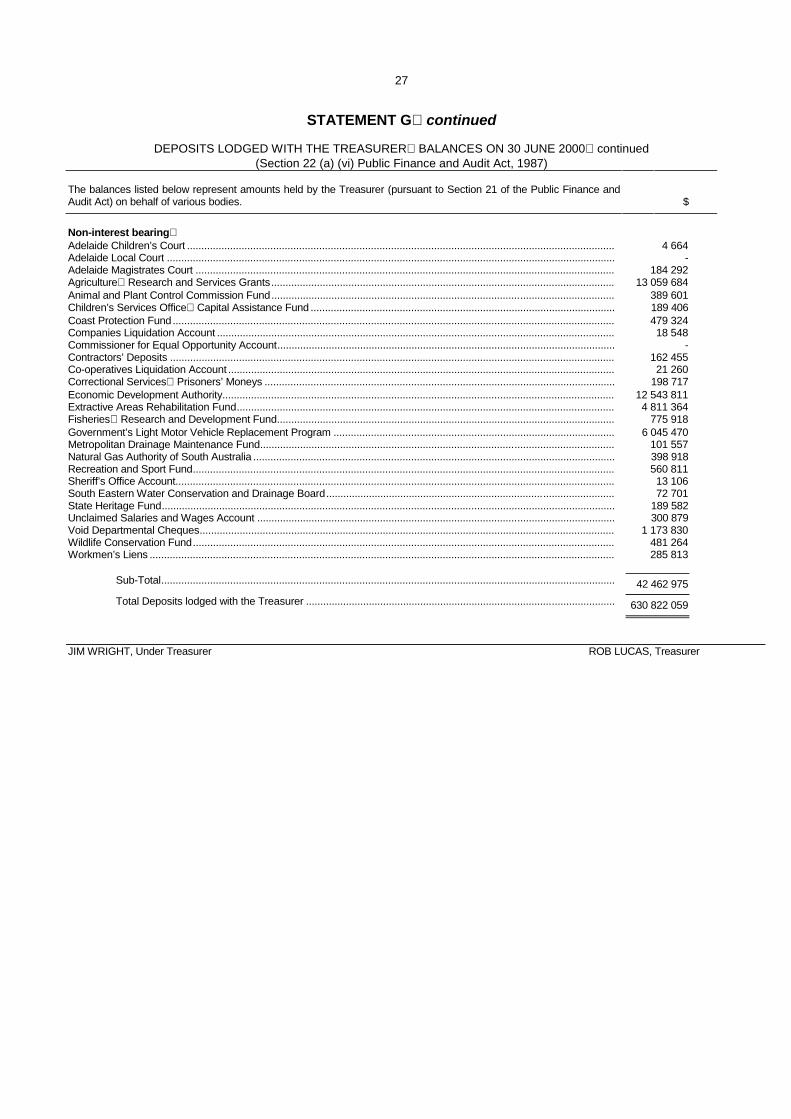
27
STATEMENT G continued
DEPOSITS LODGED WITH THE TREASURER BALANCES ON 30 JUNE 2000 continued (Section 22 (a) (vi) Public Finance and Audit Act, 1987)
The balances listed below represent amounts held by the Treasurer (pursuant to Section 21 of the Public Finance and Audit Act) on behalf of various bodies.
$
Non-interest bearing Adelaide Children’s Court ..................................................................................................................................................... 4 664 Adelaide Local Court ............................................................................................................................................................ - Adelaide Magistrates Court .................................................................................................................................................. 184 292 Agriculture Research and Services Grants........................................................................................................................ 13 059 684 Animal and Plant Control Commission Fund........................................................................................................................ 389 601 Children’s Services Office Capital Assistance Fund .......................................................................................................... 189 406 Coast Protection Fund.......................................................................................................................................................... 479 324 Companies Liquidation Account ........................................................................................................................................... 18 548 Commissioner for Equal Opportunity Account...................................................................................................................... - Contractors’ Deposits ........................................................................................................................................................... 162 455 Co-operatives Liquidation Account ....................................................................................................................................... 21 260 Correctional Services Prisoners’ Moneys .......................................................................................................................... 198 717 Economic Development Authority......................................................................................................................................... 12 543 811 Extractive Areas Rehabilitation Fund.................................................................................................................................... 4 811 364 Fisheries Research and Development Fund...................................................................................................................... 775 918 Government’s Light Motor Vehicle Replacement Program .................................................................................................. 6 045 470 Metropolitan Drainage Maintenance Fund............................................................................................................................ 101 557 Natural Gas Authority of South Australia .............................................................................................................................. 398 918 Recreation and Sport Fund................................................................................................................................................... 560 811 Sheriff’s Office Account......................................................................................................................................................... 13 106 South Eastern Water Conservation and Drainage Board..................................................................................................... 72 701 State Heritage Fund.............................................................................................................................................................. 189 582 Unclaimed Salaries and Wages Account ............................................................................................................................. 300 879 Void Departmental Cheques................................................................................................................................................. 1 173 830 Wildlife Conservation Fund................................................................................................................................................... 481 264 Workmen’s Liens .................................................................................................................................................................. 285 813 Sub-Total.............................................................................................................................................................. 42 462 975
Total Deposits lodged with the Treasurer ............................................................................................................ 630 822 059
JIM WRIGHT, Under Treasurer ROB LUCAS, Treasurer

28
STATEMENT H
IMPREST ACCOUNTS (Section 22 (a) (vii) Public Finance and Audit Act, 1987)
These amounts represent moneys advanced by the Treasurer to Chief Executive Officers pursuant to Section 9 of the Public Finance and Audit Act. Imprest accounts provide funds to meet payments at short notice and are subsequently recouped from departmental moneys.
By Whom Held Agency Unappropriated Funds Allocated
$
Chief Executive Department for Administrative and Information Services ................... 120 950 Chief Executive Attorney-General’s Department.......................................................... 41 020 Auditor-General Auditor-General’s Department............................................................ 3 100 Chief Executive Department of Education, Training and Employment......................... 619 700 Clerk House of Assembly............................................................................. 344 Chief Executive Department of Human Services ......................................................... 285 000 Chief Executive Department of Industry and Trade...................................................... 3 000 Chief Executive South Australian Police Department................................................... 200 000 Chief Executive Department of the Premier and Cabinet............................................. 23 260 Chief Executive Department of Primary Industries and Resources.............................. 92 000 Electoral Commissioner State Electoral Office.......................................................................... 200 Chief Executive Department for Environment and Heritage......................................... 8 000 Chief Executive Department for Transport, Urban Planning and the Arts ................... 282 590 Under Treasurer Department of Treasury and Finance................................................. 7 000 Total 1 686 164
JIM WRIGHT, Under Treasurer ROB LUCAS, Treasurer
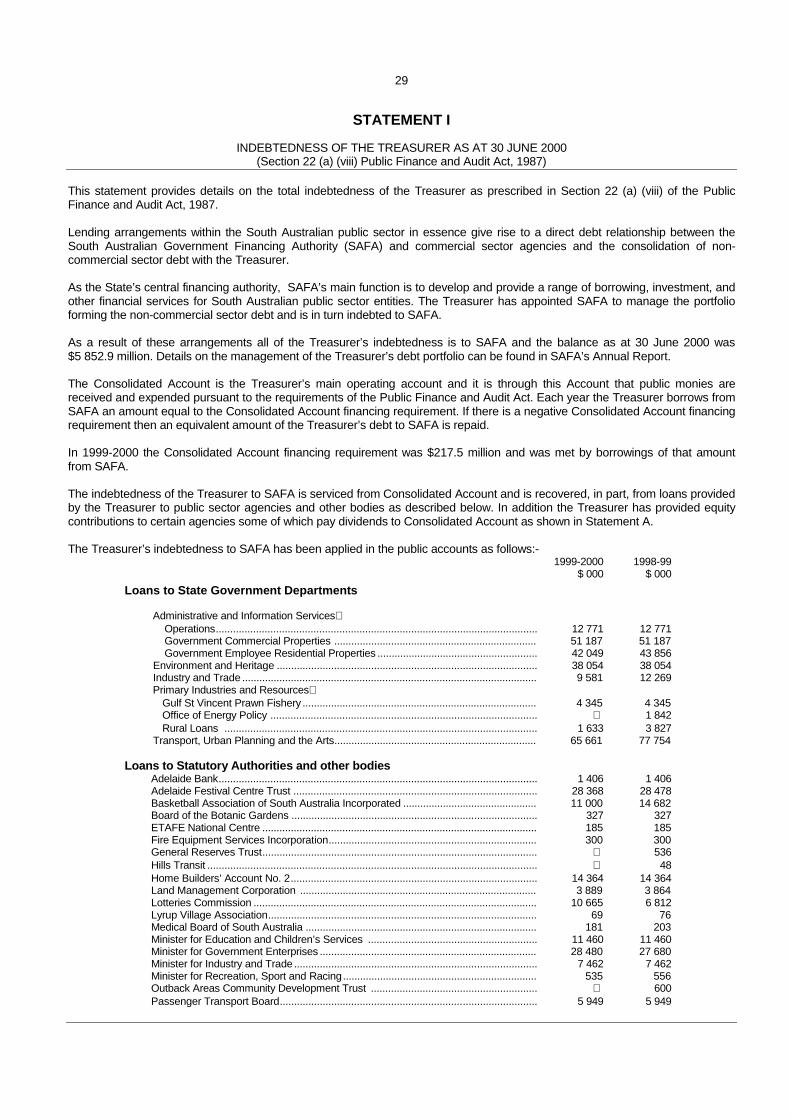
29
STATEMENT I
INDEBTEDNESS OF THE TREASURER AS AT 30 JUNE 2000 (Section 22 (a) (viii) Public Finance and Audit Act, 1987)
This statement provides details on the total indebtedness of the Treasurer as prescribed in Section 22 (a) (viii) of the Public Finance and Audit Act, 1987. Lending arrangements within the South Australian public sector in essence give rise to a direct debt relationship between the South Australian Government Financing Authority (SAFA) and commercial sector agencies and the consolidation of non-commercial sector debt with the Treasurer. As the State’s central financing authority, SAFA’s main function is to develop and provide a range of borrowing, investment, and other financial services for South Australian public sector entities. The Treasurer has appointed SAFA to manage the portfolio forming the non-commercial sector debt and is in turn indebted to SAFA. As a result of these arrangements all of the Treasurer’s indebtedness is to SAFA and the balance as at 30 June 2000 was $5 852.9 million. Details on the management of the Treasurer’s debt portfolio can be found in SAFA’s Annual Report. The Consolidated Account is the Treasurer’s main operating account and it is through this Account that public monies are received and expended pursuant to the requirements of the Public Finance and Audit Act. Each year the Treasurer borrows from SAFA an amount equal to the Consolidated Account financing requirement. If there is a negative Consolidated Account financing requirement then an equivalent amount of the Treasurer’s debt to SAFA is repaid. In 1999-2000 the Consolidated Account financing requirement was $217.5 million and was met by borrowings of that amount from SAFA. The indebtedness of the Treasurer to SAFA is serviced from Consolidated Account and is recovered, in part, from loans provided by the Treasurer to public sector agencies and other bodies as described below. In addition the Treasurer has provided equity contributions to certain agencies some of which pay dividends to Consolidated Account as shown in Statement A. The Treasurer’s indebtedness to SAFA has been applied in the public accounts as follows:-
1999-2000 $ 000
1998-99 $ 000
Loans to State Government Departments Administrative and Information Services Operations................................................................................................................ 12 771 12 771 Government Commercial Properties ....................................................................... 51 187 51 187 Government Employee Residential Properties ........................................................ 42 049 43 856 Environment and Heritage ........................................................................................... 38 054 38 054
Industry and Trade ....................................................................................................... 9 581 12 269 Primary Industries and Resources Gulf St Vincent Prawn Fishery .................................................................................. 4 345 4 345 Office of Energy Policy ............................................................................................. 1 842 Rural Loans ............................................................................................................. 1 633 3 827
Transport, Urban Planning and the Arts....................................................................... 65 661 77 754
Loans to Statutory Authorities and other bodies Adelaide Bank............................................................................................................... 1 406 1 406 Adelaide Festival Centre Trust ..................................................................................... 28 368 28 478 Basketball Association of South Australia Incorporated ............................................... 11 000 14 682 Board of the Botanic Gardens ...................................................................................... 327 327 ETAFE National Centre ................................................................................................ 185 185 Fire Equipment Services Incorporation......................................................................... 300 300 General Reserves Trust................................................................................................ 536 Hills Transit ................................................................................................................... 48 Home Builders’ Account No. 2...................................................................................... 14 364 14 364 Land Management Corporation ................................................................................... 3 889 3 864 Lotteries Commission ................................................................................................... 10 665 6 812 Lyrup Village Association.............................................................................................. 69 76 Medical Board of South Australia ................................................................................. 181 203 Minister for Education and Children’s Services ........................................................... 11 460 11 460 Minister for Government Enterprises ............................................................................ 28 480 27 680 Minister for Industry and Trade..................................................................................... 7 462 7 462 Minister for Recreation, Sport and Racing.................................................................... 535 556 Outback Areas Community Development Trust .......................................................... 600 Passenger Transport Board.......................................................................................... 5 949 5 949
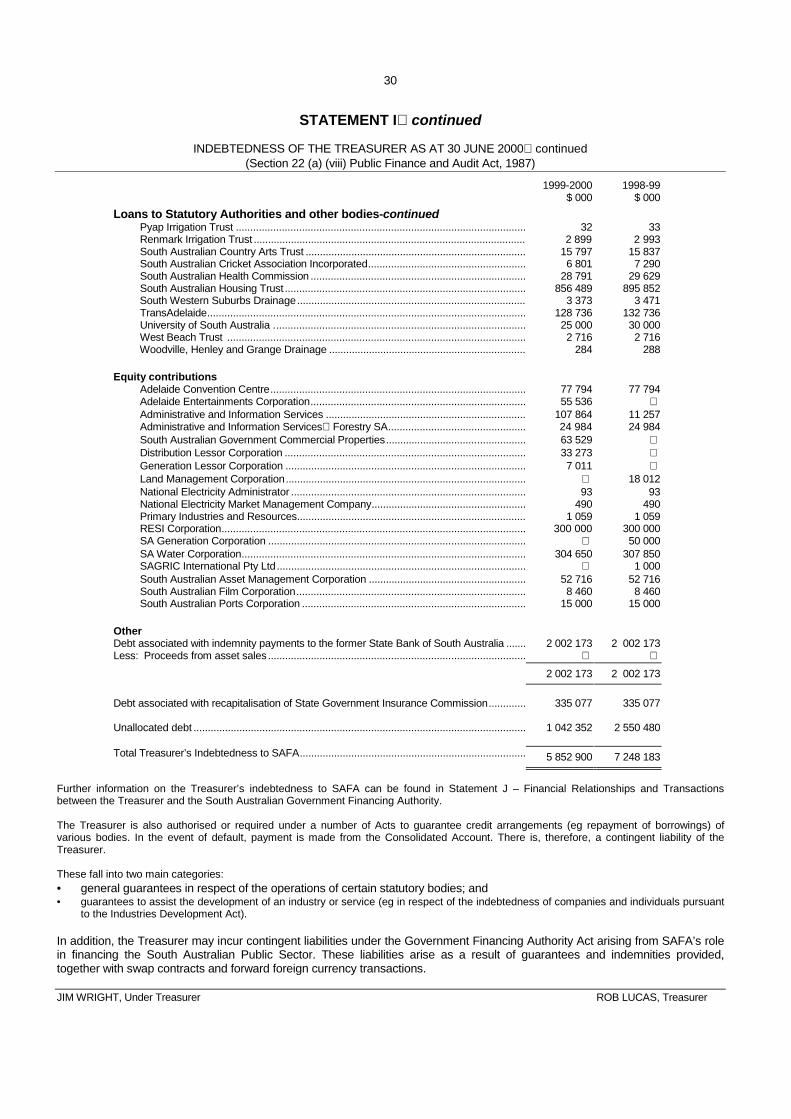
30
STATEMENT I continued
INDEBTEDNESS OF THE TREASURER AS AT 30 JUNE 2000 continued (Section 22 (a) (viii) Public Finance and Audit Act, 1987)
1999-2000
$ 000 1998-99
$ 000
Loans to Statutory Authorities and other bodies-continued Pyap Irrigation Trust ...................................................................................................... 32 33 Renmark Irrigation Trust ............................................................................................... 2 899 2 993 South Australian Country Arts Trust .............................................................................. 15 797 15 837 South Australian Cricket Association Incorporated........................................................ 6 801 7 290 South Australian Health Commission ............................................................................ 28 791 29 629 South Australian Housing Trust ..................................................................................... 856 489 895 852 South Western Suburbs Drainage................................................................................. 3 373 3 471 TransAdelaide................................................................................................................ 128 736 132 736 University of South Australia ......................................................................................... 25 000 30 000 West Beach Trust ......................................................................................................... 2 716 2 716 Woodville, Henley and Grange Drainage ...................................................................... 284 288
Equity contributions Adelaide Convention Centre.......................................................................................... 77 794 77 794 Adelaide Entertainments Corporation............................................................................ 55 536 Administrative and Information Services ....................................................................... 107 864 11 257 Administrative and Information Services Forestry SA................................................. 24 984 24 984 South Australian Government Commercial Properties.................................................. 63 529 Distribution Lessor Corporation ..................................................................................... 33 273 Generation Lessor Corporation ..................................................................................... 7 011 Land Management Corporation..................................................................................... 18 012 National Electricity Administrator ................................................................................... 93 93 National Electricity Market Management Company....................................................... 490 490 Primary Industries and Resources................................................................................. 1 059 1 059 RESI Corporation........................................................................................................... 300 000 300 000 SA Generation Corporation ........................................................................................... 50 000 SA Water Corporation.................................................................................................... 304 650 307 850 SAGRIC International Pty Ltd........................................................................................ 1 000 South Australian Asset Management Corporation ........................................................ 52 716 52 716 South Australian Film Corporation................................................................................. 8 460 8 460 South Australian Ports Corporation ............................................................................... 15 000 15 000
Other Debt associated with indemnity payments to the former State Bank of South Australia ........ 2 002 173 2 002 173 Less: Proceeds from asset sales...........................................................................................
2 002 173 2 002 173
Debt associated with recapitalisation of State Government Insurance Commission.............. 335 077 335 077
Unallocated debt ..................................................................................................................... 1 042 352 2 550 480
Total Treasurer’s Indebtedness to SAFA................................................................................ 5 852 900 7 248 183
Further information on the Treasurer’s indebtedness to SAFA can be found in Statement J – Financial Relationships and Transactions between the Treasurer and the South Australian Government Financing Authority. The Treasurer is also authorised or required under a number of Acts to guarantee credit arrangements (eg repayment of borrowings) of various bodies. In the event of default, payment is made from the Consolidated Account. There is, therefore, a contingent liability of the Treasurer. These fall into two main categories: • general guarantees in respect of the operations of certain statutory bodies; and • guarantees to assist the development of an industry or service (eg in respect of the indebtedness of companies and individuals pursuant
to the Industries Development Act). In addition, the Treasurer may incur contingent liabilities under the Government Financing Authority Act arising from SAFA’s role in financing the South Australian Public Sector. These liabilities arise as a result of guarantees and indemnities provided, together with swap contracts and forward foreign currency transactions. JIM WRIGHT, Under Treasurer ROB LUCAS, Treasurer

31
STATEMENT J
FINANCIAL RELATIONSHIPS AND TRANSACTIONS BETWEEN THE TREASURER AND THE SOUTH AUSTRALIAN GOVERNMENT FINANCING AUTHORITY
(Section 22 (a) (ix) Public Finance and Audit Act, 1987) The South Australian Government Financing Authority (SAFA) is an integral part of the management of the Government’s finances. Transactions between SAFA and the Public Accounts are described below
Indebtedness The indebtedness of the Government to SAFA stems from • direct loans from SAFA to the Government; • indebtedness resulting from the assumption by SAFA of the obligations of the State to the Commonwealth Government
under the Financial Agreement, Housing and other Specific Purpose Agreements; • indebtedness in respect of payments made on account of the Government’s indemnity arrangements with the former State
Bank of South Australia; • indebtedness resulting from debt rearrangements within the South Australian Public Sector whereby SAFA is assigned loan
assets in return for assuming the associated debt servicing obligations of the South Australian Government; and • assumption by the Government of obligations of semi-government authorities and Public Sector financial institutions for past
loans from SAFA. The overall movement in the Government’s indebtedness to SAFA during 1999-2000 is summarised as follows
$ million Balance at 30 June 1999 ........................................................................................ 7 248 Add- Consolidated Account borrowing in 1999-2000......................................... 218 Add- Assumption of electricity entity debt........................................................... 620 Add- SAFA book gains/losses (net).................................................................... 187 Less- Repayment of borrowing........................................................................... 2 410 Less- Other minor adjustments (net) .................................................................. 10 Balance at 30 June 2000 ........................................................................................ 5 853
SAFA’s accounting policy in relation to gains and losses resulting from debt management transactions is to recognise these gains and losses immediately in its profit and loss account and recoup the gain/loss through an adjustment to the Treasurer’s debt level.
Cash Balances Arrangements for the management of cash require that virtually all funds under the control of the Treasurer which are not immediately required, are deposited with SAFA each day on an at call basis. During 1999-2000 interest at the Common Public Sector Interest Rate (CPSIR) was paid to the Treasurer by SAFA in respect of those balances held by the Treasurer which earn interest at the CPSIR. The Treasurer received interest at a rate determined by reference to SAFA’s overnight borrowing rate in respect of the remaining funds deposited with SAFA. At 30 June 2000 the amount deposited by the Treasurer with SAFA was $2 632 million. Statement C shows details of cash balances held by the Treasurer at 30 June 2000 and the form in which those balances were held.
Capital and Surpluses Consistent with the South Australian Commission of Audit recommendations of April 1994, SAFA has repaid all capital contributions from the Government. The size of SAFA’s operating surplus in 1999-2000 before abnormal items was $34 million. SAFA and its controlled entities come under the Tax Equivalent Regime (TER) and under this arrangement $21.6 million from the surplus was paid to Consolidated Account in 1999-2000 and is reported in Statement A. After taking account of the retained surplus carried forward from previous years and the TER payment in 1999-2000 the amount of SAFA’s surplus potentially available for distribution at 30 June 2000 was $227 million. The Treasurer determined that there would be no distribution for 1999-2000.

32
STATEMENT J continued
FINANCIAL RELATIONSHIPS AND TRANSACTIONS BETWEEN THE TREASURER AND THE SOUTH AUSTRALIAN GOVERNMENT FINANCING AUTHORITY continued
(Section 22 (a) (ix) Public Finance and Audit Act, 1987)
Banking Arrangements Similar to many other semi-government authorities, SAFA operates a Deposit Account see Statement G. Any surplus funds otherwise standing to the credit of the Account are invested by SAFA each day.
Government Guarantee All the liabilities of SAFA are unconditionally guaranteed by the State pursuant to Section 15 of the Government Financing Authority Act. The Government does not foresee any circumstances in which the guarantee is likely to be called upon. JIM WRIGHT, Under Treasurer ROB LUCAS, Treasurer
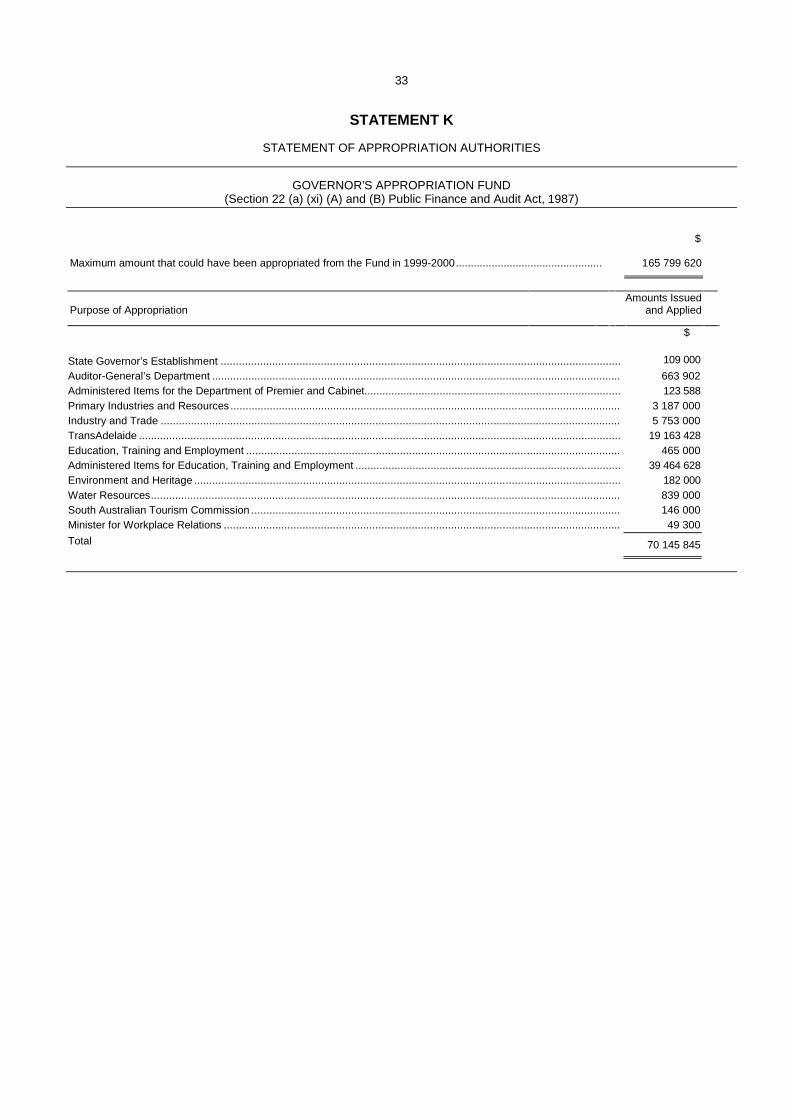
33
STATEMENT K
STATEMENT OF APPROPRIATION AUTHORITIES
GOVERNOR’S APPROPRIATION FUND (Section 22 (a) (xi) (A) and (B) Public Finance and Audit Act, 1987)
$
Maximum amount that could have been appropriated from the Fund in 1999-2000................................................. 165 799 620
Purpose of Appropriation
Amounts Issued and Applied
$
State Governor’s Establishment .................................................................................................................................... 109 000
Auditor-General’s Department ....................................................................................................................................... 663 902 Administered Items for the Department of Premier and Cabinet..................................................................................... 123 588 Primary Industries and Resources ................................................................................................................................. 3 187 000 Industry and Trade ........................................................................................................................................................ 5 753 000 TransAdelaide ............................................................................................................................................................... 19 163 428 Education, Training and Employment ............................................................................................................................ 465 000 Administered Items for Education, Training and Employment ........................................................................................ 39 464 628 Environment and Heritage ............................................................................................................................................. 182 000 Water Resources........................................................................................................................................................... 839 000 South Australian Tourism Commission .......................................................................................................................... 146 000 Minister for Workplace Relations ................................................................................................................................... 49 300
Total 70 145 845
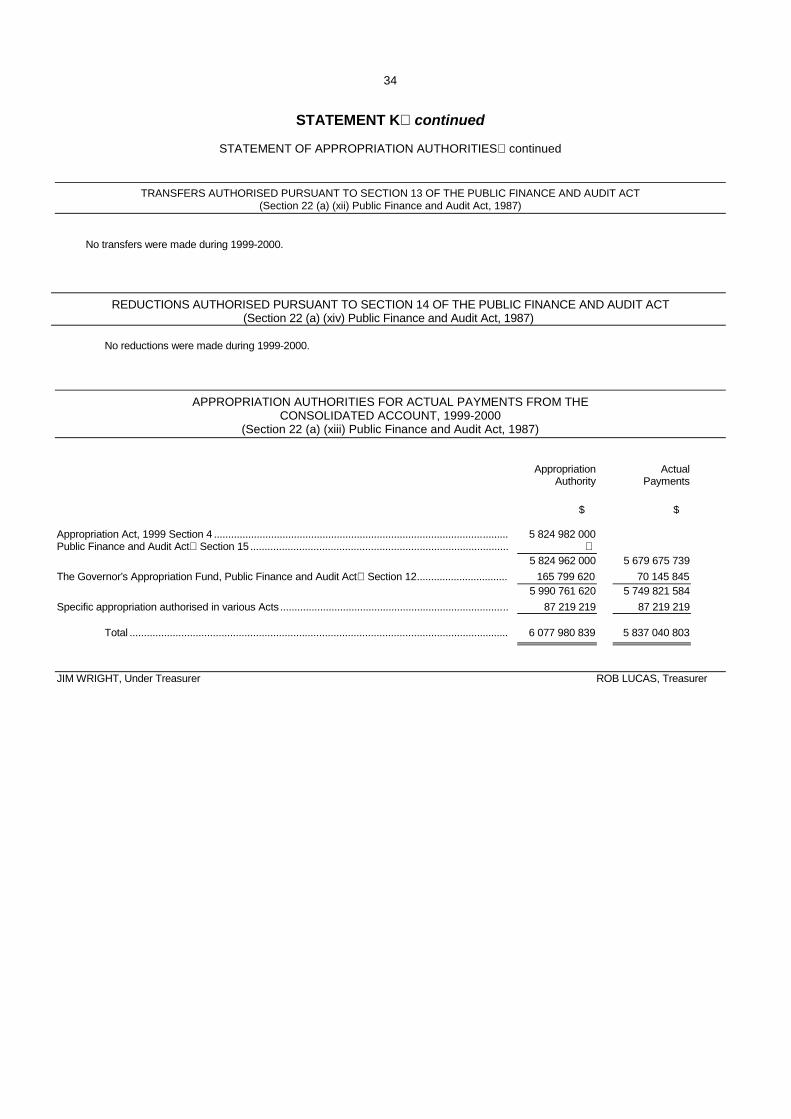
34
STATEMENT K continued
STATEMENT OF APPROPRIATION AUTHORITIES continued
TRANSFERS AUTHORISED PURSUANT TO SECTION 13 OF THE PUBLIC FINANCE AND AUDIT ACT (Section 22 (a) (xii) Public Finance and Audit Act, 1987)
No transfers were made during 1999-2000.
REDUCTIONS AUTHORISED PURSUANT TO SECTION 14 OF THE PUBLIC FINANCE AND AUDIT ACT (Section 22 (a) (xiv) Public Finance and Audit Act, 1987)
No reductions were made during 1999-2000.
APPROPRIATION AUTHORITIES FOR ACTUAL PAYMENTS FROM THE CONSOLIDATED ACCOUNT, 1999-2000
(Section 22 (a) (xiii) Public Finance and Audit Act, 1987)
Appropriation
Authority Actual
Payments
$ $ Appropriation Act, 1999 Section 4 ....................................................................................................... 5 824 982 000 Public Finance and Audit Act Section 15.......................................................................................... 5 824 962 000 5 679 675 739
The Governor’s Appropriation Fund, Public Finance and Audit Act Section 12................................ 165 799 620 70 145 845 5 990 761 620 5 749 821 584
Specific appropriation authorised in various Acts ................................................................................ 87 219 219 87 219 219 Total .................................................................................................................................... 6 077 980 839 5 837 040 803
JIM WRIGHT, Under Treasurer ROB LUCAS, Treasurer
General Index to Part B
of the
Report
of the
Auditor-General
for the
Year ended 30 June 2000


A Aboriginal Housing Authority,
Authorisation of Remuneration for the Chairperson Human Services, Department of, 303
Transfer of Activities South Australian Housing Trust, 381
Aboriginal Housing Programs, transfer of South Australian Aboriginal Housing Authority, 329
Accountability for Commission, Non-Commission and Trust Funds in Health Units South Australian Health Commission and Associated
Activities, 359, 360 Accounting for Crown Land
Environment and Heritage, Department for, 261 Accounting Policies
Education, Training and Employment, Department of, 166 Accounts Payable Processing
Human Services, Department of, 302 Accounts Receivable
Education, Training and Employment, Department of, 161 Adelaide Contract
South Australian Water Corporation, 121 Adelaide Convention Centre, 573
Adelaide Railway Station Area Service Facilities Arrangement, 576
Changes to Agency Organisational Structure, 573 Extension Project, 575 Financial Management Framework, 574
Adelaide Entertainments Corporation, 586 Governance Framework, 587 Interpretation and Analysis of Financial Statements, 588
Adelaide Festival Centre Trust, 686 Car Park, 687 Catering, 687 Operating Result, 689 Programming, 686 Statement of Cash Flows, 690 Theatre Operations, 686 Ticketing Services, 686
Adelaide Festival Corporation, 679 Operating Result, 680
Adelaide Institute of TAFE Education, Training and Employment, Department of, 161
Adelaide Railway Station Area Service Facilities Arrangement Adelaide Convention Centre, 576
Administered Transactions Land Management Corporation, 54
Administration of the Food Act South Australian Health Commission and Associated
Activities, 359 Administrative and Information Services, Department for, 5
Asset Control, 14 Computer Information Systems Environment, 9 Corporatisation of Forestry SA, 21 EDS IT Infrastructure Contract, 19 Financial Management Framework, 7 Further Commentary on Operations, 19 Government Radio Network Contract, 20 Independent Audit Report, 18 Interpretation and Analysis of Financial Statements, 15 Land Ownership and Tenure System, 13 Land Services Group, 13 Linen Establishment, 18 Motor Vehicle Fleet Finance Lease, 17 Outsourcing of Building Maintenance Work, 12 Outsourcing of Warehouse Operations, 10 Procurement Arrangements, 10 Qualified Audit Opinion, 19 Real Estate Management, 13 Sale of Central Linen, 21 Significant Features, 5 South Australian Government Light Vehicle Fleet - Sale and
Leaseback Arrangement, 21 Valuation of Forest Assets, 16
Advance Payments-Capital Program Human Services, Department of, 302
Adverse Events Primary Industries and Resources, Department of, 655
Agency Funding Arrangements from 1 July 1999, Changes to Country Fire Service Board, 499 Emergency Services Administrative Unit, 515 South Australian Metropolitan Fire Service, 557
Agency Organisational Structure, Changes to Adelaide Convention Centre, 573 Country Fire Service Board, 498 Electricity Supply Industry - Overview, 851, 854 South Australian Metropolitan Fire Service, 556 Transport, Urban Planning and the Arts, Department
for, 709 Art Gallery Board, 699
Non-Current Assets, 700 Operating Revenues, 700
Artlab Australia, Revenue Transport, Urban Planning and the Arts, Department
for, 711 Arts SA Transport, Urban Planning and the Arts, Department
for, 710 Asset Control
Administrative and Information Services, Department for, 14 Asset Leases/Sales
Electricity Reform and Sales Unit, 841 Asset Management
South Australian Housing Trust, 387 Asset Quality
HomeStart Finance, 286 Asset Registers
Transport, Urban Planning and the Arts, Department for, 710, 711
Asset Valuations Land Management Corporation, 52
Assets for Disposal Electricity Reform and Sales Unit, 840
Attorney-General’s Department, 423 Commentary on General Financial Controls, 426 Criminal Injuries Compensation, 449 Emergency Services Levy, 428 Financial Management Framework, 425 Gambling, Total Revenue to Government from all Forms of,
430 Residential Tenancies Fund, 447
Audit Committee Motor Accident Commission, 945 South Australian Ports Corporation, 89 South Australian Water Corporation, 119
Audit Findings and Comments Human Services, Department of, 300 Industry and Trade, Department of, 406 South Australian Health Commission and Associated
Activities, 357 Auditor-General’s Department, 595 Australian Major Events
South Australian Tourism Commission, 639 AUSTRICS
TransAdelaide, 821
B Bad and Doubtful Debts, Provision for
South Australian Health Commission and Associated Activities, 358
Banked Gas Terra Gas Trader Pty Ltd, 909
Borrowings South Australian Ports Corporation, 91
Brukunga Mine Site, Transfer of Primary Industries and Resources, Department of, 655
Budgetary and Financial Management System (BFMS) Treasury and Finance, Department of, 1080
Building Maintenance Work, Outsourcing of Administrative and Information Services, Department for, 12
C Capital Operations
Education, Training and Employment, Department of, 173 Capital Works Assistance Scheme
Education, Training and Employment, Department of, 160 Cash on Hand and Deposits
Transport, Urban Planning and the Arts, Department for, 714
Cash Management in the Health Sector South Australian Health Commission and Associated
Activities, 358 Catastrophe Reinsurance
South Australian Government Captive Insurance Corporation (SAICORP), 975
Catchment Water Management Boards, 1099 Northern Adelaide and Barossa Catchment Water
Management Board, 1117 Onkaparinga Catchment Water Management Board, 1123 Patawalonga Catchment Water Management Board, 1105 River Murray Catchment Water Management Board, 1102
Status of Financial Statements, 1100 South East Catchment Water Management Board, 1101
Independent Audit Report, 1102 Qualified Audit Opinion, 1102
Torrens Catchment Water Management Board, 1111 Water Based Levies, 1101, 1103
Catering Adelaide Festival Centre Trust, 687
Central Linen, Sale of Administrative and Information Services, Department for, 21
Changes to Agency Funding Arrangements from 1 July 1999 Country Fire Service Board, 499 South Australian Metropolitan Fire Service, 557
Changes to Agency Organisational Structure Adelaide Convention Centre, 573 Country Fire Service Board, 498 Electricity Supply Industry - Distribution, 877 Electricity Supply Industry - Generation, 887 Electricity Supply Industry - Transmission, 926 Industry and Trade, Department of, 405 RESI OE Pty Ltd, 902 RESI SYN Pty Ltd, 905 South Australian Metropolitan Fire Service, 556
Changes to the South Australian Health Commission Act 1976 South Australian Health Commission and Associated
Activities, 355 Claims Management Agreement
Motor Accident Commission, 948 Commentary on Compliance with Legislation
Construction Industry Training Board, 152 Commentary on Computer Information Systems Environment
Lotteries Commission of South Australia, 72 Commentary on General Financial Controls
Attorney-General’s Department, 426 Lotteries Commission of South Australia, 71 South Australian Aboriginal Housing Authority, 330 South Australian Housing Trust, 383
Common Public Sector Interest Rate South Australian Government Financing Authority, 1006
Community Housing Organisation Audited Financial Statements South Australian Community Housing Authority, 343
Competitive Tendering and Contracting Process Passenger Transport Board, 776
Compliance with Legislation, Commentary on Construction Industry Training Board, 152
Computer Information Systems Environment Administrative and Information Services, Department for, 9 Lotteries Commission of South Australia, 72
Construction Industry Training Board, 151 Commentary on Compliance with Legislation, 152
Contract Income TransAdelaide, 820
Contract Management Passenger Transport Board, 775
Contracts to Provide Passenger Transport Services TransAdelaide, 817
Contributions to Government South Australian Water Corporation, 125
Control Environment Legal Services Commission, 519
Controlled Entities Operations TransAdelaide, 821
Convention Centre Extension Project Adelaide Convention Centre, 575
Corporate Governance Statement Motor Accident Commission, 945
Corporate Information Technology (IT) Structure and Operations Treasury and Finance, Department of, 1083
Corporatisation of Forestry SA Administrative and Information Services, Department for, 21
Correctional Services, Department for, 479 Renewal of the Agreement for the Provision of Services for
the Management and Operation of the Mount Gambier Prison, 481
Cost Recovery from Passengers Passenger Transport Board, 777
Country Fire Service Board, 498 Changes to Agency Funding Arrangements from
1 July 1999, 499 Changes to Agency Organisational Structure from
1 July 1999, 498 Status of Financial Statements, 499
Courts Administration Authority, 500 Courts Case Management System, 501
CTP - Management Agreements Motor Accident Commission, 948
CTP Operations Motor Accident Commission, 947
Criminal Injuries Compensation Attorney-General’s Department, 449
Crown Land, Accounting for Environment and Heritage, Department for, 261
Customer Service Information System South Australian Water Corporation, 120
D DAIS. See Administrative and Information Services,
Department for Debt Management
South Australian Government Financing Authority, 1007 DECStech 2001
Education, Training and Employment, Department of, 169 DEH. See Environment and Heritage, Department for Delegations of Authority
South Australian Community Housing Authority, 342 Department for Administrative and Information Services. See
Administrative and Information Services, Department for Department for Correctional Services. See Correctional
Services, Department for Department for Environment and Heritage. See Environment
and Heritage, Department for Department for Transport, Urban Planning and the Arts. See
Transport, Urban Planning and the Arts, Department for Department for Water Resources. See Water Resources,
Department for Department of Education, Training and Employment. See
Education, Training and Employment, Department of Department of Human Services. See Human Services,
Department of Department of Industry and Trade. See Industry and Trade,
Department of Department of Justice. See Justice, Department of Department of Primary Industries and Resources. See Primary
Industries and Resources, Department of Department of the Premier and Cabinet. See Premier and
Cabinet, Department of the

Department of Treasury and Finance. See Treasury and Finance, Department of
DETE. See Education, Training and Employment, Department of
Directors’ Questionnaires South Australian Ports Corporation, 89
Disposal of Assets and Liabilities of the Business Electricity Supply Industry - Generation, 889 Terra Gas Trader Pty Ltd, 908
Disposal of Non-Prescribed Assets and Liabilities Electricity Supply Industry - Distribution, 879 Electricity Supply Industry - Retail, 924 RESI OE Pty Ltd, 904 RESI SYN Pty Ltd, 907
Distribution Lessor Corporation, 880 Transfer and Lease of Electricity Distribution Assets, 880
Documentation of Policies and Procedures Human Services, Department of, 301 State Opera of South Australia, The, 800
E Economic Development Obligations
South Australian Water Corporation, 121 EDSAS (School Administration System)
Education, Training and Employment, Department of, 162 EDS IT Infrastructure Contract
Administrative and Information Services, Department for, 19 Education, Training and Employment, Department of, 159
Accounting Policies, 166 Accounts Receivable, 161 Adelaide Institute of TAFE, 161 Capital Operations, 173 Capital Works Assistance Scheme, 160 DECStech 2001, 169 Financial Management Framework, 166 Independent Audit Report, 163 Partnerships 21, 166 Qualified Audit Opinion, 163 School Administration System (EDSAS), 162
Electoral Districts Boundaries Commission State Electoral Office, 565
Electricity Corporations, the Sale/Lease of, Management Proceeds South Australian Government Financing Authority, 1006
Electricity Reform and Sales Unit, 837 Asset Leases/Sales, 841 Assets for Disposal, 840 Electricity Sale/Lease Proceeds Account, 846 Operating Expenses, 839 Special Deposit Account, 837
Electricity Risk Management Electricity Supply Industry - Generation, 891
Electricity Sale/Lease Proceeds Account Electricity Reform and Sales Unit, 846
Electricity Supply Industry Distribution, 877
Changes to Agency Organisational Structure, 877 RESI Utilities Pty Ltd, 877 Transfer of Assets to Distribution Lessor Corporation
Disposal of Non-Prescribed Assets and Liabilities, 879 Transfer of Assets to Distribution Lessor
Corporation, 878 Generation, 887
Changes to Agency Organisational Structures in 1999-2000, 887
Disposal of Assets and Liabilities of the Business, 889 Electricity Risk Management, 891 Flinders Power Pty Ltd, 889 Future Losses on Co-Generation Contracts, 890
Retail, 923 Disposal of Non-Prescribed Assets and Liabilities, 924 RESI Power Pty Ltd, 923
Electricity Supply Industry (continued) Transmission, 926
Changes to Agency Organisational Structure in 2000-01, 926
Debt to Equity Ratio, 927 Rate of Return on Assets, 927 Transmission Lessor Corporation, 926
Emergency Services Administrative Unit, 515 Agency Funding from 1 July 1999, 515 Status of Financial Statements, 516
Emergency Services Levy Attorney-General’s Department, 428
Employee Remuneration Lotteries Commission of South Australia, 73
Environment and Heritage, Department for, 257 Accounting for Crown Land, 261 Financial Management Framework, 258 Independent Audit Report, 265 Land Services Group, 262 Office for Recreation and Sport, 264 Property Plant and Equipment, 260 Qualified Audit Opinion, 265 Waste Depot Levies, 263 Water Licensing System, 263
ETSA Corporation. See RESI Corporation
F Financial Management Framework
Adelaide Convention Centre, 574 Administrative and Information Services, Department for, 7 Attorney-General’s Department, 425 Education, Training and Employment, Department of, 166 Environment and Heritage, Department for, 258 Human Services, Department of, 300 Primary Industries and Resources, Department of, 654 South Australian Tourism Commission, 640 South Australian Health Commission and Associated
Activities, 357 Financial Performance and Financial Position
South Australian Government Financing Authority, 1003 Financial Position
South Australian Government Captive Insurance Corporation (SAICORP), 981
Financial Statement Preparation Industry and Trade, Department of, 406
Firearms Control System Police Department, 530
Fixed Assets Water Resources, Department for, 1136
Fleet Finance Lease, Motor Vehicle Administrative and Information Services, Department for, 17
Flinders Coal Pty Ltd, 875 Transfer of Assets and Liabilities to RESI Corporation and
the Treasurer, 875 Flinders Power Pty Ltd
Electricity Supply Industry - Generation, 889 Flinders University of South Australia, 188
Statutory Financial Statement Reporting, 189 Food Act, Administration of
South Australian Health Commission and Associated Activities, 359
Foreign Exchange Management South Australian Health Commission and Associated
Activities, 358 Forest Assets, Valuation of
Administrative and Information Services, Department for, 16 Forestry SA, Corporatisation of
Administrative and Information Services, Department for, 21 Funds Under Management
Superannuation Funds Management Corporation of South Australia, 1053
Further Commentary on Operations Administrative and Information Services, Department for, 19
Future Losses on Co-Generation Contracts Electricity Supply Industry - Generation, 890

G Gambling, Total Revenue to Government from all Forms
Attorney-General’s Department, 430 General Financial Controls, Commentary on
Attorney-General’s Department, 426 Lotteries Commission of South Australia, 71
Generation Lessor Corporation, 917 Transfer and Lease of Electricity Generation Assets, 917
Governance Framework Adelaide Entertainments Corporation, 587
Government Management Framework and Budget Reform Treasury and Finance, Department of, 1079
Government Ownership, Review of South Australian Totalizator Agency Board, 101
Government Radio Network Contract Administrative and Information Services, Department for, 20
Government Workers Rehabilitation and Compensation Fund Premier and Cabinet, Department of the, 618
Grants Transport, Urban Planning and the Arts, Department
for, 710
H Health Commission. See South Australian Health Commission
and Associated Activities Health Sector, Cash Management South Australian Health
Commission and Associated Activities, 358 Health Units, Accountability for Commission, Non-Commission
and Trust Funds South Australian Health Commission and Associated
Activities, 359, 360 Heritage Collection Registers
Museum Board, 766 Hills Transit
TransAdelaide, 821 History Trust of South Australia, 733 HomeStart Finance, 283
Asset Quality, 286 Lending, 286 Profitability and Return to Government, 285
HomeStart Profitability and Return to Government HomeStart Finance, 285
Housing Improvement Act 1940, 381 Housing Reform
South Australian Housing Trust, 381 Human Services, Department of, 299
Accounts Payable Processing, 302 Advance Payments-Capital Program, 302 Audit Findings and Comments, 300 Authorisation of Remuneration for the Chairperson of the
Aboriginal Housing Authority, 303 Documentation of Policies and Procedures, 301 Financial Management Framework, 300 Functional Responsibility and Structure, 299 Internal Audit, 301 Interpretation and Analysis of Financial Statements, 303 Risk Management, 300
I Impact of the Electricity Businesses on the State’s Finances
Electricity Supply Industry - Overview, 854 Income from Investments
Superannuation Funds Management Corporation of South Australia, 1052
Independent Audit Report Administrative and Information Services, Department for, 18 Education, Training and Employment, Department of, 163 Environment and Heritage, Department for, 265 Justice Information System Services, 493 South Australian Motor Sport Board, 633 South East Catchment Water Management Board, 1102 Water Resources, Department for, 1136
Independent Review SA St John Ambulance Service Inc, 547
Industrial and Commercial Premises Corporation, 43 Interpretation and Analysis of Financial Statements, 44
Industry and Trade, Department of, 405 Audit Findings and Comments, 406 Changes to Organisational Structure, 405 Financial Statement Preparation, 406 Functional Responsibility and Structure, 405 Industry and Other Financial Assistance, 406 Infrastructure Development, 406 Rail Reform Transition Program, 406
Infrastructure Development Industry and Trade, Department of, 406
Institute of Medical and Veterinary Science, 315 Insurance Arrangements
South Australian Health Commission and Associated Activities, 357
Internal Audit Human Services, Department of, 301
Interpretation and Analysis of Financial Statements Adelaide Entertainments Corporation, 588 Administrative and Information Services, Department for, 15 Human Services, Department of, 303 Industrial and Commercial Premises Corporation, 44 SA St John Ambulance Service Inc, 544 Seventh Australian Masters Games Corporation, 625
Investment Management Agreement Motor Accident Commission, 948
Investment Operations Motor Accident Commission, 947
Investment Returns Superannuation Funds Management Corporation of South
Australia, 1055 Investment Strategy
South Australian Government Captive Insurance Corporation (SAICORP), 977
Investments South Australian Water Corporation, 125
J
Joint Venture Agreement TransAdelaide, 817
Justice Information System Services, 493 Independent Audit Report, 493 Qualified Audit Opinion, 493
Justice Portfolio, 419 Justice, Department of, 421
L
Land Management Corporation, 51 Administered Transactions, 54 Asset Valuations, 52 Land Sales, 52 Mawson Lakes Government Infrastructure Project, 53 Net Interest Income, 53
Land Ownership and Tenure System Administrative and Information Services, Department for, 13
Land Sales Land Management Corporation, 52
Land Services Group Administrative and Information Services, Department for, 13 Environment and Heritage, Department for, 262
Legal Services Commission, 517 Control Environment, 519 Planning and Analysis, 518
Liability for Accrued Benefits South Australian Superannuation Scheme, 1029
Libraries Board of South Australia, 742 Net Assets, 744 Property, Plant and Equipment Registers, 743 Research and Heritage Collection Management, 742 State Government Grants, 743 Subsidies to Public Libraries, 743
Lending HomeStart Finance, 286
Light Vehicle Fleet - Sale and Leaseback Arrangement Administrative and Information Services, Department for, 21
Linen Establishment Administrative and Information Services, Department for, 18
Local Government Elections State Electoral Office, 565
Local Government Finance Authority of South Australia, 753 Assets and Liabilities, 755 Results of Operation, 754
Lotteries Commission of South Australia, 69 Commentary on Computer Information Systems (CIS)
Environment, 72 Commentary on General Financial Controls, 71 Employee Remuneration, 73
M Major Events
South Australian Tourism Commission, 642 Management of Major Contracts
South Australian Water Corporation, 121 Management Representations
Motor Accident Commission, 945 South Australian Water Corporation, 119 TransAdelaide, 819
Market Value Accounting Motor Accident Commission, 947
Mawson Lakes Government Infrastructure Project Land Management Corporation, 53
Member Investment Choice Superannuation Funds Management Corporation of South
Australia, 1054 Ministerial Directions
South Australian Ports Corporation, 89 Motor Accident Commission, 943
Audit Committee, 945 Claims Management Agreement, 948 Consolidated Operating Result, 946 Corporate Governance Statement, 945 CTP - Management Agreements, 948 CTP Operations, 947 Investment Management Agreement, 948 Investment Operations, 947 Management Representations, 945 Market Value Accounting, 947 Underwriting Operations, 947
Motor Vehicle Fleet Finance Lease Administrative and Information Services, Department for, 17
Mount Gambier Prison, Renewal of the Agreement for the Provision of Services
Correctional Services, Department for, 481 Museum Board, 766
Heritage Collection Registers, 766 Non-Current Assets, 767 Operating Result, 767 State Government Grants, 767
N Net Interest Income
Land Management Corporation, 53 Non-Current Assets
Art Gallery Board, 700 Museum Board, 767 Police Department, 529 Recording and Accounting for
Treasury and Finance, Department of, 1084 Transport, Urban Planning and the Arts, Department
for, 714
Northern Adelaide and Barossa Catchment Water Management Board, 1117
O Office for Recreation and Sport
Environment and Heritage, Department for, 264 Olympic Football Tournament
South Australian Tourism Commission, 642 Onkaparinga Catchment Water Management Board, 1123 Operating Expenses
Electricity Reform and Sales Unit, 839 Transport, Urban Planning and the Arts, Department
for, 713 Operating Performance
South Australian Government Captive Insurance Corporation (SAICORP), 980
Operating Result Adelaide Festival Centre Trust, 689 Adelaide Festival Corporation, 680 Motor Accident Commission (Consolidated), 946 Museum Board, 767 Public Trustee Services, 452 South Australian Motor Sport Board, 632
Operating Revenues Art Gallery Board, 700 Transport, Urban Planning and the Arts, Department
for, 713 Operations and Maintenance
South Australian Water Corporation, 121 Outsourcing of Building Maintenance Work
Administrative and Information Services, Department for, 12 Outsourcing of Warehouse Operations
Administrative and Information Services, Department for, 10
P Passenger Transport Board, 774
Competitive Tendering and Contracting Process, 776 Contract Management, 775 Cost Recovery from Passengers, 777
Passenger Transport Services, Contracts to Provide TransAdelaide, 817
Partnerships 21 Education, Training and Employment, Department of, 166
Patawalonga Catchment Water Management Board Catchment Water Management Boards, 1105
Payments made to the Treasurer from Electricity Businesses Electricity Supply Industry - Overview, 854
Performance Measurement South Australian Water Corporation, 126
Planning SA Transport, Urban Planning and the Arts, Department
for, 712 Police Department, 527
Firearms Control System, 530 Non-Current Assets, 529 Police Security Services, 529
Police Superannuation Scheme, 965 Status of Financial Statements, 965
Policies, Accounting Education, Training and Employment, Department of, 166
Policies and Procedures University of South Australia, 236
Policies and Procedures, Documentation of Human Services, Department of, 301
Premier and Cabinet, Department of the, 602 Government Workers Rehabilitation and Compensation
Fund, 618 Targeted Voluntary Separation Package (TVSP)
Scheme, 614 Primary Industries and Resources, Department of, 653
Adverse Events, 655 Financial Management Framework, 654 Restructuring, 655 Transfer of Brukunga Mine Site, 655
Procurement Arrangements Administrative and Information Services, Department for, 10
Programming Adelaide Festival Centre Trust, 686
Property Database South Australian Community Housing Authority, 342
Property Plant and Equipment Environment and Heritage, Department for, 260 Registers
Libraries Board of South Australia, 743 Provision for Bad and Doubtful Debts
South Australian Health Commission and Associated Activities, 358
Provisions RESI Corporation, 858
Public Trustee Services, 450 Operating Result, 452 Statement of Trusts being Administered, 453
Purchasing System Transport, Urban Planning and the Arts, Department
for, 711
Q Qualified Audit Opinion
Administrative and Information Services, Department for, 19 Education, Training and Employment, Department of, 163 Environment and Heritage, Department for, 265 Justice Information System Services, 493 South Australian Motor Sport Board, 633 South East Catchment Water Management Board, 1102 Water Resources, Department for, 1136
R Radio Network Contract, Government
Administrative and Information Services, Department for, 20 Rail Reform Transition Program
Industry and Trade, Department of, 406 Railway Station Area Service Facilities Arrangement
Adelaide Convention Centre, 576 Rate of Return on Assets
Electricity Supply Industry - Transmission, 927 Real Estate Management
Administrative and Information Services, Department for, 13 Recreation and Sport, Office for
Environment and Heritage, Department for, 264 Registration and Licensing
Transport, Urban Planning and the Arts, Department for, 712
Remuneration for the Chairperson of the Aboriginal Housing Authority, Authorisation of Human Services, Department of, 303
Research and Heritage Collection Management Libraries Board of South Australia, 742
Residential Tenancies Fund Attorney-General’s Department, 447
RESI Corporation, 856 Net Liabilities, 857 Provisions, 858 Transfers of Assets and Liabilities, 857
RESI OE Pty Ltd, 902 Changes to Agency Organisational Structure from July
1999, 902 Disposal of Non-Prescribed Assets and Liabilities, 904 Transfer of Assets to Generation Lessor Corporation, 903
RESI Power Pty Ltd Electricity Supply Industry - Retail, 923
RESI SYN Pty Ltd, 905 Changes to Agency Organisational Structure from July
1999, 905 Disposal of Non-Prescribed Assets and Liabilities, 907 Transfer of Assets to Generation Lessor Corporation, 906
RESI Utilities Pty Ltd Electricity Supply Industry - Distribution, 877
Revaluation of Non-Current Assets South Australian Ports Corporation, 90
Revenue - Artlab Australia Transport, Urban Planning and the Arts, Department
for, 711 Review of Capital Projects
South Australian Housing Trust, 384 Review of Government Ownership
South Australian Ports Corporation, 88 South Australian Totalizator Agency Board, 101
Risk Management Human Services, Department of, 300 University of South Australia, 236
Riverland Contract South Australian Water Corporation, 121
River Murray Catchment Water Management Board Catchment Water Management Boards, 1100, 1102
S SAFA. See South Australian Government Financing Authority SAICORP. See South Australian Government Captive
Insurance Corporation Sale of Central Linen
Administrative and Information Services, Department for, 21 SAOFS. See South Australian Office of Financial Supervision SA St John Ambulance Service Inc, 542
Independent Review, 547 Interpretation and Analysis of Financial Statements, 544
Schlumberger Contract South Australian Water Corporation, 121
School Administration System (EDSAS) Education, Training and Employment, Department of, 162
Seventh Australian Masters Games Corporation, 624 Interpretation and Analysis of Financial Statements, 625 Scope of Audit and Findings, 624
South Australian Aboriginal Housing Authority, 329 Aboriginal Housing programs, transfer of, 329 Approval of Remuneration for the Authority
Chairperson, 330 Commentary on General Financial Controls, 330 Significant Feature, 329
South Australian Asset Management Corporation and its Controlled Entities, 966 Status of Financial Statements, 966
South Australian Community Housing Authority, 341 Community Housing Organisation Audited Financial
Statements, 343 Delegations of Authority, 342 Property Database, 342
South Australian Film Corporation, 788 South Australian Finance Trust Limited, 967 South Australian Government Captive Insurance Corporation
(SAICORP), 975 Catastrophe Reinsurance, 975 Financial Position, 981 Investment Strategy, 977 Operating Performance, 980
South Australian Government Financing Authority, 999 Debt Management, 1007 Financial Performance and Financial Position, 1003 Sale/Lease of Electricity Corporations and Management
Proceeds, 1006 Common Public Sector Interest Rate, 1006
South Australian Health Commission and Associated Activities, 354 Accountability for Commission, Non-Commission and Trust
Funds in Health Units, 359, 360 Administration of the Food Act, 359 Audit Findings and Comments, 357 Cash Management in the Health Sector, 358 Changes to the South Australian Health Commission Act
1976, 355 Financial Management Framework, 357 Foreign Exchange Management, 358 Insurance Arrangements, 357 Provision for Bad and Doubtful debts, 358 Significant Features, 356

South Australian Housing Trust, 381 Aboriginal Housing Authority, Transfer of Activities, 381 Asset Management, 387 Commentary on General Financial Controls, 383 Housing Improvement Act 1940, 381 Housing Reform, 381 Indebtedness, 386 Review of Capital Projects, 384 South Australian Housing Trust Act 1936, 381
South Australian Housing Trust Act 1995, 381 South Australian Metropolitan Fire Service, 556
Changes to Agency Funding Arrangements from 1 July 1999, 557
Changes to Agency Organisational Structure from 1 July 1999, 556
Status of Financial Statements, 557 South Australian Motor Sport Board, 631
Independent Audit Report, 633 Operating Result, 632 Qualified Audit Opinion, 633 Significant Features, 631
South Australian Office of Financial Supervision, 558 Wind up, 558
South Australian Ports Corporation, 88 Audit Committee, 89 Borrowings, 91 Directors’ Questionnaires, 89 Ministerial Directions, 89 Revaluation of Non-Current Assets, 90 Review of Government Ownership, 88
South Australian Superannuation Board, 1024, 1026 Systems Developments, 1026 Transfer of ETSA Pensioners and Former Employees to
State Superannuation Scheme, 1026 South Australian Superannuation Scheme, 1027
Liability for Accrued Benefits, 1029 South Australian Totalizator Agency Board, 101
Additional Distribution, 103 Five Year Analysis of Turnover, 104 Review of Government Ownership, 101
South Australian Tourism Commission, 639 Administered Items, 642 Australian Major Events, 639 Financial Management Framework, 640 Major Events, 642 Olympic Football Tournament, 642
South Australian Water Corporation, 117 Adelaide Contract, 121 Audit Committee, 119 Contributions to Government, 125 Customer Service Information System (CSIS), 120 Economic Development Obligations, 121 Investments, 125 Management of Major Contracts, 121 Management Representations, 119 Operations and Maintenance, 121 Performance Measurement, 126 Riverland Contract, 121 Schlumberger Contract, 121
South East Catchment Water Management Board, 1129 Catchment Water Management Boards, 1101 Independent Audit Report, 1102 Qualified Audit Opinion, 1102
Southern State Superannuation Scheme, 1041 Total Assets, 1042
Special Deposit Account Electricity Reform and Sales Unit, 837
State Electoral Office, 564 Electoral Districts Boundaries Commission, 565 Local Government Elections, 565
State Government Grants Libraries Board of South Australia, 743 Museum Board, 767
State Opera of South Australia, The, 799 Documentation of Policies and Procedure, 800 Result of Operations, 801
State Opera Ring Corporation, 799 Statistical Details on Productions, 802
State Opera Ring Corporation, 799 State Theatre Company of South Australia, 808
Statistical Details on Productions, 810 State Supply Board, 142 Status of Financial Statements
Country Fire Service Borad, 499 Emergency Service Administrative Unit, 516 Police Superannuation Scheme, 965 River Murray Catchment Water Management Boards, 1100 South Australian Asset Management Corporation and its
Controlled Entities, 966 South Australian Metropolitan Fire Service, 557
Statement of Trusts Being Administered Public Trustee Services, 453
Statistical Details on Productions State Opera of South Australia, The, 802 State Theatre Company of South Australia, 810
Statutory Financial Statement Reporting Flinders University of South Australia, 189
Subsidies to Public Libraries Libraries Board of South Australia, 743
Superannuation Funds Management Corporation of South Australia, 1050 Funds Under Management, 1053 Income from Investments, 1052 Investment Returns, 1055 Member Investment Choice, 1054
Systems Developments South Australian Superannuation Board, 1026
T TAFE, Adelaide Institute of
Education, Training and Employment, Department of, 161 Targeted Voluntary Separation Package (TVSP) Scheme
Premier and Cabinet, Department of the, 614 Theatre Operations
Adelaide Festival Centre Trust, 686 Terra Gas Trader Pty Ltd, 908
Banked Gas, 909 Disposal of Assets and Liabilities of the Business, 908
Ticketing Services Adelaide Festival Centre Trust, 686
Torrens Catchment Water Management Board Catchment Water Management Boards, 1111
TransAdelaide, 816 AUSTRICS, 821 Contract Income, 820 Contracts to Provide Passenger Transport Services, 817 Controlled Entities Operations, 821 Hills Transit, 821 Joint Venture Agreement, 817 Management Representations, 819
Transfer and Lease of Electricity Distribution Assets Distribution Lessor Corporation, 880
Transfer and Lease of Electricity Generation Assets Generation Lessor Corporation, 917
Transfer of Assets and Liabilities to RESI Corporation and the Treasurer Flinders Coal Pty Ltd, 875
Transfer of Assets to Distribution Lessor Corporation Electricity Supply Industry - Distribution, 878
Transfer of Assets to Generation Lessor Corporation RESI OE Pty Ltd, 903 RESI SYN Pty Ltd, 906
Transfer of ETSA Pensioners and Former Employees to State Superannuation Scheme South Australian Superannuation Board, 1026
Transfer of Brukunga Mine Site Primary Industries and Resources, Department of, 655
Transmission Lessor Corporation Electricity Supply Industry - Transmission, 926
Transport SA, Transport, Urban Planning and the Arts, Department for, 711
Transport, Urban Planning and the Arts, Department for, 709 Administered Items, 715 Agency Organisational Structure, Changes to, 709 Arts SA, 710 Asset Registers, 710, 711 Cash on Hand and Deposits, 714 Division of State Aboriginal Affairs (DOSAA), 712 Grants, 710 Non-Current Assets, 714 Operating Expenses, 713 Operating Revenues, 713 Payroll, 711 Planning SA, 712 Purchasing System, 711 Registration and Licensing, 712 Revenue - Artlab Australia, 711 Transport SA, 711
Treasury and Finance, Department of, 1075 Budgetary and Financial Management System
(BFMS), 1080 Corporate Information Technology (IT) Structure and
Operations, 1083 Corporatisation, Commercialisation and Cost Reflective
Pricing, 1082 Government Management Framework and Budget
Reform, 1079 Recording and Accounting for Non-Current Assets, 1084 Whole-of-Government Reporting, 1081
TVSP. See Targeted Voluntary Separation Package (TVSP) Scheme
U Underwriting Operations
Motor Accident Commission, 947 University of Adelaide, 208 University of South Australia, 235
Policies and Procedures, 236 Responsibilities of Cost Centre Managers, 236 Risk Management Strategy, 236
V
Valuation of Forest Assets Administrative and Information Services, Department for, 16
W Warehouse Operations, Outsourcing of
Administrative and Information Services, Department for, 10 Waste Depot Levies
Environment and Heritage, Department for, 263 Water Based Levies
Catchment Water Management Boards, 1101, 1103 Water Licensing System
Environment and Heritage, Department for, 263 Water Resources, Department for, 1135
Water Resources, Department for, 1134 Fixed Assets, 1136 Independent Audit Report, 1136 Qualified Audit Opinion, 1136 Water Licensing System, 1135
Whole-of-Government Reporting Treasury and Finance, Department of, 1081