REPORT Quantitative risk assessment for Greve biogas plant
37
Trondheim - 25.11.2020 Ref. No.: Gexcon-20-F100936-RA-1 Rev.: 03 REPORT Quantitative risk assessment for Greve biogas plant Client Author(s) Air Liquide Skagerak Lillian Kråkmo
Transcript of REPORT Quantitative risk assessment for Greve biogas plant

Trondheim - 25.11.2020 Ref. No.: Gexcon-20-F100936-RA-1 Rev.: 03
REPORT
Quantitative risk assessment for Greve biogas plant Client Author(s)
Air Liquide Skagerak Lillian Kråkmo

Quantitative risk assessment for Greve biogas plant Report
Ref. No.: Gexcon-20-F100936-RA-1 Rev.: 03 Date: 25.11.2020 Page 2 of 37
© Gexcon AS. The information contained herein is to be used by the recipient solely for the purpose for which it was supplied. It shall not be disclosed in whole or in part, by any other party without the written permission of Gexcon AS.
Document Info
Author(s) Classification
Lillian Kråkmo Confidential (F)
Title
Quantitative risk assessment for Greve biogas plant
Extract
This report documents a quantitative risk assessment for a planned LBG plant at Sem in Tønsberg. The implied individual risk is presented as risk contours, with the purpose of establishment of consideration zones for land-use planning.
Project Info
Client Clients ref.
Air Liquide Skagerak Eystein Helland
Gexcon Project No. Gexcon Project Name
100936 AirLiquideSkagerak_Greve _LBG_RA
Revision
Rev. Date Author Checked by Approved by Reason for revision
00 25.11.19
Lillian Kråkmo Øystein Spangelo Øystein Spangelo Draft issue
01 29.05.20
Lillian Kråkmo Øystein Spangelo Øystein Spangelo Updated risk contours based on new layout and adjusted release frequency analysis
02 30.10.20 Lillian Kråkmo Øystein Spangelo Øystein Spangelo Updated based on comments from The Norwegian Directorate for Civil Protection
03 25.11.20 Lillian Kråkmo Øystein Spangelo Øystein Spangelo Minor corrections

Quantitative risk assessment for Greve biogas plant Report
Ref. No.: Gexcon-20-F100936-RA-1 Rev.: 03 Date: 25.11.2020 Page 3 of 37
© Gexcon AS. The information contained herein is to be used by the recipient solely for the purpose for which it was supplied. It shall not be disclosed in whole or in part, by any other party without the written permission of Gexcon AS.
Disclaimer
Gexcon shall not be liable for any damages which the assignor, or assignor’s clients, vendors, consultants or other third party, may incur as a result of applying or using the results of Gexcon’s work, unless there is misconduct or gross negligence on the part of Gexcon or on the part of the persons used by Gexcon to carry out the work.

Quantitative risk assessment for Greve biogas plant Report
Ref. No.: Gexcon-20-F100936-RA-1 Rev.: 03 Date: 25.11.2020 Page 4 of 37
© Gexcon AS. The information contained herein is to be used by the recipient solely for the purpose for which it was supplied. It shall not be disclosed in whole or in part, by any other party without the written permission of Gexcon AS.
Changes from previous revisions
The documented risk analysis has been subject to several updates from the first revision of this report. The most significant changes are detailed below.
Revision 03
The current revision has only been subject to small corrections in the descriptions of the LBG tank foundation.
Revision 02
The updates in revision 02 were based on feedback from the Norwegian Directorate for Civil Protection (1). This involved several adjustments and clarifications, most importantly:
• An event tree was included, describing how Riskcurves models ignited events based on release scenarios.
• The assumed plant site limit in the context of ignition probabilities was defined. Moreover, the ignition probabilities assumed for some of the release scenarios (most importantly releases in the category “large” from the existing upgrade units), were adjusted, to correctly reflect the definition of the plant site limit.
• The assumed protection factor from heat exposure due to clothing, which by default is set to 0.14 in Riskcurves, was changed to 0.
• A note was made concerning the modelling of the liquid releases from the LBG tank segments in Riskcurves (see Chapter 4.3).
Revision 01
Several changes were made from revision 00 to revision 01 of this report. The most significant updates are listed below:
• The layout of the LBG plant was modified. In revision 00 of the report, the LBG plant was assumed to be located further south, and hence closer to the greenhouse. Moreover, the LBG tank foundation was not designed for confining the pool in case of a full rupture.
• The two additional digester tanks and the biogas buffer storage were not included in the layout assumed in revision 00, and the full rupture scenarios for the existing digester tanks were not accounted for in the risk calculations.
• The release frequency analysis was updated based on preliminary P&IDs for the process units located inside the liquefaction building. (In revision 00, the analysis of these units was based on comparable units on a different LBG plant.)
• The release frequencies for the process equipment were calculated with the latest version of Gexcon’s inhouse tool FLACS Frequency, which implements an updated version of the PLOFAM model (2). Moreover, the risk contours were calculated with Riskcurves 11, which models flash fires in a slightly different manner than Riskcurves 10, which was used for revision 00.

Quantitative risk assessment for Greve biogas plant Report
Ref. No.: Gexcon-20-F100936-RA-1 Rev.: 03 Date: 25.11.2020 Page 5 of 37
© Gexcon AS. The information contained herein is to be used by the recipient solely for the purpose for which it was supplied. It shall not be disclosed in whole or in part, by any other party without the written permission of Gexcon AS.
Table of Contents
Disclaimer ............................................................................................................................................... 3
Changes from previous revisions ........................................................................................................ 4
Revision 03 .................................................................................................................................. 4
Revision 02 .................................................................................................................................. 4
Revision 01 .................................................................................................................................. 4
1 Introduction ................................................................................................................................ 7
1.1 Riskcurves .................................................................................................................................... 7
1.2 Abbreviations and definitions ....................................................................................................... 7
2 System description .................................................................................................................... 8
2.1 Location ........................................................................................................................................ 8
2.2 Exposed areas ............................................................................................................................. 9
2.3 Greve biogas plant ..................................................................................................................... 11
2.4 Weather data .............................................................................................................................. 12
2.5 Manning and traffic ..................................................................................................................... 13
3 Risk analysis ............................................................................................................................ 14
3.1 Release scenarios ...................................................................................................................... 14
3.1.1 Digester and water removal facilities ......................................................................... 14
3.1.2 Upgrading units.......................................................................................................... 14
3.1.3 Compressor system ................................................................................................... 14
3.1.4 Polishing and liquefaction units ................................................................................. 14
3.1.5 LBG storage tanks with export and filling facilities .................................................... 15
3.1.6 Odorizer systems ....................................................................................................... 15
3.1.7 Pipelines .................................................................................................................... 15
3.2 Release frequency analysis ....................................................................................................... 16
3.3 Release rates and durations ...................................................................................................... 18
3.4 Ignition probabilities ................................................................................................................... 21
3.5 Ignited events ............................................................................................................................. 22
3.6 Modelling ignited events in Riskcurves ...................................................................................... 23
3.6.1 Parameter choices ..................................................................................................... 23
3.6.2 Vulnerability ............................................................................................................... 25
3.7 Risk related to toxic substances ................................................................................................ 25
3.8 Domino effects ........................................................................................................................... 25
4 Results ...................................................................................................................................... 27
4.1 Risk contours ............................................................................................................................. 27
4.2 Risk distribution .......................................................................................................................... 28
Quantitative risk assessment for Greve biogas plant Report
Ref. No.: Gexcon-20-F100936-RA-1 Rev.: 03 Date: 25.11.2020 Page 6 of 37
© Gexcon AS. The information contained herein is to be used by the recipient solely for the purpose for which it was supplied. It shall not be disclosed in whole or in part, by any other party without the written permission of Gexcon AS.
4.3 On the modelling of LBG tank releases in Riskcurves ............................................................... 32
4.4 Risk mitigation measures ........................................................................................................... 32
5 Conclusion ................................................................................................................................ 34
6 Bibliography ............................................................................................................................. 35
A 1 Consideration zones and risk acceptance criteria ..................................................................... 36
Quantitative risk assessment for Greve biogas plant Report
Ref. No.: Gexcon-20-F100936-RA-1 Rev.: 03 Date: 25.11.2020 Page 7 of 37
© Gexcon AS. The information contained herein is to be used by the recipient solely for the purpose for which it was supplied. It shall not be disclosed in whole or in part, by any other party without the written permission of Gexcon AS.
1 Introduction
Air Liquide Skagerak AS and Greve Biogass AS have started the process of establishing a plant for producing liquefied biogas (LBG) at Sem in Tønsberg. The new plant will be installed as an extension to an existing plant for production of upgraded biogas from organic waste. In line with the regulations set forth by the Norwegian Directorate for Civil Protection (DSB) a quantitative risk assessment (QRA) has been performed in order to assess the risk related to handling of hazardous substances at the plant. The risk assessment includes both the existing biogas plant and the planned extension for LBG production. The calculated individual risk is presented as risk contours, providing a basis for establishment of consideration zones for land-use planning.
1.1 Riskcurves
The risk contours presented in this report are generated by Riskcurves. Riskcurves is a complete tool for performing QRAs and consequence analysis, based on empirical models for gas and liquid release, gas dispersion, fire and explosion. It calculates geographical risk, societal risk, and individual risk, and presents the results as various types of frequency contours. Being an empirical tool, Riskcurves does not take into account the geometric aspects of a scenario, such as effects from terrain and obstacles. Releases are assumed to have the same direction as the wind, thus no effects from headwind or crosswind are included.
1.2 Abbreviations and definitions
LBG Liquefied Biogas
QRA Quantitative Risk Assessment
DSB The Norwegian Directorate for Civil Protection
LFL Lower Flammability Limit
CFD Computational Fluid Dynamics
ESD Emergency Shut Down
ALARP As Low as Reasonably Practicable
Frequency A number of occurrences of an event per unit of time.
Hazard A chemical or physical condition that has the potential for causing damage to people, property, or the environment.
Risk A measure of human injury, environmental damage or economic loss regarding both the incident likelihood and the magnitude of the loss/injury
Risk analysis The development of a quantitative estimate of risk based on engineering evaluation and mathematical techniques for combining estimates of incident consequences and frequencies.

Quantitative risk assessment for Greve biogas plant Report
Ref. No.: Gexcon-20-F100936-RA-1 Rev.: 03 Date: 25.11.2020 Page 8 of 37
© Gexcon AS. The information contained herein is to be used by the recipient solely for the purpose for which it was supplied. It shall not be disclosed in whole or in part, by any other party without the written permission of Gexcon AS.
2 System description
2.1 Location
The Greve biogas plant is located at Sem in Tønsberg Municipality in Vestfold, as shown in Figure 2-1. The plant site is part of a small, relatively flat industrial area surrounded by forest and cropland. An overview of the existing plant is provided in Figure 2-2, where the planned location of the LBG plant is indicated by a layout drawing.
Figure 2-1: The geographical location of the Greve biogas plant is indicated by "1". Source: gulesider.no

Quantitative risk assessment for Greve biogas plant Report
Ref. No.: Gexcon-20-F100936-RA-1 Rev.: 03 Date: 25.11.2020 Page 9 of 37
© Gexcon AS. The information contained herein is to be used by the recipient solely for the purpose for which it was supplied. It shall not be disclosed in whole or in part, by any other party without the written permission of Gexcon AS.
Figure 2-2: Overview of the existing plant, with a layout drawing showing the planned location of the LBG plant. The white circle represents an existing digester tank, while the red circle indicates the planned location of a biogas buffer storage. The green rectangle represents an existing greenhouse. Source: gulesider.no
2.2 Exposed areas
The plant site is surrounded by forest and cropland on the north and east sides, and has an industrial area to the west and south. A road passes the site on the west side. As shown in Figure 2-3, the nearest residential house is located in Taranrødveien 98, about 400 from the plant. The greenhouse located on the plant site, represented by the green rectangle in Figure 2-2, is frequently visited by 3rd parties, e.g. by school classes. It is therefore categorized by DSB as a particularly vulnerable object (3). There is also a nursery home, Granly sykehjem, about 1400 m from the plant.

Quantitative risk assessment for Greve biogas plant Report
Ref. No.: Gexcon-20-F100936-RA-1 Rev.: 03 Date: 25.11.2020 Page 10 of 37
© Gexcon AS. The information contained herein is to be used by the recipient solely for the purpose for which it was supplied. It shall not be disclosed in whole or in part, by any other party without the written permission of Gexcon AS.
Figure 2-3: Distances from the plant to the nearest residential house and particularly vulnerable objects. Source: gulesider.no

Quantitative risk assessment for Greve biogas plant Report
Ref. No.: Gexcon-20-F100936-RA-1 Rev.: 03 Date: 25.11.2020 Page 11 of 37
© Gexcon AS. The information contained herein is to be used by the recipient solely for the purpose for which it was supplied. It shall not be disclosed in whole or in part, by any other party without the written permission of Gexcon AS.
2.3 Greve biogas plant
The existing biogas plant consists of digester facilities, where biogas is produced from sludge, food waste and manure, before being compressed and purified by two upgrading units. The upgraded biogas is then odorized and injected into a grid, leading the gas to refueling stations for buses and garbage trucks. A photo of the existing plant is shown in Figure 2-4.
Figure 2-4: Photo of the existing biogas plant. Source: Greve Biogass
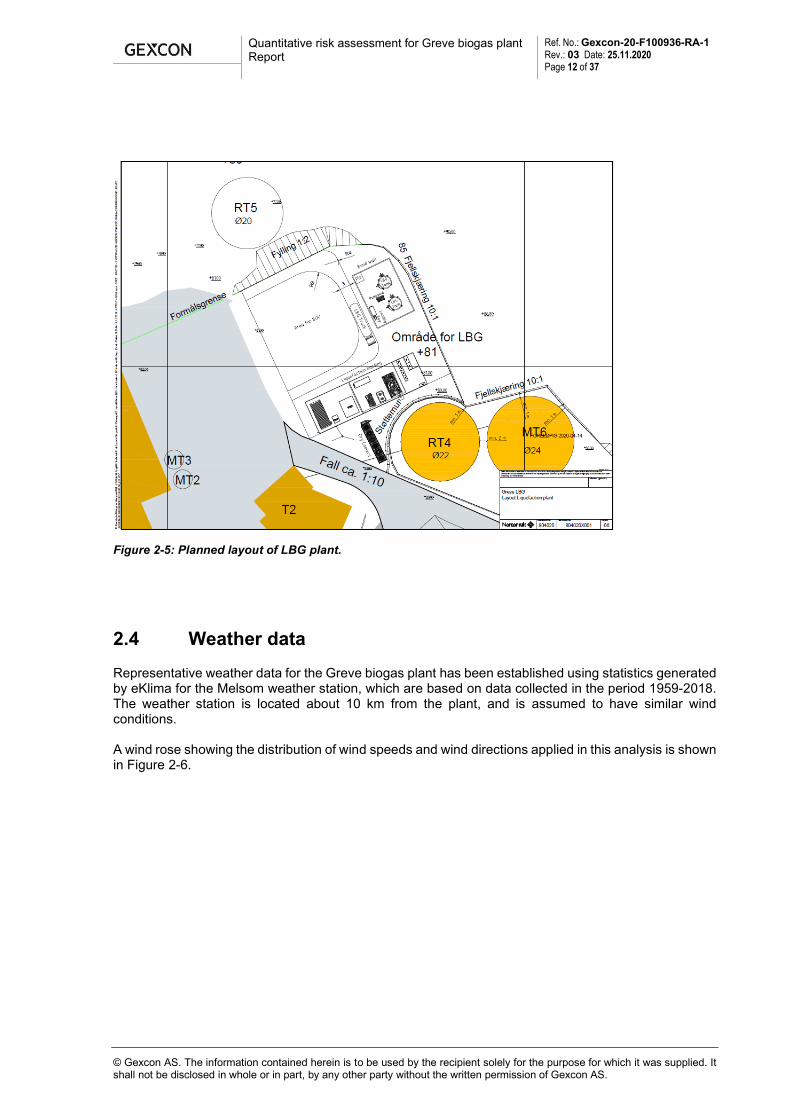
A layout drawing of the new LBG plant is shown in Figure 2-5. According to available input at the issue date of this report, the planned LBG plant will include the following units and systems:
• A new upgrading unit for treatment of additional biogas
• A polishing unit for achieving sufficient quality for liquefaction
• A liquefaction unit
• A compression system which allows for routing of biogas from the existing upgrading units to the polishing and liquefaction system
• An LBG storage system equipped with an export system for filling of road tankers
• An odorizer system Moreover, the digester facilities will be expanded by two additional digester tanks (“RT4” and “RT5” in Figure 2-5), as well as a buffer storage for raw biogas.
Quantitative risk assessment for Greve biogas plant Report
Ref. No.: Gexcon-20-F100936-RA-1 Rev.: 03 Date: 25.11.2020 Page 12 of 37
© Gexcon AS. The information contained herein is to be used by the recipient solely for the purpose for which it was supplied. It shall not be disclosed in whole or in part, by any other party without the written permission of Gexcon AS.
Figure 2-5: Planned layout of LBG plant.
2.4 Weather data
Representative weather data for the Greve biogas plant has been established using statistics generated by eKlima for the Melsom weather station, which are based on data collected in the period 1959-2018. The weather station is located about 10 km from the plant, and is assumed to have similar wind conditions. A wind rose showing the distribution of wind speeds and wind directions applied in this analysis is shown in Figure 2-6.

Quantitative risk assessment for Greve biogas plant Report
Ref. No.: Gexcon-20-F100936-RA-1 Rev.: 03 Date: 25.11.2020 Page 13 of 37
© Gexcon AS. The information contained herein is to be used by the recipient solely for the purpose for which it was supplied. It shall not be disclosed in whole or in part, by any other party without the written permission of Gexcon AS.
Figure 2-6: Wind rose applied for the risk assessment.
2.5 Manning and traffic
The biogas production process is fully automated and monitored from a control room. The production area is therefore normally not manned during normal operation of the plant. The LBG plant will also be fully automated, except for the filling operations related to road tankers, where the truck driver will be present during the entire operation. Export of LBG to road tankers is assumed to take place 8 times a week, with each filling operation lasting one hour. There is no restriction on traffic on the plant site, nor any fences to prevent the public from entering. There is currently a waste disposal facility on the site, but this will be moved in order to limit traffic close to the production facilities. Disposal facilities for sludge and manure are also located on the site.

Quantitative risk assessment for Greve biogas plant Report
Ref. No.: Gexcon-20-F100936-RA-1 Rev.: 03 Date: 25.11.2020 Page 14 of 37
© Gexcon AS. The information contained herein is to be used by the recipient solely for the purpose for which it was supplied. It shall not be disclosed in whole or in part, by any other party without the written permission of Gexcon AS.
3 Risk analysis
The conducted risk analysis is documented in the following sections. Potential release scenarios are evaluated in Chapter 3.1, and calculated release frequencies are presented in Chapter 3.2. Representative release rates and durations are established in Chapter 3.3. Ignition probabilities are discussed in Chapter 3.4, while relevant ignited events are evaluated in Chapter 3.5. Chapter 3.6 contains a discussion of parameter choices for modelling of ignited events in Riskcurves, as well as vulnerability definitions used for calculating lethality. Risk related to toxic substances are assessed in Chapter 3.7, while domino effects are discussed in Chapter 3.8.
3.1 Release scenarios
Initiating events on the plant which may cause major accidents are releases of flammable or toxic substances from the biogas and LBG production, storage and export facilities.
3.1.1 Digester and water removal facilities
Biogas is generated from hygienized sludge, food waste and manure in digester tanks. Water is removed from the gas by demisters, before the gas is routed either to the buffer storage, the upgrading units, or the flare system. According to a recent gas analysis, these facilities contain biogas with a composition of about 61 % methane, 38 % CO2, and minor fractions of other compounds, e.g. toxic gases like hydrogen sulphide (H2S) and ammonia. These facilities are characterized by large pipe and equipment
dimensions (up to 350 mm), but the pressure is low (0.015 barg). As a result, potential gas releases will
have low momentum.
3.1.2 Upgrading units
From the digester and water removal facilities, biogas may be pumped into one of three upgrading units. In the two existing upgrading units, the biogas is compressed, before H2S is removed by filters. CO2 is then removed by water scrubbers. The new upgrading unit also has a compressor and an H2S filter, but uses membrane technology for the removal of CO2. The upgraded biogas has a methane content of 97-99 %, and minor fractions of other compounds, mainly CO2 and nitrogen. The compressed gas in the upgrading units has a pressure of 6-13 barg. Some of the equipment, e.g. pumps and compressors, are located within containers. A gas release within a container will hit a wall or other equipment and lose momentum before being vented out through the ventilation outlet. Other equipment, e.g. the absorption columns, are located outside, and may give rise to gas jets with relatively high momentum.
3.1.3 Compressor system
From the upgrading units, the biogas may be odorized and routed to the grid, or it may be routed to a compressor for further pressure increase to 21 barg. The compressor system is located within a building, so a gas release is assumed to lose momentum before being vented out.
3.1.4 Polishing and liquefaction units
From the compressors, the biogas is routed to a polishing unit for further purification, before it is cooled down to -30 °C by a chiller. A liquefaction unit then cools the gas down to liquid state by reducing the

Quantitative risk assessment for Greve biogas plant Report
Ref. No.: Gexcon-20-F100936-RA-1 Rev.: 03 Date: 25.11.2020 Page 15 of 37
© Gexcon AS. The information contained herein is to be used by the recipient solely for the purpose for which it was supplied. It shall not be disclosed in whole or in part, by any other party without the written permission of Gexcon AS.
temperature to -161 °C. Potential releases from these units are thus gas jets and liquid sprays. The liquid spray may partially rain out and form a pool on the ground. Notably, given the low boiling point of methane at atmospheric pressure (-162 °C), the pool is expected to evaporate relatively quickly. The polishing and liquefaction units are located inside a building, so any gas jets or liquid sprays will lose their momentum, and the resulting gas clouds will be vented out.
3.1.5 LBG storage tanks with export and filling facilities
The produced LBG will be stored in two vertical storage tanks, each with a volume of about 127 m3. The tanks are vacuum insulated, with an inner wall of steel and an outer shell of carbon steel. The outer shell is not designed to contain the liquid in case of damage to the inner wall. The tanks are equipped with safety valves, releasing gas to a cold flare if the pressure increases above a certain level. The LBG is stored under low pressure (0.3 barg), so potential releases from the gas phase will have low momentum. Regarding releases from the liquid phase, the tanks are installed on a concrete foundation with a surface area of 150 m2, surrounded by concrete walls. The foundation is designed to drain any liquid released from the tanks to a pit with a surface area of 5 m2, located at some distance from the tanks. The pit is dimensioned for containing the volume of the liquid pipes connected to the tanks, but not the entire tank volume. Consequently, a release from a relatively small hole in the liquid pipes is expected to form an evaporating pool of cold methane within the pit. In the event of a larger release from the liquid phase of the tank, the resulting pool may overflow the pit, but is expected to be confined by the walls surrounding the foundation. During export of LBG to road tankers, LBG is pumped at a pressure of 5 barg. A release from the installed equipment or the filling hose may result in a liquid pool or a liquid spray or a combination of these. Such releases are assumed to have release rates limited by the pump rate. Furthermore, since the operation is continually monitored by the truck driver, who may shut down the pump, such releases are assumed to have short durations.
3.1.6 Odorizer systems
Before being injected into the grid, the upgraded biogas is odorized by one of three odorizer systems. The odorant, which is a flammable gas, is pumped into the biogas stream from small pressurized tanks. A potential release will thus result in a gas jet. The odorizer systems are connected to the biogas stream by check valves, only permitting flow in one direction. Consequently, as only small amounts of flammable gas are contained within these systems, and no inflow is permitted from the biogas stream, releases from the odorizer systems are assumed to have short durations.
3.1.7 Pipelines
Releases may also originate from the pipelines transporting the biogas between the different process units, or to the grid for distribution. Most pipelines contain gas, so a leak will typically be a gas jet. The pipelines are mainly welded and have low release frequencies. On the other hand, releases may have long durations. This concerns in particular the pipelines leading the upgraded biogas to the grid, which are not separated from the grid by ESD valves. The grid contains about 900 kg of biogas, which may potentially be released during a leak.

Quantitative risk assessment for Greve biogas plant Report
Ref. No.: Gexcon-20-F100936-RA-1 Rev.: 03 Date: 25.11.2020 Page 16 of 37
© Gexcon AS. The information contained herein is to be used by the recipient solely for the purpose for which it was supplied. It shall not be disclosed in whole or in part, by any other party without the written permission of Gexcon AS.
3.2 Release frequency analysis
For the purpose of the risk analysis, the extended plant has been divided into isolatable process segments according to a preliminary process flow diagram, shown in Figure 3-1. Furthermore, segments containing both gas and liquid have been split into two subsegments, i.e. one for each phase. The digester tanks and the biogas buffer storage, which are not shown in the diagram, are all treated as isolatable segments in the analysis.
Figure 3-1: Preliminary process flow diagram for the extended plant.
Release frequencies have been calculated using Gexcon’s inhouse tool FLACS Frequency, which calculates release frequencies using equipment counts for each subsegment as input. For the existing facilities, equipment counts have been based on P&ID’s provided by Greve Biogass. For the planned biomethane compressor system, as well as the polishing and liquefaction units, equipment counts have been based on preliminary P&ID’s provided by Air Liquide. For the remaining new facilities, equipment counts have been based on data from similar facilities at the existing plant, or other comparable plants. FLACS Frequency implements the PLOFAM model (2) for process equipment. In this analysis, an exception has been made for the hoses used for LBG export to road tankers, as the leak frequency for flexible hoses assumed by PLOFAM is considered to be overly conservative for representing standard stainless steel LBG hoses. Instead, leak frequencies suggested by Shell (4) have been applied. For the LBG tanks, leak frequencies have been based on the OGP model (5) according to the category “Pressurized storage tank”. For the digester tanks, where only the gas phase is assumed to be

Quantitative risk assessment for Greve biogas plant Report
Ref. No.: Gexcon-20-F100936-RA-1 Rev.: 03 Date: 25.11.2020 Page 17 of 37
© Gexcon AS. The information contained herein is to be used by the recipient solely for the purpose for which it was supplied. It shall not be disclosed in whole or in part, by any other party without the written permission of Gexcon AS.
flammable, the PLOFAM model has been applied to the valves and flanges on top of the tanks. In addition, a frequency for rupture of the digester tanks has been assumed according to the tank category “Atmospheric storage tank with fixed roof” described in the OGP model. For the biogas buffer storage, the PLOFAM model has been applied to the associated equipment, while a full rupture frequency has been assumed according to the proposed value for instantaneous releases from gas containers given by the RIVM model (6). The resulting release frequencies are presented in Table 3-1 (gas releases) and Table 3-2 (liquid releases). Segment 11 (Loading bay) and Segment 12 (Export to LBG truck) are assumed to be in use 13 % of the time, and the release frequencies have been adjusted accordingly. The failure frequencies for the hoses used for LBG export, which have been calculated based on 8 filling operations per week, have been added to the category “Medium” for liquid releases from Segment 12. The table shows that Segment 1 (Inlet and water removal) gives the largest contribution to the release frequencies, followed by Segment 2 (Upgrade 1), Segment 3 (Upgrade 2), and Segment 4 (Membrane upgrade).
Table 3-1: Calculated frequencies for gas releases.
Segment Small
(1-10 mm) Medium
(10-50 mm) Large
(50-155 mm) Very large
(155-350 mm) Major
(>350 mm) Full
rupture Sum
0a-e: Digester tanks 3.38E-04 2.77E-05 4.63E-06 1.48E-06 1.38E-06 3.00E-06 3.76E-04
1a. Biogas buffer storage 6.57E-03 1.23E-04 7.45E-06 4.04E-06 - 5.00E-06 6.71E-03
1b. Inlet and water removal 1.62E-01 1.32E-02 8.74E-04 1.24E-04 - - 1.76E-01
2. Upgrade 1 3.38E-02 2.98E-03 2.80E-04 2.49E-06 - - 3.71E-02
3. Upgrade 2 3.38E-02 2.98E-03 2.80E-04 2.49E-06 - - 3.71E-02
4. Membrane upgrade 3.38E-02 2.98E-03 2.80E-04 2.49E-06 - - 3.71E-02
5. Gas to grid 1.71E-02 5.96E-04 1.65E-04 - - - 1.79E-02
6. Gas to LBG 1.27E-03 3.20E-05 7.16E-06 - - - 1.31E-03
7. Biomethane compressor 3.06E-02 3.53E-03 3.93E-04 - - - 3.45E-02
8. Liquefaction 2.59E-02 3.79E-03 1.90E-04 1.25E-06 - - 2.99E-02
Sum 3.45E-01 3.02E-02 2.48E-03 1.38E-04 1.38E-06 8.00E-06 3.78E-01
Table 3-2: Calculated frequencies for liquid releases.
Segment Small
(1-10 mm) Medium
(10-50 mm) Large
(50-155 mm) Full
rupture Sum
8. Liquefaction 1.78E-03 2.32E-04 1.94E-05 - 2.03E-03
9. LBG tank a 4.66E-03 5.15E-04 4.29E-05 4.70E-07 5.22E-03
10. LBG tank b 4.66E-03 5.15E-04 4.29E-05 4.70E-07 5.22E-03
11. Loading bay 5.89E-03 3.93E-04 3.11E-05 - 6.31E-03
12. Export to LBG truck 6.81E-04 2.05E-04 1.37E-05 - 9.00E-04
Sum 1.77E-02 1.86E-03 1.50E-04 9.40E-07 1.97E-02

Quantitative risk assessment for Greve biogas plant Report
Ref. No.: Gexcon-20-F100936-RA-1 Rev.: 03 Date: 25.11.2020 Page 18 of 37
© Gexcon AS. The information contained herein is to be used by the recipient solely for the purpose for which it was supplied. It shall not be disclosed in whole or in part, by any other party without the written permission of Gexcon AS.
3.3 Release rates and durations
Release rates and durations have been estimated for each subsegment and for each hole size category. For each category a representative hole size has been used, according to Table 3-3.
Table 3-3: Representative hole sizes used for release rate and duration calculations.
Hole size category Representative hole size
Small (1-10 mm) 5 mm
Medium (10-50 mm) 25 mm
Large (50-155 mm) 100 mm*
Very large (155 – 350 mm) 250 mm**
Major (> 350 mm) 750 mm
*) For liquid releases from the liquefaction, loading bay and export segments (no. 8, 11, and 12), 50 mm is used, corresponding to the assumed maximum equipment dimension. **) For gas releases from the upgrade and liquefaction segments (no. 2, 3, 4, and 8), 200 mm is used, corresponding to the maximum equipment dimension.
The assumed process conditions for each subsegment are shown in Table 3-4. The “raw biogas” referred to in the table is assumed to consist of 60 vol% methane and 40 vol% CO2. For simplicity, the upgrade segments (no. 2, 3, and 4) are assumed to contain pure methane gas, and the mass values presented for these segments represent the methane content. The risk related to potential toxic effects from CO2, H2S and ammonia is not included in the overall risk calculations, but is instead explicitly evaluated in Chapter 3.7. For the LBG tanks (Segment 9 and 10) a methane volume of 76 m3 per tank has been assumed, which corresponds to a filling degree of 60 %. This assumption is based on a prediction of the average amount of stored LBG throughout the week during normal operation of the plant (7).
Table 3-4: Assumed process conditions for each subsegment.
Segment Subsegment Composition/
phase Pressure
(barg) Temperature
(C) Density (kg/m3)
Mass (kg)
Volume (m3)
0a. Digester tank RT1 0a.1. Digester tank RT1 Raw biogas 0.025 35 1.10 763 692
0b. Digester tank RT2 0b.1. Digester tank RT2 Raw biogas 0.025 35 1.10 763 692
0c. Digester tank RT3 0c.1. Digester tank RT3 Raw biogas 0.025 35 1082 981 1082
0d. Digester tank RT4 0d.1. Digester tank RT4 Raw biogas 0.025 35 1.10 763 692
0e. Digester tank RT5 0e.1. Digester tank RT5 Raw biogas 0.025 35 1.10 763 692
1a. Biogas buffer storage 1a.1. Biogas buffer storage Raw biogas 0.030 20 1.17 781 670
1b. Inlet and water removal 1b.1. Inlet and water removal Raw biogas 0.015 35 1.09 39 36
2. Upgrade 1 2.1. Upgrade 1 Methane gas 6 15 4.7 228 49
3. Upgrade 2 3.1. Upgrade 2 Methane gas 6 15 4.7 228 49
4. Membrane upgrade 4.1. Membrane upgrade Methane gas 13 15 9.4 225 24
5. Gas to grid 5.1. Gas to grid Methane gas 4 15 3.3 976 292
6. Gas to LBG 6.1. Gas to LBG Methane gas 6 15 4.7 10 2.1
7. Biomethane compressor 7.1. Biomethane compressor Methane gas 13.5 20 9.5 120 13
8. Liquefaction 8.1. Polishing and chiller Methane gas 21 -5 16 100 6.3
8.2. Liquefier LBG 21 -161 425 200 0.47
9. LBG tank a 9.1. LBG tank a LBG 0.3 -161 425 32300 76
10. LBG tank b 10.1. LBG tank b LBG 0.3 -161 425 32300 76
11. Loading bay 11.1. Loading bay LBG 3.4 -161 425 135 0.32
12. Export to LBG truck 12.1. Export to LBG truck LBG 5 -161 425 10 0.024

Quantitative risk assessment for Greve biogas plant Report
Ref. No.: Gexcon-20-F100936-RA-1 Rev.: 03 Date: 25.11.2020 Page 19 of 37
© Gexcon AS. The information contained herein is to be used by the recipient solely for the purpose for which it was supplied. It shall not be disclosed in whole or in part, by any other party without the written permission of Gexcon AS.
When modeling gas dispersion based on release scenarios, Riskcurves uses a representative, constant release rate and a representative release duration. Typically, for flammable substances, the representative rate is the average rate over the period of time when the first 20 % of the total released mass is released. The release scenarios available in Riskcurves are relatively simple, and do not account for aspects such as process shutdown, or inflow to the segment from neighboring segments. In order to include such aspects, transient release rates have been calculated using an internal tool. The tool models each segment as a tank containing the gas and liquid parts of the segment, and takes a shutdown time as input, as well as potential gas and liquid inflow to the segment (before shutdown). In this analysis, a general shutdown time of 30 seconds has been assumed. An exception has been made for Segment 12 (Export to LBG truck). As the export operation is continually monitored, a shutdown time of 20 seconds has been applied for this segment. As for inflow before shutdown, this has been estimated based on the assumed production rate of the plant, as well as possible inflow from neighboring segments due to pressure differences. The inflow due to pressure differences is assumed limited by the orifices of the ESD valves separating the segments. Examples of calculated transient release rates are shown in Figure 3-2 and Figure 3-3. For the gas release in Figure 3-2, the release rate is maintained by gas inflow from the neighboring segments until shutdown. For the liquid release in Figure 3-3, all the liquid within the segment is released within the first 16 seconds, and then gas is released at a steady rate until shutdown.
Figure 3-2: Transient release rate for gas release from Segment 4 with 25 mm hole size.
0,00
0,20
0,40
0,60
0,80
1,00
1,20
0 20 40 60 80 100 120 140 160 180 200
Rel
ease
mas
s fl
ow
(kg
/s)
Time (s)

Quantitative risk assessment for Greve biogas plant Report
Ref. No.: Gexcon-20-F100936-RA-1 Rev.: 03 Date: 25.11.2020 Page 20 of 37
© Gexcon AS. The information contained herein is to be used by the recipient solely for the purpose for which it was supplied. It shall not be disclosed in whole or in part, by any other party without the written permission of Gexcon AS.
Figure 3-3: Transient release rate for liquid release from Segment 8 with 25 mm hole size.
Based on the results from the internal tool, representative release rates and durations have been chosen for each subsegment and for each representative hole size. These rates and durations have then been used as input to Riskcurves for the release and gas dispersion modeling. An exception has been made for releases from the tank and buffer storage segments (no. 0a-e, 1a, 9, and 10). These release scenarios, where segment inflow and shutdown are assumed less relevant, have been modelled entirely by Riskcurves. The representative release rates and durations applied for each subsegment and each hole size category are summarized in Table 3-5. As for the rupture scenarios, a full rupture of an LBG tank has been modelled as an instantaneous release of the entire LBG content. For the digester tanks and the biogas buffer storage, an instantaneous release of the entire gas content is considered highly unlikely, and a full rupture has instead been modelled as a release of the entire gas content within 5 s.
Table 3-5: Representative release rates and durations for each subsegment and each hole size category.
Subsegment
Small (5 mm)
Medium (25 mm)
Large (100 mm)
Very large (250 mm)
Major (700 mm)
Rate (kg/s)
Duration (s)
Rate (kg/s)
Duration (s)
Rate (kg/s)
Duration (s)
Rate (kg/s)
Duration (s)
Rate (kg/s)
Duration (s)
0a.1. Digester tank RT1 0.0012 >1000 0.028 469 0.44 29 2.8 4.7 25 0.52
0b.1. Digester tank RT2 0.0012 >1000 0.028 469 0.44 29 2.8 4.7 25 0.52
0c.1. Digester tank RT3 0.0012 >1000 0.028 664 0.44 41 2.8 6.6 25 0.74
0d.1. Digester tank RT4 0.0012 >1000 0.028 469 0.44 29 2.8 4.7 25 0.52
0e.1. Digester tank RT5 0.0012 >1000 0.028 469 0.44 29 2.8 4.7 25 0.52
1a.1. Biogas buffer storage 0.0013 >1000 0.031 512 0.50 32 3.1 5.1 - -
1b.1. Inlet and water removal 0.02 58 0.02 58 0.38 33 2.4 32 - -
2.1. Upgrade 1 0.02 >1000 0.50 393 4.0 58 15 15 - -
3.1. Upgrade 2 0.02 >1000 0.50 393 4.0 58 15 15 - -
4.1. Membrane upgrade 0.04 >1000 1.0 210 8.0 31 30 8 - -
5.1. Gas to grid 0.012 >1000 0.36 >1000 5.0 173 - - - -
6.1. Gas to LBG 0.02 440 0.50 48 8.1 31 - - - -
7.1. Biomethane compressor 0.04 >1000 1.0 137 17 37 - - - -
8.1. Polishing and chiller 0.66 141 1.7 86 20 31 30 21 - -
8.2. Liquefaction 0.50 581 12 26 50 9 - - - -
0,00
2,00
4,00
6,00
8,00
10,00
12,00
14,00
0 20 40 60 80 100 120 140 160 180 200
Rel
ease
mas
s fl
ow
(kg
/s)
Time (s)

Quantitative risk assessment for Greve biogas plant Report
Ref. No.: Gexcon-20-F100936-RA-1 Rev.: 03 Date: 25.11.2020 Page 21 of 37
© Gexcon AS. The information contained herein is to be used by the recipient solely for the purpose for which it was supplied. It shall not be disclosed in whole or in part, by any other party without the written permission of Gexcon AS.
9.1. LBG tank a 0.093 >1000 2.3 >1000 32 865 - - - -
10.1. LBG tank b 0.093 >1000 2.3 >1000 32 865 - - - -
11.1. Loading bay 0.22 712 5.0 59 10 30 - - - -
12.1. Export to LBG truck 0.25 62 5.0 23 5.0 23 - - - -
3.4 Ignition probabilities
Potential ignition sources on the plant site are traffic related to LBG export and disposal of sludge and manure, and electrical and rotating equipment (pumps and compressors) at the biogas plant. Even equipment approved for ATEX zones are potential ignition sources, in the event of equipment faults. Furthermore, if flammable gas enters the process building through an air intake, potential ignition sources within the building may be exposed. Given the absence of fences and traffic restrictions, there are also potential ignition sources related to visitors, such as smoking. It is assumed in this analysis that ATEX regulations are adhered to, i.e. that equipment used in potentially explosive atmospheres are approved for such use. Furthermore, the LBG road tankers are assumed to be subject to ignition source control, such as grounding of the tanker to an earthing point during fueling to prevent build-up of static electricity. For flammable releases only exposing the plant site (see Figure 3-4), ignition probabilities based on the UKOOA ignition model (8) have been applied. For releases with release rate below 1 kg/s, an ignition probability of 0.01 is assumed. For release rates in the interval 1 – 25 kg/s an ignition probability of 0.03 is assumed, while for release rates above 25 kg/s, an ignition probability of 0.1 is applied. Outside of the plant site, an ignition probability of 1 is applied in this analysis. This is in line with DSB’s guidelines for quantitative risk assessments (9), and reflects that no restriction of public access nor ignition source control can be expected outside of this area.

Quantitative risk assessment for Greve biogas plant Report
Ref. No.: Gexcon-20-F100936-RA-1 Rev.: 03 Date: 25.11.2020 Page 22 of 37
© Gexcon AS. The information contained herein is to be used by the recipient solely for the purpose for which it was supplied. It shall not be disclosed in whole or in part, by any other party without the written permission of Gexcon AS.
Figure 3-4: In the context of ignition probabilities, the “plant site” is defined as the area contained within the orange line. Inside this area, ignition probabilities have been based on the UKOOA model; outside this area, an ignition probability of 1 has been applied.
3.5 Ignited events
Ignited events that might result from a release of flammable gas or liquid at the Greve biogas plant include jet or spray fires, pool fires, flash fires, and vapour cloud explosions. If released flammable gas or liquid ignites immediately, a jet or spray fire will occur. Released flammable liquid forming a pool on the ground will evaporate and give rise to a gas cloud, which upon immediate ignition will result in a pool fire. The consequences of such fires are primarily related to the size of the flame and the resulting heat radiation. For jet or spray fires, the release rate of flammable material is an important factor. For pool fires, the flame size depends on the evaporation rate, which is limited by the surface area of the pool. For the Greve biogas plant, the pool fire scenario will primarily be relevant for releases from the LBG tank, where liquefied gas is stored under low pressure. For the segments containing liquefied gas under higher pressure, the spray fire scenario is most relevant, as the rainout fraction is likely to be low. If a flammable gas cloud reaches a considerable size before it is ignited, the result will be a flash fire or a vapour cloud explosion (which may burn back to the source and eventually cause a jet and/or pool fire). If the gas cloud is located in an open area, a flash fire will occur. A flash fire is characterized by a short term heat radiation without significant overpressures, and it is assumed that only people located within the flammable gas cloud at the time of ignition are affected. A gas cloud in a confined area may on the other hand cause a vapour cloud explosion, which also represents an overpressure hazard.

Quantitative risk assessment for Greve biogas plant Report
Ref. No.: Gexcon-20-F100936-RA-1 Rev.: 03 Date: 25.11.2020 Page 23 of 37
© Gexcon AS. The information contained herein is to be used by the recipient solely for the purpose for which it was supplied. It shall not be disclosed in whole or in part, by any other party without the written permission of Gexcon AS.
The Greve biogas plant site is relatively open. However, a considerable part of the equipment is located in more or less enclosed spaces. For such equipment, a release followed by delayed ignition is considered likely to involve overpressure effects. This concerns the following segments:
• Parts of Segment 2: Upgrade 1
• Parts of Segment 3: Upgrade 2
• Parts of Segment 4: Membrane upgrade
• Segment 7: Biomethane compressor
• Segment 8: Liquefaction
3.6 Modelling ignited events in Riskcurves
3.6.1 Parameter choices
When modelling ignited events based on a release scenario in Riskcurves using a combined model, the user specifies separate probabilities for direct and delayed ignition, as well as a “fraction with explosion phenomena”. The risk related to the release scenario is then calculated based on an event tree customized for the type of release in question. The event tree for a continuous release of a pressurized liquefied flammable gas, which is used for the main part of the liquid releases modelled in this study, is illustrated in Figure 3-5. As indicated by the event tree, the risk related to jet or spray fires is calculated based on the probability of direct ignition, while the risk related to flash fires and vapour cloud explosions is calculated based on the probability of delayed ignition. Delayed ignition is assumed to always result in a flash fire, while the “fraction with explosion phenomena” determines the probability of additional overpressure effects from a vapour cloud explosion. The events related to delayed ignition are modelled under the assumption that the flammable cloud ignites at its largest extent. For pool fires, both ignition probabilities are relevant: If a significant proportion of the released liquefied gas rains out, direct ignition is assumed to result in an immediate pool fire, while delayed ignition may result in a late pool fire. Notably, for the cases where delayed ignition results in a vapour cloud explosion, no effects from a late pool fire are included. For the flammable gas releases modelled in this study, a similar event tree as the one in Figure 3-5 is used, except that no pool fire scenario is included.

Quantitative risk assessment for Greve biogas plant Report
Ref. No.: Gexcon-20-F100936-RA-1 Rev.: 03 Date: 25.11.2020 Page 24 of 37
© Gexcon AS. The information contained herein is to be used by the recipient solely for the purpose for which it was supplied. It shall not be disclosed in whole or in part, by any other party without the written permission of Gexcon AS.
Figure 3-5: Event tree for a continuous release of a pressurized liquefied flammable gas (6).
The overpressures generated by a vapour cloud explosion are estimated using the TNO Multi-Energy method, where an important parameter is the curve number describing the type of explosion. This number, which is specified by the user, may vary from 1 (“Very weak deflagration”) to 10 (“Detonation”). In this analysis, for releases only exposing the plant site to flammable gas, the ignition probabilities given in Chapter 0 have been split 50/50 between direct and delayed ignition. For releases exposing the perimeter of the plant site, the same probabilities have been applied for direct ignition, but the probabilities of delayed ignition have been increased to ensure a total ignition probability of 1. As for the “fraction with explosion phenomena”, this has been set based on a rough estimate of the fraction of releases located in enclosed areas. These fractions are listed below for the relevant segments:
• Segment 2: 0.3
• Segment 3: 0.3
• Segment 4: 0.7
• Segment 7: 1
• Segment 8: 1 The curve number describing the type of explosion has been set to 7 for all explosion scenarios, based on guidance given in Chapter 5.5.2 of the TNO Yellow Book (10), and the assumption that the overall blockage fraction of the ignited gas clouds is below 30 %.

Quantitative risk assessment for Greve biogas plant Report
Ref. No.: Gexcon-20-F100936-RA-1 Rev.: 03 Date: 25.11.2020 Page 25 of 37
© Gexcon AS. The information contained herein is to be used by the recipient solely for the purpose for which it was supplied. It shall not be disclosed in whole or in part, by any other party without the written permission of Gexcon AS.
3.6.2 Vulnerability
For jet or spray and pool fires, Riskcurves calculates lethality based on a “total destruction” level for heat radiation, as well as a probit function. The default value for the “total destruction” level is 35 kW/m2, implying an immediate lethality of 1 for areas exposed to radiation above that level. The probit function, which also accounts for the duration of the heat exposure, is based on the TNO Green Book (11), and is defined by: Pr = -36.38 + 2.56 ln (q4/3*t), where q denotes the heat radiation level in W/m2, and t denotes the exposure duration in seconds. The maximum heat exposure duration has been set to 30 s, and no protection from clothing has been assumed. For flash fires, the lethality is by default set to 1 within the flame contour and 0 elsewhere, in accordance with DSB’s guidelines (9). As for vapour cloud explosions, lethality from overpressure effects is by default set to 1 for areas with overpressures above 300 mbar, and 0 elsewhere. This threshold value is larger than the value suggested by DSB’s guidelines (74 mbar), but is still used in this analysis, as the value proposed by the guideline is believed to be overly conservative.
3.7 Risk related to toxic substances
Based on a recent gas analysis, the biogas contains about 61 % methane before being upgraded. In addition, it contains the following volume fractions of potentially toxic gases:
• CO2: 38 %
• Ammonia: 10 ppmv
• H2S: 60 ppmv The concentrations of Ammonia and H2S are far below potentially lethal levels for humans. CO2, however, can cause fatalities in concentrations around 10 % (12). DSB recommends using the following probit function for CO2 poisoning: Pr = -90.8 + 1.01 ln (C8*t), where C is the concentration in ppmv, and t is the time in minutes. CO2 is removed from the biogas in the water scrubbers of the existing upgrade units, and a rough estimate suggests that each upgrade unit contains about 200 kg of CO2, while each of the digester tanks and the biogas buffer storage contains about 700 kg of CO2. Calculations in Riskcurves based on the above probit function imply that, for release scenarios where toxic effects from CO2 are significant, the flammable methane cloud represents a much greater risk. The risk related to CO2 poisoning has thus not been analyzed in more detail, and is not included in the overall risk calculations.
3.8 Domino effects
A potential consequence of a fire on the plant site is heat exposure of the LBG tanks. In a worst-case scenario this may cause a tank to rupture and the entire tank content to be released and then ignited by the initial fire. For the segments located close enough for this to be a concern, i.e. Segment 8 (Liquefaction) and 11 (Loading bay), the fire durations are considered too short, or the release rates too low, for causing damage to the tanks. A release from one of the tanks is assumed to result in a liquid

Quantitative risk assessment for Greve biogas plant Report
Ref. No.: Gexcon-20-F100936-RA-1 Rev.: 03 Date: 25.11.2020 Page 26 of 37
© Gexcon AS. The information contained herein is to be used by the recipient solely for the purpose for which it was supplied. It shall not be disclosed in whole or in part, by any other party without the written permission of Gexcon AS.
pool confined by the walls surrounding the tank foundation. Upon ignition, this could cause a large and long-lasting fire. In order to limit the heat exposure to the tanks from such events, the foundation is drained to a smaller pit located at some distance from the tanks. The pit is however not dimensioned for containing a large release. Another possible consequence is a spray fire exposing the tank itself or the other tank. As a means to further reduce the risk of domino effects related to the LBG tanks, gas and liquid detection should be installed, and fire fighting equipment should be available, e.g. for cooling of exposed surfaces. Another potential domino effect is damage to an LBG tank from overpressure effects generated by an explosion on the plant site. This risk should be considered when evaluating the need for pressure relief facilities for equipment in enclosed spaces.

Quantitative risk assessment for Greve biogas plant Report
Ref. No.: Gexcon-20-F100936-RA-1 Rev.: 03 Date: 25.11.2020 Page 27 of 37
© Gexcon AS. The information contained herein is to be used by the recipient solely for the purpose for which it was supplied. It shall not be disclosed in whole or in part, by any other party without the written permission of Gexcon AS.
4 Results
4.1 Risk contours
Taking into account the ignition probabilities, parameter choices and vulnerability definitions discussed in Chapter 3, frequency contours for lethality have been established. The contours, shown in Figure 4-1, are based on calculation of individual risk, i.e. they illustrate the chance of lethality on a location, assuming constant presence and exposure to the risk.
Figure 4-1: Contours showing lethality for yearly frequencies of 10-3 (red), 10-4 (orange), 10-5 (yellow), 10-6 (green), and 10-7 (blue).
The risk contours provide a basis for establishing consideration zones according to DSB’s report Sikkerheten rundt anlegg som håndterer brannfarlige, reaksjonsfarlige, trykksatte og eksplosjonsfarlige stoffer: Kriterier for akseptabel risiko (3). The zone definitions and risk acceptance critera are summarized in Appendix A 1. The contours in Figure 4-1 indicate that:
• The 10-5 contour does not overlap with the road passing on the west side of the plant.
• There are no residential buildings or particularly vulnerable objects within the 10-7 contour. In particular, the greenhouse, which is occasionally visited by 3rd parties, is located outside of the 10-7 contour.

Quantitative risk assessment for Greve biogas plant Report
Ref. No.: Gexcon-20-F100936-RA-1 Rev.: 03 Date: 25.11.2020 Page 28 of 37
© Gexcon AS. The information contained herein is to be used by the recipient solely for the purpose for which it was supplied. It shall not be disclosed in whole or in part, by any other party without the written permission of Gexcon AS.
4.2 Risk distribution
The contributions to the risk from the different process segments are shown in Figure 4-2 (for the 10-5 contour) and Figure 4-3 (for the 10-7 contour). Figure 4-2 indicates that Segment 7 (Biomethane compressor) and Segment 8 (Liquefaction) give the most significant contributions to the 10-5 contour. As for the 10-7 contour, the largest contributions are due to Segment 8 (Liquefaction) and segments 9 and 10 (the LBG tanks). Notably, the line indicating the contribution to the 10-7 contour from Segment 1a (Biogas buffer storage) is only about 10 m away from overlapping with the greenhouse, and calculations confirm that the 10-7 contour is sensitive to the location and size of the biogas buffer storage. This implies that a significant increase in volume or change of location may cause an overlap between the 10-7 contour and the greenhouse. On the other hand, a decrease in volume will have the opposite effect, and may lead to a significantly smaller risk contribution.
Figure 4-2: Contributions from the different segments to the 10-5 lethality contour. (Segments 0a-e, 1a and 6 do not contribute to this contour.)

Quantitative risk assessment for Greve biogas plant Report
Ref. No.: Gexcon-20-F100936-RA-1 Rev.: 03 Date: 25.11.2020 Page 29 of 37
© Gexcon AS. The information contained herein is to be used by the recipient solely for the purpose for which it was supplied. It shall not be disclosed in whole or in part, by any other party without the written permission of Gexcon AS.
Figure 4-3: Contributions from the different segments to the 10-7 lethality contour. The assumed location of the biogas buffer storage is marked by “x”, and the contour from the associated segment is represented by a blue line.
For segments containing equipment in enclosed spaces, the risk distribution between overpressure effects and flammable cloud effects (i.e. flame exposure) related to delayed ignition may be of interest. These distributions are presented in Figure 4-4 (Upgrade 1 and 2), Figure 4-5 (Membrane upgrade), Figure 4-6 (Biomethane compressor), and Figure 4-7 (Liquefaction). The plots suggest that, for most of these segments, the estimated overpressure risk is significantly larger than the risk related to flame exposure.

Quantitative risk assessment for Greve biogas plant Report
Ref. No.: Gexcon-20-F100936-RA-1 Rev.: 03 Date: 25.11.2020 Page 30 of 37
© Gexcon AS. The information contained herein is to be used by the recipient solely for the purpose for which it was supplied. It shall not be disclosed in whole or in part, by any other party without the written permission of Gexcon AS.
Figure 4-4: Contributions from overpressure risk and flammable cloud risk to the 10-6 lethality contour for segments 2 and 3 (Upgrade 1 and 2). (There is no 10-5 contour associated with these risks.)
Figure 4-5: Contributions from overpressure risk and flammable cloud risk to the 10-5 lethality contour for Segment 4 (Membrane upgrade).

Quantitative risk assessment for Greve biogas plant Report
Ref. No.: Gexcon-20-F100936-RA-1 Rev.: 03 Date: 25.11.2020 Page 31 of 37
© Gexcon AS. The information contained herein is to be used by the recipient solely for the purpose for which it was supplied. It shall not be disclosed in whole or in part, by any other party without the written permission of Gexcon AS.
Figure 4-6: Contributions from overpressure risk and flammable cloud risk to the 10-5 lethality contour for Segment 7 (Biomethane compressor).
Figure 4-7: Contributions from overpressure risk and flammable cloud risk to the 10-5 lethality contour for Segment 8 (Liquefaction).

Quantitative risk assessment for Greve biogas plant Report
Ref. No.: Gexcon-20-F100936-RA-1 Rev.: 03 Date: 25.11.2020 Page 32 of 37
© Gexcon AS. The information contained herein is to be used by the recipient solely for the purpose for which it was supplied. It shall not be disclosed in whole or in part, by any other party without the written permission of Gexcon AS.
4.3 On the modelling of LBG tank releases in Riskcurves
Concerning the liquid releases from the LBG tank segments included in this study, it is noted that the rainout fraction calculated by Riskcurves is 0 for all considered hole sizes, except for the full rupture scenario. This means that, even if the planned tank foundation with pit and walls is expected to have a significant risk reducing effect (by limiting pool evaporation rates), this effect is only reflected in the modelling of the tank rupture scenario. According to Table 3-2, the frequency assumed for the tank rupture scenario is very low compared to the other release scenarios. As a consequence, the lethality contours calculated by Riskcurves are not very sensitive to whether the pit and walls are assumed to serve their intended purpose. In order to demonstrate this, lethality contours have also been calculated without accounting for the pit and walls, i.e. assuming that any pool resulting from an LBG release spreads freely on the ground. In Figure 4-8, these lethality contours are compared to the contours presented in Chapter 4.1. As expected, only minor differences can be observed, and mainly in the 10-7 contours.
Figure 4-8: Original lethality contours (left) and lethality contours calculated without accounting for the tank foundation with pit and walls (right). (The contours represent yearly frequencies of 10-3 (red), 10-4 (orange), 10-5 (yellow), 10-6 (green), and 10-7 (blue).)
4.4 Risk mitigation measures
In the context of the results presented in the previous chapters, some general risk mitigation measures are discussed. In order to limit leak durations, suitable detection, alarm and shutdown systems should be provided. The presented results assume a general shutdown time of 30 seconds. A longer shutdown time may drastically affect the consequences of a release. This especially concerns large gas leaks, as the release rates are likely to be sustained by inflow from neighboring segments until shutdown. In regard of overpressure risk, equipment should preferably not be located within enclosed spaces. If this cannot be avoided, adequate venting should be provided, to limit accumulation of flammable gas in confined areas. Moreover, appropriate pressure relief facilities should be installed, to reduce the consequences of potential explosions.

Quantitative risk assessment for Greve biogas plant Report
Ref. No.: Gexcon-20-F100936-RA-1 Rev.: 03 Date: 25.11.2020 Page 33 of 37
© Gexcon AS. The information contained herein is to be used by the recipient solely for the purpose for which it was supplied. It shall not be disclosed in whole or in part, by any other party without the written permission of Gexcon AS.
The risk related to domino effects involving the LBG tanks should be considered. As discussed in Chapter 3.8, the potential heat exposure from fires should be controlled, by installing gas and liquid detection, as well as suitable fire fighting equipment In order to limit the ignition probability on the plant site, internal traffic should be restricted to a minimum. Outside the plant site, the dominating ignition source is motorized vehicles on the public road passing on the west side. A risk reducing measure in this context could be installing fences along the road. Another concern related to internal traffic is collisions with pressurized process equipment, causing releases that may in turn be ignited by the vehicle or other ignition sources. This risk should be mitigated by installing barriers between the internal road and the exposed equipment.

Quantitative risk assessment for Greve biogas plant Report
Ref. No.: Gexcon-20-F100936-RA-1 Rev.: 03 Date: 25.11.2020 Page 34 of 37
© Gexcon AS. The information contained herein is to be used by the recipient solely for the purpose for which it was supplied. It shall not be disclosed in whole or in part, by any other party without the written permission of Gexcon AS.
5 Conclusion
A quantitative risk assessment has been performed for the Greve biogas plant, including both the existing biogas plant and the planned extension for LBG production. Individual risk levels have been presented as risk contours, with the purpose of establishment of consideration zones for land-use planning.
The results indicate that the 10-5 contour does not overlap with the road passing on the west side of the plant. Moreover, there are no residential buildings or particularly vulnerable objects within the 10-7 contour. In particular, the greenhouse, which is occasionally visited by 3rd parties, is located outside of the 10-7 contour. Notably, the 10-7 contour is sensitive to the location and size of the planned biogas buffer storage, i.e. the risk contours should be recalculated if the size is increased, or if the storage is to be moved closer to the greenhouse. It should also be noted that the results presented in this report are partly based on preliminary input and assumptions, and may change in future revisions.

Quantitative risk assessment for Greve biogas plant Report
Ref. No.: Gexcon-20-F100936-RA-1 Rev.: 03 Date: 25.11.2020 Page 35 of 37
© Gexcon AS. The information contained herein is to be used by the recipient solely for the purpose for which it was supplied. It shall not be disclosed in whole or in part, by any other party without the written permission of Gexcon AS.
6 Bibliography
1. Direktoratet for samfunnssikkerhet og beredskap (DSB). Tilbakemelding på søknad om samtykke til håndtering av farlig stoff. 27.08.2020. 2. Lloyds Register Consulting. Process leak for offshore installations frequency assessment MODEL - PLOFAM. s.l. : available at: https://www.norskoljeoggass.no/drift/publikasjoner/hms-og-drift/plofam-report/, 2018. 3. Direktoratet for samfunnssikkerhet og beredskap (DSB). Sikkerheten rundt anlegg som håndterer brannfarlige ,reaksjonsfarlige, trykksatte. eksplosjonsfarlige stoffer : Kriterier for akseptabel risiko. s.l. : DSB, 2012. 4. Otis, B.A. "LNG Hose Failure Probability". s.l. : Shell, 2014. 5. International Association of Oil and Gas Producers. Risk assessment data directory – Process release frequencies. 2019. Vols. IOGP Report 434-01. 6. RIVM. Reference Manual Bevi Risk Assessments. Bilthoven, the Netherlands : s.n., July 2009. 7. Helland, Eystein. Email to Lillian Kråkmo. RE: Greve LBG layout. 16.04.20. 8. United Kingdom Offshore Operators Association. Ignition probability review, model development and look-up correlations. London : IP research report. Energy Institute, January 2006. 9. Lloyds Register Consulting. Retningslinjer for kvantitative risikovurderinger for anlegg som håndterer farlig stoff. October 2017. Report no. 106535/R1. 10. TNO. Methods for Calculation of Physical Effects (TNO "Yellow Book"). 1996. Vol. CPR 14E. 11. —. Methods for the Determination of Potential Damage (TNO “Green Book”). 1989. Vol. CPR 16E. 12. Langford, NJ. Carbon dioxide poisoning. s.l. : US National Library of Medicine, 2005. 13. Gexcon. Quantitative risk assessment for Greve biogas plant, Gexcon-19-F100936-RA-1, rev. 00. Trondheim : s.n., 2019.

Quantitative risk assessment for Greve biogas plant Report
Ref. No.: Gexcon-20-F100936-RA-1 Rev.: 03 Date: 25.11.2020 Page 36 of 37
© Gexcon AS. The information contained herein is to be used by the recipient solely for the purpose for which it was supplied. It shall not be disclosed in whole or in part, by any other party without the written permission of Gexcon AS.
A 1 Consideration zones and risk acceptance criteria
According to DSB’s report Sikkerheten rundt anlegg som håndterer brannfarlige, reaksjonsfarlige, trykksatte og eksplosjonsfarlige stoffer: Kriterier for akseptabel risiko (3), the following consideration zones should be established around facilities handling hazardous substances: Inner zone (Indre sone): This is primarily the organisation’s own area, but may also include e.g. agricultural, natural and recreational areas (LNF-områder). Only momentary bypass for third parties (footpaths etc.) can be included in this zone. The population of concern in this area is the personnel at the facility. Central zone (Midtre sone): Public road, railway, quay and the like. Permanent jobs in industrial and office operations can also reside here. In this zone, there shall be no accommodation or housing. Scattered residential buildings may be accepted in some cases. Central zone is mainly designated to personnel on businesses near the plant (adjacent plants) and sometimes arterial roads, and random residence of people. Outer zone (Ytre sone): Areas regulated for residential purposes and other uses of the general population may be included in the outer zone, including stores and smaller accommodations. Outer zone considers areas where the population normally reside. Outside outer zone (Utenfor ytre sone): Schools, kindergartens, nursing homes, hospitals and similar institutions, shopping centres, hotels or large public venues must normally be placed outside the outer zone. Individuals who are particularly vulnerable are expected to be placed here. The risk acceptance criteria set forth by DSB can be summarised as follows:
• The presented map with risk contours must be made on the basis of calculation of individual risk assuming that someone would be constantly present and exposed to the risk (i.e. with an annual exposure of 8760 hours per year).
• Upper Risk Limit is 1 x 10⁻⁵.
• The level of individual risk should be further reduced to 10-6 or lower for people living in ordinary residential areas, and to 10-7 or lower for particularly vulnerable sections of the population.
• Lower Risk Limit is 1 x 10⁻⁸.
• It should be noted that DSB recommends adherence to the ALARP practice, but with certain specifics. As per recommendation of DSB, the risk shall be reduced to a level which can reasonably be achieved, regardless of other criteria of acceptable risk.
Figure 6-1 provides a visual representation of the zones and summarises the risk acceptance criteria.

Quantitative risk assessment for Greve biogas plant Report
Ref. No.: Gexcon-20-F100936-RA-1 Rev.: 03 Date: 25.11.2020 Page 37 of 37
© Gexcon AS. The information contained herein is to be used by the recipient solely for the purpose for which it was supplied. It shall not be disclosed in whole or in part, by any other party without the written permission of Gexcon AS.
Figure 6-1: Risk acceptance criteria for consideration zones.