REPORT ON WORKING CAPITAL MGT OF JSPL
70
A SUMMER PROJECT REPORT ON WORKING CAPITAL OF JINDAL STEEL & POWER LIMITED SUBMITTED TO: SUBMITTED BY JSPL Page 1
-
Upload
harshalgupta -
Category
Documents
-
view
121 -
download
4
description
STUDY ABT STEEL INDUSTRY AND ECONOMICS POSITION
Transcript of REPORT ON WORKING CAPITAL MGT OF JSPL

A SUMMER PROJECT REPORT ON
WORKING CAPITAL OF JINDAL STEEL &
POWER LIMITED
SUBMITTED TO: SUBMITTED BY
DEEPAK JAIN Guarav Lakani (PGDM) JSPL RBMIRAIGARH GR. NOIDA
Harshal Gupta(MBA)DIMAT
Raipur,C.G.
JSPL Page 1

I pay my sincere gratitude to MR. DEEPAK JAIN SIR Senior
Manager (F&A) Jindal steel & plant ltd Raigarh (C.G). For
granting me this project and also for his sage guidance in every step
of my project. The immense learning that I have got from him will
prove as a source of inspiration throughout my professional &
personal life.
I express my deep sense of gratitude to all faculty member of
department of MBA, who have provided me the theoretical
background, theoretical methodology, noble suggestion. Constant
encouragement and brilliant guidance which made me able to
present this project report for which I m grateful.
Lastly I pay my sincere regards to my parents, friends well
wishers who have encouraged me to complete this project report.
GUARAV LAKANI Student Pursuing PGDM from RBMI (GR. NOIDA)
HARSHAL GUPTAStudent Pursuing MBA from DIMAT (RAIPUR)
JSPL Page 2

CONTENT
Preface
Acknowledgement
Declaration
Certificate
1. Introduction
2. Aims & objectives of the project
3. Research Methodology
4. Company Profile
5. Synopsis for project
6. Working capital management
7. Components of working capital management
8. Calculation of ratios
9. Estimation of working capital requirements
10.Analysis & conclusion
11.Suggestion & recommendation
12.Bibliography
JSPL Page 3

Jindal Steel and Power Limited (JSPL) is one of the leading power
in steel industry with interest spanning across the spectrum from
mining iron ore to manufacturing value added steel product.
Production is required for the company but there is required to
WORKING CAPITAL of the company.
The steel industry is changes at a very
rapid rate and changes are frequent today. There is competition
getting fierce as compared to earlier days as by the help of
WORKING CAPITAL every company is designing there own
strategies to grow at rapid rate. The need for a better and improved
system it is a must for any industry. Company strategies totally
depend on WORKING CAPITAL.
JSPL Page 4
The founder
Aims and Objective
Research Methodology
JSPL Page 5

THE FOUNDER : LATE O.P JINDAL- Babuji (The man of destiny) (1930-2005).
The jindal orgination owes its brilliant growth to the
dedicated endeavors of its employees with a strong emphasis on quality and
on time delivery to our customer as per their specification our progresses as
well as successful achievement have made the jindal org as a leading name in
INDIA.
Late O.P jindal, the founder of jindal org, which is
now a US $4 billion conglomerate, started his industrial career with a small
bucket manufacturing unit in HISSAR .the life journey of MR.Jindal from a
farmer’s son to be successful industrialist, a philanthropist, a politician and a
leader would sense, as a great source of inspiration for generation to come. He
was the first industrialist of India to be elected as a member of parliament.
JSPL Page 6

JINDAL STEEL AND POWER (JSPL)
Background
Jindal Steel & Power Ltd. (JSPL), formed in 1998 with the transfer of the
Raipur and Raigarh units of Jindal Strips Limited (JSL), is the largest coal-
based steel producer with a production of 0.62 mn tpa. Under the scheme
of transfer, equity capital of JSL was split between JSL and JSPL in the
ratio 60:40.
. The Raigarh division (consisting of sponge iron, mild steel slabs and
captive power consumption units), iron ore mines at Tensa (Orissa),
Coal mines at Gare, Tamnar (C G.) and heavy engineering equipment
unit at Raipur (C.G.) were transferred to JSPL. JSPL has added various
manufacturing facility gradually during 1988 to 2007 Mainly Rail and
Universal Beam mill 0.75 Million MT, Steel Making Capacity of 2.4
Million MT, Power 340 MW, Hot Metal 1.5 Million MT, Plate Mill 1
Million MT, High Carbon Ferro Chrome 36000 Mt, Sponge Iron (Coal
Based which is largest in the World) 1.32 Million MT.
JSPL Page 7

Key Highlights
High level of vertical integration, a sustainable competitive advantage:
JSPL is a highly integrated steel producer. It has captive iron ore and coal
mines. It also has a captive source of power. Its low input costs make it one of
the lowest cost producers of sponge iron in the world. Its high value added
products like rails and structural help it to 1earn higher margins.
Diversified business model: JSPL is diversifying its business risk by
transforming itself from a pure steel producer to a diversified, steel and power
producer. We believe that change in revenue stream from a pure cyclical steel
business to a mix of steel and power will result in rapid Growth of the
company. Jindal Steel & Power (JSPL) is one of the lowest cost producers of
sponge iron in the world. Besides sponge iron, the company has interests in
the steel and power businesses.
Riding on steel cycle upturn
On the back of the upturn in the steel cycle, JSPL has shown impressive profit
growth during the last three years. Due to the sharp growth in volumes and
realizations, The Company has achieved revenue CAGR at 62.4%. We
estimate EBITDA and net profit CAGR at 60.9% and 67.9%, respectively.
JSPL Page 8

Long-term growth plans
JSPL is taking advantage of the present steel cycle upturn to scale up its
operations. It has a definite expansion plan, which will make it one of the
leading players in the steel and power sector.
Future Plans
The price of sponge iron is firming up and is expected to remain stable.
The benefits of the additional sponge iron capacity should now be enjoyed.
In order to further reduce the variable cost of steel production, the
company is setting up a power Plant of 2x135 MW at the coalmine itself.
This is also expected to reduce cost of power generation.
JSPL Page 9

INDIAN STEEL INDUSTRY Steel is one such material that has played an important role in the
development of mankind in the last century. Today, it is difficult to imagine a
world without steel. Steel has become vital to our everyday life. It is at the
root of the quality of life that each of us enjoys today, helping to shelter us, to
feed us and to facilitate both our working day and leisure activities. We
depend on steel for almost everything from our houses and buildings, the cars
we drive, roads, bridges, agricultural equipment, machines, the list is endless.
Steel is a versatile, constantly developing material that underpins all
manufacturing activity. Even if a product is not made entirely from steel, it
will undoubtedly have steel as a component at some point in the
manufacturing process. There are currently more than 3,500 different grades
of steel with many different properties - physical, chemical, environmental,
75% of which have been developed in the last 20 years. Steel is also an
environment friendly material and has the distinction of being the most
recycled material in the world today.
Today, consumption of steel is also regarded as an indicator of development
of a nation. Per capita steel consumption is now universally accepted as an
index of economic development of a nation. Given its role, steel has
established itself as the backbone of any economy
JSPL Page 10

The Indian Steel industry is almost 100 years old now. Till 1990, the
Indian steel industry operated under a regulated environment with insulated
markets and large-scale capacities reserved for the public sector. Production
and prices were determined and regulated by the Government, while SAIL
and Tata Steel were the main producers, the latter being the only private
player. In 1990, the Indian steel Industry had a production capacity of 23 MT.
1992 saw the onset of liberalization and the Indian economy was opened to
the world. Indian steel sector also witnessed the entry of several domestic
private players and large private investments flowed into the sector to add
fresh capacities.
With capital investments of over Rs 100,000 crores, the Indian steel industry
currently provides direct/indirect employment to over 2 million people. As
India moves ahead in the new millennium, the steel industry will play a
critical role in transforming India into an economic superpower. INDIAN
steel industry is one of the least protected one in the world. There is no
restriction on cheap imports from competive nation where as there are
numerous tariff and non-tariff barriers in developed countries. the industries is
witnessing various merger & acquisition (M&A) and the Indian steel industry
is not lagging behind. The Tata’s take over of Corus steel and the recent Essar
steel acquisition of Canadian firm Algoma, Tisco take over of a Singapore
based 2.5 million tone steel company natsteel and jindal steel stainless take
over f an Indonesian cold roller called mapsian stainless steel .in addition to
global acquisition Indian player are consolidating their position in the
domestic market JISCO & JVSL have merged to form JISCO.
JSPL Page 11

MAJOR STEEL PLAYER
Steel authority of India limited.
Tata steel
Steel authority of India limited.
Rashtriya Ispat Nigam Limited.
JSW
Jindal Steel & Power Limited.
Essar steel
Ispat Industries Tata steel
JSPL Page 12

Jindal Steel & Power Limited (JSPL), part of the US $ 8 billion Jindal organization has business interests in steel production, steel products, power generation,mining, sponge iron, ferro chrome and heavy machinery.An enterprising spirit and ability to discern long-range trends have been the driving forces behind JSPL’s remarkable growth. Along the way, JSPL has consistently tapped new opportunities by increasing production capacity, diversifying investments, and leveraging the core capabilities to advance into new businesses. And that has prepared the company for growth today and tomorrow.
Steel Infrastructure: Excelling the level of steel making, JSPL has exceeded the production capacity of 2.90 MTPA with its plant at Raigarh, Chhattisgarh.Upgrading its existing facility at Raigarh and by commissioning of additional facilities in Jharkhand and Orissa, JSPL is encompassing the future production capacity of steel that will rise by 12 MTPA in coming years.
JSPL’s sinter plant, blast furnaces (1681m and 351m), coke oven, state-of-theart Steel Melting Shop with electric arc furnace, ladle refining, vacuum degassing and continuous casting bears testimony to its promise of providing its customers with international quality steel.
Innovative products: JSPL continuously endeavours to increase the portfolio of the value-added products. The product mix of the company
JSPL Page 13

includes Hot Rolled Parallel Flange Beams and Columns, Rails, Channels, Plates, Cathode bar and Continuously Cast Products that includes Billets/Blooms, Beam Blanks, Rounds and Slabs and Metallics and Ferro Alloy.
Rails: With its unparalleled technical know-how, JSPL pioneered the world’s longest finished rails of 120 meters in India. Further, an integrated Flash Butt Welding Plant has been installed to enable the supply of 240-480 meters long welded rail panels. These rails are preferred for their economy, safety and for providing a comfortable rail journey.
H-Beams and Columns: JSPL has been a pioneer in producing Hot Rolled Parallel Flange Beams (H-beam) and Columns in medium and large sizes in India. The structural engineers, architects and construction companies, consider these H-Beams and columns strongest, safest and most stable.
Plates: JSPL also introduced 3.5m wide steel plates for the first time in India. Following world-class technology in its production of the finest and widest plates JSPL reaffirmed its commitment to develop state-of-the-art steel products of international standards. JSPL’s sharp focus on customer relationship management and manufacturing execution systems ensures delivery of customised solutions to the customer needs.
Power: JSPL has a 340 MW power generation facility In Raigarh based on waste heat recovery from rotary kilns, washery rejects and coal fines to meet the captive requirements as well as supply to the State Electricity Boards of Chhattisgarh. JSPL have expansion plans of expanding the power generation facility to 600 MW. Jindal Power limited (JPL): JPL a wholly owned subsidiary of JSPL, is setting up a 1000 MW O.P. Jindal Super Thermal Power Plant at Raigarh, Chhattisgarh, with an investment of over Rs. 4500 crores. The project has been accorded Mega Power Project status by the Ministry of Power, Government of India.
JSPL Page 14
Coal mining: JSPL has its captive Coal Mines at Dongamahua, Chhattisgarh. Since the coal is of very poor grade and quality it has to be beneficiated. Hence a coal washery with capacity of 6 MTPA to wash 47-48% coal ash to 26% has been commissioned and is operating successfully. The company has been allotted additional Coal Block to meet increased requirement of coal for its expansion project.
Iron-ore mining: JSPL has captive Iron Ore Mines at Tensa, Orissa, to meet the part requirement of its Sponge Iron Plant. Accoutered with fully mechanized techniques, it is currently producing about 555000 MT of sponge grade ore. An additional crusher is also being installed to ensure the availability of high-grade iron ore. The captive Iron Ore and Coalmines are the core strength of the company.
Diamond Exploration: JSPL has recently made its foray into exploration of high value minerals and metals like diamonds, precious stones, gold, platinum group of minerals, base metals, tar sands etc. Initiation has been made in exploration for diamond, gold and associated minerals in Jashpur district of Chhattisgarh, parts of Jharkhand and Democratic Republic of Congo.Sponge Iron: JSPL has worlds largest coal-based sponge iron manufacturing facility, which uses indigenously developed rotary kilns.
Ferro chrome: Manufacturing of stainless and special steel requires an important component called Ferro chrome. Ferro chrome is the result of a continuous smelting of chrome ore, coke, coal and quartz at the Submerged Arc Furnace (SAF).
Machinery Division: JSPL has set up a state-of-the-art Machinery Division atRaipur, Chhattisgarh, which caters to the in-house machinery & components requirements of the Raigarh plant and other group companies. The unit is ISO9002, has machinery-manufacturing capacity of 11,500 MT and production capacity of 30,000 MT of steel ingots and castings.
CSR initiative: JSPL has from the very beginning devoted itself entirely to the cause of up liftment of backward areas of the country. The company has taken up a number of programmes to improve the lives of the underprivileged. Raigarh, a tribal district in Chhattisgarh is one such example. One of the key priority areas has been education as it has a direct impact on
JSPL Page 15

nation building. The 10+2 co-educational O.P. Jindal School, with an investment of over Rs. 5 crore is operational at Raigarh. The oldest girls' school has been renovated. In addition, 42 villages have been adopted, contributing to the development of the region through a more holistic effort. From providing sewage and sanitation facilities, building and maintaining roads and parks, to healthcare and education facilities, JSPL is leaving no stone unturned in serving the society. Availability of medical facilities by setting up charitable clinics and hospitals is yet another aspect of our social initiative. JSPL is constantly working towards providing world-class health facilities to the people of Raigarh at the 100-bedmulti-specialty O. P. Jindal Hospital & Research Centre. The hospital has four well-equipped Operation Theatre, Intensive care units, medical teams for various specialty including orthopedics and pediatrics. Medical camps are regularly organized which benefits more than 40,000 people in the district. Women empowerment programmes are organized regularly which includes education, livelihood training, health check ups etc.JSPL's scope of social activities extends beyond healthcare and welfare to the cultural and sports arena, too. JSPL has also developed a unique Musical Fountain in Raigarh. The Kamla Nehru Park in the city has been developed and is being maintained by JSPL. The initiation of a social accountability system, the SA8000, is a measure towards becoming an increasingly aware and conscientious corporate member of society.
Future Plans of action:
Modification of the existing 351 Cu.M mini blast furnace to 418 Cu.M Establishment of cold briquetting of sponge iron. Production of sponge iron through coal gasification. Installation of servo hydraulic universal testing machine for fatigue ,
sub zero frecture toughness and high temperature testing .
JSPL Page 16

Installation of electron probe micro analyzer Study to minimize accretion in coal base DRI kilns. Study to reduce rusting problems in structurals. Blending of non coking to produce desired coke . Process optimization for casting of SAE 52100 in round section. Laboratory scale induction furnance and forging press to develop new
grade.
CURRENT CAPACITIES: At Raigarh Sponge Iron 1.37 million tonnes per annum Mild Steel 2.4 million tonnes per annum Ferro Alloys 36,000 tonnes per annum Power 333 MW Hot Metal / Pig Iron 1.5 million tonnes per annum RUBM 75,000 tonnes per annum Coal Washery 6 million tonnes per annum
At Raipur Machinery and Castings 11,500 tonnes per annum Ingots 30,000 tonnes per annum CF Castings 3,000 tonnes per annum JSPL has proved its mettle to take on the new challenges of growth scenarios. By giving the best to the customers, employees, stakeholders and to the community at large, JSPL is setting its goals of tomorrow for a new flourishing India.
JSPL Page 17

JSPL IN I NDIAThe following map shows the spread of JSPL which is in all corners of India. The map shows all the registered, corporate, branch and marketing offices,minesworksandproposedprojects
JSPL Page 18

OBJECTIVES OF THE STUDY
To study the need and importance of working capital.
Analysis of important Ratio for the management of the company,
To study the various sources of working capital.
To maintain the optimum balance of working capital components.
To study the various techniques used in managing the working capital effectively such as ratio analysis
Collection of Data:
1. Primary Data:
Data collected from financial statements of the company;
Profit & Loss A/c,
Balance Sheet,
Annual Report, etc.
2. Secondary Data:
Discussions with managers
Referring books, journals and magazines
Information collected from Internet.
JSPL Page 19
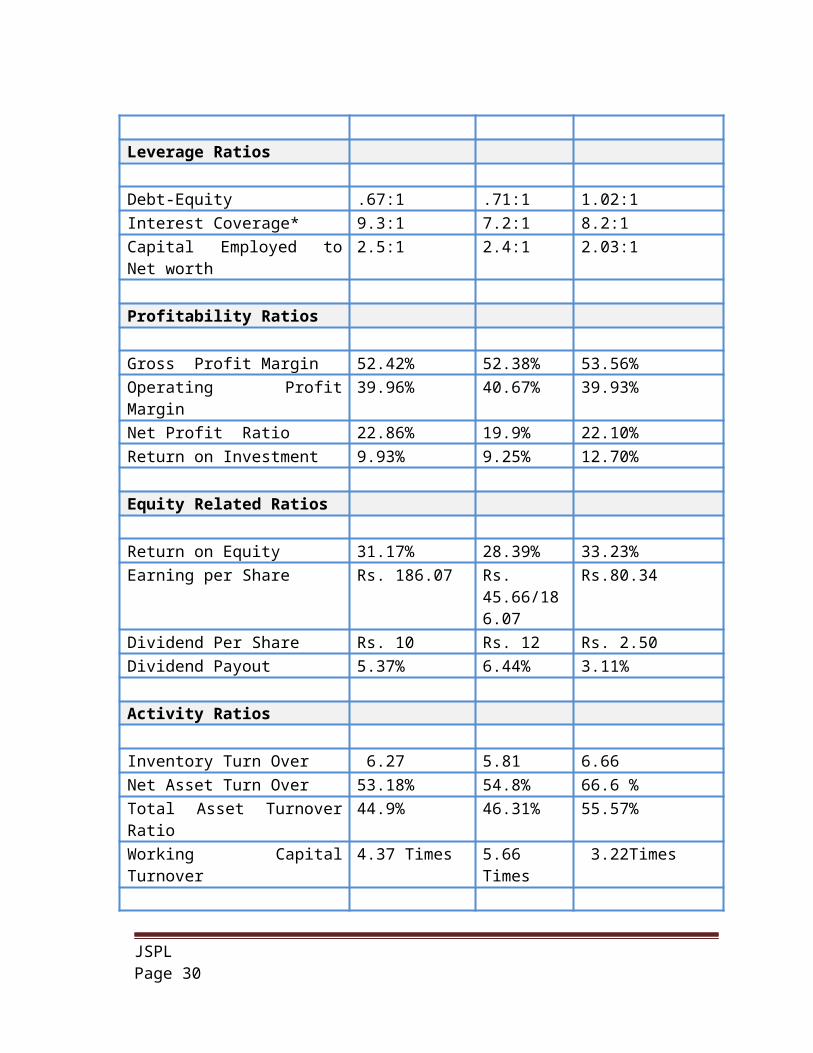
RATIO ANALYSIS
Chart Showing Various ratios Of JSPL for last three years
Ratio 2006 2007 2008
Liquidity Ratios
Current 1.7:1 1.5:1 2.03:1Quick 1:1 1:1 1.4:1
Leverage Ratios
Debt-Equity .67:1 .71:1 1.02:1Interest Coverage* 9.3:1 7.2:1 8.2:1Capital Employed to Net worth 2.5:1 2.4:1 2.03:1
Profitability Ratios
Gross Profit Margin 52.42% 52.38% 53.56%Operating Profit Margin 39.96% 40.67% 39.93%Net Profit Ratio 22.86% 19.9% 22.10%Return on Investment 9.93% 9.25% 12.70%
Equity Related Ratios
Return on Equity 31.17% 28.39% 33.23%Earning per Share Rs. 186.07 Rs.
45.66/186.07
Rs.80.34
Dividend Per Share Rs. 10 Rs. 12 Rs. 2.50Dividend Payout 5.37% 6.44% 3.11%
Activity Ratios
Inventory Turn Over 6.27 5.81 6.66Net Asset Turn Over 53.18% 54.8% 66.6 %Total Asset Turnover Ratio 44.9% 46.31% 55.57%Working Capital Turnover 4.37 Times 5.66 Times 3.22Times
JSPL Page 20

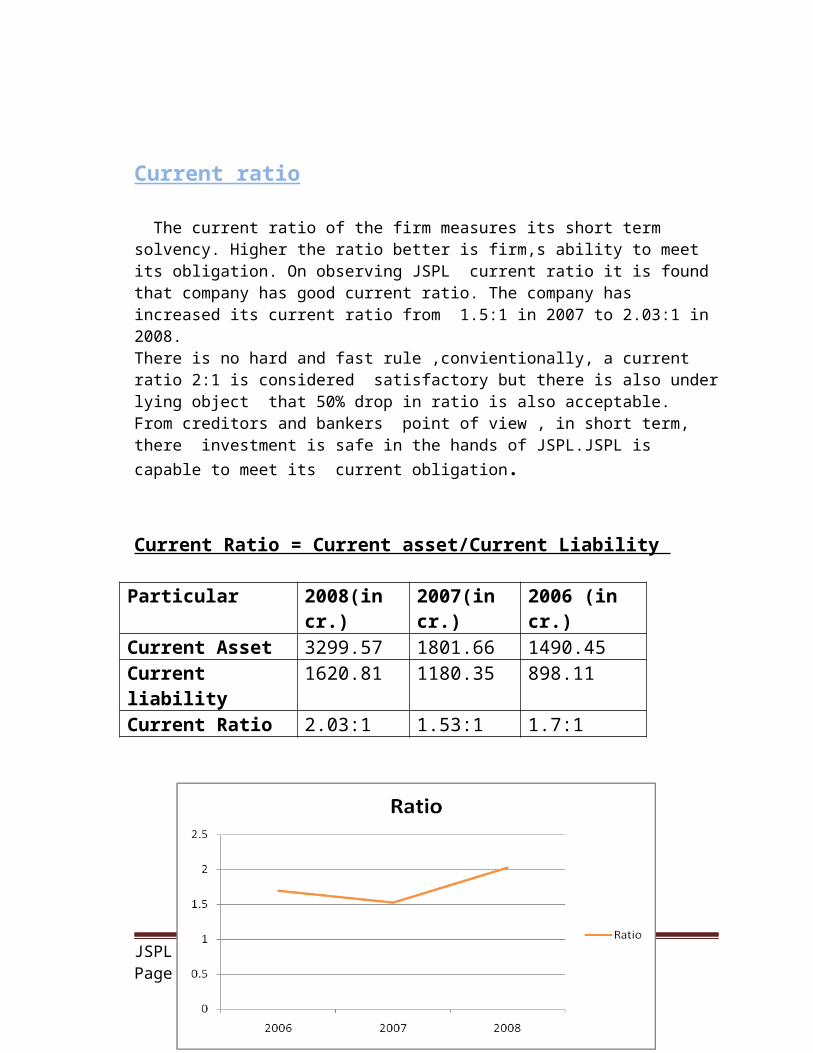
Current ratio
The current ratio of the firm measures its short term solvency. Higher the ratio better is firm,s ability to meet its obligation. On observing JSPL current ratio it is found that company has good current ratio. The company has increased its current ratio from 1.5:1 in 2007 to 2.03:1 in 2008.There is no hard and fast rule ,convientionally, a current ratio 2:1 is considered satisfactory but there is also under lying object that 50% drop in ratio is also acceptable.From creditors and bankers point of view , in short term, there investment is safe in the hands of JSPL.JSPL is capable to meet its current obligation.
Current Ratio = Current asset/Current Liability
Particular 2008(in cr.) 2007(in cr.) 2006 (in cr.)Current Asset 3299.57 1801.66 1490.45Current liability 1620.81 1180.35 898.11Current Ratio 2.03:1 1.53:1 1.7:1
JSPL Page 21

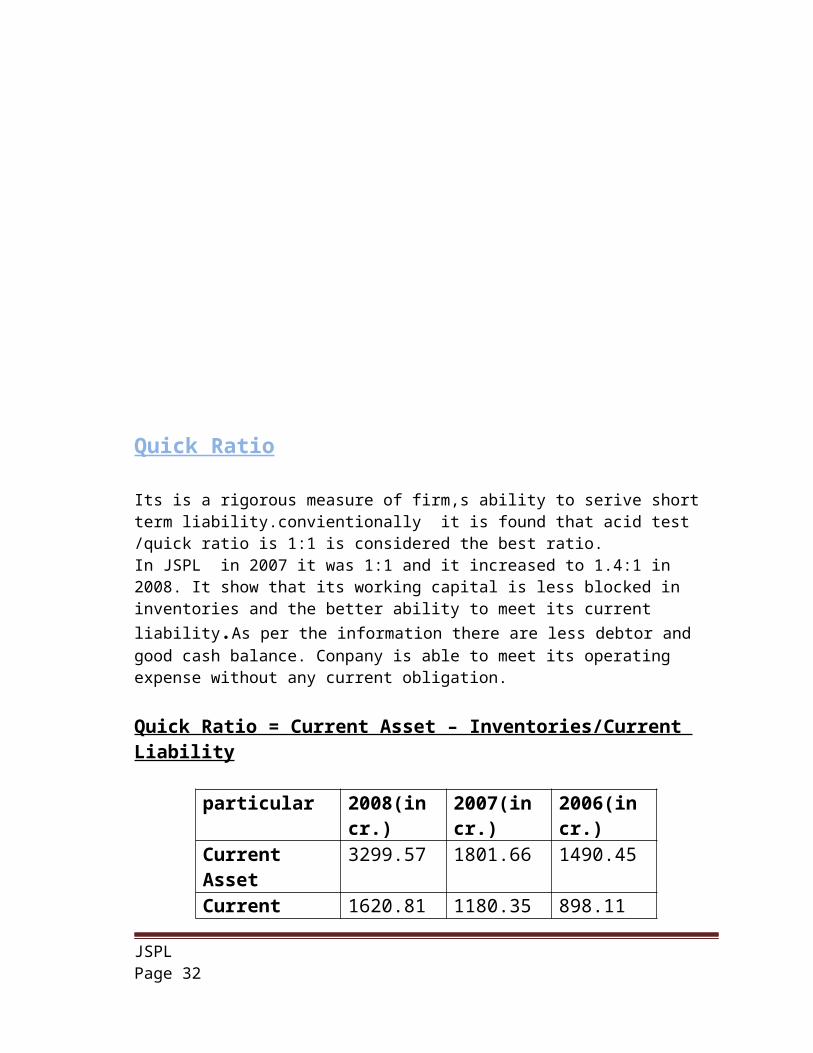
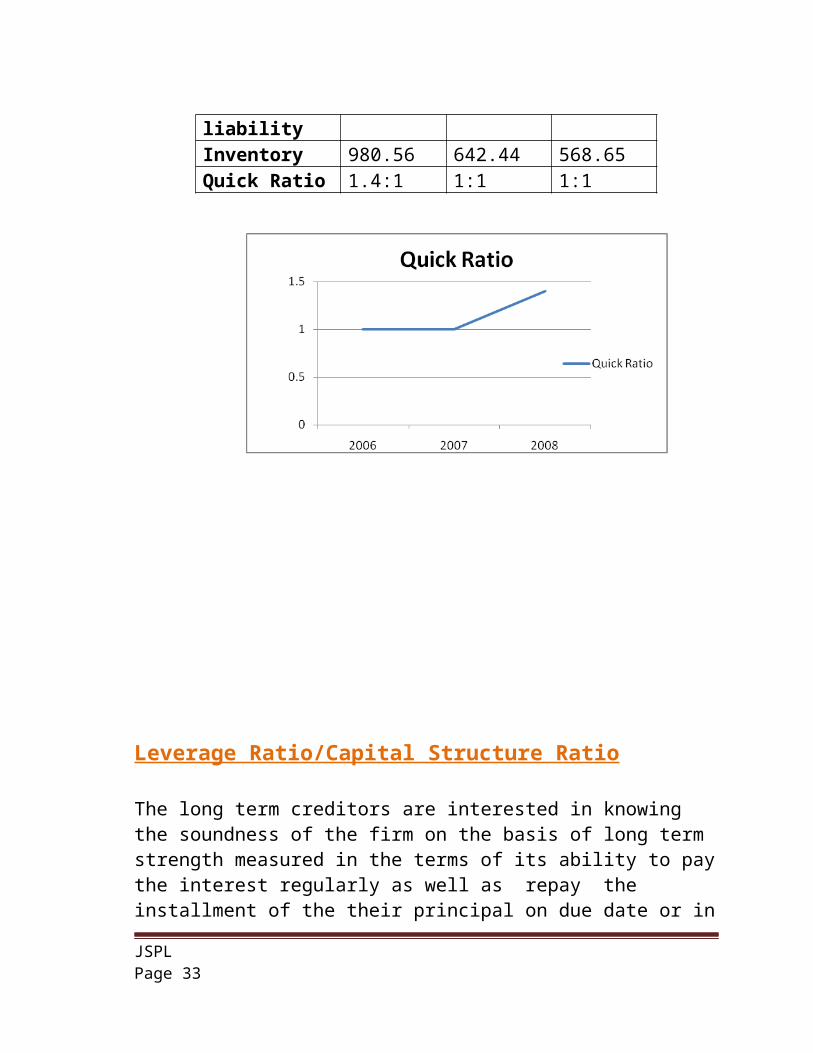
Quick Ratio
Its is a rigorous measure of firm,s ability to serive short term liability.convientionally it is found that acid test /quick ratio is 1:1 is considered the best ratio.In JSPL in 2007 it was 1:1 and it increased to 1.4:1 in 2008. It show that its working capital is less blocked in inventories and the better ability to meet its current liability.As per the information there are less debtor and good cash balance. Conpany is able to meet its operating expense without any current obligation.
Quick Ratio = Current Asset – Inventories/Current Liability
particular 2008(in cr.) 2007(in cr.) 2006(in cr.)Current Asset 3299.57 1801.66 1490.45Current liability
1620.81 1180.35 898.11
Inventory 980.56 642.44 568.65Quick Ratio 1.4:1 1:1 1:1
JSPL Page 22

Leverage Ratio/Capital Structure Ratio
The long term creditors are interested in knowing the soundness of the firm on the basis of long term strength measured in the terms of its ability to pay the interest regularly as well as repay the installment of the their principal on due date or in lump-sum at the time of maturity. It can be examined by leverage ratio. There are different types of leverage ratio.
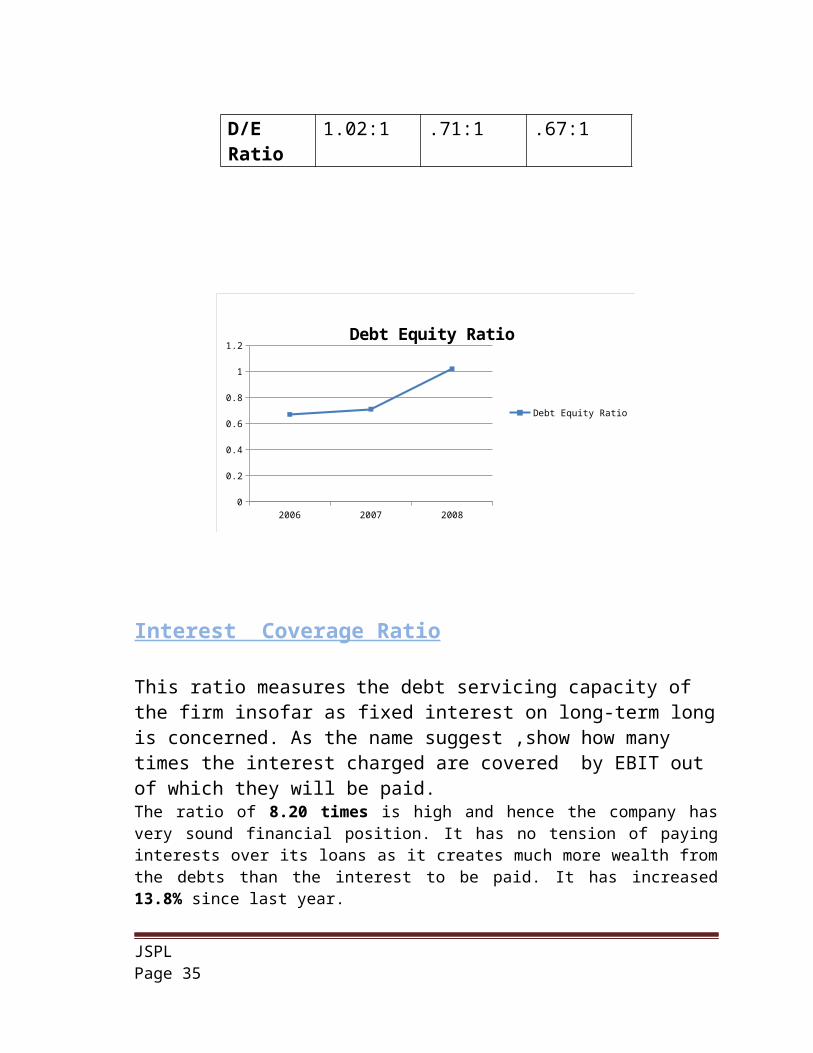
Debt-Equity Ratio
Interest Coverage Ratio
Capital employed to Net Worth
Debt-Equity RatioIt shows the relationship between borrowed fund and owner’s equity in measuring long term financial solvency of the firm. It reflect the relative claim of the creditors and shareholder against the asset of the firm. Alternatively, it also indicates the relative proportion of the debt and equity in the financing the asset of the firm. It has been found that JSPl has increased its debt in debt/equity in financing the asset of the firm. Due to its good earning capacity JSPL is able to raise its debt compare to equity. Its increased D/E ratio 43.6% from 2007.
D/E Ratio = Debt / Equity
particular
2008(in cr.) 2007(in cr.)
2006(in cr.)
Debt 3863.35 2496.73 1844.71Equity 3756.38 3507.72 2745.37D/E Ratio 1.02:1 .71:1 .67:1
JSPL Page 23

2006 2007 20080
0.2
0.4
0.6
0.8
1
1.2Debt Equity Ratio
Debt Equity Ratio
Interest Coverage Ratio
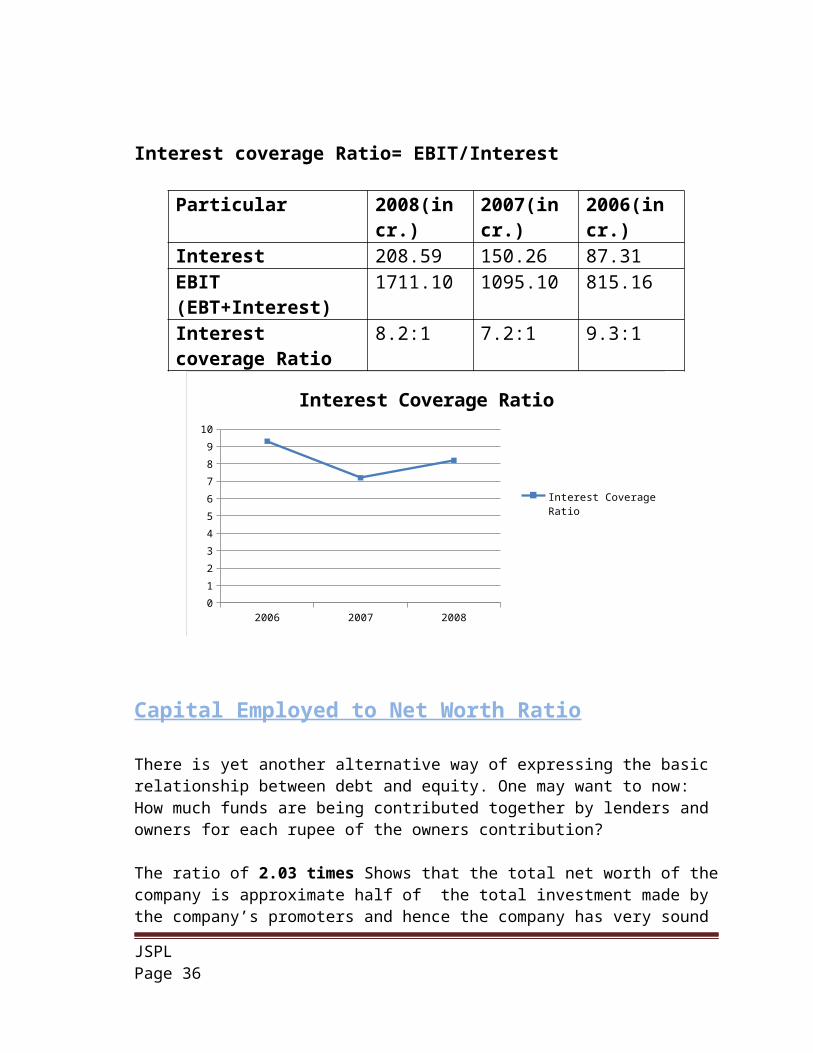
This ratio measures the debt servicing capacity of the firm insofar as fixed interest on long-term long is concerned. As the name suggest ,show how many times the interest charged are covered by EBIT out of which they will be paid.The ratio of 8.20 times is high and hence the company has very sound financial position. It has no tension of paying interests over its loans as it creates much more wealth from the debts than the interest to be paid. It has increased 13.8% since last year.
Interest coverage Ratio= EBIT/Interest
Particular 2008(in cr.) 2007(in cr.) 2006(in cr.)Interest 208.59 150.26 87.31EBIT (EBT+Interest) 1711.10 1095.10 815.16Interest coverage Ratio
8.2:1 7.2:1 9.3:1
JSPL Page 24

2006 2007 20080
1
2
3
4
5
6
7
8
9
10
Interest Coverage Ratio
Interest Coverage Ratio
Capital Employed to Net Worth Ratio
There is yet another alternative way of expressing the basic relationship between debt and equity. One may want to now: How much funds are being contributed together by lenders and owners for each rupee of the owners contribution?
The ratio of 2.03 times Shows that the total net worth of the company is approximate half of the total investment made by the company’s promoters and hence the company has very sound financial position. We can also derive that the promoters finance around 50% of the total net worth of the company.
C\N Ratio = Capital Employed/Net Worth
Particular 2008(in cr.) 2007(in cr.) 2006(in cr.)Capital Employed (Debt +Net Worth)
7585.45 5982.89 4583.29
Net Worth 3722.12 2475.17 1837.92C\NRatio 2.03:1 2.4:1 2.5:1
JSPL Page 25

2006 2007 20080
0.5
1
1.5
2
2.5
3
Capital Employed to Net Worth
Capital Employed to Net Worth
Profitability Ratio
A company should earn profits to survive and grow over a long period of time. The profitability ratio are calculated to measure the operating efficiency of the company. Besides management of the company, creditors and owners are also interested in the profitability of the firm. There are different type of profitability ratio:
Gross Profit Ratio
Operating Profit Ratio
Net Profit Ratio
Return on Investment
Gross Profit Ratio
Gross Profit is the result of the relationship between prices, sales, volume and cost.A high GP ratio is sign of good management as it implies that the cost of production of the firm is relatively low and vice versa.In JSPL, company has shown rising trend in its GP ratio, which show that JSPL has increasing its efficiency with period of time.there was certain foreign fluctuating ,shut down in 2007 which decreased its GP ratio in 2007 there by its again recovered its position in 2008 and 2009.
JSPL Page 26

G\P Ratio =Gross Profit \Net Sales
Particular 2008(in cr.)
2007(in cr.) 2006(in cr.)
Gross Profit 2848.55 1859.22 1393.59
Net Sales 5410.75 3519.81 2590.25G\P Ratio 52.42% 52.38% 53.56%
2006 2007 200851.5
52
52.5
53
53.5
54
GP RATIO
GP RATIO
Operating Profit Ratio
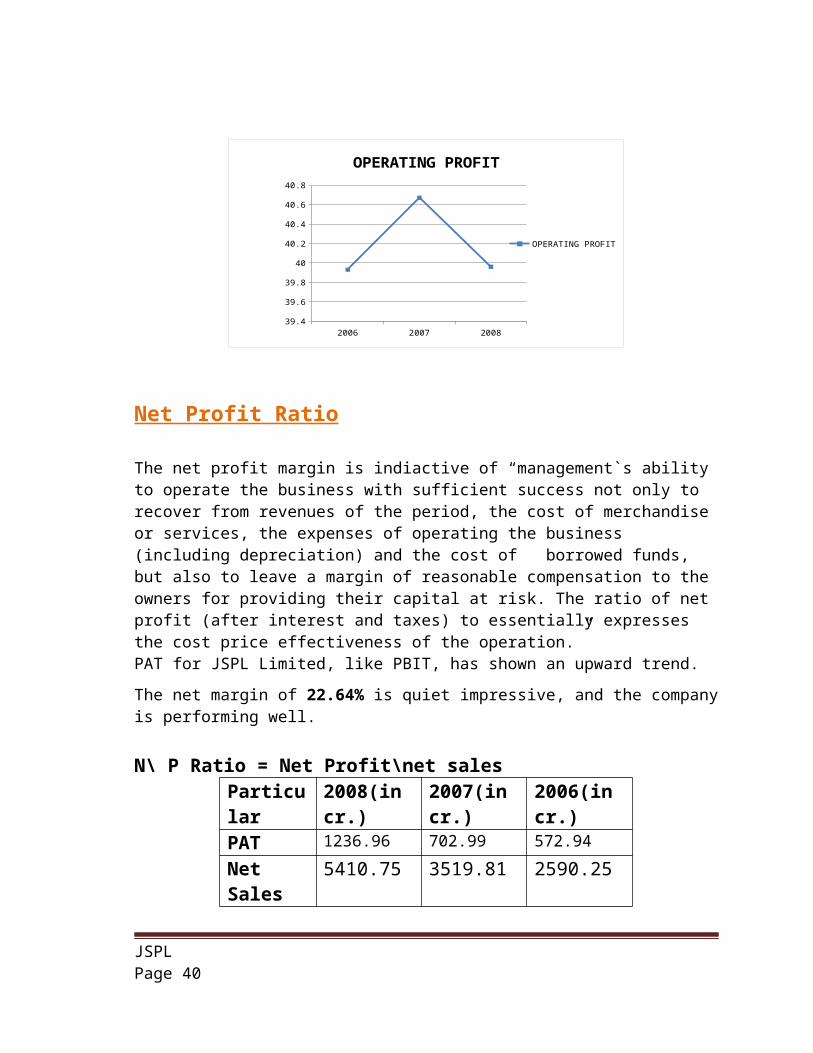
Operating Profit ensures adequate coverage for operating expense of the firm and sufficient return to the owners of the business.Comparing various factors of operating profit it found that from 2006 to 2007 their was tremous change in depreciation, interest and tax as compare to 2007 to 2008.
O/P Ratio=Operating Profit/Net Sales
Particular 2008(in cr.)
2007(in cr.) 2006(in cr.)
Operating Profit(PBIDT)
2162.61 1431.58 1034.33
Net Sales 5410.75 3519.81 2590.25O\P Ratio 39.96% 40.67% 39.93%
JSPL Page 27

2006 2007 200839.4
39.6
39.8
40
40.2
40.4
40.6
40.8
OPERATING PROFIT
OPERATING PROFIT
Net Profit Ratio
The net profit margin is indiactive of “management`s ability to operate the business with sufficient success not only to recover from revenues of the period, the cost of merchandise or services, the expenses of operating the business (including depreciation) and the cost of borrowed funds, but also to leave a margin of reasonable compensation to the owners for providing their capital at risk. The ratio of net profit (after interest and taxes) to essentially expresses the cost price effectiveness of the operation.”PAT for JSPL Limited, like PBIT, has shown an upward trend.
N\ P Ratio = Net Profit\net sales
Particular 2008(in cr.) 2007(in cr.) 2006(in cr.)PAT 1236.96 702.99 572.94
Net Sales 5410.75 3519.81 2590.25N\P Ratio 22.86% 19.9% 22.10%
2006 2007 2008
18
19
20
21
22
23
24
NP RATIO
NP RATIO
JSPL Page 28
The net margin of 22.64% is quiet impressive, and the company is performing well.

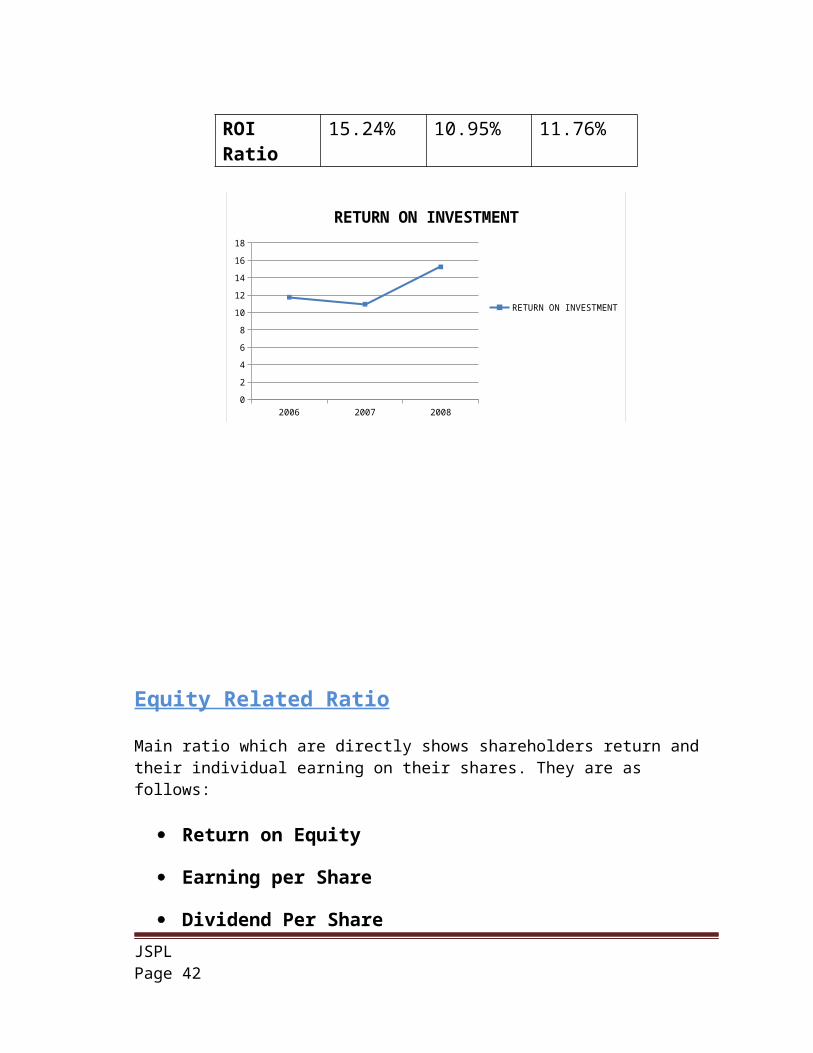
Return on Investment
The return on investment is another measure of the returns that the business generates. This is expressed as the ratio between the profit before interest and taxes (PBIT) to the Total Assets (Loans and Owner’s Fund) in the business. The ROI of 15.29% signifies that the company is getting good return out of its investment decisions. The graph below shows a consistent growth in JSPL’s return on investment which shows that the company’s key decision maker are doing a great job.
ROI = PBT\Total Asset
Particular 2008(in cr.) 2007(in cr.) 2006(in cr.)PAT 1236.96 702.99 572.94
Net Assets
8114.40 6419.49 4870.37
ROI Ratio 15.24% 10.95% 11.76%
2006 2007 20080
2
4
6
8
10
12
14
16
18
RETURN ON INVESTMENT
RETURN ON INVESTMENT
JSPL Page 29
Equity Related Ratio
Main ratio which are directly shows shareholders return and their individual earning on their shares. They are as follows:
Return on Equity
Earning per Share
Dividend Per Share
Dividend Payout Ratio
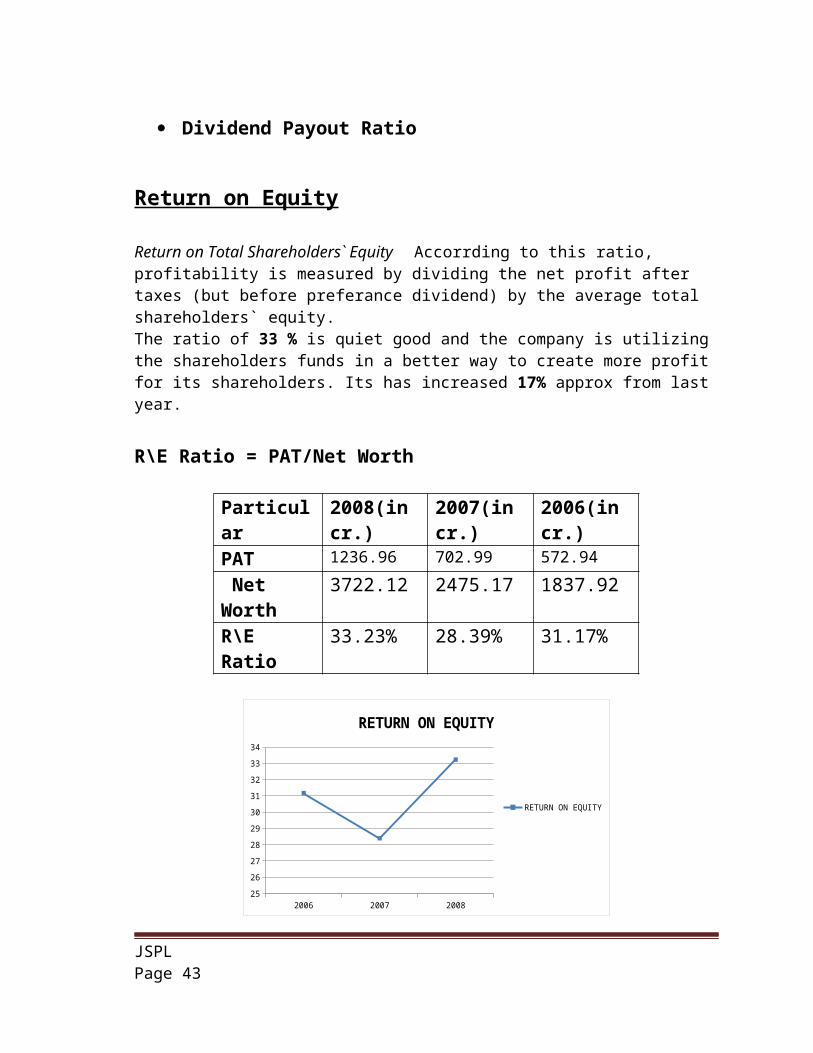
Return on Equity
Return on Total Shareholders` Equity Accorrding to this ratio, profitability is measured by dividing the net profit after taxes (but before preferance dividend) by the average total shareholders` equity.The ratio of 33 % is quiet good and the company is utilizing the shareholders funds in a better way to create more profit for its shareholders. Its has increased 17% approx from last year.
R\E Ratio = PAT/Net Worth
Particular 2008(in cr.) 2007(in cr.) 2006(in cr.)PAT 1236.96 702.99 572.94
Net Worth
3722.12 2475.17 1837.92
R\E Ratio 33.23% 28.39% 31.17%
JSPL Page 30
2006 2007 200825
26
27
28
29
30
31
32
33
34
RETURN ON EQUITY
RETURN ON EQUITY
Earning Per ShareIt measures the profit available to the equityholders on a per share basis, i.e. the amount that they can get on every shere held. It is calculated by dividing the profits available to the shareholders by the number of outstanding shares.
It is to be noted that there was a stock split in the year 2006-07 due to which the face value of the shares changes from Rs. 5/- per share to Re. 1/- per share
EPS = PAT\No. of Share
Particular 2008(in cr.) 2007(in cr.) 2006(in cr.)PAT 1236.96 702.99 572.94
No. of Share 153,961,340 153,961,340 30,792,268R\E Ratio 80.34 Rs 45.66 Rs 186.07 Rs
Dividend Per Share
The EPS represents whats the owners are theoritically entitled to receive from the firm. A part of the net profits belonging to them is retained in the business and balance is paid to them as dividends. DPS is the net distributed profit belonging to the shareholders divided by the number of ordinary shares outstanding.In compared to the face value of the shares, i.e. Re.1.00/share. DPS of Rs. 2.59 is quiet good.
DPS = Dividend Declared\No. of Share
Particular 2008(in cr.) 2007(in cr.) 2006(in cr.)Dividend 39.93 36.95 30.79
JSPL Page 31
DeclaredNo. of Share 153,961,340 153,961,340 30,792,268R\E Ratio 2.50Rs 12 Rs 10 Rs
Activity Ratio
Activity ratios are employed to evauate the effiency with which the firm manage to utilize its assets this ratio is also called turn over ratio because they indicates the speed with which assets are converted into sales. Different types of activity ratios are mentioned below:
Inventory Turn Over
Net Asset Turn Over
Total Asset Turnover Ratio
Working Capital Turnover
Inventory Turnover Ratio
Indicates the number of times inventory is replaced the year. The inventor/stock turnover ratio measures how quickly inventory sold. It is a test of efficient inventory management. In general, a high inventory turnover ratio is better than a low ratio. A high ratio implies good management.
The ratio of 6.6 times signifies that the company is efficient in selling its stocks. Being a manufacturing sector company, the company is able to convert its inventory into receivables 6.6 times a year, which can be considered moderate depending on the nature of manufacturing sector.
I/T Ratio = Net Sales\ Average Inventory
JSPL Page 32
The Inventory turnover Ratio shows how rapidly the inventory is turning into receivables. Higher the inventory turnover ratio, better the inventory management and inturn higher profit for the company.
Particular 2008(in cr.) 2007(in cr.) 2006(in cr.)Net Sales 5410.75 3519.81 2590.25
Avg. Inventory 811.50 605.55 413.10I\T Ratio 6.66 5.81 6.27No. of Days(365/IT Ratio)
55 Days 63 days 58 Days
2006 2007 20085.2
5.4
5.6
5.8
6
6.2
6.4
6.6
6.8
INVENTORY TURNOVER RATIO
INVENTORY TURNOVER RATIO
Net Asset Turnover Ratio
It is based on the relationship between the cost of the good sold and assets/investments of a firm. A reference to this was made while working out the over-all profitability of a firm as reflected in its earning power. The assets turnover ratio howsoever defined, measures the efficiency of a firm in managing and utilizing its assets. The higher the turnover ratio, the more efficient the management and utilisation of the assets.The Return of 66.6% is very good and company is performing well. The Net Assets of the company are managed very well.
Net Asset Turnover Ratio =Net Sales/ Net Asset
JSPL Page 33

Particular 2008(in cr.) 2007(in cr.) 2006(in cr.)Net Sales 5410.75 3519.81 2590.25
Net Asset 8114.40 6419.49 4870.37 Ratio 66.6% 54.8% 53.18%
2006 2007 20080
10
20
30
40
50
60
70
NET ASSET TURNOVER RATIO
NET ASSET TURNOVER RATIO
Total Asset Turnover Ratio
The Return of 55.5% is very good and company is performing well. The Total Assets of the company are managed very well.
Total Assets Turnover Ratio = Net Sales / Total Asset
Particular 2008(in cr.) 2007(in cr.)
2006(in cr.)
Net Sales 5410.75 3519.81 2590.25
Total Asset
9735.21 7599.84 5768.48
Ratio 55.57% 46.31% 44.90%
JSPL Page 34
2006 2007 20080
10
20
30
40
50
60
TOTAL ASSET TURNOVER RATIO
TOTAL ASSET TURNOVER RATIO
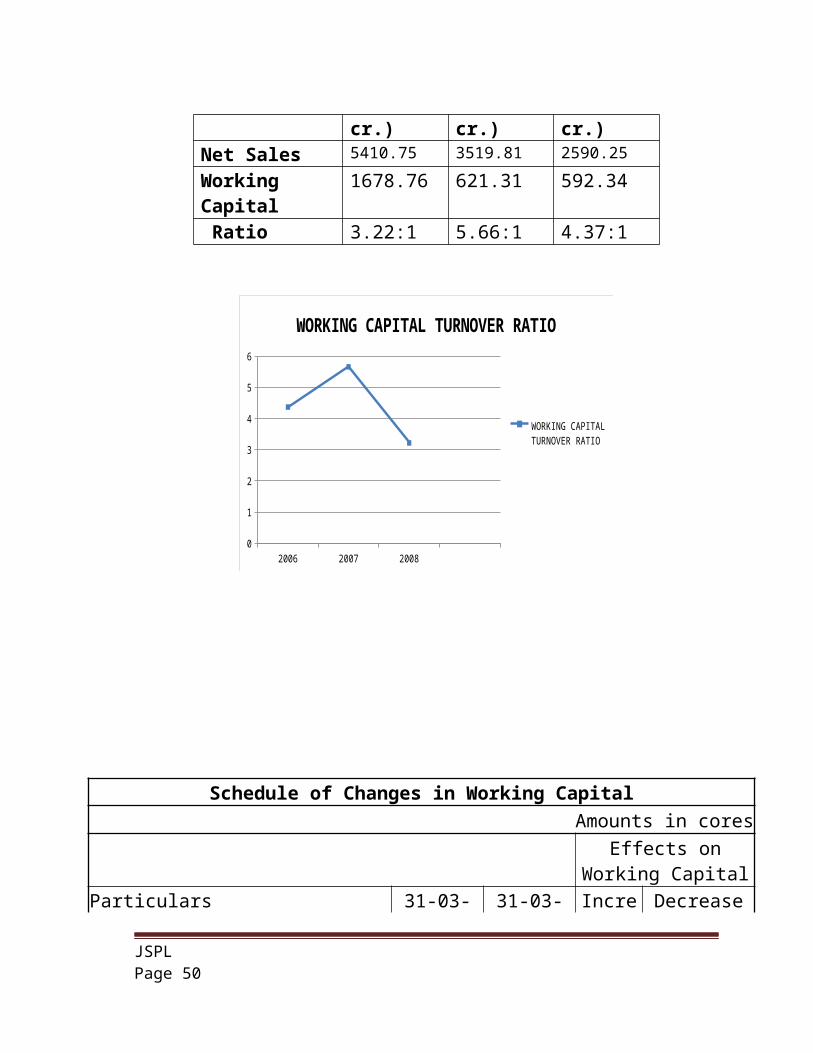
Working Capital Turnover Ratio
WC/T Ratio = Net Sales/Working capital
The Net Working Capital ratio is basically measure of firm’s liquidity. The Return of 3.23 times is very good and company is performing well. The Net Assets of the company are managed very well and 3.23 times of turnover is generated from the net working capital of the company annually. This also means that the company manages its working capital very efficiently.
Particular 2008(in cr.) 2007(in cr.)
2006(in cr.)
Net Sales 5410.75 3519.81 2590.25
Working Capital
1678.76 621.31 592.34
Ratio 3.22:1 5.66:1 4.37:1
JSPL Page 35
2006 2007 20080
1
2
3
4
5
6
WORKING CAPITAL TURNOVER RATIO
WORKING CAPITAL TURNOVER RATIO
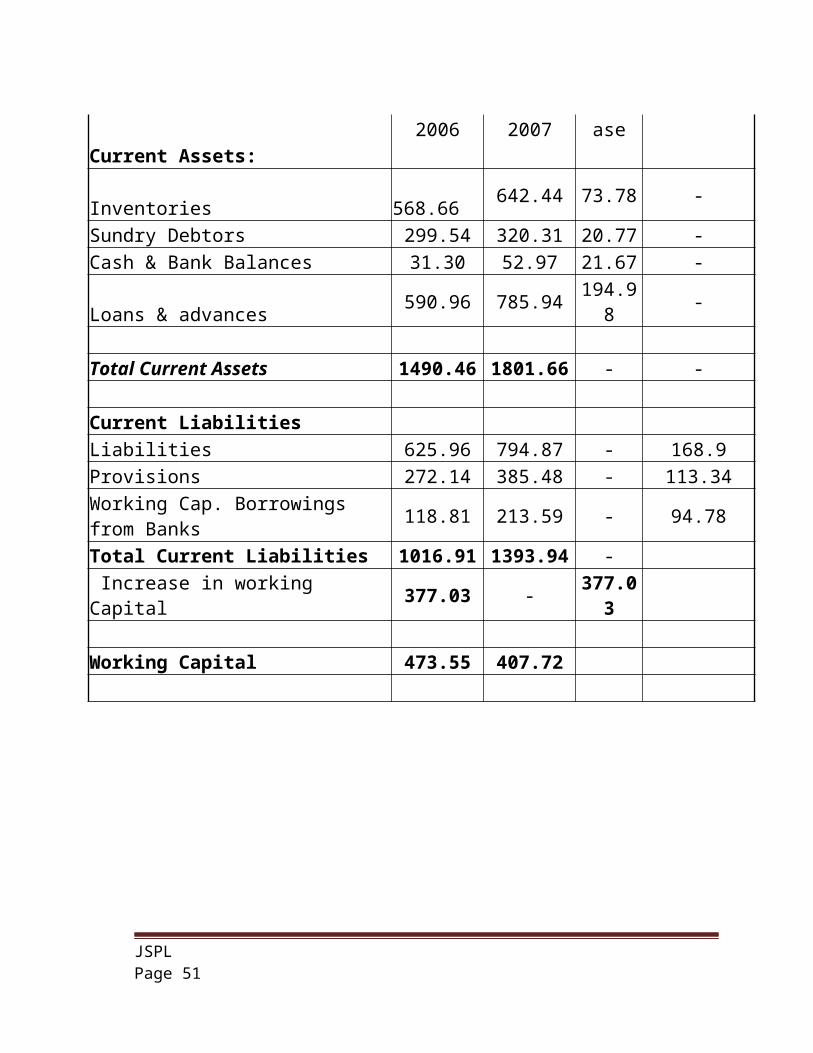
Schedule of Changes in Working Capital Amounts in cores
Effects on Working
CapitalParticulars 31-03-2006 31-03-2007 Increase DecreaseCurrent Assets: Inventories 568.66 642.44 73.78 -Sundry Debtors 299.54 320.31 20.77 -Cash & Bank Balances 31.30 52.97 21.67 -Loans & advances 590.96 785.94 194.98 - Total Current Assets 1490.46 1801.66 - - Current LiabilitiesLiabilities 625.96 794.87 - 168.9Provisions 272.14 385.48 - 113.34
JSPL Page 36

Working Cap. Borrowings from Banks 118.81 213.59 - 94.78Total Current Liabilities 1016.91 1393.94 - Increase in working Capital 377.03 - 377.03
Working Capital 473.55 407.72
Schedule of Changes in Working Capital Amounts in cores
Effects on Working
CapitalParticulars 31-03-2007 31-03-2008 Increase DecreaseCurrent Assets: Inventories 642.44 980.56 338.12 -Sundry Debtors 320.31 287.38 32.93Cash & Bank Balances 52.97 577.91 524.94 -Loans & advances 785.94 1453.72 667.78 - Total Current Assets 1801.66 3299.57 - -
JSPL Page 37

Current LiabilitiesLiabilities 794.87 1038.87 - 244Provisions 385.48 581.94 - 196.46Working Cap. Borrowings from Banks
213.59 44.25 169.34 -
Total Current Liabilities 1393.94 1665.06 - - Increase in Working Capital 271.12 - 271.12Working Capital
407.72 1634.51
Ratio Analysis Comparison of JSPL, Tata Steel & Sail for the year 2008
JSPL Page 38

Liquidity Ratio Current Ratio Quick Ratio
JSPL Page 39
Ratio JSPL TATA SAIL
Liquidity Ratios
Current 2.03:1 5.46:1 2.9:1
Quick 1.4:1 5.07:1 1.4:1
Leverage Ratios
Debt-Equity 1.03:1 .66:1 .13:1Interest Coverage Ratio 8.2:1 9.04:1 47.73:1Capital Employed to Net worth 2.03:1 1.66:1 1.13:1
Profitability Ratios
Gross Profit Margin 52.42% 40.86% 37.91%Net Profit Margin(before tax) 22.86% 31.84% 16.54%
Operating Ratio 39.96% 32.77% 39.97%Return On Investment 15.24% 9.95% 27.23%
Equity Related Ratios
Return on Equity 33.23% 17.27% 32.67%
Earning per Share Rs. 80.34 Rs. 67.17 Rs.18.24
Dividend Per Share 2.50 Rs 16 Rs Rs.3.70Dividend Payout 3.11% 23.8% 20.28%
Activity Ratios
Inventory Turn Over 6.66 Times 10.16 Times
5.84 Times
No. of Days 55 Days 36 Days 63 DaysNet Asset Turnover Ratio 66.6% 41.83% 142.74%Total Asset Turnover Ratio 55.57% 41.21% 107.73%
Working Capital Turnover 3.22Times .65Times 3.01 Times
Current Ratio
Particlar JSPL TATA SAIL
Current Assets 3299.57 36962.44 26762.76
Current Liablity
1620.81 6768.78 13544.50
CR Ratio 2.03:1 5.46:1 1.97:1
JSPL TATA SAIL0
1
2
3
4
5
6
CURRENT RATIO
CURRENT RATIO
Quick Ratio
Particlar JSPL TATA SAIL
JSPL Page 40

Current Assets(in cr.)
3299.57 36962.44 26762.76
Current Liablity(in cr.)
1620.81 6768.78 13544.50
Inventory(in cr)
980.56 2047.31 6954.08
CR Ratio 1.43:1 5.15:1 1.46:1
JSPL TATA SAIL0
1
2
3
4
5
6
QUICK RATIO
QUICK RATIO
Leverage Ratio/Capital Structure Ratio Debt-Equity Ratio
Interest Coverage Ratio
Capital employed to Net Worth
JSPL Page 41
Debt-Equity Ratio
particular JSPL TATA SAILDebt (in cr.) 3863.35 18,021.69 3887.64
Equity(in cr.)
3756.38 27,300.73 23287.27
D/E Ratio 1.02:1 .66:1 .17:1
JSPL TATA SAIL0
0.2
0.4
0.6
0.8
1
1.2
D/E Ratio
D/E Ratio
Interest Coverage Ratio
Particular JSPL TATA SAILInterest (in cr.) 208.59 878.70 245.41
EBIT (EBT+Interest) (in cr.)
1711.10 7945.06 11714.14
Interest coverage Ratio 8.2:1 9.04:1 47.73:1
JSPL Page 42
JSPL TATA SAIL0
10
20
30
40
50
60
Interest coverage Ratio
Interest coverage Ratio
Capital Employed to Net Worth
Particular JSPL TATA SAILCapital Employed(Debt +Net Worth)
7585.45
45322.42 26108.81
Net Worth 3722.12
27300.73 23063.57
C\NRatio 2.03:1 1.66:1 1.13:1
JSPL TATA SAIL0
0.5
1
1.5
2
2.5
C\NRatio
C\NRatio
JSPL Page 43

Profitability Ratio Gross Profit Ratio
Operating Profit Ratio
Net Profit Ratio
Gross Profit Ratio
Particular JSPL TATA SAILGross Profit(in cr.) 2848.55 8048.04 14978.37
Net Sales(in cr.) 5410.75 19,693.28
39508.45
G\P Ratio 52.42% 40.86% 37.91%
JSPL TATA SAIL0.00%
10.00%
20.00%
30.00%
40.00%
50.00%
60.00%G\P Ratio
G\P Ratio
Operating Profit Ratio
Particular JSPL TATA SAILOperating Profit(PBIDT) (in cr.)
2162.61 7872.54 12949.62
Net Sales(in cr.) 5410.75 19,693.28 39508.45O\P Ratio 39.96% 39.97% 32.77%
JSPL Page 44

JSPL TATA SAIL0
5
10
15
20
25
30
35
40
45
0perating Profit
0perating Profit
Net Profit Ratio
Particular JSPL TATA SAILPAT(in cr.) 1236.96 4,687.03 7536.78
Net Sales(in cr.) 5410.75
19,693.28 39508.45
N\P Ratio 22.86% 23.80% 19.07%
JSPL TATA SAIL0
5
10
15
20
25
Net Profit Ratio
Net Profit Ratio
JSPL Page 45

Return on Investment
Particular JSPL TATA SAILPAT (in cr.) 1236.96 4,687.0
37536.78
Net Assets (in cr.)
8114.40 47,075.52
27677.41
ROI Ratio 15.24% 9.95% 27.23%
JSPL TATA SAIL0.00%
5.00%
10.00%
15.00%
20.00%
25.00%
30.00%
ROI Ratio
ROI Ratio
Equity Related Ratio
Return on Equity
Particular JSPL TATA SAILPAT(in cr.) 1236.96 4,687.03 7536.78Net Worth(in cr.) 3722.12 27,145.62 23063.57R\E Ratio 33.23% 17.26% 32.67%
JSPL Page 46

JSPL TATA SAIL0.00%
5.00%
10.00%
15.00%
20.00%
25.00%
30.00%
35.00%
R\E Ratio
R\E Ratio
Earning Per Share
Particular JSPL TATA SAILPAT(in cr.) 1236.96 4,687.03 7536.78No. of Share 153,961,34
0697,748,601 4,130,400,545
R\E Ratio 80.34 Rs 67.17 Rs 18.25 Rs
Dividend Per Share
Particular JSPL TATA SAILDividend Declared(in
cr.)39.93 1167.86 1528.25
No. of Share 153,961,340 697,748,601 4,130,400,545DPS 2.50Rs 16 Rs 3.70 Rs
Dividend Payout Ratio 3.11% 23.8% 20.27%
JSPL Page 47

Activity Ratio
Inventory Turn Over
Net Asset Turn Over
Total Asset Turnover Ratio
Working Capital Turnover
Inventory Turnover Ratio
Particular JSPL TATA SAILNet Sales(in cr.) 5410.75 19,693.
2839508.45
Avg. Inventory(in cr.)
811.50 1937.43 6754.35
I\T Ratio 6.66 10.16 5.84No. of Days
(365/IT Ratio)55 Days 36 Days 63 Days
JSPL Page 48

JSPL TATA SAIL0
2
4
6
8
10
12
I\T Ratio
I\T Ratio
Net Asset Turnover Ratio
Particular JSPL TATA SAILNet Sales(in cr.) 5410.75 19,693.
2839508.45
Net Asset(in cr.) 8114.40
47,075.52
27677.41
Ratio 66.6% 41.83% 142.74%
JSPL TATA SAIL0
20
40
60
80
100
120
140
160
NET ASSET TURNOVER RATIO
NET ASSET TURNOVER RATIO
JSPL Page 49
Total Asset Turnover Ratio
Particular JSPL TATA SAILNet Sales(in cr.) 5410.75 19,693.
2839508.45
Total Asset(in cr.) 9735.21
53844.3 40876.16
Ratio 55.57% 36.57% 96.65%
JSPL TATA SAIL0
20
40
60
80
100
120
TOTAL ASSET TURNOVER RATIO
TOTAL ASSET TURNOVER RATIO
Working Capital Turnover Ratio
Particular JSPL TATA SAILNet Sales(in cr.) 5410.75 19,693.
2839508.45
Working Capital(in cr.) 1678.76 30,193.66
13118.87
Ratio 3.22:1 .65:1 3.01:1
JSPL Page 50
JSPL TATA SAIL0
0.5
1
1.5
2
2.5
3
3.5
WORKING CAPITAL TURNOVER RATIO
WORKING CAPITAL TURNOVER RATIO
JSPL Page 51