Report on Violent Crimes Committed Against Senior Citizens...
27
Report on Violent Crimes Committed Violent Crimes Committed Violent Crimes Committed Violent Crimes Committed Violent Crimes Committed Against Senior Citizens Against Senior Citizens Against Senior Citizens Against Senior Citizens Against Senior Citizens in California, 1998 State of California Office of the Attorney General Bureau of Criminal Information and Analysis CRIMINAL JUSTICE STATISTICS CENTER RIMINAL JUSTICE STATISTICS CENTER RIMINAL JUSTICE STATISTICS CENTER RIMINAL JUSTICE STATISTICS CENTER RIMINAL JUSTICE STATISTICS CENTER REPORT SERIES REPORT SERIES REPORT SERIES REPORT SERIES REPORT SERIES Volume 1, Number 4 ■ January 2000 ■ CJSC Home P a g e ■ CJSC Pub lica tions ■ Attor ne y Gener al’ s Home P a g e
Transcript of Report on Violent Crimes Committed Against Senior Citizens...
Report onViolent Crimes CommittedViolent Crimes CommittedViolent Crimes CommittedViolent Crimes CommittedViolent Crimes CommittedAgainst Senior CitizensAgainst Senior CitizensAgainst Senior CitizensAgainst Senior CitizensAgainst Senior Citizensin California, 1998
State of CaliforniaOffice of the Attorney GeneralBureau of Criminal Information and AnalysisCCCCCRIMINAL JUSTICE STATISTICS CENTERRIMINAL JUSTICE STATISTICS CENTERRIMINAL JUSTICE STATISTICS CENTERRIMINAL JUSTICE STATISTICS CENTERRIMINAL JUSTICE STATISTICS CENTERREPORT SERIESREPORT SERIESREPORT SERIESREPORT SERIESREPORT SERIES
Volume 1, Number 4 ■ January 2000
■ CJSC Home Page ■ CJSC Publications
■ Attorney General’s Home Page
Report onViolent Crimes CommittedAgainst Senior Citizensin California, 1998
Bill Lockyer, Attorney GeneralCalifornia Department of JusticeDivision of Criminal Justice Information ServicesBureau of Criminal Information and AnalysisCriminal Justice Statistics Center
ATTORNEY GENERAL ON THE INTERNET ➤ http://caag.state.ca.us

Report onViolent Crimes Committed
Against Senior Citizensin
California, 1998
CALIFORNIA DEPARTMENT OF JUSTICEBill Lockyer, Attorney General
DIVISION OF CRIMINAL JUSTICE INFORMATION SERVICESNick Dedier, Director
BUREAU OF CRIMINAL INFORMATION AND ANALYSISDoug Smith, Chief
CRIMINAL JUSTICE STATISTICS CENTERMike Acosta, Assistant ChiefSteve Galeria, Manager
STATISTICAL DATA CENTERRoy V. Lewis, Ph.D., Manager
PREPARED BYLaura Towse, Research Analyst
ACKNOWLEDGEMENTS:
Marie Herbert, Research AnalystShirley Anderson, Crime Studies TechnicianLaTanya Henley, Crime Studies Technician
The role of the Criminal Justice Statistics Center is:
Criminal Justice Statistics Center4949 BroadwayP.O. Box 903427Sacramento, CA 94203-4270
To promote the responsible presentation and use of crime statistics.
To collect, analyze, and report statistical data, which provide valid measures of crime and the criminal justice process;
To examine these data on an ongoing basis to better describe crime and the criminal justice system;
468
10121416182224
1 Violent Crimes Committed Against the Population & Senior Citizens, 1988-1998………. 82 103 124 Robberies Committed Against the Population & Senior Citizens, 1988-1998……………. 145 166 18
1 92 93 114 115 Forcible Rapes Reported, 1988-1998…………….………………………….……………. 136 Forcible Rape Rates, 1988-1998………………………………………………………….. 137 Robberies Reported, 1988-1998………………………………………………………….. 158 Robbery Rates, 1988-1998………………………………..………………………………. 159 Aggravated Assaults Reported, 1988-1998…………….…………………………………. 1710 Aggravated Assault Rates, 1988-1998………...…….……………………………………. 1711 Violent Crimes Reported, 1988……………………………………………………………. 2012 Violent Crimes Reported, 1998.……………..…………………………………………….. 21
A24
B25
Violent Crimes Committed Against Senior Citizens, by Cities
Violent Crimes Committed Against Senior Citizens by County
with Populations over 100,000, 1988-1998, and Percent Change………………………...
CONTENTS
Tables
Figures
Appendices
Aggravated Assaults Committed Against the Population & Senior Citizens, 1988-1998…Total Violent Crimes Reported, 1988-1998..……......…...…………………….…………..
1988-1998, and Percent Change….…………...………...…………………………………
Highlights……………………………………………………………………………………….Introduction……………………………………………………………………………………..Total Violent Crimes……………………………………………………………………………Homicide Crimes………………………………………………………………………………..Forcible Rape Crimes…………………………………………………………………………..
Aggravated Assault Crimes……………………………………………………………………..Relative Impact of Crime on Senior Citizens…….…….……………………………………….
Robbery Crimes…………………………………………………………………………………
Summary of Findings...……………………….…………………………………………………
Violent Crimes Reported, 1988-1998………………………….…………………………..Violent Crime Rates, 1988-1998............…………………………………………………..Homicides Reported, 1988-1998……………………………………….…………………Homicide Rates, 1988-1998…..……..…………….…………..…………………………..
Appendices……………………………………………….……………………….…………….
Forcible Rapes Committed Against the Population & Senior Citizens, 1988-1998……….Homicides Committed Against the Population & Senior Citizens, 1988-1998……………
3
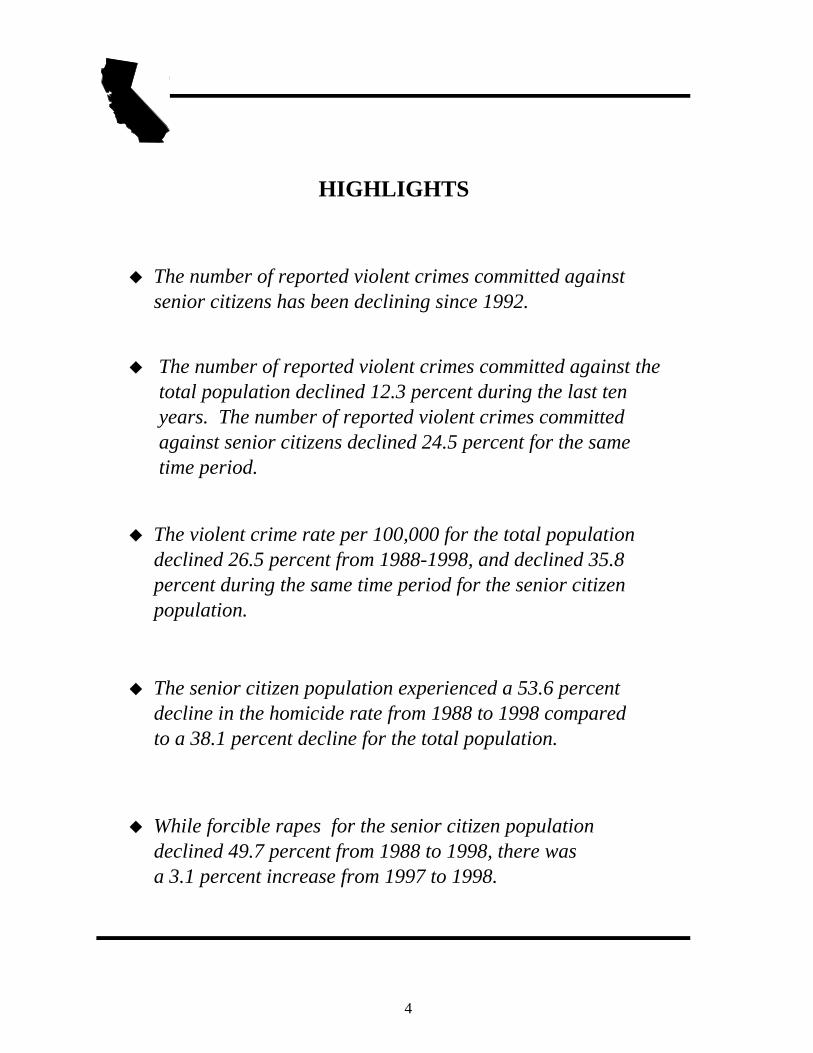
u While forcible rapes for the senior citizen population declined 49.7 percent from 1988 to 1998, there was a 3.1 percent increase from 1997 to 1998.
HIGHLIGHTS
u The number of reported violent crimes committed against senior citizens has been declining since 1992.
u The number of reported violent crimes committed against the total population declined 12.3 percent during the last ten years. The number of reported violent crimes committed against senior citizens declined 24.5 percent for the same time period.
u The violent crime rate per 100,000 for the total population declined 26.5 percent from 1988-1998, and declined 35.8 percent during the same time period for the senior citizen population.
u The senior citizen population experienced a 53.6 percent decline in the homicide rate from 1988 to 1998 compared to a 38.1 percent decline for the total population.
4
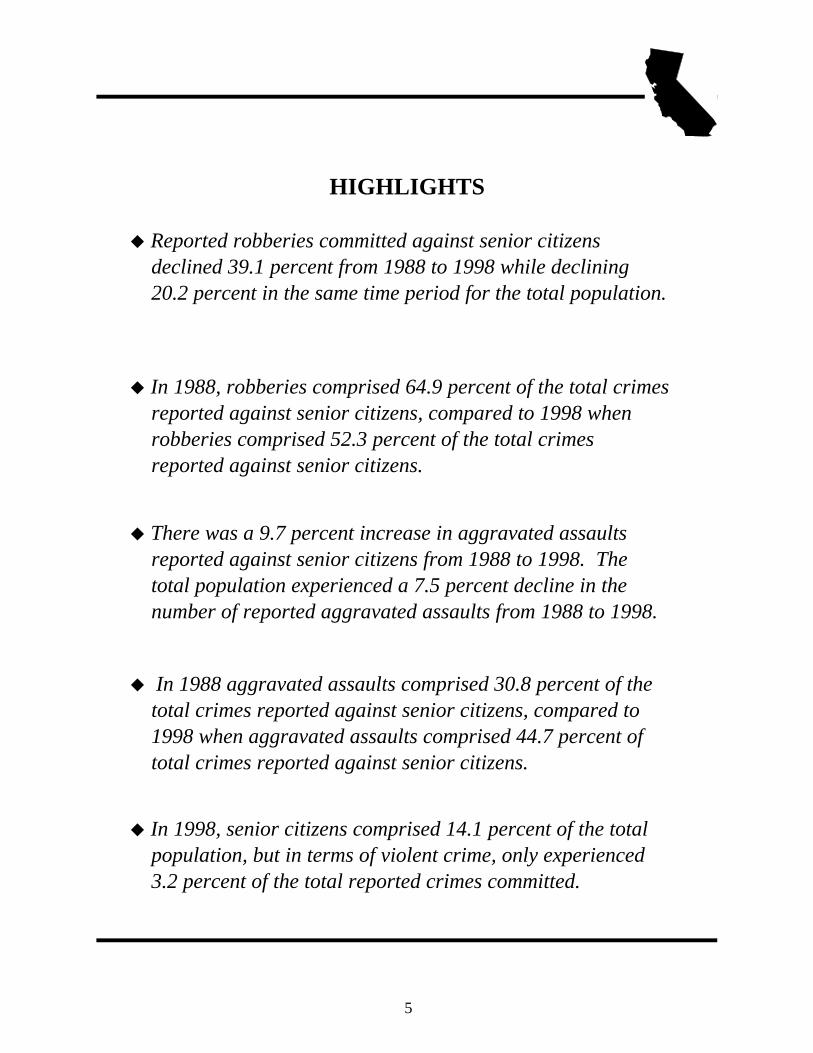
u In 1998, senior citizens comprised 14.1 percent of the total population, but in terms of violent crime, only experienced 3.2 percent of the total reported crimes committed.
HIGHLIGHTS
u In 1988 aggravated assaults comprised 30.8 percent of the total crimes reported against senior citizens, compared to 1998 when aggravated assaults comprised 44.7 percent of total crimes reported against senior citizens.
u Reported robberies committed against senior citizens declined 39.1 percent from 1988 to 1998 while declining 20.2 percent in the same time period for the total population.
u There was a 9.7 percent increase in aggravated assaults reported against senior citizens from 1988 to 1998. The total population experienced a 7.5 percent decline in the number of reported aggravated assaults from 1988 to 1998.
u In 1988, robberies comprised 64.9 percent of the total crimes reported against senior citizens, compared to 1998 when robberies comprised 52.3 percent of the total crimes reported against senior citizens.
5
Introduction
..
.
REPORT ON VIOLENT CRIMES COMMITTED
AGAINST SENIOR CITIZENS
IN
CALIFORNIA, 1998
This report contains information about reported violent crimes committed against members of the population who are 60 years of age and older. The purpose of this report is to provide policy makers and the public with accurate and complete statistical information by organizing and displaying data about violent crimes against senior citizens and the total population. Data by county and by cities with populations over 100,000 are also available in the Appendices.
This report is based on violent crime information reported from local city police departments, county sheriff offices, the California Highway Patrol, and other law enforcement agencies who report monthly to the Department of Justice. The four types of violent crimes which are reported, pursuant to the Federal Bureau of Investigation's (FBI) Uniform Crime Reporting (UCR) Program guidelines, are: homicide, forcible rape, robbery, and aggravated assault.
Homicide: the willful (nonnegligent) killing of one human being by another. Murder and nonnegligent manslaughter comprise this category. § 128, 187(a), 189, 192(a), 192(b), 193(a), 193(b), 273ab, 399, and 12310(a).
Forcible Rape: the carnal knowledge of a female forcibly and against her will (the UCR definition of forcible rape states that only females can be victims). Assaults or attempts to commit rape by force or threat of force are included. § 220, 261, 261(a)(1), 261(a)(2), 261(a)(3), 261(a)(4), 261(a)(5), 261(a)(6), 261(a)(7), 262(a)(1), 262(a)(2), 262(a)(3), 262(a)(4), 262(a)(5), 264.1, 266c, 269(a)(1), and 664/261.
Robbery: the taking or attempting to take anything of value from the care, custody, or control of a person or persons by force or threat of force or violence and/or by putting the victim in fear. § 211, 212.5(a), 212.5(b), 212.5c, 213(b), 214, 215(a), 664/211, 664/212.5(a), and 664/212.5(b).
6
Introduction (continued)
.
Aggravated Assault: the unlawful attack or attempted attack by one person upon another for the purpose of inflicting severe or aggravated bodily injury. This type of assault is usually accompanied by the use of a weapon or by means likely to produce death or great bodily harm. § 69, 71, 76(a), 95.1, 139(a), 140, 146e(b), 148(b), 148c, 148(d)(1), 148.1(a), 148.1(b), 148.1c, 148.1(d), 148.3(b), 148.4(b)(1), 148.4(b)(2), 148.10(a), 149, 151(a)(2), 186.26(a), 203, 205, 206, 217.1(a), 217.1(b), 218, 219, 219.1, 291.2, 222, 241.1, 241.4, 241.7, 242, 242/243, 243(c), 243(d), 243.1, 243.3, 243.6, 243.7, 244, 244.5(b), 244.5(c), 245(a)(1), 245(a)(2), 245(a)(3), 245(b), 245(c), 245(d)(1), 245(d)(2), 245(d)(3), 245.2, 245.3, 245.5(a), 245.5(b), 245.5(c), 246, 246.3, 247(a), 247(b), 247.5, 273a(a), 273d(a), 273.5(a), 347(a), 347(b), 368(a), 375(a), 375(d), 401, 405a, 405b, 417(b), 417(c), 417.1, 417.3, 417.6(a), 417.8, 422, 422.7(a), 588a, 601(a)(1), 601(a)(2), 625c, 664/187(a), 664/189, 1768.8(b), 1808.4(d), 4131.5, 4500, 4501, 4501.5, 11412, 11413(a), 12303, 12303.1(a), 12303.1(b), 12303.1(c), 12303.2, 12303.3, 12304, 12308, 12309, 12310(b), 12312, 12355(a), 12355(b), and 15656(a).
For crime-reporting purposes, under the FBI's UCR Program guidelines, when agencies report the number of offenses for homicides, forcible rapes, and aggravated assaults, they are recorded as one incident per victim. For example, if a man enters a store and kills two women, two homicide incidents are recorded. Robberies, however are recorded as one incident and the actual number of victims is not recorded. For example, if a man enters a store and robs seven customers, only one robbery would be recorded. When agencies report robberies to the VCASC database however, the actual number of senior citizen robbery victims is recorded.
This report compares the four violent crimes reported under the FBI's UCR guidelines with the four violent crimes in the database known as Violent Crimes Committed Against Senior Citizens (VCASC), which is reported in accordance with Senate Concurrent Resolution No. 64, Chapter 147, 1982, concerning victims of violent crime who are 60 years of age or older.
Another factor the reader should consider is that under the FBI's UCR Program guidelines, in the case of multiple offenses being committed simultaneously, only the most serious offense is reported to the Department of Justice. Therefore, totals should not be interpreted as the actual number of violent crimes committed because it is possible that in some cases, more than one crime may have been committed.
7
Total Violent Crimes
YearTotal
population
Total violent crimes
reported
Rate per
100,000
Percent change in rate from previous
year
Senior citizen
population
Senior citizen
percent of population
Senior citizen violent crimes
reported
Rate per
100,000
Percent change in rate from previous
year
1998 33,494,000 229,766 686.0 -12.2 4,723,548 14.1 7,333 155.2 -15.5
1997 32,957,000 257,409 781.0 -7.9 4,640,908 14.1 8,519 183.6 -7.6
1996 32,383,000 274,675 848.2 -10.8 4,560,834 14.1 9,058 198.6 -8.0
1995 32,063,000 304,998 951.2 -4.2 4,506,030 14.1 9,728 215.9 -11.1
1994 32,140,000 318,946 992.4 -6.3 4,461,735 13.9 10,834 242.8 -13.8
1993 31,742,000 336,100 1,058.8 -4.1 4,435,388 14.0 12,500 281.8 -1.6
1992 31,300,000 345,508 1,103.9 2.2 4,396,780 14.0 12,590 286.3 6.3
1991 30,646,000 330,916 1,079.8 2.3 4,326,788 14.1 11,651 269.3 2.7
1990 29,557,836 311,923 1,055.3 6.9 4,232,094 14.3 11,096 262.2 5.2
1989 28,771,207 284,015 987.2 5.7 4,096,768 14.2 10,208 249.2 3.1
1988 28,060,746 261,990 933.7 - 4,014,965 14.3 9,710 241.8 -
Notes: Rates are based on population estimates provided by the Demographic Research Unit, California Department of Finance. Rates are calculated by dividing the number of crimes by the respective population. The result is multiplied by 100,000. Percentages may not add to 100.0 due to independent rounding.
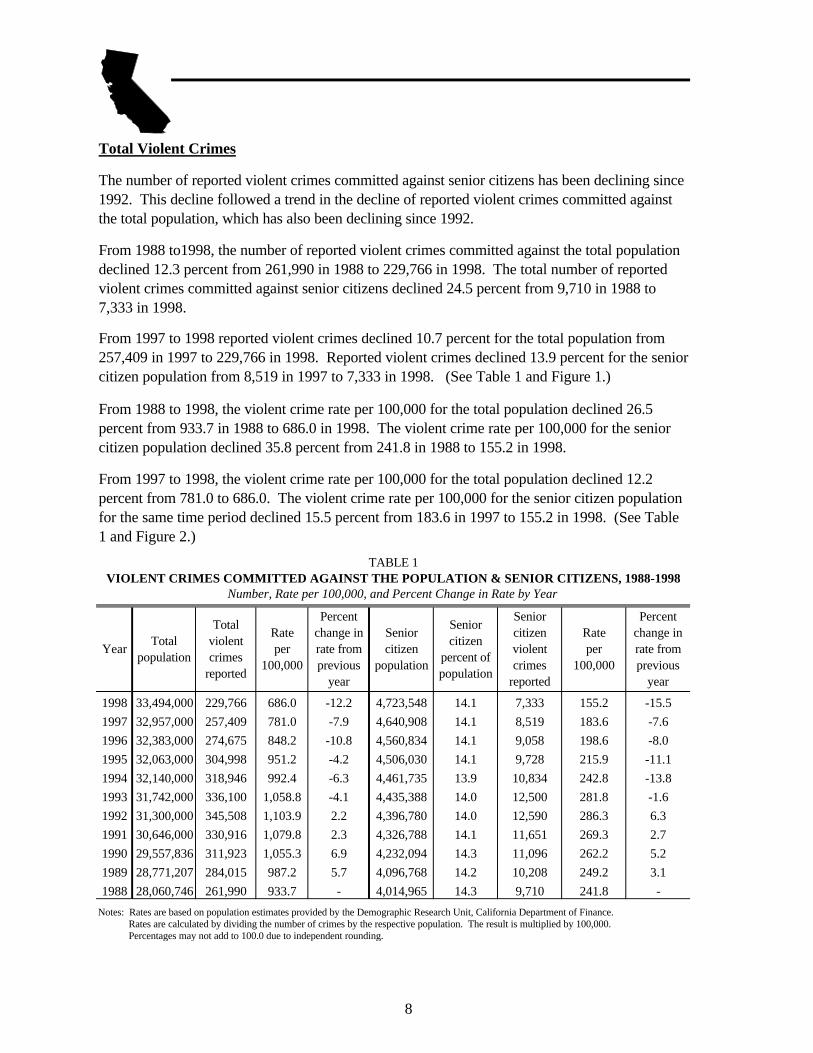
The number of reported violent crimes committed against senior citizens has been declining since 1992. This decline followed a trend in the decline of reported violent crimes committed against the total population, which has also been declining since 1992.
From 1988 to1998, the number of reported violent crimes committed against the total population declined 12.3 percent from 261,990 in 1988 to 229,766 in 1998. The total number of reported violent crimes committed against senior citizens declined 24.5 percent from 9,710 in 1988 to 7,333 in 1998.
From 1997 to 1998 reported violent crimes declined 10.7 percent for the total population from 257,409 in 1997 to 229,766 in 1998. Reported violent crimes declined 13.9 percent for the senior citizen population from 8,519 in 1997 to 7,333 in 1998. (See Table 1 and Figure 1.)
Number, Rate per 100,000, and Percent Change in Rate by YearVIOLENT CRIMES COMMITTED AGAINST THE POPULATION & SENIOR CITIZENS, 1988-1998
TABLE 1
From 1988 to 1998, the violent crime rate per 100,000 for the total population declined 26.5 percent from 933.7 in 1988 to 686.0 in 1998. The violent crime rate per 100,000 for the senior citizen population declined 35.8 percent from 241.8 in 1988 to 155.2 in 1998.
From 1997 to 1998, the violent crime rate per 100,000 for the total population declined 12.2 percent from 781.0 to 686.0. The violent crime rate per 100,000 for the senior citizen population for the same time period declined 15.5 percent from 183.6 in 1997 to 155.2 in 1998. (See Table 1 and Figure 2.)
8
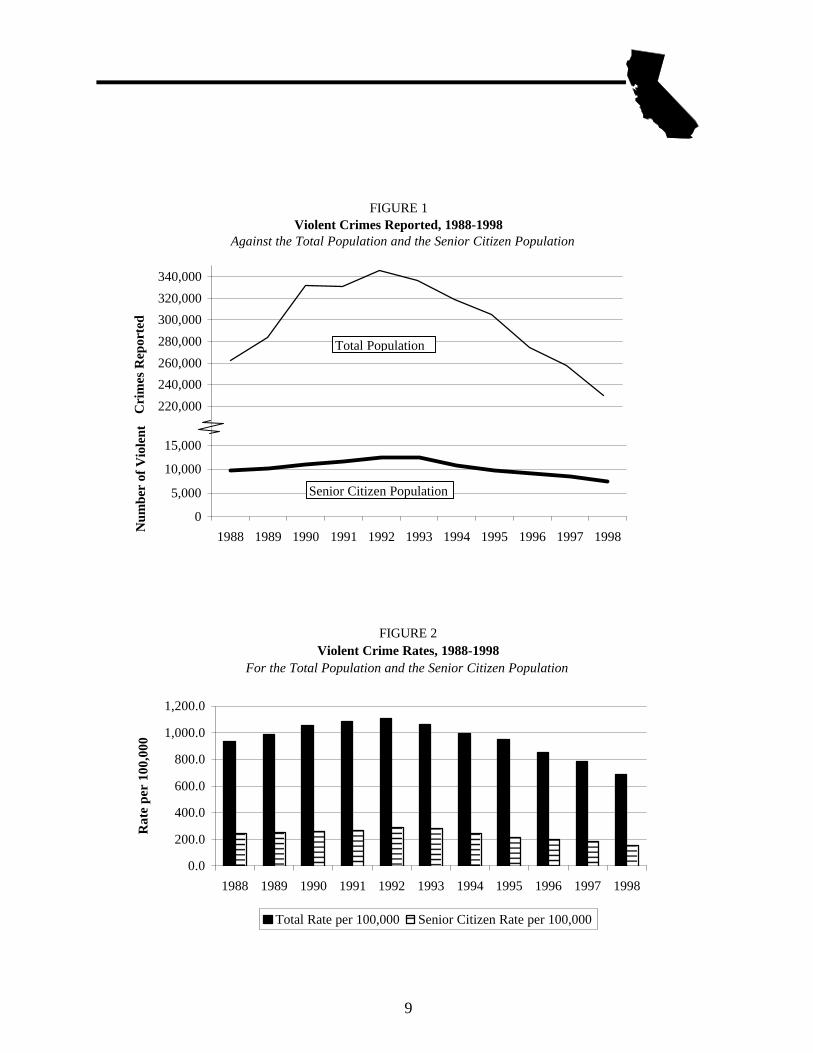
FIGURE 1Violent Crimes Reported, 1988-1998
Against the Total Population and the Senior Citizen Population
220,000
240,000
260,000
280,000
300,000
320,000
340,000
Cri
mes
Rep
orte
d
0
5,000
10,000
15,000
1988 1989 1990 1991 1992 1993 1994 1995 1996 1997 1998
Num
ber
of V
iole
nt
Total Population
Senior Citizen Population
FIGURE 2 Violent Crime Rates, 1988-1998
For the Total Population and the Senior Citizen Population
0.0
200.0
400.0
600.0
800.0
1,000.0
1,200.0
1988 1989 1990 1991 1992 1993 1994 1995 1996 1997 1998
Rat
e pe
r 10
0,00
0
Total Rate per 100,000 Senior Citizen Rate per 100,000
9
YearTotal
population
Total homicides reported
Rate per
100,000
Percent change in rate from previous
year
Senior citizen
population
Senior citizen
percent of population
Senior citizen
homicides reported
Rate per
100,000
Percent change in rate from previous
year
1998 33,494,000 2,170 6.5 -16.7 4,723,548 14.1 121 2.6 -13.3
1997 32,957,000 2,579 7.8 -13.3 4,640,908 14.1 139 3.0 20.0
1996 32,383,000 2,910 9.0 -18.2 4,560,834 14.1 114 2.5 -19.4
1995 32,063,000 3,530 11.0 -4.3 4,506,030 14.1 140 3.1 -3.1
1994 32,140,000 3,699 11.5 -10.9 4,461,735 13.9 143 3.2 -36.0
1993 31,742,000 4,095 12.9 3.2 4,435,388 14.0 220 5.0 13.6
1992 31,300,000 3,920 12.5 -0.8 4,396,780 14.0 192 4.4 18.9
1991 30,646,000 3,876 12.6 4.1 4,326,788 14.1 161 3.7 -19.6
1990 29,557,836 3,562 12.1 10.0 4,232,094 14.3 193 4.6 2.2
1989 28,771,207 3,159 11.0 4.8 4,096,768 14.2 184 4.5 -19.6
1988 28,060,746 2,947 10.5 - 4,014,965 14.3 226 5.6 -
Notes: Rates are based on population estimates provided by the Demographic Research Unit, California Department of Finance. Rates are calculated by dividing the number of crimes by the respective population. The result is multiplied by 100,000. Percentages may not add to 100.0 due to independent rounding.
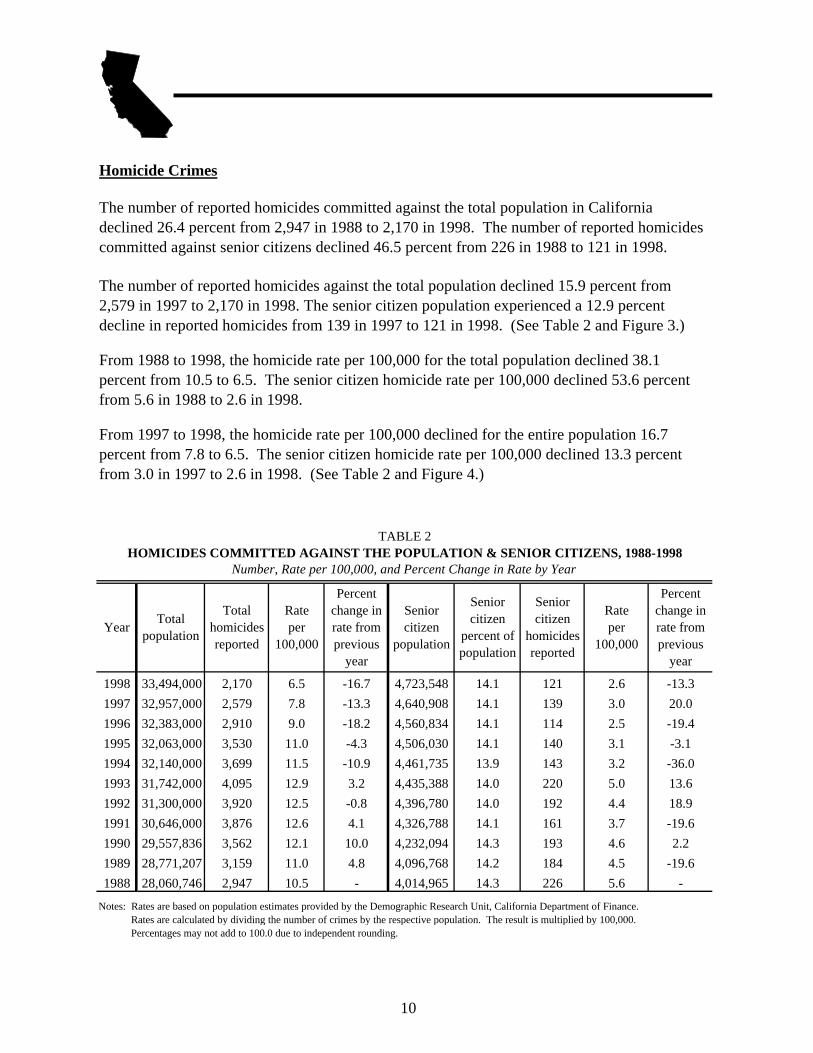
Homicide Crimes
TABLE 2HOMICIDES COMMITTED AGAINST THE POPULATION & SENIOR CITIZENS, 1988-1998
Number, Rate per 100,000, and Percent Change in Rate by Year
The number of reported homicides committed against the total population in California declined 26.4 percent from 2,947 in 1988 to 2,170 in 1998. The number of reported homicides committed against senior citizens declined 46.5 percent from 226 in 1988 to 121 in 1998.
The number of reported homicides against the total population declined 15.9 percent from 2,579 in 1997 to 2,170 in 1998. The senior citizen population experienced a 12.9 percent decline in reported homicides from 139 in 1997 to 121 in 1998. (See Table 2 and Figure 3.)
From 1988 to 1998, the homicide rate per 100,000 for the total population declined 38.1 percent from 10.5 to 6.5. The senior citizen homicide rate per 100,000 declined 53.6 percent from 5.6 in 1988 to 2.6 in 1998.
From 1997 to 1998, the homicide rate per 100,000 declined for the entire population 16.7 percent from 7.8 to 6.5. The senior citizen homicide rate per 100,000 declined 13.3 percent from 3.0 in 1997 to 2.6 in 1998. (See Table 2 and Figure 4.)
10
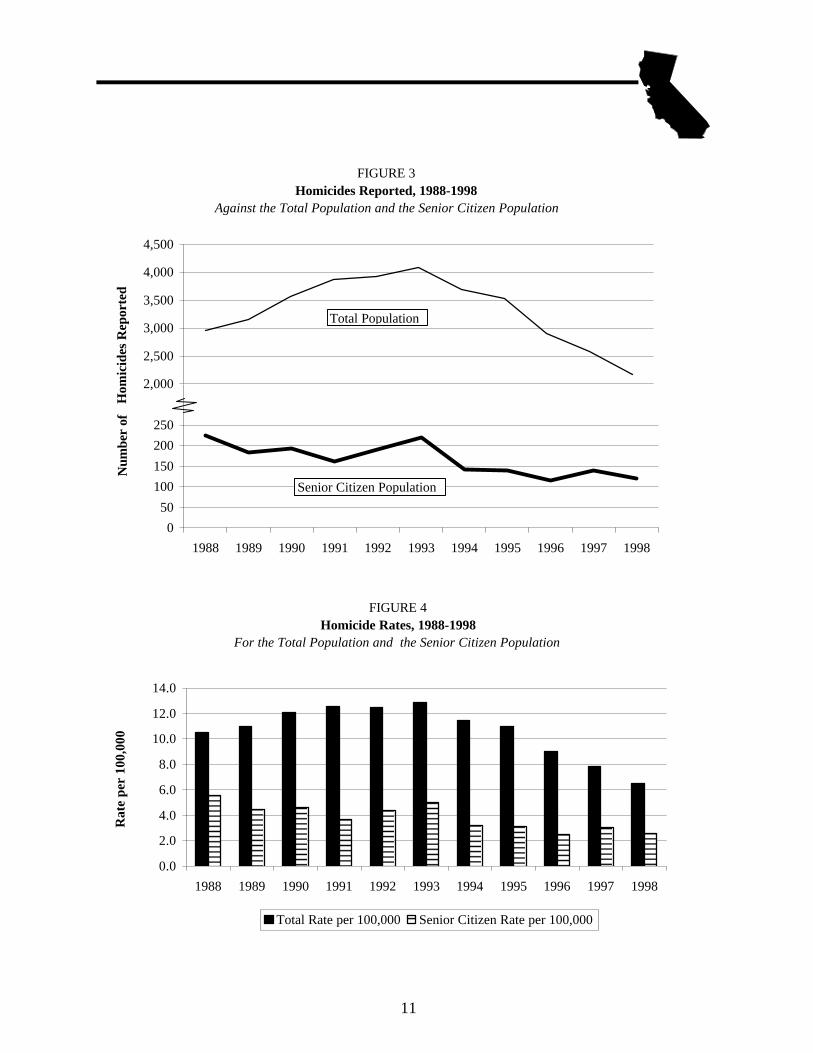
FIGURE 4 Homicide Rates, 1988-1998
For the Total Population and the Senior Citizen Population
0.0
2.0
4.0
6.0
8.0
10.0
12.0
14.0
1988 1989 1990 1991 1992 1993 1994 1995 1996 1997 1998
Rat
e pe
r 10
0,00
0
Total Rate per 100,000 Senior Citizen Rate per 100,000
FIGURE 3Homicides Reported, 1988-1998
Against the Total Population and the Senior Citizen Population
2,000
2,500
3,000
3,500
4,000
4,500
Hom
icid
es R
epor
ted
0
50
100
150
200
250
1988 1989 1990 1991 1992 1993 1994 1995 1996 1997 1998
Num
ber
of
Total Population
Senior Citizen Population
11
YearTotal
population
Total forcible rapes
reported
Rate per
100,000
Percent change in rate from previous
year
Senior citizen
population
Senior citizen
percent of population
Senior citizen forcible rapes
reported
Rate per
100,000
Percent change in rate from previous
year
1998 33,494,000 9,777 29.2 -5.5 4,723,548 14.1 99 2.1 0.0
1997 32,957,000 10,182 30.9 -2.2 4,640,908 14.1 96 2.1 -16.0
1996 32,383,000 10,238 31.6 -4.0 4,560,834 14.1 115 2.5 13.6
1995 32,063,000 10,550 32.9 -3.5 4,506,030 14.1 98 2.2 0.0
1994 32,140,000 10,960 34.1 -7.8 4,461,735 13.9 100 2.2 -21.4
1993 31,742,000 11,754 37.0 -9.1 4,435,388 14.0 122 2.8 -15.2
1992 31,300,000 12,751 40.7 -3.6 4,396,780 14.0 147 3.3 3.1
1991 30,646,000 12,942 42.2 -1.9 4,326,788 14.1 140 3.2 -3.0
1990 29,557,836 12,716 43.0 3.4 4,232,094 14.3 140 3.3 -15.4
1989 28,771,207 11,956 41.6 -0.7 4,096,768 14.2 161 3.9 -20.4
1988 28,060,746 11,771 41.9 - 4,014,965 14.3 197 4.9 -
Notes: Rates are based on population estimates provided by the Demographic Research Unit, California Department of Finance. Rates are calculated by dividing the number of crimes by the respective population. The result is multiplied by 100,000. Percentages may not add to 100.0 due to independent rounding.
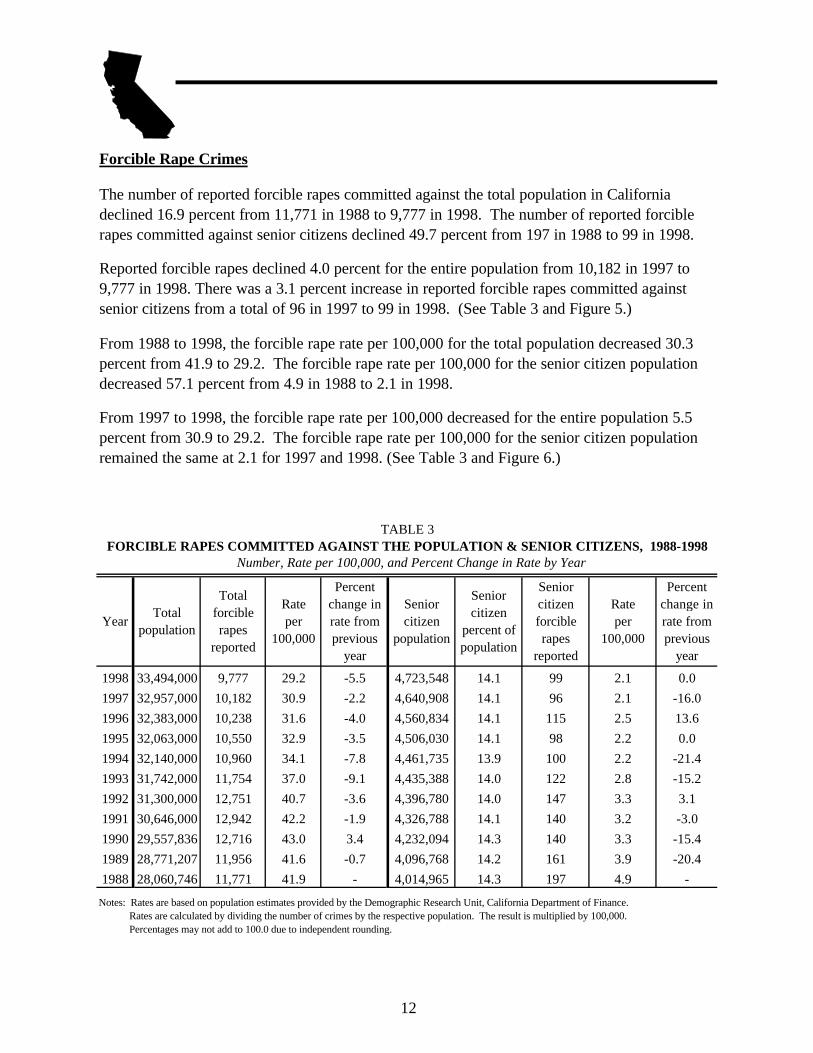
Forcible Rape Crimes
FORCIBLE RAPES COMMITTED AGAINST THE POPULATION & SENIOR CITIZENS, 1988-1998Number, Rate per 100,000, and Percent Change in Rate by Year
The number of reported forcible rapes committed against the total population in California declined 16.9 percent from 11,771 in 1988 to 9,777 in 1998. The number of reported forcible rapes committed against senior citizens declined 49.7 percent from 197 in 1988 to 99 in 1998.
Reported forcible rapes declined 4.0 percent for the entire population from 10,182 in 1997 to 9,777 in 1998. There was a 3.1 percent increase in reported forcible rapes committed against senior citizens from a total of 96 in 1997 to 99 in 1998. (See Table 3 and Figure 5.)
From 1988 to 1998, the forcible rape rate per 100,000 for the total population decreased 30.3 percent from 41.9 to 29.2. The forcible rape rate per 100,000 for the senior citizen population decreased 57.1 percent from 4.9 in 1988 to 2.1 in 1998.
From 1997 to 1998, the forcible rape rate per 100,000 decreased for the entire population 5.5 percent from 30.9 to 29.2. The forcible rape rate per 100,000 for the senior citizen population remained the same at 2.1 for 1997 and 1998. (See Table 3 and Figure 6.)
TABLE 3
12
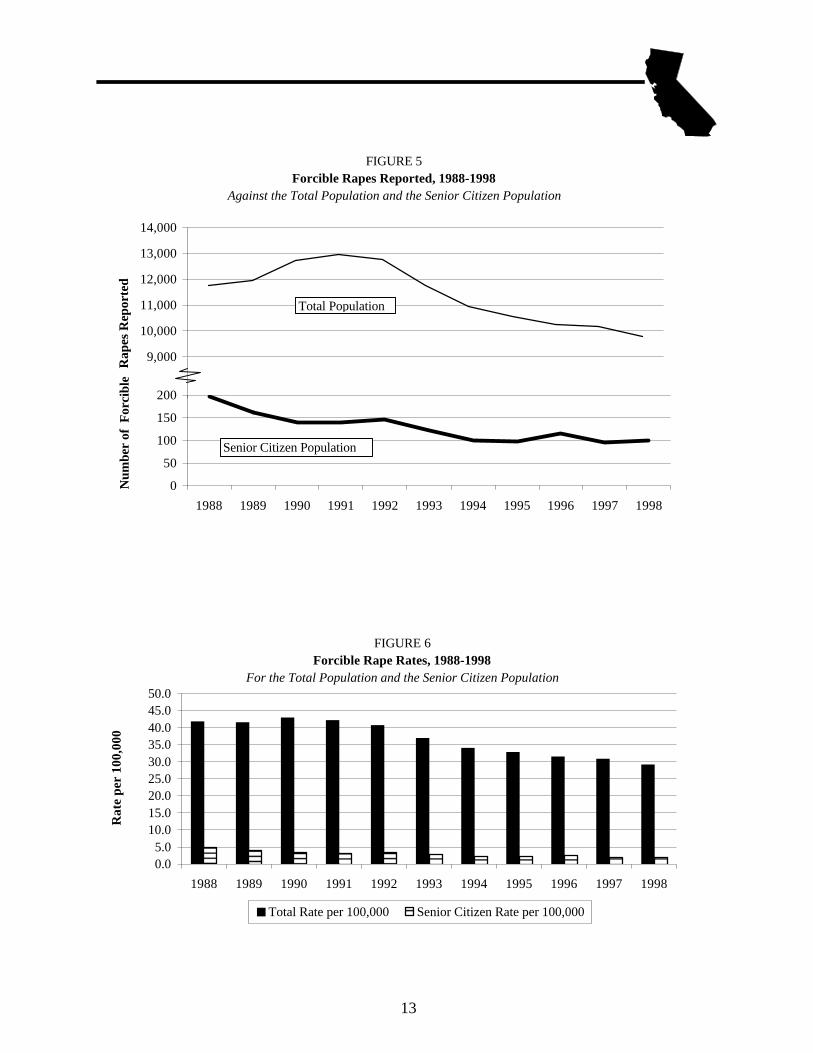
FIGURE 6 Forcible Rape Rates, 1988-1998
For the Total Population and the Senior Citizen Population
0.05.0
10.015.020.025.030.035.040.045.050.0
1988 1989 1990 1991 1992 1993 1994 1995 1996 1997 1998
Rat
e pe
r 10
0,00
0
Total Rate per 100,000 Senior Citizen Rate per 100,000
FIGURE 5Forcible Rapes Reported, 1988-1998
Against the Total Population and the Senior Citizen Population
9,000
10,000
11,000
12,000
13,000
14,000
Rap
es R
epor
ted
0
50
100
150
200
1988 1989 1990 1991 1992 1993 1994 1995 1996 1997 1998
Num
ber
of F
orci
ble
Total Population
Senior Citizen Population
13
YearTotal
population
Total robberies
reported a
Rate per
100,000
Percent change in rate from previous
year
Senior citizen
population
Senior citizen
percent of population
Senior citizen
robberies
reported a
Rate per
100,000
Percent change in rate from previous
year
1998 33,494,000 68,752 205.3 -16.9 4,723,548 14.1 3,838 81.3 -23.1
1997 32,957,000 81,413 247.0 -15.0 4,640,908 14.1 4,905 105.7 -12.3
1996 32,383,000 94,137 290.7 -10.9 4,560,834 14.1 5,496 120.5 -7.5
1995 32,063,000 104,581 326.2 -6.5 4,506,030 14.1 5,865 130.2 -13.0
1994 32,140,000 112,149 348.9 -12.3 4,461,735 13.9 6,675 149.6 -19.3
1993 31,742,000 126,347 398.0 -4.8 4,435,388 14.0 8,225 185.4 0.1
1992 31,300,000 130,867 418.1 2.4 4,396,780 14.0 8,142 185.2 7.7
1991 30,646,000 125,105 408.2 7.3 4,326,788 14.1 7,439 171.9 2.9
1990 29,557,836 112,460 380.5 13.5 4,232,094 14.3 7,069 167.0 6.4
1989 28,771,207 96,424 335.1 9.1 4,096,768 14.2 6,431 157.0 0.1
1988 28,060,746 86,190 307.2 - 4,014,965 14.3 6,301 156.9 -
Notes: Rates are based on population estimates provided by the Demographic Research Unit, California Department of Finance. Rates are calculated by dividing the number of crimes by the respective population. The result is multiplied by 100,000. Percentages may not add to 100.0 due to independent rounding.a See introduction for data limitations regarding the reporting of robberies.
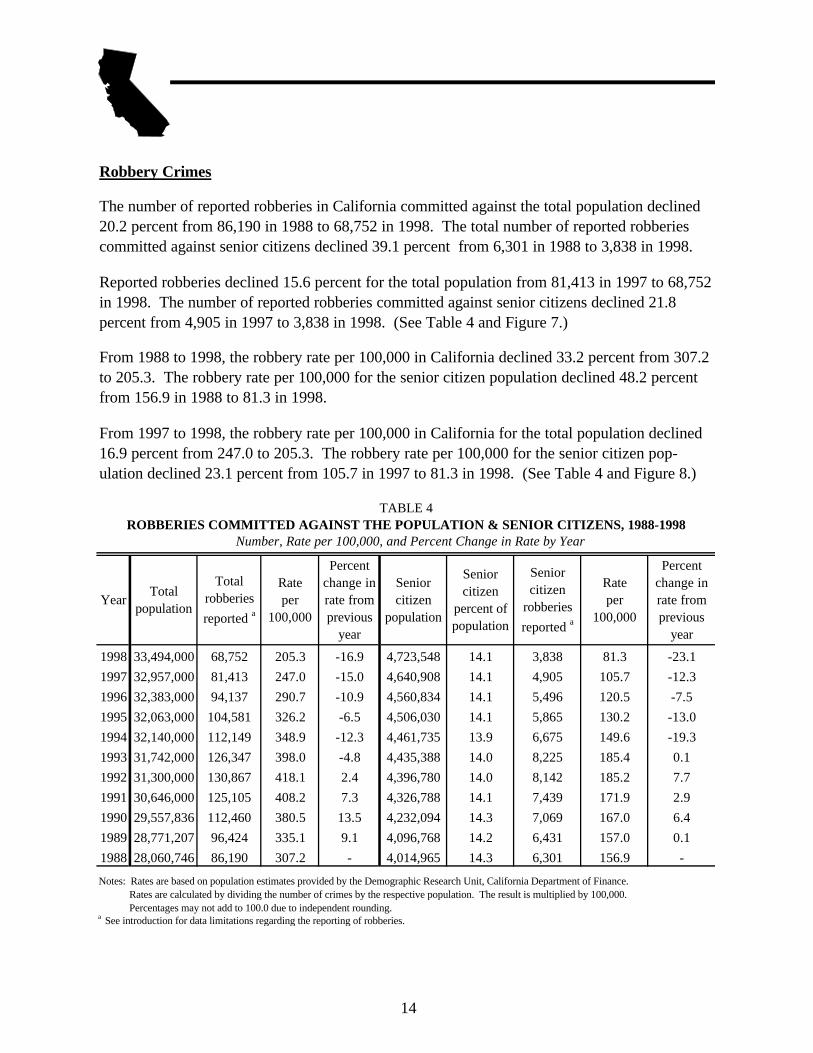
Robbery Crimes
ROBBERIES COMMITTED AGAINST THE POPULATION & SENIOR CITIZENS, 1988-1998Number, Rate per 100,000, and Percent Change in Rate by Year
TABLE 4
The number of reported robberies in California committed against the total population declined 20.2 percent from 86,190 in 1988 to 68,752 in 1998. The total number of reported robberies committed against senior citizens declined 39.1 percent from 6,301 in 1988 to 3,838 in 1998.
Reported robberies declined 15.6 percent for the total population from 81,413 in 1997 to 68,752 in 1998. The number of reported robberies committed against senior citizens declined 21.8 percent from 4,905 in 1997 to 3,838 in 1998. (See Table 4 and Figure 7.)
From 1988 to 1998, the robbery rate per 100,000 in California declined 33.2 percent from 307.2 to 205.3. The robbery rate per 100,000 for the senior citizen population declined 48.2 percent from 156.9 in 1988 to 81.3 in 1998.
From 1997 to 1998, the robbery rate per 100,000 in California for the total population declined 16.9 percent from 247.0 to 205.3. The robbery rate per 100,000 for the senior citizen pop-ulation declined 23.1 percent from 105.7 in 1997 to 81.3 in 1998. (See Table 4 and Figure 8.)
14
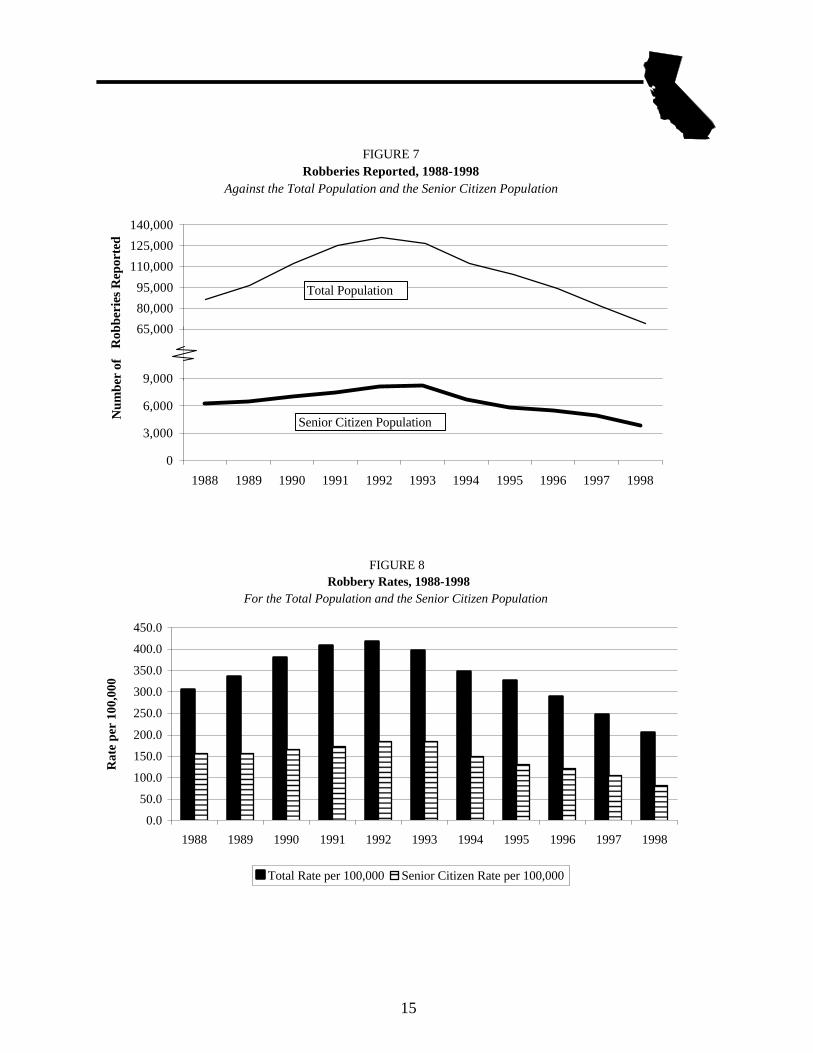
FIGURE 8 Robbery Rates, 1988-1998
For the Total Population and the Senior Citizen Population
0.0
50.0
100.0
150.0
200.0
250.0
300.0
350.0
400.0
450.0
1988 1989 1990 1991 1992 1993 1994 1995 1996 1997 1998
Rat
e pe
r 10
0,00
0
Total Rate per 100,000 Senior Citizen Rate per 100,000
FIGURE 7 Robberies Reported, 1988-1998
Against the Total Population and the Senior Citizen Population
65,000
80,000
95,000
110,000
125,000
140,000
Rob
beri
es R
epor
ted
0
3,000
6,000
9,000
1988 1989 1990 1991 1992 1993 1994 1995 1996 1997 1998
Num
ber
of
Total Population
Senior Citizen Population
15
YearTotal
population
Total aggravated
assaults reported
Rate per
100,000
Percent change in rate from previous
year
Senior citizen
population
Senior citizen
percent of population
Senior citizen
aggravated assaults reported
Rate per
100,000
Percent change in rate from
previous year
1998 33,494,000 149,067 445.1 -10.1 4,723,548 14.1 3,275 69.3 -4.8
1997 32,957,000 163,235 495.3 -4.2 4,640,908 14.1 3,379 72.8 -0.4
1996 32,383,000 167,390 516.9 -11.1 4,560,834 14.1 3,333 73.1 -9.1
1995 32,063,000 186,337 581.2 -2.8 4,506,030 14.1 3,625 80.4 -8.4
1994 32,140,000 192,138 597.8 -2.1 4,461,735 13.9 3,916 87.8 -1.0
1993 31,742,000 193,904 610.9 -3.4 4,435,388 14.0 3,933 88.7 -5.1
1992 31,300,000 197,970 632.5 2.6 4,396,780 14.0 4,109 93.5 3.4
1991 30,646,000 188,993 616.7 -0.5 4,326,788 14.1 3,911 90.4 3.6
1990 29,557,836 183,185 619.8 3.4 4,232,094 14.3 3,694 87.3 4.2
1989 28,771,207 172,476 599.5 4.4 4,096,768 14.2 3,432 83.8 12.6
1988 28,060,746 161,082 574.0 - 4,014,965 14.3 2,986 74.4 -
Notes: Rates are based on population estimates provided by the Demographic Research Unit, California Department of Finance. Rates are calculated by dividing the number of crimes by the respective population. The result is multiplied by 100,000. Percentages may not add to 100.0 due to independent rounding.
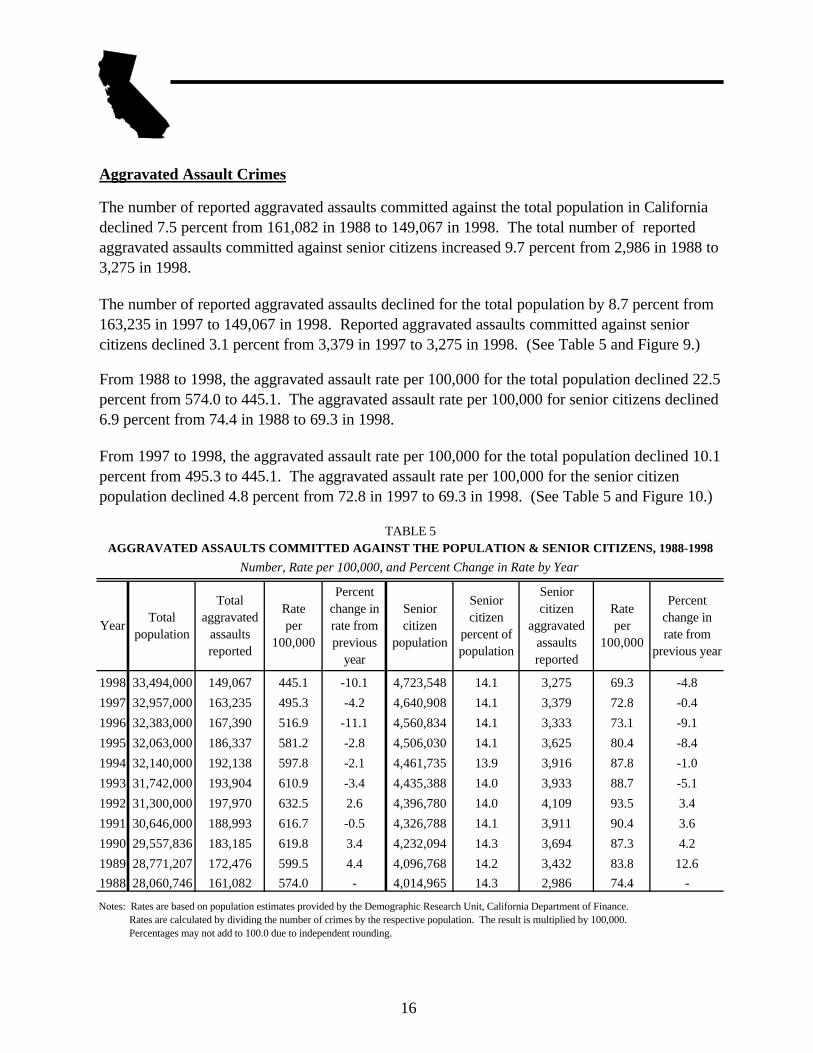
Aggravated Assault Crimes
AGGRAVATED ASSAULTS COMMITTED AGAINST THE POPULATION & SENIOR CITIZENS, 1988-1998
Number, Rate per 100,000, and Percent Change in Rate by Year
TABLE 5
The number of reported aggravated assaults committed against the total population in California declined 7.5 percent from 161,082 in 1988 to 149,067 in 1998. The total number of reported aggravated assaults committed against senior citizens increased 9.7 percent from 2,986 in 1988 to 3,275 in 1998.
The number of reported aggravated assaults declined for the total population by 8.7 percent from 163,235 in 1997 to 149,067 in 1998. Reported aggravated assaults committed against senior citizens declined 3.1 percent from 3,379 in 1997 to 3,275 in 1998. (See Table 5 and Figure 9.)
From 1988 to 1998, the aggravated assault rate per 100,000 for the total population declined 22.5 percent from 574.0 to 445.1. The aggravated assault rate per 100,000 for senior citizens declined 6.9 percent from 74.4 in 1988 to 69.3 in 1998.
From 1997 to 1998, the aggravated assault rate per 100,000 for the total population declined 10.1 percent from 495.3 to 445.1. The aggravated assault rate per 100,000 for the senior citizen population declined 4.8 percent from 72.8 in 1997 to 69.3 in 1998. (See Table 5 and Figure 10.)
16
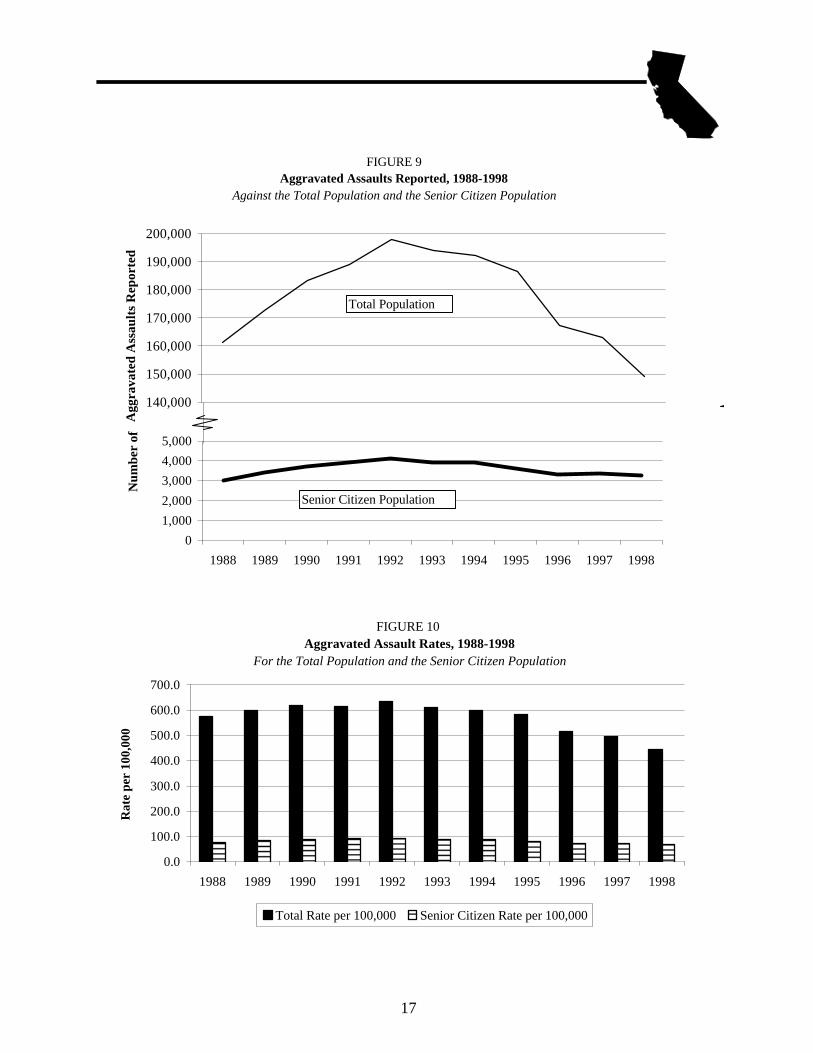
FIGURE 10 Aggravated Assault Rates, 1988-1998
For the Total Population and the Senior Citizen Population
0.0
100.0
200.0
300.0
400.0
500.0
600.0
700.0
1988 1989 1990 1991 1992 1993 1994 1995 1996 1997 1998
Rat
e pe
r 10
0,00
0
Total Rate per 100,000 Senior Citizen Rate per 100,000
FIGURE 9 Aggravated Assaults Reported, 1988-1998
Against the Total Population and the Senior Citizen Population
140,000
150,000
160,000
170,000
180,000
190,000
200,000
Agg
rava
ted
Ass
ault
s R
epor
ted
0
1,000
2,000
3,000
4,000
5,000
1988 1989 1990 1991 1992 1993 1994 1995 1996 1997 1998
Num
ber
of
Total Population
Senior Citizen Population
17
1998 2,170 2,049 121 9,777 9,678 99 68,752 64,914 3,838 149,067 145,792 3,2751997 2,579 2,440 139 10,182 10,086 96 81,413 76,508 4,905 163,235 159,856 3,3791996 2,910 2,796 114 10,238 10,123 115 94,137 88,641 5,496 167,390 164,057 3,3331995 3,530 3,390 140 10,550 10,452 98 104,581 98,716 5,865 186,337 182,712 3,6251994 3,699 3,556 143 10,960 10,860 100 112,149 105,474 6,675 192,138 188,222 3,9161993 4,095 3,875 220 11,754 11,632 122 126,347 118,122 8,225 193,904 189,971 3,9331992 3,920 3,728 192 12,751 12,604 147 130,867 122,725 8,142 197,970 193,861 4,1091991 3,876 3,715 161 12,942 12,802 140 125,105 117,666 7,439 188,993 185,082 3,9111990 3,562 3,369 193 12,716 12,576 140 112,460 105,391 7,069 183,185 179,491 3,6941989 3,159 2,975 184 11,956 11,795 161 96,424 89,993 6,431 172,476 169,044 3,4321988 2,947 2,721 226 11,771 11,574 197 86,190 79,889 6,301 161,082 158,096 2,986
1998 6.5 7.1 2.6 29.2 33.6 2.1 205.3 225.6 81.3 445.1 506.7 69.31997 7.8 8.6 3.0 30.9 35.6 2.1 247.0 270.2 105.7 495.3 564.5 72.81996 9.0 10.0 2.5 31.6 36.4 2.5 290.7 318.6 120.5 516.9 589.7 73.11995 11.0 12.3 3.1 32.9 37.9 2.2 326.2 358.2 130.2 581.2 663.0 80.41994 11.5 12.8 3.2 34.1 39.2 2.2 348.9 381.1 149.6 597.8 680.0 87.81993 12.9 14.2 5.0 37.0 42.6 2.8 398.0 432.6 185.4 610.9 695.7 88.71992 12.5 13.9 4.4 40.7 46.8 3.3 418.1 456.2 185.2 632.5 720.6 93.51991 12.6 14.1 3.7 42.2 48.6 3.2 408.2 447.1 171.9 616.7 703.2 90.41990 12.1 13.3 4.6 43.0 49.7 3.3 380.5 416.1 167.0 619.8 708.7 87.31989 11.0 12.1 4.5 41.6 47.8 3.9 335.1 364.7 157.0 599.5 685.1 83.81988 10.5 11.3 5.6 41.9 48.1 4.9 307.2 332.2 156.9 574.0 657.5 74.4
Notes: Rates are based on population estimates provided by the Demographic Research Unit, California Department of Finance. Rates are calculated by dividing the number of crimes by the respective population. The result is multiplied by 100,000. Percentages may not add to 100.0 due to independent rounding.
Rate per 100,000
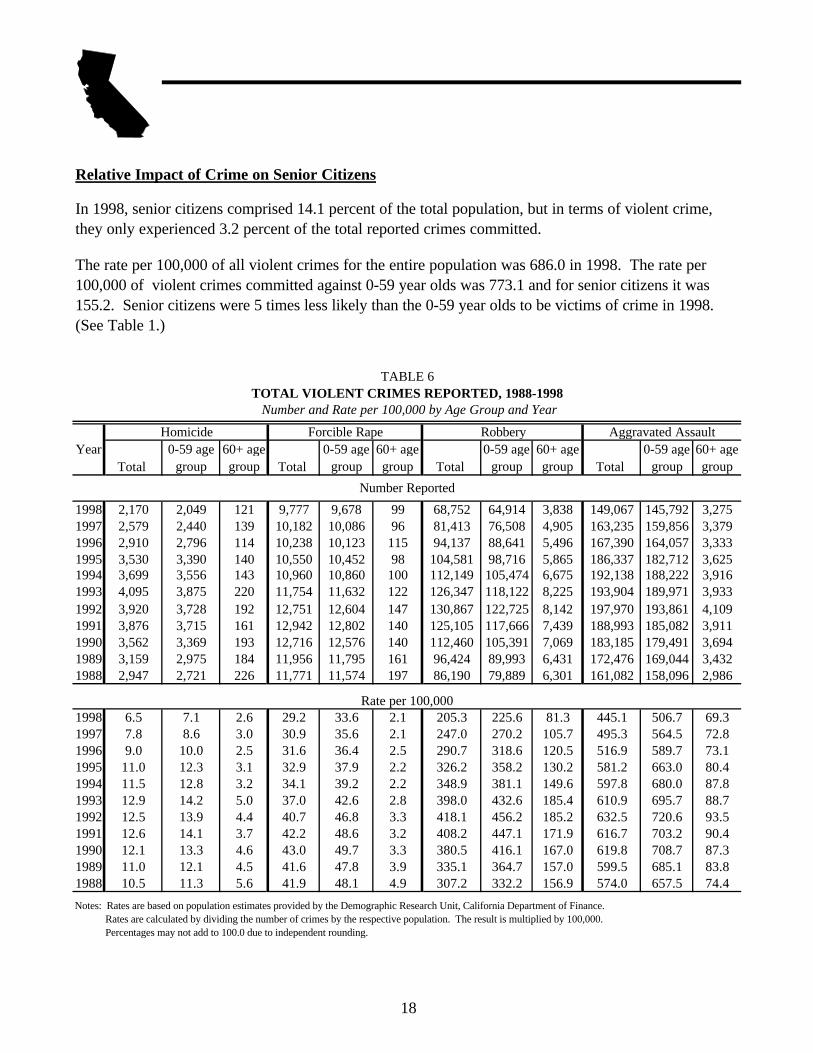
In 1998, senior citizens comprised 14.1 percent of the total population, but in terms of violent crime, they only experienced 3.2 percent of the total reported crimes committed.
The rate per 100,000 of all violent crimes for the entire population was 686.0 in 1998. The rate per 100,000 of violent crimes committed against 0-59 year olds was 773.1 and for senior citizens it was 155.2. Senior citizens were 5 times less likely than the 0-59 year olds to be victims of crime in 1998. (See Table 1.)
Number Reported
0-59 age groupTotal Total Total Total
60+ age group
Aggravated Assault0-59 age
group60+ age group
0-59 age group
YearHomicide Forcible Rape Robbery
60+ age group
0-59 age group
60+ age group
Relative Impact of Crime on Senior Citizens
TABLE 6TOTAL VIOLENT CRIMES REPORTED, 1988-1998
Number and Rate per 100,000 by Age Group and Year
18
In 1988, 2.3 percent of all reported crimes committed against senior citizens were homicides. For the total population in 1988, 1.1 percent of the reported crimes committed were homicides. In 1998, homicides were 1.7 percent of the reported crimes committed against senior citizens, and only .9 percent of the reported crimes committed against the total population.
Robberies were 64.9 percent of the total crime reported against seniors in 1988, and 52.3 percent of reported crime against seniors in 1998. Robberies constituted 32.9 percent of the reported crimes committed against the total population in 1988, and 29.9 percent of reported crimes committed against the total population in 1998. (See Figure 11 and Figure 12.)
In 1998, the homicide rate per 100,000 for the 0-59 year old population was 7.1. The homicide rate per 100,000 for senior citizens was 2.6. Members of the 0-59 year old age group were 2.7 times more likely to be victims of homicide than senior citizens. The 0-59 year old population was approximately 6 times greater than the senior citizen population, yet they experienced nearly 17 times as many reported homicides.
In 1998, the forcible rape rate per 100,000 for the 0-59 year old population was 33.6, and for senior citizens it was 2.1. Members of the 0-59 year old age group were 16 times more likely to be victims of forcible rape than senior citizens. The 0-59 year old population was approximately 6 times greater than the senior citizen population; however, they experienced 98 times as many reported forcible rapes .
The robbery rate per 100,000 in 1998 for the 0-59 year old age group was 225.6 in 1998, and for senior citizens it was 81.3. Members of the 0-59 year old age group were 2.8 times more likely to be victims of robbery than senior citizens. The 0-59 year old population was 6 times greater than the senior citizens population, yet they experienced almost 17 times as many reported robberies.
The aggravated assault rate per 100,000 for the 0-59 year old age group was 506.7 in 1998. For senior citizens in 1998, the aggravated assault rate per 100,000 was 69.3. Members of the 0-59 year old age group were 7.3 times more likely to be victims of aggravated assault than senior citizens. The 0-59 year old population was 6 times greater than the senior citizen population, yet they experienced 45 times the number of reported aggravated assaults. (See Table 1 and Table 6.)
19
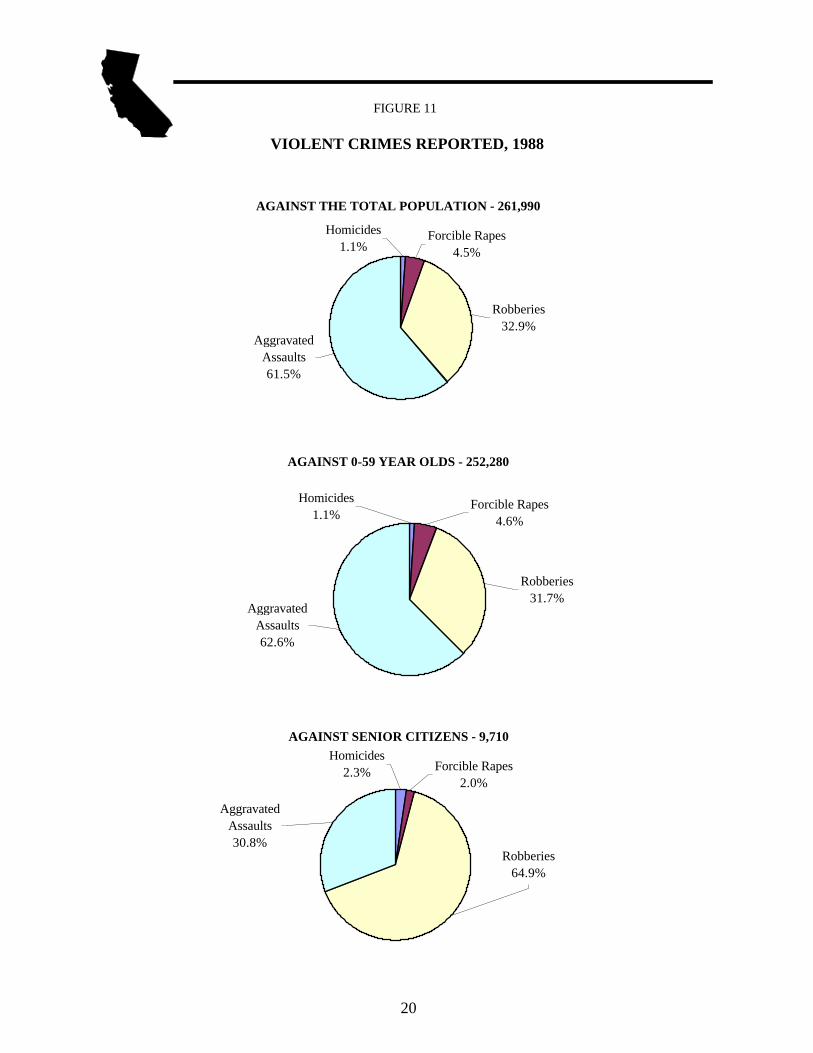
FIGURE 11
VIOLENT CRIMES REPORTED, 1988
AGAINST THE TOTAL POPULATION - 261,990
Aggravated Assaults61.5%
Robberies32.9%
Forcible Rapes4.5%
Homicides1.1%
AGAINST 0-59 YEAR OLDS - 252,280
Homicides1.1%
Forcible Rapes4.6%
Robberies31.7%
Aggravated Assaults62.6%
AGAINST SENIOR CITIZENS - 9,710
Aggravated Assaults30.8%
Robberies64.9%
Forcible Rapes2.0%
Homicides2.3%
20
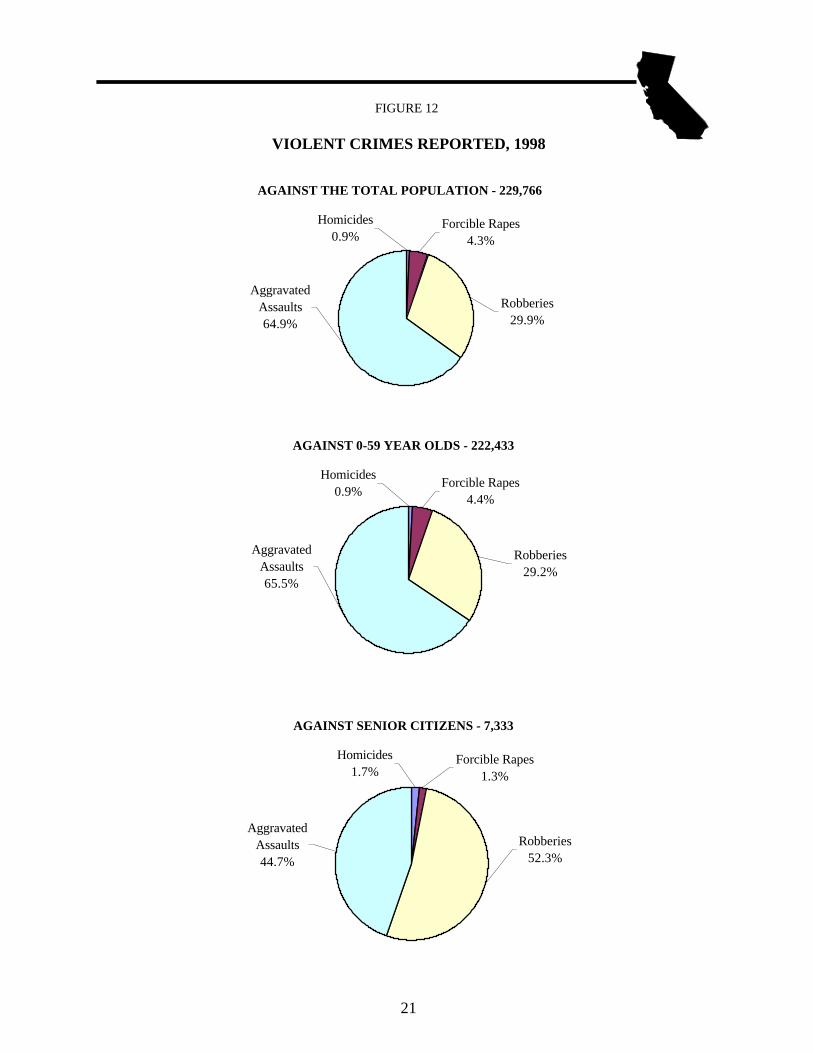
FIGURE 12
VIOLENT CRIMES REPORTED, 1998
AGAINST THE TOTAL POPULATION - 229,766
Aggravated Assaults64.9%
Robberies29.9%
Forcible Rapes4.3%
Homicides0.9%
AGAINST 0-59 YEAR OLDS - 222,433
Aggravated Assaults65.5%
Robberies29.2%
Forcible Rapes4.4%
Homicides0.9%
AGAINST SENIOR CITIZENS - 7,333
Aggravated Assaults44.7%
Robberies52.3%
Forcible Rapes1.3%
Homicides1.7%
21

APPENDICES
County 1988 1989 1990 1991 1992 1993 1994 1995 1996 1997 1998
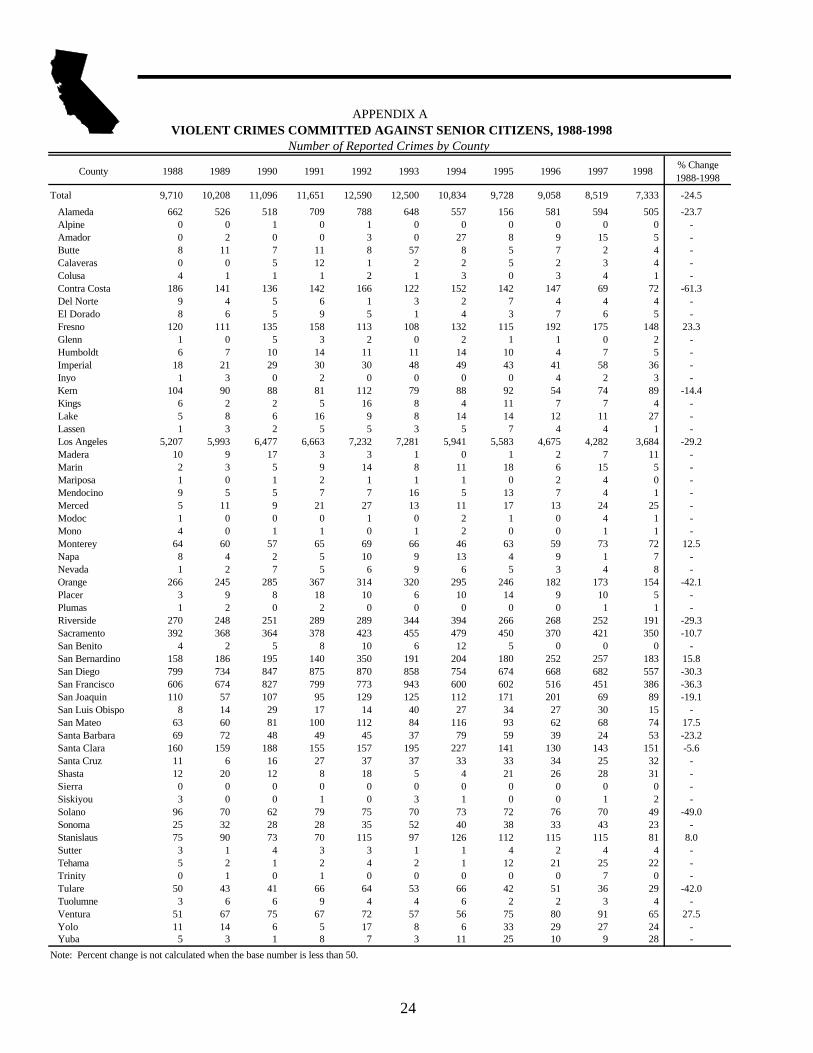
Total 9,710 10,208 11,096 11,651 12,590 12,500 10,834 9,728 9,058 8,519 7,333 -24.5
Alameda 662 526 518 709 788 648 557 156 581 594 505 -23.7 Alpine 0 0 1 0 1 0 0 0 0 0 0 - Amador 0 2 0 0 3 0 27 8 9 15 5 - Butte 8 11 7 11 8 57 8 5 7 2 4 - Calaveras 0 0 5 12 1 2 2 5 2 3 4 - Colusa 4 1 1 1 2 1 3 0 3 4 1 - Contra Costa 186 141 136 142 166 122 152 142 147 69 72 -61.3 Del Norte 9 4 5 6 1 3 2 7 4 4 4 - El Dorado 8 6 5 9 5 1 4 3 7 6 5 - Fresno 120 111 135 158 113 108 132 115 192 175 148 23.3 Glenn 1 0 5 3 2 0 2 1 1 0 2 - Humboldt 6 7 10 14 11 11 14 10 4 7 5 - Imperial 18 21 29 30 30 48 49 43 41 58 36 - Inyo 1 3 0 2 0 0 0 0 4 2 3 - Kern 104 90 88 81 112 79 88 92 54 74 89 -14.4 Kings 6 2 2 5 16 8 4 11 7 7 4 - Lake 5 8 6 16 9 8 14 14 12 11 27 - Lassen 1 3 2 5 5 3 5 7 4 4 1 - Los Angeles 5,207 5,993 6,477 6,663 7,232 7,281 5,941 5,583 4,675 4,282 3,684 -29.2 Madera 10 9 17 3 3 1 0 1 2 7 11 - Marin 2 3 5 9 14 8 11 18 6 15 5 - Mariposa 1 0 1 2 1 1 1 0 2 4 0 - Mendocino 9 5 5 7 7 16 5 13 7 4 1 - Merced 5 11 9 21 27 13 11 17 13 24 25 - Modoc 1 0 0 0 1 0 2 1 0 4 1 - Mono 4 0 1 1 0 1 2 0 0 1 1 - Monterey 64 60 57 65 69 66 46 63 59 73 72 12.5 Napa 8 4 2 5 10 9 13 4 9 1 7 - Nevada 1 2 7 5 6 9 6 5 3 4 8 - Orange 266 245 285 367 314 320 295 246 182 173 154 -42.1 Placer 3 9 8 18 10 6 10 14 9 10 5 - Plumas 1 2 0 2 0 0 0 0 0 1 1 - Riverside 270 248 251 289 289 344 394 266 268 252 191 -29.3 Sacramento 392 368 364 378 423 455 479 450 370 421 350 -10.7 San Benito 4 2 5 8 10 6 12 5 0 0 0 - San Bernardino 158 186 195 140 350 191 204 180 252 257 183 15.8 San Diego 799 734 847 875 870 858 754 674 668 682 557 -30.3 San Francisco 606 674 827 799 773 943 600 602 516 451 386 -36.3 San Joaquin 110 57 107 95 129 125 112 171 201 69 89 -19.1 San Luis Obispo 8 14 29 17 14 40 27 34 27 30 15 - San Mateo 63 60 81 100 112 84 116 93 62 68 74 17.5 Santa Barbara 69 72 48 49 45 37 79 59 39 24 53 -23.2 Santa Clara 160 159 188 155 157 195 227 141 130 143 151 -5.6 Santa Cruz 11 6 16 27 37 37 33 33 34 25 32 - Shasta 12 20 12 8 18 5 4 21 26 28 31 - Sierra 0 0 0 0 0 0 0 0 0 0 0 - Siskiyou 3 0 0 1 0 3 1 0 0 1 2 - Solano 96 70 62 79 75 70 73 72 76 70 49 -49.0 Sonoma 25 32 28 28 35 52 40 38 33 43 23 - Stanislaus 75 90 73 70 115 97 126 112 115 115 81 8.0 Sutter 3 1 4 3 3 1 1 4 2 4 4 - Tehama 5 2 1 2 4 2 1 12 21 25 22 - Trinity 0 1 0 1 0 0 0 0 0 7 0 - Tulare 50 43 41 66 64 53 66 42 51 36 29 -42.0 Tuolumne 3 6 6 9 4 4 6 2 2 3 4 - Ventura 51 67 75 67 72 57 56 75 80 91 65 27.5 Yolo 11 14 6 5 17 8 6 33 29 27 24 - Yuba 5 3 1 8 7 3 11 25 10 9 28 -
Note: Percent change is not calculated when the base number is less than 50.
APPENDIX A VIOLENT CRIMES COMMITTED AGAINST SENIOR CITIZENS, 1988-1998
Number of Reported Crimes by County% Change 1988-1998
24
City Police Departments
1988 1989 1990 1991 1992 1993 1994 1995 1996 1997 1998
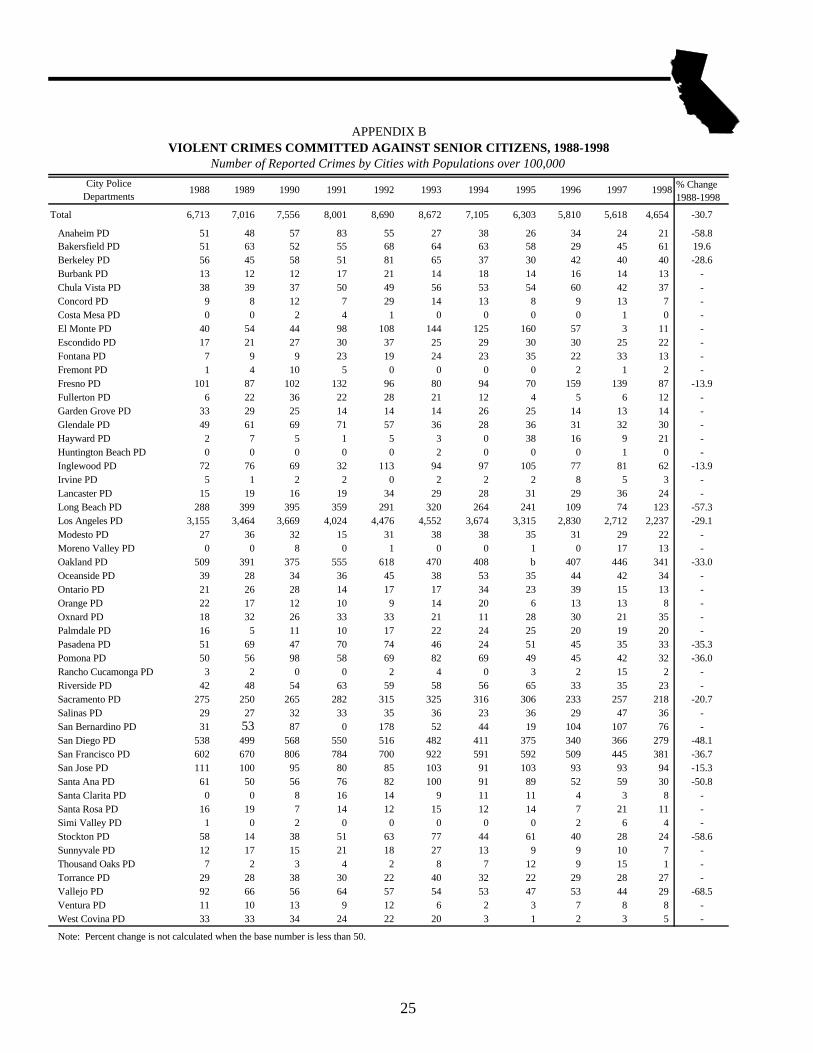
Total 6,713 7,016 7,556 8,001 8,690 8,672 7,105 6,303 5,810 5,618 4,654 -30.7
Anaheim PD 51 48 57 83 55 27 38 26 34 24 21 -58.8 Bakersfield PD 51 63 52 55 68 64 63 58 29 45 61 19.6 Berkeley PD 56 45 58 51 81 65 37 30 42 40 40 -28.6 Burbank PD 13 12 12 17 21 14 18 14 16 14 13 - Chula Vista PD 38 39 37 50 49 56 53 54 60 42 37 - Concord PD 9 8 12 7 29 14 13 8 9 13 7 - Costa Mesa PD 0 0 2 4 1 0 0 0 0 1 0 - El Monte PD 40 54 44 98 108 144 125 160 57 3 11 - Escondido PD 17 21 27 30 37 25 29 30 30 25 22 - Fontana PD 7 9 9 23 19 24 23 35 22 33 13 - Fremont PD 1 4 10 5 0 0 0 0 2 1 2 - Fresno PD 101 87 102 132 96 80 94 70 159 139 87 -13.9 Fullerton PD 6 22 36 22 28 21 12 4 5 6 12 - Garden Grove PD 33 29 25 14 14 14 26 25 14 13 14 - Glendale PD 49 61 69 71 57 36 28 36 31 32 30 - Hayward PD 2 7 5 1 5 3 0 38 16 9 21 - Huntington Beach PD 0 0 0 0 0 2 0 0 0 1 0 - Inglewood PD 72 76 69 32 113 94 97 105 77 81 62 -13.9 Irvine PD 5 1 2 2 0 2 2 2 8 5 3 - Lancaster PD 15 19 16 19 34 29 28 31 29 36 24 - Long Beach PD 288 399 395 359 291 320 264 241 109 74 123 -57.3 Los Angeles PD 3,155 3,464 3,669 4,024 4,476 4,552 3,674 3,315 2,830 2,712 2,237 -29.1 Modesto PD 27 36 32 15 31 38 38 35 31 29 22 - Moreno Valley PD 0 0 8 0 1 0 0 1 0 17 13 - Oakland PD 509 391 375 555 618 470 408 b 407 446 341 -33.0 Oceanside PD 39 28 34 36 45 38 53 35 44 42 34 - Ontario PD 21 26 28 14 17 17 34 23 39 15 13 - Orange PD 22 17 12 10 9 14 20 6 13 13 8 - Oxnard PD 18 32 26 33 33 21 11 28 30 21 35 - Palmdale PD 16 5 11 10 17 22 24 25 20 19 20 - Pasadena PD 51 69 47 70 74 46 24 51 45 35 33 -35.3 Pomona PD 50 56 98 58 69 82 69 49 45 42 32 -36.0 Rancho Cucamonga PD 3 2 0 0 2 4 0 3 2 15 2 - Riverside PD 42 48 54 63 59 58 56 65 33 35 23 - Sacramento PD 275 250 265 282 315 325 316 306 233 257 218 -20.7 Salinas PD 29 27 32 33 35 36 23 36 29 47 36 - San Bernardino PD 31 53 87 0 178 52 44 19 104 107 76 - San Diego PD 538 499 568 550 516 482 411 375 340 366 279 -48.1 San Francisco PD 602 670 806 784 700 922 591 592 509 445 381 -36.7 San Jose PD 111 100 95 80 85 103 91 103 93 93 94 -15.3 Santa Ana PD 61 50 56 76 82 100 91 89 52 59 30 -50.8 Santa Clarita PD 0 0 8 16 14 9 11 11 4 3 8 - Santa Rosa PD 16 19 7 14 12 15 12 14 7 21 11 - Simi Valley PD 1 0 2 0 0 0 0 0 2 6 4 - Stockton PD 58 14 38 51 63 77 44 61 40 28 24 -58.6 Sunnyvale PD 12 17 15 21 18 27 13 9 9 10 7 - Thousand Oaks PD 7 2 3 4 2 8 7 12 9 15 1 - Torrance PD 29 28 38 30 22 40 32 22 29 28 27 - Vallejo PD 92 66 56 64 57 54 53 47 53 44 29 -68.5 Ventura PD 11 10 13 9 12 6 2 3 7 8 8 - West Covina PD 33 33 34 24 22 20 3 1 2 3 5 -
Note: Percent change is not calculated when the base number is less than 50.
APPENDIX BVIOLENT CRIMES COMMITTED AGAINST SENIOR CITIZENS, 1988-1998
Number of Reported Crimes by Cities with Populations over 100,000
% Change 1988-1998
25
01/00
CJSC* PUBLICATIONS ON THE INTERNEThttp://caag.state.ca.us/cjsc/pubs.htm
CJSC Outlook: Crime in Urban and Rural California(1987 and 1996)
Crime and Delinquency in California (1996 to current)Crime and Delinquency in California (Advance
Release) (1996 to current)Crime as Reported by Selected California Agencies,
January through September (1995 to current)
Hate Crime in California (1995 to current)Homicide in California (1995 to current)Preliminary Report, Crime (1996 to current)Report on Arrests for Driving Under the Influence in
California, 1997Report on Arrests for Burglary in California, 1998Report on Arrests for Domestic Violence in
California, 1998
AnnualsCrime and Delinquency in CaliforniaCrime and Delinquency in California -
Advance ReleaseCriminal Justice Profile - A Supplement to
C&D (statewide and individual counties)Hate Crime in CaliforniaHomicide in CaliforniaPreliminary Report, Crime (January-June
and January-December)
BCS Focus and ForumsThe California Experience in American
Juvenile Justice: Some HistoricalPerspectives (December 1988)
Controlling Plea Bargaining in California(September 1985)
Coordinating Justice in California: “Thereought to be a law about it” (December1988)
Crime Control and the Criminal Career(December 1992)
The Development of California DrunkDriving Legislation (December 1988)
Employment and Crime (February 1989)The Impact of California’s “Prior Felony
Conviction” Law (September 1987)The Origins and Development of Penalties
for Drunk Drivers in California (August1988)
A Policy Role for Focus Groups:Community Corrections (September1991)
The Prevalence and Incidence of ArrestsAmong Adult Males in California (August1988)
The Social Structure of Street DrugDealing (December 1988)
CJSC* PUBLICATIONS IN PRINT
BCS OutlooksAdult Felony Arrest Dispositions in
California (1982-1984 and 1986-1989)Crime in California and the United States,
1982 (December 1983)Crime in Urban and Rural California
(December 1997)Crime in Urban and Rural California
(November 1984)Felony Drug Arrests in California, 1985
(December 1986)Juvenile Justice in California, 1983 (June
1984)Motor Vehicle Theft in California
(December 1987)Motor Vehicle Theft Recovery Data, 1983
1989 (October 1990)Women in Crime: The Sentencing of
Female Defendants (April 1988)
BCS ReportsAdult Felony Arrest Dispositions in
California (April 1992)Crime in California and the U.S., 1980
1991 (January 1993)Crime in California and the U.S., 1988
data (January 1990)Effectiveness of Statutory Requirements
for the Registration of Sex Offenders - AReport to the California State Legislature
Executive Summary of the Final Report -Blue Ribbon Commission on InmatePopulation Management (January 1990)
Parolees Returned to Prison and theCalifornia Prison Population (January1988)
Target Hardening: A Literature Review(October 1989)
Monograph SeriesConspicuous Depredation: Automobile
Theft in Los Angeles, 1904 to 1987(March 1990)
Controlling Felony Plea Bargaining inCalifornia: The Impact of the Victim’sBill of Rights (1986)
Development of a White Collar Crime Index(December 1992)
Incapacitation Strategies and the CareerCriminal (December 1992)
Measuring White Collar Crime inDepository Institutions (December 1993)
Prosecutors’ Reponse to Parental ChildStealing: A Statewide Study (April 1995)
Race & Delinquency in Los AngelesJuvenile Court, 1950 (December 1990)
Survey Report: “The Expansion of theCriminal Justice and Penal System inCalifornia - Is greater coordinationrequired?” (December 1988)
MiscellaneousGang Organization and Migration/Drugs,
Gangs & Law EnforcementProceedings of the Attorney General’s
Crime Conference 85 (September 1985)Proceedings of Symposium 87: White
Collar/Institutional Crime - Its Measure-ment and Analysis
CJSC Report SeriesReport on Arrests for Driving Under the
Influence in California, 1997Report on Arrests for Burglary in
California, 1998Report on Arrests for Domestic Viol;ence
in California, 1998
If you need a publication, assistance in obtaining statistical information, or a customized statisticalreport, contact the CJSC's Special Requests Unit at the California Department of Justice, CriminalJustice Statistics Center, Special Requests Unit, P. O. Box 903427, Sacramento, CA 94203-4270,Telephone: (916) 227-3509, FAX: (916) 227-0427, E-mail: [email protected]
*Prior to 1991, the Criminal Justice Statistics Center (CJSC) was known as the Bureau of Criminal Statistics (BCS).
■ CJSC Home Page ■ CJSC Publications
■ Attorney General’s Home Page