Report on Union Dues & Officer Salaries In Right-To-Work v Non-Right-To-Work States
14
BACKGROUNDER K P U nions Charge Higher Dues and Pa y Their Officers Larger Salaries in Non–Right-to-Work States Ja mes Sher k No. 2987 | JANUARY 26, 2015 n In half of U.S. states, workers at unionized companies must pay union dues or get fired. n These compulsory dues give unions a monopoly in the work- place. Workers have no option but to purchase their services. n Economists recognize that monopolies hurt consumers. Business monopolies charge their customers higher prices and put less effort into controlling costs. Unions do the same. n Labor unions charge workers 10 percent higher dues and pay their top full-time officers $20,000 more a year in states with com- pulsory dues. n Right-to-work laws make union dues voluntary and require unions to earn their members’ voluntary support. This freedom prevents unions from taking advantage of their monopoly position at work- ers’ expense. Abstract In the absence of competition, businesses charge their customers higher prices and care less about controlling costs. Labor unions do the same. Half of U.S. states allow unions to force workers to pay dues as a condition of employment. In these states unions charge 10 per- cent higher dues and pay their top officers $20,000 more a year. The remaining states have right-to-work laws that make union dues vol- untary. These laws prevent unions from exploiting their monopoly and reduce the cost of union representation for workers. B usinesses with monopolies charge higher prices and operate less efficiently than they would facing competition. Labor unions operate no differently. Unio ns cha rge workers more and spend their money less carefully i n states where they can compel wor kers to pur- chase their services. Union financial reports reveal that they charge workers roughly 10 percent hig her dues and pay their f ull-time top officers $20,000 more annually in states with compulsory dues. Several states and local governments are considering right-to- work l aws to make paying union dues voluntar y. Such laws would preven t unions f rom chargi ng their members monopoly prices. Competition vs. Monopoly One of the most widely accepted facts in economics is that monopolies with no fear of competition harm consumers. Any i ntro- ductory economics textbook explains that monopolists raise prices beyond what they could charge i f they faced competition. 1 This rais- es the monopolists’ profits at the cost of even greater losses to con- sumers. For example, throughout most of the 20th century the De This paper, in its entirety, can be found at http:/ /report.heritage.org /bg2987 The Heritage Foundation 214 Massachusetts Avenue, NE Washington, DC 20002 (202) 546-4400 | heritage.org Nothing written here is to be construed as necessarily reflecting the views of The Heritage Foundation or as an attempt to aid or hinder the passage of any bill before Congress.
Transcript of Report on Union Dues & Officer Salaries In Right-To-Work v Non-Right-To-Work States
892019 Report on Union Dues amp Officer Salaries In Right-To-Work v Non-Right-To-Work States
httpslidepdfcomreaderfullreport-on-union-dues-officer-salaries-in-right-to-work-v-non-right-to-work 114
BACKGROUNDER
K983141983161 P983151983145983150983156983155
Unions Charge Higher Dues and Pay Their OfficersLarger Salaries in NonndashRight-to-Work States
James Sherk
No 2987 | JANUARY 26 2015
n In half of US states workers atunionized companies must payunion dues or get fired
n These compulsory dues giveunions a monopoly in the work-place Workers have no option butto purchase their services
n Economists recognize thatmonopolies hurt consumersBusiness monopolies charge theircustomers higher prices and putless effort into controlling costsUnions do the same
n Labor unions charge workers 10percent higher dues and pay theirtop full-time officers $20000more a year in states with com-pulsory dues
n Right-to-work laws make uniondues voluntary and require unionsto earn their membersrsquo voluntarysupport This freedom prevents
unions from taking advantage oftheir monopoly position at work-ersrsquo expense
Abstract In the absence of competition businesses charge their customers
higher prices and care less about controlling costs Labor unions do
the same Half of US states allow unions to force workers to pay dues
as a condition of employment In these states unions charge 10 per-
cent higher dues and pay their top officers $20000 more a year The
remaining states have right-to-work laws that make union dues vol-
untary These laws prevent unions from exploiting their monopoly and
reduce the cost of union representation for workers
Businesses with monopolies charge higher prices and operate less
efficiently than they would facing competition Labor unions
operate no differently Unions charge workers more and spend theirmoney less carefully in states where they can compel workers to pur-
chase their services Union financial reports reveal that they charge
workers roughly 10 percent higher dues and pay their full-time top
officers $20000 more annually in states with compulsory dues
Several states and local governments are considering right-to-
work laws to make paying union dues voluntary Such laws would
prevent unions from charging their members monopoly prices
Competition vs Monopoly One of the most widely accepted facts in economics is that
monopolies with no fear of competition harm consumers Any intro-
ductory economics textbook explains that monopolists raise pricesbeyond what they could charge if they faced competition1 This rais-
es the monopolistsrsquo profits at the cost of even greater losses to con-
sumers For example throughout most of the 20th century the De
This paper in its entirety can be found at httpreportheritageorgbg2987
The Heritage Foundation
214 Massachusetts Avenue NE
Washington DC 20002
(202) 546-4400 | heritageorg
Nothing written here is to be construed as necessarily reflecting the views of The Heritage
Foundation or as an attempt to aid or hinder the passage of any bill before Congress
892019 Report on Union Dues amp Officer Salaries In Right-To-Work v Non-Right-To-Work States
httpslidepdfcomreaderfullreport-on-union-dues-officer-salaries-in-right-to-work-v-non-right-to-work 214
2
BACKGROUNDER | NO 2987
JANUARY 26 2015
Beers cartel controlled most of the worldrsquos diamond
supply It used this monopoly to restrict production
and drive up diamond prices2
Economists have also discovered that the man-
agers of monopolistic firms often take advantage
of their position to make their lives easier They do
not work as hard to hold down costs or to innovate
and they often pay themselves higher salaries 3 This
ldquoX-Inefficiencyrdquo further increases the economic
damage caused by unchecked monopolies Manag-
ers do not work as ha rd without competition
The Union Monopoly In many American states labor unions enjoy
a legal monopoly4 In jurisdictions without right-
to-work laws union contracts force workers to paydues as a condition of employment irrespective
of the value that they believe their union provides
For example the Teamsters recently had Michael
Romanchock fired from his job at a Pepsi bottling
plant in Ebensburg Pennsylvania Romanchock had
worked at the plant for nine months without even
realizing Teamsters Local 110 had organized it5 He
learned about his union representation when Local
110 sent him a letter demanding full duesmdashroughly
$600 a year6 When he refused to pay for services he
had not even noticed ldquohisrdquo union had him fired
With compulsory dues unions do not need to
earn workersrsquo supportmdashthey can compel it Even top
union officials see that this monopoly does not bene-
fit workers As Gary Casteel Southern Region direc-
tor for the United Auto Workers (UAW) stated
This is something Irsquove never understood that
people think right to work hurts unionshellip To
me it helps them You donrsquot have to belong if you
donrsquot want to So if I go to an organizing drive I
can tell these workers ldquoIf you donrsquot like this
arrangement you donrsquot have to belongrdquo Versus
ldquoIf we get 50 percent of you then al l of you have tobelong whether you like to or notrdquo I donrsquot even
like the way that sounds because itrsquos a voluntary
system and if you donrsquot think the systemrsquos earn-
ing its keep then you donrsquot have to pay7
Approximately three-quarters of union members
live in states where they must pay dues8 Dues come
out of these workersrsquo paychecks whether or not they
1 For example see James D Gwartney Richard L Stroup and Russell S Sobel Economics Private and Public Choices 9th ed (Boston Harcourt
College Publishers 2000) pp 611ndash615
2 Paul Zimnisky ldquoDiamonds Driven by Market Forces for the First Time in 100 Yearsrdquo Resource Investor April 9 2013
httpwwwresourceinvestorcom20130409diamonds-driven-by-market-forces-for-the-first-tim (accessed January 7 2015)
3 Harvey Leibenstein ldquoAllocative Efficiency vs X-Efficiencyrdquo American Economic Review Vol 56 No 3 (June 1966) pp 392ndash415 and Benjamin E
Hermalin ldquoThe Effects of Competition on Executive Behaviorrdquo The RAND Journal of Economics Vol 23 No 3 (Autumn 1992) pp 350ndash365
4 Federal anti-trust law specifically exempts labor unions ldquoThe labor of a human being is not a commodity or article of commerce Nothing
contained in the antitrust laws shall be construed to forbid the existence and operation of labor agricultural or horticultural organizations
instituted for the purposes of mutual help and not having capital stock or conducted for profit or to forbid or restrain individual members of
such organizations from lawfully carrying out the legitimate objects thereof nor shall such organizations or the members thereof be held or
construed to be illegal combinations or conspiracies in restraint of trade under the antitrust lawsrdquo 15 US Code sect 17 Unions enjoy a double
monopoly within a workforce First unions recognized as an ldquoexclusive bargaining representativerdquo are the sole representative for workers
before their employers An employee may not elect to negotiate a separate contract through another union or individually Second unions
in nonndashright-to-work states can compel workers to purchase their services Workers may not keep their money to spend on other goods and
services This paper focuses on the second form of monopoly power that unions enjoy Right-to-work laws do not give workers a choice over
who represents them in the workplacemdashonly whether they will purchase union services
5 News release ldquoFormer Pepsi Worker Files Federal Charges Against Teamsters and Company for Illegally Firing Him for Refusing to Pay Union
Duesrdquo National Right to Work Legal Defense Foundation September 24 2014
httpwwwnrtworgenpress201409former-pepsi-worker-files-federal-ch (accessed January 7 2015)
6 Teamsters Local 110rsquos dues were estimated from information released on their 2013 Form LM-2 report to the Office of Labor-Management
Statistics Local 110 reported collecting $818637 in dues from 1382 membersmdashan average of $592 per member
7 Lydia DePillis ldquoWhy Harris v Quinn Isnrsquot as Bad for Workers as It Soundsrdquo The Washington Post July 1 2014
httpwwwwashingtonpostcomblogswonkblog wp20140701why-harris-v-quinn-isnt-as-bad-for-workers-as-it-sounds
(accessed January 7 2015)
8 Heritage Foundation calculations using data from Barry T Hirsch and David A Macpherson ldquoUnion Membership Coverage Density and
Employment by State 2013rdquo 2014 httpunionstatsgsueduState_U_2013htm (accessed January 7 2015) In 2013 37 million of the 145
million union members in the United States lived in right-to-work states
892019 Report on Union Dues amp Officer Salaries In Right-To-Work v Non-Right-To-Work States
httpslidepdfcomreaderfullreport-on-union-dues-officer-salaries-in-right-to-work-v-non-right-to-work 314
3
BACKGROUNDER | NO 2987
JANUARY 26 2015
believe their union has earned its keep Economic
theory predicts that unions would take advantage
of this monopoly to charge their members higher
dues and that this monopoly would reduce the pres-
sure to hold down costs including the salaries of top
union officers
Some evidence indicates unions in fact act like
other monopolies Polls show that a majority of
union members believe that their dues are too high
for the value they receive9 Press reports often high-
light the high salaries that top union officers col-
lect10 However to date economists have given little
empirical attention to whether unions institutional-
ly take advantage of their monopoly position Newly
available data now allow economists to examine
this question
Union Financial Transparency ReportsIn the wake of hearings documenting Mafia
influence over major unions Congress passed the
Labor-Management Reporting and Disclosure Act
(LMRDA) of 1959 The law requires every private-
sector union to disclose how it spends its membersrsquo
dues Congress intended this transparency to deter
corruption and misconduct but left large loopholes
in the reporting requirements Unions could classify
most of their expenses as ldquomiscellaneousrdquo with no
further detailDuring the George W Bush Administration
Labor Secretary Elaine Chao modernized the regu-
lations to require unions to itemize their expenses
She also had the Department of Labor release the
transparency reports online This data available
from 2005 to 2013 enables researchers to examine
how much unions collect in dues and how much they
pay their top officers
The LMRDA reports do not contain all of the
information that researchers would ideally want
Unions strongly resisted this disclosure and fought
numerous court and regulatory battles against it
They succeeded in delaying the promulgation of two
major rules until shortly before President Barack
Obama took office These rules would have required
unions to disclose the total compensationmdashinclud-
ing benefitsmdashof their officers and required disclo-
sure from union trust funds such as strike benefit
funds Some unions pay their officers supplemental
salaries from trust funds that they control
Shortly after his inauguration President Obama
rescinded these disclosure requirements As a result
the LMRDA reports include neither benefits nor pay-
ments from union trusts Nonetheless they provide
more detail on union financial activities than was
previously available Online publication has made
this data far more accessible The Chao reforms
now allow researchers to determine the base sala-ries of top union officers and the average dues that
union locals charge their members11 The Appendix
explains in detail how the data were compiled
Average DuesTable 1 shows the median and average dues
unions charge their members These figures were
calculated by dividing the total union dues income
by the total membership unions reported on their
disclosure forms Table 1 and most other tables in
this report present the data in two ways weighted
and unweighted The unweighted data treat a unionlocal with 100 members and a local with 1000 mem-
bers equally The weighted figures are weighted by
the number of members in the union For example a
local with 1000 members counts 10 times more than
the 100-member local Both figures provide insights
into how unions respond to right-to-work laws The
unweighted numbers show their impact on the typi-
cal union The weighted numbers show their impact
on the ty pical union member12
Table 1 shows that unions charge workers great-
er dues in states where they can compel payment
Whether looking at medians or averages weighted
9 The Word Doctors ldquoBenchmark Study of Union Employee Election Year Attitudesrdquo October 2010 p 14 Question 41
httpwwwnrtwcorgFactSheets2010NationalRightToWorkLuntzUnionMemberSurveypdf (accessed January 7 2015) The survey used a
representative sample of 760 union members with a margin of error of plus or minus 37 percent The Word Doctors is Frank Luntzrsquos polling
and focus group firm
10 Luke Rosiak ldquoUnion Bossesrsquo Salaries Put lsquoBigrsquo in Big Laborrdquo The Washington Times January 10 2013
httpwwwwashingtontimescomnews2013jan10labor-union-bosses-salaries-put-big-in-big-labor (accessed January 7 2015)
11 Under the old LMRDA regulation unions were required to disclose the salaries they paid their top employees However the lack of online
disclosure meant that researchers had few practical ways of accessing and compiling this data
12 The average union member belongs to a union with above-average union membership
892019 Report on Union Dues amp Officer Salaries In Right-To-Work v Non-Right-To-Work States
httpslidepdfcomreaderfullreport-on-union-dues-officer-salaries-in-right-to-work-v-non-right-to-work 414
4
BACKGROUNDER | NO 2987
JANUARY 26 2015
or unweighted data unions charge substantially
higher dues in every case For example the average
union member pays $432 per year in right-to-work
states but $610 a year in states with compulsory
duesmdash41 percent more13
Table 2 shows another way of examining dues
costs dues per paying member Many unions have
members who formally belong to the union but donot pay dues These include retired members inac-
tive members and honorary members Larger
unions file more thorough disclosure forms that
enable researchers to identify nonpaying mem-
bers14 Table 2 breaks down dues per paying mem-
bers for this smaller subset of unions
Again unions charge higher dues per paying
member in nonndashright-to-work states The average
dues-paying union member pays $515 per year in
right-to-work states versus $656 per year for paying
members in states with mandatory duesmdasha 27 per-
cent difference15
However higher average dues in nonndashright-to-
work states do not necessarily mean that unions take
advantage of their monopoly to extract money from
workers Other factors could be at work For example
unions frequently deride right to work as ldquoright to
work for lessrdquo because workers have lower wages in
right-to-work states This happens because right-to-
work statesmdashconcentrated in the Southmdashhave lowercosts of living and because the South was historical-
ly less developed than the North long before states
began passing right to work Studies controlling for
such differences find that workers in right-to-work
states make no less possibly more than in states
with compulsory dues16
Similarly unions often charge dues as a propor-
tion of workersrsquo incomes If right-to-work states
have lower wages and costs of living this would nat-
urally lead to lower dues payments Further differ-
ent unions often represent different types of work-
ers with different wage levels For example the
13 These figures and all figures in this paper exclude unions located in Washington DC Many unions locate their national headquarters in
Washington These national headquarters largely derive their income from per-capita taxes levied on their local chapters Further it is not
clear that these headquarters should be classified as nonndashright-to-work when they cover locals located in right-to-work states For more
details see the Appendix
14 The Office of Labor Management Standards Form LM-2 includes this more detailed breakdown
15 These figures are expressed in 2013 dollars inflation adjusted with the PCE deflator
16 William J Moore ldquoThe Determinants and Effects of Right-to-Work Laws A Review of the Recent Literaturerdquo Journal of Labor Research
No 19 (Summer 1998) pp 445ndash469 and W Robert Reed ldquoHow Right-to-Work Laws Affect Wagesrdquo Journal of Labor Research Vol 24 No 4
(October 2003) pp 713ndash730
MEDIAN DUES
Right-to-Work Compulsory Dues Difference Difference
Unweighted 983076983091983093983090 983076983092983090983089 983076983094983096 983089983097983086983092
Weighted by total membership 983076983091983094983094 983076983093983090983091 983076983089983093983095 983092983091983086983088
AVERAGE DUES
Right-to-Work Compulsory Dues Difference Difference
Unweighted 983076983092983093983096 983076983093983096983095 983076983089983090983097 983090983096983086983089
Weighted by total membership 983076983092983091983090 983076983094983089983088 983076983089983095983096 983092983089983086983090
Sample size 983091983097983084983095983088983092 983094983093983084983092983095983089
TABLE 1
Median and Average Annual Dues per Member
Source Heritage Foundation calculations using data from 2005ndash2013 union financial reports filed withthe US Department of Labor Offi ce of Labor Management Standards See Appendix for details BG 2987 heritageorg
892019 Report on Union Dues amp Officer Salaries In Right-To-Work v Non-Right-To-Work States
httpslidepdfcomreaderfullreport-on-union-dues-officer-salaries-in-right-to-work-v-non-right-to-work 514
5
BACKGROUNDER | NO 2987
JANUARY 26 2015
UAW primarily represents well-paid manufacturing
employees but has had little success in persuading
Southern workers to join If manufacturing union
membership is concentrated in nonndashright-to-work
states average dues will be higher in those states no
matter how individual locals set their rates
Controlling for Other FactorsEconomists use regression analysis to control
for such extraneous factors Tables 3 and 4 show the
results of regressing average dues per member17 on
mandatory dues requirements and several control
variables Both tables display the results for both
average dues per member and dues per paying mem-
ber Table 3 presents the unweighted results while
Table 4 shows the results weighted by total union
membership and total paying membership
The tables display average percent difference in
dues per member which can be attributed to forced
unionization The p-values also reported in thetables indicate the probability the results differ
from zero by random chance Any p-value less than
005 is considered statistically significant Since all
the p-values are 0012 or less the results are statis-
tically significant The Appendix describes these
regressions in more detail
The first column in each table shows the results
of regressing dues per member (in log form) on just
forced-dues requirements As in Tables 1 and 2 the
regression finds that unions charge significantly
higher dues in nonndashright-to-work states between
19 percent and 30 percent more in the unweight-
ed regressions Weighting for union membership
increases the disparity to between 37 percent and48 percent greater dues18 Larger unions appear to
charge disproportionately higher dues in nonndashright-
to-work states than smaller unions do
The second column controls for the particular
international union such as the United Auto Work-
ers the United Food and Commercial Workers and
the Service Employees International Union This
controls both for differences in dues structures
between unionsmdashsome unions charge higher dues
than othersmdashand differences in average wages
between members of different unions Tables 3 and 4
demonstrate the importance of controlling for suchfactors The estimated premium that unions charge
their members in nonndashright-to-work states drops
by approximately two-thirds in the second column
Much of the difference in union dues between right-
to-work states and nonndashright-to-work states comes
from differences in which unions operate in those
17 Average dues are expressed in log terms Regressing on logged variables has helpful statistical properties
18 These means differ from those in Tables 1 and 2 because in regressions on logged dependent variables the coefficient values reveal the
geometric mean percent difference not the arithmetic mean as in Tables 1 and 2
MEDIAN DUES
Right-to-Work Compulsory Dues Difference Difference
Unweighted 983076983093983088983093 983076983094983095983088 983076983089983094983093 983091983090983086983095
Weighted by total membership 983076983092983091983089 983076983093983091983093 983076983089983088983092 983090983092983086983089
AVERAGE DUES
Right-to-Work Compulsory Dues Difference Difference
Unweighted 983076983095983097983090 983076983097983097983090 983076983090983088983088 983090983093983086983090
Weighted by total membership 983076983093983089983093 983076983094983093983094 983076983089983092983089 983090983095983086983092
Sample size 983094983084983096983093983097 983089983096983084983093983088983095
TABLE 2
Median and Average Annual Dues per Paying Member
Source Heritage Foundation calculations using data from 2005ndash2013 union financial reports filed withthe US Department of Labor Offi ce of Labor Management Standards See Appendix for details BG 2987 heritageorg
892019 Report on Union Dues amp Officer Salaries In Right-To-Work v Non-Right-To-Work States
httpslidepdfcomreaderfullreport-on-union-dues-officer-salaries-in-right-to-work-v-non-right-to-work 614
6
BACKGROUNDER | NO 2987
JANUARY 26 2015
states However the remaining premium remains
highly statistically significant
The third and final column controls for timeeffects and for the average weekly wages of union
members in that state and year This captures
remaining differences in wages between union
members across states such as those driven by dif-
ferences in cost of living These additional variables
have little effect on the overall results which remain
highly statistically significant
The unweighted numbers show that the aver-
age union charges its members 7 percent to 10 per-
cent more in states where it can force workers to
pay dues The weighted numbers show the aver-
age union member gets charged 14 percent to 15
percent more in nonndashright-to-work states Larg-er unions with more members appear to charge
higher premiums
Table 5 shows the results of simply regressing
dues per membermdashwith no logsmdashon control vari-
ables For the sake of conserving space Table 5 shows
only weighted results The unweighted regressions
show similar results As Column 3 shows after con-
trolling for other factors unions still charge their
members approximately $70 per year more in states
lacking right-to-work protections
AVERAGE DUES PER MEMBER
Model specification 983089 983090 983091Percent difference in dues per member 983089983097983086983091 983094983086983089 983094983086983096
Coeffi cient on Forced Dues variable 983088983086983089983095983095 983088983086983088983094983088 983088983086983088983094983094
Standard error 983088983086983088983089983090 983088983086983088983089983090 983088983086983088983089983090
P-value 983088983086983088983088983088 983088983086983088983088983088 983088983086983088983088983088
Controls for
Particular union No Yes Yes
Log of average private-sector union earnings No No Yes
Year No No Yes
Sample size 983089983088983093983084983089983095983093 983097983091983084983088983095983088 983097983091983084983088983095983088
R-squared 983088983086983088983089983090 983088983086983092983091983089 983088983086983092983091983094
AVERAGE DUES PER PAYING MEMBER
Model specification 983089 983090 983091
Percent difference in dues per paying member 983091983088983086983091 983097983086983095 983097983086983096
Coeffi cient on Forced Dues variable 983088983086983090983094983093 983088983086983088983097983091 983088983086983088983097983092
Standard error 983088983086983088983090983095 983088983086983088983090983091 983088983086983088983090983091
P-value 983088983086983088983088983088 983088983086983088983088983088 983088983086983088983088983088
Controls for
Particular union No Yes Yes
Log of average private-sector union earnings No No Yes
Year No No Yes
Sample size 983090983093983084983091983094983094 983090983091983084983089983089983096 983090983091983084983089983089983096
R-squared 983088983086983088983090983093 983088983086983093983091983088 983088983086983093983091983089
TABLE 3
Log Dues per Member Regressed on Forced Dues Requirements and Control Variables
Note Observations are unweightedSource Heritage Foundation calculations using data from the US Census Bureau Current Population Survey andunion financial disclosure reports filed with the US Department of Labor and reported publicly on unionreportsgov See Appendix for details BG 2987 heritageorg
892019 Report on Union Dues amp Officer Salaries In Right-To-Work v Non-Right-To-Work States
httpslidepdfcomreaderfullreport-on-union-dues-officer-salaries-in-right-to-work-v-non-right-to-work 714
7
BACKGROUNDER | NO 2987
JANUARY 26 2015
These results show that unions act like corpo-
rations when using their monopoly power Many
union officers are undoubtedly honorablemdashas are
many corporate officers Nonetheless both unionsand corporations institutionally tend to raise prices
when their customers have no other options Unions
with the ability to compel payment charge workers
approximately one-tenth more than unions that
must earn their membersrsquo voluntary support Right-
to-work laws pressure unions to reduce costs and
improve service or risk losing members
Union Officer SalariesThis ra ises the question of how unions spend the
additional dues that they charge in nonndashright-to-work
states If un ions act like corporate monopolies they would pay some of this money to union officers in
the form of higher salaries Competitive firms try
to reduce unnecessary costsmdashincluding labor costsmdash
to keep their prices down Monopolies that do not
fear competition often operate with considerable
slack including higher pay for their employees and
managers19
19 David G Blanchflower Andrew J Oswald and Peter Sanfey ldquoWages Profits and Rent-Sharingrdquo Quarterly Journal of Economics Vol 111 No 1
(February 1996) pp 227ndash251
AVERAGE DUES PER MEMBERModel specification 983089 983090 983091
Percent difference in dues per member 983092983096983086983090 983089983092983086983091 983089983092983086983092
Coeffi cient on Forced Dues variable 983088983086983091983097983092 983088983086983089983091983092 983088983086983089983091983092
Standard error 983088983086983088983091983093 983088983086983088983092983090 983088983086983088983092983091
P-value 983088983086983088983088983088 983088983086983088983088983090 983088983086983088983088983090
Controls for
Particular union No Yes Yes
Log of average private-sector union earnings No No Yes
Year No No Yes
Sample size 983089983088983093983084983089983095983093 983097983091983084983088983095983088 983097983091983084983088983095983088R-squared 983088983086983088983093983092 983088983086983091983094983095 983088983086983091983095983088
AVERAGE DUES PER PAYING MEMBER
Model specification 983089 983090 983091
Percent difference in dues per paying member 983091983094983086983093 983089983092983086983094 983089983092983086983094
Coeffi cient on Forced Dues variable 983088983086983091983089983089 983088983086983089983091983094 983088983086983089983091983094
Standard error 983088983086983088983093983088 983088983086983088983093983092 983088983086983088983093983092
P-value 983088983086983088983088983088 983088983086983088983089983090 983088983086983088983089983090
Controls for
Particular union No Yes Yes
Log of average private-sector union earnings No No Yes
Year No No Yes
Sample size 983090983093983084983091983094983094 983090983091983084983089983089983096 983090983091983084983089983089983096
R-squared 983088983086983088983091983093 983088983086983091983092983090 983088983086983091983092983090
TABLE 4
Log Dues per Member Regressed on Forced Dues Requirementsand Control Variables Weighted by Union Membership
Note Observations are weighted by total union membership or total paying membershipSource Heritage Foundation calculations using data from the US Census Bureau Current Population Surveyand union financial disclosure reports filed with the US Department of Labor and reported publicly onunionreportsgov See Appendix for details BG 2987 heritageorg
892019 Report on Union Dues amp Officer Salaries In Right-To-Work v Non-Right-To-Work States
httpslidepdfcomreaderfullreport-on-union-dues-officer-salaries-in-right-to-work-v-non-right-to-work 814
8
BACKGROUNDER | NO 2987
JANUARY 26 2015
Unions appear to act no differently Table 6 shows
the average salaries for full-time employees in the
top four positions in many unions president vice
president business manager and treasurer20 These
figures include only gross salary payments that anindividual union reports on its disclosure forms
They do not include benefits or supplemental pay-
ments from other union entities
Union officers make considerably more in nonndash
right-to-work states Without weighting by mem-
bership the average union with a full-time president
pays him just under $90000 annually in a right-to-
work jurisdiction and just over $110000 annually in
states with compulsory dues Likewise the median
union with a full-time president pays him about
$20000 more in nonndashright-to-work states
Weighting by union membership increases aver-age union salaries because larger unions tend to pay
more The weighted figures show the salaries paid to
full-time officers in the unions to which the average
union member belongs
In most cases weighting increases the salary dif-
ference between right-to-work and nonndashright-to-
work states The average union member has a union
20 Not every union employs every officer The top official in some union locals is the president while in others it may be the business manager
Some unions have many vice presidents Others have none
AVERAGE DUES PER MEMBER
Model specification 983089 983090 983091
Coeffi cient on Forced Dues variable 983076983089983095983096983086983089983090 983076983094983096983086983097983090 983076983094983097983086983095983090
Standard error 983076983089983094983086983094983091 983076983090983088983086983091983091 983076983090983088983086983093983096
P-value 983088983086983088983088983088 983088983086983088983088983089 983088983086983088983088983089
Controls for
Particular union No Yes Yes
Log of agerage private-sector union earnings No No Yes
Year No No Yes
Sample size 983089983088983093983084983089983095983093 983097983091983084983088983095983088 983097983091983084983088983095983088
R-squared 983088983086983088983090983097 983088983086983091983095983096 983088983086983091983096983088
AVERAGE DUES PER PAYING MEMBER
Model specification 983089 983090 983091
Coeffi cient on Forced Dues variable 983076983089983092983089983086983091983096 983076983095983089983086983096983093 983076983095983090983086983089983091
Standard error 983076983090983091983086983097983091 983076983090983097983086983090983092 983076983090983097983086983089983089
P-value 983088983086983088983088983088 983088983086983088983089983092 983088983086983088983089983091
Controls for
Particular union No Yes Yes
Log of average private-sector union earnings No No Yes
Year No No Yes
Sample size 983090983093983084983091983094983094 983090983091983084983089983089983096 983090983091983084983089983089983096
R-squared 983088983086983088983089983090 983088983086983092983088983092 983088983086983092983088983093
TABLE 5
Dues per Member Regressed on Forced Dues Requirements and Control Variables
Note Observations are weighted by total union membership or total paying membershipSource Heritage Foundation calculations using data from the US Census Bureau Current Population Surveyand union financial disclosure reports filed with the US Department of Labor and reported publicly onunionreportsgov See Appendix for details BG 2987 heritageorg
892019 Report on Union Dues amp Officer Salaries In Right-To-Work v Non-Right-To-Work States
httpslidepdfcomreaderfullreport-on-union-dues-officer-salaries-in-right-to-work-v-non-right-to-work 914
9
BACKGROUNDER | NO 2987
JANUARY 26 2015
president who makes $170000 annually in states
with compulsory dues but only $132000 in states
with voluntary duesmdasha $38000 difference Agai n other factors could influence this gap
Southern statesmdashalmost entirely right to workmdash
generally have lower wages and lower costs of liv-
ing21 Economists would expect unions in these
states to pay lower salaries As with dues charged
controlling for other factors substantially reduces
the difference between right-to-work and com-
pulsory-dues states However a significant pre-
mium for union officers in nonndashright-to-work
states remains
Table 7 and Table 8 show the unweighted and
weighted regressions for the log of union officersrsquosalaries on forced-dues requirements and control
variables for each of the four separate union posi-
tions They follow the same format as the regres-
sions on dues per member The first column shows a
simple regression of logged salaries on an indicator
for compulsory-dues requirements The second col-
umn adds controls for the particular international
union that employs the officers The third columnadds controls for average union member (not officer)
earnings in that state and year the size of the union
and the particular year22 All figures are in inflation-
adjusted 2013 dollars
In the unweighted regressions after controlling
for all other factors and looking only at full-time
employees the average union pays its president 12
percent more its vice presidents 7 percent more its
business manager 22 percent more and its treasurer
13 percent more in states with forced dues The dif-
ferences are highly statistically significant for presi-
dents business managers and treasurers The esti-mate for vice presidents was statistically significant
at the 6 percent level
Weighted by union membership and controlling
for other factors the pay premium for the aver-
age union membersrsquo president is not statistically
21 Every Southern state except Kentucky and Missouri has a right-to-work law
22 Total union membership was omitted as a control from the regressions on dues per member because it entered into the denominator of the
dependent variable
UNWEIGHTED
MEDIAN SALARY AVERAGE SALARY SAMPLE SIZE
Right-to-Work
CompulsoryDues Difference
Right-to-Work
CompulsoryDues Difference
Right-to-Work
CompulsoryDues
President 983076983095983094983084983096983095983091 983076983097983095983084983088983090983091 983076983090983088983084983089983093983088 (983090983094983086983090) 983076983096983096983084983097983095983090 983076983089983089983089983084983096983097983093 983076983090983090983084983097983090983091 (983090983093983086983096) 983090983084983093983094983095 983095983084983094983089983095
Vice-President 983076983095983092983084983097983093983093 983076983097983095983084983097983088983097 983076983090983090983084983097983093983093 (983091983088983086983094) 983076983096983096983084983091983089983090 983076983089983088983093983084983088983089983091 983076983089983094983084983095983088983088 (983089983096983086983097) 983089983084983090983094983093 983094983084983089983093983095
Treasurer 983076983096983089983084983091983096983090 983076983097983096983084983094983091983091 983076983089983095983084983090983093983090 (983090983089983086983090) 983076983096983096983084983097983092983094 983076983089983088983097983084983096983092983091 983076983090983088983084983096983097983094 (983090983091983086983093) 983089983084983092983095983092 983094983084983093983093983092
Business Manager 983076983095983097983084983092983096983088 983076983089983088983088983084983094983090983089 983076983090983089983084983089983092983088 (983090983094983086983094) 983076983096983094983084983094983091983094 983076983089983088983097983084983097983089983089 983076983090983091983084983090983095983092 (983090983094983086983097) 983089983084983088983097983096 983092983084983088983089983097
WEIGHTED BY TOTAL MEMBERSHIP
MEDIAN SALARY AVERAGE SALARY SAMPLE SIZE
Right-to-Work
CompulsoryDues Difference
Right-to-Work
CompulsoryDues Difference
Right-to-Work
CompulsoryDues
President 983076983089983088983091983084983095983090983094 983076983089983094983095983084983094983095983090 983076983094983091983084983097983092983095 (983094983089983086983094) 983076983089983091983090983084983092983090983088 983076983089983095983088983084983088983093983095 983076983091983095983084983094983091983094 (983090983096983086983092) 983090983084983093983090983091 983095983084983093983089983089
Vice-President 983076983097983097983084983094983093983092 983076983089983090983094983084983091983088983094 983076983090983094983084983094983093983090 (983090983094983086983095) 983076983089983089983091983084983097983095983094 983076983089983091983092983084983089983092983088 983076983090983088983084983089983094983092 (983089983095983086983095) 983089983084983090983094983091 983094983084983089983088983089
Treasurer 983076983089983088983095983084983097983088983091 983076983089983092983097983084983096983095983092 983076983092983089983084983097983095983089 (983091983096983086983097) 983076983089983090983089983084983094983096983096 983076983089983093983097983084983090983090983090 983076983091983095983084983093983091983093 (983091983088983086983096) 983089983084983092983094983091 983094983084983092983094983088
Business Manager 983076983096983097983084983090983097983094 983076983089983090983093983084983094983094983088 983076983091983094983084983091983094983092 (983092983088983086983095) 983076983097983096983084983091983092983093 983076983089983091983092983084983093983094983094 983076983091983094983084983090983090983088 (983091983094983086983096) 983089983084983088983096983093 983091983084983097983095983095
TABLE 6
Salaries for Full-Time Top Union Offi cers in Compulsory Duesand Right-to-Work States
Source Heritage Foundation calculations using data from 2005ndash2013 union financial reports filed withthe US Department of Labor Offi ce of Labor Management Standards See Appendix for details BG 2987 heritageorg
892019 Report on Union Dues amp Officer Salaries In Right-To-Work v Non-Right-To-Work States
httpslidepdfcomreaderfullreport-on-union-dues-officer-salaries-in-right-to-work-v-non-right-to-work 1014
10
BACKGROUNDER | NO 2987
JANUARY 26 2015
significant23 However the other three offices all
show large and highly significant pay differences
for full-time employees The typical union mem-
bersrsquo vice presidents make 13 percent more busi-ness managers make 17 percent more and trea-
surers make 9 percent more in the absence of a
right-to-work law
Table 9 shows the results of regressing dues
requirements and control variables on officersrsquo gross
salaries (instead of the log) To conserve space and
for ease of presentation the table shows only thepreferred model specification in the third column of
Tables 7 and 8 which includes all of the control vari-
ables It is also weighted by union membership24
23 The 47 percent pay premium for union presidents when weighted by union membership does not approach statistical significance because
it could arise from pure chance 188 percent of the time However this lack of significance could arise from random chance Just as a table of
random numbers will occasionally have some statistically significant differences a series of true relationships will occasionally fail to exhibit
statistical significance
24 Specifications (1) and (2) also showed large and statistically significant differences between right-to-work and nonndashright-to-work states as
did the unweighted regressions
PRESIDENT VICE PRESIDENTModel specification 983089 983090 983091 983089 983090 983091
Percentage difference in salaries 983090983091983086983088 983089983097983086983091 983089983090983086983092 983090983089983086983088 983089983095983086983094 983094983086983093
Coeffi cient on Forced Dues variable 983088983086983090983088983095 983088983086983089983095983095 983088983086983089983089983095 983088983086983089983097983089 983088983086983089983094983090 983088983086983088983094983091
Standard error 983088983086983088983089983097 983088983086983088983090983093 983088983086983088983090983090 983088983086983088983093983090 983088983086983088983092983091 983088983086983088983091983091
P-value 983088983086983088983088983088 983088983086983088983088983088 983088983086983088983088983088 983088983086983088983088983088 983088983086983088983088983088 983088983086983088983094983088
Controls for983098
Particular union No No Yes No Yes Yes
Year No Yes Yes No No Yes
Log membership size No Yes Yes No No Yes
Log of average private-sector union earnings No Yes Yes No No Yes
Sample size 983089983088983084983089983096983092 983097983084983088983091983093 983096983084983097983088983092 983095983084983092983090983090 983094983084983094983097983088 983094983084983094983091983097
R-squared 983088983086983088983092983097 983088983086983090983093983088 983088983086983091983097983090 983088983086983088983092983090 983088983086983090983097983096 983088983086983092983092983094
BUSINESS MANAGER TREASURER
Model specification 983089 983090 983091 983089 983090 983091
Percentage difference in salaries 983090983094983086983090 983090983094983086983097 983090983090983086983089 983090983089983086983094 983090983089983086983094 983089983091983086983092
Coeffi cient on Forced Dues variable 983088983086983090983091983091 983088983086983090983091983097 983088983086983090983088983088 983088983086983089983097983093 983088983086983089983097983093 983088983086983089983090983094
Standard error 983088983086983088983090983093 983088983086983088983090983090 983088983086983088983089983097 983088983086983088983090983090 983088983086983088983090983091 983088983086983089983090983094
P-value 983088983086983088983088983088 983088983086983088983088983088 983088983086983088983088983088 983088983086983088983088983088 983088983086983088983088983088 983088983086983088983088983088
Controls for983098
Particular union No Yes Yes No Yes Yes
Year No No Yes No No Yes
Log membership size No No Yes No No Yes
Log of average private-sector union earnings No No Yes No No Yes
Sample size 983093983084983089983089983095 983093983084983088983094983093 983093983084983088983089983088 983096983084983088983090983096 983095983084983093983095983090 983095983084983092983095983090
R-squared 983088983086983088983095983097 983088983086983089983096983089 983088983086983091983093983096 983088983086983088983092983089 983088983086983090983088983088 983088983086983091983095983096
TABLE 7
Full-Time Log Offi cer Salaries Regressed on Forced Dues Requirementsand Control Variables
Notes Observations are unweighted ndash Statistically insignificantSource Heritage Foundation calculations using data from the US Census Bureau Current Population Surveyand union financial disclosure reports filed with the US Department of Labor and reported publicly onunionreportsgov See Appendix for details BG 2987 heritageorg
892019 Report on Union Dues amp Officer Salaries In Right-To-Work v Non-Right-To-Work States
httpslidepdfcomreaderfullreport-on-union-dues-officer-salaries-in-right-to-work-v-non-right-to-work 1114
11
BACKGROUNDER | NO 2987
JANUARY 26 2015
This linear specification continues to show that
after controlling for other factors full-time union
officers collect substantially higher salaries in states
with compulsory dues Union presidents make$12800 more per year vice presidents make $19500
more business managers make $30000 more and
treasurers make $23200 more
The officers representing the typical union mem-
ber make roughly $20000 more per year thanks
to forced unionization Compulsory dues enable
unions to force workers to pay higher dues Part of
those funds flow back to their officers in the form of
higher salaries
Right to Work Protects WorkersCompulsory dues give unions a monopoly in the
workplace The absence of a right-to-work law forces
workers to purchase union representation regard-
less of how their union performs UAW Commit-
teeman Chad Poynor recently admitted to The New
York Times ldquoYou hear people all the time say lsquoIf I
were in a right-to-work state Irsquod withdrawrsquordquo25
25 Shalia Dewan ldquoFoes of Unions Try Their Luck in County Lawsrdquo The New York Times December 18 2014
httpwwwnytimescom20141219uspoliticsfoes-of-unions-try-their-luck-in-county-lawshtml (accessed January 7 2015)
PRESIDENT VICE PRESIDENTModel specification 983089 983090 983091 983089 983090 983091
Percentage difference in salaries 983091983089983086983088 983090983089983086983090 983092983086983095 983090983088983086983094 983089983096983086983096 983089983090983086983095
Coeffi cient on Forced Dues variable 983076983088983086983090983095983088 983076983088983086983089983097983090 983076983088983086983088983092983094 983088983086983089983096983096 983088983086983089983095983090 983088983086983089983089983097
Standard error 983076983088983086983088983096983095 983076983088983086983088983093983089 983076983088983086983088983091983093 983088983086983089983090983090 983088983086983088983092983088 983088983086983088983091983092
P-value 983088983086983088983088983090 983088983086983088983088983088 983088983086983089983096983096 983088983086983089983090983094 983088983086983088983088983088 983088983086983088983088983088
Controls for983098
Particular union No Yes Yes No Yes Yes
Year No No Yes No No Yes
Log membership size No No Yes No No Yes
Log of average private-sector union earnings No No Yes No No Yes
Sample size 983089983088983084983088983091983092 983096983084983097983088983092 983096983084983097983088983092 983095983084983091983094983092 983094983084983094983091983097 983094983084983094983091983097R-squared 983076983088983086983088983091983091 983076983088983086983092983089983094 983076983088983086983093983092983088 983088983086983088983089983094 983088983086983092983094983093 983088983086983093983090983093
BUSINESS MANAGER TREASURER
Model specification 983089 983090 983091 983089 983090 983091
Percentage difference in salaries 983091983093983086983093 983091983093983086983091 983089983095983086983088 983091983089983086983093 983090983091983086983088 983097983086983091
Coeffi cient on Forced Dues variable 983088983086983091983088983092 983088983086983091983088983090 983088983086983089983093983095 983088983086983090983095983092 983088983086983090983088983095 983088983086983088983096983097
Standard error 983088983086983088983095983093 983088983086983088983093983090 983088983086983088983091983097 983088983086983088983097983090 983088983086983088983093983093 983088983086983088983091983091
P-value 983088983086983088983088983088 983088983086983088983088983088 983088983086983088983088983088 983088983086983088983088983091 983088983086983088983088983088 983088983086983088983088983095
Controls for983098
Particular union No Yes Yes No Yes Yes
Year No No Yes No No Yes
Log membership size No No Yes No No Yes
Log of average private-sector union earnings No No Yes No No Yes
Sample size 983093983084983088983094983090 983093983084983088983089983088 983093983084983088983089983088 983095983084983097983090983091 983095983084983092983095983090 983095983084983092983095983090
R-squared 983088983086983088983093983091 983088983086983091983093983091 983088983086983094983089983093 983088983086983088983091983091 983088983086983091983092983093 983088983086983093983088983094
TABLE 8
Log Full-Time Offi cer Salaries Regressed on Forced Dues Requirementsand Control Variables Weighted by Total Union Membership
Notes Observations are weighted by total union membership ndash Statistically insignificantSource Heritage Foundation calculations using data from the US Census Bureau Current Population Surveyand union financial disclosure reports filed with the US Department of Labor and reported publicly onunionreportsgov See Appendix for details BG 2987 heritageorg
892019 Report on Union Dues amp Officer Salaries In Right-To-Work v Non-Right-To-Work States
httpslidepdfcomreaderfullreport-on-union-dues-officer-salaries-in-right-to-work-v-non-right-to-work 1214
12
BACKGROUNDER | NO 2987
JANUARY 26 2015
Unions use their monopoly position the same way
corporations do They raise their prices and pay their
employees more Because workers in nonndashright-to-
work states ca nnot opt out unions have little incen-
tive to hold down either dues or labor costs
Of course many union officers truly want to
improve workersrsquo lives However without right-to- work laws unions face few institutional pressures to
put their membersrsquo interests first They do not need
to persuade workers that the benefits of union repre-
sentation outweigh its costs They can simply force
them to pay dues or be fired The lack of incentives to
economize leads to higher costs for union members
and inflated salaries for their officers
Unions complain that right to work forces them
to represent free riders Besides its legal inaccu-
racy this claim has the problem backwards26 The
absence of right-to-work laws allows unions to free
ride on captive customers Controlling for other fac-
tors unions charge 10 percent higher dues and pay
their top officers $20000 more annually in nonndashright-to-work states
Right-to-work laws protect workers from a union
monopoly Voluntary dues require unions earn
workersrsquo support
mdashJames Sherk is Senior Policy Analyst in Labor
Economics in the Center for Data Analysis of the
Institute for Economic Freedom and Opportunity at
The Heritage Foundation
26 The Supreme Court has repeatedly ruled that the National Labor Relations Act allows unions to negotiate contracts covering only dues-paying
members As Justice William J Brennan wrote in Retail Clerks v Dry Lion Goods (1962) ldquolsquoMembers onlyrsquo contracts have long been recognizedrdquo
Unions represent non-members only when they act as ldquoexclusive bargaining representativesrdquo which requires non-members to accept the
unionrsquos representation In that case the law requires unions to represent non-members fairly They cannot negotiate high wages for their
supporters and the minimum wage for non-members Unions can avoid representing non-members by disclaiming exclusive representative
status 369 US 17 (1962)
Model specification President Vice President Business Manager Treasurer
Difference in salaries in Forced Dues states 983076983089983090983084983096983090983092 983076983089983097983084983093983092983093 983076983091983088983084983088983093983089 983076983090983091983084983090983092983088
Standard error 983076983094983084983092983093983090 983076983093983084983091983095983094 983076983095983084983096983092983091 983076983094983084983096983093983095
P-value 983088983086983088983092983095 983088983086983088983088983088 983088983086983088983088983088 983088983086983088983088983089
Sample size 983096983084983097983088983092 983094983084983094983091983097 983093983084983088983089983088 983095983084983092983095983090
R-squared 983088983086983093983091983093 983088983086983093983090983091 983088983086983091983095983091 983088983086983092983090983090
TABLE 9
Full-Time Offi cer Salaries Regressed on Forced Dues Requirementsand Control Variables Weighted by Total Union Membership
Note Observations are weighted by total union membership The regression model used to arrive at these estimates used the same specificationand control variables as used in specification 3 in Tables 7 and 8 with all variables specified in linear and not log form These controls includedummy variables for the year individual union average earnings of union members in that state and year and union size
Source Heritage Foundation calculations using data from the US Census Bureau Current Population Survey and union financial disclosurereports filed with the US Department of Labor and reported publicly on unionreportsgov See Appendix for details
BG 2987 heritageorg
892019 Report on Union Dues amp Officer Salaries In Right-To-Work v Non-Right-To-Work States
httpslidepdfcomreaderfullreport-on-union-dues-officer-salaries-in-right-to-work-v-non-right-to-work 1314
13
BACKGROUNDER | NO 2987
JANUARY 26 2015
Appendix
The Heritage Foundationrsquos Center for Data Anal-
ysis (CDA) calculated these figures using data for
2005ndash2013 from the Department of Laborrsquos Office
of Labor-Management Standards (OLMS) yearly
labor-management (LM) data and the Current Pop-
ulation Survey These data are publicly available
online at no cost27
All LM forms require unions to identify how
many members they had that year The subset of
unions that file the LM-2 forms must also break
down their members by category The CDA used a
regular expression match to identify subgroups of
these categories unlikely to pay dues such as mem-
bers in the ldquolaid offrdquo ldquoretiredrdquo and ldquofree duesrdquo cat-egories These members were subtracted from the
larger category of overall membership to arrive at an
estimate of the number of dues-paying members in
union locals filing LM-2 forms The CDA construct-
ed the dues-per-member and dues-per-paying-
member variables by dividing the total amount that
a union reported collecting in dues and agency fees
by the number of members and dues-paying member
variables respectively All the dues and officer sala-
ry figures were converted to 2013 dollars using the
Personal Consumption Expenditures price index
The LMRDA applies to unions that have at leastone private-sector member Consequently the
LMRDA filings used in this analysis exclude the local
chapters of most government unions Some govern-
ment unions do represent private-sector workers
such as teachers unions that have organized private
schools Such unions must file federal disclosure
reports and this analysis includes them
In many unions local chapters directly collect
dues Those locals then remit a per-capita tax to their
state andor international headquarters The state
and national headquarters consequently report far
lower ldquodues per memberrdquo because their incomecomes from levies on their local chapters not direct-
ly collected dues The CDA excluded such unions
from the dues-per-member analysis by examining
only unions that derived at least two-thirds of their
revenues from dues and agency fees
Some unions reported implausibly large or
small annual dues-per-member figures even after
this exclusion For example one union charged an
estimated $1 per member per year while another
charged more than $1000000 per member per
year Such outliers are primarily the result of either
(a) data or reporting errors such as misplaced dec-
imal places and zeros in completed forms or (b)
state or national headquarters with limited direct
dues income but large memberships To prevent
such data errors from biasing the results the CDArestricted attention to unions that charged more
than $50 but less than $10000 in annual dues This
captures over 95 percent of unions while exclud-
ing implausible outliers The results were robust to
using alternative cutoffs
The CDA used a regular expression match on
the job titles reported in the OLMS filings to create
dummy variables identifying the four top positions
in most unions president vice president business
manager and treasurer (sometimes secretary-trea-
surer) The categories are mutually exclusive Some-
one reported as ldquopresident and treasurerrdquo on theforms was classified in this analysis as only a union
president and not as a treasurer
The LMRDA filings do not directly indicate
full-time and part-time or full-year and part-year
employees Taken at face value this can produce
seriously misleading estimates of union compensa-
tion For example in 2011 Carpenters Local 1024
reported paying its president $2130 on its LM-2
forms28 Further analysis of the localrsquos 990 forms
filed with the IRS revealed that the president report-
ed working two hours a week To focus the analysis
on full-time employees the CDA excluded officers who did not make at least $50000 a year These
restrictions considerably reduced the sample size
27 See US Department of Labor Office of Labor-Management Standards ldquoDownload Yearly Datardquo
httpkcerdsdol-esagovquerygetYearlyDatado (accessed January 7 2015) and National Bureau of Economic Research ldquoCPS Merged
Outgoing Rotation Groupsrdquo httpwwwnberorgmorgannual (accessed January 7 2015)
28 United Brotherhood of Carpenters Local 1024 ldquoForm LM-2 Labor Organization Annual Reportrdquo US Department of Labor Office of Labor-
Management Standards 2011 File No 011-457 httpkcerdsdol-esagovquerygetOrgQrydo (accessed January 7 2015) It is unknown
whether the president received additional payments from separate union trust funds because disclosure of these funds is not required
892019 Report on Union Dues amp Officer Salaries In Right-To-Work v Non-Right-To-Work States
httpslidepdfcomreaderfullreport-on-union-dues-officer-salaries-in-right-to-work-v-non-right-to-work 1414
BACKGROUNDER | NO 2987
JANUARY 26 2015
Sensitivity tests found that removing this restric-
tion produced similar results to those presented in
the main paper29 Also excluded were officers who
did not work for the union the year before or the year
after the filing so as to exclude employees who joined
or left the union partway through the year 30
The CDA identified workers as subject to com-
pulsory dues if they (1) lived in a nonndashright-to-
work state or (2) belonged to a union subject to the
Railway Labor Act principally airline and railway
unions It excluded unions located in Indiana or
Michigan after they passed their right-to-work laws
as well as unions located in Washington DC The
right-to-work status of these unions was ambiguous
Indiana and Michigan passed right-to-work laws
which took effect in 2012 and 2013 respectively andapplied only to union contracts renewed after that
time Many unions filing LMRDA reports in those
states still enjoyed compulsory-dues powers in 2013
For example the UAW contracts with the Big Three
automakers requiring compulsory dues run through
2015 Many unions representing workers in both
right-to-work and nonndashright-to-work states have
their national headquarters in Washington
The CDA used a regular expression match on
union names in LM filings to create dummy vari-
ables for the most common unions to which work-
ers belong such as the Machinists the Boilermakersand the Food and Commercial Workers
Data from the Current Population Survey outgo-
ing rotation groups was used to estimate the average
weekly earnings of private-sector unions by state
and year These averages excluded union members
with imputed earnings because the Census Bureau
does not use union membership status as a matching
variable for imputation
The CDA conducted the analysis using OLS
regressions on the log and level of dues per member
and officer salaries The CDA used heteroskedastici-
ty robust errors clustered by union local throughoutOne concern is that clustering does not sufficiently
account for the increase in sample size driven by
the panel dimension of the datamdashrepeated observa-
tions from many of the same unions over time The
CDA ran the analysis in a panel-data format using
Driscoll-Kraay standard errors and found very simi-
lar results31 It also ran the analysis using a panel data
specification and both random effects and between
effects estimators The results from these analyses
were also highly statistically significant and very
similar to the unweighted regressions reported here
Stata does not produce weighted random effects or
between effects estimates
The CDA did not use either state or union local
fixed effects in its analysis because right-to-work
laws varied little within states or union locals dur-
ing this period Including such fixed effects would
absorb all variation in right-to-work status except
that caused by passage of the Indiana and Michigan
right-to-work laws in 2012mdashlaws that had not taken
effect for many union locals by 2013 Additional variables included dummy variables
for year the particular international union repre-
senting workers the log or level of average union
earnings and total union membership Alternative
specifications for the control variables such as high-
er-order polynomials of union membership size had
little effect on the overall results
When weighting union officersrsquo salaries by union
membership the CDA divided by the total number
of such officers in that union local For example if
a union local had three vice presidents the analysis
would give each of those officersrsquo salary one-thirdof the weight of a solitary vice presidentrsquos salary in
a local with the same number of members This was
done so that the final weighted estimates would
reflect the average salaries paid to the top officers
representing the typical union member
The CDA also examined the effect of forced-dues
requirements on total disbursements to union offi-
cers including both gross salaries and reimburse-
ments for official expenses such as work meals and
travel expenses Mandatory dues requirements had
a modestly larger effect on total disbursements than
on gross salaries However detailed examination of whether the additional disbursements beyond sala-
ries resulted from a greater workload or from addi-
tional non-salary compensation is beyond the scope
of this paper These results are available from the
author upon request
29 The proportional difference in salaries was similar and highly statistically significant The absolute magnitude of the salary differences
decreased when the analysis included lower-earning part-time employees
30 For 2013 filings this restriction was relaxed to exclude only employees who did not work for the union the year before
31 Driscoll-Kraay standard errors are robust to both between and within correlation in panel data
892019 Report on Union Dues amp Officer Salaries In Right-To-Work v Non-Right-To-Work States
httpslidepdfcomreaderfullreport-on-union-dues-officer-salaries-in-right-to-work-v-non-right-to-work 314
3
BACKGROUNDER | NO 2987
JANUARY 26 2015
believe their union has earned its keep Economic
theory predicts that unions would take advantage
of this monopoly to charge their members higher
dues and that this monopoly would reduce the pres-
sure to hold down costs including the salaries of top
union officers
Some evidence indicates unions in fact act like
other monopolies Polls show that a majority of
union members believe that their dues are too high
for the value they receive9 Press reports often high-
light the high salaries that top union officers col-
lect10 However to date economists have given little
empirical attention to whether unions institutional-
ly take advantage of their monopoly position Newly
available data now allow economists to examine
this question
Union Financial Transparency ReportsIn the wake of hearings documenting Mafia
influence over major unions Congress passed the
Labor-Management Reporting and Disclosure Act
(LMRDA) of 1959 The law requires every private-
sector union to disclose how it spends its membersrsquo
dues Congress intended this transparency to deter
corruption and misconduct but left large loopholes
in the reporting requirements Unions could classify
most of their expenses as ldquomiscellaneousrdquo with no
further detailDuring the George W Bush Administration
Labor Secretary Elaine Chao modernized the regu-
lations to require unions to itemize their expenses
She also had the Department of Labor release the
transparency reports online This data available
from 2005 to 2013 enables researchers to examine
how much unions collect in dues and how much they
pay their top officers
The LMRDA reports do not contain all of the
information that researchers would ideally want
Unions strongly resisted this disclosure and fought
numerous court and regulatory battles against it
They succeeded in delaying the promulgation of two
major rules until shortly before President Barack
Obama took office These rules would have required
unions to disclose the total compensationmdashinclud-
ing benefitsmdashof their officers and required disclo-
sure from union trust funds such as strike benefit
funds Some unions pay their officers supplemental
salaries from trust funds that they control
Shortly after his inauguration President Obama
rescinded these disclosure requirements As a result
the LMRDA reports include neither benefits nor pay-
ments from union trusts Nonetheless they provide
more detail on union financial activities than was
previously available Online publication has made
this data far more accessible The Chao reforms
now allow researchers to determine the base sala-ries of top union officers and the average dues that
union locals charge their members11 The Appendix
explains in detail how the data were compiled
Average DuesTable 1 shows the median and average dues
unions charge their members These figures were
calculated by dividing the total union dues income
by the total membership unions reported on their
disclosure forms Table 1 and most other tables in
this report present the data in two ways weighted
and unweighted The unweighted data treat a unionlocal with 100 members and a local with 1000 mem-
bers equally The weighted figures are weighted by
the number of members in the union For example a
local with 1000 members counts 10 times more than
the 100-member local Both figures provide insights
into how unions respond to right-to-work laws The
unweighted numbers show their impact on the typi-
cal union The weighted numbers show their impact
on the ty pical union member12
Table 1 shows that unions charge workers great-
er dues in states where they can compel payment
Whether looking at medians or averages weighted
9 The Word Doctors ldquoBenchmark Study of Union Employee Election Year Attitudesrdquo October 2010 p 14 Question 41
httpwwwnrtwcorgFactSheets2010NationalRightToWorkLuntzUnionMemberSurveypdf (accessed January 7 2015) The survey used a
representative sample of 760 union members with a margin of error of plus or minus 37 percent The Word Doctors is Frank Luntzrsquos polling
and focus group firm
10 Luke Rosiak ldquoUnion Bossesrsquo Salaries Put lsquoBigrsquo in Big Laborrdquo The Washington Times January 10 2013
httpwwwwashingtontimescomnews2013jan10labor-union-bosses-salaries-put-big-in-big-labor (accessed January 7 2015)
11 Under the old LMRDA regulation unions were required to disclose the salaries they paid their top employees However the lack of online
disclosure meant that researchers had few practical ways of accessing and compiling this data
12 The average union member belongs to a union with above-average union membership
892019 Report on Union Dues amp Officer Salaries In Right-To-Work v Non-Right-To-Work States
httpslidepdfcomreaderfullreport-on-union-dues-officer-salaries-in-right-to-work-v-non-right-to-work 414
4
BACKGROUNDER | NO 2987
JANUARY 26 2015
or unweighted data unions charge substantially
higher dues in every case For example the average
union member pays $432 per year in right-to-work
states but $610 a year in states with compulsory
duesmdash41 percent more13
Table 2 shows another way of examining dues
costs dues per paying member Many unions have
members who formally belong to the union but donot pay dues These include retired members inac-
tive members and honorary members Larger
unions file more thorough disclosure forms that
enable researchers to identify nonpaying mem-
bers14 Table 2 breaks down dues per paying mem-
bers for this smaller subset of unions
Again unions charge higher dues per paying
member in nonndashright-to-work states The average
dues-paying union member pays $515 per year in
right-to-work states versus $656 per year for paying
members in states with mandatory duesmdasha 27 per-
cent difference15
However higher average dues in nonndashright-to-
work states do not necessarily mean that unions take
advantage of their monopoly to extract money from
workers Other factors could be at work For example
unions frequently deride right to work as ldquoright to
work for lessrdquo because workers have lower wages in
right-to-work states This happens because right-to-
work statesmdashconcentrated in the Southmdashhave lowercosts of living and because the South was historical-
ly less developed than the North long before states
began passing right to work Studies controlling for
such differences find that workers in right-to-work
states make no less possibly more than in states
with compulsory dues16
Similarly unions often charge dues as a propor-
tion of workersrsquo incomes If right-to-work states
have lower wages and costs of living this would nat-
urally lead to lower dues payments Further differ-
ent unions often represent different types of work-
ers with different wage levels For example the
13 These figures and all figures in this paper exclude unions located in Washington DC Many unions locate their national headquarters in
Washington These national headquarters largely derive their income from per-capita taxes levied on their local chapters Further it is not
clear that these headquarters should be classified as nonndashright-to-work when they cover locals located in right-to-work states For more
details see the Appendix
14 The Office of Labor Management Standards Form LM-2 includes this more detailed breakdown
15 These figures are expressed in 2013 dollars inflation adjusted with the PCE deflator
16 William J Moore ldquoThe Determinants and Effects of Right-to-Work Laws A Review of the Recent Literaturerdquo Journal of Labor Research
No 19 (Summer 1998) pp 445ndash469 and W Robert Reed ldquoHow Right-to-Work Laws Affect Wagesrdquo Journal of Labor Research Vol 24 No 4
(October 2003) pp 713ndash730
MEDIAN DUES
Right-to-Work Compulsory Dues Difference Difference
Unweighted 983076983091983093983090 983076983092983090983089 983076983094983096 983089983097983086983092
Weighted by total membership 983076983091983094983094 983076983093983090983091 983076983089983093983095 983092983091983086983088
AVERAGE DUES
Right-to-Work Compulsory Dues Difference Difference
Unweighted 983076983092983093983096 983076983093983096983095 983076983089983090983097 983090983096983086983089
Weighted by total membership 983076983092983091983090 983076983094983089983088 983076983089983095983096 983092983089983086983090
Sample size 983091983097983084983095983088983092 983094983093983084983092983095983089
TABLE 1
Median and Average Annual Dues per Member
Source Heritage Foundation calculations using data from 2005ndash2013 union financial reports filed withthe US Department of Labor Offi ce of Labor Management Standards See Appendix for details BG 2987 heritageorg
892019 Report on Union Dues amp Officer Salaries In Right-To-Work v Non-Right-To-Work States
httpslidepdfcomreaderfullreport-on-union-dues-officer-salaries-in-right-to-work-v-non-right-to-work 514
5
BACKGROUNDER | NO 2987
JANUARY 26 2015
UAW primarily represents well-paid manufacturing
employees but has had little success in persuading
Southern workers to join If manufacturing union
membership is concentrated in nonndashright-to-work
states average dues will be higher in those states no
matter how individual locals set their rates
Controlling for Other FactorsEconomists use regression analysis to control
for such extraneous factors Tables 3 and 4 show the
results of regressing average dues per member17 on
mandatory dues requirements and several control
variables Both tables display the results for both
average dues per member and dues per paying mem-
ber Table 3 presents the unweighted results while
Table 4 shows the results weighted by total union
membership and total paying membership
The tables display average percent difference in
dues per member which can be attributed to forced
unionization The p-values also reported in thetables indicate the probability the results differ
from zero by random chance Any p-value less than
005 is considered statistically significant Since all
the p-values are 0012 or less the results are statis-
tically significant The Appendix describes these
regressions in more detail
The first column in each table shows the results
of regressing dues per member (in log form) on just
forced-dues requirements As in Tables 1 and 2 the
regression finds that unions charge significantly
higher dues in nonndashright-to-work states between
19 percent and 30 percent more in the unweight-
ed regressions Weighting for union membership
increases the disparity to between 37 percent and48 percent greater dues18 Larger unions appear to
charge disproportionately higher dues in nonndashright-
to-work states than smaller unions do
The second column controls for the particular
international union such as the United Auto Work-
ers the United Food and Commercial Workers and
the Service Employees International Union This
controls both for differences in dues structures
between unionsmdashsome unions charge higher dues
than othersmdashand differences in average wages
between members of different unions Tables 3 and 4
demonstrate the importance of controlling for suchfactors The estimated premium that unions charge
their members in nonndashright-to-work states drops
by approximately two-thirds in the second column
Much of the difference in union dues between right-
to-work states and nonndashright-to-work states comes
from differences in which unions operate in those
17 Average dues are expressed in log terms Regressing on logged variables has helpful statistical properties
18 These means differ from those in Tables 1 and 2 because in regressions on logged dependent variables the coefficient values reveal the
geometric mean percent difference not the arithmetic mean as in Tables 1 and 2
MEDIAN DUES
Right-to-Work Compulsory Dues Difference Difference
Unweighted 983076983093983088983093 983076983094983095983088 983076983089983094983093 983091983090983086983095
Weighted by total membership 983076983092983091983089 983076983093983091983093 983076983089983088983092 983090983092983086983089
AVERAGE DUES
Right-to-Work Compulsory Dues Difference Difference
Unweighted 983076983095983097983090 983076983097983097983090 983076983090983088983088 983090983093983086983090
Weighted by total membership 983076983093983089983093 983076983094983093983094 983076983089983092983089 983090983095983086983092
Sample size 983094983084983096983093983097 983089983096983084983093983088983095
TABLE 2
Median and Average Annual Dues per Paying Member
Source Heritage Foundation calculations using data from 2005ndash2013 union financial reports filed withthe US Department of Labor Offi ce of Labor Management Standards See Appendix for details BG 2987 heritageorg
892019 Report on Union Dues amp Officer Salaries In Right-To-Work v Non-Right-To-Work States
httpslidepdfcomreaderfullreport-on-union-dues-officer-salaries-in-right-to-work-v-non-right-to-work 614
6
BACKGROUNDER | NO 2987
JANUARY 26 2015
states However the remaining premium remains
highly statistically significant
The third and final column controls for timeeffects and for the average weekly wages of union
members in that state and year This captures
remaining differences in wages between union
members across states such as those driven by dif-
ferences in cost of living These additional variables
have little effect on the overall results which remain
highly statistically significant
The unweighted numbers show that the aver-
age union charges its members 7 percent to 10 per-
cent more in states where it can force workers to
pay dues The weighted numbers show the aver-
age union member gets charged 14 percent to 15
percent more in nonndashright-to-work states Larg-er unions with more members appear to charge
higher premiums
Table 5 shows the results of simply regressing
dues per membermdashwith no logsmdashon control vari-
ables For the sake of conserving space Table 5 shows
only weighted results The unweighted regressions
show similar results As Column 3 shows after con-
trolling for other factors unions still charge their
members approximately $70 per year more in states
lacking right-to-work protections
AVERAGE DUES PER MEMBER
Model specification 983089 983090 983091Percent difference in dues per member 983089983097983086983091 983094983086983089 983094983086983096
Coeffi cient on Forced Dues variable 983088983086983089983095983095 983088983086983088983094983088 983088983086983088983094983094
Standard error 983088983086983088983089983090 983088983086983088983089983090 983088983086983088983089983090
P-value 983088983086983088983088983088 983088983086983088983088983088 983088983086983088983088983088
Controls for
Particular union No Yes Yes
Log of average private-sector union earnings No No Yes
Year No No Yes
Sample size 983089983088983093983084983089983095983093 983097983091983084983088983095983088 983097983091983084983088983095983088
R-squared 983088983086983088983089983090 983088983086983092983091983089 983088983086983092983091983094
AVERAGE DUES PER PAYING MEMBER
Model specification 983089 983090 983091
Percent difference in dues per paying member 983091983088983086983091 983097983086983095 983097983086983096
Coeffi cient on Forced Dues variable 983088983086983090983094983093 983088983086983088983097983091 983088983086983088983097983092
Standard error 983088983086983088983090983095 983088983086983088983090983091 983088983086983088983090983091
P-value 983088983086983088983088983088 983088983086983088983088983088 983088983086983088983088983088
Controls for
Particular union No Yes Yes
Log of average private-sector union earnings No No Yes
Year No No Yes
Sample size 983090983093983084983091983094983094 983090983091983084983089983089983096 983090983091983084983089983089983096
R-squared 983088983086983088983090983093 983088983086983093983091983088 983088983086983093983091983089
TABLE 3
Log Dues per Member Regressed on Forced Dues Requirements and Control Variables
Note Observations are unweightedSource Heritage Foundation calculations using data from the US Census Bureau Current Population Survey andunion financial disclosure reports filed with the US Department of Labor and reported publicly on unionreportsgov See Appendix for details BG 2987 heritageorg
892019 Report on Union Dues amp Officer Salaries In Right-To-Work v Non-Right-To-Work States
httpslidepdfcomreaderfullreport-on-union-dues-officer-salaries-in-right-to-work-v-non-right-to-work 714
7
BACKGROUNDER | NO 2987
JANUARY 26 2015
These results show that unions act like corpo-
rations when using their monopoly power Many
union officers are undoubtedly honorablemdashas are
many corporate officers Nonetheless both unionsand corporations institutionally tend to raise prices
when their customers have no other options Unions
with the ability to compel payment charge workers
approximately one-tenth more than unions that
must earn their membersrsquo voluntary support Right-
to-work laws pressure unions to reduce costs and
improve service or risk losing members
Union Officer SalariesThis ra ises the question of how unions spend the
additional dues that they charge in nonndashright-to-work
states If un ions act like corporate monopolies they would pay some of this money to union officers in
the form of higher salaries Competitive firms try
to reduce unnecessary costsmdashincluding labor costsmdash
to keep their prices down Monopolies that do not
fear competition often operate with considerable
slack including higher pay for their employees and
managers19
19 David G Blanchflower Andrew J Oswald and Peter Sanfey ldquoWages Profits and Rent-Sharingrdquo Quarterly Journal of Economics Vol 111 No 1
(February 1996) pp 227ndash251
AVERAGE DUES PER MEMBERModel specification 983089 983090 983091
Percent difference in dues per member 983092983096983086983090 983089983092983086983091 983089983092983086983092
Coeffi cient on Forced Dues variable 983088983086983091983097983092 983088983086983089983091983092 983088983086983089983091983092
Standard error 983088983086983088983091983093 983088983086983088983092983090 983088983086983088983092983091
P-value 983088983086983088983088983088 983088983086983088983088983090 983088983086983088983088983090
Controls for
Particular union No Yes Yes
Log of average private-sector union earnings No No Yes
Year No No Yes
Sample size 983089983088983093983084983089983095983093 983097983091983084983088983095983088 983097983091983084983088983095983088R-squared 983088983086983088983093983092 983088983086983091983094983095 983088983086983091983095983088
AVERAGE DUES PER PAYING MEMBER
Model specification 983089 983090 983091
Percent difference in dues per paying member 983091983094983086983093 983089983092983086983094 983089983092983086983094
Coeffi cient on Forced Dues variable 983088983086983091983089983089 983088983086983089983091983094 983088983086983089983091983094
Standard error 983088983086983088983093983088 983088983086983088983093983092 983088983086983088983093983092
P-value 983088983086983088983088983088 983088983086983088983089983090 983088983086983088983089983090
Controls for
Particular union No Yes Yes
Log of average private-sector union earnings No No Yes
Year No No Yes
Sample size 983090983093983084983091983094983094 983090983091983084983089983089983096 983090983091983084983089983089983096
R-squared 983088983086983088983091983093 983088983086983091983092983090 983088983086983091983092983090
TABLE 4
Log Dues per Member Regressed on Forced Dues Requirementsand Control Variables Weighted by Union Membership
Note Observations are weighted by total union membership or total paying membershipSource Heritage Foundation calculations using data from the US Census Bureau Current Population Surveyand union financial disclosure reports filed with the US Department of Labor and reported publicly onunionreportsgov See Appendix for details BG 2987 heritageorg
892019 Report on Union Dues amp Officer Salaries In Right-To-Work v Non-Right-To-Work States
httpslidepdfcomreaderfullreport-on-union-dues-officer-salaries-in-right-to-work-v-non-right-to-work 814
8
BACKGROUNDER | NO 2987
JANUARY 26 2015
Unions appear to act no differently Table 6 shows
the average salaries for full-time employees in the
top four positions in many unions president vice
president business manager and treasurer20 These
figures include only gross salary payments that anindividual union reports on its disclosure forms
They do not include benefits or supplemental pay-
ments from other union entities
Union officers make considerably more in nonndash
right-to-work states Without weighting by mem-
bership the average union with a full-time president
pays him just under $90000 annually in a right-to-
work jurisdiction and just over $110000 annually in
states with compulsory dues Likewise the median
union with a full-time president pays him about
$20000 more in nonndashright-to-work states
Weighting by union membership increases aver-age union salaries because larger unions tend to pay
more The weighted figures show the salaries paid to
full-time officers in the unions to which the average
union member belongs
In most cases weighting increases the salary dif-
ference between right-to-work and nonndashright-to-
work states The average union member has a union
20 Not every union employs every officer The top official in some union locals is the president while in others it may be the business manager
Some unions have many vice presidents Others have none
AVERAGE DUES PER MEMBER
Model specification 983089 983090 983091
Coeffi cient on Forced Dues variable 983076983089983095983096983086983089983090 983076983094983096983086983097983090 983076983094983097983086983095983090
Standard error 983076983089983094983086983094983091 983076983090983088983086983091983091 983076983090983088983086983093983096
P-value 983088983086983088983088983088 983088983086983088983088983089 983088983086983088983088983089
Controls for
Particular union No Yes Yes
Log of agerage private-sector union earnings No No Yes
Year No No Yes
Sample size 983089983088983093983084983089983095983093 983097983091983084983088983095983088 983097983091983084983088983095983088
R-squared 983088983086983088983090983097 983088983086983091983095983096 983088983086983091983096983088
AVERAGE DUES PER PAYING MEMBER
Model specification 983089 983090 983091
Coeffi cient on Forced Dues variable 983076983089983092983089983086983091983096 983076983095983089983086983096983093 983076983095983090983086983089983091
Standard error 983076983090983091983086983097983091 983076983090983097983086983090983092 983076983090983097983086983089983089
P-value 983088983086983088983088983088 983088983086983088983089983092 983088983086983088983089983091
Controls for
Particular union No Yes Yes
Log of average private-sector union earnings No No Yes
Year No No Yes
Sample size 983090983093983084983091983094983094 983090983091983084983089983089983096 983090983091983084983089983089983096
R-squared 983088983086983088983089983090 983088983086983092983088983092 983088983086983092983088983093
TABLE 5
Dues per Member Regressed on Forced Dues Requirements and Control Variables
Note Observations are weighted by total union membership or total paying membershipSource Heritage Foundation calculations using data from the US Census Bureau Current Population Surveyand union financial disclosure reports filed with the US Department of Labor and reported publicly onunionreportsgov See Appendix for details BG 2987 heritageorg
892019 Report on Union Dues amp Officer Salaries In Right-To-Work v Non-Right-To-Work States
httpslidepdfcomreaderfullreport-on-union-dues-officer-salaries-in-right-to-work-v-non-right-to-work 914
9
BACKGROUNDER | NO 2987
JANUARY 26 2015
president who makes $170000 annually in states
with compulsory dues but only $132000 in states
with voluntary duesmdasha $38000 difference Agai n other factors could influence this gap
Southern statesmdashalmost entirely right to workmdash
generally have lower wages and lower costs of liv-
ing21 Economists would expect unions in these
states to pay lower salaries As with dues charged
controlling for other factors substantially reduces
the difference between right-to-work and com-
pulsory-dues states However a significant pre-
mium for union officers in nonndashright-to-work
states remains
Table 7 and Table 8 show the unweighted and
weighted regressions for the log of union officersrsquosalaries on forced-dues requirements and control
variables for each of the four separate union posi-
tions They follow the same format as the regres-
sions on dues per member The first column shows a
simple regression of logged salaries on an indicator
for compulsory-dues requirements The second col-
umn adds controls for the particular international
union that employs the officers The third columnadds controls for average union member (not officer)
earnings in that state and year the size of the union
and the particular year22 All figures are in inflation-
adjusted 2013 dollars
In the unweighted regressions after controlling
for all other factors and looking only at full-time
employees the average union pays its president 12
percent more its vice presidents 7 percent more its
business manager 22 percent more and its treasurer
13 percent more in states with forced dues The dif-
ferences are highly statistically significant for presi-
dents business managers and treasurers The esti-mate for vice presidents was statistically significant
at the 6 percent level
Weighted by union membership and controlling
for other factors the pay premium for the aver-
age union membersrsquo president is not statistically
21 Every Southern state except Kentucky and Missouri has a right-to-work law
22 Total union membership was omitted as a control from the regressions on dues per member because it entered into the denominator of the
dependent variable
UNWEIGHTED
MEDIAN SALARY AVERAGE SALARY SAMPLE SIZE
Right-to-Work
CompulsoryDues Difference
Right-to-Work
CompulsoryDues Difference
Right-to-Work
CompulsoryDues
President 983076983095983094983084983096983095983091 983076983097983095983084983088983090983091 983076983090983088983084983089983093983088 (983090983094983086983090) 983076983096983096983084983097983095983090 983076983089983089983089983084983096983097983093 983076983090983090983084983097983090983091 (983090983093983086983096) 983090983084983093983094983095 983095983084983094983089983095
Vice-President 983076983095983092983084983097983093983093 983076983097983095983084983097983088983097 983076983090983090983084983097983093983093 (983091983088983086983094) 983076983096983096983084983091983089983090 983076983089983088983093983084983088983089983091 983076983089983094983084983095983088983088 (983089983096983086983097) 983089983084983090983094983093 983094983084983089983093983095
Treasurer 983076983096983089983084983091983096983090 983076983097983096983084983094983091983091 983076983089983095983084983090983093983090 (983090983089983086983090) 983076983096983096983084983097983092983094 983076983089983088983097983084983096983092983091 983076983090983088983084983096983097983094 (983090983091983086983093) 983089983084983092983095983092 983094983084983093983093983092
Business Manager 983076983095983097983084983092983096983088 983076983089983088983088983084983094983090983089 983076983090983089983084983089983092983088 (983090983094983086983094) 983076983096983094983084983094983091983094 983076983089983088983097983084983097983089983089 983076983090983091983084983090983095983092 (983090983094983086983097) 983089983084983088983097983096 983092983084983088983089983097
WEIGHTED BY TOTAL MEMBERSHIP
MEDIAN SALARY AVERAGE SALARY SAMPLE SIZE
Right-to-Work
CompulsoryDues Difference
Right-to-Work
CompulsoryDues Difference
Right-to-Work
CompulsoryDues
President 983076983089983088983091983084983095983090983094 983076983089983094983095983084983094983095983090 983076983094983091983084983097983092983095 (983094983089983086983094) 983076983089983091983090983084983092983090983088 983076983089983095983088983084983088983093983095 983076983091983095983084983094983091983094 (983090983096983086983092) 983090983084983093983090983091 983095983084983093983089983089
Vice-President 983076983097983097983084983094983093983092 983076983089983090983094983084983091983088983094 983076983090983094983084983094983093983090 (983090983094983086983095) 983076983089983089983091983084983097983095983094 983076983089983091983092983084983089983092983088 983076983090983088983084983089983094983092 (983089983095983086983095) 983089983084983090983094983091 983094983084983089983088983089
Treasurer 983076983089983088983095983084983097983088983091 983076983089983092983097983084983096983095983092 983076983092983089983084983097983095983089 (983091983096983086983097) 983076983089983090983089983084983094983096983096 983076983089983093983097983084983090983090983090 983076983091983095983084983093983091983093 (983091983088983086983096) 983089983084983092983094983091 983094983084983092983094983088
Business Manager 983076983096983097983084983090983097983094 983076983089983090983093983084983094983094983088 983076983091983094983084983091983094983092 (983092983088983086983095) 983076983097983096983084983091983092983093 983076983089983091983092983084983093983094983094 983076983091983094983084983090983090983088 (983091983094983086983096) 983089983084983088983096983093 983091983084983097983095983095
TABLE 6
Salaries for Full-Time Top Union Offi cers in Compulsory Duesand Right-to-Work States
Source Heritage Foundation calculations using data from 2005ndash2013 union financial reports filed withthe US Department of Labor Offi ce of Labor Management Standards See Appendix for details BG 2987 heritageorg
892019 Report on Union Dues amp Officer Salaries In Right-To-Work v Non-Right-To-Work States
httpslidepdfcomreaderfullreport-on-union-dues-officer-salaries-in-right-to-work-v-non-right-to-work 1014
10
BACKGROUNDER | NO 2987
JANUARY 26 2015
significant23 However the other three offices all
show large and highly significant pay differences
for full-time employees The typical union mem-
bersrsquo vice presidents make 13 percent more busi-ness managers make 17 percent more and trea-
surers make 9 percent more in the absence of a
right-to-work law
Table 9 shows the results of regressing dues
requirements and control variables on officersrsquo gross
salaries (instead of the log) To conserve space and
for ease of presentation the table shows only thepreferred model specification in the third column of
Tables 7 and 8 which includes all of the control vari-
ables It is also weighted by union membership24
23 The 47 percent pay premium for union presidents when weighted by union membership does not approach statistical significance because
it could arise from pure chance 188 percent of the time However this lack of significance could arise from random chance Just as a table of
random numbers will occasionally have some statistically significant differences a series of true relationships will occasionally fail to exhibit
statistical significance
24 Specifications (1) and (2) also showed large and statistically significant differences between right-to-work and nonndashright-to-work states as
did the unweighted regressions
PRESIDENT VICE PRESIDENTModel specification 983089 983090 983091 983089 983090 983091
Percentage difference in salaries 983090983091983086983088 983089983097983086983091 983089983090983086983092 983090983089983086983088 983089983095983086983094 983094983086983093
Coeffi cient on Forced Dues variable 983088983086983090983088983095 983088983086983089983095983095 983088983086983089983089983095 983088983086983089983097983089 983088983086983089983094983090 983088983086983088983094983091
Standard error 983088983086983088983089983097 983088983086983088983090983093 983088983086983088983090983090 983088983086983088983093983090 983088983086983088983092983091 983088983086983088983091983091
P-value 983088983086983088983088983088 983088983086983088983088983088 983088983086983088983088983088 983088983086983088983088983088 983088983086983088983088983088 983088983086983088983094983088
Controls for983098
Particular union No No Yes No Yes Yes
Year No Yes Yes No No Yes
Log membership size No Yes Yes No No Yes
Log of average private-sector union earnings No Yes Yes No No Yes
Sample size 983089983088983084983089983096983092 983097983084983088983091983093 983096983084983097983088983092 983095983084983092983090983090 983094983084983094983097983088 983094983084983094983091983097
R-squared 983088983086983088983092983097 983088983086983090983093983088 983088983086983091983097983090 983088983086983088983092983090 983088983086983090983097983096 983088983086983092983092983094
BUSINESS MANAGER TREASURER
Model specification 983089 983090 983091 983089 983090 983091
Percentage difference in salaries 983090983094983086983090 983090983094983086983097 983090983090983086983089 983090983089983086983094 983090983089983086983094 983089983091983086983092
Coeffi cient on Forced Dues variable 983088983086983090983091983091 983088983086983090983091983097 983088983086983090983088983088 983088983086983089983097983093 983088983086983089983097983093 983088983086983089983090983094
Standard error 983088983086983088983090983093 983088983086983088983090983090 983088983086983088983089983097 983088983086983088983090983090 983088983086983088983090983091 983088983086983089983090983094
P-value 983088983086983088983088983088 983088983086983088983088983088 983088983086983088983088983088 983088983086983088983088983088 983088983086983088983088983088 983088983086983088983088983088
Controls for983098
Particular union No Yes Yes No Yes Yes
Year No No Yes No No Yes
Log membership size No No Yes No No Yes
Log of average private-sector union earnings No No Yes No No Yes
Sample size 983093983084983089983089983095 983093983084983088983094983093 983093983084983088983089983088 983096983084983088983090983096 983095983084983093983095983090 983095983084983092983095983090
R-squared 983088983086983088983095983097 983088983086983089983096983089 983088983086983091983093983096 983088983086983088983092983089 983088983086983090983088983088 983088983086983091983095983096
TABLE 7
Full-Time Log Offi cer Salaries Regressed on Forced Dues Requirementsand Control Variables
Notes Observations are unweighted ndash Statistically insignificantSource Heritage Foundation calculations using data from the US Census Bureau Current Population Surveyand union financial disclosure reports filed with the US Department of Labor and reported publicly onunionreportsgov See Appendix for details BG 2987 heritageorg
892019 Report on Union Dues amp Officer Salaries In Right-To-Work v Non-Right-To-Work States
httpslidepdfcomreaderfullreport-on-union-dues-officer-salaries-in-right-to-work-v-non-right-to-work 1114
11
BACKGROUNDER | NO 2987
JANUARY 26 2015
This linear specification continues to show that
after controlling for other factors full-time union
officers collect substantially higher salaries in states
with compulsory dues Union presidents make$12800 more per year vice presidents make $19500
more business managers make $30000 more and
treasurers make $23200 more
The officers representing the typical union mem-
ber make roughly $20000 more per year thanks
to forced unionization Compulsory dues enable
unions to force workers to pay higher dues Part of
those funds flow back to their officers in the form of
higher salaries
Right to Work Protects WorkersCompulsory dues give unions a monopoly in the
workplace The absence of a right-to-work law forces
workers to purchase union representation regard-
less of how their union performs UAW Commit-
teeman Chad Poynor recently admitted to The New
York Times ldquoYou hear people all the time say lsquoIf I
were in a right-to-work state Irsquod withdrawrsquordquo25
25 Shalia Dewan ldquoFoes of Unions Try Their Luck in County Lawsrdquo The New York Times December 18 2014
httpwwwnytimescom20141219uspoliticsfoes-of-unions-try-their-luck-in-county-lawshtml (accessed January 7 2015)
PRESIDENT VICE PRESIDENTModel specification 983089 983090 983091 983089 983090 983091
Percentage difference in salaries 983091983089983086983088 983090983089983086983090 983092983086983095 983090983088983086983094 983089983096983086983096 983089983090983086983095
Coeffi cient on Forced Dues variable 983076983088983086983090983095983088 983076983088983086983089983097983090 983076983088983086983088983092983094 983088983086983089983096983096 983088983086983089983095983090 983088983086983089983089983097
Standard error 983076983088983086983088983096983095 983076983088983086983088983093983089 983076983088983086983088983091983093 983088983086983089983090983090 983088983086983088983092983088 983088983086983088983091983092
P-value 983088983086983088983088983090 983088983086983088983088983088 983088983086983089983096983096 983088983086983089983090983094 983088983086983088983088983088 983088983086983088983088983088
Controls for983098
Particular union No Yes Yes No Yes Yes
Year No No Yes No No Yes
Log membership size No No Yes No No Yes
Log of average private-sector union earnings No No Yes No No Yes
Sample size 983089983088983084983088983091983092 983096983084983097983088983092 983096983084983097983088983092 983095983084983091983094983092 983094983084983094983091983097 983094983084983094983091983097R-squared 983076983088983086983088983091983091 983076983088983086983092983089983094 983076983088983086983093983092983088 983088983086983088983089983094 983088983086983092983094983093 983088983086983093983090983093
BUSINESS MANAGER TREASURER
Model specification 983089 983090 983091 983089 983090 983091
Percentage difference in salaries 983091983093983086983093 983091983093983086983091 983089983095983086983088 983091983089983086983093 983090983091983086983088 983097983086983091
Coeffi cient on Forced Dues variable 983088983086983091983088983092 983088983086983091983088983090 983088983086983089983093983095 983088983086983090983095983092 983088983086983090983088983095 983088983086983088983096983097
Standard error 983088983086983088983095983093 983088983086983088983093983090 983088983086983088983091983097 983088983086983088983097983090 983088983086983088983093983093 983088983086983088983091983091
P-value 983088983086983088983088983088 983088983086983088983088983088 983088983086983088983088983088 983088983086983088983088983091 983088983086983088983088983088 983088983086983088983088983095
Controls for983098
Particular union No Yes Yes No Yes Yes
Year No No Yes No No Yes
Log membership size No No Yes No No Yes
Log of average private-sector union earnings No No Yes No No Yes
Sample size 983093983084983088983094983090 983093983084983088983089983088 983093983084983088983089983088 983095983084983097983090983091 983095983084983092983095983090 983095983084983092983095983090
R-squared 983088983086983088983093983091 983088983086983091983093983091 983088983086983094983089983093 983088983086983088983091983091 983088983086983091983092983093 983088983086983093983088983094
TABLE 8
Log Full-Time Offi cer Salaries Regressed on Forced Dues Requirementsand Control Variables Weighted by Total Union Membership
Notes Observations are weighted by total union membership ndash Statistically insignificantSource Heritage Foundation calculations using data from the US Census Bureau Current Population Surveyand union financial disclosure reports filed with the US Department of Labor and reported publicly onunionreportsgov See Appendix for details BG 2987 heritageorg
892019 Report on Union Dues amp Officer Salaries In Right-To-Work v Non-Right-To-Work States
httpslidepdfcomreaderfullreport-on-union-dues-officer-salaries-in-right-to-work-v-non-right-to-work 1214
12
BACKGROUNDER | NO 2987
JANUARY 26 2015
Unions use their monopoly position the same way
corporations do They raise their prices and pay their
employees more Because workers in nonndashright-to-
work states ca nnot opt out unions have little incen-
tive to hold down either dues or labor costs
Of course many union officers truly want to
improve workersrsquo lives However without right-to- work laws unions face few institutional pressures to
put their membersrsquo interests first They do not need
to persuade workers that the benefits of union repre-
sentation outweigh its costs They can simply force
them to pay dues or be fired The lack of incentives to
economize leads to higher costs for union members
and inflated salaries for their officers
Unions complain that right to work forces them
to represent free riders Besides its legal inaccu-
racy this claim has the problem backwards26 The
absence of right-to-work laws allows unions to free
ride on captive customers Controlling for other fac-
tors unions charge 10 percent higher dues and pay
their top officers $20000 more annually in nonndashright-to-work states
Right-to-work laws protect workers from a union
monopoly Voluntary dues require unions earn
workersrsquo support
mdashJames Sherk is Senior Policy Analyst in Labor
Economics in the Center for Data Analysis of the
Institute for Economic Freedom and Opportunity at
The Heritage Foundation
26 The Supreme Court has repeatedly ruled that the National Labor Relations Act allows unions to negotiate contracts covering only dues-paying
members As Justice William J Brennan wrote in Retail Clerks v Dry Lion Goods (1962) ldquolsquoMembers onlyrsquo contracts have long been recognizedrdquo
Unions represent non-members only when they act as ldquoexclusive bargaining representativesrdquo which requires non-members to accept the
unionrsquos representation In that case the law requires unions to represent non-members fairly They cannot negotiate high wages for their
supporters and the minimum wage for non-members Unions can avoid representing non-members by disclaiming exclusive representative
status 369 US 17 (1962)
Model specification President Vice President Business Manager Treasurer
Difference in salaries in Forced Dues states 983076983089983090983084983096983090983092 983076983089983097983084983093983092983093 983076983091983088983084983088983093983089 983076983090983091983084983090983092983088
Standard error 983076983094983084983092983093983090 983076983093983084983091983095983094 983076983095983084983096983092983091 983076983094983084983096983093983095
P-value 983088983086983088983092983095 983088983086983088983088983088 983088983086983088983088983088 983088983086983088983088983089
Sample size 983096983084983097983088983092 983094983084983094983091983097 983093983084983088983089983088 983095983084983092983095983090
R-squared 983088983086983093983091983093 983088983086983093983090983091 983088983086983091983095983091 983088983086983092983090983090
TABLE 9
Full-Time Offi cer Salaries Regressed on Forced Dues Requirementsand Control Variables Weighted by Total Union Membership
Note Observations are weighted by total union membership The regression model used to arrive at these estimates used the same specificationand control variables as used in specification 3 in Tables 7 and 8 with all variables specified in linear and not log form These controls includedummy variables for the year individual union average earnings of union members in that state and year and union size
Source Heritage Foundation calculations using data from the US Census Bureau Current Population Survey and union financial disclosurereports filed with the US Department of Labor and reported publicly on unionreportsgov See Appendix for details
BG 2987 heritageorg
892019 Report on Union Dues amp Officer Salaries In Right-To-Work v Non-Right-To-Work States
httpslidepdfcomreaderfullreport-on-union-dues-officer-salaries-in-right-to-work-v-non-right-to-work 1314
13
BACKGROUNDER | NO 2987
JANUARY 26 2015
Appendix
The Heritage Foundationrsquos Center for Data Anal-
ysis (CDA) calculated these figures using data for
2005ndash2013 from the Department of Laborrsquos Office
of Labor-Management Standards (OLMS) yearly
labor-management (LM) data and the Current Pop-
ulation Survey These data are publicly available
online at no cost27
All LM forms require unions to identify how
many members they had that year The subset of
unions that file the LM-2 forms must also break
down their members by category The CDA used a
regular expression match to identify subgroups of
these categories unlikely to pay dues such as mem-
bers in the ldquolaid offrdquo ldquoretiredrdquo and ldquofree duesrdquo cat-egories These members were subtracted from the
larger category of overall membership to arrive at an
estimate of the number of dues-paying members in
union locals filing LM-2 forms The CDA construct-
ed the dues-per-member and dues-per-paying-
member variables by dividing the total amount that
a union reported collecting in dues and agency fees
by the number of members and dues-paying member
variables respectively All the dues and officer sala-
ry figures were converted to 2013 dollars using the
Personal Consumption Expenditures price index
The LMRDA applies to unions that have at leastone private-sector member Consequently the
LMRDA filings used in this analysis exclude the local
chapters of most government unions Some govern-
ment unions do represent private-sector workers
such as teachers unions that have organized private
schools Such unions must file federal disclosure
reports and this analysis includes them
In many unions local chapters directly collect
dues Those locals then remit a per-capita tax to their
state andor international headquarters The state
and national headquarters consequently report far
lower ldquodues per memberrdquo because their incomecomes from levies on their local chapters not direct-
ly collected dues The CDA excluded such unions
from the dues-per-member analysis by examining
only unions that derived at least two-thirds of their
revenues from dues and agency fees
Some unions reported implausibly large or
small annual dues-per-member figures even after
this exclusion For example one union charged an
estimated $1 per member per year while another
charged more than $1000000 per member per
year Such outliers are primarily the result of either
(a) data or reporting errors such as misplaced dec-
imal places and zeros in completed forms or (b)
state or national headquarters with limited direct
dues income but large memberships To prevent
such data errors from biasing the results the CDArestricted attention to unions that charged more
than $50 but less than $10000 in annual dues This
captures over 95 percent of unions while exclud-
ing implausible outliers The results were robust to
using alternative cutoffs
The CDA used a regular expression match on
the job titles reported in the OLMS filings to create
dummy variables identifying the four top positions
in most unions president vice president business
manager and treasurer (sometimes secretary-trea-
surer) The categories are mutually exclusive Some-
one reported as ldquopresident and treasurerrdquo on theforms was classified in this analysis as only a union
president and not as a treasurer
The LMRDA filings do not directly indicate
full-time and part-time or full-year and part-year
employees Taken at face value this can produce
seriously misleading estimates of union compensa-
tion For example in 2011 Carpenters Local 1024
reported paying its president $2130 on its LM-2
forms28 Further analysis of the localrsquos 990 forms
filed with the IRS revealed that the president report-
ed working two hours a week To focus the analysis
on full-time employees the CDA excluded officers who did not make at least $50000 a year These
restrictions considerably reduced the sample size
27 See US Department of Labor Office of Labor-Management Standards ldquoDownload Yearly Datardquo
httpkcerdsdol-esagovquerygetYearlyDatado (accessed January 7 2015) and National Bureau of Economic Research ldquoCPS Merged
Outgoing Rotation Groupsrdquo httpwwwnberorgmorgannual (accessed January 7 2015)
28 United Brotherhood of Carpenters Local 1024 ldquoForm LM-2 Labor Organization Annual Reportrdquo US Department of Labor Office of Labor-
Management Standards 2011 File No 011-457 httpkcerdsdol-esagovquerygetOrgQrydo (accessed January 7 2015) It is unknown
whether the president received additional payments from separate union trust funds because disclosure of these funds is not required
892019 Report on Union Dues amp Officer Salaries In Right-To-Work v Non-Right-To-Work States
httpslidepdfcomreaderfullreport-on-union-dues-officer-salaries-in-right-to-work-v-non-right-to-work 1414
BACKGROUNDER | NO 2987
JANUARY 26 2015
Sensitivity tests found that removing this restric-
tion produced similar results to those presented in
the main paper29 Also excluded were officers who
did not work for the union the year before or the year
after the filing so as to exclude employees who joined
or left the union partway through the year 30
The CDA identified workers as subject to com-
pulsory dues if they (1) lived in a nonndashright-to-
work state or (2) belonged to a union subject to the
Railway Labor Act principally airline and railway
unions It excluded unions located in Indiana or
Michigan after they passed their right-to-work laws
as well as unions located in Washington DC The
right-to-work status of these unions was ambiguous
Indiana and Michigan passed right-to-work laws
which took effect in 2012 and 2013 respectively andapplied only to union contracts renewed after that
time Many unions filing LMRDA reports in those
states still enjoyed compulsory-dues powers in 2013
For example the UAW contracts with the Big Three
automakers requiring compulsory dues run through
2015 Many unions representing workers in both
right-to-work and nonndashright-to-work states have
their national headquarters in Washington
The CDA used a regular expression match on
union names in LM filings to create dummy vari-
ables for the most common unions to which work-
ers belong such as the Machinists the Boilermakersand the Food and Commercial Workers
Data from the Current Population Survey outgo-
ing rotation groups was used to estimate the average
weekly earnings of private-sector unions by state
and year These averages excluded union members
with imputed earnings because the Census Bureau
does not use union membership status as a matching
variable for imputation
The CDA conducted the analysis using OLS
regressions on the log and level of dues per member
and officer salaries The CDA used heteroskedastici-
ty robust errors clustered by union local throughoutOne concern is that clustering does not sufficiently
account for the increase in sample size driven by
the panel dimension of the datamdashrepeated observa-
tions from many of the same unions over time The
CDA ran the analysis in a panel-data format using
Driscoll-Kraay standard errors and found very simi-
lar results31 It also ran the analysis using a panel data
specification and both random effects and between
effects estimators The results from these analyses
were also highly statistically significant and very
similar to the unweighted regressions reported here
Stata does not produce weighted random effects or
between effects estimates
The CDA did not use either state or union local
fixed effects in its analysis because right-to-work
laws varied little within states or union locals dur-
ing this period Including such fixed effects would
absorb all variation in right-to-work status except
that caused by passage of the Indiana and Michigan
right-to-work laws in 2012mdashlaws that had not taken
effect for many union locals by 2013 Additional variables included dummy variables
for year the particular international union repre-
senting workers the log or level of average union
earnings and total union membership Alternative
specifications for the control variables such as high-
er-order polynomials of union membership size had
little effect on the overall results
When weighting union officersrsquo salaries by union
membership the CDA divided by the total number
of such officers in that union local For example if
a union local had three vice presidents the analysis
would give each of those officersrsquo salary one-thirdof the weight of a solitary vice presidentrsquos salary in
a local with the same number of members This was
done so that the final weighted estimates would
reflect the average salaries paid to the top officers
representing the typical union member
The CDA also examined the effect of forced-dues
requirements on total disbursements to union offi-
cers including both gross salaries and reimburse-
ments for official expenses such as work meals and
travel expenses Mandatory dues requirements had
a modestly larger effect on total disbursements than
on gross salaries However detailed examination of whether the additional disbursements beyond sala-
ries resulted from a greater workload or from addi-
tional non-salary compensation is beyond the scope
of this paper These results are available from the
author upon request
29 The proportional difference in salaries was similar and highly statistically significant The absolute magnitude of the salary differences
decreased when the analysis included lower-earning part-time employees
30 For 2013 filings this restriction was relaxed to exclude only employees who did not work for the union the year before
31 Driscoll-Kraay standard errors are robust to both between and within correlation in panel data

892019 Report on Union Dues amp Officer Salaries In Right-To-Work v Non-Right-To-Work States
httpslidepdfcomreaderfullreport-on-union-dues-officer-salaries-in-right-to-work-v-non-right-to-work 514
5
BACKGROUNDER | NO 2987
JANUARY 26 2015
UAW primarily represents well-paid manufacturing
employees but has had little success in persuading
Southern workers to join If manufacturing union
membership is concentrated in nonndashright-to-work
states average dues will be higher in those states no
matter how individual locals set their rates
Controlling for Other FactorsEconomists use regression analysis to control
for such extraneous factors Tables 3 and 4 show the
results of regressing average dues per member17 on
mandatory dues requirements and several control
variables Both tables display the results for both
average dues per member and dues per paying mem-
ber Table 3 presents the unweighted results while
Table 4 shows the results weighted by total union
membership and total paying membership
The tables display average percent difference in
dues per member which can be attributed to forced
unionization The p-values also reported in thetables indicate the probability the results differ
from zero by random chance Any p-value less than
005 is considered statistically significant Since all
the p-values are 0012 or less the results are statis-
tically significant The Appendix describes these
regressions in more detail
The first column in each table shows the results
of regressing dues per member (in log form) on just
forced-dues requirements As in Tables 1 and 2 the
regression finds that unions charge significantly
higher dues in nonndashright-to-work states between
19 percent and 30 percent more in the unweight-
ed regressions Weighting for union membership
increases the disparity to between 37 percent and48 percent greater dues18 Larger unions appear to
charge disproportionately higher dues in nonndashright-
to-work states than smaller unions do
The second column controls for the particular
international union such as the United Auto Work-
ers the United Food and Commercial Workers and
the Service Employees International Union This
controls both for differences in dues structures
between unionsmdashsome unions charge higher dues
than othersmdashand differences in average wages
between members of different unions Tables 3 and 4
demonstrate the importance of controlling for suchfactors The estimated premium that unions charge
their members in nonndashright-to-work states drops
by approximately two-thirds in the second column
Much of the difference in union dues between right-
to-work states and nonndashright-to-work states comes
from differences in which unions operate in those
17 Average dues are expressed in log terms Regressing on logged variables has helpful statistical properties
18 These means differ from those in Tables 1 and 2 because in regressions on logged dependent variables the coefficient values reveal the
geometric mean percent difference not the arithmetic mean as in Tables 1 and 2
MEDIAN DUES
Right-to-Work Compulsory Dues Difference Difference
Unweighted 983076983093983088983093 983076983094983095983088 983076983089983094983093 983091983090983086983095
Weighted by total membership 983076983092983091983089 983076983093983091983093 983076983089983088983092 983090983092983086983089
AVERAGE DUES
Right-to-Work Compulsory Dues Difference Difference
Unweighted 983076983095983097983090 983076983097983097983090 983076983090983088983088 983090983093983086983090
Weighted by total membership 983076983093983089983093 983076983094983093983094 983076983089983092983089 983090983095983086983092
Sample size 983094983084983096983093983097 983089983096983084983093983088983095
TABLE 2
Median and Average Annual Dues per Paying Member
Source Heritage Foundation calculations using data from 2005ndash2013 union financial reports filed withthe US Department of Labor Offi ce of Labor Management Standards See Appendix for details BG 2987 heritageorg
892019 Report on Union Dues amp Officer Salaries In Right-To-Work v Non-Right-To-Work States
httpslidepdfcomreaderfullreport-on-union-dues-officer-salaries-in-right-to-work-v-non-right-to-work 614
6
BACKGROUNDER | NO 2987
JANUARY 26 2015
states However the remaining premium remains
highly statistically significant
The third and final column controls for timeeffects and for the average weekly wages of union
members in that state and year This captures
remaining differences in wages between union
members across states such as those driven by dif-
ferences in cost of living These additional variables
have little effect on the overall results which remain
highly statistically significant
The unweighted numbers show that the aver-
age union charges its members 7 percent to 10 per-
cent more in states where it can force workers to
pay dues The weighted numbers show the aver-
age union member gets charged 14 percent to 15
percent more in nonndashright-to-work states Larg-er unions with more members appear to charge
higher premiums
Table 5 shows the results of simply regressing
dues per membermdashwith no logsmdashon control vari-
ables For the sake of conserving space Table 5 shows
only weighted results The unweighted regressions
show similar results As Column 3 shows after con-
trolling for other factors unions still charge their
members approximately $70 per year more in states
lacking right-to-work protections
AVERAGE DUES PER MEMBER
Model specification 983089 983090 983091Percent difference in dues per member 983089983097983086983091 983094983086983089 983094983086983096
Coeffi cient on Forced Dues variable 983088983086983089983095983095 983088983086983088983094983088 983088983086983088983094983094
Standard error 983088983086983088983089983090 983088983086983088983089983090 983088983086983088983089983090
P-value 983088983086983088983088983088 983088983086983088983088983088 983088983086983088983088983088
Controls for
Particular union No Yes Yes
Log of average private-sector union earnings No No Yes
Year No No Yes
Sample size 983089983088983093983084983089983095983093 983097983091983084983088983095983088 983097983091983084983088983095983088
R-squared 983088983086983088983089983090 983088983086983092983091983089 983088983086983092983091983094
AVERAGE DUES PER PAYING MEMBER
Model specification 983089 983090 983091
Percent difference in dues per paying member 983091983088983086983091 983097983086983095 983097983086983096
Coeffi cient on Forced Dues variable 983088983086983090983094983093 983088983086983088983097983091 983088983086983088983097983092
Standard error 983088983086983088983090983095 983088983086983088983090983091 983088983086983088983090983091
P-value 983088983086983088983088983088 983088983086983088983088983088 983088983086983088983088983088
Controls for
Particular union No Yes Yes
Log of average private-sector union earnings No No Yes
Year No No Yes
Sample size 983090983093983084983091983094983094 983090983091983084983089983089983096 983090983091983084983089983089983096
R-squared 983088983086983088983090983093 983088983086983093983091983088 983088983086983093983091983089
TABLE 3
Log Dues per Member Regressed on Forced Dues Requirements and Control Variables
Note Observations are unweightedSource Heritage Foundation calculations using data from the US Census Bureau Current Population Survey andunion financial disclosure reports filed with the US Department of Labor and reported publicly on unionreportsgov See Appendix for details BG 2987 heritageorg
892019 Report on Union Dues amp Officer Salaries In Right-To-Work v Non-Right-To-Work States
httpslidepdfcomreaderfullreport-on-union-dues-officer-salaries-in-right-to-work-v-non-right-to-work 714
7
BACKGROUNDER | NO 2987
JANUARY 26 2015
These results show that unions act like corpo-
rations when using their monopoly power Many
union officers are undoubtedly honorablemdashas are
many corporate officers Nonetheless both unionsand corporations institutionally tend to raise prices
when their customers have no other options Unions
with the ability to compel payment charge workers
approximately one-tenth more than unions that
must earn their membersrsquo voluntary support Right-
to-work laws pressure unions to reduce costs and
improve service or risk losing members
Union Officer SalariesThis ra ises the question of how unions spend the
additional dues that they charge in nonndashright-to-work
states If un ions act like corporate monopolies they would pay some of this money to union officers in
the form of higher salaries Competitive firms try
to reduce unnecessary costsmdashincluding labor costsmdash
to keep their prices down Monopolies that do not
fear competition often operate with considerable
slack including higher pay for their employees and
managers19
19 David G Blanchflower Andrew J Oswald and Peter Sanfey ldquoWages Profits and Rent-Sharingrdquo Quarterly Journal of Economics Vol 111 No 1
(February 1996) pp 227ndash251
AVERAGE DUES PER MEMBERModel specification 983089 983090 983091
Percent difference in dues per member 983092983096983086983090 983089983092983086983091 983089983092983086983092
Coeffi cient on Forced Dues variable 983088983086983091983097983092 983088983086983089983091983092 983088983086983089983091983092
Standard error 983088983086983088983091983093 983088983086983088983092983090 983088983086983088983092983091
P-value 983088983086983088983088983088 983088983086983088983088983090 983088983086983088983088983090
Controls for
Particular union No Yes Yes
Log of average private-sector union earnings No No Yes
Year No No Yes
Sample size 983089983088983093983084983089983095983093 983097983091983084983088983095983088 983097983091983084983088983095983088R-squared 983088983086983088983093983092 983088983086983091983094983095 983088983086983091983095983088
AVERAGE DUES PER PAYING MEMBER
Model specification 983089 983090 983091
Percent difference in dues per paying member 983091983094983086983093 983089983092983086983094 983089983092983086983094
Coeffi cient on Forced Dues variable 983088983086983091983089983089 983088983086983089983091983094 983088983086983089983091983094
Standard error 983088983086983088983093983088 983088983086983088983093983092 983088983086983088983093983092
P-value 983088983086983088983088983088 983088983086983088983089983090 983088983086983088983089983090
Controls for
Particular union No Yes Yes
Log of average private-sector union earnings No No Yes
Year No No Yes
Sample size 983090983093983084983091983094983094 983090983091983084983089983089983096 983090983091983084983089983089983096
R-squared 983088983086983088983091983093 983088983086983091983092983090 983088983086983091983092983090
TABLE 4
Log Dues per Member Regressed on Forced Dues Requirementsand Control Variables Weighted by Union Membership
Note Observations are weighted by total union membership or total paying membershipSource Heritage Foundation calculations using data from the US Census Bureau Current Population Surveyand union financial disclosure reports filed with the US Department of Labor and reported publicly onunionreportsgov See Appendix for details BG 2987 heritageorg
892019 Report on Union Dues amp Officer Salaries In Right-To-Work v Non-Right-To-Work States
httpslidepdfcomreaderfullreport-on-union-dues-officer-salaries-in-right-to-work-v-non-right-to-work 814
8
BACKGROUNDER | NO 2987
JANUARY 26 2015
Unions appear to act no differently Table 6 shows
the average salaries for full-time employees in the
top four positions in many unions president vice
president business manager and treasurer20 These
figures include only gross salary payments that anindividual union reports on its disclosure forms
They do not include benefits or supplemental pay-
ments from other union entities
Union officers make considerably more in nonndash
right-to-work states Without weighting by mem-
bership the average union with a full-time president
pays him just under $90000 annually in a right-to-
work jurisdiction and just over $110000 annually in
states with compulsory dues Likewise the median
union with a full-time president pays him about
$20000 more in nonndashright-to-work states
Weighting by union membership increases aver-age union salaries because larger unions tend to pay
more The weighted figures show the salaries paid to
full-time officers in the unions to which the average
union member belongs
In most cases weighting increases the salary dif-
ference between right-to-work and nonndashright-to-
work states The average union member has a union
20 Not every union employs every officer The top official in some union locals is the president while in others it may be the business manager
Some unions have many vice presidents Others have none
AVERAGE DUES PER MEMBER
Model specification 983089 983090 983091
Coeffi cient on Forced Dues variable 983076983089983095983096983086983089983090 983076983094983096983086983097983090 983076983094983097983086983095983090
Standard error 983076983089983094983086983094983091 983076983090983088983086983091983091 983076983090983088983086983093983096
P-value 983088983086983088983088983088 983088983086983088983088983089 983088983086983088983088983089
Controls for
Particular union No Yes Yes
Log of agerage private-sector union earnings No No Yes
Year No No Yes
Sample size 983089983088983093983084983089983095983093 983097983091983084983088983095983088 983097983091983084983088983095983088
R-squared 983088983086983088983090983097 983088983086983091983095983096 983088983086983091983096983088
AVERAGE DUES PER PAYING MEMBER
Model specification 983089 983090 983091
Coeffi cient on Forced Dues variable 983076983089983092983089983086983091983096 983076983095983089983086983096983093 983076983095983090983086983089983091
Standard error 983076983090983091983086983097983091 983076983090983097983086983090983092 983076983090983097983086983089983089
P-value 983088983086983088983088983088 983088983086983088983089983092 983088983086983088983089983091
Controls for
Particular union No Yes Yes
Log of average private-sector union earnings No No Yes
Year No No Yes
Sample size 983090983093983084983091983094983094 983090983091983084983089983089983096 983090983091983084983089983089983096
R-squared 983088983086983088983089983090 983088983086983092983088983092 983088983086983092983088983093
TABLE 5
Dues per Member Regressed on Forced Dues Requirements and Control Variables
Note Observations are weighted by total union membership or total paying membershipSource Heritage Foundation calculations using data from the US Census Bureau Current Population Surveyand union financial disclosure reports filed with the US Department of Labor and reported publicly onunionreportsgov See Appendix for details BG 2987 heritageorg
892019 Report on Union Dues amp Officer Salaries In Right-To-Work v Non-Right-To-Work States
httpslidepdfcomreaderfullreport-on-union-dues-officer-salaries-in-right-to-work-v-non-right-to-work 914
9
BACKGROUNDER | NO 2987
JANUARY 26 2015
president who makes $170000 annually in states
with compulsory dues but only $132000 in states
with voluntary duesmdasha $38000 difference Agai n other factors could influence this gap
Southern statesmdashalmost entirely right to workmdash
generally have lower wages and lower costs of liv-
ing21 Economists would expect unions in these
states to pay lower salaries As with dues charged
controlling for other factors substantially reduces
the difference between right-to-work and com-
pulsory-dues states However a significant pre-
mium for union officers in nonndashright-to-work
states remains
Table 7 and Table 8 show the unweighted and
weighted regressions for the log of union officersrsquosalaries on forced-dues requirements and control
variables for each of the four separate union posi-
tions They follow the same format as the regres-
sions on dues per member The first column shows a
simple regression of logged salaries on an indicator
for compulsory-dues requirements The second col-
umn adds controls for the particular international
union that employs the officers The third columnadds controls for average union member (not officer)
earnings in that state and year the size of the union
and the particular year22 All figures are in inflation-
adjusted 2013 dollars
In the unweighted regressions after controlling
for all other factors and looking only at full-time
employees the average union pays its president 12
percent more its vice presidents 7 percent more its
business manager 22 percent more and its treasurer
13 percent more in states with forced dues The dif-
ferences are highly statistically significant for presi-
dents business managers and treasurers The esti-mate for vice presidents was statistically significant
at the 6 percent level
Weighted by union membership and controlling
for other factors the pay premium for the aver-
age union membersrsquo president is not statistically
21 Every Southern state except Kentucky and Missouri has a right-to-work law
22 Total union membership was omitted as a control from the regressions on dues per member because it entered into the denominator of the
dependent variable
UNWEIGHTED
MEDIAN SALARY AVERAGE SALARY SAMPLE SIZE
Right-to-Work
CompulsoryDues Difference
Right-to-Work
CompulsoryDues Difference
Right-to-Work
CompulsoryDues
President 983076983095983094983084983096983095983091 983076983097983095983084983088983090983091 983076983090983088983084983089983093983088 (983090983094983086983090) 983076983096983096983084983097983095983090 983076983089983089983089983084983096983097983093 983076983090983090983084983097983090983091 (983090983093983086983096) 983090983084983093983094983095 983095983084983094983089983095
Vice-President 983076983095983092983084983097983093983093 983076983097983095983084983097983088983097 983076983090983090983084983097983093983093 (983091983088983086983094) 983076983096983096983084983091983089983090 983076983089983088983093983084983088983089983091 983076983089983094983084983095983088983088 (983089983096983086983097) 983089983084983090983094983093 983094983084983089983093983095
Treasurer 983076983096983089983084983091983096983090 983076983097983096983084983094983091983091 983076983089983095983084983090983093983090 (983090983089983086983090) 983076983096983096983084983097983092983094 983076983089983088983097983084983096983092983091 983076983090983088983084983096983097983094 (983090983091983086983093) 983089983084983092983095983092 983094983084983093983093983092
Business Manager 983076983095983097983084983092983096983088 983076983089983088983088983084983094983090983089 983076983090983089983084983089983092983088 (983090983094983086983094) 983076983096983094983084983094983091983094 983076983089983088983097983084983097983089983089 983076983090983091983084983090983095983092 (983090983094983086983097) 983089983084983088983097983096 983092983084983088983089983097
WEIGHTED BY TOTAL MEMBERSHIP
MEDIAN SALARY AVERAGE SALARY SAMPLE SIZE
Right-to-Work
CompulsoryDues Difference
Right-to-Work
CompulsoryDues Difference
Right-to-Work
CompulsoryDues
President 983076983089983088983091983084983095983090983094 983076983089983094983095983084983094983095983090 983076983094983091983084983097983092983095 (983094983089983086983094) 983076983089983091983090983084983092983090983088 983076983089983095983088983084983088983093983095 983076983091983095983084983094983091983094 (983090983096983086983092) 983090983084983093983090983091 983095983084983093983089983089
Vice-President 983076983097983097983084983094983093983092 983076983089983090983094983084983091983088983094 983076983090983094983084983094983093983090 (983090983094983086983095) 983076983089983089983091983084983097983095983094 983076983089983091983092983084983089983092983088 983076983090983088983084983089983094983092 (983089983095983086983095) 983089983084983090983094983091 983094983084983089983088983089
Treasurer 983076983089983088983095983084983097983088983091 983076983089983092983097983084983096983095983092 983076983092983089983084983097983095983089 (983091983096983086983097) 983076983089983090983089983084983094983096983096 983076983089983093983097983084983090983090983090 983076983091983095983084983093983091983093 (983091983088983086983096) 983089983084983092983094983091 983094983084983092983094983088
Business Manager 983076983096983097983084983090983097983094 983076983089983090983093983084983094983094983088 983076983091983094983084983091983094983092 (983092983088983086983095) 983076983097983096983084983091983092983093 983076983089983091983092983084983093983094983094 983076983091983094983084983090983090983088 (983091983094983086983096) 983089983084983088983096983093 983091983084983097983095983095
TABLE 6
Salaries for Full-Time Top Union Offi cers in Compulsory Duesand Right-to-Work States
Source Heritage Foundation calculations using data from 2005ndash2013 union financial reports filed withthe US Department of Labor Offi ce of Labor Management Standards See Appendix for details BG 2987 heritageorg
892019 Report on Union Dues amp Officer Salaries In Right-To-Work v Non-Right-To-Work States
httpslidepdfcomreaderfullreport-on-union-dues-officer-salaries-in-right-to-work-v-non-right-to-work 1014
10
BACKGROUNDER | NO 2987
JANUARY 26 2015
significant23 However the other three offices all
show large and highly significant pay differences
for full-time employees The typical union mem-
bersrsquo vice presidents make 13 percent more busi-ness managers make 17 percent more and trea-
surers make 9 percent more in the absence of a
right-to-work law
Table 9 shows the results of regressing dues
requirements and control variables on officersrsquo gross
salaries (instead of the log) To conserve space and
for ease of presentation the table shows only thepreferred model specification in the third column of
Tables 7 and 8 which includes all of the control vari-
ables It is also weighted by union membership24
23 The 47 percent pay premium for union presidents when weighted by union membership does not approach statistical significance because
it could arise from pure chance 188 percent of the time However this lack of significance could arise from random chance Just as a table of
random numbers will occasionally have some statistically significant differences a series of true relationships will occasionally fail to exhibit
statistical significance
24 Specifications (1) and (2) also showed large and statistically significant differences between right-to-work and nonndashright-to-work states as
did the unweighted regressions
PRESIDENT VICE PRESIDENTModel specification 983089 983090 983091 983089 983090 983091
Percentage difference in salaries 983090983091983086983088 983089983097983086983091 983089983090983086983092 983090983089983086983088 983089983095983086983094 983094983086983093
Coeffi cient on Forced Dues variable 983088983086983090983088983095 983088983086983089983095983095 983088983086983089983089983095 983088983086983089983097983089 983088983086983089983094983090 983088983086983088983094983091
Standard error 983088983086983088983089983097 983088983086983088983090983093 983088983086983088983090983090 983088983086983088983093983090 983088983086983088983092983091 983088983086983088983091983091
P-value 983088983086983088983088983088 983088983086983088983088983088 983088983086983088983088983088 983088983086983088983088983088 983088983086983088983088983088 983088983086983088983094983088
Controls for983098
Particular union No No Yes No Yes Yes
Year No Yes Yes No No Yes
Log membership size No Yes Yes No No Yes
Log of average private-sector union earnings No Yes Yes No No Yes
Sample size 983089983088983084983089983096983092 983097983084983088983091983093 983096983084983097983088983092 983095983084983092983090983090 983094983084983094983097983088 983094983084983094983091983097
R-squared 983088983086983088983092983097 983088983086983090983093983088 983088983086983091983097983090 983088983086983088983092983090 983088983086983090983097983096 983088983086983092983092983094
BUSINESS MANAGER TREASURER
Model specification 983089 983090 983091 983089 983090 983091
Percentage difference in salaries 983090983094983086983090 983090983094983086983097 983090983090983086983089 983090983089983086983094 983090983089983086983094 983089983091983086983092
Coeffi cient on Forced Dues variable 983088983086983090983091983091 983088983086983090983091983097 983088983086983090983088983088 983088983086983089983097983093 983088983086983089983097983093 983088983086983089983090983094
Standard error 983088983086983088983090983093 983088983086983088983090983090 983088983086983088983089983097 983088983086983088983090983090 983088983086983088983090983091 983088983086983089983090983094
P-value 983088983086983088983088983088 983088983086983088983088983088 983088983086983088983088983088 983088983086983088983088983088 983088983086983088983088983088 983088983086983088983088983088
Controls for983098
Particular union No Yes Yes No Yes Yes
Year No No Yes No No Yes
Log membership size No No Yes No No Yes
Log of average private-sector union earnings No No Yes No No Yes
Sample size 983093983084983089983089983095 983093983084983088983094983093 983093983084983088983089983088 983096983084983088983090983096 983095983084983093983095983090 983095983084983092983095983090
R-squared 983088983086983088983095983097 983088983086983089983096983089 983088983086983091983093983096 983088983086983088983092983089 983088983086983090983088983088 983088983086983091983095983096
TABLE 7
Full-Time Log Offi cer Salaries Regressed on Forced Dues Requirementsand Control Variables
Notes Observations are unweighted ndash Statistically insignificantSource Heritage Foundation calculations using data from the US Census Bureau Current Population Surveyand union financial disclosure reports filed with the US Department of Labor and reported publicly onunionreportsgov See Appendix for details BG 2987 heritageorg
892019 Report on Union Dues amp Officer Salaries In Right-To-Work v Non-Right-To-Work States
httpslidepdfcomreaderfullreport-on-union-dues-officer-salaries-in-right-to-work-v-non-right-to-work 1114
11
BACKGROUNDER | NO 2987
JANUARY 26 2015
This linear specification continues to show that
after controlling for other factors full-time union
officers collect substantially higher salaries in states
with compulsory dues Union presidents make$12800 more per year vice presidents make $19500
more business managers make $30000 more and
treasurers make $23200 more
The officers representing the typical union mem-
ber make roughly $20000 more per year thanks
to forced unionization Compulsory dues enable
unions to force workers to pay higher dues Part of
those funds flow back to their officers in the form of
higher salaries
Right to Work Protects WorkersCompulsory dues give unions a monopoly in the
workplace The absence of a right-to-work law forces
workers to purchase union representation regard-
less of how their union performs UAW Commit-
teeman Chad Poynor recently admitted to The New
York Times ldquoYou hear people all the time say lsquoIf I
were in a right-to-work state Irsquod withdrawrsquordquo25
25 Shalia Dewan ldquoFoes of Unions Try Their Luck in County Lawsrdquo The New York Times December 18 2014
httpwwwnytimescom20141219uspoliticsfoes-of-unions-try-their-luck-in-county-lawshtml (accessed January 7 2015)
PRESIDENT VICE PRESIDENTModel specification 983089 983090 983091 983089 983090 983091
Percentage difference in salaries 983091983089983086983088 983090983089983086983090 983092983086983095 983090983088983086983094 983089983096983086983096 983089983090983086983095
Coeffi cient on Forced Dues variable 983076983088983086983090983095983088 983076983088983086983089983097983090 983076983088983086983088983092983094 983088983086983089983096983096 983088983086983089983095983090 983088983086983089983089983097
Standard error 983076983088983086983088983096983095 983076983088983086983088983093983089 983076983088983086983088983091983093 983088983086983089983090983090 983088983086983088983092983088 983088983086983088983091983092
P-value 983088983086983088983088983090 983088983086983088983088983088 983088983086983089983096983096 983088983086983089983090983094 983088983086983088983088983088 983088983086983088983088983088
Controls for983098
Particular union No Yes Yes No Yes Yes
Year No No Yes No No Yes
Log membership size No No Yes No No Yes
Log of average private-sector union earnings No No Yes No No Yes
Sample size 983089983088983084983088983091983092 983096983084983097983088983092 983096983084983097983088983092 983095983084983091983094983092 983094983084983094983091983097 983094983084983094983091983097R-squared 983076983088983086983088983091983091 983076983088983086983092983089983094 983076983088983086983093983092983088 983088983086983088983089983094 983088983086983092983094983093 983088983086983093983090983093
BUSINESS MANAGER TREASURER
Model specification 983089 983090 983091 983089 983090 983091
Percentage difference in salaries 983091983093983086983093 983091983093983086983091 983089983095983086983088 983091983089983086983093 983090983091983086983088 983097983086983091
Coeffi cient on Forced Dues variable 983088983086983091983088983092 983088983086983091983088983090 983088983086983089983093983095 983088983086983090983095983092 983088983086983090983088983095 983088983086983088983096983097
Standard error 983088983086983088983095983093 983088983086983088983093983090 983088983086983088983091983097 983088983086983088983097983090 983088983086983088983093983093 983088983086983088983091983091
P-value 983088983086983088983088983088 983088983086983088983088983088 983088983086983088983088983088 983088983086983088983088983091 983088983086983088983088983088 983088983086983088983088983095
Controls for983098
Particular union No Yes Yes No Yes Yes
Year No No Yes No No Yes
Log membership size No No Yes No No Yes
Log of average private-sector union earnings No No Yes No No Yes
Sample size 983093983084983088983094983090 983093983084983088983089983088 983093983084983088983089983088 983095983084983097983090983091 983095983084983092983095983090 983095983084983092983095983090
R-squared 983088983086983088983093983091 983088983086983091983093983091 983088983086983094983089983093 983088983086983088983091983091 983088983086983091983092983093 983088983086983093983088983094
TABLE 8
Log Full-Time Offi cer Salaries Regressed on Forced Dues Requirementsand Control Variables Weighted by Total Union Membership
Notes Observations are weighted by total union membership ndash Statistically insignificantSource Heritage Foundation calculations using data from the US Census Bureau Current Population Surveyand union financial disclosure reports filed with the US Department of Labor and reported publicly onunionreportsgov See Appendix for details BG 2987 heritageorg
892019 Report on Union Dues amp Officer Salaries In Right-To-Work v Non-Right-To-Work States
httpslidepdfcomreaderfullreport-on-union-dues-officer-salaries-in-right-to-work-v-non-right-to-work 1214
12
BACKGROUNDER | NO 2987
JANUARY 26 2015
Unions use their monopoly position the same way
corporations do They raise their prices and pay their
employees more Because workers in nonndashright-to-
work states ca nnot opt out unions have little incen-
tive to hold down either dues or labor costs
Of course many union officers truly want to
improve workersrsquo lives However without right-to- work laws unions face few institutional pressures to
put their membersrsquo interests first They do not need
to persuade workers that the benefits of union repre-
sentation outweigh its costs They can simply force
them to pay dues or be fired The lack of incentives to
economize leads to higher costs for union members
and inflated salaries for their officers
Unions complain that right to work forces them
to represent free riders Besides its legal inaccu-
racy this claim has the problem backwards26 The
absence of right-to-work laws allows unions to free
ride on captive customers Controlling for other fac-
tors unions charge 10 percent higher dues and pay
their top officers $20000 more annually in nonndashright-to-work states
Right-to-work laws protect workers from a union
monopoly Voluntary dues require unions earn
workersrsquo support
mdashJames Sherk is Senior Policy Analyst in Labor
Economics in the Center for Data Analysis of the
Institute for Economic Freedom and Opportunity at
The Heritage Foundation
26 The Supreme Court has repeatedly ruled that the National Labor Relations Act allows unions to negotiate contracts covering only dues-paying
members As Justice William J Brennan wrote in Retail Clerks v Dry Lion Goods (1962) ldquolsquoMembers onlyrsquo contracts have long been recognizedrdquo
Unions represent non-members only when they act as ldquoexclusive bargaining representativesrdquo which requires non-members to accept the
unionrsquos representation In that case the law requires unions to represent non-members fairly They cannot negotiate high wages for their
supporters and the minimum wage for non-members Unions can avoid representing non-members by disclaiming exclusive representative
status 369 US 17 (1962)
Model specification President Vice President Business Manager Treasurer
Difference in salaries in Forced Dues states 983076983089983090983084983096983090983092 983076983089983097983084983093983092983093 983076983091983088983084983088983093983089 983076983090983091983084983090983092983088
Standard error 983076983094983084983092983093983090 983076983093983084983091983095983094 983076983095983084983096983092983091 983076983094983084983096983093983095
P-value 983088983086983088983092983095 983088983086983088983088983088 983088983086983088983088983088 983088983086983088983088983089
Sample size 983096983084983097983088983092 983094983084983094983091983097 983093983084983088983089983088 983095983084983092983095983090
R-squared 983088983086983093983091983093 983088983086983093983090983091 983088983086983091983095983091 983088983086983092983090983090
TABLE 9
Full-Time Offi cer Salaries Regressed on Forced Dues Requirementsand Control Variables Weighted by Total Union Membership
Note Observations are weighted by total union membership The regression model used to arrive at these estimates used the same specificationand control variables as used in specification 3 in Tables 7 and 8 with all variables specified in linear and not log form These controls includedummy variables for the year individual union average earnings of union members in that state and year and union size
Source Heritage Foundation calculations using data from the US Census Bureau Current Population Survey and union financial disclosurereports filed with the US Department of Labor and reported publicly on unionreportsgov See Appendix for details
BG 2987 heritageorg
892019 Report on Union Dues amp Officer Salaries In Right-To-Work v Non-Right-To-Work States
httpslidepdfcomreaderfullreport-on-union-dues-officer-salaries-in-right-to-work-v-non-right-to-work 1314
13
BACKGROUNDER | NO 2987
JANUARY 26 2015
Appendix
The Heritage Foundationrsquos Center for Data Anal-
ysis (CDA) calculated these figures using data for
2005ndash2013 from the Department of Laborrsquos Office
of Labor-Management Standards (OLMS) yearly
labor-management (LM) data and the Current Pop-
ulation Survey These data are publicly available
online at no cost27
All LM forms require unions to identify how
many members they had that year The subset of
unions that file the LM-2 forms must also break
down their members by category The CDA used a
regular expression match to identify subgroups of
these categories unlikely to pay dues such as mem-
bers in the ldquolaid offrdquo ldquoretiredrdquo and ldquofree duesrdquo cat-egories These members were subtracted from the
larger category of overall membership to arrive at an
estimate of the number of dues-paying members in
union locals filing LM-2 forms The CDA construct-
ed the dues-per-member and dues-per-paying-
member variables by dividing the total amount that
a union reported collecting in dues and agency fees
by the number of members and dues-paying member
variables respectively All the dues and officer sala-
ry figures were converted to 2013 dollars using the
Personal Consumption Expenditures price index
The LMRDA applies to unions that have at leastone private-sector member Consequently the
LMRDA filings used in this analysis exclude the local
chapters of most government unions Some govern-
ment unions do represent private-sector workers
such as teachers unions that have organized private
schools Such unions must file federal disclosure
reports and this analysis includes them
In many unions local chapters directly collect
dues Those locals then remit a per-capita tax to their
state andor international headquarters The state
and national headquarters consequently report far
lower ldquodues per memberrdquo because their incomecomes from levies on their local chapters not direct-
ly collected dues The CDA excluded such unions
from the dues-per-member analysis by examining
only unions that derived at least two-thirds of their
revenues from dues and agency fees
Some unions reported implausibly large or
small annual dues-per-member figures even after
this exclusion For example one union charged an
estimated $1 per member per year while another
charged more than $1000000 per member per
year Such outliers are primarily the result of either
(a) data or reporting errors such as misplaced dec-
imal places and zeros in completed forms or (b)
state or national headquarters with limited direct
dues income but large memberships To prevent
such data errors from biasing the results the CDArestricted attention to unions that charged more
than $50 but less than $10000 in annual dues This
captures over 95 percent of unions while exclud-
ing implausible outliers The results were robust to
using alternative cutoffs
The CDA used a regular expression match on
the job titles reported in the OLMS filings to create
dummy variables identifying the four top positions
in most unions president vice president business
manager and treasurer (sometimes secretary-trea-
surer) The categories are mutually exclusive Some-
one reported as ldquopresident and treasurerrdquo on theforms was classified in this analysis as only a union
president and not as a treasurer
The LMRDA filings do not directly indicate
full-time and part-time or full-year and part-year
employees Taken at face value this can produce
seriously misleading estimates of union compensa-
tion For example in 2011 Carpenters Local 1024
reported paying its president $2130 on its LM-2
forms28 Further analysis of the localrsquos 990 forms
filed with the IRS revealed that the president report-
ed working two hours a week To focus the analysis
on full-time employees the CDA excluded officers who did not make at least $50000 a year These
restrictions considerably reduced the sample size
27 See US Department of Labor Office of Labor-Management Standards ldquoDownload Yearly Datardquo
httpkcerdsdol-esagovquerygetYearlyDatado (accessed January 7 2015) and National Bureau of Economic Research ldquoCPS Merged
Outgoing Rotation Groupsrdquo httpwwwnberorgmorgannual (accessed January 7 2015)
28 United Brotherhood of Carpenters Local 1024 ldquoForm LM-2 Labor Organization Annual Reportrdquo US Department of Labor Office of Labor-
Management Standards 2011 File No 011-457 httpkcerdsdol-esagovquerygetOrgQrydo (accessed January 7 2015) It is unknown
whether the president received additional payments from separate union trust funds because disclosure of these funds is not required
892019 Report on Union Dues amp Officer Salaries In Right-To-Work v Non-Right-To-Work States
httpslidepdfcomreaderfullreport-on-union-dues-officer-salaries-in-right-to-work-v-non-right-to-work 1414
BACKGROUNDER | NO 2987
JANUARY 26 2015
Sensitivity tests found that removing this restric-
tion produced similar results to those presented in
the main paper29 Also excluded were officers who
did not work for the union the year before or the year
after the filing so as to exclude employees who joined
or left the union partway through the year 30
The CDA identified workers as subject to com-
pulsory dues if they (1) lived in a nonndashright-to-
work state or (2) belonged to a union subject to the
Railway Labor Act principally airline and railway
unions It excluded unions located in Indiana or
Michigan after they passed their right-to-work laws
as well as unions located in Washington DC The
right-to-work status of these unions was ambiguous
Indiana and Michigan passed right-to-work laws
which took effect in 2012 and 2013 respectively andapplied only to union contracts renewed after that
time Many unions filing LMRDA reports in those
states still enjoyed compulsory-dues powers in 2013
For example the UAW contracts with the Big Three
automakers requiring compulsory dues run through
2015 Many unions representing workers in both
right-to-work and nonndashright-to-work states have
their national headquarters in Washington
The CDA used a regular expression match on
union names in LM filings to create dummy vari-
ables for the most common unions to which work-
ers belong such as the Machinists the Boilermakersand the Food and Commercial Workers
Data from the Current Population Survey outgo-
ing rotation groups was used to estimate the average
weekly earnings of private-sector unions by state
and year These averages excluded union members
with imputed earnings because the Census Bureau
does not use union membership status as a matching
variable for imputation
The CDA conducted the analysis using OLS
regressions on the log and level of dues per member
and officer salaries The CDA used heteroskedastici-
ty robust errors clustered by union local throughoutOne concern is that clustering does not sufficiently
account for the increase in sample size driven by
the panel dimension of the datamdashrepeated observa-
tions from many of the same unions over time The
CDA ran the analysis in a panel-data format using
Driscoll-Kraay standard errors and found very simi-
lar results31 It also ran the analysis using a panel data
specification and both random effects and between
effects estimators The results from these analyses
were also highly statistically significant and very
similar to the unweighted regressions reported here
Stata does not produce weighted random effects or
between effects estimates
The CDA did not use either state or union local
fixed effects in its analysis because right-to-work
laws varied little within states or union locals dur-
ing this period Including such fixed effects would
absorb all variation in right-to-work status except
that caused by passage of the Indiana and Michigan
right-to-work laws in 2012mdashlaws that had not taken
effect for many union locals by 2013 Additional variables included dummy variables
for year the particular international union repre-
senting workers the log or level of average union
earnings and total union membership Alternative
specifications for the control variables such as high-
er-order polynomials of union membership size had
little effect on the overall results
When weighting union officersrsquo salaries by union
membership the CDA divided by the total number
of such officers in that union local For example if
a union local had three vice presidents the analysis
would give each of those officersrsquo salary one-thirdof the weight of a solitary vice presidentrsquos salary in
a local with the same number of members This was
done so that the final weighted estimates would
reflect the average salaries paid to the top officers
representing the typical union member
The CDA also examined the effect of forced-dues
requirements on total disbursements to union offi-
cers including both gross salaries and reimburse-
ments for official expenses such as work meals and
travel expenses Mandatory dues requirements had
a modestly larger effect on total disbursements than
on gross salaries However detailed examination of whether the additional disbursements beyond sala-
ries resulted from a greater workload or from addi-
tional non-salary compensation is beyond the scope
of this paper These results are available from the
author upon request
29 The proportional difference in salaries was similar and highly statistically significant The absolute magnitude of the salary differences
decreased when the analysis included lower-earning part-time employees
30 For 2013 filings this restriction was relaxed to exclude only employees who did not work for the union the year before
31 Driscoll-Kraay standard errors are robust to both between and within correlation in panel data
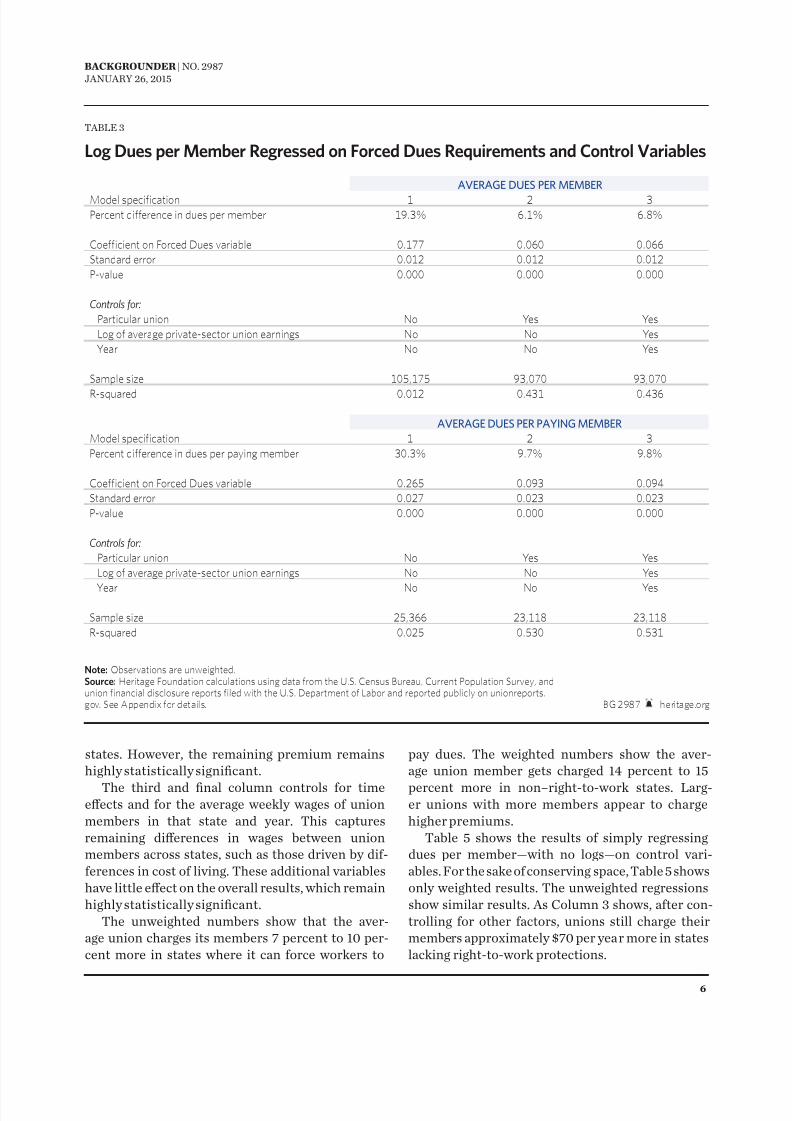
892019 Report on Union Dues amp Officer Salaries In Right-To-Work v Non-Right-To-Work States
httpslidepdfcomreaderfullreport-on-union-dues-officer-salaries-in-right-to-work-v-non-right-to-work 1114
11
BACKGROUNDER | NO 2987
JANUARY 26 2015
This linear specification continues to show that
after controlling for other factors full-time union
officers collect substantially higher salaries in states
with compulsory dues Union presidents make$12800 more per year vice presidents make $19500
more business managers make $30000 more and
treasurers make $23200 more
The officers representing the typical union mem-
ber make roughly $20000 more per year thanks
to forced unionization Compulsory dues enable
unions to force workers to pay higher dues Part of
those funds flow back to their officers in the form of
higher salaries
Right to Work Protects WorkersCompulsory dues give unions a monopoly in the
workplace The absence of a right-to-work law forces
workers to purchase union representation regard-
less of how their union performs UAW Commit-
teeman Chad Poynor recently admitted to The New
York Times ldquoYou hear people all the time say lsquoIf I
were in a right-to-work state Irsquod withdrawrsquordquo25
25 Shalia Dewan ldquoFoes of Unions Try Their Luck in County Lawsrdquo The New York Times December 18 2014
httpwwwnytimescom20141219uspoliticsfoes-of-unions-try-their-luck-in-county-lawshtml (accessed January 7 2015)
PRESIDENT VICE PRESIDENTModel specification 983089 983090 983091 983089 983090 983091
Percentage difference in salaries 983091983089983086983088 983090983089983086983090 983092983086983095 983090983088983086983094 983089983096983086983096 983089983090983086983095
Coeffi cient on Forced Dues variable 983076983088983086983090983095983088 983076983088983086983089983097983090 983076983088983086983088983092983094 983088983086983089983096983096 983088983086983089983095983090 983088983086983089983089983097
Standard error 983076983088983086983088983096983095 983076983088983086983088983093983089 983076983088983086983088983091983093 983088983086983089983090983090 983088983086983088983092983088 983088983086983088983091983092
P-value 983088983086983088983088983090 983088983086983088983088983088 983088983086983089983096983096 983088983086983089983090983094 983088983086983088983088983088 983088983086983088983088983088
Controls for983098
Particular union No Yes Yes No Yes Yes
Year No No Yes No No Yes
Log membership size No No Yes No No Yes
Log of average private-sector union earnings No No Yes No No Yes
Sample size 983089983088983084983088983091983092 983096983084983097983088983092 983096983084983097983088983092 983095983084983091983094983092 983094983084983094983091983097 983094983084983094983091983097R-squared 983076983088983086983088983091983091 983076983088983086983092983089983094 983076983088983086983093983092983088 983088983086983088983089983094 983088983086983092983094983093 983088983086983093983090983093
BUSINESS MANAGER TREASURER
Model specification 983089 983090 983091 983089 983090 983091
Percentage difference in salaries 983091983093983086983093 983091983093983086983091 983089983095983086983088 983091983089983086983093 983090983091983086983088 983097983086983091
Coeffi cient on Forced Dues variable 983088983086983091983088983092 983088983086983091983088983090 983088983086983089983093983095 983088983086983090983095983092 983088983086983090983088983095 983088983086983088983096983097
Standard error 983088983086983088983095983093 983088983086983088983093983090 983088983086983088983091983097 983088983086983088983097983090 983088983086983088983093983093 983088983086983088983091983091
P-value 983088983086983088983088983088 983088983086983088983088983088 983088983086983088983088983088 983088983086983088983088983091 983088983086983088983088983088 983088983086983088983088983095
Controls for983098
Particular union No Yes Yes No Yes Yes
Year No No Yes No No Yes
Log membership size No No Yes No No Yes
Log of average private-sector union earnings No No Yes No No Yes
Sample size 983093983084983088983094983090 983093983084983088983089983088 983093983084983088983089983088 983095983084983097983090983091 983095983084983092983095983090 983095983084983092983095983090
R-squared 983088983086983088983093983091 983088983086983091983093983091 983088983086983094983089983093 983088983086983088983091983091 983088983086983091983092983093 983088983086983093983088983094
TABLE 8
Log Full-Time Offi cer Salaries Regressed on Forced Dues Requirementsand Control Variables Weighted by Total Union Membership
Notes Observations are weighted by total union membership ndash Statistically insignificantSource Heritage Foundation calculations using data from the US Census Bureau Current Population Surveyand union financial disclosure reports filed with the US Department of Labor and reported publicly onunionreportsgov See Appendix for details BG 2987 heritageorg
892019 Report on Union Dues amp Officer Salaries In Right-To-Work v Non-Right-To-Work States
httpslidepdfcomreaderfullreport-on-union-dues-officer-salaries-in-right-to-work-v-non-right-to-work 1214
12
BACKGROUNDER | NO 2987
JANUARY 26 2015
Unions use their monopoly position the same way
corporations do They raise their prices and pay their
employees more Because workers in nonndashright-to-
work states ca nnot opt out unions have little incen-
tive to hold down either dues or labor costs
Of course many union officers truly want to
improve workersrsquo lives However without right-to- work laws unions face few institutional pressures to
put their membersrsquo interests first They do not need
to persuade workers that the benefits of union repre-
sentation outweigh its costs They can simply force
them to pay dues or be fired The lack of incentives to
economize leads to higher costs for union members
and inflated salaries for their officers
Unions complain that right to work forces them
to represent free riders Besides its legal inaccu-
racy this claim has the problem backwards26 The
absence of right-to-work laws allows unions to free
ride on captive customers Controlling for other fac-
tors unions charge 10 percent higher dues and pay
their top officers $20000 more annually in nonndashright-to-work states
Right-to-work laws protect workers from a union
monopoly Voluntary dues require unions earn
workersrsquo support
mdashJames Sherk is Senior Policy Analyst in Labor
Economics in the Center for Data Analysis of the
Institute for Economic Freedom and Opportunity at
The Heritage Foundation
26 The Supreme Court has repeatedly ruled that the National Labor Relations Act allows unions to negotiate contracts covering only dues-paying
members As Justice William J Brennan wrote in Retail Clerks v Dry Lion Goods (1962) ldquolsquoMembers onlyrsquo contracts have long been recognizedrdquo
Unions represent non-members only when they act as ldquoexclusive bargaining representativesrdquo which requires non-members to accept the
unionrsquos representation In that case the law requires unions to represent non-members fairly They cannot negotiate high wages for their
supporters and the minimum wage for non-members Unions can avoid representing non-members by disclaiming exclusive representative
status 369 US 17 (1962)
Model specification President Vice President Business Manager Treasurer
Difference in salaries in Forced Dues states 983076983089983090983084983096983090983092 983076983089983097983084983093983092983093 983076983091983088983084983088983093983089 983076983090983091983084983090983092983088
Standard error 983076983094983084983092983093983090 983076983093983084983091983095983094 983076983095983084983096983092983091 983076983094983084983096983093983095
P-value 983088983086983088983092983095 983088983086983088983088983088 983088983086983088983088983088 983088983086983088983088983089
Sample size 983096983084983097983088983092 983094983084983094983091983097 983093983084983088983089983088 983095983084983092983095983090
R-squared 983088983086983093983091983093 983088983086983093983090983091 983088983086983091983095983091 983088983086983092983090983090
TABLE 9
Full-Time Offi cer Salaries Regressed on Forced Dues Requirementsand Control Variables Weighted by Total Union Membership
Note Observations are weighted by total union membership The regression model used to arrive at these estimates used the same specificationand control variables as used in specification 3 in Tables 7 and 8 with all variables specified in linear and not log form These controls includedummy variables for the year individual union average earnings of union members in that state and year and union size
Source Heritage Foundation calculations using data from the US Census Bureau Current Population Survey and union financial disclosurereports filed with the US Department of Labor and reported publicly on unionreportsgov See Appendix for details
BG 2987 heritageorg
892019 Report on Union Dues amp Officer Salaries In Right-To-Work v Non-Right-To-Work States
httpslidepdfcomreaderfullreport-on-union-dues-officer-salaries-in-right-to-work-v-non-right-to-work 1314
13
BACKGROUNDER | NO 2987
JANUARY 26 2015
Appendix
The Heritage Foundationrsquos Center for Data Anal-
ysis (CDA) calculated these figures using data for
2005ndash2013 from the Department of Laborrsquos Office
of Labor-Management Standards (OLMS) yearly
labor-management (LM) data and the Current Pop-
ulation Survey These data are publicly available
online at no cost27
All LM forms require unions to identify how
many members they had that year The subset of
unions that file the LM-2 forms must also break
down their members by category The CDA used a
regular expression match to identify subgroups of
these categories unlikely to pay dues such as mem-
bers in the ldquolaid offrdquo ldquoretiredrdquo and ldquofree duesrdquo cat-egories These members were subtracted from the
larger category of overall membership to arrive at an
estimate of the number of dues-paying members in
union locals filing LM-2 forms The CDA construct-
ed the dues-per-member and dues-per-paying-
member variables by dividing the total amount that
a union reported collecting in dues and agency fees
by the number of members and dues-paying member
variables respectively All the dues and officer sala-
ry figures were converted to 2013 dollars using the
Personal Consumption Expenditures price index
The LMRDA applies to unions that have at leastone private-sector member Consequently the
LMRDA filings used in this analysis exclude the local
chapters of most government unions Some govern-
ment unions do represent private-sector workers
such as teachers unions that have organized private
schools Such unions must file federal disclosure
reports and this analysis includes them
In many unions local chapters directly collect
dues Those locals then remit a per-capita tax to their
state andor international headquarters The state
and national headquarters consequently report far
lower ldquodues per memberrdquo because their incomecomes from levies on their local chapters not direct-
ly collected dues The CDA excluded such unions
from the dues-per-member analysis by examining
only unions that derived at least two-thirds of their
revenues from dues and agency fees
Some unions reported implausibly large or
small annual dues-per-member figures even after
this exclusion For example one union charged an
estimated $1 per member per year while another
charged more than $1000000 per member per
year Such outliers are primarily the result of either
(a) data or reporting errors such as misplaced dec-
imal places and zeros in completed forms or (b)
state or national headquarters with limited direct
dues income but large memberships To prevent
such data errors from biasing the results the CDArestricted attention to unions that charged more
than $50 but less than $10000 in annual dues This
captures over 95 percent of unions while exclud-
ing implausible outliers The results were robust to
using alternative cutoffs
The CDA used a regular expression match on
the job titles reported in the OLMS filings to create
dummy variables identifying the four top positions
in most unions president vice president business
manager and treasurer (sometimes secretary-trea-
surer) The categories are mutually exclusive Some-
one reported as ldquopresident and treasurerrdquo on theforms was classified in this analysis as only a union
president and not as a treasurer
The LMRDA filings do not directly indicate
full-time and part-time or full-year and part-year
employees Taken at face value this can produce
seriously misleading estimates of union compensa-
tion For example in 2011 Carpenters Local 1024
reported paying its president $2130 on its LM-2
forms28 Further analysis of the localrsquos 990 forms
filed with the IRS revealed that the president report-
ed working two hours a week To focus the analysis
on full-time employees the CDA excluded officers who did not make at least $50000 a year These
restrictions considerably reduced the sample size
27 See US Department of Labor Office of Labor-Management Standards ldquoDownload Yearly Datardquo
httpkcerdsdol-esagovquerygetYearlyDatado (accessed January 7 2015) and National Bureau of Economic Research ldquoCPS Merged
Outgoing Rotation Groupsrdquo httpwwwnberorgmorgannual (accessed January 7 2015)
28 United Brotherhood of Carpenters Local 1024 ldquoForm LM-2 Labor Organization Annual Reportrdquo US Department of Labor Office of Labor-
Management Standards 2011 File No 011-457 httpkcerdsdol-esagovquerygetOrgQrydo (accessed January 7 2015) It is unknown
whether the president received additional payments from separate union trust funds because disclosure of these funds is not required
892019 Report on Union Dues amp Officer Salaries In Right-To-Work v Non-Right-To-Work States
httpslidepdfcomreaderfullreport-on-union-dues-officer-salaries-in-right-to-work-v-non-right-to-work 1414
BACKGROUNDER | NO 2987
JANUARY 26 2015
Sensitivity tests found that removing this restric-
tion produced similar results to those presented in
the main paper29 Also excluded were officers who
did not work for the union the year before or the year
after the filing so as to exclude employees who joined
or left the union partway through the year 30
The CDA identified workers as subject to com-
pulsory dues if they (1) lived in a nonndashright-to-
work state or (2) belonged to a union subject to the
Railway Labor Act principally airline and railway
unions It excluded unions located in Indiana or
Michigan after they passed their right-to-work laws
as well as unions located in Washington DC The
right-to-work status of these unions was ambiguous
Indiana and Michigan passed right-to-work laws
which took effect in 2012 and 2013 respectively andapplied only to union contracts renewed after that
time Many unions filing LMRDA reports in those
states still enjoyed compulsory-dues powers in 2013
For example the UAW contracts with the Big Three
automakers requiring compulsory dues run through
2015 Many unions representing workers in both
right-to-work and nonndashright-to-work states have
their national headquarters in Washington
The CDA used a regular expression match on
union names in LM filings to create dummy vari-
ables for the most common unions to which work-
ers belong such as the Machinists the Boilermakersand the Food and Commercial Workers
Data from the Current Population Survey outgo-
ing rotation groups was used to estimate the average
weekly earnings of private-sector unions by state
and year These averages excluded union members
with imputed earnings because the Census Bureau
does not use union membership status as a matching
variable for imputation
The CDA conducted the analysis using OLS
regressions on the log and level of dues per member
and officer salaries The CDA used heteroskedastici-
ty robust errors clustered by union local throughoutOne concern is that clustering does not sufficiently
account for the increase in sample size driven by
the panel dimension of the datamdashrepeated observa-
tions from many of the same unions over time The
CDA ran the analysis in a panel-data format using
Driscoll-Kraay standard errors and found very simi-
lar results31 It also ran the analysis using a panel data
specification and both random effects and between
effects estimators The results from these analyses
were also highly statistically significant and very
similar to the unweighted regressions reported here
Stata does not produce weighted random effects or
between effects estimates
The CDA did not use either state or union local
fixed effects in its analysis because right-to-work
laws varied little within states or union locals dur-
ing this period Including such fixed effects would
absorb all variation in right-to-work status except
that caused by passage of the Indiana and Michigan
right-to-work laws in 2012mdashlaws that had not taken
effect for many union locals by 2013 Additional variables included dummy variables
for year the particular international union repre-
senting workers the log or level of average union
earnings and total union membership Alternative
specifications for the control variables such as high-
er-order polynomials of union membership size had
little effect on the overall results
When weighting union officersrsquo salaries by union
membership the CDA divided by the total number
of such officers in that union local For example if
a union local had three vice presidents the analysis
would give each of those officersrsquo salary one-thirdof the weight of a solitary vice presidentrsquos salary in
a local with the same number of members This was
done so that the final weighted estimates would
reflect the average salaries paid to the top officers
representing the typical union member
The CDA also examined the effect of forced-dues
requirements on total disbursements to union offi-
cers including both gross salaries and reimburse-
ments for official expenses such as work meals and
travel expenses Mandatory dues requirements had
a modestly larger effect on total disbursements than
on gross salaries However detailed examination of whether the additional disbursements beyond sala-
ries resulted from a greater workload or from addi-
tional non-salary compensation is beyond the scope
of this paper These results are available from the
author upon request
29 The proportional difference in salaries was similar and highly statistically significant The absolute magnitude of the salary differences
decreased when the analysis included lower-earning part-time employees
30 For 2013 filings this restriction was relaxed to exclude only employees who did not work for the union the year before
31 Driscoll-Kraay standard errors are robust to both between and within correlation in panel data
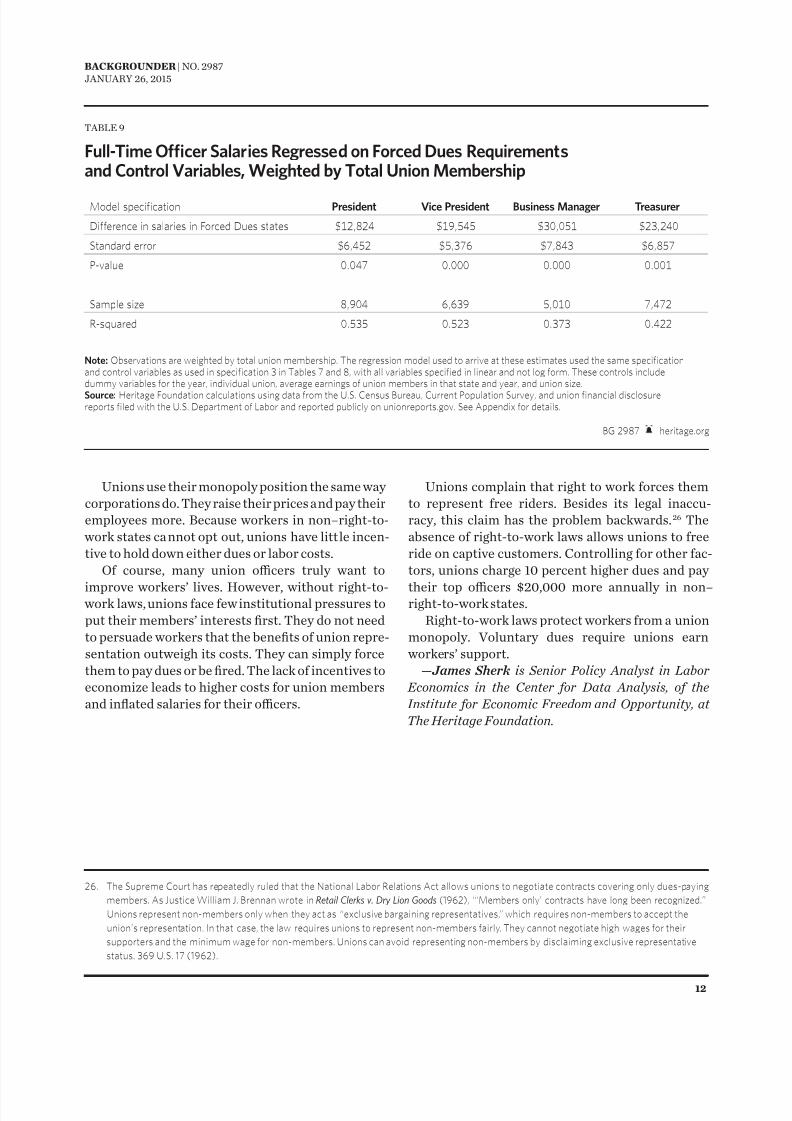
892019 Report on Union Dues amp Officer Salaries In Right-To-Work v Non-Right-To-Work States
httpslidepdfcomreaderfullreport-on-union-dues-officer-salaries-in-right-to-work-v-non-right-to-work 1214
12
BACKGROUNDER | NO 2987
JANUARY 26 2015
Unions use their monopoly position the same way
corporations do They raise their prices and pay their
employees more Because workers in nonndashright-to-
work states ca nnot opt out unions have little incen-
tive to hold down either dues or labor costs
Of course many union officers truly want to
improve workersrsquo lives However without right-to- work laws unions face few institutional pressures to
put their membersrsquo interests first They do not need
to persuade workers that the benefits of union repre-
sentation outweigh its costs They can simply force
them to pay dues or be fired The lack of incentives to
economize leads to higher costs for union members
and inflated salaries for their officers
Unions complain that right to work forces them
to represent free riders Besides its legal inaccu-
racy this claim has the problem backwards26 The
absence of right-to-work laws allows unions to free
ride on captive customers Controlling for other fac-
tors unions charge 10 percent higher dues and pay
their top officers $20000 more annually in nonndashright-to-work states
Right-to-work laws protect workers from a union
monopoly Voluntary dues require unions earn
workersrsquo support
mdashJames Sherk is Senior Policy Analyst in Labor
Economics in the Center for Data Analysis of the
Institute for Economic Freedom and Opportunity at
The Heritage Foundation
26 The Supreme Court has repeatedly ruled that the National Labor Relations Act allows unions to negotiate contracts covering only dues-paying
members As Justice William J Brennan wrote in Retail Clerks v Dry Lion Goods (1962) ldquolsquoMembers onlyrsquo contracts have long been recognizedrdquo
Unions represent non-members only when they act as ldquoexclusive bargaining representativesrdquo which requires non-members to accept the
unionrsquos representation In that case the law requires unions to represent non-members fairly They cannot negotiate high wages for their
supporters and the minimum wage for non-members Unions can avoid representing non-members by disclaiming exclusive representative
status 369 US 17 (1962)
Model specification President Vice President Business Manager Treasurer
Difference in salaries in Forced Dues states 983076983089983090983084983096983090983092 983076983089983097983084983093983092983093 983076983091983088983084983088983093983089 983076983090983091983084983090983092983088
Standard error 983076983094983084983092983093983090 983076983093983084983091983095983094 983076983095983084983096983092983091 983076983094983084983096983093983095
P-value 983088983086983088983092983095 983088983086983088983088983088 983088983086983088983088983088 983088983086983088983088983089
Sample size 983096983084983097983088983092 983094983084983094983091983097 983093983084983088983089983088 983095983084983092983095983090
R-squared 983088983086983093983091983093 983088983086983093983090983091 983088983086983091983095983091 983088983086983092983090983090
TABLE 9
Full-Time Offi cer Salaries Regressed on Forced Dues Requirementsand Control Variables Weighted by Total Union Membership
Note Observations are weighted by total union membership The regression model used to arrive at these estimates used the same specificationand control variables as used in specification 3 in Tables 7 and 8 with all variables specified in linear and not log form These controls includedummy variables for the year individual union average earnings of union members in that state and year and union size
Source Heritage Foundation calculations using data from the US Census Bureau Current Population Survey and union financial disclosurereports filed with the US Department of Labor and reported publicly on unionreportsgov See Appendix for details
BG 2987 heritageorg
892019 Report on Union Dues amp Officer Salaries In Right-To-Work v Non-Right-To-Work States
httpslidepdfcomreaderfullreport-on-union-dues-officer-salaries-in-right-to-work-v-non-right-to-work 1314
13
BACKGROUNDER | NO 2987
JANUARY 26 2015
Appendix
The Heritage Foundationrsquos Center for Data Anal-
ysis (CDA) calculated these figures using data for
2005ndash2013 from the Department of Laborrsquos Office
of Labor-Management Standards (OLMS) yearly
labor-management (LM) data and the Current Pop-
ulation Survey These data are publicly available
online at no cost27
All LM forms require unions to identify how
many members they had that year The subset of
unions that file the LM-2 forms must also break
down their members by category The CDA used a
regular expression match to identify subgroups of
these categories unlikely to pay dues such as mem-
bers in the ldquolaid offrdquo ldquoretiredrdquo and ldquofree duesrdquo cat-egories These members were subtracted from the
larger category of overall membership to arrive at an
estimate of the number of dues-paying members in
union locals filing LM-2 forms The CDA construct-
ed the dues-per-member and dues-per-paying-
member variables by dividing the total amount that
a union reported collecting in dues and agency fees
by the number of members and dues-paying member
variables respectively All the dues and officer sala-
ry figures were converted to 2013 dollars using the
Personal Consumption Expenditures price index
The LMRDA applies to unions that have at leastone private-sector member Consequently the
LMRDA filings used in this analysis exclude the local
chapters of most government unions Some govern-
ment unions do represent private-sector workers
such as teachers unions that have organized private
schools Such unions must file federal disclosure
reports and this analysis includes them
In many unions local chapters directly collect
dues Those locals then remit a per-capita tax to their
state andor international headquarters The state
and national headquarters consequently report far
lower ldquodues per memberrdquo because their incomecomes from levies on their local chapters not direct-
ly collected dues The CDA excluded such unions
from the dues-per-member analysis by examining
only unions that derived at least two-thirds of their
revenues from dues and agency fees
Some unions reported implausibly large or
small annual dues-per-member figures even after
this exclusion For example one union charged an
estimated $1 per member per year while another
charged more than $1000000 per member per
year Such outliers are primarily the result of either
(a) data or reporting errors such as misplaced dec-
imal places and zeros in completed forms or (b)
state or national headquarters with limited direct
dues income but large memberships To prevent
such data errors from biasing the results the CDArestricted attention to unions that charged more
than $50 but less than $10000 in annual dues This
captures over 95 percent of unions while exclud-
ing implausible outliers The results were robust to
using alternative cutoffs
The CDA used a regular expression match on
the job titles reported in the OLMS filings to create
dummy variables identifying the four top positions
in most unions president vice president business
manager and treasurer (sometimes secretary-trea-
surer) The categories are mutually exclusive Some-
one reported as ldquopresident and treasurerrdquo on theforms was classified in this analysis as only a union
president and not as a treasurer
The LMRDA filings do not directly indicate
full-time and part-time or full-year and part-year
employees Taken at face value this can produce
seriously misleading estimates of union compensa-
tion For example in 2011 Carpenters Local 1024
reported paying its president $2130 on its LM-2
forms28 Further analysis of the localrsquos 990 forms
filed with the IRS revealed that the president report-
ed working two hours a week To focus the analysis
on full-time employees the CDA excluded officers who did not make at least $50000 a year These
restrictions considerably reduced the sample size
27 See US Department of Labor Office of Labor-Management Standards ldquoDownload Yearly Datardquo
httpkcerdsdol-esagovquerygetYearlyDatado (accessed January 7 2015) and National Bureau of Economic Research ldquoCPS Merged
Outgoing Rotation Groupsrdquo httpwwwnberorgmorgannual (accessed January 7 2015)
28 United Brotherhood of Carpenters Local 1024 ldquoForm LM-2 Labor Organization Annual Reportrdquo US Department of Labor Office of Labor-
Management Standards 2011 File No 011-457 httpkcerdsdol-esagovquerygetOrgQrydo (accessed January 7 2015) It is unknown
whether the president received additional payments from separate union trust funds because disclosure of these funds is not required
892019 Report on Union Dues amp Officer Salaries In Right-To-Work v Non-Right-To-Work States
httpslidepdfcomreaderfullreport-on-union-dues-officer-salaries-in-right-to-work-v-non-right-to-work 1414
BACKGROUNDER | NO 2987
JANUARY 26 2015
Sensitivity tests found that removing this restric-
tion produced similar results to those presented in
the main paper29 Also excluded were officers who
did not work for the union the year before or the year
after the filing so as to exclude employees who joined
or left the union partway through the year 30
The CDA identified workers as subject to com-
pulsory dues if they (1) lived in a nonndashright-to-
work state or (2) belonged to a union subject to the
Railway Labor Act principally airline and railway
unions It excluded unions located in Indiana or
Michigan after they passed their right-to-work laws
as well as unions located in Washington DC The
right-to-work status of these unions was ambiguous
Indiana and Michigan passed right-to-work laws
which took effect in 2012 and 2013 respectively andapplied only to union contracts renewed after that
time Many unions filing LMRDA reports in those
states still enjoyed compulsory-dues powers in 2013
For example the UAW contracts with the Big Three
automakers requiring compulsory dues run through
2015 Many unions representing workers in both
right-to-work and nonndashright-to-work states have
their national headquarters in Washington
The CDA used a regular expression match on
union names in LM filings to create dummy vari-
ables for the most common unions to which work-
ers belong such as the Machinists the Boilermakersand the Food and Commercial Workers
Data from the Current Population Survey outgo-
ing rotation groups was used to estimate the average
weekly earnings of private-sector unions by state
and year These averages excluded union members
with imputed earnings because the Census Bureau
does not use union membership status as a matching
variable for imputation
The CDA conducted the analysis using OLS
regressions on the log and level of dues per member
and officer salaries The CDA used heteroskedastici-
ty robust errors clustered by union local throughoutOne concern is that clustering does not sufficiently
account for the increase in sample size driven by
the panel dimension of the datamdashrepeated observa-
tions from many of the same unions over time The
CDA ran the analysis in a panel-data format using
Driscoll-Kraay standard errors and found very simi-
lar results31 It also ran the analysis using a panel data
specification and both random effects and between
effects estimators The results from these analyses
were also highly statistically significant and very
similar to the unweighted regressions reported here
Stata does not produce weighted random effects or
between effects estimates
The CDA did not use either state or union local
fixed effects in its analysis because right-to-work
laws varied little within states or union locals dur-
ing this period Including such fixed effects would
absorb all variation in right-to-work status except
that caused by passage of the Indiana and Michigan
right-to-work laws in 2012mdashlaws that had not taken
effect for many union locals by 2013 Additional variables included dummy variables
for year the particular international union repre-
senting workers the log or level of average union
earnings and total union membership Alternative
specifications for the control variables such as high-
er-order polynomials of union membership size had
little effect on the overall results
When weighting union officersrsquo salaries by union
membership the CDA divided by the total number
of such officers in that union local For example if
a union local had three vice presidents the analysis
would give each of those officersrsquo salary one-thirdof the weight of a solitary vice presidentrsquos salary in
a local with the same number of members This was
done so that the final weighted estimates would
reflect the average salaries paid to the top officers
representing the typical union member
The CDA also examined the effect of forced-dues
requirements on total disbursements to union offi-
cers including both gross salaries and reimburse-
ments for official expenses such as work meals and
travel expenses Mandatory dues requirements had
a modestly larger effect on total disbursements than
on gross salaries However detailed examination of whether the additional disbursements beyond sala-
ries resulted from a greater workload or from addi-
tional non-salary compensation is beyond the scope
of this paper These results are available from the
author upon request
29 The proportional difference in salaries was similar and highly statistically significant The absolute magnitude of the salary differences
decreased when the analysis included lower-earning part-time employees
30 For 2013 filings this restriction was relaxed to exclude only employees who did not work for the union the year before
31 Driscoll-Kraay standard errors are robust to both between and within correlation in panel data
892019 Report on Union Dues amp Officer Salaries In Right-To-Work v Non-Right-To-Work States
httpslidepdfcomreaderfullreport-on-union-dues-officer-salaries-in-right-to-work-v-non-right-to-work 1414
BACKGROUNDER | NO 2987
JANUARY 26 2015
Sensitivity tests found that removing this restric-
tion produced similar results to those presented in
the main paper29 Also excluded were officers who
did not work for the union the year before or the year
after the filing so as to exclude employees who joined
or left the union partway through the year 30
The CDA identified workers as subject to com-
pulsory dues if they (1) lived in a nonndashright-to-
work state or (2) belonged to a union subject to the
Railway Labor Act principally airline and railway
unions It excluded unions located in Indiana or
Michigan after they passed their right-to-work laws
as well as unions located in Washington DC The
right-to-work status of these unions was ambiguous
Indiana and Michigan passed right-to-work laws
which took effect in 2012 and 2013 respectively andapplied only to union contracts renewed after that
time Many unions filing LMRDA reports in those
states still enjoyed compulsory-dues powers in 2013
For example the UAW contracts with the Big Three
automakers requiring compulsory dues run through
2015 Many unions representing workers in both
right-to-work and nonndashright-to-work states have
their national headquarters in Washington
The CDA used a regular expression match on
union names in LM filings to create dummy vari-
ables for the most common unions to which work-
ers belong such as the Machinists the Boilermakersand the Food and Commercial Workers
Data from the Current Population Survey outgo-
ing rotation groups was used to estimate the average
weekly earnings of private-sector unions by state
and year These averages excluded union members
with imputed earnings because the Census Bureau
does not use union membership status as a matching
variable for imputation
The CDA conducted the analysis using OLS
regressions on the log and level of dues per member
and officer salaries The CDA used heteroskedastici-
ty robust errors clustered by union local throughoutOne concern is that clustering does not sufficiently
account for the increase in sample size driven by
the panel dimension of the datamdashrepeated observa-
tions from many of the same unions over time The
CDA ran the analysis in a panel-data format using
Driscoll-Kraay standard errors and found very simi-
lar results31 It also ran the analysis using a panel data
specification and both random effects and between
effects estimators The results from these analyses
were also highly statistically significant and very
similar to the unweighted regressions reported here
Stata does not produce weighted random effects or
between effects estimates
The CDA did not use either state or union local
fixed effects in its analysis because right-to-work
laws varied little within states or union locals dur-
ing this period Including such fixed effects would
absorb all variation in right-to-work status except
that caused by passage of the Indiana and Michigan
right-to-work laws in 2012mdashlaws that had not taken
effect for many union locals by 2013 Additional variables included dummy variables
for year the particular international union repre-
senting workers the log or level of average union
earnings and total union membership Alternative
specifications for the control variables such as high-
er-order polynomials of union membership size had
little effect on the overall results
When weighting union officersrsquo salaries by union
membership the CDA divided by the total number
of such officers in that union local For example if
a union local had three vice presidents the analysis
would give each of those officersrsquo salary one-thirdof the weight of a solitary vice presidentrsquos salary in
a local with the same number of members This was
done so that the final weighted estimates would
reflect the average salaries paid to the top officers
representing the typical union member
The CDA also examined the effect of forced-dues
requirements on total disbursements to union offi-
cers including both gross salaries and reimburse-
ments for official expenses such as work meals and
travel expenses Mandatory dues requirements had
a modestly larger effect on total disbursements than
on gross salaries However detailed examination of whether the additional disbursements beyond sala-
ries resulted from a greater workload or from addi-
tional non-salary compensation is beyond the scope
of this paper These results are available from the
author upon request
29 The proportional difference in salaries was similar and highly statistically significant The absolute magnitude of the salary differences
decreased when the analysis included lower-earning part-time employees
30 For 2013 filings this restriction was relaxed to exclude only employees who did not work for the union the year before
31 Driscoll-Kraay standard errors are robust to both between and within correlation in panel data