Wheat, Corn and Milled Rice Situation and Outlook Grain and Feed ...

ISBN 978-83-7658-207-8
Report on the situation
on global high protein
animal feed market
with particular focus
on GMO plant production
Wiesław DzwonkowskiKrzysztof Hryszko
no 22.1Warsaw 2012
Report on the situationon global high protein
animal feed marketwith particular focus
on GMO plant production

Report on the situation
on global high protein
animal feed market
with particular focus
on GMO plant production
Warsaw 2012
Authors:
mgr Wiesław Dzwonkowski
mgr inż. Krzysztof Hryszko

This publication was prepared as a contribution to the research on the following subject Monitoring of agri-food markets under changing economic conditions within the framework of the research task Monitoring and assessment of changes on global agricultural markets The main objective of the study is an analysis of supply and demand on the world market of high-protein feed components in the view of changing conditions, particularly growing importance of GMOs and their impact on the domestic feed market and livestock sector. Reviewer prof. dr hab. Stanis�aw Andrzej Zi�ba Computer development Krzysztof Hryszko Proofreader Barbara Walkiewicz Technical editor Leszek �lipski Translated by Contact Language Services Cover Project AKME Projekty Sp. z o.o. ISBN 978-83-7658-337-2 Instytut Ekonomiki Rolnictwa i Gospodarki �ywno�ciowej – Pa�stwowy Instytut Badawczy 00-950 Warszawa, ul. �wi�tokrzyska 20, skr. poczt. nr 984 tel.: (0�22) 50 54 444 faks: (0 22) 50 54 636 e-mail: [email protected] http://www.ierigz.waw.pl
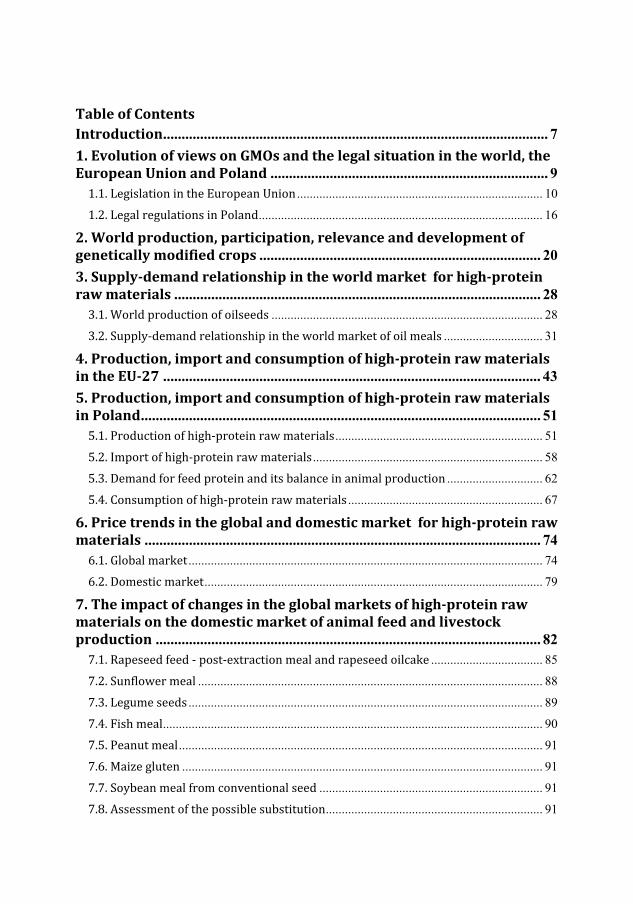
Table�of�Contents�Introduction ........................................................................................................ 7�
1.�Evolution�of�views�on�GMOs�and�the�legal�situation�in�the�world,�the�European�Union�and�Poland ........................................................................... 9�
������������ ������������ �������� � ............................................................................. 10�
����������������� ������ ��� ......................................................................................... 16�
2.�World�production,�participation,�relevance�and�development�of�genetically�modified�crops ............................................................................ 20�
3.�Supply�demand�relationship�in�the�world�market��for�high�protein�raw�materials ................................................................................................... 28�
������ ����� ����� �� �� ���� ..................................................................................... 28�
����������������������� ������������ ������!��� �� ����� ............................... 31�
4.�Production,�import�and�consumption�of�high�protein�raw�materials�in�the�EU�27 ...................................................................................................... 43�
5.�Production,�import�and�consumption�of�high�protein�raw�materials�in�Poland ............................................................................................................ 51�
"������ ����� �� ��������� ������� �������� ................................................................. 51�
"����#�� ��� ��������� ������� �������� ........................................................................ 58�
"����$������� ��������� ������������%����������������� ����� � .............................. 62�
"�&��' ������ �� ��������� ������� �������� ............................................................. 67�
6.�Price�trends�in�the�global�and�domestic�market��for�high�protein�raw�materials ........................................................................................................... 74�
(����) %�����!�� ............................................................................................................... 74�
(����$ ���������!�� .......................................................................................................... 79�
7.�The�impact�of�changes�in�the�global�markets�of�high�protein�raw�materials�on�the�domestic�market�of�animal�feed�and�livestock�production ........................................................................................................ 82�
*����+��������������� ���,������ ������������������ ���!� ................................... 85�
*�������� ������ ............................................................................................................ 88�
*�������������� ............................................................................................................... 89�
*�&��-������ ....................................................................................................................... 90�
*�"������������ .................................................................................................................. 91�
*�(��.��/������� ................................................................................................................. 91�
*�*��� �%���������� ��� �0���� ������ ...................................................................... 91�
*�1��2������ ������� �%���%������ � .................................................................... 91�

6
Summary ........................................................................................................... 94�
References ......................................................................................................... 98�
Annexes ........................................................................................................... 100�
7
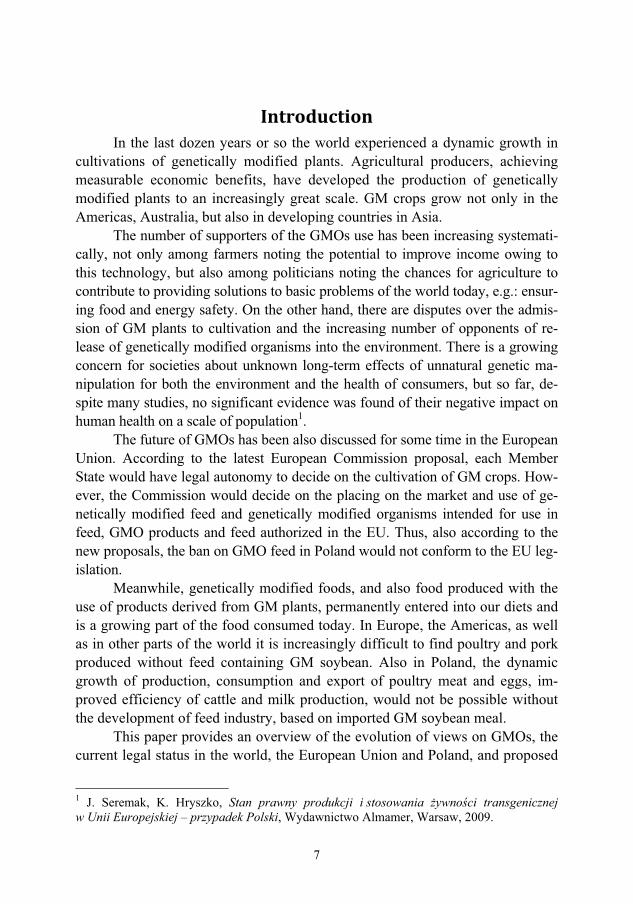
Introduction�In the last dozen years or so the world experienced a dynamic growth in
cultivations of genetically modified plants. Agricultural producers, achieving measurable economic benefits, have developed the production of genetically modified plants to an increasingly great scale. GM crops grow not only in the Americas, Australia, but also in developing countries in Asia.
The number of supporters of the GMOs use has been increasing systemati-cally, not only among farmers noting the potential to improve income owing to this technology, but also among politicians noting the chances for agriculture to contribute to providing solutions to basic problems of the world today, e.g.: ensur-ing food and energy safety. On the other hand, there are disputes over the admis-sion of GM plants to cultivation and the increasing number of opponents of re-lease of genetically modified organisms into the environment. There is a growing concern for societies about unknown long-term effects of unnatural genetic ma-nipulation for both the environment and the health of consumers, but so far, de-spite many studies, no significant evidence was found of their negative impact on human health on a scale of population1.
The future of GMOs has been also discussed for some time in the European Union. According to the latest European Commission proposal, each Member State would have legal autonomy to decide on the cultivation of GM crops. How-ever, the Commission would decide on the placing on the market and use of ge-netically modified feed and genetically modified organisms intended for use in feed, GMO products and feed authorized in the EU. Thus, also according to the new proposals, the ban on GMO feed in Poland would not conform to the EU leg-islation.
Meanwhile, genetically modified foods, and also food produced with the use of products derived from GM plants, permanently entered into our diets and is a growing part of the food consumed today. In Europe, the Americas, as well as in other parts of the world it is increasingly difficult to find poultry and pork produced without feed containing GM soybean. Also in Poland, the dynamic growth of production, consumption and export of poultry meat and eggs, im-proved efficiency of cattle and milk production, would not be possible without the development of feed industry, based on imported GM soybean meal.
This paper provides an overview of the evolution of views on GMOs, the current legal status in the world, the European Union and Poland, and proposed
1 J. Seremak, K. Hryszko, Stan prawny produkcji i stosowania �ywno�ci transgenicznej w Unii Europejskiej – przypadek Polski, Wydawnictwo Almamer, Warsaw, 2009.

8
changes in this area. It also presents an analysis of the development of genetical-ly modified crop production, both in terms of the main species of cultivated plants, as well as their major producers.
An analysis was carried out regarding supply-demand relationship in the global market for high-protein raw materials, focusing mainly on oil meals, es-pecially soybean meal that is dominant in the production and trade in the world and very significant for our market.
An assessment was made of the balance of high-protein raw materials in the EU-27 group and self-sufficiency of the group in the demand for high-protein raw materials used in animal feed. We also analyzed the trends in the cultivation and production of legume seeds, in the context of opportunities to increase their role in meeting protein needs.
We analyzed the production, import and consumption of high-protein raw materials in Poland, in relation to changes in the supply and the demand result-ing from growing livestock and feed production.
We devoted plenty of space and attention to the analysis of trends in high-protein raw material prices in the world and in Poland, and the main factors that affect their formation.
A key element of this study was to determine the impact of changes in the global high-protein raw material market on the Polish market of animal feed and on livestock production. This part of the analysis presents the possibility of substi-tution of genetically modified soybean meal, taking into account both the nutri-tional requirements, the availability of other protein feed and their prices. It also presents the negative consequences of the effects of a possible elimination of modified soybean meal from livestock feed.
Assessment of the analyzed effects uses the available literature on the sub-ject, the statistics of: USDA, FAO, Eurostat, Central Statistical Office, Ministry of Agriculture and Rural Development and other available sources. Assessment of the direction and strength of the impact of each factor on changes in Poland, in the EU and around the world uses the statistical comparative analysis, de-scriptive statistics, statistical analysis of cause-and-effect relationships (regres-sion, correlation). The focus was on the years 1996-2010, and the correctness of the analysis required it, it was extended to a period of 1990-2010. In some cases, due to the limited availability of data, particularly with regard to Poland, the study period was shorter.

9
1.�Evolution�of�views�on�GMOs�and�the�legal�situation�in�the�world,�the�European�Union�and�Poland�
Dynamic growth of genetically modified organisms (GMO) in recent years meant that in addition to supporters of the use of these plants in agriculture and in-dustry there is a rapidly growing group of countries, organizations and people who see a high risk in this production, mainly for the ecosystem and consumer health. In addition to the undeniable benefits, such as the possibility of improving the profita-bility of agricultural production, reducing the negative environmental impact of fertilizers and plant protection products, improving self-sufficiency and energy se-curity, reducing CO2 emissions, and thus counteracting the effects of global warm-ing, there are growing concerns about the unknown long-term effects of genetic changes in plants. Many years of research shows a lack of evidence on the negative impact of consumed products containing GMO, and the basic problem is the coex-istence of conventional and modified crops. It does not seem possible to ensure complete separation of these crops and to ensure that consumers have access to products that does not contain GMO ingredients. Genetically modified food and food produced with the use of raw materials obtained from GMO plants has be-come a permanent element of our diet and forms an increasing part of food con-sumed today. Currently, it is difficult to produce poultry and pig meat, in particular in Europe and other highly-developed countries, without feed containing genetical-ly modified soybean. There is also a rapidly expanding list of highly processed food products produced with GM soy or maize.
In recent years, however, the debate on GMOs is growing in the EU, espe-cially in relation to the cultivation of individual species of plants, and to a lesser extent, to the import and marketing. This results in changes in Community legisla-tion and the possibility of prohibitions of such crops in individual countries. This can cause further tightening of the conflict in the free trade area between the Euro-pean Union and the major producers of GM crops from America and Asia.
Genetically modified plants are very important for the production of high-protein animal feed. In 2010, the cultivation of GM soybean accounted for over 80% of this plant in the world in total and about 50% of all GM crops. It is estimat-ed that about 85% of soybean meal in the international trade is produced from GM plants.
Controversies related to cultivation and use of GM plants made the legal regu-lations focus mainly on assurance of tight control of the whole process of creating new plants and their products, beginning from laboratory works through the possibil-ity of their transition to finished products on shelves with relevant labelling. These issues are primarily governed by national law and local and regional authorities, but
10
there are also acts of an international character. Approach to the issue of GMOs in the legal framework, in particular countries
or groups of countries is different. In general, three basic approaches may be identi-fied: sectoral (vertical), horizontal and mixed2. The sectoral approach is characterized by the fact that GMOs are treated like any other component of a product and are sub-ject to the regulations on the product under the existing legislation on food, plant pro-tection, etc. In practice it means that the use of the same modified organism may be interpreted differently, thus a certain comprehensiveness of control is lacking. Such an approach is preferred e.g. in the USA. On the other hand, horizontal approach recognises GMO as a whole, irrespective of their use, and regulations of this kind are used in the EU legislation and that of respective Member States. However, they do not preclude the existence of sector-specific regulation.
The first international act indirectly relating to GMOs is the Convention on Biological Diversity of 1992 (ratified by Poland in 1995)3. The purpose of the con-vention is “conservation of biological diversity, the sustainable use of its compo-nents and the fair and equitable sharing of the benefits arising out of the utilization of genetic resources, including by appropriate access to genetic resources and by appropriate transfer of relevant technologies, taking into account all rights over those resources and to technologies, and by appropriate funding”. As part of this convention The Protocol on Biosafety of the Cartagena was adopted (ratified by Poland in 2003)4. It establishes rules and procedures for the safe movement (espe-cially cross-border movements of organisms), handling and use of living modified organisms that may have adverse effects on the conservation and sustainable use of biological diversity, taking into account risks to human health.
1.1.�Legislation�in�the�European�Union�Issues related to GMOs are a relatively new field of science and are not direct-
ly relevant to the original EU legislation. All solutions have been developed already on the forum of the Community and approved by the Member States. However, for many years the European Commission has not developed a coherent recommenda-tions on the direction in which the EU and national legislation should follow and what goals it should adopt. The first such document was the Commission Recom-mendation of 23 July 2003 on guidelines for the development of national strategies and best practices to ensure the coexistence of genetically modified crops with con-
2 Erechemla A., Regulacje wspólnotowe dotycz�ce organizmów genetycznie zmo-dyfikowanych, Kwartalnik Prawo i �rodowisko No. 4, Warsaw, 2006. 3 Drawn up in Rio de Janeiro on 5 June 1992 (OJ No 184, item 1532 of 6 November 2002). 4 Cartagena Protocol on Biosafety to the Convention on Diversity, drawn up in Montreal on 29 January 2000 (OJ No 216, item 2201 of 4 October 2004).
11
ventional and organic farming5. In line with this recommendation, above all, no kind of agriculture (traditional, organic and GM crops) should be excluded or discriminat-ed against, and the rules are designed to provide long-term safety and provide con-sumers with full information about the genetically modified products available on the market. These guidelines were liberal in nature and in subsequent years evolved to-wards greater protection of conventional production. This was reflected in the adop-tion of new guidelines on 13 July 20106, which provide for the establishment of GMO-free zones. This aspect was in recent years the main point of contention be-tween the EU and individual Member States which prohibit the cultivation of GMOs in their territory. This resulted in a number of processes before the European Court of Justice and the order to allow GM crops and marketing of GM seeds and products in those countries.
During a dozen or so years, the European Union, through its legislative bod-ies, has developed many directives and regulations. Because of the scope to govern, they can be divided into several main groups:
– legislation on controlled use of genetically modified micro-organisms, – legislation on the deliberate release of GMOs into the environment and
placing on the market, – legislation on the authorization and supervision of genetically modified
food and feed, – and legislation covering the supervision and control of transgenic move-
ment of GMOs. For the first time the controlled use of genetically modified micro-
organisms (GMM) was standardized in 1990 by Council Directive 90/219/EEC of 23 April 1990 on the contained use of genetically modified micro-organisms7. The directive in later years was twice amended (19988 and 20099) and supple-mented by a number of implementing regulations, decisions and guiding notes. It regulates in detail the principles of contained use of genetically modified mi-cro-organisms in order to eliminate any potential threats that they might have on the environment and human health. It also requires Member States to provide full information to other countries about their work, especially on any irregulari- 5 European Commission Recommendation (2003/556/EC), OJ L 189, 29.7.2003. 6 Commission Recommendation (2010/C 200/01) on guidelines for the development of na-tional co-existence measures to avoid the unintended presence of GMOs in conventional and organic crops (OJ C 200/1, 22.07.2010). 7 Official Journal L 117, 8.5.1990, p. 1-14. 8 Council Directive 98/81/EC of 26 October 1998 amending Directive 90/219/EEC on the contained use of genetically modified micro-organisms (OJ L 330, 5.12.1998, p. 13–31). 9 Directive 2009/41/EC of the European Parliament and of the Council of 6 May 2009 on the contained use of genetically modified micro-organisms (OJ L 125, 21.5.2009, p. 75–97).
12
ties and failures. The amendment to the Directive has introduced a division into four groups of activities depending on the degree of risk and clarified the princi-ples of good microbiological practice and principles of occupational health and safety. Amendments put an increased emphasis on the protection of human health and the environment by minimizing the spread of these organisms.
Since 1990 regulations also apply to deliberate release of GMOs into the envi-ronment, mainly in field crops and marketing of GM products, or products contain-ing GMOs. Council Directive No 220 of 23 April 199010 on the deliberate release into the environment of genetically modified organisms focused primarily on provid-ing harmonized and tight monitoring by the Member States of all work, with particu-lar emphasis on the cumulative impact of individual organisms to the environment and human health. Directive established uniform procedures and criteria for each case of release of GMOs into the environment with regard to potential threats. Ob-taining written consent was required for release into the environment, as well as plac-ing GMOs on the market. Each case was examined individually and required a risk assessment. The Directive also contained the so-called safeguard clause, according to which the GM product approved for marketing in one country and thus throughout the European Union, could be banned in another state, if it shows in the studies that its use may be dangerous to humans and the environment. The growing unrest about GMOs and the increasing number of applications to exclude crops and marketing of products in the respective countries, led practically to blocking of permits for re-search and necessitated amendments to the Directive. In March 2001, it was replaced by the Directive 2001/18/EC of the European Parliament and of the Council of 12 March 2001 on the deliberate release into the environment of genetically modified organisms11. The new directive extends mainly prevention in reporting, risk man-agement, labelling, monitoring and informing the public, and imposes a number of obligations on Member States in the implementation of these tasks. Directive 2001/18/EC also adopted the safeguard clause substantially lessening previous provi-sions as to the possibility of limiting the marketing of GM organisms in each coun-try. To take full advantage of it, there is no requirement to provide full proof of nega-tive impacts of GMOs, but only a reasonable assumption based on the most complete risk assessment that can be done in the circumstances of the case. Directives of 1990 and 2001 are horizontal-sectoral in nature and provide for the issuance of separate regulations for specific sectors of the economy. The regulations are included, among others, in Regulation (EC) No 258/97 of the European Parliament and of the Council of 27 January 1997 concerning novel foods and novel food ingredients12, and the 10 Official Journal L 117, 8.5.1990, p. 15-27. 11 Official Journal L 106, 17.4.2001, p. 1-39. 12 Official Journal L 043, 14.2.1997, p. 1-6. Regulation concerns the placing on the market of foods and food ingredients that have not been used for human consumption to a large extent,
13
seed and forestry law. Directive 2001/18/EC and a large part of other regulatory acts were sup-
plemented, amended in part or withdrawn by two regulations:
– Regulation (EC) No 1829/2003 of the European Parliament and of the Council of 22 September 2003 on genetically modified food and feed13;
– Regulation (EC) No 1830/2003 of the European Parliament and of the Council of 22 September 2003 concerning the traceability and labelling of genetically modified organisms and the traceability of food and feed products produced from genetically modified organisms14. The Regulations refer mainly to the provisions on marketing of GM prod-
ucts. They extend and complement the procedures related to control and grant-ing consents to market foodstuffs and feed as GMO or containing GMO. They also introduce a new labelling system.
Regulation 1830/2003 applies to all stages of the placing on the market of products containing or consisting of GMOs and food and feed produced from GMOs. Traceability of products provides a unique identifier given to GMOs15. Identifier is to facilitate the control and verification of records on labels, target-ing of monitoring and identification and withdrawal of products in the event of unforeseen risks.
Regulation 1829/2003 aims to establish the basis for ensuring a high level of protection of human life and health, health and welfare of animals, the envi-ronment and consumer interests in relation to genetically modified food and feed, whilst ensuring the effective functioning of the internal market; establish-ing Community procedures for the authorization and supervision of genetically modified food and feed, and laying down provisions for the labelling of genet-ically modified food and feed.
The final piece of the EU's legal system covering the issue of GMOs is the Regulation (EC) No 1946/2003 of the European Parliament and of the Council of 15 July 2003 on transboundary movements of genetically modified organisms16. The Regulation requires the Member States to establish a common system of noti-
including foods and food ingredients containing or consisting of genetically modified organ-isms within the meaning of Directive 90/220/EEC and the foods and food ingredients pro-duced on the basis of genetically modified organisms, but not containing them. Regulation also allows each state to ban the use of GMOs in their territory. 13 Official Journal L 268, 18.10.2003, p. 1-23. 14 Official Journal L 268, 18.10.2003, p. 24-28. 15 Commission Regulation (EC) No 65/2004 of 14 January 2004 establishing a system for the development and assignment of unique identifiers for genetically modified organisms (OJ L 10, 16.1.2004, p. 5–10) 16 Official Journal L 287, 5.11.2003, p. 1-10.
14
fication and information for transboundary movements of genetically modified organisms and to ensure an adequate level of protection in the field of the safe transfer, handling and use of GMOs. It takes into account that living organisms released into the environment in large or small amounts for experimental purposes or as commercial products, may reproduce in the environment and cross national borders. Thus, the provisions of the Regulation introduce the provisions of the Cartagena Protocol on Biosafety and ensure their consistent implementation by the European Union.
Still unresolved is the issue of co-existence of GM crops with convention-al and organic crops. The European Commission has not developed a binding regulation of co-existence of such crops, but only recommended to individual countries to develop their own national strategies for best practices in this area. In order to provide appropriate guidance to the Member States in implementing the principles of co-existence, the European Coexistence Bureau (ECoB) was established within the structures of the Community. In 2010, the Office present-ed recommendations for growing modified maize, where it analyzed the poten-tial sources of mixing crops and identified a number of commonly agreed best practices in the management of agriculture to ensure coexistence, without preju-dice to both economic and agronomic performance of farms17.
Currently (as of October 2011) on the basis of Directive 2001/18/EC and Regulation 1829/2003 it is allowed in the European Union to grow two species of GM crops: maize MON810 (Lepidoptera insect-resistant and potato variety with altered physico- chemical properties (EH92-527-1). Another variation of maize (T25 with increased resistance to the use of herbicides (glufosinate am-monium) awaits renewal of authorization after a 10-year period of admission to growing. Definitely more varieties of GMO has been authorized for marketing as ingredients in food and feed, or authorized for import and processing. These authorizations include: 23 maize varieties, 7 cotton varieties, the three varieties of rape and soybean, and one of sugar beet and potato18.
Many Member States pursuant to the provisions of Article 23 of Directive 2001/18/EC and Article 12 of the Novel Food Regulation applied to the Europe-an Commission with proposal for temporary ban on the growing of GMO crops and use of a particular food or food ingredient on its own territory. Although the
17 One of the practices proposed by ECoB is the use of spatial isolation of 15 to 50 m, in order to reduce cross-pollination between genetically modified maize and unmodified maize and to reduce the content of GMOs in conventional food and feed to levels below 0.9% (threshold marking). Limitation of the level of mixing crops to even lower levels (e.g. to the value of 0.1% - considered the threshold of quantification) is possible with the application of even greater distance (from 100 to 500 m). 18 Based on http://ec.europa.eu/food/dyna/gm_register/index_en.cfm (of 24.10.2011).
15
Commission has never issued a positive decision on this matter, and often ap-plied to the Court of Justice against individual countries, such prohibitions are maintained. Currently, nine countries of the Community maintain to a different extent prohibitions of primarily field crops of GM plants (often through prohibi-tion of marketing of GM seed material).
Prohibitions and other barriers to trade and marketing of GM products (in the European Union until the end of 2003 there had been a moratorium on the in-troduction of GM products on the market) became the basis of a dispute between the European Union and the United States, Canada and Argentina, which filed a lawsuit against the practices to the WTO. Plaintiffs objected among others to:
– excessively long proceedings relating to the approval and testing of GMOs and food and feed obtained from GMOs in procedures for permit-ting the marketing of GMOs,
– not bringing these procedures to final settlement or the use of "safety clause" with respect to products that have already received formal author-ization for the use in the EU. In March 2006, after three years of the so called Panel, the WTO dispute
settlement body agreed with the plaintiff, and despite the fact that the European Commission has already in 2004 fulfilled the majority of claims adjusting legisla-tion as appropriate, a matter of national bans is still unresolved.
The current debate in the European Union on the future of GMOs is fo-cused primarily on providing Member States with legal autonomy to decide on GMO cultivation on grounds other than those based on risk assessment for health and environmental risks. To this end, the Commission proposes the introduction of a new rule which would apply to all GMOs that would be approved for cultiva-tion in the EU on the basis of Directive 2001/18/EC or under Regulation No 1829/2003. Member States would be able to restrict or prohibit the cultivation of GMOs in their territory or parts thereof without resorting to the safeguard clause. Their decisions will not need the approval of the Commission, but Member States will have to inform other Member States and the Commission about the decision one month before the introduction of the measures. Member States will also have to comply with the general principles of the Treaties and the single market and with the international obligations of the EU. At the same time the validation sys-tem based on an assessment of risks to health and environmental risks will be maintained and will be further developed, thus ensuring consumer protection and the functioning of the internal market for seed of GMOs and non-GMOs, as well as food and feed containing GMOs. The new approach is designed to achieve the right balance between maintaining an EU authorization system and the freedom of Member States to decide on the cultivation of GMOs in their territory.
16
1.2.�Legal�regulations�in�Poland�National regulations on genetically modified plants have their origins in
the early 1980s, when the Act on environmental protection and development introduced fragmentary provision on their control. But only the provisions estab-lished in 1997 required permits for field experiments on GMOs (in practice op-erating since 1999), and the issue of GMOs in Poland was normalized in 2001 by the Ac on genetically modified organisms19. This Act regulates, among oth-ers:
– contained use of GM organisms, – deliberate release of GMOs into the environment, for purposes other than
placing on the market, – marketing of GM products, – export and transit of GM products, – competence of government bodies for the GM.
The Act harmonises the Polish law with part of the European law and is-sues relating to the Cartagena Protocol. In 2003, the act went through an amendment, which included the provision which obliges the Minister of the En-vironment to draft the National Strategy for Biosafety and the resulting action programme. The draft was created in 2005 at the Plant Breeding and Acclimati-zation Institute. The strategy discusses in detail the GMO procedures in the light of national and international law and presents the main objectives and tasks aris-ing from this strategy20.
The Law on Genetically Modified Organisms of 2001 is accompanied by secondary legislation, based on the relevant EU directives:
– Ordinance of the Minister of the Environment of 21 February 2002 on the detailed functioning of the Commission for genetically modified organ-isms (Dz.U. of 2002, No. 19, item 196);
– Ordinance of the Minister of the Environment of 6 June 2002 on the mod-
19 Act of 22 June 2001 on genetically modified organisms (consolidated text, Dz.U. 2007 No. 36, item 233). 20 The aim of the strategy was to identify and monitor the range of activities related to the use of genetically modified organisms that may have an impact on maintaining bio-security, i.e. the removal or reduction of current and potential risks of the use of GMOs and the integration of actions for the implementation and maintenance of biological safety. This was to be achieved by a review and assessment of the law on GMOs in Poland. The creation of the con-trol system (including the role of regulatory bodies), sealing and securing the borders against uncontrolled movement of GMOs, the development of IT system for the activities related to GMOs and the inclusion of Poland in the International Information Exchange System, and education of the population on biosafety.
17
el applications for approvals and permits for activities in the field of ge-netically modified organisms (Dz.U. of 2002, No. 87, item 797);
– Ordinance of the Minister of the Environment of 8 July 2002 laying down the detailed method of conducting the risk assessment for human health and the environment in relation to taking action involving the contained use of GMOs, the deliberate release of GMOs into the environment, in-cluding the marketing of GMO products, and the requirements to be met by documentation containing the results of this assessment (Dz.U. of 2002, No. 107, item 944);
– Ordinance of the Minister of the Environment of 29 November 2002 on the list of pathogenic organisms and their classification, and the measures required for individual levels of containment (Dz.U. of 2002, No. 212, item 1798);
– Ordinance of the Minister of Finance of 15 April 2004 on the customs of-fices competent for import or export of GMO products (Dz.U. of 2004, No. 82, item 750). Under the Act on genetically modified organisms, each of the entities
wishing to take any action with GMOs is obliged to submit an application to the Minister of the Environment, together with a full assessment of the risks that may arise from the use of GMOs. Applications are reviewed in terms of content and formal-legal aspects by the GM team, and then verified by the Commission on GMOs. Decisions on the contained use of GMOs and the intended release of GMOs are issued at the national level, and the procedure for the marketing of GMO products is uniform in all Member States and approved by a vote in the European Commission (qualified majority). Product allowed to be marketed pursuant to application of a given state is simultaneously allowed to be marketed within the whole EU. Decisions are issued for a period not exceeding 10 years.
The bio-security system in Poland and the regulations on GM food also use provisions of sectoral laws. They include:
– Act of 25 August 2006 on food safety and nutrition (Dz.U. of 2006, No. 171, item 1225), as amended21;
– Act of 22 July 2006 on feed (Dz.U. of 2006, No. 144, item 1045), as amended22;
– Act of 27 April 2001 the Environmental Law (Dz.U. of 2008, No. 25, 21 Act of 8 January 2010 amending the Act on food safety and nutrition, and certain other acts (Dz.U. of 2010, No. 21, item 105). 22 The amendment of 26 June 2008 (Dz.U. of 2008, No. 144, item 899) introducing a morato-rium GMO feed ban until the end of 2012 and the Act of 22 October 2010 amending the Act on feed and the Act on food safety and nutrition (Dz.U. 2010, No. 230, item 1511).

18
item 150); – Seed Act of 26 June 2003 (Dz.U. of 2007, No. 41 item 271), as amend-
ed23; – Laws governing actions of individual inspections responsible for compli-
ance with the laws on GMOs. Sectoral laws are, however, essential for the functioning of GMOs in Po-
land. Since 2006, Poland is one of the biggest opponents of genetically modified crops24 and by legislation seeks to prohibit the marketing and cultivation of these plants and products made therefrom. In 2006, two laws were amended: on feed and on seed, introducing the provisions for reaching those goals. The first Act in-troduced a ban on the production, marketing and use in animal nutrition and of genetically modified feed and genetically modified organisms for feed use. Alt-hough long-term industry lobbying efforts of industry organization of local gov-ernments led to the introduction of a moratorium on GM feed ban until the end of 2012, the ban is still in force. In turn, the Seed Act introduces a ban on the regis-tration of crops and marketing of seed of varieties of genetically modified plants. In practice, however, farmers obtain GM seed from abroad and release them into the environment without control.
Provisions of the Act on feed were the basis for suing Poland by the Euro-pean Commission to the Court of Justice because they were incompatible with the Regulation 1829/2003. The Directive requires compliance with common authori-zation procedure in the field of production, marketing and use of genetically mod-ified feed, based on an independent risk assessment carried out by the European Food Safety Authority (EFSA). Member States may not be independent from the provisions of Regulation and prohibit the placing on the market of GM feed. EU Court of Justice in Luxembourg rejected the Commission's action, not on the mer-its, but on formal grounds (Commission failed to meet the required deadlines) and in March 2011 the Commission applied again for investigating the matter25.
23 The Act of 27 April 2006 amending the Act on seeds and Act on plant protection (Dz.U. of 2006, No. 92, item 639) which bans entry into the national register of GMO varieties. 24 The document adopted by the Council of Ministers on 18 November 2008 on the frame-work position of the Polish government on the issue of genetically modified organisms (GMOs) supported only carrying out the work on contained use of GMOs in accordance with the conditions laid down by law. In other matters, i.e. the release of GM organisms for exper-imental purposes, marketing and cultivation of GMOs, the Polish Government seeks that Po-land is granted the status of "GMO-free country", but claims compliance with EU law in this area. 25 In addition, the European Commission brought a case against Poland to the Court of Justice of the European Union because of an incorrect implementation of Directive 2009/41/EC con-cerning activities related to genetically modified micro-organisms. The Commission claims

19
However, the Court of Justice confirmed the non-compliance of the provi-sions of the Seed Act with the Directive No 2001/18/EC of the European Par-liament and of the Council. In its judgment of 19 July 2009, it ordered the change in the law and threatened multi-million fines26. In 2011, work was com-pleted on the amendment of the Act. Lawmakers, with the assumption of the continuation of efforts to eliminate the possibility of GM crops in Poland, while ensuring compliance with EU directives in this area, have proposed a ban on buying and selling GMO seeds, but consented to the entry of seeds in the Na-tional Register. In this form, the law was adopted in July 2011 by the Sejm and the Senate, however, the President vetoed on this issue still arguing its non-compliance in the part concerning GMOs with the EU legislation.
For several years, there has been ongoing work on the draft of a new law regulating the issues related to GMOs. Since the adoption of the previous Act in 2001, there have been significant changes in this area, mainly in EU legislation. The bill aims to ensure full alignment with the requirements of Directive 2001/18/EC and Regulations of 2003 (1829, 1830 and 1946), and the arrange-ment of the national legal system. Number of regulations and institutions re-sponsible for the control of the application of the law, in the absence of precise, clear division of responsibilities and the lack of sanctions for non-compliance with regulations causes that, in practice, there is uncontrolled use of GMOs. The draft act "Act on Genetically Modified Organisms" developed in the Ministry of Environment was presented to the Sejm in November 2009 and since then is considered by parliamentary committees (Committee on Agriculture and Rural Development and the Committee on the Environment, Natural Resources and Forestry). In 2010, member of the Sejm have proposed two major changes in the project, i.e. to ban cultivation of genetically modified organisms and the prohibi-tion of the marketing of genetically modified organisms. At the moment, these provisions are incompatible with EU rules, and the work on the bill has been put on hold.
that Poland did not fulfil the requirements of the Directive to take all appropriate measures to limit possible risks to human health and the environment that may result from such activities. 26 Failure to comply with judgments of the Court of Justice or the lack of the implications of EU legislation in national law is associated with severe financial penalties. In the case of Po-land such penalty for the first failure to comply with the Court's recommendations could range from EUR 1.4 to 28.9 thousand per day, while another evasion of the decision will cost around EUR 4.3-260.0 thousand per day. In 2007, the penalty was imposed, among others, on France for not implementing the directive on the release of GMOs. The Court of Justice de-cided on the amount of penalty for each day of delay, which brought the amount due of over EUR 42 million.
20
2.�World�production,�participation,�relevance�and�de�velopment�of�genetically�modified�crops�
Genetically modified organisms are organism in which the genetic material has been altered in a way that does not occur naturally through crossbreed or natural recombination by introducing with a variety of methods any gene from another or-ganism into the genome of the modified organism. Gene modification is meant to give plants characteristics desired by man, i.e. increased tolerance for herbicides, in-sects and diseases, resistance to adverse environmental conditions or improvement of qualitative characteristics (taste, smell, shape). Ornamental plants are also subject to modifications. They become more durable and have more intensive colour. In plants which had been allowed to grow in the world in 2010, majority of transformations relate to immunization to herbicides (61% of the crop), followed by varieties re-sistant to insects (17%) and two or three phase modifications (22%).
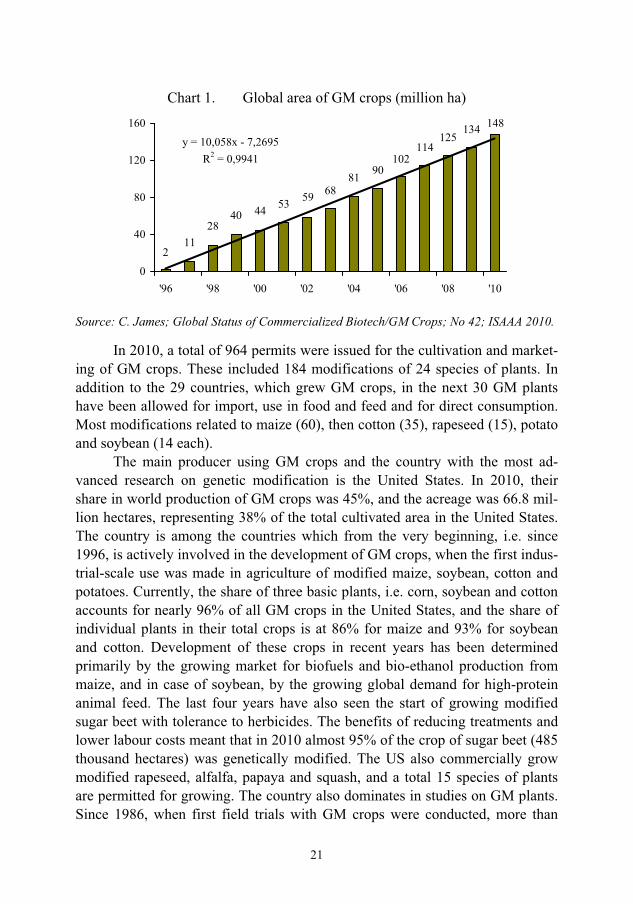
In 2010, genetically modified crops grew in the area of 148 million hectares, maintaining uninterrupted growth since 1996. Compared with the previous year the world's crop area increased by 10.4%, and the benefits arising from the use of GM crops caused that the list of countries in which they are allowed to use in agricultural production increased to 29 (for the first time GM crops were grown in Pakistan, My-anmar and Sweden). The increase in crops relates mainly to developing countries, where, due to lower costs and improved competitiveness, agriculture is likely to grow faster in areas inhabited by relatively poor people. The share of these countries in the total GM crop area in 2010 was 48%, compared to 38% in 2005 and 14% in 1997 Despite the continuing growth of crops in developed countries (5% in 2010), they are clearly losing ground to countries such as: Brazil, Argentina, China, India and South Africa. Area under cultivation of GM crops in 2010 was more than 10% of the world's arable land.
The average annual growth rate of GM crops in 1996-2010 was over 37%, i.e. about 10 million hectares per year. It is therefore difficult to find another area of ag-riculture growing so rapidly in recent years. In total, over the course of 15 years, the area of agricultural land for the cultivation of GMOs was close to 1.1 billion hec-tares, and the number of farmers who have benefited from the possibility of using GM crops in 1996 exceeded 100 million. In 2010, GM crops involved 15.4 million farmers, of which over 90% were small farms, which due to the new technology could often not only meet the basic needs of food, but spent part of the crop for sale, clearly improving its financial situation.
21
Chart 1. Global area of GM crops (million ha) 148134
125114
1029081
685953444028
112
y = 10,058x - 7,2695R2 = 0,9941
0
40
80
120
160
'96 '98 '00 '02 '04 '06 '08 '10
Source: C. James; Global Status of Commercialized Biotech/GM Crops; No 42; ISAAA 2010.
In 2010, a total of 964 permits were issued for the cultivation and market-ing of GM crops. These included 184 modifications of 24 species of plants. In addition to the 29 countries, which grew GM crops, in the next 30 GM plants have been allowed for import, use in food and feed and for direct consumption. Most modifications related to maize (60), then cotton (35), rapeseed (15), potato and soybean (14 each).
The main producer using GM crops and the country with the most ad-vanced research on genetic modification is the United States. In 2010, their share in world production of GM crops was 45%, and the acreage was 66.8 mil-lion hectares, representing 38% of the total cultivated area in the United States. The country is among the countries which from the very beginning, i.e. since 1996, is actively involved in the development of GM crops, when the first indus-trial-scale use was made in agriculture of modified maize, soybean, cotton and potatoes. Currently, the share of three basic plants, i.e. corn, soybean and cotton accounts for nearly 96% of all GM crops in the United States, and the share of individual plants in their total crops is at 86% for maize and 93% for soybean and cotton. Development of these crops in recent years has been determined primarily by the growing market for biofuels and bio-ethanol production from maize, and in case of soybean, by the growing global demand for high-protein animal feed. The last four years have also seen the start of growing modified sugar beet with tolerance to herbicides. The benefits of reducing treatments and lower labour costs meant that in 2010 almost 95% of the crop of sugar beet (485 thousand hectares) was genetically modified. The US also commercially grow modified rapeseed, alfalfa, papaya and squash, and a total 15 species of plants are permitted for growing. The country also dominates in studies on GM plants. Since 1986, when first field trials with GM crops were conducted, more than

22
16,000 permits has been issued for the controlled release into the environment, which covered approximately 200 species of plants27. The most studied plants in this period were: maize (45% of trials), soybean (12%), cotton (6%), potatoes (5%), tomatoes (4%), and wheat, alfalfa, tobacco and rapeseed. Genetic changes in plants involved primarily introduction of herbicide tolerance (40% of trials), resistance to insects (30%) and improving agrotechnics (27%).
Table 1. Leading producers of genetically modified crops (million ha) Country 2000 2005 2010 GM plants
Total 44.2 90.0 148.0 - including:
USA 30.3 49.8 66.8Soybean, maize, cotton, canola, papa-ya, squash, alfalfa, sugar beets
Brazil - 9.4 25.4 Soybean, maize, cotton Argentina 10.0 17.1 22.9 Soybean, maize, cotton India - 1.3 9.4 Cotton Canada 3.0 5.8 8.8 Rapeseed, maize, soybean, sugar beets
China 0.5 3.3 3.5Cotton, tomatoes, poplar, papaya, sweet peppers
Paraguay - 1.8 2.6 Soybean Pakistan - - 2.4 Cotton South Africa 0.2 0.5 2.2 Maize, soybean, cotton Uruguay <0.1 0.3 1.1 Soybean, maize Bolivia 0.9 Soybean Australia 0.2 0.3 0.7 Cotton, rapeseed Philippines - 0.1 0.5 Maize
Source: C. James; Global Status of Commercialized Biotech/GM Crops; No. 23-42; ISAAA;2001-2010.
Brazil, with an area of GM crops in 2010 exceeding 25 million hectares, is one of the countries with the fastest growing crop production using new technolo-gies. In comparison with the previous year acreage of these crops increased by 4 million hectares, i.e. by nearly 19% and accounted for 43% of the total arable land in the country. Three plants are allowed for growing - soybean, maize and cotton, of which the individual species account for respectively 70, 29 and 1% of the crop. Estimated economic benefits arising from the use of GM crops grown in the season 2009/2010 were approximately USD 2.7 billion, and since the beginning of their use, i.e. the season 1996/1997 nearly USD 5.9 billion28. In the case of soybean, the increase in income is primarily due to lower production costs, and 27 Study based on data from Information Systems for Biotechnology (http://www.isb.vt.edu). 28 The Commercial Benefits from Crop Biotechnology in Brazil: 1996/97 - 2009/10, Céleres, 2011.
23
for maize and cotton also due to increased yield. It is predicted that by the end of the decade the total increase in income from the use of GM crops in Brazil could amount to more than USD 80 million. Given the current state of research, cultiva-tion of maize will develop primarily, which will generate up to 60% of the addi-tional revenue (currently share of 32%), while decreasing the role of soybean (down from 65 to 35%). In terms socio-environmental terms, most benefits are generated by cultivation of GM soybean, which in total accounts for about 86% of reduction in water consumption, CO2 emissions and emissions of plant protection active compounds29. In subsequent years, Brazil will strengthen its position among the countries using GM crops, probably by introducing modified sugar cane and rice (the largest cane producer in the world and tenth producer of rice).
An important producer using GM crops is Argentina. In 2010, the acreage of soya, maize and cotton increased in the country by 8% to 22.9 million hectares, and its share in the total crop is nearly 70%. Argentina grows primarily soybean (85%), which in the period of 14 years, i.e. since the beginning of the cultivation of GM crops, virtually replaced conventional crops. The same happens in the case of maize (3.0 million hectares), where the share is 98%. In the case of Argentine farmers, the low cost of the seeds for many years had a significant impact on in-creasing the profitability of GM crops. Lack of patent protection for seed produc-ers meant that in a large part they used seed material from their own crops.
European Union countries, despite the numerous and advanced research and field trials of GM crops, do not grow commodity crops to a larger scale. Nu-merous obstacles (mainly social) and long approval process for individual varia-tions and modifications for cultivation makes the acreage of GM crop plants rang-ing in recent years at around 80-110 thousand ha. According to estimates, GM crops in 2010 occupied 91.4 thousand ha, of which 99.7% was allocated for crops of maize, and the rest, i.e. 245 ha were admitted for the first time to grow modi-fied potatoes. Allowing farmers to grow potatoes, which have a modified starch composition for the manufacture of high quality paper, glue and use in the textile industry increased the number of Commonwealth countries where GMOs are grown to eight. Spain, Portugal, Poland, Slovakia and Romania continued grow-ing maize, Germany and Sweden in 2010 for the first time grew potatoes, the Czech Republic grew both plants. The leader in GM crops in the European Union with 84% share is Spain. At the same time the share of GM maize crops in the country's total crop of this plant in 2010 was 24%. In all countries, there was an increase of economic benefits arising from the use of new technologies in maize growing. The crops use primarily maize variety resistant to Lepidoptera pests
29 The Social-Environmental Benefits from Crop Biotechnology in Brazil:1996/97 - 2009/10, Céleres, 2011.
24
(European corn borer)30 and thus achieved higher yielding (from a few to a dozen or so percent). Currently, there are 24 modifications of 6 species of GM plants (maize, cotton, potato, rapeseed, soybean and sugar beet) at the various stages of approval process for cultivation in the European Union31.
Polish experience in research and cultivation of GM plants are relatively small. Since 1999, the Ministry of Environment32 received a total of 55 applica-tions for the deliberate release of GMOs into the environment, with a positive opinion for 45 of them33. Currently, field research is conducted for 6 species of plants: poplar, flax, sugar beet, maize, potato and cucumber. In the earlier years, the studies were also conducted on the modified plum trees and the spring and winter rapeseed. Commercial cultivation of modified maize resistant to European corn borer in Poland started in 2007 and covered 327 ha. In the following year, crop acreage increased more than 9-fold to 3 thousand ha and this figure is proba-bly maintained at present. There are no clear rules for the registration of crops, and farmers buy seed outside the country.
According to estimates34 benefits from GM crops globally in 2009, were nearly USD 10.8 billion, which increased farmers' incomes on average by 5.8%. The largest increase in income from lower costs of protection products, lower la-bour costs and increase in crop yields were obtained in the cultivation of modified cotton (+13.3%), with a relatively small benefits from the use of modified soy-bean (+2.7%). In 1996-2009, the total increase in revenues from GM crops was about USD 65 billion, of which approximately 40% for soybean. In recent years, however, its share is decreasing in favour of cotton and maize varieties which more often joint resistance for two types of risks and generate more income growth. In 2009, the share of soybean in the increase of revenue was 19%, maize was 40%, and cotton was 37%. Per hectare of crop, the average income growth from cultivation of GM soybean in 2009 was less than USD 30, while in the case of maize it was more than 3-fold higher, and for cotton more than 8-fold higher.
30 The modification involves the introduction into plants of genes from the bacteria Bacillus thuringiensis (Bt), which produces a protein toxic to insects after eating. 31 Based on www.gmo-compass.org. 32 In addition to permits for research, the Ministry of the Environment also issues permits for the marketing of GM products. Issued permits almost entirely concern the possibility of intro-ducing on the market of seeds, meal, post-extraction oilcakes and concentrates containing modified soybean and in one case, modified maize. Currently (November 2011) 38 GM prod-ucts are approved on the market. 33 In the case of studies involving the contained use of GMOs (both plants and animals), more than 630 applications were submitted for the period 1999-2011. 34 G. Brookes, P. Barfoot, GM Crops: Global Socio-Economic and Environmental Impacts 1996-2009, PG Economics Ltd, United Kingdom, 2011, p. 9.

25
Chart 2. Incomes of agricultural producers from GM crops in 1996-2009 (USD bn)
by country by plant species
Source: Own work based on G. Brookes and P. Barfoot: GM Crops: Global Socio--Economic and Environmental Impacts 1996-2009, PG Economics Ltd, UK 2011.
In addition to the benefits of GM crops, there are also a lot of potential risks associated with the use of new technologies, especially in a relatively short period of their operation and lack of long-term research in the field of health and environmental safety. At the level of the agricultural producer there is a risk of the emergence of the so-called super weeds resistant to herbicides, which may result not in reduction but in increase in the consumption of plant protection products. Farms must also incur higher costs to prevent the contamination of conventional and GMO seeds during storage, marketing and processing of con-ventional and GMO seeds, while cultivation of GMO crops alone can lead to local conflicts. In addition, with the growing opposition to GMOs, there may be a decrease in purchase prices of GM plants and difficulties in selling them. At the consumer level, there is a possibility of new allergens and toxins, taste dete-rioration and worsening of GM foods nutritional values. Development of bio-technology and GM crops for energy purposes is increasingly affecting the bur-den of ecosystems and intensifies water shortages in many areas. GM crop pro-duction also poses major challenges for the budget. An effective system for monitoring compliance with the law in respect of crops, and in particular their co-existence with conventional production and marketing of GM products en-tails high costs. In the long term, one must also run the risk of having to coun-teract the negative effects of uncontrolled spreading in the nature of genes com-binations, not existing in nature, which we are not currently able to predict.
Dynamic development of GM crops over a dozen or so years has caused that many branches of agri-food economy are largely dependent on the use of

26
GM products (mainly feed industry and the production of poultry and pork). At the same time, together with the prohibition of the use of animal meal in animal nutrition and, consequently, limited access to this type of protein, there was an increase in global demand for high-protein animal feed of plant origin, especial-ly for soybean and rapeseed meal.
In 2010, GM soybean was cultivated on the area of 73.3 million hectares, which accounted for nearly half of the total crops of all modified plants. In com-parison with the previous year the area has increased by 9%, mainly due to more than 10% growth in Brazil. The largest producer of GM soybean in the world are still the United States (30.0 million ha), which are ahead of Argentina (19.5 million ha) and Brazil (17.8 million ha). In total, modified soybean was grown in 2010 in 11 countries, mainly in America (exceptions were crops in South Af-rica). Until 2007, GM soybean was grown in Romania (more than 150 thousand ha), but with the country's accession to the European Union, and the lack of no-tification of varieties to be grown in the Community, it ceased its production. The most common variety of soybean approved for cultivation in the world is soybean GTS 40-3-2, which shows characteristics of resistance to Roundup Ready herbicide containing glyphosate. 12 out of 14 GM varieties of soybean approved for any use were allowed to grow. Modifications include, in addition to resistance to herbicides, resistance to insects, altered physico-chemical char-acteristics (higher fatty acids) and hybrids of particular modifications. Dynami-cally growing acreage meant that in the case of soybean more than 80% of the global crop is made using modified seeds. At the same time, it is estimated that about 95% of world trade in grain and 85% of trade in soybean meal are the GMO products. The share of GM soybean in total soybean crops, in each coun-try is quite varied and ranges from 75% in Brazil and 93% in USA and 99% in Argentina.
Studies on the economic and social effects of growing GM soybean show a relatively small impact on the profitability of farming35. In most countries, there was no increase in crop yields and lower production costs, resulting from re-striction of the use of herbicides, were offset by higher prices of GM seeds. The increase in yield occurred only in Romania and Argentina. The relatively small difference in purchase prices of GM seeds and conventional seeds in Brazil means that growers in this country obtain relatively the largest increase in gross margin. Increased farm income is mainly due to limiting activities associated with weed control, crop management simplification, ease of non-crop activities and, conse-quently, the time savings due to increased off-farm income of farmers.
35 Assessment of the Economic Performance of GM Crops Worldwide, Ecologic Institute, Ber-lin, 29 March 2011.
27
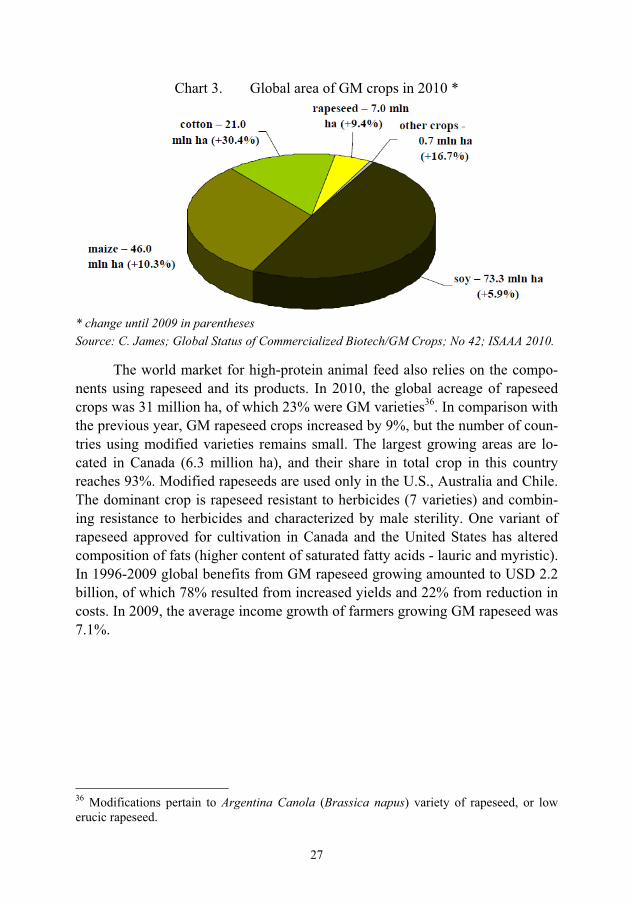
Chart 3. Global area of GM crops in 2010 *
* change until 2009 in parentheses Source: C. James; Global Status of Commercialized Biotech/GM Crops; No 42; ISAAA 2010.
The world market for high-protein animal feed also relies on the compo-nents using rapeseed and its products. In 2010, the global acreage of rapeseed crops was 31 million ha, of which 23% were GM varieties36. In comparison with the previous year, GM rapeseed crops increased by 9%, but the number of coun-tries using modified varieties remains small. The largest growing areas are lo-cated in Canada (6.3 million ha), and their share in total crop in this country reaches 93%. Modified rapeseeds are used only in the U.S., Australia and Chile. The dominant crop is rapeseed resistant to herbicides (7 varieties) and combin-ing resistance to herbicides and characterized by male sterility. One variant of rapeseed approved for cultivation in Canada and the United States has altered composition of fats (higher content of saturated fatty acids - lauric and myristic). In 1996-2009 global benefits from GM rapeseed growing amounted to USD 2.2 billion, of which 78% resulted from increased yields and 22% from reduction in costs. In 2009, the average income growth of farmers growing GM rapeseed was 7.1%.
36 Modifications pertain to Argentina Canola (Brassica napus) variety of rapeseed, or low erucic rapeseed.
28
3.�Supply�demand�relationship�in�the�world�market��for�high�protein�raw�materials�
3.1.�World�production�of�oilseeds�The most important oilseed plants include: soybean, rapeseed, cotton, sun-
flower, peanuts and oil and coconut palm. The greatest share in the world pro-duction of oilseeds is soybean (57% on average between 2005/06-2010/11). Rapeseed and sunflower, which from the point of view of the Polish market is important is respectively ca. 14% and 7%.
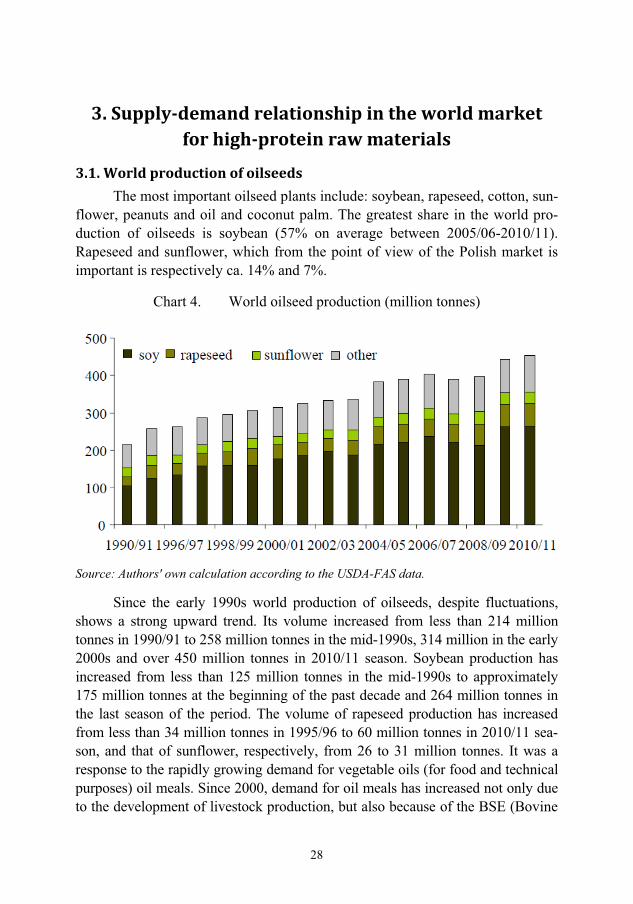
Chart 4. World oilseed production (million tonnes)
Source: Authors' own calculation according to the USDA-FAS data.
Since the early 1990s world production of oilseeds, despite fluctuations, shows a strong upward trend. Its volume increased from less than 214 million tonnes in 1990/91 to 258 million tonnes in the mid-1990s, 314 million in the early 2000s and over 450 million tonnes in 2010/11 season. Soybean production has increased from less than 125 million tonnes in the mid-1990s to approximately 175 million tonnes at the beginning of the past decade and 264 million tonnes in the last season of the period. The volume of rapeseed production has increased from less than 34 million tonnes in 1995/96 to 60 million tonnes in 2010/11 sea-son, and that of sunflower, respectively, from 26 to 31 million tonnes. It was a response to the rapidly growing demand for vegetable oils (for food and technical purposes) oil meals. Since 2000, demand for oil meals has increased not only due to the development of livestock production, but also because of the BSE (Bovine
29
Spongiform Encephalopathy) crisis and the ban in some countries on the use of meat and bone meal fed to livestock.
The average annual growth rate of oilseeds production in 1995/96-2010/11 was 3.8%. In the case of soybean, it was much higher, and amounted to 5.1%. Over the last fifteen years, the production of all oilseeds increased by ca. 76%, including soybean by 112%. The increase in world production of rapeseed was 75% and of sunflower 21%. The average annual growth rate of production of these crops was respectively 3.8% and 1.3%. With such a large and growing share of soybean in the production of oilseeds, the world market for oilseeds is increas-ingly dependent on soybean and its processed products.
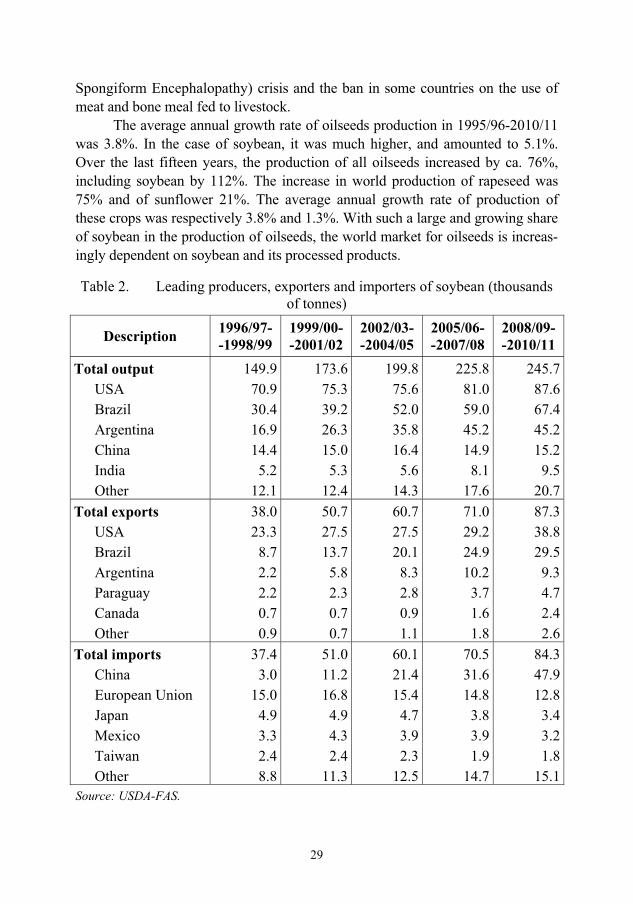
Table 2. Leading producers, exporters and importers of soybean (thousands of tonnes)
Description 1996/97--1998/99
1999/00--2001/02
2002/03--2004/05
2005/06--2007/08
2008/09--2010/11
Total output 149.9 173.6 199.8 225.8 245.7USA 70.9 75.3 75.6 81.0 87.6Brazil 30.4 39.2 52.0 59.0 67.4Argentina 16.9 26.3 35.8 45.2 45.2China 14.4 15.0 16.4 14.9 15.2India 5.2 5.3 5.6 8.1 9.5Other 12.1 12.4 14.3 17.6 20.7
Total exports 38.0 50.7 60.7 71.0 87.3USA 23.3 27.5 27.5 29.2 38.8Brazil 8.7 13.7 20.1 24.9 29.5Argentina 2.2 5.8 8.3 10.2 9.3Paraguay 2.2 2.3 2.8 3.7 4.7Canada 0.7 0.7 0.9 1.6 2.4Other 0.9 0.7 1.1 1.8 2.6
Total imports 37.4 51.0 60.1 70.5 84.3China 3.0 11.2 21.4 31.6 47.9European Union 15.0 16.8 15.4 14.8 12.8Japan 4.9 4.9 4.7 3.8 3.4Mexico 3.3 4.3 3.9 3.9 3.2Taiwan 2.4 2.4 2.3 1.9 1.8Other 8.8 11.3 12.5 14.7 15.1
Source: USDA-FAS.

30
Cultivation of oilseed plants have a high concentration, especially in the case of soybean, rapeseed and coconut and oil palms. More than 80% of global soybean production is in the United States, Brazil and Argentina. The world's soybean exports is dominated in an even greater extent than the production by the three major players who provide nearly 90% of the seeds of this plant to the world market. In addition to these three countries, Paraguay and Canada have a surplus supply, the former has been rapidly expanding production of soybean in recent years.
The relatively large producers of soybean are China and India. At the same time China dominated imports of soybean, which in the past two seasons was over 50 million tonnes per year. One of the many rapidly growing industries in this country is the oil industry, and the limited growth potential of oilseeds production will increase rapidly the demand for their imports, particularly soy-bean. A major importer of soybean is also the European Union, which, above all, increases the production and processing of rapeseed.
The EU is the largest producer of rapeseed in the world; the harvest in the region has increased over the last several years more than 2-fold and in the last three years the average level exceeded 20 million tonnes. Production of rapeseed in Canada had a similar growth rate in this period; it has increased from 6.4 mil-lion tonnes to 12.8 million.
In recent years, rapeseed production is growing in China and India, but its growth rate was much lower than in the EU or Canada. Over the last fifteen years, rapeseed production in China increased by 34% to more than 13 million tonnes, with an average annual growth rate of 2%. In India, this was an increase of 17% to 7 million tonnes, with an average annual rate slightly above 1%. Po-land, with the production of 2.0-2.5 million tonnes of rapeseed, is in the world's top producers of this plant.
In recent years, an important player, especially from the point of view of Poland, is Ukraine, where rapeseed production exceeds on average 2.1 million tonnes per year, while exports amounted to about 1.9 million tonnes. This is par-ticularly important from the point of view of supplying the EU market, as the EU-27, despite increasing its own production of rapeseed, becomes more and more the importer.
There are four major producers of sunflower in the world: EU, Argentina and Russia, and Ukraine. In the EU and Argentina, in the last fifteen years, the production of sunflower decreased by 15-20%, respectively to 5.7 million tonnes and 3.9 million tonnes, while in Russia and Ukraine increased by 35-45% to 6.3 million tonnes and 4.7 million tonnes. Global sunflower seed sales amount to ca. 1.5 million tonnes. Its major exporters are the EU and Ukraine, and major im-porters are Turkey and the EU.
31
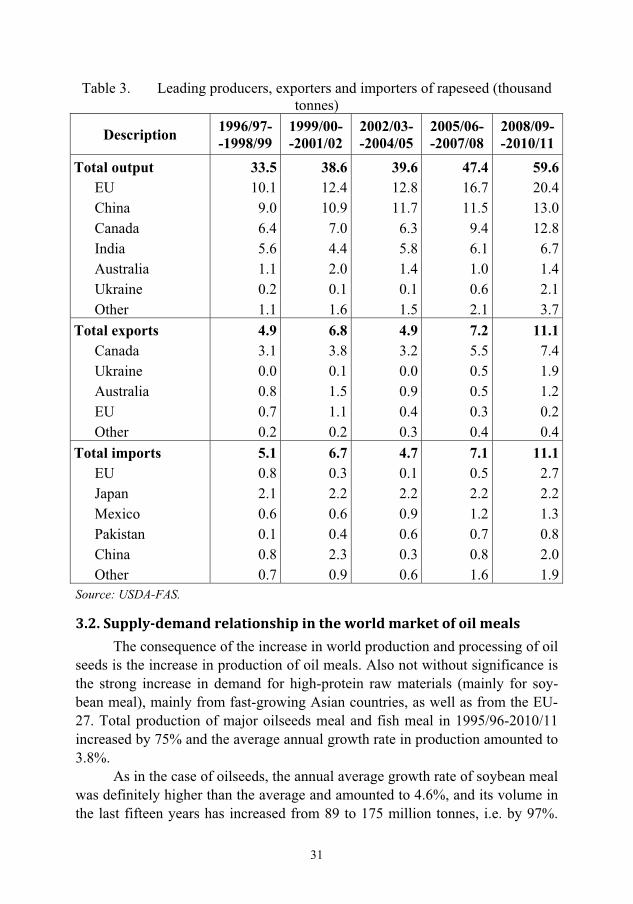
Table 3. Leading producers, exporters and importers of rapeseed (thousand tonnes)
Description 1996/97--1998/99
1999/00--2001/02
2002/03--2004/05
2005/06--2007/08
2008/09--2010/11
Total output 33.5 38.6 39.6 47.4 59.6EU 10.1 12.4 12.8 16.7 20.4China 9.0 10.9 11.7 11.5 13.0Canada 6.4 7.0 6.3 9.4 12.8India 5.6 4.4 5.8 6.1 6.7Australia 1.1 2.0 1.4 1.0 1.4Ukraine 0.2 0.1 0.1 0.6 2.1Other 1.1 1.6 1.5 2.1 3.7
Total exports 4.9 6.8 4.9 7.2 11.1Canada 3.1 3.8 3.2 5.5 7.4Ukraine 0.0 0.1 0.0 0.5 1.9Australia 0.8 1.5 0.9 0.5 1.2EU 0.7 1.1 0.4 0.3 0.2Other 0.2 0.2 0.3 0.4 0.4
Total imports 5.1 6.7 4.7 7.1 11.1EU 0.8 0.3 0.1 0.5 2.7Japan 2.1 2.2 2.2 2.2 2.2Mexico 0.6 0.6 0.9 1.2 1.3Pakistan 0.1 0.4 0.6 0.7 0.8China 0.8 2.3 0.3 0.8 2.0Other 0.7 0.9 0.6 1.6 1.9
Source: USDA-FAS.
3.2.�Supply�demand�relationship�in�the�world�market�of�oil�meals�The consequence of the increase in world production and processing of oil
seeds is the increase in production of oil meals. Also not without significance is the strong increase in demand for high-protein raw materials (mainly for soy-bean meal), mainly from fast-growing Asian countries, as well as from the EU-27. Total production of major oilseeds meal and fish meal in 1995/96-2010/11 increased by 75% and the average annual growth rate in production amounted to 3.8%.
As in the case of oilseeds, the annual average growth rate of soybean meal was definitely higher than the average and amounted to 4.6%, and its volume in the last fifteen years has increased from 89 to 175 million tonnes, i.e. by 97%.

32
The clear leader in the production of soybean meal is China, where over fifteen years, it increased 7-fold (from 6 million to 43.5 million tonnes in 2010/11), while in the last period, ca. 75% were meal produced from imported seeds. Also other Asian countries develop oilseed processing and, consequently, the produc-tion of meal. For example, in India in the period 1995-2010 the production of soybean meal increased from 3.2 to 7.7 million tonnes, i.e. by 140%.
Chart 5. World production of oil meals and fish meal (million tonnes)
Source: Authors' own calculation according to the USDA-FAS data.
The second largest producer of soybean meal is the United States, with an annual production in the 2000s at around 35 million tonnes. Also South America is a region with a large production of soybean meal, mainly in Argentina and Brazil. In both countries, in the last three years production of soybean meal was 26-27 million tonnes each, with the higher growth rate of production in recent years in Argentina. It is connected on one side with a very dynamic development of cultivation and production of GMO soybean, on the other hand with the poli-cy of the government of this country, which promotes sales of processed prod-ucts abroad more than sales of raw materials (lower export tax on oil and soy-bean meal than on seeds). In addition, the development of the production of oilseeds and products of their processing is favoured by continued boom in re-cent years for raw materials and agricultural products on the world market, which allows achieving and maintaining high profits.

33
Table 4. Global balance of oil meals (in million tonnes)*
Description 1996/97--1998/99
1999/00--2001/02
2002/03--2004/05
2005/06--2007/08
2008/09--2010/11
Initial stock 7.2 7.4 6.8 7.4 7.6Production 154.5 175.0 194.3 224.5 243.0Import 45.4 48.9 57.0 67.4 69.6Supply 207.2 231.3 258.1 299.3 320.2Export 45.3 49.4 58.1 69.4 72.7Consumption 154.5 174.9 193.3 222.0 239.4Final stock 7.4 7.1 6.7 7.8 8.0*Includes soybean, cotton, peanut, sunflower, rapeseed, palm nut, dill meal and fish meal. Source: USDA-FAS.
Relatively large producers of soybean meal are also EU Member States, with the volume of production in recent years oscillating in the range of 10-11 million tonnes, and in 90-95% it is obtained from imported seeds. However, alt-hough the production of the meal in the world is growing rapidly, the EU in 2000s recorded a decline of 20-25%. In most EU countries the consumption of vegetable oils, including soybean oil for food purposes and the related demand for nearly ten years is characterized by low growth and is partly implemented with import of the oil itself.
Also the production of rapeseed meal grew rapidly (annual average of 4.4%), the volume in the period 1995-2010 increased from 18.4 to 35 million tonnes, i.e. by 90%. Processing of rapeseed and production of rapeseed meal is increasing in all the major centres of cultivation. Over the past fifteen years, the most dynamic growth in the production took place in the EU, where the pro-cessing of rapeseed and production of rapeseed meal increased by 130%, with nearly 6% average annual rate of growth, and its volume increased from 5.5 mil-lion tonnes to nearly 13 million tonnes. This increase was largely caused by non-economic factors and was associated with the obligation to implement progres-sively higher share of biofuels in the energy balance of the EU countries37.
37 Directive 2001/77/EC of the European Parliament and of the Council of 27 September 2001 on the promotion of electricity produced from renewable energy sources in the internal elec-tricity market, Directive 2003/30/EC of the European Parliament and of the Council of 8 May 2003 on the promotion of the use of biofuels or other renewable fuels for transport, and Di-rective 2009/28/EC of the European Parliament and of the Council of 23 April 2009 on the promotion of the use of energy from renewable sources and amending and subsequently re-pealing Directives 2001/77/EC and 2003/30/EC.

34
Table 5. Leading producers, exporters and importers of soybean meal (thou-sand tonnes)
Description 1996/97--1998/99
1999/00--2001/02
2002/03--2004/05
2005/06--2007/08
2008/09--2010/11
Total output 98.1 116.0 132.6 153.3 163.9 China 7.6 14.4 21.7 29.0 38.2 USA 26.8 29.1 33.3 35.5 34.8 Argentina 10.9 14.7 20.0 26.0 26.8 Brazil 16.0 17.9 22.2 23.6 26.2 EU 12.2 12.8 11.8 11.3 10.0 India 3.7 3.6 3.6 5.8 6.5 Other 20.9 23.5 20.0 22.0 21.4
Total exports 32.8 37.4 45.6 54.8 55.6 Argentina 10.5 14.5 19.4 25.6 25.5 Brazil 10.0 10.8 14.2 12.6 13.4 USA 7.4 7.2 5.7 7.9 8.7 India 2.6 2.5 2.5 4.6 3.9 Paraguay 0.4 0.6 0.5 1.3 1.1 Other 1.9 1.8 3.3 2.9 3.0
Total imports 33.5 37.1 44.5 53.1 53.5 EU 16.1 18.5 21.5 23.2 21.2 Thailand 0.9 1.5 1.8 2.1 2.3 Indonesia 0.5 1.3 1.7 2.2 2.6 Vietnam 0.2 0.5 1.3 2.2 2.6 Japan 0.9 0.8 1.3 1.7 2.0 Other 14.9 14.5 17.0 21.7 22.6
Source: USDA-FAS.
The increase in production of rapeseed meal in Asian countries (China, India) is a consequence of rapid economic development in this region of the world, including increase in the production of agri-food industry. Food con-sumption, including vegetable oils and animal products, is steadily increasing in this region. Therefore, there is a growing demand for food products and feed material, including oil seed meal.

35
Table 6. Leading producers, exporters and importers of rapeseed meal (thou-sands of tonnes)
Description 1996/97--1998/99
1999/00--2001/02
2002/03--2004/05
2005/06--2007/08
2008/09--2010/11
Total output 18.5 21.1 21.6 26.7 33.1 EU 5.5 6.2 6.5 9.3 12.5 China 5.6 7.6 7.2 7.4 8.8 India 3.2 2.4 2.9 3.4 3.5 Canada 1.7 1.6 1.7 2.2 3.0 Other 2.5 3.3 3.3 4.3 5.3
Total exports 3.0 1.9 2.2 3.0 4.1 Canada 1.3 1.0 1.3 1.6 2.2 India 0.7 0.2 0.6 1.0 1.0 Other 1.0 0.7 0.3 0.4 0.9
Total imports 2.5 1.9 2.2 3.1 4.1 USA 1.1 1.0 1.2 1.6 1.6 China 0.1 0.0 0.1 0.3 0.9 Republic of Korea 0.4 0.3 0.3 0.4 0.3 Thailand 0.0 0.1 0.1 0.3 0.3 Other 0.9 0.5 0.4 0.6 1.0
Source: USDA-FAS.
The rate of growth in the production of sunflower meal was relatively low (by ca. 1.3% on average per year and 22% rate of growth in 1995-2010); its vol-ume increased from 10.3 to 12.5 million tonnes. This increase was achieved by increasing the production and processing of sunflower in Russia and Ukraine. In these countries, following the deep decline in the early 1990s, slowly but steadi-ly the production of agricultural raw materials and agri-food products is being rebuilt. This applies not only to oilseeds and products of their processing, but also to cereals. However, in the EU, which as a group is still the largest producer and processor of sunflower, production of sunflower meal in 2000s was stable at around 3.3 million tonnes per year.
In case of other meal production there was a grown by 33% during the pe-riod, with the average annual rate of 1.9%.
In 1995-2010 there was a decline in the production of fishmeal from 5.9 million tonnes to 4.6 million tonnes, i.e. by 27.5%. Its main producers and ex-porters are Peru and Chile. The total share of these two countries in the world production of fish meal, depending on the season, ranged from 32 to 52%. These
36
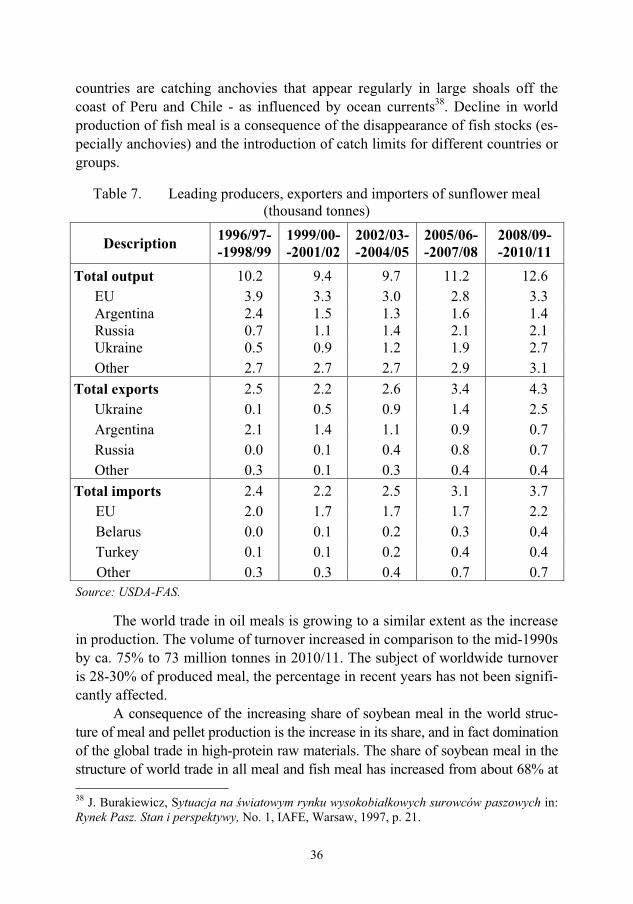
countries are catching anchovies that appear regularly in large shoals off the coast of Peru and Chile - as influenced by ocean currents38. Decline in world production of fish meal is a consequence of the disappearance of fish stocks (es-pecially anchovies) and the introduction of catch limits for different countries or groups.
Table 7. Leading producers, exporters and importers of sunflower meal (thousand tonnes)
Description 1996/97--1998/99
1999/00--2001/02
2002/03--2004/05
2005/06--2007/08
2008/09--2010/11
Total output 10.2 9.4 9.7 11.2 12.6 EU 3.9 3.3 3.0 2.8 3.3 Argentina 2.4 1.5 1.3 1.6 1.4 Russia 0.7 1.1 1.4 2.1 2.1 Ukraine 0.5 0.9 1.2 1.9 2.7 Other 2.7 2.7 2.7 2.9 3.1
Total exports 2.5 2.2 2.6 3.4 4.3 Ukraine 0.1 0.5 0.9 1.4 2.5 Argentina 2.1 1.4 1.1 0.9 0.7 Russia 0.0 0.1 0.4 0.8 0.7 Other 0.3 0.1 0.3 0.4 0.4
Total imports 2.4 2.2 2.5 3.1 3.7 EU 2.0 1.7 1.7 1.7 2.2 Belarus 0.0 0.1 0.2 0.3 0.4 Turkey 0.1 0.1 0.2 0.4 0.4 Other 0.3 0.3 0.4 0.7 0.7
Source: USDA-FAS.
The world trade in oil meals is growing to a similar extent as the increase in production. The volume of turnover increased in comparison to the mid-1990s by ca. 75% to 73 million tonnes in 2010/11. The subject of worldwide turnover is 28-30% of produced meal, the percentage in recent years has not been signifi-cantly affected.
A consequence of the increasing share of soybean meal in the world struc-ture of meal and pellet production is the increase in its share, and in fact domination of the global trade in high-protein raw materials. The share of soybean meal in the structure of world trade in all meal and fish meal has increased from about 68% at 38 J. Burakiewicz, Sytuacja na �wiatowym rynku wysokobia�kowych surowców paszowych in: Rynek Pasz. Stan i perspektywy, No. 1, IAFE, Warsaw, 1997, p. 21.
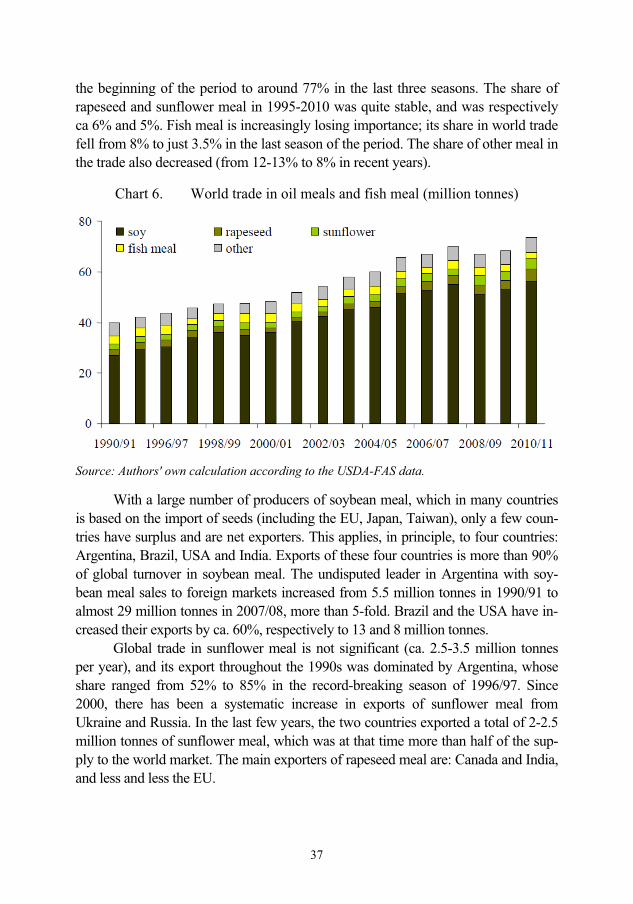
37
the beginning of the period to around 77% in the last three seasons. The share of rapeseed and sunflower meal in 1995-2010 was quite stable, and was respectively ca 6% and 5%. Fish meal is increasingly losing importance; its share in world trade fell from 8% to just 3.5% in the last season of the period. The share of other meal in the trade also decreased (from 12-13% to 8% in recent years).
Chart 6. World trade in oil meals and fish meal (million tonnes)
Source: Authors' own calculation according to the USDA-FAS data.
With a large number of producers of soybean meal, which in many countries is based on the import of seeds (including the EU, Japan, Taiwan), only a few coun-tries have surplus and are net exporters. This applies, in principle, to four countries: Argentina, Brazil, USA and India. Exports of these four countries is more than 90% of global turnover in soybean meal. The undisputed leader in Argentina with soy-bean meal sales to foreign markets increased from 5.5 million tonnes in 1990/91 to almost 29 million tonnes in 2007/08, more than 5-fold. Brazil and the USA have in-creased their exports by ca. 60%, respectively to 13 and 8 million tonnes.
Global trade in sunflower meal is not significant (ca. 2.5-3.5 million tonnes per year), and its export throughout the 1990s was dominated by Argentina, whose share ranged from 52% to 85% in the record-breaking season of 1996/97. Since 2000, there has been a systematic increase in exports of sunflower meal from Ukraine and Russia. In the last few years, the two countries exported a total of 2-2.5 million tonnes of sunflower meal, which was at that time more than half of the sup-ply to the world market. The main exporters of rapeseed meal are: Canada and India, and less and less the EU.

38
Chart 7. Leading exporters of oil meals and fish meal (million tonnes) Soybean meal Rapeseed meal
Sunflower meal Fish meal
Source: USDA, FAS.
Global imports of high-protein raw materials (oil meals and fish meal) in the 1995-2010 increased from 42 million tonnes to ca. 73.5 million tonnes in 2010/11, i.e. by more than 74%, with an average annual rate of growth of 3.8%.
The main importers of high-protein raw materials (high-protein meal) are the EU-27 and Asian countries: Thailand, Japan, Indonesia, Vietnam, Taiwan, South Korea, with Asian countries having much higher rate of growth of import demand. China and India, where demand and consumption of oil meals is grow-ing fastest, develop their own production and processing of oil seeds or, especially China, rapidly increase imports of seeds that are then reprocessed in oil plants to
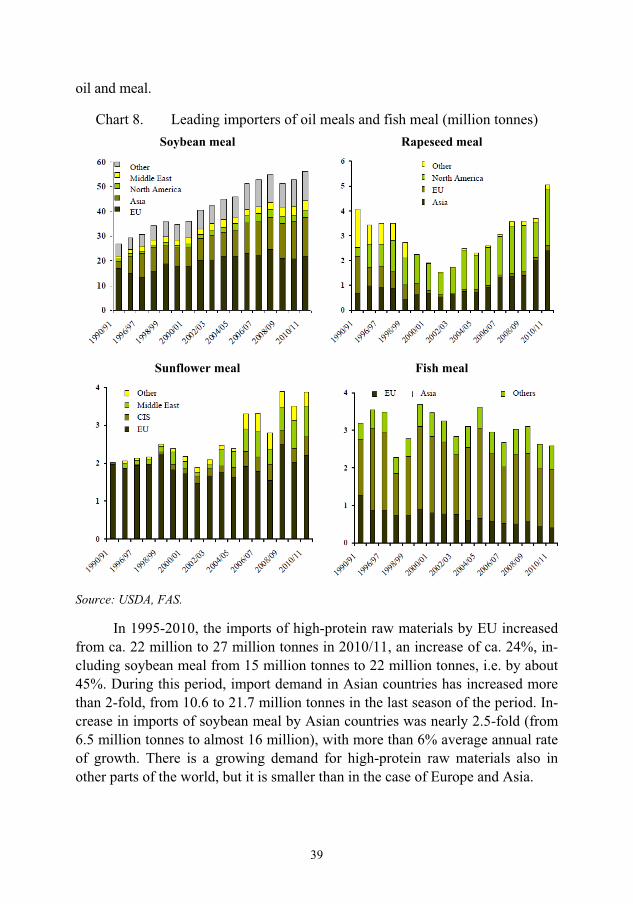
39
oil and meal.
Chart 8. Leading importers of oil meals and fish meal (million tonnes) Soybean meal Rapeseed meal
Sunflower meal Fish meal
Source: USDA, FAS.
In 1995-2010, the imports of high-protein raw materials by EU increased from ca. 22 million to 27 million tonnes in 2010/11, an increase of ca. 24%, in-cluding soybean meal from 15 million tonnes to 22 million tonnes, i.e. by about 45%. During this period, import demand in Asian countries has increased more than 2-fold, from 10.6 to 21.7 million tonnes in the last season of the period. In-crease in imports of soybean meal by Asian countries was nearly 2.5-fold (from 6.5 million tonnes to almost 16 million), with more than 6% average annual rate of growth. There is a growing demand for high-protein raw materials also in other parts of the world, but it is smaller than in the case of Europe and Asia.

40
Chart 9. Global consumption of oil meals and fish meal (million tonnes)
Source: Authors' own calculation according to the USDA-FAS data.
With the development of livestock production there has been a growing demand for high-protein raw materials, the use of which in the last fifteen years has increased by almost 74% to 251 million tonnes. The role of soybean meal is increasingly important in meeting the demand for high-protein raw materials; the consumption increased from 88 million tonnes to 170 million tonnes in 2010, i.e. by more than 93%, and its share in the structure of consumption in-creased to 67-68%. Consumption of rapeseed meal is also increasing at a higher rate; its volume increased from 18 to 35 million tonnes, and the share in the bal-ance of meal from 12 to 14%. The importance of the remaining meal is decreas-ing, including sunflower meal and fish meal.
The undisputed leaders in the consumption of oil meals are countries in Asia. In 1995-2010 they increased their consumption by 126% to 106 million tonnes, an average in the last three years was 98 million tonnes. This increase is primarily a consequence of the rapid growth in Chinese demand for high-protein raw materials; their consumption during this period increased more than 3-fold, from 19 to 63 million tonnes. Currently, consumption of high-protein raw mate-rials in China accounts for nearly 25% of world consumption. In the European Union, which is the second largest region of oil meals consumption, it increased in the last fifteen years by ca. 26% and in the last season of the period it was nearly 53 million tonnes and was ca. 16% lower than in China. Similar growth in demand for oil meals was recorded in North America (increase from 33 to 40 million tonnes).
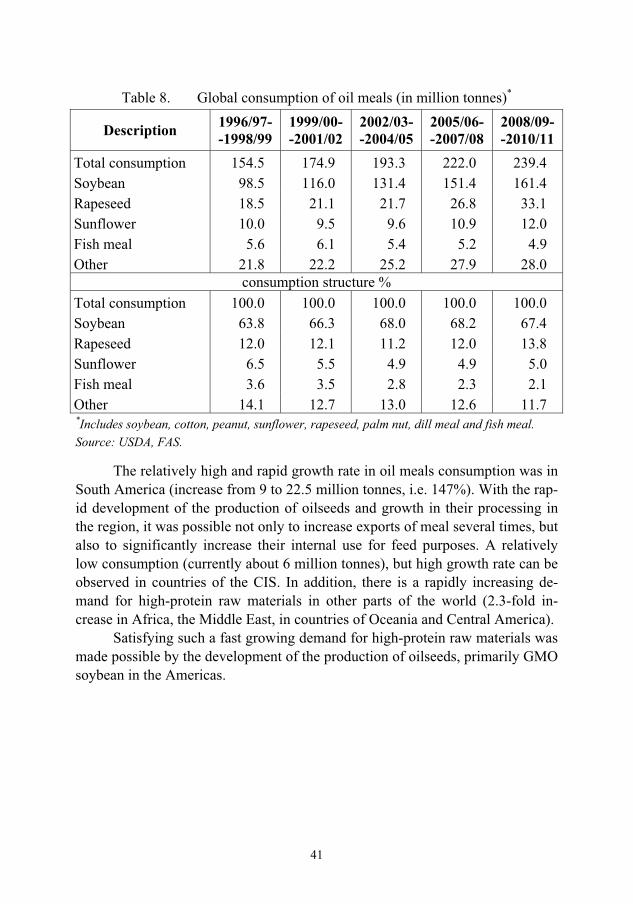
41
Table 8. Global consumption of oil meals (in million tonnes)*
Description 1996/97--1998/99
1999/00--2001/02
2002/03--2004/05
2005/06--2007/08
2008/09--2010/11
Total consumption 154.5 174.9 193.3 222.0 239.4 Soybean 98.5 116.0 131.4 151.4 161.4 Rapeseed 18.5 21.1 21.7 26.8 33.1 Sunflower 10.0 9.5 9.6 10.9 12.0 Fish meal 5.6 6.1 5.4 5.2 4.9 Other 21.8 22.2 25.2 27.9 28.0
consumption structure % Total consumption 100.0 100.0 100.0 100.0 100.0 Soybean 63.8 66.3 68.0 68.2 67.4 Rapeseed 12.0 12.1 11.2 12.0 13.8 Sunflower 6.5 5.5 4.9 4.9 5.0 Fish meal 3.6 3.5 2.8 2.3 2.1 Other 14.1 12.7 13.0 12.6 11.7 *Includes soybean, cotton, peanut, sunflower, rapeseed, palm nut, dill meal and fish meal. Source: USDA, FAS.
The relatively high and rapid growth rate in oil meals consumption was in South America (increase from 9 to 22.5 million tonnes, i.e. 147%). With the rap-id development of the production of oilseeds and growth in their processing in the region, it was possible not only to increase exports of meal several times, but also to significantly increase their internal use for feed purposes. A relatively low consumption (currently about 6 million tonnes), but high growth rate can be observed in countries of the CIS. In addition, there is a rapidly increasing de-mand for high-protein raw materials in other parts of the world (2.3-fold in-crease in Africa, the Middle East, in countries of Oceania and Central America).
Satisfying such a fast growing demand for high-protein raw materials was made possible by the development of the production of oilseeds, primarily GMO soybean in the Americas.

42
Table 9. Global consumption of oil meals (in million tonnes)*
Description 1996/97--1998/99
1999/00--2001/02
2002/03--2004/05
2005/06--2007/08
2008/09--2010/11
Total consumption 154.5 174.9 193.3 222.0 239.4 EU 43.0 47.0 48.3 51.1 52.1 Asia 51.0 59.4 70.7 83.6 97.9 China 22.6 28.6 36.4 45.3 56.2 India 8.8 7.7 8.3 9.4 10.8 North America 35.7 39.4 40.6 43.3 39.8 South America 10.2 11.9 13.8 18.4 21.1 CIS 3.2 3.7 4.1 6.1 6.5 Other 11.4 13.5 15.8 19.5 22.1
consumption structure % Total consumption 100,0 100,0 100,0 100,0 100,0
EU 27,8 26,9 25,0 23,0 21,8 Asia 33,0 34,0 36,6 37,7 40,9 China 14,6 16,3 18,9 20,4 23,5 India 5,7 4,4 4,3 4,2 4,5 North America 23,1 22,5 21,0 19,5 16,6 South America 6,6 6,8 7,1 8,3 8,8 CIS 2,1 2,1 2,1 2,7 2,7 Other 7,4 7,7 8,2 8,8 9,2
*Includes soybean, cotton, peanut, sunflower, rapeseed, palm nut, dill meal and fish meal. Source: USDA, FAS.
43
4.�Production,�import�and�consumption�of�high�protein�raw�materials�in�the�EU�27�
EU-27 countries are major producers of rapeseed and sunflower. Rapeseed production amounting to 20 million tonnes in recent years is about one-third of the global harvest of this plant. Sunflower crops in the EU-27 are ca. 7 million tonnes, representing one-fifth of world production. Due to the unfavourable climatic condi-tions soybean cultivation in the European Union is carried out on a small scale, and its crops in recent years rarely exceed 1 million tonnes and meet the demand for it in a very small extent (about 5-8%).
The European Union, after China, is the world's second-largest importer of high-protein plants. Soybean imports amounting in recent years to 13-15 mil-lion tonnes comprises 15-20% of the worldwide turnover of the plant.
Member States import mostly meal. The European Union is currently cre-ates ca. 40% of international trade in soybean meal, while in the mid-1990s it was on average ca .55%. The volume of EU imports of soybean meal in recent years is estimated at about 22 million tonnes, and it grew from the mid-1990s on an average annual rate of 2.5% and in the last season of the period (2010/11) was by 45% higher in comparison with the beginning of the period. This in-crease was largely due to the growing demand for raw protein in the countries which are members of the EU since 2004, including Poland.
A significant increase in imports of high-protein meal took place especial-ly in the late 1990s. It was largely associated with the complete withdrawal, first from the EU-15, and then in the countries, which in subsequent years joined the European Union, of animal meal from the food chain, which necessitated in-creased imports of high-protein feed material of plant origin. EU imports of fish meal in recent seasons is 0.4-0.5 million tonnes and is nearly half that in the 1990s.
Production of high-protein feed material in the EU-27 shows a systematic increase from 21 million tonnes in the mid-1990s to nearly 27 million tonnes in the last two seasons, i.e. by ca. 25% and the average annual rate of growth was 1.5%. About half of the production is rapeseed meal, which in the period in-creased 2.5-fold to 13 million tonnes. This production uses mainly rapeseed produced in the EU countries, but the last three years have seen imports and processing of ca. 3 million tonnes of imported rapeseed on average per year.

44
Table 10. Production, import and consumption of high-protein raw materials in the EU-27 (million tonnes)
Description 1996/97--1998/99
1999/00--2001/02
2002/03--2004/05
2005/06--2007/08
2008/09--2010/11
ProductionTotal 22.4 23.2 22.1 24.2 26.5
including: soybean meal 12.2 12.8 11.8 11.3 10.0 rapeseed meal 5.5 6.2 6.5 9.3 12.5 sunflower meal 3.9 3.3 3.0 2.8 3.3 fish meal 0.6 0.5 0.5 0.5 0.5 other meal 0.2 0.3 0.3 0.2 0.2
Net imports Total 20.5 23.8 26.1 27.1 25.4
including: soybean meal 15.0 18.3 21.1 22.6 20.7 rapeseed meal 0.3 0.2 0.0 0.0 0.0 sunflower meal 1.8 1.6 1.6 1.6 2.1 fish meal 0.5 0.6 0.4 0.3 0.2 other meal 2.9 3.1 3.0 2.5 2.3
Total consumption Total 43.0 47.0 48.2 51.3 51.9
including: soybean meal 27.2 31.1 32.8 34.0 30.7 rapeseed meal 5.8 6.4 6.5 9.3 12.5 sunflower meal 5.7 4.9 4.6 4.4 5.5 fish meal 1.0 1.1 1.0 0.9 0.8 other meal 3.2 3.4 3.2 2.8 2.4
Self-sufficiency ratio (%) Total 52.2 49.3 45.8 47.1 51.1
including: soybean meal 45.0 41.2 35.8 33.4 32.5 rapeseed meal 95.0 97.2 99.4 99.9 100.3 sunflower meal 67.9 66.7 65.4 63.2 60.8 fish meal 54.5 48.5 56.3 61.1 67.9 other meal 7.2 8.4 7.8 7.7 6.7
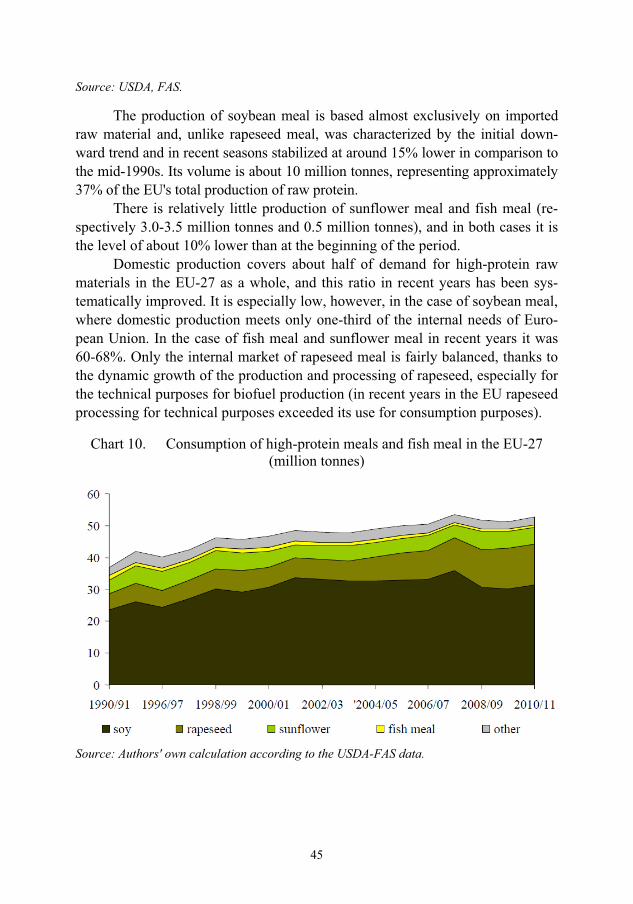
45
Source: USDA, FAS.
The production of soybean meal is based almost exclusively on imported raw material and, unlike rapeseed meal, was characterized by the initial down-ward trend and in recent seasons stabilized at around 15% lower in comparison to the mid-1990s. Its volume is about 10 million tonnes, representing approximately 37% of the EU's total production of raw protein.
There is relatively little production of sunflower meal and fish meal (re-spectively 3.0-3.5 million tonnes and 0.5 million tonnes), and in both cases it is the level of about 10% lower than at the beginning of the period.
Domestic production covers about half of demand for high-protein raw materials in the EU-27 as a whole, and this ratio in recent years has been sys-tematically improved. It is especially low, however, in the case of soybean meal, where domestic production meets only one-third of the internal needs of Euro-pean Union. In the case of fish meal and sunflower meal in recent years it was 60-68%. Only the internal market of rapeseed meal is fairly balanced, thanks to the dynamic growth of the production and processing of rapeseed, especially for the technical purposes for biofuel production (in recent years in the EU rapeseed processing for technical purposes exceeded its use for consumption purposes).
Chart 10. Consumption of high-protein meals and fish meal in the EU-27 (million tonnes)
Source: Authors' own calculation according to the USDA-FAS data.
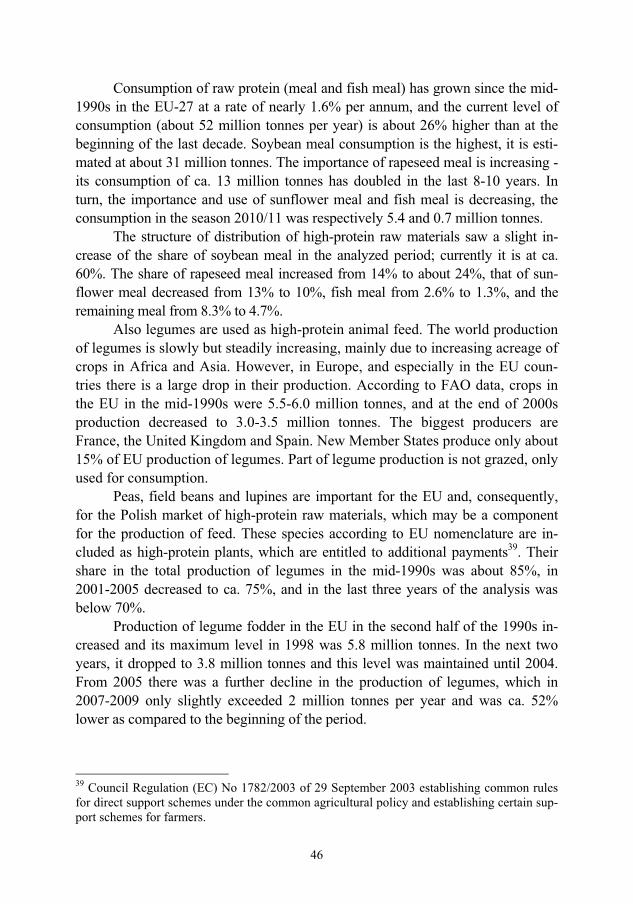
46
Consumption of raw protein (meal and fish meal) has grown since the mid-1990s in the EU-27 at a rate of nearly 1.6% per annum, and the current level of consumption (about 52 million tonnes per year) is about 26% higher than at the beginning of the last decade. Soybean meal consumption is the highest, it is esti-mated at about 31 million tonnes. The importance of rapeseed meal is increasing - its consumption of ca. 13 million tonnes has doubled in the last 8-10 years. In turn, the importance and use of sunflower meal and fish meal is decreasing, the consumption in the season 2010/11 was respectively 5.4 and 0.7 million tonnes.
The structure of distribution of high-protein raw materials saw a slight in-crease of the share of soybean meal in the analyzed period; currently it is at ca. 60%. The share of rapeseed meal increased from 14% to about 24%, that of sun-flower meal decreased from 13% to 10%, fish meal from 2.6% to 1.3%, and the remaining meal from 8.3% to 4.7%.
Also legumes are used as high-protein animal feed. The world production of legumes is slowly but steadily increasing, mainly due to increasing acreage of crops in Africa and Asia. However, in Europe, and especially in the EU coun-tries there is a large drop in their production. According to FAO data, crops in the EU in the mid-1990s were 5.5-6.0 million tonnes, and at the end of 2000s production decreased to 3.0-3.5 million tonnes. The biggest producers are France, the United Kingdom and Spain. New Member States produce only about 15% of EU production of legumes. Part of legume production is not grazed, only used for consumption.
Peas, field beans and lupines are important for the EU and, consequently, for the Polish market of high-protein raw materials, which may be a component for the production of feed. These species according to EU nomenclature are in-cluded as high-protein plants, which are entitled to additional payments39. Their share in the total production of legumes in the mid-1990s was about 85%, in 2001-2005 decreased to ca. 75%, and in the last three years of the analysis was below 70%.
Production of legume fodder in the EU in the second half of the 1990s in-creased and its maximum level in 1998 was 5.8 million tonnes. In the next two years, it dropped to 3.8 million tonnes and this level was maintained until 2004. From 2005 there was a further decline in the production of legumes, which in 2007-2009 only slightly exceeded 2 million tonnes per year and was ca. 52% lower as compared to the beginning of the period.
39 Council Regulation (EC) No 1782/2003 of 29 September 2003 establishing common rules for direct support schemes under the common agricultural policy and establishing certain sup-port schemes for farmers.
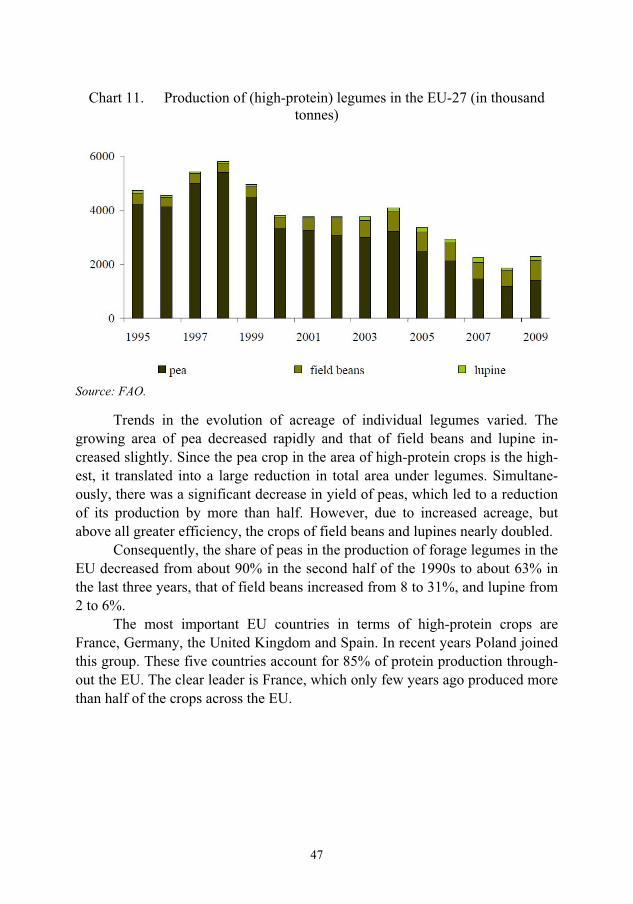
47
Chart 11. Production of (high-protein) legumes in the EU-27 (in thousand tonnes)
Source: FAO.
Trends in the evolution of acreage of individual legumes varied. The growing area of pea decreased rapidly and that of field beans and lupine in-creased slightly. Since the pea crop in the area of high-protein crops is the high-est, it translated into a large reduction in total area under legumes. Simultane-ously, there was a significant decrease in yield of peas, which led to a reduction of its production by more than half. However, due to increased acreage, but above all greater efficiency, the crops of field beans and lupines nearly doubled.
Consequently, the share of peas in the production of forage legumes in the EU decreased from about 90% in the second half of the 1990s to about 63% in the last three years, that of field beans increased from 8 to 31%, and lupine from 2 to 6%.
The most important EU countries in terms of high-protein crops are France, Germany, the United Kingdom and Spain. In recent years Poland joined this group. These five countries account for 85% of protein production through-out the EU. The clear leader is France, which only few years ago produced more than half of the crops across the EU.
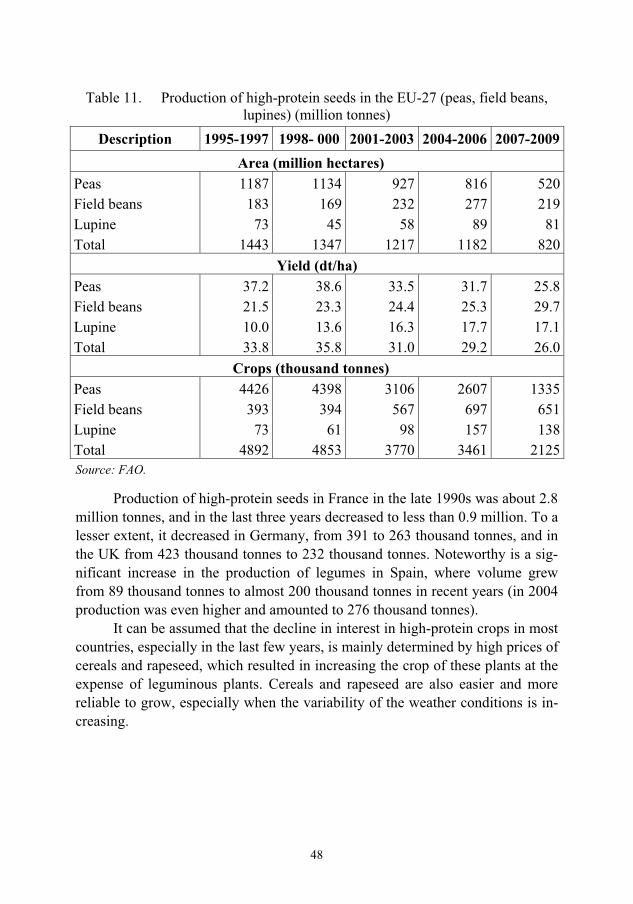
48
Table 11. Production of high-protein seeds in the EU-27 (peas, field beans, lupines) (million tonnes)
Description 1995-1997 1998- 000 2001-2003 2004-2006 2007-2009Area (million hectares)
Peas 1187 1134 927 816 520Field beans 183 169 232 277 219Lupine 73 45 58 89 81Total 1443 1347 1217 1182 820
Yield (dt/ha)Peas 37.2 38.6 33.5 31.7 25.8Field beans 21.5 23.3 24.4 25.3 29.7Lupine 10.0 13.6 16.3 17.7 17.1Total 33.8 35.8 31.0 29.2 26.0
Crops (thousand tonnes)Peas 4426 4398 3106 2607 1335Field beans 393 394 567 697 651Lupine 73 61 98 157 138Total 4892 4853 3770 3461 2125Source: FAO.
Production of high-protein seeds in France in the late 1990s was about 2.8 million tonnes, and in the last three years decreased to less than 0.9 million. To a lesser extent, it decreased in Germany, from 391 to 263 thousand tonnes, and in the UK from 423 thousand tonnes to 232 thousand tonnes. Noteworthy is a sig-nificant increase in the production of legumes in Spain, where volume grew from 89 thousand tonnes to almost 200 thousand tonnes in recent years (in 2004 production was even higher and amounted to 276 thousand tonnes).
It can be assumed that the decline in interest in high-protein crops in most countries, especially in the last few years, is mainly determined by high prices of cereals and rapeseed, which resulted in increasing the crop of these plants at the expense of leguminous plants. Cereals and rapeseed are also easier and more reliable to grow, especially when the variability of the weather conditions is in-creasing.

49
Table 12. Production of high-protein seeds in the EU-27 by country (million tonnes)
Description 1995-1997 1998- 000 2001-2003 2004-2006 2007-2009Production (thousand tonnes)
Total 4892 4853 3770 3461 2125 France 2817 2673 1926 1704 873 Germany 391 620 560 514 263 United Kingdom 423 459 423 291 232 Spain 89 78 146 233 187 Poland* 167 184 140 175 199 Other 1004 839 574 544 372
Structure of production (%)Total 100.0 100.0 100.0 100.0 100.0 France 57.6 55.1 51.1 49.2 41.1 Germany 8.0 12.8 14.9 14.8 12.4 United Kingdom 8.6 9.5 11.2 8.4 10.9 Spain 1.8 1.6 3.9 6.7 8.8 Poland 3.4 3.8 3.7 5.1 9.4 Other 20.5 17.3 15.2 15.7 17.5 * data for Poland according to the Central Statistical Office, also include the production of cereal-leguminous mixes Source: FAO.
In the EU-15 cultivation of high-protein plants was covered by additional support in the amount of 55.57 EUR/ha (in Poland subsidies were introduced in 2010). But this is not a sufficient level of support even to maintain acreage to for high-protein crops at the level from few years ago.
Table 13. Comparison between the maximum area covered by subsidies for high-protein plants and the surface for which the aid was actually paid (thousand
hectares) Description 2004 2005 2006 2007
AID PAID 1244.2 1222.4 1034.5 859.8 MGA 1400.0 1400.0 1600.0 1648.0 % 89% 87% 65% 52% Source: Workshop „Protein crops: what are the stakes for the European Union?”, Brussels, 26/03/2008.
50
The comparison between the maximum area that can be covered by aid (MGA), and the area for which additional payments were paid (AID PAID) shows that the interest in this element of additional support is systematically de-clining. In 2004, the entitlement limit was used in 89%, and in 2007 only in 52%, simply because high-protein plants are cultivated less and less in the EU. This situation could only be changed radically by increase in direct support for production, which seems unlikely due to the fact that the actions of the European Commission and changes to the CAP are moving towards full decoupling of payments and production. This also applies to legumes that since 1 January 2012 are covered by full decoupling, which in fact leads to deterioration in the profit-ability of their crops in relation to other plants. In a free market game, legumes are rather doomed to failure, at least for the reason that there is no increase in crops (there is even a decrease in performance), while in the cultivation of cere-als and rapeseed the progress is very visible. No one is interested in the benefits of crop rotation.
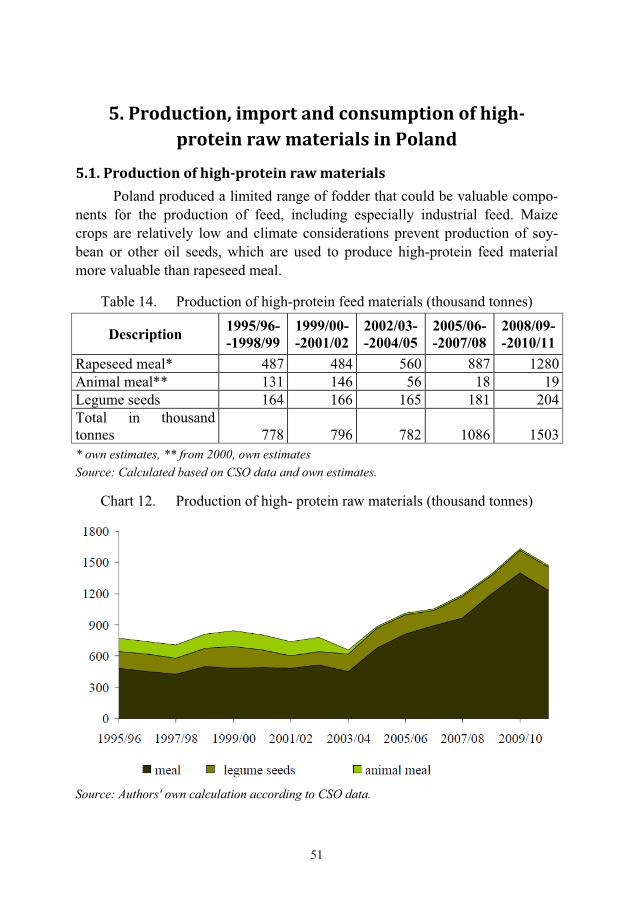
51
5.�Production,�import�and�consumption�of�high�protein�raw�materials�in�Poland�
5.1.�Production�of�high�protein�raw�materials�Poland produced a limited range of fodder that could be valuable compo-
nents for the production of feed, including especially industrial feed. Maize crops are relatively low and climate considerations prevent production of soy-bean or other oil seeds, which are used to produce high-protein feed material more valuable than rapeseed meal.
Table 14. Production of high-protein feed materials (thousand tonnes)
Description 1995/96--1998/99
1999/00--2001/02
2002/03--2004/05
2005/06--2007/08
2008/09--2010/11
Rapeseed meal* 487 484 560 887 1280Animal meal** 131 146 56 18 19Legume seeds 164 166 165 181 204Total in thousand tonnes 778 796 782 1086 1503* own estimates, ** from 2000, own estimates Source: Calculated based on CSO data and own estimates.
Chart 12. Production of high- protein raw materials (thousand tonnes)
Source: Authors' own calculation according to CSO data.
52
Major importance in the domestic production of high-protein raw materials have: rapeseed, forage legume seeds and animal meals, and since 2003, only fish meal. Total production of high-protein feed material increased from about 0.77 million tonnes in 1996 to ca. 1.50 million tonnes per annum in the last three years, i.e. by more than 92%. Average annual rate of growth was 4.5% and was varied for different types of high-protein raw materials. In the period 1996-2003 the lev-el of this production was quite stable and ranged from 650-800 thousand tonnes. After the Poland’s accession to the EU, leguminous fodder production has been growing at 12% per annum. Oilseed meal
Production of rapeseed meal in Poland is the highest of all high-protein raw materials40. Rapeseed meal, with relatively low costs, is an inexpensive source of protein. However, its use in the preparation of industrial animal feed is limited. It is a rich source of protein, but slightly worse than soybean meal, because of the lower protein content and worse digestibility – ca 1.4 kg of rapeseed meal is a replace-ment for 1 kg of soybean meal. The share of rapeseed meal in a ration depends on the species, age, and use of animals. In the case of poultry nutrition, for which the production of industrial feed production is by far the largest, the use of rapeseed meal is very limited due to the high fibre content and reduced energy content and toxicity of products of glucosinolate breakdown. These restrictions apply mainly to chickens and turkeys. These factors make the use of rapeseed meal for poultry very limited, and many feed producers do not use rapeseed meal in the production of mixes and concentrates for that direction of animal production.
The volume of meal production is determined by volume of rapeseed har-vest and conditions on the market of vegetable fats. Meal is a by-product of the processing of rape, and the main aim is to obtain rapeseed oil; this is the main driver for oil mills when taking production decisions. Not without significance is the supply of rapeseed in the country. High supply results in price reductions and leads to greater processing. 40Rapeseed meal is recovered as a by-product during processing of rapeseed for oil. Processing of rapeseed in classic technology relies on the initial pressing by means of screw presses, which produces expeller and crude rapeseed oil. The second step is the extraction of remaining oil from the expeller using a solvent. The end product is inter alia, rapeseed meal, and its yield rate in this technology is 58-59%. In addition, rapeseed oil may be extracted in the process of one-or two-step hot-pressing. Then, the yield rate of the oil ranges from 32-38%, and the rest is expel-ler (rapeseed oilcake). In the technology for obtaining oil from rapeseed in cold pressing the oil yield rate is 25-29%. Currently, according to expert estimates, post-extraction rapeseed meal accounts for about 90% of production, and 10% is oil cake. The analysis assumes a simplifica-tion, reducing by-products of the processing of rapeseed without distinction to meal and oil cake, using only the term "rapeseed meal". It was also assumed that the rate of yield of meal from 1 tonne of rapeseed is 0.60 tonne.

53
Chart 13. Production and processing of rapeseed and production of meal (thousand tonnes)
Source: Authors' own calculation and estimates according to CSO data.
In the early 1990s rapeseed meal production in Poland was ca. 300 thou-sand tonnes. In 1995-2003, it ranged between 420-500 thousand tonnes. Greater processing of rapeseed took place generally in good harvest years, but this rela-tionship has not been clearly correlated. A significant increase in rapeseed pro-cessing and at the same time the production of rapeseed meal is recorded since 2004, when processing exceeded 1.1 million tonnes, and meal production was ca. 675 thousand tonnes. In subsequent years, there was a further, rapid increase in processing of rapeseed and rapeseed meal production in the next five years almost doubled and in 2008-2010 exceeded 1.2 million tonnes per year. In 1995-2010 the average annual increase in production of rapeseed meal was over 6% and of rapeseed nearly 3%; in 2000s it was respectively 9.6% and more than 8%. The correlation coefficient between production volume of meal and the volume of rapeseed harvest during this period was very high and amounted to 0.96.
In the following years the production of rapeseed meal will probably con-tinue to grow, but its growth rate will slow down. This will be associated with an increase of rapeseed processing for energy purposes (biofuels), as the demand for rapeseed intended for consumption is stable. The European Commission as-sumes an increase in the share of biofuels in transport to 10% in 2020, which will result in higher production of rapeseed and rapeseed meal.
In Poland, only rapeseed is processed on a large scale. Processing of soy-bean would be possible, but since the second half of the 1990s none of the mill operators does it. Acreage of soybean and sunflower is very small and from the
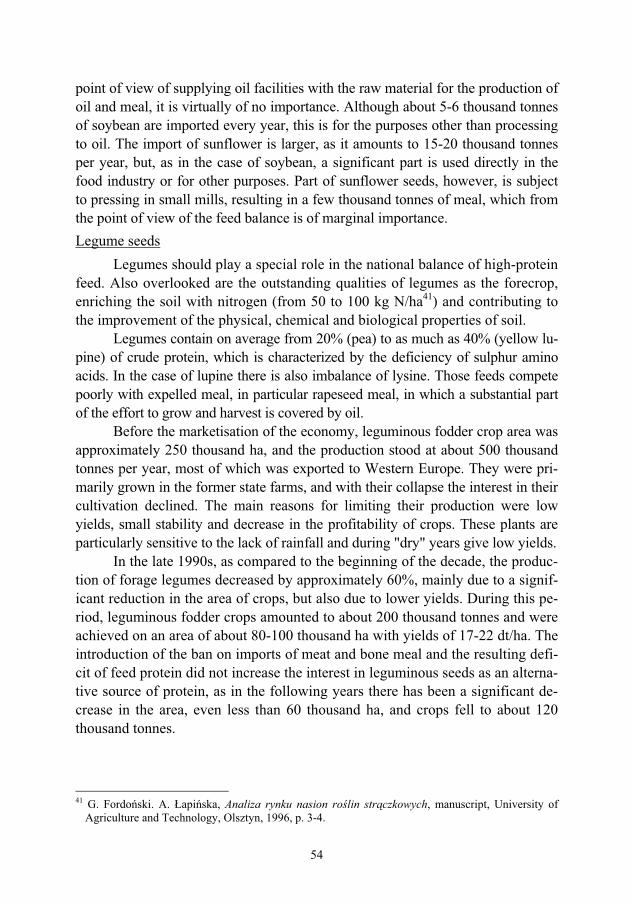
54
point of view of supplying oil facilities with the raw material for the production of oil and meal, it is virtually of no importance. Although about 5-6 thousand tonnes of soybean are imported every year, this is for the purposes other than processing to oil. The import of sunflower is larger, as it amounts to 15-20 thousand tonnes per year, but, as in the case of soybean, a significant part is used directly in the food industry or for other purposes. Part of sunflower seeds, however, is subject to pressing in small mills, resulting in a few thousand tonnes of meal, which from the point of view of the feed balance is of marginal importance. Legume seeds
Legumes should play a special role in the national balance of high-protein feed. Also overlooked are the outstanding qualities of legumes as the forecrop, enriching the soil with nitrogen (from 50 to 100 kg N/ha41) and contributing to the improvement of the physical, chemical and biological properties of soil.
Legumes contain on average from 20% (pea) to as much as 40% (yellow lu-pine) of crude protein, which is characterized by the deficiency of sulphur amino acids. In the case of lupine there is also imbalance of lysine. Those feeds compete poorly with expelled meal, in particular rapeseed meal, in which a substantial part of the effort to grow and harvest is covered by oil.
Before the marketisation of the economy, leguminous fodder crop area was approximately 250 thousand ha, and the production stood at about 500 thousand tonnes per year, most of which was exported to Western Europe. They were pri-marily grown in the former state farms, and with their collapse the interest in their cultivation declined. The main reasons for limiting their production were low yields, small stability and decrease in the profitability of crops. These plants are particularly sensitive to the lack of rainfall and during "dry" years give low yields.
In the late 1990s, as compared to the beginning of the decade, the produc-tion of forage legumes decreased by approximately 60%, mainly due to a signif-icant reduction in the area of crops, but also due to lower yields. During this pe-riod, leguminous fodder crops amounted to about 200 thousand tonnes and were achieved on an area of about 80-100 thousand ha with yields of 17-22 dt/ha. The introduction of the ban on imports of meat and bone meal and the resulting defi-cit of feed protein did not increase the interest in leguminous seeds as an alterna-tive source of protein, as in the following years there has been a significant de-crease in the area, even less than 60 thousand ha, and crops fell to about 120 thousand tonnes.
41 G. Fordo�ski. A. �api�ska, Analiza rynku nasion ro�lin str�czkowych, manuscript, University of
Agriculture and Technology, Olsztyn, 1996, p. 3-4.

55
Chart 14. Production of legumes (thousand tonnes)
Source: Authors' own calculation according to CSO data.
Since 2003, we observe some recovery in their production, but legumes continue to enjoy low interest of farmers. There is still a very low profitability of their cultivation in comparison to other crops and the situation after Poland’s ac-cession to the EU did not improved significantly. Additional area payments for growing pulses and legumes were introduced in 2010 and amounted to 207 PLN/ha. In addition, since 2011 the government implements the programme "Im-proving domestic sources of vegetable protein, their production, trading and use in feed", which assumes an increase in the production of vegetable protein in our country by increasing the area under legumes to 500 thousand hectares. With these instruments, the trend to increase area under legumes and legumes produc-tion is likely to become established, but it is difficult to assess at the moment how significant it will be. Animal meal
In the early 1990s animal meal production amounted to 80-90 thousand tonnes, of which approximately half was fish meal and half was meat-and-bone meal. In the following years there were two opposing trends observed in the production of animal meal: increase in the production of meat-and-bone meal with simultaneous decrease in the volume of fish meal.
The main driver of growth in the production of meat-and-bone meal was the growing demand for this raw material from the feed industry, as domestic production only covered 30% of the domestic demand for the material. It was
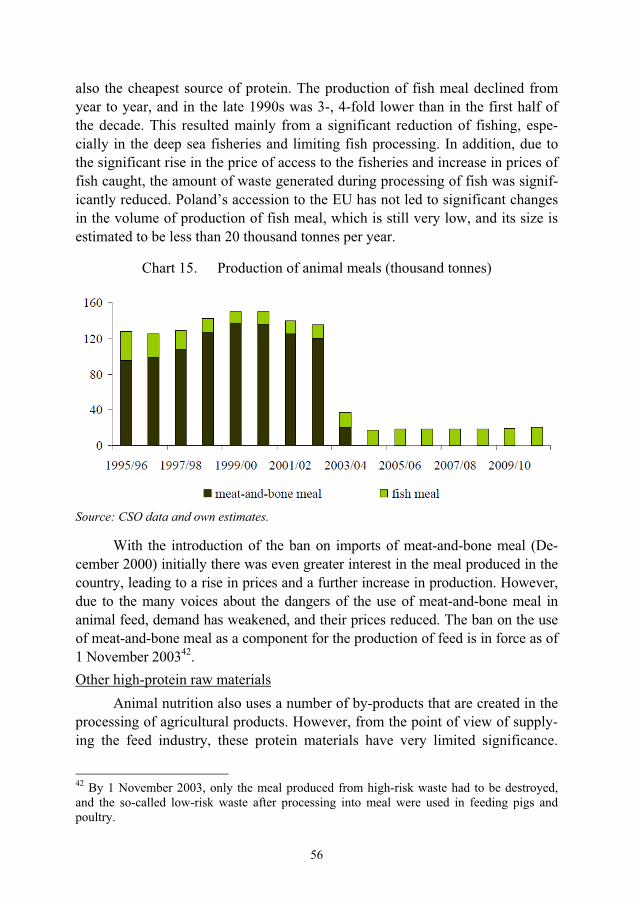
56
also the cheapest source of protein. The production of fish meal declined from year to year, and in the late 1990s was 3-, 4-fold lower than in the first half of the decade. This resulted mainly from a significant reduction of fishing, espe-cially in the deep sea fisheries and limiting fish processing. In addition, due to the significant rise in the price of access to the fisheries and increase in prices of fish caught, the amount of waste generated during processing of fish was signif-icantly reduced. Poland’s accession to the EU has not led to significant changes in the volume of production of fish meal, which is still very low, and its size is estimated to be less than 20 thousand tonnes per year.
Chart 15. Production of animal meals (thousand tonnes)
Source: CSO data and own estimates.
With the introduction of the ban on imports of meat-and-bone meal (De-cember 2000) initially there was even greater interest in the meal produced in the country, leading to a rise in prices and a further increase in production. However, due to the many voices about the dangers of the use of meat-and-bone meal in animal feed, demand has weakened, and their prices reduced. The ban on the use of meat-and-bone meal as a component for the production of feed is in force as of 1 November 200342. Other high-protein raw materials
Animal nutrition also uses a number of by-products that are created in the processing of agricultural products. However, from the point of view of supply-ing the feed industry, these protein materials have very limited significance.
42 By 1 November 2003, only the meal produced from high-risk waste had to be destroyed, and the so-called low-risk waste after processing into meal were used in feeding pigs and poultry.

57
These are:
– by-products of the agri-food industry (fresh and dried beet pulp, molas-ses),
– by-products of the distilleries and breweries (decoction43, spent grains44, malt sprouts45, fodder yeast),
– by-products from mills and starch works (wheat and rye bran, potato pulp) – by-products of dairy (buttermilk, skimmed milk, whey).
Of the following protein components, protein derived from whey becomes more and more important in recent years. There is no statistical data on the size of its production, but it is relatively large46. But probably only to a small extent it is a product used in the feed industry, since the vast majority is exported. In addition, whey protein is used in a number of areas of the food industry. Also potato protein has been obtained on a large scale since relatively recently (currently produced in some potato processing plants). Similarly as in the case of whey protein, about 40% was still exported in 2007. However, in 2008-2010, due to increased domestic de-mand, it was used by local feed producers and farmers.
All feeds of plant origin are rich in phosphorus, but it is in a form difficult to digest by animals, but deficient in components such as calcium, sodium. The use of components of vegetable origin only in the blends requires a very good balance of minerals. Commercially available premixes balanced these compo-nents well when there was 3-5% of meat-and-bone meal in the blends. When using only vegetable products in feeds, in addition to premixes it is necessary to introduce chalk fodder, often also phosphates.
43 It contains a lot of water (94%), a small amount of nitrogen compounds and organic acids, used in the feeding of dairy cows and fattening in an amount of 40 kg of fresh, warm decoc-tions. For some time available in dry form with protein content above 30%. 44 Grains - product of the manufacture of beer, the residue of unfermented barley, can be used for cows, contains about 4% protein. 45 Energy feed obtained in the manufacture of beer, contains 17-30% protein, used in mixtures for all animals. 46 Whey powder has a protein content of 10-18% and 65% lactose, which may be a problem in the feeding of monogastric animals.
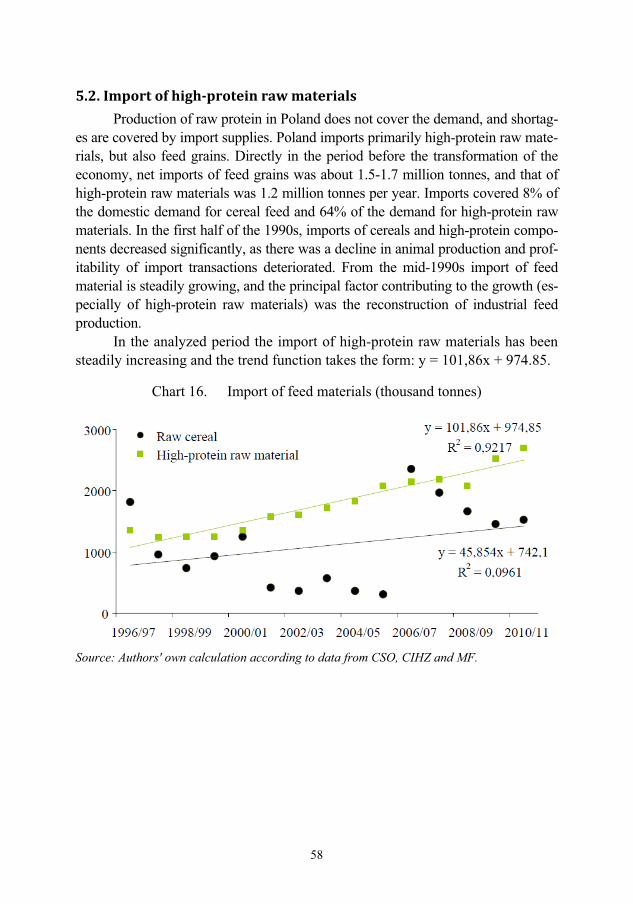
58
5.2.�Import�of�high�protein�raw�materials�Production of raw protein in Poland does not cover the demand, and shortag-
es are covered by import supplies. Poland imports primarily high-protein raw mate-rials, but also feed grains. Directly in the period before the transformation of the economy, net imports of feed grains was about 1.5-1.7 million tonnes, and that of high-protein raw materials was 1.2 million tonnes per year. Imports covered 8% of the domestic demand for cereal feed and 64% of the demand for high-protein raw materials. In the first half of the 1990s, imports of cereals and high-protein compo-nents decreased significantly, as there was a decline in animal production and prof-itability of import transactions deteriorated. From the mid-1990s import of feed material is steadily growing, and the principal factor contributing to the growth (es-pecially of high-protein raw materials) was the reconstruction of industrial feed production.
In the analyzed period the import of high-protein raw materials has been steadily increasing and the trend function takes the form: y = 101,86x + 974.85.
Chart 16. Import of feed materials (thousand tonnes)
Source: Authors' own calculation according to data from CSO, CIHZ and MF.
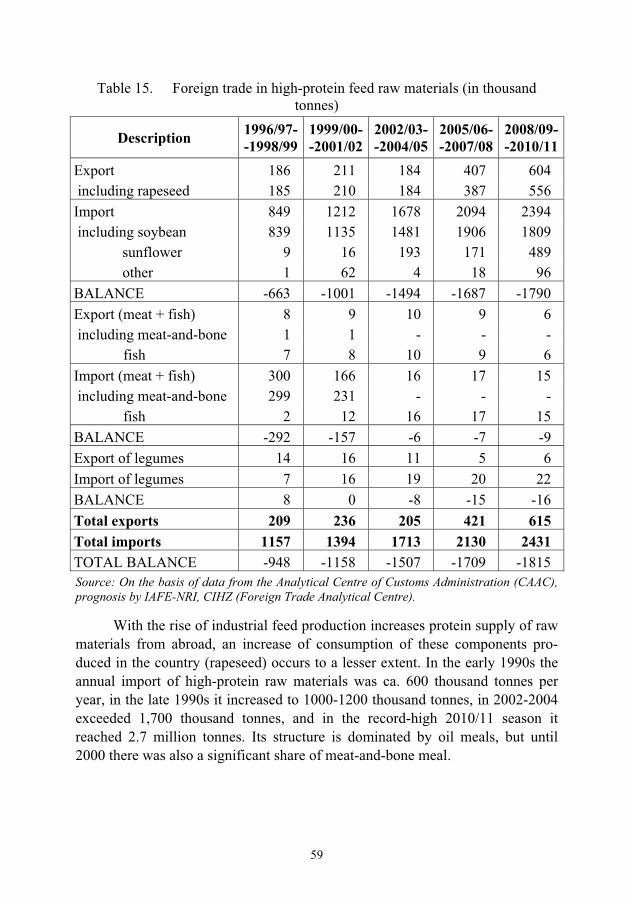
59
Table 15. Foreign trade in high-protein feed raw materials (in thousand tonnes)
Description 1996/97--1998/99
1999/00--2001/02
2002/03--2004/05
2005/06--2007/08
2008/09--2010/11
Export 186 211 184 407 604 including rapeseed 185 210 184 387 556 Import 849 1212 1678 2094 2394 including soybean 839 1135 1481 1906 1809
sunflower 9 16 193 171 489 other 1 62 4 18 96
BALANCE -663 -1001 -1494 -1687 -1790 Export (meat + fish) 8 9 10 9 6 including meat-and-bone 1 1 - - -
fish 7 8 10 9 6 Import (meat + fish) 300 166 16 17 15 including meat-and-bone 299 231 - - -
fish 2 12 16 17 15 BALANCE -292 -157 -6 -7 -9 Export of legumes 14 16 11 5 6 Import of legumes 7 16 19 20 22 BALANCE 8 0 -8 -15 -16 Total exports 209 236 205 421 615 Total imports 1157 1394 1713 2130 2431 TOTAL BALANCE -948 -1158 -1507 -1709 -1815 Source: On the basis of data from the Analytical Centre of Customs Administration (CAAC), prognosis by IAFE-NRI, CIHZ (Foreign Trade Analytical Centre).
With the rise of industrial feed production increases protein supply of raw materials from abroad, an increase of consumption of these components pro-duced in the country (rapeseed) occurs to a lesser extent. In the early 1990s the annual import of high-protein raw materials was ca. 600 thousand tonnes per year, in the late 1990s it increased to 1000-1200 thousand tonnes, in 2002-2004 exceeded 1,700 thousand tonnes, and in the record-high 2010/11 season it reached 2.7 million tonnes. Its structure is dominated by oil meals, but until 2000 there was also a significant share of meat-and-bone meal.
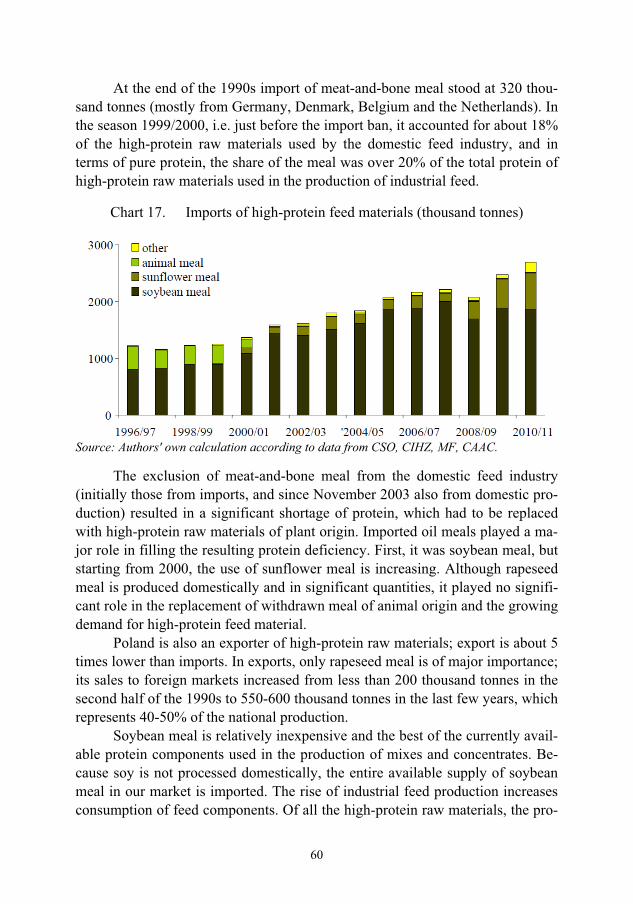
60
At the end of the 1990s import of meat-and-bone meal stood at 320 thou-sand tonnes (mostly from Germany, Denmark, Belgium and the Netherlands). In the season 1999/2000, i.e. just before the import ban, it accounted for about 18% of the high-protein raw materials used by the domestic feed industry, and in terms of pure protein, the share of the meal was over 20% of the total protein of high-protein raw materials used in the production of industrial feed.
Chart 17. Imports of high-protein feed materials (thousand tonnes)
Source: Authors' own calculation according to data from CSO, CIHZ, MF, CAAC.
The exclusion of meat-and-bone meal from the domestic feed industry (initially those from imports, and since November 2003 also from domestic pro-duction) resulted in a significant shortage of protein, which had to be replaced with high-protein raw materials of plant origin. Imported oil meals played a ma-jor role in filling the resulting protein deficiency. First, it was soybean meal, but starting from 2000, the use of sunflower meal is increasing. Although rapeseed meal is produced domestically and in significant quantities, it played no signifi-cant role in the replacement of withdrawn meal of animal origin and the growing demand for high-protein feed material.
Poland is also an exporter of high-protein raw materials; export is about 5 times lower than imports. In exports, only rapeseed meal is of major importance; its sales to foreign markets increased from less than 200 thousand tonnes in the second half of the 1990s to 550-600 thousand tonnes in the last few years, which represents 40-50% of the national production.
Soybean meal is relatively inexpensive and the best of the currently avail-able protein components used in the production of mixes and concentrates. Be-cause soy is not processed domestically, the entire available supply of soybean meal in our market is imported. The rise of industrial feed production increases consumption of feed components. Of all the high-protein raw materials, the pro-

61
duction of high-protein animal industrial feed consumes soybean meal the most because the possibilities of its use are versatile, and directions of allocations are determined by the structure of industrial animal feed production. The demand for soybean meal also grows among larger farmers, who prepare their own feed on the basis of purchased raw materials and feed additives.
For years, the traditional direction of soybean meal imports were South American countries (Brazil, Argentina) and the European Union. Recent years have seen an increased meal imports from South America. Custom duties were of no importance in this regard, because the duty on meal from this two direc-tions was "0". The lower price of South American meal was of some im-portance, but perhaps primarily it was the limited supply in the EU-15.
As previously mentioned, sunflower meal is not produced domestically, and the resources available in the domestic market are imported. Demand for sunflower meal grown in leaps and bounds after the December 2000 ban on im-ports of meat-and-bone meal. The resulting gap was filled in a significant part by sunflower meal, which has a similar, or even slightly higher protein content than rapeseed meal, and the possibilities of its use are considerably greater. Sun-flower meal was also often cheaper than domestic rapeseed meal.
Sunflower meal was imported from our nearest neighbours, and the main supplier was Ukraine. Smaller quantities of sunflower meal come from the Czech Republic and Hungary, and in some seasons it was imported also from Moldova.
Although Poland has a surplus of rapeseed meal, the consequence of which is its high exports, small quantities are still imported.
With the introduction of the ban on imports of meat-and-bone meal for feeding purposes47, the imports of fish meal increased. The volume of imports is not significant, mainly because of the high prices. Most imported meal comes from countries of the Community, mainly from Denmark, and a major supplier from outside the area is Peru.
Some fodder legumes in the feed industry are imported. Mostly it is fod-der peas, imported mainly from the Czech Republic, and in smaller quantities from Slovakia.
47 In 2001-2004, Poland imported 1-2 thousand tonnes of meat-and-bone meal. In 2005-2010, the imports increased to tens of thousands of tonnes. It was included in the balance of foreign trade, as their use is for purposes other than as feed. Trade in meal is under veterinary super-vision and meal should be used for purposes other than feeding, i.e. as feed for fur animals, a component of dog and cat food, as a component for the production of biogas, for compost, etc. In those years, the Veterinary Inspection checks stated number of cases of unauthorized use in feed for farm animals.

62
Chart 18. Directions of import of high-protein raw materials (thousand tonnes)
Soybean meal Sunflower meal
Fodder legumes Fish meal
Source: Authors' own calculation according to data from CSO, CIHZ and MF.
5.3.�Demand�for�feed�protein�and�its�balance�in�animal�production�Protein is an essential component of animals. It is the main structural
component of cells and tissues of the animals. Proteins include active enzymes in the cells and enzymes produced and secreted in the gastrointestinal lumen. Animals have no ability to synthesize a number of amino acids comprising the protein. Demand for protein is thus in fact the need for exogenous amino acids and endogenous contained in the feed protein. Feed (protein in the feed) is the sole source of exogenous acids and a primary source of endogenous acids, alt-hough they are also synthesized in the body. Their synthesis in the transfor-mation process, as well as the synthesis of other nitrogen compounds, require a constant supply of them and should therefore receive a certain amount of pro-

63
tein. Demand for amino acids (protein) is the sum of demand to cover the exist-ence and production needs48. The quantity and quality of protein in the feed is important in its usefulness and the manner of use in animal nutrition. The quality and nutritional value of feed is determined not only by protein content, but above all by the content of essential amino acids, among which the most im-portant are the limiting amino acids, i.e. those that are the least in the protein in relation to the needs of an animal (mainly lysine and methionine)49.
Transformation of the political system and the resulting transformation of ownership in agriculture and the changing economic conditions of livestock production meant that the domestic demand for feed protein in the 1990s was subject to great changes. After a deep, almost 25% drop from 4.9 to 3.8 million tonnes, which took place in the early years of transition, the global scale in the second half of the 1990s increased to 4.2 million tonnes, and in 2000-2001 de-clined to 4.0 million tonnes.
In the 1990s, breeding cattle and sheep was increasingly losing im-portance in creating demand for feed protein. Due to the decline in demand and low profitability of milk production, and especially cattle and sheep production, there was a reduction in beef and dairy cattle and sheep. The crisis in breeding slaughter cattle increasingly deepened in the second half of the 1990s and was additionally exacerbated by a further drop in demand for beef because of the BSE panic. These factors meant that the demand for feed protein by ruminant animals decreased steadily. In the season 2000/01 it was estimated at about 1.4 million tonnes, while in 1990/91 amounted to nearly 2.5 million tonnes, and in the mid-1990s fluctuated in the range 1.5-1.7 million tonnes. At the beginning of the first decade of 2000s the process of reduction in dairy and slaughter cattle followed, and in the case of dairy cows it takes place even now. However, with the Poland’s accession to the EU and improving profitability, breeding of slaughter cattle is slowly being rebuilt, resulting in increased demand for feed protein, which is still about 40% lower than in the early 1990s.
48 �ywienie zwierz�t i paszoznawstwo (collective work edited by D. Jamroz), vol. I, PWN, Warsaw, 2004, pp. 268-269. 49 �ywienie zwierz�t i paszoznawstwo (collective work edited by D. Jamroz), vol. I, PWN, Warsaw, 2004, p. 55.
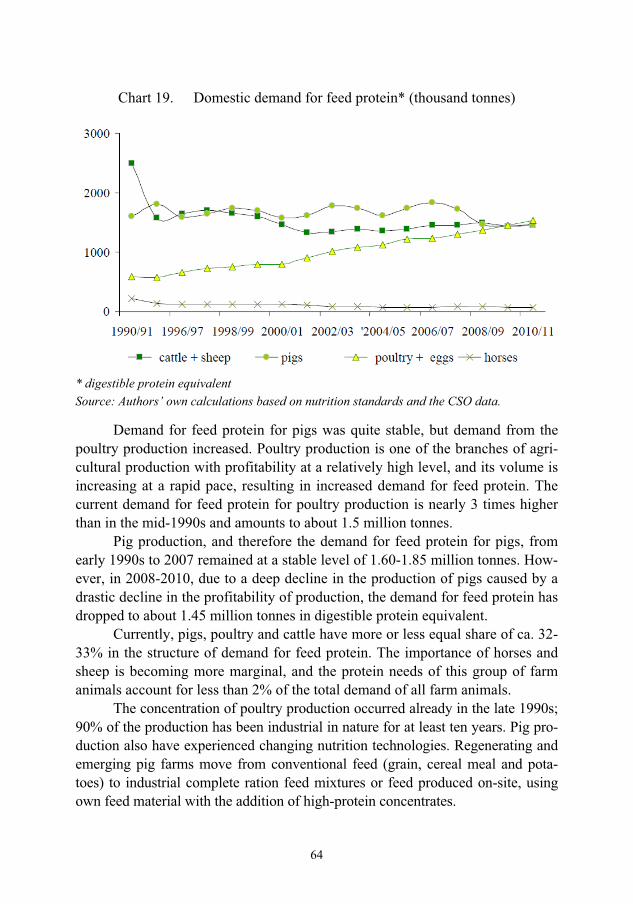
64
Chart 19. Domestic demand for feed protein* (thousand tonnes)
* digestible protein equivalent Source: Authors’ own calculations based on nutrition standards and the CSO data.
Demand for feed protein for pigs was quite stable, but demand from the poultry production increased. Poultry production is one of the branches of agri-cultural production with profitability at a relatively high level, and its volume is increasing at a rapid pace, resulting in increased demand for feed protein. The current demand for feed protein for poultry production is nearly 3 times higher than in the mid-1990s and amounts to about 1.5 million tonnes.
Pig production, and therefore the demand for feed protein for pigs, from early 1990s to 2007 remained at a stable level of 1.60-1.85 million tonnes. How-ever, in 2008-2010, due to a deep decline in the production of pigs caused by a drastic decline in the profitability of production, the demand for feed protein has dropped to about 1.45 million tonnes in digestible protein equivalent.
Currently, pigs, poultry and cattle have more or less equal share of ca. 32-33% in the structure of demand for feed protein. The importance of horses and sheep is becoming more marginal, and the protein needs of this group of farm animals account for less than 2% of the total demand of all farm animals.
The concentration of poultry production occurred already in the late 1990s; 90% of the production has been industrial in nature for at least ten years. Pig pro-duction also have experienced changing nutrition technologies. Regenerating and emerging pig farms move from conventional feed (grain, cereal meal and pota-toes) to industrial complete ration feed mixtures or feed produced on-site, using own feed material with the addition of high-protein concentrates.
65
Along with the changes and transformations of animal production there were adjustment processes taking place in the production and supply of feed. This period was characterized by increase in area of rapeseed cultivation and production, which took place principally at the expense of reduced forage crop area in the field cultivation (potatoes), and after the accession also at the expense of the cereals and sugar beet. After 2004, these processes intensified as a result of the introduction of new market regulations and payment systems, and, in the case of rapeseed, due to significant increase in demand for biofuels. In addition, the growing, along with the increase in concentration of pig herds and poultry, changes in nutrition technology lead to limited grazing of livestock feed, includ-ing potatoes and reduction in their crop acreage.
In comparison with the beginning of the 1990s, there was a significant in-crease in the proportion of protein obtained from concentrate feeds in the total production of fodder protein from about 40% to 52-53% at the beginning of 2000s, and 62-63% in recent years, and a corresponding reduction in the share of protein production from roughage. However, the structure of production of concentrate feeds calculated in protein equivalent changed only to a small ex-tent. Although the share of high-protein feed in the production of this feed in-creased from 13% to about 20% (including the share of rapeseed meal from 8% to 19%), but still the dominant position is occupied by raw cereal (80%), result-ing in low concentration of protein in concentrate feeds (about 10% in digestible protein equivalent).
A comparison of the domestic demand for fodder protein and its supply (resources) shows that in the 1990s the balance was generally stable. Coverage of demand measured by the ratio of digestible protein resources and demand in all years, except for the year 1990/91, was above 100%, and in some years the resources exceeded demand by 7-8%. The overall picture, however, hides signif-icant disparities, if one takes into account the nutritional needs of different spe-cies of farm animals and the availability of digestible protein to meet those needs. This conclusion follows from the results of a simplified comparison of digestible protein requirements of ruminants with its resources from the produc-tion of roughage on the one hand, and the demand for protein from pigs and poultry with its resources from concentrate feeds on the other50.
50 These considerations, out of necessity, use the results of a very simplified calculation, be-cause there is no reliable information on the various types of feed fed in the breeding of par-ticular species.

66
Table 16. Demand for digestible feed protein and degree of coverage by groups of livestock (thousand tonnes and %)*
Description 1990/91 1995/96 2000/01 2001/02
-2003/04
2004/05-
2006/07
2007/08-
2009/10
Total demand
4903 4092 3975 4153 4393 4457Total resources of pro-tein
4865 4368 3837 3996 4018 4455
Coverage in % 99.2 106.8 96.5 96.4 91.9 100.0Cattle + sheep 2494 1573 1471 1353 1397 1461Resources of roughag-es
2905 2146 1814 1724 1574 1709
Coverage in % 116.5 136.4 123.3 127.5 113.1 117.0Pig + poultry 2193 2380 2378 2712 2924 2920Production of concen-trate feeds
1910 1744 1395 1622 1699 1953
Resources of roughag-es
1960 2223 2022 2272 2444 2746
Coverage by produc-tion
87.1 73.3 58.7 60.1 58.6 67.0
Coverage by re-sources in % 89.4 93.4 85.1 84.1 84.0 94.1Net imports 49 479 627 650 745 793 including cereal feeds -5 80 109 38 17 42high-protein 54 399 519 612 729 751*calculations included in the table were carried out in digestible protein equivalent Source: Authors' own calculation according to CSO data.
Both in the 1990s and in the first decade of the twenty-first century, there were no major problems with covering protein requirements of ruminant animals, i.e. dairy and beef cattle and sheep. On the contrary, the available resources of digestible protein obtained from on-farm produced roughage, even if one takes into account the feeding of horses, has covered the nutritional needs of ruminants with a sizeable surplus.
The situation is different for the rearing of pigs and poultry. Production of feed protein resources in relation to the demand are in permanent shortage. Data in table 16 indicate that, depending on the production results obtained in differ-ent seasons, the coverage of demand of pig and poultry with production of pro-tein from concentrates in the late 1990s and in the period before accession amounted to 68-73%, and the coverage of concentrate feed supply from domes-
67
tic production and imports was about 85%. In recent years, the situation in this respect has improved slightly, but still there are shortages of feed protein in an-imal nutrition.
Since the late 1990s production of poultry and eggs uses balanced indus-trial mixes, also in terms of protein requirements. The production of pig, despite progressing, but very slowly, concentration processes, is still fragmented and conducted based on farm feed, low in protein. So the problem of protein defi-ciency occurs in particular in pig nutrition, and in spite of rising imports of high-protein animal feed the shortages are permanent. Steadily growing imports of high-protein animal feed is mainly to meet the demand of poultry and eggs pro-duction, and in fact mainly the needs of industrial food producer for this type of production.
Due to the fact that the significant part of protein resources from concen-trate feeds, sourced mainly from cereals and products of milling, is used in the feeding of cattle (mainly dairy), sheep and horses, deficiencies of protein in nu-trition of pigs, in fact, are probably much greater than showed by the simplified calculation. This has a certain negative impact on breeding inefficiency and un-satisfactory quality of meat obtained in this production system.
5.4.�Consumption�of�high�protein�raw�materials�Along with the desire to improve the efficiency of breeding and increased
poultry production, there is a growing demand for high-protein raw materials. Their consumption compared with the beginning of the last decade has increased by more than 80%, and in relation to mid-1990s the increase was more than dou-ble. Average annual rate of growth during the period was 5.2%.
The share of high-protein components in the consumption of concentrate feeds increased from just over 8% in the mid-1990s to 15-16% during the last three years. During this period, consumption of cereal feed materials in animal production increased by only 9%, with an average annual rate of growth of 0.6%.
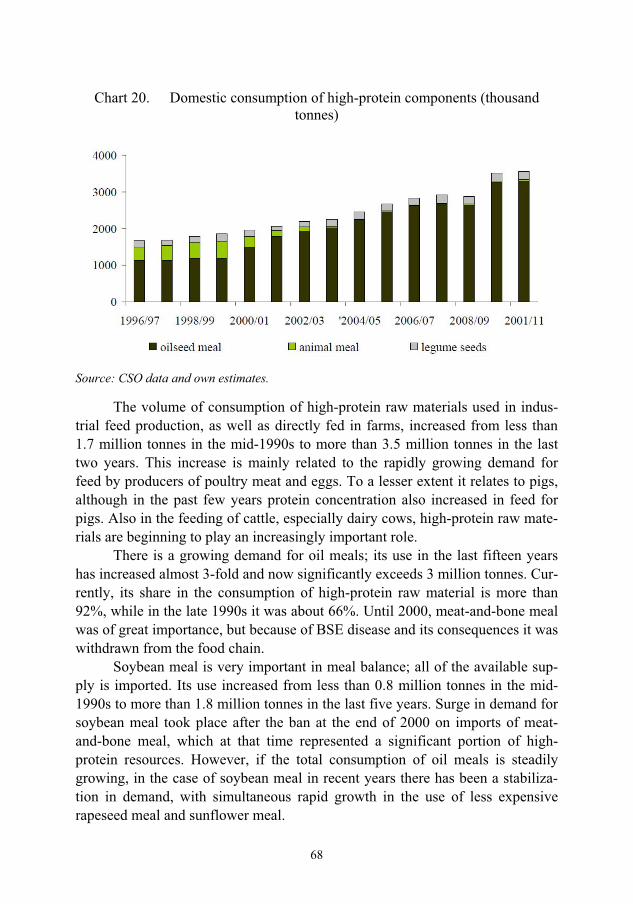
68
Chart 20. Domestic consumption of high-protein components (thousand tonnes)
Source: CSO data and own estimates.
The volume of consumption of high-protein raw materials used in indus-trial feed production, as well as directly fed in farms, increased from less than 1.7 million tonnes in the mid-1990s to more than 3.5 million tonnes in the last two years. This increase is mainly related to the rapidly growing demand for feed by producers of poultry meat and eggs. To a lesser extent it relates to pigs, although in the past few years protein concentration also increased in feed for pigs. Also in the feeding of cattle, especially dairy cows, high-protein raw mate-rials are beginning to play an increasingly important role.
There is a growing demand for oil meals; its use in the last fifteen years has increased almost 3-fold and now significantly exceeds 3 million tonnes. Cur-rently, its share in the consumption of high-protein raw material is more than 92%, while in the late 1990s it was about 66%. Until 2000, meat-and-bone meal was of great importance, but because of BSE disease and its consequences it was withdrawn from the food chain.
Soybean meal is very important in meal balance; all of the available sup-ply is imported. Its use increased from less than 0.8 million tonnes in the mid-1990s to more than 1.8 million tonnes in the last five years. Surge in demand for soybean meal took place after the ban at the end of 2000 on imports of meat-and-bone meal, which at that time represented a significant portion of high-protein resources. However, if the total consumption of oil meals is steadily growing, in the case of soybean meal in recent years there has been a stabiliza-tion in demand, with simultaneous rapid growth in the use of less expensive rapeseed meal and sunflower meal.
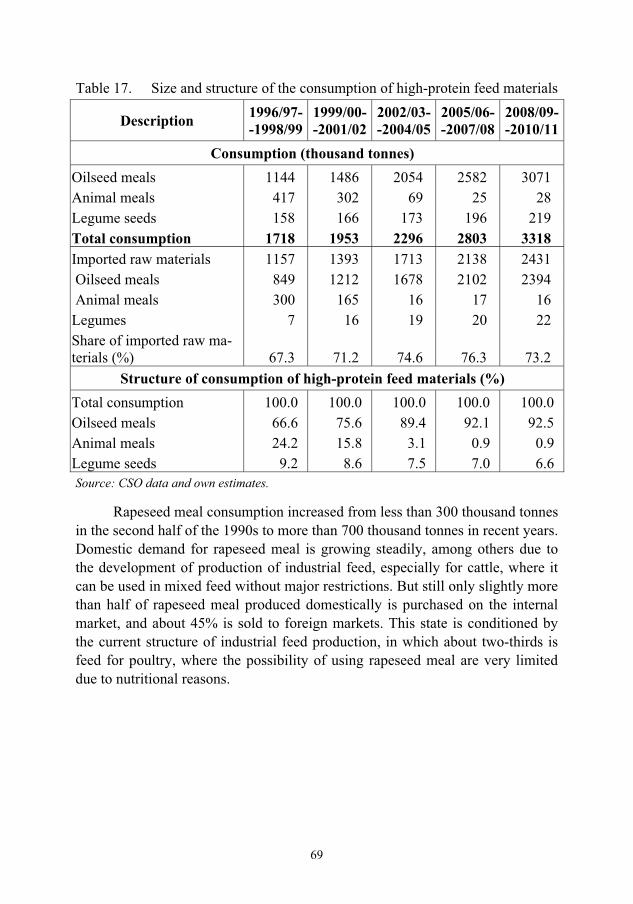
69
Table 17. Size and structure of the consumption of high-protein feed materials
Description 1996/97--1998/99
1999/00--2001/02
2002/03--2004/05
2005/06--2007/08
2008/09--2010/11
Consumption (thousand tonnes) Oilseed meals 1144 1486 2054 2582 3071 Animal meals 417 302 69 25 28 Legume seeds 158 166 173 196 219 Total consumption 1718 1953 2296 2803 3318 Imported raw materials 1157 1393 1713 2138 2431 Oilseed meals 849 1212 1678 2102 2394 Animal meals 300 165 16 17 16 Legumes 7 16 19 20 22 Share of imported raw ma-terials (%) 67.3 71.2 74.6 76.3 73.2
Structure of consumption of high-protein feed materials (%) Total consumption 100.0 100.0 100.0 100.0 100.0 Oilseed meals 66.6 75.6 89.4 92.1 92.5 Animal meals 24.2 15.8 3.1 0.9 0.9 Legume seeds 9.2 8.6 7.5 7.0 6.6 Source: CSO data and own estimates.
Rapeseed meal consumption increased from less than 300 thousand tonnes in the second half of the 1990s to more than 700 thousand tonnes in recent years. Domestic demand for rapeseed meal is growing steadily, among others due to the development of production of industrial feed, especially for cattle, where it can be used in mixed feed without major restrictions. But still only slightly more than half of rapeseed meal produced domestically is purchased on the internal market, and about 45% is sold to foreign markets. This state is conditioned by the current structure of industrial feed production, in which about two-thirds is feed for poultry, where the possibility of using rapeseed meal are very limited due to nutritional reasons.
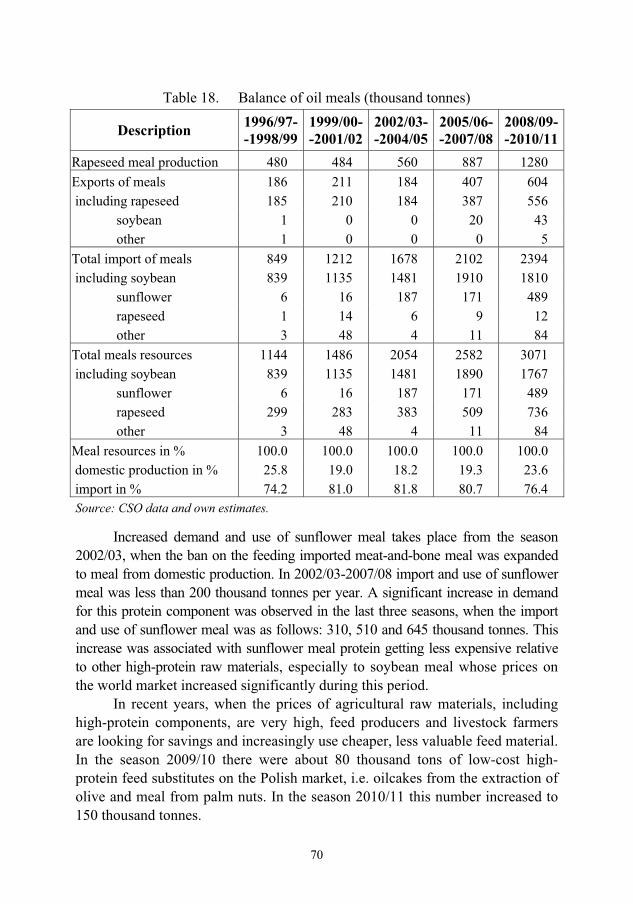
70
Table 18. Balance of oil meals (thousand tonnes)
Description 1996/97--1998/99
1999/00--2001/02
2002/03--2004/05
2005/06--2007/08
2008/09--2010/11
Rapeseed meal production 480 484 560 887 1280 Exports of meals 186 211 184 407 604 including rapeseed 185 210 184 387 556
soybean 1 0 0 20 43 other 1 0 0 0 5
Total import of meals 849 1212 1678 2102 2394 including soybean 839 1135 1481 1910 1810
sunflower 6 16 187 171 489 rapeseed 1 14 6 9 12 other 3 48 4 11 84
Total meals resources 1144 1486 2054 2582 3071 including soybean 839 1135 1481 1890 1767
sunflower 6 16 187 171 489 rapeseed 299 283 383 509 736 other 3 48 4 11 84
Meal resources in % 100.0 100.0 100.0 100.0 100.0 domestic production in % 25.8 19.0 18.2 19.3 23.6 import in % 74.2 81.0 81.8 80.7 76.4 Source: CSO data and own estimates.
Increased demand and use of sunflower meal takes place from the season 2002/03, when the ban on the feeding imported meat-and-bone meal was expanded to meal from domestic production. In 2002/03-2007/08 import and use of sunflower meal was less than 200 thousand tonnes per year. A significant increase in demand for this protein component was observed in the last three seasons, when the import and use of sunflower meal was as follows: 310, 510 and 645 thousand tonnes. This increase was associated with sunflower meal protein getting less expensive relative to other high-protein raw materials, especially to soybean meal whose prices on the world market increased significantly during this period.
In recent years, when the prices of agricultural raw materials, including high-protein components, are very high, feed producers and livestock farmers are looking for savings and increasingly use cheaper, less valuable feed material. In the season 2009/10 there were about 80 thousand tons of low-cost high-protein feed substitutes on the Polish market, i.e. oilcakes from the extraction of olive and meal from palm nuts. In the season 2010/11 this number increased to 150 thousand tonnes.

71
Above considerations are reflected in changes in the consumption of oil meals, consisting in share of soybean meal reduced to about 58%, and the grow-ing importance of rapeseed and sunflower meal.
Since 2003, meat-and-bone meal cannot be used in livestock feed and on-ly fish meal can be a component of animal feed. Since then, animal meal is of marginal importance (less than 1%) in the balance of high-protein raw materials.
Table 19. Structure of oil meals consumption (%)
Description 1996/97--1998/99
1999/00--2001/02
2002/03--2004/05
2005/06--2007/08
2008/09--2010/11
Total consumption 100.0 100.0 100.0 100.0 100.0 including soybean 73.3 76.1 72.1 73.3 57.9
rapeseed 26.2 19.6 18.6 19.7 24.0 sunflower 0.5 1.1 9.1 6.6 15.6 other 0.0 3.2 0.1 0.4 2.4
Source: CSO data and own estimates.
Table 20. Balance of animal meals (thousand tonnes)
Description 1996/97--1998/99
1999/00--2001/02
2002/03--2004/05
2005/06--2007/08
2008/09--2010/11
Production 132.2 146.6 63.0 17.7 18.0 including meat-and-bone 111.3 132.5 46.7 0.0 0.0 fish 20.9 14.1 16.3 17.7 18.0 Export 16.0 9.7 9.9 9.3 4.6 including meat-and-bone 1.3 0.9 0.0 0.0 0.0 fish 14.7 8.8 9.9 9.3 4.6 Total imports of meal 300.3 165.2 16.1 16.7 15.7 including meat-and-bone 298.5 153.5 0.0 0.0 0.0 fish 1.8 11.7 16.1 16.7 15.0 Resources 416.6 302.1 69.2 25.0 28.3 including meat-and-bone 408.5 285.0 46.7 0.0 0.0 fish 8.0 17.1 22.5 25.0 28.3 Resources in % 100.0 100.0 100.0 100.0 100.0 domestic production in % 27.6 55.2 61.6 33.4 44.7 import in % 72.4 44.8 38.4 66.6 55.3 Source: CSO data and own estimates.
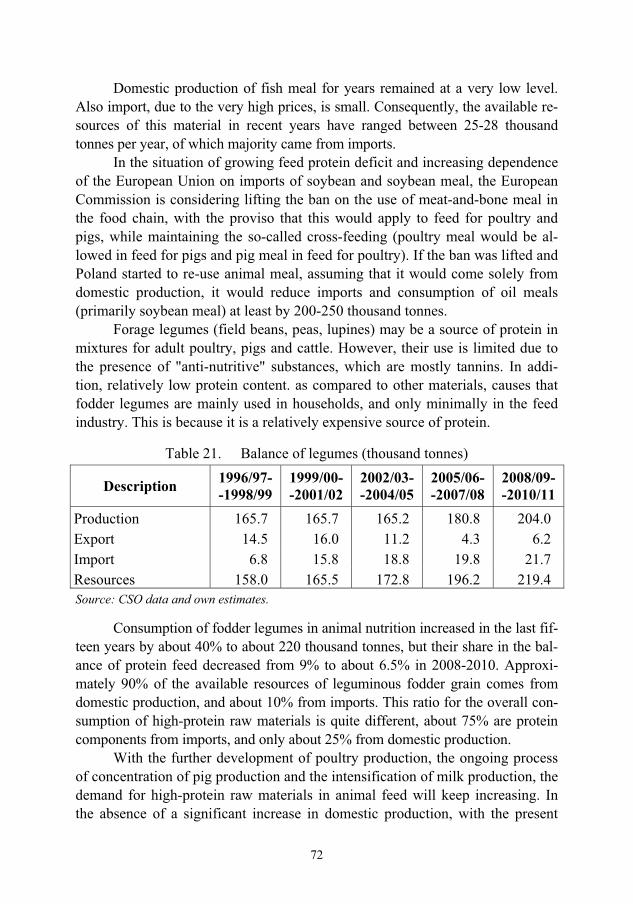
72
Domestic production of fish meal for years remained at a very low level. Also import, due to the very high prices, is small. Consequently, the available re-sources of this material in recent years have ranged between 25-28 thousand tonnes per year, of which majority came from imports.
In the situation of growing feed protein deficit and increasing dependence of the European Union on imports of soybean and soybean meal, the European Commission is considering lifting the ban on the use of meat-and-bone meal in the food chain, with the proviso that this would apply to feed for poultry and pigs, while maintaining the so-called cross-feeding (poultry meal would be al-lowed in feed for pigs and pig meal in feed for poultry). If the ban was lifted and Poland started to re-use animal meal, assuming that it would come solely from domestic production, it would reduce imports and consumption of oil meals (primarily soybean meal) at least by 200-250 thousand tonnes.
Forage legumes (field beans, peas, lupines) may be a source of protein in mixtures for adult poultry, pigs and cattle. However, their use is limited due to the presence of "anti-nutritive" substances, which are mostly tannins. In addi-tion, relatively low protein content. as compared to other materials, causes that fodder legumes are mainly used in households, and only minimally in the feed industry. This is because it is a relatively expensive source of protein.
Table 21. Balance of legumes (thousand tonnes)
Description 1996/97--1998/99
1999/00--2001/02
2002/03--2004/05
2005/06--2007/08
2008/09--2010/11
Production 165.7 165.7 165.2 180.8 204.0 Export 14.5 16.0 11.2 4.3 6.2 Import 6.8 15.8 18.8 19.8 21.7 Resources 158.0 165.5 172.8 196.2 219.4 Source: CSO data and own estimates.
Consumption of fodder legumes in animal nutrition increased in the last fif-teen years by about 40% to about 220 thousand tonnes, but their share in the bal-ance of protein feed decreased from 9% to about 6.5% in 2008-2010. Approxi-mately 90% of the available resources of leguminous fodder grain comes from domestic production, and about 10% from imports. This ratio for the overall con-sumption of high-protein raw materials is quite different, about 75% are protein components from imports, and only about 25% from domestic production.
With the further development of poultry production, the ongoing process of concentration of pig production and the intensification of milk production, the demand for high-protein raw materials in animal feed will keep increasing. In the absence of a significant increase in domestic production, with the present
73
structure of animal production and the industrial feed production adapted to it, the increase in demand for high-protein raw materials will be carried out by growing imports, mainly of soybean meal.

74
6.�Price�trends�in�the�global�and�domestic�market��for�high�protein�raw�materials�
6.1.�Global�market�Prices of high-protein feed material, with some fluctuations caused by
weather problems, over the entire decade of the 1990s and the mid-2000s were stable. World soybean and rapeseed prices fluctuated in the range of 200-300 USD/tonne, only in the mid-1990s and in 2003, due to a severe drought, they increased to more than 300 USD/tonne. Similar trends were observed on the market for soybean meal and rapeseed meal; their prices ranged between 150-220 USD/tonne and 105-150 USE/tonne, and in those adverse years increased to 278 USD/tonne (soybean meal) and 180 USD/tonne (rapeseed meal). Over the analyzed period, the average price of soybean meal was approximately 53% higher than the price of rapeseed meal.
Chart 21. Chain price growth rate of soybean meal, rapeseed meal and fish meal (at the variable base – previous season = 100)
Source: Oil World.
Season 2006/07, and especially 2007/08, brought a strong increase in the price of both oil seeds and meal. This was primarily due to strong growth in de-mand for oil products mainly for processing into biofuels, with a decline in soy-bean production, which has a decisive influence on the supply-demand relation-ship in the world market.
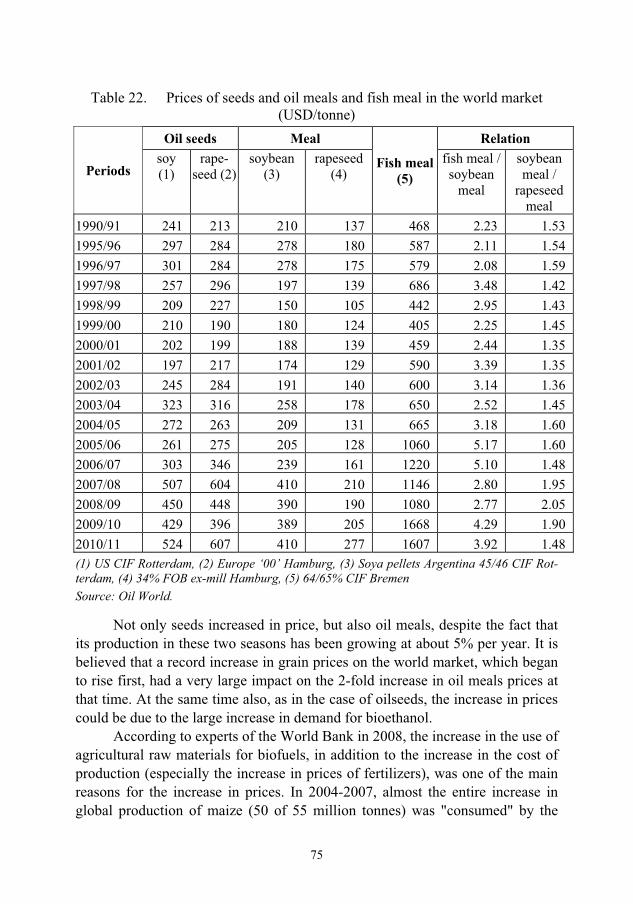
75
Table 22. Prices of seeds and oil meals and fish meal in the world market (USD/tonne)
Periods
Oil seeds Meal
Fish meal (5)
Relation soy (1)
rape-seed (2)
soybean (3)
rapeseed (4)
fish meal / soybean
meal
soybean meal /
rapeseed meal
1990/91 241 213 210 137 468 2.23 1.53 1995/96 297 284 278 180 587 2.11 1.54 1996/97 301 284 278 175 579 2.08 1.59 1997/98 257 296 197 139 686 3.48 1.42 1998/99 209 227 150 105 442 2.95 1.43 1999/00 210 190 180 124 405 2.25 1.45 2000/01 202 199 188 139 459 2.44 1.35 2001/02 197 217 174 129 590 3.39 1.35 2002/03 245 284 191 140 600 3.14 1.36 2003/04 323 316 258 178 650 2.52 1.45 2004/05 272 263 209 131 665 3.18 1.60 2005/06 261 275 205 128 1060 5.17 1.60 2006/07 303 346 239 161 1220 5.10 1.48 2007/08 507 604 410 210 1146 2.80 1.95 2008/09 450 448 390 190 1080 2.77 2.05 2009/10 429 396 389 205 1668 4.29 1.90 2010/11 524 607 410 277 1607 3.92 1.48 (1) US CIF Rotterdam, (2) Europe ‘00’ Hamburg, (3) Soya pellets Argentina 45/46 CIF Rot-terdam, (4) 34% FOB ex-mill Hamburg, (5) 64/65% CIF Bremen Source: Oil World.
Not only seeds increased in price, but also oil meals, despite the fact that its production in these two seasons has been growing at about 5% per year. It is believed that a record increase in grain prices on the world market, which began to rise first, had a very large impact on the 2-fold increase in oil meals prices at that time. At the same time also, as in the case of oilseeds, the increase in prices could be due to the large increase in demand for bioethanol.
According to experts of the World Bank in 2008, the increase in the use of agricultural raw materials for biofuels, in addition to the increase in the cost of production (especially the increase in prices of fertilizers), was one of the main reasons for the increase in prices. In 2004-2007, almost the entire increase in global production of maize (50 of 55 million tonnes) was "consumed" by the

76
increase in biofuels production in the United States. The increase in consump-tion for other purposes, mainly for food (about 27 million tonnes), significantly reduced inventories, and as a consequence there was a 2-fold increase in maize prices. During this period the increase in world production of vegetable oils in one-third was used in the production of biofuels, and in two-thirds allocated for consumption purposes. Increased demand for bioethanol increased maize crop acreage at the expense of soybean, as a consequence, in the season 2007/08 there was a decrease in its production by more than 7% and price increased by 80%. At the same time, there was a speculative rise in prices of raw materials in the global financial markets, including that of agricultural raw materials, for which the "medium" was tension on the market caused by biofuels.
Chart 22. Chain price growth rate of soybean meal, rapeseed meal and fish meal (fixed basis - 1990-1991 = 100)
Source: Oil World.
In 2008-2010, the growth rate of demand for oilseeds and cereals for bio-fuel production was high, not only in the EU and the USA, but also in South America and China. This was conducive to maintaining the high level of prices of agricultural products, including oil meals.
Fish meal was also characterized by strong price fluctuations during the period. There did not always coincide with fluctuations in vegetable protein ma-terials, and the amplitude was similar to that in the case of fluctuations in the price of oil meals, except that the production, in contrast to the meal, systemati-cally decreased. The strong increase in the price of fish meal took place a year earlier than it was in the case of oilseeds and cereals. In 2005/06-2006/07 its prices significantly exceeded USD 1,000/tonne, and the ratio of fish meal price

77
to soybean meal price stood at 5:1, while in previous years it was approximately 2.5:1. In 2007/08-2008/09 the prices stabilized, and then slightly declined, but the level was still above USD 1,000/tonne. Since the beginning of 2009, once again there was a sharp increase in the price of this protein component, in some months it even exceeded USD 1,800/tonne. In the last two seasons, the average level of prices of fish meal exceed 1600 USD/tonne and it was four times more expensive than soybean meal.
Fish meal is by far the most expensive high-protein component used in the production of animal feed, and also its price increase was much larger than that of oil meals in the analyzed period. The current level of prices of soybean meal and rape-seed meal in the world market is approximately 2-fold higher than in the 1990s, and fish meal prices have risen during that time 3-3.5-fold.
As can be seen from the correlation analysis, the increase in world prices of oil meals and fish meal could be affected by a number of statistically signifi-cant factors. A very strong correlation was shown between the prices of oilseeds and prices of meal (R2> 0.92), despite the fact that in the production of oil, meal is obtained as a by-product, several times cheaper than oil. This relationship was observed for the price of soybean meal and rapeseed meal, as well as fish meal.
The analysis shows a positive correlation of the increase in the prices of meal with its production, which seems to be confusing, because the increase in production should result in lower prices, and the situation was reversed. This means that the global increase in the production of meal did not compensate the factors that influenced prices more strongly than supply. In the case of fishmeal there was a statistically significant negative correlation between the price and the changes in its production.
World prices of high-protein raw materials were significantly correlated with changes in their consumption, as well as with changes in the global produc-tion of pigs and poultry. A very strong relationship was also observed between prices of oil meals and the prices of cereals, especially maize in the world mar-ket. It is fully understandable, because meal is an essential component of animal feed used in animal nutrition, and to a large extent it is a substitute of maize. Al-so, the analysis of correlation between the prices of meal and increasing produc-tion of biofuels has confirmed very strong dependencies between them. Statisti-cal dependencies between world prices of fish meal and determining factors for its growth in the majority of cases are very similar to those of oil meals.
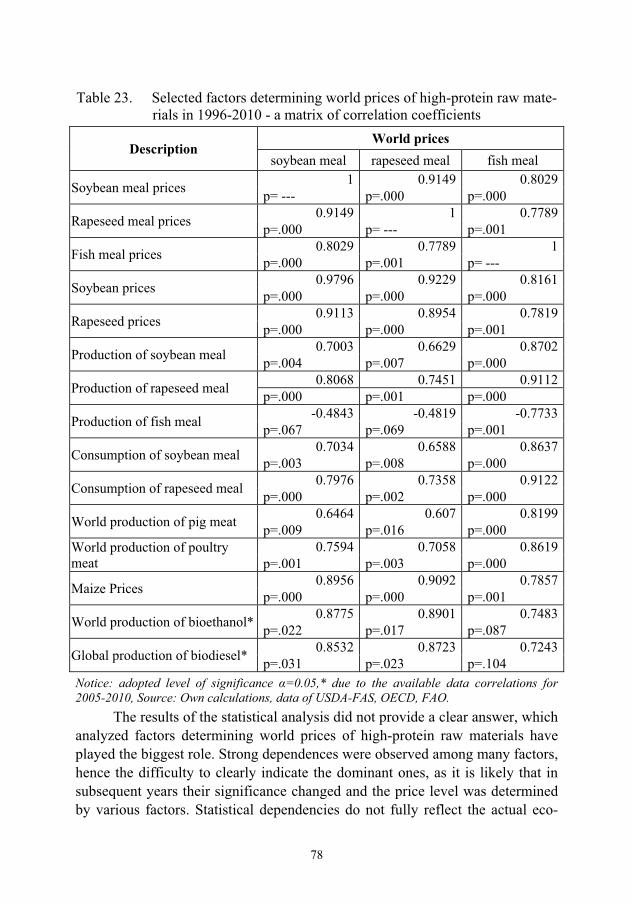
78
Table 23. Selected factors determining world prices of high-protein raw mate-rials in 1996-2010 - a matrix of correlation coefficients
DescriptionWorld prices
soybean meal rapeseed meal fish meal
Soybean meal prices 1 0.9149 0.8029p= --- p=.000 p=.000
Rapeseed meal prices 0.9149 1 0.7789p=.000 p= --- p=.001
Fish meal prices 0.8029 0.7789 1p=.000 p=.001 p= ---
Soybean prices 0.9796 0.9229 0.8161p=.000 p=.000 p=.000
Rapeseed prices 0.9113 0.8954 0.7819p=.000 p=.000 p=.001
Production of soybean meal 0.7003 0.6629 0.8702p=.004 p=.007 p=.000
Production of rapeseed meal 0.8068 0.7451 0.9112p=.000 p=.001 p=.000
Production of fish meal -0.4843 -0.4819 -0.7733p=.067 p=.069 p=.001
Consumption of soybean meal 0.7034 0.6588 0.8637p=.003 p=.008 p=.000
Consumption of rapeseed meal 0.7976 0.7358 0.9122p=.000 p=.002 p=.000
World production of pig meat 0.6464 0.607 0.8199p=.009 p=.016 p=.000
World production of poultry meat
0.7594 0.7058 0.8619p=.001 p=.003 p=.000
Maize Prices 0.8956 0.9092 0.7857p=.000 p=.000 p=.001
World production of bioethanol* 0.8775 0.8901 0.7483p=.022 p=.017 p=.087
Global production of biodiesel* 0.8532 0.8723 0.7243p=.031 p=.023 p=.104
Notice: adopted level of significance �=0.05,* due to the available data correlations for 2005-2010, Source: Own calculations, data of USDA-FAS, OECD, FAO.
The results of the statistical analysis did not provide a clear answer, which analyzed factors determining world prices of high-protein raw materials have played the biggest role. Strong dependences were observed among many factors, hence the difficulty to clearly indicate the dominant ones, as it is likely that in subsequent years their significance changed and the price level was determined by various factors. Statistical dependencies do not fully reflect the actual eco-
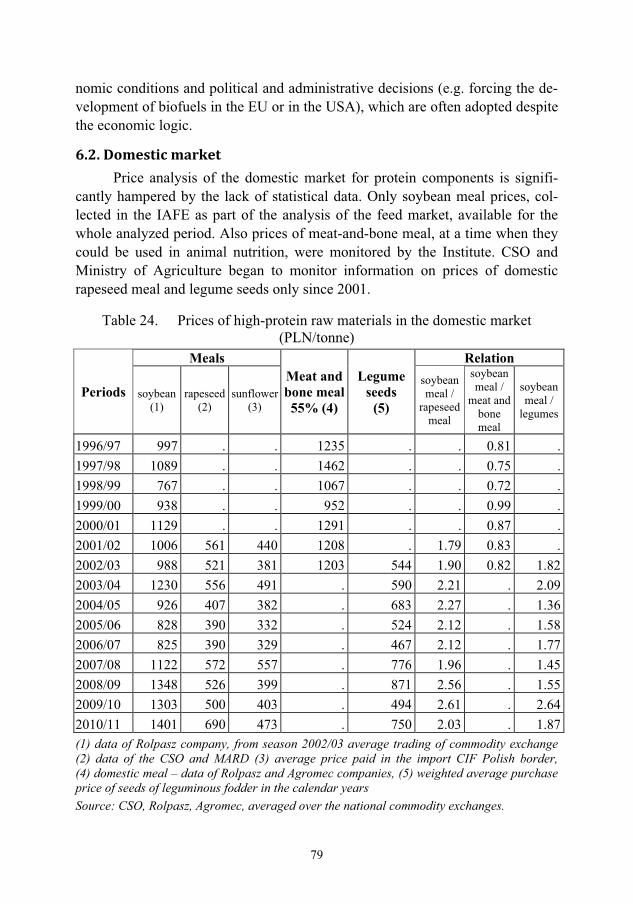
79
nomic conditions and political and administrative decisions (e.g. forcing the de-velopment of biofuels in the EU or in the USA), which are often adopted despite the economic logic.
6.2.�Domestic�market�Price analysis of the domestic market for protein components is signifi-
cantly hampered by the lack of statistical data. Only soybean meal prices, col-lected in the IAFE as part of the analysis of the feed market, available for the whole analyzed period. Also prices of meat-and-bone meal, at a time when they could be used in animal nutrition, were monitored by the Institute. CSO and Ministry of Agriculture began to monitor information on prices of domestic rapeseed meal and legume seeds only since 2001.
Table 24. Prices of high-protein raw materials in the domestic market (PLN/tonne)
Periods
Meals Meat and bone meal55% (4)
Legumeseeds
(5)
Relation
soybean (1)
rapeseed (2)
sunflower(3)
soybean meal /
rapeseed meal
soybean meal /
meat and bone meal
soybean meal /
legumes
1996/97 997 . . 1235 . . 0.81 .1997/98 1089 . . 1462 . . 0.75 .1998/99 767 . . 1067 . . 0.72 .1999/00 938 . . 952 . . 0.99 .2000/01 1129 . . 1291 . . 0.87 .2001/02 1006 561 440 1208 . 1.79 0.83 .2002/03 988 521 381 1203 544 1.90 0.82 1.822003/04 1230 556 491 . 590 2.21 . 2.092004/05 926 407 382 . 683 2.27 . 1.362005/06 828 390 332 . 524 2.12 . 1.582006/07 825 390 329 . 467 2.12 . 1.772007/08 1122 572 557 . 776 1.96 . 1.452008/09 1348 526 399 . 871 2.56 . 1.552009/10 1303 500 403 . 494 2.61 . 2.642010/11 1401 690 473 . 750 2.03 . 1.87(1) data of Rolpasz company, from season 2002/03 average trading of commodity exchange (2) data of the CSO and MARD (3) average price paid in the import CIF Polish border, (4) domestic meal – data of Rolpasz and Agromec companies, (5) weighted average purchase price of seeds of leguminous fodder in the calendar years Source: CSO, Rolpasz, Agromec, averaged over the national commodity exchanges.

80
Trends in high-protein raw material prices in the domestic market were largely in line with the changes in these prices on the world market. Domestic prices of soybean meal, similar to that on the world market, were quite stable in the 1990s and in the first half of the 2000s. The higher price level was recorded in 2000/01, when a ban on meat-and-bone meal imports was introduced, and in the season 2003/04 due to soybean meal getting significantly more expensive on world markets. Clear, almost 40% increase in the price of imported soybean meal took place especially in the last three seasons, the average level rose to about 1350 PLN/tonne, compared to 975 PLN/tonne on average in 1996-2006. Oil meals prices on the world market increased during this period by about 90%. Smaller increase in the price of soybean meal in the domestic market than on the world market was mainly due to a reduction in import costs due to weakening by more than 20% of the value of the dollar against zloty. Moreover, in recent years, because of the crisis, there was a significantly decrease in freight costs, which could also contribute to lower prices of imported raw protein. There is a growing interest in lower-cost substitutes for the dominant soybean meal, espe-cially in sunflower meal, resulting in greater competition in the market for pro-tein components and, consequently, reducing the gross margin of importers and distributors of meal.
Price changes of domestic rapeseed meal were similar to that of soybean meal, but it is at least half cheaper than soybean meal. Its prices in 2001/02-2009/10 ranged between 390-572 PLN/tonne, and in the last season increased to 690 PLN/tonne. Slightly smaller disparities exist between the prices of soybean meal and fodder legume seeds. In 2001-2010 the weighted average purchase price of fodder legume seeds ranged between 470-870 PLN/tonne and was on average 42% cheaper than soybean meal, but about 27% more expensive than rapeseed meal. However, their availability in the market is very small, since the purchase of fodder legumes recorded by CSO is only a few thousand tonnes per year.
The statistical correlation analysis confirmed the significant relationship between oil meals prices on the domestic market and their counterparts in the global market. Despite large exchange rate fluctuations of zloty against the euro and the dollar in recent years, there was no statistically significant effect on the prices of high-protein raw materials in the domestic market.
The cheapest high-protein raw material available in large quantities is the imported sunflower meal. Average prices paid in imports for this meal in 2001-2010, depending on the season, ranged from 329 to 557 PLN/tonne. Taking into account the additional costs associated with the import and distribution of the meal (including the importer margin), it must be assumed that the real price for producers of feed poultry and pigs were 20-25% higher and amounted to 400-
81
700 PLN/tonne. According to OECD forecasts of 2011, within the next ten years, the pro-
duction of oilseeds can be increased by about 17%, oil meals by over 18% and vegetable oils by 26%. It will be linked to the growing demand for vegetable oils used in the production of biofuels, especially biodiesel, whose global vol-ume by 2020 will increase more than 2-fold. In the period 2011-2020 oilseeds prices will be 5-10% higher than the average for 2008-2010, the prices of feed grains will increase by about 5%, while oil meals during this period may get cheaper by 5%. This means that feed material prices will remain at very high levels, nearly 100% higher than in the 1990s and in the first decade of the 2000s.

82
7.�The�impact�of�changes�in�the�global�markets�of�high�protein�raw�materials�on�the�domestic�market�of�ani�
mal�feed�and�livestock�production�Over the past several years, the world production and consumption of
meal increased by more than 75%, including more than 2-fold increase of soy-bean meal consumption. During this period, the supply of high-protein raw ma-terials of animal protein significantly decreased, because of the limitations of fish meal production and the introduction of ban on the use of meat-and-bone meal in many countries. The share of soybean and soybean meal in the produc-tion, consumption and global trade in high-protein raw materials is getting more dominant.
At the same time, the share of GMOs in the cultivation and production of soybean, and soybean meal as a consequence, which is currently around 80%, is increasing, and with such a high growth rate in a few years non-GM soy will be probably completely pushed out from growing. The share of GMOs in the world exports is higher than production and exceeds 90%.
Developments in the global market, have certain consequences for the Polish market for feed and animal products, as the rising demand for imported high-protein raw materials can be met almost exclusively by GMO soybean meal, because meal produced from traditional seeds is less and less available on the market, and therefore also more expensive. In a situation where GM crops are supported and promoted in many countries of the world (also in Asia), in a few years, non-GM soybean meal may be practically not available in the world trade.
Without imports of high-protein feed materials, which in fifteen years in-creased from 1.35 to 2.60 million tonnes, including soybean meal from 0.8 to 1.8 million tonnes, it would not be possible to develop industrial feed produc-tion, which in turn was the basis of a very dynamic development of poultry pro-duction, which in turn has significantly increased the consumption of poultry meat and multiplied its exports (up to 500 thousand tonnes, which represents approximately 30% of national production).
During 1996-2010 the production of poultry increased 3.3-fold, and the eggs of more than 50%. With high quality of feed balanced in terms of the pro-tein content, it was possible to improve the production efficiency. Optimization of poultry feeding in large farms resulted in a reduction in feed consumption per 1 kg of livestock to 1.7-1.9 kg and shortened production cycle of broiler with the final weight of 2.4 kg to 40 days, while at the beginning of the period it was 2.0
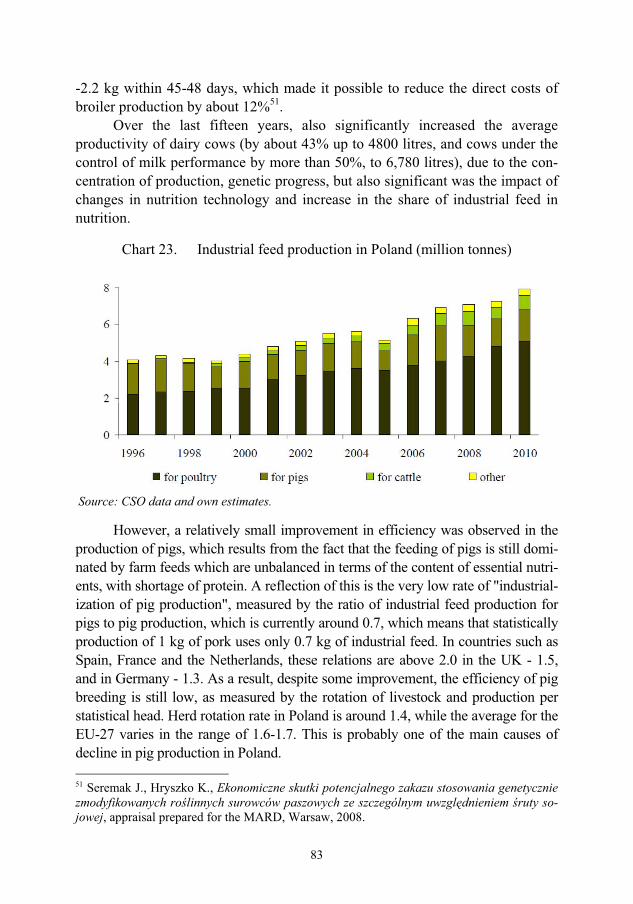
83
-2.2 kg within 45-48 days, which made it possible to reduce the direct costs of broiler production by about 12%51.
Over the last fifteen years, also significantly increased the average productivity of dairy cows (by about 43% up to 4800 litres, and cows under the control of milk performance by more than 50%, to 6,780 litres), due to the con-centration of production, genetic progress, but also significant was the impact of changes in nutrition technology and increase in the share of industrial feed in nutrition.
Chart 23. Industrial feed production in Poland (million tonnes)
Source: CSO data and own estimates.
However, a relatively small improvement in efficiency was observed in the production of pigs, which results from the fact that the feeding of pigs is still domi-nated by farm feeds which are unbalanced in terms of the content of essential nutri-ents, with shortage of protein. A reflection of this is the very low rate of "industrial-ization of pig production", measured by the ratio of industrial feed production for pigs to pig production, which is currently around 0.7, which means that statistically production of 1 kg of pork uses only 0.7 kg of industrial feed. In countries such as Spain, France and the Netherlands, these relations are above 2.0 in the UK - 1.5, and in Germany - 1.3. As a result, despite some improvement, the efficiency of pig breeding is still low, as measured by the rotation of livestock and production per statistical head. Herd rotation rate in Poland is around 1.4, while the average for the EU-27 varies in the range of 1.6-1.7. This is probably one of the main causes of decline in pig production in Poland. 51 Seremak J., Hryszko K., Ekonomiczne skutki potencjalnego zakazu stosowania genetycznie zmodyfikowanych ro�linnych surowców paszowych ze szczególnym uwzgl�dnieniem �ruty so-jowej, appraisal prepared for the MARD, Warsaw, 2008.

84
Table 25. Production of industrial feed (million tonnes)
Product 1996--2000
2001--2005 2006 2007 2008 2009 2010 2011*
Total production 4192 4729 6337 6938 7070 7255 7906 8050for poultry 2392 3184 3777 4032 4263 4807 5118 5300for pigs 1493 1203 1653 1878 1700 1477 1693 1650for cattle 126 313 551 678 756 652 767 780other feeds 181 172 356 350 352 319 328 320
Structure % Total production 100.0 100.0 100.0 100.0 100.0 100.0 100.0 100.0
for poultry 57.1 67.3 59.6 58.1 60.3 66.3 64.7 65.8for pigs 35.6 25.4 26.1 27.1 24.0 20.4 21.4 20.5for cattle 3.0 6.6 8.7 9.8 10.7 9.0 9.7 9.7other feeds 4.3 3.6 5.6 5.0 5.0 4.4 4.1 4.0
* estimation Source: CSO and own estimates.
Compared with the second half of the 1990s, industrial feed production has increased by over 90%, including poultry feed by 122%. However, the vol-ume of feed for pigs is only about 10% higher than in the second half of the 1990s. The most dynamic growth was in the case of feed for cattle, mainly dairy, the volume has increased more than 6-fold, although in comparison with other EU countries, it remains at a relatively low level. As a result, the structure of produced feed significantly changed, currently about 66% is feed for poultry, a little over 20% is feed for pigs, and less than 10% is feed for cattle and about 4% is other feed. This creates a certain impact on the balance of feed protein in Poland.
The dynamic development of the production of poultry meat and eggs, and the strongly correlated increase in production of industrial feed for poultry, causes a very large increase in demand for high-quality, high-protein compo-nents. Genetic progress significantly increased demand for amino acids and en-ergy by chickens. The high content of fibre and anti-nutritive substances in the seeds of legumes, rapeseed meal or sunflower meal, reduces the digestibility of protein, fat and amino acid absorption by hens and broilers. From the point of view of nutrition of broilers and laying hens, from among the high-protein feed material available on a large scale, excluding meat-and-bone meal from the food chain, only soybean meal can be used in feeding without any limitations, and it also provides high efficiency production.
85
Global trade for several years now has been completely dominated by soybean and GM soybean meal. Because Poland does not produce and process soy, all available supply in the domestic market is imported. The analysis carried out previously on imports and the domestic shows that soybean meal imported to Poland by feed companies and traders comes from Argentina, Brazil, Para-guay, USA, and was produced from GM soybean. Also meal imported from the EU is genetically modified, because the EU processes almost exclusively im-ported soybean. Own research shows that currently none of the major producers of industrial feed does not use soybean meal derived from non-genetically modi-fied seeds in mixtures.
The current Feed Law contains a provision on the ban of cultivation and use of genetically modified feed in nutrition, but until the end of 2012 there is a moratorium on its use. This means that if a law is not passed to adjust the regula-tions in this regard to the EU Regulations, then from 1 January 2013 there will be the prohibition of using imported GM soybean meal in animal feeding. In this sit-uation, one should consider the effects of the ban for the feed industry and live-stock production, as well as the real possibilities to mitigate them by substitution with other high-protein components.
7.1.�Rapeseed�feed���post�extraction�meal�and�rapeseed�oilcake�Rapeseed meal and rapeseed oilcake are by-products of processing rape-
seed for oil. After the preliminary pressing the expeller is formed (rapeseed oil-cake), which is then subjected to chemical extraction in order to further recover the oil, and the obtained products include post-extraction rapeseed meal. Some oleochemical plants abandoned chemical extraction and produce rapeseed oil-cake. Also, new oil mills, launched in recent years, producing fatty acid esters for diesel engines, limit themselves to the oil extraction phase, thus producing rapeseed oilcake.
Rapeseed meal contains, according to various sources, 33-35% of total protein. In the case of oilcake, the contents are lower, 28-32% of protein. Rape-seed meal is a fully valuable protein feed and to some extent can be used as a substitute for soybean meal. This is a very good feed for pigs and cattle, and to a limited extent can be used in poultry nutrition. In comparison with the soybean meal, rapeseed feeds contain less lysine amino acid, but a bit more methionine. However, the digestibility of both of these exogenous amino acids is lower than in the case of soybean meal and is 70-75% for rapeseed meal and 90-92% for soybean meal. Rapeseed feed for poultry has excessive fibre content (over 14%), as well glucosinolates, which are antinutritional substances. The high fibre con-tent is a factor which reduces the digestibility of protein, fat and the absorption

86
of amino acids and fatty acids in the small intestine52. Also, glucosinolates im-pair growth and development of chickens. In the case of hens laying eggs with brown shells, the sinapine contained in rapeseed gives yolks a fishy flavour.
Polish rapeseed varieties contain 2.3-fold less glucosinolates than those grown in Western Europe, so our rapeseed meal is a valued component of feed for foreign customers. Currently Poland carries out research on obtaining varieties of rapeseed with yellow seed coats, referred to as 3-nil, with a much lower fibre con-tent. The future introduction of these varieties for cultivation on a large scale will cause that rapeseed meal made from them could be used in poultry nutrition to a greater extent.
It is assumed that the allowed amount of rapeseed meal in feed mixtures for laying hens is 3-4%. Larger quantities of the meal can be used in compound feeds for broilers. According to the National Research Institute of Animal Pro-duction, 4-5% of rapeseed feed in the starter mixtures and 6-8% in grower and finisher mixtures will not have a negative impact on body weight and carcass quality of broilers53.
Rapeseed meal can be used in the feeding of pigs, especially those of more than 30 kg, due to the longer alimentary tract and greater tolerability of the fibres contained in the feed. The nutrition of young pigs should use 10-12% of rapeseed feed in the first period of fattening (50-60 kg) and 16-18% in the sec-ond (60-100 kg)54. The analysis of the literature shows relatively few scientific studies on the use of rapeseed feeds in nutrition of breeding boars and sows, and piglets. Therefore, the recommended dose is lower and in feeding of loose sows should be about 10%, and 3-5% for the piglets.
Rapeseed feeds (post-extraction meal and rapeseed oilcake) can be used in large quantities in the feeding of cattle. According to research conducted at the National Research Institute of Animal Production, replacing soybean meal with rapeseed feed in feeding of cows with a capacity of 6-7 thousand kg of milk re-sulted in similar production effects. Feed mixtures for cattle feed can contain 25-30% of rapeseed feed, and in feed for slaughter cattle as much as 40%. Also sheep and goats can be fed with feed containing high proportion of rapeseed meal. However, the production of feed mixtures for ruminants in Poland is small and represents less than 10% of the total production of industrial feed. Limited replacement of soybean meal with rapeseed meal has been done for a few years,
52 F. Brzóska, Czy istnieje mo�liwo� substytucji bia�ka GMO innymi surowcami bia�kowymi (Cz�� II), Wiadomo�ci Zootechniczne, R. XLVII, 2, 2009, p. 3-11. 53 S. Smulikowska, Warto� pokarmowa i wykorzystanie wyt�oków rzepakowych w �ywieniu drobiu i �wi, National Research Institute of Animal Production, Kraków, 2004, p. 15-23. 54 E. Hanczakowska, Zastosowanie wyt�oków z nasion rzepaku w �ywieniu �wi, Wiadomo�ci Zootechniczne, 44, 3, 2006, p. 38-43.
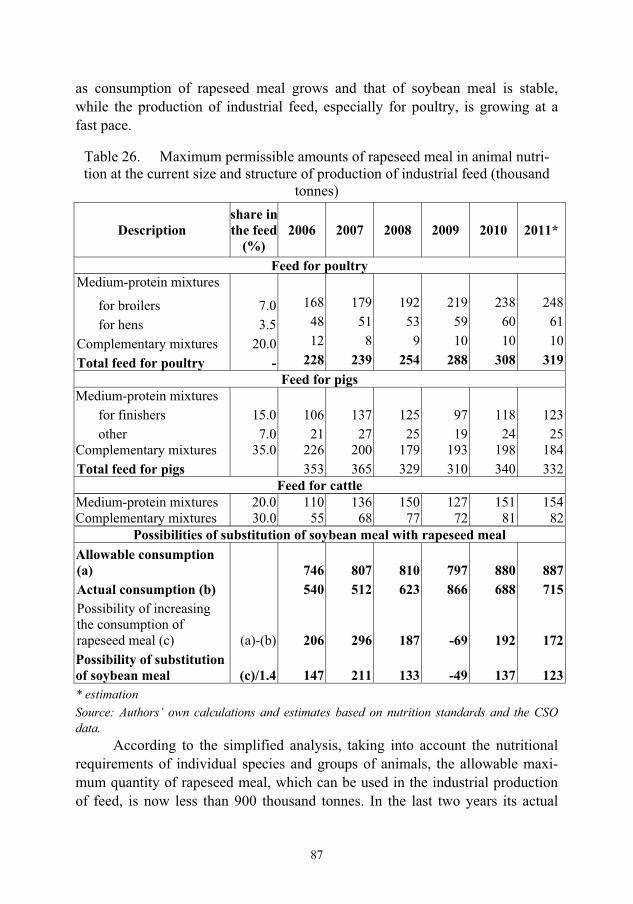
87
as consumption of rapeseed meal grows and that of soybean meal is stable, while the production of industrial feed, especially for poultry, is growing at a fast pace.
Table 26. Maximum permissible amounts of rapeseed meal in animal nutri-tion at the current size and structure of production of industrial feed (thousand
tonnes)
Descriptionshare inthe feed
(%) 2006 2007 2008 2009 2010 2011*
Feed for poultryMedium-protein mixtures
for broilers 7.0 168 179 192 219 238 248for hens 3.5 48 51 53 59 60 61
Complementary mixtures 20.0 12 8 9 10 10 10Total feed for poultry - 228 239 254 288 308 319
Feed for pigs Medium-protein mixtures
for finishers 15.0 106 137 125 97 118 123other 7.0 21 27 25 19 24 25
Complementary mixtures 35.0 226 200 179 193 198 184Total feed for pigs 353 365 329 310 340 332
Feed for cattleMedium-protein mixtures 20.0 110 136 150 127 151 154Complementary mixtures 30.0 55 68 77 72 81 82
Possibilities of substitution of soybean meal with rapeseed mealAllowable consumption (a) 746 807 810 797 880 887Actual consumption (b) 540 512 623 866 688 715Possibility of increasing the consumption of rapeseed meal (c) (a)-(b) 206 296 187 -69 192 172Possibility of substitution of soybean meal (c)/1.4 147 211 133 -49 137 123* estimation Source: Authors’ own calculations and estimates based on nutrition standards and the CSO data.
According to the simplified analysis, taking into account the nutritional requirements of individual species and groups of animals, the allowable maxi-mum quantity of rapeseed meal, which can be used in the industrial production of feed, is now less than 900 thousand tonnes. In the last two years its actual
88
consumption was about 170-190 thousand tonnes lower, so by this volume (170-190 thousand tonnes) one can increase the consumption of rapeseed meal in the feed industry, assuming that rapeseed meal is consumed in its entirety in the feed industry. In this way it would be possible to replace 130-140 thousand tonnes of soybean meal (1.4 kg of rapeseed meal is equivalent to 1 kg of soy-bean meal). Probably some of the rapeseed feed resources, especially oilcakes, goes directly to dairy farmers and pig farmers, and is consumed there ignoring the feed industry. This would mean that the difference between the actual con-sumption of rapeseed meal in the industrial production of feed and the allowable level is higher than shown in the calculations below, and hence the possibilities of substitution of soybean meal with rapeseed feed, arising from that difference, are also higher.
7.2.�Sunflower�meal�Sunflower meal contains approximately 34% of protein, with fibre content
of 17-19%. It is obtained from the seeds of varying degreasing level, hence its nutritional value is variable and highly diverse. Mainly due to the high content of fibre, sunflower meal is characterized by much worse amino acid assimilation than soybean meal. Its share allowed in the compound feeds for poultry and young pigs is relatively small, beyond it production rates decrease. In case of exceeding certain levels in feed for poultry, there may be problems with the health of the birds. As shown by similar calculations as for rapeseed meal taking into account dietary requirements, the permissible maximum amount of sun-flower meal, which can be used in the industrial production of animal feed, is currently around 660 thousand tonnes, or as much as its actual consumption in the last two years. But here it may be the case that some of the resources of sun-flower meal goes directly to dairy and livestock farmers without the feed indus-try.
In addition, according to information coming from the market, sunflower meal can be used as fuel in power plants, although the scale of this use is not sig-nificant. A further increase in the domestic use of sunflower meal for feeding purposes, as in the case of rapeseed feeds, is limited by the current structure of production of industrial feed, in which two-thirds are feeds for poultry.
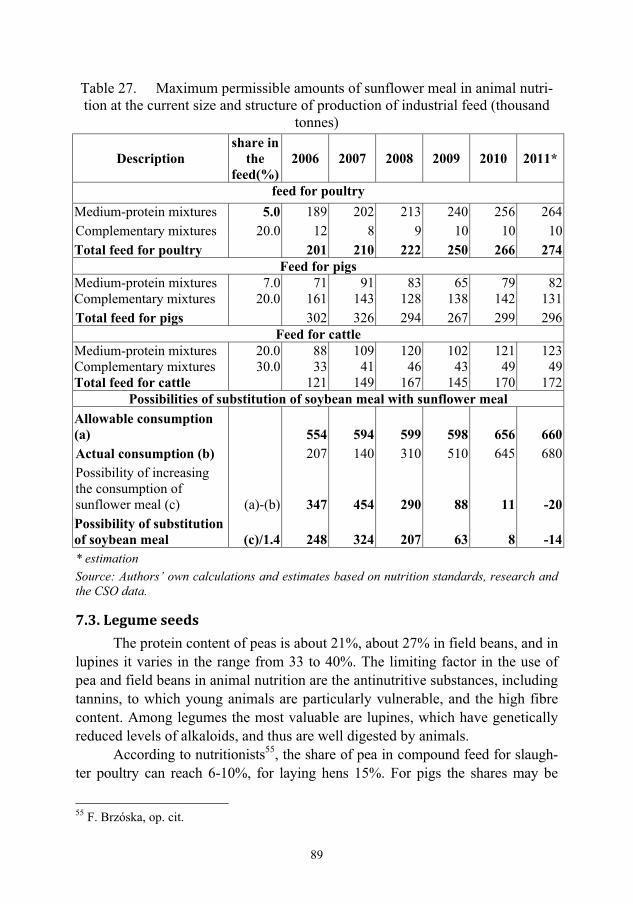
89
Table 27. Maximum permissible amounts of sunflower meal in animal nutri-tion at the current size and structure of production of industrial feed (thousand
tonnes)
Descriptionshare in
thefeed(%)
2006 2007 2008 2009 2010 2011*
feed for poultryMedium-protein mixtures 5.0 189 202 213 240 256 264Complementary mixtures 20.0 12 8 9 10 10 10Total feed for poultry 201 210 222 250 266 274
Feed for pigs Medium-protein mixtures 7.0 71 91 83 65 79 82Complementary mixtures 20.0 161 143 128 138 142 131Total feed for pigs 302 326 294 267 299 296
Feed for cattleMedium-protein mixtures 20.0 88 109 120 102 121 123Complementary mixtures 30.0 33 41 46 43 49 49Total feed for cattle 121 149 167 145 170 172
Possibilities of substitution of soybean meal with sunflower mealAllowable consumption (a) 554 594 599 598 656 660Actual consumption (b) 207 140 310 510 645 680Possibility of increasing the consumption of sunflower meal (c) (a)-(b) 347 454 290 88 11 -20Possibility of substitution of soybean meal (c)/1.4 248 324 207 63 8 -14* estimation Source: Authors’ own calculations and estimates based on nutrition standards, research and the CSO data.
7.3.�Legume�seeds�The protein content of peas is about 21%, about 27% in field beans, and in
lupines it varies in the range from 33 to 40%. The limiting factor in the use of pea and field beans in animal nutrition are the antinutritive substances, including tannins, to which young animals are particularly vulnerable, and the high fibre content. Among legumes the most valuable are lupines, which have genetically reduced levels of alkaloids, and thus are well digested by animals.
According to nutritionists55, the share of pea in compound feed for slaugh-ter poultry can reach 6-10%, for laying hens 15%. For pigs the shares may be
55 F. Brzóska, op. cit.
90
slightly higher: 15-20% for finishers and 10% for sows and boars. Field beans in compound feed may constitute 5-8% for broilers and about 15% for finishers. In the case of lupine, the limitation to its use for monogastric animals is a high fibre content. In mixtures for ruminants, legume seeds may constitute up to 35%.
Majority of about 200 thousand tonnes of fodder legumes produced in re-cent years (about 125 thousand tonnes) were mixtures of cereals and legumes. They can be used in animal feed directly on farms, but they are useless from the point of view of the supply of raw protein to the feed industry, which requires standardized feed material. The production of sweet lupines, field beans and peas on average per year was respectively 51, 12 and 11 thousand tonnes, i.e. a total of about 75 thousand tonnes per year. However, the industrial production of feed consumes only a small part, because most is fed directly on farms.
The main reasons for lack of interest in legume seeds by the feed industry are relatively high prices and relatively low protein content and lower quality than in many other protein materials. Another important limitation is the ability to pro-vide larger supplies with standard parameters, since their production is very frag-mented. The average area under legumes, which are cultivated mainly in small farms, is only 1.7 hectares56 (about 50% of the crops in the farms of the area up to 20 ha). Also buying from many small producers is a cost-intensive project and increases the prices of raw materials.
7.4.�Fish�meal�Fish meal is a very valuable feed material containing 60-70% and more
protein with digestibility of even 95%. This feed is rich in lysine and methio-nine. It is also rich in vitamins, especially of the B group, and many macro-and microelements. According to experts on nutrition57, its content in compound feed for poultry can amount to 2-4%. Exceeding these shares significantly (above 10%) may cause that eggs and meat will taste of fish, which is associated with the accumulation of long-chain fatty acids of fish meal in these products.
The use of fishmeal in feed is limited primarily by economic factors. Its price is very high and in the case of imported meal it currently fluctuates around 5000 PLN/tonne. Domestic meal is a few dozen percent cheaper, but has a lower quality and lower protein content. In addition, the production and supply are steadily shrinking, and thus the price of this protein component will be higher.
56 W. Dzwonkowski, W. �opaciuk, M. Krzemi�ski, Wp�yw uwarunkowa prawnych, ekonomicznych, �rodowiskowych oraz zmian zachodz�cych na rynku �wiatowym na rozwój rynku zbó�, ro�lin oleistych i wysokobia�kowych w Polsce, appraisal prepared for the Ministry of Agriculture and Rural Development, Warsaw, October 2008. 57 F. Brzóska, op. cit.
91
7.5.�Peanut�meal�There is an opinion that any problems with the deficiency of protein in the
situation where the ban on GMOs is introduced, can be solved with the in-creased import of peanut meal. Indeed, peanut meal has similar parameters to soybean meal. It contains 43-47% of highly digestible protein but less important amino acids.
Its share in compound feed for laying hens may be 15-20%, and 15-30% for slaughter chickens. Slightly smaller amounts of this meal can be used in feed for pigs: 6-8% in mixtures for piglets, 8-10% for finishers and 12-14%
However, the basic problem is the low availability on the market. World production of peanut meal in recent years amounted to about 6 million tonnes, of which nearly 80% was produced and consumed in China and India. Global trade in this meal is very small and steadily shrinking. In the last three years, global ex-port of peanut meal was slightly above 100 thousand tonnes.
7.6.�Maize�gluten�Maize gluten can be a valuable substitute for soybean meal; it may contain
60% or more of highly digestible protein. It also has a high content of lysine and methionine. However, the supply of the domestic market is at most tens of thou-sands of tonnes, mainly from imports, and the price stands at about 3000 PLN/tonne. It can be used in the feeding of pigs and poultry, and is a valuable source of protein, especially for cows with the highest milk yield.
7.7.�Soybean�meal�from�conventional�seed�It would be best, in terms of nutritional requirements and from the point
of view of organizational solutions in the production of industrial feed and in animal production, to replace GM soybean meal with the equivalent produced from conventional seed. But non-GMO meal prices are now much higher, and the availability smaller. According to the information received from companies involved in the import of high-protein raw materials, non-GMO meal prices are now about 300 PLN/tonne, i.e. about 20-25% higher than that of GM meal, and interest in the purchase is minimum. While GM soybean meal is available on the market without limitation, in the case of non-GMO meal deliveries are carried out over a longer period and on request.
7.8.�Assessment�of�the�possible�substitution�As is clear from the review of the availability, nutritional values and pric-
es of the major high-protein raw materials, the possible ban on the import of GM meal, apart from the legal aspect, gives very limited possibilities of its substitu-tion with other components in animal nutrition, especially with the use of indus-
92
trial feed. The greatest potential for substitution is in feed for finishers in the second phase of breeding and for cattle, and only to a small extent it is possible in compound feed for slaughter poultry and laying hens and piglets and weaners. In terms of nutritional value, it is not possible to replace soybean meal with leg-ume meal, sunflower meal or rapeseed meal in feed for broilers and piglets and weaners – here, only gluten and feed of animal origin may be substitutes (fish meal, dried milk or dried whey) in which 1 kg of protein contained therein is 2-2.5 times more expensive than in the soybean meal. Furthermore, they are com-mercially available in small quantities.
Substitution of soybean meal with other raw protein can result in signifi-cant deterioration of the production effects and lowering feed efficiency, due to the deterioration in its quality. One should keep in mind that due to the high ge-netic progress it was possible to significantly shorten the production cycle and reduce the consumption of feed per kg of produced livestock and eggs. Howev-er, currently because of that, both broiler chickens and laying hens have much higher nutritional requirements than 15-20 years ago. It is also one of the factors that significantly reduces the possibility of eliminating soybean meal from their diet. This may result in increased costs of production and prices of industrial feed, which in turn will affect the higher production costs of livestock, eggs and milk.
As can be seen from the calculations, in case of replacing GM soybean meal with more expensive non-GM soybean meal in mixtures for broiler chick-ens, with the current conditions the increase in the costs of feed material used will be about 7%. A large increase in demand for non-GMO meal will increase its prices. Assuming that the difference in prices between GM and non-GM meal will increase to 30-40% from the current 20%, the increase in the cost of pro-ducing the mixture will increase by 10-13.5%. If the calculation takes into ac-count the fact that costs of raw materials represent only a portion of the cost of producing a mixture (70-75%), then it turns out that the increase in the price of soybean meal by 20-40% will translate into an increase in prices of produced mixture by 5-11%. The larger increase in prices will occur if soybean meal is replaced with other high-protein raw materials. Substitution of soybean with maize gluten and fish meal results in the cost of consumed raw material in-creased by 26%, and of the mixture itself by more than 20% (Annex 1).
Similar calculations of changes in the cost of feed for laying hens show that the price increase of raw material used and the increase in feed prices are smaller than in the case of feed for broilers. Substitution of GM meal with traditional soy-bean meal results in price increase of raw material by 4-7% and of feed by 3-6%. If substitution is made with the use of other raw protein, the raw material prices increase by 15-26%, and prices of prepared feeds by 11-20% (Annex 2).
93
Feeding pigs in Poland is mainly based on farm prepared feeds made with purchased concentrates. As can be seen from the calculations of changes in the cost of production of Provita concentrate, replacing GM soybean meal with more expensive non-GMO soybean meal will increase its production costs by 3-10%. However, the cost of pig production, based on concentrate which is more expensive due to substitution with non-GMO meal, will increase by 1-3% (An-nex 3).
Although Poland is a very competitive producer of broilers in the EU, the estimated increase in production costs due to GM feed ban will significantly re-duce our competitiveness in price and cost, especially that no other Member State prohibits the use of GMO soybean. One should therefore expect limitations in exports and the influx of imported poultry and, consequently, decrease in the production of poultry and bankruptcy of some farms. Similar situation pertains to egg production, especially since the prices of eggs in Poland are higher than in many Member States. The consequence may be not only the inhibition of the dynamic development of poultry industry, but even a considerable decline in production.
With regard to pigs, the ban on GM feeds may also worsen the already low profitability and production efficiency in Poland, which is already less com-petitive, which is reflected in the decline in pork production and increasing im-ports.
In this situation, so as not to lead to a significant deterioration of the pro-duction results and the collapse of farms producing eggs, chicken and turkey broilers, and in order not to increase the cost of pig production, the minimum import of soybean meal should be about 1.5 million tonnes.
Any administrative ban on GM feed would be unambiguously negative. It would generate an increase in production costs and decrease in agricultural in-come in important branches of agricultural production. It may be the cause of a crisis call in poultry industry. This prohibition, contributing to the deterioration of the competitiveness of the feed industry and the important branches of agri-cultural production, would be ineffective in protecting consumers against eating food produced with feed made of GM plants. The absence of such prohibition in other Member States makes it impossible to enforce the ban on imported food produced on the basis of GM feed, including increasing amounts of imported pork.
94
Summary�� Biotechnology is the fastest growing field of science in the last few years,
covering many topics and applications. Since 1996, it has also contributed to agriculture, which began to use genetically modified plants. The benefits of the use of such plants, particularly in countries with lower economic devel-opment, meant that these countries have become important exporters of agri-cultural products, and in practice GM crops in many cases replace the use of traditional technology. This results in changes not only in domestic markets but also significantly affects the global situation of many agricultural prod-ucts, especially high-protein raw materials. In 2010, the global GM plant crops occupied about 10% of the world's agricultural land, including over 80% of soybean were GM varieties.
� The proposal of the European Commission to allow Member States to estab-lish GMO free zones will not currently affect the supply and demand situation in the sourcing of raw materials and production of high-protein feeds. This is because no GM plants that can be used for the production of such feeds (soy-bean and rapeseed) are allowed to grow within the Community. Applications for such permits are only in a preliminary assessment by the EU, and taking into account the duration of the procedure it can take place in a few years. Provided, however, that both rapeseed and soybean could be grown already, also in this case the possible ban on the use of modified seeds would have limited negative effects for the market of high-protein feed and for improving its balance. Any losses would be incurred mainly by farmers who would be less competitive in the market due to loss of increase in production yield. It seems highly unlikely to introduce regulations prohibiting the marketing of GMOs. Such solutions would be economically unjustified; they would expose the countries to severe financial penalties from the Community and would lead to aggravated trade disputes on the international stage.
� The macroeconomic situation in the world has an increasing impact on local markets. Economies of developing countries are growing much faster than that of developed countries. Along with the economic development, the in-comes in these countries are also rising rapidly, which translates into an in-crease in demand for food, particularly for animal products and consequently for feed. In response, the developing countries (including China and India), over a relatively short period, increased import demand for high-protein raw materials and developed their own production.
� In the last few years, the prices of agricultural raw materials in the world market, including high-protein feed, stood at a level 2-fold higher than in
95
1995-2005. This growth was due to rising demand, fluctuations in supply, speculation in commodity markets and the rapidly growing biofuels sector, where the impact on agricultural markets is growing, through competition with existing traditional sources of demand, especially for food purposes.
� Agricultural markets, after exceptional fluctuations in the past few years, should be relatively stable until 2020, but the balance will be achieved with a price level as high as in 2008-2010. According to OECD forecasts, world production of oil meals over the next ten years could rise by about 18%, and feed grains by about 15%. The continuing high demand for feed material in the production of livestock will cause that its price in case of oil meals may be only slightly lower than recent record levels, and prices for feed grain will be at the level of 5-10% higher than the average from 2008-2010. Thanks to an ever-closer links with other markets (energy market, financial markets), and the increasing demand for agricultural raw materials for non-food purposes, agricultural markets, including the market of high-protein feed materials, may be more sensitive to shock situations that have occurred in the recent years.
� In 1995-2010, world production and consumption of oil meals increased by approximately 75%, including soybean meal close to 2-fold, and rapeseed meal by 90%. There was an increase in the share of soybean meal in world production of oil meals to about 68% and in world trade to 80%. The main producers and exporters of soybean and soybean meal are countries in South America and the USA, where the share of GMOs in this plant crops is grow-ing steadily and now stands at 75% (Brazil) to 99% (Argentina). As a conse-quence, in the trade on the world market about 90% is GM soybean meal, at the expense of reducing the importance of non-GM meal, which is much more expensive and less available.
� The EU-27 is a large producer of rapeseed and sunflower meal. It also pro-duces significant amounts of soybean meal, but based on imported soybean, whose annual imports is 13-15 million tonnes, from which about 10 million tons of soybean meal is produced. In addition, EU countries import mainly the meal, the volume of which exceeds 25 million tonnes, of which 21 million tonnes is soybean meal. Domestic production covers about half of the demand for high-protein raw materials in the EU, but if soybean meal produced from imported seed is treated as imports, than the self-sufficiency ratio drops to about 30%.
� In Poland, the supply of domestic production, which is dominated by rapeseed meal, does not cover the growing demand for high-protein components. Shortages are covered with supply from imports, which, compared with mid-1990s, increased 3-fold and in season 2010/11 exceeded 2.7 million tonnes,

96
including 1.85 million tonnes of soybean meal. The vast majority (at least 97-98%) is the GM soybean meal, sourced mainly from South America and the USA.
� Demand for high-protein raw materials in Poland is met in 73-75% by import supplies. However, if the total consumption of oil meals is steadily growing, in the case of soybean meal in recent years there has been a stabilization in demand, with simultaneous rapid growth in the use of less expensive rapeseed meal and sunflower meal.
� The ever-increasing demand for high-protein raw materials is due to the dy-namic development of poultry production, which in the last 15 years has in-creased more than 3-fold. To a lesser extent this applies to pigs, although over the last dozen or so years, the protein concentration in feed for pigs also in-creased. Also in the feeding of cattle, especially dairy cows, high-protein raw materials are beginning to play an increasingly important role.
� With the current trends in the development of livestock production and grow-ing production of industrial feeds, especially those intended for poultry, only soybean meal ensures meeting the demand for necessary high-quality protein components in the current context. Taking into account nutritional require-ments, the availability of other protein feed and their prices, the possibilities of substitution of modified soybean meal are limited. In terms of nutritional value it is not possible to replace soybean meal with legume seeds, sunflower meal and rapeseed meal in feed for broilers and piglets and weaners. Here, substitution can only be gluten and animal feeds (fish meal, powdered milk or dried whey), which are much more expensive and commercially available in small quantities. However, there are more opportunities for substitution in feed for pigs and cattle.
� From the nutritional point of view, the minimum level of demand for soybean meal in livestock production in Poland is estimated at about 1.5 million tonnes. The lower level of consumption can lead to a significant deterioration in production and decrease in feed use, due to the deterioration of its quality. This will increase production costs and prices of industrial feeds, which in turn will affect the higher production costs of livestock, eggs and milk. In the case of substitution of GM soybean meal with traditional soybean meal, the price increase may range from a few to a dozen or so percent, depending on the type of the mixture. However, if the substitution will be made with other protein components as valuable as soybean meal, the increase in prices can even exceed 20%.
� Any administrative ban on GM feed would be unambiguously negative. It would generate an increase in production costs and decrease in agricultural

97
income in important branches of agricultural production. It can cause a crisis call in poultry industry, resulting in lower production and exports of live poul-try and the bankruptcy of some farms. In production of pigs, the ban on GM feeds will worsen the already low profitability and production efficiency in Poland, which is already less competitive. This prohibition, contributing to the deterioration of the competitiveness of the feed industry and the important branches of agricultural production, would be ineffective in protecting con-sumers against eating food produced with feed made of GM plants.
� Polish agriculture and our food producers cannot and should not be outside the global trends, if our agriculture is to grow and food export is to give a chance to use its productive potential. For this reason, it is necessary to use products made of genetically modified plants (soybean meal), which in the Polish reality are one of the main feed ingredients and which now cannot be replaced without negative consequences for the livestock and many branches of the food industry.

98
References�1. Assessment of the Economic Performance of GM Crops Worldwide, Ecolog-
ic Institute, Berlin, 2011. 2. Brookes G., Barfoot P., GM Crops: Global Socio-Economic and Environmental
Impacts 1996-2009, PG Economics Ltd, United Kingdom, 2011. 3. Brzóska F., Czy istnieje mo�liwo� substytucji bia�ka GMO innymi surow-
cami bia�kowymi (Cz�� II), Wiadomo�ci Zootechniczne, R. XLVII, 2, Kra-ków, 2009.
4. Burakiewicz J., Sytuacja na �wiatowym rynku wysokobia�kowych surowców pa-szowych, [in:] Rynek Pasz. Stan i perspektywy, No. 1, IAFE, Warsaw, 1997.
5. Chakrabortty A., Secret Report: Biofuel Caused Food Crisis – Internal World Bank Study Delivers Blow to Plant Energy Drive, guardian.co.uk, Thursday 3 July 2008.
6. Dzwonkowski W., �opaciuk W., Krzemi�ski M., Wp�yw uwarunkowa praw-nych, ekonomicznych, �rodowiskowych oraz zmian zachodz�cych na rynku �wia-towym na rozwój rynku zbó�, ro�lin oleistych i wysokobia�kowych w Polsce, IA-FE-NRI appraisal prepared for the Ministry of Agriculture and Rural Deve-lopment, Warsaw, 2008.
7. Erechemla A., Regulacje wspólnotowe dotycz�ce organizmów genetycznie zmodyfikowanych, Prawo i �rodowisko No. 4, Warsaw, 2006.
8. Fordo�ski G., �api�ska A., Analiza rynku nasion ro�lin str�czkowych, man-uscript, University of Agriculture and Technology, Olsztyn, 1996.
9. Hanczakowska E., Zastosowanie wyt�oków z nasion rzepaku w �ywieniu �wi, Wiadomo�ci Zootechniczne, No. 44, Kraków, 2006.
10. James C.; Global Status of Commercialized Biotech/GM Crop; Brief no 42; ISAAA, Ithaca, New York, 2010.
11. Knight J., Yao Y., Yueh L., Economic Growth in China: Productivity and Policy, Oxford Bulletin of Economics and Statistics, No. 73, 2011.
12. Li W., Mengistae T., Xu L. C., Diagnosing Development Bottlenecks: China and India, Oxford Bulletin of Economics and Statistics, No. 73, 2011.
13. Seremak J., Hryszko K., Stan prawny produkcji i stosowania �ywno�ci transgenicznej w Unii Europejskiej – przypadek Polski, Wydawnictwo Almamer, Warsaw, 2009.
14. Seremak J., Hryszko K., Ekonomiczne skutki potencjalnego zakazu stoso-wania genetycznie zmodyfikowanych ro�linnych surowców paszowych ze szczególnym uwzgl�dnieniem �ruty sojowej, IAFE-NRI appraisal prepared
99
for the MARD, Warsaw, 2008. 15. Smulikowska S., Warto� pokarmowa i wykorzystanie wyt�oków rzepako-
wych w �ywieniu drobiu i �wi, National Research Institute of Animal Pro-duction, Kraków, 2004.
16. Smulikowska S., Warto� od�ywcza wyt�oków rzepakowych dla drobiu, Pol-ski Drób, No. 6, 2002.
17. Tibbets G. W., Nucleotides from Yeast Extract: Potential to Replace Animal Protein Sources in Food Animal Diets, Proc. Alltech 18th Annual Symposium: Nutritional Biotechnology in the Feed and Food Industries, 2002.
18. The Commercial Benefits from Crop Biotechnology in Brazil: 1996/97 - 2009/10, Céleres, 2011.
19. The Social-Environmental Benefits from Crop Biotechnology in Brazil: 1996/97 - 2009/10, Céleres, 2011.
20. Wolny K., Bilans bia�kowy, Farmer 09/2005. 21. �ywienie zwierz�t i paszoznawstwo (collective work edited by D. Jamroz),
vol. I, PWN, Warsaw, 2004.


Annexes�


A
nnex
1. C
ost c
alcu
latio
ns fo
r pro
duct
ion
of 1
ton
of D
KA
star
ter w
ith d
iffer
ent h
igh-
prot
ein
supp
lem
ents
Raw
mat
eria
ls u
sed
% sh
are
cost
GM
so
yPL
N/to
nne
cost
non
-GM
soy
PLN
/tonn
e %
shar
e co
stPL
N/to
nne
pric
e of
1
tonn
e in
PL
N
(+20
%)
(+30
%)
(+40
%)
stan
dard
with
mea
l 44-
46%
w
ith g
lute
n an
d fis
h m
eal
Tot
al c
erea
ls
62
465
465
465
465
70
527
x
incl
udin
g w
heat
21
15
8 15
8 15
8 15
8 20
15
1 75
4 m
aize
35
26
8 26
8 26
8 26
8 44
33
7 76
7 ot
her
6 39
39
39
39
6
39
642
Tot
al h
igh-
prot
ein
raw
mat
eria
ls
30
392
435
469
503
23
609
x
incl
udin
g so
ybea
n m
eal
26
364
409
443
477
0 0
1 40
0 ra
pese
ed m
eal
4 28
28
28
28
2
14
690
sunf
low
er m
eal
0 0
0 0
0 2
11
550
field
bea
ns
0 0
0 0
0 5
33
655
fish
mea
l 0
0 0
0 0
7 35
0 5
000
whe
y po
wde
r 0
0 0
0 0
0 0
4 00
0 m
aize
glu
ten
0 0
0 0
0 7
202
2 88
0 O
ther
add
itive
s 8
207
207
207
207
7 20
7 x
T
otal
dir
ect c
osts
10
0 1
064
1 13
7 1
174
1 21
0 10
0 1
343
x
Oth
er c
osts
(ind
irec
t)
x 30
0 30
0 30
0 30
0 x
300
x T
otal
cos
t of f
eed
prod
uctio
n x
1 36
4 1
437
1 47
4 1
510
x 1
643
xR
ate
of c
hang
e in
pric
es o
f mat
eria
ls(r
aw
mat
eria
ls)
x
x 10
6.8
110.
3 11
3.7
x 12
9.2
x R
ate
of fe
ed p
rice
chan
ges
x x
105.
3 10
8.0
110.
7 x
122.
7 x
Sour
ce: A
utho
rs' o
wn
calc
ulat
ion
acco
rdin
g to
CSO
dat
a an
d da
ta fr
om fe
ed c
ompa
nies
..

Ann
ex 2
. Cos
t cal
cula
tions
for p
rodu
ctio
n of
1 to
n of
mix
ture
for l
ayin
g he
ns w
ith d
iffer
ent h
igh-
prot
ein
supp
lem
ents
Raw
mat
eria
ls u
sed
%sh
are
cost
GM
soy
PLN
/tonn
e
cost
non
-GM
soy
PLN
/tonn
e %
sh
are
cost
PLN
/ton
ne
%sh
are
cost
PLN
/ton
ne
%sh
are
cost
PLN
/ton
ne
%sh
are
cost
PLN
/ton
nepr
ice
of 1
to
nne
in
PLN
(+20
%)
(+30
%)
(+40
%)
stan
dard
with
mea
l 44-
46%
fie
ld b
ean,
su
nflo
wer
, fis
h m
eal
rape
seed
, sun
-flo
wer
, fis
h m
eal
sunf
low
er,
whe
y, fi
eld
bean
s, fis
h m
eal
rape
seed
, sun
-flo
wer
, whe
y,
field
bea
ns,
glut
en
Tot
al c
erea
ls
6549
449
449
449
469
51
169
524
6749
661
471
x in
clud
ing
whe
at
2518
918
918
918
944
33
230
226
4231
720
151
754
mai
ze
2519
219
219
219
215
11
524
184
1511
523
176
767
whe
at fl
our
550
5050
500
05
500
08
801
000
othe
r 10
6464
6464
10
6410
6410
6410
6464
2 T
otal
hig
h-pr
otei
n ra
w m
ater
i-al
s 22
249
280
298
309
21
345
1933
419
393
2532
4x
incl
udin
g so
ybea
n m
eal
1521
025
227
329
40
00
00
00
01
400
rape
seed
mea
l 0
00
00
0 0
535
00
535
690
sunf
low
er m
eal
739
3939
399
509
505
288
4455
0 fie
ld b
eans
0
00
00
7 46
00
746
639
655
fish
mea
l 0
00
00
5 25
05
250
420
00
05
000
whe
y po
wde
r 0
00
00
0 0
00
312
03
120
4 00
0 m
aize
glu
ten
00
00
00
00
00
03
862
880
Oth
er a
dditi
ves
1379
7979
7910
86
1213
614
148
1414
8x
Tot
al d
irec
t cos
ts
100
822
853
871
882
100
942
100
994
100
1037
100
944
x O
ther
cos
ts (i
ndir
ect)
x
250
250
250
250
x 25
0 x
250
x25
0 x
250
x T
otal
cos
t of f
eed
prod
uctio
n x
1 07
2 1
103
1 12
1 1
132
x 1
192
x1
244
x1
287
x1
194
x R
ate
of c
hang
e in
pric
es o
f mat
e-ria
ls (r
aw m
ater
ial)
x
x10
3.8
106.
0 10
7.4
x 11
4.6
x12
1.0
x12
6.2
x11
4.8
x R
ate
of fe
ed p
rice
chan
ges
xx
102.
910
4.6
105.
6x
111.
2 x
116.
1 x
120.
1 x
111.
3 x
Sour
ce: A
utho
rs' o
wn
calc
ulat
ion
acco
rdin
g to
CSO
dat
a an
d da
ta fr
om fe
ed c
ompa
nies
..
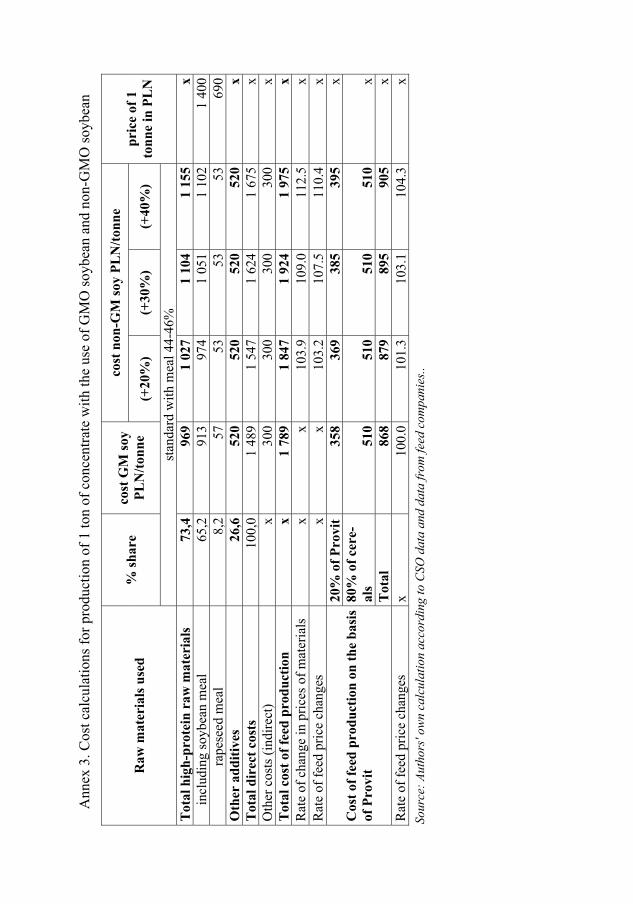
Ann
ex 3
. Cos
t cal
cula
tions
for p
rodu
ctio
n of
1 to
n of
con
cent
rate
with
the
use
of G
MO
soyb
ean
and
non-
GM
O so
ybea
n
Raw
mat
eria
ls u
sed
% sh
are
cost
GM
soy
PLN
/tonn
e
cost
non
-GM
soy
PLN
/tonn
e pr
ice
of 1
to
nne
in P
LN
(+
20%
) (+
30%
) (+
40%
)
stan
dard
with
mea
l 44-
46%
T
otal
hig
h-pr
otei
n ra
w m
ater
ials
73
,496
91
027
1 10
41
155
xin
clud
ing
soyb
ean
mea
l 65
,291
397
41
051
1 10
21
400
rape
seed
mea
l 8,
257
5353
5369
0 O
ther
add
itive
s 26
,652
052
052
052
0x
Tot
al d
irec
t cos
ts10
0,0
1 48
91
547
1 62
41
675
x O
ther
cos
ts (i
ndire
ct)
x30
030
030
030
0x
Tot
al c
ost o
f fee
d pr
oduc
tion
x1
789
1 84
71
924
1 97
5x
Rat
e of
cha
nge
in p
rices
of m
ater
ials
x
x10
3.9
109.
011
2.5
x R
ate
of fe
ed p
rice
chan
ges
xx
103.
210
7.5
110.
4x
Cos
t of f
eed
prod
uctio
n on
the
basi
s of
Pro
vit
20%
of P
rovi
t35
836
938
539
5x
80%
of c
ere-
als
510
510
510
510
x T
otal
86
887
989
590
5x
Rat
e of
feed
pric
e ch
ange
s x
100.
010
1.3
103.
110
4.3
x So
urce
: Aut
hors
' ow
n ca
lcul
atio
n ac
cord
ing
to C
SO d
ata
and
data
from
feed
com
pani
es..