REPORT ON THE POLICY FOR BIODIVERSITY, …Title Report on the policy for biodiversity, conservation...
26
PROJECT N. 037033 EXIOPOL A NEW ENVIRONMENTAL ACCOUNTING FRAMEWORK USING EXTERNALITY DATA AND INPUT-OUTPUT TOOLS FOR POLICY ANALYSIS REPORT ON THE POLICY FOR BIODIVERSITY, CONSERVATION AND RESTORATION Report of the EXIOPOL project
Transcript of REPORT ON THE POLICY FOR BIODIVERSITY, …Title Report on the policy for biodiversity, conservation...

PROJECT N. 037033
EXIOPOL
A NEW ENVIRONMENTAL ACCOUNTING
FRAMEWORK USING EXTERNALITY
DATA AND INPUT-OUTPUT TOOLS
FOR POLICY ANALYSIS
REPORT ON THE POLICY FOR
BIODIVERSITY, CONSERVATION AND
RESTORATION Report of the EXIOPOL project

Title Report on the policy for biodiversity, conservation and restoration
Purpose
Filename EXIOPOL_DIV.3.b-1.doc
Authors Maria Loureiro, FEEM
Document history
Current version.
Changes to previous version.
Date
Status Final
Target readership
General readership
Dissemination level
Maria Loureiro, FEEM
May 2011
Prepared under contract from the European Commission
Contract no 037033-2 Integrated Project in PRIORITY 6.3 Global Change and Ecosystems in the 6th EU framework programme
Deliverable title: Report on the policy for biodiversity,
conservation and restoration Deliverable no. : DII.5-b.1 Due date of deliverable: 50 Period covered: from 1st March 2007 to 31st October 2011 Actual submission date: M50 Duration: 56 Months Start date of project: 1st March 2007 Project coordinator: Anil Markandya, BC3 Project coordinator organisation: FEEM

Executive Summary
This report contains three main sections. The first provides an assessment of the
various experiences of biodiversity preservation around the world. The second
section follows with policies related to biodiversity preservation using economic
instruments, and in particular, taxes and payments of ecosystem services are revised.
Then, the last section provides some intuition of the main results obtained in the
stated preference valuation exercise in WP II.3 in the context of biodiversity
preservation in two surveys: one face-to-face Italian survey, and a second online
survey conducted in the UK, Spain and Italy. To this end, two major conclusions are
gathered with respect to the policy implications of the obtained results: a) the
consideration of citizen´s preferences is very important when articulating
sustainable biodiversity preservation policies, and b) in spite of their importance,
citizen’s preferences should be combined with scientific assessment in order to
construct well grounded biodiversity preservation policies.
2
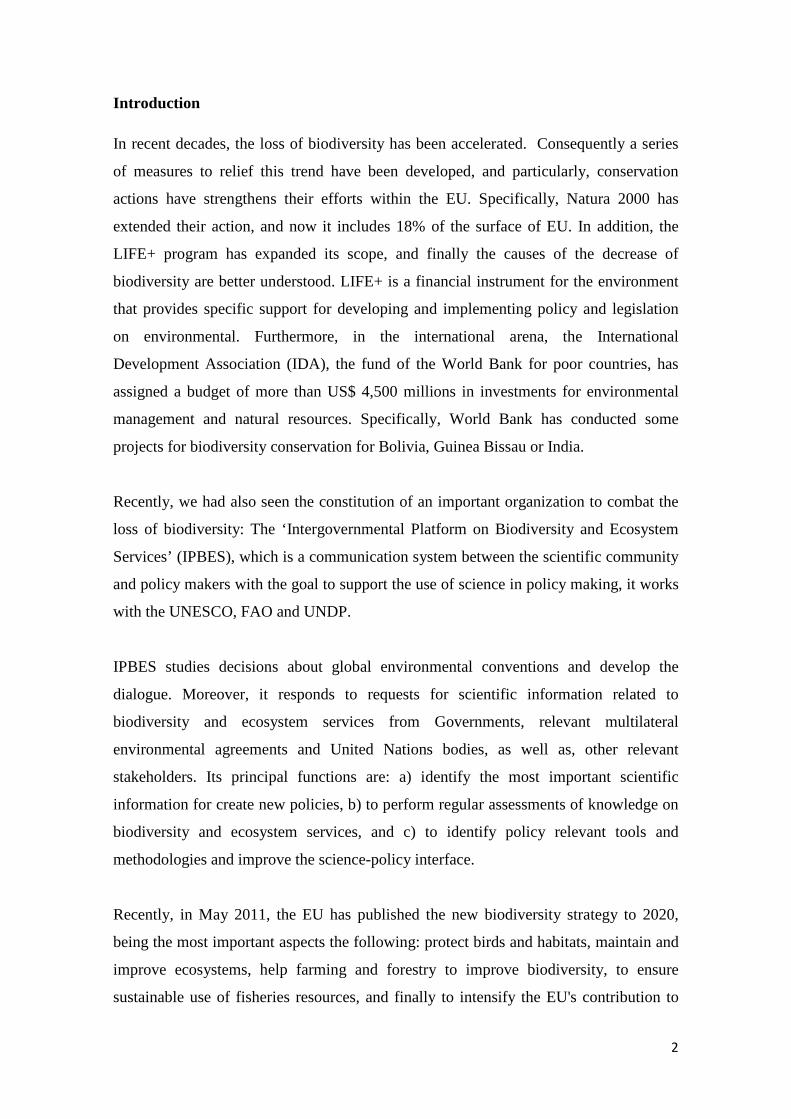
Introduction
In recent decades, the loss of biodiversity has been accelerated. Consequently a series
of measures to relief this trend have been developed, and particularly, conservation
actions have strengthens their efforts within the EU. Specifically, Natura 2000 has
extended their action, and now it includes 18% of the surface of EU. In addition, the
LIFE+ program has expanded its scope, and finally the causes of the decrease of
biodiversity are better understood. LIFE+ is a financial instrument for the environment
that provides specific support for developing and implementing policy and legislation
on environmental. Furthermore, in the international arena, the International
Development Association (IDA), the fund of the World Bank for poor countries, has
assigned a budget of more than US$ 4,500 millions in investments for environmental
management and natural resources. Specifically, World Bank has conducted some
projects for biodiversity conservation for Bolivia, Guinea Bissau or India.
Recently, we had also seen the constitution of an important organization to combat the
loss of biodiversity: The ‘Intergovernmental Platform on Biodiversity and Ecosystem
Services’ (IPBES), which is a communication system between the scientific community
and policy makers with the goal to support the use of science in policy making, it works
with the UNESCO, FAO and UNDP.
IPBES studies decisions about global environmental conventions and develop the
dialogue. Moreover, it responds to requests for scientific information related to
biodiversity and ecosystem services from Governments, relevant multilateral
environmental agreements and United Nations bodies, as well as, other relevant
stakeholders. Its principal functions are: a) identify the most important scientific
information for create new policies, b) to perform regular assessments of knowledge on
biodiversity and ecosystem services, and c) to identify policy relevant tools and
methodologies and improve the science-policy interface.
Recently, in May 2011, the EU has published the new biodiversity strategy to 2020,
being the most important aspects the following: protect birds and habitats, maintain and
improve ecosystems, help farming and forestry to improve biodiversity, to ensure
sustainable use of fisheries resources, and finally to intensify the EU's contribution to

3
preventing global biodiversity loss. Keeping in mind these goals, in the current
document we revised the experiences of biodiversity preservation and the role played by
the main economic instruments, as well citizens´ preferences towards various actions
based on biodiversity conservation. The document summarizes the main valuation
results obtained from valuation exercise in WP II.3 in the context of biodiversity
preservation. Our results reinforce the fact that valuation of ecosystem services linked to
biodiversity preservation is rather complex. This complexity arises from the existence
of multiple linkages between biodiversity preservation and the production of multiple
ecosystem goods and services. In order for citizens to properly value and assess such
diverse goods and services, general information and knowledge about the most
important consequences of biodiversity loss should be provided via educational or
awareness campaigns.

4
Economic Instruments to Preserve Biodiversity
Regarding the measures implemented to combat the loss of biodiversity, broadly
speaking, two types of policy instruments can be highlighted due to their importance:
ecosystem payments (subsidies) and taxes.
• Ecosystem payments
According to the OCDE, payments for ecosystem services (PES) can be defined as
“direct and flexible incentive-based mechanism under which the user or beneficiary of
an ecosystem service makes a direct payment to an individual or community whose land
use decisions have an impact on the ecosystem service provision”. Consequently,
payments for ecosystem services involve direct payments from the beneficiaries to the
providers of enhanced ecosystem services and the nature of the transaction has to be
voluntary (DEFRA, 2010). These payments can help to address the destruction of
Earth’s habitats, landscapes and ecosystems by assigning values to these services
(Conservation International).
Wetz-Kanounnikoff and Wunder (2006) state that ecosystem payments can be a tool for
conservation; but they are not the only solution. These are specially useful to internalize
environmental services that present indirect externalities and for which the traditional
environmental economic tool set was deficient. According to Ferraro and Kiss (2002)
we can differentiate between direct and indirect payments. It has been argued that direct
payments may displace biodiversity loss to other areas or create a social conflict,
although these authors indicate that such problems can also arise from indirect
payments. They state that direct payments can be seen like a form of bribery or
imposition of western values on developing nations. Issues that need be examined are,
on the one hand, the institutional complexity, given that both mechanisms need be
monitored by institutions. On the other hand, the costs can be also important. Usually a
direct payment will be more cost-efficient than any indirect approach. Another question
is about development benefits: under an indirect approach, these may be effective for
many stakeholders and under a direct approach, the benefits may be directed to poor
farmers. The last issue to be considered is the sustainability of the payment; direct
payments are seen as undesirable because financial commitment is necessary to

5
maintain investment and conservation objectives. On the contrary, indirect payments are
also likely to need a sustained flow of funds over time.
Wunder (2006) points out four types of PES: carbon sequestration and storage,
biodiversity protection, watershed protection, and landscape beauty. He also compares
PES with other conservation tools like command and control regulations, sustainable
forest management, integrated conservation and development projects, social markets,
environmental taxes, product certification or land acquisition. He concludes that
criticisms about the PES are based on preliminary results. Therefore, he stresses the
need for care in its design and the need to refine further developments.
Wendland et al. (2009) indicate that five characteristics which are very important for
PES: these are voluntary, they involve an environmental service, the service is “bought”
by at least one buyer; the service is “provided” by at least one provider; and finally the
transaction is conditional on provision of that service. They also establish a method that
those interested in biodiversity conservation can use to target PES projects in areas that
perfect biodiversity and provide important additional ecosystem services. They find that
PES will not be the right approach for every situation where biodiversity conservation is
warranted. Additionally, in many situations where PES might be an appropriate
approach to biodiversity conservation, the institutional frameworks and the country´s
capacity to implement these types of projects are still developing. There are other
studies such as Wunder (2005), where the idea that through the PES poverty can also be
reduced is presented.
If we attend now to countries that apply these mechanisms, it is observable that in
recent years their use has increased. Wetz-Kanounnikoff and Wunder (2008) study four
cases where PES has been implemented. The first one is in Bolivia, where the goal of
this program is to reduce CO2 emissions from deforestation. The second case presented
took place in Brazil. In this case, the principal objectives are: to improve forest
conservation and livelihood improvements of traditional communities in state protected
areas and sustainable use reserves. This program rewards indigenous communities and
long-term settlers for their commitment to avoid deforestation. Ecuador also employs
PES, establishing a scheme cost, where the target recipients are 27 households. In the
same way, in Mexico there are payment levels derived from opportunity cost
assessments, and differentiated by forest type.

6
In addition, Liu et al (2007) show how China has implemented two payments for
ecosystem services. One of these is the Natural Forest Conservation Program, which
from 1998 to 2005 has invested more than 61 billion Yuan and the second one is the
Grain to Green Program, that by the end of 2005 is expected to have invested more than
90 billion Yuan; concluding that both programs have demonstrated ecological and
socioeconomic positive impacts but also negatives in the short run. Furthermore, Hall
(2008) evaluates the effects of Proambiente in Amazonia. Proambiente is a system of
PES obtained by producers who are helping to maintain the Amazon rainforest by
adopting more sustainable farming systems, arriving to the conclusion that this system
has problems such as limited financing, limited implementation capacity and
coordination, among others. Limited payments have been made, while there has been
almost no effective monitoring, quantification or certification of such services. Alpízar
et al (2007) study a pilot project in Honduras, illustrating how targeting and the use of
more precise proxies can be used to enhance effectiveness and efficiency of a PES
system. The problem is that in two watersheds live 1000 families that drink water from
local rivers, being the quality and quantity of this drinking water lessened by human
activities. The administrators developed an index like a combination of land
management practices and land uses, obtaining a method for constructing payments on
the level of ecosystem services provided by each site. They conclude that the success of
the program depends on both strategies and methods for targeting payments to ensure a
change behavior.
A more recent study was conducted by Alpízar and Nordén (2011), analyzing entrance
fees in tourism destinations. Specifically they employ a survey to study the case of
Cahuita National Park in Costa Rica. The survey was applied randomly and excluding
community residents, finding that in this case study, low entrance fees had a positive
effect in visitor’s utility and people’s willingness to contribute to public goods. In a
Costa Rica’s setting, Robalino et al. (2008), study the effects of PES implementation
during 2000-2005, concluding that less than 1% of the parcels involved in the program
would have been deforested annually in the case that the payments were not to exist.
In the EU area, some budget is provided through programs designed by each Member
State according to their environmental priorities payments to supply environmental

7
services. These payments are supported up to a given percentage from the EU budget,
while the rest is provided by the Members States budget and from private sources.
Specifically, the Common Agricultural Policy (CAP) has one of its principal objectives
is biodiversity conservation. In this way, the EU has stressed the importance to prevent
its abandonment and its intensification using the CAP as a key action to avoid
biodiversity decline.
The CAP was born in 1962 and is the principal policy instrument that the EU uses for
influencing the agricultural land use. In a first moment, this policy instrument focused
on the economic and social objectives of increasing productivity, establishing markets
and ensuring a fair standard of living for European farmers and reasonable prices for
consumers. In 1992, the CAP was reformed with the aim to address overproduction,
budgetary costs and environmental issues linked to intensive farming. At present, the
CAP budget amounts around 53€ billions, approximately 290€/ha of agricultural land.
In 1998, the EU adopted the biodiversity strategies with the following objectives:
“maintenance and further development of farming with a view to optimizing its positive
impact on the conservation taking into account the positive role of extensive agriculture,
sometimes in marginal areas; it is necessary to preserve the value that such areas have
for biodiversity”.
As stated earlier, Natura 2000 is the main tool of EU nature and biodiversity policy.
Principal actions include optimizing the use of available measures under the reformed
CAP, notably to prevent intensification or abandonment of high nature value farmland,
woodland and forest and supporting their restoration.
Currently, the structure of CAP has two pillars: one is 100% financing from EU budgets
and the other is co-financed by Member States and regions. The first include direct
payments, such as income support payments for farmers. Furthermore, there are markets
interventions, such as tariffs, exports subsidies, and intervention purchasing and output
quotas. As a consequence, there are enormous differences across member states in the
level of expenditure per hectare of farmland, and it would be necessary a redesign of the
policy intervention with the goal that funds redistribution would be feasible and
effective.

8
PES in Europe could be designed based on the future agri-environmental policies
(AEP), because these policies protect the environment, provide ecosystem services and
maintain the countryside, cultural heritage and landscape (Vakrou, 2010). According to
Baylis et al. (2007), there are some differences in the application of theses policies
between EU and US. Thus, in the EU they address positive environmental externalities
while in the US address negative externalities. Moreover, AEP in the US are based on
the anticipated environmental outputs associated with certain activities; on the contrary
in Europe it is sufficient to use agricultural inputs or technologies that have been
qualified such as environmentally friendly. On the other hand, in US they also take into
account the individual opportunity costs, while in the EU are based on national or
regional set fees.
Now attending to taxes and according to the Directive 2004/35/CE of the European
Parliament, new measures are necessary, specially promoting the “polluter pays”
principle. In this way, a polluter that causes environmental damages should be bearing
the cost of necessary preventive or remedial measures. The principal goal of this
Directive is to establish a common framework for prevention and reparation of
environmental damages with a reasonable cost to society. Environmental damages
should be understood as “damage caused by airborne elements as far as they cause
damage to water, land or protected species or natural habitats”.
Current threats against biodiversity
Over the past few decades, global food production has grown at a spectacular rate. This
has been possible by the release of high-yielding varieties, increased use of
agrochemicals and reliance on irrigation. However, the expansion and industrialization
of farming has also resulted in detrimental effects on natural ecosystems, wildlife and
the environment. In this context, the intensification of land use in agriculture is widely
considered the main reason why biodiversity has been declining in Europe and around
the globe.
It is a fairly widespread belief that nature is worth preserving for its own sake.
However, conservation has also been advocated based on the economic argument that

9
biodiversity loss reduces human welfare. The underlying idea is that natural and semi
natural ecosystems sustain a variety of ecological processes that are beneficial to
society. Turning the ecosystem level approach to conservation into practical guidance
for policy makers is problematic given that it requires measuring and valuing the
contribution of biodiversity to ecosystem services.
The relationship between human activities, biodiversity and ecosystem services are
particularly complex in agricultural landscapes, mainly due to two reasons. Farmers
influence the provision of ecosystem services by altering biodiversity on their farms and
in addition, the agricultural production is enhanced by ecosystem services and is
afflicted by ecosystem disservices.
A remarkable number of distinct patterns have been proposed for how the magnitude of
ecosystem processes may respond to changes in species diversity. Much of the
empirical work in this area has tended to focus on the link between diversity and
primary productivity in plant communities. Nevertheless, patterns vary considerably
across locations and environmental conditions. Two sorts of mechanisms might explain
why experimental manipulations of diversity would enhance ecosystem functions.
Firstly, species might exhibit positive interactions. Secondly, as the number of species
in a system increases, so does the probability of including one species that performs
particularly well under the present conditions.
Focusing on the use of pesticides, this is costly for farmers and has being linked to a
variety of adverse environmental effects. Pesticides may harm also non-pest
invertebrates that represent alternative sources of food. An additional problem with
pesticides is that they tend to become ineffective. Biodiversity has been often associated
with the ability to control pest populations. Some important aspects to consider are:
firstly, crop diversification in time and space can contribute to the natural suppression
of the unwanted organisms and improve crop resistance to pests. Secondly, non-crop
biodiversity is also credited with the ability to produce benefits in terms of pest
regulation; and finally, it has been argued that pest damage to the crops is likely to be
less of a problem in farming systems that create a mosaic of relatively small fields
where different crops

10
On the other hand, another aspect to take into account is the pollination, that consists
on the transfer of pollen between flowers. This is necessary for many plants to achieve
sexual reproduction. Insect pollination of crops represents in part an ecosystem service
and in part the result of farmers´ practices. Moreover, wild pollinators can increase the
productivity of crops that are self-pollinating. So, pollination by wild insects is believed
to depend in a crucial way on the availability of areas of natural or semi-natural habitat
in the surrounding landscape.
Other important issue is the biodiversity and soil quality, because soil organisms and
their interactions are important actors in the processes that maintain soil fertility and
ensure plant growth, it has been proposed that changes in soil biodiversity have
potentially large effects on the quantity and quality of agricultural production.
Also it is important the use of genetic resources on farms. These provide the raw
material for breeding new varieties with improved adaptation and productivity. Until
recently, concern for the biodiversity implications of agricultural land use has centered
around the negative effects of intensification, industrialization and habitat loss, but also
it is necessary to consider that the abandonment of agriculture represents as much of a
threat to biodiversity. In the present work, we explore new venues to analyze the value
of biodiversity services.
European preferences towards biodiversity: what have we have learnt
Due to all these concerns mentioned in the earlier section, in WP IV.3b we assessed the
importance of environmental, agricultural and cultural services related to preservation
of biodiversity in samples of three European countries: Italy, Spain and UK. The link
between biodiversity preservation and policy applications requires an understanding of
citizens’ preferences and willingness to pay or support such biodiversity services.
In order to elicit Europeans´preferences towards biodiversity, several research proyects
were conducted within EXIOPOL. The first survey we will refer was done in Italy in
2009 while the second panel survey was conducted in Italy, Spain and UK in 2011.
2009 Italian Survey

11
The questionnaire was developed by using the results from two focus groups and one
pre-test, in collaboration with WWF Italia and a team of biologists of the University of
Pavia, working on pilot practices for rice cultivation in the study area. The survey
questionnaire was administered with face-to-face interviews by a trained interviewer to
a selected sample of 300 households. Respondents are those persons in the household
who contribute to the household’s income. Overall 300 questionnaires were completed.
The questionnaire consisted of three sections. The first section introduced the concept of
biodiversity and its related services, and how they can be affected by agricultural
practices. Next we focused on rice production. By using a cost-benefit perspective,
which emphasized existing trade-offs between the positive and negative externalities
associated with intensive and alternative rice production practices, we presented
possible methods to produce rice, while minimizing threats to biodiversity. In particular,
we used the traditional rice production method as a reference point to depict a rice
production strategy able to be in harmony with the environment. Differences between
traditional and modern cultivation methods, and negative effects of intensive rice
cultivation were therefore explained with the help of simple tables (see Table 1 and
Table 2).
Table 1: Explanation of the differences between traditional and modern cultivation
methods.
TRADITIONAL TODAY - MODERN
• Small fields • Large fields
• Limited use of fertilizers • Massive use of fertilizers and chemicals
• Paddies are dry for short periods of time • Paddies are dry for long and frequent periods of time
• Presence of hedges and trees between paddies
• Absence of hedges and trees between paddies
Table 2: Explanation of the negative effects of modern rice cultivation practices.

12
The NEGATIVE ASPECTS of modern rice cultivation include:
1. The paddies, large and often dry, create a monotonous and arid landscape.
2. The use of fertilizers and chemicals pollutes the water and soil harming plants and wild animals.
3. The paddies act as “ecological traps”. During the spring, when they are flooded, they attract many aquatic organisms (frogs, tree frog and other amphibians) which will then reproduce. When the water is removed the eggs, larvae and tadpoles are unable to survive.
4. The absence of water favors the proliferation of mosquitoes because of the absence of the insects (dragonflies) and aquatic organisms (frogs, tree frogs etc) that prey on mosquitoes
5. The lack of shrubs and trees between the cultivated fields removes natural environment for plants (flowers, shrubs and trees), insects (butterflies, bees), birds and small mammals (hares, porcupines).
It was explained that by changing the modern methods of rice cultivation it is possible
to protect the environment and the variety of animals and plants (biodiversity). The
presented three alternative techniques of rice cultivation that protect biodiversity are in
line with those recently studied and tested by the University of Pavia1:
1. Spontaneous vegetation along the levees
2. Canals in the rice paddy
3. Re-naturalization of the paddy
To facilitate the rice production practices’ comprehension, respondents were provided
with figures depicting alternative production methods.
The second section of the questionnaire contained the CE exercise. Preliminary to the
CE questions, respondents were informed that the three alternative production
techniques can be planned and used in various combinations based on local
requirements. In this manner, it is possible to identify the best potential intervention to
achieve the desired environmental results. To reduce the problem of hypothetical bias,
we informed the respondents that their Municipality support a project of the Region to
protect biodiversity in the areas dedicated to rice cultivation. We explained that the
Municipality, in collaboration with the regional administration is evaluating the best
possible combination of the above techniques to be applied in their area; but
1 The experiments conducted in the area of Novara have proven that with small interventions and slight modifications of currently used methods, it is possible to grow rice in equilibrium with the cycles of nature and to protect biodiversity.
13
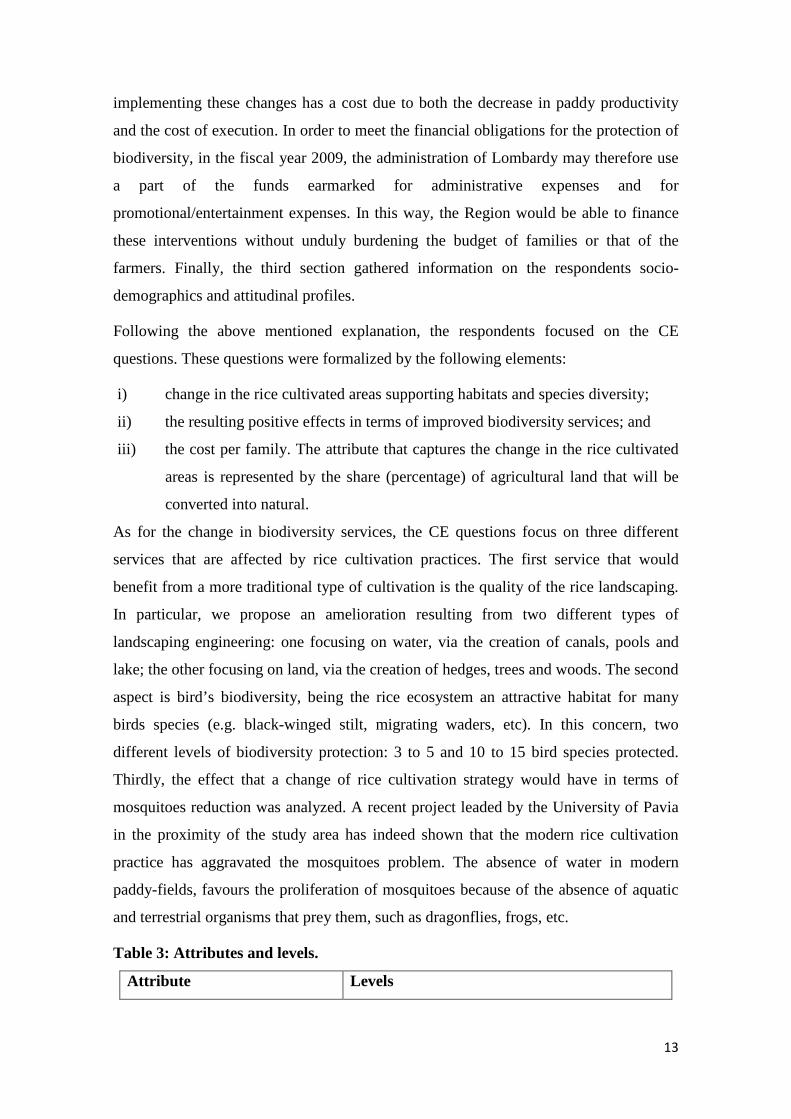
implementing these changes has a cost due to both the decrease in paddy productivity
and the cost of execution. In order to meet the financial obligations for the protection of
biodiversity, in the fiscal year 2009, the administration of Lombardy may therefore use
a part of the funds earmarked for administrative expenses and for
promotional/entertainment expenses. In this way, the Region would be able to finance
these interventions without unduly burdening the budget of families or that of the
farmers. Finally, the third section gathered information on the respondents socio-
demographics and attitudinal profiles.
Following the above mentioned explanation, the respondents focused on the CE
questions. These questions were formalized by the following elements:
i) change in the rice cultivated areas supporting habitats and species diversity;
ii) the resulting positive effects in terms of improved biodiversity services; and
iii) the cost per family. The attribute that captures the change in the rice cultivated
areas is represented by the share (percentage) of agricultural land that will be
converted into natural.
As for the change in biodiversity services, the CE questions focus on three different
services that are affected by rice cultivation practices. The first service that would
benefit from a more traditional type of cultivation is the quality of the rice landscaping.
In particular, we propose an amelioration resulting from two different types of
landscaping engineering: one focusing on water, via the creation of canals, pools and
lake; the other focusing on land, via the creation of hedges, trees and woods. The second
aspect is bird’s biodiversity, being the rice ecosystem an attractive habitat for many
birds species (e.g. black-winged stilt, migrating waders, etc). In this concern, two
different levels of biodiversity protection: 3 to 5 and 10 to 15 bird species protected.
Thirdly, the effect that a change of rice cultivation strategy would have in terms of
mosquitoes reduction was analyzed. A recent project leaded by the University of Pavia
in the proximity of the study area has indeed shown that the modern rice cultivation
practice has aggravated the mosquitoes problem. The absence of water in modern
paddy-fields, favours the proliferation of mosquitoes because of the absence of aquatic
and terrestrial organisms that prey them, such as dragonflies, frogs, etc.
Table 3: Attributes and levels.
Attribute Levels

14
Extension of the cultivated area
to be transformed into natural
reserves
− 2%; 8%; 15%
Type of landscaping
amelioration for the area (land
or water landscape engineering
− Landscape engineering: hedges, trees, woods
− Waterscape engineering: canals, pools, lakes
Birds’ biodiversity
− The presence of few bird species is facilitated
(3-5)
− The presence of many bird species is
facilitated (10-15)
Mosquitoes reduction − No decrease in mosquitoes
− Decrease in mosquitoes
Cost per family (in terms of tax-
reallocation)
− 0€ (status quo)
− 40€; 80€; 110€; 160€; 200€
Special attention was given to the selection of the payment vehicle. During pretests
respondents protested any payment vehicle implying additional direct expenditure at the
household level. We therefore adopted a ‘budget reallocation payment regime’, a new
payment mechanism that does not alter a household’s income. In this context, the
financing of new public environmental goods is to be paid for by a decrease in the
amount of a household’s taxation money that was previously spent on other
government-funded goods. Respondents were thus informed that, in order to meet the
financial obligations for the protection of biodiversity, the regional administration
would use a part of the funds earmarked for administrative expenses and for
promotional/entertainment expenses. Bids were selected and tested during focus groups,
resulting into five possible costs per family, in terms of tax-reallocation.
Table 4 shows the implicit prices under the basic RPL model including attributes. As
can be seen, MOSQ is the highest ranked attribute, for which the respondents are
willing to pay approximately €497household/year2009. For birds biodiversity
respondents are willing to pay about €46/household/year2009 for the protection of one
additional bird specie population. The respondents are willing to pay about
€14/household/year2009 for the conversion of 1% of rice cultivated area into natural.

15
Lastly, respondents are willing to pay for an amelioration of the rice landscape, up to
€129/household/year2009, via waterscape engineering based on canals, pools.
According to the results discussed in the previous section, there are several interesting
points that can be set. Firstly, all the attributes are statistically significant. In terms of
biodiversity services this signals that respondents are able to understand the relationship
between the proposed changes in rice cultivation practices and what this would bring in
terms of enhancing both biodiversity as such (i.e. species diversity), and its related
services (i.e. regulating and aesthetic ones).
Among the services mentioned in the survey, mosquitoes reduction represents the most
important service for respondents (€496.73household/year2009), who were therefore
able to understand that an amelioration of the rice-field ecosystem would lead to a
reduction of mosquitoes’ proliferation. Similarly, respondents showed to appreciate the
renaturalization of a part of cultivated area (€14.22/household/year2009 for the
conversion of 1% of rice cultivated area into natural), and its effects in terms of
landscape improvement, which is raked as the second important service
(€129.03household/year2009). Biodiversity protection in terms of species diversity is
also relevant for respondents, but it shows a lower unit WTP
(€45.96/household/year2009 for the protection of one additional bird specie population).
However, if we consider the average proposed protection of 7.5 and 12.5 birds’ species,
such as those proposed the CE scenarios, the WTP ranges from about 344.7 to 574.5. In
addition, in principle, we might suppose to observe different WTP values for a different
indicator of species diversity; but this issue lays out of the purposes of the present study.
Table 4: Willingness- to- pay estimates .
Mean
AREA € 14.22
LAND € 129.03
BIODIV € 45.96
16
MOSQ € 496.73
2011 Survey: Spain, UK and Italy
According to many financial reports, 2011 is clearly marked by the worst economic
crisis suffered in Europe since the War World II. Given this exceptional economic
situation, a tax revenue reallocation scheme was adopted as the payment vehicle to
minimize strategic behaviour and protest responses. Protest responses were a major
concern at the designing stage of the survey, since given the deteriorated economic
conditions, not many households are wiling to pay extra taxes to protect biodiversity or
environmental amenities.
The structure of this survey is common in all countries and it contains five differentiated
parts. First, it starts with some introductory questions about citizens concerns and
biodiversity issues. Second, it contains the valuation section in which information was
given about the current situation of cereal areas in Europe, the intensification of
harvesting and its impacts in landscapes and biodiversity. Next, the stated choice
experiments are used in order to elicit preferences for various agricultural biodioversity
related services. It continues with the NEP scale and it concludes with socio-economic
questions.
In the valuation scenario participants were presented with a choice scenario in order to
select the most preferable agricultural policy in terms of biodiversity and landscape
conservation benefits. In particular, the exact verbatim presented in the survey was:
“Your Country participates to a European agri-environmental program to
protect biodiversity in the areas dedicated to cereal cultivation. Your
Country, in collaboration with the European Commission is evaluating the
best possible policy to be applied in the most intensive cereal cultivation
areas.
The main biodiversity benefits that could be achieved are:
• Landscape enhancement: amelioration of the visual beauty of the rural
landscape aimed at restoring the local traditional rural landscape by

17
converting a part of the cultivated areas into natural areas and by
fragmenting cultivated areas with establishment of hedgerows, shelterbelts,
small trees and natural streams.
• Additional protection of pollinating insects: the current number of
pollinating insects (bees, hornets, etc.) would be preserved from additional
decline.
• Additional protection of rural sites: the current rural sites of interest for
traditionally and locally produced food would be preserved.
To cover the cost of the agro-environmental biodiversity protection program described
above funds will be raised from the government purse in your country. In this case no
new taxes will be introduced. Money will be reallocated to the biodiversity protection
program through a reduction only in 2011 budget on the public services you think that
can be reduced, without any further taxation.
Now we will ask you to choose among different agri-environmental policies leading to
different biodiversity benefits and characterized by different cost and financial
mechanism.
Please read the effects attached to each different agri-environmental policy (A and B)
and to the status quo, and pick which of these you would buy.
Table 5: Example of Choice: Which would you select now given the new options
below?
EFFECTS Status quo
Policy A Policy B
Landscape enhancement
As today: 0% of
cultivated areas
converted into
natural
5% of cultivated
areas converted
into natural
5% of cultivated areas
converted into natural

18
Protection of pollinating
insects
As today: continued
decline of the
number of species of
pollinator insects
As today:
continued decline
of the number of
species of
pollinator insects
Stop of the decline of the
number of species of pollinator
insects
Protection of cultural
heritage
As today As today
Additional protection of local
rural sites of interest for
traditionally and locally
produced food
Cost: tax reallocation
In the year 2011
(Pounds)
0,- 70,- 180,-
I prefer:
���� Status quo ����A ����B
Then several choice experiments that contained three combinations (Policy A, Policy B)
and status quo were presented to participants. Table 1 shows the description of these
choice sets and their corresponding levels.
Table 6: WTP equivalent results (National policy Ranking), Tax reallocation
scheme sample
Variable Italy (€) Spain (€) England (₤)
Landscape 12.7 (3rd rank) 9.6 (3rd rank) 3.9 (1st rank)

19
(8.7152)
(5.5422)
(2.5251)
Pollinator insects 61.9 (2nd rank) 74.7 (2nd rank) -3.8
(71.5959)
(61.1129)
(25.8495)
Heritage 98.3 (1st rank) 100.0 (1st rank) -7.3
(85.8414)
(73.8902)
(21.2038)
(*) standard errors are in parentheses.
Results are displayed per country in Table 6. In the case of the Spanish data, all
estimates are positive and statistically significant; implying that individuals are much
willing to reallocate some of the current public expenditures towards biodiversity
protection and landscape enhancement. The same pattern of preferences is observable in
Italy. However, the UK sample shows clear differences. In particular, citizens are only
willing to reallocate part of the existing public budget towards rural landscape
enhancement measures, but are against enhancing insect and cultural heritage
protection, if this requires a reduction on other present public services. Consequently,
the present results show clear heterogeneous preferences towards biodiversity and rural
landscapes across Europe. Table 6 provides the willingness to pay estimates (WTP) for
the three attributes across countries. As observable, heritage protection, or in other
words, cultural services are the most valued in Italy and Spain, where in the UK,
landscape protection would be the most preferable service linked to an agricultural
policy aiming at recovering traditional harvesting ways. In the three countries, insect
pollination services seem not to be much valued by the population in general.
Therefore, it seems that in order for public policies to be successful protecting or
enhancing biodiversity services, citizens should be aware of the multiple services
derived from biodiversity. This lack of knowledge may be behind individuals´ concerns

20
about protecting insect pollination services, which turned in lower valuations for
pollination services.
Conclusions and Policy Implications
Many studies show scientifically the importance to enhance biodiversity not only to
preserve the endangered species from an altruistic view point, but also from an
economic perspective. Thus, the Millennium Ecosystem report clearly states the
importance of the multiple services provided by biodiversity, classifying them into:
provisioning, regulating, supporting, and cultural services. In this sense, we tested the
importance of such services related to agricultural biodiversity two different surveys:
the first one was conducted in Italy and the second in a sample of three European
countries: Italy, Spain and UK. Our valuation study employs stated preferences
techniques and we used a tax reallocation mechanism in choice experiments. In the
first Italian survey, results reinforce and call attention to the feasibility of implementing
an agri-environmental policy aimed at protecting biodiversity services in the future.
More importantly, there are further implications about enhancing the applicability of
biodiversity protection policies when we consider the results obtained for different
biodiversity services. For example, the highest value attached to mosquitoes reduction
would imply, for policy makers, that stressing more direct-use anthropocentric-related
benefits in the biodiversity policies may encourage greater support from people with
different environmental attitudes.
As stated earlier, in the second survey conducted online in Spain, Italy and UK, of we
found that preferences of European citizens diverge considerably with respect to their
aims for biodiversity preservation and their valuation or raking of the evaluated
services. In particular, we found that Spanish and Italian citizens are more likely to be
willing to reallocate current public budget and forego some of the current public
services in order to enhance agricultural areas and biodiversity, whereas UK citizens are
not so likely to be willing to reallocate existing public budget in order to enhance
biodiversity protection. Specifically, they would rather not reallocate any existing
public funds to preserve insect population and cultural heritage.
The implications of the results obtained in the conducted valuations in WP II.3 are
various and all important. The survey developed in this study aimed at analyzing

21
citizen’s preferences based on marginal willingness to pay for various measures that
affect agricultural landscapes and biodiversity preservation in three countries: UK,
Spain and Italy. In agriculture, biodiversity loss is being exacerbated due to two main
trends: a) abandonment of marginal lands, and b) intensification activities in productive
lands. However, although biodiversity generates many benefits, including
environmental externalities and economic benefits, the general public may not be fully
aware of such benefits. This is most likely the case of the pollination benefits that
citizens are not willing to support, probably because the association of existence of
insects with other negative insect externalities. Furthermore, preferences are also
heterogeneous across countries. Thus, a common PES based on ecosystem services may
have to vary between North and Southern European countries in order to properly
reflect such heterogeneous preferences. While in the Southern European countries,
survey participants are willing to support the cultural services linked to biodiversity
preservation, such priority or concern does not emerge in the UK. Therefore, it is
important that citizens fully understand the key role played by biodiversity in order to
properly assess values to its multiple functions and services. As a consequence, policies
of preservation and protection of biodiversity should be constructed based not only on
preferences and citizens views, but also on scientific assessments.

22
REFERENCES
Alpízar, F., Blackman, A. and Ptaff, A. “Payments for ecosystem services: why
precision and targeting matter”. Resources for the future. Available from:
http://www.rff.org/rff/Documents/RFF-Resources-
165_PaymentsforEcosystemServices.pdf
Alpízar, F. and Nordén, A. 2011. “Donation versus fees in protected area finance?-
Evidence from stated behavior in Cahuita National Park. Paper presented for European
Association of Environmental and Resource Economics.
Baylis, K., Peplow, S., Rausser, G. and Simon, L. 2007. “Agri- Environmental policies
in the Eu and the United States: A Comparison”. From the selected works of Kathy
Baylis. Available from:
http://works.bepress.com/cgi/viewcontent.cgi?article=1004&context=kathy_baylis
Conservartion International (CI). 2011. “Nature Provides. Ecosystem services and their
benefits to human kind”. Available
from:http://www.conservation.org/Documents/CI_EcosystemServices_Brochure.pdf
DEFRA,2010. “Payments for ecosystem services. A short introduction”. Available
from:
http://www.oecd.org/document/59/0,3343,en_2649_34285_46104123_1_1_1_1,00.html
European Environment Agency. 2011. Distribution and targeting of CAP budget from a
biodiversity perspective. Available from:
http://www.eea.europa.eu/publications/distribution-and-targeting-of-the-cap-budget-
from-a-biodiversity-perspective
European Commission Environment. 2011. “Biodiversity: Assessment confirms EU has
missed 2010 target, but important lessons learned”. Available from:
http://europa.eu/rapid/pressReleasesAction.do?reference=IP/10/1303&format=HTML&
aged=0&language=EN&guiLanguage=en
European Commission Environment. 2011. “LIFE Program”. Available from: http://eur-
lex.europa.eu/LexUriServ/LexUriServ.do?uri=OJ:L:2007:149:0001:0016:EN:PDF
Intergovernmental science-policy platform on biodiversity and ecosystem services.
2011. Available from: http://ipbes.net/
European Commission Environment. 2011. “Communication from the commission to
the European parliament, the council, the economic and social committee and the
committee of the regions”. Available from:

23
http://ec.europa.eu/environment/nature/biodiversity/comm2006/pdf/2020/1_EN_ACT_p
art1_v7%5b1%5d.pdf
Ferraro, P and Kiss, A. 2002. “Direct payments to conserve biodiversity”. Science, 298,
1718-1719.
Hall, A. 2008. “Better RED than dead: paying the people for environmental services in
Amazonia”. Available from:
http://rstb.royalsocietypublishing.org/content/363/1498/1925.full.pdf+html
International Development Association (IDA). Available from:
http://www.worldbank.org/ida/
Liu, J et al. 2007. “Ecological and socioeconomic effects of China’s policies for
ecosystem services”. Available from:
http://www.pnas.org/content/105/28/9477.full.pdf+html
OCDE,2011. Available from:
http://www.oecd.org/document/59/0,3343,en_2649_34285_46104123_1_1_1_1,00.html
Red Natura 2000. Available from:
http://ec.europa.eu/environment/nature/natura2000/index_en.htm
Robalino, J., Ptaff, A., Sanchez-Azofeita, A., Alpízar, F., León, C and Rodríguez, C.
2008. “Deforestation Impacts of Environmental Services Payments: the evolution
(2000-2005) of the Costa Rican PSA program”. Paper presented for BIOECON, May
2008.
Vakrou, A. 2010. “Payments for Ecosystem Services (PES): Experiences in the EU”.
Expert workshop of enhancing the cost-effectiveness of payments for ecosystem
services. Available from: http://www.oecd.org/dataoecd/4/59/44903483.pdf
Wertz-Kanounnikoff, S. 2006. “Payments for environmental services – A solution for
biodiversity conservation?” Ressources Naturelles. Nº 12/2006.
Wertz-Kanounnikoff, S. 2008. “Reducing forest emissions in the Amazon Basin. A
review of drivers of land-use change and how payments for environmental services
(PES) schemes can affect them”. Working Paper, nº40. CIFOR.
Wendland, K. et al.. 2009. “Targeting and implementing payments for ecosystem
services: Opportunities for bundling biodiversity conservation with carbon and water
services in Madagascar”. Ecological Economics. doi:10.1016/j.ecolecon.2009.01.002.
Wunder, S. 2005. “Payments for environmental services: some nuts and bolts”. CIFOR
Occasional Paper, Nº 42.
24
Wunder, S. 2006. “Are direct payments for environmental services spelling doom for
sustainable forest management in the tropics?” Ecology and Society, 11 (2), 23.