REPORT ON THE OUTCOMES OF STAGE 2: COHORT 2 AND …
28
Transcript of REPORT ON THE OUTCOMES OF STAGE 2: COHORT 2 AND …


2 Research report No.3 to DIS on outcomes of Stage 2: Cohort 2 and progress on Stage 3: Cohort 2 BtGP team
REPORT ON THE OUTCOMES OF STAGE 2: COHORT 2 AND
PROGRESS ON STAGE 3: COHORT 2
31st January 2018 to 31st August2018
Prepared for the Department for Innovation and Skills
This project is supported by funding from the South Australian Government through the Department for Innovation and Skills and the Flinders University of South Australia.
Acknowledgement: Many people have been involved both directly and indirectly in the Bridging the Gap project and the accompanying research, not the least of whom have been the pre-service teachers of secondary science, the mentor teachers in Government, Catholic and Independent schools, as well as the many secondary students in science classes taught by the Bridging the Gap pre-service teachers. Thanks also, must go to the industry mentors who so graciously gave of their time and resources to help the pre-service teachers identify a STEM industry problem and also to the New Venture Institute in so ably assisting the pre-service teachers in the translation and communication of the industry problem, with the help of Flinders research scientists, into some possible solutions.
Flinders Project Team: Carol Aldous, Aidan Cornelius-Bell, David Jeffries, Narmon Tulsi, Stella Vosniadou.
Department for Innovation and Skills: Ben Samy.
Industry Partners: APA Group-Australian Gas Networks, BAE Systems Australia, Basil Hetzel Institute for Translational Health Research, Beach Energy, Department of Human Services, New Venture Institute, REDARC, SAGE Automation, SA Power Networks, SA Water, SAHMRI and SIMEC Mining.
© 2018 Carol R. Aldous, Flinders University
Cover design and layout by Aidan Cornelius-Bell
Published online by Flinders University (Bridging the Gap Project)
https://bridgingthegap.edu.au/publications/
ISBN: 978-1-925562-29-3

3 Research report No.3 to DIS on outcomes of Stage 2: Cohort 2 and progress on Stage 3: Cohort 2 BtGP team
EXECUTIVE SUMMARY: RESEARCH REPORT NO 3 Background to the Report
What is the Bridging the Gap Project (BtGP)?
BtGP is an innovation1 in pre-service teacher education involving student-teachers of secondary science undertaking a short-term STEM2 industry engagement experience. The project is jointly funded by the Department of Industry and Skills and Flinders University.
Project Vision
To investigate the potential to increase secondary school student interest in STEM by forging connections between different communities of practice namely university teacher education, schools, centres of innovation, business and industry and government departments by engaging preservice teachers in an industry placement (see Figure 2 page 9).
Project Objectives
Equip a cohort of future STEM teachers with the skills and confidence to build effective and sustainable partnerships with industry, congruent with a spirit of enterprise;
Strengthen these teachers’ ability to interpret and translate how STEM is utilised in the workplace into inspiring and stimulating contexts for students;
Enhance these pre-service teachers’ capacity to innovate and create new curricula and resources for the learning and teaching of secondary science that is congruent with creative Problem-Solving and contemporary science; and
Enable a shift in secondary school students’ mindset regarding the relevance of STEM in society.
Project Structure
The project occurs in three-stages.
Stage 1: create and maintain a web-based platform of resources;
Stage 2: preservice science teachers undertake a STEM industry placement for 3 weeks at 4 hours per week and subsequently develop units of work (see Figure 4 page 13); and
Stage 3: preservice teachers undertake final teaching practicum in STEM-focused school.
Four cohorts of student-teachers are cycling through the project stages.
Cohort 1: commence Stage 2 in October 2016 and Stage 3 in May 2017;
Cohort 2: commence Stage 2 in October 2017 and Stage 3 in May 2018;
Cohort 3: commence Stage 2 in October 2018 and Stage 3 in May 2019; and
Cohort 4: commence Stage 2 in October 2019 and Stage 3 in May 2020.
1Innovation in an education context is defined as the process of assembling and maintaining a novel alignment of ideas, practices and actors to respond to site-specific issues and or to pursue a vision (Tytler, R., Symington, D., Smith, C. and Rodrigues, S.(2008) An innovation framework based on best practice exemplars from the Australian School Innovation in Science, Technology and Mathematics (ASISTM) Project Canberra: Common wealth of Australia. 2STEM refers to Science, Technology, Engineering and Mathematics.

4 Research report No.3 to DIS on outcomes of Stage 2: Cohort 2 and progress on Stage 3: Cohort 2 BtGP team
Research Method and Plan
Question: “What is the relationship between pre-service teacher industry engagement, entrepreneurial creative thinking and secondary student engagement and entry into STEM”.
Data Collection Stage 2: pre-service teachers respond to a purpose-designed questionnaire and focus group interviews, pre and post the industry experience.
Stage 3: secondary school students respond to the PISA3 2006/2015 attitudes, engagement and motivation in science inventory, pre and post the preservice teacher practicum. Interviews were conducted with mentor teachers and focus groups with pre-service teachers post the teaching practicum.
Foci for Research Report No 3 Stage 2: Industry Placement Results: Cohort 2 Seventeen pre-service teachers working in groups of two or three, engaged with seven industry partners viz APA Australian Gas Works, Basil Hetzel Institute, Human Services, SAGE Automation, SA Power Networks and SIMEC Mining.
Findings concerning the Pre-service teacher perceptions of the industry experience 1. Survey Results Pre-service teachers were surveyed along four dimensions pre and post the industry engagement activity. Dimensions surveyed: Confidence going into a STEM Industry, Teaching and Learning Innovations, View of STEM and STEM Industries, Creativity and Problem-Solving in STEM. The number of student-teachers undertaking the survey pre was n= 16, the number post was n= 17.
Pre-service teachers’ confidence about going into an industry engagement experience had increased by 18 mean percentage points following the industry visit;
Pre-service teachers’ perceptions of creativity in STEM had increased by almost seven and a half mean percentage points following the industry experience;
Pre-service teachers’ view of STEM Industries had increased by five mean percentage points following the industry experience;
Pre-service teachers’ felt more cognitively enabled with skills and abilities in teaching and learning STEM by nearly four mean percentage points, following the industry placement; and
The largest percentage agreement for any dimension pre or post was that for post Creativity and Problem-Solving in STEM with 90 per cent agreement.
2. Focus Group Interviews Focus group interviews were conducted pre (n=8 people) and post (n=13 people) the industry experience with the pre-service teacher using open-ended questions based on the themes/dimensions stated above.
3 PISA stands for the Programme for International Student Assessment conducted among OECD nations in Science, Mathematics and Reading in three yearly cycles.

5 Research report No.3 to DIS on outcomes of Stage 2: Cohort 2 and progress on Stage 3: Cohort 2 BtGP team
The pre-service teachers expressed positive views, in each dimension viz Confidence going into a STEM Industry, Creativity and Problem-Solving in STEM, View of STEM industries and Teaching and Learning Innovations in STEM following the industry experience.
This finding, of an increase in percentage agreement from pre to post the industry experience, in all four dimensions of the pre-service teacher survey for Cohort 2, compares with Cohort 1 where an increase in the dimension View of STEM and STEM industries only was found. Consequently, it can be inferred that with each iteration(s) of the Bridging the Gap project, further connections between science and society can be developed which have the potential to be employed in creating innovative pedagogy in STEM by the student-teachers.
The industry engagement activity in Bridging the Gap Project is positively impacting pre-service teachers’ perceptions of STEM not only in the context of industry but also in teaching and learning and creative problem-solving. Stage 3: Progress on School Placement Findings: Cohort 2
Thirteen BtGP pre-service teachers distributed across 12 schools, undertook their final year teaching practicum in Cohort 2. Secondary students in science classes taught by the pre-service teacher answered the PISA 2006/2015 attitudes, engagement and motivation in science inventory pre and post the pre-service teachers’ practicum.
Findings concerning the Secondary school students 3. Secondary students survey data (Matched sample) In a matched sample of n= 106 cases, a paired sample T-test revealed 5 dimensions of the PISA 2006/2015 attitudes, engagement and motivation in science inventory, to be highly significant pre to post. These are Science self- efficacy, Science self-concept, Science teaching using investigations, Science related activities and importantly Future-oriented Science motivation.
PISA survey findings indicate that the Bridging the Gap project and its industry engagement is positively impacting students in secondary schools through the activities of its pre-service teachers on teaching practicum.

6 Research report No.3 to DIS on outcomes of Stage 2: Cohort 2 and progress on Stage 3: Cohort 2 BtGP team
TABLE OF CONTENTS Executive Summary: Research Report No 3 ........................................................................................................ 3
List of Tables ........................................................................................................................................................ 7
List of Figures ....................................................................................................................................................... 7
1. Purpose of the report ................................................................................................................................. 8
1.1 Principal foci for reporting ..................................................................................................................... 9
1.2 The stated Project requirements ........................................................................................................... 9
2. The Research Method and Plan ............................................................................................................... 10
2.1 Stage 2: ................................................................................................................................................ 10
2.2 Stage 3: ................................................................................................................................................ 12
3. The Industry Experience Explained .......................................................................................................... 13
4. Stage 2: Initial survey and interview Pre and Post results compared: Cohort 2 .................................... 14
4.1 Findings ................................................................................................................................................ 15
4.2 Summarising the Differences in Mean Percentage Agreement Pre to Post ....................................... 18
4.3 The Size and Direction of the Difference Pre to Post Industry Engagement ....................................... 23
4.4 Discussion and Conclusion................................................................................................................... 24
5. Stage 3: Progress made with survey data Pre and Post compared: Cohort 2 ........................................ 25
5.1 Mentor Teacher Conference ............................................................................................................... 25
References ......................................................................................................................................................... 26
Appendix 1: Conference program ..................................................................................................................... 27

7 Research report No.3 to DIS on outcomes of Stage 2: Cohort 2 and progress on Stage 3: Cohort 2 BtGP team
LIST OF TABLES Table 1: Industry issues and questions addressed by Cohort 2 pre-service teachers ...................................... 14
Table 2: Industry Experience Survey Results Pre (N=16) Post (N=17) .............................................................. 19
Table 3: Industry Survey Results Pre (n= 16), Post (n=17) with Percentage not sure ....................................... 21
Table 4: Mean percentage agreement Pre to Post Industry experience .......................................................... 23
Table 5: Paired samples T-testing conducted on n=106, pre and post student-teacher practicum. ................ 25
LIST OF FIGURES Figure 1: Stylised diagram showing three cycles of Bridging the Gap Project (BtGP), represented by three cohorts of pre-service science teachers from June 2016 through to 2019. ........................................................ 8
Figure 2: The various communities of practice assembled to pursue a vision NB: To investigate the potential to increase secondary school student interest in STEM by forging connections between university teacher education, schools and business & industry by engaging pre-service science teachers in short term STEM industry placement .............................................................................................................................................. 9
Figure 3: Stylised view of the Research Plan for Stage 2 and Stage 3 of BtGP ................................................. 10
Figure 4: Phases of pre-service teacher industry engagement .......................................................................... 13
Figure 5: Bar graph showing mean percentage agreement pre and post the industry experience for each of the four dimensions .......................................................................................................................................... 23
Figure 6: Direction and size of difference pre to post industry engagement. ................................................. 23

8 Research report No.3 to DIS on outcomes of Stage 2: Cohort 2 and progress on Stage 3: Cohort 2 BtGP team
1. Purpose of the report
This paper reports on Stage 2 and progress made on Stage 3 with cohort 2 of a three-stage project entitled Improving student interest in STEM through Preservice Teacher Industry Engagement: Bridging the Gap between knowledge creation and its application in industry and society (herein referred to as Bridging the Gap Project: BtGP) funded by the South Australian Department for Industry and Skills (primary sponsor) and Flinders University, Adelaide Australia.
A diagram indicating the cycles of the BtGP and its respective stages is depicted diagrammatically in Figure 1. A red hash indicates the stages and cohort of preservice science teachers reported on in this paper.
Figure 1: Stylised diagram showing three cycles of Bridging the Gap Project (BtGP), represented by three cohorts of pre-service science teachers from June 2016 through to 2019.
The project elaborates four objectives. These are to:
(1) Equip a cohort of future STEM teachers with the skills and confidence to build effective and sustainable partnerships with industry, congruent with a spirit of enterprise;
(2) Strengthen these teachers’ ability to interpret and translate how STEM is utilised in the workplace into inspiring and stimulating contexts for students;
(3) Enhance these pre-service teachers’ capacity to innovate and create new curricula and resources for the learning and teaching of secondary science that is congruent with creative Problem-Solving and contemporary science;
(4) Enable a shift in secondary school students’ mindset regarding the relevance of STEM in society.
For Cohort 2, the outcomes of Stage 2 and progress made in Stage 3 of the BtGP are reported against these four objectives.
As indicated in Figure 1 the opportunity to extend the project to a third cycle with a third group of pre-service science teachers exists. Indeed Cohort 3 students are currently being prepared to undertake an industry engagement in October 2018.
Novel Alignment of Communities of Practice: Defining innovation in the context of BtGP

9 Research report No.3 to DIS on outcomes of Stage 2: Cohort 2 and progress on Stage 3: Cohort 2 BtGP team
In the education context an innovation may be defined as “the process of assembling and maintaining a novel alignment of ideas, practices and actors to respond to site-specific issues and/or to pursue a vision” (Tytler, Symington, Smith & Rodrigues, 2008). A diagram depicting the novel alignment of players and communities of practice within the BtGP is given in Figure 2.
Figure 2: The various communities of practice assembled to pursue a vision NB: To investigate the potential to increase secondary school student interest in STEM by forging connections between university teacher education, schools and business & industry by engaging pre-service science teachers in short term STEM industry placement.
Since each stage of the project is interdependent on every other stage, the project is best viewed in its entirety as an integrated, interacting system or whole. The synergy arising from different communities of practice working together at every stage of the project, has the likelihood of giving rise to outcomes that are more than the sum of any individual stage or part. Consequently, the partial findings of this report will be both refined and built upon by the future findings of a final report.
1.1 Principal foci for reporting The foci of the project objectives for this report reside largely with the preservice teachers of secondary science
1.2 The stated Project requirements Stage 2: Industry Engagement and ongoing communication between communities of practice
The implementation of the second stage of BtGP involves selected pre-service teachers of secondary science:
• being placed with a STEM industry partner for a period of three weeks for approximately four hours per week supported by University Personnel;

10 Research report No.3 to DIS on outcomes of Stage 2: Cohort 2 and progress on Stage 3: Cohort 2 BtGP team
• engaging with STEM business partners with the goal of developing units of work and other teaching resources that showcase STEM as a human endeavour in line with the Australian Curriculum applicable for students in schools; and
• gaining contextual knowledge in order to innovate learning and teaching through the translation of workplace STEM into inspiring and stimulating contexts for students in schools.
Stage 3: Placement of pre-service teachers in STEM Industry focused schools
The implementation of the third stage of BtGP requires that at least 10 pre-service teachers of secondary science:
• undertake their final six-week practicum in a school with an established industry partner; • are mentored by schoolteachers with experience in industry partnership along with the
creating innovative science learning and teaching practices in order to assist pre-service teachers trialling the curriculum and teaching resources developed during Stage 2 of the project.
Finally, mentor teachers are to be:
• invited to participate in a full day conference to enable dialogue between the University and schools regarding the industry engagement experience.
2. The Research Method and Plan
The research schema for Stage 2 and Stage 3 of the BtGP project is given in Figure 3.
Figure 3: Stylised view of the research plan for Stage 2 and Stage 3 of BtGP.
The overarching research question for the project is “What is the relationship between pre-service teacher industry engagement, entrepreneurial and creative thinking and student engagement and entry into STEM”.
2.1 Stage 2: Population under study: Cohort 2 Pre-service teachers.
Stage 2– STEM Industry EngagementStage 3 – Pre-service Teacher
Placement
Pre Post Pre Post
Questionnaire and Focus Group
– Pre-service Teachers
Questionnaire– Industry Experts
Telephone Survey– Mentor Teachers + field notes booklet
Questionnaire and Focus Groups–
School Students
Questionnaire and Focus Group
– Pre-service Teachers
Questionnaire and Focus Group
– Pre-service Teachers
Questionnaire– Industry Experts
Questionnaire School
Students
Questionnaire Research Scientists

11 Research report No.3 to DIS on outcomes of Stage 2: Cohort 2 and progress on Stage 3: Cohort 2 BtGP team
Participants comprised 17 pre-service teachers (n=17) undertaking curriculum studies in secondary science. Of these, 10 were graduate students enrolled in the first year of a Master of Teaching degree (n=10) and 7 were enrolled in their third year of a double degree (n=7), Bachelor of Education and Bachelor of Science.
Cohort 2 participants ranged in age from 20 to 38 years with a mean age of 25 years. Of these 5 were male and 12 were female.
Data collection Survey data were collected from pre-service teachers, pre and post the industry experience using an online format through the BtGP website. Focus group interviews with the pre-service teachers were also conducted pre and post the industry engagement visits.
Instruments A purpose-designed questionnaire was developed for the study. Items were written to tap the following dimensions. These are:
• Confidence going into a STEM industry; • Teaching and learning innovations; • View of STEM and STEM Industries; and • Creativity and Problem-Solving in STEM.
Student-teachers responded to each of the items on a five-point Likert scale, ranging from strongly disagree, disagree, not sure, agree and strongly agree. Strongly disagree was rated 1, disagree 2, not sure 3, agree 4 and strongly agree 5. Consequently, means greater than or equal to three (≥ 3) are considered positive while means less than three (< 3) are considered negative.
Focus group interviews conducted pre and post, probed student thinking concerning:
• What they hoped to get out of the industry placement; • How the industry placement may benefit their understanding of the connection between
science knowledge and its application in society in terms of, o their own teaching; o their future students;
• What they understood about science as a human endeavour; • Whether creativity was needed in science; and • How they have been innovative and creative in their science teaching; • How confident and prepared they felt going into the industry placement.
Response Rate: Cohort 2
Pre-service Teacher Surveys Sixteen student-teachers completed the pre-survey (n= 16). Of these five were male and 11 were female.
All seventeen pre-service teachers in cohort 2 completed the post-survey (n=17) of whom five were male and 12 were female.

12 Research report No.3 to DIS on outcomes of Stage 2: Cohort 2 and progress on Stage 3: Cohort 2 BtGP team
Pre-service Teacher Focus groups Two focus groups (n=4; n=4) comprising eight students in total were conducted prior to the industry experience. Of these four were male, four were female and three were Masters’ students and five were Double degree students.
Two focus groups (n=6; n=7) totalling 13 students were conducted post the industry engagement. Of the 12 participants, three were male, ten were female, eight were Master of teaching students and five were Double degree students.
2.2 Stage 3: Population under study: Cohort 2
Pre-service teachers on Final Practicum Thirteen BtGP students in Cohort 2 undertook their final year teaching practicum. Another four for health and/or personal reasons deferred their final placement until the end of 2018 or semester one next year. Nine students undertook an 8-week block, three a 10-week extended block and one a 6-week placement in an Australian owned international school in Malaysia. The three extended placements were undertaken in rural South Australia by students specially selected for that purpose. The 13 students were distributed across 12 schools of which seven were government, two Catholic and three Independent of which one was an Australian based international school. All project schools had a special interest in STEM.
Consequently, participants under survey in Stage 3 of the project were secondary students in classes taught by the BtGP student-teachers who were undertaking their final year practicum.
Data collection: Cohort 2
Secondary school students Pre and post survey data were collected from secondary school students who had agreed to participate in the research; in secondary schools who had volunteered to be part of the BtGP project. Follow up focus group interviews with selected individual secondary school students were also conducted.
Mentor Teachers Both telephone and face to face interviews, depending on opportunity and preference for the interviewee, were conducted (and indeed are still being conducted) with mentor teachers involved in the project.
Instruments: Cohort 2 As with previous rounds in the project items from the PISA 2006/ 2015 survey relating to student engagement were used in developing the secondary student questionnaire. These dimensions are Enjoyment of science, Science self-efficacy, General value of science, Personal value of science, Science related activities, School preparation for science career, Student information on science careers, Future-oriented science motivation, Science teaching interaction, Science teaching: hands-on activities, Science teaching: student investigation, Science teaching: focus on models or applications, Instrumental motivation to learn science and Science self-concept.
13 Research report No.3 to DIS on outcomes of Stage 2: Cohort 2 and progress on Stage 3: Cohort 2 BtGP team
Mentor teacher interviews invited discussion around aspects of the pre-service teacher’s placement and their unit of work with respect to each of the following:
• engagement and relationship with students; • utilization of Science as a human endeavor; • Pedagogy, teaching strategies and innovative and creative approaches, and • Links to STEM Industries.
Response Rates: Secondary Student Surveys (2017-2018)
In total, 213 pre-surveys and 298 post surveys have been received. Of these, 106 surveys have been matched pre and post for detailed analyses. This yields a Power = 0.8 able to detect medium-sized effects at the critical level of α =0.01 (Cohen, 1992). Some preliminary analyses of the latest combined figures (2017- 2018) have been conducted and are reported briefly here.
Secondary Student Focus group interviews (2018) To date four focus group interviews have been conducted with secondary school students willing to be involved with the project.
Mentor teacher Interviews (2018) Separate interviews with six mentor teachers from across three schools have been conducted.
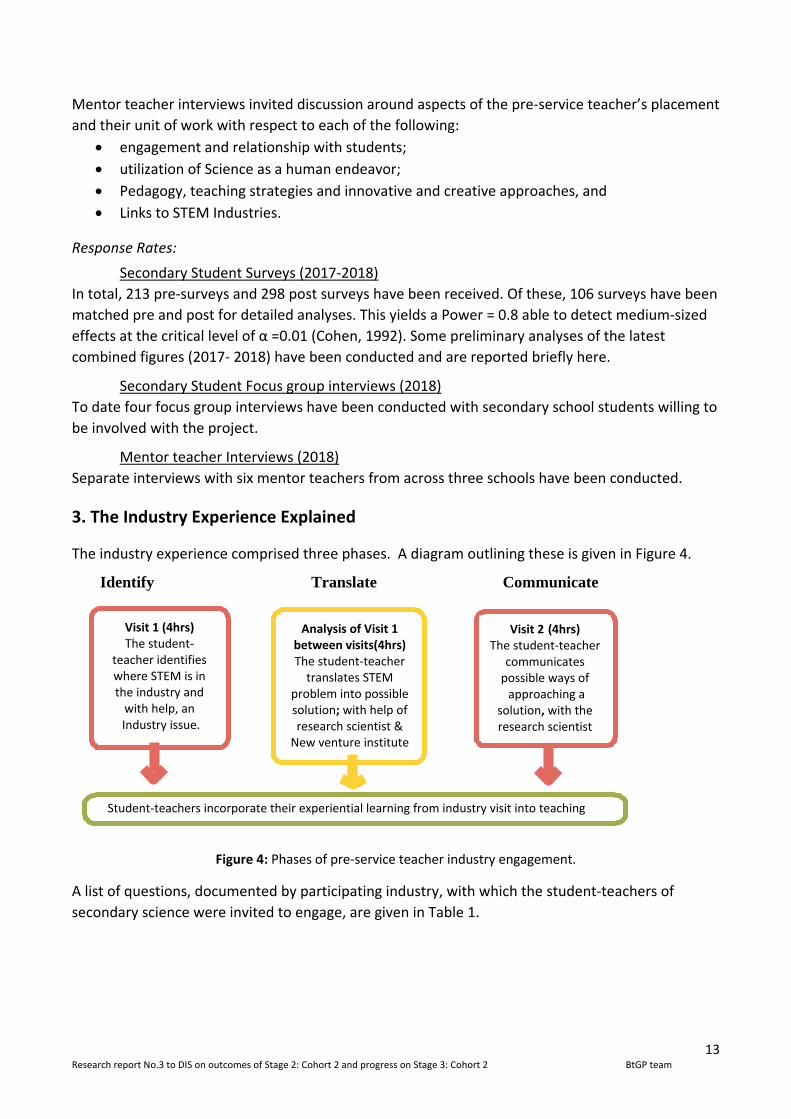
3. The Industry Experience Explained
The industry experience comprised three phases. A diagram outlining these is given in Figure 4.
Identify Translate Communicate
Figure 4: Phases of pre-service teacher industry engagement.
A list of questions, documented by participating industry, with which the student-teachers of secondary science were invited to engage, are given in Table 1.
Visit 1 (4hrs) The student-
teacher identifies where STEM is in the industry and
with help, an Industry issue.
Analysis of Visit 1 between visits(4hrs) The student-teacher
translates STEM problem into possible solution; with help of research scientist &
New venture institute
Visit 2 (4hrs) The student-teacher
communicates possible ways of approaching a
solution, with the research scientist
Student-teachers incorporate their experiential learning from industry visit into teaching

14 Research report No.3 to DIS on outcomes of Stage 2: Cohort 2 and progress on Stage 3: Cohort 2 BtGP team
Table 1: Industry issues and questions addressed by Cohort 2 pre-service teachers.
Business and Industry Problem or Question Posed for Ideation and Investigation APA Australian Gas Works
How can gas leaks travelling horizontally be allowed to surface quickly into safe areas?
Basil Hetzel Institute (SA Health): QEH
How can radioactive components generated during nuclear medicine treatments be disposed of safely and efficiently?
Human Services Identify possible strategies (e.g. IT) we can deploy to manage a multi-disciplinary team with a complex human resources matrix to best advantage
SAGE Automation How can the components of expensive but obsolete control cabinets be recycled?
SAHMRI How can awareness about spinal cord injuries be raised in the context of STEM? How can SAHMRI best connect its STEM Program to students, teachers and parents in schools?
SA Power Networks Looking into a future that sees the introduction of electric cars – How can SA Power best develop a network of charging stations that meet the energy demands required
SIMEC Mining How can SIMEC best communicate its industry benefits and needs to students in schools and the wider public?
4. Stage 2: Initial survey and interview Pre and Post results compared: Cohort 2
The pre-service teachers of secondary science were surveyed along four dimensions before entering the industry experience. These were confidence, teaching and learning skills related to innovation in STEM, views of STEM industries as well as creativity and Problem-Solving in STEM.
The dimension of confidence was selected as an indicator of student self-efficacy to engage with new and challenging environments within the STEM industry setting. It was also used as an indicator of how well prepared the student-teachers were feeling going into the industry placement. It comprised of ten items.
Skills related to teaching and learning were selected as an indicator of how well students were cognitively engaging with the processes of science teaching and learning such as science inquiry skills, science as a human endeavour and STEM applications to society. It comprised of 12 items.
The dimension on views on STEM industries was selected as an indicator of the value that students placed on STEM-based industries and their relevance and importance both to society and their own science teaching. These views may help to formulate future orientations to learning science. It comprised of 11 items.
Since creativity has often been viewed as the antithesis of scientific rigour (Mc William, Poronnik & Taylor, 2008), the dimension of creativity in STEM was selected as an indicator of student understanding about creativity, creative Problem-Solving and innovation in STEM and STEM Industries. It comprised of 12 items.
The percentage agreement for each of the items, pre and post the industry engagement together with the mean, median and mode for each item is given in Table 2. The percentage agreement comprised the percentage of strongly agree and agree categories combined.

15 Research report No.3 to DIS on outcomes of Stage 2: Cohort 2 and progress on Stage 3: Cohort 2 BtGP team
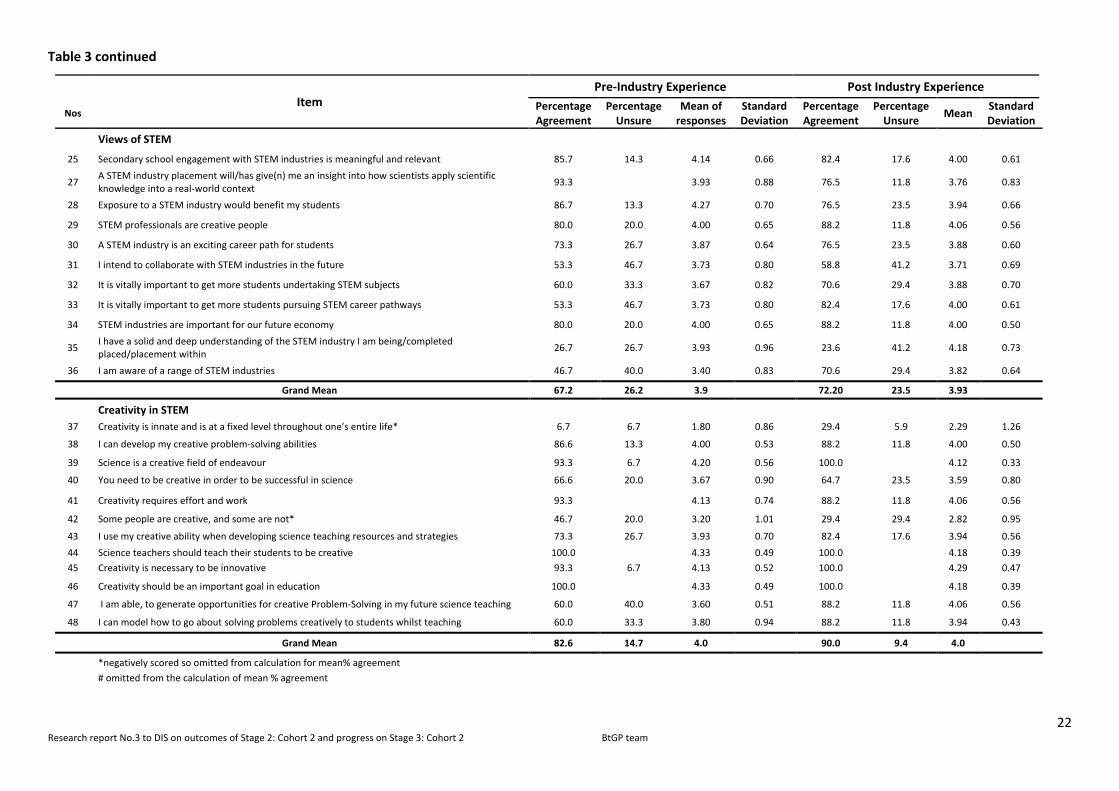
Table 3 documents the percentage agreement, percentage not sure, the mean and the standard deviation. What follows is a discussion around each of the stated dimensions.
4.1 Findings Confidence
Within the confidence dimension the overall mean percentage agreement increased by eighteen percentage points, pre to post the industry experience. Tables 2 and 3 indicate that all items related to student confidence increased post the industry experience. The largest increase in confidence was for item 7 I feel confident to make science an engaging and meaningful subject for students, closely followed by item 3 I feel confident to engage in scientific discussions with industry experts. The smallest increase was for item 9 I feel confident to make, a contribution, to the industry that I will be placed within.
These findings are consistent with focus group interviews concerning a discussion on how prepared and how confident the student-teachers felt going into the industry placement. The following comments were expressed prior to the industry placement:
I’m not sure what to fully expect. I haven’t really had much experience in science industries before. .... I’m looking forward to it, but I don’t feel like I can be confident going to something I’m not fully sure of
I don’t really have any preconceptions. I guess I’m kind of excited, less nervous.
I feel confident to approach anyone when it comes to learning … but when it comes to … trying to talk science with a scientist, maybe not 100% confident, because I don’t know all the fields, but yeah prepared.
The following comments were among those expressed post the industry placement:
It was really good … we did get to speak to a lot of engineers from a lot of different fields… we were seeing the kind of behind the scenes, all the design and constructing and …maintenance … but I think as university students we were able to have quite good conversations with those engineers, even though their knowledge was still far above us … everything we learned was through conversation …
I do think it was beneficial overall … the fact that, we actually, have real-life examples of how maths and science are actually being used, it’s a lot easier now to integrate it into the curriculum, kind of make things a bit more interesting for students.
Teaching and Learning
The mean percentage agreement increased by nearly four percentage points from pre to post the industry experience in the teaching and learning dimension. After industry placement students felt cognitively enabled with skills and abilities to teach STEM than they had prior to it. Importantly, for project objectives, the following items increased viz: item 16, I find it easy to use real-world STEM examples in my teaching; item 23 I can develop innovative teaching resources in science; Item 22 I am well prepared to engage with science as a human endeavor in my future science teaching; item 18 It’s important to understand how STEM industries operate in order to teach science; item 12 I have the skills to enable school students to think and act like scientists; item 20 I have a solid and deep understanding of how my teaching major is applied in a real-world context.

16 Research report No.3 to DIS on outcomes of Stage 2: Cohort 2 and progress on Stage 3: Cohort 2 BtGP team
In considering those items that had decreased from pre to post it is interesting to highlight item 15, this placement will increase my ability to effectively teach science as having decreased from pre to post. This reflects the students’ ability to reflect deeply on the statement and to discern that the repertoire of pedagogical content knowledge and pedagogical skills are neither mutually exclusive nor necessarily context dependent.
The pre-service teachers were found expressing the following comments during focus group discussion prior to the industry visit:
I don't think we've ever had any interaction with science industry full stop, in any part of Uni, so this helps to find the connection in our own heads... as well as in our work with kids.
So, I want to get skills from this to be able to bring real-world scenarios more into the classroom and hopefully keep those students engaged and not telling you every single lesson, why do we have to do this.
we learn a lot ... we'll learn about the real-life application, and the curriculum, but there's very rarely a connection between the two. So, any opportunity to make those connections, even in our own heads before we expect the students to, it's really going to help us, then the students to make that …
The following comments are among those expressed post the industry visit:
I think it was helpful because we always learn at Uni about project-based learning, and problem-based learning, but often it's, kind of, just words and I think, when we went to the industry, we were actually given problems. And so, we had to use STEM skills. … We had to use that, and then give back a solution to them. So, I think that was helpful '… So, it was a good way to learn those actual hands-on skills instead of just being told about them.
… it was useful, in that it definitely gives …more of a local understanding to being able to connect science to the real-world and show why it's applicable to a student. So I could have, before, talked theoretically about how they can use it in real-life in the future, but now, I can actually relate it to an actual company here within Adelaide, which again, creates a sense of community, localisation, … more engagement within the students,… plus, you've then got the connection and networking there … to do an excursion or something.
Views of STEM Industries
The mean percentage agreement on student-teacher self- reported perceptions regarding their views of STEM industries increased by five percentage points from pre to post. An increase in percentage agreement was observed for seven of the 11 items. Of note is the shift in item 33 It is vitally important to get more students pursuing STEM career pathways by 29 percentage points followed by item 36 I am aware of a range of STEM industries by nearly 24 percentage points.
Other items to increase are items, 29, 30, 31, 32, and 34. These are listed below:
STEM professionals are creative people;
A STEM industry is an exciting career path for students;
I intend to collaborate with STEM industries in the future;
It is vitally important to get more students undertaking STEM subjects;
It is vitally important to get more students undertaking STEM career paths; and

17 Research report No.3 to DIS on outcomes of Stage 2: Cohort 2 and progress on Stage 3: Cohort 2 BtGP team
STEM industries are important for our future economy.
The following focus group comments were expressed prior to the industry visit:
As soon as I find out where my placement will be, I'll research it as much as I can. Find out what they do, where they are, what their vision is. Similar, to that workshop we did a few weeks ago, so when I go in there, I'm not asking silly questions. I can ask them more specific questions about their industry.
I'd say, I'm fairly ready, to jump in and learn, and give back to what they're working on, I think it comes down to the ability of not just myself, but others, people in industry to be able to communicate with me and each other.... They're professionals, I'm going to be a professional...
The following comments are among some typically expressed post the industry visit:
I think that's what we mainly gained out of the experience …showed how they were using each component of science, so biology, physics, chem, whatever. And it just felt a bit more legitimate than what you see at Uni, and they kind of just go, "Oh yeah. They do use it in industries", but you don't get to see it. Whereas, … coming from the people who use it themselves, it just seems that bit more legitimate, and that bit easier to grasp how they are using all the different components of science, and maths, and engineering every day, essentially.
The experience that we had, particularly with the biology aspect, was really, interesting. The nuclear physics … had a really, good understanding of what they needed to do… I think I got out what I expected from the experience.
So, we went to the Basil Hetzel Research Institute, and so in the sense that-- because they're doing research, and it's new knowledge and stuff, I found that was really interesting to see what people are sort of working on at the moment, what they're researching. And we went and saw their research presentation day, so we saw all the honours and the PhD people were researching as well. And I found that really, interesting, like you could take those ideas of this is what people are doing, to do that human endeavour side of things like this is how it's helping people. So, I thought it was good to see that and how their research is linked with the hospital and they're using that practically.
Creativity in STEM
The mean percentage agreement increased nearly seven percentage points from pre to post in the creativity in STEM dimension. Interpreting the percentage agreement pre and post can be difficult to report as some items require a negative response, these being items 37 and 42. However of the ten items used in calculating the mean percentage agreement six items increased pre to post while another two remained the same that being one hundred percent agreement both pre and post. Of note are the positive increases by 28 percentage points for both item 47 I am able, to generate opportunities for creative Problem-Solving in my future science teaching and item 48 I can model how to go about solving problems creatively to students whilst teaching.
Other notable items to increase are item 43 I use my creative ability when developing science teaching resources and strategies, item 45, Creativity is necessary to be innovative and item 38 I can develop my creative problem-solving abilities.
The two items which remained the same are item 44 Science teachers should teach their students to be creative and item 46 creativity should be an important goal in education.

18 Research report No.3 to DIS on outcomes of Stage 2: Cohort 2 and progress on Stage 3: Cohort 2 BtGP team
The following focus group comments were expressed prior to the industry visit with respect to creativity:
So creative, creativity is something you're supposed to be developed when you study and as a teacher you definitely want your students to become more creative but it’s really, we don’t have the theory support and I don’t have any like practical experience about how to create my own creativity or my students creativity so this is what I want to get from the project.
… I’m supposed to be able to learn from this project is to meet like scientists and to know who they are and what they're concerned of and what the project that they're doing now so what’s the real situation whilst they're working and so talk about creativity how they usually… find their problem, solve their problem and so what’s the way of their thinking and this is what I want to know and want my students to know as well. …I think like everything that we have today has evolved from someone’s original idea and the idea at the time … was probably completely abstract but its refining that through creativity… that gets us to where we are today, you don’t have new ideas if you're not creative like we would just be exactly the same place we were 100 years ago if no one was creative enough to think of what if we did this.
The following focus group comments were expressed post the industry visit with respect to creativity:
I don't know how I feel about the creativity. I feel like it's inside so you sort of have to be creative because you have to find the problem, figure out what experiment you're going to run, do all of that and you have to be creative in thinking about that anyway. We did see when we were doing the research day, some people coming up with different solutions and different ways of doing things that haven't been done before, which is interesting, so you could talk about science creativity in that sort of sense.
… and I went to SAHMRI, and we met someone who does spinal cord research and they were talking about how they can use PET scans, not just MRI, to see live imaging of what's actually happening in a spinal cord injury … and if you could get that footage and actually bring it into the classroom, that's amazing. So, I mean STEM is part of technology as well, so getting kids … to come up with ideas on how to improve on the current technology, that's really, amazing. But you definitely see creativity, in science. I mean, you can't come up with a solution if you can't think out of the box.
4.2 Summarising the Differences in Mean Percentage Agreement Pre to Post The overall mean percentage agreement for each of the dimensions described above, are represented pictorially in Figure 5.

19 Research report No.3 to DIS on outcomes of Stage 2: Cohort 2 and progress on Stage 3: Cohort 2 BtGP team
Table 2: Industry Experience Survey Results Pre (N=16) Post (N=17) Cohort 2
1=strongly disagree, 2=disagree, 3=not sure, 4=agree, 5=strongly agree Pre-Industry Experience Post Industry Experience
No Item Percentage Agreement Mean Median Mode Percentage
Agreement Mean Median Mode
Confidence
1 I feel confident going into the industry placement 50.0 3.44 4 4 64.7 3.71 4 4
2 I feel confident doing practical science activities with my students 56.3 3.50 4 4 82.4 3.88 4 4
3 I feel confident to engage in scientific discussions with industry experts 31.3 2.94 3 3 58.8 3.59 4 4
4 I feel confident to teach content from my science major to students at a range of secondary school levels 68.8 3.81 4 4 82.4 4.12 4 4
5 I feel confident to be innovative in creating new approaches to teaching in science 37.6 3.25 3 3 58.8 3.59 4 4
6 I feel confident in my level of science knowledge and understanding # 68.8 3.81 4 4 Missing
7 I feel confident to make science an engaging and meaningful subject for students 56.3 3.75 4 3 88.2 4.00 4 4
8 I feel confident to make STEM an attractive option for students 37.5 3.31 3 3 64.7 3.65 4 4
9 I feel confident to make a contribution to the industry that I will be placed within 25.1 2.88 3 3 29.4 3.12 3 3
10 I feel confident inquiring into phenomena and testing ideas within my field of expertise 40.0 3.33 3 3 58.8 3.47 4 4
Mean Percentage Agreement 47.2 3.4 65.4 3.7 Teaching and Learning
11 I model thinking and acting like a scientist with my students whilst teaching 62.5 3.69 4 4 58.8 3.59 4 4
12 I have the skills to enable school students to think and act like scientists 53.3 3.60 4 3,4 64.7 3.71 4 4
13 It is vitally important to teach science as a human endeavour 100.0 4.40 4 4 94.1 4.29 4 4
14 Entrepreneurship skills are vitally important in science teaching and learning 60.0 3.60 4 4 64.7 3.71 4 4
15 This placement will increase my ability to effectively teach science 73.3 3.93 4 4 29.4 3.12 3 3
16 I find it easy to use real-world STEM examples in my teaching 20.0 3.00 3 3 52.9 3.41 4 4
18 It’s important to understand how STEM industries operate in order to teach science 66.6 3.60 4 4 82.4 3.82 4 4
19 Adding real-world examples of STEM industry processes into science unit plans would be beneficial 93.3 4.13 4 4 82.4 4.12 4 4
20 I have a solid and deep understanding of how my teaching major is applied in a real-world context 80.0 2.80 3 2 82.4 3.00 3 3
22 I am well prepared to engage with ‘Science as a Human Endeavour’ in my future science teaching 53.3 3.60 4 3,4 70.6 3.71 4 4
23 I can develop innovative teaching resources in science 46.6 3.53 3 3 76.5 3.88 4 4
24 Science Inquiry skills are important in science teaching 100.0 4.47 4 4 94.1 4.24 4 4 Mean Percentage Agreement 67.4 3.7 71.1 3.7

20 Research report No.3 to DIS on outcomes of Stage 2: Cohort 2 and progress on Stage 3: Cohort 2 BtGP team
Table 2 continued
1=strongly disagree, 2=disagree, 3=not sure, 4=agree, 5=strongly agree Pre-Industry Experience Post Industry Experience
No Item Percentage Agreement Mean Median Mode Percentage
Agreement Mean Median Mode
Views of STEM
25 Secondary school engagement with STEM industries is meaningful and relevant 85.7 4.14 4 4 82.4 4.00 4 4
27 A STEM industry placement will give me an insight into how scientists apply scientific knowledge into a real-world context 93.3 3.93 4 4 76.5 3.76 4 4
28 Exposure to a STEM industry would benefit my students 86.7 4.27 4 4 76.5 3.94 4 4
29 STEM professionals are creative people 80.0 4.00 4 4 88.2 4.06 4 4
30 A STEM industry is an exciting career path for students 73.3 3.87 4 4 76.5 3.88 4 4
31 I intend to collaborate with STEM industries in the future 53.3 3.73 4 3 58.8 3.71 4 4
32 It is vitally important to get more students undertaking STEM subjects 60.0 3.67 4 4 70.6 3.88 4 4
33 It is vitally important to get more students pursuing STEM career pathways 53.3 3.73 4 3 82.4 4.00 4 4
34 STEM industries are important for our future economy 80.0 4.00 4 4 88.2 4.00 4 4
35 I have a solid and deep understanding of the STEM industry I am being placed within 26.7 3.93 4 4 23.6 4.18 4 4
36 I am aware of a range of STEM industries 46.7 3.40 3 3,4 70.6 3.82 4 4 Mean Percentage Agreement 67.2 3.9 72.2 3.9 Creativity in STEM
37 Creativity is innate and is at a fixed level throughout one’s entire life * 6.7 1.80 2 2 29.4 2.29 2 1
38 I can develop my creative problem-solving abilities 86.6 4.00 4 4 88.2 4.00 4 4
39 Science is a creative field of endeavour 93.3 4.20 4 4 100.0 4.12 4 4
40 You need to be creative in order to be successful in science 66.6 3.67 4 4 64.7 3.59 4 4
41 Creativity requires effort and work 93.3 4.13 4 4 88.2 4.06 4 4
42 Some people are creative, and some are not* 46.7 3.20 3 4 29.4 2.82 3 2
43 I use my creative ability when developing science teaching resources and strategies 73.3 3.93 4 4 82.4 3.94 4 4
44 Science teachers should teach their students to be creative 100.0 4.33 4 4 100.0 4.18 4 4
45 Creativity is necessary to be innovative 93.3 4.13 4 4 100.0 4.29 4 4
46 Creativity should be an important goal in education 100.0 4.33 4 4 100.0 4.18 4 4
47 I am able, to generate opportunities for creative Problem-Solving in my future science teaching 60.0 3.60 4 4 88.2 4.06 4 4
48 I can model how to go about solving problems creatively to students whilst teaching 60.0 3.80 4 3,4 88.2 3.94 4 4
Mean Percentage Agreement 82.6 3.8 90.0 3.8 * Negatively scored so omitted from calculation for mean % agreement

21 Research report No.3 to DIS on outcomes of Stage 2: Cohort 2 and progress on Stage 3: Cohort 2 BtGP team
Table 3: Industry Survey Results Pre (n= 16), Post (n=17) with Percentage not sure for Cohort 2.
Item
Pre-Industry Experience Post Industry Experience
No Percentage Agreement
Percentage Not sure
Mean of responses
Standard Deviation
Percentage Agreement
Percentage Not sure Mean Standard
Deviation Confidence
1 I feel confident going into the/another industry placement 50.0 31.3 3.44 0.96 64.7 35.3 3.71 0.59
2 I feel confident doing practical science activities with my students 56.3 25.0 3.50 0.97 82.4 11.8 3.88 0.70
3 I feel confident to engage in scientific discussions with industry experts 31.3 37.5 2.94 0.93 58.8 41.2 3.59 0.51
4 I feel confident to teach content from my science major to students at a range of secondary school levels 68.8 25.0 3.81 0.83 82.4 17.6 4.12 0.70
5 I feel confident to be innovative in creating new approaches to teaching in science 37.6 43.8 3.25 0.86 58.8 41.2 3.59 0.51
6 I feel confident in my level of science knowledge and understanding # 68.8 31.3 3.81 0.66 Missing
7 I feel confident to make science an engaging and meaningful subject for students 56.3 43.8 3.75 0.77 88.2 11.8 4.00 0.50
8 I feel confident to make STEM an attractive option for students 37.5 43.8 3.31 0.95 64.7 23.5 3.65 0.86
9 I feel confident to make a contribution to the industry that I will be placed within 25.1 37.5 2.88 1.02 29.4 52.9 3.12 0.70
10 I feel confident inquiring into phenomena and testing ideas within my field of expertise 40.0 40.0 3.33 1.18 58.8 29.4 3.47 0.72
Grand Mean 47.2 35.9 3.40 65.4 29.4 3.68
Teaching and Learning
11 I model thinking and acting like a scientist with my students whilst teaching 62.5 37.5 3.69 0.60 58.8 35.3 3.59 0.71
12 I have the skills to enable school students to think and act like scientists 53.3 46.7 3.60 0.63 64.7 35.3 3.71 0.59
13 It is vitally important to teach science as a human endeavour 100.0 4.40 0.51 94.1 - 4.29 0.77
14 Entrepreneurship skills are vitally important in science teaching and learning 60.0 33.3 3.60 0.74 64.7 29.4 3.71 0.99
15 This placement will/has increase(d) my ability to effectively teach science 73.3 26.7 3.93 0.70 29.4 47.1 3.12 0.86
16 I find it easy to use real-world STEM examples in my teaching 20.0 60.0 3.00 0.65 52.9 35.3 3.41 0.71
18 It’s important to understand how STEM industries operate in order to teach science 66.6 20.0 3.60 1.06 82.4 5.9 3.82 0.81
19 Adding real-world examples of STEM industry processes into science unit plans would be beneficial 93.3 6.7 4.13 0.52 82.4 11.8- 4.12 0.86
20 I have a solid and deep understanding of how my teaching major is applied in a real-world context 80.0 6.7 2.80 0.86 82.4 17.6 3.00 1.00
22 I am well prepared to engage with ‘Science as a Human Endeavour’ in my future science teaching 53.3 33.3 3.60 0.99 70.6 23.5 3.71 0.69
23 I can develop innovative teaching resources in science 46.6 46.7 3.53 0.83 76.5 23.5 3.88 0.60
24 Science Inquiry skills are important in science teaching 100 - 4.47 0.52 94.1 5.9 4.42 0.56
Grand Mean 67.4 31.8 3.70 71.1 24.6 3.72
# Item omitted from calculation
22 Research report No.3 to DIS on outcomes of Stage 2: Cohort 2 and progress on Stage 3: Cohort 2 BtGP team
Table 3 continued
Item
Pre-Industry Experience Post Industry Experience
Nos Percentage Agreement
Percentage Unsure
Mean of responses
Standard Deviation
Percentage Agreement
Percentage Unsure Mean Standard
Deviation Views of STEM
25 Secondary school engagement with STEM industries is meaningful and relevant 85.7 14.3 4.14 0.66 82.4 17.6 4.00 0.61
27 A STEM industry placement will/has give(n) me an insight into how scientists apply scientific knowledge into a real-world context 93.3 3.93 0.88 76.5 11.8 3.76 0.83
28 Exposure to a STEM industry would benefit my students 86.7 13.3 4.27 0.70 76.5 23.5 3.94 0.66
29 STEM professionals are creative people 80.0 20.0 4.00 0.65 88.2 11.8 4.06 0.56
30 A STEM industry is an exciting career path for students 73.3 26.7 3.87 0.64 76.5 23.5 3.88 0.60
31 I intend to collaborate with STEM industries in the future 53.3 46.7 3.73 0.80 58.8 41.2 3.71 0.69
32 It is vitally important to get more students undertaking STEM subjects 60.0 33.3 3.67 0.82 70.6 29.4 3.88 0.70
33 It is vitally important to get more students pursuing STEM career pathways 53.3 46.7 3.73 0.80 82.4 17.6 4.00 0.61
34 STEM industries are important for our future economy 80.0 20.0 4.00 0.65 88.2 11.8 4.00 0.50
35 I have a solid and deep understanding of the STEM industry I am being/completed placed/placement within 26.7 26.7 3.93 0.96 23.6 41.2 4.18 0.73
36 I am aware of a range of STEM industries 46.7 40.0 3.40 0.83 70.6 29.4 3.82 0.64 Grand Mean 67.2 26.2 3.9 72.20 23.5 3.93
Creativity in STEM 37 Creativity is innate and is at a fixed level throughout one’s entire life* 6.7 6.7 1.80 0.86 29.4 5.9 2.29 1.26
38 I can develop my creative problem-solving abilities 86.6 13.3 4.00 0.53 88.2 11.8 4.00 0.50
39 Science is a creative field of endeavour 93.3 6.7 4.20 0.56 100.0 4.12 0.33
40 You need to be creative in order to be successful in science 66.6 20.0 3.67 0.90 64.7 23.5 3.59 0.80
41 Creativity requires effort and work 93.3 4.13 0.74 88.2 11.8 4.06 0.56
42 Some people are creative, and some are not* 46.7 20.0 3.20 1.01 29.4 29.4 2.82 0.95
43 I use my creative ability when developing science teaching resources and strategies 73.3 26.7 3.93 0.70 82.4 17.6 3.94 0.56 44 Science teachers should teach their students to be creative 100.0 4.33 0.49 100.0 4.18 0.39 45 Creativity is necessary to be innovative 93.3 6.7 4.13 0.52 100.0 4.29 0.47
46 Creativity should be an important goal in education 100.0 4.33 0.49 100.0 4.18 0.39
47 I am able, to generate opportunities for creative Problem-Solving in my future science teaching 60.0 40.0 3.60 0.51 88.2 11.8 4.06 0.56
48 I can model how to go about solving problems creatively to students whilst teaching 60.0 33.3 3.80 0.94 88.2 11.8 3.94 0.43
Grand Mean 82.6 14.7 4.0 90.0 9.4 4.0
*negatively scored so omitted from calculation for mean% agreement
# omitted from the calculation of mean % agreement

23 Research report No.3 to DIS on outcomes of Stage 2: Cohort 2 and progress on Stage 3: Cohort 2 BtGP team
Figure 5: Bar graph showing mean percentage agreement pre and post the industry experience for each of the four dimensions.
It can be seen from Figure 5 that the largest mean percent agreement of the four dimensions listed is that for the post Creativity in STEM. This is followed by mean percentage agreement post View of STEM followed by post Teaching and Learning and lastly the post Confidence dimension.
4.3 The Size and Direction of the Difference Pre to Post Industry Engagement The direction and size of the mean differences in percentage agreement indicated graphically in Figure 5 are given in Table 4 and represented diagrammatically in Figure 6.
Table 4: Mean percentage agreement Pre to Post Industry experience
Dimension Pre Mean Percentage Agreement
Post Mean Percentage Agreement
Size of Difference
Creativity in STEM 82.6 90.0 7.4 View of STEM 67.2 72.2 5.0 Teaching and Learning 67.4 71.1 3.7 Confidence 47.2 65.4 18.2
Figure 6: Direction and size of difference pre to post industry engagement.
0 10 20 30 40 50 60 70 80 90 100
Confidence
Teaching and Learning
Views of STEM
Creativity in STEM
Percentage Agreement
Post-Industry Experience Pre-Industry Experience
0
5
10
15
20
Creativity inSTEM
View of STEM Teaching andLearning
Confidence
Perc
enta
ge c
hang
e in
m
ean
agre
emen
t
Percentage Change in Mean Agreement Pre to Post

24 Research report No.3 to DIS on outcomes of Stage 2: Cohort 2 and progress on Stage 3: Cohort 2 BtGP team
It can be seen from Table 4 and Figure 6 that changes for all dimensions pre to post are in the positive direction. The largest change is that for the Confidence dimension, followed by the Creativity in STEM dimension, then the View of STEM dimension and finally the Teaching and Learning dimension.
4.4 Discussion and Conclusion This is the second round of industry engagement undertaken in the STEM industry engagement: Bridging the Gap project. Lessons learned, from round one, of the project have been implemented in round two. The evidence of the effectiveness of lessons learned can be seen in the finding that in all four categories namely confidence, teaching and learning skills related to innovation in STEM, views of STEM industries as well as creativity and Problem-Solving in STEM, there has been a change from pre to post in the positive direction. This contrasts with round one where there was a change in the positive direction in only one dimension that being students self-reported perception on their views of STEM.
One of the strategies implemented was to develop a workshop prior to the industry engagement experience in which past alumni were invited to come and share their experiences about undertaking a STEM industry engagement activity – what they learned, what happened, what to expect and what they might do differently next time. These students also provided examples of the industry problems they were given, their presentations to industry, their units of work as well as example e-mails used in communicating with the industry partner. Further, a person from industry was also invited to come and share the industry perspective – their expectations, how to approach industry while providing some simple pointers about appropriate attire, punctuality and other matters.
Further some modifications were made to the translate phase of the New Venture Institute led workshop that involved changing the manner, in which, industry problems were pitched, to a more inclusive format. Additionally, increasing the number of research scientists available to assist students in the Problem-Solving and ideation process was also beneficial. This gave the student-teachers more confidence in presenting their ideas back to industry at the final visit. However, as with accessing industry partners, this step relies on, the availability and goodwill, of the research scientists from across the university.
Finally, in the assessment of the curriculum studies topic in which the industry engagement activity was conducted, students were able to re-present their industry presentation as part of the oral presentation component of the topic but this time linking it to their ideas for a STEM learning and teaching unit of work.
In answering the question has the Bridging the Gap Industry experience had an impact on student-teachers of secondary science, the answer according to the evidence documented herewith, would be, a resounding yes. That greater connections are being made, between science and society and their relationship to learning and teaching, which can then be translated into innovative and creative pedagogy, is evident in the following comment by one preservice teacher:
I think going into industry …looking at what problems could be and how you can apply those textbook theories and stuff to those problems … that's given me a new insight on how I can run a classroom,

25 Research report No.3 to DIS on outcomes of Stage 2: Cohort 2 and progress on Stage 3: Cohort 2 BtGP team
rather than how my teachers ran a classroom, which is what we all sort of feed off, of as teachers …we've got all these different ideas coming in and that's what has shaped us … it's new ideas.
5. Stage 3: Progress made with survey data Pre and Post compared: Cohort 2
The final objective of the BtGP project is to “enable a shift in secondary school students’ mindset regarding the relevance of STEM in society”. Evidence to date indicates that the activities of the BtGP are indeed having a flow-on effect to students in secondary schools.
Data using the paired samples T-Test on 106 cases with 0.8 power and α = 0.01 identifies five attitudinal (PISA 2006/15) factors that are being significantly impacted among secondary students in the BtGP project. These are Science self- efficacy, Science self-concept, Science teaching using investigations, Science related activities and importantly Future-oriented Science motivation. The size, of these effects, are considered medium to small.
Table 5: Paired samples T-testing conducted on n=106, pre and post student-teacher practicum.
Summary of significant factors – Paired Samples T-test, for α = 0.01 to 0.05
Factor
Mean Difference
Significance Level
Effect Size (Cohen's D)
Future-oriented science motivation -0.19 0.009** -0.26 Science related activities -0.10 0.046* -0.20 Science teaching uses investigations -0.24 0.007** -0.27 Self-concept in science -0.12 0.028* -0.22 Self-efficacy in science -0.10 0.008** -0.26
** significant at the 0.01 level *significant at the 0.05 level
5.1 Mentor Teacher Conference A full day mentor teacher conference was held on the 23rd March at the Flinders University, Tonsley campus. The theme of the conference was “STEM, Education and Industry: Transforming the rhetoric into reality”. It was attended by 30 participants involving 13 schools. A copy of the programme is given in appendix 1.
Report written and compiled by
Dr Carol Aldous: Project leader
28/09/18
26 Research report No.3 to DIS on outcomes of Stage 2: Cohort 2 and progress on Stage 3: Cohort 2 BtGP team
REFERENCES Cohen J. (1992) Quantitative methods in psychology: A power Primer Psychological Bulletin 112 (1) 155-159.
Mc William, E. Poronnik, P. &Taylor P. G (2008) Re-designing science pedagogy: Reversing the flight from science. Journal of Science Education and Technology, 17: 226-235.
Tytler, R. Symington, D., Smith, C. & Rodrigues, S. (2008) An innovation framework, based on best practice exemplars from the Australian School Innovation in Science, Technology and Mathematics (ASISTM) Project Department of Education, Employment and Workplace Relations, Canberra: Commonwealth of Australia.

27 Research report No.3 to DIS on outcomes of Stage 2: Cohort 2 and progress on Stage 3: Cohort 2 BtGP team
APPENDIX 1: CONFERENCE PROGRAM
STEM, Education and Industry: Transforming the rhetoric into reality
Friday, 23rd March from 9:00am Level 5, Room 5.29 Flinders University Tonsley Campus
Online resources and registration at https://www.bridgingthegap.edu.au/teacher_conference
9:00 Registration, tea and coffee
9:30 Overview of Bridging the Gap program Dr Carol Aldous
10:00 Work Integrated Learning: The challenges for the sciences Prof. Jan Orrell
10:40 Morning tea provided for participants
11:00 What’s happening in STEM at your school? Small group sharing
11:30 The Findings so Far An analysis of the results from schools participating in the project compared with state and national 2006/2015 PISA findings
12:00 The Role of the Mentor Teacher Supporting the next generation of science educators
12:30 STEM units and activities for the classroom Engaging students in active learning
1:00 Complementary lunch
1:45 New Venture Institute tour of Tonsley The latest in robotics, 3D printing, new technologies
2:30 Bridging the Gap Panel discussion Industry representatives, research scientists, teachers and government representatives discuss interdisciplinary engagement
3:00 Where to from here? Open discussion
3:30 Conference close

Research report No.3 to DIS on outcomes of Stage 2: Cohort 2 and progress on Stage 3: Cohort 2 BTGP team 28


![Optimizing Outcomes in Advanced Prostate Cancer · PDF fileAzad et al. [86] Retro MC Cohort 37 -- 32 --Zafeiriou et al. [91] Retro SC Cohort 37 -- -- --Mezynski [92] Retro SC Cohort](https://static.fdocuments.in/doc/165x107/5a73289f7f8b9abb538e612e/optimizing-outcomes-in-advanced-prostate-cancer-a-azad-et-al-86-retro-mc.jpg)