Report on the Australian petroleum market March quarter … on the Australian... · increase of 6.3...
49
accc.gov.au March quarter 2018 Report on the Australian petroleum market June 2018
Transcript of Report on the Australian petroleum market March quarter … on the Australian... · increase of 6.3...

accc.gov.au
March quarter 2018
Report on the Australian petroleum market
June 2018

ISBN 978 1 920702 33 5
Australian Competition and Consumer Commission 23 Marcus Clarke Street, Canberra, Australian Capital Territory, 2601
© Commonwealth of Australia 2018
This work is copyright. In addition to any use permitted under the Copyright Act 1968, all material contained within this work is provided under a Creative Commons Attribution 3.0 Australia licence, with the exception of:• the Commonwealth Coat of Arms• the ACCC and AER logos• any illustration, diagram, photograph or graphic over which the Australian Competition and Consumer Commission does not hold
copyright, but which may be part of or contained within this publication.
The details of the relevant licence conditions are available on the Creative Commons website, as is the full legal code for the CC BY 3.0 AU licence.
Requests and inquiries concerning reproduction and rights should be addressed to the Director, Content and Digital Services, ACCC, GPO Box 3131, Canberra ACT 2601.
Important notice
The information in this publication is for general guidance only. It does not constitute legal or other professional advice, and should not be relied on as a statement of the law in any jurisdiction. Because it is intended only as a general guide, it may contain generalisations. You should obtain professional advice if you have any specific concern.
The ACCC has made every reasonable effort to provide current and accurate information, but it does not make any guarantees regarding the accuracy, currency or completeness of that information.
Parties who wish to re-publish or otherwise use the information in this publication must check this information for currency and accuracy prior to publication. This should be done prior to each publication edition, as ACCC guidance and relevant transitional legislation frequently change. Any queries parties have should be addressed to the Director, Content and Digital Services, ACCC, GPO Box 3131, Canberra ACT 2601.
ACCC 06/18_1423
www.accc.gov.au

Key messages 1
1. Developments in the petroleum industry 51.1 Record number of hits on the FuelWatch website 5
1.2 More than one million people have downloaded 7-Eleven’s fuel app since 2016 5
1.3 Increase in fuel excise 5
1.4 Release of Victorian Parliament inquiry into fuel prices in regional Victoria 5
1.5 Proposed changes to fuel quality standards 6
1.6 Caltex plans to buy back all petrol station franchises by mid-2020 6
2. ACCC Activities 72.1 ACCC and the petrol industry 7
2.2 Activities during the March quarter 2018 7
2.3 Report on petrol prices by major retailer in 2017 7
3. Retail petrol price movements in the capital cities 83.1 Retail prices over the year to March 2018 8
3.2 Retail prices compared with Mogas 95 prices 9
3.3 Gross indicative retail differences 9
3.4 Retail prices in Brisbane were the highest among the five largest cities 11
3.5 Price cycles in the five largest cities 12
3.6 Prices in the three smaller capital cities 12
3.7 Retail prices of the different petrol grades 14
3.8 Petrol prices in Australia and other OECD countries 14
4. Retail petrol price movements in regional locations 174.1 Influences on regional petrol prices 17
4.2 Regional petrol prices in aggregate 17
4.3 Prices in each of the states and the Northern Territory 18
5. International price movements 225.1 Crude oil and refined petrol 22
5.2 AUD–USD exchange rate 24
6. Diesel and LPG prices 256.1 Diesel price movements 25
6.2 LPG price movements 26
Appendix A: Key messages from ‘Petrol prices are not the same: report on petrol prices by major retailer in 2017’ 27
Appendix B: Petrol price data for monitored locations 32
Appendix C: Update on regional market studies 37
Contents

1 Report on the Australian petroleum market—March 2018
Key messages
Consumers continue to embrace fuel price apps and websitesIn the March quarter 2018, two fuel price data providers announced increasing numbers of consumers using their services.
On 23 January 2018, the Western Australian Government announced that in December 2017 the FuelWatch website reached a record of over one million hits. This is the highest number of hits FuelWatch has received in a single month since its launch in January 2001. The announcement also stated that if motorists in Western Australia buy petrol from the cheapest priced retail site every time they make a fuel purchase, they could save up to $780 per year.
On 29 March 2018, 7-Eleven announced that over one million people had downloaded its fuel app since its launch in 2016, resulting in total savings to consumers for fuel purchases of over $4.5 million. The app allows customers to lock in 7-Eleven’s best local price for seven days and receive this price at any 7-Eleven retail site in Australia. The app also allows consumers to search for prices at 7-Eleven retail sites when they are looking to buy petrol. This function has had more than 16 million searches.
Readily available information about current retail petrol prices, from fuel price websites and apps, enables motorists to shop around and purchase petrol at relatively lower priced retail sites. Increased transparency and promotion of vigorous and effective price competition can lead to lower petrol prices.
Average retail prices in the five largest cities remained broadly stableIn the March quarter 2018, average retail petrol prices across the five largest cities (Sydney, Melbourne, Brisbane, Adelaide and Perth) were 135.5 cents per litre (cpl), an increase of only 0.4 cpl from the December quarter 2017.1 This followed an increase of 12.6 cpl in the December quarter 2017.
In real terms, the March quarter 2018 average prices were the highest since the September quarter 2015 (138.5 cpl).
Average gross retail margins decreased but remained above their long-term averageIn the March quarter 2018, average gross indicative retail differences (GIRDs) in the five largest cities were 12.4 cpl, a decrease of 1.8 cpl from the previous quarter. GIRDs were highest in Brisbane (14.6 cpl) and lowest in Adelaide (9.4 cpl). Despite the decrease in quarterly average GIRDs in the March quarter 2018, they remain 4.4 cpl above their real long-term average since the ACCC began monitoring them in the September quarter 2002 (8.0 cpl).
GIRDs are a broad indicator of gross retail margins. They are calculated by subtracting average wholesale prices (or terminal gate prices (TGPs)) from average retail prices. TGPs are the prices at which petrol can be purchased from wholesalers in the spot market and are posted on a regular basis on the websites of the major wholesalers.
TGPs vary across brands and cities. TGPs reflect the wholesale price of petrol only, and exclude other retail operating costs (such as branding, transportation, and labour). As they do not include these costs, GIRDs should not be confused with actual retail profits.
1 In this report references to petrol are to regular unleaded petrol (RULP) unless otherwise specified. From 1 July 2014, the ACCC has used E10 prices instead of RULP prices for Sydney in the average price for the five largest cities.

2 Report on the Australian petroleum market—March 2018
The GIRDs reported by the ACCC are averages across the five largest cities over time. The level of prices, costs and profits vary significantly between retail operations and not all petrol retailing sites will be achieving these margins. Some will be achieving higher margins, others lower.
International crude oil and refined petrol prices were higher but their influence on retail prices was partially offset by a higher AUD–USD exchange rateInternational crude oil and refined petrol prices increased in the March quarter 2018. Quarterly average Brent crude oil prices increased by around USD 6 per barrel to around USD 67 per barrel, and quarterly average Mogas 95 prices (the benchmark price for refined regular unleaded petrol (RULP) relevant to Australia) increased by around USD 4 per barrel to around USD 78 per barrel.
In the March quarter 2018, the AUD–USD exchange rate increased by around USD 0.02. The AUD-USD exchange rate is a significant determinant of Australia’s retail petrol prices because international refined petrol is bought and sold in United States dollars in global markets. The higher AUD–USD exchange rate in the quarter partially offset the influence of the increase in international refined petrol prices on Australian retail petrol prices.
Brisbane retail petrol prices remain the highest among the five largest citiesRetail prices in Brisbane were the highest of the five largest cities in the March quarter 2018. The average retail petrol price in Brisbane in the quarter was 138.2 cpl, which was 3.4 cpl higher than the average across the other four largest cities (Sydney, Melbourne, Adelaide and Perth). This was 0.9 cpl lower than the differential in the December quarter 2017.
The city-country price differential increasedThe ACCC monitors fuel prices in all capital cities and over 190 regional locations across Australia. The average differential between regional prices and prices in the five largest cities in the March quarter 2018 was 4.8 cpl, which was 3.4 cpl higher than in the December quarter 2017 (1.4 cpl). The annual average difference in 2017 was 5.0 cpl.
Diesel and automotive LPG prices increasedAverage retail diesel prices in the five largest cities increased in the March quarter 2018 to 140.1 cpl, an increase of 6.3 cpl from the December quarter 2017 (133.8 cpl).
Average retail LPG prices in the five largest cities also increased in the March quarter 2018 to 85.2 cpl, an increase of 3.0 cpl from the December quarter 2017 (82.2 cpl).
ACCC industry report found that petrol prices vary significantly between major retailersOn 13 May 2018, the ACCC released its first industry report under the new petrol monitoring direction. The report analysed annual average retail prices in 2017 and identified the highest and lowest priced major retailers on average in the five largest cities.
The report found that petrol prices vary significantly between major retailers. In 2017, independent chains on average were the lowest priced major retailers in each city (United in Melbourne and Brisbane, Speedway in Sydney, Liberty in Adelaide and Vibe in Perth), and Coles Express on average was the highest priced major retailer in each city. The average range between the highest and lowest average priced major retailer in each city in 2017 was 6.3 cpl. These results dispel the myth held by some consumers that all petrol prices are the same.
3 Report on the Australian petroleum market—March 2018
The report also examined the difference between average prices in 2017 with those in 2007. It found that the range between the highest and lowest average priced major retailer increased between the two periods. In 2007, the average range across the five cities was 2.4 cpl, which was just over a third of the average range in 2017. The greater range of prices in 2017 suggests that a motorist’s decision about where to buy petrol is more important in 2017 than it was in 2007.
The 10-year comparison also highlighted some similarities. Independent chains were the lowest priced major retailer in all five cities in 2017, and an independent chain had the lowest average price in Sydney, Brisbane and Perth in 2007. Woolworths was the lowest in Melbourne and Adelaide in 2007.
By choosing to buy petrol at lower priced retailers, consumers can make significant savings over time. The information in the ACCC report can be used by motorists, in conjunction with other publicly available fuel price information from a variety of fuel price apps and websites, to help make more informed purchasing decisions.
Motorists can save money by avoiding buying petrol at the peaks of the price cycleAnalysis in the ACCC’s Report on the Australian petroleum market—September quarter 2017 showed that if motorists in Sydney had avoided buying E10 on the six days around the price cycle peaks in the previous six months, they would have paid on average around 2.6 cpl less. Assuming similar savings for the other types of petrol (RULP and premium unleaded petrol), the estimated overall savings for Sydney motorists over a year would have been in the region of $85 million.
Motorists who can fill up less frequently and therefore buy petrol when prices are falling can save even more. For example, if motorists in Sydney avoided buying E10 on the 10 most expensive days around the peak of the price cycle, they would have paid on average 4.3 cpl less. Motorists who only buy a small amount of petrol when prices are at their peak, waiting until prices are falling before filling up, can also make significant savings.
Motorists can avoid buying petrol around the peaks by following the ACCC’s advice on its website. The ACCC provides information on petrol price cycles in the five largest cities and gives buying tips, updated three times a week, about when to buy and, importantly, when not to buy. Consumers taking this more active approach would likely save considerably more. Even at the peak of the price cycle, there is often a range of prices across various retailers, so motorists can also use fuel price websites and apps to decide where to buy.
ACCC regional market studiesThe ACCC has undertaken four regional petrol market studies—in Darwin, Launceston, Armidale and Cairns—and continues to monitor retail prices and GIRDs in those locations.
The ACCC has compared actual retail prices in Darwin, Launceston, Armidale and Cairns with estimated retail prices calculated on a long-term competitive cost basis. This calculation reflects the fact that costs (such as freight and operating costs per litre) are higher in these locations, and assumes that retail margins in these locations should be broadly similar to long-term average retail margins in the five largest cities.
This long-term competitive cost-based price provides a benchmark against which to compare current price levels. It is not static and will change as its underlying elements change over time. If retail prices are constantly above this benchmark price for a sustained period, this may be indicative of a less-competitive market in which retailers are earning higher margins at the expense of consumers.
Motorists in these locations are encouraged to use available fuel price websites and apps to find retailers with relatively lower prices.

4 Report on the Australian petroleum market—March 2018
Darwin petrol prices increased significantly and were above a long-term competitive cost-based priceIn the March quarter 2018, average retail prices in Darwin were 148.3 cpl, an increase of 8.3 cpl from the December quarter 2017 (140.0 cpl). The average differential between prices in Darwin and the five largest cities was 12.8 cpl, an increase of 7.9 cpl from the December quarter 2017 (4.9 cpl).
In the March quarter 2018, average GIRDs in Darwin were 20.3 cpl, an increase of 5.8 cpl from the December quarter 2017 (14.5 cpl). Petrol prices in Darwin were above a long-term competitive cost-based price.
Motorists in Darwin can use the MyFuel NT scheme to identify the highest and lowest priced retail sites in Darwin and buy petrol at the lower priced sites. For example, on 23 May 2018, MyFuel NT showed that FuelXpress Winnellie had the lowest RULP retail price at 143.5 cpl, which was 8.4 cpl lower than the highest retail price (151.9 cpl). There were seven Puma retail sites and four United retail sites selling RULP at 149.9 cpl.
Launceston petrol prices increased and remained significantly above a long-term competitive cost-based priceIn the March quarter 2018, average retail prices in Launceston were 148.4 cpl, an increase of 5.1 cpl from the December quarter 2017 (143.3 cpl). The average differential between prices in Launceston and the five largest cities was 12.9 cpl, an increase of 4.7 cpl from the December quarter 2017 (8.2 cpl).
In the March quarter 2018, Launceston GIRDs were 19.9 cpl, an increase of 3.1 cpl from the December quarter 2017 (16.8 cpl). Petrol prices in Launceston remained significantly above a long-term competitive cost-based price.
Armidale petrol prices increased and were marginally above a long-term competitive cost-based priceIn the March quarter 2018, average retail prices in Armidale were 139.1 cpl, an increase of 3.9 cpl from the December quarter 2017 (135.2 cpl). The average differential between prices in Armidale and the five largest cities was 3.6 cpl, an increase of 3.5 cpl from the December quarter 2017 (0.1 cpl).
In the March quarter 2018, average GIRDs in Armidale were 17.2 cpl, an increase of 1.9 cpl from the December quarter 2017 (15.3 cpl). Petrol prices in Armidale were marginally above a long-term competitive cost-based price.
Cairns petrol prices decreased but remained above a long-term competitive cost-based priceIn the March quarter 2018, average retail prices in Cairns were 135.5 cpl, a decrease of 2.2 cpl from the December quarter 2017 (137.7 cpl). The average price in Cairns was equal to the average price in the five largest cities for the March quarter 2018.
In the March quarter 2018, average GIRDs in Cairns were 8.9 cpl, a decrease of 4.3 cpl from the December quarter 2017 (13.2 cpl). Average GIRDs in Cairns were below the average GIRDs in the five largest cities (12.4 cpl).
Despite the decrease in retail prices and GIRDs in Cairns in the March 2018 quarter, petrol prices in Cairns remained above a long-term competitive cost-based price (which is calculated on a rolling annual average basis).
However, the difference between Cairn’s average price and the long-term competitive cost-based price decreased significantly during the quarter. This may have been due to more vigorous competition as United increased its presence in the Cairns area in the March quarter.

5 Report on the Australian petroleum market—March 2018
1. Developments in the petroleum industry
1.1 Record number of hits on the FuelWatch websiteOn 23 January 2018, the Western Australian Government announced that in December 2017 the FuelWatch website reached a record of over one million hits.2 This is the highest number of hits FuelWatch has received in a single month since its launch in January 2001. The FuelWatch website normally averages 800 000 visits per month. The announcement also stated that if motorists in Western Australia buy petrol from the cheapest priced retail site every time they make a fuel purchase, they could save up to $780 per year.
1.2 More than one million people have downloaded 7-Eleven’s fuel app since 2016
On 29 March 2018, 7-Eleven announced that over one million people had downloaded its fuel app since its launch in 2016, resulting in total savings for fuel purchases of over $4.5 million.3 The app allows customers to lock in 7-Eleven’s best local price for seven days and receive this price at any 7-Eleven retail site in Australia. 7-Eleven noted when consumers use the locked in fuel price they save an average of $4.59 per purchase. The app also allows consumers to search for prices at 7-Eleven retail sites when they are looking to buy petrol. This function has had more than 16 million searches.
1.3 Increase in fuel exciseIn the 2014–15 Budget the Australian Government announced that it would reintroduce biannual indexation, by the Consumer Price Index, of excise and excise-equivalent customs duty for all fuels except aviation fuels. Under these arrangements excise is generally increased on 1 February and 1 August each year. The announced excise changes took effect from 10 November 2014.
On 5 February 2018 excise on petrol and diesel increased by 0.6 cpl to 40.9 cpl. Excise on automotive LPG increased by 0.1 cpl to 13.3 cpl.4
1.4 Release of Victorian Parliament inquiry into fuel prices in regional Victoria
On 20 February 2018, the report of the inquiry into fuel prices in regional Victoria by the Economic, Education, Jobs and Skills Committee of the Victorian Parliament was released.5
The inquiry made five findings relating to improving fuel price transparency. These were:
�� existing fuel price apps and websites do not provide complete or timely information for all Victorian service stations
�� fuel discounters lose their competitive advantage under mandatory fuel price reporting because their competitors can see their prices instantly and match them
2 Government of Western Australia, A record one millions hits for FuelWatch website, media statement, 23 January 2018, at: https://www.mediastatements.wa.gov.au/Pages/McGowan/2018/01/A-record-one-million-hits-for-FuelWatch-website.aspx, accessed on 23 May 2018.
3 7-Eleven, One million Australians download 7-Eleven fuel app, 29 March 2018, at: https://www.7eleven.com.au/media-centre/article/one-million-australians-download-7-eleven-fuel-app, accessed on 23 May 2018.
4 Australian Taxation Office, Excise rates for fuel, at: https://www.ato.gov.au/business/excise-and-excise-equivalent-goods/fuel-excise/excise-rates-for-fuel/, accessed on 23 May 2018.
5 Parliament of Victoria (Economic, Education, Jobs and Skills Committee), Inquiry into fuel prices in regional Victoria, at: https://www.parliament.vic.gov.au/eejsc/article/3149, accessed on 23 May 2018.

6 Report on the Australian petroleum market—March 2018
�� there is no evidence that mandatory fuel price reporting schemes in Australia and overseas have reduced fuel prices
�� it is unlikely that mandatory fuel price reporting would reduce prices in regional Victoria due to the small number of competing service stations
�� planning restrictions may hinder the entry of new service stations to a regional market, which may limit competition.
The inquiry also made three recommendations:
�� the Victorian Government conduct a public awareness campaign in regional Victoria to encourage the use of fuel price apps
�� the Victorian Government support the Royal Automobile Club of Victoria’s efforts to improve the coverage of fuel prices on its app through crowdsourced data
�� the Victorian Government and local governments review planning policies to encourage the entry of new service stations to regional fuel markets with low competition.
The Victorian Government is yet to respond to the report.
1.5 Proposed changes to fuel quality standardsIn October 2015, a Ministerial Forum was established to address emissions from motor vehicles. In January 2018, the Ministerial Forum released a draft regulation impact statement for consultation on proposed changes to fuel quality standards.6
The draft canvassed three policy options for updating fuel quality standards for Australia. These were:
�� Option 1—revise Australian fuel standards to harmonise with European standards and phase out RULP. This produces a negative net present value (NPV) of $718 million in 2022 and $607 million in 2027.
�� Option 2—revise Australian fuel standards to harmonise with European standards as per option 1 but retain RULP with a lower sulphur level of 10 parts per million (ppm). This produces a positive NPV of $641 million in 2022 and $319 million in 2027.
�� Option 3—revise the petrol standard to reduce sulphur to 10 ppm, consistent with European standards, and make no other changes. This produces a positive NPV of $628 million in 2022 and $317 million in 2027.
On 8 March 2018, submissions on the consultation paper closed. The Ministerial Forum will continue to undertake a mix of public consultation and targeted discussions with key stakeholders, and intends to provide a draft implementation plan on potential measures for consideration by Government.7
1.6 Caltex plans to buy back all petrol station franchises by mid-2020
On 27 February 2018, Caltex Australia announced in its 2017 full year results that it had completed a review of its convenience retail operating model. Caltex stated that an intended outcome of this review is the buy-back of all 433 of its current retail franchise petrol sites by mid-2020 and move them to company operated sites.8
6 Ministerial Forum on Vehicle Emissions, Better fuel for cleaner air: Draft regulation impact statement, January 2018, at: http://www.environment.gov.au/system/files/consultations/56be59ae-a8ff-4c7e-8586-6b25b975b212/files/better-fuel-cleaner-air-draft-ris.pdf, accessed on 23 May 2018.
7 Department of Infrastructure, Regional Development and Cities, Ministerial forum on vehicle emissions, at: https://infrastructure.gov.au/vehicles/environment/forum/index.aspx, accessed on 23 May 2018.
8 Caltex, 2017 full year results, 27 February 2018, at: https://www.caltex.com.au/our-company/media-releases/2017-full-year-results, accessed on 23 May 2018.

7 Report on the Australian petroleum market—March 2018
2. ACCC Activities
2.1 ACCC and the petrol industryThe main role of the ACCC is to enforce the Competition and Consumer Act 2010 (the Act) across the Australian economy, including the fuel industry. The ACCC’s activities under the Act include enforcement and compliance, mergers and acquisitions assessments, authorisations and notifications, and administration of the Oilcode.
Wholesale and retail petrol prices in Australia are determined by market forces. The ACCC’s role is to assist consumers to navigate this complex industry. Through its petrol monitoring reports, market studies and other information channels, the ACCC promotes transparency in the Australian petroleum industry and improved public awareness of the factors that determine retail petrol prices.
2.2 Activities during the March quarter 20182.2.1 Stakeholder engagement and communications activityIn the March quarter 2018, the fuel-related pages on the ACCC website received 109 243 page views. Of this total, the petrol price cycle webpage received 101 323 page views, making it the third-most viewed page on the ACCC website in the quarter.
The ACCC responded to a number of fuel-related enquiries from a range of media organisations during the quarter, providing clarification about the ACCC’s directed fuel price monitoring role and promoting fuel price transparency in Australia. Responses were also prepared for Ministerial and other correspondence on fuel-related competition and consumer matters.
2.3 Report on petrol prices by major retailer in 2017On 13 May 2018, the ACCC released its first industry report under the new petrol monitoring direction issued in December 2017.9 The report analysed monthly and annual average retail petrol prices in 2017 to identify the highest and lowest priced major retailers of petrol on average in each of the five largest cities. The key points of the report are provided in appendix A.
9 ACCC, Large price differences between petrol retailers, media release, 13 May 2018, at: https://www.accc.gov.au/media-release/large-price-differences-between-petrol-retailers.

8 Report on the Australian petroleum market—March 2018
3. Retail petrol price movements in the capital cities
This chapter focuses on petrol prices across the five largest cities (Sydney, Melbourne, Brisbane, Adelaide and Perth).10 It also examines retail prices in the three smaller capital cities (Canberra, Hobart and Darwin). Petrol prices in regional locations across Australia are discussed in chapter 4.
3.1 Retail prices over the year to March 2018Chart 3.1 shows that seven-day rolling average retail petrol prices in the five largest cities decreased from a high of 132.0 cpl in early-May 2017 to a low of 116.4 cpl in early-July 2017.11 Prices subsequently increased to a high of 144.5 cpl in mid-December 2017 and decreased to 136.1 cpl at the end of December 2017.
In the March quarter 2018, prices increased from 133.8 in early-January 2018 to 140.7 cpl in late-February 2018. Prices subsequently decreased to a low of 129.4 cpl in mid-March 2018 before increasing to 140.5 cpl at the end of March 2018.
Chart 3.1: Seven-day rolling average retail petrol prices in the five largest cities: 1 April 2017 to 31 March 2018
110
115
120
125
130
135
140
145
150
Apr-17
May
-17
Jun-17
Jul-1
7
Aug
-17
Sep-17
Oct-17
Nov
-17
Dec
-17
Jan-18
Feb-18
Mar-18
cpl
Source: ACCC calculations based on FUELtrac data.
Note: The area to the right of the dotted vertical line in this and subsequent charts represents the March quarter 2018.
Average prices in the March quarter 2018 were 135.5 cpl, an increase of 0.4 cpl from the December quarter 2017 (135.1 cpl). In real terms, average prices in the March quarter 2018 were the highest since the September quarter 2015 (138.5 cpl).
10 From 1 July 2014, the ACCC has used E10 prices instead of RULP prices for Sydney in the average price for the five largest cities.11 A seven-day rolling average price is the average of the current day’s price and prices on the six previous days. Traditionally, the ACCC
has used a seven-day rolling average to smooth out the influence of petrol price cycles in the larger capital cities on price movements. This has been less effective in recent years because the duration of price cycles in most of the larger capital cities has become substantially greater than seven days.
9 Report on the Australian petroleum market—March 2018
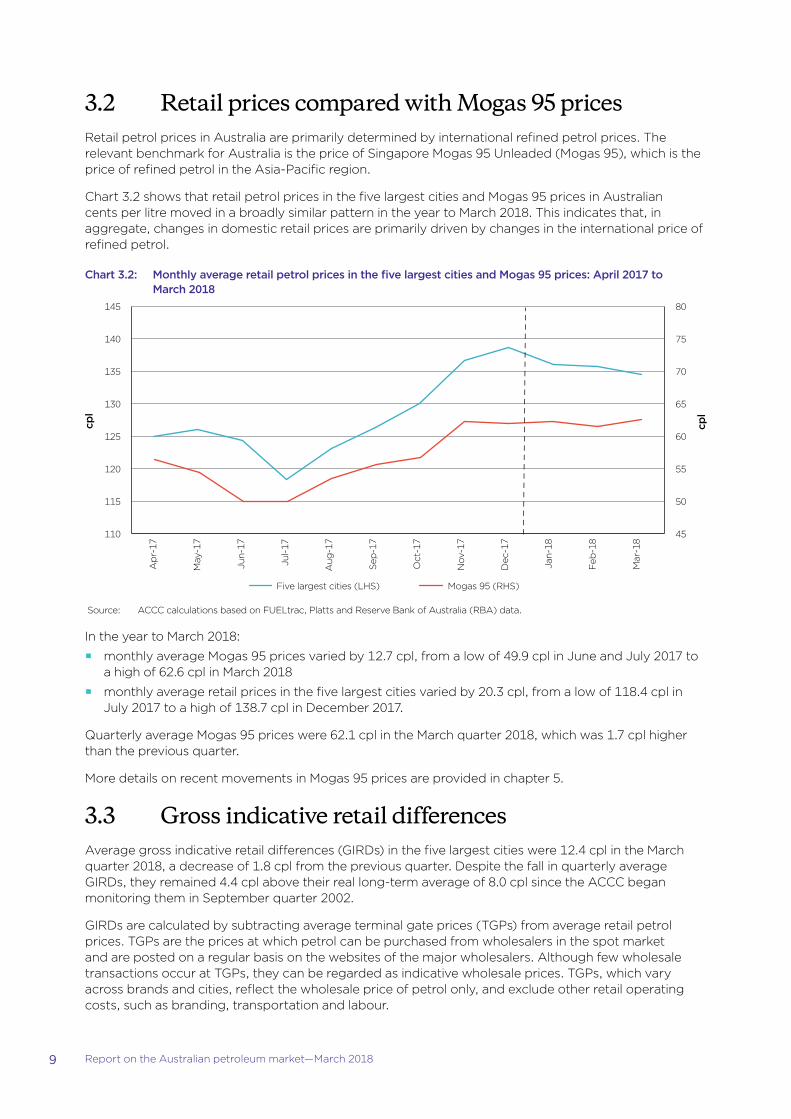
3.2 Retail prices compared with Mogas 95 pricesRetail petrol prices in Australia are primarily determined by international refined petrol prices. The relevant benchmark for Australia is the price of Singapore Mogas 95 Unleaded (Mogas 95), which is the price of refined petrol in the Asia-Pacific region.
Chart 3.2 shows that retail petrol prices in the five largest cities and Mogas 95 prices in Australian cents per litre moved in a broadly similar pattern in the year to March 2018. This indicates that, in aggregate, changes in domestic retail prices are primarily driven by changes in the international price of refined petrol.
Chart 3.2: Monthly average retail petrol prices in the five largest cities and Mogas 95 prices: April 2017 to March 2018
cpl
cpl
Five largest cities (LHS) Mogas 95 (RHS)
45
50
55
60
65
70
75
80
110
115
120
125
130
135
140
145
Apr-17
May
-17
Jun-17
Jul-17
Aug
-17
Sep
-17
Oct-17
Nov
-17
Dec
-17
Jan-18
Feb
-18
Mar-18
Source: ACCC calculations based on FUELtrac, Platts and Reserve Bank of Australia (RBA) data.
In the year to March 2018:
�� monthly average Mogas 95 prices varied by 12.7 cpl, from a low of 49.9 cpl in June and July 2017 to a high of 62.6 cpl in March 2018
�� monthly average retail prices in the five largest cities varied by 20.3 cpl, from a low of 118.4 cpl in July 2017 to a high of 138.7 cpl in December 2017.
Quarterly average Mogas 95 prices were 62.1 cpl in the March quarter 2018, which was 1.7 cpl higher than the previous quarter.
More details on recent movements in Mogas 95 prices are provided in chapter 5.
3.3 Gross indicative retail differencesAverage gross indicative retail differences (GIRDs) in the five largest cities were 12.4 cpl in the March quarter 2018, a decrease of 1.8 cpl from the previous quarter. Despite the fall in quarterly average GIRDs, they remained 4.4 cpl above their real long-term average of 8.0 cpl since the ACCC began monitoring them in September quarter 2002.
GIRDs are calculated by subtracting average terminal gate prices (TGPs) from average retail petrol prices. TGPs are the prices at which petrol can be purchased from wholesalers in the spot market and are posted on a regular basis on the websites of the major wholesalers. Although few wholesale transactions occur at TGPs, they can be regarded as indicative wholesale prices. TGPs, which vary across brands and cities, reflect the wholesale price of petrol only, and exclude other retail operating costs, such as branding, transportation and labour.

10 Report on the Australian petroleum market—March 2018
GIRDs are a broad indicator of gross retail margins, and should not be confused with actual retail profits. The GIRDs reported by the ACCC are averages across the five largest cities over time. The level of prices, costs and profits vary significantly between retail operations and not all petrol retailing sites will be achieving these margins. Some will be achieving higher margins, others lower.
Table 3.1: Quarterly average retail petrol prices, TGPs and GIRDs in the five largest cities: June quarter 2017 to March quarter 2018
Location Quarter Retail prices cpl
TGPs cpl
GIRDs cpl
Five largest cities Jun-17 125.2 113.5 11.7
Sep-17 122.5 112.2 10.3
Dec-17 135.1 120.9 14.2
Mar-18 135.5 123.1 12.4
Year to Mar 2018 129.5 117.4 12.1
Sydney Jun-17 122.5 112.3 10.2
Sep-17 118.8 111.3 7.5
Dec-17 133.6 119.8 13.8
Mar-18 132.0 121.9 10.1
Year to Mar 2018 126.7 116.3 10.4
Melbourne Jun-17 127.0 113.5 13.5
Sep-17 123.2 112.2 11.0
Dec-17 136.3 120.9 15.4
Mar-18 137.1 123.1 14.0
Year to Mar 2018 130.9 117.4 13.5
Brisbane Jun-17 127.8 114.0 13.8
Sep-17 124.7 112.6 12.1
Dec-17 138.5 121.4 17.1
Mar-18 138.2 123.6 14.6
Year to Mar 2018 132.3 117.9 14.4
Adelaide Jun-17 122.8 113.7 9.1
Sep-17 122.7 112.3 10.4
Dec-17 132.7 121.1 11.6
Mar-18 132.7 123.3 9.4
Year to Mar 2018 127.7 117.6 10.1
Perth Jun-17 125.7 113.9 11.8
Sep-17 123.3 112.5 10.8
Dec-17 134.4 121.1 13.3
Mar-18 137.4 123.5 13.9
Year to Mar 2018 130.2 117.7 12.5
Source: ACCC calculations based on FUELtrac, BP, Caltex, Mobil, Viva Energy and WA FuelWatch data.
Note: Retail prices, TGPs and GIRDs in Sydney are for E10.

11 Report on the Australian petroleum market—March 2018
Table 3.1 shows that, in the five largest cities over the year to March 2018, quarterly average GIRDs:
�� decreased in the March quarter 2018 in four cities (Sydney, Melbourne, Brisbane and Adelaide) and increased in Perth
�� in the March quarter 2018, were the highest in Brisbane (14.6 cpl) and lowest in Adelaide (9.4 cpl)
�� varied significantly over the year and across cities, ranging from a high of 17.1 cpl (in Brisbane in the December quarter 2017) to a low of 7.5 cpl (in Sydney in the September quarter 2017).
The table also shows that annual average GIRDs across the five largest cities in the year to March 2018 were 12.1 cpl. This was 0.8 cpl higher than the average GIRDs over the year to March 2017 (11.3 cpl).
3.4 Retail prices in Brisbane were the highest among the five largest cities
Retail prices in Brisbane are regularly higher than those in Sydney, Melbourne, Adelaide and Perth.
Chart 3.3 shows quarterly average retail prices in Brisbane and average prices across Sydney, Melbourne, Adelaide and Perth over the two years to March 2018. Over this period Brisbane retail prices were on average 3.2 cpl higher than the average across the other four largest cities (ranging from a high of 5.2 cpl in the June quarter 2016 to a low of 1.3 cpl in the September quarter 2016).
In the March quarter 2018, average retail prices in Brisbane were 138.2 cpl, which was 3.4 cpl higher than the average across the other four largest cities. This was 0.9 cpl lower than the differential in the December quarter 2017 (4.3 cpl).
Chart 3.3: Quarterly average retail prices in Brisbane and the other four largest cities: June quarter 2016 to March quarter 2018
cpl
105
110
115
120
125
130
135
140
145
Other four largest citiesBrisbane
Mar-18
Jun-16
Sep
-16
Dec
-16
Mar-17
Jun-17
Sep
-17
Dec
-17
Source: ACCC calculations based on FUELtrac data.
The ACCC released the findings of its report on the Brisbane petrol market on 9 October 2017.12 It noted that petrol prices in Brisbane have been significantly higher than those in the other four largest cities for the last eight years. Between 2009–10 and 2016–17, Brisbane motorists paid on average 3.3 cpl more for petrol than motorists in the other four largest cities.
12 ACCC, Report on the Brisbane petrol market, October 2017, at: https://www.accc.gov.au/publications/petrol-market-studies/report-on-the-brisbane-petrol-market.

12 Report on the Australian petroleum market—March 2018
The report found that the main factor influencing the higher prices in Brisbane is higher retail margins on petrol, which have contributed to profits in Brisbane being significantly higher than the average across Australia. The cost to motorists in Brisbane of higher petrol prices has been significant, at around $50 million per annum.
The report also found that retail pricing is less competitive in Brisbane, with retailers setting prices higher at the top and bottom of the price cycle than retailers in Sydney. Furthermore, Brisbane has fewer retail chains that price competitively and aggressively. Brisbane has only four retailers in this category (7-Eleven, Woolworths, Puma Energy and United), while Sydney has seven (Speedway, Metro, Budget, Westside, United, 7-Eleven and Woolworths).
3.5 Price cycles in the five largest citiesRetail petrol prices in the five largest cities in Australia move in cycles. These price cycles do not generally occur in the smaller capital cities or in most regional locations. Price cycles are the result of the pricing policies of fuel retailers and the competitive dynamic between them. They only occur at the retail level; wholesale prices do not exhibit similar cyclical movements.
Table 3.2 shows that over the year to March 2018, the number of price cycles in each quarter was stable in all cities. Melbourne and Brisbane had the fewest price cycles over the year, at 11 price cycles each. Perth had the most price cycles, with a regular weekly cycle for the whole period.
Table 3.2: Number of price cycles per quarter in the five largest cities: June quarter 2017 to March quarter 2018
Quarter Sydney Melbourne Brisbane Adelaide Perth
Jun-17 3 2 2 3 13
Sep-17 3 3 3 4 13
Dec-17 4 3 3 4 13
Mar-18 3 3 3 4 13
Year to Mar 2018 13 11 11 15 52
Source: ACCC calculations based on FUELtrac data.
The number of price cycles in the year to March 2018 was lower than the previous year in Sydney (by one price cycle) and higher in Melbourne (by two price cycles), Brisbane (by one price cycle) and Adelaide (by two price cycles). In Perth, the number of price cycles in the year to March 2018 compared with the previous year remained unchanged.
The unpredictable nature of price cycles in the eastern capital cities in recent years is of concern to consumers, as it is harder for them to take advantage of the low point of the cycle. This highlights the importance of consumers being aware of the stages of the price cycle, and where possible, timing their purchases towards the bottom of the price cycle.
3.6 Prices in the three smaller capital citiesThe differential between retail petrol prices in the three smaller capital cities (Canberra, Hobart and Darwin) and the five largest cities increased in the March quarter 2018 to 11.9 cpl, compared with the previous quarter (5.5 cpl).
Chart 3.4 shows that in the year to March 2018, monthly average retail prices:
�� in Darwin, Hobart and Canberra were always higher than in the five largest cities
�� were the highest in Hobart in eight months, and in Darwin in the remaining four months.

13 Report on the Australian petroleum market—March 2018
Chart 3.4: Monthly average retail petrol prices in Canberra, Hobart, Darwin and the five largest cities: April 2017 to March 2018
cpl
110
115
120
125
130
135
140
145
150
155
Five largest citiesHobart Canberra Darwin
Jan-18
Feb
-18
Mar-18
Apr-17
May
-17
Jun-17
Jul-17
Aug
-17
Sep
-17
Oct-17
Nov
-17
Dec
-17
Source: ACCC calculations based on FUELtrac data.
In the March quarter 2018, average retail prices in:
�� Hobart were 147.3 cpl, which was 11.8 cpl higher than in the five largest cities (135.5 cpl)
�� Canberra were 146.7 cpl (11.2 cpl higher)
�� Darwin were 148.3 cpl (12.8 cpl higher).
Factors that may lead to relatively higher prices in Canberra, Hobart and Darwin are similar to those factors influencing prices in regional locations outlined in section 4.1.
Recent movements in Darwin retail prices are discussed further in appendix C.

14 Report on the Australian petroleum market—March 2018
3.7 Retail prices of the different petrol gradesChart 3.5 shows that retail prices of the different grades of unleaded petrol—RULP, premium unleaded petrol (PULP) 95, PULP 98, and E10—all moved in a similar manner over the year to March 2018.13
Chart 3.5: Monthly average retail prices of RULP, PULP 95, PULP 98 and E10 in the five largest cities: April 2017 to March 2018
cpl
110
115
120
125
130
135
140
145
150
155
160
Jan-18
Feb
-18
Mar-18
Apr-17
May
-17
Jun-17
Jul-17
Aug
-17
Sep
-17
Oct-17
Nov
-17
Dec
-17
E10RULP PULP 95 PULP 98
Source: ACCC calculations based on FUELtrac data.
In the March quarter 2018, the average differential in the five largest cities between:
�� RULP and PULP 95 prices was 12.8 cpl (an increase of 0.4 cpl from the previous quarter)
�� RULP and PULP 98 prices was 20.3 cpl (an increase of 0.7 cpl)
�� E10 and RULP prices was 1.9 cpl (an increase of 1.3 cpl).
Retail prices of the different grades of petrol move in a similar manner because they are all influenced by international refined petrol benchmark prices (which, in turn, predominantly move in line with changes in the price of crude oil).
However, the price differentials between the various types of petrol vary over time. For example, retailers will generally set the price of PULP at a fixed premium to RULP. Premiums are adjusted from time to time in response to factors such as changes in international benchmark differentials and local supply and demand conditions.
3.8 Petrol prices in Australia and other OECD countriesCompared with other developed countries Australia’s retail petrol prices are relatively low. However, a degree of caution needs to be exercised when comparing international petrol prices, because fuel quality standards differ among countries, as does the availability and use of fuel types.
Chart 3.6 shows average retail PULP 95 prices—both including and excluding taxes—among 33 countries in the Organisation for Economic Cooperation and Development (OECD) in the December quarter 2017 (the latest data available). It shows that of these countries, Australia had the fourth-lowest retail PULP 95 prices.
13 E10 prices are for Sydney and Brisbane only. RULP prices in Sydney are used in this section to calculate average RULP prices in the five largest cities.

15 Report on the Australian petroleum market—March 2018
Chart 3.6: Average retail PULP 95 prices and taxes in OECD countries: Australian cents per litre, December quarter 2017
United States
Mexico
Canada
Australia
Chile
Poland
Czech Republic
Hungary
Latvia
Luxembourg
Austria
Estonia
Spain
Slovenia
Slovak Republic
Germany
New Zealand
United Kingdom
Ireland
France
Turkey
Belgium
Switzerland
Finland
Sweden
Portugal
Greece
Denmark
Korea
Italy
Netherlands
Norway
Israel
0 10 20 30 40 50 60 70 80 90 100 110 120 130 140 150 160 170 180 190 200 210 220 230 240 250
Australian cpl
Price less tax Tax component Average price less tax
Source: Department of the Environment and Energy, Australian Petroleum Statistics, issue 260, March 2018.
Note: All international prices shown are for PULP 95 RON, except for New Zealand (96 RON).
The main reason for the lower retail petrol prices in Australia is the relatively low rate of taxation on fuel. In the December quarter 2017 taxes made up around 36 per cent of retail PULP 95 prices in Australia. This is much lower than in many OECD countries: the average tax component on PULP 95 prices in the OECD was around 57 per cent in the December quarter 2017. Excluding taxes, PULP 95 prices in Australia were fourth-highest of the OECD countries.
Chart 3.7 shows average retail RULP prices—both including and excluding taxes—among 10 OECD countries in the December quarter 2017. In the majority of OECD countries RULP is not sold in significant quantities. The chart shows that, as with PULP 95, Australia had the fourth-lowest retail RULP prices in the OECD. Excluding taxes, RULP prices in Australia were the fifth-highest of the OECD countries.

16 Report on the Australian petroleum market—March 2018
Chart 3.7: Average retail RULP prices and taxes in OECD countries: Australian cents per litre, December quarter 2017
United StatesMexicoCanadaAustralia
ChileJapanAustriaKorea
New ZealandDenmark
Australian cpl
0 10 20 30 40 50 60 70 80 90 100 110 120 130 140 150 160 170 180 190 200 210 220 230 240 250
Price less tax Tax component Average price less tax
Source: Department of the Environment and Energy, Australian Petroleum Statistics, issue 260, March 2018.

17 Report on the Australian petroleum market—March 2018
4. Retail petrol price movements in regional locations
The ACCC monitors fuel prices in all capital cities and over 190 regional locations across Australia. These locations are identified in appendix B.
4.1 Influences on regional petrol pricesMovements in retail petrol prices in regional locations are largely driven by changes in international refined petrol prices and the AUD–USD exchange rate, as they are in the five largest cities.
However, prices are generally higher in regional locations. A number of factors may contribute to these higher prices, including: a lower level of local competition; lower volumes of fuel sold; distance/location factors; and lower convenience store sales. The influence of these factors varies significantly from location to location. This means that there may be substantial differences in prices between specific regional locations.
4.2 Regional petrol prices in aggregateIn the March quarter 2018, the differential between average prices in regional locations in aggregate (regional prices) and prices in the five largest cities was 4.8 cpl. This was 3.4 cpl higher than in the December quarter (1.4 cpl). In 2017, the annual average differential was 5.0 cpl.
Chart 4.1 shows that monthly average regional prices decreased by 0.7 cpl over the March quarter 2018 – from 140.4 cpl in December 2017 to 139.7 cpl in March 2018. This decrease was less than that in the five largest cities, where prices decreased by 4.2 cpl over the same period.
Chart 4.1: Monthly average retail petrol prices in regional locations in aggregate and the five largest cities: April 2017 to March 2018
cpl
115
120
125
130
135
140
145
Jan-18
Feb
-18
Mar-18
Apr-17
May
-17
Jun-17
Jul-17
Aug
-17
Sep
-17
Oct-17
Nov
-17
Dec
-17
Five largest citiesAll regional locations
Source: ACCC calculations based on FUELtrac data.
The monthly average differential between regional prices and prices in the five largest cities varied substantially during the 12-month period between April 2017 and March 2018, ranging from a high of 10.2 cpl in July 2017 to a low of 1.1 cpl in November 2017. During the March quarter 2018, the monthly average differential ranged between 4.5 cpl (in January) and 5.2 cpl (in March).

18 Report on the Australian petroleum market—March 2018
In March 2018, average prices in 161 regional locations (around 88 per cent of monitored locations) were higher than average prices in the five largest cities.
While retail petrol prices in regional locations generally follow movements in the international price of refined petrol, they often do not respond as quickly—either up or down—as prices in the five largest cities. For example, between July and October 2017, average petrol prices in the five largest cities increased substantially, in line with international refined petrol prices, while average petrol prices in regional locations were relatively stable.
Further information on petrol price movements in the March quarter 2018 in all locations monitored by the ACCC is presented in appendix B.
4.3 Prices in each of the states and the Northern Territory
Charts 4.2 to 4.8 show seven-day rolling average retail petrol prices in regional locations in each state and the Northern Territory, along with those of the relevant capital city, from 1 April 2017 to 31 March 2018.14 These charts also show the differential between prices in regional locations in the state/territory and the respective capital city in the months of December 2017 and March 2018, and in 2017.
In March 2018, monthly average regional prices were higher than average capital city prices in New South Wales, Victoria, Queensland, South Australia, Western Australia and the Northern Territory. The monthly average regional price in Tasmania was lower than the average price in Hobart.
The charts show that price comparisons between capital cities and regional locations are significantly influenced by price cycles in a number of the capital cities over the short term.
Chart 4.2: Seven-day rolling average petrol prices in New South Wales regional locations and Sydney: 1 April 2017 to 31 March 2018
NSW regional locations Sydney
cpl
100
110
120
130
140
150
160Ja
n-18
Feb-18
Mar-18
Apr-17
May
-17
Jun-17
Jul-1
7
Aug
-17
Sep-17
Oct-17
Nov
-17
Dec
-17
Mar avg: 8.7 cplDec avg: 4.8 cpl
2017 avg: 7.9 cpl
Source: ACCC calculations based on FUELtrac data.
14 There are no prices available for locations in the Australian Capital Territory other than Canberra.

19 Report on the Australian petroleum market—March 2018
Chart 4.3: Seven-day rolling average petrol prices in Victorian regional locations and Melbourne: 1 April 2017 to 31 March 2018
Vic regional locations Melbourne
cpl
100
110
120
130
140
150
160
Mar avg: 3.5 cplDec avg: –1.8 cpl
2017 avg: 0.5 cpl
Jan-18
Feb-18
Mar-18
Apr-17
May
-17
Jun-17
Jul-1
7
Aug
-17
Sep-17
Oct-17
Nov
-17
Dec
-17
Source: ACCC calculations based on FUELtrac data.
Chart 4.4: Seven-day rolling average petrol prices in Queensland regional locations and Brisbane: 1 April 2017 to 31 March 2018
Qld regional locations Brisbane
cpl
100
110
120
130
140
150
160
Jan-18
Feb-18
Mar-18
Apr-17
May
-17
Jun-17
Jul-1
7
Aug
-17
Sep-17
Oct-17
Nov
-17
Dec
-17
Mar avg: 1.3 cplDec avg: –1.6 cpl
2017 avg: 3.7 cpl
Source: ACCC calculations based on FUELtrac data.

20 Report on the Australian petroleum market—March 2018
Chart 4.5: Seven-day rolling average petrol prices in South Australian regional locations and Adelaide: 1 April 2017 to 31 March 2018
SA regional locations Adelaide
cpl
100
110
120
130
140
150
160
Jan-18
Feb-18
Mar-18
Apr-17
May
-17
Jun-17
Jul-1
7
Aug
-17
Sep-17
Oct-17
Nov
-17
Dec
-17
Mar avg: 2.8 cplDec avg: 0.9 cpl
2017 avg: 3.1 cpl
Source: ACCC calculations based on FUELtrac data.
Chart 4.6: Seven-day rolling average petrol prices in Western Australian regional locations and Perth: 1 April 2017 to 31 March 2018
WA regional locations Perth
cpl
100
110
120
130
140
150
160
Jan-18
Feb-18
Mar-18
Apr-17
May
-17
Jun-17
Jul-1
7
Aug
-17
Sep-17
Oct-17
Nov
-17
Dec
-17
Mar avg: 7.5 cplDec avg: 3.8 cpl
2017 avg: 6.0 cpl
Source: ACCC calculations based on FUELtrac data.

21 Report on the Australian petroleum market—March 2018
Chart 4.7: Seven-day rolling average petrol prices in Tasmanian regional locations and Hobart: 1 April 2017 to 31 March 2018
Tas regional locations Hobart
cpl
100
110
120
130
140
150
160
Jan-18
Feb-18
Mar-18
Apr-17
May
-17
Jun-17
Jul-1
7
Aug
-17
Sep-17
Oct-17
Nov
-17
Dec
-17
Mar avg: –0.9 cplDec avg: –1.6 cpl
2017 avg: –1.4 cpl
Source: ACCC calculations based on FUELtrac data.
Chart 4.8: Seven-day rolling average petrol prices in Northern Territory regional locations and Darwin: 1 April 2017 to 31 March 2018
NT regional locations Darwin
cpl
100
110
120
130
140
150
160
Jan-18
Feb-18
Mar-18
Apr-17
May
-17
Jun-17
Jul-1
7
Aug
-17
Sep-17
Oct-17
Nov
-17
Dec
-17
Mar avg: 5.0 cplDec avg: 3.5 cpl
2017 avg: 9.8 cpl
Source: ACCC calculations based on FUELtrac data.

22 Report on the Australian petroleum market—March 2018
5. International price movementsThe main influences on movements in retail petrol prices in Australia are the international price of refined petrol (which, in turn, is influenced by the price of crude oil) and the AUD–USD exchange rate.
5.1 Crude oil and refined petrolCrude oil prices are an important influence on movements in refined petrol prices around the world. There are a number of international benchmarks used for pricing crude oil, including West Texas Intermediate (WTI), Brent, Tapis and Dubai. The most widely used benchmark on global markets is Brent crude oil.
The relevant international benchmark price for petrol in Australia is the price of refined petrol in the Asia-Pacific region. For RULP it is Singapore Mogas 95 Unleaded (Mogas 95). This benchmark is used for pricing petrol in Australia due to Australia’s proximity to Singapore, which is one of the world’s most important trading and refining centres.
5.1.1 Price movements over the last two yearsChart 5.1 shows movements in international crude oil and refined petrol prices in the two years to March 2018.
Chart 5.1: Weekly average Brent crude oil and Mogas 95 prices: April 2016 to March 2018
Brent crude oil Mogas 95
USD
per bl
30
40
50
60
70
80
90
Apr-16
Jul-16
Oct-16
Jan-17
Apr-17
Jul-17
Oct-17
Jan-18
Source: ACCC calculations based on Platts data.
Weekly average Brent crude prices trended upwards between April 2016 and March 2018. Prices were around USD 38 per barrel in early-April 2016 and increased to around USD 56 per barrel in early-February 2017. They subsequently decreased to around USD 45 per barrel in late-June 2017 before increasing steadily to around USD 66 per barrel by the end of December 2017.
In the March quarter 2018, weekly average Brent crude prices increased to around USD 70 per barrel by late-January 2018, which was their highest level since early-December 2014. Weekly average prices subsequently decreased to around USD 63 per barrel in mid-February 2018, before increasing again to around USD 67 per barrel at the end of March 2018.
Mogas 95 prices moved in a similar manner to Brent crude oil prices over the two-year period. During the March quarter 2018, Mogas 95 prices were around USD 76 per barrel at the beginning of January

23 Report on the Australian petroleum market—March 2018
2018, before rising to around USD 81 per barrel in early-February 2018. Mogas 95 prices ended the quarter at around USD 78 per barrel.
Brent crude oil and Mogas 95 prices both increased in the March quarter 2018: quarterly average Brent crude oil prices were around USD 67 per barrel (an increase of USD 6 per barrel from the previous quarter) and quarterly average Mogas 95 prices were USD 78 per barrel (an increase of USD 4 per barrel).
The increase in prices in the March quarter 2018 was influenced by an ongoing agreement between OPEC and 11 non-OPEC countries, including Russia, to cut crude oil output. This agreement commenced in late-2016 and has subsequently been extended a number of times, most recently in November 2017.15 However, price increases in the March quarter were tempered by rising crude oil inventories and increased production in the United States.16
5.1.2 Crude oil prices in the long termAs with many commodities, crude oil prices fluctuate greatly. In the short term, market sentiment about economic conditions and geo-political events can drive rapid movements in crude oil prices. Over the medium to longer term, prices are driven by supply and demand factors, with periods of high or low prices lasting several years.
Extended periods of high crude oil prices provide an incentive for producers to invest in exploration and expansion. This leads to an increase in supply, which in turn puts downward pressure on prices. Conversely, when crude oil prices are low, producers tend not to invest, which puts upward pressure on prices as growth in demand is not met by supply.
Chart 5.2 shows that over the 40 years to March 2018 WTI crude oil prices in real terms were on average around USD 60 per barrel. Over the last 10 years, prices were historically high, with the average around USD 82 per barrel. In the March quarter 2018, real WTI crude oil prices were on average around USD 63 per barrel, which was around USD 7 per barrel higher than the December quarter 2017 (USD 56 per barrel) and around USD 3 per barrel higher than the 40-year average.
Chart 5.2: Monthly average real WTI crude oil prices: April 1978 to March 2018
USD
per bl
0
20
40
60
80
100
120
140
160
1978
1979
1980
1981
1982
1983
1984
1985
1986
1987
1988
1989
1990
1991
1992
1993
1994
1995
1996
1997
1998
1999
2000
2001
2002
2003
2004
2005
2006
2007
2008
2009
2010
2011
2012
2013
2014
2015
2016
2017
WTI 40-year average 10-year average
Source: ACCC calculations based on data used with permission from The Wall Street Journal, WSJ.com, Copyright 2015 Dow Jones & Company, Inc. All rights reserved, Reuters and U.S. Department of Labor, Bureau of Labor Statistics, Consumer Price Index for all urban consumers, http://www.dlt.ri.gov/Lmi/pdf/cpi.pdf, accessed on 23 May 2018.
Note: Real (inflation adjusted) values in March 2018 dollars.
15 Reuters, OPEC, Russia agree oil cut extension to end of 2018, 30 November 2017, https://www.reuters.com/article/us-opec-meeting/opecrussia-agree-oil-cut-extension-to-end-of-2018-idUSKBN1DU0WW, accessed on 23 May 2018.
16 Reuters, Oil prices rise as OPEC seen continuing supply cuts through 2018, 29 March 2018, https://www.reuters.com/article/global-oil/oil-prices-rise-as-opec-seen-continuing-supply-cuts-through-2018-idUSL3N1RB1NL, accessed on 23 May 2018.

24 Report on the Australian petroleum market—March 2018
5.2 AUD–USD exchange rateThe AUD–USD exchange rate is a significant determinant of Australia’s retail petrol prices, because international refined petrol is bought and sold in United States dollars in global markets.
Chart 5.3 shows that in the two years to March 2018, the AUD–USD exchange rate fluctuated between USD 0.72 and USD 0.81. The average AUD–USD exchange rate during the two-year period was USD 0.76.
Chart 5.3: Daily AUD–USD exchange rates: 1 April 2016 to 31 March 2018
0.71
0.73
0.75
0.77
0.79
0.81
0.83
Apr-16
Jul-16
Oct-16
Oct-17
Jan-18
Jan-17
Apr-17
Jul-17
USD
Source: RBA data.
Note: Exchange rates are the daily RBA 4.00 pm closing rates. See: http://www.rba.gov.au/statistics/frequency/exchange-rates.html.
In the March quarter 2018, the average AUD–USD exchange rate was USD 0.79, which was around USD 0.02 higher than the December quarter 2017. Had the AUD–USD exchange rate remained at the two-year high of USD 0.81 (in September 2017), average retail petrol prices in the March quarter 2018 in Australia would have been 2.2 cpl lower (everything else being equal).
The higher AUD–USD exchange rate partially offset the influence of the increase in international refined petrol prices on Australian retail petrol prices.

25 Report on the Australian petroleum market—March 2018
6. Diesel and LPG prices
6.1 Diesel price movementsAverage retail diesel prices in the five largest cities increased in the March quarter 2018 to 140.1 cpl, an increase of 6.3 cpl from the December quarter 2017 (133.8 cpl).
The appropriate international benchmark price for diesel is the price of Singapore Gasoil with 10 parts per million sulphur content (Gasoil 10 ppm). International demand for diesel is different from that for petrol, in part because of diesel’s off-road, industrial and electricity generation uses. However, both petrol and diesel are refined from crude oil and their prices tend to broadly follow similar movements over the long term.
Chart 6.1 shows that seven-day rolling average retail diesel prices in the five largest cities broadly tracked Gasoil 10 ppm prices over the past year, although the difference between the two prices was relatively high in the March quarter 2018. Unlike petrol prices, diesel prices in the five largest cites do not move in cycles.
Chart 6.1: Seven-day rolling average retail diesel prices in the five largest cities and Gasoil 10 ppm prices: 1 April 2017 to 31 March 2018
cpl
cpl
Retail prices (LHS) Gasoil 10 ppm (lagged 11 days) (RHS)
30
40
50
60
70
80
90
100
110
105
110
115
120
125
130
135
140
145
Jan-18
Feb-18
Mar-18
Oct-17
Nov
-17
Dec
-17
Apr-17
May
-17
Jun-17
Jul-1
7
Aug
-17
Sep-17
Source: ACCC calculations based on FUELtrac, Platts and RBA data.
Note: Gasoil 10 ppm prices are lagged by 11 days as there is generally around a one to two-week lag between changes in international prices and changes in retail prices in the five largest cities.
Seven-day rolling average diesel retail prices at the beginning of the March quarter 2018 were 138.7 cpl. They fluctuated within a 2.2 cpl range during the quarter and were 140.1 cpl at the end of the quarter. Gasoil 10 ppm prices were 62.2 cpl at the beginning of the quarter. They increased to a high of 65.1 cpl at the end of January 2018 and were 62.4 cpl at the end of the quarter.
Average Gasoil 10 ppm prices in the March quarter 2018 were 63.1 cpl, an increase of 4.2 cpl from the December quarter 2017 (58.9 cpl).

26 Report on the Australian petroleum market—March 2018
6.2 LPG price movementsIn the March quarter 2018, average retail LPG prices in the five largest cities were 85.2 cpl, an increase of 3.0 cpl from the December quarter (82.2 cpl).
The appropriate international benchmarks for LPG are the Saudi Aramco Contract Prices for propane and butane (Saudi CP). These prices only change once a month, at the start of each month. International LPG prices loosely move in line with international refined petrol and diesel prices.
Seven-day rolling average retail LPG prices at the beginning of the March quarter 2018 were 86.3 cpl and peaked at 86.7 cpl in mid-January. They subsequently decreased to end the quarter at 82.3 cpl (see chart 6.2). Over the same period the Saudi CP benchmarks decreased by 8.7 cpl, from 41.4 cpl in January 2018 to 32.7 cpl in March 2018.
The chart shows that retail prices were not as responsive, both down and up, to movements in Saudi CP benchmark prices.
Chart 6.2: Seven-day rolling average retail LPG prices in the five largest cities and monthly Saudi CP benchmarks: 1 April 2017 to 31 March 2018
cpl
cpl
Retail prices (LHS) Saudi CP (RHS)
20
25
30
35
40
45
50
55
60
65
45
50
55
60
65
70
75
80
85
90
Jan-18
Feb-18
Mar-18
Oct-17
Nov
-17
Dec
-17
Apr-17
May
-17
Jun-17
Jul-1
7
Aug
-17
Sep-17
Source: ACCC calculations based on FUELtrac, RBA, Gas Energy Australia and Reuters data.
As the Saudi CP benchmarks only change at the start of each month, the relationship between movements in the international benchmark prices and retail prices for LPG is somewhat different from petrol and diesel. Furthermore, international LPG prices are influenced by non-transport factors, such as demand for heating, particularly in the Northern Hemisphere.
Like diesel prices, retail LPG prices tend to be less volatile than petrol prices and do not have price cycles. LPG usage in Australia is significantly less than petrol and diesel usage, and there are fewer retailers of LPG, particularly outside Victoria (where around half of Australia’s automotive LPG is sold).
27 Report on the Australian petroleum market—March 2018
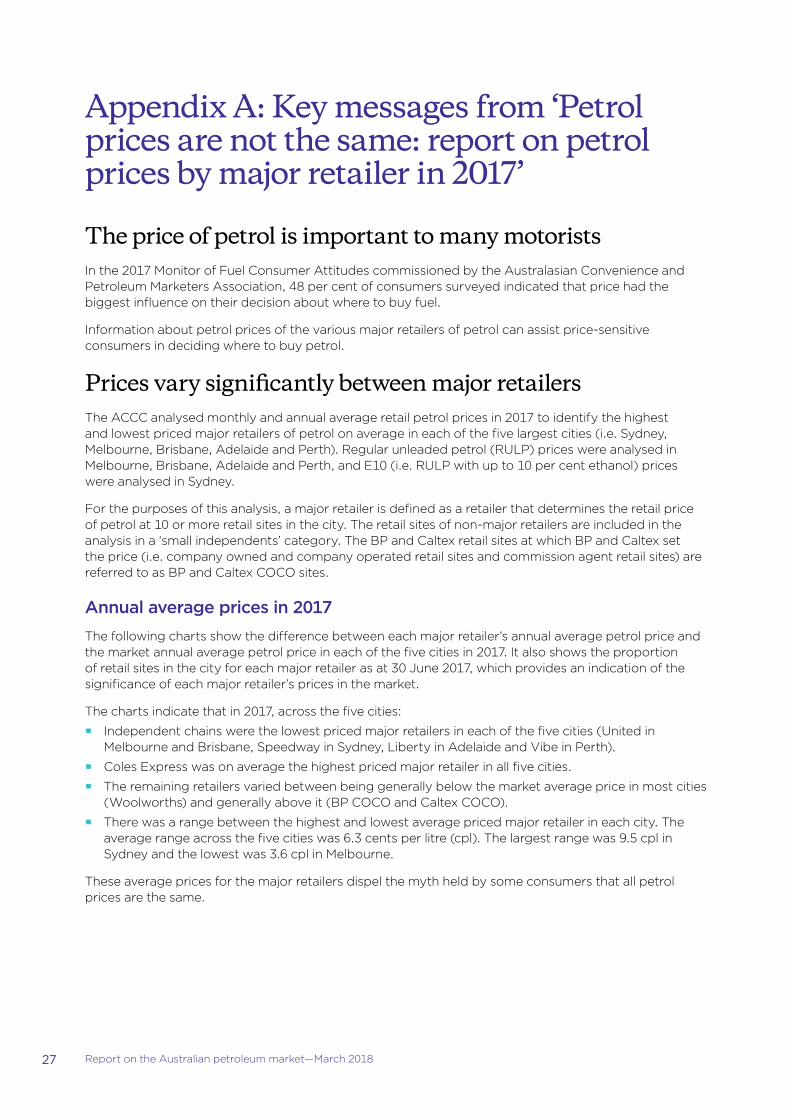
Appendix A: Key messages from ‘Petrol prices are not the same: report on petrol prices by major retailer in 2017’
The price of petrol is important to many motoristsIn the 2017 Monitor of Fuel Consumer Attitudes commissioned by the Australasian Convenience and Petroleum Marketers Association, 48 per cent of consumers surveyed indicated that price had the biggest influence on their decision about where to buy fuel.
Information about petrol prices of the various major retailers of petrol can assist price-sensitive consumers in deciding where to buy petrol.
Prices vary significantly between major retailersThe ACCC analysed monthly and annual average retail petrol prices in 2017 to identify the highest and lowest priced major retailers of petrol on average in each of the five largest cities (i.e. Sydney, Melbourne, Brisbane, Adelaide and Perth). Regular unleaded petrol (RULP) prices were analysed in Melbourne, Brisbane, Adelaide and Perth, and E10 (i.e. RULP with up to 10 per cent ethanol) prices were analysed in Sydney.
For the purposes of this analysis, a major retailer is defined as a retailer that determines the retail price of petrol at 10 or more retail sites in the city. The retail sites of non-major retailers are included in the analysis in a ‘small independents’ category. The BP and Caltex retail sites at which BP and Caltex set the price (i.e. company owned and company operated retail sites and commission agent retail sites) are referred to as BP and Caltex COCO sites.
Annual average prices in 2017The following charts show the difference between each major retailer’s annual average petrol price and the market annual average petrol price in each of the five cities in 2017. It also shows the proportion of retail sites in the city for each major retailer as at 30 June 2017, which provides an indication of the significance of each major retailer’s prices in the market.
The charts indicate that in 2017, across the five cities:
�� Independent chains were the lowest priced major retailers in each of the five cities (United in Melbourne and Brisbane, Speedway in Sydney, Liberty in Adelaide and Vibe in Perth).
�� Coles Express was on average the highest priced major retailer in all five cities.
�� The remaining retailers varied between being generally below the market average price in most cities (Woolworths) and generally above it (BP COCO and Caltex COCO).
�� There was a range between the highest and lowest average priced major retailer in each city. The average range across the five cities was 6.3 cents per litre (cpl). The largest range was 9.5 cpl in Sydney and the lowest was 3.6 cpl in Melbourne.
These average prices for the major retailers dispel the myth held by some consumers that all petrol prices are the same.

28 Report on the Australian petroleum market—March 2018
Difference between each major retailer’s annual average E10 price and the market annual average E10 price in Sydney in 2017
–6 –4 –2 Market average 2 4 6
Speedway (4%)
Metro (9%)
Budget (4%)
Westside (1%)
Small independents (21%)
United (2%)
7-Eleven (16%)
Woolworths (8%)
BP Jasbe (2%)
Caltex COCO (13%)
BP COCO (7%)
Coles Express (12%)
cpl
Source: ACCC calculations based on Informed Sources data and information provided by some major retailers.
Notes: The number in brackets for each major retailer is the proportion of retail sites in the city for that retailer.
The proportions of retail sites shown in the chart do not total 100 per cent due to rounding.
The annual average Woolworths price was equal to the market average price.
BP Jasbe is a BP-branded independent chain.
Difference between each major retailer’s annual average RULP price and the market annual average RULP price in Melbourne in 2017
–6 –4 –2 Market average 2 4 6
Small independents (18%)
Caltex COCO (11%)
United (11%)
7-Eleven (17%)
Woolworths (11%)
BP Jasbe (2%)
BP COCO (4%)
Coles Express (18%)
BP AA (6%)
cpl
Source: ACCC calculations based on Informed Sources data and information provided by some major retailers.
Notes: The number in brackets for each major retailer is the proportion of retail sites in the city for each major retailer.
Prices were unavailable for Liberty retail sites in Melbourne. Therefore, the proportions of retail sites shown in the chart do not total 100 per cent.
BP Jasbe and BP AA are BP-branded independent chains.

29 Report on the Australian petroleum market—March 2018
Difference between each major retailer’s annual average RULP price and the market annual average RULP price in Brisbane in 2017
–6 –4 –2 Market average 2 4 6
United (3%)
7-Eleven (17%)
Puma Energy (9%)
Woolworths (10%)
Small independents (20%)
Caltex COCO (13%)
Freedom Fuels (5%)
BP COCO (8%)
Coles Express (15%)
cpl
Source: ACCC calculations based on Informed Sources data and information provided by some major retailers.
Note: The numbers in brackets are the proportion of retail sites in the city for each major retailer.
Difference between each major retailer’s annual average RULP price and the market annual average RULP price in Adelaide in 2017
–6 –4 –2 Market average 2 4 6
Liberty (8%)
Small independents (19%)
Woolworths (8%)
Caltex COCO (16%)
On The Run (37%)
Coles Express (12%)
cpl
Source: ACCC calculations based on Informed Sources data and information provided by some major retailers.
Notes: The numbers in brackets are the proportion of retail sites in the city for each major retailer.
The annual average Caltex COCO price was equal to the market average price.

30 Report on the Australian petroleum market—March 2018
Difference between each major retailer’s annual average RULP price and the market annual average RULP price in Perth in 2017
–6 –4 –2 Market average 2 4 6
Vibe (3%)
United (4%)
7-Eleven (4%)
Woolworths (7%)
Small independents (21%)
Puma Energy (13%)
Caltex COCO (19%)
BP COCO (13%)
Coles Express (15%)
cpl
Source: ACCC calculations based on Informed Sources data and information provided by some major retailers.
Notes: The numbers in brackets are the proportion of retail sites in the city for each major retailer.
The proportions of retail sites shown in the chart do not total 100 per cent due to rounding.
Some caveats about the use of these average prices are described in chapter 2 of the report.
Monthly average prices in 2017The ACCC also analysed average prices of the major retailers in the five cities in 2017 on a monthly basis.
This analysis showed that the relativities between the major retailers varied over the months. For example, while Coles Express was on average the highest priced retailer in all five cities on an annual basis, this was not always the case on a monthly basis. Similarly, in Sydney, Melbourne, Brisbane and Adelaide, the lowest priced major retailer in each city on an annual basis did not always have the lowest price on a monthly basis. The analysis showed, however, that the independent chains (such as 7-Eleven and United) generally had monthly average prices that were lower than market average prices.
The range between the highest and lowest average prices has increased significantly since 2007The ACCC calculated annual average prices for most major retailers in 2007 and compared them with those in 2017.
A major difference was that the range between the lowest and highest annual average priced retailer increased between the two periods. In 2007, the average range across the five cities was 2.4 cpl, which was just over a third of the average range in 2017 (6.3 cpl). In 2007, the largest range was 3.7 cpl in Perth and the lowest was 1.1 cpl in Melbourne, whereas in 2017 the largest range was 9.5 cpl in Sydney and the lowest was 3.6 cpl in Melbourne.
The greater range of prices in 2017 suggests that a motorist’s decision about where to buy petrol is more important in 2017 than it was in 2007.
There were also similarities between the two periods. An independent chain was the lowest priced retailer in all five cities in 2017, and an independent chain had the lowest average price in Sydney, Brisbane and Perth in 2007 (with Woolworths the lowest in Melbourne and Adelaide). The average prices of BP-branded retail sites were above the market average price in all five cities in 2007 and 2017. The average price of Caltex-branded sites were above the market average in the majority of the five cities in the two periods.

31 Report on the Australian petroleum market—March 2018
Motorists can make savings by buying petrol at the lowest priced retailersBy choosing to buy petrol at lower priced retailers, consumers can make significant savings over time.
The information about the relative average prices of the major retailers contained in this report can be used by motorists, in conjunction with other publicly available fuel price information, to help make more informed purchasing decisions.
There are a variety of fuel price websites and apps that provide information to motorists about petrol prices. These include: the NSW FuelCheck website and app; the Northern Territory MyFuel NT website and app; the WA FuelWatch website; the MotorMouth website and app, and apps operated by GasBuddy, the NRMA, 7-Eleven and Woolworths. There are differences in the quality of the price data available from these websites and apps as well as the frequency with which it is updated.
However, readily available information about current retail petrol prices enables motorists to shop around and purchase petrol at relatively lower priced retail sites. Not only do motorists benefit from those lower prices, but the availability of petrol price data may promote competitive market behaviour. It will reward those retailers that are prepared to compete actively on price, because their pricing behaviour can be seen, and acted upon, by motorists.
Petrol retailers are not the sameThere are currently around 7300 retail fuel sites in Australia and these operate under a range of business models. The variety of business models and ownership structures mean that there are different pricing strategies among retail sites, as well as different capital structures and cost bases.
For example, some retailers may consider that they have a ‘premium brand’, an attractive retail site, a good location and a superior convenience store, and set their retail prices higher to reflect these features. Other retailers may consider that they need to set prices below those of many of their local competitors to attract customers to their retail site. Some may have competitive prices to attract consumers into their convenience store where margins are often higher than on sales of fuel.
Some retailers may offer discounts to qualifying customers. Examples of these include shopper docket discount arrangements of the supermarket chains, discount arrangements between some major retailers and state motoring organisations, and discounts associated with fuel cards. These offers may also influence a retailer’s pricing strategy.
These differences need to be borne in mind when considering the average prices of the major retailers. Consumers should remember, however, that there are minimum standards for RULP that all retailers must adhere to, and RULP sold by an independent retailer is typically supplied by the same refinery or import terminal as that sold by a so called ‘premium brand’.
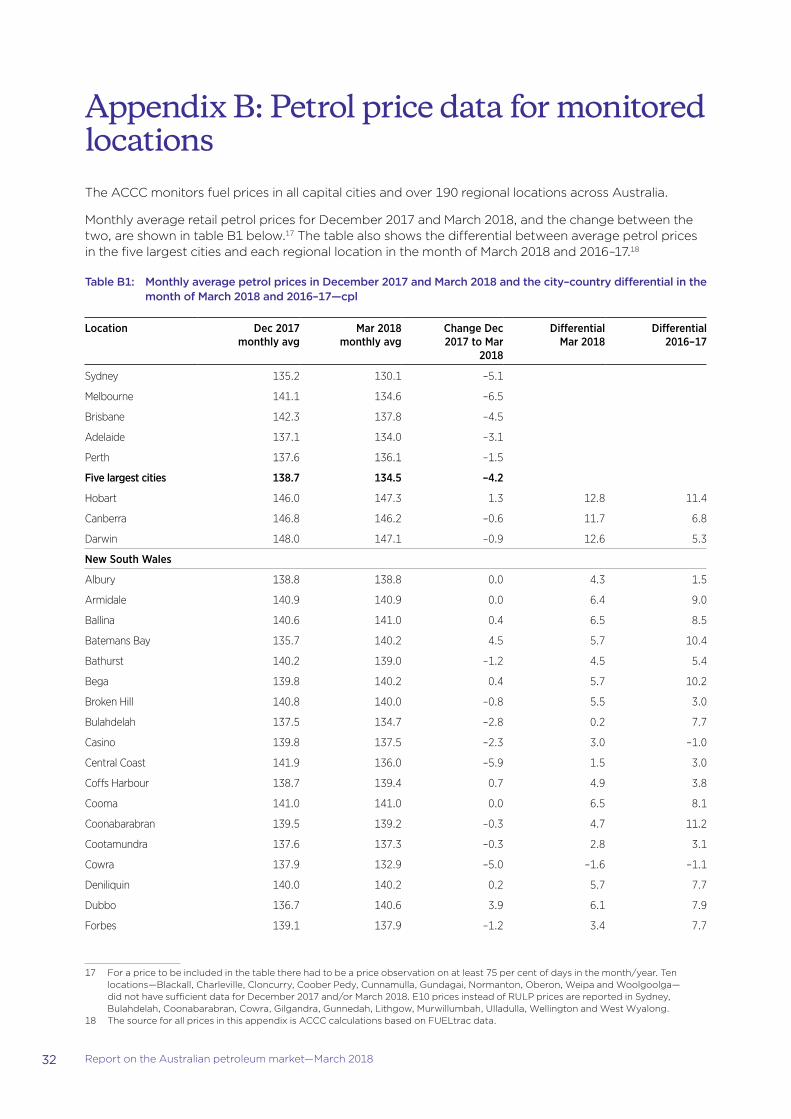
32 Report on the Australian petroleum market—March 2018
Appendix B: Petrol price data for monitored locationsThe ACCC monitors fuel prices in all capital cities and over 190 regional locations across Australia.
Monthly average retail petrol prices for December 2017 and March 2018, and the change between the two, are shown in table B1 below.17 The table also shows the differential between average petrol prices in the five largest cities and each regional location in the month of March 2018 and 2016–17.18
Table B1: Monthly average petrol prices in December 2017 and March 2018 and the city–country differential in the month of March 2018 and 2016–17—cpl
Location Dec 2017 monthly avg
Mar 2018 monthly avg
Change Dec 2017 to Mar
2018
Differential Mar 2018
Differential 2016–17
Sydney 135.2 130.1 –5.1
Melbourne 141.1 134.6 –6.5
Brisbane 142.3 137.8 –4.5
Adelaide 137.1 134.0 –3.1
Perth 137.6 136.1 –1.5
Five largest cities 138.7 134.5 –4.2
Hobart 146.0 147.3 1.3 12.8 11.4
Canberra 146.8 146.2 –0.6 11.7 6.8
Darwin 148.0 147.1 –0.9 12.6 5.3
New South Wales
Albury 138.8 138.8 0.0 4.3 1.5
Armidale 140.9 140.9 0.0 6.4 9.0
Ballina 140.6 141.0 0.4 6.5 8.5
Batemans Bay 135.7 140.2 4.5 5.7 10.4
Bathurst 140.2 139.0 –1.2 4.5 5.4
Bega 139.8 140.2 0.4 5.7 10.2
Broken Hill 140.8 140.0 –0.8 5.5 3.0
Bulahdelah 137.5 134.7 –2.8 0.2 7.7
Casino 139.8 137.5 –2.3 3.0 –1.0
Central Coast 141.9 136.0 –5.9 1.5 3.0
Coffs Harbour 138.7 139.4 0.7 4.9 3.8
Cooma 141.0 141.0 0.0 6.5 8.1
Coonabarabran 139.5 139.2 –0.3 4.7 11.2
Cootamundra 137.6 137.3 –0.3 2.8 3.1
Cowra 137.9 132.9 –5.0 –1.6 –1.1
Deniliquin 140.0 140.2 0.2 5.7 7.7
Dubbo 136.7 140.6 3.9 6.1 7.9
Forbes 139.1 137.9 –1.2 3.4 7.7
17 For a price to be included in the table there had to be a price observation on at least 75 per cent of days in the month/year. Ten locations—Blackall, Charleville, Cloncurry, Coober Pedy, Cunnamulla, Gundagai, Normanton, Oberon, Weipa and Woolgoolga—did not have sufficient data for December 2017 and/or March 2018. E10 prices instead of RULP prices are reported in Sydney, Bulahdelah, Coonabarabran, Cowra, Gilgandra, Gunnedah, Lithgow, Murwillumbah, Ulladulla, Wellington and West Wyalong.
18 The source for all prices in this appendix is ACCC calculations based on FUELtrac data.

33 Report on the Australian petroleum market—March 2018
Location Dec 2017 monthly avg
Mar 2018 monthly avg
Change Dec 2017 to Mar
2018
Differential Mar 2018
Differential 2016–17
Forster 141.5 141.4 –0.1 6.9 10.6
Gilgandra 137.5 138.5 1.0 4.0 7.2
Glen Innes 135.0 138.1 3.1 3.6 n/a
Goulburn 135.1 132.8 –2.3 –1.7 –2.1
Grafton 138.0 137.2 –0.8 2.7 3.7
Griffith 138.9 138.7 –0.2 4.2 6.4
Gunnedah 129.8 130.9 1.1 –3.6 5.2
Hay 135.9 138.5 2.6 4.0 3.2
Inverell 136.7 139.0 2.3 4.5 6.8
Jerilderie 139.9 141.9 2.0 7.4 6.6
Kempsey 136.7 137.0 0.3 2.5 4.9
Leeton 135.6 135.5 –0.1 1.0 0.3
Lismore 133.6 133.5 –0.1 –1.0 3.4
Lithgow 130.0 123.1 –6.9 –11.4 0.8
Merimbula 137.8 136.2 –1.6 1.7 5.7
Mittagong 147.4 143.4 –4.0 8.9 11.4
Moama 139.7 139.7 0.0 5.2 –1.8
Moree 139.4 139.4 0.0 4.9 6.2
Moruya 139.9 141.4 1.5 6.9 6.0
Moss Vale 148.0 141.4 –6.6 6.9 7.2
Mudgee 140.8 140.4 –0.4 5.9 7.8
Murwillumbah 133.5 134.3 0.8 –0.2 0.4
Muswellbrook 138.5 135.4 –3.1 0.9 6.6
Narrabri 143.3 143.4 0.1 8.9 8.3
Newcastle 141.4 138.6 –2.8 4.1 1.1
Nowra 144.9 132.4 –12.5 –2.1 4.2
Nyngan 140.6 136.8 –3.8 2.3 7.5
Orange 140.2 135.5 –4.7 1.0 4.2
Parkes 139.8 138.9 –0.9 4.4 8.9
Port Macquarie 140.4 142.3 1.9 7.8 7.8
Queanbeyan 146.9 136.0 –10.9 1.5 4.2
Singleton 146.4 142.1 –4.3 7.6 8.3
Tamworth 137.5 139.7 2.2 5.2 6.2
Taree 142.4 141.7 –0.7 7.2 9.1
Temora 135.9 136.0 0.1 1.5 2.0
Tumut 137.7 138.1 0.4 3.6 5.9
Tweed Heads South 146.7 131.7 –15.0 –2.8 2.8
Ulladulla 137.9 138.8 0.9 4.3 3.8
Wagga Wagga 140.0 134.0 –6.0 –0.5 7.6
Wauchope 140.0 140.1 0.1 5.6 7.1
Wellington 135.9 137.7 1.8 3.2 –2.6
West Wyalong 138.0 138.1 0.1 3.6 4.9
Wollongong 143.9 139.1 –4.8 4.6 0.4

34 Report on the Australian petroleum market—March 2018
Location Dec 2017 monthly avg
Mar 2018 monthly avg
Change Dec 2017 to Mar
2018
Differential Mar 2018
Differential 2016–17
Yass 142.1 143.2 1.1 8.7 8.0
Northern Territory
Alice Springs 154.0 154.6 0.6 20.1 13.2
Katherine 145.3 146.1 0.8 11.6 8.9
Tennant Creek 154.2 154.9 0.7 20.4 21.0
Queensland
Atherton 140.1 137.9 –2.2 3.4 11.7
Ayr 140.2 139.5 –0.7 5.0 0.7
Biloela 142.0 142.4 0.4 7.9 11.0
Blackwater 140.1 141.9 1.8 7.4 13.3
Bowen 141.8 139.9 –1.9 5.4 8.2
Bundaberg 138.0 131.9 –6.1 –2.6 0.2
Buronga 137.2 135.5 –1.7 1.0 n/a
Caboolture 144.1 137.3 –6.8 2.8 3.1
Cairns 139.0 131.6 –7.4 –2.9 13.1
Charters Towers 140.5 139.5 –1.0 5.0 9.2
Childers 137.5 135.2 –2.3 0.7 1.9
Dalby 140.4 139.9 –0.5 5.4 4.6
Emerald 140.4 141.9 1.5 7.4 12.0
Gladstone 141.2 134.6 –6.6 0.1 4.6
Gold Coast 142.5 136.8 –5.7 2.3 1.7
Goondiwindi 141.3 139.9 –1.4 5.4 5.2
Gympie 134.8 131.9 –2.9 –2.6 1.4
Hervey Bay 140.9 141.4 0.5 6.9 9.5
Ingham 140.3 140.9 0.6 6.4 7.1
Innisfail 140.1 134.2 –5.9 –0.3 12.2
Ipswich 141.5 138.0 –3.5 3.5 –2.3
Kingaroy 140.6 140.1 –0.5 5.6 6.4
Longreach 145.4 145.6 0.2 11.1 13.6
Mackay 141.9 137.8 –4.1 3.3 7.2
Mareeba 141.5 135.2 –6.3 0.7 9.4
Maryborough 137.0 136.3 –0.7 1.8 1.4
Miles 132.9 134.1 1.2 –0.4 –4.3
Moranbah 137.1 140.9 3.8 6.4 4.2
Mt Isa 149.7 149.7 0.0 15.2 9.4
Rockhampton 141.7 140.9 –0.8 6.4 11.8
Roma 140.1 139.9 –0.2 5.4 5.1
Sunshine Coast 141.2 138.8 –2.4 4.3 5.2
Toowoomba 139.6 138.3 –1.3 3.8 0.7
Townsville 141.7 139.0 –2.7 4.5 5.3
Tully 140.2 140.0 –0.2 5.5 10.3
Warwick 140.4 140.2 –0.2 5.7 7.8
Whitsunday 141.1 137.9 –3.2 3.4 –2.0
Yeppoon 141.0 140.6 –0.4 6.1 11.5

35 Report on the Australian petroleum market—March 2018
Location Dec 2017 monthly avg
Mar 2018 monthly avg
Change Dec 2017 to Mar
2018
Differential Mar 2018
Differential 2016–17
South Australia
Bordertown 135.1 135.2 0.1 0.7 0.1
Ceduna 137.5 139.3 1.8 4.8 3.3
Clare 135.4 134.9 –0.5 0.4 –4.6
Gawler 139.8 137.5 –2.3 3.0 –0.2
Kadina 135.6 136.4 0.8 1.9 –3.0
Keith 139.0 136.5 –2.5 2.0 1.3
Loxton 138.5 132.3 –6.2 –2.2 –1.6
Mt Gambier 137.8 137.0 –0.8 2.5 –1.6
Murray Bridge 135.6 135.5 –0.1 1.0 –0.9
Naracoorte 138.8 134.0 –4.8 –0.5 2.6
Port Augusta 139.3 139.3 0.0 4.8 0.6
Port Lincoln 138.9 139.0 0.1 4.5 1.5
Port Pirie 135.3 132.8 –2.5 –1.7 –2.3
Renmark 138.9 134.7 –4.2 0.2 –2.0
Tailem Bend 137.5 136.6 –0.9 2.1 0.4
Victor Harbour 139.6 138.1 –1.5 3.6 1.6
Whyalla 139.0 138.4 –0.6 3.9 1.9
Tasmania
Burnie 143.9 145.9 2.0 11.4 8.3
Campbell Town 145.3 147.9 2.6 13.4 10.7
Devonport 141.2 145.7 4.5 11.2 9.3
Huonville 144.9 145.6 0.7 11.1 9.6
Launceston 147.1 148.6 1.5 14.1 11.9
New Norfolk 146.6 148.2 1.6 13.7 9.9
Queenstown 147.0 147.0 0.0 12.5 12.9
Smithton 141.2 144.9 3.7 10.4 8.7
Sorell 143.7 146.5 2.8 12.0 9.2
Ulverstone 144.4 146.1 1.7 11.6 8.6
Wynyard 143.4 144.1 0.7 9.6 9.0
Victoria
Ararat 140.0 141.2 1.2 6.7 0.7
Bairnsdale 135.3 134.3 –1.0 –0.2 –3.0
Ballarat 138.2 135.9 –2.3 1.4 –1.0
Benalla 138.8 139.5 0.7 5.0 2.7
Bendigo 139.5 132.6 –6.9 –1.9 1.5
Cobram 138.4 136.7 –1.7 2.2 2.0
Colac 137.1 139.3 2.2 4.8 –0.1
Corryong 147.2 141.9 –5.3 7.4 9.1
Echuca 139.5 139.8 0.3 5.3 –1.1
Euroa 138.7 140.1 1.4 5.6 2.5
Geelong 140.3 133.5 –6.8 –1.0 0.2
Hamilton 139.4 139.9 0.5 5.4 2.0
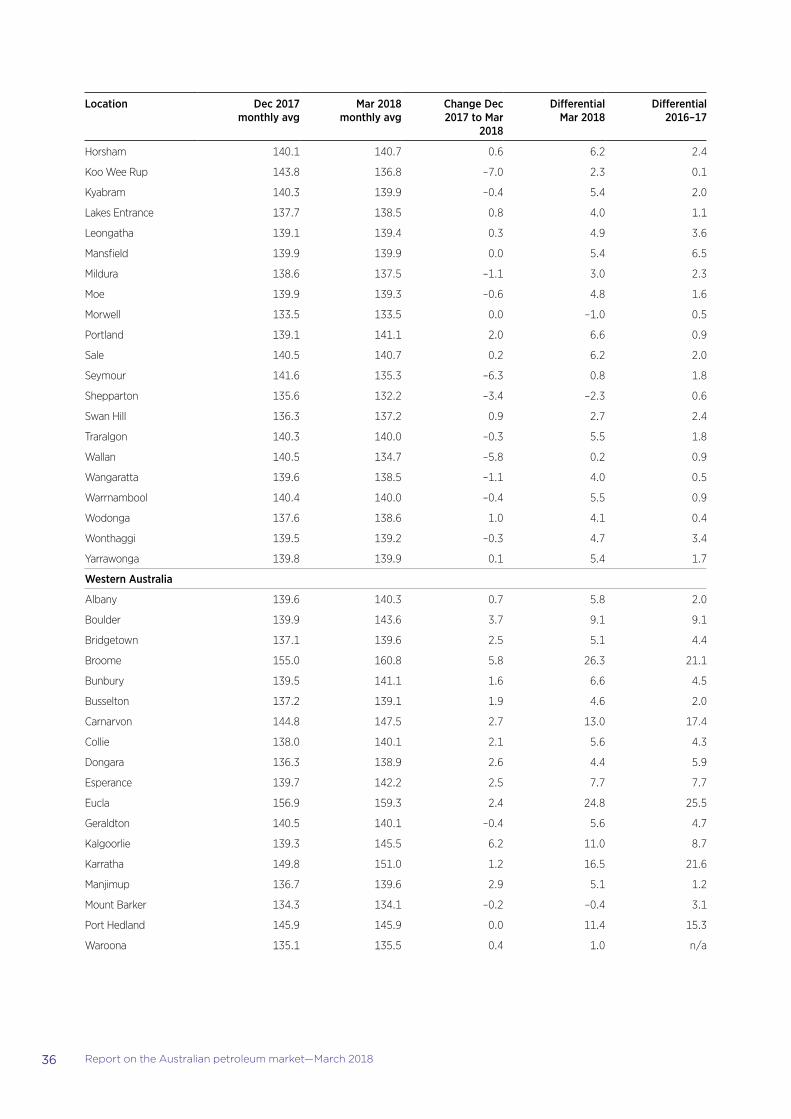
36 Report on the Australian petroleum market—March 2018
Location Dec 2017 monthly avg
Mar 2018 monthly avg
Change Dec 2017 to Mar
2018
Differential Mar 2018
Differential 2016–17
Horsham 140.1 140.7 0.6 6.2 2.4
Koo Wee Rup 143.8 136.8 –7.0 2.3 0.1
Kyabram 140.3 139.9 –0.4 5.4 2.0
Lakes Entrance 137.7 138.5 0.8 4.0 1.1
Leongatha 139.1 139.4 0.3 4.9 3.6
Mansfield 139.9 139.9 0.0 5.4 6.5
Mildura 138.6 137.5 –1.1 3.0 2.3
Moe 139.9 139.3 –0.6 4.8 1.6
Morwell 133.5 133.5 0.0 –1.0 0.5
Portland 139.1 141.1 2.0 6.6 0.9
Sale 140.5 140.7 0.2 6.2 2.0
Seymour 141.6 135.3 –6.3 0.8 1.8
Shepparton 135.6 132.2 –3.4 –2.3 0.6
Swan Hill 136.3 137.2 0.9 2.7 2.4
Traralgon 140.3 140.0 –0.3 5.5 1.8
Wallan 140.5 134.7 –5.8 0.2 0.9
Wangaratta 139.6 138.5 –1.1 4.0 0.5
Warrnambool 140.4 140.0 –0.4 5.5 0.9
Wodonga 137.6 138.6 1.0 4.1 0.4
Wonthaggi 139.5 139.2 –0.3 4.7 3.4
Yarrawonga 139.8 139.9 0.1 5.4 1.7
Western Australia
Albany 139.6 140.3 0.7 5.8 2.0
Boulder 139.9 143.6 3.7 9.1 9.1
Bridgetown 137.1 139.6 2.5 5.1 4.4
Broome 155.0 160.8 5.8 26.3 21.1
Bunbury 139.5 141.1 1.6 6.6 4.5
Busselton 137.2 139.1 1.9 4.6 2.0
Carnarvon 144.8 147.5 2.7 13.0 17.4
Collie 138.0 140.1 2.1 5.6 4.3
Dongara 136.3 138.9 2.6 4.4 5.9
Esperance 139.7 142.2 2.5 7.7 7.7
Eucla 156.9 159.3 2.4 24.8 25.5
Geraldton 140.5 140.1 –0.4 5.6 4.7
Kalgoorlie 139.3 145.5 6.2 11.0 8.7
Karratha 149.8 151.0 1.2 16.5 21.6
Manjimup 136.7 139.6 2.9 5.1 1.2
Mount Barker 134.3 134.1 –0.2 –0.4 3.1
Port Hedland 145.9 145.9 0.0 11.4 15.3
Waroona 135.1 135.5 0.4 1.0 n/a

37 Report on the Australian petroleum market—March 2018
Appendix C: Update on regional market studiesUnder the previous monitoring direction, the ACCC undertook regional petrol market studies in Darwin, Launceston, Armidale and Cairns. The ACCC continues to monitor prices and GIRDs in those locations.
DarwinThe ACCC’s report on the Darwin petrol market was released in November 2015.19 It found that the increase in retail petrol margins in Darwin in recent years had imposed a significant cost on motorists. The report noted that higher prices and profits in Darwin were the result of weak retail competition.
Darwin petrol prices increased significantly in the March quarter 2018Chart C1 shows quarterly average retail petrol prices in Darwin and the five largest cities from the June quarter 2015 to the March quarter 2018.
Chart C1: Quarterly average retail petrol prices in Darwin and the five largest cities: June quarter 2015 to March quarter 2018
cpl
100
110
120
130
140
150
160
Five largest citiesDarwin
Mar-18
Jun-15
Sep
-15
Dec
-15
Mar-16
Jun-16
Sep
-16
Dec
-16
Mar-17
Jun-17
Sep
-17
Dec
-17
Source: ACCC calculations based on FUELtrac data.
In the March quarter 2018, average retail petrol prices in Darwin were 148.3 cpl, an increase of 8.3 cpl from the December quarter 2017 (140.0 cpl).
The market study noted that the average differential between prices in Darwin and the five largest cities in 2012–13 and 2013–14 was over 19.0 cpl. Since then it has decreased significantly.
In the March quarter 2018, the average differential was 12.8 cpl, an increase of 7.9 cpl from the December quarter 2017 (4.9 cpl). In 2017, the annual average differential was 6.6 cpl.
19 ACCC, Report on the Darwin petrol market, November 2015, at: https://www.accc.gov.au/publications/petrol-market-studies/report-on-the-darwin-petrol-market.

38 Report on the Australian petroleum market—March 2018
Darwin petrol prices were above a long-term competitive cost based priceThe ACCC’s Darwin report noted that motorists were paying around 10 cpl more than they should have been in a competitive market. This was based on a comparison of GIRDs in Darwin with those in the larger capital cities.
Chart C2 shows Darwin petrol prices on a rolling annual average basis from 1 January 2015 to 31 March 2018. Each daily price in the chart is the average of that day’s price and prices on 364 previous days. Analysis of prices over the long term enables short-term influences (such as lags in regional price movements) to be smoothed out.
The chart also shows estimated Darwin prices calculated on a long-term cost basis. This calculation reflects the fact that costs (such as freight and operating costs per litre) are higher in Darwin, and assumes that retail margins in Darwin should be broadly similar to long-term average retail margins in the five largest cities. This long-term competitive cost-based price provides a benchmark against which to compare current price levels. It is not static and will change as its underlying elements change over time. If retail prices are constantly above this benchmark price for a sustained period, this may be indicative of a less-competitive market in which retailers are earning higher margins at the expense of consumers.
Chart C2: Rolling annual average retail prices and a long-term competitive cost-based price in Darwin, and the difference: 1 January 2015 to 31 March 2018
cpl
cpl
Retail price (LHS) Competitive cost-based price (LHS) Di�erence (RHS)
ACCC announces Darwin market study 10 Mar 2015
100
110
120
130
140
150
160
170
180
–10
0
10
20
30
40
50
60
70
Jan-15
Apr-15
Jul-1
5
Oct-15
Jan-16
Apr-16
Jul-1
6
Oct-16
Jan-17
Apr-17
Jul-1
7
Oct-17
Mar-18
ACCC report released23 Nov 2015
Source: ACCC calculations based on FUELtrac and Informed Sources data, and data from the companies that participated in the Darwin market study.
The chart indicates that petrol prices in Darwin were above a long-term competitive cost-based price in the March quarter 2018.
Darwin GIRDs increased significantly in the March quarter 2018Chart C3 shows quarterly average GIRDs in Darwin over a three-year period from the June quarter 2015 to the March quarter 2018. GIRDs in Darwin have decreased in recent years since the peak of 30.6 cpl in the September quarter 2014.
In the March quarter 2018, Darwin GIRDs were 20.3 cpl, an increase of 5.8 cpl from the December quarter 2017 (14.5 cpl). Darwin GIRDs were 7.9 cpl higher than the five largest cities during the March quarter 2018, an increase of 7.7 cpl from the previous quarter (0.2 cpl).

39 Report on the Australian petroleum market—March 2018
Chart C3: Quarterly average petrol GIRDs in Darwin and the five largest cities: June quarter 2015 to March quarter 2018
0
5
10
15
20
25
30
cpl
Five largest citiesDarwin
Jun-15
Sep
-15
Dec
-15
Mar-16
Jun-16
Sep
-16
Dec
-16
Mar-17
Jun-17
Sep
-17
Dec
-17
Mar-18
Source: ACCC calculations based on FUELtrac, Australian Institute of Petroleum (AIP), BP, Caltex, Mobil, Viva Energy and WA FuelWatch data.
Darwin retail prices since the introduction of MyFuel NTOn 1 November 2017, the MyFuel NT scheme commenced. It is a territory-wide real-time mandatory retail fuel price-reporting scheme, which gives consumers access (via website or mobile app) to live data from every fuel retailer in the NT.
Chart C4 shows daily average petrol prices and TGPs (lagged by five days) in Darwin over the period 1 September 2017 to 31 March 2018.
Retail prices increased significantly prior to the introduction of MyFuel NT following an increase in TGPs. However, the increase in retail prices (around 11.0 cpl) was larger than the increase in TGPs (around 8.0 cpl) and occurred immediately. Retail prices increased in mid-November 2017 by around 5.0 cpl, and again in early-December 2017 by a further 4.0 cpl to around 149.0 cpl.
In the March quarter 2018, retail prices in Darwin were around 149.0 cpl for almost two months before decreasing by 2.0 cpl to around 147.0 cpl. TGPs were in a 5.0 cpl range between 125.0 cpl and 130.0 cpl, ending the quarter at 129.2 cpl.

40 Report on the Australian petroleum market—March 2018
Chart C4: Daily average petrol prices and TGPs (lagged five days) in Darwin: 1 September 2017 to 31 March 2018
cpl
TGP (lagged 5 days)Retail price
115
120
125
130
135
140
145
150
155
Sep-17 Oct-17 Nov-17 Dec-17 Feb-18 Jan-18 Mar-18
MyFuel NT introduced1 November 2017
Source: ACCC calculations based on FUELtrac and AIP data.
Consumers can use the MyFuel NT scheme to identify the highest and lowest priced retail sites in Darwin and buy petrol at the lower priced sites. For example, on 23 May 2018, it showed that eight retail sites (three Coles Express, two Caltex, two Puma and one Woolworths) had the highest retail price (151.9 cpl), and FuelXpress Winnellie had the lowest retail price (143.5 cpl). There were seven Puma and four United retail sites at 149.9 cpl.
LauncestonThe ACCC report on the Launceston petrol market was released in July 2016. 20 It found that between 2012–13 and the first half of 2015–16 Launceston motorists paid on average around 12 cpl more for petrol than motorists in the five largest cities. The report noted that if the Launceston market was more competitive, motorists could expect savings of 4–5 cpl on a sustainable basis. The three main factors causing higher prices in Launceston were higher transport costs; higher wholesale operating costs and margins; and higher retail operating costs and margins.
Launceston petrol prices increased in the March quarter 2018In the March quarter 2018, average retail petrol prices in Launceston were 148.4 cpl, an increase of 5.1 cpl from the December quarter 2017 (143.3 cpl) (see chart C5). The average differential between prices in Launceston and the five largest cities was 12.9 cpl an increase of 4.7 cpl from the December quarter 2017 (8.2 cpl). In 2017, the annual average differential was 13.5 cpl.
20 ACCC, Report on the Launceston petrol market, July 2016, at: https://www.accc.gov.au/publications/petrol-market-studies/report-on-the-launceston-petrol-market.
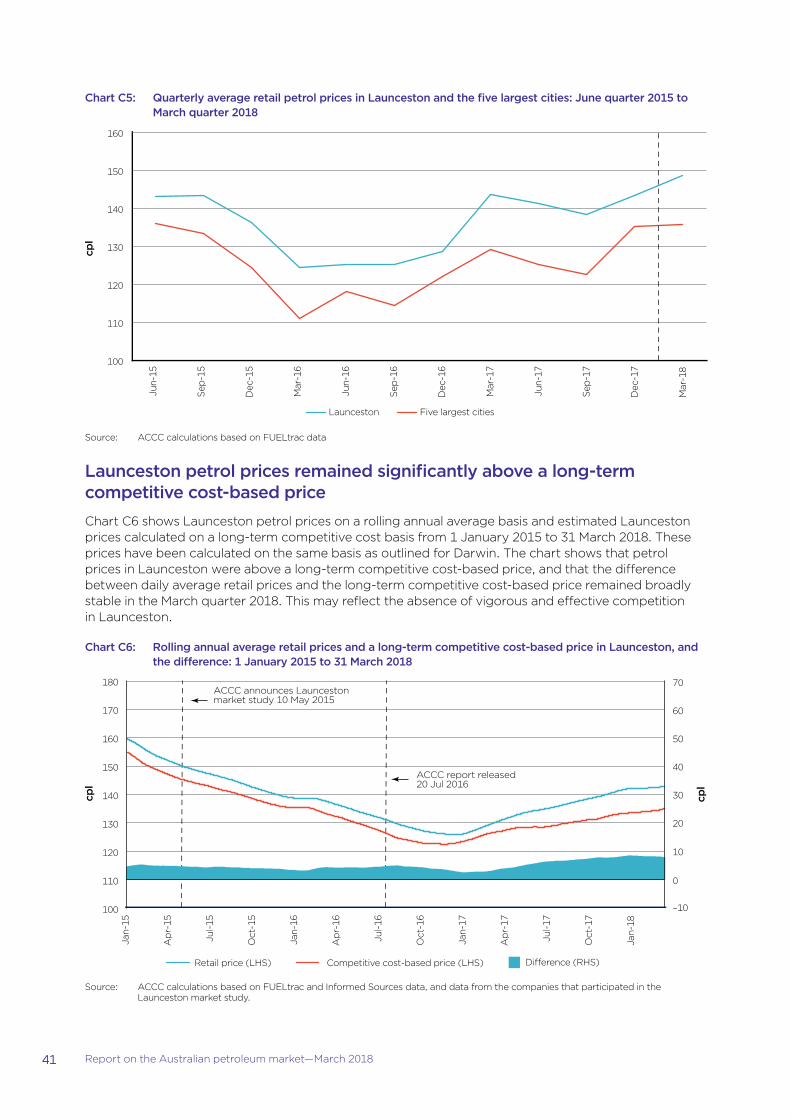
41 Report on the Australian petroleum market—March 2018
Chart C5: Quarterly average retail petrol prices in Launceston and the five largest cities: June quarter 2015 to March quarter 2018
cpl
Five largest citiesLaunceston
100
110
120
130
140
150
160
Jun-15
Sep-15
Dec
-15
Mar-16
Jun-16
Sep-16
Dec
-16
Mar-17
Jun-17
Sep-17
Mar-18
Dec
-17
Source: ACCC calculations based on FUELtrac data
Launceston petrol prices remained significantly above a long-term competitive cost-based priceChart C6 shows Launceston petrol prices on a rolling annual average basis and estimated Launceston prices calculated on a long-term competitive cost basis from 1 January 2015 to 31 March 2018. These prices have been calculated on the same basis as outlined for Darwin. The chart shows that petrol prices in Launceston were above a long-term competitive cost-based price, and that the difference between daily average retail prices and the long-term competitive cost-based price remained broadly stable in the March quarter 2018. This may reflect the absence of vigorous and effective competition in Launceston.
Chart C6: Rolling annual average retail prices and a long-term competitive cost-based price in Launceston, and the difference: 1 January 2015 to 31 March 2018
ACCC announces Launceston market study 10 May 2015
cpl
cpl
Retail price (LHS) Competitive cost-based price (LHS) Di�erence (RHS)
–10
0
20
10
30
40
50
60
70
ACCC report released20 Jul 2016
100
110
120
130
140
150
160
170
180
Jan-15
Apr-15
Jul-1
5
Oct-15
Jan-16
Apr-16
Jul-1
6
Oct-16
Jan-17
Apr-17
Jul-1
7
Oct-17
Jan-18
Source: ACCC calculations based on FUELtrac and Informed Sources data, and data from the companies that participated in the Launceston market study.

42 Report on the Australian petroleum market—March 2018
Launceston GIRDs increased in the March quarter 2018Chart C7 shows quarterly average GIRDs in Launceston and the five largest cities over the three-year period from the June quarter 2015 to the March quarter 2018.21
In the March quarter 2018, Launceston GIRDs were 19.9 cpl, an increase of 3.1 cpl from the December quarter 2017 (16.8 cpl). They were 7.5 cpl higher than the five largest cities in the March quarter 2018.
Chart C7: Quarterly average petrol GIRDs in Launceston and the five largest cities: June quarter 2015 to March quarter 2018
cpl
Five largest citiesLaunceston
0
5
10
15
20
25
30
Jun-15
Sep-15
Dec
-15
Mar-16
Jun-16
Sep-16
Dec
-16
Mar-17
Jun-17
Sep-17
Mar-18
Dec
-17
Source: ACCC calculations based on FUELtrac, AIP, BP, Caltex, Mobil, Viva Energy and WA FuelWatch data.
Note: Hobart TGPs were used as a proxy for TGPs in Launceston.
ArmidaleThe ACCC report on the Armidale petrol market was released in November 2016.22 It found that relatively weak retail competition in Armidale, reflected by a lack of price discounting, contributed to E10 prices in Armidale being on average 8.0 cpl higher than RULP prices in the five largest cities between 2012–13 and 2014–15.
Armidale petrol prices increased in the March quarter 2018Chart C8 shows quarterly average retail petrol prices in Armidale and the five largest cities from the June quarter 2015 to the March quarter 2018.
In the March quarter 2018, average retail petrol prices in Armidale were 139.1 cpl, an increase of 3.9 cpl from the December quarter 2017 (135.2 cpl). The average differential between prices in Armidale and the five largest cities was 3.6 cpl, an increase of 3.5 cpl from the December quarter 2017 (0.1cpl). In 2017, the annual average differential was 3.9 cpl.
21 Hobart TGPs were used as a proxy for TGPs in Launceston.22 ACCC, Report on the Armidale petrol market, November 2016, at: https://www.accc.gov.au/publications/petrol-market-studies/
report-on-the-armidale-petrol-market. References to petrol prices in Armidale are to E10 prices.

43 Report on the Australian petroleum market—March 2018
Chart C8: Quarterly average retail petrol prices in Armidale and the five largest cities: June quarter 2015 to March quarter 2018
cpl
Five largest citiesArmidale
100
110
120
130
140
150
160
Mar-18
Jun-15
Sep-15
Dec
-15
Mar-16
Jun-16
Sep-16
Dec
-16
Mar-17
Jun-17
Sep-17
Dec
-17
Source: ACCC calculations based on FUELtrac data.
Armidale petrol prices were marginally above a long-term competitive cost-based priceChart C9 shows Armidale petrol prices on a rolling annual average basis and estimated Armidale prices calculated on a long-term competitive cost basis from 1 January 2015 to 31 March 2018. These prices have been calculated on the same basis as outlined for Darwin. The chart indicates that at the end of March 2018, petrol prices in Armidale were marginally above a long-term competitive cost-based price.
Chart C9: Rolling annual average retail prices and a long-term competitive cost-based price in Armidale, and the difference: 1 January 2015 to 31 March 2018
cpl
cpl
Retail price (LHS) Competitive cost-based price (LHS) Di�erence (RHS)
–10
0
10
20
30
40
50
60
70
100
110
120
130
140
150
160
170
180
ACCC report released21 Nov 2016
ACCC announces Armidale market study 3 Aug 2015
Jan-15
Apr-15
Jul-1
5
Oct-15
Jan-16
Apr-16
Jul-1
6
Oct-16
Jan-17
Apr-17
Jul-1
7
Oct-17
Jan-18
Source: ACCC calculations based on FUELtrac and Informed Sources data, and data from the companies that participated in the Armidale market study.

44 Report on the Australian petroleum market—March 2018
Armidale GIRDs increased in the March quarter 2018Chart C10 shows quarterly average GIRDs in Armidale over a three-year period from the June quarter 2015 to the March quarter 2018.
In the March quarter 2018, average GIRDs in Armidale were 17.2 cpl, an increase of 1.9 cpl from the December quarter 2017 (15.3 cpl). In 2017, annual average GIRDs in Armidale were 17.1 cpl.
Chart C10: Quarterly average petrol GIRDs in Armidale and the five largest cities: June quarter 2015 to March quarter 2018
cpl
Five largest citiesArmidale
Mar-18
Jun-15
Sep-15
Dec
-15
Mar-16
Jun-16
Sep-16
Dec
-16
Mar-17
Jun-17
Sep-17
Dec
-17
0
5
10
15
20
25
30
Source: ACCC calculations based on FUELtrac, BP, Caltex, Mobil, Viva Energy and WA FuelWatch data.
Note: Sydney and Brisbane E10 TGPs from monitored companies were used as a proxy for Armidale TGPs.
CairnsThe ACCC report on the Cairns petrol market was released in May 2017. 23 It found that between 2012–13 and the first half of 2016-17, the average differential between prices in Cairns and the five largest cities was around 11.0 cpl. It concluded that a lack of vigorous and effective retail price competition in Cairns contributed to the increase in retail margins and profits in recent years.
Cairns petrol prices decreased in the March quarter 2018Chart C11 shows quarterly average retail petrol prices in Cairns and the five largest cities from the June quarter 2015 to the March quarter 2018.
In the March quarter 2018, average retail petrol prices in Cairns were 135.5 cpl, a decrease of 2.2 cpl from the December quarter 2017 (137.7 cpl). The average price in Cairns was equal to the average price in the five largest cities in the March quarter 2018. In 2017, the annual average differential was 11.8 cpl.
In the March quarter 2018, United increased the number of its retail sites in the Cairns area to five, after taking over two retail petrol sites in Gordonvale (formerly BP and Caltex retail sites).24 United’s increased presence in the Cairns retail petrol market may be contributing to greater competition.
23 ACCC, Report on the Cairns petrol market, May 2017, at: https://www.accc.gov.au/publications/petrol-market-studies/report-on-the-cairns-petrol-market.
24 Janessa Ekert, ‘United front at bowser’, Cairns Post, 14 March 2018.

45 Report on the Australian petroleum market—March 2018
Chart C11: Quarterly average retail petrol prices in Cairns and the five largest cities: June quarter 2015 to March quarter 2018
cpl
Five largest citiesCairns
100
110
120
130
140
150
160
Mar-18
Jun-15
Sep
-15
Dec
-15
Mar-16
Jun-16
Sep
-16
Dec
-16
Mar-17
Jun-17
Sep
-17
Dec
-17
Source: ACCC calculations based on FUELtrac data.
Cairns petrol prices were above a long-term competitive cost-based priceChart C12 shows Cairns petrol prices on a rolling annual average basis and estimated Cairns prices calculated on a long-term competitive cost basis from 1 January 2015 to 31 March 2018. These prices have been calculated on the same basis as outlined for Darwin. The chart indicates that petrol prices in Cairns were above a long-term competitive cost-based price, but the difference between daily average retail prices and the long-term competitive cost-based price decreased in the March quarter 2018.
Chart C12: Rolling annual average retail prices and a long-term competitive cost-based price in Cairns, and the difference: 1 January 2015 to 31 March 2018
cpl
cpl
Retail price (LHS) Competitive cost-based price (LHS) Di�erence (RHS)
–10
0
10
20
30
40
50
60
70
ACCC report released30 May 2017
ACCC announces Cairns market study 19 Apr 2016
Jan-15
Apr-15
Jul-1
5
Oct-15
Jan-16
Apr-16
Jul-1
6
Oct-16
Jan-17
Apr-17
Jul-1
7
Oct-17
Jan-18
100
110
120
130
140
150
160
170
180
Source: ACCC calculations based on FUELtrac and Informed Sources data, and data from the companies that participated in the Cairns market study.

46 Report on the Australian petroleum market—March 2018
Cairns GIRDs decreased substantially in the March quarter 2018Chart C13 shows quarterly average GIRDs in Cairns over the three-year period from the June quarter 2015 to the March quarter 2018.
In the March quarter 2018, average GIRDs in Cairns were 8.9 cpl, a decrease of 4.3 cpl from the December quarter 2017 (13.2 cpl). Cairns GIRDs were 3.5 cpl lower than the five largest cities during the March quarter 2018.
Chart C13: Quarterly average petrol GIRDs in Cairns and the five largest cities: June quarter 2015 to March quarter 2018
cpl
Five largest citiesCairns
0
5
10
15
20
25
30
Mar-18
Jun-15
Sep
-15
Dec
-15
Mar-16
Jun-16
Sep
-16
Dec
-16
Mar-17
Jun-17
Sep
-17
Dec
-17
Source: ACCC calculations based on FUELtrac, BP, Caltex, Mobil, Viva Energy and WA FuelWatch data.