REPORT ON THE ALLOWANCES PROVIDED FOR BOARD...
22
REPORT ON THE ALLOWANCES PROVIDED FOR BOARD & LODGINGS UNDER THE NATIONAL MINIMUM WAGE REPORT ON THE ALLOWANCES PROVIDED FOR BOARD & LODGINGS UNDER THE NATIONAL MINIMUM WAGE REPORT ON THE ALLOWANCES 2018 February 2018 LPC NO. 8 (2018) REPORT ON THE LENGTH OF TIME EMPLOYEES SPEND ON THE NATIONAL MINIMUM WAGE
Transcript of REPORT ON THE ALLOWANCES PROVIDED FOR BOARD...

REPORT ON THE ALLOWANCES PROVIDED FOR BOARD & LODGINGS UNDER THE
NATIONAL MINIMUM WAGE REPORT ON THE ALLOWANCES
PROVIDED FOR BOARD & LODGINGS UNDER THE
NATIONAL MINIMUM WAGE REPORT ON THE ALLOWANCES
PROVIDED FOR BOARD & LODGINGS UNDER THE
NATIONAL MINIMUM WAGE
2018
May 2018
LPC NO. 6 (2018)
February 2018
LPC NO. 8 (2018)
REPORT ON THE LENGTH OF TIME EMPLOYEES SPEND ON THE NATIONAL MINIMUM WAGE

REPORT OF THE LOW PAY COMMISSION
ON
THE LENGTH OF TIME EMPLOYEES SPEND
ON THE NATIONAL MINIMUM WAGE
Contents
1. Introduction 1
2. Transitions from the Minimum Wage 6
3. Conclusions 14
Appendix 15-16
Acknowledgements
We are very grateful to Mr Brian Ring and his colleagues in the Central Statistics Office for their cooperation in developing very valuable new data sources. We also wish to acknowledge the contribution of Dr Seamus McGuinness, Dr Helen Russell, Mr Bertrand Maître and Dr Paul Redmond of the Economic and Social Research Institute in providing research essential to our work. We are particularly grateful to the Secretariat to the Commission, Máire Ní Chuirc, Roshin Sen, Paul Norris, and Chris Smith for organising our business so efficiently and for their work in preparing our report.
1
Chapter 1 Introduction
Our Brief
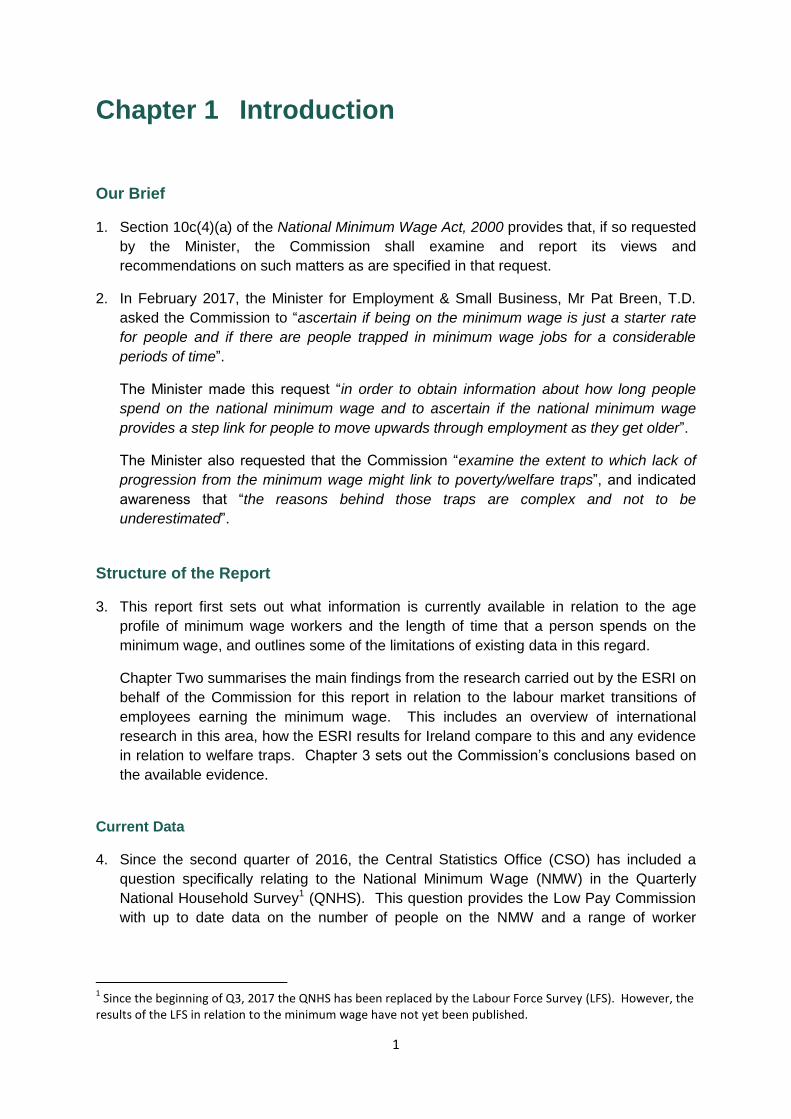
1. Section 10c(4)(a) of the National Minimum Wage Act, 2000 provides that, if so requested
by the Minister, the Commission shall examine and report its views and
recommendations on such matters as are specified in that request.
2. In February 2017, the Minister for Employment & Small Business, Mr Pat Breen, T.D.
asked the Commission to “ascertain if being on the minimum wage is just a starter rate
for people and if there are people trapped in minimum wage jobs for a considerable
periods of time”.
The Minister made this request “in order to obtain information about how long people
spend on the national minimum wage and to ascertain if the national minimum wage
provides a step link for people to move upwards through employment as they get older”.
The Minister also requested that the Commission “examine the extent to which lack of
progression from the minimum wage might link to poverty/welfare traps”, and indicated
awareness that “the reasons behind those traps are complex and not to be
underestimated”.
Structure of the Report
3. This report first sets out what information is currently available in relation to the age
profile of minimum wage workers and the length of time that a person spends on the
minimum wage, and outlines some of the limitations of existing data in this regard.
Chapter Two summarises the main findings from the research carried out by the ESRI on
behalf of the Commission for this report in relation to the labour market transitions of
employees earning the minimum wage. This includes an overview of international
research in this area, how the ESRI results for Ireland compare to this and any evidence
in relation to welfare traps. Chapter 3 sets out the Commission’s conclusions based on
the available evidence.
Current Data
4. Since the second quarter of 2016, the Central Statistics Office (CSO) has included a
question specifically relating to the National Minimum Wage (NMW) in the Quarterly
National Household Survey1 (QNHS). This question provides the Low Pay Commission
with up to date data on the number of people on the NMW and a range of worker
1 Since the beginning of Q3, 2017 the QNHS has been replaced by the Labour Force Survey (LFS). However, the
results of the LFS in relation to the minimum wage have not yet been published.
2
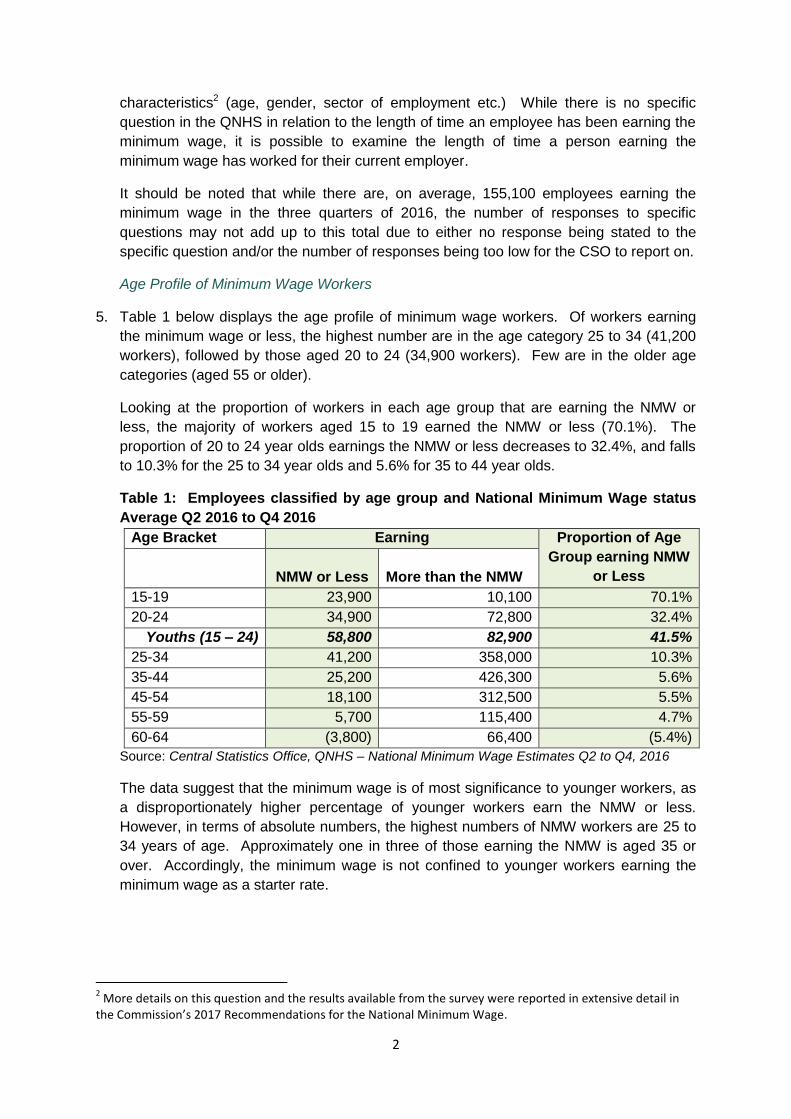
characteristics2 (age, gender, sector of employment etc.) While there is no specific
question in the QNHS in relation to the length of time an employee has been earning the
minimum wage, it is possible to examine the length of time a person earning the
minimum wage has worked for their current employer.
It should be noted that while there are, on average, 155,100 employees earning the
minimum wage in the three quarters of 2016, the number of responses to specific
questions may not add up to this total due to either no response being stated to the
specific question and/or the number of responses being too low for the CSO to report on.
Age Profile of Minimum Wage Workers
5. Table 1 below displays the age profile of minimum wage workers. Of workers earning
the minimum wage or less, the highest number are in the age category 25 to 34 (41,200
workers), followed by those aged 20 to 24 (34,900 workers). Few are in the older age
categories (aged 55 or older).
Looking at the proportion of workers in each age group that are earning the NMW or
less, the majority of workers aged 15 to 19 earned the NMW or less (70.1%). The
proportion of 20 to 24 year olds earnings the NMW or less decreases to 32.4%, and falls
to 10.3% for the 25 to 34 year olds and 5.6% for 35 to 44 year olds.
Table 1: Employees classified by age group and National Minimum Wage status
Average Q2 2016 to Q4 2016
Age Bracket Earning Proportion of Age
Group earning NMW
or Less
NMW or Less
More than the NMW
15-19 23,900 10,100 70.1%
20-24 34,900 72,800 32.4%
Youths (15 – 24) 58,800 82,900 41.5%
25-34 41,200 358,000 10.3%
35-44 25,200 426,300 5.6%
45-54 18,100 312,500 5.5%
55-59 5,700 115,400 4.7%
60-64 (3,800) 66,400 (5.4%)
Source: Central Statistics Office, QNHS – National Minimum Wage Estimates Q2 to Q4, 2016
The data suggest that the minimum wage is of most significance to younger workers, as
a disproportionately higher percentage of younger workers earn the NMW or less.
However, in terms of absolute numbers, the highest numbers of NMW workers are 25 to
34 years of age. Approximately one in three of those earning the NMW is aged 35 or
over. Accordingly, the minimum wage is not confined to younger workers earning the
minimum wage as a starter rate.
2 More details on this question and the results available from the survey were reported in extensive detail in
the Commission’s 2017 Recommendations for the National Minimum Wage.

3
Length of time with current employer
6. Table 2 below outlines the length of time a person earning the minimum wage has
worked with their current employer. This can be used as a possible indicator for the
length of time that a person has earned the minimum wage. The first column of the table
breaks down the number of workers earning the minimum wage by the length of time
with their employer. It is notable that the most common length of time for minimum wage
employees to have worked with their employer is four years or more (40,000 workers).
In total, an average of 62,800 NMW workers report having been with their employer for
less than a full year while 78,500 report working with their employer for more than 12
months.
Table 2: Employees classified by duration of employment and National Minimum
Wage Status (‘000) Average Q2 2016 to Q4 2016
Length of Time
Employees reporting earning
NMW or less More than the NMW
Less than 3 months 21,100 50,100
3-5 Months 17,100 50,800
6-11 Months 24,600 91,300
12-17 Months 15,900 72,400
18-23 Months 10,700 57,000
24-47 Months 22,600 145,800
48 Months or greater 40,000 881,200
Source: Central Statistics Office, QNHS – National Minimum Wage Estimates Q2 to Q4, 2016
7. Table 3 below gives a breakdown of the percentage share of NMW workers by duration
of employment versus the percentage share of all employees by length of employment.
This table shows that the percentage of NMW employees who have worked with their
employer for four or more years is significantly less than the percentage of total
employees who do the same (25.8% versus 60.0%). In line with this, NMW workers are
also more likely than other employees to have been in their current role for a shorter
period of time; 40.5% of NMW workers have been in their current job for less than 12
months compared to only 16.6% of all employees.
Table 3: Share of NMW employees and total employees by duration of employment
Duration of
Employment
Share of employees
earning the NMW or less
Share of total employees
by duration of employment
Less than 3 months 13.6% 4.6%
3-5 months 11.0% 4.4%
6-11 months 15.9% 7.6%
Less than one year 40.5% 16.6%
12-17 months 10.3% 5.8%
18-23 months 6.9% 4.4%
24-47 months 14.5% 11.0%
48 months or greater 25.8% 60.0%
More than one year 59.5% 83.4%
Source: Central Statistics Office, QNHS – National Minimum Wage Estimates Q2 to Q4, 2016

4
8. Table 4 below further shows that those who earn the NMW or less are far more highly
represented among those who have been in their current employment for a relatively
short period of time. Out of all employees working with their employer for less than three
months, 29.7% were earning the NMW or less, while out of all employees working their
employer for more than 48 months, 4.3% were earning the NMW of less.
Table 4: Proportion of total employees who earn the NMW or less by duration of
work Q2 2016 – Q4 2016
Duration of Employment Proportion of total
employees who earn the
NMW or less
Number of employees
who earn the NMW or
less
Less than 3 months 29.7% 21,100
3-5 Months 25.1% 17,100
6-11 Months 21.2% 24,600
12-17 Months 18.0% 15,900
18-23 Months 15.8% 10,700
24-47 Months 13.4% 22,600
48 Months or greater 4.3% 40,000
Source: Central Statistics Office, QNHS – National Minimum Wage Estimates Q2 to Q4, 2016
9. These data suggest that as the length of time with an employer increases, the likelihood
that a person earns the minimum wage decreases. However, for a significant minority of
workers, the minimum wage remains a feature despite having worked with their
employer for 4 years or more.
Conclusions from Existing Data
10. The QNHS data do, to a certain extent, bear out the idea that the NMW is a starter wage
for younger workers and that employees progress out of it relatively quickly to higher
paid employment over the course of their careers as:
a disproportionately higher number of younger workers earn the NMW or less
compared to older workers; and
those earning the NMW or less represent a greater share among those who have
been in their current employment for less than 12 months than compared to those
who have been in their current employment for 24 months or more.
However, on the other hand, there is also evidence that:
approximately one in three of those earning the NMW or less is aged 35 or over,
and
one in four employees earning the NMW or less has worked with their employer
for four years or more.
This would indicate that for some workers, the minimum wage may not represent a
starter wage, and that these workers may remain working for the minimum wage for a
prolonged period of time.
5
11. In order to gain a better understanding of what type of workers find themselves on the
NMW for longer periods of time the Commission requested that the ESRI, as part of its
research partnership, examine transitions in and out of minimum wage employment.
Chapter 2 sets out the main findings of the ESRI study.
6
Chapter 2 Transitions from the Minimum Wage
1. This chapter reports on the ESRI research into transitions in and out of minimum wage
employment, and provides an overview of the welfare supports that are available to
minimum wage workers.
Objective of ESRI research
2. This section is based on the ESRI report, “An Examination of the Labour Market
Transitions of Minimum Wage Workers in Ireland”. The full report provides a
comprehensive account of the research methods used and more detailed results than
outlined below.
3. The ESRI sets out that the objective of the research is two-fold:
To identify the labour market status and key characteristics of individuals moving
in and out of NMW employment, and
To assess the extent to which NMW is transitory, to identify the rate at which
NMW employees transition to higher paid jobs, and the characteristics of the
individuals most likely to make this transition.
4. This chapter reproduces the main findings from the ESRI research and international
comparisons contained in the ESRI paper. These findings add to the available evidence
base in Ireland on the characteristics of workers that transition out of minimum wage
employment into higher earnings, and of those that remain on the minimum wage.
5. The ESRI also provide a discussion on the impact of tax and welfare arrangements on
minimum wage transitions.
Main Findings from the ESRI report
6. The main findings from the report include:
This study uses a new measure of minimum wage employment in Ireland, taken from
the Quarterly National Household Survey (QNHS), to assess the degree to which
individuals in receipt of the National Minimum Wage (NMW) transition in and out of
NMW employment over a period of three quarters3 in 2016 and 2017.
In total we have longitudinal data on 1,514 employees who were in receipt of the
NMW in at least one of three consecutive quarters.
Of the 1,514 employees, 18 percent remained on the minimum wage for all three
quarters. Approximately 30 percent transitioned from minimum wage employment to
3 The Commission notes that although the QNHS data is primarily cross-section in nature, there is a limited
longitudinal component to the data whereby some individuals are followed for a maximum of five consecutive quarters. However due to sample size constraints this study follows people for just three quarters.

7
higher paid employment and approximately 6 percent transitioned from minimum
wage employment to unemployment or inactivity.
Therefore, more workers transitioned from minimum wage to higher paid employment
over a period of three-quarters than remained on the NMW.
Approximately 13 percent of the sample transitioned from higher pay to minimum
wage employment, while 11 percent transitioned to minimum wage employment from
unemployment or inactivity.
Finally, just under 17 percent had more than one transition. This includes 9 percent
who transitioned from higher paid work to minimum wage employment and back
again to higher paid work. There were 5 percent who went from being on the
minimum wage to higher pay and back again to minimum wage employment and
approximately 3 percent who transitioned from unemployment/inactivity to minimum
wage employment and back to unemployment/inactivity4.
The results also show that exits from NMW status to higher waged employment are
achieved primarily through within-employer wage progression rather than between
employer job change. Over 90 percent of employees who transition to higher paid
employment do not change occupation or employer.
There is some variation in the characteristics of workers who exit NMW status,
relative to those who remain in NMW employment. Our multivariate analysis shows
that Irish nationals, older workers, those with higher levels of schooling and full-time
employees were more likely to exit NMW employment to higher paid employment5
compared to non-nationals, younger persons, those with lower educational
attainment and part-time workers.
Individuals in sales occupations are relatively less prominent among those leaving
NMW employment, which may suggest less scope for wage progression within such
occupations.
The research suggests that NMW employment is likely to represent more of a “trap”
for members of some groups than others.
Approximately 11 percent of people who were in NMW employment in at least one of
the three quarters experienced unemployment or inactivity in a subsequent quarter.
This is higher than the transition rate to unemployment or inactivity among higher
earning employees.
Our analysis reveals that a high percentage of responses to the minimum wage
question do not come from the individual themselves, but from another family
member (so called “proxy responses”). In quarter 2 of 2016, 56 percent of responses
to the minimum wage question were proxy responses.
Approximately one quarter of individuals in the sample move from higher pay to
minimum wage employment at some point during the three quarters, without
4 The remaining 5% fell into categories for which there was no clear pattern.
5 The Commission notes that this analysis refers to transitions within a year.

8
changing employer or occupation. While it is possible that proxy responses may be
leading to some misclassification among this group, our research does not find
strong evidence of this.
While the introduction of the minimum wage question is an important addition to the
QNHS survey, it is important to take account of the limitations of this measure which
relate to high levels of proxy responses.
International Comparisons
7. The ESRI note in the paper’s introduction that:
There is a limited literature on the extent to which minimum wage employment leads to
future labour market progression. However, the evidence that does exist is supportive of
the view that minimum wage employment can act as a stepping stone to higher earning
positions for many individuals. For the USA, Smith and Vavrichek (1992), using
longitudinal data to examine the wage progression of workers in the mid-1980s, find that
60 percent of workers on the minimum wage earn higher wages one year later. Similarly,
Schiller (1992), also for the USA, find that less than 15 per cent of workers are still in
receipt of the minimum wage three years following the take up of minimum wage
employment.
However, while large proportions of minimum wage workers appear to transition to
higher paid employment quite quickly, a substantial minority are likely to remain in low
paid jobs for a considerable period. Carrington and Fallick (2001) use the National
Longitudinal Survey of Youth to study the transition patterns of young workers entering
minimum wage jobs in the US, and find that approximately 8 percent are still employed in
minimum wage positions ten years into their careers. Carrington and Fallick (2001) also
report that individuals remaining in long-term minimum wage positions are more likely to
be from minorities, female and have lower levels of schooling. With respect to evidence
from the UK and elsewhere, Dickens (2000), while not strictly focusing on minimum
wage workers, finds that between 20 and 30 per cent of British males in the lowest
income decile remained there after three years, with similar results for females. Stewart
and Swaffield (1999), also for the UK, report high rates of persistent, low-wage
employment. They also find that low wage workers tend to move more frequently
between employment and unemployment. Finally, for Italy, Cappellari (2007) finds that
accepting a low paid job raises the probability of future low wage episodes, with
persistence levels higher for females and those with lower levels of education. Therefore,
the international evidence suggests that minimum wage employment is likely to lead to
higher earnings for most workers. However, a significant minority experience persistent
low-wage employment.
8. Looking more broadly at progression into higher earnings from low pay, rather than the
minimum wage specifically, the Resolution Foundation in the UK produced a number of
reports on this topic. Their 2013 report6, “Starting out or getting stuck? An analysis of
6 http://www.resolutionfoundation.org/app/uploads/2014/08/Starting-out-or-getting-stuck-FINAL.pdf

9
who gets trapped in low paid work – and who escapes”, defines employees as being
‘stuck’ in low-paid work if they are aged over 25 and low paid in 2012, and have only
held low paid jobs throughout the previous decade (2002 – 2011). Low pay is defined as
pay that is less than two-thirds of the median hourly wage. The research indicates that
more than one in four (28%) of all low paid workers found themselves ‘stuck’ on low pay
for the previous decade, corresponding to 5 per cent of the workforce. The report found
that low paid workers were more likely to have remained on low pay if they are female,
work in a low-skilled occupation and live in a particular geographic location. There was
also an age dimension to this, with middle-aged women particularly affected.
9. Their most recent report7 on this “Escape Plan: Understanding who progresses from low
pay and who gets stuck” (November 2014) was prepared for and funded by the Social
Mobility and Child Poverty Commission, which is an advisory non-departmental body of
the Department of Education, the Department for Work & Pensions and the Cabinet
Office. The main factors impacting on pay progression are listed below:
In terms of individual and household factors, the research found that initially
having a degree or gaining a degree was positively linked to pay progression.
Both quantitative and qualitative research flagged the role of attitudes in pay
progression. Factors that were negatively linked to pay progression include
being registered as disabled, time spent as a single parent, being born in the UK,
living in a local authority rented house and being older in the initial period.
In terms of factors related to firms, working for a large employer (1000+
employees) had a positive impact on pay progression, while working part-time
had a negative impact.
Looking at sectors of employment8, working in sales and hospitality was
negatively linked to pay progression, while working in the public sector had a
positive effect on pay.
10. From a different perspective entirely, Dickinson and Papps (2016) wrote a report9 for the
Low Pay Commission in the UK in relation to how the national minimum wage affects
turnover in the labour market. Their research found evidence that workers who are
affected by an increase in the minimum wage have a reduced likelihood of changing jobs
or exiting employment. The paper concludes that annual increases in the minimum
wage rates have a large negative effect on turnover.
Impact of Tax and Welfare on Minimum Wage Transitions
11. The ESRI report discusses the impact of how tax and welfare arrangements might
potentially influence individual transitions both into and from minimum wage
employment.
7 http://www.resolutionfoundation.org/app/uploads/2014/11/Escape-Plan.pdf
8 The report refers to research carried out in relation to a number of sectors and firms on pathways to improve
progression for low-skilled and low-paid workers. 9 Dickinson, M. and Kerry L. Papps (2016) How the national minimum wage affects flows in and out of
employment: An investigation using worker-level data. Report for the Low Pay Commission. February 2016.

10
In relation to transitions from unemployment or inactivity into minimum wage
employment, the report considers income supports such as the Back to Work Family
Dividend (which allows recipients to retain the child dependent portion of their social
welfare payment on a tapered basis after moving from off welfare to work), the Working
Family Payment (formerly called the Family Income Supplement) and replacement rates,
particularly since the introduction of age-related reduced rates of Jobseeker’s Allowance.
It notes that “the evidence suggests that there are relatively little impediments within the
structure of the Irish tax and welfare system that would actively inhibit transition rates
from unemployment to employment, and in particular, minimum wage jobs”.
12. The Commission notes that the impact of age-related reduced rates of Jobseeker’s
Allowance payments on labour market transitions for young people is evaluated in a
2017 IZA paper10 “Does Reducing Unemployment Benefits During a Recession Reduce
Youth Unemployment? Evidence from a 50% Cut in Unemployment Assistance”. This
research also considered the potential interaction between the benefit system and
minimum wage. While the study found a significant effect of the benefit cut on
unemployment durations for younger claimants there was little evidence that the benefit
cut affected exit wages. This is plausible since the exit wages of these claimants were
already close to the minimum wage rate; as a result there was limited scope for
reductions in the reservation wage.
13. In relation to aspects of the tax and welfare system that would inhibit transition from
minimum wage employment to higher earnings, the report notes that much less is
known. It states that the Working Family Payment (formerly the Family Income
Supplement) eases both the transition from welfare to work and also the transition from
low paid to higher paid employment as once a family qualifies for the payment, the rate
of payment continues for 52 weeks, even if the family moves to higher paid employment.
14. The ESRI report notes that it is possible that welfare or tax disincentives exist for
individuals to move out of low waged employment, but that any impacts are likely to be
highly specific to individual circumstances and household composition.
Some discussion on the income supports available to jobseekers and low-paid workers
is provided in the section below.
Welfare supports for people and families in employment
15. A 2015 ESRI publication entitled Making Work Pay More11, found that, “based on an
analysis of current incomes, benefits and taxes - more than eight out of ten unemployed
jobseekers would see their income increase by at least 40 per cent upon taking up
employment. Fewer than 3 per cent would, in the short-term, be financially better off not
in work. The risk of facing weak financial incentives to work is higher for unemployed
persons with a spouse and children, as the income support goal of the welfare system
10
Doris, A, D. O’Neill and O. Sweetman (2017) “Does Reducing Unemployment Benefits During a Recession Reduce Youth Unemployment? Evidence from a 50% Cut in Unemployment Assistance,” IZA Working paper 10727 11Making Work Pay More: Recent Initiatives. ESRI June 16, 2015 | Budget Perspectives
11
means that they tend to have higher welfare payments. However, even among that
group, fewer than 1 in 15 would be financially better off not working. With the addition of
the Back to Work Family Dividend, that figure drops to 1 in 20”.
16. This section provides a broad overview of the income supports available from the
Department of Employment Affairs and Social Protection (DEASP) to people in
employment, including those who are earning the minimum wage. The DEASP provides
a range of income supports to working people, and in particular, working families.
Jobseeker Payments
17. There are two main schemes for jobseekers seeking full-time work; the social insurance
based Jobseeker’s Benefit and the means-tested social assistance scheme, Jobseeker’s
Allowance. The conditions for both of these schemes require that the person must be
seeking full-time work; however, it is possible for recipients to work up to three days a
week and still qualify for payment. Disregards and tapers apply in the assessment of
earnings in the means test for almost all social assistance schemes, including jobseeker
schemes, to ensure that there are financial incentives to work, even on a part-time basis.
To safeguard against jobseekers entering welfare traps, all long-term jobseekers,
including those working part-time, are subject to activation by the Department (such as
the development of a personal progression plan with a case officer, assistance with job
search and referral to appropriate training courses and employment supports).
Supports for working families
18. For working families, the Back to Work Family Dividend provides an incentive to take up
full-time work (as it is only payable to those who come off a relevant social welfare
payment and enter employment). This scheme continues to pay the qualified child
portion of the person’s social welfare payment (€31.80 per week from 26th March 2018)
for 52 weeks, which tapers to a half-rate payment for the next 52 weeks. As the rate of
payment is not affected by the person’s earnings, there is no disincentive to taking up
higher paid employment.
19. The Working Family Payment (formerly called Family Income Supplement) is an in-work
support that provides an income top-up for low-earning employees with children. The
payment is provided tax-free and is paid weekly to low-income families working a
minimum of 19 hours per week. The payment ensures that there is a financial incentive
to take up or remain in employment in circumstances where the employee might only be
marginally better off in work. Some examples of how the supports provided through the
Working Family Payment and the Back to Work Family Dividend help to make work pay
for families on the minimum wage and low earnings, are provided in the text box below.
Example 1
A lone parent with one child is working the minimum 19 hours at the National Minimum
Wage of €9.55 per hour, giving assessable earnings from employment of €181.45 per
week. With the addition of the Working Family Payment, total family income rises to
€385.45 per week. If the family is moving from welfare to work it will mean they can
qualify for the Back to Work Family Dividend. For this family, this means an extra
€31.80 per week in the first year, giving a total income of €417.25 per week (combined
income supports of €235.80 per week.). This results in an annual income of almost
€21,700 from earnings of c. €9,435 per annum.
12
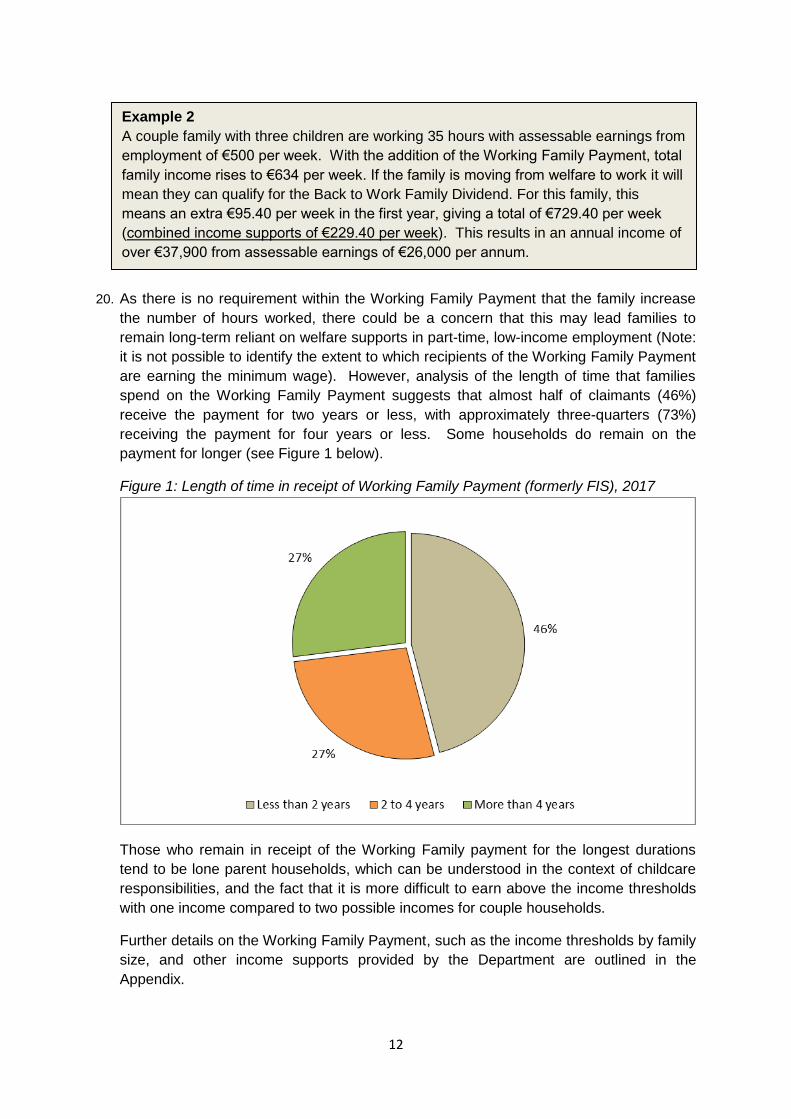
20. As there is no requirement within the Working Family Payment that the family increase
the number of hours worked, there could be a concern that this may lead families to
remain long-term reliant on welfare supports in part-time, low-income employment (Note:
it is not possible to identify the extent to which recipients of the Working Family Payment
are earning the minimum wage). However, analysis of the length of time that families
spend on the Working Family Payment suggests that almost half of claimants (46%)
receive the payment for two years or less, with approximately three-quarters (73%)
receiving the payment for four years or less. Some households do remain on the
payment for longer (see Figure 1 below).
Figure 1: Length of time in receipt of Working Family Payment (formerly FIS), 2017
Those who remain in receipt of the Working Family payment for the longest durations
tend to be lone parent households, which can be understood in the context of childcare
responsibilities, and the fact that it is more difficult to earn above the income thresholds
with one income compared to two possible incomes for couple households.
Further details on the Working Family Payment, such as the income thresholds by family
size, and other income supports provided by the Department are outlined in the
Appendix.
Example 2
A couple family with three children are working 35 hours with assessable earnings from
employment of €500 per week. With the addition of the Working Family Payment, total
family income rises to €634 per week. If the family is moving from welfare to work it will
mean they can qualify for the Back to Work Family Dividend. For this family, this
means an extra €95.40 per week in the first year, giving a total of €729.40 per week
(combined income supports of €229.40 per week). This results in an annual income of
over €37,900 from assessable earnings of €26,000 per annum.

13
21. It is also useful to consider secondary payments, which may impact on an individual’s
decision to take up work, or increase hours at work. In this regard, rent supplement,
payable by DEASP, has previously been identified as a potential disincentive to full-time
work, as it is not generally payable where a person or their spouse or partner is in full-
time employment, i.e. for 30 hours or more a week. This potential disincentive has been
addressed with the nationwide roll-out of the Housing Assistance Payment (HAP) by
local authorities since 2017. HAP provides rental assistance to those with a long-term
housing need under the auspices of the Department of Housing, Planning, Community
and Local Government. HAP is particularly attractive for low income households, as they
can work full time and pay the local authority a weekly rent contribution based on their
ability to pay.
22. The Commission notes that the DEASP is bringing forward a report reviewing the
operation of the Working Family Payment to the Committee on Social Protection by the
end of June 2018. This paper will consider potential disincentives to work arising in the
welfare system.

14
Chapter 3 Conclusions
Low Pay Commission Conclusions
1. Having considered available data from the Quarterly National Household Survey (QNHS)
and examined the report of the ESRI into the labour market transitions of minimum wage
workers, the Low Pay Commission has drawn the following conclusions in relation to
whether people remain on the minimum wage for considerable periods of time:
a. Approximately two-thirds (65%) of minimum wage workers are under 35. While
most progressed beyond the minimum wage within a year, some remain on the
minimum wage for a longer period of time.
b. Those most likely to progress beyond the minimum wage within a year are Irish
nationals, older workers, those with higher educational attainment and those in
full-time work.
c. Non-Irish nationals, part-time workers and those with lower educational
attainment are more likely to experience longer periods on the minimum wage.
2. The Commission notes that analysis on the length of time a person spends on the
national minimum wage is limited by the lack of longitudinal earnings data in Ireland. In
this regard, the ESRI is necessarily limited, given the constraints of the existing QNHS
data, to studying transitions over a period of three quarters. The Commission notes that
the ESRI research makes use of the available QNHS data, and that this work adds to the
evidence on minimum wage transitions in Ireland.
However, the Commission wishes to highlight the need for the CSO to develop a
comprehensive dataset on earnings, linked to details on both the employer and
employee. This will allow the Commission to conduct more meaningful analysis, and
gain a better understanding, of minimum wage employment.
3. With regard to the extent of possible poverty/welfare traps, the Commission understands
that the Department of Employment Affairs and Social Protection is bringing forward a
report to the Committee on Social Protection, reviewing the operation of the Working
Family Payment by the end of June 2018. This paper will consider potential disincentives
to work arising from the welfare system, both in taking up employment and in taking up
additional hours of employment.

15
Appendix
Selected income supports provided by the Department of Employment Affairs and Social Protection Jobseeker’s Allowance
Jobseeker’s Allowance (JA) is a social assistance scheme. To qualify, a claimant must be unemployed, capable of work, available for and genuinely seeking full-time work, satisfy the means test and meet the habitual residence condition. Reduced rates are generally payable to jobseekers under the age of 26.
Jobseeker’s Allowance is means-tested payment. The means test for earnings includes an incentive to take up work as there is a daily disregard (€20 per day for a maximum of three days) and a taper provided (whereby earnings above the disregard are assessed at 60%).
The budget allocation for the Jobseeker’s Allowance scheme is €1.837 billion in 2018.
Jobseeker’s Benefit
Jobseeker's Benefit (JB) is a weekly payment to insured people who are out of work. It is a non-means tested payment and it is paid at the same rate as the JA scheme. Reduced rates for those aged under 26 do not apply to the JB scheme.
To qualify a claimant must be unemployed, be available for and genuinely seeking work, and have had a substantial loss of employment.
Recipients can work up to three days a week and still qualify for the payment. In these cases, the weekly payment of Jobseeker’s Benefit is reduced by a daily rate (one-fifth of the weekly rate) for each day worked (up to a maximum of three days).
The budget allocation for the Jobseeker’s Benefit scheme is €331.7 million in 2018.
The CSO’s most recent Live Register publication (January 2018) reports that over 50,200 persons on the Live Register (i.e. in receipt of Jobseeker’s Allowance, Jobseeker’s Benefit or signing for credits) were working on a casual or part-time basis.
Back To Work Family Dividend
The Back to Work Family Dividend (BTWFD) scheme was introduced in January 2015. It allows JA/JB recipients who have been jobseekers for 12 months or recipients of the One-Parent Family Payment to retain their full Increase for Qualified Children (IQC) for the first year in employment, tapering to 50% in the

16
second year. From March 2018, BTWFD is payable at a rate of €31.80 per relevant child – up to a maximum of €127.20 for 4 children.
The budget allocation for the BTFWD scheme is 20.7 million in 2018.
Working Family Payment (formerly Family Income Supplement)
Working Family Payment provides support for employees with families who have low earnings in relation to their family size. The payment is provided tax-free and is paid weekly.
Payment is calculated on the basis of 60% of the difference between the income limit for the family size and the weekly family income of the person(s) raising the
children. Earnings are assessed net of tax, PRSI and superannuation payments. The income limits are outlined in the table below.
To qualify for payment, a person must be engaged in full-time paid employment as an employee which is expected to last for at least 3 months and be working for a minimum of 38 hours per fortnight or 19 hours per week. A couple may combine their hours of employment to meet the qualification criteria. The applicant must also have at least one qualified child.
An integral part of the scheme is that once the level of payment is determined, that rate continues to be payable for a period of 52 weeks, provided that the person remains in full-time employment. The exceptions to this rule are where there is an additional child born to the family during that period or following the termination of One-Parent Family Payment due to the age of the youngest child.
The budget allocation for the Working Family Payment scheme is €431.3 million in 2018.
Table: Working Family Payment weekly family income thresholds, 2007 to 2018
2007 2008 2009 2010 - 2015 2016 2017 2018
1 Child €480 €490 €500 €506 €511 €511 €521
2 Children €550 €570 €590 €602 €612 €612 €622
3 Children €625 €655 €685 €703 €713 €713 €723
4 Children €720 €760 €800 €824 €834 €834 €834
5 Children €820 €870 €920 €950 €960 €960 €960
6 Children €910 €970 €1,030 €,1066 €1,076 €1,076 €1,076
7 Children €1,020 €1,090 €1,160 €1,202 €1,212 €1,212 €1,212
8 + Children €1,090 €1,170 €1,250 €1,298 €1,308 €1,308 €1,308


![--Yb]~-~:~~~O, ---- - Atlantic County Library3]llroadw~ew~orJ~ or cou be+ colds, ~ore throat croup aud diphtheria, etc. f:~e,1 atgd approved by the leading p’nyalchmS el Europe $’](https://static.fdocuments.in/doc/165x107/5acb6f3b7f8b9a7d548ec9aa/-yb-o-atlantic-county-3llroadweworj-or-cou-be-colds-ore-throat.jpg)