REPORT ON THE 2021-2024 STABILITY PROGRAMME UPDATE
141
REPORT ON THE 2021-2024 STABILITY PROGRAMME UPDATE REPORT 20/21
Transcript of REPORT ON THE 2021-2024 STABILITY PROGRAMME UPDATE

REPORT ON THE 2021-2024 STABILITY PROGRAMME UPDATE
REPORT 20/21

The mission of the Independent Authority for Fiscal Responsibility (AIReF) is to ensure strict compliance with the principles of budgetary stability and financial sustainability enshrined in Article 135 of the Spanish Constitution.
AIReF Contact:
C/José Abascal, 2, 2º planta. 28003 Madrid, Tel. +34 910 100 599
Email: [email protected]
Website: www.airef.es
This document may be used and reproduced, in whole or in part, provided its source is acknowledged as AIReF
TABLE OF CONTENTS
AIReF’s 2021-2024 macroeconomic scenario ..................................... 17
External and health assumptions ..................................................... 17
Main features of the 2021-2024 macroeconomic scenario ......... 19
Ex-ante evaluation of official forecasts ............................................... 38
Evaluation summary .......................................................................... 38
Risk overview ........................................................................................... 45
Ex-post evaluation of 2017-2020 forecasts .......................................... 51
Evolution of General Government revenue ....................................... 70
Taxes on production and imports .................................................... 72
Income and wealth taxes ................................................................ 74
Taxes on capital ................................................................................. 76
Social contributions ........................................................................... 77
Other revenue ................................................................................... 78
Evolution of GG expenditure ................................................................ 78
Public consumption ........................................................................... 79
Social benefits in cash ...................................................................... 82
Subsidies ............................................................................................. 85
Interest ................................................................................................ 86
Gross capital formation .................................................................... 87
Capital transfers ................................................................................. 88
Analysis by sub-sector ............................................................................ 89
Impact of the measures on the General Government accounts .... 99
Impact of COVID-19 measures ........................................................ 99
New measures included in the Budgetary Plan and the General State Budget .................................................................................... 102
Analysis of the Transformation, Recovery and Resilience Plan (RTRP) ............................................................................................................... 104
Recent evolution and starting point .................................................. 121
Debt projections over the horizon of the Stability Programme Update (2021-2024) ............................................................................. 124
Sustainability and risk analysis ............................................................. 127
Financing conditions ....................................................................... 127
Budgetary balance and sustainability over the medium term .. 129
Medium and long-term risks ........................................................... 130
Future evolution of pension expenditure and its impact on sustainability ..................................................................................... 132
New Recommendations. .................................................................... 135
Live recommendations ........................................................................ 137
Recommendations contained in the endorsement of the macroeconomic forecasts ................................................................. 138
11 May 2021 Report on the 2021-2024 Stability Programme Update 5
EXECUTIVE SUMMARY
The Independent Authority for Fiscal Responsibility (AIReF) must report on the content of the 2021-2024 Stability Programme Update (SPU), both in terms of the macroeconomic forecasts and its fiscal scenario, in compliance with the mandate of Articles 14 and 16 of Organic Law 6/2013 on the Establishment of AIReF. This report provides a comprehensive assessment of the SPU, which this year recovers its usual medium-term horizon.
The presentation of the SPU comes at a complex time. On the one hand, the pandemic continues to cast a high level of uncertainty over macroeconomic and fiscal projections. In addition, activation of the escape clause at least until 2022, both within the scope of national legislation and the Stability and Growth Pact, means that there are no regulatory benchmarks for comparing the evolution of the public balances forecast in the SPU. Furthermore, the European fiscal framework to be applied as from that time is subject to the outcome of the review process that was launched prior to the crisis and has, for the time being, been put on hold. In this changing context, the work performed by independent fiscal institutions supervising the public finances is even more relevant, but also more complex.
In addition, the progress in the design of the Recovery, Transformation and Resilience Plan (RTRP) allows us to foresee major changes in Spain's economic and budgetary policy that are still pending budgetary and legislative implementation, and which might have a fundamental impact on the fiscal scenario over the medium and long term.
In this regard, this year's Stability Programme does not meet the objective of being an instrument for guiding fiscal policy in the medium term.
In its previous reports, AIReF has been recommending the need to design a realistic and credible medium-term fiscal strategy that guarantees the sustainability of the public finances. The SPU can merely be considered an incomplete approach to this strategy.
Firstly, in its budgetary aspect, the SPU is presented as an element that is isolated from the RTRP. It only incorporates the macroeconomic impact of the
Report
6 Report on the 2021-2024 Stability Programme Update 11 May 2021
investments planned in the RTRP and the consequent revenue impact associated with this higher growth. On the one hand, the SPU does not incorporate the reforms that are still pending legislative implementation and that affect core areas for the growth and sustainability of public finances, such as the pension system, the tax system, and the labour market. In the same vein, from 2021 onwards, it draws a “no-policy-change” fiscal scenario which does not include any target path for the fiscal policy or even any tax measures that the RTRP sets out as entering into force in 2022. In addition, the SPU does not consider which part of the investments will lead to structural expenditure increases that may persist after the end of the plan.
Secondly, the analysis carried out in this report shows how the health crisis has led to an increase in the structural deficit of the Spanish economy, which was already starting from high levels (close to 3.5% of GDP). Another legacy of the crisis is the high levels of debt, which would stand at around 112% in 2024 according to the Government’s forecasts. These are a major factor in the vulnerability of the Spanish economy to any changes in financing conditions. It is therefore necessary to establish a rebalancing plan that will start to be implemented when the recovery is strong and that will allow sufficient room for manoeuvre to be generated to meet the challenges arising from the ageing population and future crises.
For all these reasons, AIReF reiterates its recommendation to design a medium-term fiscal strategy with a sufficiently long-time horizon, which will need to be integrated with the RTRP.
2021-2024 macroeconomic scenario
On April 26th, AIReF gave advance notice of its endorsement of the macroeconomic outlook, thus allowing it to be included in the SPU for it to be submitted by the Government to the EU institutions. However, it highlighted the high level of uncertainty surrounding the health crisis and the design, implementation, and macroeconomic impact of the RTRP.
The macroeconomic scenario of the Stability Programme assumes GDP growth of 6.5% in 2021, almost three percentage points lower than the growth of 9.8% with which the General State Budget for 2021 was prepared only six months ago. At that time, AIReF already warned of the risk of more adverse scenarios regarding the evolution of the pandemic and highlighted downside risks to the impact of the Plan estimated by the Government related both to the process of implementing the projects and their possible effects.
The uncertainty relating to both elements remains high. AIReF therefore believes that the growth forecast for 2021 is feasible if, and only if, progress is made in controlling the pandemic so that mobility restrictions can be lifted
Report
11 May 2021 Report on the 2021-2024 Stability Programme Update 7
over the year and if the effects of the RTRP begin to materialise in the second half of the year.
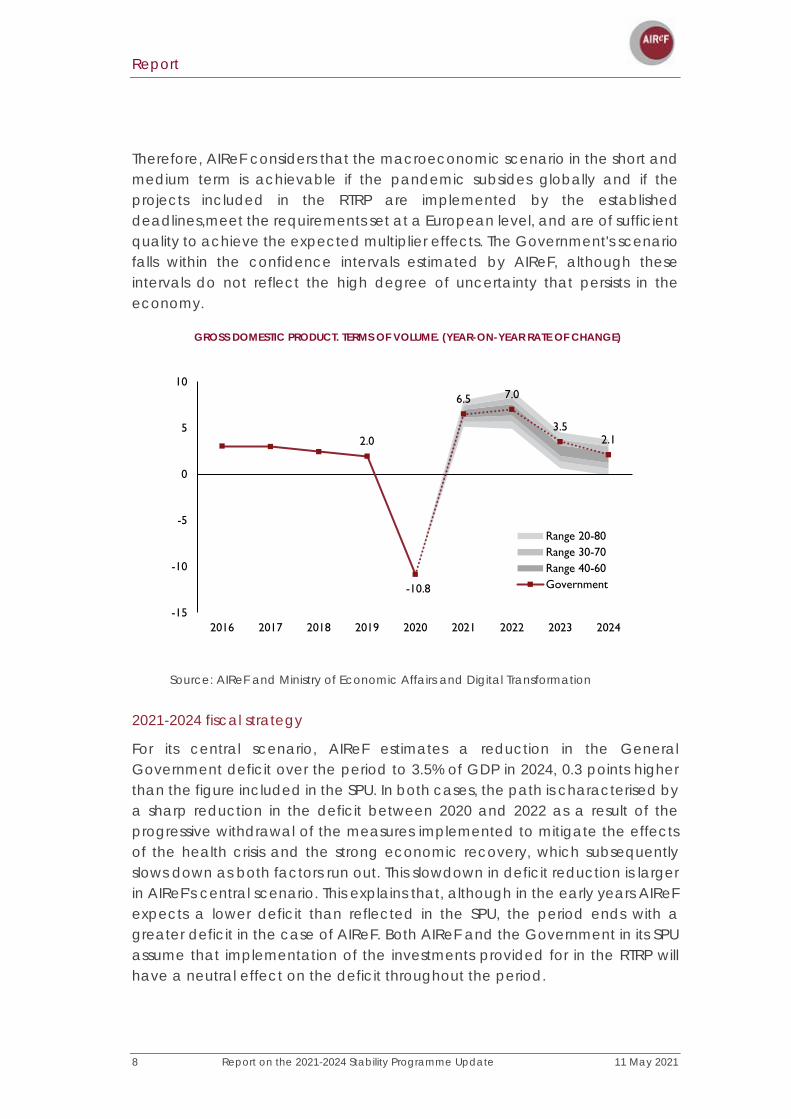
More in the medium term, the Government's forecasts assume that GDP will record high growth, of 7% in 2022, to return at the end of the forecast horizon to rates of 3.5% in 2023 and 2.1% in 2024, higher than the pre-crisis estimates of potential growth. The high growth estimated in 2022 is conditioned by two key elements. The first is the return of tourism activity to normal, which according to the SPU will recover pre-pandemic levels in 2022. The materialisation of this assumption depends on progress in the vaccination process and the lifting of restrictions on international travel. The second is the impact of the RTRP, which is an essential element in the macroeconomic scenario over the projection horizon and regarding which the stability programme provides little information beyond indicating the related increase in GDP on average over 2021-2023 and the accumulated job creation over the period (two additional points of growth and an additional 800,000 jobs). It also indicates an impact on potential growth of 0.4 pp.
In this regard, the Government has now published the details and timing of investments and projects for most of the components of the RTRP. According to this information, AIReF estimates that the investments and expenditure associated with the RTRP might have an impact of 1.5% in 2021, 2.5% in 2022 and 1.6% in 2023, mainly resulting from the boost to demand. Although these estimates are like those envisaged by the Government, it should be noted that they are subject to a high degree of uncertainty. Firstly, the pace at which projects are implemented and their final completion will be key to determining the impact on growth and employment. Secondly, there is little empirical evidence on the macroeconomic impact associated with any of the components of the Plan. Empirical evidence suggests that expenditure on investment in physical, technological, and human capital is associated with a high impact on GDP and employment, particularly when it takes place in periods of recession and in a coordinated manner in a group of countries, as is the case with the Next Generation EU funds. Furthermore, the effects associated with technological and human capital tend to last over time, particularly if they are accompanied by structural reforms. However, there is little evidence on the macroeconomic effects of such new types of investment as the Artificial Intelligence Strategy or the Hydrogen Roadmap, for example, although it should be noted that these represent a small proportion of investments. In addition, there is still no specific legislation for the structural reforms of the job market and the pension and tax systems that are crucial for determining the possible impact of the Plan on productivity, medium-term growth, and the sustainability of public accounts.
Report
8 Report on the 2021-2024 Stability Programme Update 11 May 2021
Therefore, AIReF considers that the macroeconomic scenario in the short and medium term is achievable if the pandemic subsides globally and if the projects included in the RTRP are implemented by the established deadlines,meet the requirements set at a European level, and are of sufficient quality to achieve the expected multiplier effects. The Government's scenario falls within the confidence intervals estimated by AIReF, although these intervals do not reflect the high degree of uncertainty that persists in the economy.
GROSS DOMESTIC PRODUCT. TERMS OF VOLUME. (YEAR-ON-YEAR RATE OF CHANGE)
Source: AIReF and Ministry of Economic Affairs and Digital Transformation
2021-2024 fiscal strategy
For its central scenario, AIReF estimates a reduction in the General Government deficit over the period to 3.5% of GDP in 2024, 0.3 points higher than the figure included in the SPU. In both cases, the path is characterised by a sharp reduction in the deficit between 2020 and 2022 as a result of the progressive withdrawal of the measures implemented to mitigate the effects of the health crisis and the strong economic recovery, which subsequently slows down as both factors run out. This slowdown in deficit reduction is larger in AIReF's central scenario. This explains that, although in the early years AIReF expects a lower deficit than reflected in the SPU, the period ends with a greater deficit in the case of AIReF. Both AIReF and the Government in its SPU assume that implementation of the investments provided for in the RTRP will have a neutral effect on the deficit throughout the period.
2.0
-10.8
6.5 7.0
3.52.1
-15
-10
-5
0
5
10
2016 2017 2018 2019 2020 2021 2022 2023 2024
Range 20-80Range 30-70Range 40-60Government

Report
11 May 2021 Report on the 2021-2024 Stability Programme Update 9
EVOLUTION OF THE BALANCE OF THE GENERAL GOVERNMENT
Source: AIReF, Ministry of Economic Affairs and Digital Transformation and AIReF estimates
AIReF forecasts that the weight of revenue over GDP, excluding the RTRP, will gradually fall to 39.1% in 2024, slightly less than 0.2 points below the path of the SPU. In 2021 and 2022, revenue grows strongly on average by 6%, due to the dynamism of the economic recovery, albeit at a slower pace than nominal GDP. This growth moderates in the last two years of the period to an average of 3.5%, which is closer, although still slightly below nominal GDP. Taxes on production grow strongly with domestic demand in 2021 and 2022, with more moderate growth in the following years. For their part, taxes on income and social contributions record more moderate growth in 2021and 2022, reflecting the smaller fall they suffered in 2020, with their rate of growth also slowing in 2023 and 2024. Compared with the SPU, AIReF forecasts higher revenue from taxes on production and lower social security contributions and taxes on income.
The weight of expenditure as a proportion of GDP, excluding the RTRP, also falls in AIReF's central scenario, to 42.7% in 2024, 0.2 points above the figure included in the SPU. As in the case of revenue, there are two distinct periods with a more notable fall in 2021 and 2022. As a consequence of the gradual withdrawal of the measures, AIReF forecasts in nominal terms a fall in total expenditure excluding the RTRP following its practical stabilisation in 2021. Subsequently, expenditure would grow by around 2.3% following its baseline evolution. In terms of its composition, AIReF estimates that the components of
0.6 0.4 0.0
-0.4
-11.0
-7.8
-4.6-3.9
-3.5
-8.4
-5.0
-4.0
-3.2
-12
-10
-8
-6
-4
-2
0
2
2010 2011 2012 2013 2014 2015 2016 2017 2018 2019 2020 2021 2022 2023 2024
Observed AIReF SPU
Report
10 Report on the 2021-2024 Stability Programme Update 11 May 2021
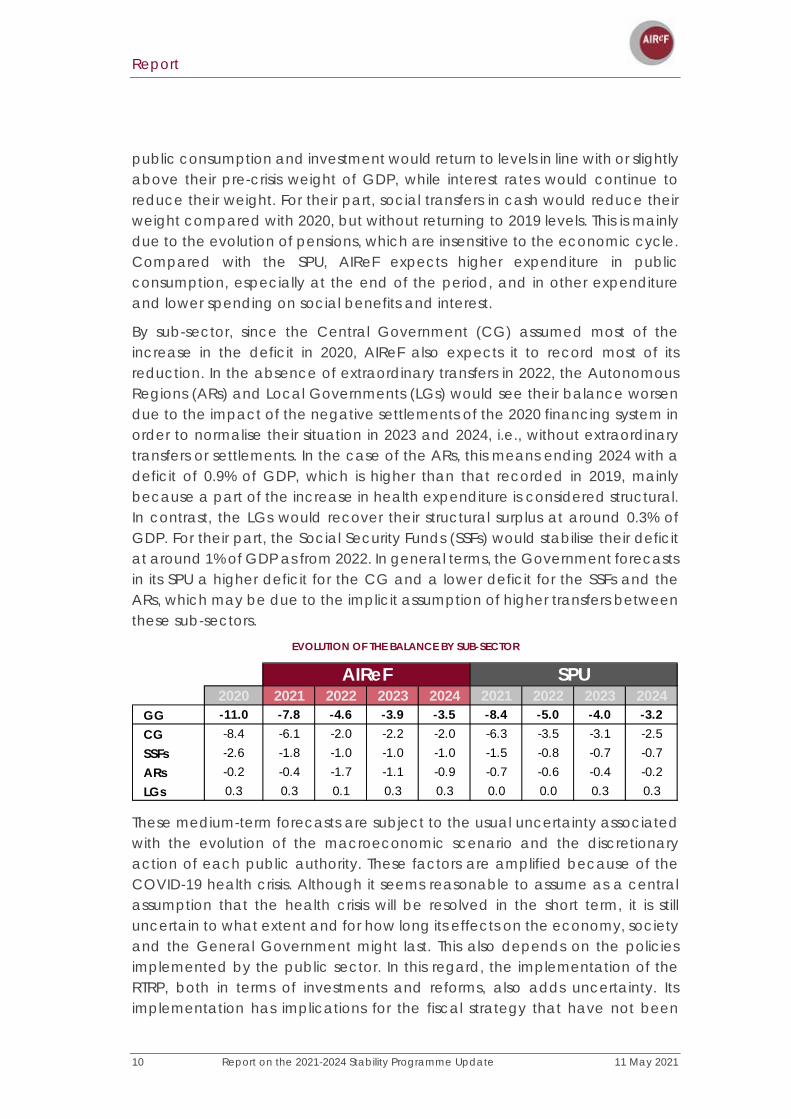
public consumption and investment would return to levels in line with or slightly above their pre-crisis weight of GDP, while interest rates would continue to reduce their weight. For their part, social transfers in cash would reduce their weight compared with 2020, but without returning to 2019 levels. This is mainly due to the evolution of pensions, which are insensitive to the economic cycle. Compared with the SPU, AIReF expects higher expenditure in public consumption, especially at the end of the period, and in other expenditure and lower spending on social benefits and interest.
By sub-sector, since the Central Government (CG) assumed most of the increase in the deficit in 2020, AIReF also expects it to record most of its reduction. In the absence of extraordinary transfers in 2022, the Autonomous Regions (ARs) and Local Governments (LGs) would see their balance worsen due to the impact of the negative settlements of the 2020 financing system in order to normalise their situation in 2023 and 2024, i.e., without extraordinary transfers or settlements. In the case of the ARs, this means ending 2024 with a deficit of 0.9% of GDP, which is higher than that recorded in 2019, mainly because a part of the increase in health expenditure is considered structural. In contrast, the LGs would recover their structural surplus at around 0.3% of GDP. For their part, the Social Security Funds (SSFs) would stabilise their deficit at around 1% of GDP as from 2022. In general terms, the Government forecasts in its SPU a higher deficit for the CG and a lower deficit for the SSFs and the ARs, which may be due to the implicit assumption of higher transfers between these sub-sectors.
EVOLUTION OF THE BALANCE BY SUB-SECTOR
These medium-term forecasts are subject to the usual uncertainty associated with the evolution of the macroeconomic scenario and the discretionary action of each public authority. These factors are amplified because of the COVID-19 health crisis. Although it seems reasonable to assume as a central assumption that the health crisis will be resolved in the short term, it is still uncertain to what extent and for how long its effects on the economy, society and the General Government might last. This also depends on the policies implemented by the public sector. In this regard, the implementation of the RTRP, both in terms of investments and reforms, also adds uncertainty. Its implementation has implications for the fiscal strategy that have not been
2020 2021 2022 2023 2024 2021 2022 2023 2024GG -11.0 -7.8 -4.6 -3.9 -3.5 -8.4 -5.0 -4.0 -3.2CG -8.4 -6.1 -2.0 -2.2 -2.0 -6.3 -3.5 -3.1 -2.5SSFs -2.6 -1.8 -1.0 -1.0 -1.0 -1.5 -0.8 -0.7 -0.7ARs -0.2 -0.4 -1.7 -1.1 -0.9 -0.7 -0.6 -0.4 -0.2LGs 0.3 0.3 0.1 0.3 0.3 0.0 0.0 0.3 0.3
AIReF SPU
Report
11 May 2021 Report on the 2021-2024 Stability Programme Update 11
assessed in the SPU and which AIReF has not been able to evaluate. These might lead to increases or reductions in the structural deficit beyond those envisaged in the SPU.
Fiscal policy stance
The fiscal policy stance over the projection horizon is crucially dependent on the RTRP. AIReF therefore considers it relevant on this occasion to offer a separate diagnosis of the national fiscal policy stance, excluding the expansionary fiscal boost associated with the RTRP, which, in accordance with the guidelines of the European Commission, will have a neutral impact on the deficit.
In this regard, AIReF's estimates of the fiscal policy stance over the horizon of the stability programme – under alternative methodologies that attempt to bypass the high level of uncertainty associated with estimating the output gap and the structural balances at times of major fluctuations in activity – suggest that, after the fiscal expansion that took place in 2020, the national fiscal policy takes a neutral tone that would extend to the end of the projection horizon.
These estimates show some discrepancies with the contents of the SPU. Specifically, the Government estimates that, after maintaining a neutral tone in 2020, the national fiscal policy will remain expansionary in 2021 (without considering the boost provided by the RTRP). However, according to the Government, in 2024 there would then be a structural adjustment (of €8bn) that AIReF does not consider to be supported by measures, and which may be unrealistic in view of the usual optimism shown in the stability programmes in that projection horizon.
In addition, according to AIReF’s estimates, the medium-term structural cost of the pandemic for Spanish public finances is around 1% to 2% of GDP, depending on the different methodologies used.
Challenges that can be noted from the point of view of the sustainability of public finances
The COVID-19 pandemic triggered a global economic crisis in 2020 that has resulted in a deterioration in the public accounts and an unprecedented increase in government debt ratios. The Spanish economy is among those that have been hit hardest by this crisis and it has recorded the largest government deficit and largest contraction in GDP in the European Union. This has led to an increase in the debt ratio of 24.5 points, placing it at 120% of GDP, its highest level for the last 100 years.
Under its macro-fiscal forecasts, AIReF projects a reduction in the debt-to-GDP ratio of 7.6 points by 2024, to 112.4%. The expected upturn in economic activity
Report
12 Report on the 2021-2024 Stability Programme Update 11 May 2021
driven by the RTRP, the improvement in the cyclical component of the public balance and the gradual disappearance of the pandemic-related emergency measures, make it possible to project this reduction in the debt ratio, which is in line with that presented by the Government.
The significant increase in the stock of public debt resulting from the crisis, on top of the previous high level, places the sustainability of public finances in a position of greater vulnerability. In the short term, one of the first challenges will be to tackle a higher structural deficit through a consolidation strategy that allows a gradual return to a balanced budget that does not adversely affect growth. This is essential for generating the fiscal space that will allow future risks to be addressed.
Higher public expenditure resulting from the ageing of the population, together with a possible tightening of financing conditions, are seen as the main risks for the sustainability of public finances in a medium and long-term horizon. This is due both to the likelihood of occurrence and to their high impact.
Recommendations
In this context, AIReF once again insists on the need for a credible and realistic medium-term fiscal strategy that guarantees the sustainability of public finances. The SPU is a starting point but is insufficient as shown by the sustainability analysis of the government debt and the limitations for analysing the macroeconomic and fiscal implications of the RTRP. In addition, as AIReF has repeatedly pointed out in previous reports, the SPU still does not have sufficient content to be the main instrument for the medium-term budgetary planning of the General Government in the terms provided for by both European and national legislation. For these reasons, AIReF recommends that:
• The Government should complete the medium-term fiscal strategy to achieve a level of deficit that is sufficient to steer the debt towards more sustainable paths that will reduce the vulnerability of the Spanish economy. This implies extending the time horizon of the strategy and integrating into it the macroeconomic and fiscal implications of the implementation of the investments and reforms set out in the RTRP.
• AIReF also maintains its recommendation on the need to expand the content of the SPU.

11 May 2021 Report on the 2021-2024 Stability Programme Update
13
INTRODUCTION
The law establishes that the Independent Authority for Fiscal Responsibility (AIReF) must prepare a report on the Stability Programme Update (SPU). Unlike last year, and despite the high degree of uncertainty that remains due to the health crisis caused by COVID-19, the SPU recovers its usual medium-term horizon, setting out the Government's macroeconomic and fiscal forecasts for the period 2021-2024. AIReF must report on the macroeconomic forecasts that underpin the 2021-2024 SPU as well as its budgetary scenario, in accordance with Articles 14 and 16 of Organic Law 6/2013 on the Establishment of AIReF. In addition, at the same time as the SPU, the Government has presented the Recovery, Transformation and Resilience Plan (RTRP), which conditions both the macroeconomic and the fiscal scenario. Moreover, the fiscal rules remain suspended to date and at least until 2022. They are likely to be reinstated before the end of the forecast period, either in their previous version or reformed.
AIReF gave advance notice of its endorsement of the macroeconomic framework underpinning the 2021-2024 SPU. On April 26th, AIReF endorsed the Government's macroeconomic scenario, considering that the growth forecast for 2021 is feasible if progress is made in controlling the pandemic and the RTRP investments start to be put into action. It also considered that the Government's estimates in the medium term are also achievable if the pandemic subsides globally and if the RTRP projects are implemented in a timely manner and with sufficient quality. This initial assessment was sent to the Government, enabling AIReF’s conclusions and endorsement to be incorporated before the SPU was sent to the EU institutions.
Report
14 Report on the 2021-2024 Stability Programme Update 11 May 2021
AIReF made two recommendations to the Government in its preliminary assessment. To increase the rigour of the endorsement process, AIReF calls for more information on the budgetary and fiscal measures incorporated in the macroeconomic scenario. In addition, to make the process of endorsing the macroeconomic outlook more transparent and efficient, AIReF reiterates its recommendation to the Government to regulate the flow and timing of the exchange of information by means of an agreement or “Memorandum of Understanding” (MoU).
Following approval of submission of the SPU at the Council of Ministers, this report sets out the full macroeconomic and fiscal assessment performed by AIReF. For this purpose, the analysis is divided into six main blocks. Following this introduction, the macroeconomic scenario is evaluated first. Secondly, the fiscal scenario is analysed, with a breakdown of the evolution of the revenue and expenditure of the General Government and of the balance of each one of the sub-sectors. This section includes information on COVID-19 measures and the impact of the NGEU funds on the public accounts. The third and fourth sections analyse fiscal risks and the orientation of the fiscal framework. This is followed by an analysis of debt sustainability. Finally, the analysis carried out by AIReF leads to a series of recommendations for the Government, in addition to those made in its preliminary assessment.

11 May 2021 Report on the 2021-2024 Stability Programme Update
15
EVALUATION OF THE MACROECONOMIC SCENARIO
AIReF considers that the macroeconomic scenario of the SPU for the period 2021-2024 is feasible, although it highlights the high level of uncertainty surrounding the health crisis and the design, implementation, and macroeconomic impact of the RTRP. This section presents in detail the analysis performed by AIReF underpinning this diagnosis.
To assess the SPU's macroeconomic scenario, AIReF prepares its own macroeconomic scenario and presents a probabilistic analysis of the Government's forecasts together with a detailed assessment of existing risks. The progress made in the vaccination process has reduced the likelihood of more unfavourable scenarios. Therefore, to assess the degree of realism of the Government's macroeconomic scenario, AIReF has abandoned the scenario-based approach that it began to carry out at the outbreak of the health crisis with the aim of reflecting the enormous uncertainty surrounding the pandemic and its influence on economic performance. Now, one single complete forecast scenario is prepared for the period 2021-2024 and statistical uncertainty bands are built around it based on the historical variability of each one of the macroeconomic aggregates. Aware that these bands cannot reflect all the uncertainty that remains in the economy in the current circumstances, AIReF conducts a more detailed analysis of the factors that are key in the Government's forecasting scenario and of the risks or sensitivity of the results to changes in the assumptions considered.
These factors include the uncertainty surrounding the evolution of the pandemic, which continues to condition economic activity and the prospects for recovery. Although medical advances in response to the pandemic have
Report
16 Report on the 2021-2024 Stability Programme Update 11 May 2021
improved the prospects for resolving the health crisis and global economic projections, it is still too early to consider the economic and social crisis it has caused to be over. In the short term, the severity of the infections continues to hinder the recovery in Spain and other European economies. In the medium term, the emergence of massive waves in some countries and the appearance of new variants project a high level of uncertainty regarding the degree of normality that it will be possible to achieve. All of this essentially conditions the intensity of the recovery, particularly in an economy such as Spain's, which specialises in activities requiring greater social interaction.
The second major element of uncertainty over the forecast horizon is the impact related with the Recovery, Transformation and Resilience Plan (RTRP). The Government has presented to the European institutions the various components of the RTRP, whereby Spain undertakes to spend €69.53bn (6.5% of GDP), through an ambitious raft of investment projects and reforms to be implemented in the period 2020-2026 - although the timing concentrates the investments in the period 2021-2023. Additional resources could be added if loans under the Next Generation EU (NGEU) are applied for. The Plan has a twofold aim: it seeks to boost economic recovery in the short term and support the structural transformation and sustainability of public finances in the medium and long term with reforms in the labour market and vocational training, pension and tax systems and other measures geared towards the green and digital transitions. The details and timing of most of the investments are now known, but the reforms remain outstanding. At a European level, the Own Resources Directive - which is necessary for the EU to be able to finance itself on the markets and launch the NGEU - is pending approval by some Member States. Once approved, the macroeconomic impact of the Plan will depend on the ability to implement the projects by the agreed deadlines, and for these projects to have the agreed quality, as well as the specific implementation of the reforms.
This section first presents the main features of AIReF’s macroeconomic scenario that serves as the basis for assessing the SPU’s scenario, both from a probabilistic perspective and from an assessment of the uncertainty surrounding the key factors defining these scenarios. Finally, an analysis of the forecasting biases committed by the Government over the last four years is presented, in compliance with European and national regulations on the quality of budgetary frameworks.
Report
11 May 2021 Report on the 2021-2024 Stability Programme Update 17
AIReF’s 2021-2024 macroeconomic scenario
External and health assumptions
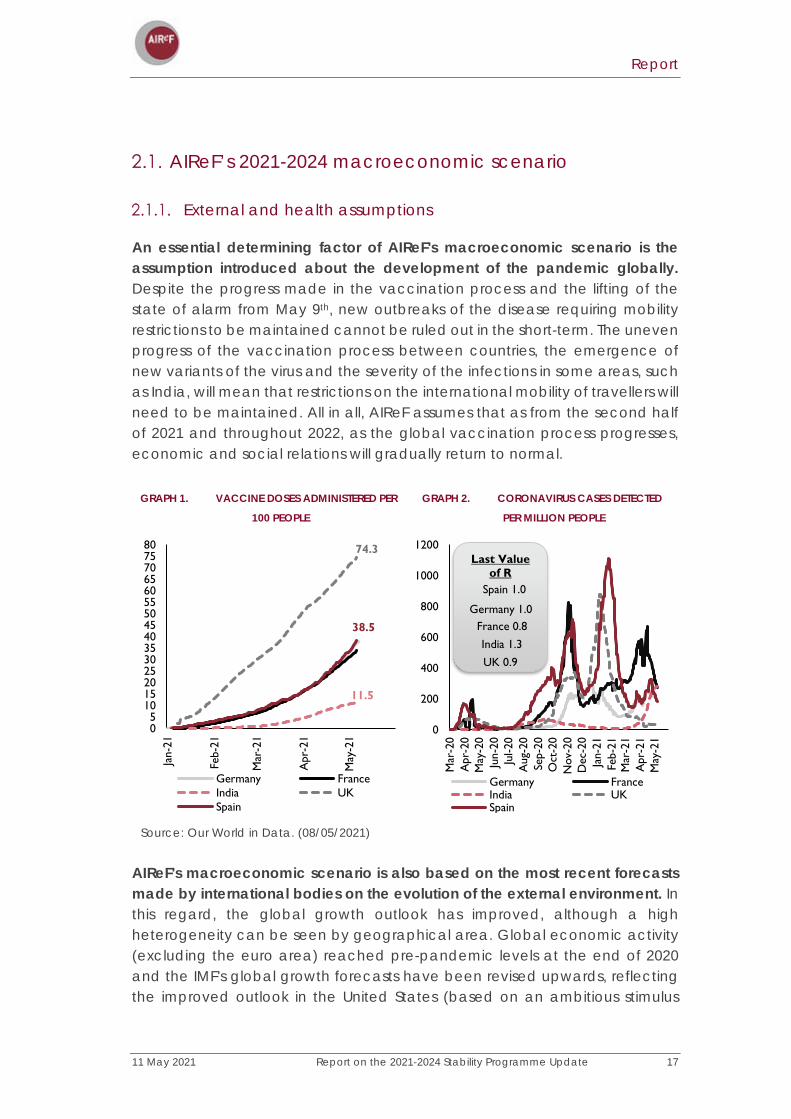
An essential determining factor of AIReF's macroeconomic scenario is the assumption introduced about the development of the pandemic globally. Despite the progress made in the vaccination process and the lifting of the state of alarm from May 9th, new outbreaks of the disease requiring mobility restrictions to be maintained cannot be ruled out in the short-term. The uneven progress of the vaccination process between countries, the emergence of new variants of the virus and the severity of the infections in some areas, such as India, will mean that restrictions on the international mobility of travellers will need to be maintained. All in all, AIReF assumes that as from the second half of 2021 and throughout 2022, as the global vaccination process progresses, economic and social relations will gradually return to normal.
GRAPH 1. VACCINE DOSES ADMINISTERED PER
100 PEOPLE
GRAPH 2. CORONAVIRUS CASES DETECTED
PER MILLION PEOPLE
Source: Our World in Data. (08/05/2021)
AIReF's macroeconomic scenario is also based on the most recent forecasts made by international bodies on the evolution of the external environment. In this regard, the global growth outlook has improved, although a high heterogeneity can be seen by geographical area. Global economic activity (excluding the euro area) reached pre-pandemic levels at the end of 2020 and the IMF's global growth forecasts have been revised upwards, reflecting the improved outlook in the United States (based on an ambitious stimulus
05
101520253035404550556065707580
Jan-
21
Feb-
21
Mar
-21
Apr
-21
May
-21
Germany FranceIndia UKSpain
74.3
11.5
38.5
0
200
400
600
800
1000
1200
Mar
-20
Apr
-20
May
-20
Jun-
20Ju
l-20
Aug
-20
Sep-
20O
ct-2
0N
ov-2
0D
ec-2
0Ja
n-21
Feb-
21M
ar-2
1A
pr-2
1M
ay-2
1
Germany FranceIndia UKSpain
Last Value of R
Spain 1.0
Germany 1.0France 0.8
India 1.3
UK 0.9

Report
18 Report on the 2021-2024 Stability Programme Update 11 May 2021
programme) and China1. In contrast, the euro area started the year immersed in a second recession caused by the severity of the pandemic and the most recent Eurosystem projections show a worsening of growth expectations for 2021. In particular, the March central scenario projects euro area GDP growth of 4% in 2021, 1.1 percentage points lower than forecast in September2. The uneven performance by country has not prevented world trade from growing at a high rate, especially trade in goods. In addition, the latest IMF forecasts point to a significant expansion in 2022 and 2023 (with expected growth of 8.4% and 6.5%, respectively, following the 8.5% contraction in 2020).
The recent rise in oil and other commodity prices may dampen the intensity of the recovery and has led to an increase in inflation expectations. The improvement in the global outlook has triggered price rises in commodity markets and increased inflation expectations in advanced economies. Empirical evidence suggests that the effects of an increase in the price of oil on activity are negative, even if they are associated with an improvement in the outlook for global growth.
GRAPH 3. COMMODITY PRICES (INDEX
2019=100)
GRAPH 4. EUROPEAN UNION 5Y-5Y INFLATION
SWAPS
Source: Ministry of Economic Affairs and Digital Transformation.
Source: Refinitiv
Finally, long-term interest rates in financial markets have started an upward path. Noteworthy in financial and foreign exchange markets is the recent
1 World Economic Outlook, April 2021: Managing Divergent Recoveries (imf.org)
2 ECB staff macroeconomic projections for the euro area, March 2021 (europa.eu)
75
100
125
150
175
200
2019
2020
2021
FoodAluminiumMetal Ind. Comm.Non-metal ind. Comm.
0.6
0.8
1.0
1.2
1.4
1.6
1.8
2.0
2018
2019
2020
2021

Report
11 May 2021 Report on the 2021-2024 Stability Programme Update 19
increase in long-term interest rates, despite the intensification of monetary stimulus measures. This has led to a slight deterioration in the economy’s financing conditions.
In addition to the new external assumptions, AIReF's macroeconomic scenario incorporates the most recent figures from the Quarterly National Accounts for the first quarter of 2021 and the economic policy measures approved. However, in the case of the ERTEs, the scenario incorporates the assumption that they will be extended until December 2021.
Main features of the 2021-2024 macroeconomic scenario
Under the assumption that the pandemic is gradually brought under control, AIReF forecasts gross domestic product growth of 6.6% in 2021, followed by expansion of 7% in 2022. In 2023-2024, the growth path gradually returns to pre-pandemic potential growth rates. In this growth scenario, the economy would recover pre-pandemic activity levels by the end of 2022. The main features are shown below.
TABLE 1. MACROECONOMIC OUTLOOK 2021-2024.
Sources: INE and AIReF estimates.
Report
20 Report on the 2021-2024 Stability Programme Update 11 May 2021
2.1.2.1 Short-term growth
As detailed in AIReF Report 01/213, the short-term growth path is determined by the dip in activity recorded in the first few months of the year and by the expected delay in the implementation of the RTRP projects. On the one hand, the national accounting figures show that economic activity in early 2021 fell again because of the severity of the pandemic and the maintenance of mobility restrictions. Although the impact of these restrictions on consumption decisions is lower than in the first few months of the pandemic, the sectors most affected by the restrictions maintain very low levels of activity. For example, effective social security affiliations in the hospitality sector in April 2021 are still lower than those recorded a year earlier, during the most stringent lockdown, and overnight stays in hotel are over 80% down on pre-pandemic levels. In addition, it seems that the RTRP projects for 2021 will start to be implemented in the second half of the year. This is in contrast with the previous assumption of implementation being spread evenly over the year.
However, the lower prevalence of the pandemic in the spring makes it likely that there will be growth in the second quarter. The available short-term economic indicators, which are still very scarce, point to positive GDP growth in the second quarter, coinciding with the gradual lifting of the mobility restriction measures. For example, AIReF's MIPred model, using 12.5% of the data for the quarter - all of which still refer to the month of April - points to an increase of 0.8% in said quarter4.
The second half of the year is expected to see a recovery in economic activity associated with the start of the recovery in tourism and the boost generated by implementation of the Recovery, Transformation and Resilience Plan (RTRP). In accordance with the assumption of progressive control of the pandemic as the vaccination process progresses, a gradual normalisation of activities involving greater social contact and international tourism, can be expected in the second half of the year. Along the same lines, according to the plans announced by the Government, implementation of the RTRP is expected to begin, albeit with a delay compared with the forecast at the end of last year. AIReF assumes that its macroeconomic effects will begin to materialise this year, with an impact of 1.6 pp on the 2021 average. This is notably less than the 2.7 pp previously estimated and is still subject to a great deal of uncertainty, as detailed below.
3 See Report 01/21, on the Initial Budgets of the General Government for 2021
4 AIReF | Data Lab. Quarterly GDP forecast for Spain

Report
11 May 2021 Report on the 2021-2024 Stability Programme Update 21
GRAPH 5. PROJECTED PATH FOR QUARTERLY GDP DURING 2021 (2019Q4=100)
Source: National Statistics Institute and AIReF forecasts.
2.1.2.2 The medium-term scenario (2021-2024)
Over the forecast horizon, the main driver of growth is domestic demand and household consumption and investment. This behaviour of consumption is sustained by the favourable evolution of unemployment and a fall in the saving rate that would stand at 7% by the end of 2024, a little above the rate recorded prior to the crisis. There is also noteworthy growth in gross fixed capital formation, driven by the recovery in private investment and the impact of the RTRP. For its part, foreign demand would reverse, from 2022 onwards, the negative contribution forecast even in 2021. This recovery would be based on a foreseeable recovery in flows of world trade in services.
In the labour market, the unemployment rate falls to below pre-crisis levels at the end of the forecast horizon. The unemployment rate would rise to 16.1% in 2021 to then fall to 13.1% of the active population in 2024. This figure is a little below pre-crisis levels (the unemployment rate stood at 13.7% of the active population in the fourth quarter of 2019). This outcome depends crucially on the RTRP deploying its effects on growth and jobs.
Finally, inflation rises significantly in 2021 because of higher oil prices and will rise more slowly thereafter. Specifically, the GDP deflator is estimated to rise to 1.5% in 2021 and then gradually increase to 1.8% in 2024, in line with rising demand pressures reflected in the disappearance of the output gap in 2024.
2.1.2.3 Key factors in AIReF’s scenario
AIReF's macroeconomic outlook is essentially based on the assumptions made on three key determining factors: the evolution of tourist flows, which is
Report
22 Report on the 2021-2024 Stability Programme Update 11 May 2021
closely linked to the evolution of the pandemic; the impact of the RTRP, and the household saving rate.
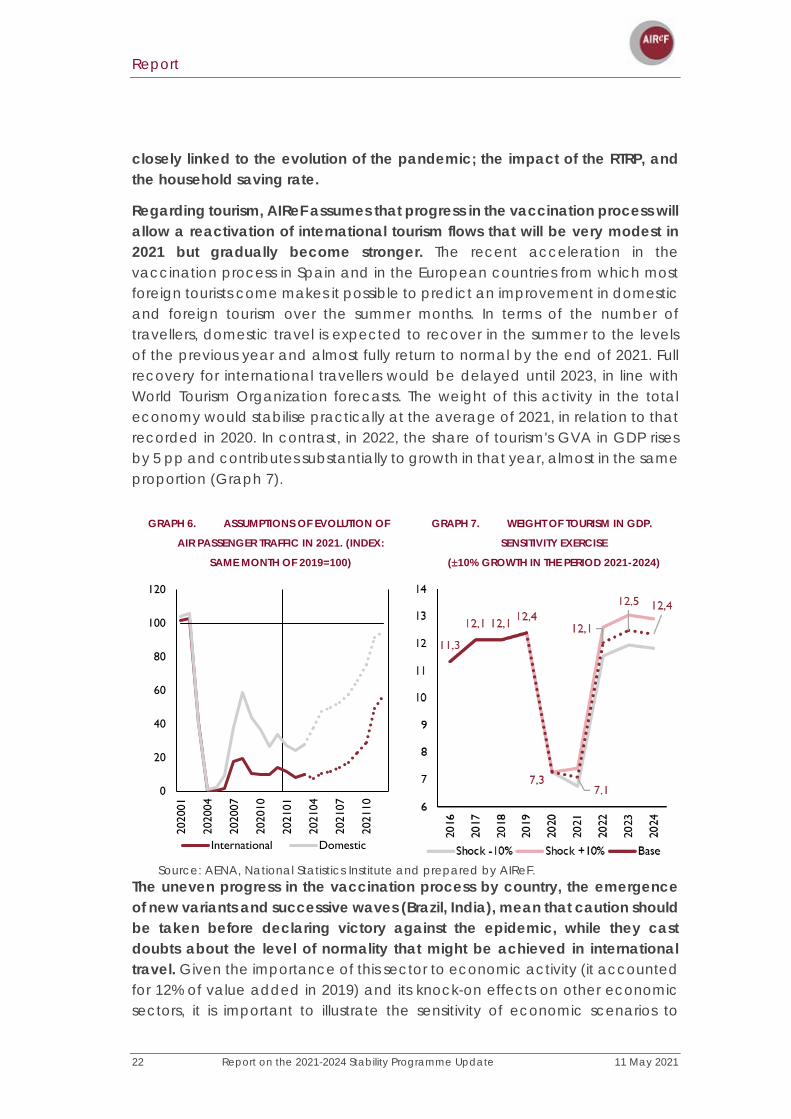
Regarding tourism, AIReF assumes that progress in the vaccination process will allow a reactivation of international tourism flows that will be very modest in 2021 but gradually become stronger. The recent acceleration in the vaccination process in Spain and in the European countries from which most foreign tourists come makes it possible to predict an improvement in domestic and foreign tourism over the summer months. In terms of the number of travellers, domestic travel is expected to recover in the summer to the levels of the previous year and almost fully return to normal by the end of 2021. Full recovery for international travellers would be delayed until 2023, in line with World Tourism Organization forecasts. The weight of this activity in the total economy would stabilise practically at the average of 2021, in relation to that recorded in 2020. In contrast, in 2022, the share of tourism's GVA in GDP rises by 5 pp and contributes substantially to growth in that year, almost in the same proportion (Graph 7).
GRAPH 6. ASSUMPTIONS OF EVOLUTION OF
AIR PASSENGER TRAFFIC IN 2021. (INDEX:
SAME MONTH OF 2019=100)
GRAPH 7. WEIGHT OF TOURISM IN GDP.
SENSITIVITY EXERCISE
(±10% GROWTH IN THE PERIOD 2021-2024)
Source: AENA, National Statistics Institute and prepared by AIReF.
The uneven progress in the vaccination process by country, the emergence of new variants and successive waves (Brazil, India), mean that caution should be taken before declaring victory against the epidemic, while they cast doubts about the level of normality that might be achieved in international travel. Given the importance of this sector to economic activity (it accounted for 12% of value added in 2019) and its knock-on effects on other economic sectors, it is important to illustrate the sensitivity of economic scenarios to
0
20
40
60
80
100
120
2020
01
2020
04
2020
07
2020
10
2021
01
2021
04
2021
07
2021
10
International Domestic
Report
11 May 2021 Report on the 2021-2024 Stability Programme Update 23
changes in the assumptions. The analysis presented in Box 1 suggests that, for example, if international travel returns to normal more quickly and strongly and the number of travellers rises by 10% more over the forecast horizon compared with the path detailed in Graph 6, the impact on growth would be an additional 0.4 pp in 2021 and 0.3 pp in 2022.
Report
24 Report on the 2021-2024 Stability Programme Update 11 May 2021
ESTIMATED CONTRIBUTION OF TOURISM TO GROWTH AND SENSITIVITY SCENARIOS
To analyse the sensitivity of AIReF’s scenario to alternative assumptions about the pace of normalisation of the tourism sector, we start from AENA's international and domestic passenger air traffic statistics. AIReF's scenario assumes a full recovery of domestic air traffic flows to the levels recorded in 2019, while international air traffic would not fully recover until 2023.
These estimates are transferred to the GVA generated in those branches most closely related to the tourism sector - branches 50-51-55-56-79-90-92 according to their CNAE (National Classification of Economic Activities) code - using the relationship between both variables estimated for the period 2017 and 2019. In this step, gross value-added data are used for 64 branches from the national accounts up to the last available period, prolonged with quarterly national accounts for 10 sections.
Based on these results, using the tourism satellite account of the National Statistics Institute, the impact of different assumptions of the normalisation of tourism on GDP and, ultimately, on the Gross Domestic Product of tourism, is estimated. This approach allows the knock-on effects of this activity on the rest of the economic sectors, which are high, to be considered. Estimates of the tourism expenditure multiplier suggest that every 1 euro spent on tourism produces almost another euro of complementary expenditure (“The economic impact of tourism in the European Union”, GRO-SME-17-C-091a/C).
This analysis shows the sensitivity of the expected path of GDP to the rate of recovery of this branch of activity. For example, if international travel returns to normal more quickly and strongly and the number of travellers rises by 10% more over the forecast horizon compared with the path detailed in Graph 6, the impact on growth would be an additional 0.4 pp in 2021 and 0.3 pp in 2022. In contrast, a slower rate of recovery, assuming that in 2021 the level of domestic and international travellers is 10% or 20% lower than in the central scenario of Graph 2, would reduce GDP growth in that year by between 0.4 and 0.8 pp of GDP. However, that impact might be offset in 2022 if normalisation takes place in that year. A greater delay in normalisation might shift the biggest boost in the recovery to 2023.

Report
11 May 2021 Report on the 2021-2024 Stability Programme Update 25
SCENARIOS OF THE CONTRIBUTION OF TOURISM TO NOMINAL GDP GROWTH IN PP OVER BASELINE SCENARIO.
Source: AENA, National Statistics Institute and prepared by AIReF.
Given the traditional concentration of the home markets of foreign tourists that visit Spain, the materialisation of one or another scenario would depend on the evolution of the pandemic and the international travel restrictions of the United Kingdom, Germany, and France.
PERCENTAGE STRUCTURE OF THE ORIGIN OF INBOUND TOURISTS IN 2019 AND 2020. (PERCENTAGE, IN BRACKETS MILLIONS OF TOURISTS IN 2019)
Source: National Statistics Institute.
0.4 0.30.0
-0.4
0.70.0
-0.8
1.6
0.1
-1.1
0.3
1.5
-1.5
-1.0
-0.5
0.0
0.5
1.0
1.5
2.0
2021
2022
2023
Permanent Shock Tourism (+10%) Shock Tourism 2021 (-10%)
Shock Tourism 2021 (-20%) Shock Tourism 2021 (-30%) & 2022 (-20%)
0
5
10
15
20
25
UK
Ger
man
y
Fran
ce
Rest
of E
urop
e
Rest
of t
he w
orld
Nor
dic
Cou
ntri
es
Italy
Rest
of A
mer
ica
Net
herl
ands
Uni
ted
Stat
es
Belg
ium
Port
ugal
Irel
and
Switz
erla
nd
Russ
ia
(18.0) (11.2) (11.1) (6.4) (5.7) (5.5) (4.5) (3.8) (3.7) (3.3) (2.5) (2.4) (2.2) (1.8) (1.3)
2019 2020
Report
26 Report on the 2021-2024 Stability Programme Update 11 May 2021
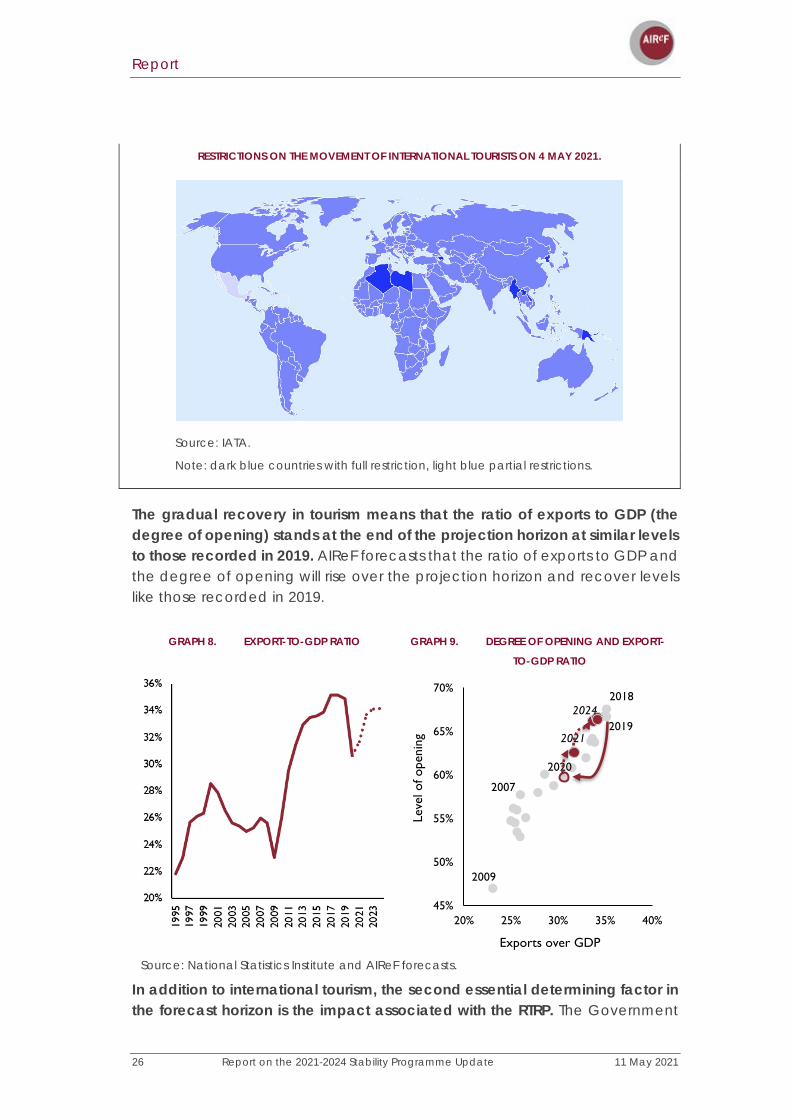
RESTRICTIONS ON THE MOVEMENT OF INTERNATIONAL TOURISTS ON 4 MAY 2021.
Source: IATA.
Note: dark blue countries with full restriction, light blue partial restrictions.
The gradual recovery in tourism means that the ratio of exports to GDP (the degree of opening) stands at the end of the projection horizon at similar levels to those recorded in 2019. AIReF forecasts that the ratio of exports to GDP and the degree of opening will rise over the projection horizon and recover levels like those recorded in 2019.
GRAPH 8. EXPORT-TO-GDP RATIO GRAPH 9. DEGREE OF OPENING AND EXPORT-
TO-GDP RATIO
Source: National Statistics Institute and AIReF forecasts.
In addition to international tourism, the second essential determining factor in the forecast horizon is the impact associated with the RTRP. The Government
2007
2009
2019
2018
2020
2021
2024
45%
50%
55%
60%
65%
70%
20% 25% 30% 35% 40%
Leve
l of o
peni
ng
Exports over GDP
Report
11 May 2021 Report on the 2021-2024 Stability Programme Update 27
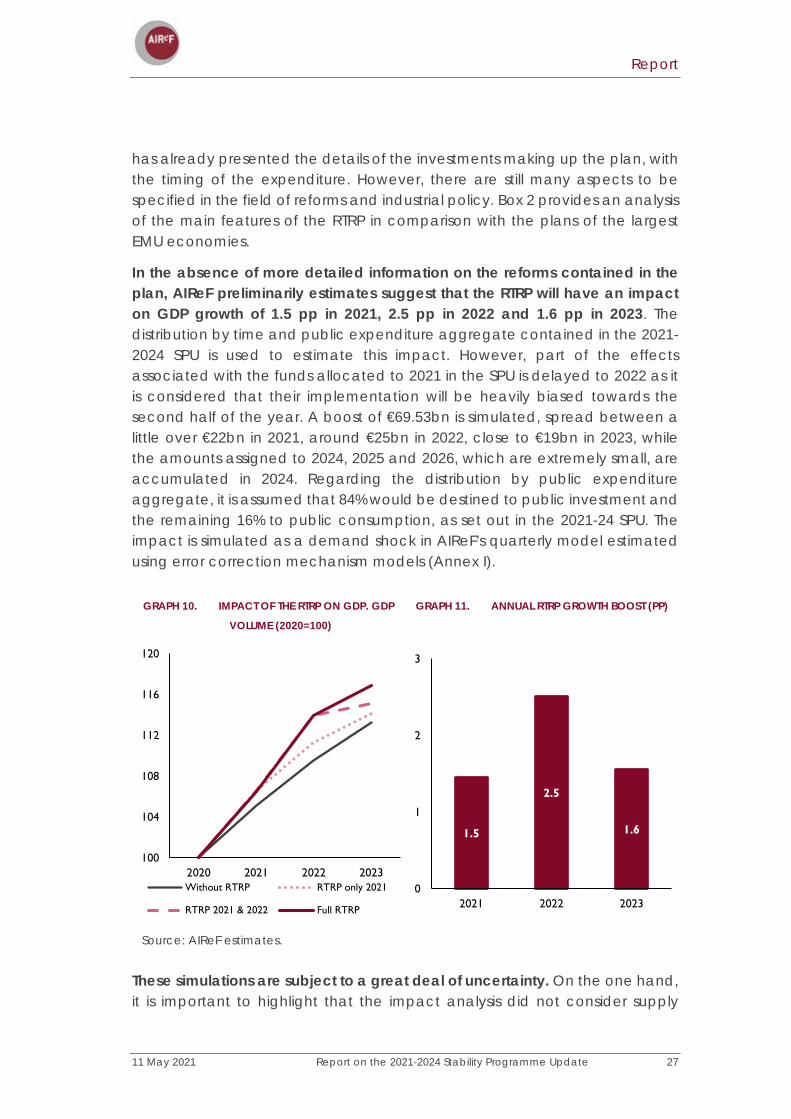
has already presented the details of the investments making up the plan, with the timing of the expenditure. However, there are still many aspects to be specified in the field of reforms and industrial policy. Box 2 provides an analysis of the main features of the RTRP in comparison with the plans of the largest EMU economies.
In the absence of more detailed information on the reforms contained in the plan, AIReF preliminarily estimates suggest that the RTRP will have an impact on GDP growth of 1.5 pp in 2021, 2.5 pp in 2022 and 1.6 pp in 2023. The distribution by time and public expenditure aggregate contained in the 2021-2024 SPU is used to estimate this impact. However, part of the effects associated with the funds allocated to 2021 in the SPU is delayed to 2022 as it is considered that their implementation will be heavily biased towards the second half of the year. A boost of €69.53bn is simulated, spread between a little over €22bn in 2021, around €25bn in 2022, close to €19bn in 2023, while the amounts assigned to 2024, 2025 and 2026, which are extremely small, are accumulated in 2024. Regarding the distribution by public expenditure aggregate, it is assumed that 84% would be destined to public investment and the remaining 16% to public consumption, as set out in the 2021-24 SPU. The impact is simulated as a demand shock in AIReF's quarterly model estimated using error correction mechanism models (Annex I).
GRAPH 10. IMPACT OF THE RTRP ON GDP. GDP
VOLUME (2020=100)
GRAPH 11. ANNUAL RTRP GROWTH BOOST (PP)
Source: AIReF estimates.
These simulations are subject to a great deal of uncertainty. On the one hand, it is important to highlight that the impact analysis did not consider supply
100
104
108
112
116
120
2020 2021 2022 2023Without RTRP RTRP only 2021
RTRP 2021 & 2022 Full RTRP
1.5
2.5
1.6
0
1
2
3
2021 2022 2023

Report
28 Report on the 2021-2024 Stability Programme Update 11 May 2021
channels as it was not possible to analyse the reforms in the required detail. In this regard, the Report on the Main Lines of the Budgets of the General Government published in November 20205 presented a stylised analysis showing that, if the demand-side shock is accompanied by measures that make it possible to increase total factor productivity, raise the level of competition or improve human capital, the impact would be greater in the short-term and much more long-lasting. Conversely, achieving the estimated demand-side effects depends on the funds being spent on quality investments with high multipliers. Empirical evidence suggests that the investments envisaged in the plan in infrastructure, human capital and digitisation may be associated with high multipliers. This is particularly the case if the boost is carried out in a coordinated manner between countries and takes place during a recession in which idle resources exist and interest rate hikes through monetary policy are not expected. However, for this to happen, the projects must be implemented on time and with the agreed quality. Box 3 shows how the impact on growth associated with the RTRP can vary significantly depending on the nature of the expenditure and how productive the investment is.
5 See Box 3 on the Report on the Main Lines of the 2021 Budgets of the General Government (Report 29/20).

Report
11 May 2021 Report on the 2021-2024 Stability Programme Update 29
The Recovery Resilience Plans in Spain, Germany, France, and Italy
At the time of writing, 16 EU Member States have submitted their National Recovery and Resilience Plans (NRRPs) to the European Commission.6 In accordance with Regulation 2021/241, the submission of these plans is essential for access to loans and grants from the Recovery and Resilience Facility (RRF).
The RRF contains €315bn billion in transfers, plus €360bn in loans. The transfers have been allocated among EU Member States according to criteria of population, GDP per capita, unemployment rate and fall in real GDP because of the pandemic. This box focuses on the comparison of the NRRPs submitted by Spain, Italy, France, and Germany, which, in addition to being the main beneficiaries of RRF transfers - accounting for, respectively 21%, 20%, 12% and 8% of total Facility transfers - are the four largest economies in the euro area. Four elements are analysed: (i) type of instrument requested (transfers and/or loans), (ii) time distribution of funds, (iii) main investment components, and (iv) macroeconomic impact that each country attributes to the funds.
Source: AIReF based on the NRRPs
The NRRPs of the major euro area economies mainly provide for the use of the transfers corresponding to them under the RRF. Only the Italian Plan also includes details on the use of loans. In contrast, France, Germany, and Spain
6 AT, HR, DK, FR, HU, PT, SI, BE, DE, RO, ES, BG, CZ, EL, IT and PL.
0
10
20
30
40
50
60
70
ES IT FR DE PL
THE
RO PT HU
CZ
BG HR SK BE NL AT SE LT MF
LV YES
DK IE CY EE MT
LU
€bi
llion
Distribution of transfers from the Recovery and Resilience Facility by country
Report
30 Report on the 2021-2024 Stability Programme Update 11 May 2021
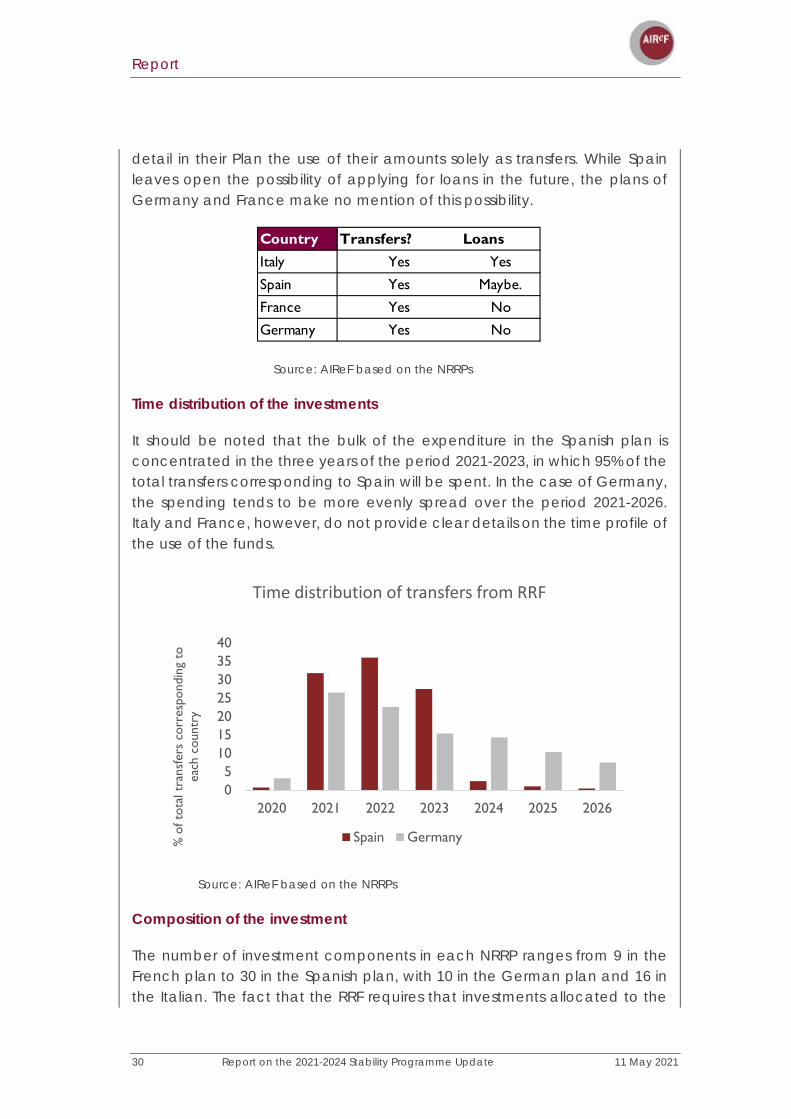
detail in their Plan the use of their amounts solely as transfers. While Spain leaves open the possibility of applying for loans in the future, the plans of Germany and France make no mention of this possibility.
Source: AIReF based on the NRRPs
Time distribution of the investments
It should be noted that the bulk of the expenditure in the Spanish plan is concentrated in the three years of the period 2021-2023, in which 95% of the total transfers corresponding to Spain will be spent. In the case of Germany, the spending tends to be more evenly spread over the period 2021-2026. Italy and France, however, do not provide clear details on the time profile of the use of the funds.
Source: AIReF based on the NRRPs
Composition of the investment
The number of investment components in each NRRP ranges from 9 in the French plan to 30 in the Spanish plan, with 10 in the German plan and 16 in the Italian. The fact that the RRF requires that investments allocated to the
Country Transfers? LoansItaly Yes Yes
Spain Yes Maybe.
France Yes No
Germany Yes No
05
10152025303540
2020 2021 2022 2023 2024 2025 2026
% o
f tot
al t
rans
fers
cor
resp
ondi
ng t
o ea
ch c
ount
ry
Time distribution of transfers from RRF
Spain Germany

Report
11 May 2021 Report on the 2021-2024 Stability Programme Update 31
green transition should account for at least 37% of the total of each Plan, and that those allocated to the digital transition represent a minimum of 20%, means that the distribution of investments by area shares certain features in all the countries.
Therefore, for the four countries analysed, climate investments account for the bulk of their respective plans, followed by investments in digitalisation. The strengthening of health systems is also an important area in three of the countries analysed, while the remaining elements are spread across diverse areas, such as territorial cohesion (France and Italy), innovation and research (Italy and Spain), social inclusion policies (Italy and Spain) and modernisation of public authorities.
Source: AIReF based on the NRRPs
Within the climate field, investments in the energy efficiency of buildings and sustainable mobility are the most heavily funded in the four countries. There are, however, differences between the countries: of the four, Germany is the country that invests the most in hydrogen; France is the country that invests the most in renewable energies; Spain prioritises electro-mobility, while Italy is the country that most diversifies its climate investment.
The component with the largest weight in each country, in relation to the plan, is in Italy: the high-speed rail network and safe road capacity (13% of the total); in Spain: the housing rehabilitation and urban regeneration plan (9.8% of the total); in France: research, health insurance, dependency and territorial cohesion (19.25% of the total); and in Germany: sustainable mobility (19.4% of the total).
50.6
40.3 40.3 40.8
25.1
3429.6
26.9
15 16.3
1.5
8.29.3 9.4
28.624.1
0
10
20
30
40
50
60
FR DE ES IT
% o
f tot
al fu
nds
Distribution of RRF funds by thematic area
climate digital health other
Report
32 Report on the 2021-2024 Stability Programme Update 11 May 2021
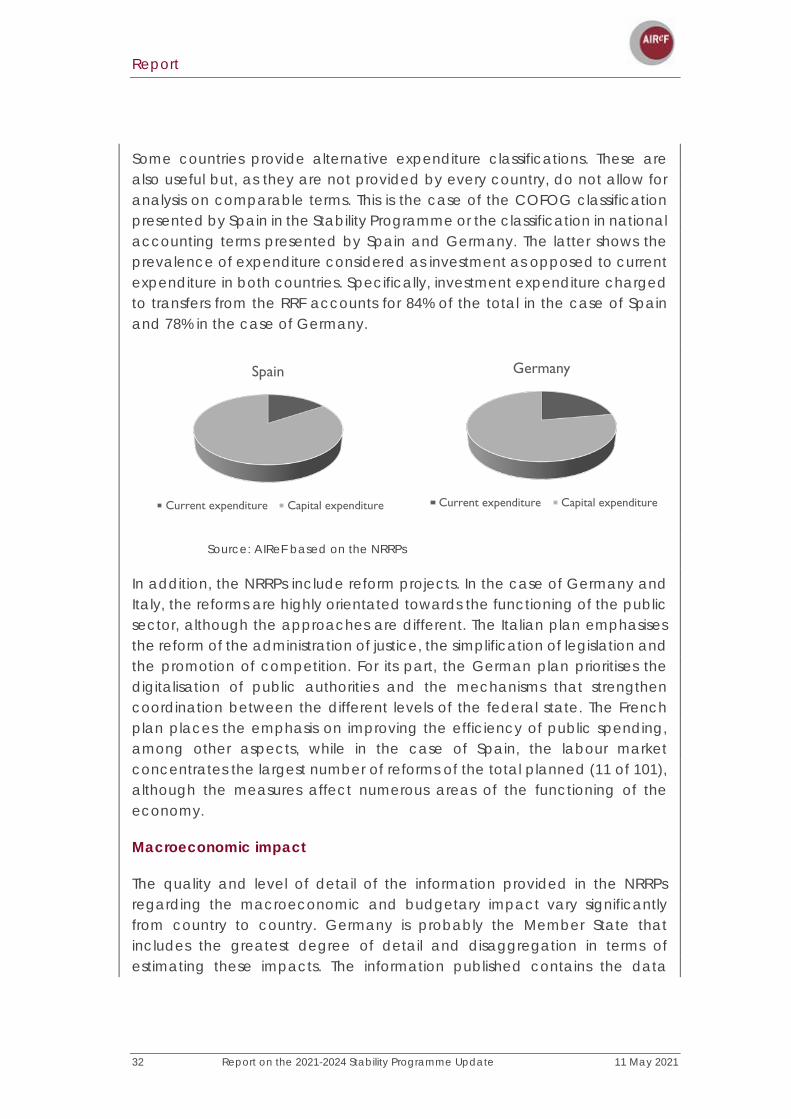
Some countries provide alternative expenditure classifications. These are also useful but, as they are not provided by every country, do not allow for analysis on comparable terms. This is the case of the COFOG classification presented by Spain in the Stability Programme or the classification in national accounting terms presented by Spain and Germany. The latter shows the prevalence of expenditure considered as investment as opposed to current expenditure in both countries. Specifically, investment expenditure charged to transfers from the RRF accounts for 84% of the total in the case of Spain and 78% in the case of Germany.
Source: AIReF based on the NRRPs
In addition, the NRRPs include reform projects. In the case of Germany and Italy, the reforms are highly orientated towards the functioning of the public sector, although the approaches are different. The Italian plan emphasises the reform of the administration of justice, the simplification of legislation and the promotion of competition. For its part, the German plan prioritises the digitalisation of public authorities and the mechanisms that strengthen coordination between the different levels of the federal state. The French plan places the emphasis on improving the efficiency of public spending, among other aspects, while in the case of Spain, the labour market concentrates the largest number of reforms of the total planned (11 of 101), although the measures affect numerous areas of the functioning of the economy.
Macroeconomic impact
The quality and level of detail of the information provided in the NRRPs regarding the macroeconomic and budgetary impact vary significantly from country to country. Germany is probably the Member State that includes the greatest degree of detail and disaggregation in terms of estimating these impacts. The information published contains the data
Spain
Current expenditure Capital expenditure
Germany
Current expenditure Capital expenditure
Report
11 May 2021 Report on the 2021-2024 Stability Programme Update 33
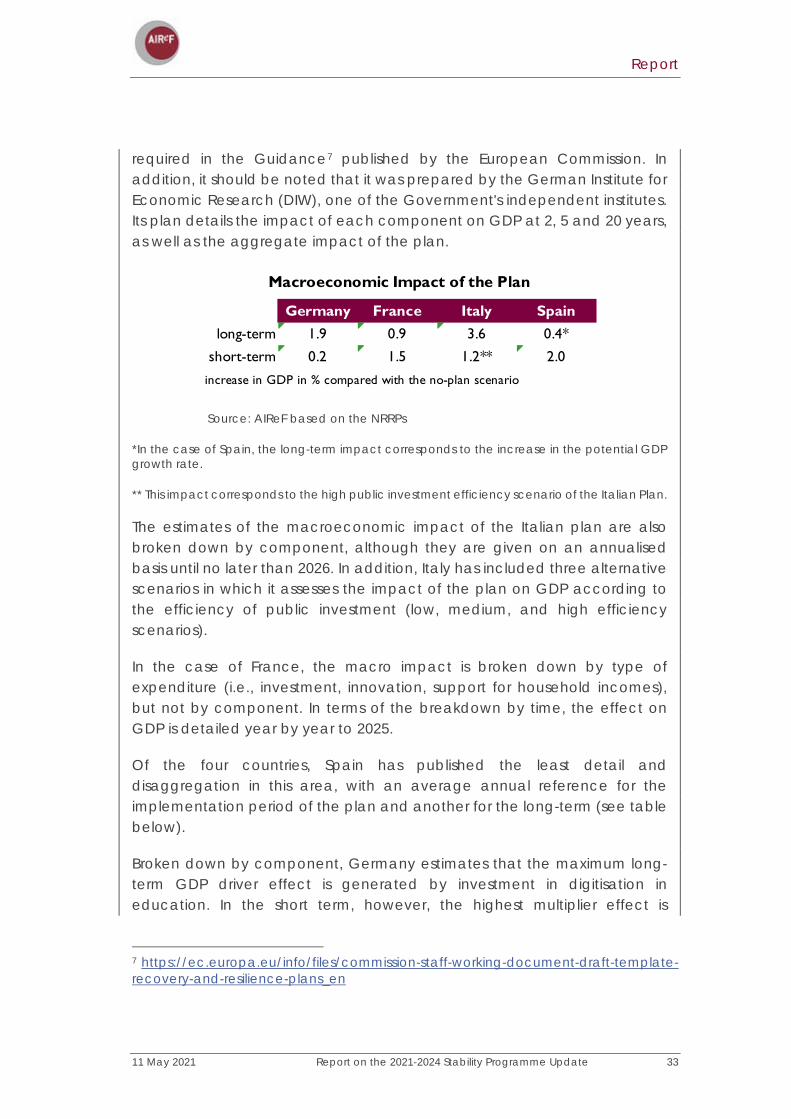
required in the Guidance7 published by the European Commission. In addition, it should be noted that it was prepared by the German Institute for Economic Research (DIW), one of the Government's independent institutes. Its plan details the impact of each component on GDP at 2, 5 and 20 years, as well as the aggregate impact of the plan.
Source: AIReF based on the NRRPs
*In the case of Spain, the long-term impact corresponds to the increase in the potential GDP growth rate.
** This impact corresponds to the high public investment efficiency scenario of the Italian Plan.
The estimates of the macroeconomic impact of the Italian plan are also broken down by component, although they are given on an annualised basis until no later than 2026. In addition, Italy has included three alternative scenarios in which it assesses the impact of the plan on GDP according to the efficiency of public investment (low, medium, and high efficiency scenarios).
In the case of France, the macro impact is broken down by type of expenditure (i.e., investment, innovation, support for household incomes), but not by component. In terms of the breakdown by time, the effect on GDP is detailed year by year to 2025.
Of the four countries, Spain has published the least detail and disaggregation in this area, with an average annual reference for the implementation period of the plan and another for the long-term (see table below).
Broken down by component, Germany estimates that the maximum long-term GDP driver effect is generated by investment in digitisation in education. In the short term, however, the highest multiplier effect is
7 https://ec.europa.eu/info/files/commission-staff-working-document-draft-template-recovery-and-resilience-plans_en
Germany France Italy Spainlong-term 1.9 0.9 3.6 0.4*
short-term 0.2 1.5 1.2** 2.0
increase in GDP in % compared with the no-plan scenario
Macroeconomic Impact of the Plan

Report
34 Report on the 2021-2024 Stability Programme Update 11 May 2021
associated with investments in decarbonisation. In the case of Italy, it is investments in energy transition and sustainable mobility that might have the largest expansionary effect on GDP in the short and medium term.
Source: AIReF based on the NRRPs *This impact corresponds to the high public investment efficiency scenario of the Italian Plan.
France Italy Spainshort-term medium-term long-term
0.5 1.1 2.0 0.8 1.2* 1.1
Germany
Report
11 May 2021 Report on the 2021-2024 Stability Programme Update 35
RTRP GROWTH SCENARIO SENSITIVITY ANALYSIS USING QUEST III
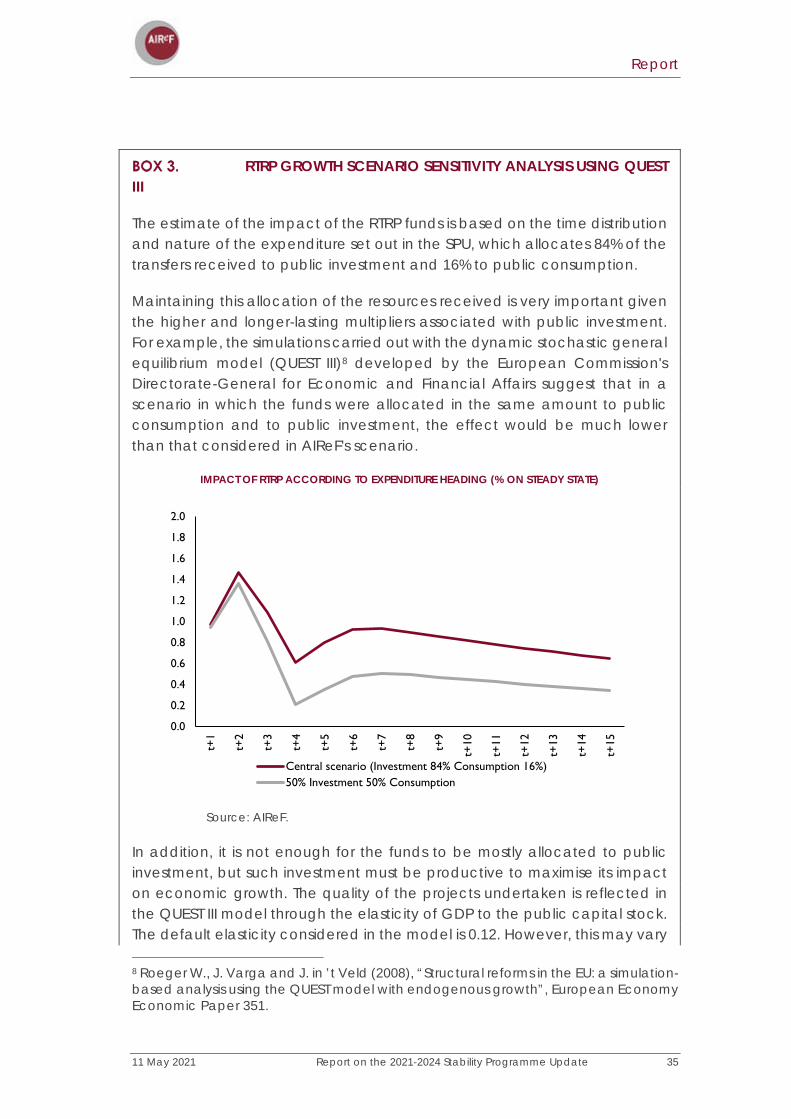
The estimate of the impact of the RTRP funds is based on the time distribution and nature of the expenditure set out in the SPU, which allocates 84% of the transfers received to public investment and 16% to public consumption.
Maintaining this allocation of the resources received is very important given the higher and longer-lasting multipliers associated with public investment. For example, the simulations carried out with the dynamic stochastic general equilibrium model (QUEST III)8 developed by the European Commission's Directorate-General for Economic and Financial Affairs suggest that in a scenario in which the funds were allocated in the same amount to public consumption and to public investment, the effect would be much lower than that considered in AIReF's scenario.
IMPACT OF RTRP ACCORDING TO EXPENDITURE HEADING (% ON STEADY STATE)
Source: AIReF.
In addition, it is not enough for the funds to be mostly allocated to public investment, but such investment must be productive to maximise its impact on economic growth. The quality of the projects undertaken is reflected in the QUEST III model through the elasticity of GDP to the public capital stock. The default elasticity considered in the model is 0.12. However, this may vary
8 Roeger W., J. Varga and J. in ’t Veld (2008), “Structural reforms in the EU: a simulation-based analysis using the QUEST model with endogenous growth”, European Economy Economic Paper 351.
0.0
0.2
0.4
0.6
0.8
1.0
1.2
1.4
1.6
1.8
2.0
t+1
t+2
t+3
t+4
t+5
t+6
t+7
t+8
t+9
t+10
t+11
t+12
t+13
t+14
t+15
Central scenario (Investment 84% Consumption 16%)50% Investment 50% Consumption
Report
36 Report on the 2021-2024 Stability Programme Update 11 May 2021
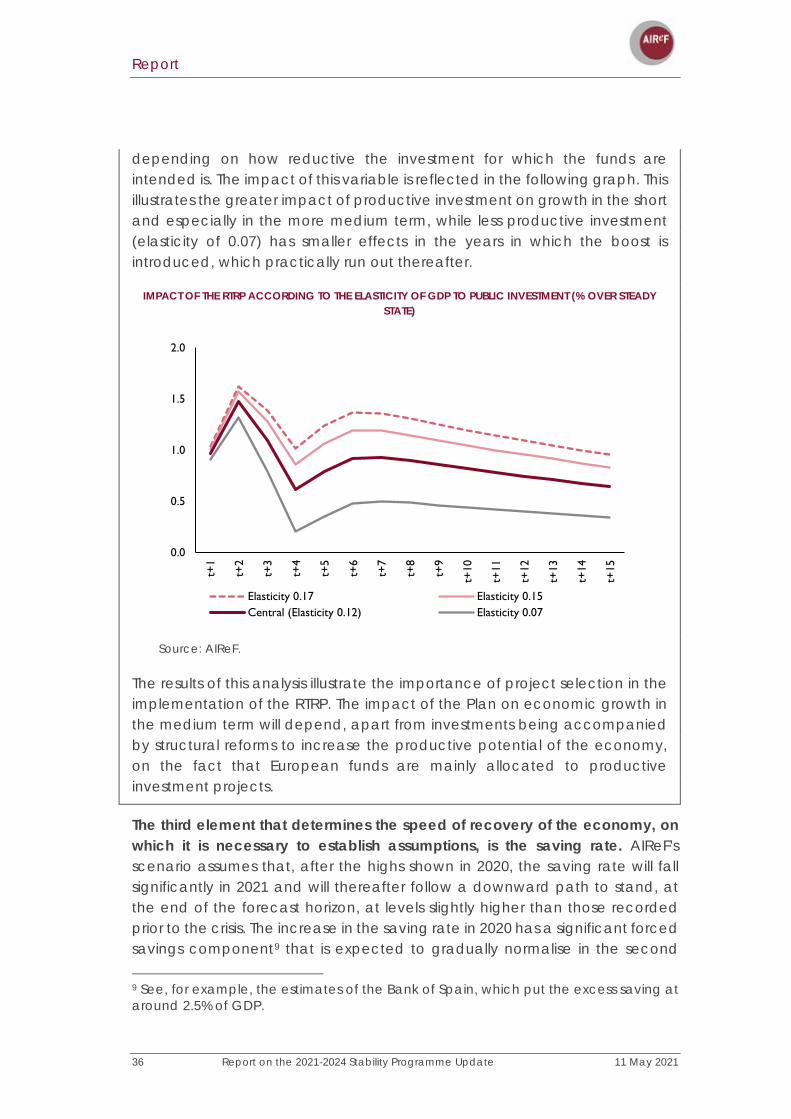
depending on how reductive the investment for which the funds are intended is. The impact of this variable is reflected in the following graph. This illustrates the greater impact of productive investment on growth in the short and especially in the more medium term, while less productive investment (elasticity of 0.07) has smaller effects in the years in which the boost is introduced, which practically run out thereafter.
IMPACT OF THE RTRP ACCORDING TO THE ELASTICITY OF GDP TO PUBLIC INVESTMENT (% OVER STEADY STATE)
Source: AIReF.
The results of this analysis illustrate the importance of project selection in the implementation of the RTRP. The impact of the Plan on economic growth in the medium term will depend, apart from investments being accompanied by structural reforms to increase the productive potential of the economy, on the fact that European funds are mainly allocated to productive investment projects.
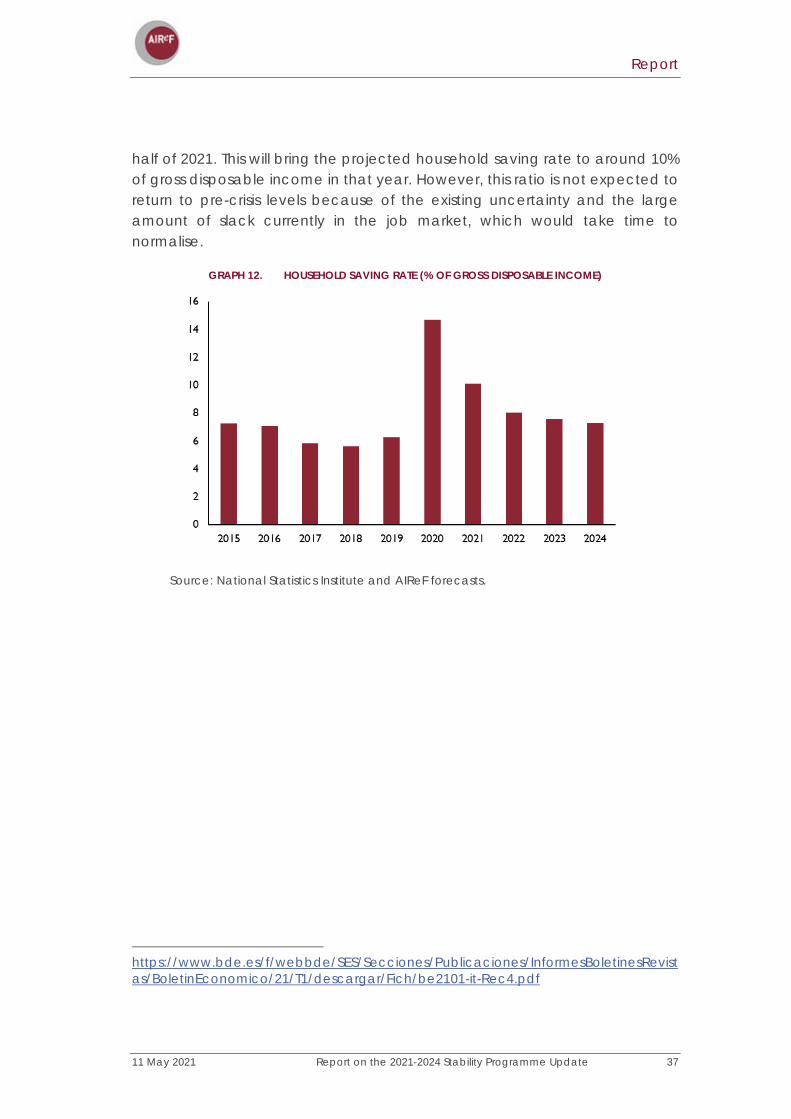
The third element that determines the speed of recovery of the economy, on which it is necessary to establish assumptions, is the saving rate. AIReF's scenario assumes that, after the highs shown in 2020, the saving rate will fall significantly in 2021 and will thereafter follow a downward path to stand, at the end of the forecast horizon, at levels slightly higher than those recorded prior to the crisis. The increase in the saving rate in 2020 has a significant forced savings component9 that is expected to gradually normalise in the second
9 See, for example, the estimates of the Bank of Spain, which put the excess saving at around 2.5% of GDP.
0.0
0.5
1.0
1.5
2.0
t+1
t+2
t+3
t+4
t+5
t+6
t+7
t+8
t+9
t+10
t+11
t+12
t+13
t+14
t+15
Elasticity 0.17 Elasticity 0.15Central (Elasticity 0.12) Elasticity 0.07
Report
11 May 2021 Report on the 2021-2024 Stability Programme Update 37
half of 2021. This will bring the projected household saving rate to around 10% of gross disposable income in that year. However, this ratio is not expected to return to pre-crisis levels because of the existing uncertainty and the large amount of slack currently in the job market, which would take time to normalise.
GRAPH 12. HOUSEHOLD SAVING RATE (% OF GROSS DISPOSABLE INCOME)
Source: National Statistics Institute and AIReF forecasts.
https://www.bde.es/f/webbde/SES/Secciones/Publicaciones/InformesBoletinesRevistas/BoletinEconomico/21/T1/descargar/Fich/be2101-it-Rec4.pdf
Report
38 Report on the 2021-2024 Stability Programme Update 11 May 2021
Ex-ante evaluation of official forecasts
Evaluation summary
Based on its scenarios, AIReF considers that the Government's scenario is feasible. Based on the scenario described in the previous section, AIReF builds uncertainty bands that allow it to assess the degree of realism of the SPU's macroeconomic scenario. These bands suggest that the growth for 2021 and 2024 forecast by the Government is feasible. However, this requires certain conditions to be met.
The first is that advances in the vaccination process or the development of new treatments allow progress to be made in controlling the pandemic, allowing an improvement in confidence and a normalisation of tourist flows. The high estimated growth for 2022 reflects the revival of international tourism which, according to the Government's assumptions, would reach pre-pandemic activity levels by the end of 2022. AIReF believes that this assumption may be somewhat optimistic and puts back the full recovery of tourism to 2023, in line with World Tourism Organization estimates.
The second condition is that the investments set out in the RTRP are implemented as early as the second half of 2021 and that the projects are of sufficient quality to achieve high multiplier effects. In this regard, it is noteworthy that the SPU has little information on the impact of this Plan. It states that, in “aggregate terms, the Plan will result in an additional 2 points of growth and the creation of over 800,000 jobs over the next three years” and that the short-term multipliers are slightly higher than 1 and rise with the forecast horizon. It also states that the Plan will have an impact on potential growth of up to 0.4 pp that could support convergence towards rates slightly higher than the potential rates at the end of the forecast horizon. In AIReF's opinion, this assumption is highly uncertain since the structural reforms accompanying the Plan have yet to be implemented. The speed with which the RTRP funds are implemented, the nature and final quality of the investments, the ability not to substitute, but to attract private investment, and the implementation of the planned structural reforms, mean that the impact of these funds on economic activity in the coming years can vary very significantly.
Report
11 May 2021 Report on the 2021-2024 Stability Programme Update 39
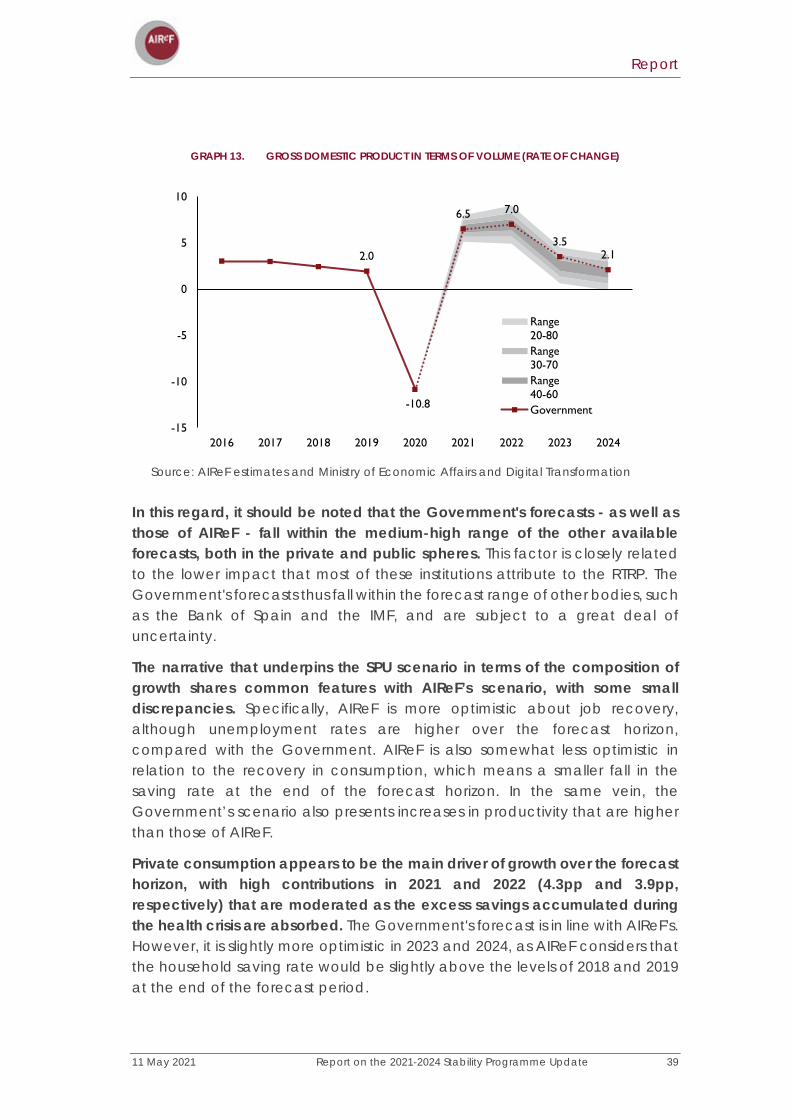
GRAPH 13. GROSS DOMESTIC PRODUCT IN TERMS OF VOLUME (RATE OF CHANGE)
Source: AIReF estimates and Ministry of Economic Affairs and Digital Transformation
In this regard, it should be noted that the Government's forecasts - as well as those of AIReF - fall within the medium-high range of the other available forecasts, both in the private and public spheres. This factor is closely related to the lower impact that most of these institutions attribute to the RTRP. The Government's forecasts thus fall within the forecast range of other bodies, such as the Bank of Spain and the IMF, and are subject to a great deal of uncertainty.
The narrative that underpins the SPU scenario in terms of the composition of growth shares common features with AIReF’s scenario, with some small discrepancies. Specifically, AIReF is more optimistic about job recovery, although unemployment rates are higher over the forecast horizon, compared with the Government. AIReF is also somewhat less optimistic in relation to the recovery in consumption, which means a smaller fall in the saving rate at the end of the forecast horizon. In the same vein, the Government’s scenario also presents increases in productivity that are higher than those of AIReF.
Private consumption appears to be the main driver of growth over the forecast horizon, with high contributions in 2021 and 2022 (4.3pp and 3.9pp, respectively) that are moderated as the excess savings accumulated during the health crisis are absorbed. The Government's forecast is in line with AIReF's. However, it is slightly more optimistic in 2023 and 2024, as AIReF considers that the household saving rate would be slightly above the levels of 2018 and 2019 at the end of the forecast period.
2.0
-10.8
6.5 7.0
3.52.1
-15
-10
-5
0
5
10
2016 2017 2018 2019 2020 2021 2022 2023 2024
Range20-80Range30-70Range40-60Government
Report
40 Report on the 2021-2024 Stability Programme Update 11 May 2021
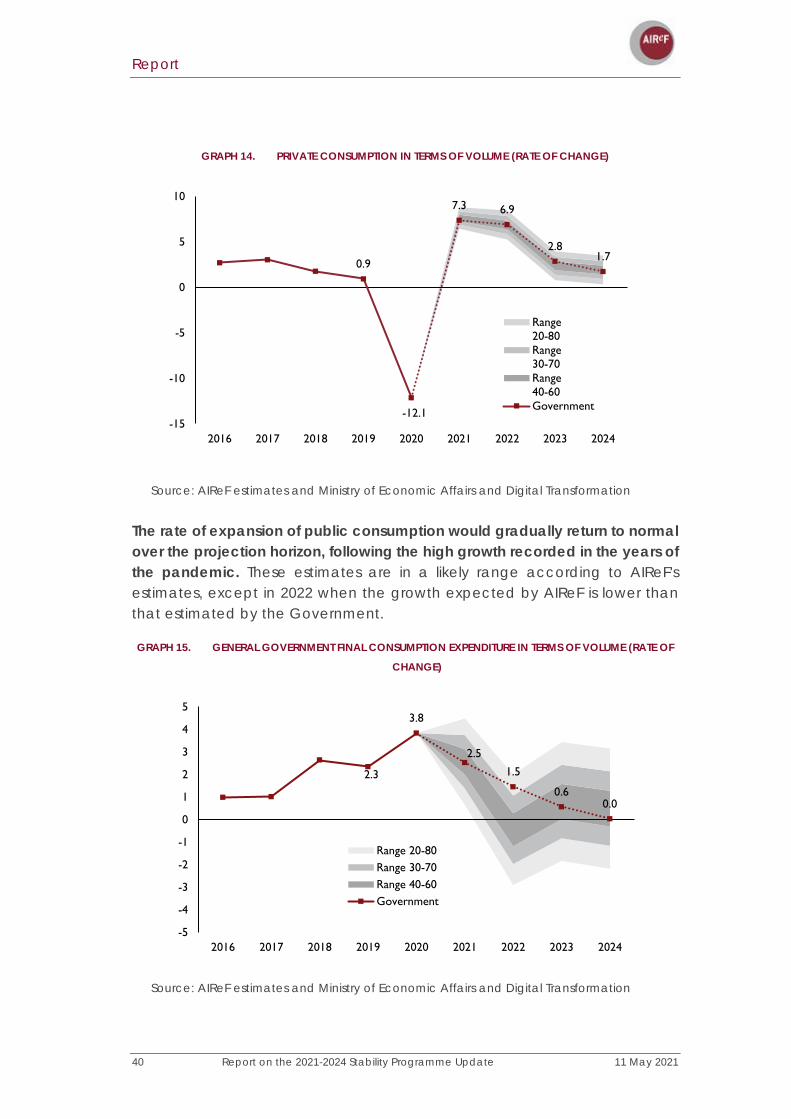
GRAPH 14. PRIVATE CONSUMPTION IN TERMS OF VOLUME (RATE OF CHANGE)
Source: AIReF estimates and Ministry of Economic Affairs and Digital Transformation
The rate of expansion of public consumption would gradually return to normal over the projection horizon, following the high growth recorded in the years of the pandemic. These estimates are in a likely range according to AIReF's estimates, except in 2022 when the growth expected by AIReF is lower than that estimated by the Government.
GRAPH 15. GENERAL GOVERNMENT FINAL CONSUMPTION EXPENDITURE IN TERMS OF VOLUME (RATE OF
CHANGE)
Source: AIReF estimates and Ministry of Economic Affairs and Digital Transformation
0.9
-12.1
7.3 6.9
2.81.7
-15
-10
-5
0
5
10
2016 2017 2018 2019 2020 2021 2022 2023 2024
Range20-80Range30-70Range40-60Government
2.3
3.8
2.5
1.5
0.60.0
-5
-4
-3
-2
-1
0
1
2
3
4
5
2016 2017 2018 2019 2020 2021 2022 2023 2024
Range 20-80Range 30-70Range 40-60Government
Report
11 May 2021 Report on the 2021-2024 Stability Programme Update 41
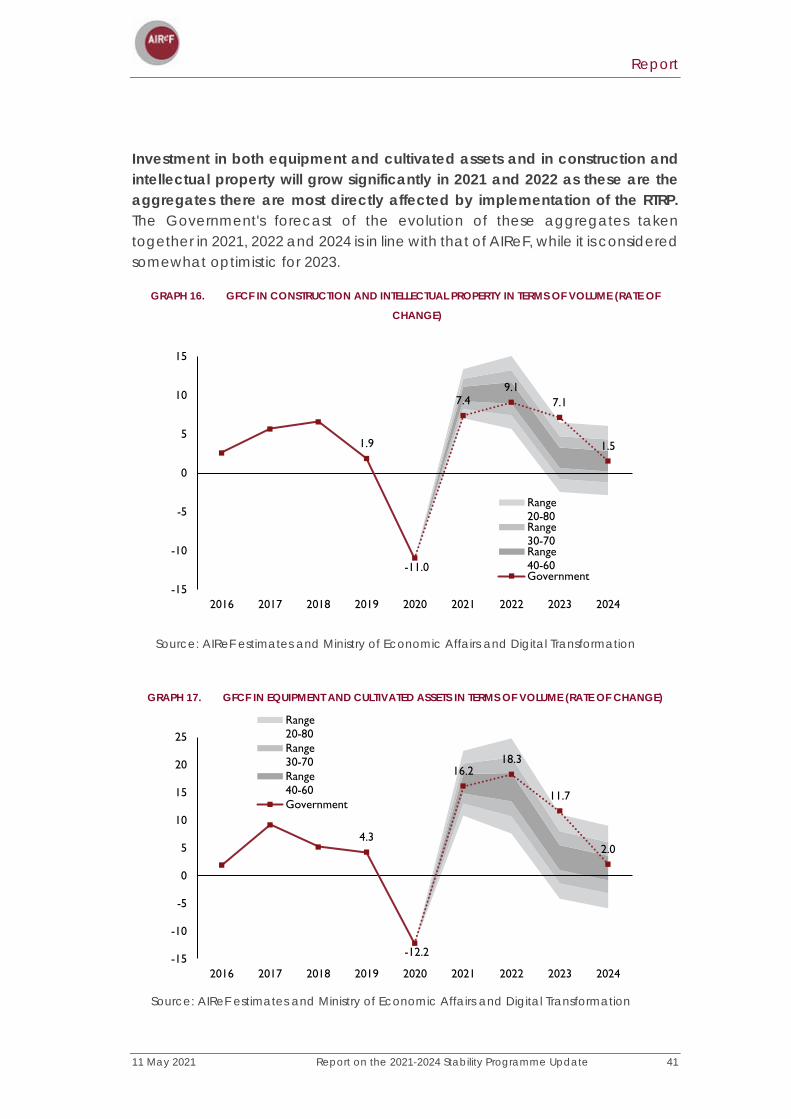
Investment in both equipment and cultivated assets and in construction and intellectual property will grow significantly in 2021 and 2022 as these are the aggregates there are most directly affected by implementation of the RTRP. The Government's forecast of the evolution of these aggregates taken together in 2021, 2022 and 2024 is in line with that of AIReF, while it is considered somewhat optimistic for 2023.
GRAPH 16. GFCF IN CONSTRUCTION AND INTELLECTUAL PROPERTY IN TERMS OF VOLUME (RATE OF
CHANGE)
Source: AIReF estimates and Ministry of Economic Affairs and Digital Transformation
GRAPH 17. GFCF IN EQUIPMENT AND CULTIVATED ASSETS IN TERMS OF VOLUME (RATE OF CHANGE)
Source: AIReF estimates and Ministry of Economic Affairs and Digital Transformation
1.9
-11.0
7.49.1
7.1
1.5
-15
-10
-5
0
5
10
15
2016 2017 2018 2019 2020 2021 2022 2023 2024
Range20-80Range30-70Range40-60Government
4.3
-12.2
16.218.3
11.7
2.0
-15
-10
-5
0
5
10
15
20
25
2016 2017 2018 2019 2020 2021 2022 2023 2024
Range20-80Range30-70Range40-60Government
Report
42 Report on the 2021-2024 Stability Programme Update 11 May 2021
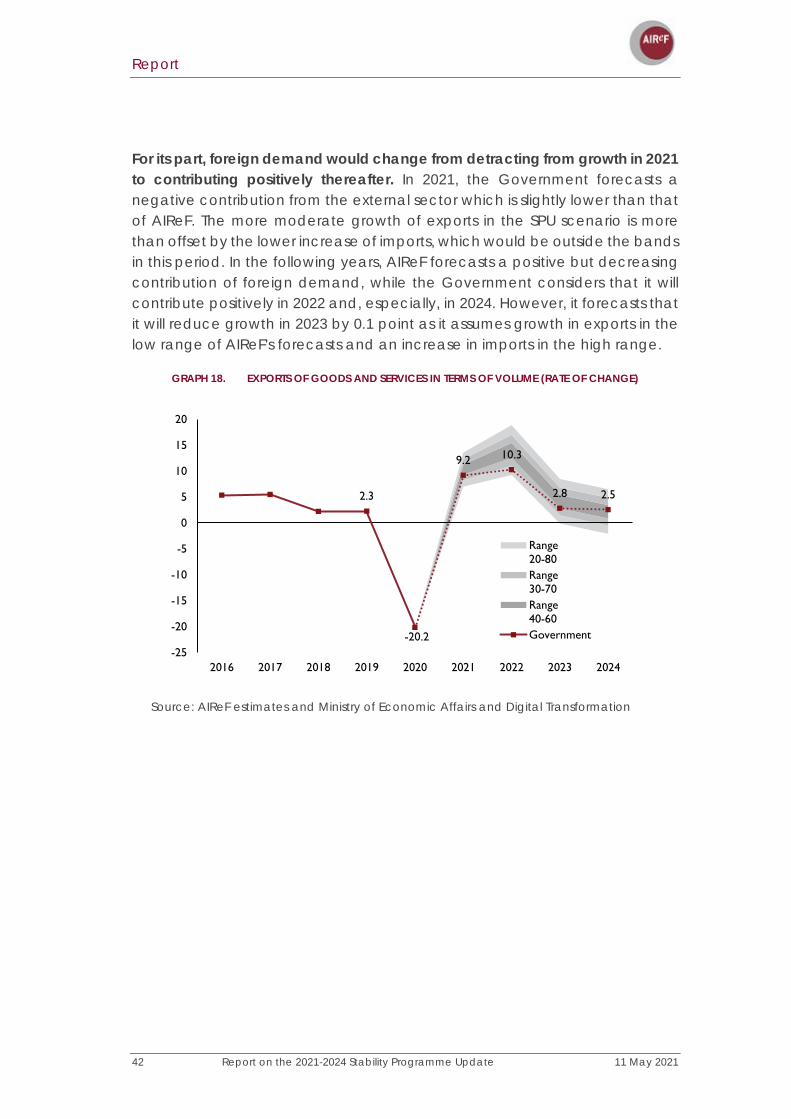
For its part, foreign demand would change from detracting from growth in 2021 to contributing positively thereafter. In 2021, the Government forecasts a negative contribution from the external sector which is slightly lower than that of AIReF. The more moderate growth of exports in the SPU scenario is more than offset by the lower increase of imports, which would be outside the bands in this period. In the following years, AIReF forecasts a positive but decreasing contribution of foreign demand, while the Government considers that it will contribute positively in 2022 and, especially, in 2024. However, it forecasts that it will reduce growth in 2023 by 0.1 point as it assumes growth in exports in the low range of AIReF's forecasts and an increase in imports in the high range.
GRAPH 18. EXPORTS OF GOODS AND SERVICES IN TERMS OF VOLUME (RATE OF CHANGE)
Source: AIReF estimates and Ministry of Economic Affairs and Digital Transformation
2.3
-20.2
9.2 10.3
2.8 2.5
-25
-20
-15
-10
-5
0
5
10
15
20
2016 2017 2018 2019 2020 2021 2022 2023 2024
Range20-80Range30-70Range40-60Government
Report
11 May 2021 Report on the 2021-2024 Stability Programme Update 43
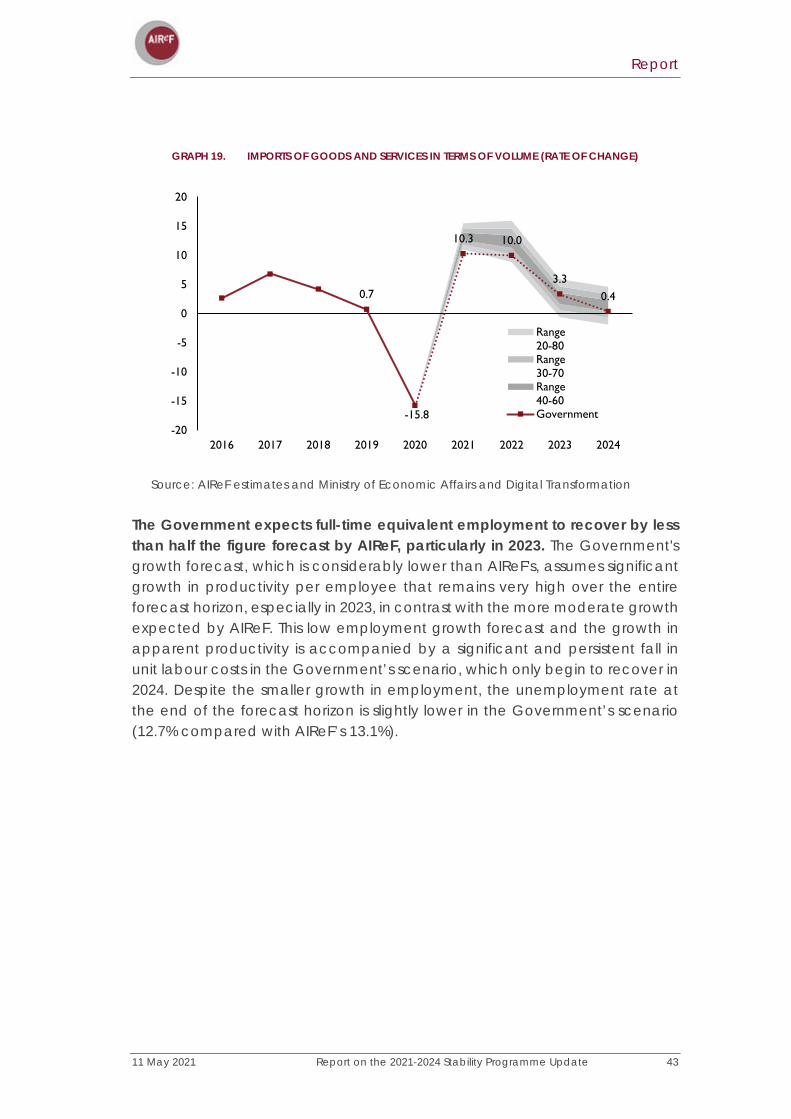
GRAPH 19. IMPORTS OF GOODS AND SERVICES IN TERMS OF VOLUME (RATE OF CHANGE)
Source: AIReF estimates and Ministry of Economic Affairs and Digital Transformation
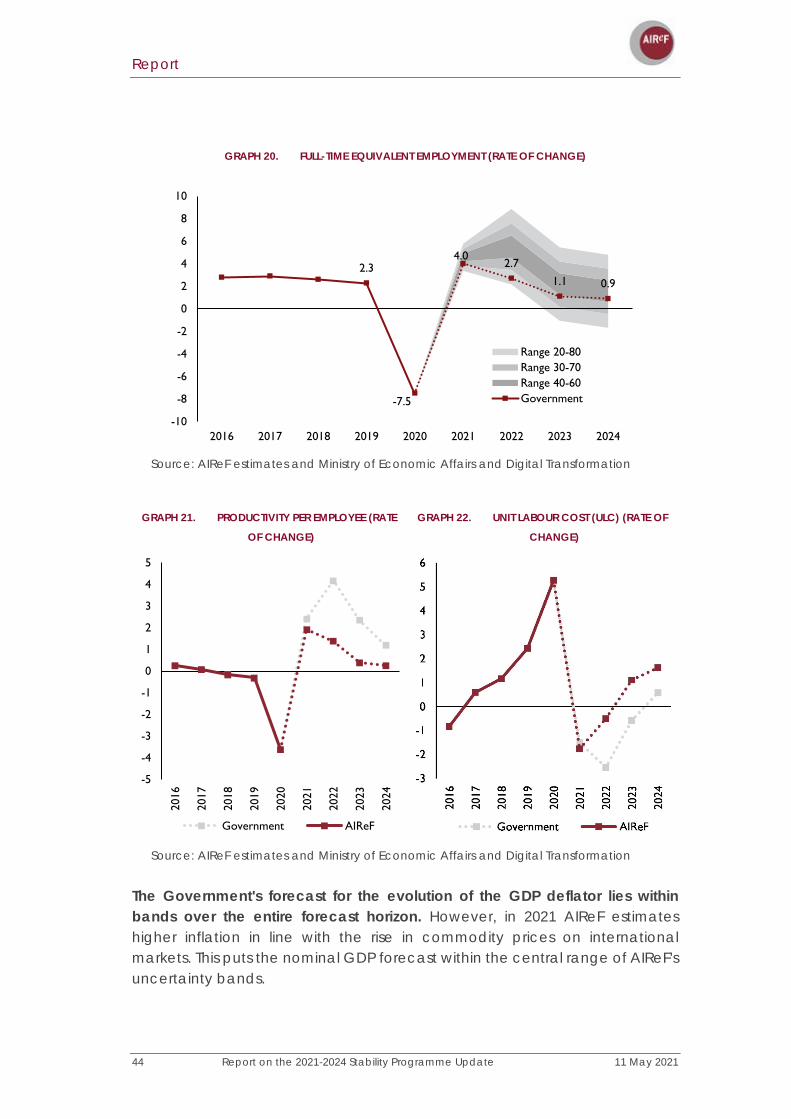
The Government expects full-time equivalent employment to recover by less than half the figure forecast by AIReF, particularly in 2023. The Government's growth forecast, which is considerably lower than AIReF's, assumes significant growth in productivity per employee that remains very high over the entire forecast horizon, especially in 2023, in contrast with the more moderate growth expected by AIReF. This low employment growth forecast and the growth in apparent productivity is accompanied by a significant and persistent fall in unit labour costs in the Government’s scenario, which only begin to recover in 2024. Despite the smaller growth in employment, the unemployment rate at the end of the forecast horizon is slightly lower in the Government’s scenario (12.7% compared with AIReF’s 13.1%).
0.7
-15.8
10.3 10.0
3.30.4
-20
-15
-10
-5
0
5
10
15
20
2016 2017 2018 2019 2020 2021 2022 2023 2024
Range20-80Range30-70Range40-60Government
Report
44 Report on the 2021-2024 Stability Programme Update 11 May 2021
GRAPH 20. FULL-TIME EQUIVALENT EMPLOYMENT (RATE OF CHANGE)
Source: AIReF estimates and Ministry of Economic Affairs and Digital Transformation
GRAPH 21. PRODUCTIVITY PER EMPLOYEE (RATE
OF CHANGE)
GRAPH 22. UNIT LABOUR COST (ULC) (RATE OF
CHANGE)
Source: AIReF estimates and Ministry of Economic Affairs and Digital Transformation
The Government's forecast for the evolution of the GDP deflator lies within bands over the entire forecast horizon. However, in 2021 AIReF estimates higher inflation in line with the rise in commodity prices on international markets. This puts the nominal GDP forecast within the central range of AIReF's uncertainty bands.
2.3
-7.5
4.02.7
1.1 0.9
-10
-8
-6
-4
-2
0
2
4
6
8
10
2016 2017 2018 2019 2020 2021 2022 2023 2024
Range 20-80Range 30-70Range 40-60Government
-5
-4
-3
-2
-1
0
1
2
3
4
5
2016
2017
2018
2019
2020
2021
2022
2023
2024
Government AIReF
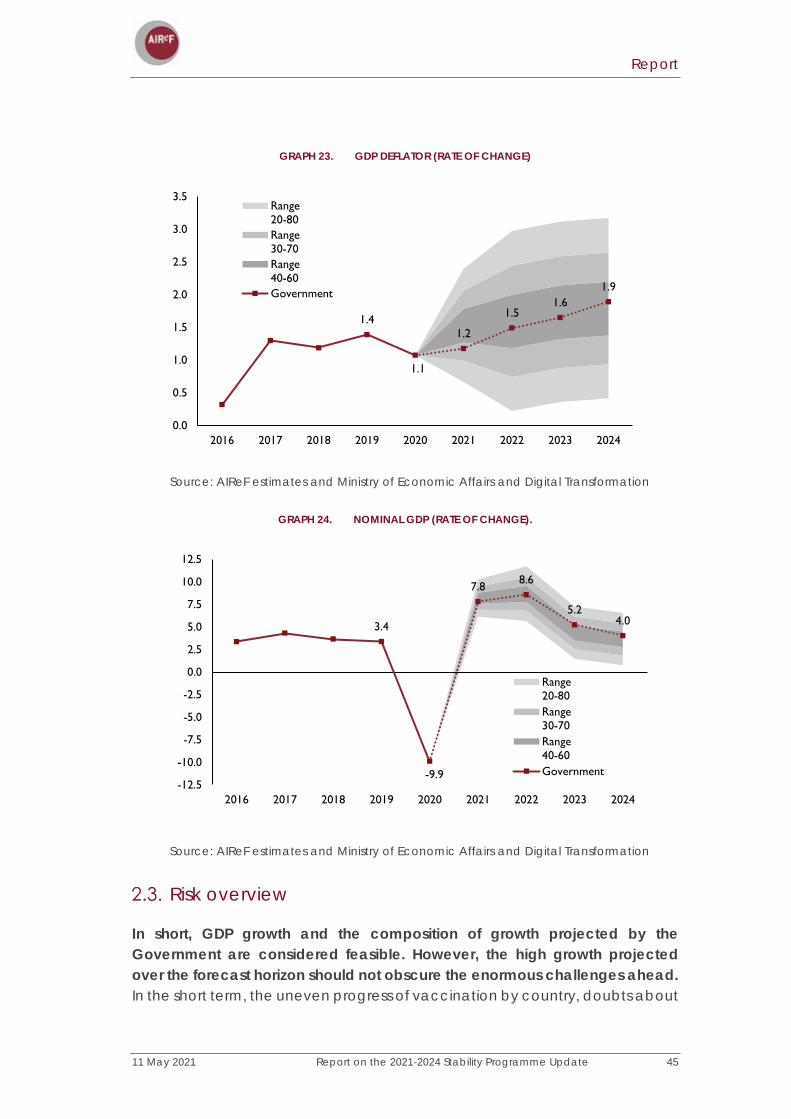
Report
11 May 2021 Report on the 2021-2024 Stability Programme Update 45
GRAPH 23. GDP DEFLATOR (RATE OF CHANGE)
Source: AIReF estimates and Ministry of Economic Affairs and Digital Transformation
GRAPH 24. NOMINAL GDP (RATE OF CHANGE).
Source: AIReF estimates and Ministry of Economic Affairs and Digital Transformation
Risk overview
In short, GDP growth and the composition of growth projected by the Government are considered feasible. However, the high growth projected over the forecast horizon should not obscure the enormous challenges ahead. In the short term, the uneven progress of vaccination by country, doubts about
1.4
1.1
1.2
1.51.6
1.9
0.0
0.5
1.0
1.5
2.0
2.5
3.0
3.5
2016 2017 2018 2019 2020 2021 2022 2023 2024
Range20-80Range30-70Range40-60Government
3.4
-9.9
7.8 8.6
5.24.0
-12.5
-10.0
-7.5
-5.0
-2.5
0.0
2.5
5.0
7.5
10.0
12.5
2016 2017 2018 2019 2020 2021 2022 2023 2024
Range20-80Range30-70Range40-60Government
Report
46 Report on the 2021-2024 Stability Programme Update 11 May 2021
the capacity of the vaccines to deal with the new variants or about the vaccination threshold necessary to achieve herd immunity make it difficult to see what level of normality will be achievable after the pandemic. This essentially conditions the recovery of social activities and tourism. The sensitivity of economic growth to the performance of this activity is high, particularly in 2022, when it accounts for around 5 pp of growth.
Although the Government's scenario and AIReF's scenario follow similar growth paths, it should be noted that both are in the upper range of the estimates made by other organisations and institutions. This is mainly because both scenarios incorporate a comparatively high impact of the RTRP in relation to that estimated by other institutions and to that estimated by other countries for their respective recovery plans (Box 2). This highlights the risks surrounding the impact of the RTRP and the need for investments to be of the highest quality so that the Plan may have the expected macroeconomic impact.
The depth of the crisis raises fears of “scarring” effects on the production structure. The Government’s report emphasises the asymmetric V-shaped recovery if the pandemic persists, while the risk of a K-shaped recovery, where some sectors and segments of the population do not participate in the recovery, is not negligible.
On the business side, lower profitability and higher borrowing has put some companies in a vulnerable position. The measures aimed at companies’ liquidity and solvency have contributed to limiting the volume of business bankruptcies (see Box 5 for a comparative analysis of the direct support programmes implemented in Spain and in other peer countries). However, as the crisis persists, the likelihood of liquidity problems becoming solvency difficulties rises, particularly in sectors with greater social interaction where there are still no signs of recovery. According to the Bank of Spain's financial stability report, the percentage of vulnerable companies according to the ratio of net debt to net assets amounts to over 40% in the hospitality sector10.
Also at a household level, there are some segments of the population that have seen their financial fragility increase and that might maintain a more cautious attitude in their spending decisions. Households employed in social industries, among which young people, women and low-skilled people are over-represented, are generally less prepared to cope with the disruption caused by COVID as they have a lower level of financial assets and net
10 Bank of Spain - Publications - Bulletins and journals - Financial Stability Report (bde.es)

Report
11 May 2021 Report on the 2021-2024 Stability Programme Update 47
wealth. In addition, as the pandemic continues, the likelihood that workers affected by an ERTE will leave this situation falls (see Box 4).
Added to this is the recent upward movement in interest rates, which, if consolidated, would lead to a tightening of the borrowing conditions of the economy and increase the cost of debt.

Report
48 Report on the 2021-2024 Stability Programme Update 11 May 2021
MONITORING OF ERTEs THROUGH THE MICRO-DATA OF THE LABOUR FORCE SURVEY
Since the outbreak of COVID-19, one of the main elements of the labour market in many countries has been the extensive use of furlough schemes such as the Expedientes de Regulación Temporal de Empleo (ERTEs). More recently, there has been a downward trend in the number of individuals in this situation, although the situation varies according to the branch of activity or geographical area considered.
THOUSAND PEOPLE UNDER ERTEs
Source: National Statistics Institute and prepared by AIReF.
To monitor workers under ERTEs, it is important to bear in mind the distinction made in the Labour Force Survey (LFS) between workers under ERTEs that are employed, unemployed and inactive. Therefore, if a person under an ERTE is going to return to work in a period of less than or equal to three months or continues to receive remuneration of at least 50% of the wage and is going to return to work in a period of over three months, the person under the ERTE is classified as employed.
In contrast, if the person under the ERTE is unsure about the following elements, they will be classified as unemployed or inactive, depending on their answers to the questions about job seeking in the questionnaire:
whether they will return to work, when they will do so, or they will do so in a period of greater than three months, or
3,552
925
650
0250500750
1,0001,2501,5001,7502,0002,2502,5002,7503,0003,2503,5003,750
3 4 5 6 7 8 9 10 11 12 1 2 3 4
2020 2021
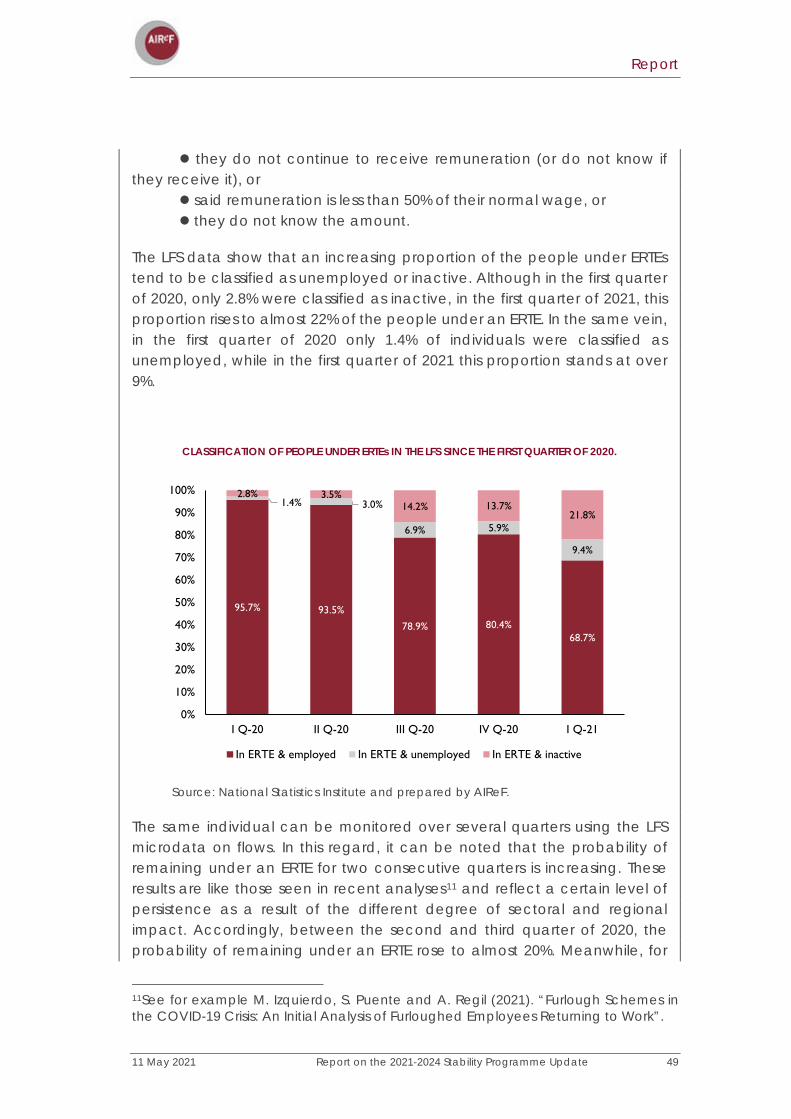
Report
11 May 2021 Report on the 2021-2024 Stability Programme Update 49
they do not continue to receive remuneration (or do not know if they receive it), or
said remuneration is less than 50% of their normal wage, or they do not know the amount.
The LFS data show that an increasing proportion of the people under ERTEs tend to be classified as unemployed or inactive. Although in the first quarter of 2020, only 2.8% were classified as inactive, in the first quarter of 2021, this proportion rises to almost 22% of the people under an ERTE. In the same vein, in the first quarter of 2020 only 1.4% of individuals were classified as unemployed, while in the first quarter of 2021 this proportion stands at over 9%.
CLASSIFICATION OF PEOPLE UNDER ERTEs IN THE LFS SINCE THE FIRST QUARTER OF 2020.
Source: National Statistics Institute and prepared by AIReF.
The same individual can be monitored over several quarters using the LFS microdata on flows. In this regard, it can be noted that the probability of remaining under an ERTE for two consecutive quarters is increasing. These results are like those seen in recent analyses11 and reflect a certain level of persistence as a result of the different degree of sectoral and regional impact. Accordingly, between the second and third quarter of 2020, the probability of remaining under an ERTE rose to almost 20%. Meanwhile, for
11See for example M. Izquierdo, S. Puente and A. Regil (2021). “Furlough Schemes in the COVID-19 Crisis: An Initial Analysis of Furloughed Employees Returning to Work”.
95.7% 93.5%
78.9% 80.4%68.7%
1.4% 3.0%
6.9% 5.9%
9.4%
2.8% 3.5%14.2% 13.7%
21.8%
0%
10%
20%
30%
40%
50%
60%
70%
80%
90%
100%
I Q-20 II Q-20 III Q-20 IV Q-20 I Q-21
In ERTE & employed In ERTE & unemployed In ERTE & inactive

Report
50 Report on the 2021-2024 Stability Programme Update 11 May 2021
individuals under an ERTE between the third and fourth quarters of 2020 and between the fourth quarter of 2020 and the first quarter of 2021, this probability stands at practically 60%.
PROBABILITIES OF TRANSITION FROM THE STATUS OF BEING UNDER AN ERTE
Source: National Statistics Institute and prepared by AIReF.
Probability of remaining under ERTE Probability of leaving from ERTE to...
0.2 0.2
0.5
0.6
0.0
0.1
0.2
0.3
0.4
0.5
0.6
0.7
0.8
0.9
1.0
2020
Q1-
2020
Q2
2020
Q2-
2020
Q3
2020
Q3-
2020
Q4
2020
Q4-
2021
Q1
0.7 0.7
0.40.3
0.00.0
0.1
0.0
0.1 0.0
0.1
0.1
0.0
0.1
0.2
0.3
0.4
0.5
0.6
0.7
0.8
0.9
1.0
2020
Q1-
2020
Q2
2020
Q2-
2020
Q3
2020
Q3-
2020
Q4
2020
Q4-
2021
Q1
ERTE to Inactivity
ERTE toUnemploymentERTE to Employment
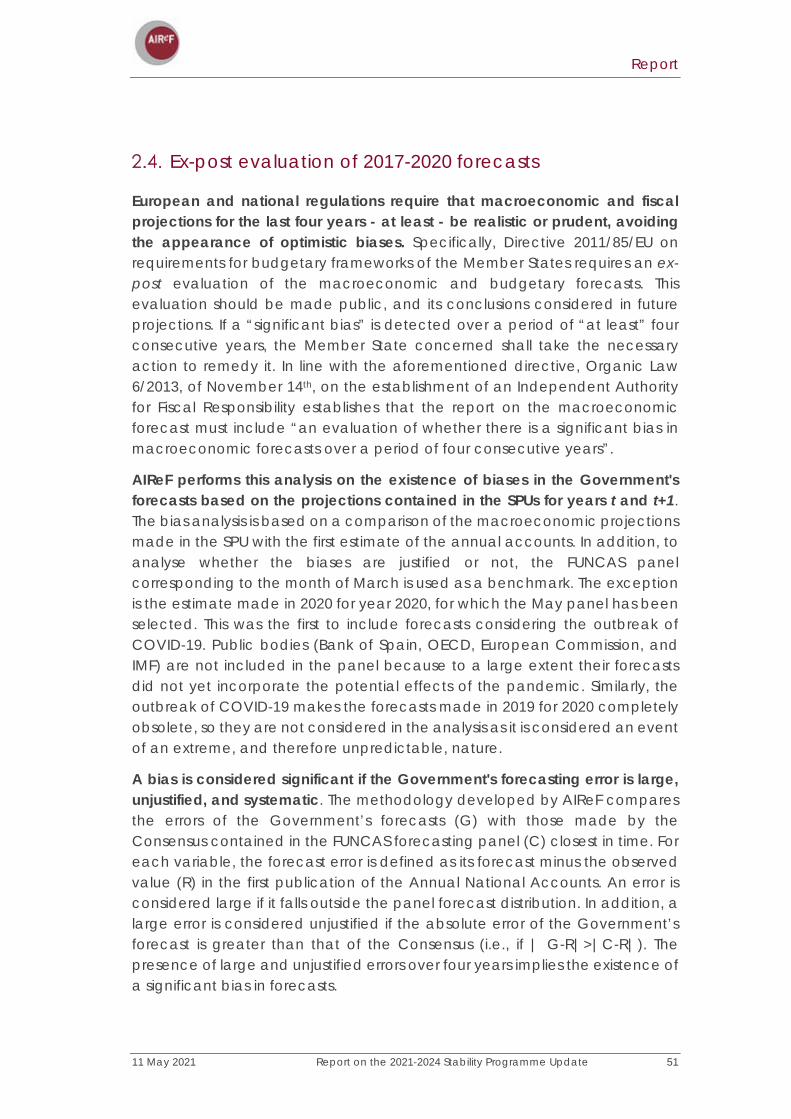
Report
11 May 2021 Report on the 2021-2024 Stability Programme Update 51
Ex-post evaluation of 2017-2020 forecasts
European and national regulations require that macroeconomic and fiscal projections for the last four years - at least - be realistic or prudent, avoiding the appearance of optimistic biases. Specifically, Directive 2011/85/EU on requirements for budgetary frameworks of the Member States requires an ex-post evaluation of the macroeconomic and budgetary forecasts. This evaluation should be made public, and its conclusions considered in future projections. If a “significant bias” is detected over a period of “at least” four consecutive years, the Member State concerned shall take the necessary action to remedy it. In line with the aforementioned directive, Organic Law 6/2013, of November 14th, on the establishment of an Independent Authority for Fiscal Responsibility establishes that the report on the macroeconomic forecast must include “an evaluation of whether there is a significant bias in macroeconomic forecasts over a period of four consecutive years”.
AIReF performs this analysis on the existence of biases in the Government's forecasts based on the projections contained in the SPUs for years t and t+1. The bias analysis is based on a comparison of the macroeconomic projections made in the SPU with the first estimate of the annual accounts. In addition, to analyse whether the biases are justified or not, the FUNCAS panel corresponding to the month of March is used as a benchmark. The exception is the estimate made in 2020 for year 2020, for which the May panel has been selected. This was the first to include forecasts considering the outbreak of COVID-19. Public bodies (Bank of Spain, OECD, European Commission, and IMF) are not included in the panel because to a large extent their forecasts did not yet incorporate the potential effects of the pandemic. Similarly, the outbreak of COVID-19 makes the forecasts made in 2019 for 2020 completely obsolete, so they are not considered in the analysis as it is considered an event of an extreme, and therefore unpredictable, nature.
A bias is considered significant if the Government's forecasting error is large, unjustified, and systematic. The methodology developed by AIReF compares the errors of the Government’s forecasts (G) with those made by the Consensus contained in the FUNCAS forecasting panel (C) closest in time. For each variable, the forecast error is defined as its forecast minus the observed value (R) in the first publication of the Annual National Accounts. An error is considered large if it falls outside the panel forecast distribution. In addition, a large error is considered unjustified if the absolute error of the Government’s forecast is greater than that of the Consensus (i.e., if | G-R|>|C-R|). The presence of large and unjustified errors over four years implies the existence of a significant bias in forecasts.

Report
52 Report on the 2021-2024 Stability Programme Update 11 May 2021
Using AIReF's methodology, the analysis of the Government's macroeconomic forecasts over the last four years shows the absence of significant biases. However, it is important to note the existence of large forecasting errors during three of the four years analysed for various aggregates and balances: gross fixed capital formation, employment, and the balance of the General Government.
As a result of the outbreak of COVID-19, in 2020 there are large and unjustified errors in all components of demand, although these are offset and not noted in the case of GDP. It should be considered that the Government's forecasts made at the end of April are compared with the Funcas Panel in May, which contains greater information on the intensity of the health crisis. As a result, large and unjustified errors occur in all demand aggregates, except GDP, in 2020.
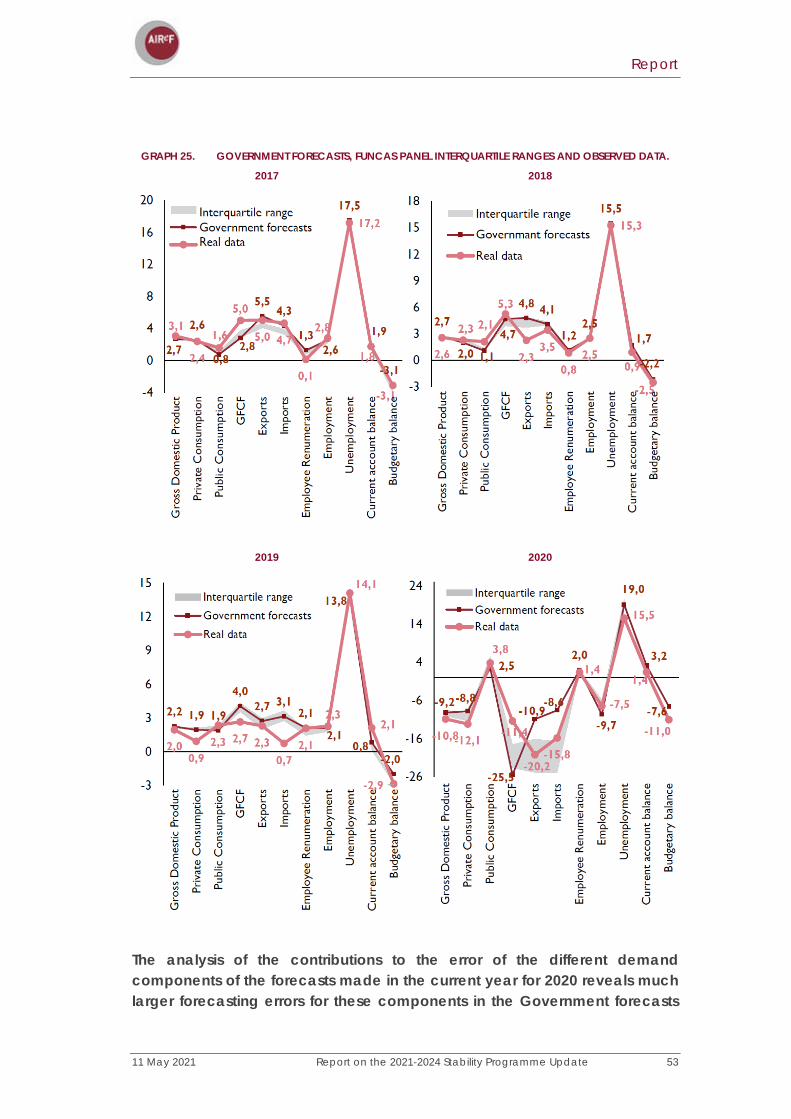
Report
11 May 2021 Report on the 2021-2024 Stability Programme Update 53
GRAPH 25. GOVERNMENT FORECASTS, FUNCAS PANEL INTERQUARTILE RANGES AND OBSERVED DATA.
2017 2018
2019 2020
The analysis of the contributions to the error of the different demand components of the forecasts made in the current year for 2020 reveals much larger forecasting errors for these components in the Government forecasts
2,7
2,6
0,82,8
5,54,3
1,32,6
17,5
1,9
-3,1
3,1
2,4
1,6
5,0
5,0 4,7
0,1
2,8
17,2
1,8
-3,1-4
0
4
8
12
16
20
Gro
ss D
omes
tic P
rodu
ct
Priv
ate
Con
sum
ptio
n
Publ
ic C
onsu
mpt
ion
GFC
F
Expo
rts
Impo
rts
Com
pens
atio
n pe
r em
ploy
ee
Empl
oym
ent
Une
mpl
oym
ent
Cur
rent
acc
ount
bal
ance
Budg
etar
y ba
lanc
e
Interquartile rangeGovernment forecastsReal data
2,7
2,0 1,1
4,7
4,8 4,1
1,22,5
15,5
1,7
-2,22,6
2,3 2,1
5,3
2,33,5
0,82,5
15,3
0,9
-2,5-3
0
3
6
9
12
15
18
Gro
ss D
omes
tic P
rodu
ct
Priv
ate
Con
sum
ptio
n
Publ
ic C
onsu
mpt
ion
GFC
F
Expo
rts
Impo
rts
Com
pens
atio
n pe
r em
ploy
ee
Empl
oym
ent
Une
mpl
oym
ent
Cur
rent
acc
ount
bal
ance
Budg
etar
y ba
lanc
e
Interquartile range
Governmant forecasts
Real data
2,2 1,9 1,9
4,02,7 3,1
2,1
2,1
13,8
0,8-2,0
2,00,9
2,3 2,7 2,30,7
2,1
2,3
14,1
2,1
-2,9-3
0
3
6
9
12
15
Gro
ss D
omes
tic P
rodu
ct
Priv
ate
Con
sum
ptio
n
Publ
ic C
onsu
mpt
ion
GFC
F
Expo
rts
Impo
rts
Com
pens
atio
n pe
r em
ploy
ee
Empl
oym
ent
Une
mpl
oym
ent
Cur
rent
acc
ount
bal
ance
Budg
etar
y ba
lanc
e
Interquartile range
Government forecasts
Real data
-9,2-8,8
2,5
-25,5
-10,9-8,6
2,0
-9,7
19,0
3,2
-7,6
-10,8-12,1
3,8
-11,4
-20,2-15,8
1,4
-7,5
15,5
1,4
-11,0
-26
-16
-6
4
14
24
Gro
ss D
omes
tic P
rodu
ct
Priv
ate
Con
sum
ptio
n
Publ
ic C
onsu
mpt
ion
GFC
F
Expo
rts
Impo
rts
Com
pens
atio
n pe
r em
ploy
ee
Empl
oym
ent
Une
mpl
oym
ent
Cur
rent
acc
ount
bal
ance
Budg
etar
y ba
lanc
e
Interquartile rangeGovernment forecastsReal data

Report
54 Report on the 2021-2024 Stability Programme Update 11 May 2021
than in the panel of experts. However, the error in the GDP forecast has the same value. The largest contributions to the error in the Government’s forecasts are seen in exports, imports, and gross fixed capital formation.
GRAPH 26. CONTRIBUTION OF DEMAND COMPONENT FORECASTING ERRORS TO THE ERROR IN THE GDP
FORECAST
The analysis of biases for the period also reveals that the Government is systematically optimistic in its estimates of public consumption and exports. The optimistic bias in public consumption also leads to an optimistic bias in the General Government deficit.
-0.30.1 0.3
1.6
-0.4
0.1 0.2
1.6
-4
-3
-2
-1
0
1
2
3
4
5
6
7
8
2017 2018 2019 2020
Private consumption Gob Private consumption PanelPublic consumption Gob Public consumption PanelGross fixed capital formation Gob Gross fixed capital formation PanelExports Gob Exports PanelGob Imports Panel ImportsGDP Gob GDP Panel
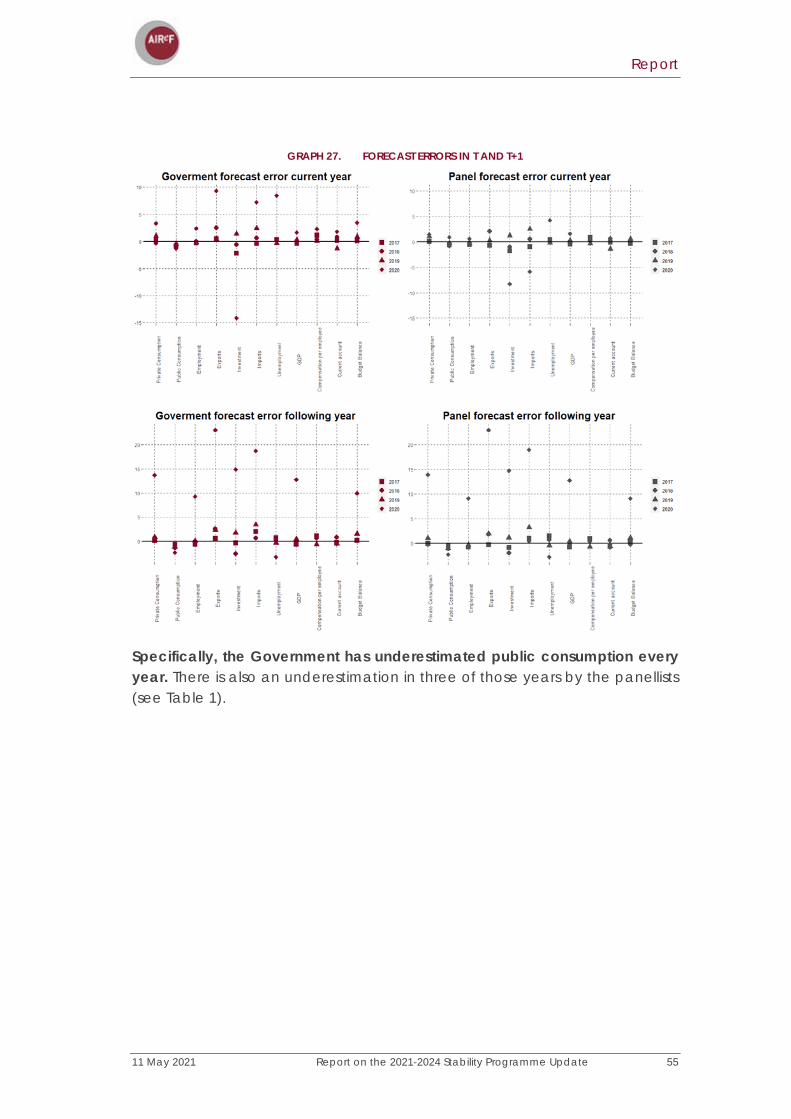
Report
11 May 2021 Report on the 2021-2024 Stability Programme Update 55
GRAPH 27. FORECAST ERRORS IN T AND T+1
Specifically, the Government has underestimated public consumption every year. There is also an underestimation in three of those years by the panellists (see Table 1).
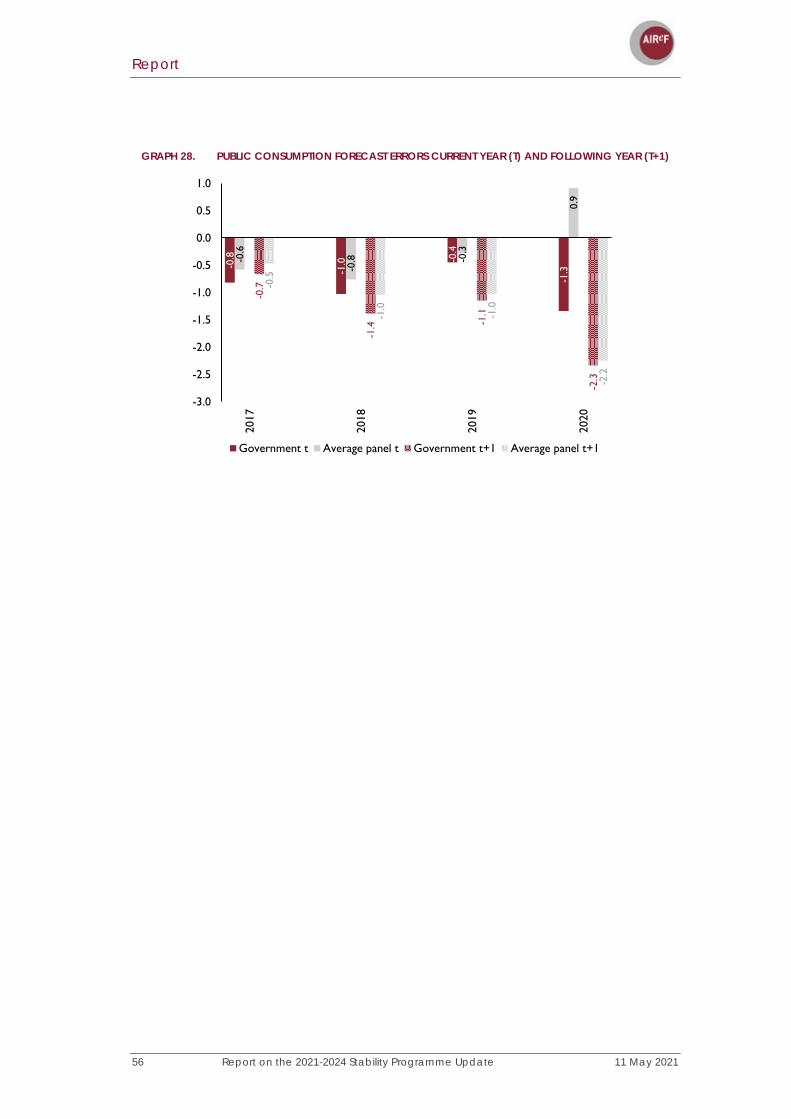
Report
56 Report on the 2021-2024 Stability Programme Update 11 May 2021
GRAPH 28. PUBLIC CONSUMPTION FORECAST ERRORS CURRENT YEAR (T) AND FOLLOWING YEAR (T+1)
-0.8
-1.0 -0
.4
-1.3
-0.6
-0.8 -0
.3
0.9
-0.7
-1.4 -1
.1
-2.3
-0.5
-1.0
-1.0
-2.2
-3.0
-2.5
-2.0
-1.5
-1.0
-0.5
0.0
0.5
1.0
2017
2018
2019
2020
Government t Average panel t Government t+1 Average panel t+1
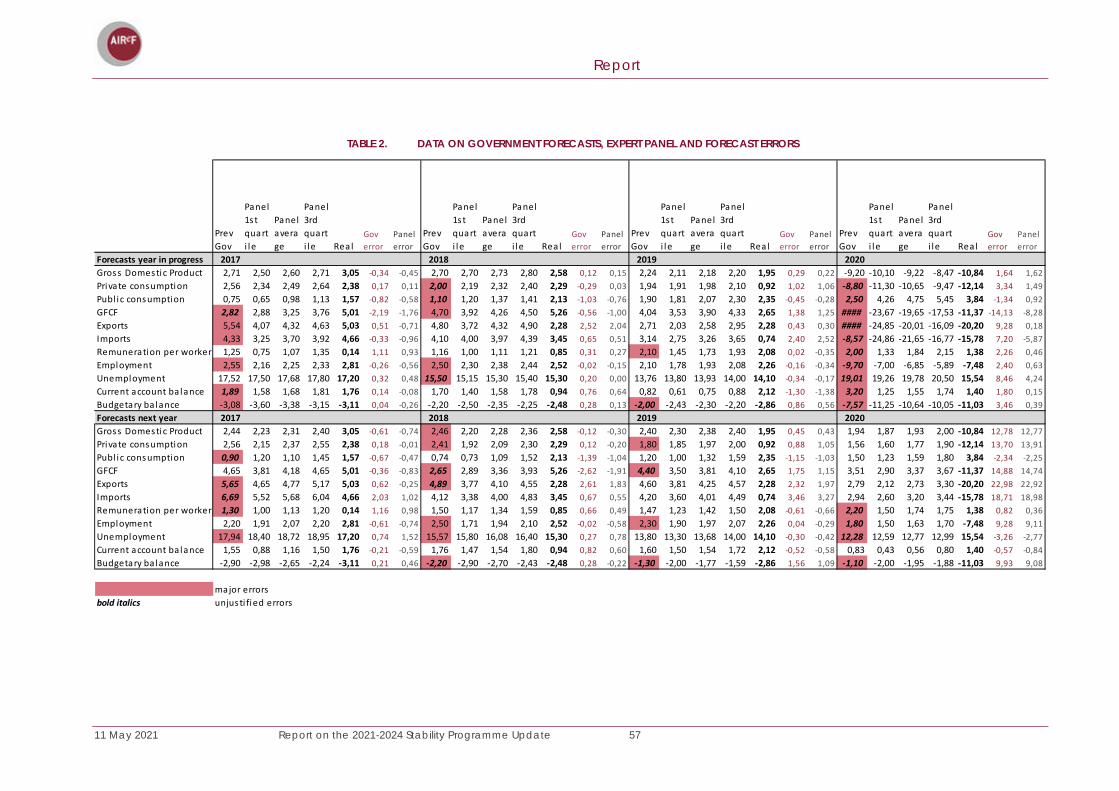
Report
11 May 2021 Report on the 2021-2024 Stability Programme Update 57
TABLE 2. DATA ON GOVERNMENT FORECASTS, EXPERT PANEL AND FORECAST ERRORS
Prev Gov
Panel 1st quarti le
Panel average
Panel 3rd quarti le Real
Gov error
Panel error
Prev Gov
Panel 1st quarti le
Panel average
Panel 3rd quarti le Real
Gov error
Panel error
Prev Gov
Panel 1st quarti le
Panel average
Panel 3rd quarti le Real
Gov error
Panel error
Prev Gov
Panel 1st quarti le
Panel average
Panel 3rd quarti le Real
Gov error
Panel error
Forecasts year in progress 2017 2018 2019 2020Gross Domestic Product 2,71 2,50 2,60 2,71 3,05 -0,34 -0,45 2,70 2,70 2,73 2,80 2,58 0,12 0,15 2,24 2,11 2,18 2,20 1,95 0,29 0,22 -9,20 -10,10 -9,22 -8,47 -10,84 1,64 1,62Private consumption 2,56 2,34 2,49 2,64 2,38 0,17 0,11 2,00 2,19 2,32 2,40 2,29 -0,29 0,03 1,94 1,91 1,98 2,10 0,92 1,02 1,06 -8,80 -11,30 -10,65 -9,47 -12,14 3,34 1,49Publ ic consumption 0,75 0,65 0,98 1,13 1,57 -0,82 -0,58 1,10 1,20 1,37 1,41 2,13 -1,03 -0,76 1,90 1,81 2,07 2,30 2,35 -0,45 -0,28 2,50 4,26 4,75 5,45 3,84 -1,34 0,92GFCF 2,82 2,88 3,25 3,76 5,01 -2,19 -1,76 4,70 3,92 4,26 4,50 5,26 -0,56 -1,00 4,04 3,53 3,90 4,33 2,65 1,38 1,25 #### -23,67 -19,65 -17,53 -11,37 -14,13 -8,28Exports 5,54 4,07 4,32 4,63 5,03 0,51 -0,71 4,80 3,72 4,32 4,90 2,28 2,52 2,04 2,71 2,03 2,58 2,95 2,28 0,43 0,30 #### -24,85 -20,01 -16,09 -20,20 9,28 0,18Imports 4,33 3,25 3,70 3,92 4,66 -0,33 -0,96 4,10 4,00 3,97 4,39 3,45 0,65 0,51 3,14 2,75 3,26 3,65 0,74 2,40 2,52 -8,57 -24,86 -21,65 -16,77 -15,78 7,20 -5,87Remuneration per worker 1,25 0,75 1,07 1,35 0,14 1,11 0,93 1,16 1,00 1,11 1,21 0,85 0,31 0,27 2,10 1,45 1,73 1,93 2,08 0,02 -0,35 2,00 1,33 1,84 2,15 1,38 2,26 0,46Employment 2,55 2,16 2,25 2,33 2,81 -0,26 -0,56 2,50 2,30 2,38 2,44 2,52 -0,02 -0,15 2,10 1,78 1,93 2,08 2,26 -0,16 -0,34 -9,70 -7,00 -6,85 -5,89 -7,48 2,40 0,63Unemployment 17,52 17,50 17,68 17,80 17,20 0,32 0,48 15,50 15,15 15,30 15,40 15,30 0,20 0,00 13,76 13,80 13,93 14,00 14,10 -0,34 -0,17 19,01 19,26 19,78 20,50 15,54 8,46 4,24Current account ba lance 1,89 1,58 1,68 1,81 1,76 0,14 -0,08 1,70 1,40 1,58 1,78 0,94 0,76 0,64 0,82 0,61 0,75 0,88 2,12 -1,30 -1,38 3,20 1,25 1,55 1,74 1,40 1,80 0,15Budgetary ba lance -3,08 -3,60 -3,38 -3,15 -3,11 0,04 -0,26 -2,20 -2,50 -2,35 -2,25 -2,48 0,28 0,13 -2,00 -2,43 -2,30 -2,20 -2,86 0,86 0,56 -7,57 -11,25 -10,64 -10,05 -11,03 3,46 0,39Forecasts next year 2017 2018 2019 2020Gross Domestic Product 2,44 2,23 2,31 2,40 3,05 -0,61 -0,74 2,46 2,20 2,28 2,36 2,58 -0,12 -0,30 2,40 2,30 2,38 2,40 1,95 0,45 0,43 1,94 1,87 1,93 2,00 -10,84 12,78 12,77Private consumption 2,56 2,15 2,37 2,55 2,38 0,18 -0,01 2,41 1,92 2,09 2,30 2,29 0,12 -0,20 1,80 1,85 1,97 2,00 0,92 0,88 1,05 1,56 1,60 1,77 1,90 -12,14 13,70 13,91Publ ic consumption 0,90 1,20 1,10 1,45 1,57 -0,67 -0,47 0,74 0,73 1,09 1,52 2,13 -1,39 -1,04 1,20 1,00 1,32 1,59 2,35 -1,15 -1,03 1,50 1,23 1,59 1,80 3,84 -2,34 -2,25GFCF 4,65 3,81 4,18 4,65 5,01 -0,36 -0,83 2,65 2,89 3,36 3,93 5,26 -2,62 -1,91 4,40 3,50 3,81 4,10 2,65 1,75 1,15 3,51 2,90 3,37 3,67 -11,37 14,88 14,74Exports 5,65 4,65 4,77 5,17 5,03 0,62 -0,25 4,89 3,77 4,10 4,55 2,28 2,61 1,83 4,60 3,81 4,25 4,57 2,28 2,32 1,97 2,79 2,12 2,73 3,30 -20,20 22,98 22,92Imports 6,69 5,52 5,68 6,04 4,66 2,03 1,02 4,12 3,38 4,00 4,83 3,45 0,67 0,55 4,20 3,60 4,01 4,49 0,74 3,46 3,27 2,94 2,60 3,20 3,44 -15,78 18,71 18,98Remuneration per worker 1,30 1,00 1,13 1,20 0,14 1,16 0,98 1,50 1,17 1,34 1,59 0,85 0,66 0,49 1,47 1,23 1,42 1,50 2,08 -0,61 -0,66 2,20 1,50 1,74 1,75 1,38 0,82 0,36Employment 2,20 1,91 2,07 2,20 2,81 -0,61 -0,74 2,50 1,71 1,94 2,10 2,52 -0,02 -0,58 2,30 1,90 1,97 2,07 2,26 0,04 -0,29 1,80 1,50 1,63 1,70 -7,48 9,28 9,11Unemployment 17,94 18,40 18,72 18,95 17,20 0,74 1,52 15,57 15,80 16,08 16,40 15,30 0,27 0,78 13,80 13,30 13,68 14,00 14,10 -0,30 -0,42 12,28 12,59 12,77 12,99 15,54 -3,26 -2,77Current account ba lance 1,55 0,88 1,16 1,50 1,76 -0,21 -0,59 1,76 1,47 1,54 1,80 0,94 0,82 0,60 1,60 1,50 1,54 1,72 2,12 -0,52 -0,58 0,83 0,43 0,56 0,80 1,40 -0,57 -0,84Budgetary ba lance -2,90 -2,98 -2,65 -2,24 -3,11 0,21 0,46 -2,20 -2,90 -2,70 -2,43 -2,48 0,28 -0,22 -1,30 -2,00 -1,77 -1,59 -2,86 1,56 1,09 -1,10 -2,00 -1,95 -1,88 -11,03 9,93 9,08
major errorsbold italics unjusti fied errors


Report
11 May 2021 Report on the 2021-2024 Stability Programme Update 59
DIRECT SUPPORT TO COMPANIES, A COMPARISON WITH EURO AREA COUNTRIES
With the aim of mitigating the effects of the pandemic, the Member States of the euro area have been adopting different fiscal policy measures that share many similarities. In most peer countries, public guarantee schemes have been accompanied by furlough schemes to support employment and measures to support the income of self-employed workers, as well as exemption and deferral systems for certain taxes. In addition, most countries have adopted direct business support programmes, which are discussed in this box. The analysis focuses on expenditure programmes with a direct budgetary impact – such as project grants, investments, or fixed costs. It excludes other measures which, while they indirectly contribute to the future viability of companies affected by the shock, have other priority objectives, such as maintaining employment or providing liquidity.
In most peer countries, the first programmes of direct support for companies were approved when the health crisis broke out, around March and April 2020. Subsidies have since been renewed as the successive waves of the pandemic have come and gone. The most recent support packages were approved in autumn 2020 or early 2021. In addition, in successive schemes the criteria for granting support have been relaxed, with the type of beneficiary companies extended to include larger companies (for example in France and Germany), the maximum support limits raised (as in Portugal and the Netherlands) and the thresholds for losses or fixed costs incurred for accessing the subsidies lowered (as in Germany and the Netherlands). In most euro area countries, the support is still in force today (see Table 1 for eligibility criteria for support).
Table 2 summarises the amounts of the schemes. As can be seen, this support has been designed as partial compensation systems for the losses suffered by companies in relation to the revenue obtained in the comparable period of 2019. Therefore, access to the support in every country has been based on a certain threshold of losses incurred. Another requirement that modulates the amount of support is the size of the company. Beneficiaries were initially mainly self-employed workers and small and medium-sized enterprises. However, as the crisis has continued, access has been given to larger companies. In addition, these benefits have generally been granted with very few associated conditions, both in terms of access to the support itself and in terms of its potential use and subsequent conditions. In most countries, it has been sufficient to demonstrate the loss of income suffered (a simple sworn statement sometimes suffices for this purpose) and the size
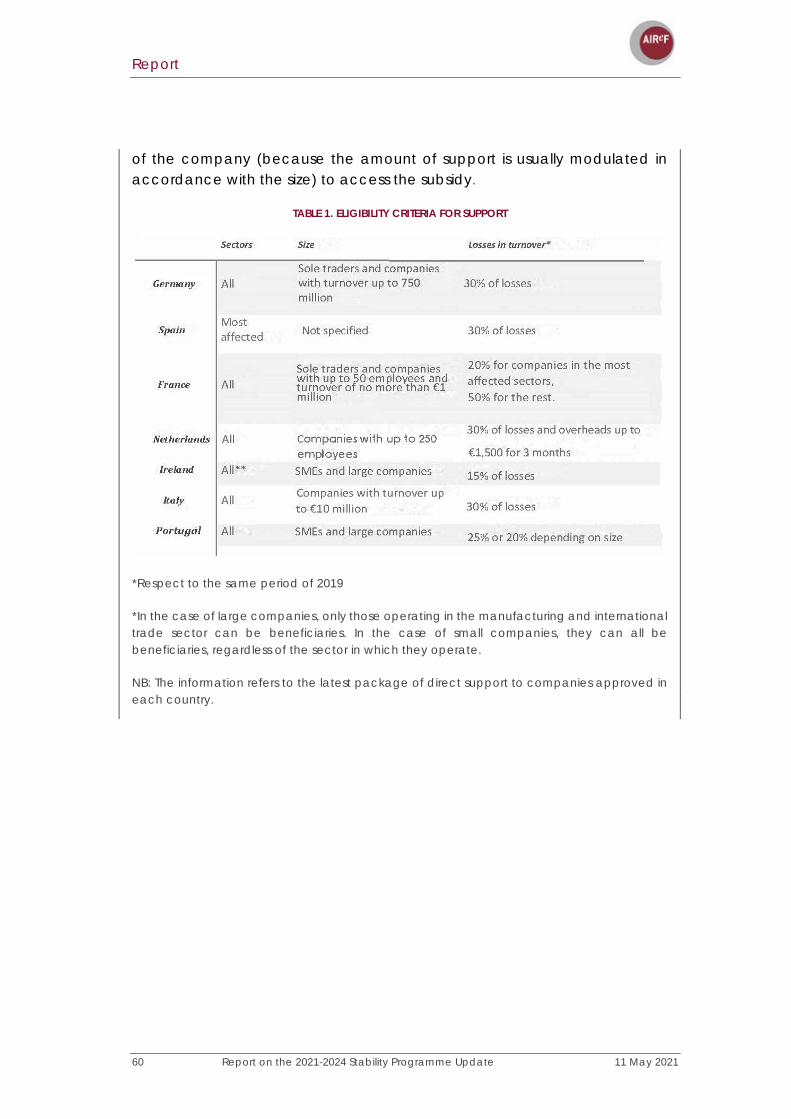
Report
60 Report on the 2021-2024 Stability Programme Update 11 May 2021
of the company (because the amount of support is usually modulated in accordance with the size) to access the subsidy.
TABLE 1. ELIGIBILITY CRITERIA FOR SUPPORT
*Respect to the same period of 2019
*In the case of large companies, only those operating in the manufacturing and international trade sector can be beneficiaries. In the case of small companies, they can all be beneficiaries, regardless of the sector in which they operate.
NB: The information refers to the latest package of direct support to companies approved in each country.

Report
11 May 2021 Report on the 2021-2024 Stability Programme Update 61
TABLE 1. IMPLEMENTATION AND AMOUNT OF THE SUPPORT
According to AIReF's estimates, based on information from the European Commission and published by the analysed countries themselves, the Netherlands has been the country that has allocated the most resources to direct support in relation to its GDP (see Figure 1). The first support programme was approved at the start of the pandemic - the “TOGS” programme - and was aimed at companies in the most affected sectors receiving a single lump sum payment. The successor to that programme was the “TVL”, which is still in place today. This is available to companies in any sector, provided they have suffered more than a 30% loss in turnover compared with 2019. In addition, the amount of the benefit is calculated based on fixed costs and depends on the percentage of losses and the size of the company. These programmes have been supplemented by other specific support schemes for sectors such as horticulture, transport, and culture.
In Germany, it should be noted that, despite being a federal state, direct support to companies has been implemented by the Central Government through the approval of different support packages for specific periods. This has taken place as new restrictions were imposed because of the
Report
62 Report on the 2021-2024 Stability Programme Update 11 May 2021
pandemic. With the first mobility restrictions, the so-called "Soforthilfeprogramme" was adopted, which was followed by three bridge support packages “Überbrückungshilfe I, II and III”. Initially, the support was implemented in the form of fixed payments, but with the bridging support, the benefits were calculated based on the companies’ fixed costs. Regarding the size of the recipient companies, the support began to be allocated to companies with up to 10 employees and with 60% losses in turnover. At this time, however, larger companies can benefit - with a turnover of up to 750 million euros - and losses of up to 30%. As in the Netherlands, the amount to be received by the beneficiary companies is calculated in relation to the fixed costs - which are covered up to a range of 40% to 90% depending on the losses, with a ceiling of €1.5m.
In other countries, such as France, the amount of the benefits has been calculated not based on fixed costs, but rather as a percentage of the losses incurred. In addition, in France, support has been developed around a single package - the Solidarity Fund - which was approved during the first wave of the pandemic and remains in force today. The amounts of the benefit vary depending on whether the companies operate within the most affected sectors - 50% turnover losses with maximum support of €10,000 - or the other sectors - 50% losses with maximum support of €1,500 or 70% losses with maximum support of €10,000. France has also approved support packages for specific sectors, such as the automotive and aeronautical sectors.
Compared with other peer countries, the direct support to companies in Spain was adopted later, one year after the outbreak of the pandemic12. Although its features are like those of the other countries analysed in this box - insofar as the support is modulated according to the loss of income, with a maximum amount depending on size - the access criteria are among the most restrictive as the support is reserved for the most affected sectors.
In addition to possible differences in programme design, the size of the budgetary impact associated with such measures has been very uneven across the countries analysed and ranges from almost 4% of GDP in the Netherlands to 0.2% of GDP in Ireland. Spain’s programme is of a similar size to that of Belgium, Ireland, and Portugal and well below the size of the support in the Netherlands, Germany and, to a lesser extent, France and Italy.
12 The budgetary impact of direct support to companies granted by the Autonomous Regions in 2020 is estimated to stand at between €680m and €730m in total, according to AIReF’s calculations, based on information supplied by the Autonomous Regions themselves.
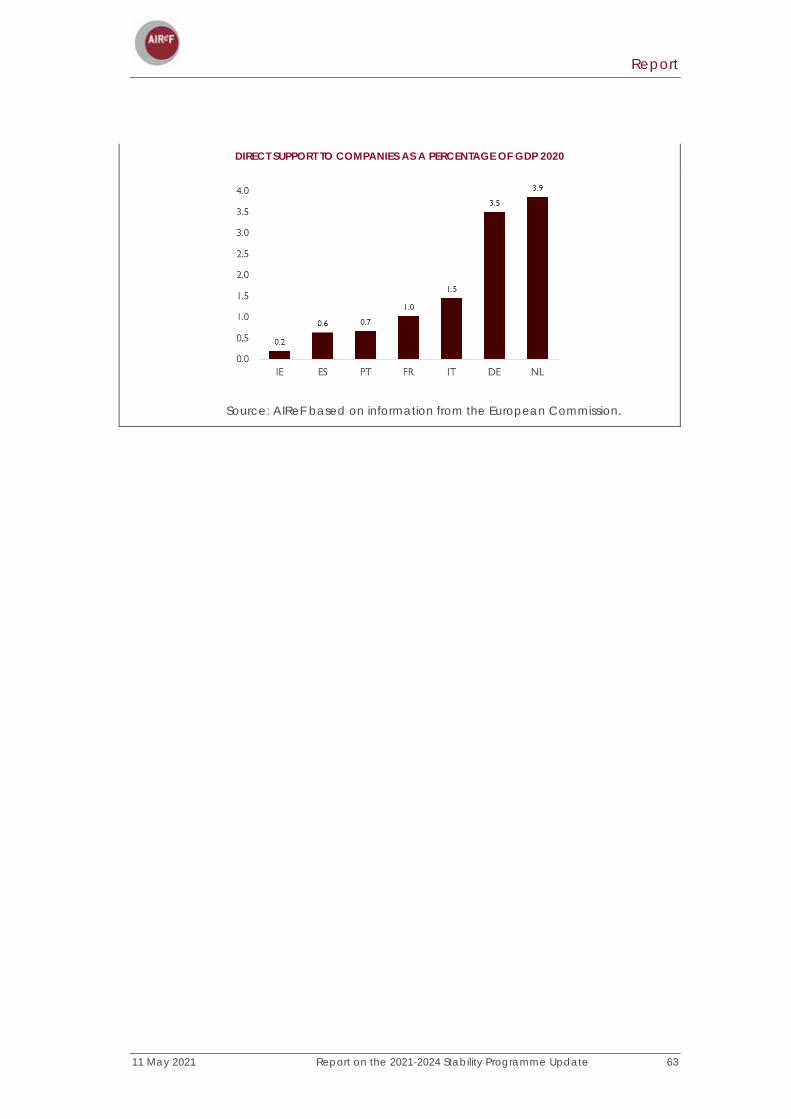
Report
11 May 2021 Report on the 2021-2024 Stability Programme Update 63
DIRECT SUPPORT TO COMPANIES AS A PERCENTAGE OF GDP 2020
Source: AIReF based on information from the European Commission.

11 May 2021 Report on the 2021-2024 Stability Programme Update 65
ANALYSIS OF THE 2021-2024 BUDGETARY SCENARIO
The fiscal strategy set out in the SPU is incomplete both in its scope and in its integration with the RTRP. The scenario set out in the SPU reflects a baseline evolution of revenue and expenditure, that is, without including measures beyond those approved through the 2021 GSB or those recently announced. Although the macroeconomic scenario does include the short-term impact of RTRP investments on economic activity, the SPU does not integrate the outcome of the reforms listed in the RTRP or the structural expenditure increases that may result from investments. This limits the usefulness of the SPU as a fiscal strategy. In addition, at the end of the period the deficit is at levels above those prior to the crisis. Therefore, the SPU should consider a broader time horizon until the deficit is at levels that make it possible to place debt on a sustainable path that is less vulnerable to future challenges.
For its central scenario, AIReF estimates a reduction in the General Government deficit over the period to 3.5% of GDP in 2024, 0.3 points higher than the figure included in the SPU. AIReF's fiscal forecast is less negative than that included in the SPU over the early years, by 0.6 and 0.4 points of GDP in 2021 and 2022, with the fiscal scenario aligned in 2023. The main differences between AIReF's and the Government's estimates are focused on the evolution of expenditure, which is more expansive in the Government's scenario during the first two years and more restrictive at the end, in 2024. Regarding revenue, both paths remain fairly aligned at the start of the period, with a gap of 0.2 points in 2024 as the Government expects more public revenue. Except for 2021, when AIReF expects a larger fall in the deficit, the speed of deficit reduction forecast by AIReF is slower than that of the SPU by between 0.3 and 0.4 points per year.
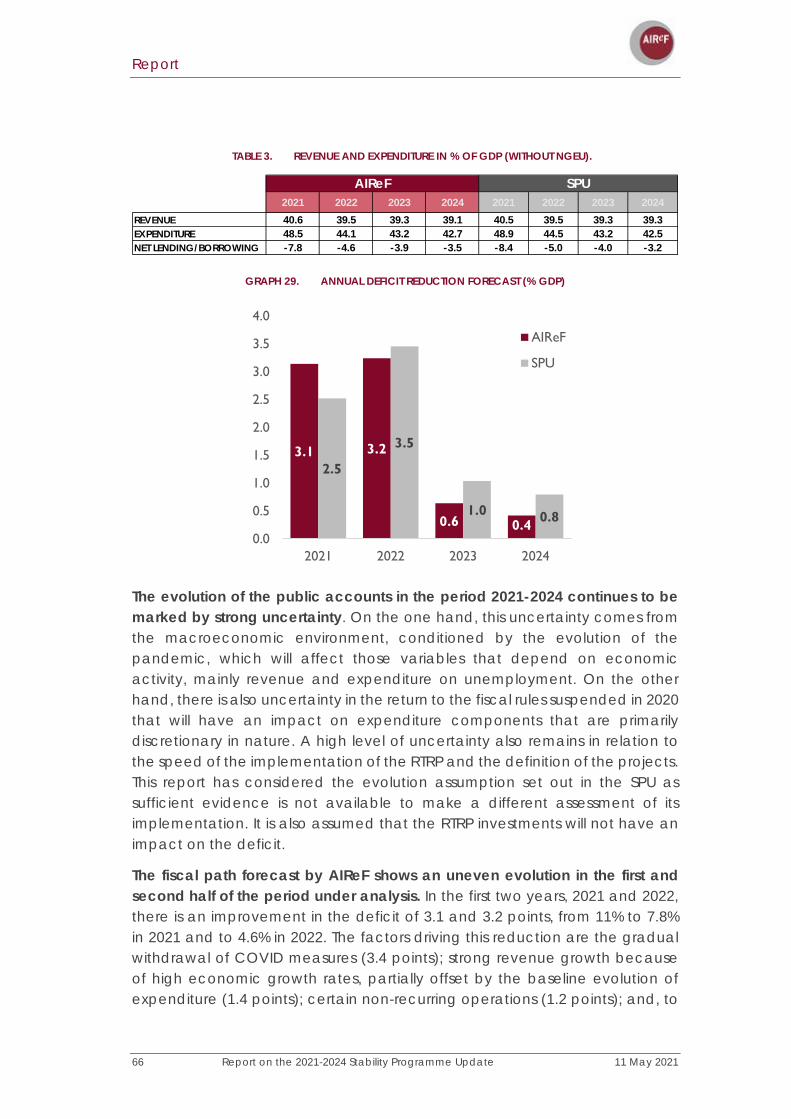
Report
66 Report on the 2021-2024 Stability Programme Update 11 May 2021
TABLE 3. REVENUE AND EXPENDITURE IN % OF GDP (WITHOUT NGEU).
GRAPH 29. ANNUAL DEFICIT REDUCTION FORECAST (% GDP)
The evolution of the public accounts in the period 2021-2024 continues to be marked by strong uncertainty. On the one hand, this uncertainty comes from the macroeconomic environment, conditioned by the evolution of the pandemic, which will affect those variables that depend on economic activity, mainly revenue and expenditure on unemployment. On the other hand, there is also uncertainty in the return to the fiscal rules suspended in 2020 that will have an impact on expenditure components that are primarily discretionary in nature. A high level of uncertainty also remains in relation to the speed of the implementation of the RTRP and the definition of the projects. This report has considered the evolution assumption set out in the SPU as sufficient evidence is not available to make a different assessment of its implementation. It is also assumed that the RTRP investments will not have an impact on the deficit.
The fiscal path forecast by AIReF shows an uneven evolution in the first and second half of the period under analysis. In the first two years, 2021 and 2022, there is an improvement in the deficit of 3.1 and 3.2 points, from 11% to 7.8% in 2021 and to 4.6% in 2022. The factors driving this reduction are the gradual withdrawal of COVID measures (3.4 points); strong revenue growth because of high economic growth rates, partially offset by the baseline evolution of expenditure (1.4 points); certain non-recurring operations (1.2 points); and, to
2021 2022 2023 2024 2021 2022 2023 2024REVENUE 40.6 39.5 39.3 39.1 40.5 39.5 39.3 39.3EXPENDITURE 48.5 44.1 43.2 42.7 48.9 44.5 43.2 42.5NET LENDING/BORROWING -7.8 -4.6 -3.9 -3.5 -8.4 -5.0 -4.0 -3.2
AIReF SPU
3.1 3.2
0.6 0.4
2.5
3.5
1.0 0.80.0
0.5
1.0
1.5
2.0
2.5
3.0
3.5
4.0
2021 2022 2023 2024
AIReF
SPU

Report
11 May 2021 Report on the 2021-2024 Stability Programme Update 67
a lesser extent, revenue growth from the measures included in the 2021 GSB (0.5 points). The second half of the period, with slower growth in activity and a lower level of expenditure linked to the effects of COVID, put the deficit reduction at 0.6 and 0.4 points for 2023 and 2024, respectively, to stand at 3.5% of GDP in 2024.
GRAPH 30. FORECAST EVOLUTION OF THE DEFICIT BY COMPONENT, AIREF (% GDP)
AIReF forecasts that the weight of revenue over GDP, excluding the RTRP, will gradually fall to 39.1% in 2024, slightly less than 0.2 points below the path of the SPU. In both scenarios, they maintain a fairly aligned evolution over the early years, with a gap of 0.2 points of GDP in 2024 since the evolution in the SPU is more optimistic. The dynamics of employee remuneration, private consumption in nominal terms and gross operating surplus (GOS) will have a greater influence on the changes in taxes on income, contributions, and VAT. The different dynamics of these macroeconomic variables largely explain the different forecasts between the revenue expected by AIReF, which are more optimistic, over the first three years, and more conservative at the end of the period. Regarding other revenue, whose evolution is explained by other determining factors that are not so linked to economic activity, AIReF maintains a more conservative scenario than that presented in the SPU throughout the period.
11.0
7.8
4.63.9 3.5
0.9
1.6 0.20.4 0.3
1.8 0.3
1.0 0.10.5
0.3 0.1
0
2
4
6
8
10
12

Report
68 Report on the 2021-2024 Stability Programme Update 11 May 2021
GRAPH 31. FORECAST ANNUAL REDUCTION IN REVENUE (WITHOUT NGEU) (% GDP)
The reduction in revenue as a proportion of GDP is greater in the early years, 0.7 and 1.2 points in 2021 and 2022, which is aligned with that presented by the Government. During the first part of the period, there is still a strong denominator effect, as nominal GDP grows faster than the fiscal variables and the macroeconomic variables underpinning them. This will explain the reduction in revenue as a proportion of GDP, which is softened in the last two years. In 2024, there is a difference of 0.2 points of GDP between AIReF’s scenario and the Government’s, which is largely explained by the different evolution of social contributions forecast, which is more optimistic in the case of the Government.
The weight of expenditure as a proportion of GDP, excluding the RTRP, also falls in AIReF's central scenario, to 42.7% of GDP in 2024, 0.2 points above the figure included in the SPU. A comparison between AIReF's scenario and that of the SPU shows higher expenditure in terms of weight of GDP for the latter over the first two years, in which the fiscal rules are expected to be suspended. An analysis of the main differences by heading reveals that it is cash benefits that show the largest difference as AIReF forecasts expenditure that is 0.4 points lower as a proportion of GDP at the end of the period, followed by interest, for which AIReF expects 0.2 points less. The lower spending on these items is more than offset by the spending on the headings making up public consumption, for which AIReF expects 0.5 points more than the Government, 0.1 points more for investment and 0.2 points more for other expenditure.
0.7
1.2
0.2 0.10.0
0.2
0.4
0.6
0.8
1.0
1.2
2021 2022 2023 2024
AIReF
0.8
1.0
0.2-0.1
-0.2
0.0
0.2
0.4
0.6
0.8
1.0
1.2
2021 2022 2023 2024
SPU
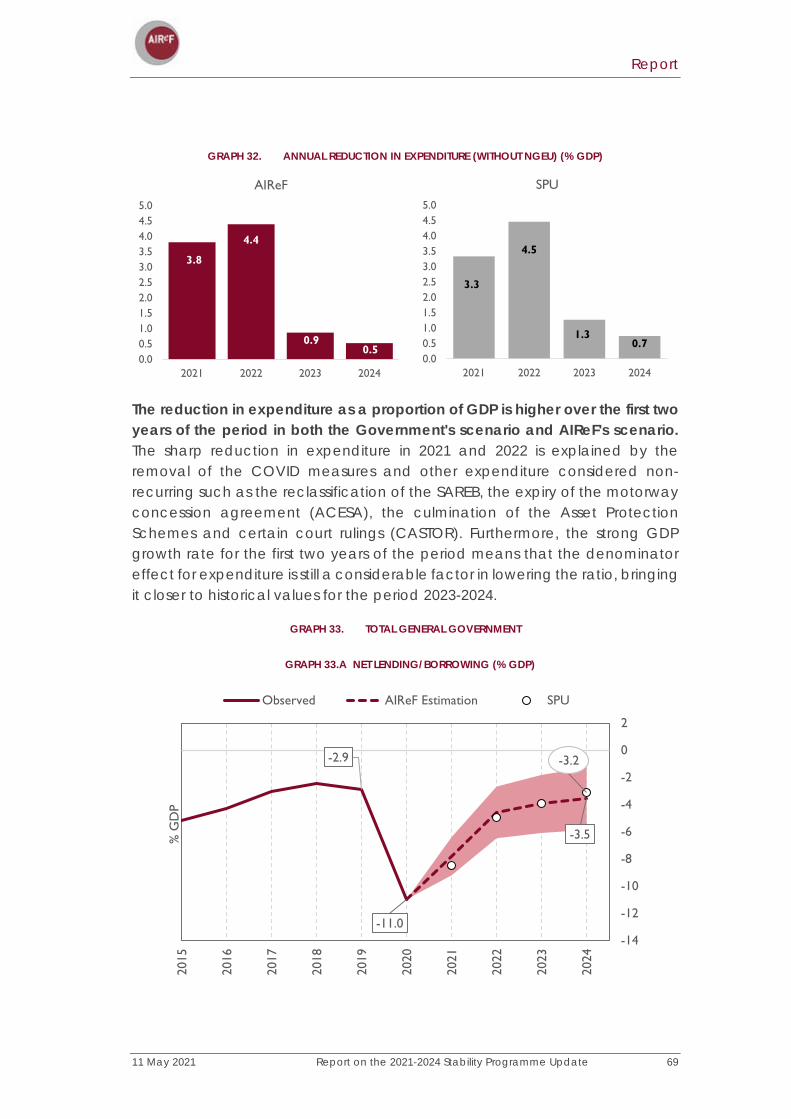
Report
11 May 2021 Report on the 2021-2024 Stability Programme Update 69
GRAPH 32. ANNUAL REDUCTION IN EXPENDITURE (WITHOUT NGEU) (% GDP)
The reduction in expenditure as a proportion of GDP is higher over the first two years of the period in both the Government's scenario and AIReF's scenario. The sharp reduction in expenditure in 2021 and 2022 is explained by the removal of the COVID measures and other expenditure considered non-recurring such as the reclassification of the SAREB, the expiry of the motorway concession agreement (ACESA), the culmination of the Asset Protection Schemes and certain court rulings (CASTOR). Furthermore, the strong GDP growth rate for the first two years of the period means that the denominator effect for expenditure is still a considerable factor in lowering the ratio, bringing it closer to historical values for the period 2023-2024.
GRAPH 33. TOTAL GENERAL GOVERNMENT
GRAPH 33.A NET LENDING/BORROWING (% GDP)
3.8
4.4
0.90.5
0.00.51.01.52.02.53.03.54.04.55.0
2021 2022 2023 2024
AIReF
3.3
4.5
1.30.7
0.00.51.01.52.02.53.03.54.04.55.0
2021 2022 2023 2024
SPU
-2.9
-11.0
-3.5
-3.2
-14
-12
-10
-8
-6
-4
-2
0
2
2015
2016
2017
2018
2019
2020
2021
2022
2023
2024
% G
DP
Observed AIReF Estimation SPU

Report
70 Report on the 2021-2024 Stability Programme Update 11 May 2021
GRAPH 33.B REVENUE (% GDP)
GRAPH 33.C EXPENDITURE (% GDP)
Evolution of General Government revenue
AIReF forecasts that the weight of revenue over GDP will reach 39.1% at the end of the period, 0.2 points less than the projection included in the SPU. If the effect of the NGEU funds is included, the weight would rise by 2.7 points in 2021, 2.1 points in 2022, 1.4 points in 2023 and just over 0.1 points in 2024. Although for the period there are no substantial differences in the weight of total revenue, there are differences in its composition, with a greater weight of tax revenue offset with that of contributions and other revenue.
39.2
41.3
39.1
39.3
34
36
38
40
42
44
46
2015
2016
2017
2018
2019
2020
2021
2022
2023
2024
% G
DP
Observed AIReF Estimation SPU
42.1
52.3
42.7
42.5
35
40
45
50
55
2015
2016
2017
2018
2019
2020
2021
2022
2023
2024
% G
DP
Observed AIReF Estimation SPU
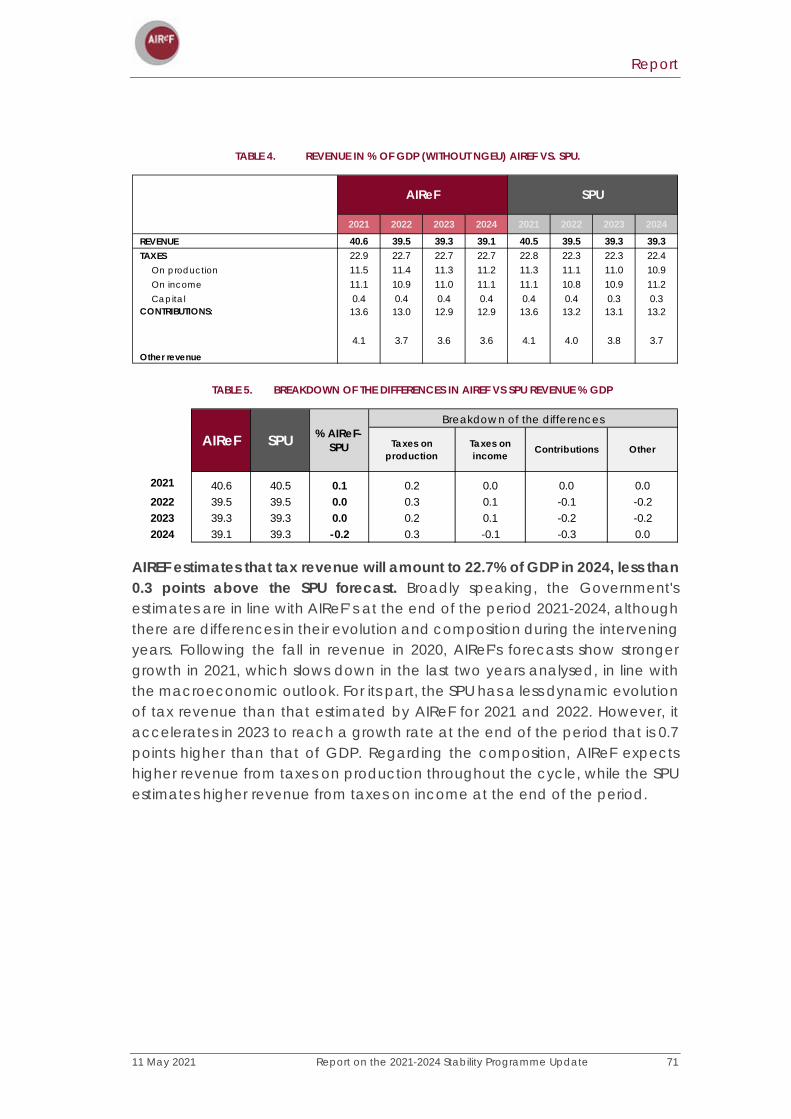
Report
11 May 2021 Report on the 2021-2024 Stability Programme Update 71
TABLE 4. REVENUE IN % OF GDP (WITHOUT NGEU) AIREF VS. SPU.
TABLE 5. BREAKDOWN OF THE DIFFERENCES IN AIREF VS SPU REVENUE % GDP
AIREF estimates that tax revenue will amount to 22.7% of GDP in 2024, less than 0.3 points above the SPU forecast. Broadly speaking, the Government's estimates are in line with AIReF’s at the end of the period 2021-2024, although there are differences in their evolution and composition during the intervening years. Following the fall in revenue in 2020, AIReF's forecasts show stronger growth in 2021, which slows down in the last two years analysed, in line with the macroeconomic outlook. For its part, the SPU has a less dynamic evolution of tax revenue than that estimated by AIReF for 2021 and 2022. However, it accelerates in 2023 to reach a growth rate at the end of the period that is 0.7 points higher than that of GDP. Regarding the composition, AIReF expects higher revenue from taxes on production throughout the cycle, while the SPU estimates higher revenue from taxes on income at the end of the period.
2021 2022 2023 2024 2021 2022 2023 2024REVENUE 40.6 39.5 39.3 39.1 40.5 39.5 39.3 39.3TAXES 22.9 22.7 22.7 22.7 22.8 22.3 22.3 22.4
On production 11.5 11.4 11.3 11.2 11.3 11.1 11.0 10.9On income 11.1 10.9 11.0 11.1 11.1 10.8 10.9 11.2Capital 0.4 0.4 0.4 0.4 0.4 0.4 0.3 0.3
CONTRIBUTIONS: 13.6 13.0 12.9 12.9 13.6 13.2 13.1 13.2
Other revenue4.1 3.7 3.6 3.6 4.1 4.0 3.8 3.7
AIReF SPU
Taxes on production
Taxes on income Contributions Other
2021 40.6 40.5 0.1 0.2 0.0 0.0 0.02022 39.5 39.5 0.0 0.3 0.1 -0.1 -0.22023 39.3 39.3 0.0 0.2 0.1 -0.2 -0.22024 39.1 39.3 -0.2 0.3 -0.1 -0.3 0.0
AIReF SPU % AIReF-SPU
Breakdown of the differences
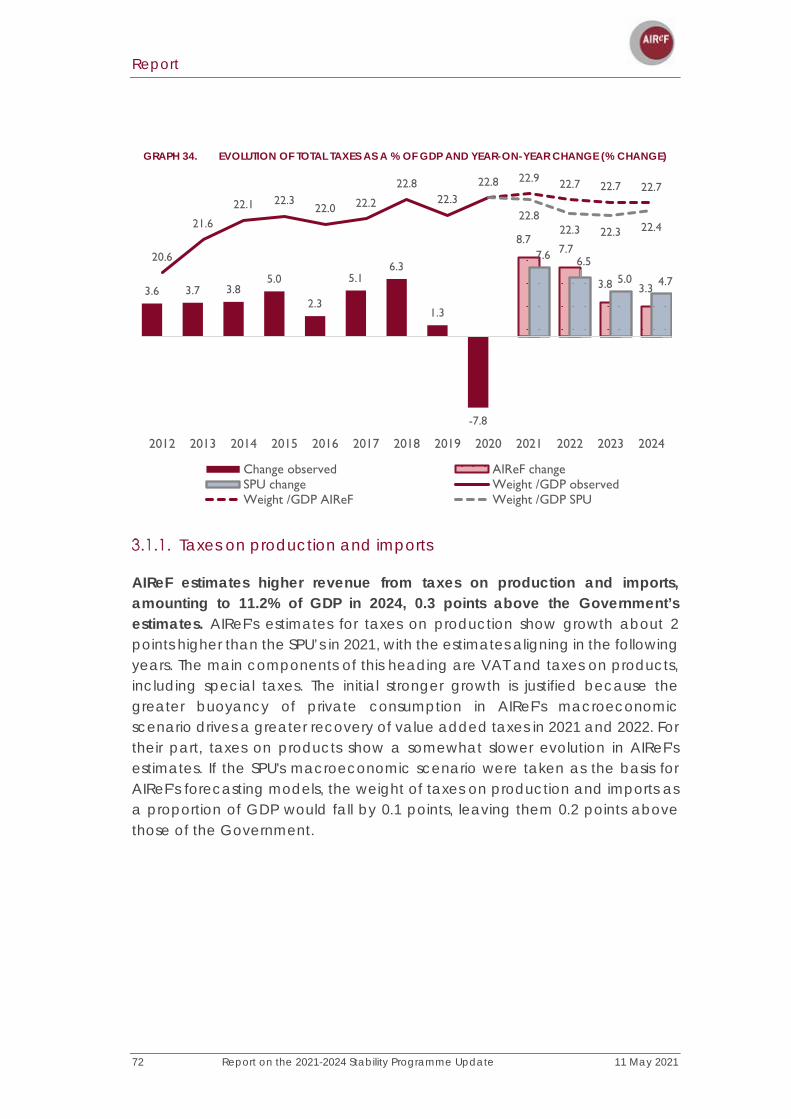
Report
72 Report on the 2021-2024 Stability Programme Update 11 May 2021
GRAPH 34. EVOLUTION OF TOTAL TAXES AS A % OF GDP AND YEAR-ON-YEAR CHANGE (% CHANGE)
Taxes on production and imports
AIReF estimates higher revenue from taxes on production and imports, amounting to 11.2% of GDP in 2024, 0.3 points above the Government’s estimates. AIReF's estimates for taxes on production show growth about 2 points higher than the SPU’s in 2021, with the estimates aligning in the following years. The main components of this heading are VAT and taxes on products, including special taxes. The initial stronger growth is justified because the greater buoyancy of private consumption in AIReF's macroeconomic scenario drives a greater recovery of value added taxes in 2021 and 2022. For their part, taxes on products show a somewhat slower evolution in AIReF's estimates. If the SPU's macroeconomic scenario were taken as the basis for AIReF's forecasting models, the weight of taxes on production and imports as a proportion of GDP would fall by 0.1 points, leaving them 0.2 points above those of the Government.
3.6 3.7 3.85.0
2.3
5.16.3
1.3
-7.8
8.77.7
3.8 3.3
7.6 6.55.0 4.7
20.6
21.6
22.1 22.322.0 22.2
22.822.3
22.8 22.9 22.7 22.7 22.7
22.822.3 22.3 22.4
2012 2013 2014 2015 2016 2017 2018 2019 2020 2021 2022 2023 2024
Change observed AIReF changeSPU change Weight /GDP observedWeight /GDP AIReF Weight /GDP SPU
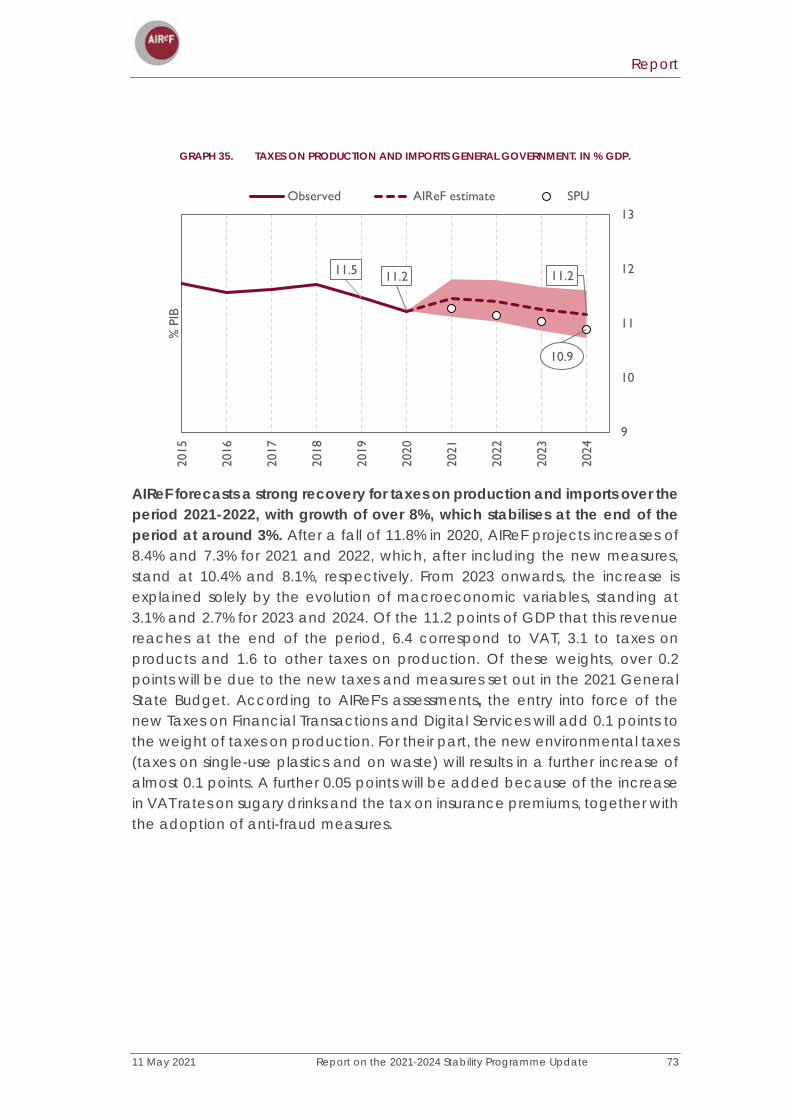
Report
11 May 2021 Report on the 2021-2024 Stability Programme Update 73
GRAPH 35. TAXES ON PRODUCTION AND IMPORTS GENERAL GOVERNMENT. IN % GDP.
AIReF forecasts a strong recovery for taxes on production and imports over the period 2021-2022, with growth of over 8%, which stabilises at the end of the period at around 3%. After a fall of 11.8% in 2020, AIReF projects increases of 8.4% and 7.3% for 2021 and 2022, which, after including the new measures, stand at 10.4% and 8.1%, respectively. From 2023 onwards, the increase is explained solely by the evolution of macroeconomic variables, standing at 3.1% and 2.7% for 2023 and 2024. Of the 11.2 points of GDP that this revenue reaches at the end of the period, 6.4 correspond to VAT, 3.1 to taxes on products and 1.6 to other taxes on production. Of these weights, over 0.2 points will be due to the new taxes and measures set out in the 2021 General State Budget. According to AIReF's assessments, the entry into force of the new Taxes on Financial Transactions and Digital Services will add 0.1 points to the weight of taxes on production. For their part, the new environmental taxes (taxes on single-use plastics and on waste) will results in a further increase of almost 0.1 points. A further 0.05 points will be added because of the increase in VAT rates on sugary drinks and the tax on insurance premiums, together with the adoption of anti-fraud measures.
11.5 11.2 11.2
10.9
9
10
11
12
13
2015
2016
2017
2018
2019
2020
2021
2022
2023
2024
% P
IB
Observed AIReF estimate SPU
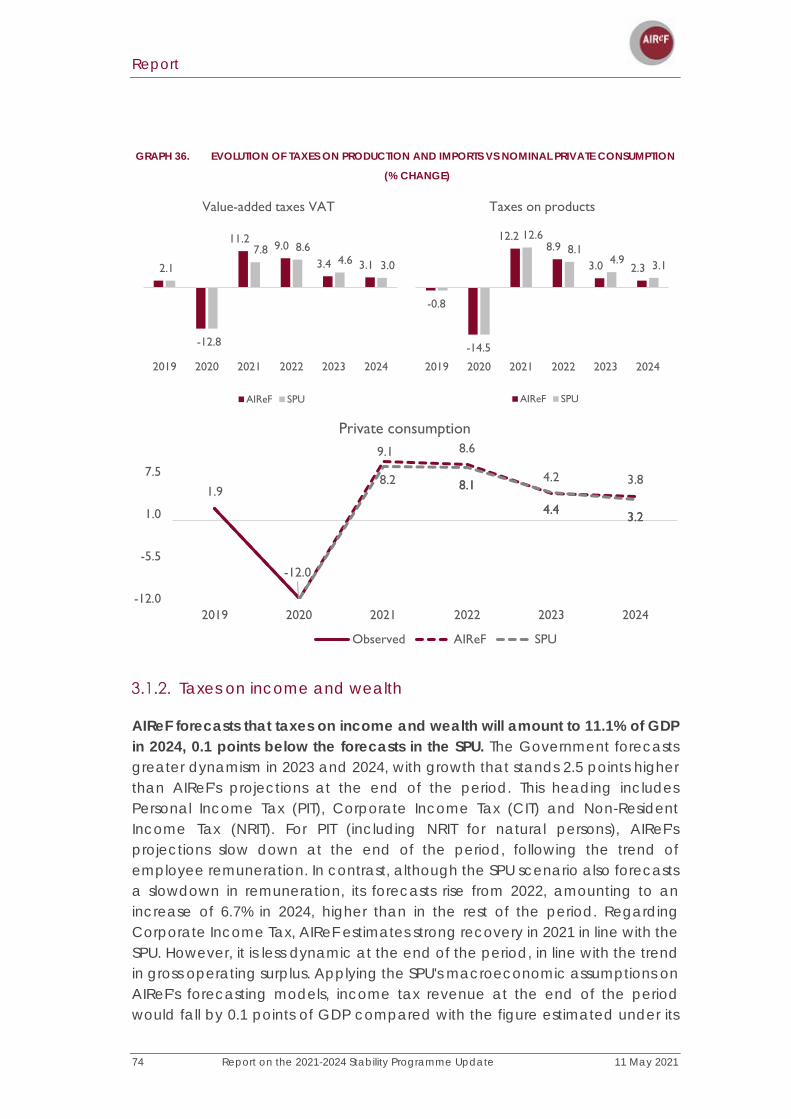
Report
74 Report on the 2021-2024 Stability Programme Update 11 May 2021
GRAPH 36. EVOLUTION OF TAXES ON PRODUCTION AND IMPORTS VS NOMINAL PRIVATE CONSUMPTION
(% CHANGE)
Taxes on income and wealth
AIReF forecasts that taxes on income and wealth will amount to 11.1% of GDP in 2024, 0.1 points below the forecasts in the SPU. The Government forecasts greater dynamism in 2023 and 2024, with growth that stands 2.5 points higher than AIReF's projections at the end of the period. This heading includes Personal Income Tax (PIT), Corporate Income Tax (CIT) and Non-Resident Income Tax (NRIT). For PIT (including NRIT for natural persons), AIReF's projections slow down at the end of the period, following the trend of employee remuneration. In contrast, although the SPU scenario also forecasts a slowdown in remuneration, its forecasts rise from 2022, amounting to an increase of 6.7% in 2024, higher than in the rest of the period. Regarding Corporate Income Tax, AIReF estimates strong recovery in 2021 in line with the SPU. However, it is less dynamic at the end of the period, in line with the trend in gross operating surplus. Applying the SPU's macroeconomic assumptions on AIReF's forecasting models, income tax revenue at the end of the period would fall by 0.1 points of GDP compared with the figure estimated under its
2.1
11.29.0
3.4 3.1
-12.8
7.8 8.64.6 3.0
2019 2020 2021 2022 2023 2024
Value-added taxes VAT
AIReF SPU
8.2 8.1
4.4 3.2
1.9
-12.0
9.1 8.6
4.2 3.88.1
4.4 3.2
-12.0
-5.5
1.0
7.5
2019 2020 2021 2022 2023 2024
Private consumption
Observed AIReF SPU
12.28.9
3.0 2.3
-0.8
-14.5
12.68.1
4.9 3.1
2019 2020 2021 2022 2023 2024
Taxes on products
AIReF SPU

Report
11 May 2021 Report on the 2021-2024 Stability Programme Update 75
own scenario and would be 0.2 points below that presented by the Government.
GRAPH 37. CURRENT INCOME AND WEALTH TAXES GENERAL GOVERNMENT IN % GDP.
AIReF forecasts a gradual decline in the growth of taxes on income from 7.2% in 2021 to 4.4% at the end of the period. After falling by 3% in 2020, the forecasting models estimate baseline growth without measures of 6.7% and 5.7% for 2021 and 2022, respectively. In addition, the valuation of the tax measures approved in the GSB is introduced in 2021, which raises the growth of these taxes to 7.2% and 7.5%. For the remaining years, the estimated growth of this revenue is determined solely based on the evolution of the macroeconomic remuneration variables of employees and gross operating surplus and stands at 5.1% and 4.4% in 2023 and 2024. The weight of revenue from taxes on income at the end of the period stands at 11.1 points of GDP. Of this figure, 8.5 points correspond to PIT (including NRIT for natural persons), 2.4 points correspond to Corporate Income Tax (including NRIT for legal persons) and 0.3 points to other current taxes. According to AIReF's estimates, the tax measures introduced in the 2021 General State Budget represent an increase of 0.2 points of GDP. The increase in PIT rates on the highest incomes and the lowering of the limit of reductions for pension plans will add just under 0.1 points, while limitations in Corporate Income Tax on exemptions on dividends and capital gains will add a further 0.1 points. The remaining, smaller effect will result from the adoption of anti-fraud measures.
10.4
11.2
11.1
11.2
9
10
11
12
13
2015
2016
2017
2018
2019
2020
2021
2022
2023
2024
% G
DP
Observed AIReF Estimation SPU
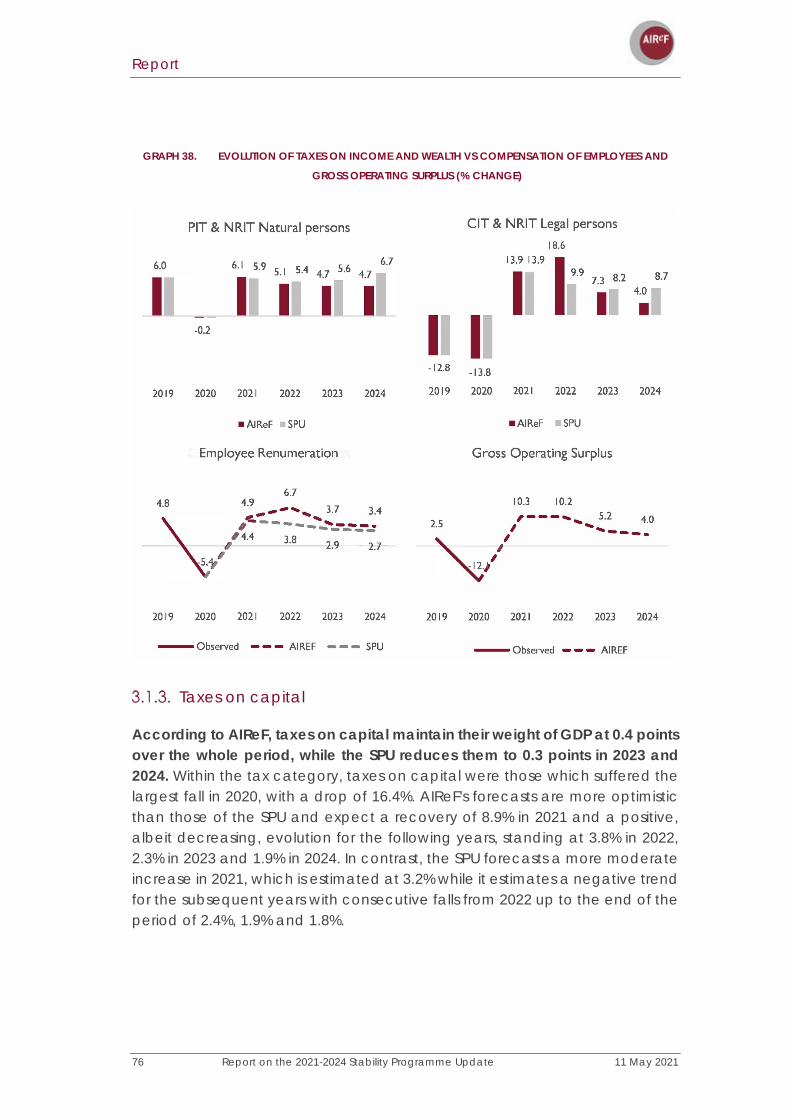
Report
76 Report on the 2021-2024 Stability Programme Update 11 May 2021
GRAPH 38. EVOLUTION OF TAXES ON INCOME AND WEALTH VS COMPENSATION OF EMPLOYEES AND
GROSS OPERATING SURPLUS (% CHANGE)
Taxes on capital
According to AIReF, taxes on capital maintain their weight of GDP at 0.4 points over the whole period, while the SPU reduces them to 0.3 points in 2023 and 2024. Within the tax category, taxes on capital were those which suffered the largest fall in 2020, with a drop of 16.4%. AIReF's forecasts are more optimistic than those of the SPU and expect a recovery of 8.9% in 2021 and a positive, albeit decreasing, evolution for the following years, standing at 3.8% in 2022, 2.3% in 2023 and 1.9% in 2024. In contrast, the SPU forecasts a more moderate increase in 2021, which is estimated at 3.2% while it estimates a negative trend for the subsequent years with consecutive falls from 2022 up to the end of the period of 2.4%, 1.9% and 1.8%.
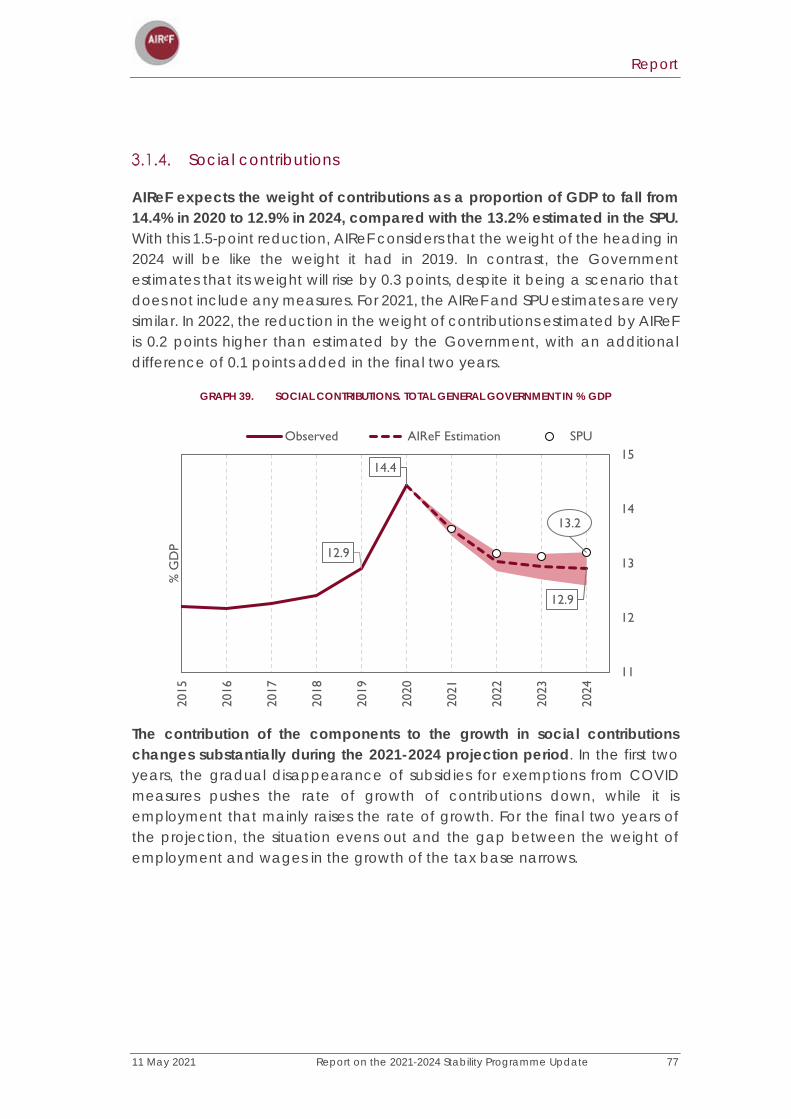
Report
11 May 2021 Report on the 2021-2024 Stability Programme Update 77
Social contributions
AIReF expects the weight of contributions as a proportion of GDP to fall from 14.4% in 2020 to 12.9% in 2024, compared with the 13.2% estimated in the SPU. With this 1.5-point reduction, AIReF considers that the weight of the heading in 2024 will be like the weight it had in 2019. In contrast, the Government estimates that its weight will rise by 0.3 points, despite it being a scenario that does not include any measures. For 2021, the AIReF and SPU estimates are very similar. In 2022, the reduction in the weight of contributions estimated by AIReF is 0.2 points higher than estimated by the Government, with an additional difference of 0.1 points added in the final two years.
GRAPH 39. SOCIAL CONTRIBUTIONS. TOTAL GENERAL GOVERNMENT IN % GDP
The contribution of the components to the growth in social contributions changes substantially during the 2021-2024 projection period. In the first two years, the gradual disappearance of subsidies for exemptions from COVID measures pushes the rate of growth of contributions down, while it is employment that mainly raises the rate of growth. For the final two years of the projection, the situation evens out and the gap between the weight of employment and wages in the growth of the tax base narrows.
12.9
14.4
12.9
13.2
11
12
13
14
15
2015
2016
2017
2018
2019
2020
2021
2022
2023
2024
% G
DP
Observed AIReF Estimation SPU
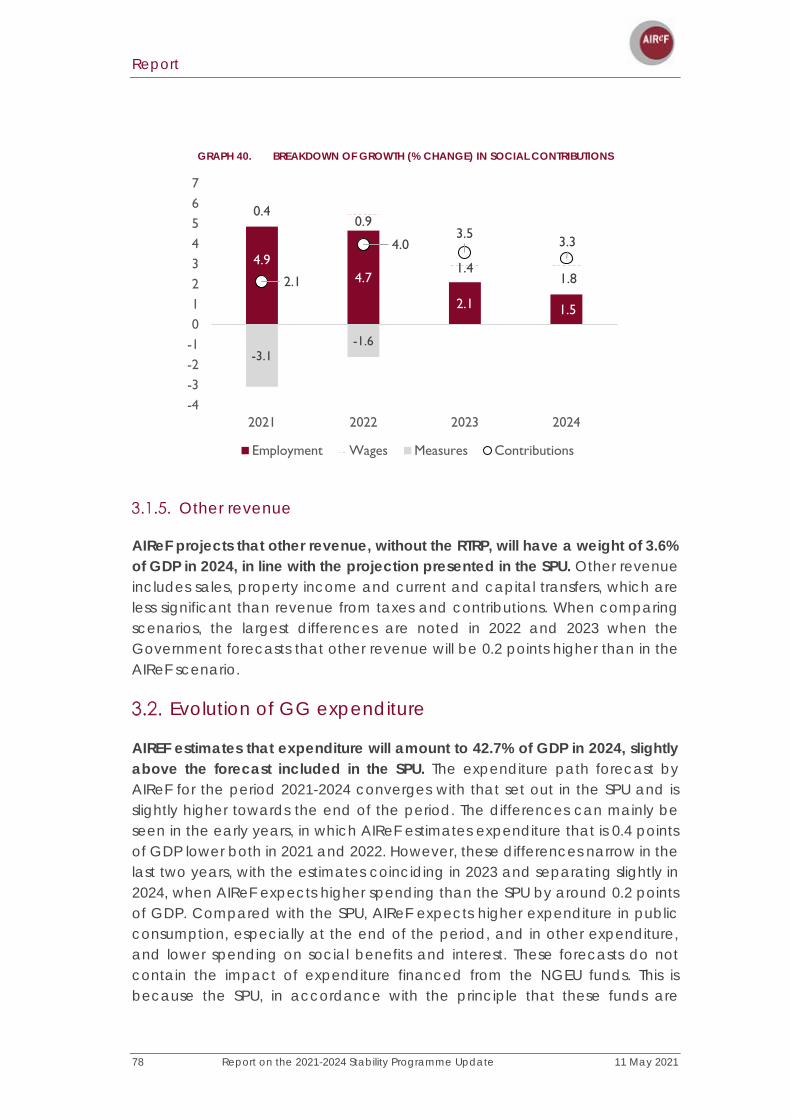
Report
78 Report on the 2021-2024 Stability Programme Update 11 May 2021
GRAPH 40. BREAKDOWN OF GROWTH (% CHANGE) IN SOCIAL CONTRIBUTIONS
Other revenue
AIReF projects that other revenue, without the RTRP, will have a weight of 3.6% of GDP in 2024, in line with the projection presented in the SPU. Other revenue includes sales, property income and current and capital transfers, which are less significant than revenue from taxes and contributions. When comparing scenarios, the largest differences are noted in 2022 and 2023 when the Government forecasts that other revenue will be 0.2 points higher than in the AIReF scenario.
Evolution of GG expenditure
AIREF estimates that expenditure will amount to 42.7% of GDP in 2024, slightly above the forecast included in the SPU. The expenditure path forecast by AIReF for the period 2021-2024 converges with that set out in the SPU and is slightly higher towards the end of the period. The differences can mainly be seen in the early years, in which AIReF estimates expenditure that is 0.4 points of GDP lower both in 2021 and 2022. However, these differences narrow in the last two years, with the estimates coinciding in 2023 and separating slightly in 2024, when AIReF expects higher spending than the SPU by around 0.2 points of GDP. Compared with the SPU, AIReF expects higher expenditure in public consumption, especially at the end of the period, and in other expenditure, and lower spending on social benefits and interest. These forecasts do not contain the impact of expenditure financed from the NGEU funds. This is because the SPU, in accordance with the principle that these funds are
4.94.7
2.1 1.5
0.40.9
1.41.8
-3.1-1.6
2.1
4.03.5 3.3
-4-3-2-101234567
2021 2022 2023 2024
Employment Wages Measures Contributions

Report
11 May 2021 Report on the 2021-2024 Stability Programme Update 79
neutral in the public accounts, has not incorporated them into its budgetary projections. AIReF estimates that, considering the expenditure financed by the NGEU, expenditure would amount to 42.8% of GDP in 2024.
TABLE 6. EXPENDITURE IN % OF GDP (WITHOUT NGEU) AIREF VS. SPU.
TABLE 7. BREAKDOWN OF THE DIFFERENCES IN AIREF VS SPU EXPENDITURE % GDP
Public consumption
AIReF expects higher expenditure on public consumption, especially at the end of the period. This difference can be seen in the three components of public expenditure: employee remuneration, intermediate consumption, and social transfers in kind. The pattern is similar in all of these in that the estimated differences arise more towards the end of the path, which is when AIReF estimates higher expenditure than in the SPU. In addition, it is important to note the consistency between the public consumption forecast in the SPU in its macroeconomic scenario and in its fiscal scenario. This is a substantial improvement on the SPUs of previous years.
Employee remuneration
AIReF's forecast for employee remuneration is 11.1% of GDP in 2024, 0.2 points higher than the figure indicated in the SPU. AIReF forecasts that employee remuneration will fall to 11.1% of GDP in 2024 from the 11.9% of GDP forecast for 2021. This represents a fall in GDP weight of 0.8 points, which is below the
Components Public
consumption
Social benefits in
cashInterest GCF Other
2021 48.5 48.9 -0.5 -0.2 -0.1 0.0 -0.1 0.02022 44.1 44.5 -0.4 0.0 -0.4 -0.1 0.1 0.12023 43.2 43.2 0.0 0.2 -0.3 -0.2 0.0 0.22024 42.7 42.5 0.2 0.5 -0.4 -0.2 0.1 0.2
AIReF SPU % AIReF-SPU
Breakdown of the differences

Report
80 Report on the 2021-2024 Stability Programme Update 11 May 2021
Government's forecast. AIReF estimates average growth of 3.1%, while the SPU estimates an average of 2.7%, with lower rates in the last years.
GRAPH 41. BREAKDOWN OF THE GROWTH IN COMPENSATION OF PUBLIC EMPLOYEES (%)
The evolution of public employees is conditioned by the gradual withdrawal of COVID measures in the early years and the later consolidation of part of the expenditure resulting from the pandemic. In the first few years, AIReF assumes a higher cost of hiring educational and health staff in the Autonomous Regions as well as security and social services staff at a local level, than existed before the health crisis. From 2022 onwards, AIReF assumes that part of the expenditure associated with the COVID measures is consolidated and stabilised at the end of the period. In addition to this, an increase in the number of public employees of close to 1% is assumed in accordance with the models based on the evolution of GDP and the population.
Regarding the remuneration component, once the agreement with the unions expires in 2020, it is assumed that public wages will increase in line with the CPI. Application of the Agreement for the Improvement of Public Employment 2018-2020 signed on 8 March 2018 with the unions entailed an increase in average remuneration above the CPI for the years it is in force. Once this is no longer in force, the 0.9% salary increase provided for in the GSB for 2021, and the CPI estimated by AIReF for the rest of the period, have been considered. Additionally, a wage drift of 0.7% has been considered from 2022 in line with the historical average.
Intermediate consumption
AIReF estimates expenditure on intermediate consumption at 5% of GDP in 2024, 0.2 points higher than that included in the SPU. AIReF estimates that at
-8%
-6%
-4%
-2%
0%
2%
4%
6%
2010 2011 2012 2013 2014 2015 2016 2017 2018 2019 2020 2021* 2022* 2023* 2024*
Employees Wage increase Wage drift Observed AIReF SPU
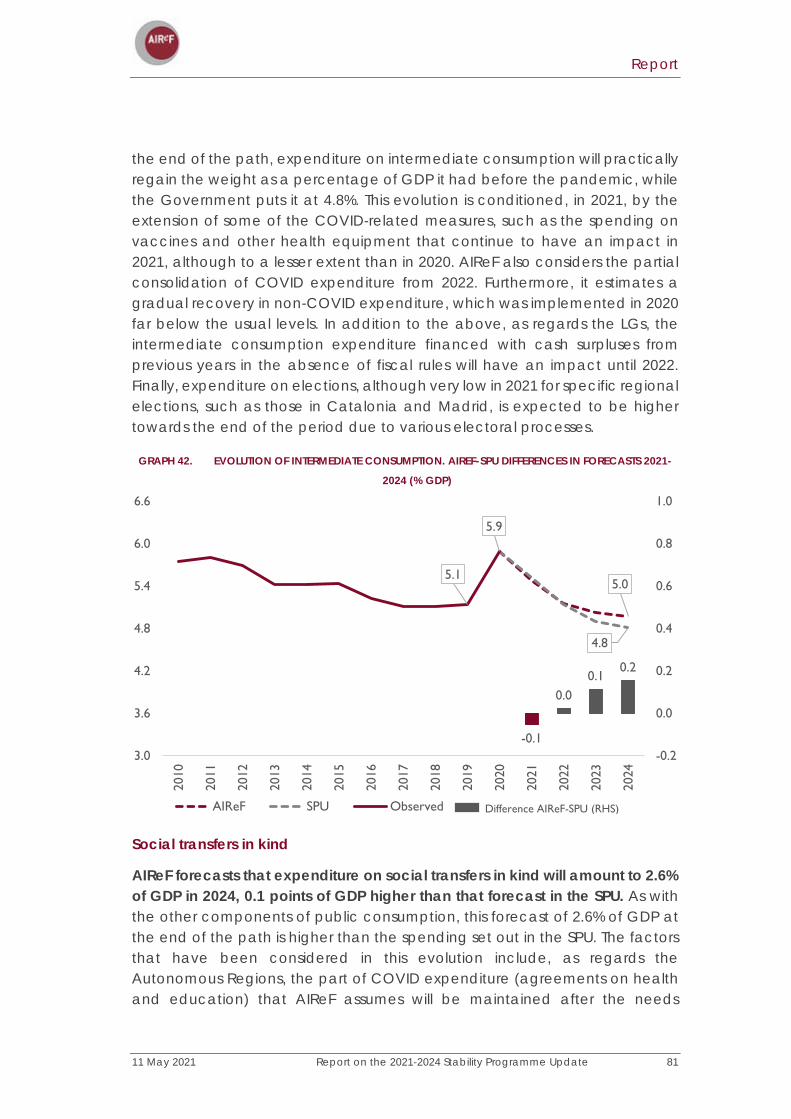
Report
11 May 2021 Report on the 2021-2024 Stability Programme Update 81
the end of the path, expenditure on intermediate consumption will practically regain the weight as a percentage of GDP it had before the pandemic, while the Government puts it at 4.8%. This evolution is conditioned, in 2021, by the extension of some of the COVID-related measures, such as the spending on vaccines and other health equipment that continue to have an impact in 2021, although to a lesser extent than in 2020. AIReF also considers the partial consolidation of COVID expenditure from 2022. Furthermore, it estimates a gradual recovery in non-COVID expenditure, which was implemented in 2020 far below the usual levels. In addition to the above, as regards the LGs, the intermediate consumption expenditure financed with cash surpluses from previous years in the absence of fiscal rules will have an impact until 2022. Finally, expenditure on elections, although very low in 2021 for specific regional elections, such as those in Catalonia and Madrid, is expected to be higher towards the end of the period due to various electoral processes.
GRAPH 42. EVOLUTION OF INTERMEDIATE CONSUMPTION. AIREF-SPU DIFFERENCES IN FORECASTS 2021-
2024 (% GDP)
Social transfers in kind
AIReF forecasts that expenditure on social transfers in kind will amount to 2.6% of GDP in 2024, 0.1 points of GDP higher than that forecast in the SPU. As with the other components of public consumption, this forecast of 2.6% of GDP at the end of the path is higher than the spending set out in the SPU. The factors that have been considered in this evolution include, as regards the Autonomous Regions, the part of COVID expenditure (agreements on health and education) that AIReF assumes will be maintained after the needs
-0.1
0.00.1
0.2
5.0
4.8
5.1
5.9
-0.2
0.0
0.2
0.4
0.6
0.8
1.0
3.0
3.6
4.2
4.8
5.4
6.0
6.6
2010
2011
2012
2013
2014
2015
2016
2017
2018
2019
2020
2021
2022
2023
2024
AIReF SPU Observed Difference AIReF-SPU (RHS)
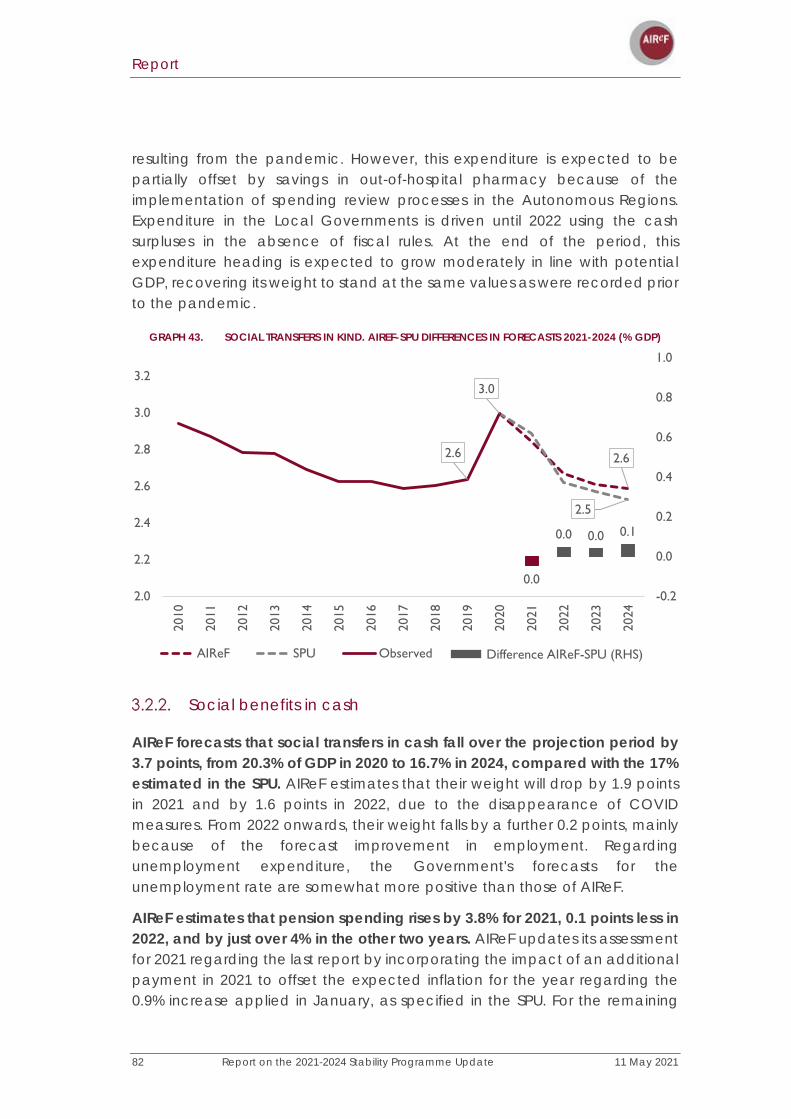
Report
82 Report on the 2021-2024 Stability Programme Update 11 May 2021
resulting from the pandemic. However, this expenditure is expected to be partially offset by savings in out-of-hospital pharmacy because of the implementation of spending review processes in the Autonomous Regions. Expenditure in the Local Governments is driven until 2022 using the cash surpluses in the absence of fiscal rules. At the end of the period, this expenditure heading is expected to grow moderately in line with potential GDP, recovering its weight to stand at the same values as were recorded prior to the pandemic.
GRAPH 43. SOCIAL TRANSFERS IN KIND. AIREF-SPU DIFFERENCES IN FORECASTS 2021-2024 (% GDP)
Social benefits in cash
AIReF forecasts that social transfers in cash fall over the projection period by 3.7 points, from 20.3% of GDP in 2020 to 16.7% in 2024, compared with the 17% estimated in the SPU. AIReF estimates that their weight will drop by 1.9 points in 2021 and by 1.6 points in 2022, due to the disappearance of COVID measures. From 2022 onwards, their weight falls by a further 0.2 points, mainly because of the forecast improvement in employment. Regarding unemployment expenditure, the Government's forecasts for the unemployment rate are somewhat more positive than those of AIReF.
AIReF estimates that pension spending rises by 3.8% for 2021, 0.1 points less in 2022, and by just over 4% in the other two years. AIReF updates its assessment for 2021 regarding the last report by incorporating the impact of an additional payment in 2021 to offset the expected inflation for the year regarding the 0.9% increase applied in January, as specified in the SPU. For the remaining
0.0
0.0 0.0 0.1
2.6
2.5
2.6
3.0
-0.2
0.0
0.2
0.4
0.6
0.8
1.0
2.0
2.2
2.4
2.6
2.8
3.0
3.2
2010
2011
2012
2013
2014
2015
2016
2017
2018
2019
2020
2021
2022
2023
2024
AIReF SPU Observed Difference AIReF-SPU (RHS)

Report
11 May 2021 Report on the 2021-2024 Stability Programme Update 83
years, AIReF estimates the substitution effect and an increase in the number of pensions with the pension expenditure projection model. Finally, it considers that pensions will be raised each year in line with the CPI.
GRAPH 44. GROWTH IN PENSION EXPENDITURE (% CHANGE). AIREF PROJECTIONS
Unemployment benefits fall from 3.3% of GDP in 2020 to 1.4% in 2024 as employment returns to pre-pandemic levels. For 2021, this heading includes the cost of the ERTE measures, which are not expected to be maintained in 2022. In addition, it also includes the impact of non-extraordinary measures approved prior to the crisis, such as the subsidy for people aged over 52 and the increase in the national minimum wage.
In 2021, the reduction in the cost of the ERTEs reduces the weight of the heading to 2.2%, while in 2022 the weight is reduced by 0.6 points because of these schemes coming to an end. For the other years, there are slight reductions in the weight of the heading due to the expected improvements in employment. The weight of contributory and non-contributory benefits remains stable over the projection period.
1.0% 1.0% 1.3% 1.3%
1.4% 1.1%1.0% 0.9%
0.9% 1.6%1.8% 1.8%
0.5%
3.8% 3.7%4.1% 4.0%
0%
1%
1%
2%
2%
3%
3%
4%
4%
5%
2021 2022 2023 2024
Number of pensions Substitution effect Revaluation
Measures Expenditure

Report
84 Report on the 2021-2024 Stability Programme Update 11 May 2021
GRAPH 45. EVOLUTION OF UNEMPLOYMENT EXPENDITURE % OF GDP. AIREF’S FORECASTS
The weight of other benefits falls from 4.4% in 2020 to 3.7% in 2024. The cost hardly falls in 2021 despite the reduction in expenditure for COVID benefits because of increased spending on the Minimum Living Income (IMV) compared with 2020. The reduction in weight occurs in 2022 due to the disappearance of the cost of the extraordinary benefit for the cessation of activity of self-employed workers and temporary incapacity for work due to COVID.
1.0%1.2%
1.1%1.0% 1.0% 0.9%
0.5%
0.6%0.6% 0.6% 0.5% 0.5%
1.5%
0.6%1.4%
1.8%
2.9%3.0%
2.8%3.1% 2.9%
2.4%
1.9%1.7%
1.5% 1.4%1.5%
3.3%
2.2%
1.6%
1.5%1.4%
0%
1%
1%
2%
2%
3%
3%
4%
Contributory Non- contributory Measures Total
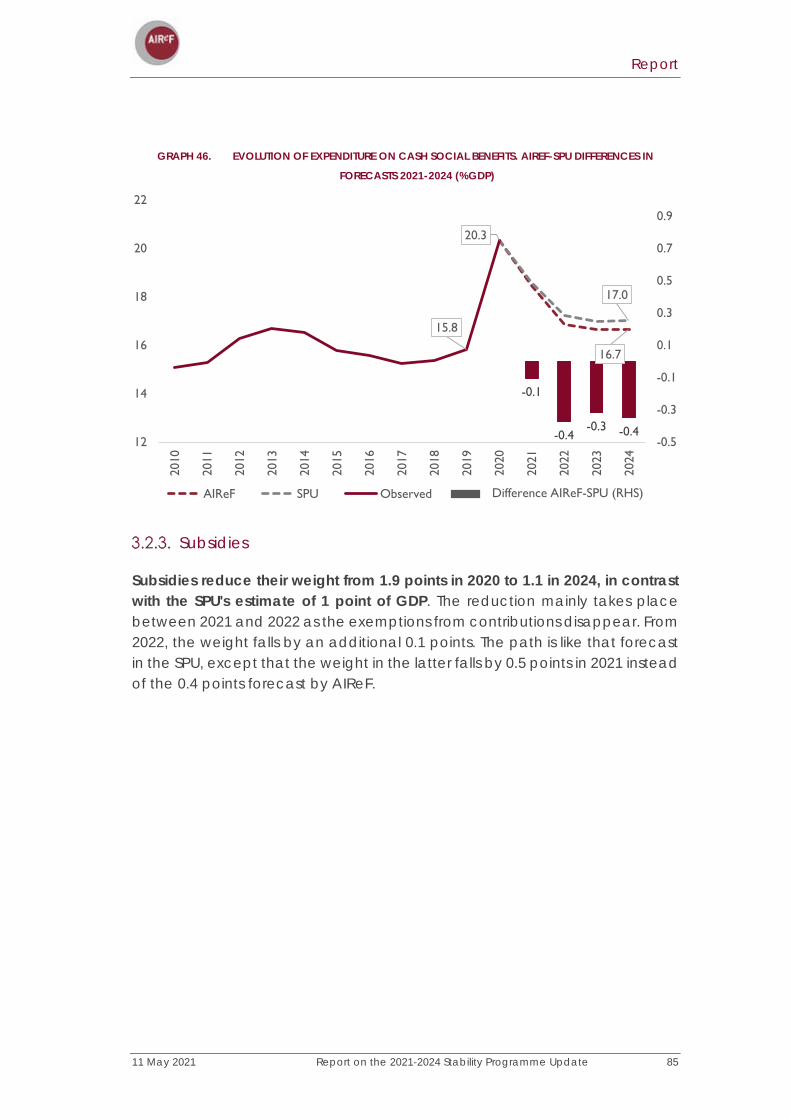
Report
11 May 2021 Report on the 2021-2024 Stability Programme Update 85
GRAPH 46. EVOLUTION OF EXPENDITURE ON CASH SOCIAL BENEFITS. AIREF-SPU DIFFERENCES IN
FORECASTS 2021-2024 (%GDP)
Subsidies
Subsidies reduce their weight from 1.9 points in 2020 to 1.1 in 2024, in contrast with the SPU's estimate of 1 point of GDP. The reduction mainly takes place between 2021 and 2022 as the exemptions from contributions disappear. From 2022, the weight falls by an additional 0.1 points. The path is like that forecast in the SPU, except that the weight in the latter falls by 0.5 points in 2021 instead of the 0.4 points forecast by AIReF.
-0.1
-0.4-0.3 -0.4
16.7
17.0
15.8
20.3
-0.5
-0.3
-0.1
0.1
0.3
0.5
0.7
0.9
12
14
16
18
20
22
2010
2011
2012
2013
2014
2015
2016
2017
2018
2019
2020
2021
2022
2023
2024
AIReF SPU Observed Difference AIReF-SPU (RHS)

Report
86 Report on the 2021-2024 Stability Programme Update 11 May 2021
GRAPH 47. EVOLUTION OF EXPENDITURE ON SUBSIDIES. AIREF-SPU DIFFERENCES IN FORECASTS 2021-2024
(%GDP)
Interest
AIReF forecasts a reduction in interest of 0.8 points of GDP in the period 2021-2024, which is higher than in the SPU. AIReF estimates an interest expense lower than that forecast by the Government throughout the period, both in nominal terms and as a percentage of GDP. Interest expenditure is forecast to stand at 1.5% of GDP in 2024, 0.3 points of GDP below the figure indicated by the SPU. AIReF's interest estimate is made at sub-sector and Autonomous Region level by considering the maturity structure of their debt and the evolution of the primary balances, a future issuance strategy with an average maturity similar to the current one, and future rates at each issuance term based on what the market is discounting.
0.1 0.1 0.1 0.1
1.1
1.0
1.0
1.9
-0.2
0.0
0.2
0.4
0.6
0.8
1.0
1.2
0.0
0.4
0.8
1.2
1.6
2.0
2010
2011
2012
2013
2014
2015
2016
2017
2018
2019
2020
2021
2022
2023
2024
AIReF SPU Observed Difference AIReF-SPU (RHS)
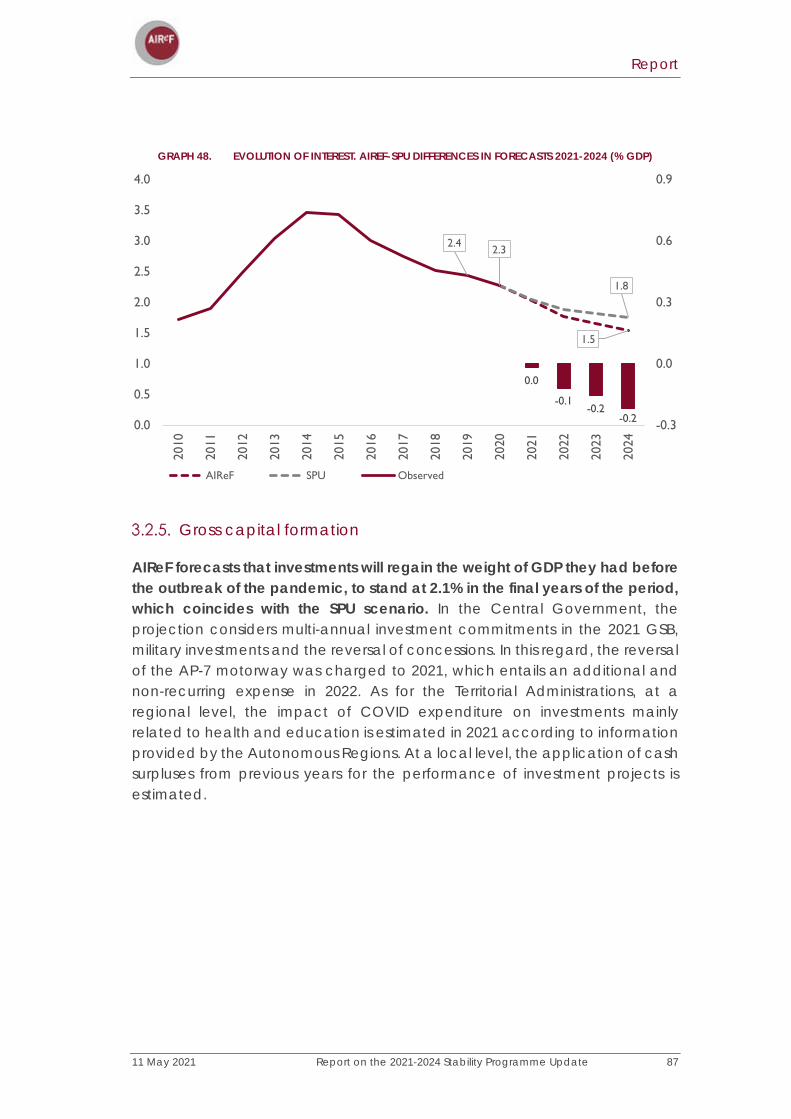
Report
11 May 2021 Report on the 2021-2024 Stability Programme Update 87
GRAPH 48. EVOLUTION OF INTEREST. AIREF-SPU DIFFERENCES IN FORECASTS 2021-2024 (% GDP)
Gross capital formation
AIReF forecasts that investments will regain the weight of GDP they had before the outbreak of the pandemic, to stand at 2.1% in the final years of the period, which coincides with the SPU scenario. In the Central Government, the projection considers multi-annual investment commitments in the 2021 GSB, military investments and the reversal of concessions. In this regard, the reversal of the AP-7 motorway was charged to 2021, which entails an additional and non-recurring expense in 2022. As for the Territorial Administrations, at a regional level, the impact of COVID expenditure on investments mainly related to health and education is estimated in 2021 according to information provided by the Autonomous Regions. At a local level, the application of cash surpluses from previous years for the performance of investment projects is estimated.
0.0
-0.1-0.2
-0.2
1.5
1.8
2.4 2.3
-0.3
0.0
0.3
0.6
0.9
0.0
0.5
1.0
1.5
2.0
2.5
3.0
3.5
4.020
10
2011
2012
2013
2014
2015
2016
2017
2018
2019
2020
2021
2022
2023
2024
AIReF SPU Observed
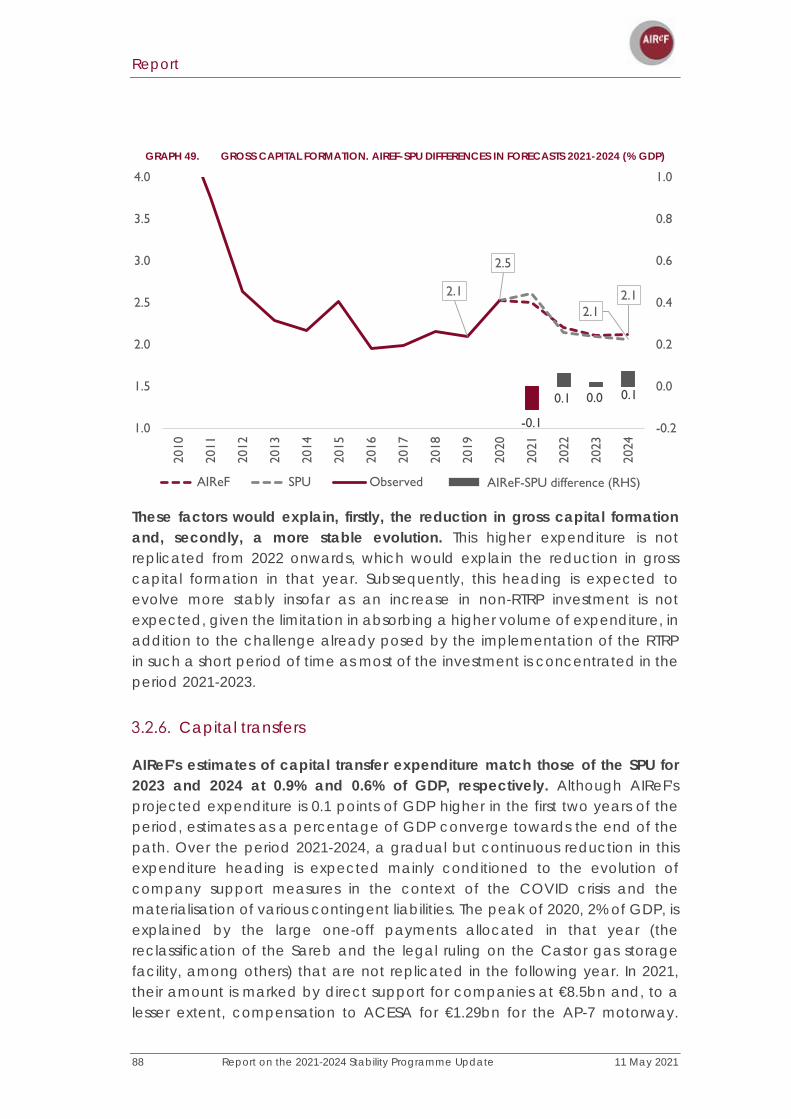
Report
88 Report on the 2021-2024 Stability Programme Update 11 May 2021
GRAPH 49. GROSS CAPITAL FORMATION. AIREF-SPU DIFFERENCES IN FORECASTS 2021-2024 (% GDP)
These factors would explain, firstly, the reduction in gross capital formation and, secondly, a more stable evolution. This higher expenditure is not replicated from 2022 onwards, which would explain the reduction in gross capital formation in that year. Subsequently, this heading is expected to evolve more stably insofar as an increase in non-RTRP investment is not expected, given the limitation in absorbing a higher volume of expenditure, in addition to the challenge already posed by the implementation of the RTRP in such a short period of time as most of the investment is concentrated in the period 2021-2023.
Capital transfers
AIReF's estimates of capital transfer expenditure match those of the SPU for 2023 and 2024 at 0.9% and 0.6% of GDP, respectively. Although AIReF's projected expenditure is 0.1 points of GDP higher in the first two years of the period, estimates as a percentage of GDP converge towards the end of the path. Over the period 2021-2024, a gradual but continuous reduction in this expenditure heading is expected mainly conditioned to the evolution of company support measures in the context of the COVID crisis and the materialisation of various contingent liabilities. The peak of 2020, 2% of GDP, is explained by the large one-off payments allocated in that year (the reclassification of the Sareb and the legal ruling on the Castor gas storage facility, among others) that are not replicated in the following year. In 2021, their amount is marked by direct support for companies at €8.5bn and, to a lesser extent, compensation to ACESA for €1.29bn for the AP-7 motorway.
-0.1
0.1 0.0 0.1
2.12.1
2.1
2.5
-0.2
0.0
0.2
0.4
0.6
0.8
1.0
1.0
1.5
2.0
2.5
3.0
3.5
4.020
10
2011
2012
2013
2014
2015
2016
2017
2018
2019
2020
2021
2022
2023
2024
AIReF SPU Observed AIReF-SPU difference (RHS)

Report
11 May 2021 Report on the 2021-2024 Stability Programme Update 89
Subsequently, in 2022, in addition to €1.5bn of the corporate debt restructuring, the calling of guarantees granted by the ICO for COVID measures adopted by the Government from 2020 for €6bn is expected, while there are no further expenses associated with the Asset Protection Schemes. Guarantees of €4bn are also expected to be called in 2023 and no non-recurring element has been considered for 2024, with this expenditure once again having a weight of GDP like the one prior to the pandemic.
GRAPH 50. EVOLUTION OF CAPITAL TRANSFERS. AIREF-SPU DIFFERENCES IN FORECASTS 2021-2024 (%
GDP)
Analysis by sub-sector
AIReF forecasts a different composition of the deficit by sub-sector in comparison with the distribution presented in the SPU, in which the Central Government also bears the greatest weight of the deficit. The biggest difference between the two scenarios is that between the Central Government and the Autonomous Regions, which could reflect a different assumption in the transfers that the former grants to the latter. The content of the SPU does not include an evolution of the main headings of the sub-sectors in national accounting terms and so the comparison can only be made at the balance level.
-0.1 -0.1
0.00.0
0.6
0.6
0.7
2.0
-0.2
0.0
0.2
0.4
0.6
0.8
1.0
-1
0
1
2
3
4
5
2010
2011
2012
2013
2014
2015
2016
2017
2018
2019
2020
2021
2022
2023
2024
AIReF SPU Observed Difference AIReF-SPU (RHS)
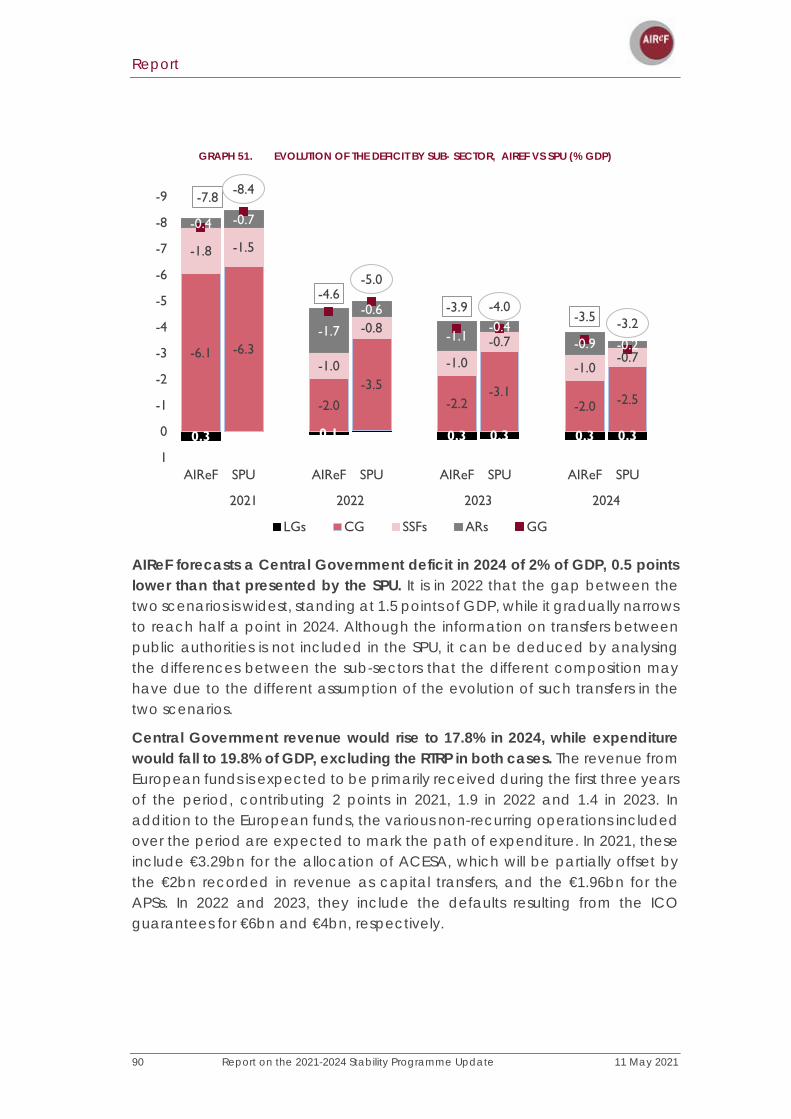
Report
90 Report on the 2021-2024 Stability Programme Update 11 May 2021
GRAPH 51. EVOLUTION OF THE DEFICIT BY SUB- SECTOR, AIREF VS SPU (% GDP)
AIReF forecasts a Central Government deficit in 2024 of 2% of GDP, 0.5 points lower than that presented by the SPU. It is in 2022 that the gap between the two scenarios is widest, standing at 1.5 points of GDP, while it gradually narrows to reach half a point in 2024. Although the information on transfers between public authorities is not included in the SPU, it can be deduced by analysing the differences between the sub-sectors that the different composition may have due to the different assumption of the evolution of such transfers in the two scenarios.
Central Government revenue would rise to 17.8% in 2024, while expenditure would fall to 19.8% of GDP, excluding the RTRP in both cases. The revenue from European funds is expected to be primarily received during the first three years of the period, contributing 2 points in 2021, 1.9 in 2022 and 1.4 in 2023. In addition to the European funds, the various non-recurring operations included over the period are expected to mark the path of expenditure. In 2021, these include €3.29bn for the allocation of ACESA, which will be partially offset by the €2bn recorded in revenue as capital transfers, and the €1.96bn for the APSs. In 2022 and 2023, they include the defaults resulting from the ICO guarantees for €6bn and €4bn, respectively.
0.3 0.1 0.3 0.3 0.3 0.3
-6.1 -6.3
-2.0-3.5
-2.2-3.1
-2.0 -2.5
-1.8 -1.5
-1.0
-0.8
-1.0
-0.7
-1.0-0.7
-0.4 -0.7
-1.7
-0.6
-1.1-0.4
-0.9 -0.2
-7.8 -8.4
-4.6-5.0
-3.9 -4.0-3.5 -3.2
-9
-8
-7
-6
-5
-4
-3
-2
-1
0
1AIReF SPU AIReF SPU AIReF SPU AIReF SPU
2021 2022 2023 2024
LGs CG SSFs ARs GG
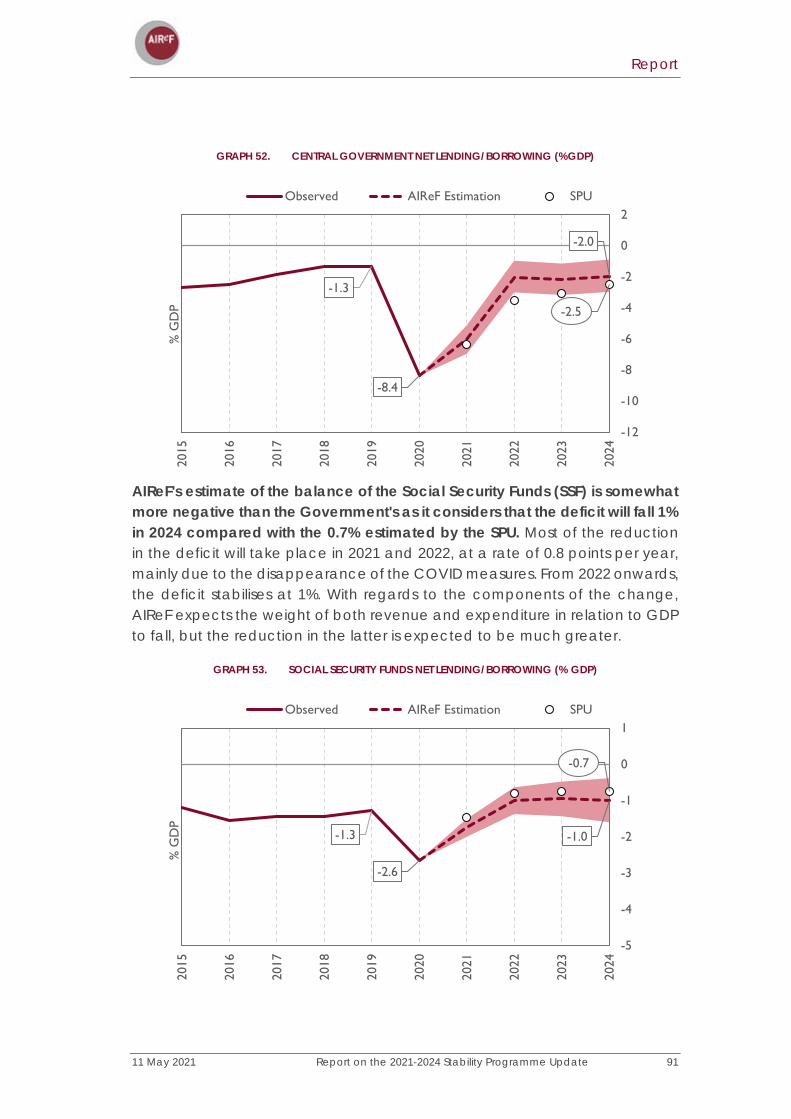
Report
11 May 2021 Report on the 2021-2024 Stability Programme Update 91
GRAPH 52. CENTRAL GOVERNMENT NET LENDING/BORROWING (%GDP)
AIReF's estimate of the balance of the Social Security Funds (SSF) is somewhat more negative than the Government's as it considers that the deficit will fall 1% in 2024 compared with the 0.7% estimated by the SPU. Most of the reduction in the deficit will take place in 2021 and 2022, at a rate of 0.8 points per year, mainly due to the disappearance of the COVID measures. From 2022 onwards, the deficit stabilises at 1%. With regards to the components of the change, AIReF expects the weight of both revenue and expenditure in relation to GDP to fall, but the reduction in the latter is expected to be much greater.
GRAPH 53. SOCIAL SECURITY FUNDS NET LENDING/BORROWING (% GDP)
-1.3
-8.4
-2.0
-2.5
-12
-10
-8
-6
-4
-2
0
2
2015
2016
2017
2018
2019
2020
2021
2022
2023
2024
% G
DP
Observed AIReF Estimation SPU
-1.3
-2.6
-1.0
-0.7
-5
-4
-3
-2
-1
0
1
2015
2016
2017
2018
2019
2020
2021
2022
2023
2024
% G
DP
Observed AIReF Estimation SPU

Report
92 Report on the 2021-2024 Stability Programme Update 11 May 2021
For the regional sub-sector, the SPU establishes, from 2022 and up to the end of the period, a more optimistic outlook than that considered by AIReF. The Programme forecasts a significant worsening of the balance of the Autonomous Regions in 2021, which is higher than AIReF's estimate. However, as from 2022, it forecasts a gradual and steady consolidation over the period, which would end in 2024 with a balance like of 2020. Although AIReF maintains a better outlook for 2021, it forecasts a significant deterioration in the regional balance in 2022. This means that fiscal consolidation is expected as from 2023 from a large deficit that would result in net lending in 2024 higher than that prior to the crisis. The assumptions on the evolution of the main regional revenue and expenditure described in the SPU are broadly like those made by AIReF. However, the quantification and specific weighting of the total amount and its various components is unknown and, therefore, the specific origin of the discrepancies between its estimates and AIReF’s is also unknown. However, the possible sources of these differences can be guessed. The SPU mentions the possible issuance of legal rulings in 2021 in the sphere of the Autonomous Regions regarding which it has not provided any information. In addition, it is worth noting the legal ruling in favour of Castile and Leon region for the appeal lodged in relation to the final VAT settlement for 2017 for the new VAT management system. This ruling sets a precedent for the other appeals filed by the Autonomous Regions and Local Governments, which are quantified in the 2019 General Account of the CSA at €2.02bn. This operation would affect the balance of the sub-sectors involved.
GRAPH 54. FORECAST EVOLUTION OF THE REGIONAL BALANCE UP TO 2024 (% GDP)
AIReF forecasts that the revenue of the Autonomous Regions will amount to 14.6% of GDP at the end of the period. After reaching the peaks of 2020 and
-0.6-0.2
-0.9
-0.2
-4
-3
-2
-1
0
1
2015
2016
2017
2018
2019
2020
2021
2022
2023
2024
% G
DP
Observed AIReF Estimation SPU
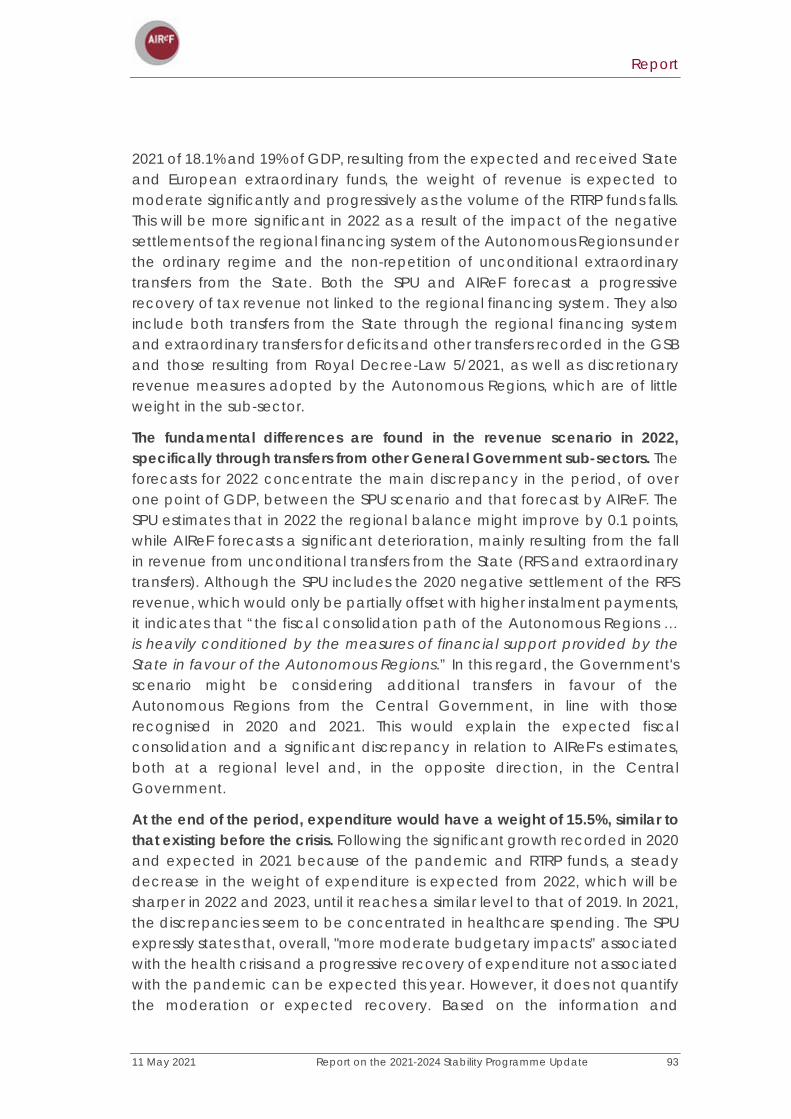
Report
11 May 2021 Report on the 2021-2024 Stability Programme Update 93
2021 of 18.1% and 19% of GDP, resulting from the expected and received State and European extraordinary funds, the weight of revenue is expected to moderate significantly and progressively as the volume of the RTRP funds falls. This will be more significant in 2022 as a result of the impact of the negative settlements of the regional financing system of the Autonomous Regions under the ordinary regime and the non-repetition of unconditional extraordinary transfers from the State. Both the SPU and AIReF forecast a progressive recovery of tax revenue not linked to the regional financing system. They also include both transfers from the State through the regional financing system and extraordinary transfers for deficits and other transfers recorded in the GSB and those resulting from Royal Decree-Law 5/2021, as well as discretionary revenue measures adopted by the Autonomous Regions, which are of little weight in the sub-sector.
The fundamental differences are found in the revenue scenario in 2022, specifically through transfers from other General Government sub-sectors. The forecasts for 2022 concentrate the main discrepancy in the period, of over one point of GDP, between the SPU scenario and that forecast by AIReF. The SPU estimates that in 2022 the regional balance might improve by 0.1 points, while AIReF forecasts a significant deterioration, mainly resulting from the fall in revenue from unconditional transfers from the State (RFS and extraordinary transfers). Although the SPU includes the 2020 negative settlement of the RFS revenue, which would only be partially offset with higher instalment payments, it indicates that “the fiscal consolidation path of the Autonomous Regions … is heavily conditioned by the measures of financial support provided by the State in favour of the Autonomous Regions.” In this regard, the Government's scenario might be considering additional transfers in favour of the Autonomous Regions from the Central Government, in line with those recognised in 2020 and 2021. This would explain the expected fiscal consolidation and a significant discrepancy in relation to AIReF's estimates, both at a regional level and, in the opposite direction, in the Central Government.
At the end of the period, expenditure would have a weight of 15.5%, similar to that existing before the crisis. Following the significant growth recorded in 2020 and expected in 2021 because of the pandemic and RTRP funds, a steady decrease in the weight of expenditure is expected from 2022, which will be sharper in 2022 and 2023, until it reaches a similar level to that of 2019. In 2021, the discrepancies seem to be concentrated in healthcare spending. The SPU expressly states that, overall, "more moderate budgetary impacts” associated with the health crisis and a progressive recovery of expenditure not associated with the pandemic can be expected this year. However, it does not quantify the moderation or expected recovery. Based on the information and
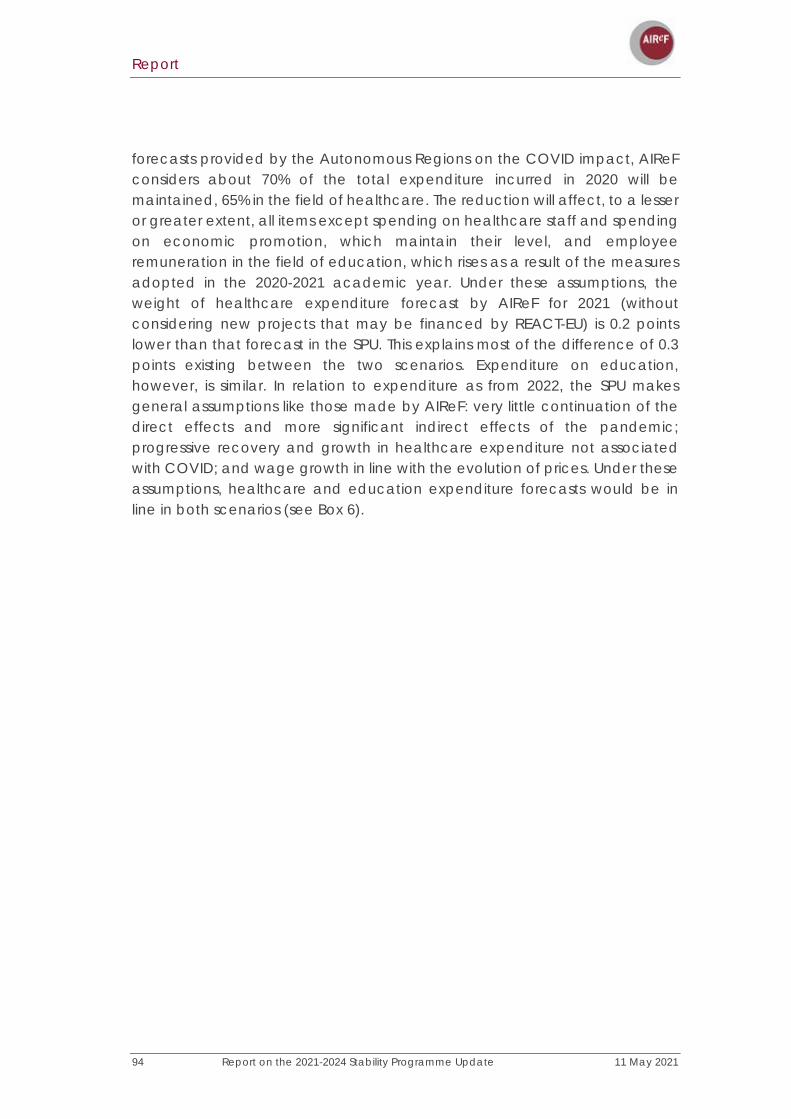
Report
94 Report on the 2021-2024 Stability Programme Update 11 May 2021
forecasts provided by the Autonomous Regions on the COVID impact, AIReF considers about 70% of the total expenditure incurred in 2020 will be maintained, 65% in the field of healthcare. The reduction will affect, to a lesser or greater extent, all items except spending on healthcare staff and spending on economic promotion, which maintain their level, and employee remuneration in the field of education, which rises as a result of the measures adopted in the 2020-2021 academic year. Under these assumptions, the weight of healthcare expenditure forecast by AIReF for 2021 (without considering new projects that may be financed by REACT-EU) is 0.2 points lower than that forecast in the SPU. This explains most of the difference of 0.3 points existing between the two scenarios. Expenditure on education, however, is similar. In relation to expenditure as from 2022, the SPU makes general assumptions like those made by AIReF: very little continuation of the direct effects and more significant indirect effects of the pandemic; progressive recovery and growth in healthcare expenditure not associated with COVID; and wage growth in line with the evolution of prices. Under these assumptions, healthcare and education expenditure forecasts would be in line in both scenarios (see Box 6).
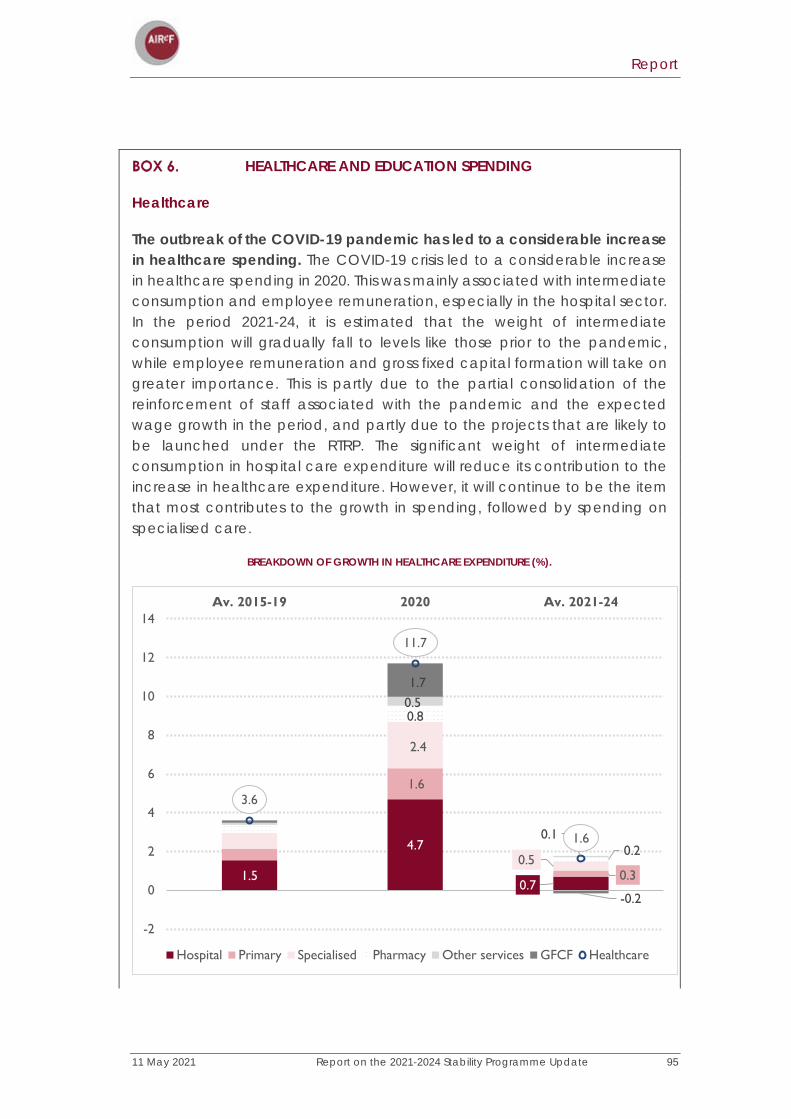
Report
11 May 2021 Report on the 2021-2024 Stability Programme Update 95
HEALTHCARE AND EDUCATION SPENDING
Healthcare
The outbreak of the COVID-19 pandemic has led to a considerable increase in healthcare spending. The COVID-19 crisis led to a considerable increase in healthcare spending in 2020. This was mainly associated with intermediate consumption and employee remuneration, especially in the hospital sector. In the period 2021-24, it is estimated that the weight of intermediate consumption will gradually fall to levels like those prior to the pandemic, while employee remuneration and gross fixed capital formation will take on greater importance. This is partly due to the partial consolidation of the reinforcement of staff associated with the pandemic and the expected wage growth in the period, and partly due to the projects that are likely to be launched under the RTRP. The significant weight of intermediate consumption in hospital care expenditure will reduce its contribution to the increase in healthcare expenditure. However, it will continue to be the item that most contributes to the growth in spending, followed by spending on specialised care.
BREAKDOWN OF GROWTH IN HEALTHCARE EXPENDITURE (%).
1.5
4.7
0.7
1.6
0.3
2.4
0.5
0.8
0.2
0.5
0.1
1.7
-0.2
3.6
11.7
1.6
-2
0
2
4
6
8
10
12
14Av. 2015-19 2020 Av. 2021-24
Hospital Primary Specialised Pharmacy Other services GFCF Healthcare
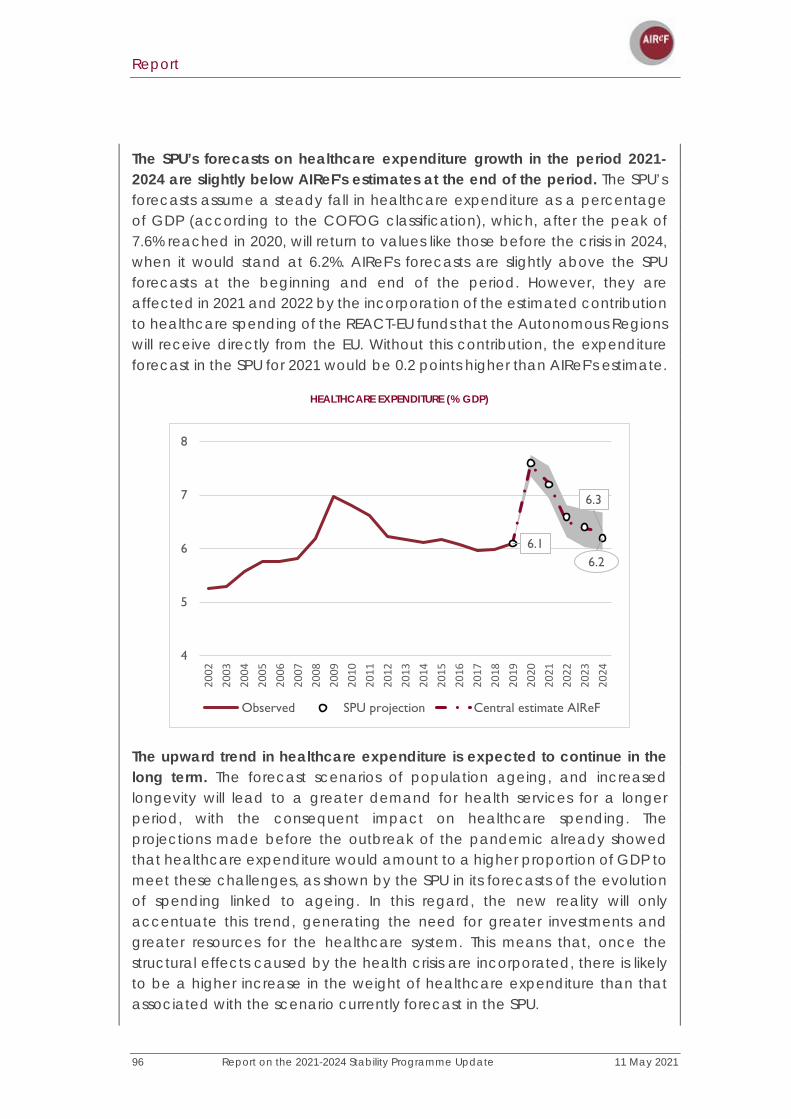
Report
96 Report on the 2021-2024 Stability Programme Update 11 May 2021
The SPU’s forecasts on healthcare expenditure growth in the period 2021-2024 are slightly below AIReF's estimates at the end of the period. The SPU’s forecasts assume a steady fall in healthcare expenditure as a percentage of GDP (according to the COFOG classification), which, after the peak of 7.6% reached in 2020, will return to values like those before the crisis in 2024, when it would stand at 6.2%. AIReF's forecasts are slightly above the SPU forecasts at the beginning and end of the period. However, they are affected in 2021 and 2022 by the incorporation of the estimated contribution to healthcare spending of the REACT-EU funds that the Autonomous Regions will receive directly from the EU. Without this contribution, the expenditure forecast in the SPU for 2021 would be 0.2 points higher than AIReF's estimate.
HEALTHCARE EXPENDITURE (% GDP)
The upward trend in healthcare expenditure is expected to continue in the long term. The forecast scenarios of population ageing, and increased longevity will lead to a greater demand for health services for a longer period, with the consequent impact on healthcare spending. The projections made before the outbreak of the pandemic already showed that healthcare expenditure would amount to a higher proportion of GDP to meet these challenges, as shown by the SPU in its forecasts of the evolution of spending linked to ageing. In this regard, the new reality will only accentuate this trend, generating the need for greater investments and greater resources for the healthcare system. This means that, once the structural effects caused by the health crisis are incorporated, there is likely to be a higher increase in the weight of healthcare expenditure than that associated with the scenario currently forecast in the SPU.
6.16.2
6.3
4
5
6
7
8
2002
2003
2004
2005
2006
2007
2008
2009
2010
2011
2012
2013
2014
2015
2016
2017
2018
2019
2020
2021
2022
2023
2024
Observed SPU projection Central estimate AIReF

Report
11 May 2021 Report on the 2021-2024 Stability Programme Update 97
Education
The SPU's forecasts on the growth of education spending in the period are similar to those of AIReF. As in the case of healthcare, the SPU forecasts a steady fall in education expenditure as a percentage of GDP (according to the COFOG classification), which, after the peak of 4.6% reached in 2020, will return to values like those of 2013, rising slightly in 2024, when it would stand at 4.1%. Although they are in line with the SPU after deducting in 2021 and 2022 the estimate of the spending associated with the REACT EU funds, AIReF’s forecasts consider a slightly higher cost of the reinforcement measures implemented to adapt to the health crisis and a more gradual removal of said measures. However, once the need for the extraordinary measures is over, they are expected to gradually disappear, allowing the weight of education spending in GDP to gradually converge to the values that existed prior to the outbreak of the pandemic.
EDUCATION EXPENDITURE (% GDP)
The weight of education spending might be maintained in the long term. In the medium and long term, the SPU forecasts a significant decrease in the weight of education over GDP associated with demographic trends, caused by low birth rates in Spanish society, and in a no-policy-change scenario. However, the new boost to vocational training and digitalisation, the reduction in the number of students per classroom and the fact that in 2019 the level of expenditure per student prior to the financial crisis had not yet been reached will probably result in the need to increase the level of expenditure per student. Therefore, AIReF considers that a scenario of
4.0
4.1
4.1
3
4
5
2002
2003
2004
2005
2006
2007
2008
2009
2010
2011
2012
2013
2014
2015
2016
2017
2018
2019
2020
2021
2022
2023
2024
Observed SPU projection Estimate
Report
98 Report on the 2021-2024 Stability Programme Update 11 May 2021
maintaining the weight of education over GDP is more realistic than the one outlined in the SPU.
AIReF estimates that the surplus of the Local Governments will remain at 0.3% of GDP until 2024, except for 2022 due to the impact of the negative settlement of the financing system. AIReF confirms the forecasts of the result to be achieved by the Local Governments in 2021 that it included in its Report on the initial budgets of the General Government13 for this year, consolidating the balance obtained in 2020, of about 0.3% of GDP. These AIReF forecasts show a local result in 2022, 2023 and 2024 that is very similar to the one estimated for this year, concluding the possible consolidation in every year of the SPU horizon of a positive balance of about 0.3%. This is corrected in 2022 due to the negative effect of the lower revenue to be received from the financing system as a result of the negative settlement of 2020 of around 0.2 points of GDP. Significant uncertainties remain resulting from the expansive effect of the expenditure resulting from the application of surpluses, as well as the impact of the pandemic in 2021 and the effect of the RTRP. AIReF's estimates may also be altered by the effect of the reduction in economic activity due to the pandemic on revenue, as well as by the measures taken or to be taken to mitigate the effects of COVID-19, and which, in terms of expenditure, will be consolidated in the future. In this regard, AIReF recommended that the Ministry of Finance strengthen the transparency of local management in this area. The ministerial department seems to have taken this recommendation on-board, as reflected in the text of the SPU.
In the medium term, AIReF's estimates are consistent with the SPU scenario, although there are uncertainties resulting from the Government's failure to specify the assumptions underlying this scenario. In the SPU horizon, AIReF's projections are consistent with the Government’s scenario. However, there are significant differences in the short term, in 2021 and 2022, of 0.2 and 0.1 points of GDP, respectively, which might result from the different quantification of the expenditure finally incurred by the Local Governments funded by the savings of previous years. The SPU specifically refers to the effect of this expenditure on the final balance but does not quantify its expected impact. AIReF's estimates have been quantified at around 0.2 points of GDP in 2021 and 0.1 points in 2022.
13 Report on the Initial Budgets of the General Government for 2021
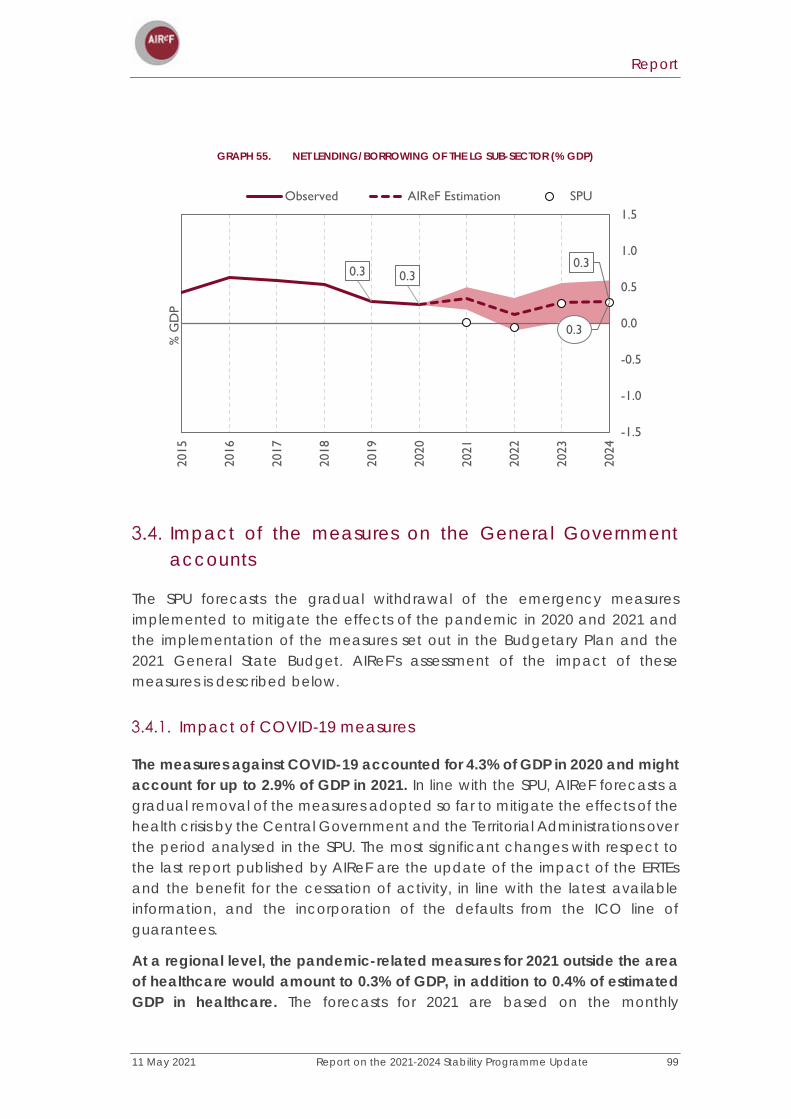
Report
11 May 2021 Report on the 2021-2024 Stability Programme Update 99
GRAPH 55. NET LENDING/BORROWING OF THE LG SUB-SECTOR (% GDP)
Impact of the measures on the General Government accounts
The SPU forecasts the gradual withdrawal of the emergency measures implemented to mitigate the effects of the pandemic in 2020 and 2021 and the implementation of the measures set out in the Budgetary Plan and the 2021 General State Budget. AIReF's assessment of the impact of these measures is described below.
Impact of COVID-19 measures
The measures against COVID-19 accounted for 4.3% of GDP in 2020 and might account for up to 2.9% of GDP in 2021. In line with the SPU, AIReF forecasts a gradual removal of the measures adopted so far to mitigate the effects of the health crisis by the Central Government and the Territorial Administrations over the period analysed in the SPU. The most significant changes with respect to the last report published by AIReF are the update of the impact of the ERTEs and the benefit for the cessation of activity, in line with the latest available information, and the incorporation of the defaults from the ICO line of guarantees.
At a regional level, the pandemic-related measures for 2021 outside the area of healthcare would amount to 0.3% of GDP, in addition to 0.4% of estimated GDP in healthcare. The forecasts for 2021 are based on the monthly
0.3 0.30.3
0.3
-1.5
-1.0
-0.5
0.0
0.5
1.0
1.5
2015
2016
2017
2018
2019
2020
2021
2022
2023
2024
% G
DP
Observed AIReF Estimation SPU
Report
100 Report on the 2021-2024 Stability Programme Update 11 May 2021
information provided by the Autonomous Regions in this regard. It is estimated that COVID measures in education and economic promotion and social services might lead to higher spending than that of 2020, with a weight of 0.1% and close to 0.2% of GDP, respectively. This might be supplemented by actions in other areas for which a much less significant impact is expected, lower than in the previous year. In the area of healthcare, it is estimated that the pandemic might result in expenditure of close to 0.4% of GDP, 65% of the estimated impact in 2020.
The total impact of income replacement measures approved in 2020 is estimated at 0.9% of GDP, based on the assumption that they will be extended until the end of the year. Both the furlough schemes (ERTEs) and the benefits for self-employed workers are expected to be extended until the end of 2021. Both instruments were already extended until May 31st through RDL 2/2021 of January 26th, on strengthening and consolidating social measures to protect employment. Negotiations as part of the social dialogue suggest that they may be extended for a further seven months. However, the impact of this measure in 2021 will still be lower than it was in 2020, at 2.4% of GDP.
AIReF estimates a fiscal impact associated with ERTEs for force majeure of a total of €8.18bn in 2021, if this measure remains in force until the end of December. AIReF expects that the extension of the validity of the ERTEs approved on January 26th until May 31st will be maintained at least until December 31st. Part of the total amount, €6.57bn, is due to unemployment benefits corresponding to existing ERTEs, the processing of which is simplified. The rest - €1.61bn - is the cost of the exemptions to social security contributions of the companies that benefit from these ERTEs. This estimate assumes that 270,000 people will remain under ERTEs at the end of the year.
The benefit for the cessation of activity of self-employed workers and the exemption from the payment of contributions will have a total impact of €3.88bn for 2021. The impact of the support measure for self-employed workers is calculated assuming, as in the case of the ERTEs, that it will be extended once again, until December 31st, following the previous extension until May 31st by RDL 2/2021 of January 26th. Of the total impact on the deficit estimated by AIReF, €2.79bn is due to the cost of the benefit for cessation of activity, while the remaining amount - €1.09bn - corresponds to the cost of the exemption from social security contributions of the self-employed workers who have benefited from this support, which are estimated to fall from 450,000 at the end of April to 200,000 at the end of the year.
Regarding the other expenditure measures generated with the aim of mitigating the effects of the pandemic, the impact of the measures to create public lines of guarantees, totalling €10bn for 2022 and 2023, is significant due
Report
11 May 2021 Report on the 2021-2024 Stability Programme Update 101
to the forecast of defaults through the calling of ICO guarantees. Although in 2021 there will be no impact derived from any defaults, since the Government extended the term of the approved lines until December 31st of this year on March 12th, the cost for the following two years is estimated at a total of €10bn, assuming a default rate of 10% of the loans granted. The impact of this measure would be €6bn in 2022 and €4bn in 2023. This cost is in addition to that already included in previous estimates, totalling €3bn spread over 2021 and 2022, because of the Line for restructuring COVID financial debt aimed at companies and self-employed workers with a debt with a public guarantee, approved in RDL 5/2021, of March 12th, on extraordinary measures to support business solvency in response to the pandemic.
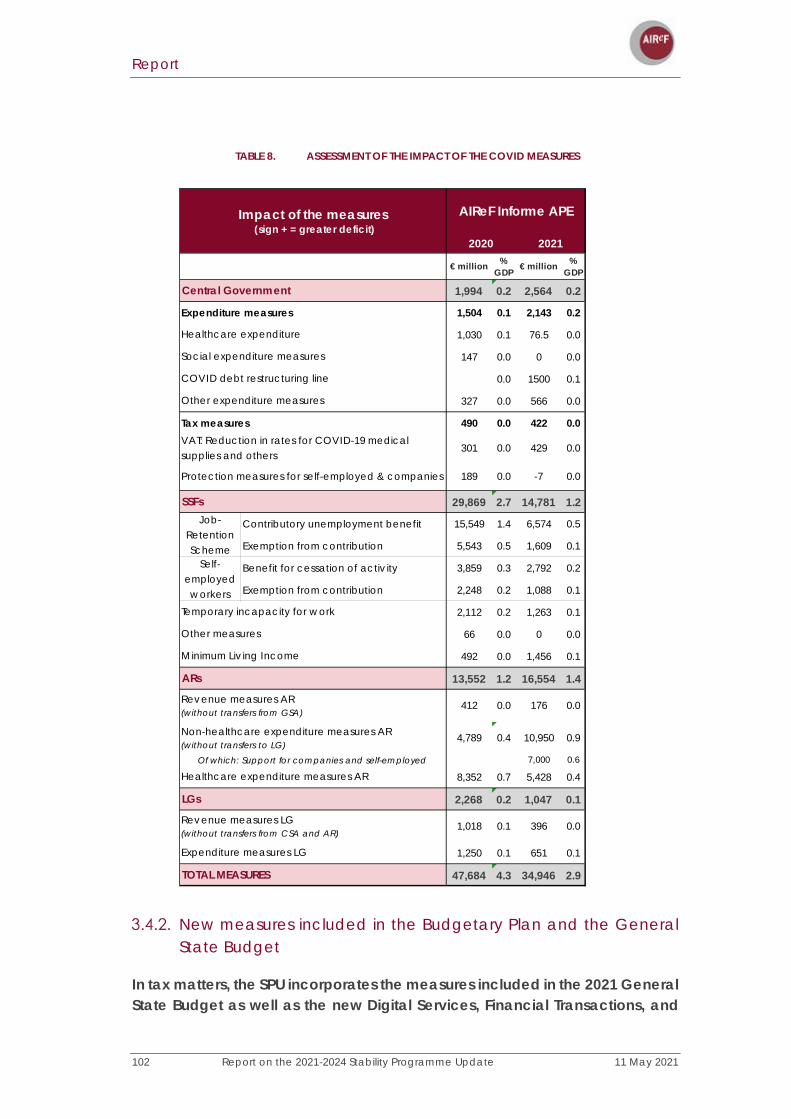
Report
102 Report on the 2021-2024 Stability Programme Update 11 May 2021
TABLE 8. ASSESSMENT OF THE IMPACT OF THE COVID MEASURES
New measures included in the Budgetary Plan and the General State Budget
In tax matters, the SPU incorporates the measures included in the 2021 General State Budget as well as the new Digital Services, Financial Transactions, and
€ million % GDP € million %
GDP
1,994 0.2 2,564 0.2
1,504 0.1 2,143 0.2
1,030 0.1 76.5 0.0
147 0.0 0 0.0
0.0 1500 0.1
327 0.0 566 0.0
490 0.0 422 0.0
301 0.0 429 0.0
189 0.0 -7 0.0
29,869 2.7 14,781 1.2
Contributory unemployment benefit 15,549 1.4 6,574 0.5
Exemption from contribution 5,543 0.5 1,609 0.1
Benefit for cessation of activ ity 3,859 0.3 2,792 0.2
Exemption from contribution 2,248 0.2 1,088 0.1
2,112 0.2 1,263 0.1
66 0.0 0 0.0
492 0.0 1,456 0.1
13,552 1.2 16,554 1.4
412 0.0 176 0.0
4,789 0.4 10,950 0.9
7,000 0.6
8,352 0.7 5,428 0.4
2,268 0.2 1,047 0.1
1,018 0.1 396 0.0
1,250 0.1 651 0.1
47,684 4.3 34,946 2.9
COVID debt restructuring line
Other expenditure measures
Impact of the measures (sign + = greater deficit)
AIReF Informe APE
2020 2021
Central Government
Expenditure measures
Healthcare expenditure
Social expenditure measures
ARs
Tax measuresVAT: Reduction in rates for COVID-19 medical supplies and others
Protection measures for self-employed & companies
SSFsJob-
Retention Scheme
Self-employed workers
Temporary incapacity for work
Other measures
Minimum Liv ing Income
Expenditure measures LG
TOTAL MEASURES
Revenue measures AR (without transfers from GSA)
Non-healthcare expenditure measures AR(without transfers to LG)
Of which: Support for companies and self-employed
Healthcare expenditure measures AR
LGs
Revenue measures LG (without transfers from CSA and AR)
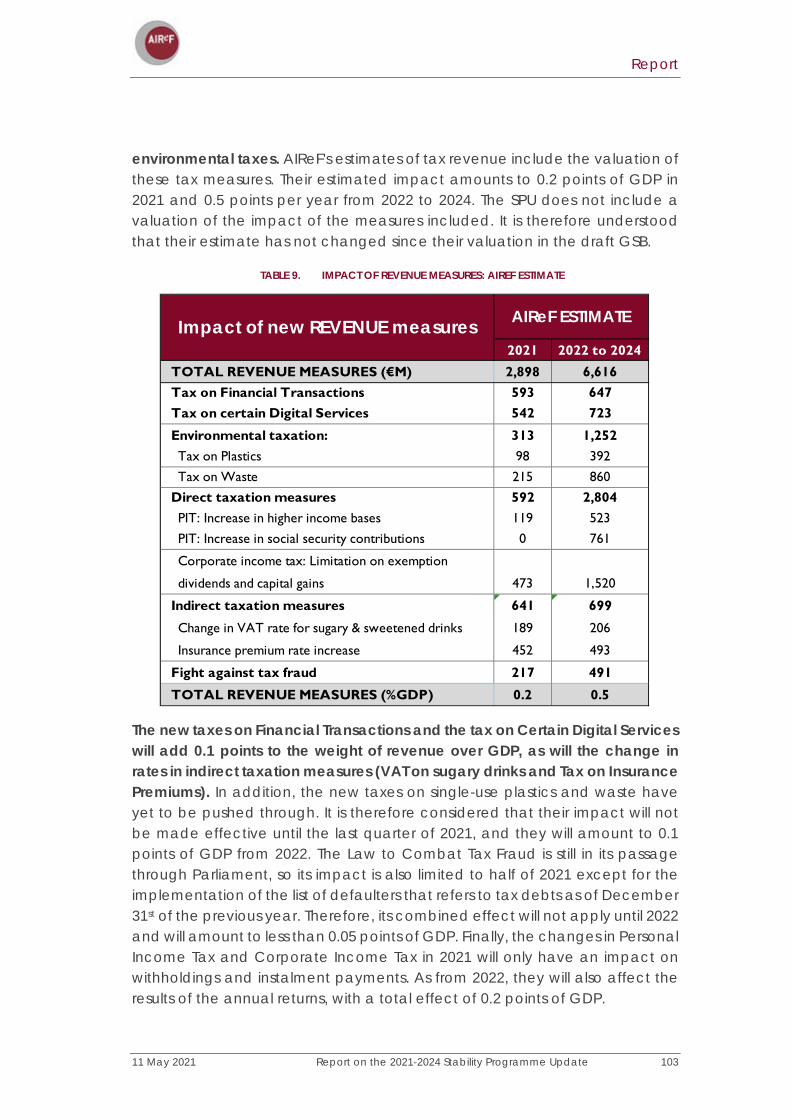
Report
11 May 2021 Report on the 2021-2024 Stability Programme Update 103
environmental taxes. AIReF's estimates of tax revenue include the valuation of these tax measures. Their estimated impact amounts to 0.2 points of GDP in 2021 and 0.5 points per year from 2022 to 2024. The SPU does not include a valuation of the impact of the measures included. It is therefore understood that their estimate has not changed since their valuation in the draft GSB.
TABLE 9. IMPACT OF REVENUE MEASURES: AIREF ESTIMATE
The new taxes on Financial Transactions and the tax on Certain Digital Services will add 0.1 points to the weight of revenue over GDP, as will the change in rates in indirect taxation measures (VAT on sugary drinks and Tax on Insurance Premiums). In addition, the new taxes on single-use plastics and waste have yet to be pushed through. It is therefore considered that their impact will not be made effective until the last quarter of 2021, and they will amount to 0.1 points of GDP from 2022. The Law to Combat Tax Fraud is still in its passage through Parliament, so its impact is also limited to half of 2021 except for the implementation of the list of defaulters that refers to tax debts as of December 31st of the previous year. Therefore, its combined effect will not apply until 2022 and will amount to less than 0.05 points of GDP. Finally, the changes in Personal Income Tax and Corporate Income Tax in 2021 will only have an impact on withholdings and instalment payments. As from 2022, they will also affect the results of the annual returns, with a total effect of 0.2 points of GDP.
2021 2022 to 2024TOTAL REVENUE MEASURES (€M) 2,898 6,616Tax on Financial Transactions 593 647Tax on certain Digital Services 542 723
Environmental taxation: 313 1,252Tax on Plastics 98 392Tax on Waste 215 860
Direct taxation measures 592 2,804PIT: Increase in higher income bases 119 523PIT: Increase in social security contributions 0 761
Corporate income tax: Limitation on exemption
dividends and capital gains 473 1,520
Indirect taxation measures 641 699
Change in VAT rate for sugary & sweetened drinks 189 206
Insurance premium rate increase 452 493
Fight against tax fraud 217 491
TOTAL REVENUE MEASURES (%GDP) 0.2 0.5
Impact of new REVENUE measures AIReF ESTIMATE

Report
104 Report on the 2021-2024 Stability Programme Update 11 May 2021
Analysis of the Transformation, Recovery and Resilience Plan (RTRP)
The SPU publishes annual RTRP expenditure figures in national accounting terms but does not incorporate 2021-2024 budget projections into them due to the principle of neutrality of these funds. The SPU provides information on the annual expenditure corresponding to the RTRP for the period 2020-2026, broken down by national accounting heading and referring to the General Government as a whole. This information is incomplete as its impact is not broken down by sub-sector and is limited to the RTRP (not including expenditure financed by REACT-EU, for which no information is provided). At any event, according to the SPU, the budget projections presented by the Government have been prepared in accordance with the principle of neutrality regarding the Recovery and Resilience Fund. They, therefore, do not include the expenditure and revenue resulting from these funds.
TABLE 10. TIME DISTRIBUTION IN NATIONAL ACCOUNTS TERMS OF THE NGEU (MILLION EUROS)
However, the Government has considered €501m of expenditure in 2020 under the NGEU funds, which might alter the principle of neutrality by this amount. Although the Government has projected that the bulk of the expenditure will be concentrated in the period 2021-2023, a low level of expenditure is expected in 2025 and 2026. It is also considered that expenditure was implemented in 2020 for an amount of €501m, which might be considered eligible for RTRP purposes. The treatment of this item of expenditure could entail an alteration of neutrality for this amount, which would take place both if it is charged to 2020 and to 2021. In both cases, the deficit would be lower, in 2020 due to the extra income regarding expenditure already implemented, and in 2021 as a result of revenue not corresponding to the expenditure already made in the previous year.
2020 2021 2022 2023 2024 2025 2026Compensation of employees D.1 0 4 5 4 0 0 0Intermediate consumption P.2 6 262 296 226 20 9 4Interest D.41 0 0 0 0 0 0 0Social transfers, credits and subsidies D.62+D.632 +D.3 +D.7
72 3,186 3,599 2,747 243 107 42
TOTAL CURRENT EXPENDITURE 78 3,452 3,899 2,977 263 116 46Gross fixed capital formation P.51g 41 1,823 2,059 1,572 139 61 24Capital transfers D.9 382 16,884 19,074 14,561 1,286 566 225TOTAL CAPITAL EXPENDITURE 423 18,707 21,134 16,133 1,425 627 249TOTAL RTRP EXPENDITURE 501 22,158 25,033 19,110 1,688 743 295
REACT EU 10,436 2,000
PRTR+REACT-UE 501 32,594 27,033 19,110 1,688 743 295
NGEU

Report
11 May 2021 Report on the 2021-2024 Stability Programme Update 105
AIReF assumes the time distribution of funds included in the SPU, although the annual figure of the RTRP planned for 2021 is lower than that included in the GSB. According to the SPU, the expenditure in 2021 financed by the RTRP amounts to €22.16bn in national accounting terms, while the expenditure that had been established in the 2021 GSB stands at €24.12bn14. Therefore, this difference would show that in 2021 the Government expects a lower implementation of the RTRP expenditure in an amount of over €1.9bn. Consequently, AIReF has modified its forecasts for 2021 to adapt them to the forecast contained in the SPU.
The SPU does not contain information on REACT-EU funds, which would also not be incorporated into the budget projections presented by the Government. Spain is expected to receive €12,44bn from REACT-EU funds in 2021 and 2022, €10.44bn in 2021 and €2bn in 2022 (see Table 10). The impact of these funds is included in the 2021 GSB for the amount planned for this year for the Central Government, €2.44bn. The SPU would not be incorporating these funds in its budget projections and, unlike the spending associated with the RTRP, it does not contain information on the annual amounts in national accounting terms or how they are spread across the different headings. Unlike the RTRP, the REACT EU operational programme for Spain is not yet known. However, it should be noted that expenditure from February 2020 to 2023 is eligible and that it is intended to finance actions in the field of health, education, social services, and support for companies to remedy the crisis in the context of the COVID-19 pandemic and its social consequences and prepare for a green, digital, and resilient recovery of the economy. Consequently, part of the REACT EU could fully finance actions already implemented by the Autonomous Regions, which would mean a reduction in the deficit in the year in which they are certified.
Despite the supposed neutrality of the NGEU funds on the public deficit, the impact on revenue and expenditure in the period 2021-2024 is very significant. Revenue and expenditure would mainly increase in the first three years of the period, when the Government intends to carry out the bulk of the spending from NGEU funds, with only small amounts earmarked for 2024. These increases would range from 2.7% of GDP in 2021, 2% in 2022 and 1.3% in 2023 to 0.2% in 2024. The expenditure headings that would be most affected are the capital expenditure headings (gross capital formation and capital transfers), which account for almost 85% of the RTRP and over 60% of the REACT-EU. In current expenditure, the main effect is expected in intermediate consumption, social
14 The 2021 GSB provides for non-financial expenditure of €26.56bn due to the NGEU, of which €24.12bn correspond to the RTRP and €2.44bn to the REACT-EU.
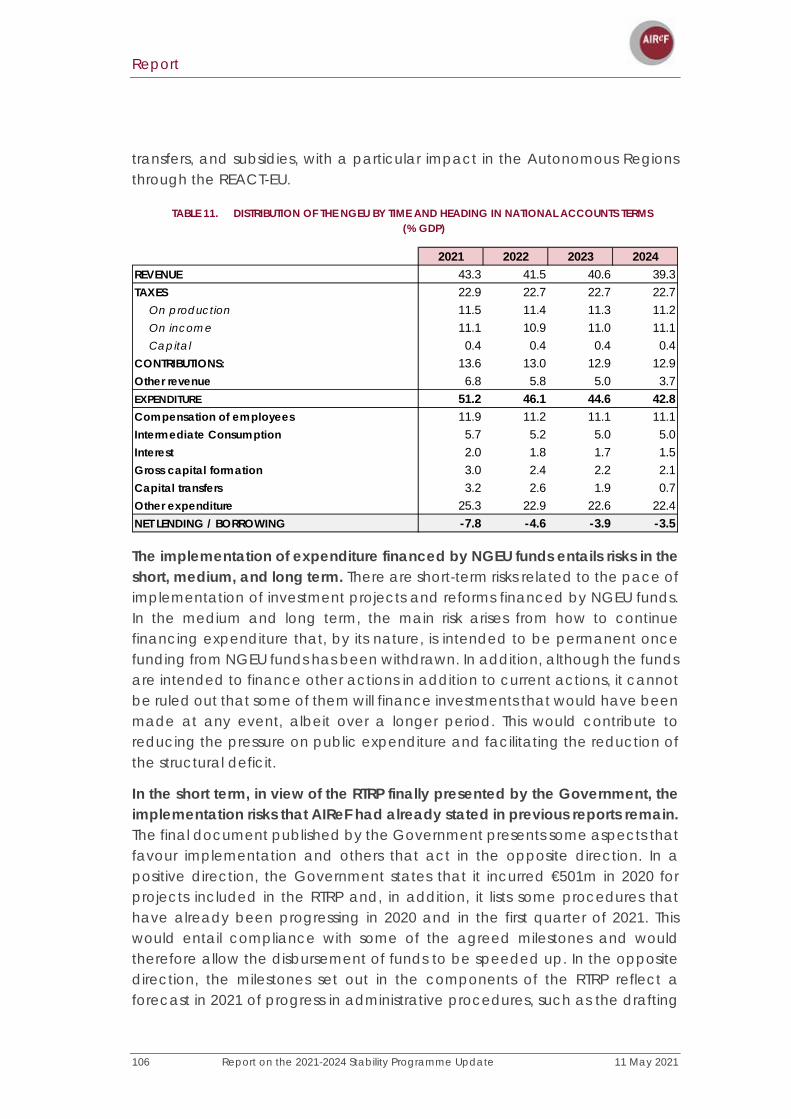
Report
106 Report on the 2021-2024 Stability Programme Update 11 May 2021
transfers, and subsidies, with a particular impact in the Autonomous Regions through the REACT-EU.
TABLE 11. DISTRIBUTION OF THE NGEU BY TIME AND HEADING IN NATIONAL ACCOUNTS TERMS (% GDP)
The implementation of expenditure financed by NGEU funds entails risks in the short, medium, and long term. There are short-term risks related to the pace of implementation of investment projects and reforms financed by NGEU funds. In the medium and long term, the main risk arises from how to continue financing expenditure that, by its nature, is intended to be permanent once funding from NGEU funds has been withdrawn. In addition, although the funds are intended to finance other actions in addition to current actions, it cannot be ruled out that some of them will finance investments that would have been made at any event, albeit over a longer period. This would contribute to reducing the pressure on public expenditure and facilitating the reduction of the structural deficit.
In the short term, in view of the RTRP finally presented by the Government, the implementation risks that AIReF had already stated in previous reports remain. The final document published by the Government presents some aspects that favour implementation and others that act in the opposite direction. In a positive direction, the Government states that it incurred €501m in 2020 for projects included in the RTRP and, in addition, it lists some procedures that have already been progressing in 2020 and in the first quarter of 2021. This would entail compliance with some of the agreed milestones and would therefore allow the disbursement of funds to be speeded up. In the opposite direction, the milestones set out in the components of the RTRP reflect a forecast in 2021 of progress in administrative procedures, such as the drafting
2021 2022 2023 2024REVENUE 43.3 41.5 40.6 39.3TAXES 22.9 22.7 22.7 22.7
On production 11.5 11.4 11.3 11.2On income 11.1 10.9 11.0 11.1Capital 0.4 0.4 0.4 0.4
CONTRIBUTIONS: 13.6 13.0 12.9 12.9Other revenue 6.8 5.8 5.0 3.7EXPENDITURE 51.2 46.1 44.6 42.8Compensation of employees 11.9 11.2 11.1 11.1Intermediate Consumption 5.7 5.2 5.0 5.0Interest 2.0 1.8 1.7 1.5Gross capital formation 3.0 2.4 2.2 2.1Capital transfers 3.2 2.6 1.9 0.7Other expenditure 25.3 22.9 22.6 22.4NET LENDING / BORROWING -7.8 -4.6 -3.9 -3.5
Report
11 May 2021 Report on the 2021-2024 Stability Programme Update 107
of strategies, public tenders, and support. This would mean that at the end of the year the first disbursements would be made, but the projects would be materialised by the final recipients (Territorial Administrations or the private sector) in 2022. As assumed by AIReF's central scenario, this would shift a large part of the macroeconomic impact to that year.
Despite the information published on the components, the degree of definition of the 212 measures (110 investment projects and 102 reforms) is not sufficient to assess their impact. Furthermore, some of the major reforms are also postponed and conditional on future agreements or commitments. The SPU does not incorporate reforms that may have a key influence on the potential growth of the economy and debt sustainability. Some of these reforms, which are pending legislative implementation, affect core areas for growth and sustainability, such as the pension system, the reform of the tax system and the labour market. In addition, there is also no specific information on the budgetary impact of the reforms set out in the RTRP.
In the medium and long term, there is a risk of expenditure on certain projects included in the RTRP becoming structural expenditure without permanent financing other than debt. The time dimension of this plan requires mechanisms to be in place to ensure the financing over time of the reforms and investments initiated from the financing of NGEU funds, without this leading to a long-term increase in government debt. The different projects will be developed over the coming years, with a very strong initial boost in the period 2021-2023, but with an objective that often goes beyond this time frame. They will therefore need to have funding in the future. Consequently, AIReF has estimated which of these components are most at risk of becoming structural expenditure.
The RTRP investments have different levels of risk of raising structural expenditure. Overall, the biggest risks are expected in those components related to the areas of dependency care, employment, education, healthcare, science and innovation, public administration, and the just transition. AIReF therefore considers that multi-annual budgetary planning is essential to anticipate these needs and to adopt measures to meet these expenses in the future.

Report
108 Report on the 2021-2024 Stability Programme Update 11 May 2021
TABLE 12. ESTIMATE OF THE RISK OF THE 30 COMPONENTS OF THE RTRP BECOMING STRUCTURAL EXPENDITURE
The RTRP reforms that might lead to savings are not detailed or quantified. Firstly, the reform of the pension system only sets out general lines of action, bringing together numerous components with opposing effects. The details are yet to be defined insofar as agreements are expected to be reached within the framework of the Toledo Pact. Accordingly, there are some elements, such as revaluation with the CPI that raise spending in the medium and short term, while others are listed that should be aimed at softening the

Report
11 May 2021 Report on the 2021-2024 Stability Programme Update 109
growth of pension expenditure as a result of the ageing of the population. In addition, the labour reform has yet to be defined. In addition to the effect from its macroeconomic impact, it may have permanent effects on spending on unemployment or on active employment policies. Another reform that might contribute to reducing the structural deficit is the modernisation of the General Government. Lastly, Component 29 (Improving the quality of public expenditure) aims to contribute to budgetary stability but does not include any quantitative savings targets.
The increase in revenue resulting from the reform of the tax system is not quantified in the SPU or the RTRP. One of the objectives of Component 28 (Adaptation of the tax system to the reality of the 21st Century) is to increase the weight of revenue over GDP to approach the average of peer countries and reduce the structural deficit. The RTRP lists the main lines of reform but does not specify any target increase that is intended to be achieved. In addition, entry into force of the tax reform would be expected in the first quarter of 2023, although its impact is not included in the SPU.

11 May 2021 Report on the 2021-2024 Stability Programme Update 111
FISCAL RISKS
The SPU still does not include sufficient information on the fiscal risks that may affect the sustainability of the General Government and merely reports on the guarantees granted by the General Government. The section on contingent liabilities in the SPU only includes information corresponding to the guarantees granted by the General Government but does not provide information on other possible liabilities that the General Government may face arising from court rulings, information relating to public-private partnerships, unpaid loans or other types of risks that may affect the objectives of budgetary stability and financial sustainability. In this regard, AIReF has requested more information in various reports in the interest of greater transparency.
This information is restricted to the outstanding balance of guarantees in 2020 and in previous years. However, the expected impact of these risks in the reference period of the 2021-2024 SPU is not quantified. The SPU highlights the sharp increase in guarantees provided in 2020 by the Government to protect the production structure in the crisis caused by the pandemic. These amount to over €57.9bn, almost 94.5% of the volume of guarantees provided at the end of 2019 and were granted mainly by the Central Government. This extraordinary increase in the volume of guarantees in the current context of the pandemic poses serious risks for the public accounts for the period 2021-2024. However, the SPU does not quantify the expected impact of these guarantees in its reference period. It merely indicates the outstanding balance of the guarantees granted in the last seven years for the General Government as a whole and by tier of government.
However, some of the risks from these guarantees are expected to materialise in 2021-2023, with an overall impact on the State deficit for support to companies due to the crisis of 1.6% of GDP. As AIReF mentioned in the previous

Report
112 Report on the 2021-2024 Stability Programme Update 11 May 2021
report, some of the risks of enforcement of the ICO guarantees due to COVID-19 measures implemented from 2020 are expected to materialise in 2021 and 2022. This is due to the creation of two COVID lines of direct support for self-employed workers and companies with the aim of reducing the debt entered as from March 2020, giving priority to reducing the nominal value of the debt with public guarantees and allowing the conversion of part of the public guarantee into transfers to the companies and self-employed workers most affected by the crisis. The impact of these measures on the deficit is estimated at 0.7% of GDP for 2021 and 0.1% of GDP for 2022. In addition to these measures, the SPU incorporates into its 2022 and 2023 budgetary projections, although without quantifying it directly, the forecast of defaults due to enforcement of these guarantees resulting from COVID-19 measures. The negative impact on the public accounts of this forecast amounts to around 0.5% of GDP in 2022 and 0.3% in 2023. Therefore, the overall impact on the State deficit of the measures to support companies due to the crisis would exceed 1.6% of GDP in the period 2021-2023.
In addition, the SPU does not provide information on the fiscal risk arising from the creation of funds to support the solvency of companies. The Solvency Support Fund for strategic companies, which is endowed with €10bn and managed by the SEPI, is another fiscal risk for which no information is provided in the SPU. This is despite the volume of operations granted and the possibility of insolvency of some of the companies, as could be the case of the company Plus Ultra Líneas Aéreas. In addition, neither is there detailed information on the risks arising from the recapitalisation fund for companies affected by COVID, which is endowed with €1bn and managed by COFIDES.
This need for information becomes particularly important due to the significant impact that the materialisation of risks has had on the General Government balance in recent years. Despite the existence of specific budget items to finance this type of expenditure in the form of contingency funds in the different public authorities, the materialisation of risks has had a major impact on the public deficit for all tiers of government. In particular, the spending in 2020 for the enforcement of legal rulings was very significant, particularly that relating to the closure of the Castor gas storage facility for a total of €1.45bn. In addition, the reclassification of the SAREB as a public administration has had an impact of €9.89bn on the deficit and €35bn on the debt.
In addition to the significant impact in 2020, other contingent liabilities with an impact in 2021 are expected. AIReF has already warned about the risk of these liabilities in previous reports. Firstly, these concern the materialisation of the contingent liabilities of ACESA, the concessionaire of the AP-7 motorway, with an impact on the deficit of €1.29bn, without prejudice to the fact that this
Report
11 May 2021 Report on the 2021-2024 Stability Programme Update 113
amount could end up being much higher in the coming years because of the discrepancies that exist with the State regarding the final amount claimed by ACESA. Secondly, these concern the legal ruling on the reimbursements of withholdings of Non-Resident Income Tax and a legal ruling in the field of the Autonomous Regions, which are mentioned in the SPU but without quantification.
Lastly, there are other contingent liabilities referred to in the General Account of the CSA, as well as other operations for which no information is provided and which may pose a risk to the deficit in the medium term. Particularly important, due to their amount, among the contingent liabilities listed in the 2019 General Account of the CSA that have not yet materialised, are the international energy arbitrations relating to the support schemes for renewable energies (€9.63bn). In addition, there are other operations for which there is no information which might have a significant impact on the deficit over the coming years. This is the case of the investments in defence modernisation programmes which are currently underway, public-private partnership contracts and loans granted by public authorities that may turn out to be non-performing.
In addition, the high uncertainty that persists over the macroeconomic scenario carries a risk in the materialisation of the projected fiscal scenario. Certain factors, such as the pace and effectiveness of the vaccination process, the emergence of new, more resistant strains of the virus or the ability to rapidly implement the RTRP as planned, remain key in the evolution of certain variables such as employment, wages, private consumption, or gross operating surplus. These will affect the final path of tax revenue and contributions, as well as unemployment expenditure. In this regard, one of the main fiscal risks is that arising from the possibility that the assumptions that would lead to the expected evolution of the economy will not be fulfilled.

11 May 2021 Report on the 2021-2024 Stability Programme Update 115
EVALUATION OF THE FISCAL POLICY STANCE
The activation of the escape clause both within the scope of national legislation and the Stability and Growth Pact means that there are no regulatory benchmarks for comparing the evolution of the public balances forecast in the Stability Programme Update. According to the Communication from the European Commission “One year since the outbreak of COVID-19: fiscal policy response”, published on March 3rd, 2021, the deactivation of the escape clause at a European level will not take place before at least 2022. The fiscal framework to be applied from the time the escape clause is deactivated is subject to the outcome of the review process that was initiated prior to the crisis and which has been put on hold.
However, the estimate of the usual metrics based on the information contained in Section 4.6 of the Stability Programme provides information on the fiscal policy stance planned by the Government for the medium term. This section provides information on these metrics, calculated from both the data contained in the Stability Programme and AIReF's estimates.
The SPU's budgetary path implies a strongly expansionary fiscal policy in 2021, which becomes neutral in 2022 and 2023, to begin consolidation in 2024, the last year covered by the programme. According to the Government's estimates, the worsening of the public balance in 2020 is almost entirely explained by the evolution of the cyclical balance and the temporary increase in pandemic-related expenditure (factors to which the Government attributes 4.5 and 1.4 percentage points, respectively, of the increase in the deficit in 2020, using an alternative elasticity to that of the usual methodology). Consequently, in 2020 the structural balance would have remained

Report
116 Report on the 2021-2024 Stability Programme Update 11 May 2021
practically constant. In contrast, according to the information provided, the fiscal policy is expected to be extremely expansive in 2021, with a boost of around 1.5 percentage points of GDP. In 2022 and 2023, the structural balance would basically remain constant since in those years the fiscal boost will come from the Next Generation EU Funds, whose impact on the deficit will in theory be neutral in accordance with Eurostat methodological guidelines. According to the Government's plan, the consolidation would eventually start in 2024, when the escape clause is expected to be deactivated in accordance with the Commission Communication of March 3rd, 2021. Specifically, the Government plans to improve the structural balance by 0.6 percentage points of GDP by 2024. This is equivalent to an adjustment of about €8.6bn euros based on the nominal GDP forecast by the Government for 2024.
GRAPH 56. CONTRIBUTIONS TO CHANGES IN
THE GOVERNMENT BALANCE - STABILITY
PROGRAMME
GRAPH 57. BREAKDOWN OF CHANGES IN THE
STRUCTURAL BALANCE - STABILITY PROGRAMME
Source: 2021-2024 Stability Programme and AIReF
* In the case of 2020, the change in the cyclical balance includes the usual element calculated with a semi-elasticity of 0.45 and the socio-health expenditure associated with the pandemic (see pages 99 and 100 of the 2021-2024 Stability Programme)
AIReF's estimates of the fiscal policy stance show a slightly different path, especially in the first and last years of the programme horizon. Based on the evolution of the cyclically adjusted balance, the main fiscal boost, of 1.2 GDP points, would have occurred in 2020. As from that moment, the progressive reduction of COVID-associated spending measures will contribute to an improvement in the cyclically adjusted balance that will remain constant towards the end of the forecast horizon. In other words, in AIReF's view, there are no measures in the Stability Programme that support the 0.6-percentage-point adjustment of the structural balance that the Government has included in its 2024 deficit figure. This figure should therefore be seen today more as an "aspirational” target than as a genuine binding reference for the design of
-7.2
1.7
3.4
1.0
-8.0
-6.0
-4.0
-2.0
0.0
2.0
4.0
2020 2021 2022 2023 2024
Structural balance change Change in cyclical balance
One-Off Change Change in public balance
-0.1
-1.3
0.2
0.0
0.6
-2.0
-1.5
-1.0
-0.5
0.0
0.5
1.0
2020 2021 2022 2023 2024
pp o
f GD
P
Change structural balance Output gap (RHS)

Report
11 May 2021 Report on the 2021-2024 Stability Programme Update 117
fiscal policy in the medium term. This is a feature that was already evident in the Stability Programmes of the past. Since 2011, the improvement seen in deficit ratios has been consistently lower than projected for t+3 in each Stability Programme update sent in April. On average, the annual improvement in the deficit observed since 2014 (the first year for which a Stability Programme projected figures at t+3) was 0.5 percentage points lower than that projected three years earlier.
GRAPH 58. GOVERNMENT BALANCE AND
COMPONENTS (% GDP)
GRAPH 59. BREAKDOWN OF CHANGES IN ADJUSTED
CYCLE BALANCE - AIREF
Source: AIReF
When the output gap recovers to an equivalent level to that prior to the pandemic, the structural deficit will be one point higher than at year-end 2019. AIReF's current estimates indicate that the economy could be operating at its potential rate by 2022 or 2023. Accordingly, and in line with the Stability Programme, the economy could be positioned from 2023 in an output gap similar to that of 2019, before the outbreak of the pandemic. At that time, in contrast, the structural position of Spanish public finances will record a deficit of -4.6% of GDP according to AIReF's estimates, compared with -3.5% in 2019. According to this metric, the structural cost that the pandemic would have entailed for Spanish public finances would therefore amount to 1 point of GDP.
-4.0 -5.2 -4.9 -4.7 -4.7 -4.4
1.2
-5.7 -3.0
0.1 0.7 0.9
-2.9
-11.0
-7.8
-4.6-3.9 -3.5
-12
-9
-6
-3
0
3
2019 2020 2021 2022 2023 2024
Cyclical balance Adjusted cycle balancePublic balance
-1.2
0.4
0.1 0.0
0.2
-10.0
-8.0
-6.0
-4.0
-2.0
0.0
2.0
4.0
-2.0
-1.5
-1.0
-0.5
0.0
0.5
1.0
2020 2021 2022 2023 2024
pp o
f GD
P
Change adjusted cycle balance Output Gap (RHS)
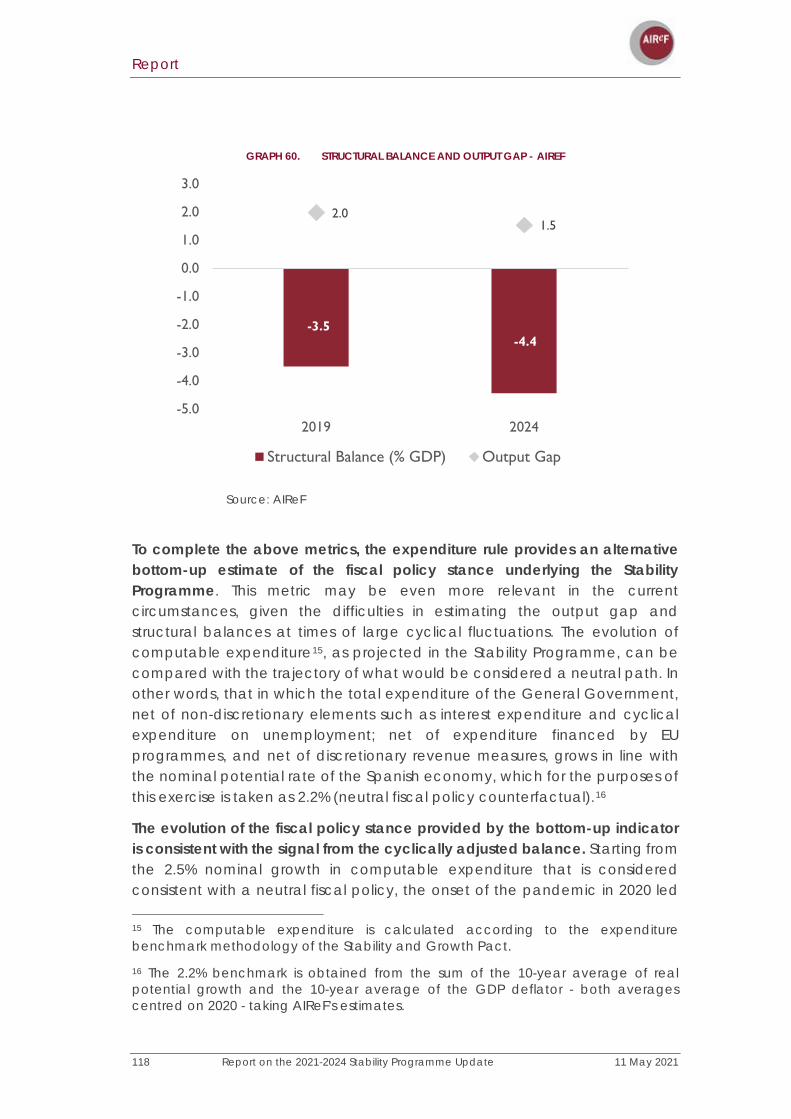
Report
118 Report on the 2021-2024 Stability Programme Update 11 May 2021
GRAPH 60. STRUCTURAL BALANCE AND OUTPUT GAP - AIREF
Source: AIReF
To complete the above metrics, the expenditure rule provides an alternative bottom-up estimate of the fiscal policy stance underlying the Stability Programme. This metric may be even more relevant in the current circumstances, given the difficulties in estimating the output gap and structural balances at times of large cyclical fluctuations. The evolution of computable expenditure15, as projected in the Stability Programme, can be compared with the trajectory of what would be considered a neutral path. In other words, that in which the total expenditure of the General Government, net of non-discretionary elements such as interest expenditure and cyclical expenditure on unemployment; net of expenditure financed by EU programmes, and net of discretionary revenue measures, grows in line with the nominal potential rate of the Spanish economy, which for the purposes of this exercise is taken as 2.2% (neutral fiscal policy counterfactual).16
The evolution of the fiscal policy stance provided by the bottom-up indicator is consistent with the signal from the cyclically adjusted balance. Starting from the 2.5% nominal growth in computable expenditure that is considered consistent with a neutral fiscal policy, the onset of the pandemic in 2020 led
15 The computable expenditure is calculated according to the expenditure benchmark methodology of the Stability and Growth Pact.
16 The 2.2% benchmark is obtained from the sum of the 10-year average of real potential growth and the 10-year average of the GDP deflator - both averages centred on 2020 - taking AIReF's estimates.
-3.5-4.4
2.01.5
-5.0
-4.0
-3.0
-2.0
-1.0
0.0
1.0
2.0
3.0
2019 2024
Structural Balance (% GDP) Output Gap
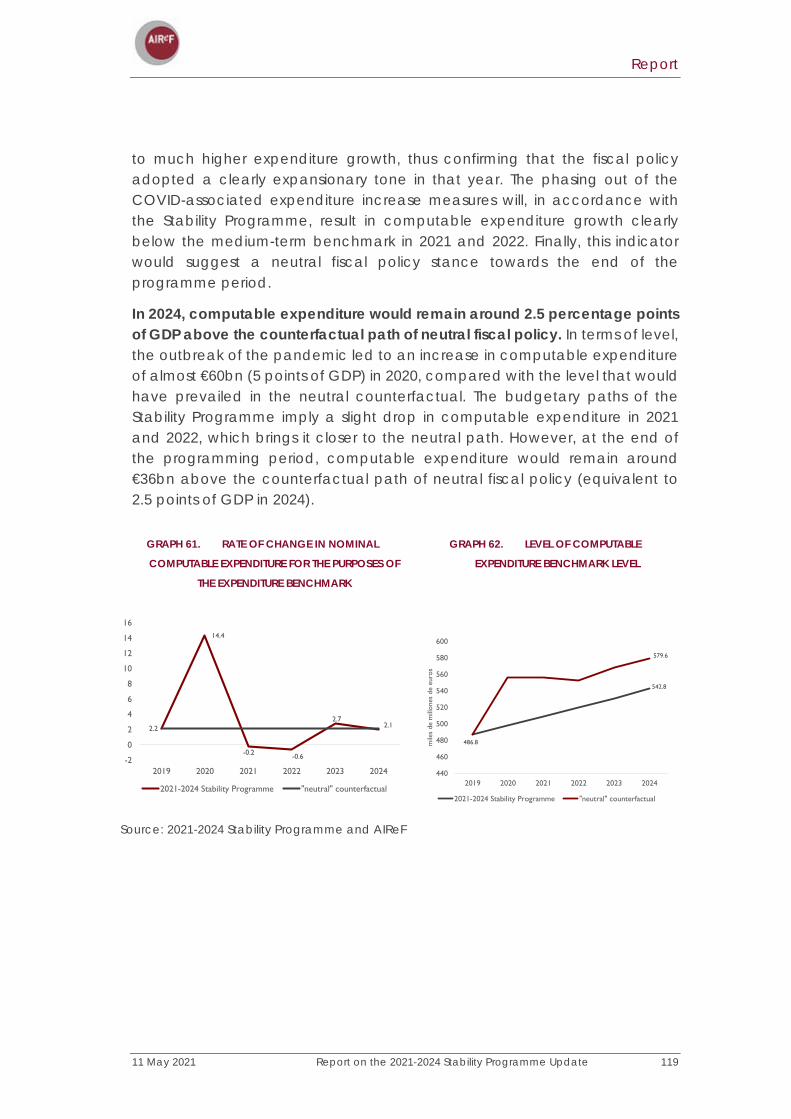
Report
11 May 2021 Report on the 2021-2024 Stability Programme Update 119
to much higher expenditure growth, thus confirming that the fiscal policy adopted a clearly expansionary tone in that year. The phasing out of the COVID-associated expenditure increase measures will, in accordance with the Stability Programme, result in computable expenditure growth clearly below the medium-term benchmark in 2021 and 2022. Finally, this indicator would suggest a neutral fiscal policy stance towards the end of the programme period.
In 2024, computable expenditure would remain around 2.5 percentage points of GDP above the counterfactual path of neutral fiscal policy. In terms of level, the outbreak of the pandemic led to an increase in computable expenditure of almost €60bn (5 points of GDP) in 2020, compared with the level that would have prevailed in the neutral counterfactual. The budgetary paths of the Stability Programme imply a slight drop in computable expenditure in 2021 and 2022, which brings it closer to the neutral path. However, at the end of the programming period, computable expenditure would remain around €36bn above the counterfactual path of neutral fiscal policy (equivalent to 2.5 points of GDP in 2024).
GRAPH 61. RATE OF CHANGE IN NOMINAL
COMPUTABLE EXPENDITURE FOR THE PURPOSES OF
THE EXPENDITURE BENCHMARK
GRAPH 62. LEVEL OF COMPUTABLE
EXPENDITURE BENCHMARK LEVEL
Source: 2021-2024 Stability Programme and AIReF
2.2
14.4
-0.2 -0.6
2.72.1
-2
0
2
4
6
8
10
12
14
16
2019 2020 2021 2022 2023 2024
2021-2024 Stability Programme "neutral" counterfactual
542.8
486.8
579.6
440
460
480
500
520
540
560
580
600
2019 2020 2021 2022 2023 2024
mile
s de
mill
ones
de
euro
s
2021-2024 Stability Programme "neutral" counterfactual


11 May 2021 Report on the 2021-2024 Stability Programme Update 121
EVOLUTION AND SUSTAINABILITY OF GOVERNMENT DEBT
Recent evolution and starting point
The COVID-19 pandemic triggered a global economic crisis in 2020 that has resulted in a deterioration in the public accounts and an unprecedented increase in government debt ratios. In the last 40 years, the world economy has only recorded a slight fall (-0.1% in 2009), in the period of the Great Recession following the financial crisis. Recent estimates suggest a global GDP contraction of over 3% in 2020 and public deficits of more than 10% of GDP in many economies.
It is estimated that the global and the euro area debt ratios will increase by close to 15 points of GDP, which in both cases stand at around 100%. To address the health crisis, ensure support for companies and avoid mass redundancies, governments around the world have taken unprecedented fiscal measures. This discretionary increase in expenditure together with the operation of automatic stabilisers has led to a very significant deterioration in the balance of the public accounts and increased borrowing. It is estimated that the global and the euro area debt ratios will increase by close to 15 points of GDP, which in both cases stand at around 100%.
The Spanish debt-to-GDP ratio stood at 120% in 2020, an increase of 24.5 points on the level of the previous year. This increase is due both to the sharp fall in GDP, the denominator of the ratio (10.5 points) and the rise in the government
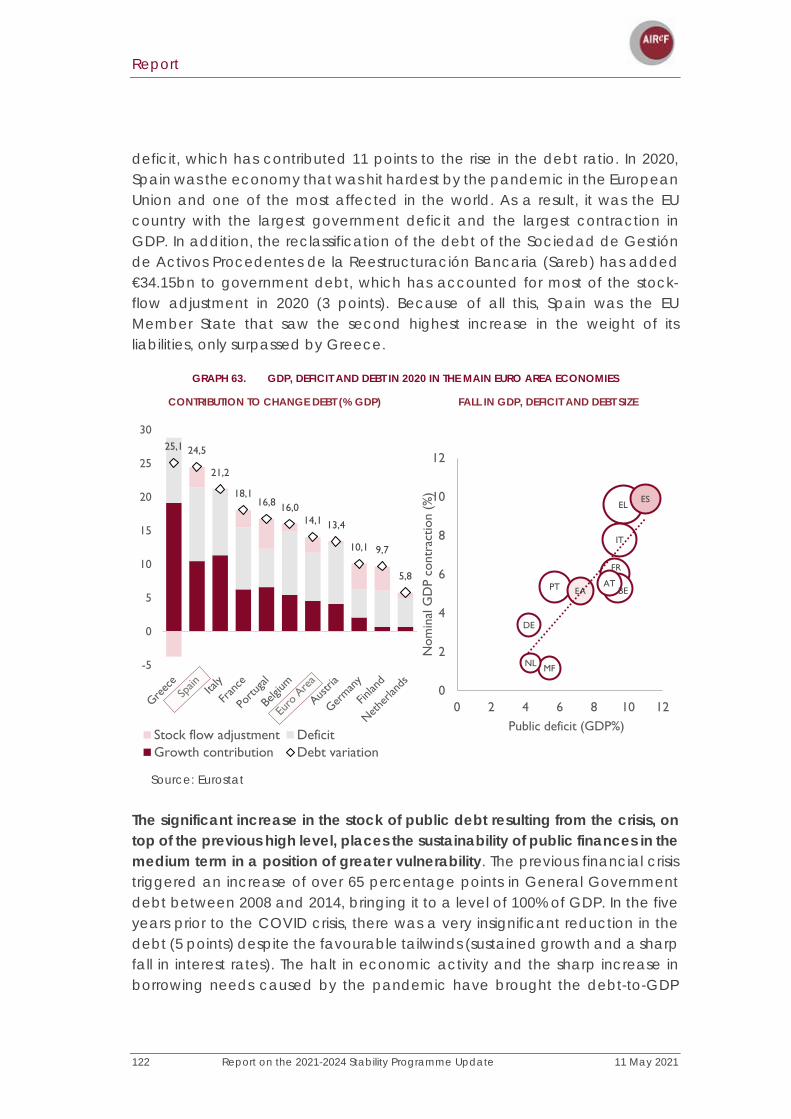
Report
122 Report on the 2021-2024 Stability Programme Update 11 May 2021
deficit, which has contributed 11 points to the rise in the debt ratio. In 2020, Spain was the economy that was hit hardest by the pandemic in the European Union and one of the most affected in the world. As a result, it was the EU country with the largest government deficit and the largest contraction in GDP. In addition, the reclassification of the debt of the Sociedad de Gestión de Activos Procedentes de la Reestructuración Bancaria (Sareb) has added €34.15bn to government debt, which has accounted for most of the stock-flow adjustment in 2020 (3 points). Because of all this, Spain was the EU Member State that saw the second highest increase in the weight of its liabilities, only surpassed by Greece.
GRAPH 63. GDP, DEFICIT AND DEBT IN 2020 IN THE MAIN EURO AREA ECONOMIES
CONTRIBUTION TO CHANGE DEBT (% GDP) FALL IN GDP, DEFICIT AND DEBT SIZE
Source: Eurostat
The significant increase in the stock of public debt resulting from the crisis, on top of the previous high level, places the sustainability of public finances in the medium term in a position of greater vulnerability. The previous financial crisis triggered an increase of over 65 percentage points in General Government debt between 2008 and 2014, bringing it to a level of 100% of GDP. In the five years prior to the COVID crisis, there was a very insignificant reduction in the debt (5 points) despite the favourable tailwinds (sustained growth and a sharp fall in interest rates). The halt in economic activity and the sharp increase in borrowing needs caused by the pandemic have brought the debt-to-GDP
25,1 24,5
21,2
18,116,8 16,0
14,1 13,4
10,1 9,7
5,8
-5
0
5
10
15
20
25
30
Stock flow adjustment DeficitGrowth contribution Debt variation
ELES
IT
FR
PT BEEAAT
DE
MFNL
0
2
4
6
8
10
12
0 2 4 6 8 10 12
Nom
inal
GD
P co
ntra
ctio
n (%
)
Public deficit (GDP%)
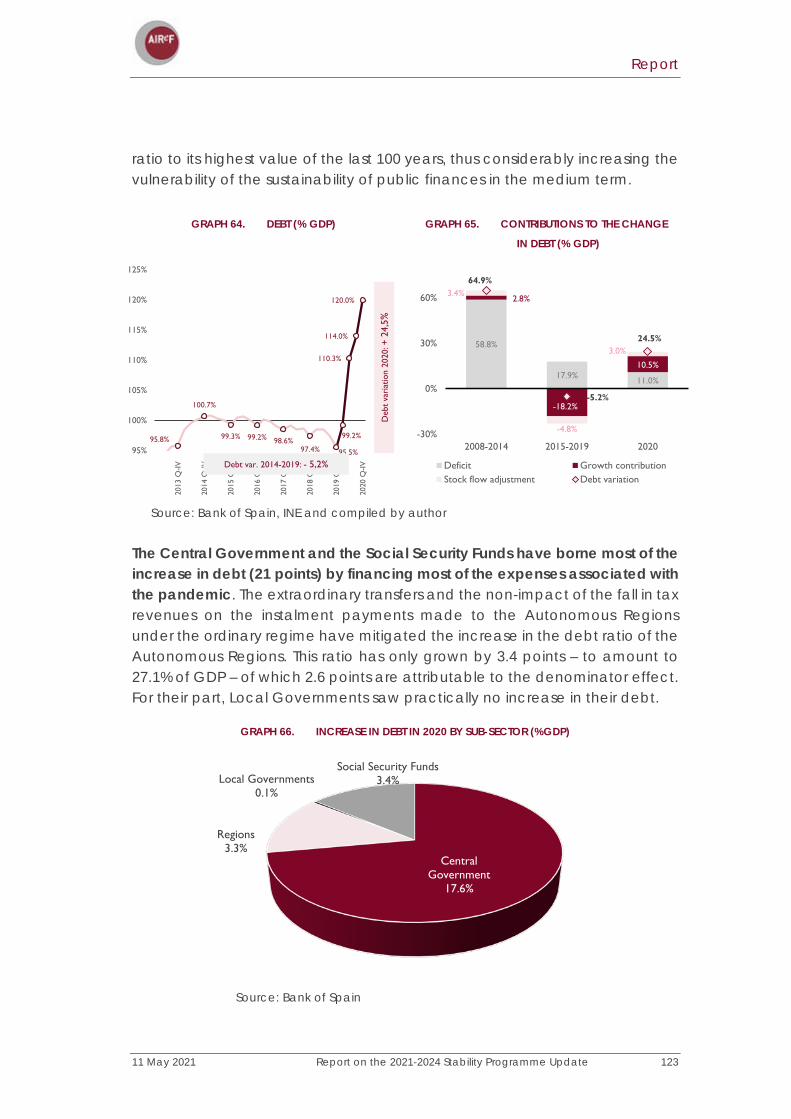
Report
11 May 2021 Report on the 2021-2024 Stability Programme Update 123
ratio to its highest value of the last 100 years, thus considerably increasing the vulnerability of the sustainability of public finances in the medium term.
GRAPH 64. DEBT (% GDP) GRAPH 65. CONTRIBUTIONS TO THE CHANGE
IN DEBT (% GDP)
Source: Bank of Spain, INE and compiled by author
The Central Government and the Social Security Funds have borne most of the increase in debt (21 points) by financing most of the expenses associated with the pandemic. The extraordinary transfers and the non-impact of the fall in tax revenues on the instalment payments made to the Autonomous Regions under the ordinary regime have mitigated the increase in the debt ratio of the Autonomous Regions. This ratio has only grown by 3.4 points – to amount to 27.1% of GDP – of which 2.6 points are attributable to the denominator effect. For their part, Local Governments saw practically no increase in their debt.
GRAPH 66. INCREASE IN DEBT IN 2020 BY SUB-SECTOR (%GDP)
Source: Bank of Spain
95.8%
100.7%
99.3% 99.2% 98.6%97.4% 95.5%
99.2%
110.3%
114.0%
120.0%
95%
100%
105%
110%
115%
120%
125%
2013
Q-IV
2014
Q-IV
2015
Q-IV
2016
Q-IV
2017
Q-IV
2018
Q-IV
2019
Q-IV
2020
Q-IVDebt var. 2014-2019: - 5,2%
Deb
t va
riat
ion
2020
: + 2
4,5%
58.8%
17.9% 11.0%
2.8%
-18.2%
10.5%
3.4%
-4.8%
3.0%
64.9%
-5.2%
24.5%
-30%
0%
30%
60%
2008-2014 2015-2019 2020
Deficit Growth contributionStock flow adjustment Debt variation
Central Government
17.6%
Regions3.3%
Local Governments0.1%
Social Security Funds3.4%

Report
124 Report on the 2021-2024 Stability Programme Update 11 May 2021
Despite higher borrowing needs, the cost of borrowing has continued to fall, recording a new all-time low. Specifically, the average cost of outstanding State Debt stood at 1.86%, below the 2.19% at the end of 2019. The average cost of new issues fell to 0.18%, compared with 0.23% in 2019. This has been helped by the fact that just over 50% of the State debt issued during the year was allocated at negative rates, resulting in record low yields along practically the entire curve. It should be noted that at the end of 2020, the Treasury managed to auction off a 10-year bond at a negative interest rate.
The State's financial burden has been reduced for the sixth consecutive year, with interest expenditure at the end of 2020 standing at 2.2% of GDP. Since mid-2012, the effective cost of financing General Government debt has systematically fallen by a cumulative total of 210 basis points. This has made it possible to reduce interest expenditure both in absolute terms and as a percentage of GDP - one of the main indicators of a country's debt sustainability.
GRAPH 67. AVERAGE COST OF STATE DEBT (%) GRAPH 68. FINANCIAL BURDEN AND IMPLICIT RATE
OF THE DEBT
Source: Public Treasury, IGAE
Debt projections over the horizon of the Stability Programme Update (2021-2024)
Under the macro-fiscal forecasts that it prepared to assess the Stability Programme, AIReF projects a reduction in the debt-to-GDP ratio of 7.6 points by 2024, placing the ratio at 112.4%. The expected upturn in economic activity driven by the RTRP, the improvement in the cyclical component of the public
4.1
1.86
0.18
0
1
2
3
4
5
6
2000
2002
2004
2006
2008
2010
2012
2014
2016
2018
2020
Cost of debt outstanding Cost at issuance
3.5
2.3
4.2
2.1
0
5
10
15
20
25
30
35
40
1.5
2.0
2.5
3.0
3.5
4.0
4.5
20
11
20
12
20
13
20
14
20
15
20
16
20
17
20
18
20
19
20
20
Interest (€bn, right axis)Interest exp. (GDP % )Implicit rate (%)

Report
11 May 2021 Report on the 2021-2024 Stability Programme Update 125
balance and the gradual disappearance of the pandemic-related emergency measures make it possible to project this reduction in the debt ratio of between 5.6 and 9.4 points for 2024 in the central interval of AIReF’s stochastic projections17. This would bring the debt-to-GDP ratio to between 110.5% and 114.3%. Most of the reduction in the debt ratio (6.3 out of 7.6 points) takes place in the first two years, while it is forecast to stabilise as from the third year.
The RTRP will have a positive but limited effect on reducing the debt ratio in the coming years. Firstly, the RTRP will provide an additional boost in the recovery of the economy and potential long-term growth. This will translate into a better evolution of the fiscal position, and consequently, a further reduction in the debt-to-GDP ratio. Accordingly, its impact has been estimated as a drop in the ratio of between 3.5 and 7 points by 2024.
GRAPH 69. STOCHASTIC DEBT PROJECTIONS (%
GDP)
Source: AIReF
In addition, it is important to bear in mind that the favourable impact on debt of the funds coming from Next Generation EU works not only through the expansive effect on the denominator of the ratio, but also thanks to its neutrality as regards the numerator of the ratio. In accordance with the methodological guide published by Eurostat, the principle of neutrality is applied to funds from the Recovery and Resilience Facility. This means that they do not imply an increase in public deficit. Furthermore, the financing obtained on the markets by the European Commission to finance the Facility is not considered as debt of the Member States, but rather as EU debt.
AIReF considers the debt projection included in the SPU for 2024 to be feasible According to AIReF's stochastic projections, achieving a debt-to-GDP ratio equal to or lower than that projected by the Government in 2024 is considered feasible.
17 The technique consists of simulating a very large number of debt paths incorporating the shocks observed in the past to determine a future probabilistic distribution around a central path through the variance-covariance matrix of the shocks of a VAR model. The central interval corresponds to the 40-60 range of these projections.
100
105
110
115
120
125
2020 2021 2022 2023 2024
Range 40-60Range 20-80Range 10-90
Excluding NGEU
110,5
114,3
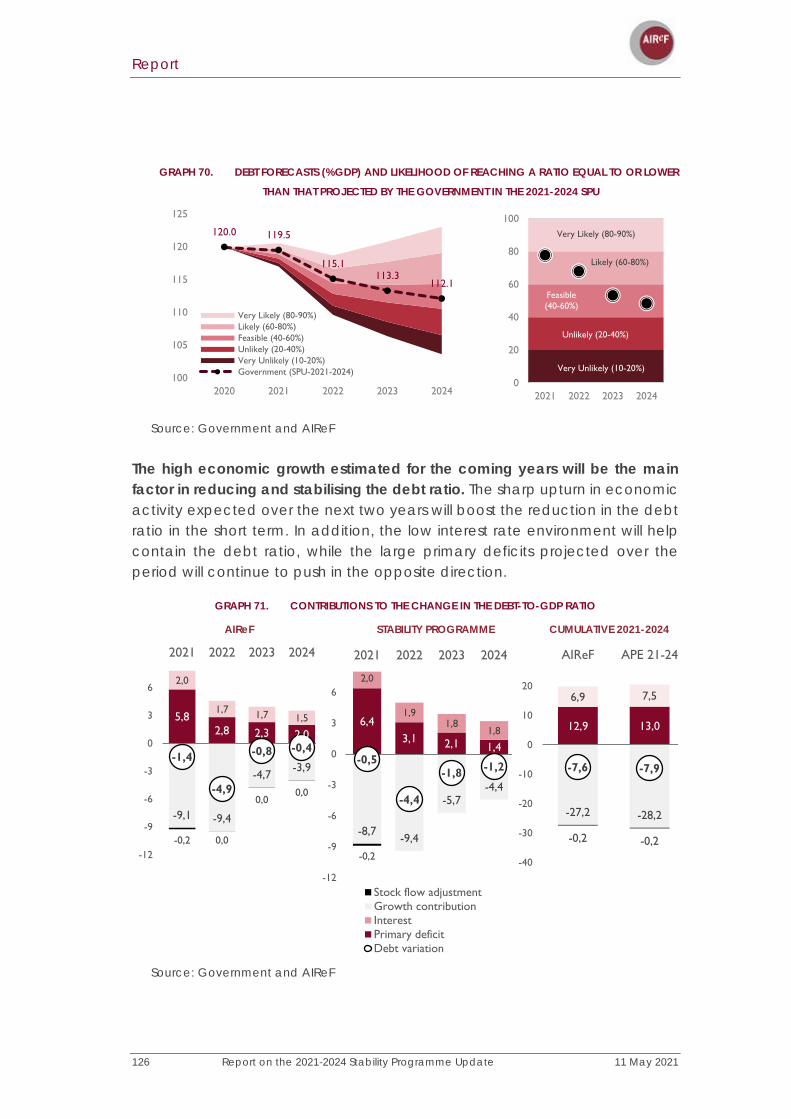
Report
126 Report on the 2021-2024 Stability Programme Update 11 May 2021
GRAPH 70. DEBT FORECASTS (%GDP) AND LIKELIHOOD OF REACHING A RATIO EQUAL TO OR LOWER
THAN THAT PROJECTED BY THE GOVERNMENT IN THE 2021-2024 SPU
Source: Government and AIReF
The high economic growth estimated for the coming years will be the main factor in reducing and stabilising the debt ratio. The sharp upturn in economic activity expected over the next two years will boost the reduction in the debt ratio in the short term. In addition, the low interest rate environment will help contain the debt ratio, while the large primary deficits projected over the period will continue to push in the opposite direction.
GRAPH 71. CONTRIBUTIONS TO THE CHANGE IN THE DEBT-TO-GDP RATIO
AIReF STABILITY PROGRAMME CUMULATIVE 2021-2024
Source: Government and AIReF
120.0 119.5
115.1113.3
112.1
100
105
110
115
120
125
2020 2021 2022 2023 2024
Very Likely (80-90%)Likely (60-80%)Feasible (40-60%)Unlikely (20-40%)Very Unlikely (10-20%)Government (SPU-2021-2024) Very Unlikely (10-20%)
Unlikely (20-40%)
Feasible(40-60%)
Likely (60-80%)
Very Likely (80-90%)
0
20
40
60
80
100
2021 2022 2023 2024
5,82,8 2,3 2,0
2,0
1,7 1,7 1,5
-9,1 -9,4
-4,7-3,9
-0,2 0,0
0,00,0
-1,4
-4,9
-0,8 -0,4
-12
-9
-6
-3
0
3
6
2021 2022 2023 2024
6,43,1 2,1 1,4
2,0
1,91,8
1,8
-8,7-9,4
-5,7-4,4
-0,2
-0,5
-4,4
-1,8 -1,2
-12
-9
-6
-3
0
3
6
2021 2022 2023 2024
Stock flow adjustmentGrowth contributionInterestPrimary deficitDebt variation
12,9 13,0
6,9 7,5
-27,2 -28,2
-0,2 -0,2
-7,6 -7,9
-40
-30
-20
-10
0
10
20
AIReF APE 21-24
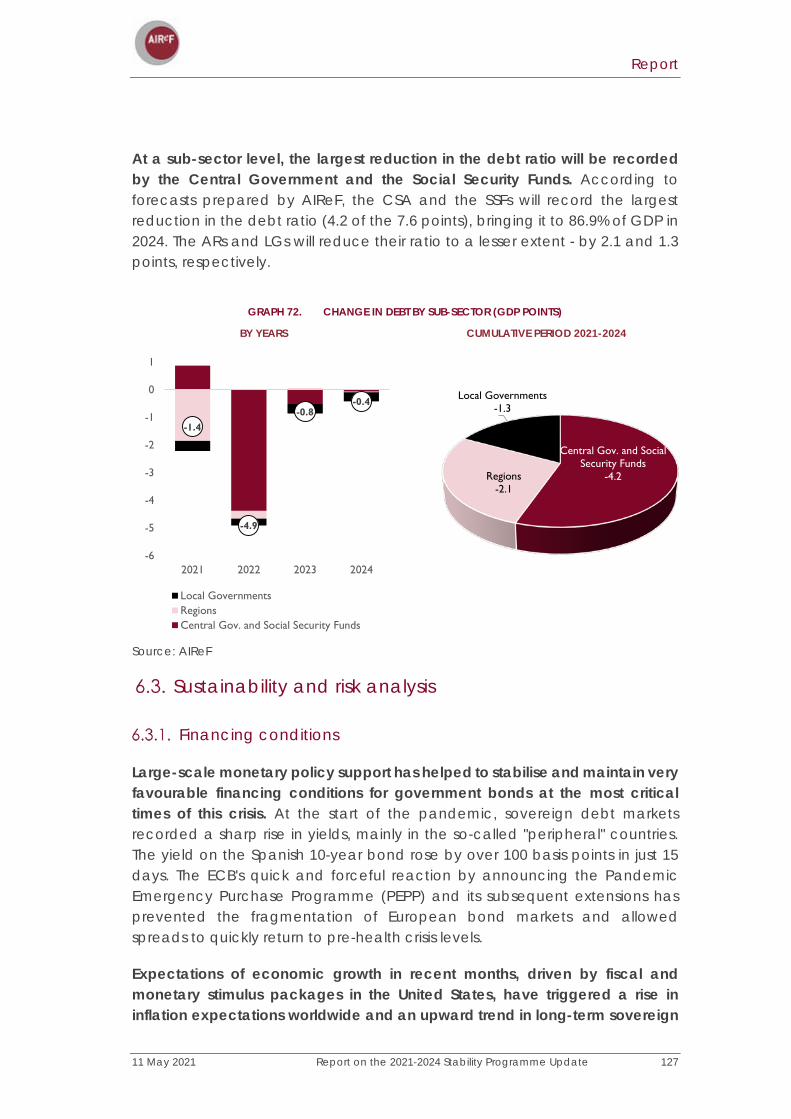
Report
11 May 2021 Report on the 2021-2024 Stability Programme Update 127
At a sub-sector level, the largest reduction in the debt ratio will be recorded by the Central Government and the Social Security Funds. According to forecasts prepared by AIReF, the CSA and the SSFs will record the largest reduction in the debt ratio (4.2 of the 7.6 points), bringing it to 86.9% of GDP in 2024. The ARs and LGs will reduce their ratio to a lesser extent - by 2.1 and 1.3 points, respectively.
GRAPH 72. CHANGE IN DEBT BY SUB-SECTOR (GDP POINTS)
BY YEARS CUMULATIVE PERIOD 2021-2024
Source: AIReF
Sustainability and risk analysis
Financing conditions
Large-scale monetary policy support has helped to stabilise and maintain very favourable financing conditions for government bonds at the most critical times of this crisis. At the start of the pandemic, sovereign debt markets recorded a sharp rise in yields, mainly in the so-called "peripheral" countries. The yield on the Spanish 10-year bond rose by over 100 basis points in just 15 days. The ECB's quick and forceful reaction by announcing the Pandemic Emergency Purchase Programme (PEPP) and its subsequent extensions has prevented the fragmentation of European bond markets and allowed spreads to quickly return to pre-health crisis levels.
Expectations of economic growth in recent months, driven by fiscal and monetary stimulus packages in the United States, have triggered a rise in inflation expectations worldwide and an upward trend in long-term sovereign
-1.4
-4.9
-0.8-0.4
-6
-5
-4
-3
-2
-1
0
1
2021 2022 2023 2024
Local GovernmentsRegionsCentral Gov. and Social Security Funds
Central Gov. and Social Security Funds
-4.2Regions-2.1
Local Governments-1.3
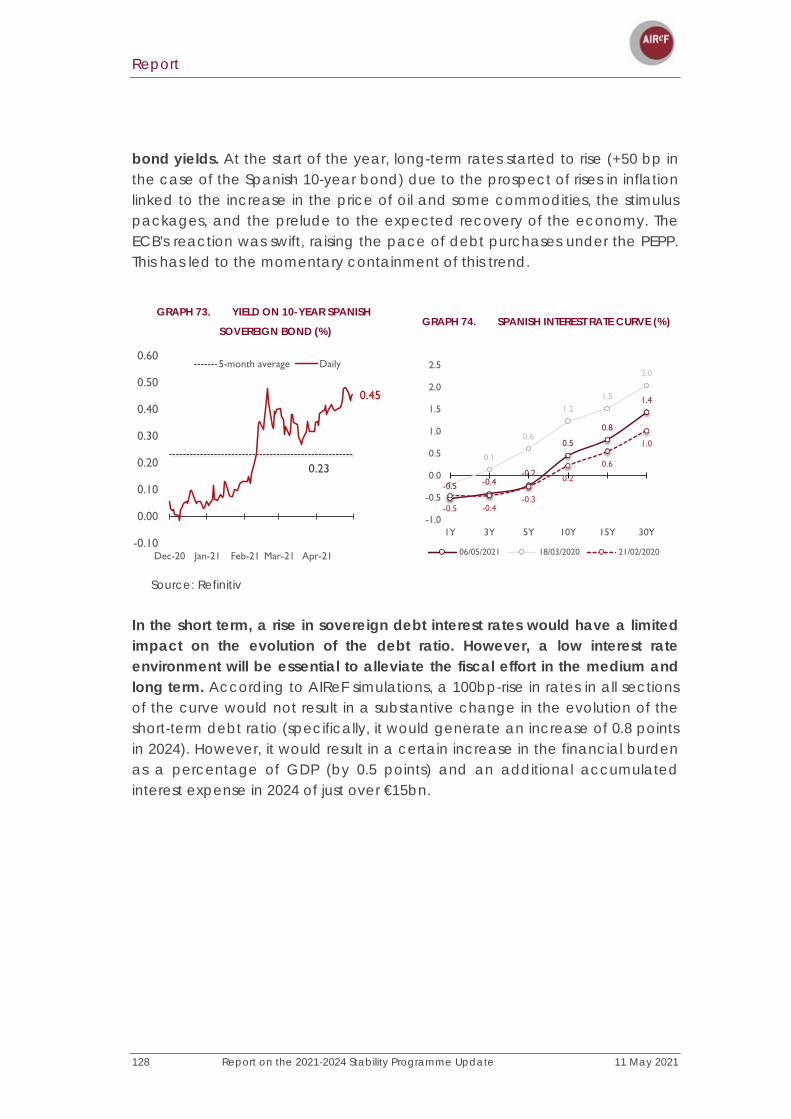
Report
128 Report on the 2021-2024 Stability Programme Update 11 May 2021
bond yields. At the start of the year, long-term rates started to rise (+50 bp in the case of the Spanish 10-year bond) due to the prospect of rises in inflation linked to the increase in the price of oil and some commodities, the stimulus packages, and the prelude to the expected recovery of the economy. The ECB's reaction was swift, raising the pace of debt purchases under the PEPP. This has led to the momentary containment of this trend.
GRAPH 73. YIELD ON 10-YEAR SPANISH
SOVEREIGN BOND (%) GRAPH 74. SPANISH INTEREST RATE CURVE (%)
Source: Refinitiv
In the short term, a rise in sovereign debt interest rates would have a limited impact on the evolution of the debt ratio. However, a low interest rate environment will be essential to alleviate the fiscal effort in the medium and long term. According to AIReF simulations, a 100bp-rise in rates in all sections of the curve would not result in a substantive change in the evolution of the short-term debt ratio (specifically, it would generate an increase of 0.8 points in 2024). However, it would result in a certain increase in the financial burden as a percentage of GDP (by 0.5 points) and an additional accumulated interest expense in 2024 of just over €15bn.
0.23
0.45
-0.10
0.00
0.10
0.20
0.30
0.40
0.50
0.60
Dec-20 Jan-21 Feb-21 Mar-21 Apr-21
5-month average Daily
-0.5 -0.4-0.2
0.5
0.8
1.4
0.1
0.6
1.21.5
2.0
-0.5 -0.4-0.3
0.2
0.6
1.0
-1.0
-0.5
0.0
0.5
1.0
1.5
2.0
2.5
1Y 3Y 5Y 10Y 15Y 30Y
06/05/2021 18/03/2020 21/02/2020
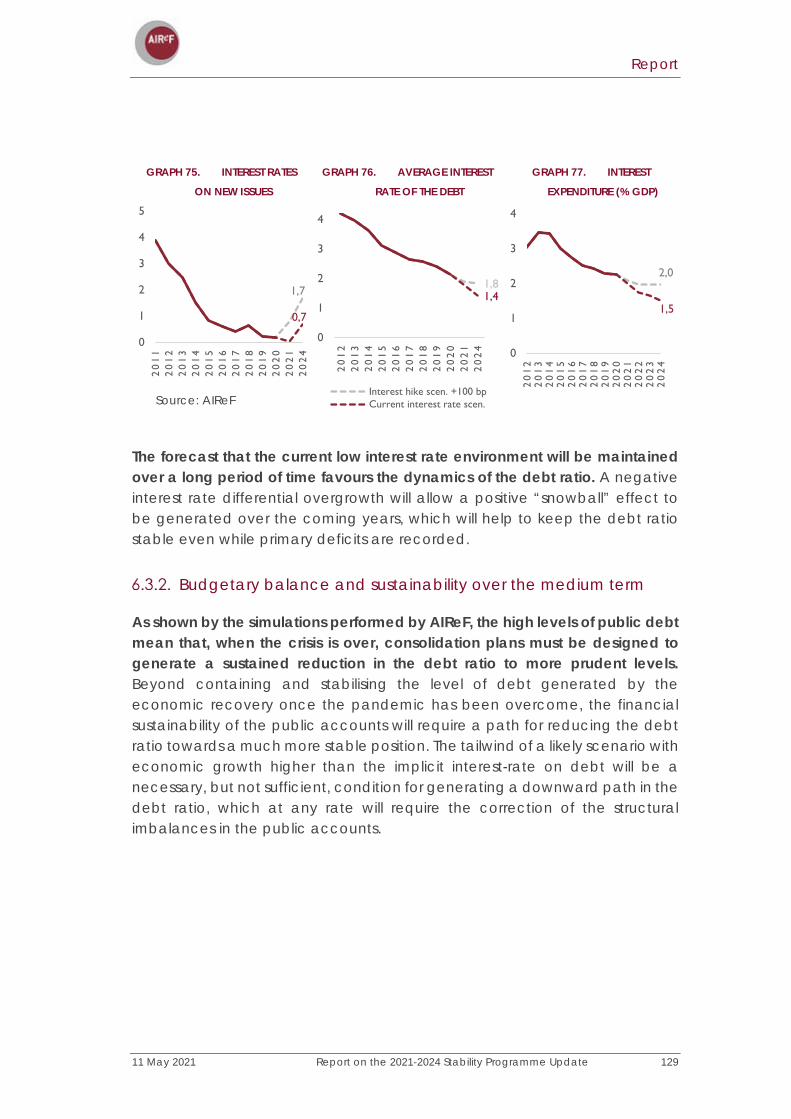
Report
11 May 2021 Report on the 2021-2024 Stability Programme Update 129
GRAPH 75. INTEREST RATES
ON NEW ISSUES
GRAPH 76. AVERAGE INTEREST
RATE OF THE DEBT
GRAPH 77. INTEREST
EXPENDITURE (% GDP)
Source: AIReF
The forecast that the current low interest rate environment will be maintained over a long period of time favours the dynamics of the debt ratio. A negative interest rate differential overgrowth will allow a positive “snowball” effect to be generated over the coming years, which will help to keep the debt ratio stable even while primary deficits are recorded.
Budgetary balance and sustainability over the medium term
As shown by the simulations performed by AIReF, the high levels of public debt mean that, when the crisis is over, consolidation plans must be designed to generate a sustained reduction in the debt ratio to more prudent levels. Beyond containing and stabilising the level of debt generated by the economic recovery once the pandemic has been overcome, the financial sustainability of the public accounts will require a path for reducing the debt ratio towards a much more stable position. The tailwind of a likely scenario with economic growth higher than the implicit interest-rate on debt will be a necessary, but not sufficient, condition for generating a downward path in the debt ratio, which at any rate will require the correction of the structural imbalances in the public accounts.
1,7
0,7
0
1
2
3
4
5
20
11
20
12
20
13
20
14
20
15
20
16
20
17
20
18
20
19
20
20
20
21
20
24
1,81,4
0
1
2
3
4
20
12
20
13
20
14
20
15
20
16
20
17
20
18
20
19
20
20
20
21
20
24
Interest hike scen. +100 bpCurrent interest rate scen.
2,0
1,5
0
1
2
3
4
20
12
20
13
20
14
20
15
20
16
20
17
20
18
20
19
20
20
20
21
20
22
20
23
20
24
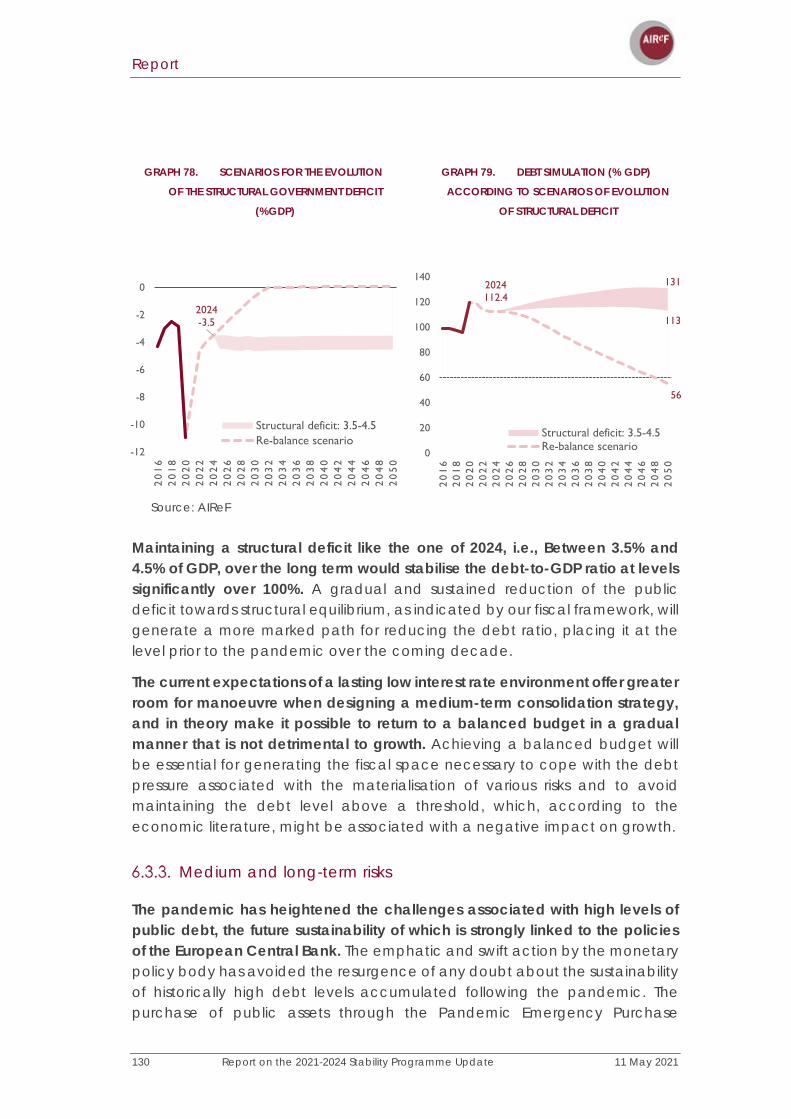
Report
130 Report on the 2021-2024 Stability Programme Update 11 May 2021
GRAPH 78. SCENARIOS FOR THE EVOLUTION
OF THE STRUCTURAL GOVERNMENT DEFICIT
(%GDP)
GRAPH 79. DEBT SIMULATION (% GDP)
ACCORDING TO SCENARIOS OF EVOLUTION
OF STRUCTURAL DEFICIT
Source: AIReF
Maintaining a structural deficit like the one of 2024, i.e., Between 3.5% and 4.5% of GDP, over the long term would stabilise the debt-to-GDP ratio at levels significantly over 100%. A gradual and sustained reduction of the public deficit towards structural equilibrium, as indicated by our fiscal framework, will generate a more marked path for reducing the debt ratio, placing it at the level prior to the pandemic over the coming decade.
The current expectations of a lasting low interest rate environment offer greater room for manoeuvre when designing a medium-term consolidation strategy, and in theory make it possible to return to a balanced budget in a gradual manner that is not detrimental to growth. Achieving a balanced budget will be essential for generating the fiscal space necessary to cope with the debt pressure associated with the materialisation of various risks and to avoid maintaining the debt level above a threshold, which, according to the economic literature, might be associated with a negative impact on growth.
Medium and long-term risks
The pandemic has heightened the challenges associated with high levels of public debt, the future sustainability of which is strongly linked to the policies of the European Central Bank. The emphatic and swift action by the monetary policy body has avoided the resurgence of any doubt about the sustainability of historically high debt levels accumulated following the pandemic. The purchase of public assets through the Pandemic Emergency Purchase
2024-3.5
-12
-10
-8
-6
-4
-2
0
20
16
20
18
20
20
20
22
20
24
20
26
20
28
20
30
20
32
20
34
20
36
20
38
20
40
20
42
20
44
20
46
20
48
20
50
Structural deficit: 3.5-4.5Re-balance scenario
2024112.4
56
0
20
40
60
80
100
120
140
20
16
20
18
20
20
20
22
20
24
20
26
20
28
20
30
20
32
20
34
20
36
20
38
20
40
20
42
20
44
20
46
20
48
20
50
Structural deficit: 3.5-4.5Re-balance scenario
131
113
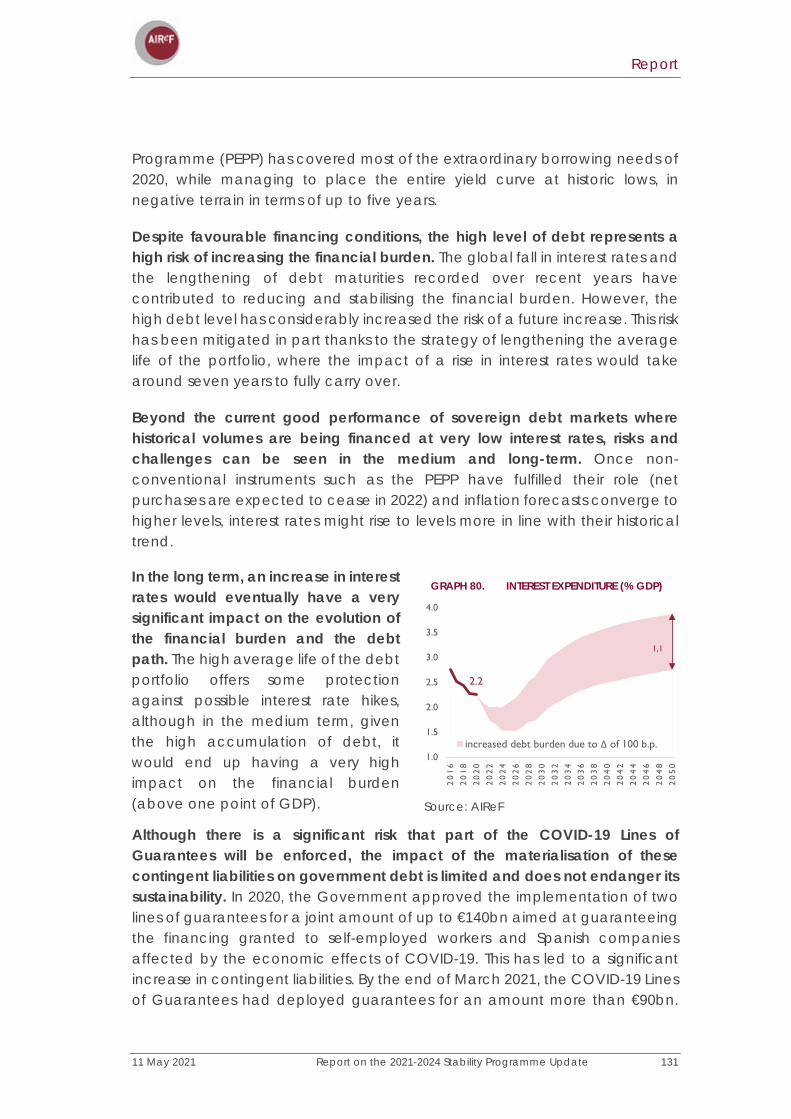
Report
11 May 2021 Report on the 2021-2024 Stability Programme Update 131
Programme (PEPP) has covered most of the extraordinary borrowing needs of 2020, while managing to place the entire yield curve at historic lows, in negative terrain in terms of up to five years.
Despite favourable financing conditions, the high level of debt represents a high risk of increasing the financial burden. The global fall in interest rates and the lengthening of debt maturities recorded over recent years have contributed to reducing and stabilising the financial burden. However, the high debt level has considerably increased the risk of a future increase. This risk has been mitigated in part thanks to the strategy of lengthening the average life of the portfolio, where the impact of a rise in interest rates would take around seven years to fully carry over.
Beyond the current good performance of sovereign debt markets where historical volumes are being financed at very low interest rates, risks and challenges can be seen in the medium and long-term. Once non-conventional instruments such as the PEPP have fulfilled their role (net purchases are expected to cease in 2022) and inflation forecasts converge to higher levels, interest rates might rise to levels more in line with their historical trend.
In the long term, an increase in interest rates would eventually have a very significant impact on the evolution of the financial burden and the debt path. The high average life of the debt portfolio offers some protection against possible interest rate hikes, although in the medium term, given the high accumulation of debt, it would end up having a very high impact on the financial burden (above one point of GDP).
GRAPH 80. INTEREST EXPENDITURE (% GDP)
Source: AIReF
Although there is a significant risk that part of the COVID-19 Lines of Guarantees will be enforced, the impact of the materialisation of these contingent liabilities on government debt is limited and does not endanger its sustainability. In 2020, the Government approved the implementation of two lines of guarantees for a joint amount of up to €140bn aimed at guaranteeing the financing granted to self-employed workers and Spanish companies affected by the economic effects of COVID-19. This has led to a significant increase in contingent liabilities. By the end of March 2021, the COVID-19 Lines of Guarantees had deployed guarantees for an amount more than €90bn.
2.2
1.0
1.5
2.0
2.5
3.0
3.5
4.0
20
16
20
18
20
20
20
22
20
24
20
26
20
28
20
30
20
32
20
34
20
36
20
38
20
40
20
42
20
44
20
46
20
48
20
50
increased debt burden due to Δ of 100 b.p.
1,1

Report
132 Report on the 2021-2024 Stability Programme Update 11 May 2021
The Government has included in the SPU an estimate of NPLs for an amount of €6bn in 2022 and €4bn in 2023, which are already reflected in the evolution of the deficit and debt path of those years. The materialisation of larger write-offs in the coming years would lead to an additional rise in the debt ratio. A sensitivity exercise indicates that for the debt-to-GDP ratio to increase by 1 to 2 percentage points over the next five years, an additional call on guarantees will be required over that period of between €15bn and €30bn.
Future evolution of pension expenditure and its impact on sustainability
The 2021-24 SPU presents the long-term projection of public expenditure associated with ageing from the 2021 Ageing Report, not yet published, in which the ratio of pension expenditure to GDP rises from 12.3% to 13% between 2019 and 2050. The European exercise incorporates demographic and macroeconomic assumptions common to all Member States under a no-policy-change principle The 2021-24 SPU recognises that the current no-policy-change assumption does not reflect recent economic policy decisions. Indeed, the baseline scenario for the European exercise involves the annual revaluation of pensions with the Pension Revaluation Index (PRI) and the application of the Sustainability Factor (SF) to new pensions from 2023. However, since 2018, the use of the PRI as an effective year-by-year revaluation mechanism has been abandoned, even if it has not been formally repealed. In addition, in 2021 it was agreed within the framework of social dialogue, following the recommendations of the Toledo Pact, to definitively abandon the PRI in favour of maintaining the purchasing power of pensions by revaluing them through the CPI and replacing the sustainability factor with another intergenerational equity mechanism to be defined.
The results of the Ageing Report should be supplemented by individual estimates that adequately reflect current pension policies. This exercise would make it possible to comply with the code of conduct18 agreed by the Economic and Financial Committee of the European Commission for the preparation of the Member States' Stability Programmes. This states that they should include all the necessary additional information, both of a quantitative and quantitative nature, to the forecasts in the joint exercise of the Ageing Report that are necessary to evaluate the sustainability of the public finances based on countries’ current policies.
18 “Specifications on the implementation of the Stability and Growth Pact and Guidelines on the format and content of Stability and Convergence Programmes”. ECOFIN 9344/17.
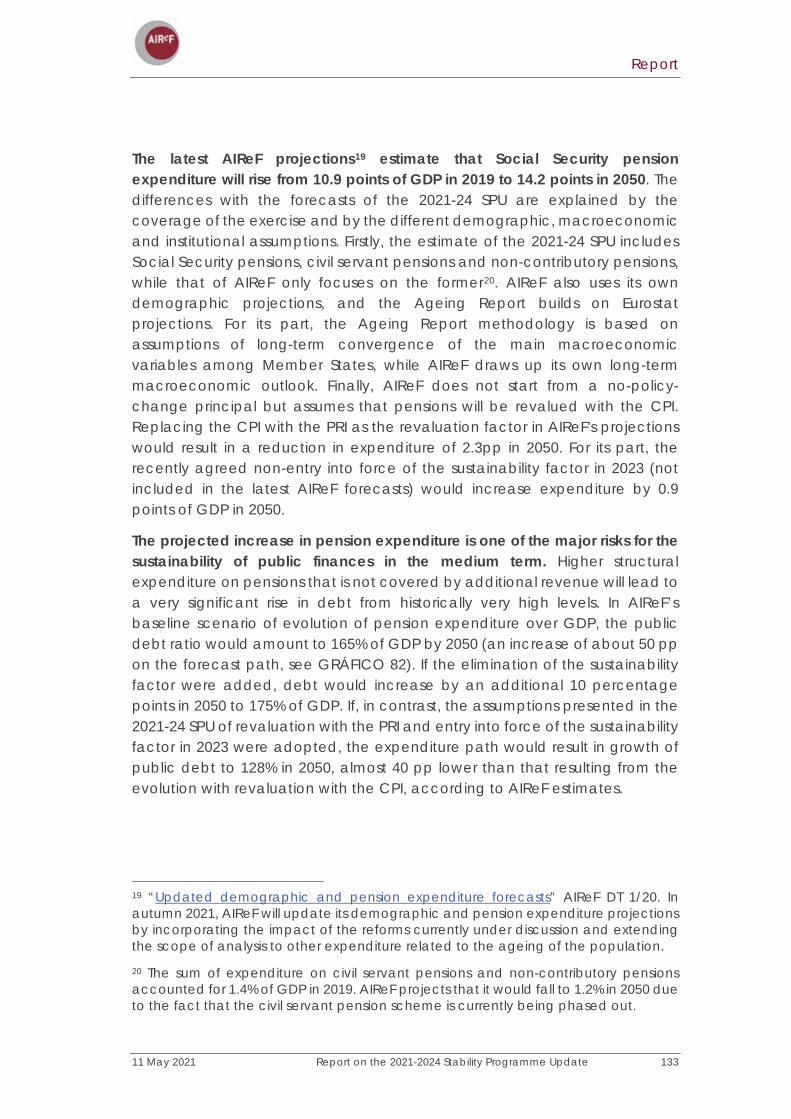
Report
11 May 2021 Report on the 2021-2024 Stability Programme Update 133
The latest AIReF projections19 estimate that Social Security pension expenditure will rise from 10.9 points of GDP in 2019 to 14.2 points in 2050. The differences with the forecasts of the 2021-24 SPU are explained by the coverage of the exercise and by the different demographic, macroeconomic and institutional assumptions. Firstly, the estimate of the 2021-24 SPU includes Social Security pensions, civil servant pensions and non-contributory pensions, while that of AIReF only focuses on the former20. AIReF also uses its own demographic projections, and the Ageing Report builds on Eurostat projections. For its part, the Ageing Report methodology is based on assumptions of long-term convergence of the main macroeconomic variables among Member States, while AIReF draws up its own long-term macroeconomic outlook. Finally, AIReF does not start from a no-policy-change principal but assumes that pensions will be revalued with the CPI. Replacing the CPI with the PRI as the revaluation factor in AIReF's projections would result in a reduction in expenditure of 2.3pp in 2050. For its part, the recently agreed non-entry into force of the sustainability factor in 2023 (not included in the latest AIReF forecasts) would increase expenditure by 0.9 points of GDP in 2050.
The projected increase in pension expenditure is one of the major risks for the sustainability of public finances in the medium term. Higher structural expenditure on pensions that is not covered by additional revenue will lead to a very significant rise in debt from historically very high levels. In AIReF’s baseline scenario of evolution of pension expenditure over GDP, the public debt ratio would amount to 165% of GDP by 2050 (an increase of about 50 pp on the forecast path, see GRÁFICO 82). If the elimination of the sustainability factor were added, debt would increase by an additional 10 percentage points in 2050 to 175% of GDP. If, in contrast, the assumptions presented in the 2021-24 SPU of revaluation with the PRI and entry into force of the sustainability factor in 2023 were adopted, the expenditure path would result in growth of public debt to 128% in 2050, almost 40 pp lower than that resulting from the evolution with revaluation with the CPI, according to AIReF estimates.
19 “Updated demographic and pension expenditure forecasts” AIReF DT 1/20. In autumn 2021, AIReF will update its demographic and pension expenditure projections by incorporating the impact of the reforms currently under discussion and extending the scope of analysis to other expenditure related to the ageing of the population.
20 The sum of expenditure on civil servant pensions and non-contributory pensions accounted for 1.4% of GDP in 2019. AIReF projects that it would fall to 1.2% in 2050 due to the fact that the civil servant pension scheme is currently being phased out.
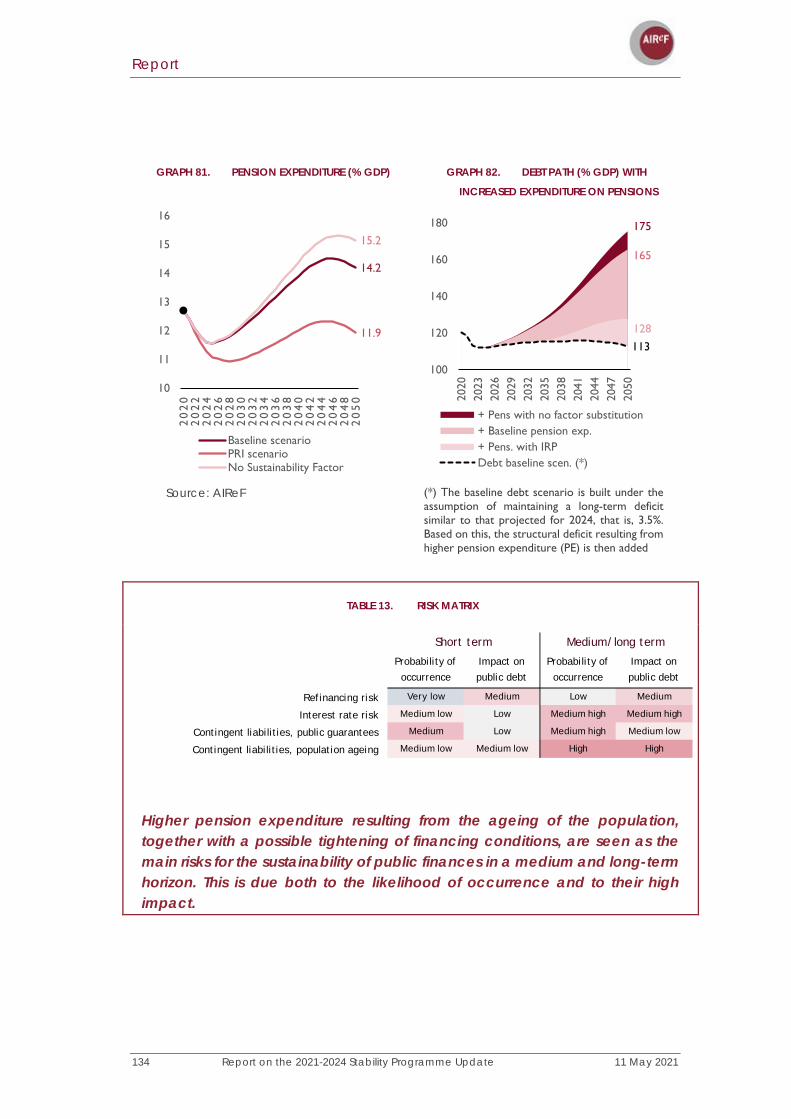
Report
134 Report on the 2021-2024 Stability Programme Update 11 May 2021
GRAPH 81. PENSION EXPENDITURE (% GDP) GRAPH 82. DEBT PATH (% GDP) WITH
INCREASED EXPENDITURE ON PENSIONS
Source: AIReF (*) The baseline debt scenario is built under the assumption of maintaining a long-term deficit similar to that projected for 2024, that is, 3.5%. Based on this, the structural deficit resulting from higher pension expenditure (PE) is then added
TABLE 13. RISK MATRIX
Higher pension expenditure resulting from the ageing of the population, together with a possible tightening of financing conditions, are seen as the main risks for the sustainability of public finances in a medium and long-term horizon. This is due both to the likelihood of occurrence and to their high impact.
14.2
11.9
15.2
10
11
12
13
14
15
16
20
20
20
22
20
24
20
26
20
28
20
30
20
32
20
34
20
36
20
38
20
40
20
42
20
44
20
46
20
48
20
50
Baseline scenarioPRI scenarioNo Sustainability Factor
113
100
120
140
160
180
2020
2023
2026
2029
2032
2035
2038
2041
2044
2047
2050
+ Pens with no factor substitution+ Baseline pension exp.+ Pens. with IRPDebt baseline scen. (*)
175
165
128
Probability of occurrence
Impact on public debt
Probability of occurrence
Impact on public debt
Refinancing risk Very low Medium Low Medium
Interest rate risk Medium low Low Medium high Medium high
Contingent liabilities, public guarantees Medium Low Medium high Medium low
Contingent liabilities, population ageing Medium low Medium low High High
Short term Medium/long term
11 May 2021 Report on the 2021-2024 Stability Programme Update 135
RECOMMENDATIONS
New Recommendations.
Medium-term fiscal strategy
In its previous reports, AIReF has been recommending the need to design a realistic and credible fiscal strategy that guarantees the sustainability of the public finances. In successive reports issued by AIReF throughout 2020, the Government has been recommended to: “establish a national medium-term fiscal strategy that will act as fiscal guidance and will realistically and credibly ensure the financial sustainability of the General Government. This requires:
- The support of all tiers of government, considering their fiscal realities in terms of revenue and powers, to ensure appropriate coordination and co-responsibility.
- Considering the public debt levels and fiscal risks, particularly those assumed as a result of managing the COVID-19 crisis.
- Establishing a tentative timetable for achieving milestones.
- Acting as a framework for the rebalancing plans of the General Government and promoting coordination of the strategy with the recovery and resilience plan.
AIReF highlights a threefold reason why it is important to provide public authorities with a medium-term perspective: (1) to reflect the multi-year impact of projects financed with European recovery funds; (2) to provide certainty on the specific lines of action and to guide fiscal policy amid the uncertainty resulting from the pandemic; and (3) to comply with the Organic
Report
136 Report on the 2021-2024 Stability Programme Update 11 May 2021
Law on Budgetary Stability and Financial Stability requirement to submit a medium-term plan (rebalancing plan) once the escape clause is triggered.
Medium-term budgetary planning is particularly important in a complex context in which fiscal policy will be marked by the conflicting effect of different factors at the time the economy leaves the crisis. The risk of the expenditure associated with the crisis becoming structural is combined with the provision of additional, but temporary, resources for the start-up of new projects, short-term or structural, initially charged to the RTRP. Therefore, to guarantee sustainability, it is necessary to ensure the structural financing of any expenditure that becomes permanent originating from both the pandemic and the RTRP.
In aggregate terms, it is necessary to lay down a fiscal policy that helps to recover pre-crisis activity levels and drive the future growth of the economy. At the same time, the sustainability of public finances requires reducing public debt to less vulnerable levels. This involves reducing the structural deficit that already existed before the crisis and facing future challenges such as an ageing population. Although the implementation of the RTRP might help to reconcile both objectives, fitting all these factors together requires a realistic and credible medium-term fiscal strategy that guarantees the sustainability of the General Government.
In this regard, the SPU already implies having a first approximation as it contains a macroeconomic scenario and a fiscal strategy until 2024 that outlines a way out of the current crisis.
However, this fiscal strategy is incomplete, principally in two respects. Firstly, it has a limited time scope insofar as at the end of the forecast period the deficit level still exceeds that necessary to steer the debt towards more sustainable levels. Secondly, it does not address essential elements such as the potential structural effect of the RTRP on government revenue and expenditure. Firstly, it does not explain which part of the investments will lead to structural expenditure increases after the end of the plan. Secondly, the macroeconomic and fiscal effects of the most important reforms contained in the RTRP, such as those relating to pensions, the labour market, taxes, and the modernisation of the General Government, are not quantified.
In this context, AIReF once again insists on the need for a full and comprehensive medium-term fiscal strategy. The SPU is a starting point but is insufficient as shown by the sustainability analysis of the government debt and the limitations for analysing the macroeconomic and fiscal implications of the RTRP. In addition, as AIReF has repeatedly pointed out in previous reports, the
Report
11 May 2021 Report on the 2021-2024 Stability Programme Update 137
SPU still does not have sufficient content to be the main instrument for the medium-term budgetary planning of the General Government.
For all these reasons, AIReF makes the following recommendations to the Ministry of Finance:
1. The Ministry should complete the medium-term fiscal strategy to achieve a level of deficit that is sufficient to steer the debt towards more sustainable levels that will reduce the vulnerability of the Spanish economy, which involves:
a. Extending the time horizon of the strategy
b. Integrating into the strategy the macroeconomic and fiscal implications of the implementation of the investments and reforms set out in the RTRP
Live recommendations21
Content of the SPU
The SPU, as stated in the document itself, is considered as a national medium-term fiscal plan referred to in Article 4 of Regulation (EU) 473/2013. Although 2021-2024 SPU collects more qualitative information by sub-sector than on other occasions, it still does not include all the information necessary to be considered as a fiscal strategy of the General Government as a whole.
As AIReF noted in its Opinion on Fiscal Transparency in the General Government in Spain22, the budgetary process is fragmented, and it is not possible to ensure consistency between its main elements: the Stability Programme Update, the budgets of each public authority and the Budgetary Plan. Consequently, the absence of a medium-term budgetary framework is
21 This section sets out recommendations made in previous reports which, even though the Ministry of Finance has explained the reasons why it deviates from compliance with the recommendations, AIReF considers them important for achieving the effectiveness and credibility of fiscal rules and a robust fiscal framework, which it believes is not guaranteed by the usual system and practices. It therefore considers that these recommendations remain in force, they are “live recommendations” and it urges the Ministry of Finance to comply with them. Should this not be the case, it is not necessary to explain once again the reasons for deviating from them, unless they are no longer the same.
22https://www.airef.es/wp-content/uploads/2021/04/ANEXOS-OPINION-TRANSPARENCIA/Opinion-Transparencia-Fiscal.pdf

Report
138 Report on the 2021-2024 Stability Programme Update 11 May 2021
one of the main weaknesses of the Spanish budgetary system. On the one hand, the multi-annual budget scenarios in which the GSB must be framed are not published. In addition, at a Central Government level, the medium-term forecasts made are performed at an aggregate level for the General Government as a whole and in national accounting terms, without developing their link with the annual budgets of the different General Government sub-sectors.
AIReF considers that, in a decentralised state such as Spain, a medium-term national fiscal framework should collect information broken down by sub-sector that is consistent with aggregate information for the General Government as a whole.
For this reason, AIReF maintains the recommendation in relation to the SPU of previous years to:
2. Include the following information in the Stability Programme Update (SPU):
• Budgetary projections for the General Government as a whole and for each of the sub-sectors incorporating the measures and showing their contribution to the reduction in the planned deficit.
• Government debt targets broken down by sub-sector.
• Detailed information for analysing the expenditure rule for each of the sub-sectors (computable expenditure and reference rates for all the years covered by the SPU).
• More information on any risks which, should they occur, might affect budgetary or debt stability targets.
Recommendations contained in the endorsement of the macroeconomic forecasts
On April 30th, AIReF published the endorsement of the SPU's macroeconomic forecasts, which contained two recommendations which are detailed below, and which have already been forwarded to the recipient administrations.
Memorandum of Understanding
Firstly, AIReF once again reiterated the need for the process of endorsing the macroeconomic forecasts to be regulated by an agreement between the parties. With the aim of making the process of endorsing the macroeconomic framework more transparent and efficient, AIReF reiterates its recommendation to the Government to regulate the flow and timing of the exchange of information through an agreement or "Memorandum of

Report
11 May 2021 Report on the 2021-2024 Stability Programme Update 139
Understanding”, in line with current practices in peer countries regarding the interaction between the Government and the National Independent Fiscal Institution.
Information for the endorsement of the macroeconomic forecasts
AIReF also called for more information on the budgetary and fiscal measures included in the macroeconomic scenario with the aim of increasing the rigour of the endorsement process. The law establishes that the endorsement refers exclusively to the macroeconomic outlook and not to the public finances’ scenario. However, given the interrelations between the two aspects, AIReF believes that an endorsement with greater rigour would require more detail on the measures incorporated, particularly when these are of the importance of those contained in the European Recovery, Transformation and Resilience Plan.
The president of AIReF
Cristina Herrero Sánchez

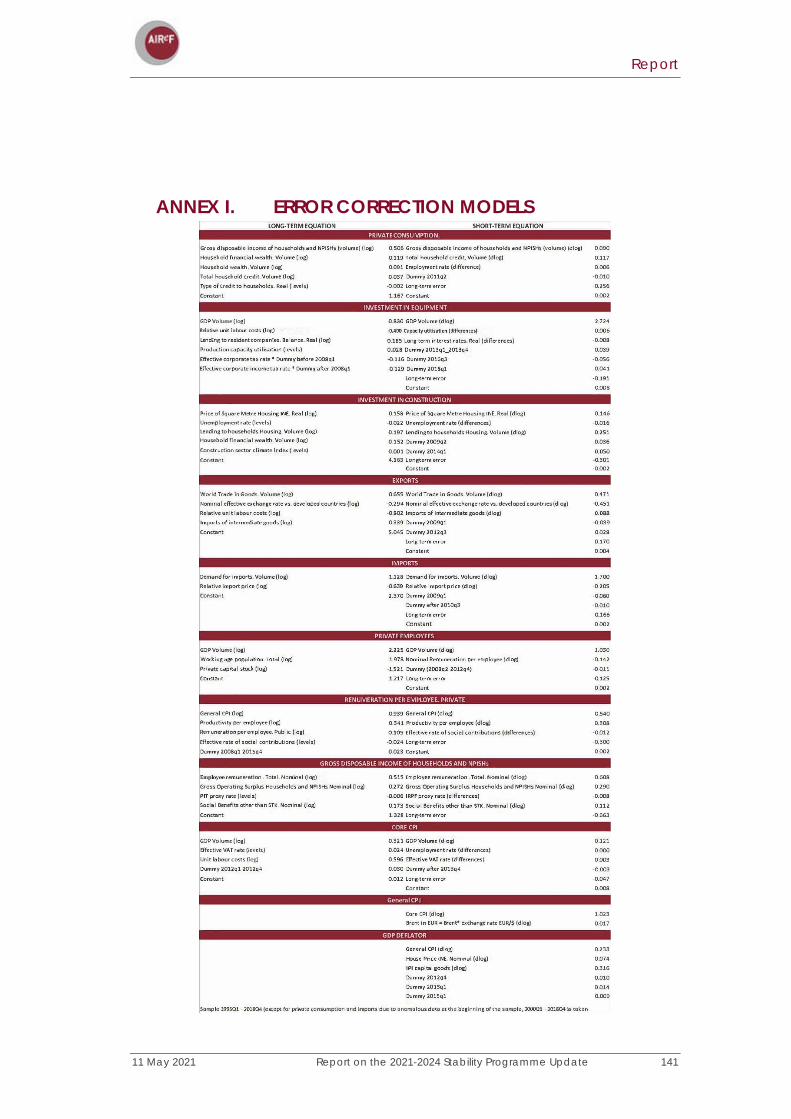
Report
11 May 2021 Report on the 2021-2024 Stability Programme Update 141
ANNEX I. ERROR CORRECTION MODELS