Report on the 2016 Proficiency Test of the ... - wur.nl
57
Carlos Oliveira Gonçalves Elena Cubero-Leon Carsten Miscke Stefanka Bratinova Joerg Stroka Determination of tropane alkaloids in tea and herbal infusions Report on the 2016 Proficiency Test of the European Union Reference Laboratory for Mycotoxins for the Network of National Reference Laboratories 2017 EUR EUR 28662 EN
Transcript of Report on the 2016 Proficiency Test of the ... - wur.nl

Carlos Oliveira Gonçalves Elena Cubero-Leon Carsten Miscke Stefanka Bratinova Joerg Stroka
Determination of tropane
alkaloids in tea and herbal
infusions
Report on the 2016 Proficiency Test of the European Union Reference Laboratory for Mycotoxins for the Network of National Reference Laboratories
2017
EUR EUR 28662 EN

This publication is a Technical report by the Joint Research Centre (JRC), the European Commission’s science and knowledge service. It aims to provide evidence-based scientific support to the European policymaking process. The scientific output expressed does not imply a policy position of the European Commission. Neither the European Commission nor any person acting on behalf of the Commission is responsible for the use that might be made of this publication. Contact information Name: Joerg Stroka Address: European Commission, Joint Research Centre Directorate F - Health, Consumers & Reference Materials, Retieseweg 111, 2440 Geel, Belgium Email: [email protected] Tel.: +32 14 571229 JRC Science Hub
https://ec.europa.eu/jrc JRC 107145 EUR 28662 EN
PDF ISBN 978-92-79-69848-4 ISSN 1831-9424 doi:10.2760/90137
Luxembourg: Publications Office of the European Union, 2017 © European Union, 2017
The reuse of the document is authorised, provided the source is acknowledged and the original meaning or message of the texts are not distorted. The European Commission shall not be held liable for any consequences stemming from the reuse. How to cite this report: Carlos Oliveira Gonçalves, Elena Cubero-Leon, Carsten Miscke, Stefanka Bratinova, Joerg Stroka, Report on the 2016 Proficiency Test of the European Union Reference Laboratory for Mycotoxins
for the Network of National Reference Laboratories: Determination of tropane alkaloids in tea and herbal
infusions, EUR 28662 EN, doi:10.2760/90137 All images © European Union 2017
1
Report on the 2016 Proficiency Test of the European Union Reference Laboratory for Mycotoxins for the Network of National Reference Laboratories

2
Table of Contents
Acknowledgements ................................................................................................ 3
Abstract ............................................................................................................... 4
1. Introduction ................................................................................................... 5
2. Scope ............................................................................................................ 6
3. Confidentiality ................................................................................................ 6
4. Time frame .................................................................................................... 6
5. Material ......................................................................................................... 6
5.1 Preparation ............................................................................................... 6
5.2 Homogeneity ............................................................................................. 7
5.3 Stability .................................................................................................... 7
5.4 Distribution ............................................................................................... 7
6. Instructions to participants .............................................................................. 8
7. Reference values and their uncertainties ............................................................ 8
8. Evaluation of results ....................................................................................... 9
8.1 General observations .................................................................................. 9
8.2 Scores and evaluation criteria ...................................................................... 9
8.3 Laboratory results and scoring ..................................................................... 9
9. Evaluation of the questionnaire ...................................................................... 20
9.1. Experience and organisational aspects ....................................................... 20
9.2. Analytical aspects ................................................................................... 22
9.3. Methods' overview .................................................................................. 23
10. Conclusions ................................................................................................ 24
References ......................................................................................................... 26
List of abbreviations and definitions ....................................................................... 27
9. Annexes ...................................................................................................... 28
9.1 Opening of registration ............................................................................. 28
9.2 Homogeneity test ..................................................................................... 29
9.3 Stability study ......................................................................................... 35
9.4 Accompanying letter ................................................................................. 36
9.5 Acknowledgement of receipt form .............................................................. 38
9.6 Questionnaire .......................................................................................... 39
9.7 Kernel density plots .................................................................................. 40
9.8. Experimental details ................................................................................ 45
9.8.1. Method performance characteristics ........................................................ 45
9.8.2. Analytical conditions ............................................................................. 46

3
Acknowledgements
The organisers of the study would like to thank the colleagues involved in the project for their support. The laboratories that participated in this exercise, listed in Table 1, are also sincerely acknowledged.
Table 1 - Participating laboratories
Department Country
Department for Pesticide and Food Analytics (PLMA) Austria
ANALYTEC® Labor für Lebensmitteluntersuchung und Umweltanalytik Austria
CODA-CERVA-NRL Mycotoxins, O.D. Chemical Safety of the Food chain, Toxins and Natural components
Belgium
Euroinspekt-Croatiakontrola Croatia
Andrija Stampar Teaching Institute of Public Health, Department of Environmental Protection and Health Ecology
Croatia
Bayerisches Landesamt für Gesundheit und Lebensmittelsicherheit, LM Zentrale Analytik Germany
Gesellschaft für Bioanalytik mbH Germany
Landesuntersuchungsamt Rheinland-Pfalz Germany
Landesamt für Verbraucherschutz Sachsen-Anhalt, Fachbereich Lebensmittelsicherheit Germany
Lower Saxony State Office for Consumer Protection and Food Safety Germany
Chemical and Veterinary Analytical Institute, Muensterland-Emscher-Lippe (CVUA-MEL) Germany
Eurofins WEJ Contaminant GmbH Germany
PhytoLab GmbH & Co KG Germany
SGS, Department of Chromatography Germany
Quality Systems International, AOII Germany
Landesbetrieb Hessisches Landeslabor (LHL), Standort Kassel Germany
Chemisches und Veterinäruntersuchungsamt Rhein Ruhr Wupper Germany
Federal Institute for Risk Assessment, Unit Contaminants (FG82) Germany
Landeslabor Berlin-Brandenburg Germany
Thueringer Landesamt für Verbraucherschutz; Abt.4 Dezernat 45 Germany
LEON Institute of Applied Analytics and Research GmbH Germany
Institut Kirchhoff Berlin GmbH, R&D Management Germany
Fa. Teekanne GmbH & Co.KG, Labor für QS Germany
General Chemical State Laboratory of Greece, A' Chemical Service of Athens Greece
Public Analyst's Laboratory Dublin Ireland
Istituto Zooprofilattico Sperimentale Lombardia ed Emilia Romagna (ISZLER) - Chemical Department - Bologna
Italy
Veterinary Public Health and Food Safety - Istituto Superiore di Sanità Italy
Laboratoire National de Santé - Depart. Food Control Luxembourg
IRTA - Chemical Food Safety Spain
National Center for Food Spanish Consumer, Food Safety and Nutrition Agency Spain
RIKILT - Wageningen UR The Netherlands
Nofa Lab B.V The Netherlands
Fera Science Ltd., Food Chemistry Dept. United Kingdom

4
Abstract
Tropane alkaloids (TAs) are toxins found in a wide variety of plant species growing in mild climates. The most well-known are Datura, Atropa and Hyoscyamus sp., belonging to the Solanaceae family. The TAs family comprises more than 200 compounds, of which atropine and scopolamine are the most active producing anticholinergic symptoms (e.g. blurred vision, dry mouth, muscle spasms, tachycardia and death) if ingested in toxic quantities. The presence of botanical impurities (e.g. seeds, leaves and roots) has been reported in a variety of tea and herbal blends, stressing the need to control the quality of these products in the EU market.
The European Union Reference Laboratory (EURL) for Mycotoxins organised a proficiency test (PT) on the determination of TAs (atropine and scopolamine) in tea and herbal infusions upon request from DG SANTE. The measurand levels were targeted to provide insight on the measurement capabilities of EU Member States' laboratories at concentrations close to the recommended limit of quantification (LOQ) established by the Commission Recommendation 2015/976 (preferably below 5 µg/kg and not higher 10 µg/kg). Additionally, the ratio of atropine to scopolamine was kept as native in the plant materials in some samples.
Three matrices appropriately processed were provided to the participants: black tea, peppermint leaves and fennel seeds. The concentrations of atropine varied from 8.3 to 42.2 µg/kg while those of scopolamine ranged from 1.5 to 20.8 µg/kg. The participants were asked to determine atropine and scopolamine in 6 contaminated samples (2 per matrix) and 3 blank materials spiked by them with a TAs solution of unknown concentration. This setup was also aimed to allow a preliminary assessment of the robustness of the EURL-developed method.
Thirty-three laboratories from 11 Member States joined the PT, with a very significant participation from Germany. The performance of the laboratories was assessed using z-scores with regard to the assigned values obtained by exact matching double isotope dilution mass spectrometry (EMD-IDMS), in line with the ISO 13528:2015. In all cases, the consensus values derived from the participants' data were within the range of the assigned values, considering the respective confidence intervals. On average, eighty-seven percent of the z-scores for atropine and 84 % for scopolamine fell in the acceptable range (|z| ≤ 2). The success rate varied from 83 to 94 % for atropine and from 67 to 94 % for scopolamine, across the distributed matrices and concentration levels. The robust standard deviations of the reported results for both TAs were in good agreement with the target standard deviation (22 %).
The results of this PT indicate that EU Member States’ laboratories can determine atropine and scopolamine reliably in tea and herbal infusions at levels relevant to the current legislation (Commission Recommendation 2015/976).
5
1. Introduction
Plant toxins have been recognised as one of the most widespread and potent groups of toxicants. Tropane alkaloids (TAs) occur mainly in Datura, Atropa and Hyoscyamus sp., belonging to the Solanaceae family, besides a variety of other families such as Erythroxylaceae, Brassicaceae, Rhizophoraceae, Proteaceae, Euphorbiaceae, Convolvulaceae and Cruciferae [1]. Datura stramonium, also known as Jimson weed or thorn apple, is widely distributed in temperate and tropical zones of the world. Seeds of this plant have been found as impurities in important agricultural crops such as linseed, soybean, millet, sunflower and buckwheat and products thereof. Other well-known TA-containing plants are the deadly nightshade (Atropa belladonna), henbane (Hyoscyamus
niger) and mandrake (Mandragora officinarum). The consumption of small quantities of parts of these plants has caused severe intoxication, including deaths in young children [2]. As a result of the anticholinergic activity of the TAs, the following intoxication symptoms may be observed: blurred vision, pupil dilation, dry mouth, vomiting, clouded consciousness, muscle spasms, low body temperature, hallucinations, tachycardia, and ultimately death [1,2]. Among the over 200 TAs known, the most studied and biologically active are (-)-hyoscyamine and (-)-scopolamine enantiomers. Due to analytical limitations, it is not always possible to distinguish between the enantiomers of hyoscyamine; therefore the racemate (atropine) is usually determined [1-3]. Their structures can be found below.
Scopolamine Atropine Over the past decades, several TA intoxications from the consumption of contaminated herbal teas; e.g. burdock (Arctium) root tea, nettle (Urtica) tea, comfrey (Symphytum) tea and Paraguay (Ilex paraguariensis)) tea, were reported [3]. The most often reported route of ingestion by humans is through tea (contaminated or mislabelled), although ingesting seeds or other plant parts and smoking dried leaves are also common. In 2013 in the Netherlands, four persons were hospitalized after developing typical signs of anticholinergic poisoning within 2 hours after drinking tea prepared from marshmallow (Althaea officinalis) root that was contaminated with A. belladonna root. In a survey carried out in the Israeli market, out of 8 different herbal teas investigated, atropine and scopolamine occurred in 80 % of the peppermint samples with mean values of 171 µg/kg (range: 20–208 µg/kg) and 81 µg/kg (range: 14–171 µg/kg), respectively. Although the concentrations per tea bag were below the recommended acute reference dose, frequent consumption of highly contaminated peppermint teas for long periods of time might expose humans to hazardous adverse effects [3]. In 2015, the European Commission published a Recommendation to the Member States (2015/976) to monitor the presence of tropane alkaloids in food commodities, among them: food supplements, teas and herbal infusions [4].
A PT was organised by the EURL-Mycotoxins to underpin and assess the measurement capability of Member States' laboratories concerning the determination of atropine and scopolamine in tea and herbal infusions. Laboratories that didn't have a method already implemented for this determination were offered the possibility to request a suitable method description. The concentrations of atropine and scopolamine were planned to resemble a natural contamination, in part of the samples.

6
2. Scope
As stated in Article 32 of Regulation (EC) No 882/2004 [5], one of the core duties of the EURL is to organise PTs for the benefit of the National Reference Laboratories (NRLs). Given the Recommendation 2015/976 [4] from the European Commission and the envisaged future legislation setting maximum limits, the EURL-Mycotoxins organised on the request of DG SANTE a proficiency test on the determination of tropane alkaloids (atropine and scopolamine) in tea and herbal infusions. The target concentration was set at the LOQ requirement established in the above mentioned Recommendation (10 µg/kg) and the levels covered the range from 1.5 to 42 µg/kg, respecting the tropane alkaloids' natural proportion. This proficiency test was addressed to the EU Member States' competent laboratories (designated by the competent national authority) and expert laboratories. Participation was free of charge and not mandatory. Forty-two laboratories from 13 Member States registered for the PT. The EURL for Mycotoxins performed the planning, execution and assessment of the measurement results based on the requirements laid down in the legislation and followed the administrative and logistic procedures of the ISO/IEC 17043:2010 [6]. The team who organized this PT is an ISO/IEC 17043:2010 accredited PT provider [7].
3. Confidentiality
Confidentiality of the identity of participants and their results towards third parties is guaranteed.
4. Time frame
The PT was announced on the EURL-Mycotoxins' webpage [7] and by direct mailing to NRLs, Official Control Laboratories (OCLs) and expert laboratories on 26 and 27 October 2015. The registration for this PT was open until 06 January 2016 (Annex 9.1). The samples were dispatched between 22 and 23 February 2016 and the participants were given six weeks to analyse the samples and to report the results along with the questionnaire duly filled. The deadline for reporting the results was 04 April 2016.
5. Material
5.1 Preparation
Three different teas and herbal products (black Assam tea, peppermint leaves and fennel seeds) were kindly supplied by the german association THIE - tea & herbal infusions Europe. These materials were milled to pass a 2 mm sieve using a Retsch ZM200 mill (Retsch GmbH, Haan, Germany). The acquired materials were shown to be blank. In order to resemble a natural contamination, three materials were spiked with suitable amounts of Datura stramonium (stems and seeds) extracts in methanol. In another three materials, the concentration of scopolamine was raised to approximate the proportion that can be found in other plant species and to provide various combinations of the analytes over the PT items. Batches of approximately 4 kg of the three teas and herbs were spiked with the respective methanol extracts following an in-house procedure1, each one at low and high contamination levels. Then, the materials were
1 The procedure used was based on the dilution of the methanol extracts in t-butylmethylether, which then was used to bedew the material. This allowed obtaining a rather homogeneous moistened mix, which was then allowed to evaporate prior further processing.

7
thoroughly homogenised, packed in amber plastic bottles in 25 g portions and stored in the freezer until dispatch. The participants were also provided with blank matrices for method optimization and to prepare spiked samples.
5.2 Homogeneity
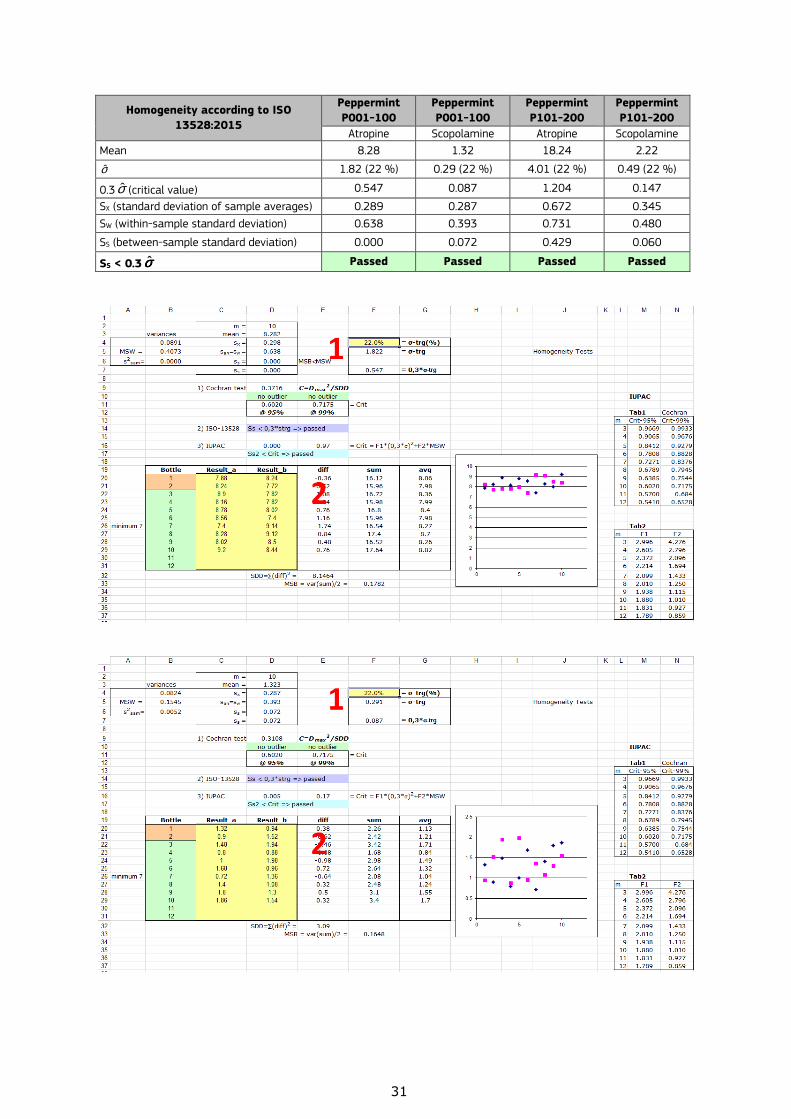
For homogeneity testing 10 units per material (2 black teas, 2 peppermint and 2 fennel materials) were selected randomly. Two independent determinations were performed per bottle using a liquid chromatography-isotope dilution tandem mass spectrometry detection (LC-ID-MS/MS) based method. Homogeneity was evaluated according to the ISO 13528:2015 standard [8]. The materials proved to be adequately homogeneous (Annex 9.2).
5.3 Stability
The stability study was conducted following an isochronous experimental design [9]; -70 °C was chosen as the reference temperature for sample storage. Stability was assessed at the following test temperatures: room temperature (≈20 °C), 4 °C and -18 °C. The periods of time considered in this study were: 14, 25 and 49 days. The stability was evaluated according to the requirements of the ISO 13528:2015 [8]. A linear regression was drawn for each tested temperature over the duration of the PT, and the significance of the slope departure from zero at 95 % confidence level was verified (Annex 9.3). The materials proved to be adequately stable at room temperature, 4 °C and 18 °C for the period between dispatch (t=0) and the submission date of the last results (t=49 days). An exception was noted for atropine in fennel at room temperature, which underwent a decrease in concentration of 18.6 % after 49 days. Nevertheless, shipment of the PT items was carried out under cooling conditions and the participants were instructed to store the PT items at -18 °C until analysis; therefore, this finding is not expected to have any impact on the participants' performance.
5.4 Distribution
The test materials were dispatched in polystyrene boxes, containing cooling packs, on 22 and 23 February 2016. The samples were mostly received within 24 hours after dispatch. Each participant received: a) nine test materials for analysis, packed in amber plastic bottles - Samples B001-100 and B101-200 – black tea - Samples P001-100 and P101-200 – peppermint leaves - Samples F001-100 and F101-200 – fennel seeds - Peppermint blank, Black tea blank and Fennel seeds blank b) five amber glass ampoules containing - Isotope labelled internal standard solution (ISTD mix) - Tropane Alkaloids standard solution (TA mix) - Spiking solutions specific for black tea, peppermint leaves and fennel seeds c) accompanying letter with instructions on sample handling and reporting (Annex 9.4) d) a sample receipt form (Annex 9.5) and e) laboratory specific reporting files with a lab code (by email). The materials were shipped such that 4 °C was not exceeded. Upon arrival, storage was required to be at -18 °C until analysis.

8
6. Instructions to participants
The scope of the PT and the instructions for sample handling and reporting was communicated to the participants via an accompanying letter (Annex 9.4). The laboratories were required to report the concentrations of atropine and scopolamine (in µg/kg), as it was standard practice in their laboratory. Then, in the Questionnaire (Annex 9.6), participants were asked to mention whether the results were corrected for recoveries or not and provide the recoveries figures (in %).
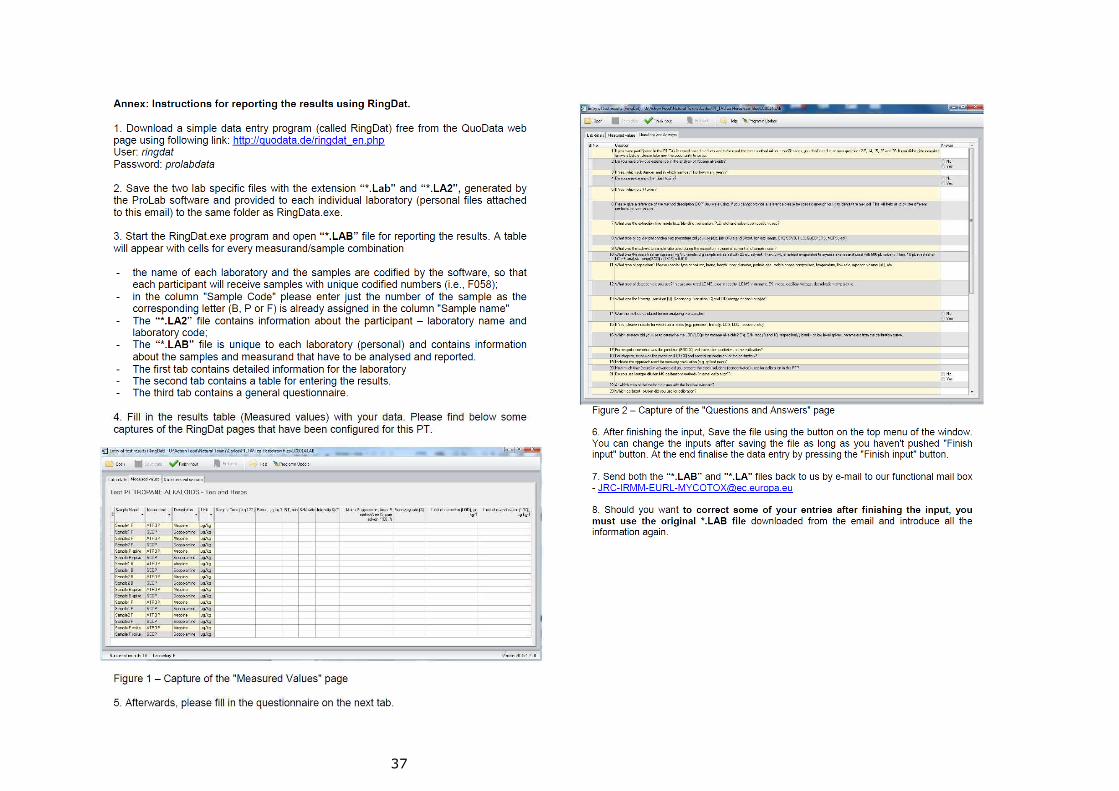
The results were reported by the participants using RingDat software, which is part of the ProLab software [10]. Laboratory specific files generated by the ProLab software were sent to each laboratory by email. A specific questionnaire was also included. The questionnaire was intended to provide further information on method-related aspects and laboratory details to allow insights on potential individual and general trends observed in the results for possible follow-up procedures. Method-related details and performance parameters such as chromatographic conditions, MRM transitions, S/N ratio of peak signals (as peak-to-peak, instead of RMS) and LOQs were requested.
Participants received information on the required storage conditions and were encouraged to perform the analysis as soon as possible, to allow enough time for data treatment and to get acquainted with the reporting software.
7. Reference values and their uncertainties
The assigned values of the analytes in the test samples and their uncertainties were established by Exact-Matching Double Isotope Dilution Mass Spectrometry (EMD-IDMS) at JRC-Geel (Table 2). This methodology is considered to provide the highest degree of accuracy of the assigned values [11].
Table 2 - Assigned values of the analytes and their associated expanded uncertainties in the tea and herbal infusion test items.
Sample Analyte Assigned value
(µg/kg) U (k=2) (µg/kg)
Black tea 001-100 Atropine 16.9 0.7
Scopolamine 2.3 0.3
Black tea 101-200 Atropine 8.3 0.3
Scopolamine 9.5 0.5
Peppermint 001-100 Atropine 9.5 0.3
Scopolamine 1.5 0.1
Peppermint 101-200 Atropine 21.2 0.5
Scopolamine 2.5 0.2
Fennel 001-100 Atropine 42.2 1.8
Scopolamine 13.4 0.4
Fennel 101-200 Atropine 18.8 0.3
Scopolamine 20.8 0.9
U - expanded uncertainty of the assigned value
The spiking solutions for the 3 matrices all had the same concentration. Following the spiking protocol mentioned in the accompanying letter (Annex 9.4), the resulting concentrations were: scopolamine – 14.6 µg/kg and atropine – 14.4 µg/kg.

9
8. Evaluation of results
8.1 General observations
Out of the 42 laboratories that received the PT samples, 33 reported back their results. Nine laboratories declined to send their results either due to a change of interest or time constraints. Eleven laboratories were NRLs for Mycotoxins, and 22 were expert laboratories.
The laboratories were free to use their method of choice. An LC-MS/MS standard operating procedure (SOP) suitable for the determination of TAs in cereals was provided to laboratories that placed a request. This SOP could be used to analyse tea and herbal infusions after minor amendments. The method provided was developed, validated and used by the EURL for Mycotoxins.
Only liquid chromatography coupled with mass spectrometric detection methods were used by the participants for the determination of the two TAs in tea and herbal infusions.
This PT was organised in a way to resemble also a layout of a collaborative method validation study. Nine test items were supplied to the participants, and seven laboratories entirely followed the EURL-provided SOP.
8.2 Scores and evaluation criteria
Individual laboratory performance was assessed in terms of z-scores in accordance with ISO 13528:2015 [8].
z= Equation 1.
where: xlab is the measurement result reported by a participant Xref is the reference value (assigned value) σp is the standard deviation for proficiency assessment (target standard deviation) σp was calculated using the Horwitz equation, modified by Thompson [12] for analyte concentrations <120 µg/kg: - for analyte concentration <120 µg/kg
Equation 2.
where: c = concentration of the measurand (assigned value, Xref, ) expressed as a dimensionless mass ratio, e.g. 1 µg/kg = 10-9, 1 mg/kg = 10-6 The z-score compares the participant's deviation from the reference value with the target standard deviation accepted for the proficiency test, σp. The z-score is interpreted as follows:
|z| ≤ 2 acceptable result 2 < |z| < 3 questionable result |z| ≥ 3 unacceptable result
8.3 Laboratory results and scoring
The statistical evaluation of the results was performed using the ProLab software [10]. The robust mean and the reproducibility standard deviation were computed according to Algorithm A of ISO 13528:2015, and are given just for information purposes [8]. Z-
pσreflab Xx −
cp ⋅= 22.0σ

10
scoring was calculated for scopolamine and atropine using the values assigned by EMD-IDMS instead of the consensus values (robust mean).
85.9 % of the results reported by the participants obtained acceptable z-scores (|z|≤ 2) whereas 6.7 % of the results fell into the unacceptable range with |z|≥ 3 (Figure 1)
Figure 1 - Distribution of all z-scores across measurands/samples/laboratories.
Figure 2 - Distribution of the z-scores for atropine (left) and scopolamine (right) across samples/laboratories.
Distribution of Z-Scores
Z-Scores6543210-1-2-3-4
Ab
solu
te fr
eq
ue
ncy
80
75
70
65
60
55
50
45
40
35
30
25
20
15
10
5
0
Ring test: TA tea only M1Measurands: ATROP, SCOP42 Laboratories9 Samples553 Z-Scores
|z| <= 1: 63.11% (Norm.: 68.27%)|z| <= 2: 85.90% (Norm.: 95.45%)|z| <= 3: 93.31% (Norm.: 99.73%)|z| <= 6: 96.20% (Norm.: 100.00%)
Distribution of Z-Scores
Z-Scores6543210-1-2-3-4
Abs
olu
te fr
eque
ncy
4442
40
38
36
34
32
30
2826
24
22
20
18
16
14
12
108
6
4
2
0
Ring test: TA tea only M1Measurand ATROP42 Laboratories9 Samples286 Z-Scores
|z| <= 1: 66.08% (Norm.: 68.27%)|z| <= 2: 87.41% (Norm.: 95.45%)|z| <= 3: 94.06% (Norm.: 99.73%)|z| <= 6: 96.50% (Norm.: 100.00%)
Distribution of Z-Scores
Z-Scores543210-1-2-3-4
Abs
olu
te fr
eque
ncy
40
38
36
34
32
30
28
26
24
22
20
18
16
14
12
10
8
6
4
2
0
Ring test: TA tea only M1Measurand SCOP42 Laboratories9 Samples267 Z-Scores
|z| <= 1: 59.93% (Norm.: 68.27%)|z| <= 2: 84.27% (Norm.: 95.45%)|z| <= 3: 92.51% (Norm.: 99.73%)|z| <= 6: 95.88% (Norm.: 100.00%)

11
The breakdown of the z-scores by analyte (Figure 2) shows that the laboratories' performance for atropine was slightly better than for scopolamine. This finding might be explained by the fact that scopolamine concentrations were in general lower or much lower than atropine, rendering the determination more demanding.
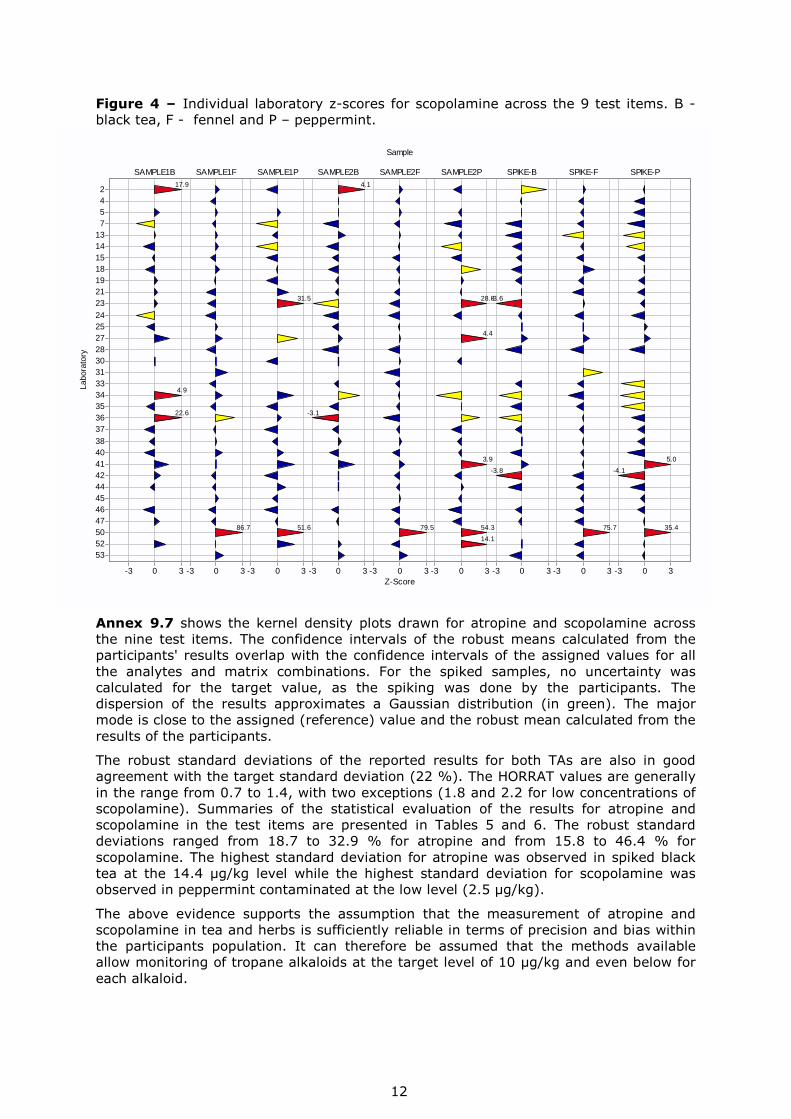
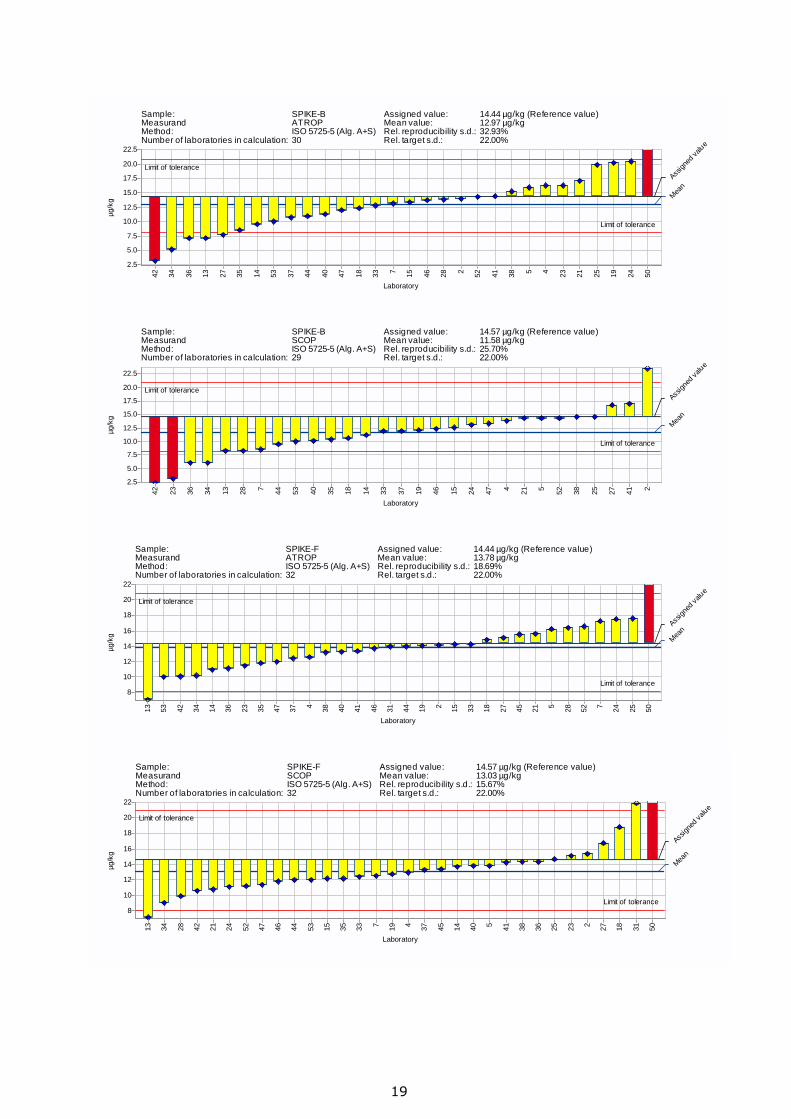
Figures 3 and 4 provide an overview of the individual z-scores assigned to the results of atropine and scopolamine, respectively, in the tea and herbal infusion test materials. The longer the triangles, the larger were the differences to the assigned values. Blue triangles represent z-scores in the acceptable range, yellow triangles in the questionable range and red triangles in the unacceptable performance range. The corresponding scores are shown next to the triangles.
Figure 3 – Individual laboratory z-scores for atropine across the 9 test items. B - black tea, F - fennel and P – peppermint.
The numerical values of the calculated z-scores are compiled in Tables 3 and 4. All z-scores in the questionable performance range are shown with a yellow background, while z-scores indicating unacceptable performance are presented a with a light-red background. This mode of presentation allows for easy distinction between the two performance ranges, even on black-and-white prints.
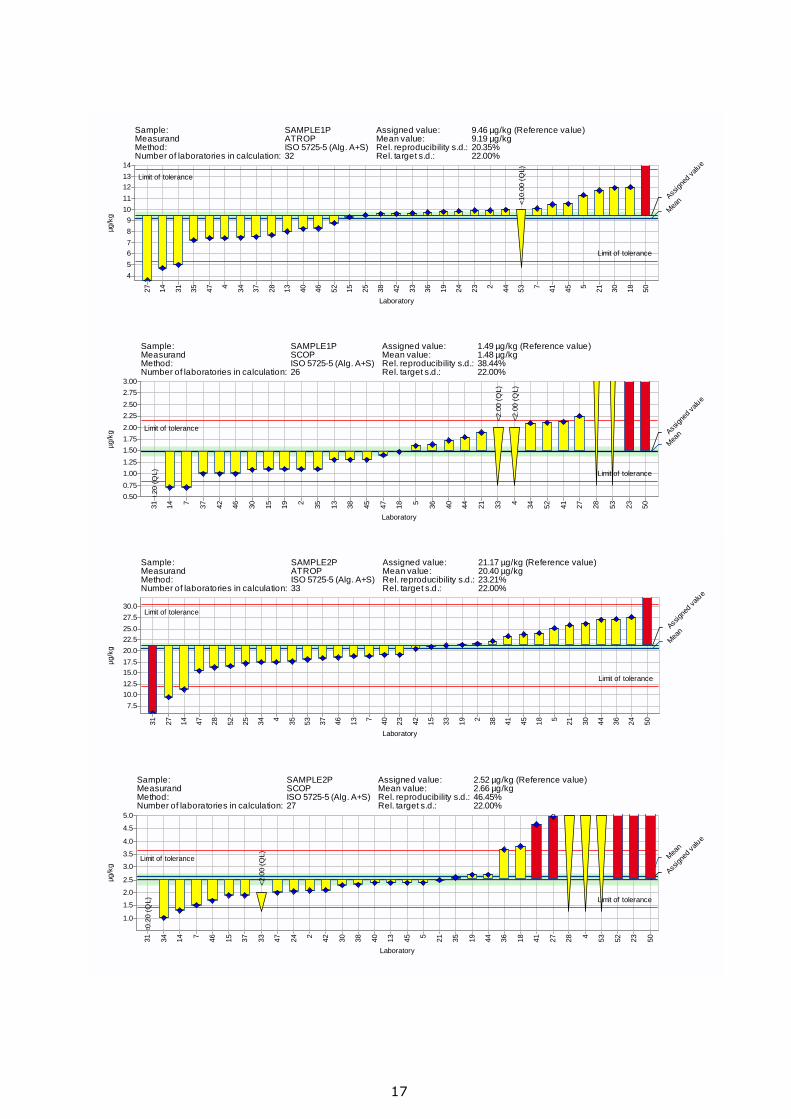
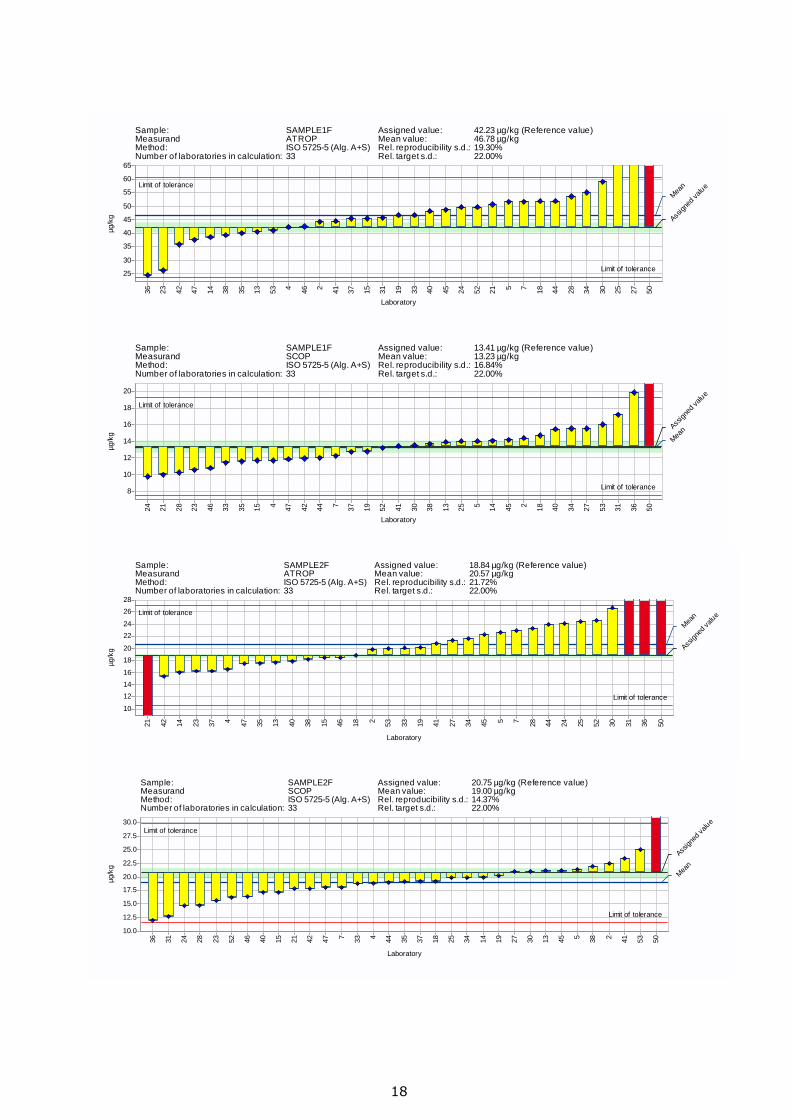
The graphical representations of the sigmoidal distribution of the results (µg/kg) for each combination of measurand/sample are given in Figure 5. Reported results are shown as bars. The green line corresponds to Xref; the green shadow covers the boundary of the reference interval (Xref ± uref), and the red lines mark the boundary of the target interval (Xref ± 2σ). Yellow bars represent results with |z-score| <3 while red bars represent unacceptable results.
Z-Score-3 0 3 -3 0 3 -3 0 3 -3 0 3 -3 0 3 -3 0 3 -3 0 3 -3 0 3 -3 0 3
Sample
SAMPLE1B SAMPLE1F SAMPLE1P SAMPLE2B SAMPLE2F SAMPLE2P SPIKE-B SPIKE-F SPIKE-P
Labo
rato
ry
2457
13141518192123
2425272830313334353637
3840414244454647505253
17.4 93.3 76.1
3.6
9.0
3.5
5.9
8.7
91.3 76.6 10.0 78.5 55.0
-3.9
-3.3
-3.5 -4.0
12
Figure 4 – Individual laboratory z-scores for scopolamine across the 9 test items. B - black tea, F - fennel and P – peppermint.
Annex 9.7 shows the kernel density plots drawn for atropine and scopolamine across the nine test items. The confidence intervals of the robust means calculated from the participants' results overlap with the confidence intervals of the assigned values for all the analytes and matrix combinations. For the spiked samples, no uncertainty was calculated for the target value, as the spiking was done by the participants. The dispersion of the results approximates a Gaussian distribution (in green). The major mode is close to the assigned (reference) value and the robust mean calculated from the results of the participants.
The robust standard deviations of the reported results for both TAs are also in good agreement with the target standard deviation (22 %). The HORRAT values are generally in the range from 0.7 to 1.4, with two exceptions (1.8 and 2.2 for low concentrations of scopolamine). Summaries of the statistical evaluation of the results for atropine and scopolamine in the test items are presented in Tables 5 and 6. The robust standard deviations ranged from 18.7 to 32.9 % for atropine and from 15.8 to 46.4 % for scopolamine. The highest standard deviation for atropine was observed in spiked black tea at the 14.4 µg/kg level while the highest standard deviation for scopolamine was observed in peppermint contaminated at the low level (2.5 µg/kg).
The above evidence supports the assumption that the measurement of atropine and scopolamine in tea and herbs is sufficiently reliable in terms of precision and bias within the participants population. It can therefore be assumed that the methods available allow monitoring of tropane alkaloids at the target level of 10 µg/kg and even below for each alkaloid.
Z-Score-3 0 3 -3 0 3 -3 0 3 -3 0 3 -3 0 3 -3 0 3 -3 0 3 -3 0 3 -3 0 3
Sample
SAMPLE1B SAMPLE1F SAMPLE1P SAMPLE2B SAMPLE2F SAMPLE2P SPIKE-B SPIKE-F SPIKE-P
Labo
rato
ry
2457
13141518192123
2425272830313334353637
3840414244454647505253
17.9
4.9
22.6
86.7
31.5
51.6
4.1
79.5
28.8
4.4
3.9
54.3
14.1
75.7
5.0
35.4
-3.1
-3.6
-3.8 -4.1

13
Table 3 - Analytical results and z-scores for atropine in the nine test items. B - black tea, F - fennel and P – peppermint. Colour code: yellow – questionable, red – unacceptable
Samples SAMPLE1B z-
score SAMPLE1F
z-score
SAMPLE1P
z-score
SAMPLE2B z-
score SAMPLE2F
z-score
SAMPLE2P z-
score SPIKE-B
z-score
SPIKE-F z-
score SPIKE-P
z-score
Lab/Unit µg/kg µg/kg µg/kg µg/kg µg/kg µg/kg µg/kg µg/kg µg/kg
2 15.97 -0.2 44.15 0.2 9.92 0.2 8.13 -0.1 19.87 0.2 21.66 0.1 13.90 -0.2 14.15 -0.1 14.81 0.1
4 14.88 -0.5 42.22 0.0 7.41 -1.0 8.68 0.2 16.65 -0.5 17.40 -0.8 16.27 0.6 12.58 -0.6 10.86 -1.1
5 19.10 0.6 51.60 1.0 11.30 0.9 9.30 0.5 22.70 0.9 25.10 0.8 15.90 0.5 16.20 0.6 16.20 0.6
7 14.30 -0.7 51.60 1.0 10.10 0.3 8.50 0.1 22.90 1.0 18.80 -0.5 13.10 -0.4 17.30 0.9 13.60 -0.3
13 17.40 0.1 40.50 -0.2 8.00 -0.7 8.50 0.1 17.70 -0.3 18.80 -0.5 7.10 -2.3 7.10 -2.3 5.90 -2.7
14 9.50 -2.0 38.50 -0.4 4.70 -2.3 4.00 -2.4 16.10 -0.7 11.30 -2.1 9.60 -1.5 11.00 -1.1 5.50 -2.8
15 17.10 0.1 45.50 0.4 9.30 -0.1 8.10 -0.1 18.40 -0.1 20.90 -0.1 13.40 -0.3 14.20 -0.1 13.00 -0.5
18 17.29 0.1 51.90 1.0 12.04 1.2 7.23 -0.6 18.83 0.0 23.99 0.6 12.31 -0.7 14.82 0.1 10.83 -1.1
19 22.00 1.4 46.70 0.5 9.80 0.2 14.90 3.6 20.20 0.3 21.40 0.0 20.20 1.8 14.10 -0.1 14.10 -0.1
21 21.00 1.1 50.70 0.9 11.70 1.1 9.60 0.7 2.80 -3.9 25.80 1.0 17.10 0.8 15.60 0.4 17.60 1.0
23 20.70 1.0 26.10 -1.7 9.90 0.2 13.70 2.9 16.30 -0.6 19.10 -0.4 16.30 0.6 11.50 -0.9 15.10 0.2
24 20.94 1.1 49.56 0.8 9.86 0.2 8.52 0.1 24.10 1.3 27.71 1.4 20.46 1.9 17.48 1.0 20.55 1.9
25 14.90 -0.5 68.60 2.8 9.50 0.0 6.60 -0.9 24.40 1.3 17.20 -0.9 19.80 1.7 17.60 1.0 18.50 1.3
27 13.64 -0.9 69.24 2.9 3.56 -2.8 5.26 -1.7 21.39 0.6 9.54 -2.5 7.70 -2.1 15.07 0.2 12.40 -0.6
28 17.00 0.0 53.60 1.2 7.70 -0.8 8.50 0.1 23.30 1.1 16.30 -1.0 13.80 -0.2 16.40 0.6 11.90 -0.8
30 23.45 1.8 58.99 1.8 11.98 1.2 11.26 1.6 26.68 1.9 26.18 1.1 not tested not tested not tested
31 not tested 45.64 0.4 4.98 -2.2 not tested 43.20 >4 5.86 -3.3 not tested 13.96 -0.2 7.82 -2.1
33 17.80 0.3 46.70 0.5 9.70 0.1 9.60 0.7 20.10 0.3 21.20 0.0 12.80 -0.5 14.20 -0.1 14.00 -0.1
34 25.20 2.2 55.10 1.4 7.48 -1.0 9.28 0.5 21.60 0.7 17.40 -0.8 5.20 -2.9 10.15 -1.4 9.55 -1.5
35 10.30 -1.8 40.10 -0.2 7.20 -1.1 4.70 -2.0 17.60 -0.3 17.60 -0.8 8.50 -1.9 11.80 -0.8 5.30 -2.9
36 10.32 -1.8 24.54 -1.9 9.73 0.1 24.84 >4 54.82 >4 27.20 1.3 7.08 -2.3 11.16 -1.0 8.17 -2.0
37 13.20 -1.0 45.40 0.3 7.50 -0.9 6.70 -0.9 16.30 -0.6 18.30 -0.6 10.70 -1.2 12.40 -0.6 11.30 -1.0
38 20.04 0.9 39.18 -0.3 9.60 0.1 9.92 0.9 18.20 -0.2 22.29 0.2 15.17 0.2 13.21 -0.4 12.58 -0.6
40 11.11 -1.6 48.30 0.7 8.23 -0.6 6.36 -1.1 17.93 -0.2 19.04 -0.5 11.28 -1.0 13.31 -0.4 10.18 -1.3
41 16.50 -0.1 44.49 0.2 10.45 0.5 8.62 0.2 20.78 0.5 23.26 0.4 14.38 0.0 13.34 -0.3 15.43 0.3
42 16.30 -0.2 35.90 -0.7 9.60 0.1 9.40 0.6 15.40 -0.8 20.50 -0.1 3.20 -3.5 10.10 -1.4 1.80 -4.0
44 17.00 0.0 52.00 1.1 10.00 0.3 8.90 0.3 24.00 1.2 27.00 1.3 11.00 -1.1 14.00 -0.1 10.00 -1.4
45 not tested 48.60 0.7 10.50 0.5 not tested 22.20 0.8 23.80 0.6 not tested 15.50 0.3 13.40 -0.3
46 15.80 -0.3 42.50 0.0 8.30 -0.6 8.20 -0.1 18.40 -0.1 18.50 -0.6 13.70 -0.2 13.70 -0.2 14.00 -0.1
47 14.80 -0.6 37.50 -0.5 7.40 -1.0 7.50 -0.4 17.50 -0.3 15.40 -1.2 12.00 -0.8 12.00 -0.8 11.90 -0.8
50 81.30 >4 908.90 >4 167.90 >4 14.80 3.5 397.40 >4 377.70 >4 46.30 >4 263.70 >4 189.30 >4
52 20.30 0.9 49.59 0.8 8.79 -0.3 9.67 0.7 24.65 1.4 16.47 -1.0 14.30 0.0 16.56 0.7 13.90 -0.2
53 16.00 -0.2 41.00 -0.1 < 10.00 < 10.00 20.00 0.3 18.00 -0.7 10.00 -1.4 10.00 -1.4 11.00 -1.1

14
Table 4 - Analytical results and z-scores for scopolamine in the nine test items. B - black tea, F - fennel and P – peppermint. Colour code: yellow – questionable, red – unacceptable
Samples SAMPLE1
B z-
score SAMPLE1F
z-score
SAMPLE1P z-
score SAMPLE2
B z-
score SAMPLE2F
z-score
SAMPLE2P z-
score SPIKE-B
z-score
SPIKE-F z-
score SPIKE-P
z-score
Lab/Unit µg/kg µg/kg µg/kg µg/kg µg/kg µg/kg µg/kg µg/kg µg/kg
2 11.15 >4 14.43 0.3 1.10 -1.2 18.07 >4 22.53 0.4 2.07 -0.8 23.54 2.8 15.39 0.3 14.20 -0.1
4 < 2.00 11.70 -0.6 < 2.00 9.65 0.1 18.84 -0.4 < 5.00 13.86 -0.2 12.99 -0.5 10.87 -1.2
5 2.50 0.5 14.00 0.2 1.60 0.3 9.60 0.0 21.40 0.1 2.40 -0.2 14.30 -0.1 13.80 -0.2 10.50 -1.3
7 1.20 -2.1 12.20 -0.4 0.70 -2.4 5.90 -1.7 18.00 -0.6 1.50 -1.8 8.60 -1.9 12.50 -0.6 8.40 -1.9
13 2.30 0.1 13.90 0.2 1.30 -0.6 11.10 0.7 21.10 0.1 2.40 -0.2 8.30 -2.0 7.20 -2.3 6.90 -2.4
14 1.60 -1.3 14.10 0.2 0.70 -2.4 6.60 -1.4 19.90 -0.2 1.30 -2.2 11.20 -1.1 13.70 -0.3 8.10 -2.0
15 2.10 -0.3 11.70 -0.6 1.10 -1.2 8.00 -0.7 17.20 -0.8 1.90 -1.1 12.60 -0.6 12.20 -0.7 12.20 -0.7
18 1.74 -1.0 14.74 0.5 1.47 -0.1 7.14 -1.1 19.22 -0.3 3.80 2.3 10.67 -1.2 18.84 1.3 14.74 0.1
19 2.40 0.3 12.80 -0.2 1.10 -1.2 8.90 -0.3 20.20 -0.1 2.70 0.3 12.10 -0.8 12.80 -0.6 12.60 -0.6
21 2.40 0.3 10.00 -1.2 1.90 1.3 8.70 -0.4 17.80 -0.6 2.50 0.0 14.30 -0.1 10.80 -1.2 12.20 -0.7
23 2.40 0.3 10.50 -1.0 11.80 >4 3.50 -2.9 15.60 -1.1 18.50 >4 3.09 -3.6 15.10 0.2 13.00 -0.5
24 1.22 -2.1 9.76 -1.2 not tested 6.07 -1.7 14.69 -1.3 2.04 -0.9 13.11 -0.5 11.14 -1.1 9.87 -1.5
25 1.80 -0.9 14.00 0.2 not tested 8.00 -0.7 19.80 -0.2 not tested 14.60 0.0 14.70 0.0 15.60 0.3
27 3.04 1.6 15.56 0.7 2.25 2.3 10.41 0.4 20.99 0.1 4.97 >4 16.79 0.7 16.75 0.7 16.59 0.6
28 < 5.00 10.20 -1.1 < 5.00 5.60 -1.9 14.80 -1.3 < 5.00 8.30 -2.0 9.90 -1.5 9.00 -1.7
30 2.24 0.0 13.51 0.0 1.09 -1.2 9.47 0.0 21.00 0.1 2.29 -0.4 not tested not tested not tested
31 not tested 17.20 1.3 < 0.20 not tested 12.72 -1.8 < 0.20 not tested 21.90 2.3 not tested
33 < 4.00 11.40 -0.7 < 2.00 8.60 -0.4 18.70 -0.4 < 2.00 12.00 -0.8 12.40 -0.7 6.40 -2.5
34 4.70 >4 15.50 0.7 2.09 1.8 14.50 2.4 19.80 -0.2 1.02 -2.7 6.13 -2.6 9.10 -1.7 5.93 -2.7
35 1.80 -0.9 11.60 -0.6 1.10 -1.2 7.20 -1.1 19.10 -0.4 2.60 0.1 10.40 -1.3 12.20 -0.7 6.20 -2.6
36 13.48 >4 19.84 2.2 1.64 0.5 3.09 -3.1 11.98 -1.9 3.67 2.1 6.12 -2.6 14.35 -0.1 9.86 -1.5
37 1.70 -1.1 12.70 -0.2 1.00 -1.5 8.00 -0.7 19.20 -0.3 1.90 -1.1 12.00 -0.8 13.30 -0.4 12.20 -0.7
38 1.92 -0.7 13.67 0.1 1.30 -0.6 10.17 0.3 21.95 0.3 2.32 -0.4 14.54 0.0 14.32 -0.1 12.14 -0.8
40 1.66 -1.2 15.43 0.7 1.72 0.7 7.42 -1.0 17.16 -0.8 2.39 -0.2 10.20 -1.4 13.78 -0.2 8.27 -2.0
41 3.00 1.5 13.47 0.0 2.12 1.9 13.35 1.8 23.46 0.6 4.67 3.9 16.99 0.8 14.21 -0.1 30.75 >4
42 2.60 0.7 11.90 -0.5 1.00 -1.5 9.50 0.0 17.80 -0.6 2.10 -0.8 2.40 -3.8 10.60 -1.2 1.40 <-4
44 2.00 -0.5 12.00 -0.5 1.80 0.9 9.40 -0.1 19.00 -0.4 2.70 0.3 9.50 -1.6 12.00 -0.8 9.50 -1.6
45 not tested 14.20 0.3 1.30 -0.6 not tested 21.10 0.1 2.40 -0.2 not tested 13.40 -0.4 13.00 -0.5
46 1.60 -1.3 10.80 -0.9 1.00 -1.5 7.80 -0.8 16.40 -1.0 1.70 -1.5 12.40 -0.7 11.80 -0.9 12.10 -0.8
47 2.50 0.5 11.80 -0.5 1.40 -0.3 9.10 -0.2 18.00 -0.6 2.00 -0.9 13.30 -0.4 11.40 -1.0 14.50 0.0
50 not tested 269.10 >4 18.40 >4 not tested 383.80 >4 32.60 >4 not tested 257.10 >4 128.00 >4
52 2.83 1.1 13.21 -0.1 2.11 1.9 10.29 0.4 16.20 -1.0 10.31 >4 14.36 -0.1 11.19 -1.1 14.53 0.0
53 < 5.00 16.00 0.9 < 5.00 11.00 0.7 25.00 0.9 < 5.00 10.00 -1.4 12.00 -0.8 14.00 -0.2

15
Table 5 - Summary statistics of the results for atropine in the nine test items. B - black tea, F - fennel and P – peppermint.
Units SAMPLE1B SAMPLE1F SAMPLE1P SAMPLE2B SAMPLE2F SAMPLE2P SPIKE-B SPIKE-F SPIKE-P No. of laboratories that submitted results
31 33 33 31 33 33 30 32 32
No. of participants (according to design)
42 42 42 42 42 42 42 42 42
Assigned (reference) value µg/kg 16.9 42.2 9.5 8.3 18.8 21.2 14.4 14.4 14.4
Uncertainty of the assigned value (k=2)
µg/kg 0.7 1.8 0.3 0.3 0.3 0.5
Mean (robust) µg/kg 17.0 46.8 9.2 8.7 20.6 20.4 13.0 13.8 12.3
Target s.d. µg/kg 3.7 9.3 2.1 1.8 4.1 4.7 3.2 3.2 3.2
Reproducibility s.d. µg/kg 4.3 8.2 1.9 2.1 4.1 4.9 4.8 2.7 4.2
Rel. SDPA % 22.0 22.0 22.0 22.0 22.0 22.0 22.0 22.0 22.0
Rel. reproducibility s.d. (robust) % 25.5 19.3 20.4 25.4 21.7 23.2 32.9 18.7 28.7
Table 6 - Summary statistics of the results for scopolamine in the nine test items. B - black tea, F - fennel and P – peppermint.
Units SAMPLE1B SAMPLE1F SAMPLE1P SAMPLE2B SAMPLE2F SAMPLE2P SPIKE-B SPIKE-F SPIKE-P No. of laboratories that submitted results
30 33 31 30 33 32 29 32 31
No. of participants (according to design)
42 42 42 42 42 42 42 42 42
Assigned (reference) value µg/kg 2.3 13.4 1.5 9.5 20.8 2.5 14.6 14.6 14.6
Uncertainty of the assigned value (k=2)
µg/kg 0.3 0.4 0.1 0.5 0.9 0.2
Mean (robust) µg/kg 2.3 13.2 1.5 8.7 19.0 2.7 11.6 13.0 11.4
Target s.d. µg/kg 0.5 3.0 0.3 2.1 4.6 0.6 3.2 3.2 3.2
Reproducibility s.d. µg/kg 0.7 2.3 0.6 2.3 3.0 1.2 3.7 2.3 3.8
Rel. SDPA % 22.0 22.0 22.0 22.0 22.0 22.0 22.0 22.0 22.0
Rel. reproducibility s.d. (robust) % 31.3 16.8 38.4 24.1 14.4 46.5 25.7 15.7 26.5

16
Figure 5 – sigmoidal plots of individual laboratory results reported for atropine (ATROP) and scopolamine (SCOP) in the test items. B - black tea, F - fennel and P – peppermint.
Laboratory
14 35 36 40 37 27 7 47 4 25 46 2 53 42 41 28 44 15 18 13 33 5 38 52 23 24 21 19 30 34 50
µg/k
g
30.0
27.5
25.0
22.5
20.0
17.5
15.0
12.5
10.0
Sample: SAMPLE1BMeasurand ATROPMethod: ISO 5725-5 (Alg. A+S)Number of laboratories in calculation: 31
Assigned value: 16.87 µg/kg (Reference value)Mean value: 17.00 µg/kgRel. reproducibility s.d.: 25.46%Rel. target s.d.: 22.00%
Limit of tolerance
Limit of tolerance
Mean
Assig
ned
value
Laboratory
7 24 14 46 40 37 18 25 35 38 4 44 15 30 13 19 21 23 47 5 42 52 41 27 33 34 28 53 2 36
µg/k
g
4.5
4.0
3.5
3.0
2.5
2.0
1.5
1.0
0.5
Sample: SAMPLE1BMeasurand SCOPMethod: ISO 5725-5 (Alg. A+S)Number of laboratories in calculation: 26
Assigned value: 2.26 µg/kg (Reference value)Mean value: 2.25 µg/kgRel. reproducibility s.d.: 31.31%Rel. target s.d.: 22.00%
Limit of tolerance
Limit of tolerance
Assig
ned
value
Mean
<2.0
0 (Q
L)
<4.0
0 (Q
L)
Laboratory
14 35 27 40 25 37 18 47 15 2 46 13 28 7 24 41 4 44 34 5 42 21 33 52 38 53 30 23 50 19 36
µg/k
g
14
131211
10
98
7654
3
Sample: SAMPLE2BMeasurand ATROPMethod: ISO 5725-5 (Alg. A+S)Number of laboratories in calculation: 30
Assigned value: 8.32 µg/kg (Reference value)Mean value: 8.71 µg/kgRel. reproducibility s.d.: 25.43%Rel. target s.d.: 22.00%
Limit of tolerance
Limit of tolerance
Mean
Assign
ed v
alue
<10.
00 (
QL)
Laboratory
36 23 28 7 24 14 18 35 40 46 15 25 37 33 21 19 47 44 30 42 5 4 38 52 27 53 13 41 34 2
µg/k
g
18
16
14
12
10
8
6
4
2
Sample: SAMPLE2BMeasurand SCOPMethod: ISO 5725-5 (Alg. A+S)Number of laboratories in calculation: 30
Assigned value: 9.54 µg/kg (Reference value)Mean value: 8.68 µg/kgRel. reproducibility s.d.: 24.06%Rel. target s.d.: 22.00%
Limit of tolerance
Limit of tolerance
Assig
ned v
alue
Mean
17
Laboratory
27 14 31 35 47 4 34 37 28 13 40 46 52 15 25 38 42 33 36 19 24 23 2 44 53 7 41 45 5 21 30 18 50
µg/k
g
14
13
12
11
10
9
8
7
6
5
4
Sample: SAMPLE1PMeasurand ATROPMethod: ISO 5725-5 (Alg. A+S)Number of laboratories in calculation: 32
Assigned value: 9.46 µg/kg (Reference value)Mean value: 9.19 µg/kgRel. reproducibility s.d.: 20.35%Rel. target s.d.: 22.00%
Limit of tolerance
Limit of tolerance
Assign
ed va
lue
Mean<1
0.00
(Q
L)
Laboratory
31 14 7 37 42 46 30 15 19 2 35 13 38 45 47 18 5 36 40 44 21 33 4 34 52 41 27 28 53 23 50
µg/k
g
3.00
2.75
2.50
2.25
2.00
1.75
1.50
1.25
1.00
0.75
0.50
Sample: SAMPLE1PMeasurand SCOPMethod: ISO 5725-5 (Alg. A+S)Number of laboratories in calculation: 26
Assigned value: 1.49 µg/kg (Reference value)Mean value: 1.48 µg/kgRel. reproducibility s.d.: 38.44%Rel. target s.d.: 22.00%
Limit of tolerance
Limit of tolerance
Assign
ed v
alue
Mea
n
<0.2
0 (Q
L)
<2.0
0 (Q
L)
<2.0
0 (Q
L)
Laboratory
31 27 14 47 28 52 25 34 4 35 53 37 46 13 7 40 23 42 15 33 19 2 38 41 45 18 5 21 30 44 36 24 50
µg/k
g
30.0
27.5
25.0
22.5
20.0
17.515.0
12.5
10.0
7.5
Sample: SAMPLE2PMeasurand ATROPMethod: ISO 5725-5 (Alg. A+S)Number of laboratories in calculation: 33
Assigned value: 21.17 µg/kg (Reference value)Mean value: 20.40 µg/kgRel. reproducibility s.d.: 23.21%Rel. target s.d.: 22.00%
Limit of tolerance
Limit of tolerance
Assign
ed v
alue
Mea
n
Laboratory
31 34 14 7 46 15 37 33 47 24 2 42 30 38 40 13 45 5 21 35 19 44 36 18 41 27 28 4 53 52 23 50
µg/k
g
5.0
4.5
4.0
3.5
3.0
2.5
2.0
1.5
1.0
Sample: SAMPLE2PMeasurand SCOPMethod: ISO 5725-5 (Alg. A+S)Number of laboratories in calculation: 27
Assigned value: 2.52 µg/kg (Reference value)Mean value: 2.66 µg/kgRel. reproducibility s.d.: 46.45%Rel. target s.d.: 22.00%
Limit of tolerance
Limit of tolerance
Mean
Assign
ed v
alue
<0.2
0 (Q
L)
<2.0
0 (Q
L)
18
Laboratory
36 23 42 47 14 38 35 13 53 4 46 2 41 37 15 31 19 33 40 45 24 52 21 5 7 18 44 28 34 30 25 27 50
µg/k
g
65
60
55
50
45
40
35
30
25
Sample: SAMPLE1FMeasurand ATROPMethod: ISO 5725-5 (Alg. A+S)Number of laboratories in calculation: 33
Assigned value: 42.23 µg/kg (Reference value)Mean value: 46.78 µg/kgRel. reproducibility s.d.: 19.30%Rel. target s.d.: 22.00%
Limit of tolerance
Limit of tolerance
Mean
Assign
ed va
lue
Laboratory
24 21 28 23 46 33 35 15 4 47 42 44 7 37 19 52 41 30 38 13 25 5 14 45 2 18 40 34 27 53 31 36 50
µg/k
g
20
18
16
14
12
10
8
Sample: SAMPLE1FMeasurand SCOPMethod: ISO 5725-5 (Alg. A+S)Number of laboratories in calculation: 33
Assigned value: 13.41 µg/kg (Reference value)Mean value: 13.23 µg/kgRel. reproducibility s.d.: 16.84%Rel. target s.d.: 22.00%
Limit of tolerance
Limit of tolerance
Assig
ned v
alue
Mean
Laboratory
21 42 14 23 37 4 47 35 13 40 38 15 46 18 2 53 33 19 41 27 34 45 5 7 28 44 24 25 52 30 31 36 50
µg/k
g
28
26
24
22
20
18
16
14
12
10
Sample: SAMPLE2FMeasurand ATROPMethod: ISO 5725-5 (Alg. A+S)Number of laboratories in calculation: 33
Assigned value: 18.84 µg/kg (Reference value)Mean value: 20.57 µg/kgRel. reproducibility s.d.: 21.72%Rel. target s.d.: 22.00%
Limit of tolerance
Limit of tolerance
Mean
Assig
ned v
alue
Laboratory
36 31 24 28 23 52 46 40 15 21 42 47 7 33 4 44 35 37 18 25 34 14 19 27 30 13 45 5 38 2 41 53 50
µg/k
g
30.0
27.5
25.0
22.5
20.0
17.5
15.0
12.5
10.0
Sample: SAMPLE2FMeasurand SCOPMethod: ISO 5725-5 (Alg. A+S)Number of laboratories in calculation: 33
Assigned value: 20.75 µg/kg (Reference value)Mean value: 19.00 µg/kgRel. reproducibility s.d.: 14.37%Rel. target s.d.: 22.00%
Limit of tolerance
Limit of tolerance
Assign
ed v
alue
Mea
n
19
Laboratory
42 34 36 13 27 35 14 53 37 44 40 47 18 33 7 15 46 28 2 52 41 38 5 4 23 21 25 19 24 50
µg/k
g
22.5
20.0
17.5
15.0
12.5
10.0
7.5
5.0
2.5
Sample: SPIKE-BMeasurand ATROPMethod: ISO 5725-5 (Alg. A+S)Number of laboratories in calculation: 30
Assigned value: 14.44 µg/kg (Reference value)Mean value: 12.97 µg/kgRel. reproducibility s.d.: 32.93%Rel. target s.d.: 22.00%
Limit of tolerance
Limit of tolerance
Assig
ned
valu
e
Mean
Laboratory
42 23 36 34 13 28 7 44 53 40 35 18 14 33 37 19 46 15 24 47 4 21 5 52 38 25 27 41 2
µg/k
g
22.5
20.0
17.5
15.0
12.5
10.0
7.5
5.0
2.5
Sample: SPIKE-BMeasurand SCOPMethod: ISO 5725-5 (Alg. A+S)Number of laboratories in calculation: 29
Assigned value: 14.57 µg/kg (Reference value)Mean value: 11.58 µg/kgRel. reproducibility s.d.: 25.70%Rel. target s.d.: 22.00%
Limit of tolerance
Limit of tolerance
Assign
ed va
lue
Mean
Laboratory
13 53 42 34 14 36 23 35 47 37 4 38 40 41 46 31 44 19 2 15 33 18 27 45 21 5 28 52 7 24 25 50
µg/k
g
22
20
18
16
14
12
10
8
Sample: SPIKE-FMeasurand ATROPMethod: ISO 5725-5 (Alg. A+S)Number of laboratories in calculation: 32
Assigned value: 14.44 µg/kg (Reference value)Mean value: 13.78 µg/kgRel. reproducibility s.d.: 18.69%Rel. target s.d.: 22.00%
Limit of tolerance
Limit of tolerance
Assig
ned
valu
e
Mea
n
Laboratory
13 34 28 42 21 24 52 47 46 44 53 15 35 33 7 19 4 37 45 14 40 5 41 38 36 25 23 2 27 18 31 50
µg/k
g
22
20
18
16
14
12
10
8
Sample: SPIKE-FMeasurand SCOPMethod: ISO 5725-5 (Alg. A+S)Number of laboratories in calculation: 32
Assigned value: 14.57 µg/kg (Reference value)Mean value: 13.03 µg/kgRel. reproducibility s.d.: 15.67%Rel. target s.d.: 22.00%
Limit of tolerance
Limit of tolerance
Assig
ned
value
Mean

20
9. Evaluation of the questionnaire
The questionnaire distributed to the participants has provided very useful information concerning the approaches and capabilities of the participating laboratories on the determination of tropane alkaloids in tea and herbal infusions.
The questionnaire will be discussed in three sections:
1) the first section will present the outcome of the Yes/No answers regarding the previous experience of the participants and general organisational matters: questions 2-5 and 32-37 of Annex 9.6.
2) the second section will deal with the outcome of the Yes/No answers concerning analytical aspects: questions 14-15, 21-22, 26-27, 29-31 and 38 of Annex 9.6.
3) the third section will give a more extensive overview of the analytical conditions used by the participants for the determination of tropane alkaloids in tea and herbal products: questions 6-13, 16-20, 24-25 and 28 of Annex 9.6.
9.1. Experience and organisational aspects
In Table 7, the number of responses received and the percentage of Yes/No answers regarding the experience of the participants and general organisational matters are compiled. Sixty-seven percent of the participants declared to have prior experience in the analysis of TAs (Q.2). Among them, a vast majority was capable of determining only atropine and scopolamine and the most common matrices were cereals, cereal products (flour, bread, pasta), baby food formulas and animal feeds (Q.3). Five laboratories also declared to analyse TAs in tea and herbal tea. One laboratory extended its analytical scope to about 20 tropane alkaloids, and another could analyse 24 compounds, not specifying which. The experience of the laboratories on the analysis of TAs is relatively
Laboratory
42 35 14 13 31 36 34 44 40 18 4 53 37 28 47 27 38 15 45 7 52 33 46 19 2 23 41 5 21 25 24 50
µg/k
g
22.5
20.0
17.5
15.0
12.5
10.0
7.5
5.0
2.5
Sample: SPIKE-PMeasurand ATROPMethod: ISO 5725-5 (Alg. A+S)Number of laboratories in calculation: 32
Assigned value: 14.44 µg/kg (Reference value)Mean value: 12.30 µg/kgRel. reproducibility s.d.: 28.73%Rel. target s.d.: 22.00%
Limit of tolerance
Limit of tolerance
Assig
ned v
alue
Mean
Laboratory
42 34 35 33 13 14 40 7 28 44 36 24 5 4 46 38 15 21 37 19 23 45 53 2 47 52 18 25 27 41 50
µg/k
g
22.5
20.0
17.5
15.0
12.5
10.0
7.5
5.0
2.5
Sample: SPIKE-PMeasurand SCOPMethod: ISO 5725-5 (Alg. A+S)Number of laboratories in calculation: 31
Assigned value: 14.57 µg/kg (Reference value)Mean value: 11.40 µg/kgRel. reproducibility s.d.: 26.46%Rel. target s.d.: 22.00%
Limit of tolerance
Limit of tolerance
Assig
ned
valu
e
Mea
n

21
limited. Most have less than two years of experience, with one laboratory mentioning five years of experience. The same number of laboratories (67 %) indicated that they could analyse other plant toxins (Q.4). Fourteen laboratories stated that they can analyse pyrrolizidine alkaloids while three can analyse opium alkaloids and glycoalkaloids. Six laboratories declared to be able to analyse ergot alkaloids, although these fall under the mycotoxin category.
Regarding the satisfaction with the organisational aspects of the PT, the participants were asked to express their opinion on whether the time for reporting the results was adequate (Q.33), the time they spent for analysing the samples, treat the data and issuing the results (Q.35) and whether the amount of test items was sufficient for their needs (Q.34). Eighty-eight percent of the participants found the time for reporting the results (about 6 weeks) as appropriate. Almost all the participants required two or more days to finalise the analytical work. Ninety-four percent of the participants found the amount of sample dispatched (25 g) enough for performing the analysis (Q.34).
Table 7 - Response to the questions related to the experience of the participants on the determination of tropane alkaloids in tea and organisational aspects of the PT
Q.2 Q.4 Q.14 Q.21 Q.26 Q.27 Q.30 Q.33 Q.34 Q.36 Q.37
Response - NO
Nr. 11 11 19 10 0 2 22 4 2 21 2
% 33 33 59 30 0 6 71 13 6 78 7
Response - YES
Nr. 22 22 13 23 33 29 9 28 30 6 25
% 67 67 41 70 100 94 29 88 94 22 93
Although the participants were asked to submit a great deal of data (both analytical results and answers to the questionnaire) the experience with the RingDat software was positive (Q.34). Seventy-eight percent didn't experience any shortcoming. Still, some comments were received which are compiled below:
- It was not possible to save all the data filled in the fields to answer the questions 11, 12, 13
- Firewall problems
- software very unstable; during the input repeated crashes
- I prefer online forms. Execution of exe-files for non-admins does not always work.
- This time, no problems
- Several crashes when changing window size
- Too long the overall procedure for reporting back the results. The error messages are not in English
About 93 % of the participants found the instructions for performing the PT (Annex 9.6) adequate (Q.37). One participant commented that "the spiking part was not obvious to understand immediately" while another noted that the method that was supplied to some laboratories in the past was targeted for the determination of TAs in cereals and not in tea and herbs. Support to analytical issues was always provided to laboratories that requested it. The participants were informed about this PT through different routes, eventually cumulative (Q.32). According to the table below, most participants were informed by direct invitation through the mail from the European Commission CIRCABC database. Many of them were also notified by their respective NRLs or got to know about the PT during the annual EURL Mycotoxins workshop.

22
Information source about the PT TAs in tea and herbal infusions %
Through the EURL Mycotoxins website 13
During the EURL workshop for the NRLs on mycotoxins 18
By invitation from the European Commission communication office 32
By the NRL in your country 18
By professional associates in your sector 8
Other 11
9.2. Analytical aspects
The participants in the PT were asked whether the analytical method used for analysing TAs in tea and herbal tea was validated (Q.14, Table 7). About 59 % of the participants replied that they did not perform any assays in that regard. It is important to note that many laboratories have implemented the method just prior to participating in the PT and, therefore, they didn't have enough time to validate the method. Among those who performed the method validation, 80 % included the parameters: precision (mainly repeatability), linearity, LOD and recovery while 90 % also estimated the LOQ. None of them estimated the measurement uncertainty.
Isotope-labelled internal standards for atropine and scopolamine are commercially available and were supplied to the participants along with the test items. Seventy percent of the participants answered that they use isotope dilution MS for quantification (Q.21). The majority of them (70 %) added the internal standards before the
extraction, 3 % added the internal standards after the extraction and 21 % responded as "Non applicable" (Q.22). The first approach provides more benefits as the internal standards can correct the results simultaneously for the biases (e.g. loss) during the extraction step and compensate for the matrix effects that occur during MS analysis.
All the participants have checked the integration of the chromatographic peaks (Q.26) while 94% also assessed the goodness of fit of the calibration curve in the region relevant for the quantification of the samples (Q.27). Additionally, the participants were asked to indicate whether they reported the results corrected for recoveries or not
corrected for recoveries (Q.28). About 74 % of the participants stated that they did not correct the results for the recoveries. Nevertheless, as long as the participants added the internal standards to the samples before the extraction (Q.22) and, assuming they did an internal calibration quantification, then the obtained results were automatically corrected for the recoveries (biases). Taking this information into consideration, only 19 % of the results might have been reported without correction for recoveries.
Regarding the satisfaction of the participants with the experience running the PT, 71% declared that they did not have major difficulties analysing the distributed samples (Q.30). Due to a program bug, it was not possible to compile the type of difficulties the remaining laboratories might have undergone (Q.31). On average, the analyst responsible for conducting the PT had about eight years of experience with LC-MS/MS methods (Q.29).
The participants were given the opportunity to raise general comments about the PT (Q.38). As listed below, the comments concern mainly clarifications related to the analytical protocol that was followed and difficulties posed by the matrices when quantifying scopolamine and atropine. Regarding the latter, it is a general opinion that the black tea sample was more difficult to analyse, sometimes hampering to send results. The analysis of scopolamine was mentioned twice as especially troublesome in these complex matrices.

23
- it was not possible to submit all the data. After saving, it was deleted automatically.
- we used standard addition for quantification purposes - For the sample F012, 1g instead of 2g was weighted, in order to achieve measurements inside the region of the calibration curve. Thus, the reported values for S/N correspond to 1g of sample diluted with 29 mL extraction solvent.
- The tea-matrix is difficult for Scopolamine, because there are a few ghost peaks. - We used the procedural standard calibration which automatically corrects for recovery losses as well as matrix effects
- we had huge problems with black tea and weren't able to report results - S/N ratio: processing with MassLynx Software; Peak to Peak; number of blank (Sample P, B, F spike) was not given: we called it "1" for P, "2" for B, "3" for F - The secondary ion for the Internal Std was poor or non-existent for some matrices in particular the fennel.
- We could not achieve repeatable and reproducible results for black tea because of matrix interferences. So we could not report results for black tea. Because we have to enter numbers in the form we increased the limits of detection and quantification and reported 0 as the amount for all samples. We did not determine the recoveries. In the form we entered 0 in all cases. We could not find sample codes on the blank samples used for spiking. So we entered 000 as sample code in the cases of spiked samples.
- Samples were analysed on two occasions: Black and Fennel tea on 27/03/2016, Peppermint tea on 31/03/2016 - Matrix suppression could not be calculated because ISTD was added at the beginning of the Sample prep. Analysis of the black tea sample was more difficult, compared to other samples. They were very extract rich and at times difficult to pass over SPE column. Resulting chromatograms were analysable, nonetheless
- In Black Tea, it was not possible to quantify Scopolamine (due to matrix effects)
9.3. Methods' overview
Along with the analytical results, the participants in this PT also submitted a compilation of some validation figures of merit and a description of core methodological features. In Annex 9.8.1, the reported limits of quantification (LOQs), recoveries (%), matrix suppression (MatrixSup, %) and retention times (RT, min) for both atropine and scopolamine are shown. The figures reported for Sample1 B, F and P, were taken as representative for the matrices black tea, fennel and peppermint, respectively. As it can be seen in Figure 6, the vast majority of the reported LOQs for atropine and scopolamine fell below 5.0 µg/kg, with a significant number being also below 1.0 µg/kg. The methodologies employed relied mostly on a fairly simple sample preparation, mainly "dilute and shoot" (Annex 9.8.2, Question 8).
The average recoveries considering the 3 matrices were 88 % for atropine and 91 % for scopolamine (see Figure 7), but with significant dispersion among the participants. Given the diversity of extraction methods applied (Question 7: shaking, QuEChERS, different solvent compositions and pH from acidic to alkaline), these figures fall within an acceptable range. Regarding the matrix effects, ionization suppression was mostly observed for both atropine and scopolamine with the instrumental response covering a range from about 20 to 80 %.
An overall overview of the analytical methodologies employed (Annex 9.8.2) indicates that nine laboratories applied the EURL-developed method. However, two laboratories deviated slightly, using an analytical column other than the recommended (pentafluorophenyl stationary phase). Five laboratories applied the RIKILT SOP A1070 or the method described in Adamse, P; van Egmond H.P. (2010): Report 2010.011, which follows similar principles. Two laboratories followed the reference: Jandric et al., Food Additives and Contaminants 28 (9) (2011) 1205-1219, which is a QuEChERS-derived method and two other laboratories adopted the BfR-PA-Tee-2.0/2014 method. Fifteen laboratories stated that they used either an in-house developed method or the reference did not allow grouping them in any of the previous categories. All the laboratories used LC-MS/MS for separation and detection. The two most used methods (EURL and RIKILT)

24
generated equivalent results (not statistically different at a significance level of 0.05). Likewise, the results obtained using the calibration standards supplied by the EURL and those existing in the laboratories were not statistically different.
Figure 6 – Histograms of the methods' LOQs for atropine and scopolamine in tea and herbal tea samples
Histogram of Atropine
0.10.5
0.91.3
1.72.1
2.52.9
3.33.7
4.14.5
4.95.3
5.76.1
6.56.9
7.37.7
8.18.5
8.99.3
9.710.1
LOQ (µg/kg)
0
10
20
30
40
50
60
70
80
No
of o
bs
Histogram of Scopolamine
0.10.5
0.91.3
1.72.1
2.52.9
3.33.7
4.14.5
4.95.3
5.76.1
6.56.9
7.37.7
8.18.5
8.99.3
9.710.1
LOQ (µg/kg)
0
10
20
30
40
50
60
70
No
of o
bs
Figure 7 – Histograms of methods' recoveries (%) for atropine and scopolamine in tea and herbal tea samples.
Histogram of Atropine
Atropine Rec = 225*5*Normal(Location=87.9989, Scale=28.2587)
2030
4050
6070
8090
100110
120130
140150
160170
180
Recov eries (%)
0
5
10
15
20
25
30
35
40
45
50
No
of o
bs
Histogram of Scopolamine
Scopolamine Rec B = 223*5*Normal(Location=90.7553,Scale=29.7897)
2030
4050
6070
8090
100110
120130
140150
160170
180
Recov eries (%)
0
10
20
30
40
50
60
70
No
of o
bs
10. Conclusions
On request of DG SANTE, the EURL for Mycotoxins organised a PT aiming to assess the measurement capability of EU Member States' laboratories regarding the determination of tropane alkaloids (atropine and scopolamine) in tea and herbal infusions.

25
Forty-two laboratories registered for this PT, of which 33 participants representing 11 EU Member States submitted their results. More than half of the participants were German laboratories.
Overall, more than 85 % of the z-scores were in the range of [-2,2], and more than 93 % fell within the range of [-3,3]. For atropine, 87 % of the results fell within the acceptable range (|z| ≤ 2) while for scopolamine, 84 % of the results were in this range. The performance of the laboratories was, therefore, comparable for both analytes, despite the fact that scopolamine was generally present in much lower concentrations than atropine (lowest level 1.5 µg/kg).
A matrix-wise evaluation of the z-scores for atropine indicated that the success rate (|z| ≤ 2) was similar in black tea and peppermint (around 85 %) but higher in fennel (91 %). For scopolamine, the rate of acceptable z-scores was the lowest in peppermint (75 %) followed by black tea (83 %) and fennel (94 %). The lowest rate of acceptable z-scores for atropine (83 %) was observed in black tea, which also contained the lowest concentration (8.3 µg/kg). The lowest rate of acceptable z-scores for scopolamine (67 %) was observed in a peppermint sample containing 2.5 µg/kg while other samples with similar concentration (2.3 and 1.5 µg/kg) originated around 81 % acceptable z-scores.
A vast majority of reported LOQs were below 5.0 µg/kg, some of them being even below 1.0 µg/kg. All laboratories used LC-MS/MS in their determinations. Nine participants followed the analytical protocol supplied by the EURL, while two of them used a different analytical column than the recommended one. Five participants used the original or adapted RIKILT SOP A1070. No significantly different results (at the 95 % confidence level) were generated by the two most applied SOPs neither by the use of standards of different origins (supplied by the EURL or the laboratories' standards).
The overall experience of the participants expressed in the questionnaire was very positive, including the organisational, technical and reporting aspects.
The results of the PT support the conclusion that atropine and scopolamine can be reliably determined in tea and herbal infusions at the quantification levels set up in the EU Recommendation 2015/976. A variety of analytical protocols has shown to be adequate for the determination of tropane alkaloids in tea. The laboratories achieved a highly satisfactory performance despite their somewhat short experience in the field. Some had implemented their methods just prior to the PT and underwent limited validation.

26
References
[1] P. Adamse, H.P.v. Egmond, M.Y. Noordam, P.P.J. Mulder, M.d. Nijs, Tropane alkaloids in food: poisoning incidents, Quality Assurance and Safety of Crops & Foods, 6 (2014) 15-24.
[2] EFSA, Scientific Opinion on Tropane alkaloids in food and feed. EFSA Panel on Contaminants in the Food Chain (CONTAM). EFSA Journal, 11 (2013) 3386.
[3] J.A. Shimshoni, A. Duebecke, P.P.J. Mulder, O. Cuneah, S. Barel, Pyrrolizidine and tropane alkaloids in teas and the herbal teas peppermint, rooibos and chamomile in the Israeli market, Food Additives & Contaminants: Part A, 32 (2015) 2058–2067.
[4] EC, Commission Recommendation (EU) 2015/976 on the monitoring of the presence of tropane alkaloids in food, Official Journal of the European Union, L 157/97 (2015).
[5] EC, Regulation (EC) No 882/2004 of the European Parliament and of the Council on official controls performed to ensure the verification of compliance with feed and food law, animal health and animal welfare rules, Official Journal of the European Union, L 165 (2004) 1-141.
[6] ISO/IEC 17043:2010 - Conformity assessment -- General requirements for proficiency testing.
[7] JRC Geel. EURL for mycotoxins. Inter-laboratory comparisons. Available from: https://ec.europa.eu/jrc/en/eurl/mycotoxins/interlaboratory-comparisons.
[8] ISO 13528:2015; Statistical methods for use in proficiency testing by interlaboratory comparisons.
[9] A. Lamberty, H. Schimmel, J. Pauwels, The study of the stability of reference materials by isochronous measurements, Fresenius J Anal Chem, 360 (1998) 359–361.
[10] Software for PT programs and collaborative studies, ProLab; http://quodata.de/en/software/for-interlaboratory-tests.html.
[11] L.G. Mackay, C.P. Taylor, R.B. Myors, R. Hearn, B. King, High accuracy analysis by isotope dilution mass spectrometry using an iterative exact matching technique, Accreditation and Quality Assurance, 8 (2003) 191-194.
[12] M. Thompson, Recent trends in inter-laboratory precision at ppb and sub-ppb concentrations in relation to fitness for purpose criteria in proficiency testing, Analyst, 125 (2000) 385-386.

27
List of abbreviations and definitions
EURL European Union Reference Laboratory IDMS Isotope Dilution Mass Spectrometry ISO International Organization for Standardization JRC Joint Research Centre LC-MS/MS Liquid chromatography-tandem mass spectrometry LOD Limit of Detection LOQ Limit of Quantification MS Member States NRL National Reference Laboratory OCL Official Control Laboratory PT Proficiency Test SOP Standard operating procedure SDPA Standard deviation for proficiency assessment s.d. Standard deviation TA Tropane alkaloids

28
9. Annexes
9.1 Opening of registration

29
9.2 Homogeneity test
Homogeneity according to ISO
13528:2015
Black tea
B001-100
Black tea
B001-100
Black tea
B101-200
Black tea
B101-200
Atropine Scopolamine Atropine Scopolamine
Mean 14.1 1.77 6.79 7.44
σ̂ 3.11 (22 %) 0.39 (22 %) 1.49 (22 %) 1.64 (22 %)
0.3 σ̂ (critical value) 0.933 0.117 0.448 0.491
SX (standard deviation of sample averages) 0.404 0.178 0.371 0.416
SW (within-sample standard deviation) 0.517 0.255 0.223 0.342
SS (between-sample standard deviation) 0.172 0.000 0.332 0.339
SS < 0.3 σσσσ̂ Passed Passed Passed Passed

30
31
Homogeneity according to ISO
13528:2015
Peppermint
P001-100
Peppermint
P001-100
Peppermint
P101-200
Peppermint
P101-200
Atropine Scopolamine Atropine Scopolamine
Mean 8.28 1.32 18.24 2.22
σ̂ 1.82 (22 %) 0.29 (22 %) 4.01 (22 %) 0.49 (22 %)
0.3 σ̂ (critical value) 0.547 0.087 1.204 0.147
SX (standard deviation of sample averages) 0.289 0.287 0.672 0.345
SW (within-sample standard deviation) 0.638 0.393 0.731 0.480
SS (between-sample standard deviation) 0.000 0.072 0.429 0.060
SS < 0.3 σσσσ̂ Passed Passed Passed Passed

32

33
Homogeneity according to ISO
13528:2015
Fennel
F001-100
Fennel
F001-100
Fennel
F101-200
Fennel
F101-200
Atropine Scopolamine Atropine Scopolamine
Mean 54.1 13.4 24.2 21.0
σ̂ 11.9 (22 %) 2.94 (22 %) 5.32 (22 %) 4.62 (22 %)
0.3 σ̂ (critical value) 3.568 0.883 1.596 1.387
SX (standard deviation of sample averages) 0.793 0.299 0.740 0.576
SW (within-sample standard deviation) 1.263 0.569 0.847 0.629
SS (between-sample standard deviation) 0.000 0.000 0.434 0.366
SS < 0.3 σσσσ̂ Passed Passed Passed Passed

34

35
9.3 Stability study
Sample - Black tea B101-200
Scopolamine Atropine
T (ºC) Slope Lower 95 % *
Upper 95 % *
Null slope
Slope Lower 95 %
Upper 95 %
Null slope
-18 -0.00815 -0.02352 0.00722 YES -0.00293 -0.01297 0.00711 YES
4 -0.00193 -0.01904 0.01518 YES 0.00351 -0.01957 0.02660 YES
20 -0.00426 -0.02207 0.01356 YES 0.00215 -0.01234 0.01665 YES
* Upper and lower intervals of the regression slope at 95 % confidence level. Sample – Peppermint P101-200
Scopolamine Atropine
T (ºC) Slope Lower 95 %
Upper 95 %
Null slope
Slope Lower 95 %
Upper 95 %
Null slope
-18 0.00167 -0.01292 0.01626 YES -0.01143 -0.04052 0.01767 YES
4 -0.00266 -0.01592 0.01059 YES 0.00318 -0.04145 0.04781 YES
20 0.00185 -0.00768 0.01139 YES -0.01804 -0.06513 0.02904 YES
Sample – Fennel F101-200
Scopolamine Atropine
T (ºC) Slope Lower 95 %
Upper 95 %
Null slope
Slope Lower 95 %
Upper 95 %
Null slope
-18 0.00906 -0.02618 0.04430 YES 0.00793 -0.02935 0.04521 YES
4 0.00639 -0.01918 0.03197 YES -0.01848 -0.04055 0.00359 YES
20 -0.01946 -0.04355 0.00463 YES -0.08208 -0.11278 -0.05138 NO

36
9.4 Accompanying letter
37
38
9.5 Acknowledgement of receipt form

39
9.6 Questionnaire

40
9.7 Kernel density plots
Sample: SAMPLE1B, Measurand: ATROP
µg/kg403020100
Pro
babi
lity
dens
ity
Low
er li
mit
of to
lera
nce
Upp
er li
mit
of to
lera
nce
Assigned value (Reference value): 16.87 ± 0.72 µg/kg
Mean: 17.00 ± 1.54 µg/kg
Mod
e 1:
16.
38 µ
g/kg
(97
%)
Sample: SAMPLE1B, Measurand: SCOP
µg/kg6543210
Pro
babi
lity
dens
ity
Low
er li
mit
of to
lera
nce
Upp
er li
mit
of to
lera
nce
Mean: 2.25 ± 0.28 µg/kg
Assigned value (Reference value): 2.26 ± 0.30 µg/kg
Mod
e 1:
2.0
6 µg
/kg
(89
%)
Mod
e 2:
4.7
0 µg
/kg
(4 %
)
Sample: SAMPLE2B, Measurand: ATROP
µg/kg2017.51512.5107.552.50
Pro
babi
lity
dens
ity
Low
er li
mit
of to
lera
nce
Upp
er li
mit
of to
lera
nce
Assigned value (Reference value): 8.32 ± 0.32 µg/kg
Mean: 8.71 ± 0.77 µg/kg
Mod
e 1:
8.7
3 µg
/kg
(88
%)
Mod
e 2:
14.
55 µ
g/kg
(10
%)
Sample: SAMPLE2B, Measurand: SCOP
µg/kg20181614121086420
Pro
babi
lity
dens
ity
Low
er li
mit
of to
lera
nce
Upp
er li
mit
of to
lera
nce
Mean: 8.68 ± 0.84 µg/kg
Assigned value (Reference value): 9.54 ± 0.51 µg/kg
Mod
e 1:
8.9
8 µg
/kg
(92
%)
Mod
e 2:
13.
68 µ
g/kg
(5
%)
Mod
e 3:
18.
06 µ
g/kg
(3
%)

41
Sample: SAMPLE1F, Measurand: ATROP
µg/kg0
Pro
babi
lity
dens
ity
Low
er li
mit
of to
lera
nce
Upp
er li
mit
of to
lera
nce
Assigned value (Reference value): 42.23 ± 1.76 µg/kg
Mean: 46.78 ± 2.84 µg/kg
Mod
e 1:
25.
00 µ
g/kg
(6
%)
Mod
e 2:
47.
00 µ
g/kg
(85
%)
Sample: SAMPLE1F, Measurand: SCOP
µg/kg250
Pro
babi
lity
dens
ity
Low
er li
mit
of to
lera
nce
Upp
er li
mit
of to
lera
nce
Assigned value (Reference value): 13.41 ± 0.44 µg/kg
Mean: 13.23 ± 0.79 µg/kg
Mod
e 1:
13.
48 µ
g/kg
(94
%)
Sample: SAMPLE2F, Measurand: ATROP
µg/kg0
Pro
babi
lity
dens
ity
Low
er li
mit
of to
lera
nce
Upp
er li
mit
of to
lera
nce
Assigned value (Reference value): 18.84 ± 0.31 µg/kg
Mean: 20.57 ± 1.42 µg/kg
Mod
e 1:
2.8
0 µg
/kg
(3 %
)
Mod
e 2:
18.
40 µ
g/kg
(88
%)
Sample: SAMPLE2F, Measurand: SCOP
µg/kg0
Pro
babi
lity
dens
ity
Low
er li
mit
of to
lera
nce
Upp
er li
mit
of to
lera
nce
Mean: 19.00 ± 1.04 µg/kg
Assigned value (Reference value): 20.75 ± 0.91 µg/kg

42
Sample: SAMPLE1P, Measurand: ATROP
µg/kg200
Pro
babi
lity
dens
ity
Low
er li
mit
of to
lera
nce
Upp
er li
mit
of to
lera
nce
Assigned value (Reference value): 9.46 ± 0.33 µg/kg
Mean: 9.19 ± 0.68 µg/kg
Mod
e 1:
4.6
8 µg
/kg
(9 %
)
Sample: SAMPLE1P, Measurand: SCOP
µg/kg420
Pro
babi
lity
dens
ity
Low
er li
mit
of to
lera
nce
Upp
er li
mit
of to
lera
nce
Assigned value (Reference value): 1.49 ± 0.08 µg/kg
Mean: 1.48 ± 0.22 µg/kg
Mod
e 1:
1.1
8 µg
/kg
(92
%)
Sample: SAMPLE2P, Measurand: ATROP
µg/kg500
Pro
babi
lity
dens
ity
Low
er li
mit
of to
lera
nce
Upp
er li
mit
of to
lera
nce
Assigned value (Reference value): 21.17 ± 0.52 µg/kg
Mean: 20.40 ± 1.71 µg/kg
Sample: SAMPLE2P, Measurand: SCOP
µg/kg50
Pro
babi
lity
dens
ity
Low
er li
mit
of to
lera
nce
Upp
er li
mit
of to
lera
nce
Assigned value (Reference value): 2.52 ± 0.19 µg/kg
Mean: 2.66 ± 0.45 µg/kg
Mod
e 1:
2.2
1 µg
/kg
(89
%)

43
Sample: SPIKE-B, Measurand: ATROP
µg/kg35302520151050-5
Pro
babi
lity
dens
ity
Low
er li
mit
of to
lera
nce
Upp
er li
mit
of to
lera
nce
Assigned value (Reference value): 14.44 µg/kg
Mean: 12.97 ± 1.74 µg/kg
Mod
e 1:
13.
32 µ
g/kg
(97
%)
Sample: SPIKE-B, Measurand: SCOP
µg/kg3532.53027.52522.52017.51512.5107.552.50-2.5
Pro
babi
lity
dens
ity
Low
er li
mit
of to
lera
nce
Upp
er li
mit
of to
lera
nce
Mean: 11.58 ± 1.39 µg/kg
Assigned value (Reference value): 14.57 µg/kg
Mod
e 1:
12.
54 µ
g/kg
(97
%)
Mod
e 2:
23.
54 µ
g/kg
(3
%)
Sample: SPIKE-F, Measurand: ATROP
µg/kg250
Pro
babi
lity
dens
ity
Low
er li
mit
of to
lera
nce
Upp
er li
mit
of to
lera
nce
Assigned value (Reference value): 14.44 µg/kg
Mean: 13.78 ± 0.95 µg/kg
Sample: SPIKE-F, Measurand: SCOP
µg/kg250
Pro
babi
lity
dens
ity
Low
er li
mit
of to
lera
nce
Upp
er li
mit
of to
lera
nce
Mean: 13.03 ± 0.81 µg/kg
Assigned value (Reference value): 14.57 µg/kg
Mod
e 1:
12.
65 µ
g/kg
(94
%)

44
Sample: SPIKE-P, Measurand: ATROP
µg/kg200
Pro
babi
lity
dens
ity
Low
er li
mit
of to
lera
nce
Upp
er li
mit
of to
lera
nce
Mean: 12.30 ± 1.47 µg/kgAssigned value (Reference value): 14.44 µg/kg
Sample: SPIKE-P, Measurand: SCOP
µg/kg3020100
Pro
babi
lity
dens
ity
Low
er li
mit
of to
lera
nce
Upp
er li
mit
of to
lera
nce
Mean: 11.40 ± 1.38 µg/kg
Assigned value (Reference value): 14.57 µg/kg
Mod
e 1:
12.
48 µ
g/kg
(94
%)
Mod
e 2:
30.
81 µ
g/kg
(3
%)

45
9.8. Experimental details
9.8.1. Method performance characteristics
Lab Sample LOQ (µg/kg)
Atrop
LOQ (µg/kg)
Scop
Rec (%) Atrop
Rec (%) Scop
MatrixSup (%) Atrop
MatrixSup (%) Scop
RT (min) Atrop
RT (min) Scop
2 Sample1 B 5.0 5.0 100 100 0.23 0.23 5.80 4.78 Sample1 F 1.0 1.0 100 100 0.8 0.8 5.80 4.78
Sample1 P 1.0 1.0 100 100 0.64 0.64 5.80 4.78
4
Sample1 B 5.0 5.0 5.08 6.86 6.92 6.54 Sample1 F 5.0 5.0 22.21 11.31 6.92 6.54 Sample1 P 5.0 5.0 5.72 16.2 6.92 6.54
5
Sample1 B 2.5 2.5 106 97 1.01 0.95 10.40 7.40
Sample1 F 2.5 2.5 106 97 1.11 1.08 10.40 7.40 Sample1 P 2.5 2.5 106 97 0.8 0.52 10.40 7.40
7
Sample1 B 2.5 2.5 110 93 2.50 2.20 Sample1 F 2.5 2.5 110 93 2.50 2.20 Sample1 P 2.5 2.5 110 93 2.50 2.20
13
Sample1 B 0.5 0.5 119.9 111.7 46.8 32.2 7.30 6.00 Sample1 F 0.5 0.5 100.8 92 46 25.9 7.30 6.00 Sample1 P 0.5 1.0 94.9 98 13.9 4.9 7.20 5.90
14
Sample1 B 0.3 1.0 80 85 22 33 6.90 2.70 Sample1 F 0.2 0.5 80 85 43 61 6.90 2.70
Sample1 P 0.5 0.5 80 85 18 36 6.90 2.70
15
Sample1 B 0.2 0.2 23 30 23 30 8.27 7.94 Sample1 F 0.2 0.2 69 70 69 70 8.27 7.95 Sample1 P 0.2 0.2 88 53 88 53 8.27 7.95
18
Sample1 B 0.3 0.3 105.7 107.2 39.8 26 7.97 6.85 Sample1 F 0.3 0.3 84 83.4 58.7 50.7 8.04 6.91
Sample1 P 0.3 0.3 90.3 79.1 26.3 15.11 8.00 6.88
19
Sample1 B 0.5 0.5 100 100 4.1 1.8 9.00 7.00 Sample1 F 0.5 0.5 100 100 36.6 46.5 9.00 7.00 Sample1 P 0.5 0.5 100 100 25.8 35.6 9.00 7.00
21
Sample1 B 8.61 6.65
Sample1 F 8.63 6.65 Sample1 P 8.61 6.65
23
Sample1 B 5.0 5.0 100 100 80 80 2.96 2.76 Sample1 F 5.0 5.0 120 120 60 60 2.96 2.76 Sample1 P 5.0 5.0 80 80 60 60 2.96 2.76
24
Sample1 B 1.3 0.4 79 52 0.54 0.56 8.32 4.29 Sample1 F 1.6 0.4 130 76 0.48 0.50 8.42 4.36 Sample1 P 1.6 0.8 117 64 0.42 0.44 8.31
25
Sample1 B 0.1 0.3 64 117 36 24 6.30 5.30 Sample1 F 0.1 0.3 21 112 34 27 6.20 5.20 Sample1 P 0.1 0.3 20 24 6.20
27
Sample1 B 71.2 108.4 3.72 3.89 Sample1 F 74.6 100.1 4.33 4.47 Sample1 P 134.8 88 4.09 4.16
28
Sample1 B 5.0 5.0 80 60 0.7 0.80 8.30 7.10 Sample1 F 5.0 5.0 100 60 1 1.20 8.30 7.10
Sample1 P 5.0 5.0 80 70 0.9 0.70 8.30 7.10
30
Sample1 B 1.0 1.0 100 100 2.99 2.46 Sample1 F 1.0 1.0 100 100 2.94 2.42 Sample1 P 1.0 1.0 100 100 2.94 2.37
31
Sample1 B 0.1 0.2 4.40 2.80
Sample1 F 0.1 0.2 78 149.8 47.9 47.8 4.40 2.80 Sample1 P 0.1 0.2 44.2 72.1 82 78 4.40 2.80
33
Sample1 B 4.0 4.0 65.3 91.9 4.73 2.36 Sample1 F 4.0 4.0 104.3 111.3 4.71 2.35 Sample1 P 4.0 4.0 90.1 78.1 91.7 159.1 4.71 2.27
34
Sample1 B 2.0 2.0 44 69 49 66 2.63 1.84
Sample1 F 2.0 2.0 57 69 61 67 2.63 1.84 Sample1 P 2.0 2.0 57 145 63 140 2.63 1.84
35
Sample1 B 1.0 1.0 7.06 3.75 Sample1 F 1.0 1.0 7.06 3.74 Sample1 P 1.0 1.0 7.08 3.77
36
Sample1 B 0.6 0.6 52.83 40.82 81 44.6 4.28 3.47 Sample1 F 0.6 0.6 79.23 97.36 61.27 80.72 4.2 3.42
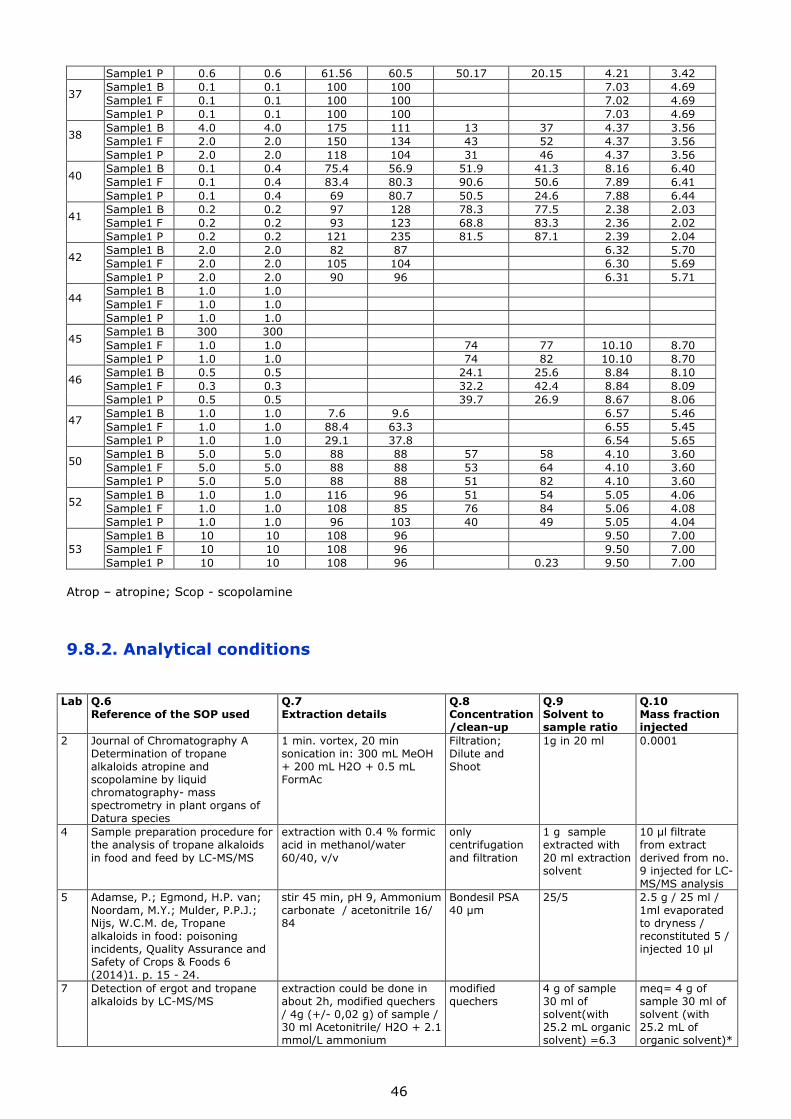
46
Sample1 P 0.6 0.6 61.56 60.5 50.17 20.15 4.21 3.42
37
Sample1 B 0.1 0.1 100 100 7.03 4.69 Sample1 F 0.1 0.1 100 100 7.02 4.69 Sample1 P 0.1 0.1 100 100 7.03 4.69
38
Sample1 B 4.0 4.0 175 111 13 37 4.37 3.56 Sample1 F 2.0 2.0 150 134 43 52 4.37 3.56 Sample1 P 2.0 2.0 118 104 31 46 4.37 3.56
40
Sample1 B 0.1 0.4 75.4 56.9 51.9 41.3 8.16 6.40 Sample1 F 0.1 0.4 83.4 80.3 90.6 50.6 7.89 6.41
Sample1 P 0.1 0.4 69 80.7 50.5 24.6 7.88 6.44
41
Sample1 B 0.2 0.2 97 128 78.3 77.5 2.38 2.03 Sample1 F 0.2 0.2 93 123 68.8 83.3 2.36 2.02 Sample1 P 0.2 0.2 121 235 81.5 87.1 2.39 2.04
42
Sample1 B 2.0 2.0 82 87 6.32 5.70 Sample1 F 2.0 2.0 105 104 6.30 5.69
Sample1 P 2.0 2.0 90 96 6.31 5.71
44
Sample1 B 1.0 1.0 Sample1 F 1.0 1.0 Sample1 P 1.0 1.0
45
Sample1 B 300 300
Sample1 F 1.0 1.0 74 77 10.10 8.70 Sample1 P 1.0 1.0 74 82 10.10 8.70
46
Sample1 B 0.5 0.5 24.1 25.6 8.84 8.10 Sample1 F 0.3 0.3 32.2 42.4 8.84 8.09 Sample1 P 0.5 0.5 39.7 26.9 8.67 8.06
47
Sample1 B 1.0 1.0 7.6 9.6 6.57 5.46 Sample1 F 1.0 1.0 88.4 63.3 6.55 5.45 Sample1 P 1.0 1.0 29.1 37.8 6.54 5.65
50
Sample1 B 5.0 5.0 88 88 57 58 4.10 3.60 Sample1 F 5.0 5.0 88 88 53 64 4.10 3.60 Sample1 P 5.0 5.0 88 88 51 82 4.10 3.60
52
Sample1 B 1.0 1.0 116 96 51 54 5.05 4.06 Sample1 F 1.0 1.0 108 85 76 84 5.06 4.08 Sample1 P 1.0 1.0 96 103 40 49 5.05 4.04
53 Sample1 B 10 10 108 96 9.50 7.00 Sample1 F 10 10 108 96 9.50 7.00
Sample1 P 10 10 108 96 0.23 9.50 7.00
Atrop – atropine; Scop - scopolamine
9.8.2. Analytical conditions
Lab Q.6 Reference of the SOP used
Q.7 Extraction details
Q.8 Concentration/clean-up
Q.9 Solvent to sample ratio
Q.10 Mass fraction injected
2 Journal of Chromatography A Determination of tropane alkaloids atropine and scopolamine by liquid chromatography- mass spectrometry in plant organs of Datura species
1 min. vortex, 20 min sonication in: 300 mL MeOH + 200 mL H2O + 0.5 mL FormAc
Filtration; Dilute and Shoot
1g in 20 ml 0.0001
4 Sample preparation procedure for the analysis of tropane alkaloids in food and feed by LC-MS/MS
extraction with 0.4 % formic acid in methanol/water 60/40, v/v
only centrifugation and filtration
1 g sample extracted with 20 ml extraction solvent
10 µl filtrate from extract derived from no. 9 injected for LC-MS/MS analysis
5 Adamse, P.; Egmond, H.P. van; Noordam, M.Y.; Mulder, P.P.J.; Nijs, W.C.M. de, Tropane alkaloids in food: poisoning incidents, Quality Assurance and Safety of Crops & Foods 6 (2014)1. p. 15 - 24.
stir 45 min, pH 9, Ammonium carbonate / acetonitrile 16/ 84
Bondesil PSA 40 µm
25/5 2.5 g / 25 ml / 1ml evaporated to dryness / reconstituted 5 / injected 10 µl
7 Detection of ergot and tropane alkaloids by LC-MS/MS
extraction could be done in about 2h, modified quechers / 4g (+/- 0,02 g) of sample / 30 ml Acetonitrile/ H2O + 2.1 mmol/L ammonium
modified quechers
4 g of sample 30 ml of solvent(with 25.2 mL organic solvent) =6.3
meq= 4 g of sample 30 ml of solvent (with 25.2 mL of organic solvent)*

47
carbonate (84/16, v/v) / 45 min rotate overhead / Add salts MgSO4 (4g)/NaCl (1g) / Centrifuge for 10,000 rpm for 5 min / 2 mL of supernatant through a 0.2 um PTFE syringe filter / standard addition with 5 microl of 100 ppb
1 microl injection
13 Draft protocol given by EURL after registration for PT
Solvent: methanol/water/formic acid 39:60:1; "head over head" extraction for 1 hour
dilute and shoot
10 0.002
14 extraction from matrix by 0.05M H2SO4, centrifugation, supernatant pH adjustment to 9-10 with ammonia, extraction with ethyl acetate, EtOAC evaporation, dissolution, centrifugation, injection
extraction by agitation (vortex 10s, overhead 15min) and sonication 15min, 0.05M H2SO4
pH adjustment to 9-10, liquid-liquid extraction with ethyl acetate, evaporation of the EtoAc phase, dissolution and high-speed centrifugation,
20 ml to 2 g 1 mg
15 RIKILT SOP for TAs in cereals and cereal products, EFSA project
30 minutes shaking. Extraction solvent methanol/water/formic acid solution (75/25/0.4%)
SPE clean-up using Strata X-C cartridges
4g/40ml 4g/40ml, 5ml for SPE, made up in 0.5ml = 1g/ml. Injection 2ul, meq= 0.002g (2mg)
18 SOP provided by the EC Joint Research Centre, IRMM, EURL Mycotoxins
Extraction time: 1hour shaking, 1 min vortex, methanol/water/formic acid 39/60/1
extract, dilute and shoot. No clean up, just filter with 0.45um membrane
2g of sample, 20 mL extraction solvent
meq=(2/20)x0.010
19 Jandric et al.: Development of a liquid chromatography-tandem mass spectrometric method for the determination of tropane alkaloids and glycoalkaloids in crops. Food Additives and Contaminants Vol 28 (9), 2011, 1205-1219 European Food Safety Authority (EFSA): Scientific Opinion on Tropane alkaloids in food and feed. EFSA Journal 2013;11(10):3386
5 Minutes, Centrifugation non 1/3.25
21 TAs are extracted from solid matrices with an acidic aqueous/methanolic solution. The extracts are purified and concentrated by means of solid phase extraction on a polymeric strong cation exchange cartridge. Tea infusions are purified and concentrated by means of solid phase extraction on a polymeric strong cation exchange cartridge. The purified extract is analysed by LC-MS/MS.
The test sample size is 4 g. IS is added and 40 ml of extraction solution (methanol/water/formic acid solution (75/25/0.4%) are added. Extraction is carried out for 30 min on a rotary tumbler and the samples are centrifuged for 15 min at 3500 rpm.
SPE with Strata X-C
10:1 2.4 mg
23 FAC Vol 28, No. 10, October 2011, 1405-1423 Screening of plant toxins in food, feed and botanicals using full-scan high resolution mass spectrometry, Mol et. al
shaking dilute and shoot
100 0.0000125
24 Ergot alkaloids in Feed by HPLC-MS/MS, BfR Berlin
30 minutes shaking, solvent-mixture: 90 % Methanol + 10 % Water + 0.4 % formic acid
concentration of spike: 0.5 ng/ml; clean-up: SPE Strata-X
20 ml solvent to 0.5 g sample
0.5 g sample extracted with 20 ml solvent, then 2 ml over SPE Strata-X, evaporated to dryness,

48
reconstituted with 2 ml solvent, 5 µl injected for LC-MS analysis
25 IRMM method from EURL "Determination of tropane alkaloids in cereals and cereal products by LC-MS/MS"
shaking in methanol/water/formic acid 39/60/1 for 1 hour
centrifugation, supernatant was used for analysis
10 meq=(2/20)x0.010
27 In house method based on modified QuEChERS procedure. Addition of internal standard was used for detection, quantification and recovery by LC-MS/MS.
Vortex-mixing 3x2minutes, automatic shaker for 2 hours; 10 mL v:v 50:50 0,5% Formic acid in water:acetonitrile.
QuEChERS (MgSO4+NaCl), dSPE (MgSO4+PSA)
28 EURL method 2g with methanol/water/formic acid 39:60:1 / shaker for 1 hour / centrifuge and inject
just dilute 1:10 compared to TA in cereals
10 0.0001
30 For this proficiency test we used the Method from the EURL Mycotoxins. Before we used Quechers
60 minutes on a shaker no 20 ml solvent and 2 g Sample
0.001
31 Deutsche Lebensmittelrundschau, Oktober 2015 page 418
30 minutes (methanol/water 60/40%)
filtration Chromafil Xtra PA 0.45 um
10 4
33 ADAMSE, P. u. H.P. VAN EGMOND (2010): Tropane alkaloids in food, RIKILT - Institute of Food Safety, Report 2010.011
methanol/water/formic acid (60+40+0,4) / 30 min shaking
Dilute and Shoot
sample mass: 2 g ; volume of solvent: 20 ml
0.2 mg
34 ADAMSE, P; H. P. VAN EGMOND (2010): Tropane alkaloids in food, RIKILT - Institute of Food Safety, Report 2010.011
extraction time: 30 sec / Ultraturax MeOH (600ml) / H2O (400ml) / formic acid (4ml) / Ultraturax solvent composition: MeOH/H2O
centrifugation / filtration 0.2µm
10 (2.5/25) x (1/5) x 0.1 = 5 mg
35 2.5 g homogenized sample; add 25 ml Extraction solvent; Blending for 30 Min.; Centrifugation for 10 Min. 4400 rpm; Filtration with syringe filter 0.2 µm; Dilution 1/20 with water: 5 µl injection to LC-MS/MS
Blending for 30 Min.; Extraction solvent: MeOH 600 ml + Water 400 ml + Formic acid 4 ml
Filtration and Dilute
2.5 g/25 ml 2.5 g/25 ml; Dilution 1/20; Inj. 5µl = 0.025 mg
36 Analysed as per method supplied As per method supplied As per method supplied
2 g/20 ml (2/20)x (1/0.5) x 0.02
37 acid extraction, SPE, drying of sample, reconstitution, LC-MS/MS
30 min, 0.05 M H2SO4, sonication
SPE 40 ml solvent for 2 g sample mass
38 Your Method 1h, shaking, Methanol/Water/formic acid 39/60/1
Dilute and Shoot
1g Sample / 10 ml Solvent
2 g sample extracted with 20 mL solvent. Then, 5 µL injected for LC-MS analysis. meq=(2/20) x 0.005
40 RIKILT SOP A1070 (modified) 15 min, blending, methanol / water (60:40) + formic acid (0.4 %)
Dilute and Shoot
4 0.002
41 EURL method provided was used extraction time 1,5 hours / 60:39:1 water: methanol:formic acid (see EURL method provided)
None 20:2 (solvent: ml : sample g)
meq = (2/20) * 0.002= 0.0002
42 In house method (own development)
60% methanol with 0.4% formic acid, 45 min, sonication
dilute and shoot
2g in 20 mL 0.025 mg
44 BfR-PA-2.0 n.s. n.s. n.s. 1g sample, 20 ml solvent, SPE with entire extract, reconst. in 1 mL, Injection of 5 mL
45 http://www.bfr.bund.de/cm/343/bestimmung-von-pyrrolizidinalkaloiden.pdf
15 min sonication (twice); 0,05 M sulfuric acid
C18 10 2
46 SOP for analysis of TAs in dry tea, in house validated (no SOP number)
30 min extraction with methanol/water/formic acid 75/25/0.4 v/v/v
SPE using strong cation exchange (150
2 g sample and 20 ml solvent
2 g extracted with 20 ml solvent, 5 ml
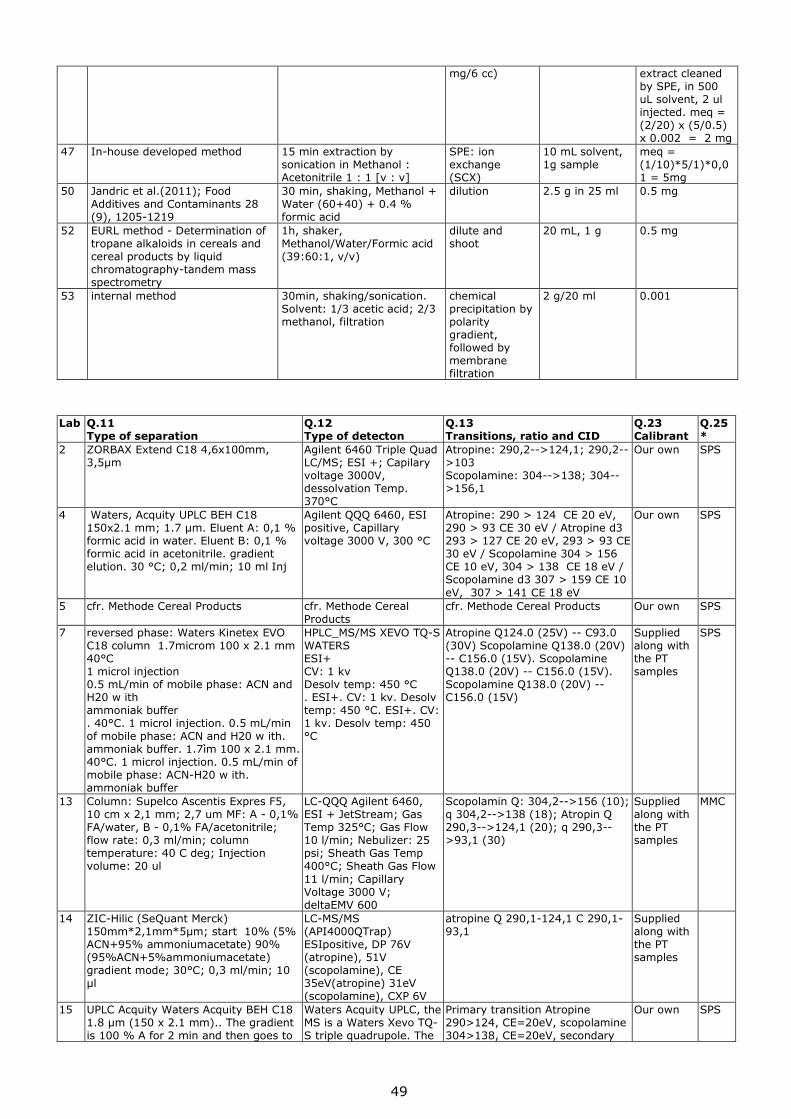
49
mg/6 cc) extract cleaned by SPE, in 500 uL solvent, 2 ul injected. meq = (2/20) x (5/0.5) x 0.002 = 2 mg
47 In-house developed method 15 min extraction by sonication in Methanol : Acetonitrile 1 : 1 [v : v]
SPE: ion exchange (SCX)
10 mL solvent, 1g sample
meq = (1/10)*5/1)*0,01 = 5mg
50 Jandric et al.(2011); Food Additives and Contaminants 28 (9), 1205-1219
30 min, shaking, Methanol + Water (60+40) + 0.4 % formic acid
dilution 2.5 g in 25 ml 0.5 mg
52 EURL method - Determination of tropane alkaloids in cereals and cereal products by liquid chromatography-tandem mass spectrometry
1h, shaker, Methanol/Water/Formic acid (39:60:1, v/v)
dilute and shoot
20 mL, 1 g 0.5 mg
53 internal method 30min, shaking/sonication. Solvent: 1/3 acetic acid; 2/3 methanol, filtration
chemical precipitation by polarity gradient, followed by membrane filtration
2 g/20 ml 0.001
Lab Q.11 Type of separation
Q.12 Type of detecton
Q.13 Transitions, ratio and CID
Q.23 Calibrant
Q.25 *
2 ZORBAX Extend C18 4,6x100mm, 3,5µm
Agilent 6460 Triple Quad LC/MS; ESI +; Capilary voltage 3000V, dessolvation Temp. 370°C
Atropine: 290,2-->124,1; 290,2-->103 Scopolamine: 304-->138; 304-->156,1
Our own SPS
4 Waters, Acquity UPLC BEH C18 150x2.1 mm; 1.7 µm. Eluent A: 0,1 % formic acid in water. Eluent B: 0,1 % formic acid in acetonitrile. gradient elution. 30 °C; 0,2 ml/min; 10 ml Inj
Agilent QQQ 6460, ESI positive, Capillary voltage 3000 V, 300 °C
Atropine: 290 > 124 CE 20 eV, 290 > 93 CE 30 eV / Atropine d3 293 > 127 CE 20 eV, 293 > 93 CE 30 eV / Scopolamine 304 > 156 CE 10 eV, 304 > 138 CE 18 eV / Scopolamine d3 307 > 159 CE 10 eV, 307 > 141 CE 18 eV
Our own SPS
5 cfr. Methode Cereal Products cfr. Methode Cereal Products
cfr. Methode Cereal Products Our own SPS
7 reversed phase: Waters Kinetex EVO C18 column 1.7microm 100 x 2.1 mm 40°C 1 microl injection 0.5 mL/min of mobile phase: ACN and H20 w ith ammoniak buffer . 40°C. 1 microl injection. 0.5 mL/min of mobile phase: ACN and H20 w ith. ammoniak buffer. 1.7ìm 100 x 2.1 mm. 40°C. 1 microl injection. 0.5 mL/min of mobile phase: ACN-H20 w ith. ammoniak buffer
HPLC_MS/MS XEVO TQ-S WATERS ESI+ CV: 1 kv Desolv temp: 450 °C . ESI+. CV: 1 kv. Desolv temp: 450 °C. ESI+. CV: 1 kv. Desolv temp: 450 °C
Atropine Q124.0 (25V) -- C93.0 (30V) Scopolamine Q138.0 (20V) -- C156.0 (15V). Scopolamine Q138.0 (20V) -- C156.0 (15V). Scopolamine Q138.0 (20V) -- C156.0 (15V)
Supplied along with the PT samples
SPS
13 Column: Supelco Ascentis Expres F5, 10 cm x 2,1 mm; 2,7 um MF: A - 0,1% FA/water, B - 0,1% FA/acetonitrile; flow rate: 0,3 ml/min; column temperature: 40 C deg; Injection volume: 20 ul
LC-QQQ Agilent 6460, ESI + JetStream; Gas Temp 325°C; Gas Flow 10 l/min; Nebulizer: 25 psi; Sheath Gas Temp 400°C; Sheath Gas Flow 11 l/min; Capillary Voltage 3000 V; deltaEMV 600
Scopolamin Q: 304,2-->156 (10); q 304,2-->138 (18); Atropin Q 290,3-->124,1 (20); q 290,3-->93,1 (30)
Supplied along with the PT samples
MMC
14 ZIC-Hilic (SeQuant Merck) 150mm*2,1mm*5µm; start 10% (5% ACN+95% ammoniumacetate) 90% (95%ACN+5%ammoniumacetate) gradient mode; 30°C; 0,3 ml/min; 10 µl
LC-MS/MS (API4000QTrap) ESIpositive, DP 76V (atropine), 51V (scopolamine), CE 35eV(atropine) 31eV (scopolamine), CXP 6V
atropine Q 290,1-124,1 C 290,1-93,1
Supplied along with the PT samples
15 UPLC Acquity Waters Acquity BEH C18 1.8 µm (150 x 2.1 mm).. The gradient is 100 % A for 2 min and then goes to
Waters Acquity UPLC, the MS is a Waters Xevo TQ-S triple quadrupole. The
Primary transition Atropine 290>124, CE=20eV, scopolamine 304>138, CE=20eV, secondary
Our own SPS

50
40 % A 60 % B at 12 min. We then step it up to 99 % B for a 3 min flush and re-equilibrate for 5 min.. A is 10 mM ammonium carbonate in water at pH 10 (adjusted with ammonia) and B is acetonitrile.
capillary voltage was 2 kV and the desolvation temperature was 500 oC.
transitions were 290>93 CE = 25 eV for atropine and 304>103 CE = 30 eV for scopolamine.
18 F5 column, 10cm x 2.1 mm, 2.7 um particle size, mob. phase water+0.1% FA and MeOH+0.1% FA gradient, temp. 40oC, flow rate 0.3 mL/min, inj. vol. 10 uL
LC-MS/MS, Thermo Finnigan TSQ Quantum, ESI+, Spray Voltage 3400V, Cap. Temp. 325oC
Atropine: Q: 124.2 (22V), C: 93.1 (31V)
Supplied along with the PT samples
SPS
19 Column Oven Agilent 1290 G1316C Agilent 1260 G1312B 0 AutoSampler CTC
see 11 see 11
21 Waters UPLC BEH C18 (1.0 mm id * 100 mm), 40 ºC, flow 0.150 mL/min, Mobile phase A: 6.65 mM ammonium hydroxide pH 10.0 ; Mobile phase B: acetonitrile . 2 microL inyected
WATERS TQD (MS/MS), ESI positive, cone voltage 30 V, capillary 3 V, desolvation temperature 400 ºC
Atropine 289.9->124.1 (CID 25 V) Scopolamine 303.9 ->138.1 (CID 40 V)
Our own MMC
23 RP18plus, Macherey-Nagel, Nucleoshell, 100 mm x 2 mm. 2.7 µm. 30°C, 0,3 mL/min, 5 µL
Agilent 6490, ESI +, Atropin 290.2/124.1 (CE28 V), Atropin 290.2/77 (CE 60 V), Atropin 290.2/93 (CE 37 V); Scopolamin 304.2/103 (CE 49 V), Scopolamin 304.2/138 (CE 21 V), Scopolamin 304.2/156 (
Our own SPS
24 1. Aqua C18, 3 µm, 50 x 2 mm; 2. Gemini C18, 3 µm, 100 x 3 mm in series connection mobile phase A: 10 mM Ammoniumbicarbonate in water mobile phase B: Acetonitrile temperature: 40 °C flow rate: 200 µl/min inject. vol.: 5 µl
LC-MS instrument: API 5500 QTRAP ESI positiv Ions spray voltage: 5500 V Temperature: 500 °C
Atropine: Q1: 124 CE: 33 Q3: 93 CE: 39 Scopolamine: Q1: 156 CE: 23 Q3: 103 CE: 55 Q3: 103 Atropine-d3: Q1: 127 CE: 33 Q3: 77 CE: 85
Our own SPS
25 Pentafluorophenyl column, Ascentis Express F5. 100mmx2.1mm 2.7µm; water/acetonitrile with 0.1% formic acid; 40 °C; 0.3 ml/min; 10 µL injection volume
LC-MS, ABSciex 5500 QTrap, ESI positiv, IS 2500 V, TEM 200 °C
atropine: Q 290-->124 CE 33 V, C 290-->93 CE 39 V. scopolamine: Q 304-->156 CE 25 V, C 304-->138 CE 29 V. scopolamine: Q 304 --> 156 CE 25 V, C 304 --> 138 CE 29 V
Supplied along with the PT samples
SPS
27 Column: XBridge Amide, Waters, 150x2,1 mm, particle size 3,5 um, temperature 30 C, flow rate 0,2 mL/min, injection volume 20 uL. Mobile phase: water and acetonitrile.
LC-MS/MS, Thermo Finnigan type TSQ Quantum ULTRA EMR, ESI (+); Spray voltage 4000 V; Dessolvation temperature: 200 C, Capillary temp. 325 C.
290.030>93.100 (31V); 290.030>124.200 (22V); 295.120>93.100 (31V); 295.120>124.170 (24V); 304.100>138.140 (22V); 304.100>156.180 (22V); 304.100>182.200 (20V); 308.100>142.160 (22V); 308.100>160.200 (22V);
Supplied along with the PT samples
SPS
28 Ascentis Express F5 10cm x 2,1 mm 2,7
LC-MS/MS Quattro Ultima Platinum Waters
Atropine Q 124.3 C 93.1 Scopolamine Q 138.0 C 155.9
Supplied along with the PT samples
SPS
30 Supelco Ascentis Express F5; 10cm * 2.1mm, 2,7µm; Water 0,01% Formic Acid, Acetonitrile + 0,01% Formic Acid; 0.300 ml/min; 10µl Inj
LC-MSMS ABSciex 400QTrap; Esi pos; DP 71, CD 27
Scopolamin: 304,007 - 155,9 304,007 - 138,0 Atropin: 290,032 - 124,0 290,032 - 93,0
Our own MMC
31 Waters BEH C18: 1.7 um; 2.1x50 mm; injection 5 ul; 0.3 ml/min. gradient elution Water/Methanol with 0.1% formic acid
UPLC-MS/MS Waters Acquity TQD
atropine: 290.1-93.1/290.1-124.1. atropine IS: 295.1-93.1/295.1-124.1. scopolamine: 304-138.1/304-156. scopolaine IS: 308-142.1/308-160
33 Waters Aquity BEH C18 1,7 µm, 2,1 x 50 mm
LC-MSMS: Waters Acquity Xevo TQD, ESI+
Scopolamin: 304 -> 138 (Q); 304 -> 103 (C)
Our own MMC
34 look PT TA in cereal-based products look PT TA in cereal-based products
look PT TA in cereal-based products
Our own MMC
35 Kinetex C18 2.6µ 100A; lenght: 100mm; inner diameter: 2.1mm; particle size: 2.6µm; Eluent A: Water with 0,1% Formic acid; Eluent B: MeOH with 0,1% Formic acid; Gradient from 10% B at 0 Min. to 90% B at 10 Min.; Temperature 35°C;
Sciex QTrap 5500; ESI pos.; 5500 Volts; 650°C
Atropin: 290.078 --> 124.0; CE 33 ; 290.078 --> 93.0; CE 39;. Scopolamin : 304.062 --> 138.1; CE 27; 304.062 --> 156.1; CE 23;
Supplied along with the PT samples
SPS
36 As supplied ESI: Positive, KV:3.75, Cone:35, Source
Scopolamine:304.3 >138(Q) CID 22 304.3> 156.1(C) CID 55 /
Supplied along with
MMC

51
Temp:120, Desolvation Temp:280
Atropine 290.3> 124.2(Q) CID 26 290.3>93.2 CID 21
the PT samples
37 C18 column, 2.1 x 150 mm, 1.8 micron; mobile phases: H2O (A) and MeOH (B) both containing formic acid and ammonium formiate, injection 1µl, flow rate 0.5 ml/min
LC-MS/MS, ESI mode (pos.)
Atropin: Q 290.2 > 124 (CE = 21); 290.2 > 93 (CE = 29). Scopolamin: Q 304.2 > 156 (CE = 9); C 304.2 > 138 (CE = 21)
MMC
38 Agilent Zorbax Eclipse Plus C18 RRHD 2,1 x 100mm 1,8µm, Acetonitril/Methanol/Water 1:1+0,1 %FA / Water+0,1% FA 10:90, 40°C, Flow: 0,4µl, Inj: 5µl
Agilent 6460, LC-MS/MS, ESI+, 3000V, 400°C
Scopolamin: Quant: 304.2 > 156.1, Quali: 304.2 > 138.1, 304.2 >103 Atropin: Quant: 290.2 > 124, Quali: 290.2 > 93
Supplied along with the PT samples
MMC
40 XBridge C18, 5µm, 3.0 x 150 mm, Waters; mobile phase: water/acetonitrile, 6 mM NH4OH; 40 °C
LC-MSMS; Waters TQ; ES+; 2 kV; 400 °C
Atropine: 290.16 > 124.24 (25 eV); 290.16 > 93.17 (25 eV); Scopolamine: 304.21 > 138.25; 304.21 > 156.25
Supplied along with the PT samples
SPS
41 Column = Acquity UPLC HSS T3, (1.8 µm, 2.1x 100 mm) Eluens A = 0.02% formic acid in H2O Eluens B= 0.02% fomic acid in acetonitril Temp. 40°C, flow rate = 0,3 ml/min, injection volume = 2.0 µl
LC=MS-MS, ESI+, capillary voltage = 1.05V, dessolvation temperature=600°C
Atropine: 290.1 ->124.1 (23 eV) / 290.1-> 93.1 (28 eV) Scopolamine: 304.1-> 138.0 (20 eV) / 304.1-> 156.0 (16 eV) CID-Energy
Our own SPS
42 50 x 2,1 mm Kinetex C18, 2,6 µm, gradient, 0.2% formic acid in water and methanol, 25°C, 0.3 mL/min, 10 µL
LC-MS/MS, API 5500 (Sciex), ESI positive
atropine Q 290.0 -> 124.0, CE 33; C 290.0 -> 93.0, CE 45 / scopolamine Q 304.1 -> 138.0, CE 31; 304.1 -> 103.1; CE 50
Our own MMC
44 n.s. LC-MS/MS (Sciex API 5500)
n.s. Our own SPS
45 Macherey-Nagel, Nucleoshell RP 18plus, 150 x 2 mm, particle diameter: 2,7 µm; eluent a: 315 mg ammonium formate + 1 ml formic acid + 1 l water; eluent b: 315 ammonium formate + 1 ml formic acid + 1 l methanol
LC-MS/MS; 5500 Triple Quad (SCIEX), ESI positive, 4500 V, 550 °C
Atropine: 290-->124 (Q), CID 41V; 290-->93 (C), CID 43V; scopolamine: 304-->138 (Q), CID 31V; 304-->156 (C), CID 23V
Supplied along with the PT samples
SPS
46 Waters UPLC BEH C18 150x2.1 mm, 1.7 um. mobile phaes A: 10 mM ammonium carbonate pH 10.0, mobile phase B: acetonitrile. 400 ul/min, 50°C
Waters Xevo TQ-S LC-MS/MS. Pos ESI, cap V: 3.0 kV, cone: 30 V., desolvation gas: 600°C, cone : 150°C, collission gas: argon, 4.2x10⁻³ mbar
Atropine: Q = 290.2 > 124.0, CE: 20 eV; C = 290.2 > 93.0, CE: 25 eV. Scopolamine: Q = 304.2 > 138.0, CE: 20 eV; C = 304.2 > 103.0, 35 eV.
Our own MMC
47 Waters Acquity BEH 150 + 2.1 mm, 1.7 µm
LC-MS² AbSciex 5500 in ESI+ mode
Q(Atropin) = 290,2 / 124 CE = 33eV C(Atropin) = 290.2 / 93.0 CE = 49 eV Q(Scopolamin) = 304.2 / 138.1 CE = 29 eV C(Scopolamin) = 304.2 / 156.1 CE = 23 eV
Supplied along with the PT samples
SPS
50 Water Xselect HSS T3, 2.5 µm 2.1 x 100 mm, Methanol, Water + 1% Formic Acid, Flow Rate 350 µm7min, 5 ml
LC-MS/MS, SCIEX QTrap 5500, Esi pos, 400 °C, 5500 V
Scopalamin: 304>138.2 DP 66V; CE 27 V; 304>156, DP 66 V, CE 23 .Aropin; 290>124.1 DP 96V; CE 33 V; 290>92.9 DP 96 V; CE 39 V
Supplied along with the PT samples
SPS
52 Supelco ascentis express F5 10cmx2.1mm; 2.7um
Waters UPLC-Quattro premier. parameters as reported in the EURL method
Same as reported in the EURL methods
Supplied along with the PT samples
SPS
53 Thermo Hypersil Gold (150 x 2,1 mm, 3 micrometer) eluent A water, eluent B methanol temperature 40°C flow rate 300 mL/min injection volume 10
SCIEX API 400, SCIEX Qtrap5500 ESI + dessolvation temperature 500°C IS 5500
Atropine 290.259/124.200 CE 31 CXP 8 / 290.259/93.000 CE 39 CXP 14 /290.259/91.000 CE 59 CXP 10 / DP 106 EP 10 Scopolamine 304.232/138.100 CE61 CXP10 / 304.232/156.100 CE23 CXP12 / 304.232/103.000 CE55 CXP10 DP61 EP10
Our own SPS
* Approach for calibration: MMC – matrix-matched calibration / SPS – standards in pure solvent

52
Lab Q.16 Strategy used for LOD/LOQs estimation
Q.17 Performance parameters SCOP
Q.18 Performance parameters ATROP
Q.19 Recovery calculation
Q.28 Results reported
2 low level spiking R2=0,99985549 R2=0,99996418 spiking matrix NOT CORRECTED
for recoveries
4 S/N 3.1 qualifier for LOD; 10 : 1 qualifier for LOQ
R^2 = 0,99885797 R^2 = 0,99918363 isotope labled internal standard
NOT CORRECTED for recoveries
5 cfr. Methode Cereal Products
cfr. Method Cereal Products
cfr. Methode Cereal Products
cfr. Methode Cereal Products
NOT CORRECTED for recoveries
7 the lowest validated level was chosen as an LOQ (2.5 ppb)
R2=0.998 Scopolamine (conc: RSD% day1 to 3) : 2.5 ppb: 4.31/ 50 pbb: 5.66/150 ppb: 11.65
R2 =0.988 Atropine (conc: RSD% day1 to 3) : 2.5ppb: 19.90/ 50 pbb: 8.19/150 ppb: 11.50
based on the in validation spiked cereal samples- a total mean recovery per component was determined which included results of 3 days and 3 concentrations
NOT CORRECTED for recoveries
13 R2=0.997 R2=0.998 spiked blank sample,
whole analytical procedure
NOT CORRECTED for recoveries
14 LOD S/N 3 RSD % 1-8 %
standard addition curve > 0,98
RSD % 1-8 % standard addition curve > 0,98
spiked matrix NOT CORRECTED for recoveries
15 LOQ = lowest calibration standard
r2=0.998 r2=0.998 Internal standard added before extraction to carry out inherent recovery correction.
CORRECTED for recoveries
18 parameters from the calibration curve
R2=0.9981 R2=0.9978 Spiked blank matrix CORRECTED for recoveries
19 calibration curve RSD <20%, >0,999 RSD <20%, >0,999 0,2-2µg/kg CORRECTED for
recoveries
21 LOD = s/n 3 r=0.998 r=0.998 recovery not
calculated for these matrices
NOT CORRECTED for recoveries
23 low level spikes 1.6 %, 0.998 3,18 %, 0.997 spiked matrix NOT CORRECTED
for recoveries
24 S/N ratio (3 and 10) of each sample and spiking each sample
r= 0.9995 (linear regression)
r= 0.9996 (linear regression)
spiked matrix NOT CORRECTED for recoveries
25 S/N 3 and 10 2 %, 0,9999 3 %, 0,9998 spiked matrix CORRECTED for
recoveries
27 Spiked matrix CORRECTED for
recoveries
28 S/N, blank and low level spike
R2 0,999 R2 0,999 spiked matrix NOT CORRECTED for recoveries
30 Low Level spike r=0,99657 r=0,98981 Procedural Standard
Calibration CORRECTED for recoveries
31 estimation from standard curve
determination of ratio of [analyte in solution of spiked sample]/[theoretical concentration calculated from area of spiked solution diluted in mobile phase]
33 S/N ration (3 and 10) of spiked blanks
r = 0,99836 r = 0,99919 spiked blank matrices NOT CORRECTED for recoveries
34 S/N ratio 10 %; 0.9973 6 % ; 0.9984 spiked matrix NOT CORRECTED
for recoveries
35 DIN 32645 (Calibration Curve with Std.'s in low Concentration)
NOT CORRECTED for recoveries
36 LOD Taken as lowest std & LOQ lowest std x calculation of method factor
Black tea:0.998765, PM:0.998849, Fennel:0.99775
Black tea:0.996609, PM:0.997278, Fennel:0.999009
As requested 0.2 mls of spiking sol into 2g as requested
CORRECTED for recoveries
37 low level spikes we used spiked matrix

53
38 S/N (3 and 10, Peak-to-Peak)
99,99%, 0,999922 99,99%, 0,999889 Matrix calibration NOT CORRECTED for recoveries
40 S/N ratio 3/6, respectively
24.6; 0.999 16.4; 0.998 Spiked matrix NOT CORRECTED for recoveries
41 Blank low level spikes + s/n ratio
RSD = 20%; correlation coeficient =0.9999
RSD= 25%;, correlation coefficient =0.9999
spiked matrix NOT CORRECTED for recoveries
42 low level spikes 0.998 0.999 spiked matrix NOT CORRECTED
for recoveries
44 S/N ratio n.s. n.s. n.s. NOT CORRECTED
for recoveries
45 S/N ratio (LOQ: 10; LOD: 3), low level spikes
0.9998 0.9999 - NOT CORRECTED for recoveries
46 LOD: S/N =3 for secondary transition (rounded off) LOQ: S/N = 6 for secondary transition (rounded off)
calibration: 0.998-1.000
calibration: 0.999-1.000
Spiked to blank matrix (3 PT materials supplied)
CORRECTED for recoveries
47 S/N ratio 3 and 10 for LOD, LOQ respectively in low level spiked samples
r = 0.99898 RSD = 5.14%
r = 0.99989 RSD = 4.03%
Matrix spiked with internal standard (SIDA)
NOT CORRECTED for recoveries
50 LOD: S/N 3: LOQ: S/N: 5 r = 0.999 r = 0.999 NOT CORRECTED
for recoveries
52 LOD S/N=3; LOQ S/N=6 17 13 spiked matrix NOT CORRECTED
for recoveries
53 S/N ratio - - spiked matrix NOT CORRECTED
for recoveries

1
How to obtain EU publications
Our publications are available from EU Bookshop (http://bookshop.europa.eu),
where you can place an order with the sales agent of your choice.
The Publications Office has a worldwide network of sales agents.
You can obtain their contact details by sending a fax to (352) 29 29-42758.
Europe Direct is a service to help you find answers to your questions about the European Union
Free phone number (*): 00 800 6 7 8 9 10 11
(*) Certain mobile telephone operators do not allow access to 00 800 numbers or these calls may be billed.
A great deal of additional information on the European Union is available on the Internet.
It can be accessed through the Europa server http://europa.eu

2
doi:10.2760/90137
ISBN 978-92-79-69848-4
KJ-N
A-2
8662-E
N
JRC Mission
As the Commission’s
in-house science service,
the Joint Research Centre’s
mission is to provide EU
policies with independent,
evidence-based scientific
and technical support
throughout the whole
policy cycle.
Working in close
cooperation with policy
Directorates-General,
the JRC addresses key
societal challenges while
stimulating innovation
through developing
new methods, tools
and standards, and sharing
its know-how with
the Member States,
the scientific community
and international partners.
Serving society Stimulating innovation Supporting legislation