REPORT ON TAX EXPENDITURES - Budget 2018 on Tax Expenditures Incorporating outcomes of certain tax...
52
REPORT ON TAX EXPENDITURES Incorporating outcomes of certain Tax Expenditure Reviews completed since October 2016 OCTOBER 2017
Transcript of REPORT ON TAX EXPENDITURES - Budget 2018 on Tax Expenditures Incorporating outcomes of certain tax...

REPORT ON TAX EXPENDITURES
Incorporating outcomes of certain Tax Expenditure Reviews completed since October
2016
OCTOBER 2017

Report on Tax Expenditures
Incorporating outcomes of certain tax expenditure reviews completed since October 2016
October 2017
Tax Policy Division Department of Finance Government Buildings, Upper Merrion Street, Dublin 2, D02 R583, Ireland
E-mail: [email protected] Website: www.finance.gov.ie

Department of Finance | Report on Tax Expenditures
i
Preface > The Department of Finance’s October 2014 “Report on Tax Expenditures” set out new Guidelines for
best practice in ex ante and ex post evaluation of tax expenditures. By way of example it included a
brief synopsis of some of the more recent tax expenditure reviews.
In October 2015, the Department published its first annual Report on Tax Expenditures which built on
the 2014 Tax Expenditure Guidelines. It contained a set of tables outlining the fiscal impact of the range
of tax expenditures as required under the EU Budgetary Framework Directive1, and also the results of
certain tax expenditure reviews that have been completed since the last Budget.
This Report, the Report on Tax Expenditures 2017, is the third such report, and continues in a similar
format to those published in 2015 and 2016. It contains the findings (one in summary) of two tax
expenditures reviews, as well as the tables referred to above.
This Report, the Report on Tax Expenditures 2017, is the third such report.
1 http://eur-lex.europa.eu/legal-content/EN/TXT/?uri=uriserv:ec0021
Department of Finance | Report on Tax Expenditures (October 2017)
ii
Contents >
1. Introduction and Summary
2. Tax Expenditure Reviews
I. Revenue Commissioners Review of the Operation of the Dwelling House Exemption
II. Summary of Indecon Impact Assessment of the Help to Buy Tax Incentive
3. Tables of Tax Expenditures having effect between October 2015 and September 2016
1. Capital Gains Tax (CGT)/Capital Acquisitions Tax (CAT)/Pensions
2. Stamp Duty/Deposit Interest Retention Tax (DIRT)/Local Property Tax (LPT)
3. Benefit-in Kind
4. Corporation Tax
5. Excise Duty
6. Value Added Tax (VAT)
7. Personal Tax Credits
Department of Finance | Report on Tax Expenditures
1
1: Introduction and Summary
This report is the third such annual report2. It sets out the tax expenditures that have been in effect
since the previous such report (which was published in October 2016).
Tax Expenditures
As was set out in the 2014 Report, the definition of a tax expenditure in Irish legislation draws on an
OECD definition and describes a tax expenditure as a transfer of public resources that is achieved
by:
a) Reducing tax obligations with respect to a benchmark tax rather than by direct expenditure;
or
b) Provisions of tax legislation that reduce or postpone revenue for a comparatively narrow
population of taxpayers relative to the tax base.
Tax expenditures may take a number of forms such as exemptions, allowances, credits, preferential
rates, deferral rules etc. They are general government policy instruments used to promote specific
social or economic policies and are closely related to direct spending programmes.
The introduction of an obligation on Member States to publish information on the impact of tax
expenditures in the context of the Budgetary Frameworks Directive was driven by the fragmented
and un-transparent nature of information about tax expenditures previously available. This was
seen as acting to both hinder the effectiveness and efficiency of fiscal policy making by Member
States, and to render the identification of possible improvements to fiscal and tax arrangements
more difficult.
The tables of Tax Expenditures having effect in the period between October 2016 and September
2017 are in section 23 of this report, showing data for the last two years for which it is available.
Driven by the ever increasing awareness of the important, but regularly overlooked, role played by
tax expenditures as a stand-alone category within the tax policy sphere, as part of the 2017 Tax
Strategy Group (TSG) process, a paper entitled “Tax Expenditure Review 2017” was prepared for
that Group’s consideration when it met in July 2017.
2 The 2016 version of this Report can be found at:
http://www.budget.gov.ie/Budgets/2017/Documents/Tax_Expenditures_Report%202016_final.pdf
The 2015 version of this Report can be found at:
http://budget.gov.ie/Budgets/2016/Documents/Tax_Expenditures_Report_pub.pdf
3 It has not proved possible to include projections for all current tax expenditures in this report, therefore
only the most recently available data for the preceding full two years is shown.

2
The TSG 2017 paper looks at:
official policy on tax expenditures;
defining tax expenditures;
the merits and demerits of tax expenditures;
the evolution of the analysis and overview of the most significant tax expenditures in
Ireland; and,
the evaluation of tax expenditures
This paper was subsequently published and can be found at http://www.finance.gov.ie/wp-
content/uploads/2017/07/TSG-17-13-Tax-Expenditures-PL.pdf
Tax Expenditure Reviews
Over the course of each year, a number of reviews of tax expenditures take place, to ensure that
the tax expenditures in place remain fit-for-purpose, and to ascertain whether changes to existing
expenditures, if they should be ended, or if new expenditures are warranted. These are carried out
in-house by the Department of Finance (in co-operation with the Office of the Revenue
Commissioners and where appropriate other relevant Departments), by the Office of the Revenue
Commissioners, or through availing of specialised consultants, again with the input of this
Department, Revenue and other relevant Departments (where appropriate).
The opportunity presented by the need to publish this Tax Expenditures Report, is being availed of
again to include a small number of the reports which have been completed since Budget 2016.
Two review reports (on a summary of a much larger report), as listed on the contents page, are
included in Section 2 of this document.

3
2: Tax Expenditure Reviews
Review I: Revenue Commissioners Review of the Operation of the Dwelling House Exemption
1. Introduction
An exemption from Capital Acquisitions Tax (CAT) is available under section 86 of the Capital
Acquisitions Tax Consolidation Act (CATCA) 2003 for a gift or an inheritance of a dwelling house
provided certain conditions are met. Originally introduced as a relief in Finance Act 1991, it became
a full exemption under Finance Act 2000. As an exemption, the full value of a dwelling house could
now be gifted or inherited without any of it being subject to CAT, subject to certain conditions.
Changes introduced in Finance Act 2016 significantly restricted the exemption, particularly as it
related to gifts.
At Report Stage of Finance Bill 2016 the following amendment was tabled by Deputy Joan Burton:
“The Minister shall within one month of the passing of this Act prepare and lay before Dáil Éireann a
report on the operation of Section 86 of the Capital Acquisitions Tax Consolidation Act 2003 (which
provides that gifts and inheritances of a dwelling house are in certain circumstances exempt from
capital acquisitions tax), insofar as the section facilitates the purchase by parents of valuable homes
for their children and the inter vivos transfer of those homes, as a means of avoiding inheritance
tax.”.
While the Minister for Finance did not accept the amendment, given the wider restriction
introduced by him in the Finance Bill, he gave a commitment that he would direct the Revenue
Commissioners to produce a report on its findings on the operation of the dwelling house
exemption.
This report describes the data analysis carried out by Revenue in relation to the period 2011 to 2016
inclusive, focussing particularly on gifts of dwelling houses from parents to children.
2. The development of the exemption
The exemption, as introduced by Finance Act 1991, applied to the inheritance of a dwelling house
by elderly (i.e. at least 55 years of age) brothers and sisters of the deceased who had lived with the
deceased for at least 5 years prior to the date of the inheritance and who had no interest in any
other house at that time. The relief was capped at the lesser of £50,000 or 50% of the value of the
house. Finance Act 2000 radically altered the relief so that it became the full exemption that was in

4
place up to 25 December 2016 (date of enactment of Finance Act 2016). Appendix 1 summarises
the changes made to the relief by a number of Finance Acts.
2.1 Pre Finance Act 2016
Prior to the Finance Act 2016 changes, section 86 CATCA 2003 provided for a wider exemption from
gift/inheritance tax in the case of a dwelling house, provided certain conditions were met. The main
conditions were that the recipient of the dwelling house must have occupied the house as his/her
only or main residence for at least the three-year period preceding the date of the gift/inheritance
and must not have had an interest in any other dwelling house. The recipient had to continue, except
where he/she was aged at least 55 years at the date of the gift/inheritance, to own and occupy that
dwelling house as his/her only or main residence for the six-year period following the date of the
gift/inheritance to retain entitlement to the exemption. In the case of gifts, the dwelling house had
to be owned by the donor during the three-year period preceding the date of the gift.
2.2 Post Finance Act 2016
Section 86 CATCA 2003 was significantly amended by Finance Act 2016 to bring the dwelling house
exemption back in line with its original policy objective, i.e. to prevent the hardship of the forced
sale of property to pay inheritance tax where the person receiving the property had lived there and
had no interest in another property. The revised exemption came into operation on 25 December
2016 (date of enactment of Finance Act 2016).
The Finance Act 2016 changes have two principal effects as follows:
Firstly, the exemption is available only for inheritances. With one exception, it is no longer
possible to receive a gift of a dwelling house free from CAT. The exception is where a person
gifts a dwelling house to a dependent relative. For this purpose, a dependent relative is a
direct relative of the donor, or of the donor’s spouse or civil partner, who is permanently and
totally incapacitated because of physical or mental infirmity from maintaining himself or
herself or who is over the age of 65.
Secondly, the inherited dwelling house must have been the deceased person’s principal
private residence at the date of his/her death. This requirement is relaxed in situations where
the deceased person had to leave the house before the date of death because of ill health;
for example, to live in a nursing home. This change means that tax-free properties passing by
inheritance from a parent to a child will be the family home.
The amended section 86 retains some of the pre Finance Act 2016 conditions such as the
requirement that the recipient does not have an interest in another dwelling house and that he/she
is required to occupy the dwelling house for the three-year period preceding the inheritance. This
means that because a dwelling house must be the principal private residence of the deceased
person, there is now an implicit requirement that the deceased person and the recipient both
occupy the dwelling house for at least some of the required three-year occupancy period.
In addition, to retain entitlement to the exemption, the recipient must continue, except where
he/she is aged at least 65 years at the date of the gift/inheritance, to continue to own and occupy

5
the dwelling house as his/her only or main residence for the six-year period following the
gift/inheritance.
3. Revenue Analysis
The restriction on the operation of the dwelling house exemption imposed by Finance Act 2016
was motivated by a concern that it was possible for people to use the exemption to pass on
significant tax-free wealth in the form of residential property in a way that was not intended when
the exemption was introduced. There was a particular concern that this was happening in the case
of gifts of property from parents to their adult children following a three-year period of occupation
of a property that had been acquired specifically for this purpose.
Revenue carried out a data gathering and analysis exercise to see how the exemption operated
over the period 2011 to 2016 in relation to the gifting of dwelling houses by parents to their
children. The primary source of data was the Capital Acquisition Tax (CAT) return forms (IT38)
submitted by recipients of dwelling houses claiming the exemption. A secondary source of data
was the stamp duty return forms (STR1) submitted by recipients of dwelling houses following the
transfer of the houses.
The analysis of the data needs to be seen within the constraints in respect of CAT returns and
Stamp Duty returns set out in Appendices 4 and 5.
4. Findings
4.1 CAT returns
Just over 3,500 CAT IT38 returns indicating that the dwelling house exemption was being claimed
were submitted to Revenue in the filing period 2011 to 2016. These returns were in respect of
transfers of property occurring in the period September 2010 to August 2016.
Table 1 below shows the total number of claims (both gifts and inheritances) submitted over this
six-year period and the number of these claims accounted for by gifts, gifts from parents to
children and properties valued at more than €400,000.
Table 1 – Dwelling House Exemption claims 2011 – 2016
2011 2012 2013 2014 2015 2016 Total
Total claims 555 498 535 611 728 642 3,569
Inheritance
claims
421 363 402 463 560 408 2,617
Gift claims 134 135 133 148 168 234 952

6
Parent to child
gifts4
68 80 76 95 121 160 600
Parent to child
gifts of houses
over €400k
27 20 14 20 25 52 158
Table 2 below provides an estimate of the CAT forgone in respect of those individuals claiming the
dwelling house exemption.
Table 2 – Cost of Exemption (CAT forgone)
2011
2012 2013 2014 2015 2016 Total
Parent to child gifts 68 80 76 95 121 160 600
Value of houses
gifted €M
25.52
30.40 22.08 29.63 34.27 74.2 216.10
CAT forgone
€M
2.94 5.13 3.06 4.27 3.28 12.85 31.53
The 600 houses gifted by parents to children had a total declared market value of €216.10m. An
estimate of the CAT forgone for each recipient was calculated by deducting the full group A tax-
free threshold applicable at the date of the gift from the value of the dwelling house and then
applying the tax rate in force at the time to the remaining taxable value. These calculations
provided a figure of €31.53m in CAT forgone in respect of the claims received over the filing period
2011 to 2016.
5. Conclusion
There is evidence of a steadily upward trend in the number of dwelling house exemption claims
over the period 2011 to 2016 within the parameters of the dwelling house exemption at the time
of the gift or inheritance. Within this overall increase, the increase in gift claims was of the order of
75% while there was actually a reduction in the number of inheritance tax claims in the order of
3%. The rate of increase in relation to gifts of dwelling houses from parents to children at 74% is in
4 The other 352 ‘gift’ claims related in the main to transfers of dwelling houses between family members other
than parents to children.

7
line with the overall increase in gift claims. There continues to be a significant number of houses
passed on through inheritance rather than gifting. With the introduction of the 2016 Finance Act
changes, it is anticipated that the number of properties to be gifted will fall in future years. In
terms of the numbers involved a significant number of dwelling house exemption claims continues
to be in respect of inheritances.
It would appear that the dwelling house exemption was used by some individuals to pass on
wealth in the form of property assets free from CAT. The report estimates that the CAT loss to the
Exchequer was in the order of €31.5m over the period from 2011 to 2016. With the change in the
2016 Finance Bill this is no longer the case.

8
Appendix 1 – Development of the Dwelling House Exemption 1991 to 2007
Finance Act Developments
1991
Introduction of a relief from inheritance tax applying to the inheritance of a
dwelling house by elderly (at least 55 years of age) siblings who lived with
the deceased for at least 5 years before the inheritance and who had no
interest in another house. The relief was capped at the lesser of £50,000 or
50% of the value of the house.
1994 Increase in the amount of the relief to the lesser of £60,000 or 60% of the
value of the house.
1997 Further increase in the amount of the relief to the lesser of £80,000 or 60%
of the value of the house.
1998
Extension of the relief to include siblings under 55 years of ages, nephews,
nieces, parents and grandparents.
Further increase in the amount of the relief to the lesser of £150,000 or 80%
of the value of the house.
Increase in the period of prior cohabitation from 5 to 10 years, except for
siblings of 55 years of age for whom the period of cohabitation remained at
5 years.
2000
Removal of the cap on the relief so that the relief became an exemption.
Extension of the relief to include gifts as well as inheritances.
Extension of the relief to all recipients, regardless of whether or not they
were related to the deceased/donor.
Removal of required period of cohabitation of deceased/donor and
recipient.
Reduction in recipient’s required period of prior occupation to 3 years.
2007
Imposition of some restrictions in relation to gifts-
Requirement for donor to own the house for the 3 years prior to the gift,
and
Any periods in which the donor also occupied the house no longer counted
towards the recipient’s required 3-year period of occupation.

9
Appendix 2 – CAT group A thresholds and tax rates 2011 to 2016
Period
Group A
Threshold
Applicable
tax rate
12 October 2016
to date
€310,000 33%
14 October 2015 to
11 October 2016
€280,000 33%
6 December 2012 to
13 October 2015
€225,000 33%
7 December 2011 to
5 December 2012
€250,000 30%
8 December 2010 to
6 December 2011
€332,084 25%
10
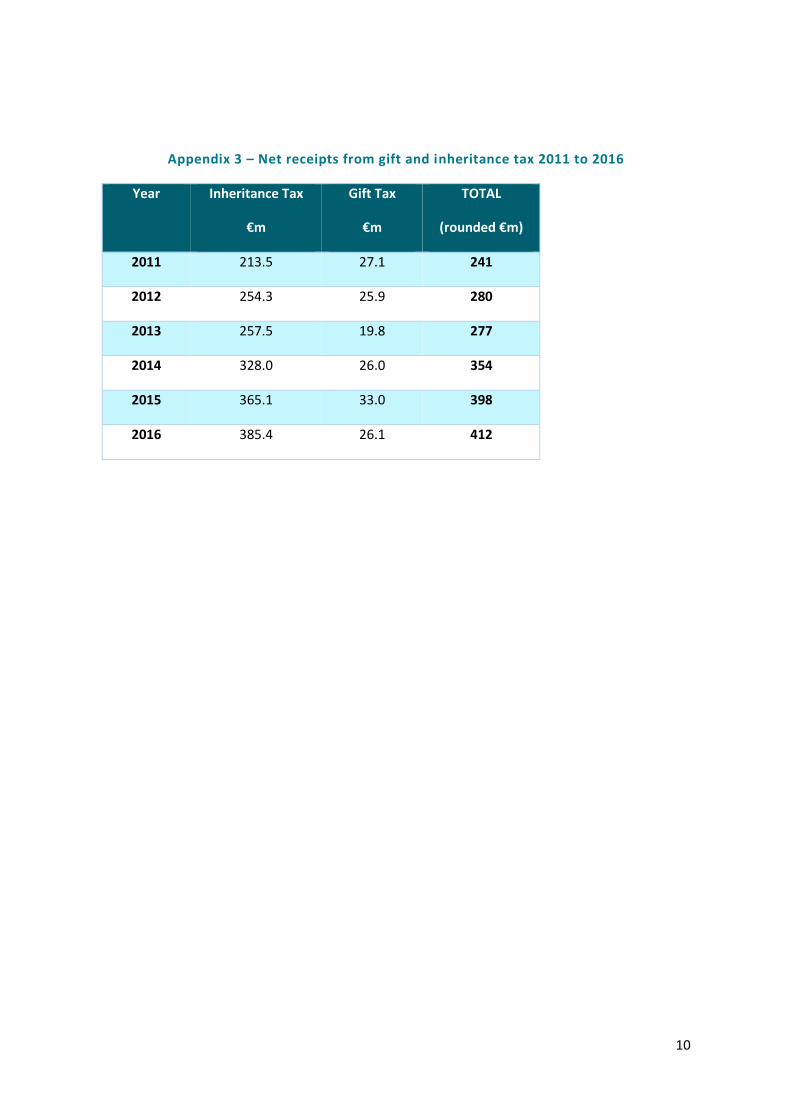
Appendix 3 – Net receipts from gift and inheritance tax 2011 to 2016
Year Inheritance Tax
€m
Gift Tax
€m
TOTAL
(rounded €m)
2011 213.5 27.1 241
2012 254.3 25.9 280
2013 257.5 19.8 277
2014 328.0 26.0 354
2015 365.1 33.0 398
2016 385.4 26.1 412
11
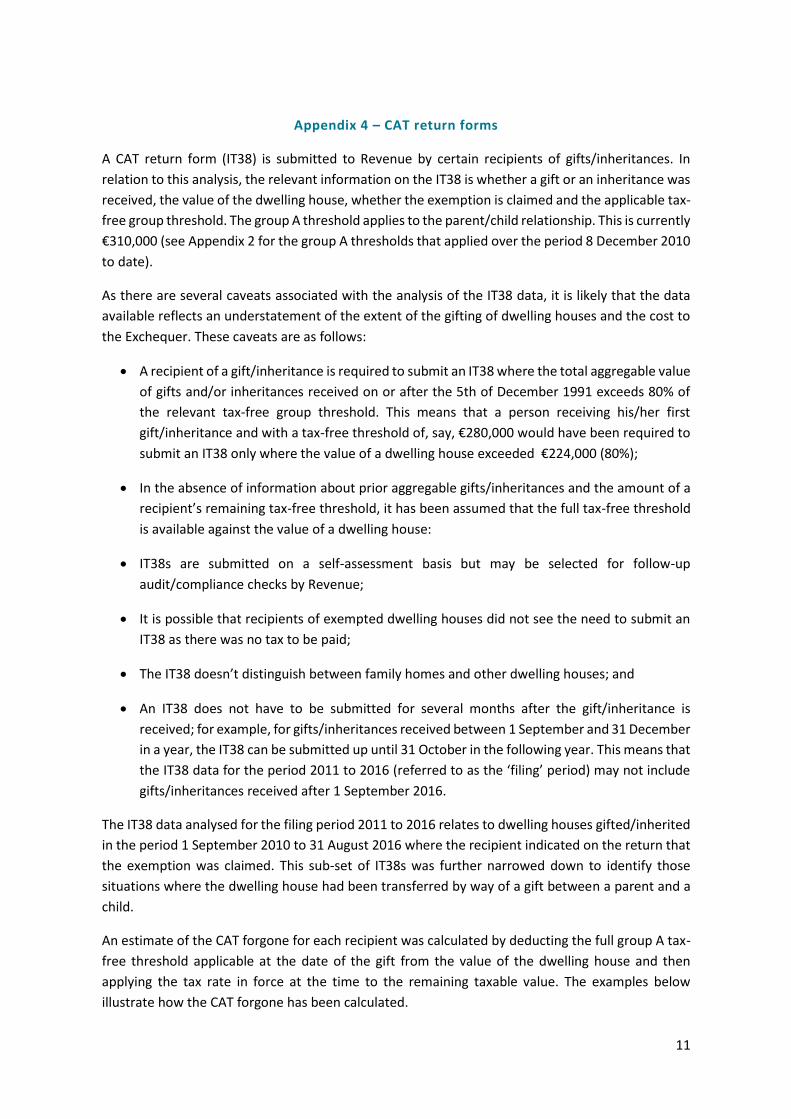
Appendix 4 – CAT return forms
A CAT return form (IT38) is submitted to Revenue by certain recipients of gifts/inheritances. In
relation to this analysis, the relevant information on the IT38 is whether a gift or an inheritance was
received, the value of the dwelling house, whether the exemption is claimed and the applicable tax-
free group threshold. The group A threshold applies to the parent/child relationship. This is currently
€310,000 (see Appendix 2 for the group A thresholds that applied over the period 8 December 2010
to date).
As there are several caveats associated with the analysis of the IT38 data, it is likely that the data
available reflects an understatement of the extent of the gifting of dwelling houses and the cost to
the Exchequer. These caveats are as follows:
A recipient of a gift/inheritance is required to submit an IT38 where the total aggregable value
of gifts and/or inheritances received on or after the 5th of December 1991 exceeds 80% of
the relevant tax-free group threshold. This means that a person receiving his/her first
gift/inheritance and with a tax-free threshold of, say, €280,000 would have been required to
submit an IT38 only where the value of a dwelling house exceeded €224,000 (80%);
In the absence of information about prior aggregable gifts/inheritances and the amount of a
recipient’s remaining tax-free threshold, it has been assumed that the full tax-free threshold
is available against the value of a dwelling house:
IT38s are submitted on a self-assessment basis but may be selected for follow-up
audit/compliance checks by Revenue;
It is possible that recipients of exempted dwelling houses did not see the need to submit an
IT38 as there was no tax to be paid;
The IT38 doesn’t distinguish between family homes and other dwelling houses; and
An IT38 does not have to be submitted for several months after the gift/inheritance is
received; for example, for gifts/inheritances received between 1 September and 31 December
in a year, the IT38 can be submitted up until 31 October in the following year. This means that
the IT38 data for the period 2011 to 2016 (referred to as the ‘filing’ period) may not include
gifts/inheritances received after 1 September 2016.
The IT38 data analysed for the filing period 2011 to 2016 relates to dwelling houses gifted/inherited
in the period 1 September 2010 to 31 August 2016 where the recipient indicated on the return that
the exemption was claimed. This sub-set of IT38s was further narrowed down to identify those
situations where the dwelling house had been transferred by way of a gift between a parent and a
child.
An estimate of the CAT forgone for each recipient was calculated by deducting the full group A tax-
free threshold applicable at the date of the gift from the value of the dwelling house and then
applying the tax rate in force at the time to the remaining taxable value. The examples below
illustrate how the CAT forgone has been calculated.

12
Example 1
Date of the gift 1 March 2013
Market value of the dwelling house €400,000
Group A tax-free threshold €225,000
Tax rate 30%
CAT forgone (400,000 – 225,000)*30% = €52,500
Example 2
Date of the gift 1 March 2016
Market value of the dwelling house €400,000
Group A tax-free threshold €280,000
Tax rate 33%
CAT forgone (400,000 – 280,000)*33% = €39,600

13
Appendix 5 – Stamp duty returns
While not directly relevant for CAT purposes, Revenue included stamp duty return form data (STR1)
in its analysis as it was considered that this form contains some potentially useful information in
relation to the dwelling house exemption that might supplement the CAT IT38 data.
An STR1 is submitted to Revenue when the ownership of a property changes; for example, where it
is sold or transferred by way of a gift. The STR1 contains information on the value of the transferred
property, the use of a sales contract, the price paid, if any (indicative of a gift rather than a sale for
full value), whether the recipient is a “lineal descendent”, such as a child, of the donor and the dates
of the donor’s acquisition of the property and its subsequent transfer.
One of the conditions for the dwelling house exemption is that the donor must have owned the
house for the three-year period preceding the gift of the house. For this reason, Revenue used STR1
data for the period 2011 to 2016 inclusive to identify those dwelling houses that were purchased
and then sold or otherwise transferred more than three years later. This data was then further
narrowed down to identify cases where the recipient was a child of the donor, where the child had
lived in the dwelling house for the required three-year period and where there was no sales contract
and/or the price paid, if any, did not represent the full value of the property.
As with the IT38 data, the cost of the tax forgone for each recipient was calculated using the full
group A tax-free threshold available and the tax rate in force at the time of the gift.
There are some caveats associated with the analysis of the STR1 data, namely:
The data was extracted from the electronic stamping system which has only been in operation
since late 2009. A minimum three-year period between the donor’s purchase of the dwelling
house and the subsequent transfer to another person was required. This left a relatively small
window for data analysis, effectively only covering those dwelling houses that were
purchased during the period 2011 to 2013. For example, a dwelling house purchased during
2011 that was subsequently transferred during 2014 to 2016 would have been identified,
whereas a dwelling house purchased in 2014 would have to have been retained by the donor
until at least 2017 and would not have been identified.
The starting data was extracted electronically which meant that any addresses that were not
exact matches would not have been identified; for example, if, at the time of purchase and
subsequent transfer, there were small differences in the addresses entered on the STR1 form
when it was being completed, possibly by different people.
STR1s are submitted on a self-assessment basis but may be selected for follow-up
audit/compliance checks by Revenue.

14
Review 2: Summary of Indecon Impact Assessment of the Help to Buy Incentive
Review: Independent impact assessment of the Help to Buy Tax Incentive
Preface
The Help to Buy initiative was introduced in Budget 2017. The scheme is designed to assist first-time
buyers with obtaining the deposit required to purchase or build their first home. With a view
towards increasing the supply of new housing, the relief is only available in respect of new build or
self-build properties.
Following the introduction of Help to Buy, and as a result of a competitive tender process, Indecon
Economic Consultants were commissioned to undertake an assessment of the scheme. The terms
of reference included an examination of whether the policy objectives on the supply of new homes
are being met, what impact (if any) the scheme is having on new and second-hand house prices, and
what impact the scheme is having on the residential property market generally.
The following is an extract from the completed report which gives an overview of its methodology,
findings, and recommendations. The full report has been published on the Budget 2018 website.
1. Introduction and Background
This study represents an evidence-based assessment of the Help to Buy (HTB) scheme. Following a competitive
tender, Indecon Research Economists were appointed by the Minister for Finance to undertake an
independent assessment of the HTB tax incentive. Given that the measure has only been in operation for
seven months, the analysis represents a preliminary assessment.
The HTB scheme was announced on 19 July 2016 as part of the “Rebuilding Ireland: Action Plan for Housing
and Homelessness.” Details of the initiative were included in Budget 2017 and legislated for in Section 9 of the
Finance Act. The HTB initiative provides a tax rebate for first-time purchasers to assist them to fund the deposit
to purchase or self-build a new house or apartment to live in as their home.
One of the policy aims of the HTB initiative is to assist first-time buyers of new homes to fund the deposit
required under the Central Bank’s macroprudential rules. The other main policy aim is to encourage the
building of additional new properties. By restricting the initiative to certain categories of new dwellings, it was
anticipated that the increase in effective demand for affordable new-build homes could encourage the
construction of an additional supply of such properties.
In line with the terms of reference for this assignment, the review examines the following issues:
- The level of take up of HTB;
- The impact on prices;
- The impact on the supply of new housing units; and
- The design of the scheme.
Indecon also examines the impact on affordability, as this is directly related to the objectives of the scheme.
15
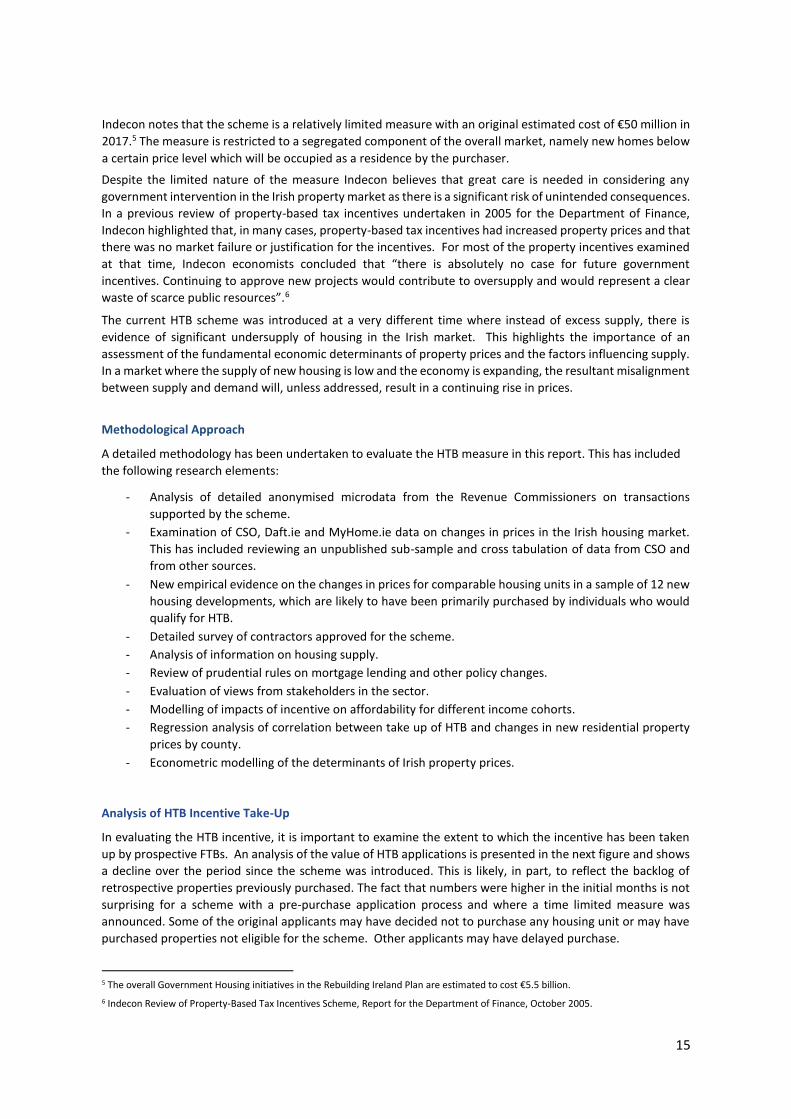
Indecon notes that the scheme is a relatively limited measure with an original estimated cost of €50 million in
2017.5 The measure is restricted to a segregated component of the overall market, namely new homes below
a certain price level which will be occupied as a residence by the purchaser.
Despite the limited nature of the measure Indecon believes that great care is needed in considering any
government intervention in the Irish property market as there is a significant risk of unintended consequences.
In a previous review of property-based tax incentives undertaken in 2005 for the Department of Finance,
Indecon highlighted that, in many cases, property-based tax incentives had increased property prices and that
there was no market failure or justification for the incentives. For most of the property incentives examined
at that time, Indecon economists concluded that “there is absolutely no case for future government
incentives. Continuing to approve new projects would contribute to oversupply and would represent a clear
waste of scarce public resources”.6
The current HTB scheme was introduced at a very different time where instead of excess supply, there is
evidence of significant undersupply of housing in the Irish market. This highlights the importance of an
assessment of the fundamental economic determinants of property prices and the factors influencing supply.
In a market where the supply of new housing is low and the economy is expanding, the resultant misalignment
between supply and demand will, unless addressed, result in a continuing rise in prices.
Methodological Approach
A detailed methodology has been undertaken to evaluate the HTB measure in this report. This has included
the following research elements:
- Analysis of detailed anonymised microdata from the Revenue Commissioners on transactions
supported by the scheme. - Examination of CSO, Daft.ie and MyHome.ie data on changes in prices in the Irish housing market.
This has included reviewing an unpublished sub-sample and cross tabulation of data from CSO and
from other sources.
- New empirical evidence on the changes in prices for comparable housing units in a sample of 12 new
housing developments, which are likely to have been primarily purchased by individuals who would
qualify for HTB.
- Detailed survey of contractors approved for the scheme. - Analysis of information on housing supply. - Review of prudential rules on mortgage lending and other policy changes.
- Evaluation of views from stakeholders in the sector. - Modelling of impacts of incentive on affordability for different income cohorts. - Regression analysis of correlation between take up of HTB and changes in new residential property
prices by county. - Econometric modelling of the determinants of Irish property prices.
Analysis of HTB Incentive Take-Up
In evaluating the HTB incentive, it is important to examine the extent to which the incentive has been taken
up by prospective FTBs. An analysis of the value of HTB applications is presented in the next figure and shows
a decline over the period since the scheme was introduced. This is likely, in part, to reflect the backlog of
retrospective properties previously purchased. The fact that numbers were higher in the initial months is not
surprising for a scheme with a pre-purchase application process and where a time limited measure was
announced. Some of the original applicants may have decided not to purchase any housing unit or may have
purchased properties not eligible for the scheme. Other applicants may have delayed purchase.
5 The overall Government Housing initiatives in the Rebuilding Ireland Plan are estimated to cost €5.5 billion.
6 Indecon Review of Property-Based Tax Incentives Scheme, Report for the Department of Finance, October 2005.

16
Value of Help to Buy Applications (Jan-Aug 2017)
Source: Revenue data provided to Indecon, August 2017
Of more significance than the applications is the number and value of claims. There have been 2,970 claims
by HTB retrospective and new applicants, but numbers have fallen in recent months. Of note is that the
online claim facility was only made available at end January, so there was a backlog in February and March.
Number of Help to Buy Claims (Jan-Aug 2017)
Jan-17 Feb-17 Mar-17 Apr-17 May-17 Jun-17 Jul-17 Aug-17
Source: Revenue data provided as at 6 September 2017.
Evidence on the overall value of claims is presented in the figure below. The data shows that the value of new
purchase claims in the first eight months amounted to €36.97 million and that there was an additional €5.68
million in claims for self-build properties. This total of €42.65 claims million includes retrospective claims on
properties purchased in 2016. Data on the property values of HTB claims shows that the majority of claims
were for properties below €375,000. However over 17% of claims were for properties in excess of this level.
11.1 10.4
10. 0
6.0 5.8
3.7
2.4
1.1
0.0
2.0
4.0
6.0
8.0
10.0
12.0
Jan-17 Feb-17 Mar-17 Apr-17 May-17 Jun-17 Jul-17 Aug-17
32
316
531
408
483 460
424
316
0
100
200
300
400
500
600

17
16.3% of claims were for less than €10,000 and 53.95% were for less than €15,000.
Value of Help to Buy Claims (Jan-Aug 2017)
Source: Revenue data as at 6 September 2017 In examining the level of take up of HTB and how this relates to overall activity in the market, it is useful to
compare this to overall mortgage approvals. Data for mortgage approvals for FTBs shows that there was a
noticeable increase in activity in terms of approvals from Q2 2016 onwards prior to the announcement of the
HTB scheme, and higher levels of approvals were evident in Q2 2017. This suggests that an increase in approval
activity was happening prior to the scheme but that this increased further in 2017. FTBs as a percentage of
total mortgage approvals was 52% in the first six months of 2017, which was slightly higher than the average
of 50% recorded in the first half of the previous three years. The total number of drawdowns for FTBs in Q1
and Q2 of 2017 for new and second hand properties amounted to a total of 7,279, and the overall number of
mortgage drawdowns in the period was just under 15,000.
Impact on Property Prices
An assessment of what impact the HTB incentive may have had on property prices in Ireland since its
introduction must consider the determinants of property price movements. Our evaluation takes into account
the economic factors driving property prices as, even without any policy changes, an expanding economy is
likely to be associated with rising prices. This view is aligned with reported comments by Professor Philip Lane,
Governor of the Central Bank of Ireland, who indicated that, “the fundamentals of the housing market were
based on employment and income growth and the prevailing interest rate, all of which were supporting strong
price increases”.7
As part of this report, Indecon developed new econometric models to examine whether any separate impacts
of the HTB on prices to date can be identified. Econometric models of property prices typically are presented
as a reduced form inverse demand function, with property prices as a function of factors such as economic
growth or changes in employment, interest rates, or demographic factors. Certain models also introduce
supply-side variables, such as housing stock and the availability of land for construction, but many focus on
the key determinants of demand.
Our modelling attempts to evaluate what prices would have been in 2017 if HTB was not introduced by
examining if there is evidence which would suggest that a statistically significant change occurred in the level
of prices in 2017 not explained by other economic factors. We model this in both a univariate and a
7 Report on comments by Philip Lane in Article by John Walsh in the Times Newspaper; July 24th, 2017
0.4
4.1
7.0
5.1
5.9 5.4
5.3
3.8
0.1 0.5
0.9 0.7 0.9 1.1
0.7 0.7
0.0
1.0
2.0
3.0
4.0
5.0
6.0
7.0
8.0
Jan-17 Feb-17 Mar-17 Apr-17 May-17 Jun-17 Jul-17 Aug-17
New Purchase Self Build
18
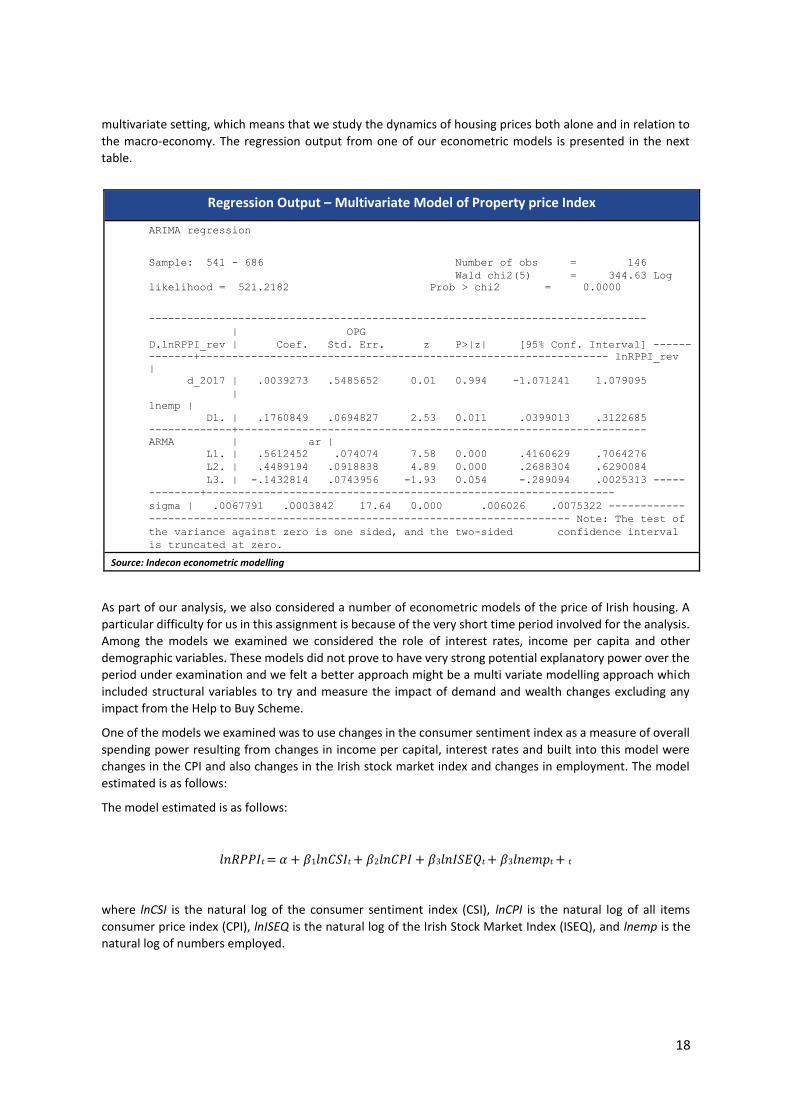
multivariate setting, which means that we study the dynamics of housing prices both alone and in relation to
the macro-economy. The regression output from one of our econometric models is presented in the next
table.
Regression Output – Multivariate Model of Property price Index
ARIMA regression Sample: 541 - 686 Number of obs = 146 Wald chi2(5) = 344.63 Log
likelihood = 521.2182 Prob > chi2 = 0.0000 ------------------------------------------------------------------------------ | OPG D.lnRPPI_rev | Coef. Std. Err. z P>|z| [95% Conf. Interval] ------
-------+---------------------------------------------------------------- lnRPPI_rev
| d_2017 | .0039273 .5485652 0.01 0.994 -1.071241 1.079095 |
lnemp | D1. | .1760849 .0694827 2.53 0.011 .0399013 .3122685
-------------+----------------------------------------------------------------
ARMA | ar | L1. | .5612452 .074074 7.58 0.000 .4160629 .7064276 L2. | .4489194 .0918838 4.89 0.000 .2688304 .6290084 L3. | -.1432814 .0743956 -1.93 0.054 -.289094 .0025313 -----
--------+----------------------------------------------------------------
sigma | .0067791 .0003842 17.64 0.000 .006026 .0075322 ------------
------------------------------------------------------------------ Note: The test of
the variance against zero is one sided, and the two-sided confidence interval
is truncated at zero. Source: Indecon econometric modelling
As part of our analysis, we also considered a number of econometric models of the price of Irish housing. A
particular difficulty for us in this assignment is because of the very short time period involved for the analysis.
Among the models we examined we considered the role of interest rates, income per capita and other
demographic variables. These models did not prove to have very strong potential explanatory power over the
period under examination and we felt a better approach might be a multi variate modelling approach which
included structural variables to try and measure the impact of demand and wealth changes excluding any
impact from the Help to Buy Scheme.
One of the models we examined was to use changes in the consumer sentiment index as a measure of overall
spending power resulting from changes in income per capital, interest rates and built into this model were
changes in the CPI and also changes in the Irish stock market index and changes in employment. The model
estimated is as follows:
The model estimated is as follows:
𝑙𝑛𝑅𝑃𝑃𝐼𝑡 = 𝛼 + 𝛽1𝑙𝑛𝐶𝑆𝐼𝑡 + 𝛽2𝑙𝑛𝐶𝑃𝐼 + 𝛽3𝑙𝑛𝐼𝑆𝐸𝑄𝑡 + 𝛽3𝑙𝑛𝑒𝑚𝑝𝑡 + 𝑡
where lnCSI is the natural log of the consumer sentiment index (CSI), lnCPI is the natural log of all items
consumer price index (CPI), lnISEQ is the natural log of the Irish Stock Market Index (ISEQ), and lnemp is the
natural log of numbers employed.
19
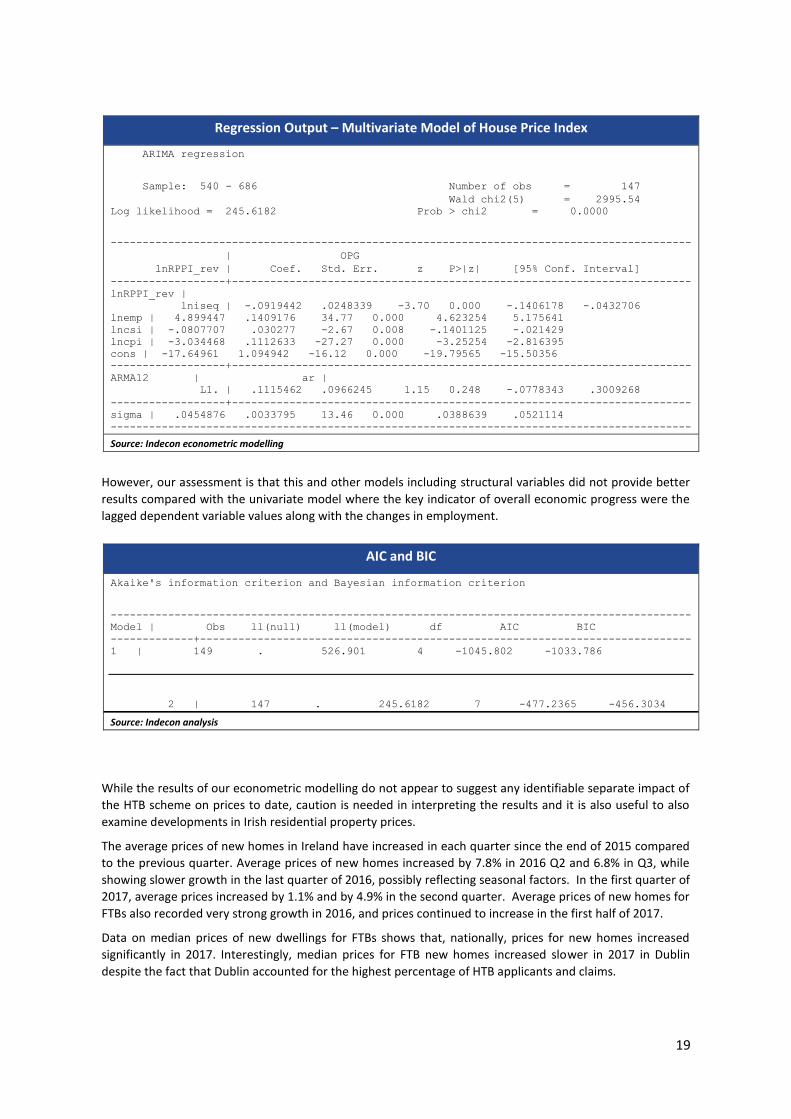
Regression Output – Multivariate Model of House Price Index
ARIMA regression Sample: 540 - 686 Number of obs = 147 Wald chi2(5) = 2995.54
Log likelihood = 245.6182 Prob > chi2 = 0.0000 ------------------------------------------------------------------------------------------- | OPG lnRPPI_rev | Coef. Std. Err. z P>|z| [95% Conf. Interval] ------------------+------------------------------------------------------------------------
lnRPPI_rev | lniseq | -.0919442 .0248339 -3.70 0.000 -.1406178 -.0432706
lnemp | 4.899447 .1409176 34.77 0.000 4.623254 5.175641
lncsi | -.0807707 .030277 -2.67 0.008 -.1401125 -.021429
lncpi | -3.034468 .1112633 -27.27 0.000 -3.25254 -2.816395
cons | -17.64961 1.094942 -16.12 0.000 -19.79565 -15.50356 ------------------+------------------------------------------------------------------------
ARMA12 | ar | L1. | .1115462 .0966245 1.15 0.248 -.0778343 .3009268 ------------------+------------------------------------------------------------------------
sigma | .0454876 .0033795 13.46 0.000 .0388639 .0521114 ------------------------------------------------------------------------------------------- Source: Indecon econometric modelling
However, our assessment is that this and other models including structural variables did not provide better
results compared with the univariate model where the key indicator of overall economic progress were the
lagged dependent variable values along with the changes in employment.
AIC and BIC
Akaike's information criterion and Bayesian information criterion -------------------------------------------------------------------------------------------
Model | Obs ll(null) ll(model) df AIC BIC -------------+-----------------------------------------------------------------------------
1 | 149 . 526.901 4 -1045.802 -1033.786
2 | 147 . 245.6182 7 -477.2365 -456.3034
Source: Indecon analysis
While the results of our econometric modelling do not appear to suggest any identifiable separate impact of
the HTB scheme on prices to date, caution is needed in interpreting the results and it is also useful to also
examine developments in Irish residential property prices.
The average prices of new homes in Ireland have increased in each quarter since the end of 2015 compared
to the previous quarter. Average prices of new homes increased by 7.8% in 2016 Q2 and 6.8% in Q3, while
showing slower growth in the last quarter of 2016, possibly reflecting seasonal factors. In the first quarter of
2017, average prices increased by 1.1% and by 4.9% in the second quarter. Average prices of new homes for
FTBs also recorded very strong growth in 2016, and prices continued to increase in the first half of 2017.
Data on median prices of new dwellings for FTBs shows that, nationally, prices for new homes increased
significantly in 2017. Interestingly, median prices for FTB new homes increased slower in 2017 in Dublin
despite the fact that Dublin accounted for the highest percentage of HTB applicants and claims.

20
In addition to reviewing CSO data, Indecon examined if there was up-to-date data on new versus second hand
average prices from Daft.ie. While the price data was not available by age, a new development variable is
included as a control in hedonic regression completed by Professor Ronan Lyons of TCD. The next chart
presents the coefficient in that variable for each of the five regions since 2015. The results do not appear to
indicate upward pressure in Dublin/Leinster in recent quarters, although, there is a different picture for some
other regions.
Regression Coefficient for New Residential Developments by Region
Source: Estimates provided to Indecon in July 2017 by Professor Ronan Lyons, Trinity College, Dublin.
There are limitations to the use of available statistics on housing prices from the point of view of reviewing
the impact of HTB, including the fact that the published data is likely to reflect transactions where the prices
were agreed some months previously. The published statistics are helpful in examining longer term trends,
but because of the lag between publication of price data on completed transactions and the date at which the
prices were agreed, there are limits on their use to measure the impact of policy changes only implemented
in January 2017.
To address this and other issues, detailed unpublished micro information was obtained from 12 different
housing sites, which accounted for over 1,200 new house sales over the period from the third quarter of 2015
until the second quarter of 2017. This data provides a very useful source of evidence on inflation in the prices
of new houses in recent months. The data from the 12 new housing sites examined suggests that the average
growth rate in prices across all sites recorded in Q1 2017 was 2.3% and in Q2 2017 was 2.9%. The weighted
average figure indicated percentage changes of 2.3% in Q1 and 0.9% in Q2.
As part of the assessment of the HTB incentive, Indecon obtained survey responses from 55 contractors
approved under the scheme. Contractors were asked to provide information on whether they had placed any
new housing units on the market which would qualify for the HTB scheme and to indicate what changes, if
any, have occurred in the price of these houses since the 1st of January 2017. The results indicate that 57% of
contractors had not increased the price of the housing units while 43% indicated that some price increases
had occurred. A smaller proportion of the larger contractors reported increases in prices.
In examining the impact of the HTB measure on housing prices, Indecon notes that in January 2017, changes
were made to the Central Bank’s macroprudential rules on mortgage lending to FTBs. Nationally, the average
loan-to-value (LTV) ratio for dwellings purchased with HTB was 86% but 21% of buyers had LTV ratios of less
than 80%. A detailed analysis of micro data undertaken by Indecon indicated that only 50% of the non-

21
retrospective purchasers paid deposits less than what was required under the previous Central Bank
prudential rules and in many cases purchasers only exceeded previous LTVs by a small amount.
The contractors surveyed were asked to indicate the significance they would attribute to various factors
influencing any price increases which occurred. More than half of respondents indicated that changes in cost
of construction was a very significant or significant factor driving price increases. The impact of revised loan
to-value mortgage rules, increased demand by FTBs, and the HTB measure were factors which were seen as
of some significance by a number of contractors, although these were judged to be of less importance than
changes in construction costs.
As part of our analysis we also examined county price data to see if there is any evidence that changes in prices
of new housing were correlated with the HTB purchasers in these local markets. If the HTB scheme had an
identifiable impact on prices, then one might expect to see prices rising faster in counties where the HTB
purchasers were a larger share of buyers in that market. The regression results can be interpreted to mean
that counties where HTB was used for a larger share of completed transactions did not have a larger increase
in price than other counties.
Indecon also examined price data on completed transactions assisted by HTB and reviewed whether the price
levels show any differences for retrospective and non-retrospective prices. The average prices on new
transactions assisted by HTB were very similar to the prices for transactions on retrospective sales prior to end
of 2016.
The evidence examined using a range of approaches does not suggest any identifiable separate impact of the
HTB scheme on prices to date. However, given the data limitations and the short period of recorded
transactions since the scheme was introduced, this finding should not be interpreted as proof that HTB had
no impact on prices. While no separate impact is evident from the modelling, we caution against assuming
that the scheme will not impact on prices in future periods, unless there is an adequate supply response.
Impact on New Build Residential Supply
Data on the total housing stock in Ireland between the 2011 and 2016 shows that while the population grew
by 3.8% over this period, housing stock grew by only 0.4%. There has however been some evidence of
improvements in the supply of housing in the Irish market in recent months, but as supply inevitably takes
time to respond, any identifiable overall impact of the HTB on supply is likely to be only seen over time. The
level of housing supply will, in Indecon’s opinion, be largely determined by the cost of construction compared
to prevailing market prices. It will also be influenced by the availability of finance for contractors and the
assessment by builders and lenders of the sustainable level of effective demand. This is consistent with
evidence from Indecon’s survey of contactors approved for the HTB scheme. Over 90% of contractors surveyed
indicated that ‘the cost of building compared to market prices’ and ‘difficulties in developers obtaining finance
to commence development’ were very significant or significant factors impacting the limited supply of new
houses. For larger companies who have the option of building offices or residential properties, the relative
returns in each sector are likely to influence resource allocation decisions.
The total number of housing completions has been rising steadily on an annual basis but the number of
housing completions remains significantly below the number required to meet population growth and
demand for housing.8 The importance of supply is recognised not only by economists but also by the
construction sector. The Construction Industry Federation indicated to Indecon that “there is no disagreement
that the level of building activity falls well short of the sustainable demand for new homes.”
As there are issues with completion data, we also examined the trends in new house registrations. An analysis
of housing completion and registration in Ireland is presented in the next figure. The data on the most recent
house registrations in Ireland show that in the first five months of 2017 there were 3,786 new registrations.
This compares with 2,257 in the comparable period in 2016.
8 ESRI, Quarterly Economic Commentary, Spring 2017
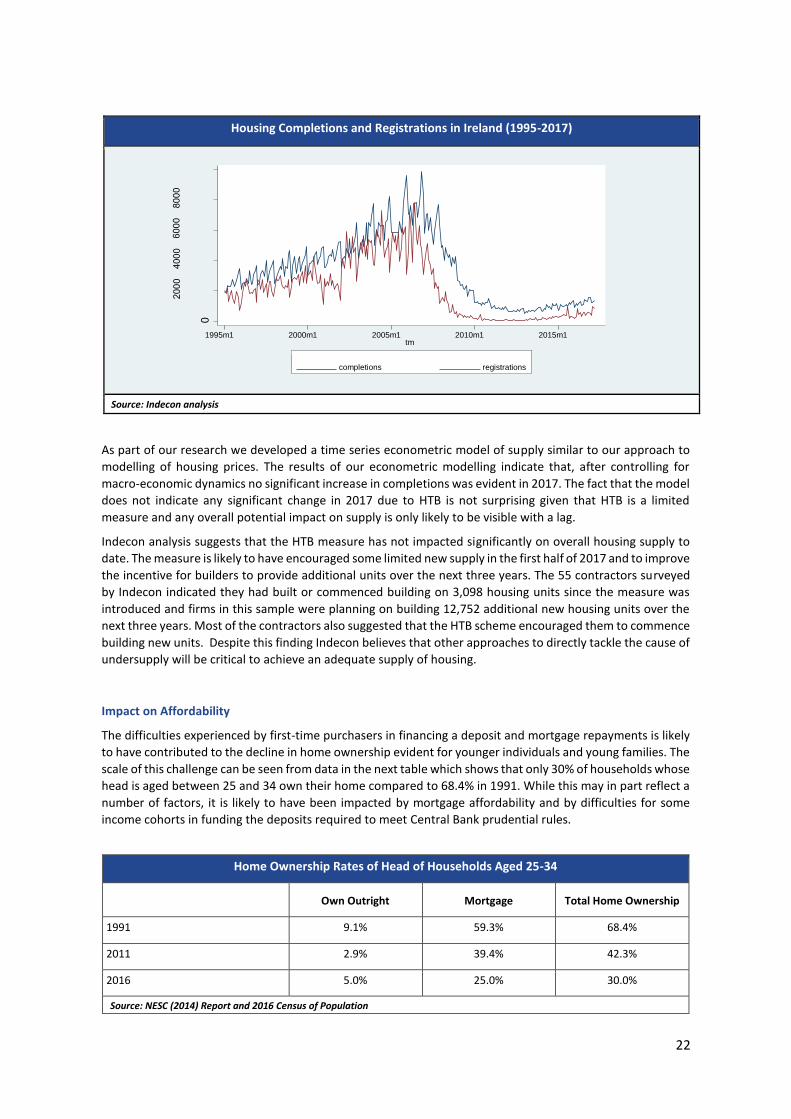
22
Housing Completions and Registrations in Ireland (1995-2017)
completions registrations
Source: Indecon analysis
As part of our research we developed a time series econometric model of supply similar to our approach to
modelling of housing prices. The results of our econometric modelling indicate that, after controlling for
macro-economic dynamics no significant increase in completions was evident in 2017. The fact that the model
does not indicate any significant change in 2017 due to HTB is not surprising given that HTB is a limited
measure and any overall potential impact on supply is only likely to be visible with a lag.
Indecon analysis suggests that the HTB measure has not impacted significantly on overall housing supply to
date. The measure is likely to have encouraged some limited new supply in the first half of 2017 and to improve
the incentive for builders to provide additional units over the next three years. The 55 contractors surveyed
by Indecon indicated they had built or commenced building on 3,098 housing units since the measure was
introduced and firms in this sample were planning on building 12,752 additional new housing units over the
next three years. Most of the contractors also suggested that the HTB scheme encouraged them to commence
building new units. Despite this finding Indecon believes that other approaches to directly tackle the cause of
undersupply will be critical to achieve an adequate supply of housing.
Impact on Affordability
The difficulties experienced by first-time purchasers in financing a deposit and mortgage repayments is likely
to have contributed to the decline in home ownership evident for younger individuals and young families. The
scale of this challenge can be seen from data in the next table which shows that only 30% of households whose
head is aged between 25 and 34 own their home compared to 68.4% in 1991. While this may in part reflect a
number of factors, it is likely to have been impacted by mortgage affordability and by difficulties for some
income cohorts in funding the deposits required to meet Central Bank prudential rules.
Home Ownership Rates of Head of Households Aged 25-34
Own Outright Mortgage Total Home Ownership
1991 9.1% 59.3% 68.4%
2011 2.9% 39.4% 42.3%
2016 5.0% 25.0% 30.0%
Source: NESC (2014) Report and 2016 Census of Population
1995m1 2000m1 2005m1 2010m1 2015m1 tm
23
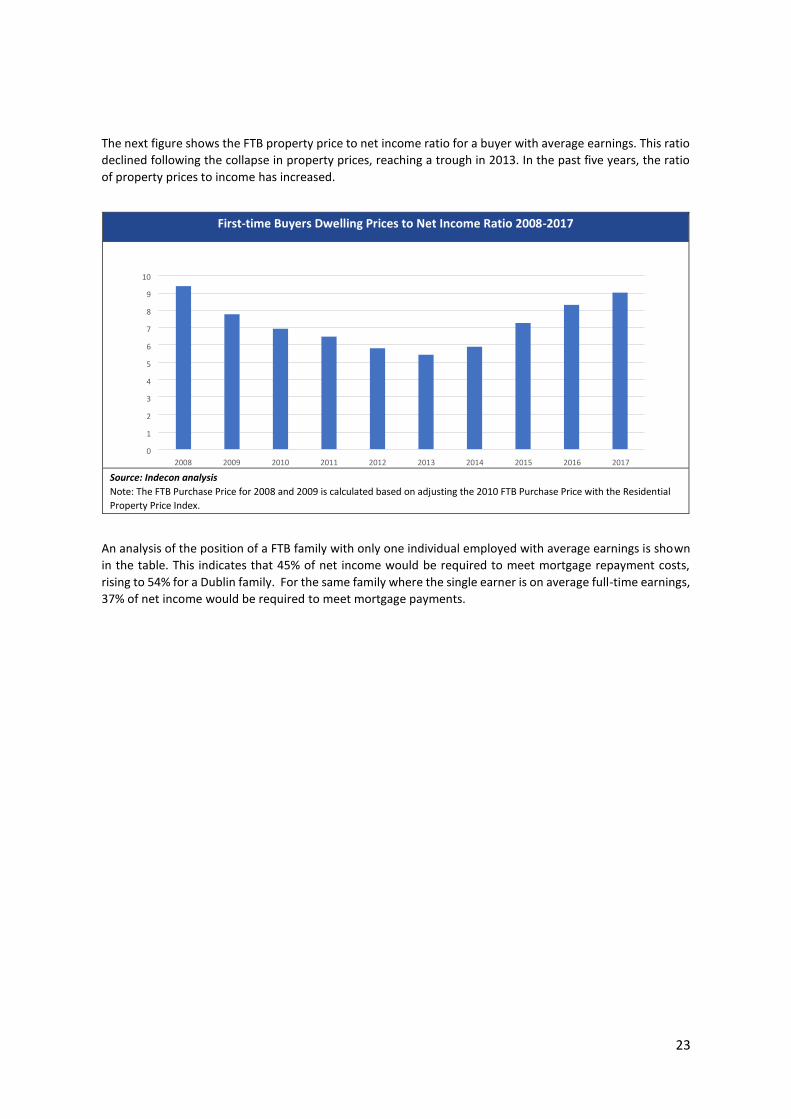
The next figure shows the FTB property price to net income ratio for a buyer with average earnings. This ratio
declined following the collapse in property prices, reaching a trough in 2013. In the past five years, the ratio
of property prices to income has increased.
First-time Buyers Dwelling Prices to Net Income Ratio 2008-2017
Source: Indecon analysis Note: The FTB Purchase Price for 2008 and 2009 is calculated based on adjusting the 2010 FTB Purchase Price with the Residential
Property Price Index.
An analysis of the position of a FTB family with only one individual employed with average earnings is shown
in the table. This indicates that 45% of net income would be required to meet mortgage repayment costs,
rising to 54% for a Dublin family. For the same family where the single earner is on average full-time earnings,
37% of net income would be required to meet mortgage payments.
2008 2009 2010 2011 2012 2013 2014 2015 2016 2017 0 1 2 3 4 5 6 7 8 9
10

24
Income and Mortgage Repayments - One-Earner First-time Buyers Married Couple at 100% of
Average Earnings
2008 2009 2010 2011 2012 2013 2014 2015 2016 2017
National (Average Earnings) Gross
Income €36,866 €36,834 €36,481 €36,056 €36,199 €36,205 €36,269 €36,491 €36,736 €37,736
Net Income €34,817 €33,829 €33,051 €32,372 €32,154 €31,890 €31,861 €32,141 €32,770 €33,662
% of Net Income 57% 39% 34% 33% 30% 28% 30% 37% 42% 45%
National (Full-time Average Earnings) Gross
Income €44,160 €44,346 €44,274 €44,062 €44,523 €44,699 €44,836 €45,075 €45,611 €46,852
Net Income €41,284 €39,781 €39,072 €38,185 €38,481 €38,346 €38,372 €38,858 €39,575 €40,652
% of Net Income 48% 33% 29% 28% 25% 23% 25% 31% 35% 37%
Dublin (Average Earnings) Gross
Income €41,132 €41,097 €40,703 €40,229 €40,435 €40,449 €40,468 €40,716 €40,989 €42,105
Net Income €38,599 €37,206 €36,313 €35,402 €35,374 €35,116 €35,053 €35,447 €36,031 €37,012
% of Net Income 67% 42% 36% 37% 32% 34% 40% 50% 52% 54%
Source: Indecon The next table shows the position for a FTB on 200% of average earnings or a couple both working and
earning average incomes. In this case gross income would be approximately €75,000 and one-quarter of
net income would be required to cover mortgage repayments. This percentage has increased in the past
four years. As before, for a Dublin family, the figure is higher due to the higher prices of new housing in
Dublin despite assumed higher average gross incomes. In this case mortgage payments are estimated to
amount to 30% of income for these households, up from 17% in 2012.
Income and Mortgage Repayments - Two-Earner First-time Buyers Married Couple Each
Earning Average Earnings
2008 2009 2010 2011 2012 2013 2014 2015 2016 2017
National (Average Earnings) Gross
Income €73,731 €73,669 €72,963 €72,112 €72,397 €72,410 €72,538 €72,982 €73,473 €75,472
Net Income €64,171 €62,613 €61,380 €59,227 €59,024 €58,486 €58,484 €59,087 €60,053 €61,687
% of Net Income 31% 21% 19% 18% 16% 15% 17% 20% 23% 25%
National (Full-time Average Earnings) Gross
Income €88,320 €88,692 €88,548 €88,124 €89,046 €89,398 €89,672 €90,150 €91,222 €93,704
Net Income €75,258 €73,782 €72,914 €70,275 €70,512 €70,208 €70,306 €70,932 €72,567 €74,541
% of Net Income 27% 18% 16% 15% 14% 13% 14% 17% 19% 20%
Dublin (Average Earnings) Gross
Income €82,264 €82,194 €81,407 €80,457 €80,870 €80,897 €80,936 €81,432 €81,979 €84,209
Net Income €70,656 €68,951 €67,629 €64,985 €64,870 €64,342 €64,279 €64,917 €66,050 €67,847
% of Net Income 37% 23% 19% 20% 17% 19% 22% 28% 29% 30%
Source: Indecon
25
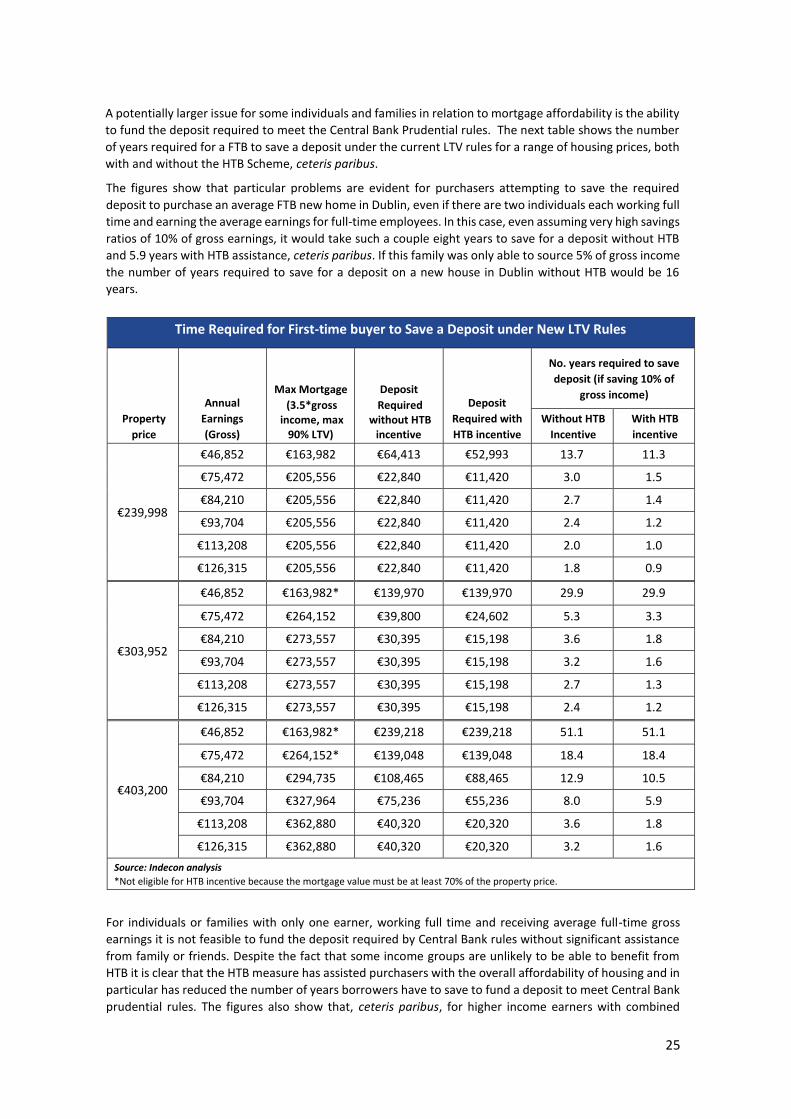
A potentially larger issue for some individuals and families in relation to mortgage affordability is the ability
to fund the deposit required to meet the Central Bank Prudential rules. The next table shows the number
of years required for a FTB to save a deposit under the current LTV rules for a range of housing prices, both
with and without the HTB Scheme, ceteris paribus.
The figures show that particular problems are evident for purchasers attempting to save the required
deposit to purchase an average FTB new home in Dublin, even if there are two individuals each working full
time and earning the average earnings for full-time employees. In this case, even assuming very high savings
ratios of 10% of gross earnings, it would take such a couple eight years to save for a deposit without HTB
and 5.9 years with HTB assistance, ceteris paribus. If this family was only able to source 5% of gross income
the number of years required to save for a deposit on a new house in Dublin without HTB would be 16
years.
Time Required for First-time buyer to Save a Deposit under New LTV Rules
Property
price
Annual Earnings (Gross)
Max Mortgage (3.5*gross
income, max 90% LTV)
Deposit Required
without HTB incentive
Deposit Required with HTB incentive
No. years required to save
deposit (if saving 10% of
gross income)
Without HTB
Incentive With HTB
incentive
€239,998
€46,852 €163,982 €64,413 €52,993 13.7 11.3
€75,472 €205,556 €22,840 €11,420 3.0 1.5
€84,210 €205,556 €22,840 €11,420 2.7 1.4
€93,704 €205,556 €22,840 €11,420 2.4 1.2
€113,208 €205,556 €22,840 €11,420 2.0 1.0
€126,315 €205,556 €22,840 €11,420 1.8 0.9
€303,952
€46,852 €163,982* €139,970 €139,970 29.9 29.9
€75,472 €264,152 €39,800 €24,602 5.3 3.3
€84,210 €273,557 €30,395 €15,198 3.6 1.8
€93,704 €273,557 €30,395 €15,198 3.2 1.6
€113,208 €273,557 €30,395 €15,198 2.7 1.3
€126,315 €273,557 €30,395 €15,198 2.4 1.2
€403,200
€46,852 €163,982* €239,218 €239,218 51.1 51.1
€75,472 €264,152* €139,048 €139,048 18.4 18.4
€84,210 €294,735 €108,465 €88,465 12.9 10.5
€93,704 €327,964 €75,236 €55,236 8.0 5.9
€113,208 €362,880 €40,320 €20,320 3.6 1.8
€126,315 €362,880 €40,320 €20,320 3.2 1.6
Source: Indecon analysis *Not eligible for HTB incentive because the mortgage value must be at least 70% of the property price.
For individuals or families with only one earner, working full time and receiving average full-time gross
earnings it is not feasible to fund the deposit required by Central Bank rules without significant assistance
from family or friends. Despite the fact that some income groups are unlikely to be able to benefit from
HTB it is clear that the HTB measure has assisted purchasers with the overall affordability of housing and in
particular has reduced the number of years borrowers have to save to fund a deposit to meet Central Bank
prudential rules. The figures also show that, ceteris paribus, for higher income earners with combined
26
incomes of €126,315 even without the HTB they would have been in a position to save the required deposit
in 3.2 years if they were able to save 10% of gross earnings.
Design of the Incentive
The HTB incentive was announced as part of the 2016 “Rebuilding Ireland – Action Plan for Housing and
Homelessness” of the Department of Housing, Planning, Community and Local Government and was seen
as a complement to the structural actions set out in the Plan. The incentive is limited to a three-and-a-half-
year period (July 2016 – December 2019).
The HTB incentive was envisaged as a scheme to improve the availability of adequate affordable mortgage
finance for FTBs as new housing output comes on-stream. The HTB scheme as designed provides a refund
of income tax and Deposit Interest Retention Tax (DIRT) paid in Ireland over the previous four years.
The design of the scheme implies that a mortgage on the property must be taken out with a qualifying
lender and must be at least 70% of the purchase value of the property. This is an appropriate design feature
to minimise the level of deadweight but the interaction of this with the Central Bank 3.5 LTV rules means
that it may have an unintended impact on low earners wishing to avail of the scheme. In practice, these
potential purchasers may even without this restriction have difficulty in obtaining finance. The scheme has
been designed to also restrict the amount that can be claimed under the HTB incentive to the lesser of:
€20,000 or 5% of the purchase price of a new home and must not be greater than the amount of income
tax and Deposit Interest Retention Tax (DIRT) paid in the four years before the purchase or self-build.
Given these design features Indecon has examined the scheme against the criteria set in Government
guidelines on evaluating tax incentives. The four key questions are as follows: Is the tax expenditure still
relevant? How much did the tax expenditure cost? What was the impact of the tax expenditure? Was it
efficient?
With regard to relevance of the measure, due to the relatively short duration since the HTB schemes
inception, it is not surprising that the objectives of the scheme are still relevant. The difficulties with
affordability and the limited level of new supply in the Irish housing market are still major issues.
With respect to the cost of the tax expenditure, the cost of the HTB scheme is within projected levels;
however, a good proportion of 2017 still remains. In addition, we understand that the Revenue
Commissioners are preparing new projections on costs, and we recommend costs are reassessed following
this forthcoming review.
The impact of the HTB scheme on prices and supply is difficult to measure due to the short period since its
inception. The evidence examined does not suggest any identifiable separate impact of the HTB scheme
on prices to date. Similarly, the analysis suggests that the HTB measure has not impacted significantly on
overall supply to date but is likely to improve the incentive for builders to provide additional units over the
next three years. The impact of the measure on affordability is evident and the scheme significantly reduces
the time required to save for a deposit. However, this could be eroded if price pass-through from the HTB
scheme becomes evident.
Our review suggests that the HTB measure has been implemented in an efficient manner and targets
support for FTBs to help them fund the deposit on a house. By restricting the measure to owner occupiers
and capping the level of support to the lesser of a number of criteria it has been efficient in minimising the
Exchequer costs. However, by providing assistance on properties above average values and by not linking
the measure to incomes, the scheme is likely to have been subject to deadweight.

27
Conclusions
A summary of our conclusions is presented in the table below. These are designed to improve the
probability that the objectives set for the HTB in terms of affordability and increased housing supply will be
met while reducing the risks that the measure will contribute to inflationary pressures. Our analysis also
suggests that structural measures are required which directly address the supply problem.
Summary of Key Conclusions
1. The Help to Buy (HTB) scheme is primarily but not exclusively a demand led measure and there is legitimate concern that, in a period of inadequate supply, the measure could result in increased inflationary pressures on property prices therefore reducing any benefit in terms of mortgage affordability.
2. This preliminary empirical analysis completed by Indecon suggests that to date there is no evident impact on overall prices of new homes for first-time buyers (FTBs) as a result of the measure. This is likely to be because of the limited level of take up to date and the fact that the incentive was confined to a segregated segment of the market. It will be vital to monitor the price of HTB new builds over the coming months. This is particularly the case given the revisions by the CSO to the Residential Property Price Index (RPPI) index announced in August. This means that the index now captures both off the plans purchases and some transactions previously excluded from the index. This change could have a non-trivial impact on emerging prices over the coming months.
3. There is potential that if the level of take up HTB accelerates that inflationary pressures would result if there is not an adequate supply response. This highlights the priority which should be given to expanding supply.
4. The HTB measure does not appear to have had any significant overall impact to date on the level of supply. While this was an objective of the scheme, it is not surprising that any impact on supply to date is muted given the time lag required to construct new houses. By increasing effective demand for new homes in certain price categories, the scheme is likely to have encouraged some limited new supply in the first half of 2017 and has increased confidence in the sector. Contractors have indicated plans to expand the supply of new houses over the next three years. The monitoring of these plans is critical to an evaluation of whether the measure contributes to inflationary pressures in the housing market. An abolishment of the scheme would at this time create uncertainty and damage confidence and would likely impact on the levels of new builds.
5. Since the HTB measure was introduced, changes in Central Bank prudential rules have made it easier for some categories of FTBs to fund deposits. The need for the HTB incentive may be reduced for some purchasers as a result of this change.
6. The HTB measure has enhanced affordability for FTB and has reduced the number of years required for purchasers to save the deposit for new houses. There is however likely to be some purchasers who did not need the incentive suggesting an element of deadweight and particular affordability issues remain for those on lower incomes. Furthermore, the enhanced affordability may erode if price pass-through from the incentive becomes evident.
7. The design of the scheme has a number of desirable characteristics, including the time limited nature of the incentive, the restriction to a segment of the market and the introduction of an application process which means that the costs and profile of purchasers is obtained. The restriction of the measure to owner occupiers is also a welcome development in minimising any distortionary impacts.
8. A cost-benefit evaluation of the scheme was not undertaken prior to its introduction. While there were understandable reasons for this, Indecon are concerned that this should not be seen as a precedent for other measures.
9. The cap of €20,000 and the restriction to house purchases below €500,000 have improved equity compared to the position without these elements. However, there is no correlation with individuals’ incomes, and there is likely to be deadweight in the scheme for some recipients of the incentive.
10. Targeting the incentive to provide greater support to assist individuals or couples with average incomes to fund deposits may be appropriate.
11. The key challenge for the housing market is to reduce the costs of housing, including both house prices and the cost of construction.
12. A comprehensive cost-benefit analysis of the scheme should be undertaken after a period, as given the
limited time since the measure was introduced, this report inevitably can only represent a preliminary
assessment.

28
3. Tables of Tax Expenditures having effect between October 2016 and September 20179
Table 1: Capital Gains Tax (CGT)/Capital Acquisitions Tax (CAT)/Pensions
Type Description Further Information
No. Utilising or No. of Claims in most recent year for which information is available
Revenue Foregone in most recent year for which information is available (€ millions)
No. Utilising / No. of Claims in previous year*
Revenue Foregone in previous year (€ millions)*
CGT CGT Retirement Relief
Provides relief for disposals of business and farming assets.
1,229 (in 2015)
Tax cost is not available as the only information in respect of this relief is the disposal consideration rather than the actual taxable gain foregone.
1,318 (in 2014, update on figure in 2016 report)
Tax cost is not available as the only information in respect of this relief is the disposal consideration rather than the actual taxable gain foregone.
CGT entrepreneur relief
Provides relief for disposals of business assets.
This is a new relief (2014) and data will not be available for a few years.
N/A N/A N/A
Revised CGT entrepreneur relief
Provides relief for disposals of business assets.
This is a new relief (2016) and data will not be available for a few years.
N/A N/A N/A
CGT principal private residence relief
Provides relief for disposal of main residence.
N/A N/A N/A N/A
9 All references to N/A in these 7 tables means “Not Available” unless otherwise indicated

29
CGT Farm consolidation relief
Provides relief for disposals of land in order to consolidate farm holdings.
Not separately identified on tax return
Not separately identified on tax return
Not separately identified on tax return
Not separately identified on tax return
CGT relief for venture fund managers
Provides relief in respect of carried interest earned by venture fund managers.
Not separately identified on tax return
Not separately identified on tax return
Not separately identified on tax return
Not separately identified on tax return
CGT exemption on disposal of site to a child
Provides relief for parents transferring a site to their children in order to build a house.
71 (in 2015) Tax cost is not available as the only information in respect of this relief is the disposal consideration rather than the actual taxable gain foregone.
81 (in 2014, update on figure in 2016 report)
Tax cost is not available as the only information in respect of this relief is the disposal consideration rather than the actual taxable gain foregone.
CGT relief on works of art loaned for public display
Provides relief for disposals of works of art loaned for public display.
Not separately identified on tax return
Not separately identified on tax return
Not separately identified on tax return
Not separately identified on tax return
CAT CAT business relief
Relief for transfers of businesses (90% reduction in market value for tax purposes)
483 85.1 461 87
CAT agricultural relief
Relief for transfer of farms (90% reduction in market value for tax purposes)
1,263 114.6 2,024 215

30
CAT exemption of heritage property
Exemption from tax for transfers of heritage houses and objects
Indicative information suggests the number using this exemption is negligible
Exact figures are not available, but thought to not be significant
Indicative information suggests the number using this exemption is negligible
Exact figures are not available, but thought to not be significant
Pensions
Employees’ contribution to approved superannuation schemes
Contributions are allowable as an expense in computing Schedule E income (Sections 774 & 776)
N/A N/A 602,100** (in 2014)
549** (in 2014)
Employers’ contributions to approved superannuation schemes
Contributions are allowable as an expense in computing Schedule D Case I or Case II income (Section 774)
N/A N/A 314,000** (in 2014)
140** (in 2014)
Exemption of investment income and gains of approved superannuation funds
Exempts the investment income of a fund held/maintained for the purpose of a scheme (Section 774 – Approved Fund, Section 785 – RSA, Section 787I – PRSA)
N/A 926
Tax Relief on “tax free” lump sums
From 1 January 2011, the lifetime tax-free limit on the aggregate of all retirement lump sums paid to an
N/A N/A N/A 134** (in 2014)

31
individual on or after 7 December 2005 is €200,000 (Section 790AA)
Retirement annuity premium
Combined with PRSA with effect from 2013 – see Personal Pensions Contribution entry following (Section 787)
N/A N/A N/A N/A
Personal retirement savings accounts
Combined with RAC with effect from 2013 - see Personal Pensions Contribution entry following (Section 787C/E)
N/A N/A N/A N/A
Pension Contribution
Figures in this field are a total for RAC’s and PRSA’s which are not available individually
N/A N/A 93,700** (in 2014)
210** (in 2014)
Exemption of employers’ contributions from employee BIK
Sums paid by an employer into an approved, statutory or foreign government employee retirement scheme are not chargeable to tax in the hands of
N/A N/A 314,000** (in 2014)
520** (in 2014)

32
the employee (Section 778)
* All figures for 2016 (most recent year) & 2015 (previous year) unless stated otherwise
** Figures for later years not yet available

33
Table 2: Stamp Duty/Deposit interest Retention Tax (DIRT)/Local Property Tax (LPT)
Type Description Further Information
No. Utilising or No. of Claims in most recent year for which information is available
Revenue Foregone in most recent year for which information is available (€ millions)
No. Utilising/No. of Claims in previous year*
Revenue Foregone in previous year (€ millions)*
Stamp Duty Consanguinity relief
1,406 2.9 3,064 6.8
Young Trained Farmer Relief
Section 81AA
735 4.6 989 5.2
Certain company reconstructions and amalgamations
Section 80 752 198 784 68.4
Charities – conveyance/transfer/lease of land
Section 82 1,159 4.6 837 2.9
Donations to approved bodies
Section 82A <10 N/A <10 N/A
Approved Sports Bodies - conveyance/transfer/lease of land
Section 82B 62 0.5 62 0.5
Pension schemes and charities
Section 82C 18 1.2 35 1.1
Certain family farm transfers
Section 83B 18 0.2 25 0.1
Certain loan capital and securities
Section 85 <10 0.5 <10 N/A
Stock borrowing
Section 87 N/A N/A N/A N/A
Stock repo Section 87A N/A N/A N/A N/A

34
Merger of companies
Section 87B N/A N/A <10 N/A
Certain stocks and marketable securities
Section 88 7 2.0 <10 N/A
Reorganisation of undertakings for collective investment
Section 88A 2 N/A N/A N/A
Funds: reorganisation
Section 88B N/A N/A N/A N/A
Reconstructions or amalgamations of certain common contractual funds
Section 88C N/A N/A N/A N/A
Reconstructions or amalgamations of certain investment undertakings
Section 88D <10 N/A <10 N/A
Transfer of assets within unit trusts
Section 88E <10 N/A <10 N/A
Reconstruction or amalgamation of offshore funds
Section 88F N/A N/A N/A N/A
Amalgamation of unit trusts
Section 88G N/A N/A N/A N/A
Foreign Government Securities
Section 89 N/A N/A N/A N/A
Certain financial services instruments
Section 90 N/A N/A N/A N/A

35
Greenhouse gas emissions allowance
Section 90A N/A N/A N/A N/A
Houses acquired from industrial and provident societies
Section 93 N/A N/A N/A N/A
Approved voluntary body
Section 93A 105 0.2 110 0.2
Purchased of land from Land Commission
Section 94 N/A N/A N/A N/A
Commercial woodland – duty not chargeable on the value of the trees growing on the land
Section 95 124 34 102 48.8
Transfers between spouses/civil partners
Section 96 3,850 11.6 3,731 10.5
Foreign immovable property
Section 98 N/A N/A <10 N/A
Dublin Docklands Development Authority
Section 99 N/A N/A <10 N/A
Courts Service
Section 99A <10 N/A <10 N/A
Sport Ireland. This exemption was provided for in the Sport Ireland Act 2015. Sport Ireland has yet to be established.
Section 99B <10 N/A N/A N/A

36
Temple Bar Properties Limited
Section 100 <10 N/A <10 N/A
Intellectual Property
Section 101 N/A N/A <10 N/A
Single Farm Payment entitlement
Section 101A
N/A N/A <10 N/A
The Alfred Beit Foundation
Section 102 <10 N/A <10 N/A
Shared ownership leases
Section 103 13 N/A <10 N/A
Licences and leases granted under Petroleum and Other Mineral Development Act, 1960, etc.
Section 104 N/A
N/A <10 N/A
Securitisation agreements
Section 105 N/A N/A N/A N/A
Housing Finance Agency
Section 106 N/A N/A N/A N/A
Housing Finance Agency Limited
Section 106A
N/A N/A N/A N/A
Housing Authorities and Affordable Homes Partnership
Section 106B
1,212 3.1 754 1
Grangegorman Development Agency
Section 106C
N/A N/A N/A N/A
National Development Finance Agency, etc. (expired 27.01.15)
Section 108A
<10 N/A 69 0.2
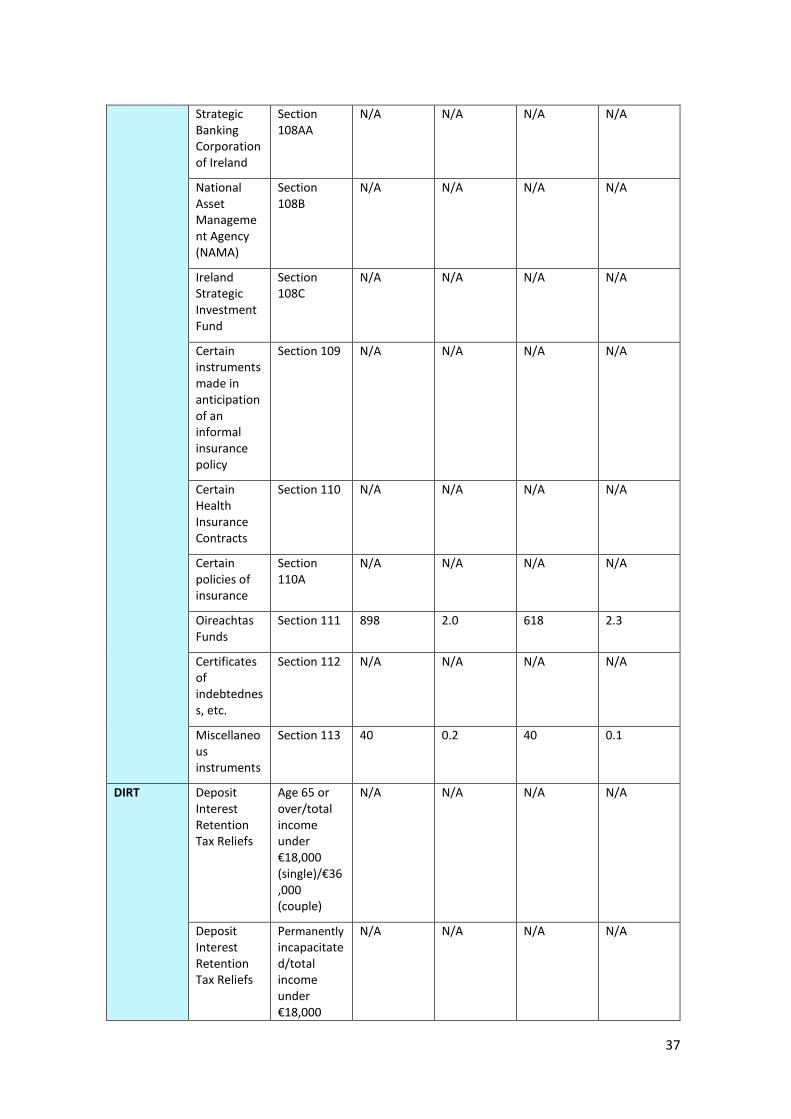
37
Strategic Banking Corporation of Ireland
Section 108AA
N/A N/A N/A N/A
National Asset Management Agency (NAMA)
Section 108B
N/A N/A N/A N/A
Ireland Strategic Investment Fund
Section 108C
N/A N/A N/A N/A
Certain instruments made in anticipation of an informal insurance policy
Section 109 N/A N/A N/A N/A
Certain Health Insurance Contracts
Section 110 N/A N/A N/A N/A
Certain policies of insurance
Section 110A
N/A N/A N/A N/A
Oireachtas Funds
Section 111 898 2.0 618 2.3
Certificates of indebtedness, etc.
Section 112 N/A N/A N/A N/A
Miscellaneous instruments
Section 113 40 0.2 40 0.1
DIRT Deposit Interest Retention Tax Reliefs
Age 65 or over/total income under €18,000 (single)/€36,000 (couple)
N/A N/A N/A N/A
Deposit Interest Retention Tax Reliefs
Permanently
incapacitated/total income under €18,000
N/A N/A N/A N/A

38
(single)/€36,000 (couple)
LPT Exemptions 49,623 13 46,800 13
Deferrals LPT Deferrals, although foregone in a particular year, are still owed to the Exchequer at a later date
61,200 14 47,200 8
* All figures for 2016 (most recent year) & 2015 (previous year) unless stated otherwise
Table 3: Benefit-in-Kind
Type Description Further Information
No. Utilising or No. of Claims in most recent year for which information is available
Revenue Foregone in most recent year for which information is available (€ millions)
No. Utilising/No. of Claims in previous year*
Revenue Foregone in previous year (€ millions)*
Benefit-in-Kind
Cycle to Work Scheme
Tax relief on the purchase of a bicycle for commuting purposes
20,000** 4.0** 20,000** 4.0**
TaxSaver Travel Scheme
Tax relief on commuter tickets
35,000** 3.5** 35,000** 3.5**
Professional subscriptions relief
Tax relief on the payment of certain professional subscriptions.
150,000** 3.75** 150,000** 3.75**
Small Benefits Exemption
Tax relief where employer provides an employee/director with one annual
70,000** 5.0** Not applicable (Only introduced on a statutory basis from
Not applicable (Only introduced on a statutory basis from

39
benefit, he value not exceeding €500
Budget Day 2015)
Budget Day 2015)
* All figures for 2016 (most recent year) & 2015 (previous year) unless stated otherwise
** Estimates, as separate returns are not required under these headings.
Table 4: Corporation Tax
Type Description Further Information
No. Utilising or No. of Claims in most recent year for which information is available
Revenue Foregone in most recent year for which information is available (€ millions)
No. Utilising/No. of Claims in previous year*
Revenue Foregone in previous year (€ millions)*
Corporation Tax
Research & Development (R&D) Tax Credit
Provides a tax credit for expenditure on certain R&D activities (Sections 766, 766A & 766B of the Taxes Consolidation Act)
1,535** 707.9** 1,570 553.3
Corporation Tax Relief for start-up Relief companies
Provides relief from corporation tax for start-up companies for the first 3 years of trading up to €40,000 per annum (Section 468C of the Taxes Consolidation Act)
1,001** 6.3** 977 4.7
Film Relief Note- this has previously been listed under “Personal Tax Credits”
1,102** 69.7** 4,140 118.6
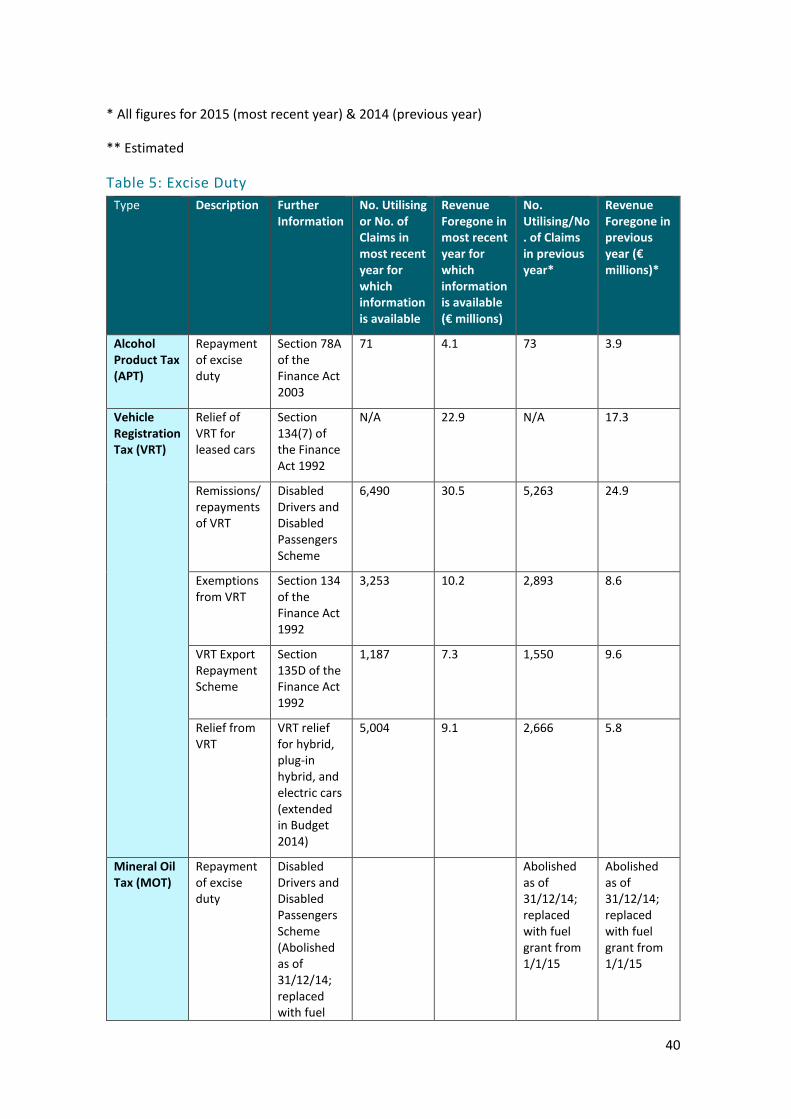
40
* All figures for 2015 (most recent year) & 2014 (previous year)
** Estimated
Table 5: Excise Duty
Type Description Further Information
No. Utilising or No. of Claims in most recent year for which information is available
Revenue Foregone in most recent year for which information is available (€ millions)
No. Utilising/No. of Claims in previous year*
Revenue Foregone in previous year (€ millions)*
Alcohol Product Tax (APT)
Repayment of excise duty
Section 78A of the Finance Act 2003
71 4.1 73 3.9
Vehicle Registration Tax (VRT)
Relief of VRT for leased cars
Section 134(7) of the Finance Act 1992
N/A 22.9 N/A 17.3
Remissions/repayments of VRT
Disabled Drivers and Disabled Passengers Scheme
6,490 30.5 5,263 24.9
Exemptions from VRT
Section 134 of the Finance Act 1992
3,253 10.2 2,893 8.6
VRT Export Repayment Scheme
Section 135D of the Finance Act 1992
1,187 7.3 1,550 9.6
Relief from VRT
VRT relief for hybrid, plug-in hybrid, and electric cars (extended in Budget 2014)
5,004 9.1 2,666 5.8
Mineral Oil Tax (MOT)
Repayment of excise duty
Disabled Drivers and Disabled Passengers Scheme (Abolished as of 31/12/14; replaced with fuel
Abolished as of 31/12/14; replaced with fuel grant from 1/1/15
Abolished as of 31/12/14; replaced with fuel grant from 1/1/15

41
grant from 1/1/15)
Diesel Rebate Scheme
Partial repayment of excise duty to qualifying road transport operators (Section 51 of the Finance Act 2013)
548 1.3 3,226 13.1
* All figures for 2016 (most recent year) & 2015 (previous year) unless stated otherwise
Table 6: Value Added Tax (VAT)
Type Description Further Information
No. Utilising or No. of Claims in most recent year for which information is available
Revenue Foregone in most recent year for which information is available (€ millions)
No. Utilising/No. of Claims in previous year*
Revenue Foregone in previous year (€ millions)*
VAT Refund Orders
Disabled Drivers & Passengers Scheme. Repayment of VAT to disabled drivers and disabled passengers and/or organisations on the purchase of specially constructed or adapted vehicles, which are used for the transport of persons with disabilities.
Disabled Drivers and Disabled Passengers (Tax Concessions) Regulations, 1994 (S.I. 353 of 1994)
6,490 26.1 5,266 20.1

42
Disabled Equipment – a refund of VAT is available on certain aids and appliances purchased by disabled persons.
Value Added Tax (Refund of Tax) (No.15) Order 1981 (S.I. 428 of 1981)
5,068 4.2 4,969 4
Touring Coaches - VAT repayment may be claimed by persons engaged in the carriage for tourists of reward by road, on the purchase, lease/hire of touring coaches
Value-Added Tax (Refund of Tax) (Touring Coaches) Order 2012 (S.I. 266 of 2012)
219 10 142 6.3
Farm construction. A refund of VAT is available to flat-rate farmers on the construction of farm buildings, fencing, drainage, reclamation of farm land, and on micro-generation equipment
Value Added Tax (Refund of Tax) (No.25) Order, 1993 (SI No.266 of 1993)
23,090 55.7 20,949 54.4
* All figures for 2016 (most recent year) & 2015 (previous year) unless stated otherwise

43
Table 7: Personal Tax Credits
Type Description Further Information
No. Utilising or No. of Claims in most recent year for which information is available
Revenue Foregone in most recent year for which information is available (€ millions)
No. Utilising/No. of Claims in previous year*
Revenue Foregone in previous year (€ millions)*
Personal Tax Credits
Age Tax Credit
170,000 63.1 158,800 58.7
Blind Person’s Tax Credit
General & Guide Dog Allowance
1,580 2.3 1,560 2.2
Dependent Relative Tax Credit
18,900 2.0 18,400 1.9
Home Carer’s Tax Credit
80,900 60.9 80,900 60.9
Incapacitated Child Tax Credit
22,800 66.7 20,300 59.0
Single Person Child Carer Credit
New, in effect from 1 January 2014
66,800 89.9 71,100 94.0
Approved Profit Sharing Schemes
26,700 44.7 25,684 50.8
Approved Training Courses/Third Level Fees
29,300 23.8 29,100 22.5
Employment and Investment Scheme
1,530 22.2 1,402 18.8

44
Donation of Heritage Items
2 1.8 1 0.13
Donation of Heritage Property to Irish Heritage Trust/OPW
2008 figures – last year in which expenditure recorded prior to 2015
1 0.9
Donations to Approved Bodies
148,300 38.1 N/A N/A
Donations to Approved Sporting Bodies
1,170 0.4 1,170 0.5
Employee Share Ownership Trusts
11,800 1.7 11,831 1.7
Employing a Carer
N/A N/A 1,910 8.1
Exempt Income – Child-minding Exemption
680 1.4 660 1.3
Exempt Income – Rent-a-Room
6,460 6.9 4,780 7.6
Exempt Income- Artist’s Exemption
2,840 10.8 2,640 5.8
Exempt Income – Foster-Care Payments
4,440 30.8 4,210 31.8
Home Renovation Incentive
Introduced in 2013
N/A N/A N/A N/A
Health Expenses
General & Nursing Home
438,300 147.4 421,800 145.9
Medical Insurance Relief
Risk equalisation credits are not given through the
1,111,300 352.2 1,111,300 354.9

45
tax system effective from 1 January 2013
Special Assignee Relief Programme (SARP)
2015 figures – latest year for which full data available
586 9.5 302 5.9
Save as You Earn Scheme (savings related share options)
1,330 3.5 1,910 3.5
Seafarer’s Allowance
N/A N/A 160 0.3
Start-Up Refunds for Entrepreneurs
Formerly Seed Capital Scheme
N/A N/A 59 1.8
Significant Buildings and Gardens Relief
150 2.2 150 2.8
Sports person’s Relief
38 0.5 38 0.3
Start Your Own Business
From Oct. 2013
3,910 15.2 1,823 5.2
Woodlands Profits & Distributions
Section 140 N/A N/A N/A N/A
Woodlands Section 232 8,268 29.7 8,234 30
Exemption of Income of Charities, Colleges, Hospitals, Schools Friendly Societies etc.
2013 figures – last year for which full data available
N/A N/A N/A N/A
General Stock Relief
Section 666 10,690 6.1 9,100 5.2
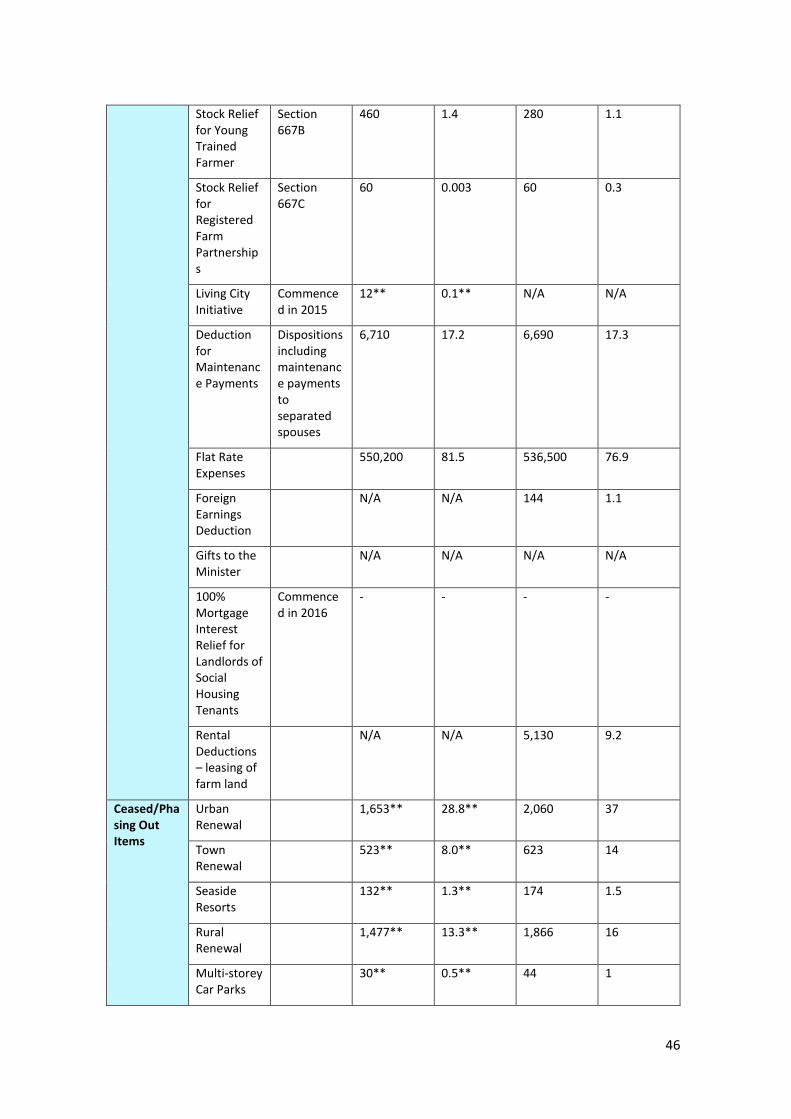
46
Stock Relief for Young Trained Farmer
Section 667B
460 1.4 280 1.1
Stock Relief for Registered Farm Partnerships
Section 667C
60 0.003 60 0.3
Living City Initiative
Commenced in 2015
12** 0.1** N/A N/A
Deduction for Maintenance Payments
Dispositions including maintenance payments to separated spouses
6,710 17.2 6,690 17.3
Flat Rate Expenses
550,200 81.5 536,500 76.9
Foreign Earnings Deduction
N/A N/A 144 1.1
Gifts to the Minister
N/A N/A N/A N/A
100% Mortgage Interest Relief for Landlords of Social Housing Tenants
Commenced in 2016
- - - -
Rental Deductions – leasing of farm land
N/A N/A 5,130 9.2
Ceased/Phasing Out Items
Urban Renewal
1,653** 28.8** 2,060 37
Town Renewal
523** 8.0** 623 14
Seaside Resorts
132** 1.3** 174 1.5
Rural Renewal
1,477** 13.3** 1,866 16
Multi-storey Car Parks
30** 0.5** 44 1

47
Living Over The Shop
35** 0.3** 40 0.3
Enterprise Areas
35** 0.3** 50 0.9
Park & Ride 13** 0.4** 15 1
Holiday Cottages
278** 3.3** 452 5
Hotels 147** 12.7** 504 16
Nursing Homes
130** 3.4** 248 7
Housing for the Elderly/Infirm
18** 0.2** 37 0.5
Hostels 4** 0.0** N/A 0.1
Guest Houses
4** 0.1** N/A 0.1
Convalescent Homes
3** 0.2** N/A N/A
Qualifying Private Hospitals
159** 4.3** 245 7
Qualifying Sports Injury Clinics
0 0 20 0.4
Buildings Used for Certain Childcare Purposes
67 1 172 2
Qualifying Hospitals
0 0.0 N/A N/A
Qualifying Mental Health Centres
0 0.0 N/A N/A
Student Accommodation
341 11.4 414 11
Caravan Camps
2 0.1 N/A 0.1
Mid-Shannon Corridor Tourism
1 0.0 N/A 0.2

48
Infrastructure
Top slicing Relief
Abolished from 1/1/2014
- - - -
SARP Predecessor
Ended 2011 with 5yr Grandfathering
- - - -
Revenue Job Assist
N/A N/A 1,570 1.2
Rent Relief N/A N/A 143,900 29.5
“Other” Relief on Interest on Loans
Acquisition of interest in a company or partnership
N/A N/A 1,100 3.0
Mortgage Interest Relief
N/A N/A 473,890 266.4
Employee Share Purchase Scheme
Abolished for shares subscribed for on or after 8 December 2010
N/A N/A N/A N/A
* All figures for 2015 (most recent year) & 2014 (previous year) unless stated otherwise
** Provisional figures