Report on Selected Issues Related to NVG Use in a … · Report on Selected Issues Related to NVG...
39
Report on Selected Issues Related to NVG Use in a Canadian Security Context Muna Shabaneh, Pearl Guterman, James Zacher, Yuichi Sakano and Robert S. Allison Technical Report CSE-2009-07 October 1 2009 Department of Computer Science and Engineering 4700 Keele Street, Toronto, Ontario M3J 1P3 Canada
-
Upload
hoangxuyen -
Category
Documents
-
view
216 -
download
0
Transcript of Report on Selected Issues Related to NVG Use in a … · Report on Selected Issues Related to NVG...

Report on Selected Issues Related to NVG Use in a CanadianSecurity Context
Muna Shabaneh, Pearl Guterman, James Zacher, Yuichi Sakanoand Robert S. Allison
Technical Report CSE-2009-07
October 1 2009
Department of Computer Science and Engineering4700 Keele Street, Toronto, Ontario M3J 1P3 Canada
Report on Selected Issues Related to NVG Use in a Canadian Security Context
ETech Grant RM05SEC02: Assessing Image Intensifier Integration in Security and Emergency Response
Sept, 2006
Updated Oct 2008, 2009
Principle Investigator Robert S. Allison York University
4700 Keele Street Toronto ON
M3J 1P3
Muna Shabaneh, Pearl Guterman, James Zacher, Yuichi Sakano
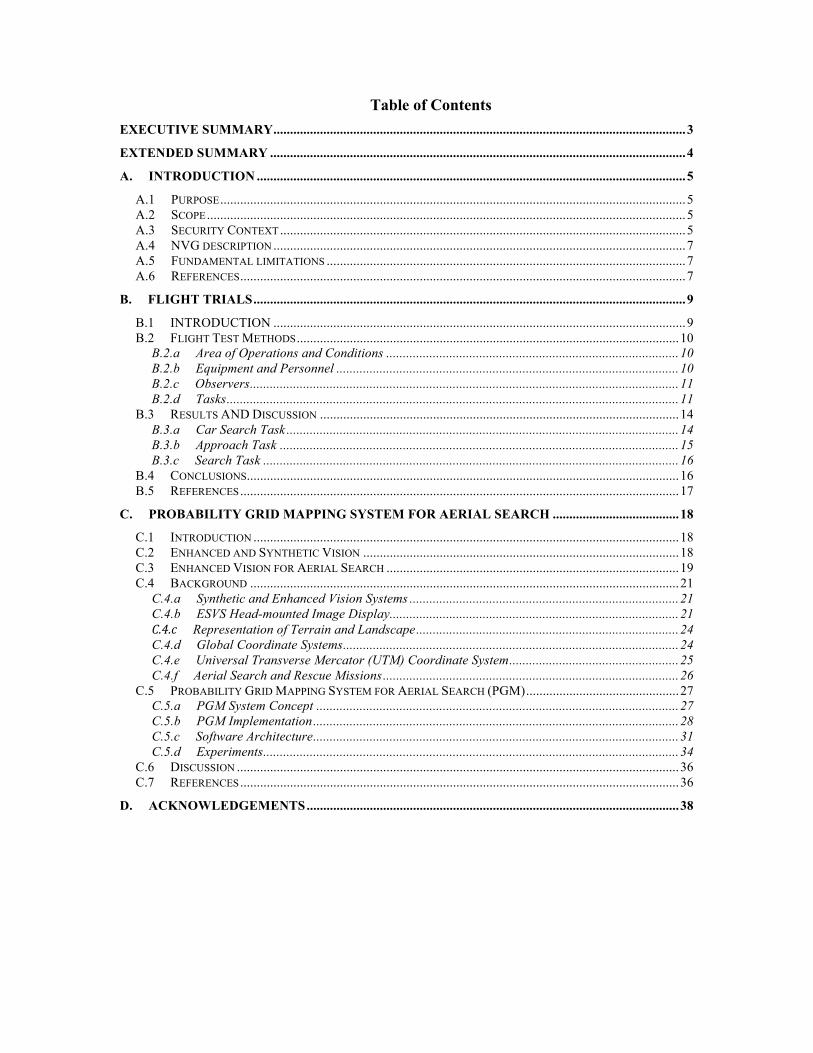
Table of Contents EXECUTIVE SUMMARY............................................................................................................................3 EXTENDED SUMMARY .............................................................................................................................4 A. INTRODUCTION .................................................................................................................................5
A.1 PURPOSE............................................................................................................................................5 A.2 SCOPE................................................................................................................................................5 A.3 SECURITY CONTEXT..........................................................................................................................5 A.4 NVG DESCRIPTION ............................................................................................................................7 A.5 FUNDAMENTAL LIMITATIONS ............................................................................................................7 A.6 REFERENCES......................................................................................................................................7
B. FLIGHT TRIALS..................................................................................................................................9 B.1 INTRODUCTION ............................................................................................................................9 B.2 FLIGHT TEST METHODS...................................................................................................................10
B.2.a Area of Operations and Conditions ........................................................................................10 B.2.b Equipment and Personnel .......................................................................................................10 B.2.c Observers.................................................................................................................................11 B.2.d Tasks........................................................................................................................................11
B.3 RESULTS AND DISCUSSION ............................................................................................................14 B.3.a Car Search Task ......................................................................................................................14 B.3.b Approach Task ........................................................................................................................15 B.3.c Search Task .............................................................................................................................16
B.4 CONCLUSIONS..................................................................................................................................16 B.5 REFERENCES....................................................................................................................................17
C. PROBABILITY GRID MAPPING SYSTEM FOR AERIAL SEARCH ......................................18 C.1 INTRODUCTION ................................................................................................................................18 C.2 ENHANCED AND SYNTHETIC VISION ...............................................................................................18 C.3 ENHANCED VISION FOR AERIAL SEARCH ........................................................................................19 C.4 BACKGROUND .................................................................................................................................21
C.4.a Synthetic and Enhanced Vision Systems .................................................................................21 C.4.b ESVS Head-mounted Image Display.......................................................................................21 C.4.c Representation of Terrain and Landscape...............................................................................24 C.4.d Global Coordinate Systems.....................................................................................................24 C.4.e Universal Transverse Mercator (UTM) Coordinate System...................................................25 C.4.f Aerial Search and Rescue Missions.........................................................................................26
C.5 PROBABILITY GRID MAPPING SYSTEM FOR AERIAL SEARCH (PGM)..............................................27 C.5.a PGM System Concept .............................................................................................................27 C.5.b PGM Implementation..............................................................................................................28 C.5.c Software Architecture..............................................................................................................31 C.5.d Experiments.............................................................................................................................34
C.6 DISCUSSION .....................................................................................................................................36 C.7 REFERENCES....................................................................................................................................36
D. ACKNOWLEDGEMENTS................................................................................................................38

Executive Summary Police and border security operations are an important and growing application of
night vision devices (NVDs). NVDs improve visibility at night but suffer from a variety of perceptual artifacts and human factors issues. In a series of helicopter-based flight trials we analyzed subject performance on model tasks based on typical security applications. Subjects performed the tasks under conditions of unaided daytime vision, unaided nighttime vision or image intensified nighttime vision. The tasks included directed search over open and forested terrain, detection and identification of a temporary landing zone and search/tracking of a moving vehicle marked with a covert IR marker. The results of this study confirm that NVDs can provide significant operational value but also illustrate the limitations of the technology. We also describe a prototype augmented vision system to aid in night time search developed as an MSc project under this ETech project.

Extended Summary Police and border security operations are an important and growing application of
night vision devices (NVDs). NVDs improve visibility at night but suffer from a variety of perceptual artifacts and human factors issues. In a series of helicopter-based flight trials we analyzed subject performance on model tasks based on typical security applications. Subjects performed the tasks under conditions of unaided daytime vision, unaided nighttime vision or image intensified nighttime vision. The tasks included directed search over open and forested terrain, detection and identification of a temporary landing zone and search/tracking of a moving vehicle marked with a covert IR marker. The results of this study confirm that NVDs can provide significant operational value but also illustrate the limitations of the technology.
We also describe a prototype augmented vision system to aid in night time search
developed as an MSc project under this ETech project. Aerial search for targets on the ground is a challenging task; success depends on providing proper intelligence to the searchers. Recent advances in avionics enhanced and synthetic vision systems (ESVS) offer new opportunities to present this information to aircrew. This paper describes the concept and implementation of a new ESVS technique intended to support flight crews in aerial search for search and rescue missions and other guided search scenarios.
The Probability Grid Map (PGM) concept provides the searcher with an
augmented, conformal, digital moving map of the search area that encodes the estimated probability of the target being found at various locations. A priori estimation of these probabilities allows for prioritization of search areas, reduces search duplication and improves coverage and ideally maximizes search effectiveness. Priorities are encoded with a colour-coded highlighting scheme indicating probability of finding the target in each area. Probability estimates can be adaptively modified (a posteriori probabilities) as the search progresses and various parts of the search area covered. The displayed probabilities and highlighting can be adaptively modified to reflect these changes. The conformal 3D map is displayed with appropriate perspective projection using a head-slaved optical see-through Head-Mounted Display (HMD) allowing it to be registered with and augment the real world. To evaluate the system prior to flight test, a simulation environment was developed for study of the effectiveness of highlighting methods, update strategies, and probability mapping methods.
A. Introduction
A.1 Purpose
In the initial phase of this research project we conducted flight tests with partner organizations to elucidate the operational needs of the users. The efficacy and opportunities provided by night vision aids were evaluated in an Integrated Border Enforcement Teams (IBETS) scenario involving federal (RCMP), and provincial (OMNR) law enforcement officers.
The desired outcome was the development of standard operating procedures and augmentation technologies that allow counter-terrorism and other law enforcement and security personnel to extend the operational window and effectiveness of their operations. The results and technologies developed will also be effective in related areas such as search and rescue and disaster relief and management.
This project will impact Ontarians and Canadians by improving the safety of the operators and the general public on the ground during helicopter operations at night. Increased vigilance and ability to counter terrorist and other criminal activities has enormous potential benefits, particular if it contributes to avoiding the worst-case scenario of a catastrophic terrorist attack.
Insights gained from the flight tests were used to guide the development of customized symbology and/or sensor fusion systems in the following years of the project. This project is described in the latter half of the report.
A.2 Scope
This report discusses the scenario design, test flights, analysis and evaluation of a set of flight trials to assess the value and opportunities of integrating NVGs into existing airborne law enforcement activities. The aim is to provide operational guidance to police, intelligence services and border officers for the effective integration of night vision aids through development of standard operating procedures. The information obtained supported the development and test of augmented vision displays to support counterterrorism and other activities. Much of this was information was conveyed or discussed with partner organizations and this document serves to archive these results and analyses and hopefully as a useful reference for the broader community.
A.3 Security Context
Canadian law and border enforcement officials face difficult challenges in monitoring our large borders and waterways. Inspired by the success of night vision aids in military operations there is strong desire from security personnel for the use of night vision aids and other sensors in surveillance, detection and tracking of threats from airborne platforms. However, Canadian organizations have little operational experience with these devices although the RCMP and others have been using infrared cameras effectively for several years. There is room for innovation in areas such as sensor
integration and integration of flight symbology if the requirements of the operational environment are understood.
Modern public security and anti-terrorism activities require constant vigilance and ability to deploy countermeasures day or night. Night Vision Goggles (NVGs) have been routinely used by military organizations to expand their existing flight operations to night conditions. Similar nighttime covert operations are required for border and law enforcement activities including border patrol, anti-terrorism, security enforcement, and related activities. While Canada is currently conducting limited operations at night it would be advantageous to enhance safety and effectiveness by integrating NVGs into normal operations.
Pilots flying counterterrorism and other activities must integrate a large amount of mission and sensor information to perform their tasks. Night vision goggles are potentially useful in extending the operational range but must be fused with other critical mission and flight data. It is clear that effective systems will need to fuse NVG imagery with mission and flight data in an enhanced visually-coupled display. However, there are little human factors data on which to base intelligent sensor fusion algorithms and task relevant symbology sets. Indeed it is unclear what benefits night vision aids confer under standard homeland security and law enforcement scenarios. Thus there is a pressing need to identify key operational requirements and develop effective sensor augmentation and symbology.
There is virtually no human factors data about NVG use in paramilitary operations and it is unclear how to most effectively and safely use and enhance night vision aids. Night vision goggles have found standard application in military covert operations that usually rely on low-level flight and high speed for stealth making NVGs essential for safe night flight. However, civilian (police and paramilitary) counterterrorism operations on operate under different constraints. Often the possibility for active lighting exists. However, the range of vision, and hence speed and operational range, is limited under active lighting and stealth is compromised. Infrared and thermal cameras are complementary technology sensitive to different wavelengths and environmental features. Image intensified NVGs offer a capability that is unique among potential night vision sensors and there is strong support for integrating these into operators’ cockpits. There is a requirement for innovation in areas such as sensor integration and integration of flight symbology, but this innovation depends on an understanding of the requirements of the operational environment. Technological innovations made possible by this research may allow increased effectiveness and availability of airborne platforms for disaster management/counter-terrorism (e.g. dirty bomb mitigation), targeting, emergency response, search and rescue, and apprehension
Canadian air wings were not capable of night-vision aided operation when we started this study. The study provided context for development of SOP and facilitation of night-vision aided flight and provide useful empirical data on which to build an enhanced operational capability. Based in pat on these studies our partner have developed SOPs for NVG operations and are currently flying NVG missions.

A.4 NVG description
Night vision goggles are helmet-mounted displays intended to improve night vision. They are based upon image intensification tubes that act to amplify the ambient light.
A.5 Fundamental limitations
Visual acuity during night vision goggle use is typically less than visual acuity at normal full light levels. Estimates of NVG visual acuity currently range from 20-30 to 20-60 [1-5]. For example, Pinkus and Task[2] have used high contrast Landolt C’s to evaluate the resolution of goggles and arrived at Snellen acuity estimates in the range of 20-20 to 20-30 for high light levels. Further, their results showed that lowering illumination levels degrades acuity (e.g. as it gets darker, acuity will get worse).
Night Vision Goggles (NVGs) allow pilots to see and navigate under minimal levels of illumination by amplifying the available light. While the NVGs amplify available light, under very low light conditions, they also create scintillating noise (i.e. a ‘grainy’ appearance similar to a detuned television) within the visual display. Reduction in the input light level results in an increase in MCP gain to enhance sensitivity and a consequent increase in NVG noise. NVG noise may influence depth, motion, resolution, form, size and distance perception[6-12]. This degradation in image quality may produce a decrease in aviator performance and an increase in the workload.
A.6 References [1] Bradley, A. and M.K. Kaiser, Evaluation of visual acuity with gen III night vision goggles. 1994, National
Aeronautics and Space Administration: Moffett Field, CA. p. 1-35.
[2] Pinkus, A. and H. Lee Task. Measuring observers' visual acuity through night vision goggles. 1998. Phoenix, AZ, USA: Survival Flight Equipment Assoc, Nashville, TN, USA.
[3] Rabin, J., Spatial Contrast Sensitivity through Aviators Night-Vision Imaging-System. Aviation Space and Environmental Medicine, 1993. 64(8): p. 706-710.
[4] Task, H.L. Night vision goggle visual acuity assessment: Results of an interagency test. 2001. Orlando, FL: Society of Photo-Optical Instrumentation Engineers.
[5] Kotulak, J.C. and S.E. Morse, Focus Adjustment Effects on Visual-Acuity and Oculomotor Balance with Aviator Night-Vision Displays. Aviation Space and Environmental Medicine, 1994. 65(4): p. 348-352.
[6] Glasgow, R.L., et al. Psychophysical Measurement of Night Vision Goggle Noise. in Helmet- and Head-Mounted Displays VIII: Technologies and Applications. 2003. Orlando, FL, United States: The International Society for Optical Engineering.
[7] Rivamonte, A. Resolution and signal-to-noise measurement US Army night vision goggles. in Proceedings of the SPIE - The International Society for Optical Engineering,vol.1290,pp.206-215,1990; Helmet-Mounted Displays II, 19-20 April 1990, Orlando, FL, USA. SPIE. 1990. USA.
[8] Durgin, F.H. and D.R. Proffitt, Perceptual Response to visual noise and display media (Final Report, 1 JUL. 1992-30 JUN. 1993) [Final Report]. . 1993, NASA: Houston, TX. p. 1-12.
[9] Riegler, J.T., et al., The effect of signal-to-noise ratio on visual acuity through night vision goggles (Interim report, October 1989-September 1990). 1990.
[10] Thomas, P.J., et al. Validation of synthetic imagery for night vision devices. 2004. Orlando, FL, USA: SPIE-Int. Soc. Opt. Eng.
[11] Reis, G.A., et al. Psychophysical measurement of night vision goggle noise using a binocular display. in Proceedings of the SPIE - The International Society for Optical Engineering,vol.5442,no.1,pp.13-24,2004;

Helmet- and Head-Mounted Displays IX: Technologies and Applications, 12-13 April 2004, Orlando, FL, USA. 2004. USA: SPIE-Int. Soc. Opt. Eng.
[12] Macuda, T., et al. Detection of motion-defined form under simulated night vision conditions. 2004. Orlando, FL, USA: SPIE-Int. Soc. Opt. Eng.
B. Flight Trials
B.1 INTRODUCTION
Modern public security and anti-terrorism activities require constant vigilance and the ability to deploy countermeasures day or night. Night Vision Goggles (NVGs) have found standard application in military covert operations that usually rely on low-level flight and high speed for stealth making NVGs essential for safe night flight. However, civilian (police and paramilitary) counterterrorism efforts are usually deployed under different constraints. Inspired by the success of night vision aids in the military there is strong desire from security personnel to use night vision aids and other sensors in surveillance, detection and tracking of threats from airborne platforms. Similar nighttime covert operations are required for border and law enforcement activities including border patrol, anti-terrorism, security enforcement, and related activities. Canadian law and border enforcement officials face difficult challenges in monitoring our large borders and waterways. While Canada is currently conducting operations at night aided by technologies such as FLIR cameras, it would be advantageous to enhance safety and effectiveness by integrating NVGs into normal operations.
In this paper we describe a set of research flight trials to evaluate the utility of night-vision aids for a variety of typical airborne security tasks. In keeping with the scope and aims of this Flight Test Methodology conference we will concentrate on the methodology and conduct of the experiment before briefly describing some general findings and their implications.
B.2 Flight Test Methods
B.2.a Area of Operations and Conditions The flight trials were conducted at and near Pendleton airfield, which is located
east of the city of Ottawa. The airfield, surrounding woods and an adjacent golf course were used for staging the experiments. The areas were surveyed by air/foot prior to the experiments. As the experiments were performed in winter access to the area of operations was by cross-country ski and snowshoe.
The experiment was conducted over a series of day and night sorties during February 20-23, 2006. Some of the daytime flights involved a brief touch down at Pendleton to switch experimental subjects (but note that no one was exposed to the experimental protocol before serving as a subject). The weather was mainly overcast but with good visibility. However, snow showers and stormy weather terminated trials at the end of the week. Typically two sorties were flown each night scheduled so that experiments would start after astronomical twilight.
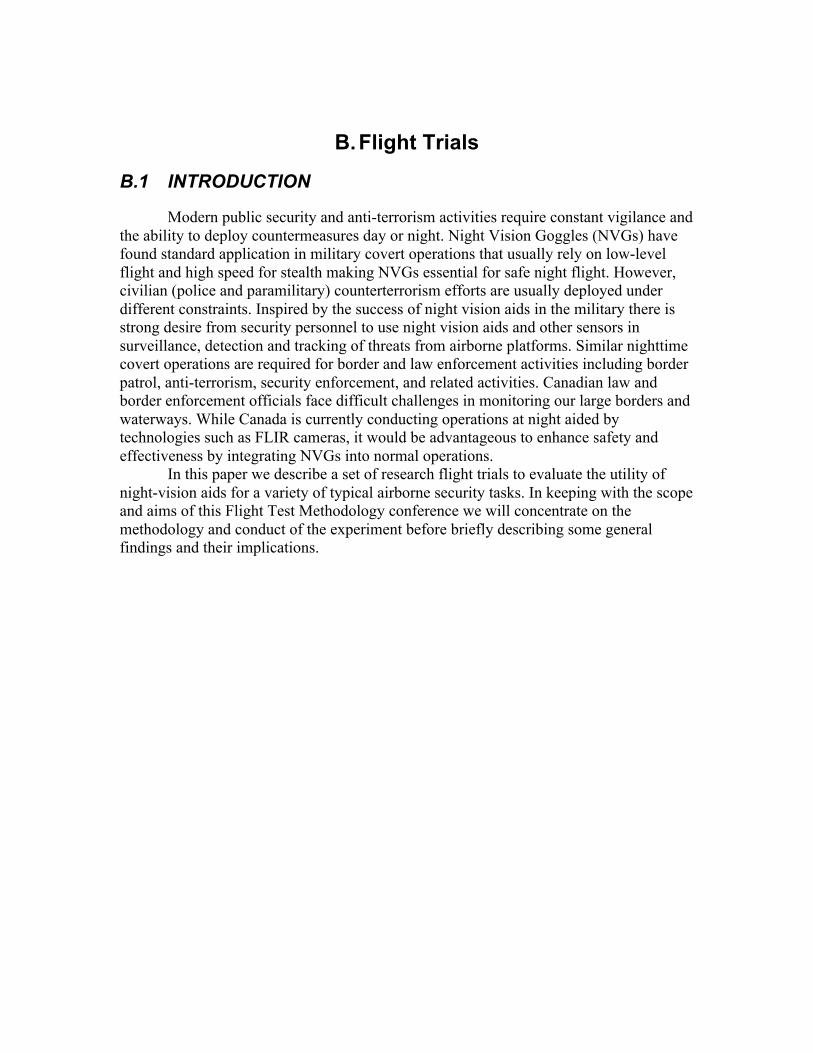
B.2.b Equipment and Personnel The study was performed using an NVG-compatible, specially-instrumented Bell
206 helicopter. The Flight Research Laboratory of the National Research Council of Canada’s (NRC) Institute for Aerospace Research has modified this aircraft to serve as a ‘flying laboratory’. Most relevant for the current study is the ability for continuous recording of precise aircraft GPS, inertial and altitude data and for the synchronous recording of experimental data such as special purpose switches mounted in the cockpit and designated for experimental input (including ‘event marker’ buttons). Continuous voice recordings were synchronized with the aircraft data collection system. During the experiments an NRC test pilot flew the aircraft (aided by NVGs on the night flights). No data was collected from these pilots who were in control of the aircraft but did not
Figure 1- Bell 206 research platform used for the flight trials
participate directly in the experimental tasks. A flight test scientist/engineer was onboard the aircraft (in the back seat) to monitor the data collection and coordinate the experiment from the air.
Ground personnel consisted of field crew (5 people) as well as support at the hanger. The ground crew arranged and activated the landing lights for the approach task, drove the marked car for the car search tasks and acted as and placed targets for the search task. A ground coordinator maintained communication with the aircraft pilot and flight test engineer on board the aircraft. The ground team surveyed the site and made portable GPS measurements of target locations.
B.2.c Observers The experimental subjects were seated in the evaluation pilot seat and did not fly
the aircraft during the test phases of the sorties. The five male subjects were NVG-qualified helicopter pilots who had experience working in airborne law enforcement (2 pilots from the Royal Canadian Mounted Police and two from the Ontario Ministry of Natural Resources) or in related regulatory aspects (one pilot from Transport Canada). Due to weather constraints only three pilots completed the full flight test protocol.
B.2.d Tasks The subjects performed three tasks: a car search, an approach to a remote landing
zone and a simulated ground search. The tasks were performed under daylight conditions (except the car search task), unaided nighttime conditions or NVG aided nighttime conditions. The order of nighttime aided and unaided viewing conditions was counterbalanced between subjects. The sequence of events for the daytime and a typical
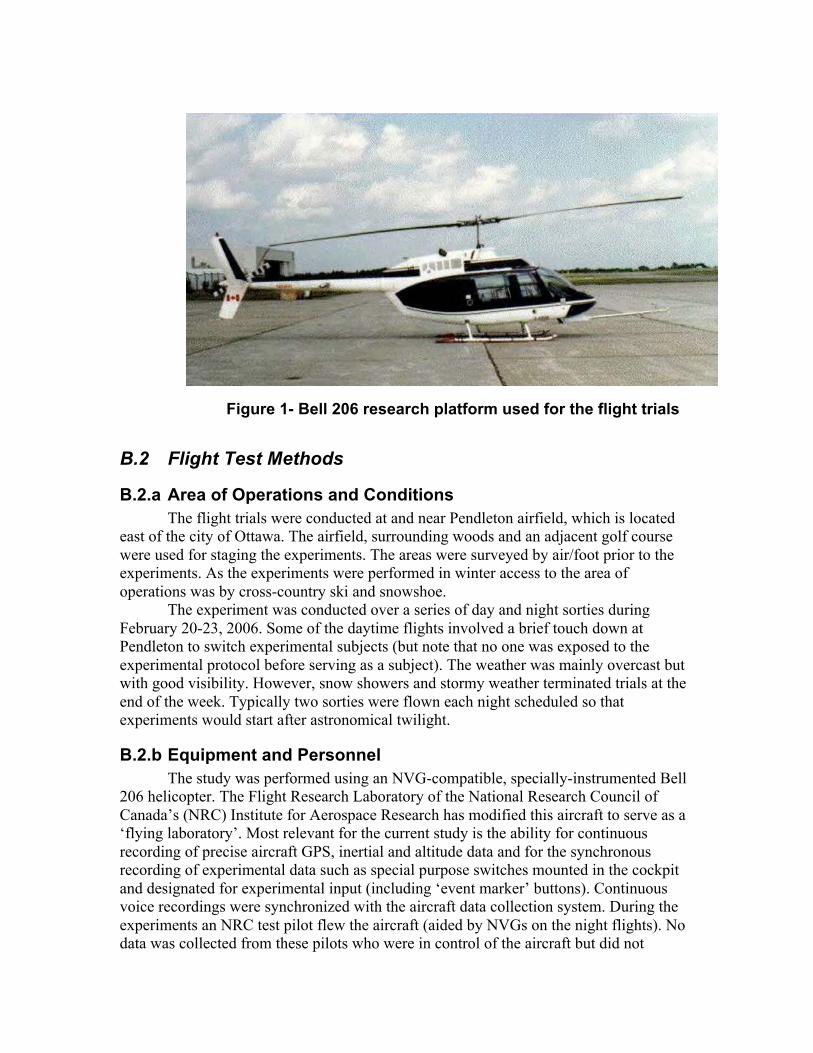
Figure 2- Automated lights used for car tracking (middle bottom) and landing zone tasks
nighttime protocol were spelled out and incorporated into flight data cards followed by the FTE. A typical nighttime sequence of the experiment would take 1.75 hours with 0.75 hours in transit and the car chase and 1.0 hours over Pendleton. A typical sortie would involve a series of events such as:
1. Take-off 2. Detour over target area and perform car search enroute 3. Goggles up/down (depending on experimental order) 4. Perform landing approach task (2 or 3 approaches, 5 minutes each) 5. Goggles up 6. Perform search task search area A (10 minutes) 7. Goggles down 8. Perform search task area B (10 minutes) 9. Goggles up/down 10. Perform landing approach task (2 or 3 approaches, 5 minutes each) 11. Direct return
The car search task was performed on night sorties only and simulated the search
and tracking of a vehicle marked covertly with a flashing infrared beacon. The beacon was supplied by Adventure Lights and designed to strobe an IR LED for easy identification. At takeoff for the sortie, a call was made from the hanger to the driver to turn on the beacon and GPS logging and to drive up and down a predetermined road turning around at predetermined intersections. During the outbound flight to the main area of operations the pilot approaches highway to the first endpoint and made single pass of the route. If the observer (who was not in control of the aircraft) finds the target vehicle they were to press the event marker button, audibly mark the event and localize the target vehicle with respect to the aircraft (e.g. 11:00, westbound, etc.). The FTE noted the time and details of the response. If the vehicle was not spotted a second pass was not
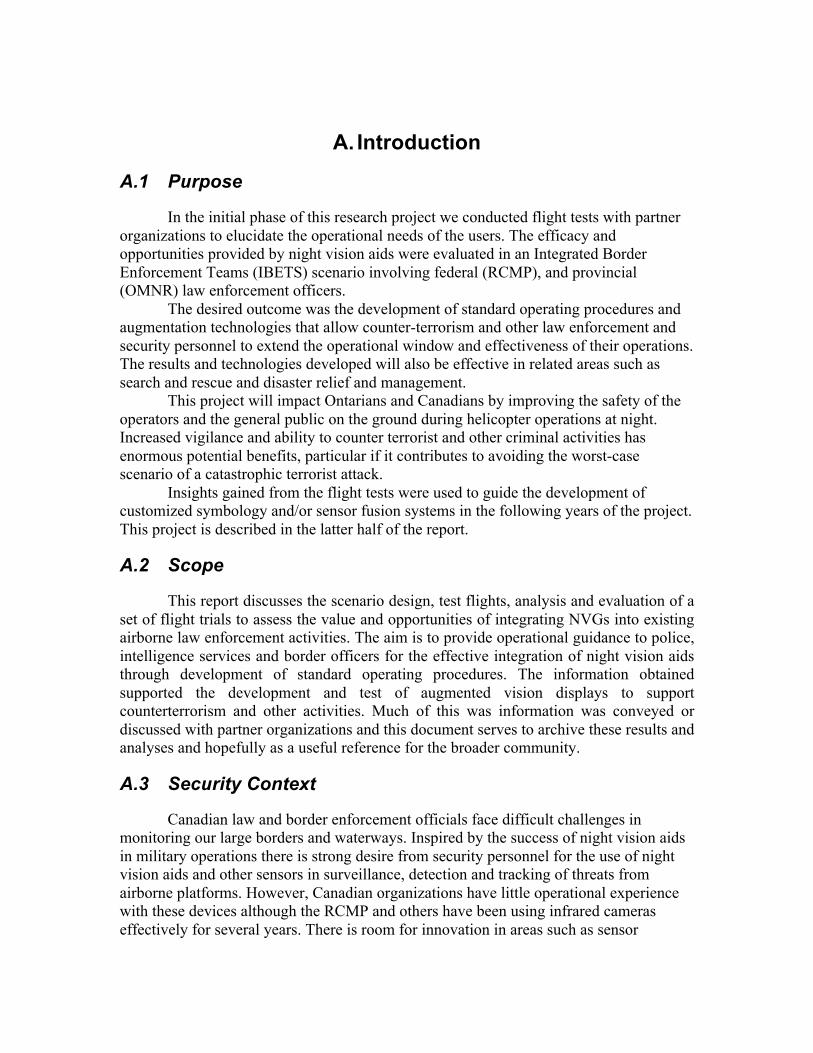
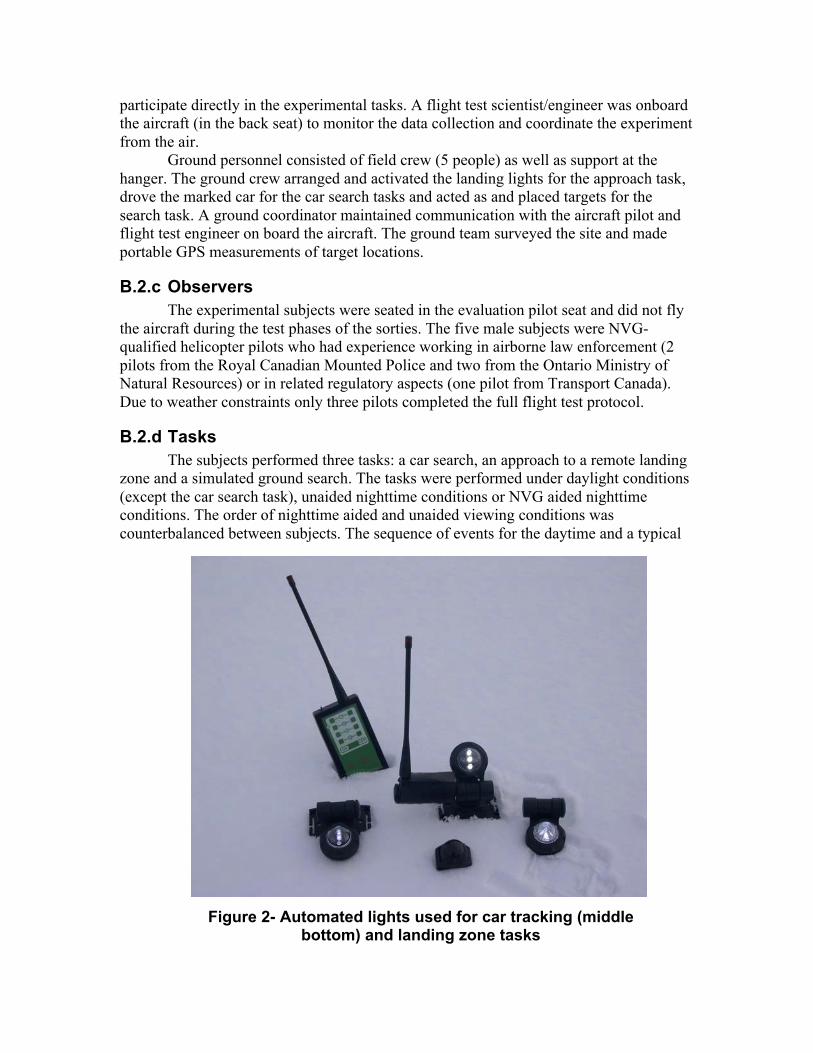
Figure 3- NATO-T and Rectangular Landing Zones defined by cones or IR beacons (under NVG viewing)
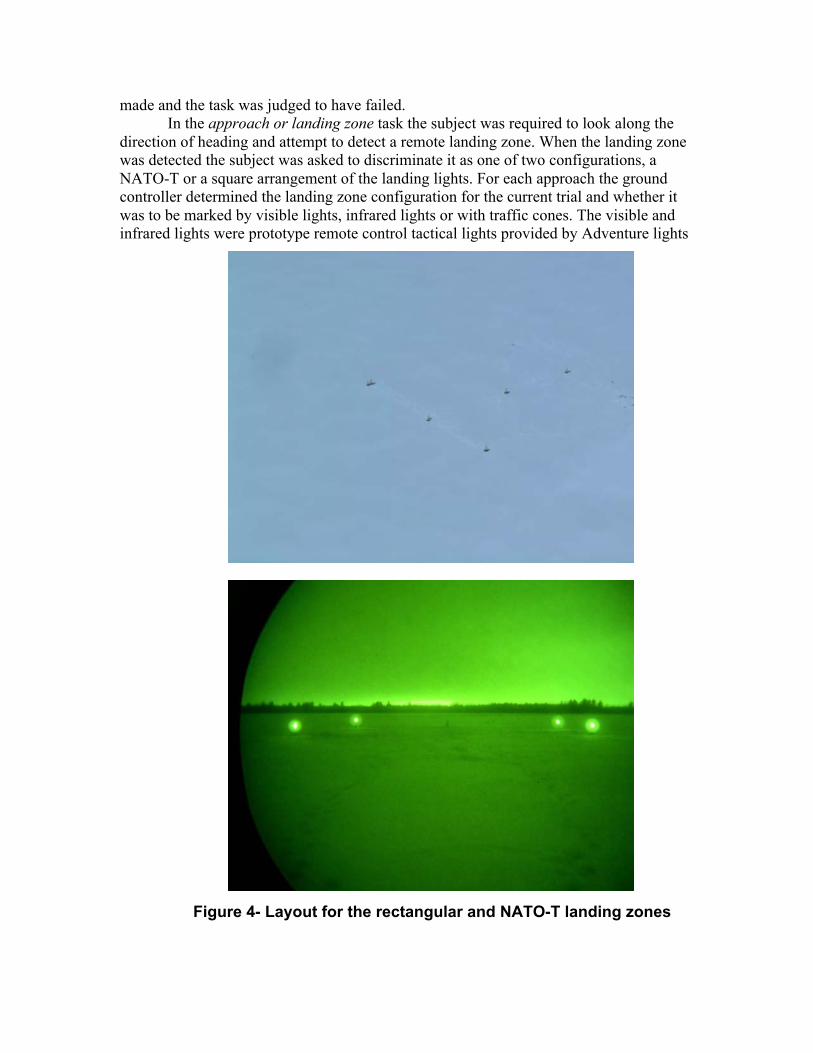
made and the task was judged to have failed. In the approach or landing zone task the subject was required to look along the
direction of heading and attempt to detect a remote landing zone. When the landing zone was detected the subject was asked to discriminate it as one of two configurations, a NATO-T or a square arrangement of the landing lights. For each approach the ground controller determined the landing zone configuration for the current trial and whether it was to be marked by visible lights, infrared lights or with traffic cones. The visible and infrared lights were prototype remote control tactical lights provided by Adventure lights
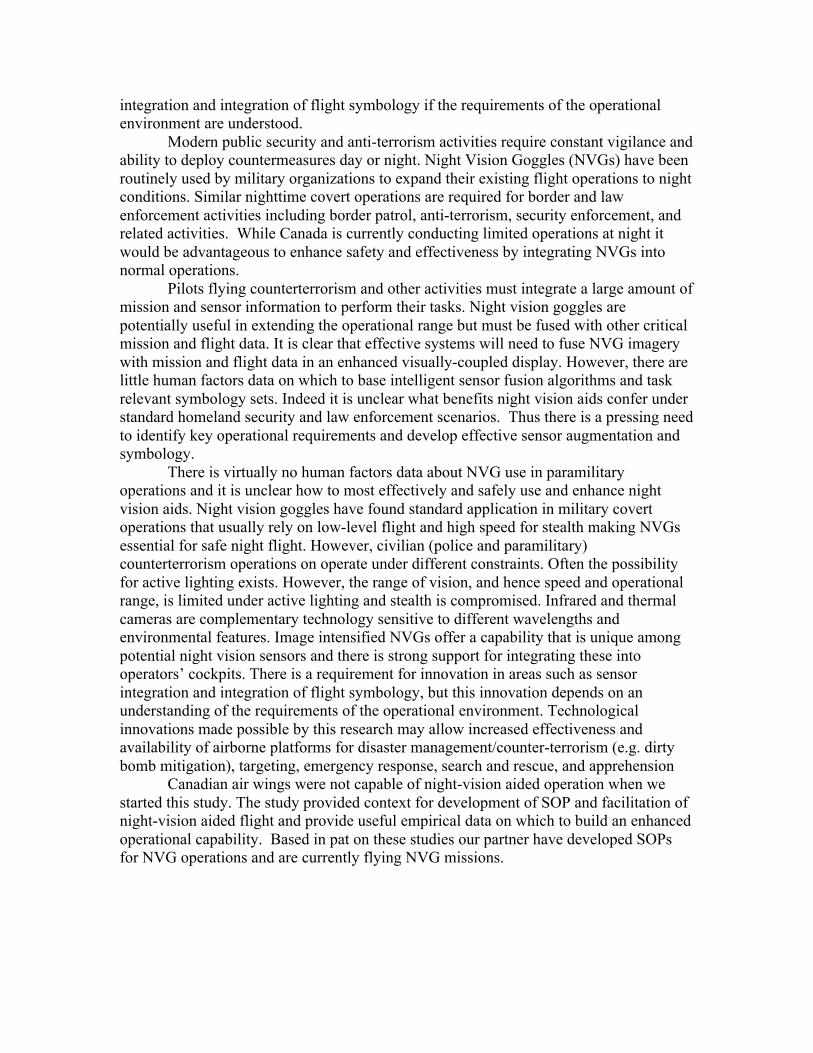
Figure 4- Layout for the rectangular and NATO-T landing zones

and operated remotely by the ground controller. When the configuration was setup the ground controller notified the pilot who began the approach from a distance of approximately 10km. The subject (in the evaluation pilot seat) monitored the scene for the landing zone. When he detected the zone he marked the time with an event click and audible marking of the event. When he could confidently discriminate the landing zone (T or square) he marked the time with an event click and audibly identified the configuration. The FTE noted times and responses in the log.
In the simulated ground search task the scenario was that the airborne officers were to search for a set of people or objects associated with suspicious activity based on intelligence supplied by ground officers. Two search areas were defined: one over the woods behind the airfield and the other over an adjacent golf course. For each subject the daylight search was performed over one area and the nighttime search over the other area in an experimenter defined order. Preliminary studies showed that nighttime unaided search had extremely low detection rates so the nighttime search was performed unaided and then with NVGs allowing the same search area to be used. Subjects had a known list of targets for the search that included people. The search time was limited to 10 minutes. The pilot started by flying circular paths around the search area but encouraged the subject to direct him to fly particular paths or over areas of interest. When the subject spotted a target they marked the event audibly and with the event marker, made a verbal identification and indicated its location with a grease pencil on an aerial photograph. The FTE verified and logged the identifications.
To evaluate the task demands and the effects of using the night vision devices, the tasks were evaluated using objective performance measures and subjective impressions and responses obtained from the observers. Subjects were encouraged to ‘think aloud’ and to verbalize their thoughts and strategies for performing the tasks. This stream of consciousness was recorded on the cockpit voice recorder and subjects were briefed to pay special attention to task demands, visual performance, orientation, workload, spatial awareness, information required and obtained, strategies followed, progress and history of the task, problems encountered and also to the advantages and disadvantages with the various viewing conditions.
Following the final sortie for each subjects a structured debriefing occurred with the observers being asked an open-ended series of 36 questions designed to address task and NVD issues. The questions were grouped into categories: General questions related to conditions and NVD impact (7 Questions), Car tracking task (9 Questions), Approach task (8 Questions) and the Ground Search task (12 Questions).
B.3 Results AND Discussion
B.3.a Car Search Task Subjects found the marked vehicle easy to track once located and motion of the
vehicle was not reported to be an issue. The flashing of the strobe was distinct but could be confused with tail and signal lights during the search; the subjects felt more experience would be beneficial. They also felt that the task would be easy in rural settings but more difficult in urban settings.
It is important to note that use of an infrared (IR) target allows for covert tracking with NVG or FLIR. This permits the covert marking of field officer vehicles for guidance and situational awareness as well as the unobtrusive marking of suspect vehicles to trail.
In general the car search task was easy despite the constraints (single pass along a suburban road with unknown initial location of the vehicle). Once detected, the vehicle was easy to track and unambiguous identification was more of an issue than detection of the beacon. Also NVG halos from vehicle light can mask the target and limit detection/identification range [1].
Use of NVGs causes restriction on field of view and load on the head that effects
efficient head movements. Pilots learn strategies for scanning instruments and scenes to facilitate accurate VFR flight. One issue that was not fully addressed here was the impact of these restrictions and scanning strategies on the effectiveness of visual search.
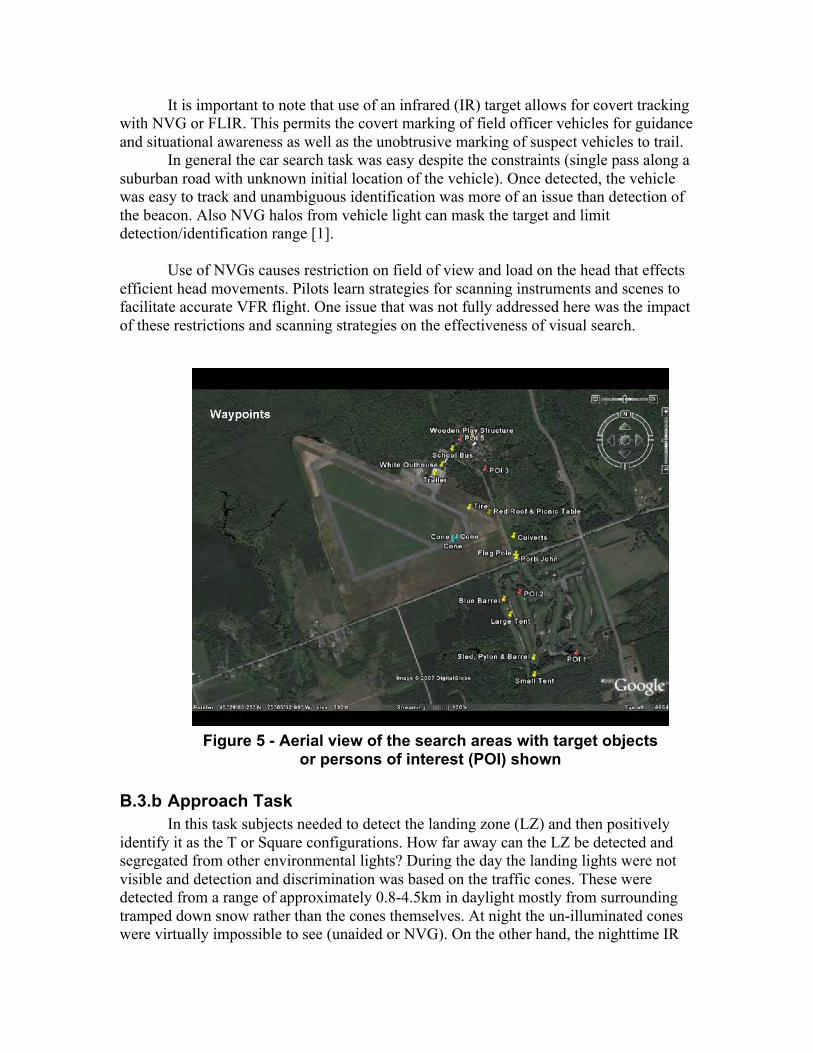
B.3.b Approach Task In this task subjects needed to detect the landing zone (LZ) and then positively
identify it as the T or Square configurations. How far away can the LZ be detected and segregated from other environmental lights? During the day the landing lights were not visible and detection and discrimination was based on the traffic cones. These were detected from a range of approximately 0.8-4.5km in daylight mostly from surrounding tramped down snow rather than the cones themselves. At night the un-illuminated cones were virtually impossible to see (unaided or NVG). On the other hand, the nighttime IR
Figure 5 - Aerial view of the search areas with target objects or persons of interest (POI) shown

and visible lights were highly visible from at least several km (3.8-9.8km NVG). The visible lights were conspicuous to the naked eye and could be detected from approximately the same range as with NVGs. The IR lights can of course be used for covert landing zones with NVG viewing. It is important to note that the lights themselves were very directional making a proper approach essential.
How well can subjects discriminate different LZ patterns? Subjects often needed to approach significantly closer to the target to identify it than to spot it. This is to be expected since detection of a light or a configuration of lights is a function of intensity and not resolution, whereas to identify the configuration requires spatial resolution of the pattern of lights. Thus, identification occurred at nearer distances (1.7-5.6km with NVG) where the lights could be resolved. Subjects reported that occlusion and merging of the lights as well as uncertainty in the number and layout hinder the ability to identify the configuration. Halo was judged to be minimal with these lights and at these distances and subjects did not feel halo was a limiting factor on LZ identification.
NVG judgment of landing zone orientation and ground slope was reported as more difficult than detection or identification. This is important since these judgments are used in the control of direction of approach and glideslope and this may indicate caution. Note that NVGs do improve visibility of the ground compared to unaided eye night vision. One pilot commented that he would prefer to overfly these nighttime LZ before attempting a landing. While prudent, this may be limiting in covert or time sensitive operations.
B.3.c Search Task Daytime search performance was high although people on the ground are difficult
to spot. Unaided nighttime search for small to medium sized targets (as oppose to say building-scale) was virtual impossible under the conditions of the flights. NVG aided vision enabled successful nighttime search. However search success rates and search times for finding at least 2/3 of the targets increased at night. Furthermore confidence decreased under night NVG-aided conditions compared to daylight conditions.
Observers noted that it is difficult to find people in the presence of cover/clutter even in daylight. At night (NVG-aided) this is compounded by loss of detail and confusion with trees especially if still. Complementary tools such as FLIR/thermal imaging and intelligence can be invaluable here. Anecdotally, we found that people lit up with visible (flashlight) or infrared markers were easily detected from the air using NVGs.
Subjects report that NVDs improve spatial awareness and ability to orient and this may lead to more effective search. Use of a head coupled imaging device such as NVDs allows for the use of an egocentric frame of reference when orienting and scanning the environment. Conversely, the limited field of view necessitates deliberate scan patterns that may interfere with normal search strategies.
B.4 Conclusions
Image intensified night vision devices offer significant benefits for nighttime search tasks over unaided vision. The improved detail and definition enables visual tasks that would otherwise be impossible without active illumination (and all for the use of
covert IR illumination). This potentially allows for increased safety, avoidance of inadvertent IMC, situational awareness and operational effectiveness. However the devices do not simply turn night into day and operators require vigilance and training for potential perceptual artifacts and human factors limitations [2-6]. We described techniques and results from a set of flights designed to evaluate these issues. The results of this study confirm that NVDs can provide significant operational value by improving nighttime visibility and allowing covert identification and tracking using infrared markers. Often the possibility for active lighting exists (e.g. visible or infrared nitesuns). However, the range of vision, and hence speed and operational range, is limited under active lighting and stealth is compromised. Infrared and thermal cameras are complementary technology sensitive to different wavelengths and environmental features. NVGs, FLIR and active lighting provide complementary functions and serve as useful tools in airborne law enforcement operations. These studies provide the basis for further research intended to support rational decision processes for the adoption and integration of NVD technology into law enforcement and related operations.
B.5 References [1] Craig, G., et al. Light source halos in Night Vision Goggles: Psychophysical assessments. 2005. Orlando, FL, United States:
International Society for Optical Engineering, Bellingham WA, WA 98227-0010, United States. [2] Rabin, J., Spatial Contrast Sensitivity through Aviators Night-Vision Imaging-System. Aviation Space and Environmental
Medicine, 1993. 64(8): p. 706-710. [3] Task, H.L. Night vision goggle visual acuity assessment: Results of an interagency test. 2001. Orlando, FL: Society of Photo-
Optical Instrumentation Engineers. [4] Braithwaite, M.G., et al., The hazard of spatial disorientation during helicopter flight using night vision devices. Aviation Space
and Environmental Medicine, 1998. 69(11): p. 1038-1044. [5] Estrera, J.P., et al. Modern Night Vision Goggles for Advanced Infantry Applications. 2003. Orlando, FL, United States: The
International Society for Optical Engineering. [6] Uttal, W.R. and R.W. Gibb, On the psychophysics of night vision goggles, in Interpreting remote sensing imagery: human
factors, R.R. Hoffman and A.B. Markam, Editors. 2001, Lewis Publishers: Boca Raton, FL. p. 117-136.
C. Probability Grid Mapping System for Aerial Search (PGM)
C.1 Introduction
Nature has provided humans with the ability to sense visual, auditory, olfactory, haptic and gustatory signals coupled with cognitive capabilities that allow decisions and behavioural responses to these stimuli. Despite this flexibility human perception and cognition is still limited in many ways [1]. For example, visible light represents only a small part of the electromagnetic spectrum and our field of view is limited.
Over the centuries we have developed aids to overcome sensory deficits (glasses and hearing aids) or to augment and extend our senses (e.g. telescopes, compasses or ultrasonic imagers). Until recently, these aids were designed primarily to enhance our sensory or motor capabilities and we have had less ability to enhance our cognitive capabilities [1]. The development of writing, maps, calculating instruments, mathematical tools and other aids certainly extend cognitive capabilities but real-time cognitive processing of sensory information remained largely unassisted. With the recent fusion of computer technology and personal digital technology, we can now develop and wear digital devices that mainly enhance our cognitive capabilities. Wearable computers and augmented reality offer a mobile user pervasive access to rich sources of information and tools to help manage and process that information [1].
C.2 Enhanced and Synthetic Vision
Augmented reality (AR) refers to the addition of synthetic components to visual, auditory or other sensory scenes, typically through specialised displays such as a see-through head mounted display (HMD). The addition of the computer generated entities is performed in such a way that they become perceptually integrated into the user’s perceptual ‘reality’. The user of such a system perceives and interacts with the real world, but has valuable additional information, such as descriptions of important features or instructions for performing physical tasks, superimposed on the world. For example, the computer could identify objects and overlay them with graphic outlines, labels and/or schematics [2]. Such techniques have proven effective in many domains including aviation [3], medicine [1,4], military training [1,5] and manufacturing [1].
Piloting an aircraft and working from an aerial platform can be demanding perceptual and cognitive tasks. Military aircraft pilots have relied on sophisticated sensors such as night vision and thermal imaging equipment to aid in their missions for decades. These capabilities have increasingly become available in civilian aviation especially in areas such as policing or search and rescue [6]. With the development of augmented reality technology, new systems have been developed for fixed- and rotary-wing aircraft that are known as enhanced synthetic vision systems. The goal of these systems is to augment and extend the pilot’s visual and cognitive capabilities based on data from other sensors, navigation instruments and geospatial databases.
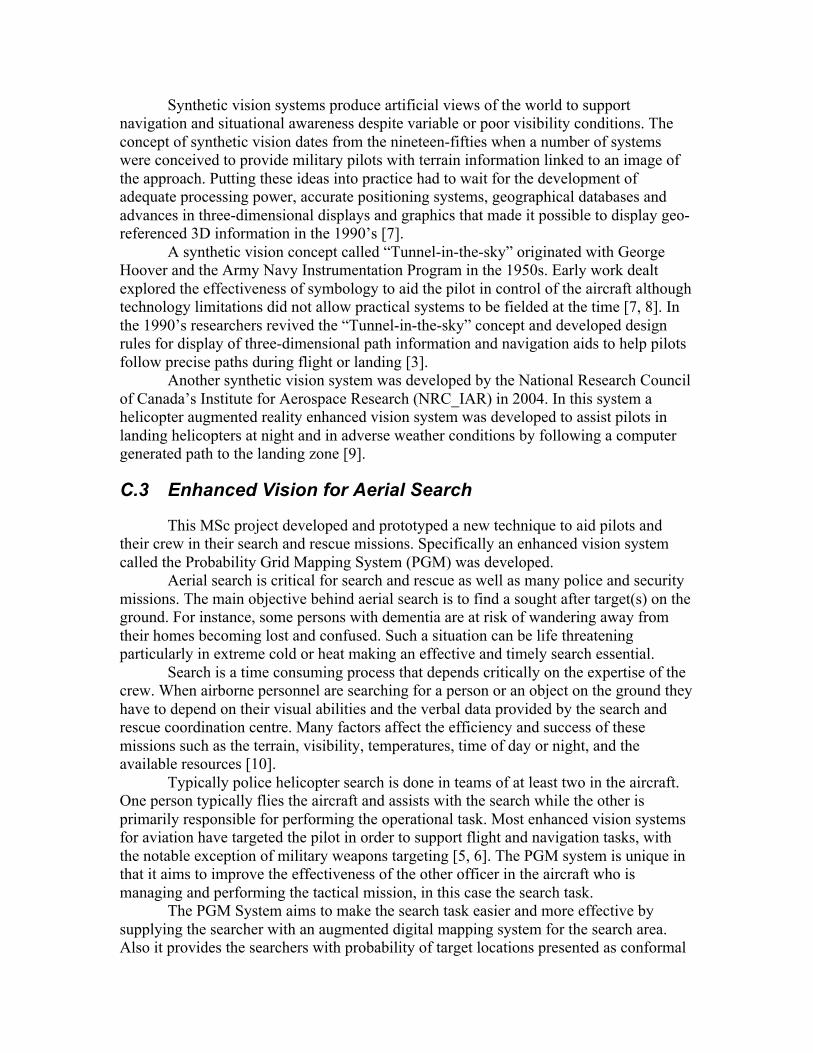
Synthetic vision systems produce artificial views of the world to support navigation and situational awareness despite variable or poor visibility conditions. The concept of synthetic vision dates from the nineteen-fifties when a number of systems were conceived to provide military pilots with terrain information linked to an image of the approach. Putting these ideas into practice had to wait for the development of adequate processing power, accurate positioning systems, geographical databases and advances in three-dimensional displays and graphics that made it possible to display geo-referenced 3D information in the 1990’s [7].
A synthetic vision concept called “Tunnel-in-the-sky” originated with George Hoover and the Army Navy Instrumentation Program in the 1950s. Early work dealt explored the effectiveness of symbology to aid the pilot in control of the aircraft although technology limitations did not allow practical systems to be fielded at the time [7, 8]. In the 1990’s researchers revived the “Tunnel-in-the-sky” concept and developed design rules for display of three-dimensional path information and navigation aids to help pilots follow precise paths during flight or landing [3].
Another synthetic vision system was developed by the National Research Council of Canada’s Institute for Aerospace Research (NRC_IAR) in 2004. In this system a helicopter augmented reality enhanced vision system was developed to assist pilots in landing helicopters at night and in adverse weather conditions by following a computer generated path to the landing zone [9].
C.3 Enhanced Vision for Aerial Search
This MSc project developed and prototyped a new technique to aid pilots and their crew in their search and rescue missions. Specifically an enhanced vision system called the Probability Grid Mapping System (PGM) was developed.
Aerial search is critical for search and rescue as well as many police and security missions. The main objective behind aerial search is to find a sought after target(s) on the ground. For instance, some persons with dementia are at risk of wandering away from their homes becoming lost and confused. Such a situation can be life threatening particularly in extreme cold or heat making an effective and timely search essential.
Search is a time consuming process that depends critically on the expertise of the crew. When airborne personnel are searching for a person or an object on the ground they have to depend on their visual abilities and the verbal data provided by the search and rescue coordination centre. Many factors affect the efficiency and success of these missions such as the terrain, visibility, temperatures, time of day or night, and the available resources [10].
Typically police helicopter search is done in teams of at least two in the aircraft. One person typically flies the aircraft and assists with the search while the other is primarily responsible for performing the operational task. Most enhanced vision systems for aviation have targeted the pilot in order to support flight and navigation tasks, with the notable exception of military weapons targeting [5, 6]. The PGM system is unique in that it aims to improve the effectiveness of the other officer in the aircraft who is managing and performing the tactical mission, in this case the search task.
The PGM System aims to make the search task easier and more effective by supplying the searcher with an augmented digital mapping system for the search area. Also it provides the searchers with probability of target locations presented as conformal

symbology. The probability is estimated by the search and rescue coordinator or equivalent on the ground prior to the flight. These estimates are based on data obtained about the situation. i.e. the last place the person was seen, areas already searched, etc. The map is displayed using a see-through Head Mounted Display (HMD) to superimpose it on a view of the real world.
C.4 Background
The PGM system is based on integrating geographically referenced symbology into an aviation AR system in the context of standard operating procedures for airborne search and rescue missions. This chapter describes the relevant background related to augmented reality, visual displays, terrain modeling and helicopter search and rescue techniques.
C.4.a Synthetic and Enhanced Vision Systems Augmented Reality (AR) involves enhancing or augmenting the user’s perception
of the real world. It supplements reality, rather than completely replacing it as in Virtual Reality [1, 2 and 5]. Ideally, in an AR environment, virtual and real objects coexist in the same space and merge together seamlessly. The enhancement can take the form of textual labels, symbology, virtual objects, or shading. Synthetic Vision (SVS) and Enhanced Vision (EVS) systems are specialised augmented reality systems that augment the real world with additional data about physical or logical features of the environment.
An enhanced vision system (EVS) combines computer-generated elements (graphics, outlines, labels or texts) with live imagery or sensor data (e.g. lidar imagery). The live image can be from imaging sensors or from direct views of the real world itself through the use of a head-up display (HUD) or a see-through HMD [11].
A synthetic vision system (SVS) uses navigation sensors along with data about the external world, for example terrain databases, to display a 3D perspective image to a user. In a pure SVS no real-time imagery is combined with the SV image. Thus, a SVS system is analogous to a VR system except that the user’s vantage point in the synthetic world matches their location and movement in the real world. Usually however the synthetic view is combined with a direct view of the real world or with an EV system [11]. Such a system is called an Enhanced and Synthetic Vision Systems (ESVS).
Since the generated EVS/SVS/ESVS imagery represents entities associated with a specific location in the real world, the virtual camera used in the rendering must accurately traverse the representation of the world based on incoming navigation sensor data [11]. The reference models and coordinate systems used in rendering affect the fidelity with which the synthetic world matches the real world. Minimizing registration errors is essential for useable SVS and EVS [11, 12].
C.4.b ESVS Head-mounted Image Display The graphical overlays in an ESVS system could be generated using stationary
monitors but is more typically displayed using a head-mounted display (HMD). A see-through HMD combines the overlays with an image of the real world providing a natural ‘first-person’ view of the world.
i) The History of See-Through HMD’s The first see-through head mounted display (HMD) system was developed in the
1960s by Ivan Sutherland and consisted a see-through stereoscopic display based on miniature CRTs and optical combiners to superimpose images of the displays with a view of the real world, a mechanical tracker to provide head position and orientation in real
time, and a hand-tracking device [1, 13]. The tracker was necessary to couple the synthetic view to the user’s viewpoint as they moved about.
The acronym HMD can also refer to helmet-mounted displays, where the display is attached to a military or aviator helmet. Notable systems include the HMD sighting system for the Cobra helicopter and the Integrated Helmet and Display Sighting System (IHADSS) used on the AH-64 Apache helicopter [9], both fielded by the US Army.
ii) The Characteristics of an Optical See-Through HMD Head-mounted display (HMD) designs may be classified as immersive or closed-
view, which block the direct real-world view, or see-through which allow synthetic augmentation of a view of the real world [5, 14]. Closed-view HMDs can be combined with head mounted image sensors to create a video see-through HMD.
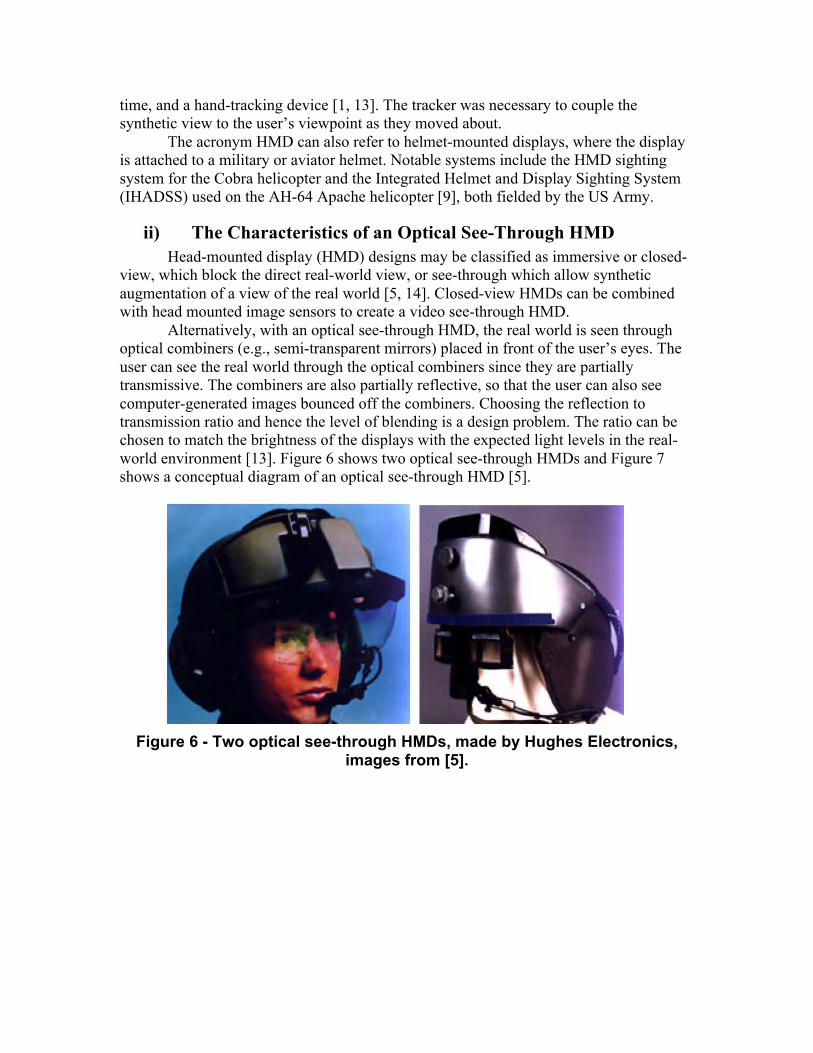
Alternatively, with an optical see-through HMD, the real world is seen through optical combiners (e.g., semi-transparent mirrors) placed in front of the user’s eyes. The user can see the real world through the optical combiners since they are partially transmissive. The combiners are also partially reflective, so that the user can also see computer-generated images bounced off the combiners. Choosing the reflection to transmission ratio and hence the level of blending is a design problem. The ratio can be chosen to match the brightness of the displays with the expected light levels in the real-world environment [13]. Figure 6 shows two optical see-through HMDs and Figure 7 shows a conceptual diagram of an optical see-through HMD [5].
Figure 6 - Two optical see-through HMDs, made by Hughes Electronics, images from [5].

Figure 7 -Optical see-through HMD conceptual diagram, reproduced from [5].
There are many advantages and disadvantages in using optical see-through HMDs
in augmented reality systems due to their characteristics. The major disadvantages of optical see-through HMDs are sensitivity to latency
and inability to support realistic occlusion. Latency or lag is the largest source of registration errors in most current HMD systems [13]. If the head moves in the presence of latency the synthetic imagery will not be immediately updated and will appear to move or ‘swim’ with respect to scene. Typically latency is minimized through system design [5, 13] and prediction is used to minimize the effects of head movements [1, 5]. However, sudden movements will still cause misregistration. In real life, an opaque object can block the view of another object so that part or all of it is not visible and occlusion is a compelling monocular depth cue. In computer graphics it is not a problem to generate virtual objects that occlude each other. However, it is more difficult to make real objects occlude virtual objects and vice versa since proper occlusion requires that the depth of real objects must be determined and, furthermore, real objects cannot be easily removed from the scene [13]. The synthetic images appear as semitransparent ghosts floating in front the real scene [15]. Finally, most existing optical see-through HMDs reduce the amount of the incoming light from the real world which can be an issue in low light situations.
Some of the major advantages of using optical see-through HMDs include safety, simplicity, and visual fidelity. From safety point of view the user still has a direct view of the real world even when the device fails or is not powered. Optical see-through displays have relatively simple structures and they are widely used [15]. Optical blending is simple and cost effective as there is only one stream of video to process and the images of the real world are from the eyes natural vantage point. Finally the real world image is preserved without any degradation except for a reduction in light levels. A resolution close to that obtained with the naked eye is provided and distortion is minimal [1, 5 and 13]. Similarly, the depth of field when viewing objects in the scene is not degraded and the eye can naturally focus on objects at various distances. For the graphical overlay, a
field of view of 20° to 60° is typical, which may appear somewhat limited. However, field of view for the real world image is not linked to the display size and can be relatively unrestricted (the user can use his/her peripheral vision around the device).
In contrast, in a video see-through display the resolution, field of view and depth of field is restricted by the camera and display characteristics and there needs to be compensation for the offset between the camera and eye vantage points. However, video and computer generated imagery can be matched for latency, focus and geometrical registration. Recovery of depth and structure of the real world is facilitated by having a video image and realistic occlusion is possible.
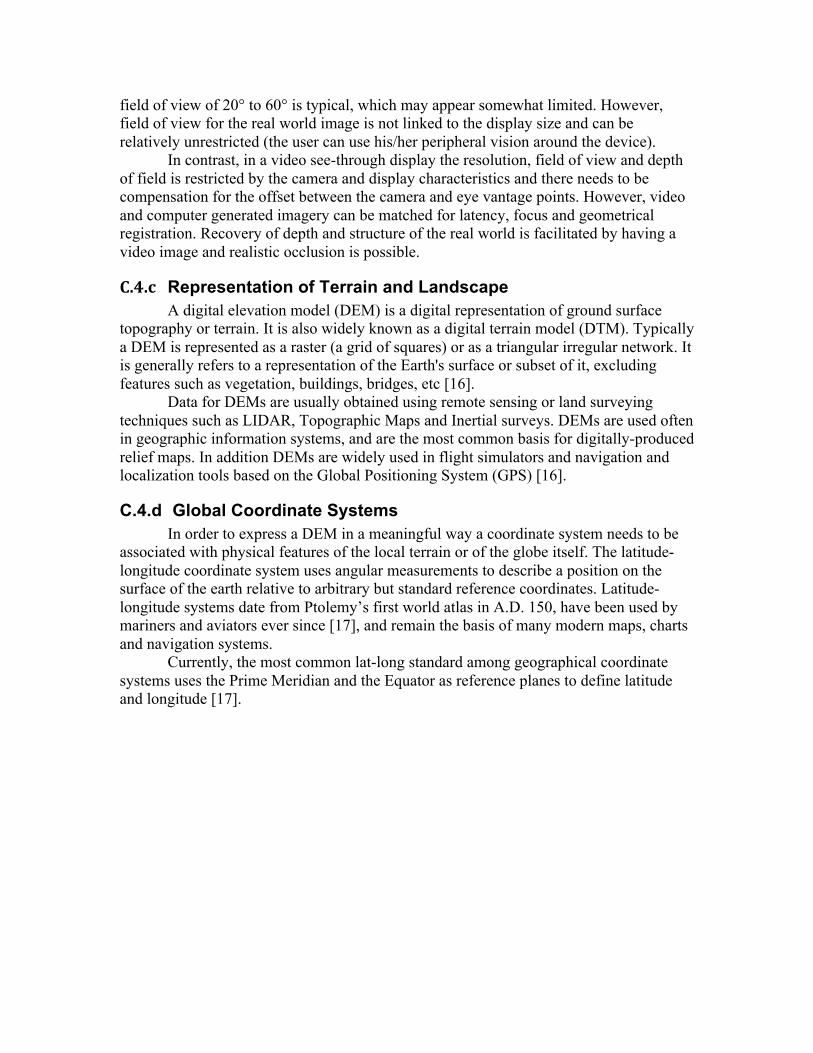
C.4.c Representation of Terrain and Landscape A digital elevation model (DEM) is a digital representation of ground surface
topography or terrain. It is also widely known as a digital terrain model (DTM). Typically a DEM is represented as a raster (a grid of squares) or as a triangular irregular network. It is generally refers to a representation of the Earth's surface or subset of it, excluding features such as vegetation, buildings, bridges, etc [16].
Data for DEMs are usually obtained using remote sensing or land surveying techniques such as LIDAR, Topographic Maps and Inertial surveys. DEMs are used often in geographic information systems, and are the most common basis for digitally-produced relief maps. In addition DEMs are widely used in flight simulators and navigation and localization tools based on the Global Positioning System (GPS) [16].
C.4.d Global Coordinate Systems In order to express a DEM in a meaningful way a coordinate system needs to be
associated with physical features of the local terrain or of the globe itself. The latitude-longitude coordinate system uses angular measurements to describe a position on the surface of the earth relative to arbitrary but standard reference coordinates. Latitude-longitude systems date from Ptolemy’s first world atlas in A.D. 150, have been used by mariners and aviators ever since [17], and remain the basis of many modern maps, charts and navigation systems.
Currently, the most common lat-long standard among geographical coordinate systems uses the Prime Meridian and the Equator as reference planes to define latitude and longitude [17].
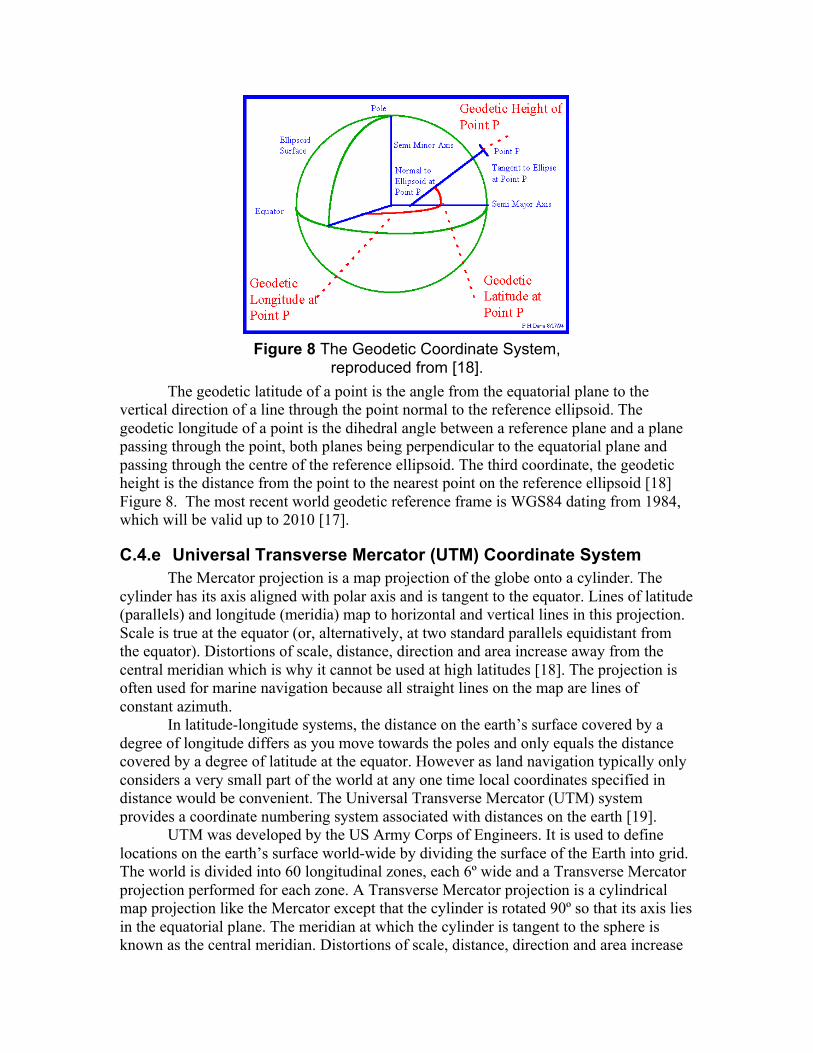
The geodetic latitude of a point is the angle from the equatorial plane to the vertical direction of a line through the point normal to the reference ellipsoid. The geodetic longitude of a point is the dihedral angle between a reference plane and a plane passing through the point, both planes being perpendicular to the equatorial plane and passing through the centre of the reference ellipsoid. The third coordinate, the geodetic height is the distance from the point to the nearest point on the reference ellipsoid [18] Figure 8. The most recent world geodetic reference frame is WGS84 dating from 1984, which will be valid up to 2010 [17].
C.4.e Universal Transverse Mercator (UTM) Coordinate System The Mercator projection is a map projection of the globe onto a cylinder. The
cylinder has its axis aligned with polar axis and is tangent to the equator. Lines of latitude (parallels) and longitude (meridia) map to horizontal and vertical lines in this projection. Scale is true at the equator (or, alternatively, at two standard parallels equidistant from the equator). Distortions of scale, distance, direction and area increase away from the central meridian which is why it cannot be used at high latitudes [18]. The projection is often used for marine navigation because all straight lines on the map are lines of constant azimuth.
In latitude-longitude systems, the distance on the earth’s surface covered by a degree of longitude differs as you move towards the poles and only equals the distance covered by a degree of latitude at the equator. However as land navigation typically only considers a very small part of the world at any one time local coordinates specified in distance would be convenient. The Universal Transverse Mercator (UTM) system provides a coordinate numbering system associated with distances on the earth [19].
UTM was developed by the US Army Corps of Engineers. It is used to define locations on the earth’s surface world-wide by dividing the surface of the Earth into grid. The world is divided into 60 longitudinal zones, each 6º wide and a Transverse Mercator projection performed for each zone. A Transverse Mercator projection is a cylindrical map projection like the Mercator except that the cylinder is rotated 90º so that its axis lies in the equatorial plane. The meridian at which the cylinder is tangent to the sphere is known as the central meridian. Distortions of scale, distance, direction and area increase
Figure 8 The Geodetic Coordinate System, reproduced from [18].
away from the central meridian [18]. In UTM, a Transverse Mercator projection is defined for each longitudinal zone with the central meridian of the projection aligned with the centre of each longitudinal strip. Use of a separate projection for each strip minimizes distortion since all projections are centred on the area of interest. Currently, the WGS84 ellipsoid is used as the underlying model of the Earth in the UTM coordinate system [18, 19].
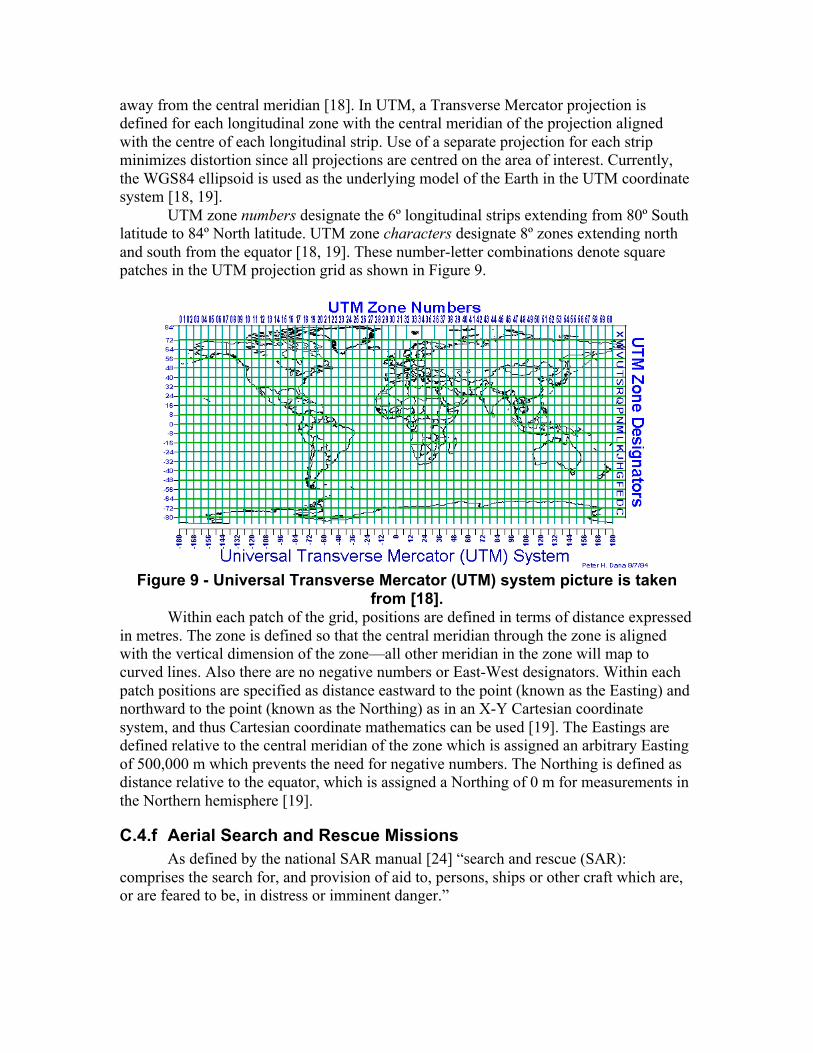
UTM zone numbers designate the 6º longitudinal strips extending from 80º South latitude to 84º North latitude. UTM zone characters designate 8º zones extending north and south from the equator [18, 19]. These number-letter combinations denote square patches in the UTM projection grid as shown in Figure 9.
Figure 9 - Universal Transverse Mercator (UTM) system picture is taken
from [18]. Within each patch of the grid, positions are defined in terms of distance expressed
in metres. The zone is defined so that the central meridian through the zone is aligned with the vertical dimension of the zone—all other meridian in the zone will map to curved lines. Also there are no negative numbers or East-West designators. Within each patch positions are specified as distance eastward to the point (known as the Easting) and northward to the point (known as the Northing) as in an X-Y Cartesian coordinate system, and thus Cartesian coordinate mathematics can be used [19]. The Eastings are defined relative to the central meridian of the zone which is assigned an arbitrary Easting of 500,000 m which prevents the need for negative numbers. The Northing is defined as distance relative to the equator, which is assigned a Northing of 0 m for measurements in the Northern hemisphere [19].
C.4.f Aerial Search and Rescue Missions As defined by the national SAR manual [24] “search and rescue (SAR):
comprises the search for, and provision of aid to, persons, ships or other craft which are, or are feared to be, in distress or imminent danger.”

Any SAR mission aims to prevent loss of life and injury; also it aims to minimize damage to or loss of property if possible. SAR operations in Canada are divided into two categories; aeronautical SAR and maritime SAR [10].
Success of guidance system such as PGM that is based on estimates of a priori search probabilities depends on the reliability of those estimates. When initiating a SAR operation, controllers must make a series of timely and critical decisions including development of a plan for the SAR mission proper [20].
The search planning task includes the determination of the last known position, developing a plan that maximizes effort allocation, selecting search patterns and track spacing to achieve suitable area coverage [10, 20]. Data for estimation of the priorities (the last reported position, a confirmed sighting, a radar image, etc.) have limitations, bias and imprecision [10]. In searches for lost persons, the search planners rely heavily on lost person behaviour profiles and statistics for developing search priorities. The search area is defined by empirically derived statistics that give probabilities for distanced travelled from last known position [21, 22] and limited by any geographical features that may make travel impossible or unlikely. Finally, analysis of the subject's behavioural profile, past incidents, and any intelligence delineate the most likely area [21]. The profiles include “hunters, hikers, children (by age group), the mentally retarded, berry pickers and the elderly” [22].
C.5 Probability Grid Mapping System for Aerial Search (PGM)
C.5.a PGM System Concept The Probability Grid Mapping System (PGM) aims to make the search task easier
and more effective by supplying the searcher with an augmented digital mapping system for the search area. The goal of PGM is to superimpose indicators of search probability directly onto the user’s view of the real world as they search. The symbology is conformal and geographically referenced so that it remains fixed to the appropriate portion of the real world terrain as the aircraft travels or pilot moves their head.
The goal is to have markers to direct the searchers’ scanning activity without obstructing their view of the terrain to be searched. Ideally, these markers would reflect both the a priori search estimates and be dynamically updated to reflect the probability of finding the target in given areas as they are covered and searched during the flight. By presenting the symbology in an ESVS display, the searcher can automatically associate markers that code the search priorities with physical locations.
This augmented reality can help guide the searcher’s scan behaviour to high probability regions by providing fixation cues and visual highlights that draw attention. Presenting the display as a geo-referenced augmented reality also avoids the need to look, interpret and transform data presented on traditional paper maps or 2-D moving map displays into coordinates in the scene viewed out the window.
The view of the real world can be either direct as in the current implementation or could be itself an ESVS display based on sensors such as LIDAR, infrared cameras and other sensors.
Challenges in implementing this vision include the typical challenges of effective and precise augmented reality—tracking, latency, registration, world modeling, and so on—as well as the requirements of effective highlighting of the areas to be searched
without interfering with the search process within those areas. This report describes a prototype implementation that embodies much of the PGM concept for evaluation of the concepts in both simulation and in real aircraft.
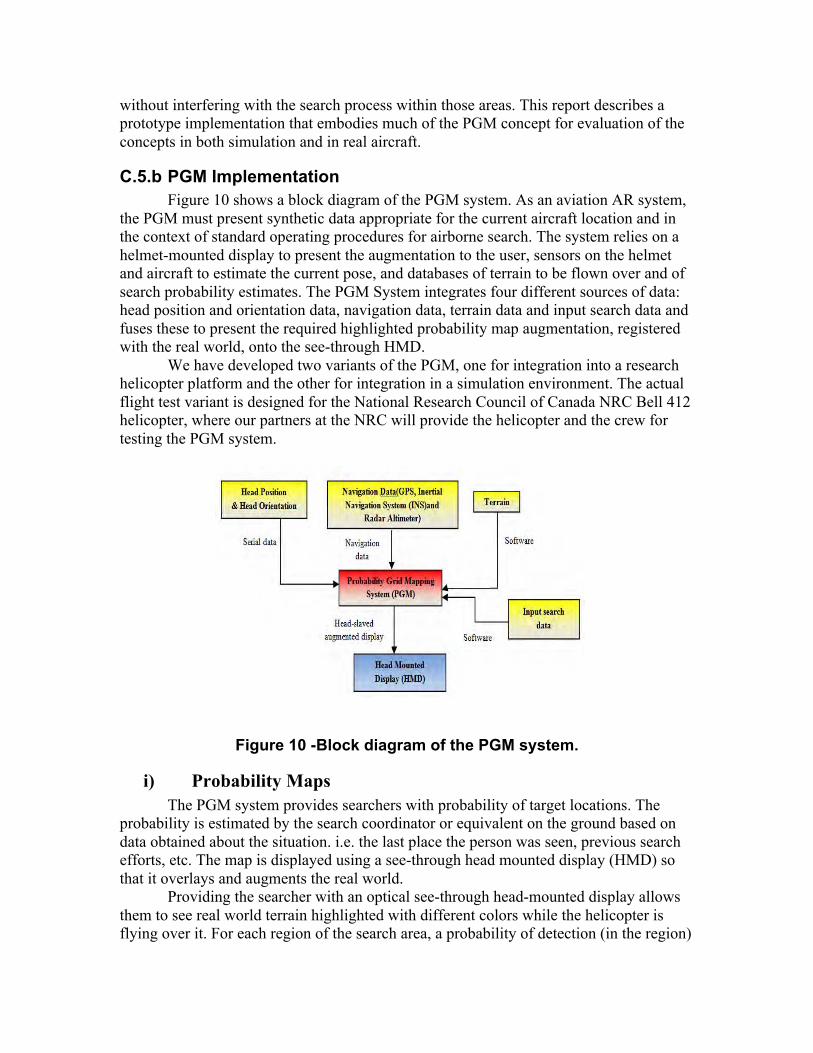
C.5.b PGM Implementation Figure 10 shows a block diagram of the PGM system. As an aviation AR system,
the PGM must present synthetic data appropriate for the current aircraft location and in the context of standard operating procedures for airborne search. The system relies on a helmet-mounted display to present the augmentation to the user, sensors on the helmet and aircraft to estimate the current pose, and databases of terrain to be flown over and of search probability estimates. The PGM System integrates four different sources of data: head position and orientation data, navigation data, terrain data and input search data and fuses these to present the required highlighted probability map augmentation, registered with the real world, onto the see-through HMD.
We have developed two variants of the PGM, one for integration into a research helicopter platform and the other for integration in a simulation environment. The actual flight test variant is designed for the National Research Council of Canada NRC Bell 412 helicopter, where our partners at the NRC will provide the helicopter and the crew for testing the PGM system.
Figure 10 -Block diagram of the PGM system.
i) Probability Maps The PGM system provides searchers with probability of target locations. The
probability is estimated by the search coordinator or equivalent on the ground based on data obtained about the situation. i.e. the last place the person was seen, previous search efforts, etc. The map is displayed using a see-through head mounted display (HMD) so that it overlays and augments the real world.
Providing the searcher with an optical see-through head-mounted display allows them to see real world terrain highlighted with different colors while the helicopter is flying over it. For each region of the search area, a probability of detection (in the region)
is estimated and the colours are assigned to code the likelihood of detection in the area. Table 1 illustrates the five different colors currently used in the PGM system with their probability ranks. Table1. The priority of the search area in the PGM system is displayed using one of the different colors. Red indicates the highest priority search area.
Probability Ranks
Color
1 Red 2 Yellow 3 Pink 4 Orange 5 Purple
These colours were chosen based on their ease of discrimination from natural
vegetation and terrain colouring. The probability ranks could be interpreted literally as the expected likelihood of finding the target within the coloured area. Alternatively, the rankings can indicate degree of coverage in previous search (i.e., red indicates 0-15% coverage with 85% of the area unsearched previously). Most often the rankings will represent relative likelihood of finding the target in the various areas – for instance on a scale from 1 to 5. In any case, a higher probability ranking indicates a higher priority for searching the specified area.
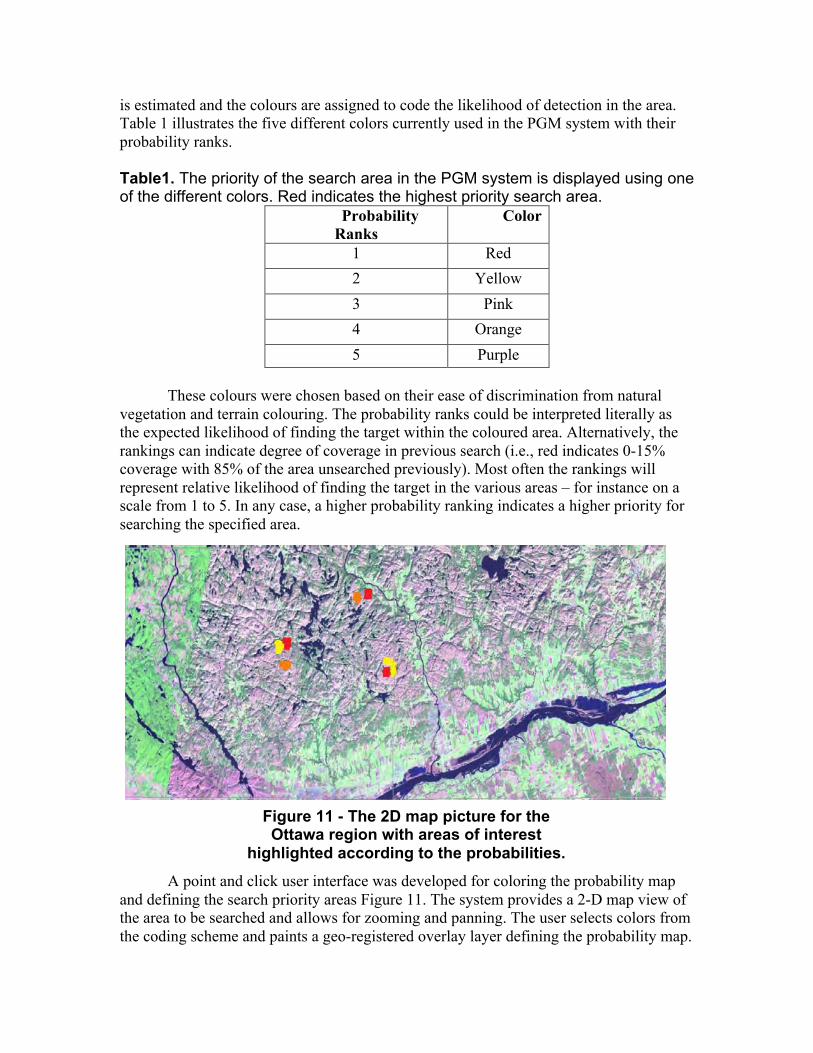
A point and click user interface was developed for coloring the probability map and defining the search priority areas Figure 11. The system provides a 2-D map view of the area to be searched and allows for zooming and panning. The user selects colors from the coding scheme and paints a geo-registered overlay layer defining the probability map.
Figure 11 - The 2D map picture for the Ottawa region with areas of interest
highlighted according to the probabilities.

This overlay is then exported to the serve as the input probability grid for the PGM system.
ii) Terrain Data Repository The PGM symbology is overlaid and conforms to the terrain traversed. To register
and align the symbology with the appropriate part of the scene, the system needs an accurate terrain model. In the PGM system this is provided by a repository of terrain data in the form of digital elevation models (DEM). Typically a DEM is represented as elevation samples along a raster (a grid of squares) or as a triangular irregular network. It represents the elevation and contour of the surface of the earth and usually excludes features such as vegetation, buildings, bridges, etc [16]. DEMs are widely used to represent terrain shape in flight simulators and navigation and localization tools based on the Global Positioning System (GPS) [16].
The Universal Transverse Mercator (UTM) coordinate system is used in PGM as use of a separate projection for each strip minimizes distortion and grid positions are defined in terms in Catersian coordinates (see Section 2.4).
The DEM used in the PGM system is provided by Geobase Canada (www.geobase.ca). For our experiments we used data from the Ottawa region (Geobase sections 031G11 and 031G12). The Canadian Digital Elevation Data (CDED) consists of an ordered array of ground elevations at regularly spaced intervals. The DEM map was converted to ESRI ASCII grid known as ARC/INFO ASCII grid which holds the geodetic data in UTM format.
iii) Motion Tracking and Pose Estimation The Bell 412 helicopter is equipped with a differential GPS receiver integrated
with an Inertial Navigation System (INS) and radar altimeter that provide the necessary geodetic data to specify the helicopter location. The flight computer estimates navigational data (a NovAtel model 3151M OEM GPS card receiver, Micropack IMU, LN-200 IMUs and medium accuracy LTN-90-100 [23]) and passes navigation data packets over Ethernet. The PGM is designed to receive these packets to obtain the current aircraft position and orientation in world coordinates so that the terrain digital elevation map can be aligned with current aircraft position.
In the simulation environment, the INS packets are generated by running an instance of the open-source flight simulator Flightgear, augmented with a custom GPS sender interface. The simulator runs on a separate Linux-based computer than the PGM and sends simulated navigation packets appropriate for current aircraft position to the PGM system via Ethernet. Thus, in both simulator and real aircraft cases, identical PGM software processes incoming navigation data to update the displayed 3-D map so that it is aligned and appropriate for the current position in the scene.
Since the display is head mounted, the displayed scene must be updated to reflect the user’s head pose for the synthetic imagery to be correctly registered with the scene. For the simulation environment we use an IS900 hybrid acoustic-inertial six degree of freedom (6DOF) position and orientation tracking system to track the head movements. In the aircraft, the acousto-inertial tracker is not feasible and a 6DOF Laser BIRD 2 head tracker Figure 12 is used to track the head position and orientation relative to the cockpit [24]. Both devices use a similar protocol interface and appear equivalent to the software.
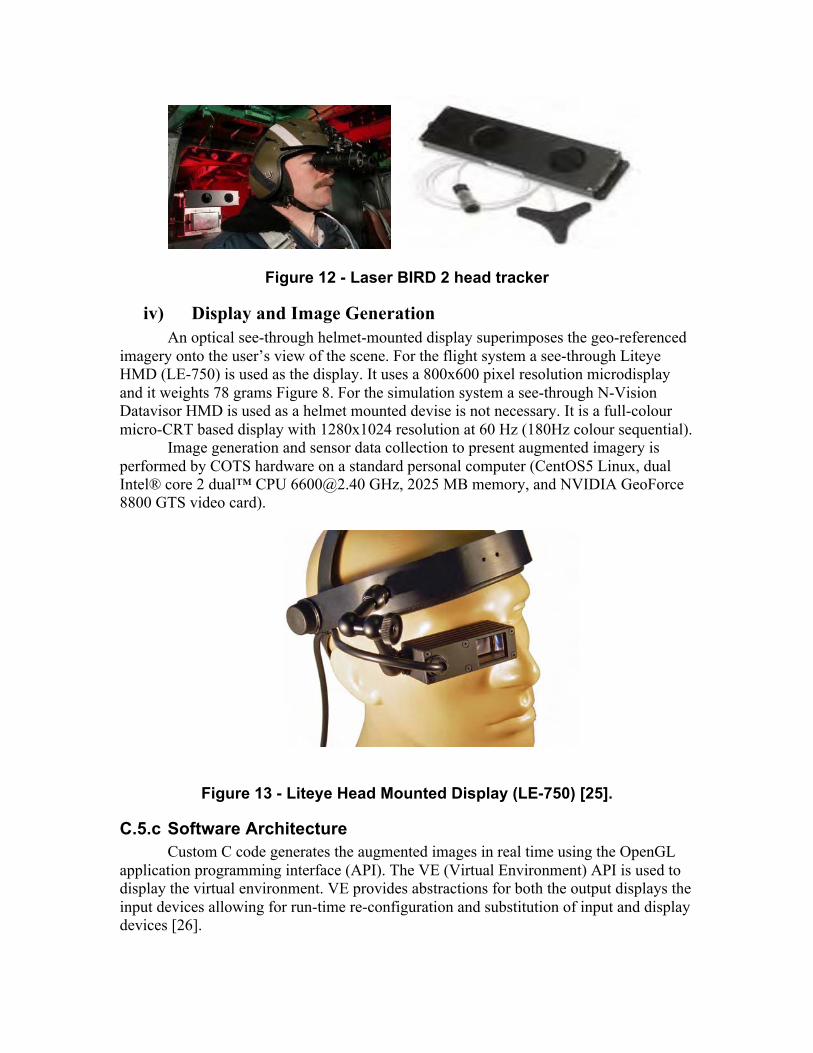
Figure 12 - Laser BIRD 2 head tracker
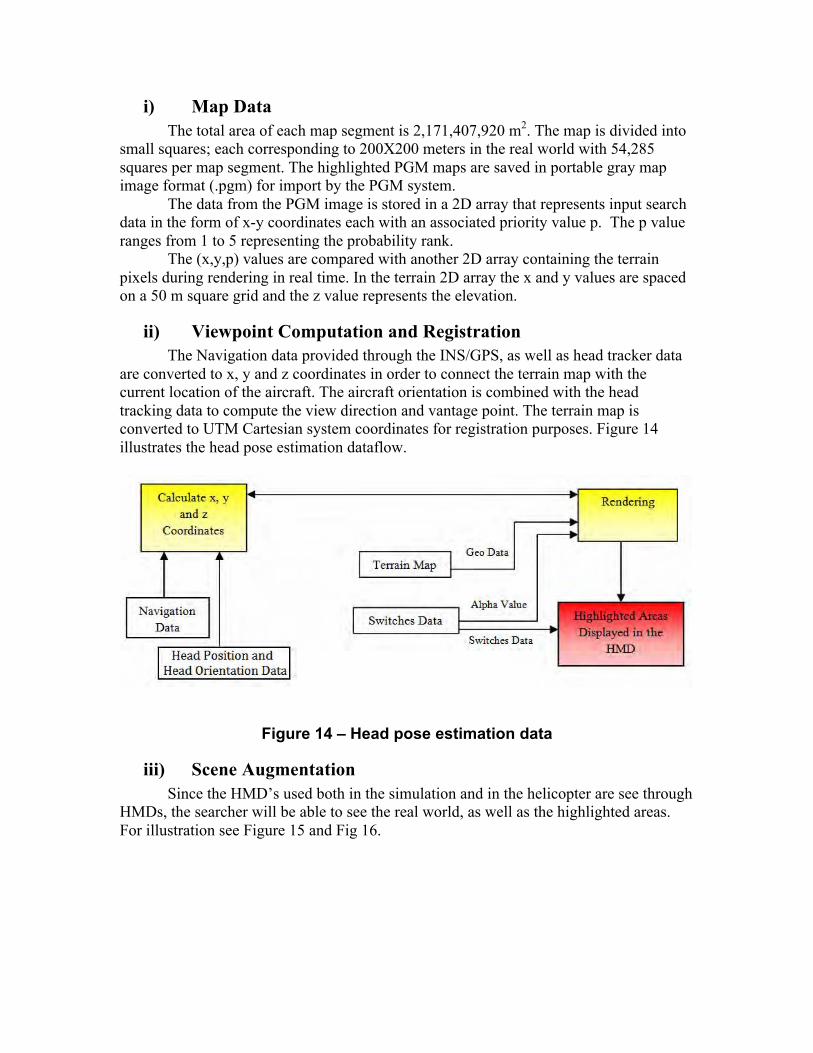
iv) Display and Image Generation An optical see-through helmet-mounted display superimposes the geo-referenced
imagery onto the user’s view of the scene. For the flight system a see-through Liteye HMD (LE-750) is used as the display. It uses a 800x600 pixel resolution microdisplay and it weights 78 grams Figure 8. For the simulation system a see-through N-Vision Datavisor HMD is used as a helmet mounted devise is not necessary. It is a full-colour micro-CRT based display with 1280x1024 resolution at 60 Hz (180Hz colour sequential).
Image generation and sensor data collection to present augmented imagery is performed by COTS hardware on a standard personal computer (CentOS5 Linux, dual Intel® core 2 dual™ CPU [email protected] GHz, 2025 MB memory, and NVIDIA GeoForce 8800 GTS video card).
Figure 13 - Liteye Head Mounted Display (LE-750) [25].
C.5.c Software Architecture Custom C code generates the augmented images in real time using the OpenGL
application programming interface (API). The VE (Virtual Environment) API is used to display the virtual environment. VE provides abstractions for both the output displays the input devices allowing for run-time re-configuration and substitution of input and display devices [26].
i) Map Data The total area of each map segment is 2,171,407,920 m2. The map is divided into
small squares; each corresponding to 200X200 meters in the real world with 54,285 squares per map segment. The highlighted PGM maps are saved in portable gray map image format (.pgm) for import by the PGM system.
The data from the PGM image is stored in a 2D array that represents input search data in the form of x-y coordinates each with an associated priority value p. The p value ranges from 1 to 5 representing the probability rank.
The (x,y,p) values are compared with another 2D array containing the terrain pixels during rendering in real time. In the terrain 2D array the x and y values are spaced on a 50 m square grid and the z value represents the elevation.
ii) Viewpoint Computation and Registration The Navigation data provided through the INS/GPS, as well as head tracker data
are converted to x, y and z coordinates in order to connect the terrain map with the current location of the aircraft. The aircraft orientation is combined with the head tracking data to compute the view direction and vantage point. The terrain map is converted to UTM Cartesian system coordinates for registration purposes. Figure 14 illustrates the head pose estimation dataflow.
Figure 14 – Head pose estimation data
iii) Scene Augmentation Since the HMD’s used both in the simulation and in the helicopter are see through
HMDs, the searcher will be able to see the real world, as well as the highlighted areas. For illustration see Figure 15 and Fig 16.
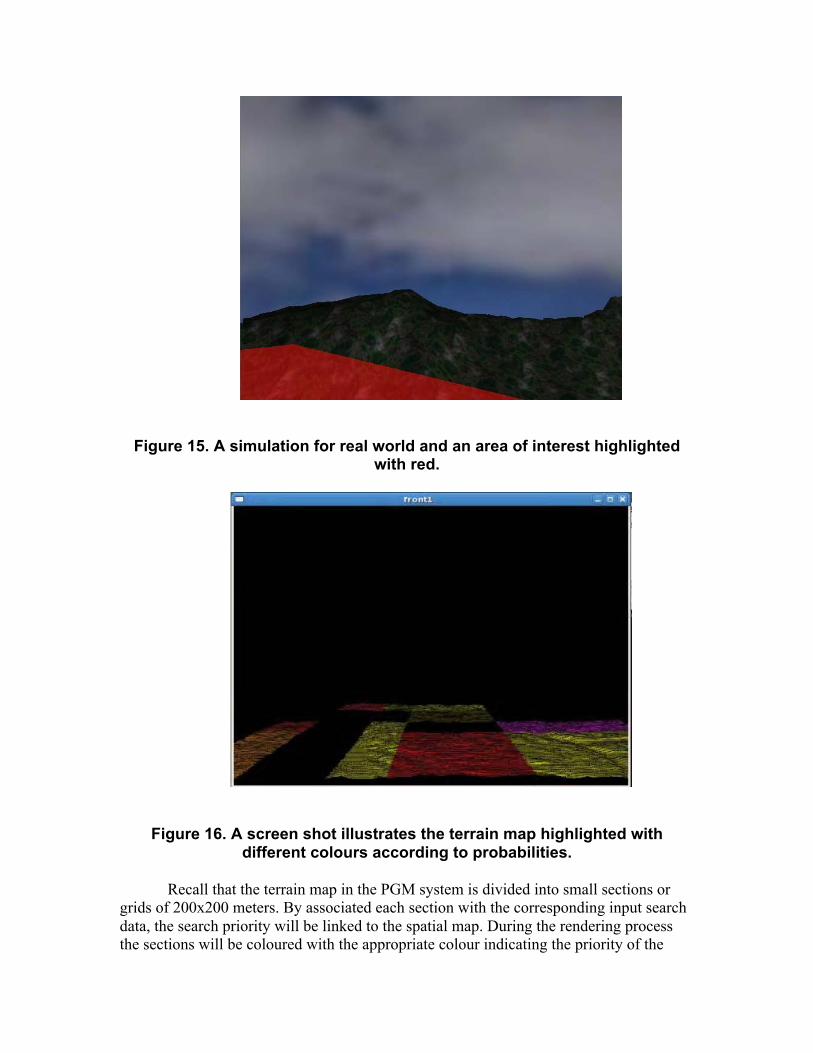
Figure 15. A simulation for real world and an area of interest highlighted with red.
Figure 16. A screen shot illustrates the terrain map highlighted with different colours according to probabilities.
Recall that the terrain map in the PGM system is divided into small sections or
grids of 200x200 meters. By associated each section with the corresponding input search data, the search priority will be linked to the spatial map. During the rendering process the sections will be coloured with the appropriate colour indicating the priority of the
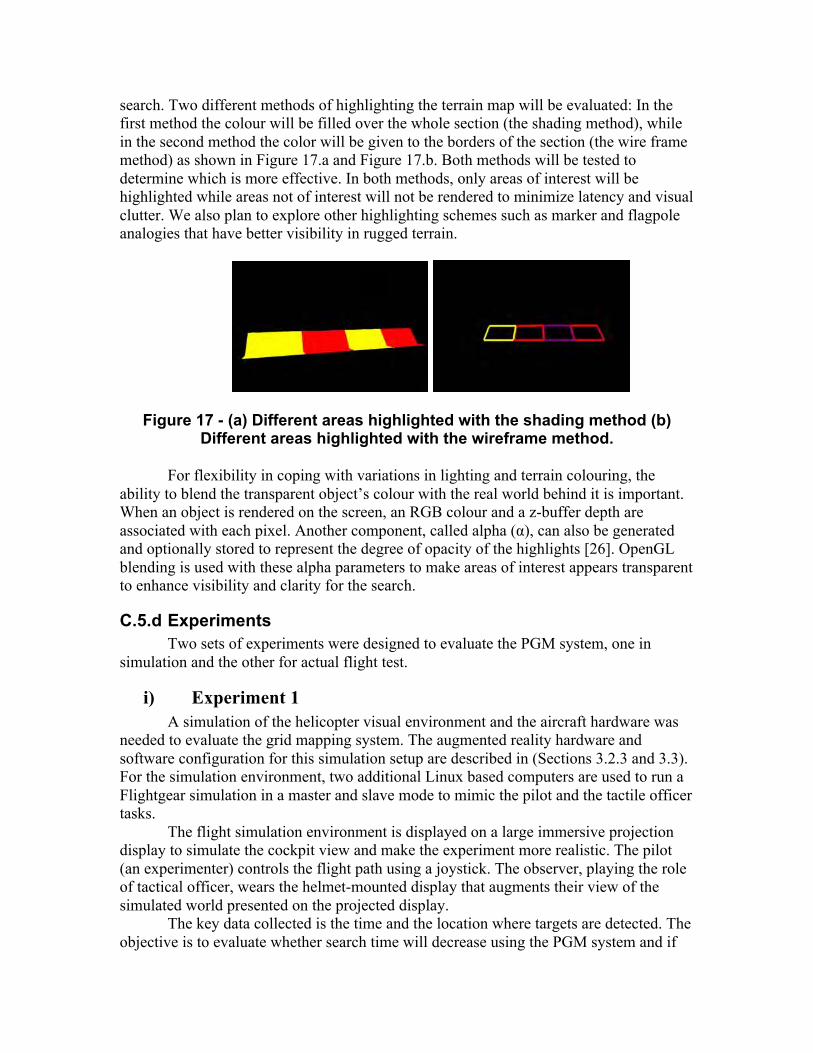
search. Two different methods of highlighting the terrain map will be evaluated: In the first method the colour will be filled over the whole section (the shading method), while in the second method the color will be given to the borders of the section (the wire frame method) as shown in Figure 17.a and Figure 17.b. Both methods will be tested to determine which is more effective. In both methods, only areas of interest will be highlighted while areas not of interest will not be rendered to minimize latency and visual clutter. We also plan to explore other highlighting schemes such as marker and flagpole analogies that have better visibility in rugged terrain.
Figure 17 - (a) Different areas highlighted with the shading method (b) Different areas highlighted with the wireframe method.
For flexibility in coping with variations in lighting and terrain colouring, the
ability to blend the transparent object’s colour with the real world behind it is important. When an object is rendered on the screen, an RGB colour and a z-buffer depth are associated with each pixel. Another component, called alpha (α), can also be generated and optionally stored to represent the degree of opacity of the highlights [26]. OpenGL blending is used with these alpha parameters to make areas of interest appears transparent to enhance visibility and clarity for the search.
C.5.d Experiments Two sets of experiments were designed to evaluate the PGM system, one in
simulation and the other for actual flight test.
i) Experiment 1 A simulation of the helicopter visual environment and the aircraft hardware was
needed to evaluate the grid mapping system. The augmented reality hardware and software configuration for this simulation setup are described in (Sections 3.2.3 and 3.3). For the simulation environment, two additional Linux based computers are used to run a Flightgear simulation in a master and slave mode to mimic the pilot and the tactile officer tasks.
The flight simulation environment is displayed on a large immersive projection display to simulate the cockpit view and make the experiment more realistic. The pilot (an experimenter) controls the flight path using a joystick. The observer, playing the role of tactical officer, wears the helmet-mounted display that augments their view of the simulated world presented on the projected display.
The key data collected is the time and the location where targets are detected. The objective is to evaluate whether search time will decrease using the PGM system and if
b

so by how much. Also it allows evaluation of the probability of detection for the searcher and false positive rates under the various conditions. The essential question is whether the efficiency of the search will improve with the augmentation. The observer indicates the locations and the time when finding a target with button presses on another joystick.
A four-level between-subject design will be used (i.e., four groups of ten participants each). Each participant will participate in one session; the length of the session is approximately half an hour. All groups will be given a 2D paper map of the search area. The first group of participants will also use the PGM system with the shaded method through the HMD. The second group will see the PGM system with the wireframe method through the HMD. The third group will not use the PGM system and will be only given the 2D paper map with no areas highlighted. The fourth group will not use the PGM system and they will be given the 2D paper map but with areas highlighted on it.
Each participant will be given the same scenario about the missing targets, the target sizes and colours will be different e.g. people, cars, pets, etc. When a participant sees a target he/she will be asked to push a button on the joystick at the moment of the detection. The pilot will then approach and hover over the target and if the observer confirms that it is true target he/she will push another button (discrimination task). Each time a button is pushed the navigation data and the time will be recorded. Also information about which target was found will be manually recorded by the experimenter.
ii) Experiment 2 In experiment 2, an analogous experiment will be run in the real aircraft. The
searcher will perform one or more sessions from the between group conditions described in experiment 1. The 2D static maps will be displayed on a head down display placed in the center of the instrument panel. Time and cost will significantly limit the number of trials so we will choose the most important conditions based on the simulation experiments. The searcher will be asked to flick one of the toggle switches on the helicopter collective stick up in the detection task and down in the discrimination task Figure 18. As in the simulation the navigation data and the time will be recorded. Also the information about the target type will be recorded.
Figure 18 - The switches in Bell 412 helicopter which will be used in the detection and discrimination process.
C.6 Discussion
When cueing visual search, one must decide how to weight a priori estimates in light of the inherent trade-off between the cost/benefits of accurate and inaccurate cueing. If probabilities are highly inaccurate, then cueing is counter-productive. Accurate cueing facilitates detection and reduces search time but at the same time produces two sorts of costs. First, it raises awareness to targets in high probability zones which may lead to both more hits and also more false alarms. Second, cueing draws attention towards high priority zones and away from low (but not zero) probability zones. This attentional bias has been shown to reduce the detection of unexpected targets in the environment[27].
A related issue is the attentional demands of the HMD itself due to reduced field of view and cognitive tunneling driven by attentional to the task relevant display. Cognitive tunneling can be reduced by explicitly directing attention to critical information in the real world [27]. The use of see-through HMD has the benefit of reduce scanning and geo-registration while accessing information but with some reduced visibility of the real world due to overlay or the image combiner.
The PGM system is a novel ESVS system concept that aims to improve the effectiveness of airborne personnel that are not flying the aircraft. In security applications the system is intended to aid the other officer in the aircraft who is managing and performing the tactical mission.
PGM is specifically intended for guided aerial search. The PGM helps the searcher by guiding his scan behaviour to high probability regions through augmented reality markers.
By presenting the markers as a geo-referenced augmented reality the system aims to avoid the need for cognitively demanding tasks of interpreting and transforming the data presented on traditional maps.
The PGM system could be applied in the future to night vision systems, permitting a similar augmented capability at night.
C.7 References [7] J. P. Rolland and H. Fuchs. ‘‘Optical versus video seethrough head-mounted displays,’’ in Fundamentals of Wearable
Computers and Augmented Reality, W. Barfield and T. Caudell, eds. (Erlbaum, Mahwah, N.J., 2001, pp. 113–156. [8] C. Jennings, A. K. Barrows,, K. Alter, And J. D. Powell. “Synthetic vision displays instrument landings and traffic awareness-
development and flight testing,” IEEE Philadelphia, PA, USA, vol. 1, pp. 2A2/1-2A2/8, 2000. [9] W. A. Hoff, ,and K. Nguyen.. “Computer vision-based registration techniques for augmented reality,” proceeding of Intellegent
Robots and Computer Vision XV, vol. 2904, pp. 18-22, November 1996 [Boston, MA, pp. 538-548.] [10] M. Rosenthal, A. State, H. Lee, G. Hirota, J. Ackerman, K. Keller, E. D. Pisano, M. Jiroutek, K. Muller and H. Fuchs.
“Augmented reality guidance for needle biopsies: An initial randomized controlled trial in phantoms,” Medical Image Analysis, vol. 6, no. 3, pp. 313-320, 2002.
[11] R. T. Azuma. “A survey of augmented reality,” Presence Teleoperators and Virtual Environments, vol. 6, no. 4, pp. 355-385, 1997.
[12] Young, R. Warren and the editors of Time-Life Books. “The Helicopters,” Time-Life Books, Alexandria, Virginia. 1982. [13] E. Theunissen, and M. Mulder. “Open and closed loop control with a perspective tunnel-in-the-sky display”. AIAA Flight
simulation technologies conference, Scottsdale, pp. 32-42, August 1-3, 1994. [14] S. Julier, M. Lanzagarto, Y. Baillot, L. Rosenblum, and S. Feiner. “Information filtering for mobile augmented reality,” IEEE
Int’l Symp. Augmented Reality, pp. 3-11, 2000. [15] “New virtual-reality helmets designed to help save more lives-Canada,”
http://www.ncerce.gc.ca/media/success/geoide99204_e.htm captured on April 28th, 2009. [16] B–GA–209–001/FP–001 DFO 5449, “National SAR manual,” May 2000. [17] A. K. Barrows, Nav3D Corp., Palo Alto, CA, USA; Registration of synthetic vision imagery: issues and pitfalls. In Proceeding
the 21st Digital Avionics Systems Conference, Vol. 2, pp. 11C3-1- 11C3-10, 2002.
[18] G. D. Hines, Rahman Zia-ur, D. J. Jobson, G. A. Woodell, S. D. Harrah, AA(NASA Langley Research Ctr. (USA)), AB(College of William & Mary (USA)), AC(NASA Langley Research Ctr. (USA)), AD(NASA Langley Research Ctr. (USA)), AE(NASA Langley Research Ctr. (USA)), “Real-time enhanced vision system.” In Proceedings of the SPIE, Vol. 5802, pp. 127-134, 2005.
[19] J. P. Rolland, R. L. Holloway, and H. A. Fuchs, “A comparison of optical and video see-through head-mounted displays.” In Proceedings of the SPIE, Vol. 2351-35, 1994.
[20] J. P. Rolland, and H. Hua, “Head-mounted display systems.” In Encyclopedia of Optical Engineering, R. B. Johnson and R. G. Driggers, eds. Dekker, 2005, pp. 1–13.
[21] K. Kiyokawa, Y. Kurata, and H. Ohno, “An Optical See-through Display for Mutual Occlusion of Real and Virtual Environments.” In Proceedings of the Int"l Symp. Augmented Reality 2000 (ISAR 00), IEEE CS Press, Los Alamitos, Calif., 2000, pp. 60-67.
[22] J. P. Wilson, J. C. Gallant, “Terrain Analysis: Principles and Applications.” pp. 1–27, 2000. [23] National Imagery and Mapping Agency. Department of Defence, NIMA Technical Report TR8350.2, “World Geodetic System
1984: Its Definition and Relationships with Local Geodetic Systems.” Third Edition 4 July 1997. Bethesda, MD: National Imagery and Mapping Agency.
[24] P. H. Dana, “Entries: National Map Accuracy Standards (NMAS), 304-305, Projection, 348-351, Universal Transverse Mercator (UTM), 497-498”. In Encyclopedia of Geographic Information Science. Ed. Karen K. Kemp. Los Angeles: Sage Publications, 2008.
[25] J. P. Snyder, “Map Projections - A Working Manual. U.S. Geological Survey Professional Paper 1395.” United States Government Printing Office, Washington, D.C., 1987.
[26] I. Abi-Zeid, Q. Yang, and L. Lamontangne, “Is CBR applicable to the coordination of search and rescue operations? A feasibility study,” In Proceeding of the third International Conference on Case-Based Reasoning, Springer, Seeon, Germany, pp. 358-371, 1999.
[27] R.J. Koester, “The lost Alzheimer’s and related disorders search subject: new research and perspectives,” Response NASAR Proceedings, National Association of Search and Rescue, Chantilly, VA, pp. 165-81, 1998.
[28] R.J. Koester, and D.E. Stooksbury, “Lost Alzheimer’s subjects–profiles and statistics,” Response, Fall 1992. [29] B. W. Leach, and k. Hui. “Low Cost Strapdown Ineertial/DGPS Intergration for Flight Test Requirements”. Aeronaut.
Space J., vol. 45, No. 3, Canada, pp. 253-263, September 1999. [30] “Ascension laserBIRD 2™,” 5DT Fifth dimention technologies virtual relaity for the real world,
http://www.5dt.com/products/plaserbird.html, captured on April 29th, 2009. [31] Inition, “LE-750 see-through head mounted displays”
http://www.inition.co.uk/inition/product.php?URL_=product_hmd_liteye_700&SubCatID_=15, captured on May, 27th, 2009.
[32] “The VE 2.2 user manual,” http://www.cse.yorku.ca/~ivy/ve-2.2/. Captured on April 20th, 2009. [33] M. Yeh, C. D. Wickens, and F. J. Seagull, “Target cueing in visual search: The effects of conformality and display
location on the allocation of visual attention,” Human Factors, vol. 41, pp. 524 – 542, 1999. [34] C. Youngblut, R. Johnson, S. Nash, R. Wienclaw and C. Will, “Review of Virtual Environment Interface Technology.” IDA
Paper P-3186, Log: H96-001239, Institute for Defense Analysis, 1996. [35] Keller, John. “Laser tracker fits the bill for helicopter augmented-reality system.” (optoelectronics watch), Military and
Aerospace. Electronics,01 May 2004. [36] R. A. Perry and S. Robertson, “Virtual Terrain for a Helicopter Mission Simulator.” Defence Science Technology Organization,
1998. [37] P. Milgram, H. Takermura, A. Utsumi, and F. Kishino, “Augmented reality: a class of displays on the reality-virtuality
continuum.” In SPIE, Telemanipulator and Telepresence Technologies, Vol. 235, 1994, 282-292. [38] C-N. Carolina, J. S. Daniel, A. D. Thomas, “Surround-screen projection-based virtual reality: the design and implementation of
the CAVE.” Proceedings of the 20th annual conference on Computer graphics and interactive techniques, p.135-142, September 1993.
[39] M. Woo, J. Neider, and T. Davis. “OpenGL programming guide,” Second Edition. Addison Wesley, 1997.

D. ACKNOWLEDGEMENTS This work was supported by contract RMO5SEC02 from the Ontario Centres of Excellence. We
are especially grateful to Rob Erdos, Stephan Carnigan, Michel Brulotte, Scott Healey, Greg Lester, Don Filliter and Doug Holby for their time and expertise. Part E was Muna Shabaneh’ MSc project report.