REPORT ON PERCEIVED EXCESS OF INFANT AND FETAL DEATHS IN …s3.amazonaws.com/zanran_storage/ · in...
20
An Epidemiologic Analysis of the Perceived Excess in Infant and Fetal Deaths in O'Fallon, Missouri: 2003 Update Missouri Department of Health and Senior Services Office of Epidemiology Jose Pagoada, Ph.D. Pamela K. Xaverius, Ph.D. Patrick E. Phillips, DVM, MSPH Bao-Ping Zhu, MD, MS Jefferson City, Missouri December 2003
Transcript of REPORT ON PERCEIVED EXCESS OF INFANT AND FETAL DEATHS IN …s3.amazonaws.com/zanran_storage/ · in...

An Epidemiologic Analysis of the Perceived Excess
in Infant and Fetal Deaths in O'Fallon, Missouri:
2003 Update
Missouri Department of Health and Senior Services
Office of Epidemiology
Jose Pagoada, Ph.D.
Pamela K. Xaverius, Ph.D.
Patrick E. Phillips, DVM, MSPH
Bao-Ping Zhu, MD, MS
Jefferson City, Missouri
December 2003

Summary
This is the 2003, and final, update of an epidemiologic investigation in response to an
inquiry regarding a suspected cluster of fetal and infant deaths in the O’Fallon area, which has
shown no evidence of an elevated fetal or infant mortality in the O’Fallon community. In
addition, the examination of the causes of fetal and infant deaths did not support the hypothesis
that a single environmental factor had caused the fetal and infant deaths in the O’Fallon
community. Recognizing that any fetal or infant death is unacceptable, even if they are not
occurring at significantly high rates, it is recommended that the O’Fallon community focus on
broader issues affecting maternal health, maternal obstetric care, newborn medical care, and
infant health.
Background
This 2003 update of a three-year study concludes a feto-infant death epidemiological
investigation recommended by the Office of Epidemiology, Missouri Department of Health and
Senior Services (DHSS) that began in September of 2001, covering the years of 1990 to 2000.
The original investigation was in response to an inquiry received by the DHSS in January 2001
from a resident of the city of O’Fallon, Missouri. The inquirer anecdotally observed an increase
in infant and fetal deaths in the city of O’Fallon, Missouri in the year 2000.
In the original investigation, the following analytical techniques were used: 1) case-series
study with cases of fetal and infant deaths from the O’Fallon area where the inquirer thought
there was a cluster of cases; 2) review of all fetal and infant deaths, by cause of death, from 1990
to 2000 using the international classification of disease codes, ICD-9 and ICD-10; and 3) cluster
study which calculated statistical differences between observed and expected events and
2

performed the Ohno and Grimson statistical test for spatial clustering of cases in the O’Fallon
community.
One of the most important findings of the original investigation and the first follow-up
completed in December 2002, but formally submitted in June 2003, was that no statistically
significant evidence supported the hypothesis that infant and fetal deaths recorded in O’Fallon in
year 2000 and 2001 had increased. In addition, the greatly diverse causes of deaths indicated that
a variety of causes and risk factors, rather than a single environmental exposure, had contributed
to the fetal and infant deaths (Simoes et al., 2001 and Pagoada et al., 2002).
This third-year analysis completes the 24-month active surveillance on these indicators in
St. Charles County and the O’Fallon area, as recommended in the original investigation, which
showed no statistically significant increase in feto-infant deaths. Further, feto-infant mortality
rates in both St. Charles County and the O’Fallon area remain consistently lower than the state
rates as a whole.
Objectives
The main objectives for updating this study through 2002 were to: a) increase the
statistical power of the analysis, by adding one more year of fetal and infant deaths data, and b)
comply with the recommendation by the original investigation that a 24-month active
surveillance follow-up be conducted.
3
xaverp
Was the first follow-up completed in 2003 or 2002???
Methods
Data and Study Population
The investigation used data from the live births and fetal deaths files maintained by the
Center for Health Information, Management and Evaluation (CHIME) at DHSS. The data
analyzed included live births, neonatal deaths (infant deaths < 28 days of age), post-neonatal
deaths (infant deaths 28 days through one year) and fetal deaths (deaths in uterus at 20 or more
weeks of pregnancy) for the state of Missouri, St. Charles County and for the zip codes that
compose the city of O’Fallon. Fetal and infant (neonatal and post-neonatal) deaths were analyzed
by cause of death. Because the focus was on determining whether an abnormal rate of fetal and
infant deaths existed and clustered in O’Fallon individual zip codes, as well as in the whole
O’Fallon area, the same geographic composition used in the previous investigation for the city of
O’Fallon (i.e., zip codes 63304, 63366, 63376 and all zip codes combined) was used.
Analysis
Consistent with the original study and the first update report, fetal and infant death rates
were calculated for Missouri, St. Charles County and the city of O’Fallon. These indicators, i.e.,
fetal, neonatal, post-neonatal, and total infant deaths, for O’Fallon (individual zip codes and all
zip codes combined) were then compared to those of the reference populations, i.e., Missouri and
St. Charles County. Furthermore, mortality rates for Missouri and St. Charles County were used
to estimate expected infant and fetal deaths events for the city of O’Fallon as a whole and for the
individual zip codes. Ratios of observed by expected events for St. Charles County and O’Fallon
were also computed. In addition to the ratio of observed to expected events, standardized z-
4

statistics were calculated to determine whether differences between observed and expected
number of cases were statistically significant.
Results
Table 1 displays live births, fetal, and infant deaths and their respective rates per 1,000
live births for Missouri, St. Charles County, the individual zip codes that comprise the city of
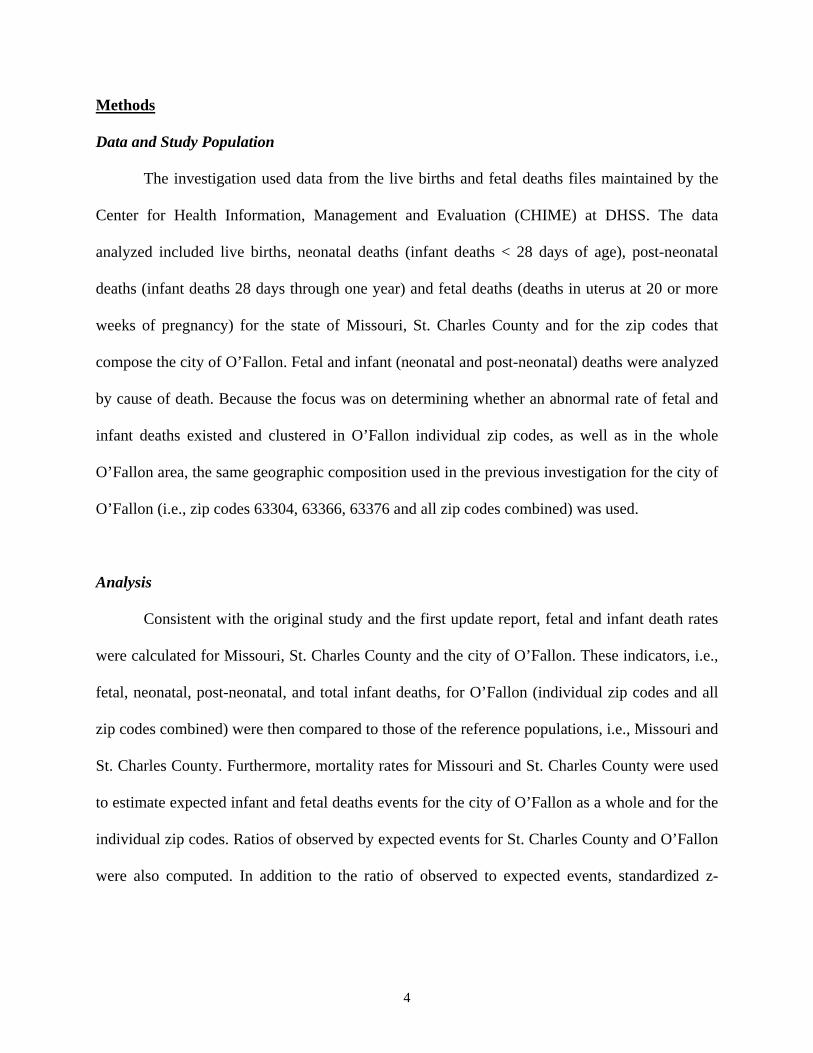
O’Fallon, and O’Fallon (all the zip codes combined). Tables 2-4 show the number of fetal,
neonatal, and post-neonatal deaths, by cause of death and year of occurrence in O’Fallon from
1990 to 2002; and Table 5 demonstrates the observed and expected events for each indicator, the
ratio of observed to expected events, and the standardized z-statistic values for St. Charles
County and O’Fallon. Figures 1-8 graphically display annual rates for fetal and infant deaths in
each of the geographical areas being analyzed.
At the state level, the fetal death ratio has remained just over six per 1,000 live births
during the period of analysis. The infant death rate in Missouri declined by more than 30 percent
during most of the last 13-year period, from 9.4 infant deaths per 1,000 live births in 1990 to 7.2
in 2000. However, the infant death rate (per 1,000 live births) increased slightly to 7.4 in 2001
and again to 8.5 in 2002. The major component of infant death rate, neonatal death rate, has
remained at approximately 5 per 1,000 live births for most of the period, and inched up to 5.6 in
2002, a rate similar to that in 1990 which was 5.7 per 1,000 live births. The post-neonatal death
rate (per 1,000 live births), on the other hand, declined steadily from 3.8 in 1990 to 2.4 in 2000,
and then inched up to 2.5 in 2001 and to 2.9 in 2002 (Table 1 and Figures 1-3).
The fetal death rate in St. Charles County shows more variability, than the state rate, as
expected due to the smaller size of the population. A year-to-year comparison shows that overall
5

the fetal death rate in St. Charles County is lower than that of Missouri except for year 2002,
during which the rates are equal, at 5.6 per 1,000 live births. Although a general decline in the
fetal death rate is observed in St. Charles County during the period of analysis, it is worth noting
that by 2002 the rate was higher, at 5.6 per 1,000 live births, than the 5.1 per 1,000 live births
reported in 1990. The rate of infant deaths in St. Charles County was lower than that of Missouri
for every single year during the study period, in spite of the slightly higher observed neonatal
death rates in years 1997 and 1999 (Table 1 and Figures 1-3).
The aggregate data for 2000-2002 shows that the fetal death rate for the city of O’Fallon
is lower than that of St. Charles County and of the entire state of Missouri, as was found using
the aggregate data for 2000-2001 in the previous report (Pagoada et al., 2002). In 2002, the infant
death rate (per 1,000 live births) was slightly higher in O’Fallon (6.7) than in St. Charles County
(6.5). When the causes of deaths were examined, there were 27 different causes of fetal deaths
listed in the death certificate throughout the period of analysis, and nine different causes of infant
deaths in 2002 (Table 2). Therefore, it appears that the increase in the fetal death rate was most
probably due to random variation than to a particular risk factor. As seen in Table 2, ‘unspecified
conditions originating in the perinatal period’ is the leading cause of fetal deaths in O’Fallon
during the study period. The second leading cause of fetal deaths in O’Fallon is ‘other
compression of umbilical cord,’ responsible for 20 fetal deaths in the 13-year period analyzed
(Table 2). Finally, Table 2 shows that a total of 12 fetal deaths, four in each year from 2000 to
2002, are attributed to ‘unspecified cause’. The increase in the infant death rate in O’Fallon was
due to an increase in the neonatal death rate from 2.2 per 1,000 live births in 2001 to 4.9 in 2002.
Because 54 different causes of neonatal deaths (Table 3) were found during the 1990-2002
6

period, 10 of these in 2002, it is very unlikely that the increase in the neonatal death rate was due
to a specific risk factor or environmental exposure as the cause of death.
The post-neonatal death rate in O’Fallon also increased from 1.1 per thousand live births
in years 2000 and 2001 to 1.9 in 2002. As in the case of fetal and neonatal deaths, many different
causes of post-neonatal deaths were found in the 13-year period analyzed in this study. Table 4
displays the 26 causes of post-neonatal deaths found in the city of O’Fallon from 1990 to 2002,
four of which accounted for the post-neonatal deaths occurred in 2002. As shown in Table 4,
SIDS was the leading cause of post-neonatal deaths in O’Fallon during the study period.
Mortality indicators for each of the chosen zip codes that compose the city of O’Fallon
are displayed in Table 1 and graphically compared to the reference populations of Missouri and
St. Charles County in Figures 5 to 8. As expected, due to the small population sizes in each of
the zip codes, all mortality indicators fluctuated widely during the study period.
The cumulative infant and fetal death rates observed in St. Charles County, O’Fallon, and
the individual zip codes that compose the city of O’Fallon during the 1990-2002 period were
generally lower than the expected rates. The two exceptions, i.e., post-neonatal death rate in
O’Fallon Zip code 63376, and fetal deaths in O’Fallon Zip code 63304, were not statistically
significant (Table 5).
Conclusions
The addition of one more year of data on fetal and infant death rates in the city of
O’Fallon, Missouri did not show any statistically significant evidence that an increase in the
number of events reported in this area had occurred. This finding is based on the comparison of
infant and fetal deaths recorded in O’Fallon with those reported for St. Charles County and the
7

8
state of Missouri for the 13-year period analyzed in this study. The large number of causes of
deaths accountable for the fetal and infant deaths occurring in O’Fallon (Tables 2-4) do not
support the hypothesis that there is a prominent risk factor or environmental exposure causing
fetal and infant deaths in O’Fallon. Instead, the fetal and infant deaths are likely due to various
factors affecting maternal health, maternal care, newborn care, and infant health. These results
are consistent with the findings of the original investigation and the update during 2002, in which
a more complex analysis of these data utilizing clustering methodology was used, but also failed
to demonstrate a true cluster of infant deaths, nor to pin-point an environmental exposure for the
infant and fetal deaths.
Recommendations
Based on the combined findings from the original study, the update in 2002, and the
present update, the Office of Epidemiology recommends that the 24-month active surveillance be
closed. The O’Fallon community should instead focus its efforts on identifying broader issues
affecting maternal health, maternal obstetric care, newborn medical care, and infant health
(Besculides et al., 2001). Examples of such issues include, pre-conceptional health, risk factors
for Sudden Infant Death Syndrome (such as infant sleep position, smoking, breastfeeding),
prevention of injury, and newborn intensive care. When it comes to the loss of human lives, one
is too many. Therefore, the Missouri Department of Health and Senior Services, through the
Office of Epidemiology, is willing to provide the expertise and technical assistance to the
O’Fallon community in identifying the main factors responsible for the observed fetal and infant
fatalities and finding a solution to the problem.

Table 1. Fetal and Infant Deaths and Rates for Missouri, St. Charles and O’Fallon: 1990-2002 Fetal and Infant Deaths and Rate 1990 1991 1992 1993 1994 1995 1996 1997 1998 1999 2000 20001 2002
Missouri Live births 79135 78468 76005 75146 73279 72804 73733 73940 75242 75366 76329 75290 75167 Fetal deaths 525 520 497 493 423 434 440 446 450 448 430 410 455 Fetal death rate 6.6 6.6 6.5 6.6 5.8 6.0 6.0 6.0 6.0 5.9 5.6 5.4 6.1 Neonatal deaths 448 489 397 385 358 334 357 350 370 381 364 367 418 Neonatal death rate 5.7 6.2 5.2 5.1 4.9 4.6 4.8 4.7 4.9 5.1 4.8 4.9 5.6 Post-neonatal deaths 298 309 250 245 239 205 201 212 203 200 183 188 220 Post-neonatal death rate 3.8 3.9 3.3 3.3 3.3 2.8 2.7 2.9 2.7 2.7 2.4 2.5 2.9 Infant deaths 746 798 647 630 597 539 558 562 573 581 547 555 638 Infant death rate 9.4 10.2 8.5 8.4 8.1 7.4 7.6 7.6 7.6 7.7 7.2 7.4 8.5 St. Charles Live births 3886 3744 3735 3724 3681 3730 3971 3905 4095 4071 4244 4178 4279 Fetal deaths 20 14 17 12 19 14 17 16 15 11 13 21 24 Fetal death rate 5.1 3.7 4.6 3.2 5.2 3.8 4.3 4.1 3.7 2.7 3.1 5.0 5.6 Neonatal deaths 13 12 10 14 12 10 15 21 14 16 21 13 22 Neonatal death rate 3.3 3.2 2.7 3.8 3.3 2.7 3.8 5.4 3.4 3.9 4.9 3.1 5.1 Post-neonatal deaths 2 10 6 5 6 10 7 6 9 6 6 5 6 Post-neonatal death rate 0.5 2.7 1.6 1.3 1.6 2.7 1.8 1.5 2.2 1.5 1.4 1.2 1.4 Infant deaths 15 22 16 19 18 20 22 27 23 22 27 18 28 Infant death rate 3.9 5.9 4.3 5.1 4.9 5.4 5.5 6.9 5.6 5.4 6.4 4.3 6.5 O’Fallon (Zip code 63304) Live births 0 151 435 453 498 544 556 502 559 604 603 567 543 Fetal deaths 0 0 1 1 3 4 3 2 1 4 2 4 4 Fetal death rate 0 0 2.3 2.2 6.0 7.4 5.4 4.0 1.8 6.6 3.3 7.1 7.4 Neonatal deaths 0 0 0 2 0 1 3 5 2 3 0 0 5 Neonatal death rate 0 0 0 4.4 0 1.8 5.4 10.0 3.6 5.0 0 0 9.2 Post-neonatal deaths 0 0 0 1 0 2 2 0 1 0 1 1 1 Post-neonatal death rate 0 0 0 2.2 0 3.7 3.6 0 1.8 0 1.7 1.8 1.8 Infant deaths 0 0 0 3 04 3 5 5 3 3 1 1 6 Infant death rate 0 0 0 6.6 0 5.5 9.0 10.0 5.4 5.0 1.7 1.8 11.0

Table 1. Fetal and Infant Deaths and Rates for Missouri, St. Charles and O’Fallon: 1990-2002 (Cont.) Fetal and Infant Deaths and Rate 1990 1991 1992 1993 1994 1995 1996 1997 1998 1999 2000 2001 2002
O’Fallon (Zip code 63366) Live births 603 633 613 684 748 738 857 874 988 991 1172 1228 1246 Fetal deaths 2 2 3 2 2 3 4 7 2 1 5 4 4 Fetal death rate 3.3 3.2 4.9 2.9 2.7 4.1 4.7 8.0 2.0 1.0 4.3 3.3 3.2 Neonatal deaths 1 2 2 4 5 1 2 3 2 2 8 2 5 Neonatal death rate 1.7 3.2 3.3 5.8 6.7 1.4 2.3 3.4 2.0 2.0 6.8 1.6 4.0 Post-neonatal deaths 0 0 1 1 1 2 0 0 1 2 1 0 3 Post-neonatal death rate 0 0 1.6 1.5 1.3 2.7 0 0 1.0 2.0 0.9 0 2.4 Infant deaths 1 2 3 5 6 3 2 3 3 4 9 2 8 Infant death rate 1.7 3.2 4.9 7.3 8.0 4.1 2.3 3.4 3.0 4.0 7.7 1.6 6.4 O’Fallon (Zip code 63376) Live births 891 948 1029 942 941 915 898 951 892 950 885 895 879 Fetal deaths 4 3 3 2 6 4 5 2 3 1 2 5 6 Fetal death rate 4.5 3.2 2.9 2.1 6.4 4.4 5.6 2.1 3.4 1.1 2.3 5.6 6.8 Neonatal deaths 0 2 3 2 3 1 1 3 4 4 4 4 3 Neonatal death rate 0 2.1 2.9 2.1 3.2 1.1 1.1 3.2 4.5 4.2 4.5 4.5 3.4 Post-neonatal deaths 0 4 3 1 1 2 2 1 3 3 1 2 1 Post-neonatal death rate 0 4.2 2.9 1.1 1.1 2.2 2.2 1.1 3.4 3.2 1.1 2.2 1.1 Infant deaths 0 6 6 3 4 3 3 4 7 7 5 6 4 Infant death rate 0 6.3 5.8 3.2 4.3 3.3 3.3 4.2 7.8 7.4 5.6 6.7 4.6 O’Fallon (All Zip codes) Live births 1494 1732 2077 2079 2187 2197 2311 2327 2439 2545 2660 2690 2668 Fetal deaths 6 5 7 5 11 11 12 11 6 6 9 13 14 Fetal death rate 4.0 2.9 3.4 2.4 5.0 5.0 5.2 4.7 2.5 2.4 3.4 4.8 5.2 Neonatal deaths 1 4 5 8 8 3 6 11 8 9 12 6 13 Neonatal death rate 0.7 2.3 2.4 3.8 3.7 1.4 2.6 4.7 3.3 3.5 4.5 2.2 4.9 Post-neonatal deaths 0 4 4 3 2 6 4 1 5 5 3 3 5 Post-neonatal death rate 0 2.3 1.9 1.4 0.9 2.7 1.7 0.4 2.1 2.0 1.1 1.1 1.9 Infant deaths 1 8 9 11 10 9 10 12 13 14 15 9 18 Infant death rate 0.7 4.6 4.3 5.3 4.6 4.1 4.3 5.2 5.3 5.5 5.6 3.3 6.7

Table 2. Fetal Deaths by Cause of Death in O’Fallon: 1990-2002 CAUSE OF DEATH 1990 1991 1992 1993 1994 1995 1996 1997 1998 1999 2000 2001 2002
1. Other forms of placental separation and hemorrhage
1
1
1
2
2
1
2
2. Other compression of umbilical cord 2 1 2 1 1 2 1 2 2 4 2 3. Unspecified condition originating in the
perinatal period
2
3
4
5
4
6
7
4
4. Fetal growth retardation 1 1 1 5. Unspecified cause 1 4 4 4 6. Premature rupture of membrane 1 1 2 1 7. Asphyxia or anoxia before labor 1 1 8. Other specified conditions originating in the
perinatal period
1
1
2
1
9. Maternal hypertensive disorders 1 1 10. Incompetent cervix 1 1 11. Down’s syndrome 1 12. Conditions due to anomaly of unspecified
chromosome
1
13. Unspecified morphological and functional abnormalities of placenta
1
1
14. Placental transfusion syndrome 1 15. Extreme immaturity 1 16. Patau’s syndrome 1 17. Other preterm infants 1 18. Osteochondrodysplasia, unspecified 1 19. Prolapsed cord 1 20. Other cardiovascular disorders originated in
the perinatal period
1
21. Congenital anomalies 1 1 22. Other & unspecified conditions of umbilical
cord
1
23. Syndrome of infant of a diabetic mother 1
24. Perinatal intestinal perforation 1 25. Spina bifida 1 26. Slow fetal growth 1 27. Triploidly and polyploidy 1
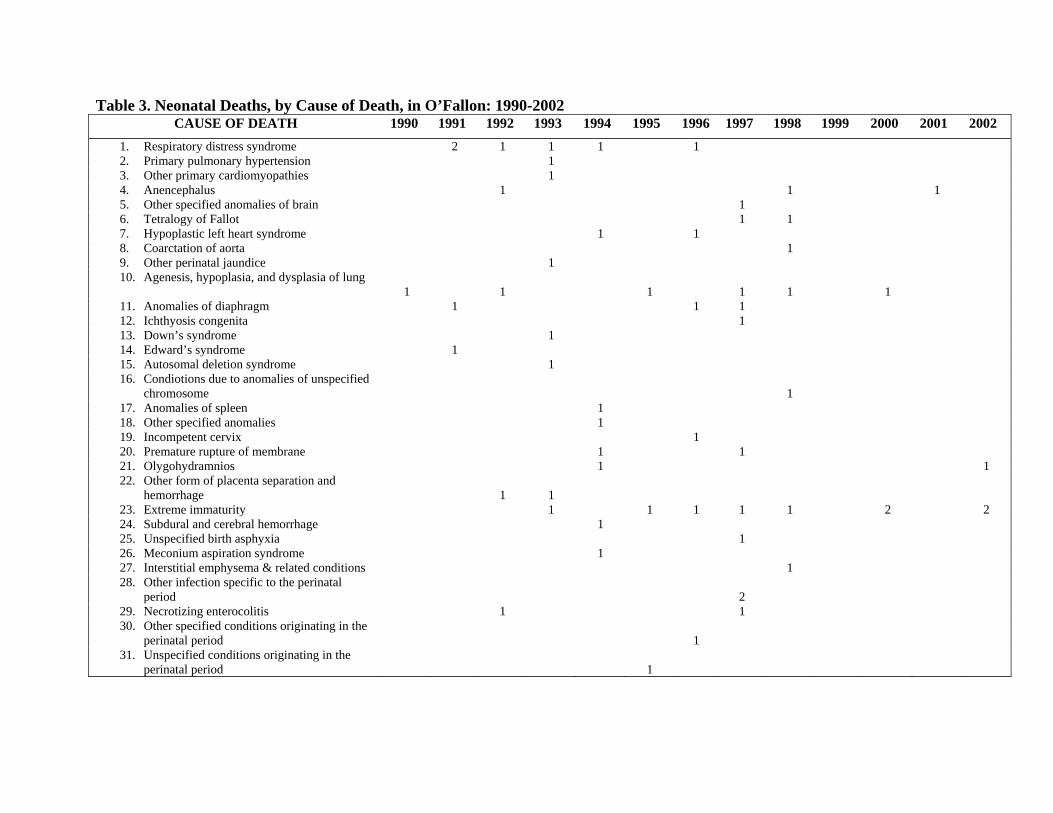
Table 3. Neonatal Deaths, by Cause of Death, in O’Fallon: 1990-2002 CAUSE OF DEATH 1990 1991 1992 1993 1994 1995 1996 1997 1998 1999 2000 2001 2002
1. Respiratory distress syndrome 2 1 1 1 1 2. Primary pulmonary hypertension 1 3. Other primary cardiomyopathies 1 4. Anencephalus 1 1 1 5. Other specified anomalies of brain 1 6. Tetralogy of Fallot 1 1 7. Hypoplastic left heart syndrome 1 1 8. Coarctation of aorta 1 9. Other perinatal jaundice 1 10. Agenesis, hypoplasia, and dysplasia of lung
1
1
1
1
1
1
11. Anomalies of diaphragm 1 1 1 12. Ichthyosis congenita 1 13. Down’s syndrome 1 14. Edward’s syndrome 1 15. Autosomal deletion syndrome 1 16. Condiotions due to anomalies of unspecified
chromosome
1
17. Anomalies of spleen 1 18. Other specified anomalies 1 19. Incompetent cervix 1 20. Premature rupture of membrane 1 1 21. Olygohydramnios 1 1 22. Other form of placenta separation and
hemorrhage
1
1
23. Extreme immaturity 1 1 1 1 1 2 2 24. Subdural and cerebral hemorrhage 1 25. Unspecified birth asphyxia 1 26. Meconium aspiration syndrome 1 27. Interstitial emphysema & related conditions 1 28. Other infection specific to the perinatal
period
2
29. Necrotizing enterocolitis 1 1 30. Other specified conditions originating in the
perinatal period
1
31. Unspecified conditions originating in the perinatal period
1

Table 3. Neonatal Deaths, by Cause of Deaths, in O’Fallon: 1990–2002 (Cont.)
CAUSE OF DEATH 1990 1991 1992 1993 1994 1995 1996 1997 1998 1999 2000 2001 2002 32. Abrasion or friction burn without mention of
infection
1
33. Viral carditis 1 34. Congenital myopathies 1 35. Multiple pregnancy 1 36. Chorioamnionitis 2 1 2 1 37. Other preterm infants 1 1 38. Respiratory distress syndrome 1 39. Bronchopulmonary displasia 1 40. Primary atelectesis 1 1 41. Respiratory failure 2 42. Sepsis due to Escherichia coli 1 43. Other bacteria sepsis 2 44. Bacterial sepsis, unspecified 2 45. Termination of pregnancy 1 46. Other specified conditions originating in the
perinatal period
1
47. Discordant ventriculoarterial connection 1 48. Hypoplastic left heart syndrome 1 49. Congenital malformation of heart 1 1 50. Hypoplasia and dysplasia of lung 1 51. Renal agenesis 1 52. Exomphalos 1 53. Congenital malformation, unspecified 1 54. Patau’s syndrome 1

Table 4. Post-Neonatal Deaths, by Cause of Death, in O’Fallon: 1990-2002 CAUSE OF DEATH 1990 1991 1992 1993 1994 1995 1996 1997 1998 1999 2000 2001 2002
1. Anoxic brain damage 1 2. Primary pulmonary hypertension 1 3. Intracerebral hemorrhage 1 4. Congenital malformation/anomalies of
heart
1
1
1 5. SIDS 1 1 1 4 1 2 2 6. Congenital absence, atresia, and stenosis
of small intestine
1
7. Accidental suffocation & strangulation in bed
2
1
2
8. Inflammatory liver disease unspecified 1 9. Asphyxia 1 10. Other sequelae of chronic liver disease 1 11. Streptococcal meningitis 1 12. Endocardial fibroelastocis 1 13. Other disease of the lungs 1 1 14. Tetralogy of Fallot 1 15. Hypoplastic left heart syndrome 1 16. Other specified anomalies of heart 1 17. Anomalies of diaphragm 1 18. Chronic respiratory disease arising in the
perinatal period
1
19. Necrotizing enterocolatis 1 20. Abrasion or friction burn without
mention of infection
1
21. Unspecified sedative or hynoptics 1 1 22. Encephalopathy, Unspecified 1 23. Ischaemic cardiomyopathy 1 24. Other specified diseases of pulmonary
vessels
1
25. Embolism and thrombosis of other unspecified parts of aorta
1
26. Epidermolysis bullosa, unspecified 1

Table 5. Infant and Fetal Deaths Observed and Expected Events, Ratios and Z-Values for St. Charles County and O’Fallon: 1990-2002 Geographic Area Indicator Observed Events Expected Events Observed/expected Z-Statistics
St. Charles County Fetal deaths 213 311 0.68 -5.56 Neonatal deaths 193 262 0.74 -4.26 Post-Neonatal deaths 84 153 0.55 -5.56 Infant deaths 277 415 0.67 -6.77 O’Fallon Fetal deaths 29 24 1.21 1.02(Zip code 63304) Neonatal deaths 21 23 0.91 -0.42 Post-Neonatal deaths 9 10 0.90 -0.32 Infant deaths 30 33 0.91 -0.52 O’Fallon Fetal deaths 41 47 0.87 -0.88(Zip code 63366) Neonatal deaths 39 44 0.89 -0.75 Post-Neonatal deaths 12 18 0.67 -1.41 Infant deaths 51 62 0.82 -1.40 O’Fallon Fetal deaths 46 50 0.92 -0.57(Zip code 63376) Neonatal deaths 34 45 0.76 -1.64 Post-Neonatal deaths 24 20 1.20 0.89 Infant deaths 58 65 0.89 -0.87 O’Fallon Fetal deaths 116 121 0.96 -0.45(All Zip codes) Neonatal deaths 94 112 0.84 -1.70 Post-Neonatal deaths 45 48 0.94 -0.43 Infant deaths 139 160 0.87 -1.66

Figure 1. Fetal Death Rates in Missouri, St. Charles and O'Fallon All Zipcodes
0.02.04.06.08.0
10.012.0
1989 1990 1991 1992 1993 1994 1995 1996 1997 1998 1999 2000 2001 2002 2003
Per
1000
Liv
e Bi
rths
Missouri St. Charles O'Fallon All Zipcodes
Figure 2. Neonatal Death Rates in Missouri, St.
Charles and O'Fallon All Zipcodes
0.02.04.06.08.0
10.012.0
1989 1990 1991 1992 1993 1994 1995 1996 1997 1998 1999 2000 2001 2002 2003
Per
1000
Liv
e Bi
rths
Missouri St. Charles O'Fallon All Zipcodes

Figure 3. Postneonatal Death Rates in Missouri, St.
Charles and O'Fallon All Zipcodes
0.02.04.06.08.0
10.012.0
1989 1990 1991 1992 1993 1994 1995 1996 1997 1998 1999 2000 2001 2002 2003
Per
1000
Liv
e Bi
rths
Missouri St. Charles O'Fallon All Zipcodes
Figure 4. Infant Death Rates in Missouri, St.
Charles and O'Fallon All Zipcodes
0.02.04.06.08.0
10.012.0
1989 1990 1991 1992 1993 1994 1995 1996 1997 1998 1999 2000 2001 2002 2003
Per
1000
Liv
e Bi
rths
Missouri St. Charles O'Fallon All Zipcodes

Figure 5. Fetal Death Rates in Missouri, St. Charles and O'Fallon Zipcode 63304
0.02.04.06.08.0
10.012.0
1989 1990 1991 1992 1993 1994 1995 1996 1997 1998 1999 2000 2001 2002 2003
Per
1000
Liv
e Bi
rths
Missouri St. Charles O'Fallon Zipcode 63304
Figure 6. Fetal Death Rates in Missouri, St. Charles
and O'Fallon Zipcode 63366
0.02.04.06.08.0
10.012.0
1989 1990 1991 1992 1993 1994 1995 1996 1997 1998 1999 2000 2001 2002 2003
Per
1000
Liv
e Bi
rths
Missouri St. Charles O'Fallon Zipcode 63366
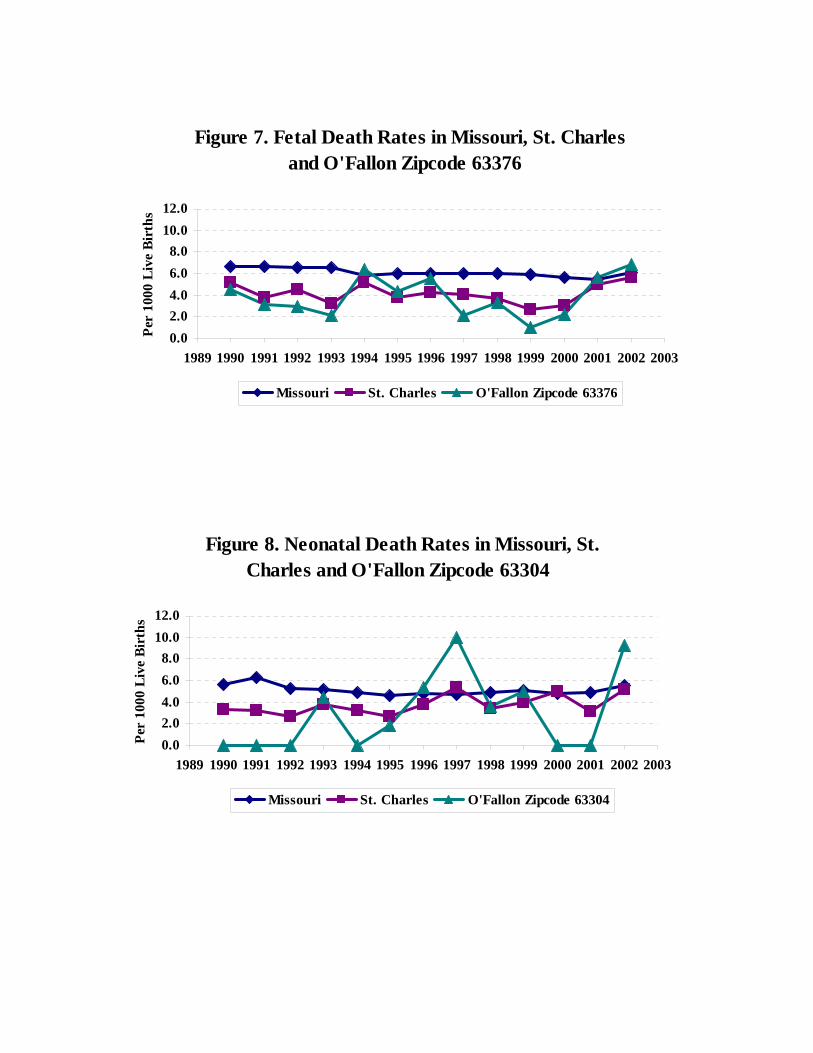
Figure 7. Fetal Death Rates in Missouri, St. Charles and O'Fallon Zipcode 63376
0.02.04.06.08.0
10.012.0
1989 1990 1991 1992 1993 1994 1995 1996 1997 1998 1999 2000 2001 2002 2003
Per
1000
Liv
e Bi
rths
Missouri St. Charles O'Fallon Zipcode 63376
Figure 8. Neonatal Death Rates in Missouri, St. Charles and O'Fallon Zipcode 63304
0.02.04.06.08.0
10.012.0
1989 1990 1991 1992 1993 1994 1995 1996 1997 1998 1999 2000 2001 2002 2003
Per
1000
Liv
e Bi
rths
Missouri St. Charles O'Fallon Zipcode 63304

REFERENCES
Besculides M, Liu K, Laraque F (2001, October). Determinants of feto-infant mortality in New York City, 1995-1998. Paper presented at the 129th Annual Meeting of the American Public Health Association, Atlanta, GA. Pagoada J, et al (2002, December). Report on Perceived Excess of Infant and Fetal Deaths in O’Fallon, Missouri: An Update Through 2001. Missouri Department of Health and Senior Services, Office of Epidemiology. Simoes EJ, et al (2001, September). Report on Perceived Excess of Infant and Fetal Deaths in O’Fallon, Missouri in 2000. Missouri Department of Health and Senior Services, Office of Epidemiology.