Report on Market Issues in the California Power Exchange ... · in the California Power Exchange...
28
Report on Market Issues in the California Power Exchange Energy Markets Prepared for the Federal Energy Regulatory Commission by The Market Monitoring Committee of the California Power Exchange Roger E. Bohn Alvin K. Klevorick, Chair Charles G. Stalon August 17, 1998
Transcript of Report on Market Issues in the California Power Exchange ... · in the California Power Exchange...

Report on Market Issuesin the California Power Exchange
Energy Markets
Prepared for theFederal Energy Regulatory Commission
by The Market Monitoring Committeeof the California Power Exchange
Roger E. BohnAlvin K. Klevorick, Chair
Charles G. Stalon
August 17, 1998

PX Market Report 2
I. Introduction
On July 17, 1998 the Federal Energy Regulatory Commission (FERC) issued an orderaccepting the proposal by the California Independent System Operator (ISO) to limittemporarily the prices the ISO will pay to bidders that had been granted authority to setmarket-based rates for Ancillary Services. In addition to granting that authority to the ISO,FERC directed the ISO Market Surveillance Committee and the California Power Exchange(PX) Market Monitoring Committee to conduct independent studies and to file reports withthe Commission within thirty days of the date of the order.
The studies were to examine “the bidding behaviors and structural characteristics of themarkets that they [the Committees] each administer and to further clarify the causes of theperceived market concerns in the pleadings.” Those concerns, expressed in pleadings by theISO and Southern California Edison (SoCal Edison), were directed at the performance of theISO markets for Ancillary Services and especially Replacement Reserves in early July. Atissue, in particular, were dramatic price spikes in the price for Replacement Reserve Capacityand insufficient bids in that market and other reserve markets. The FERC expressed specialinterest in “how the workings of the California market and activity in the generation marketaffected the prices in the Ancillary Service and Replacement Reserve markets,” and itsinterest presumably extends to the impact of activity in the ISO markets on the PX energymarkets. In addition, the FERC directed that the ISO and PX market monitoring committeesshould address how “phase-in plans implementing new procedures such as the hour-aheadmarket” will affect PX and ISO markets.
The PX Market Monitoring Committee is engaged in an ongoing analysis of the structure,behavior, and performance of the PX day-ahead energy market, and it is beginning a similarstudy of the PX hour-ahead market, which commenced operation only on July 30th. In thisreport, the Committee draws on its ongoing study and the associated work of the PXCompliance Unit staff to respond to the FERC’s inquiries. To answer the Commission’sspecific questions about interdependence of the PX and ISO markets, the Market MonitoringCommittee has examined bidding behavior and market performance in the PX energy marketespecially during July and early August. The Committee emphasizes that the time constraintson the preparation of the report have limited the depth and scope of quantitative analysis thatcould be undertaken. The members of the Committee regard this report as part of acontinuing examination and analysis of the PX markets, directed at the maintenance ofcompetitive and efficient energy markets in California, rather than as a discrete, time-limitedstudy.
In the next section of the report we delineate the boundaries of our analysis and characterizethe product we have tried to deliver. Section III provides a review of the structure andperformance of the PX day-ahead energy market from its inception to the present. Relevantcharacteristics of the Ancillary Services markets are also discussed. (In this report, we use

PX Market Report 3
"Ancillary Services" in the generic sense, including Regulation, Spinning Reserves, Non-Spinning Reserves, and Replacement Reserves.) In Section IV we present our analysis ofbidding behavior in the PX market with special attention to July including the period thatgenerated concerns about the ISO Ancillary Services markets. Section V contains ourdiscussion of the interactions between the PX and ISO markets. We conclude, in Section VI,with implications that we draw from our analysis.
II. The Character and Boundaries of Our AnalysisFirst, our report focuses on the PX market for energy and, due to the very recent introductionof the hour-ahead market, primarily on the day-ahead market. We discuss and comment onthe ISO markets only to the degree that there is reason to inquire about how developments inthose markets may have an impact on the PX market and vice versa. In particular, it isfundamental to recognize that the capacity available for the ISO markets and for the PXmarkets comes from the same generating capacity. Capacity sold in one market means lesscapacity that can be sold in other markets, thereby driving up prices in the latter. Therefore,we would expect a close relationship among the different markets.
Second, we have written a descriptive, analytical report. We are not assessing whetherparticular participants behaved well or behaved badly. Rather, we attempt to analyze howthey have behaved, based on historical data, and how we might expect them to behave, basedon the market rules and their incentives as we understand them. Our report is normative onlyto the extent that our analysis will lead us to recommend one or another policy measure.
Third, it is essential to keep in mind just how new these markets are. They are stilldeveloping and evolving in important ways. We expect behavior to change as participantsgain experience; as new markets open, such as the hour-ahead market; as supply and demandchange due to seasonal forces and market pressures; and as unanticipated events occur. Overtime we would expect the sophistication of both the demand and supply participants toincrease, and their behaviors to change. This continued evolution should be recognized whenconsidering policy changes. Problems we diagnose now may be inherent in the market or theymay be transitional difficulties.
Fourth, the information we have is limited in important ways. We do not have data on sometransactions outside the PX markets, especially bilateral sales (made outside the PowerExchange market) and Reliability Must Run transactions. As a consequence, we cannotaccurately characterize the degree to which some of the PX market participants are usingdedicated capacity as a strategic instrument.

PX Market Report 4
III. Overview of Markets and OperationsThis section provides an overview of California’s electricity market structure and a summaryof PX operations from the opening of the market on April 1, 1998 through August 11, 1998.
PX Market DescriptionsThe PX operates two separate energy markets: a day-ahead energy market and an hour-aheadenergy market. The PX has been operating its day-ahead energy market throughout the fourmonths since restructuring was implemented, while the hour-ahead energy marketcommenced operations on July 30, 1998.
PX Day-Ahead MarketIn the day-ahead market, PX Participants submit portfolio bids to buy and sell energy for eachhour of the succeeding day. These portfolio bids, which must be submitted to the PX by 7:00a.m. on the day prior to the actual dispatch day, are used by the PX to derive aggregate supplyand demand curves from which the PX establishes an unconstrained market clearing priceand quantity for each hour. Following the conclusion of the day-ahead auction, successfulbidders provide the PX with Initial Preferred Schedules that reflect the quantities awarded inthe auction process. These schedules specify the quantity and location of loads and supplieswithin the grid. The PX provides these schedules, which in aggregate must be balanced withrespect to supply and demand in each hour, to the ISO by 10:00 a.m. on the day prior to thedispatch day. Other Scheduling Coordinators, representing bilateral transactions, submit theirbalanced schedules to the ISO in a similar manner.
These schedules also include Participants’ Ancillary Services Bids and Schedule AdjustmentBids (for inter-zonal transmission congestion). Upon receiving the resource schedules fromScheduling Coordinators, the ISO conducts its Ancillary Services auction and performscongestion management, thereby, making any necessary adjustments to the Initial PreferredSchedules based on participants’ bids. The ISO then issues Final Day-Ahead Schedules,including the schedules for Ancillary Services, by approximately 1:00 p.m. each day, andpublishes final transmission Usage Charge rates if transmission congestion has occurred. ThePX then calculates Zonal Market Clearing Prices based on its Participants’ ScheduleAdjustment Bids and the Usage Charge rates provided by the ISO.
PX Hour-Ahead MarketIn the hour-ahead market, buyers and sellers are able to adjust the positions they received inthe day-ahead market. This is especially useful to distribution utilities and electric serviceproviders who may need to modify their day-ahead market positions when demand changesdue to weather conditions or supply changes due to plant outages or line de-ratings. The PXhour-ahead market also provides benefits to bilateral market participants who may wish toadjust their day-ahead market positions. The PX hour-ahead market involves trading around-the-clock through 24 hourly auctions.

PX Market Report 5
PX Schedule CoordinationIn addition to operating the forward energy markets (day-ahead and hour-ahead), the PX alsofunctions as a Scheduling Coordinator with responsibility for submitting balanced resourceschedules to the ISO, providing real-time dispatch instructions to its Participants, andperforming billing and settlements services for both the day-ahead and hour-ahead markets.
ISO Market DescriptionsThe ISO operates the real-time Imbalance Energy market, the Ancillary Services market, andthe Transmission Congestion Management market.
Imbalance Energy Market (Real-Time Market)The ISO is responsible for balancing loads and resources in real-time. The ISO uses bidsreceived in the Imbalance Energy market to increment and decrement resources as needed tomaintain a system-wide energy balance. These bids include Supplemental Energy Bids,which Participants provide to the ISO up to one hour prior to the dispatch hour, as well as theenergy bids submitted by Participants in conjunction with their Ancillary Services capacitybids, as described below. The Imbalance Energy market price is calculated in 10 minuteintervals on an ex-post basis. This price is used to settle deviations between scheduled andactual quantities of supply and demand. A Participant that over-delivers relative to itsscheduled quantity is paid the imbalance price, while a Participant that under-delivers relativeto its scheduled quantity is charged this price.
Ancillary Services MarketsThe ISO conducts four day-ahead and four hour-ahead auctions for Ancillary Services. Thesefour Ancillary Services are: Regulation, Spinning Reserves, Non-Spinning Reserves, andReplacement Reserves. Each is a capacity-only market. Bidders must also include an energybid with each capacity bid. The Energy Bids in the Regulation market are used for validationonly while the Energy Bids for Spinning, Non-Spinning, and Replacement Reserves are used,along with Supplemental Energy bids, in the real-time Imbalance Energy market. In additionto these four Ancillary Service products, which are acquired through an hourly market-clearing auction process, the ISO also is responsible for acquiring Voltage Support/ReactiveSupply and Black Start capability, which it procures though a longer term contractingprocess.
Transmission Congestion ManagementThe Transmission Congestion Management market operates on the basis of ScheduleAdjustment Bids (SABs) provided to the ISO by Scheduling Coordinators. These SABsindicate the willingness of a Scheduling Coordinator to increment a resource if the priceincreases or decrement a resource if the price decreases (vice versa for demand and exports),and are an expression of the value that the Scheduling Coordinator places on obtaining inter-zonal transmission access. The ISO uses the SABs to adjust individual resource schedules torelieve congestion and calculate transmission congestion Usage Charge rates.
Table 1 shows the detailed operational timelines for the day-ahead and hour-ahead markets.

Table 1 Timeline for Day-Ahead and Hour-Ahead Markets1
Day-Ahead Timeline Day-Ahead ActivityBy 7:00 a.m. Participants submit day-ahead portfolio energy supply bids and demand bids for
each hour to the PX.By 7:15 a.m. PX conducts day-ahead energy auction and notifies successful bidders of hourly
market-clearing prices and quantities.By 9:20 a.m.(scheduled to move to 9:10a.m., beginning August 23)
Participants submit Initial Preferred Schedules to the PX that provide details of thespecific generating units and loads that fulfill the aggregate awards in the energyauction. In addition, Participants submit Schedule Adjustment Bids for inter-zonaltransmission access.
By 9:30 a.m. Participants submit to the PX bids for Ancillary Services (regulation, spinningreserves, non-spinning reserves, and replacement reserves).
By 10:00 a.m. PX and other Scheduling Coordinators (SCs) submit their Participants’ InitialPreferred Schedules to the ISO, along with their Participants’ Schedule AdjustmentBids and Ancillary Services Bids.
By 11:00 a.m. ISO completes first iteration of inter-zonal congestion management. If there is nointer-zonal congestion, ISO issues Final Day-Ahead Schedules, including theschedules for Ancillary Services selected in the ISO’s Ancillary Services auction.If there is congestion, ISO provides the PX and other SCs with the estimated Day-Ahead Usage Charges, a Suggested Adjusted Day-Ahead Schedule, and apreliminary schedule for Ancillary Services.
By 12:00 noon If there is inter-zonal congestion, PX and other SCs submit to the ISO theirRevised Day-Ahead Schedules, in response to the ISO’s Suggested Adjusted Day-Ahead Schedules.
By 1:00 p.m. ISO performs second iteration of congestion management and provides the PX andother SCs with Final Day-Ahead Schedules, including the schedules for AncillaryServices, and issues final Day-Ahead Usage Charge rates.
By 1:15 p.m. PX and other SCs send their Participants the Final Day-Ahead Schedules, includingthe schedules for Ancillary Services, and the Final Day-Ahead Usage Charge rates.PX calculates zonal market-clearing prices.
By 1:30 p.m. (approx.) ISO determines if there are any deficiencies in the ancillary services auctions andevaluates Reliability Must-Run requirements relative to Final Schedules.
By 5:00 p.m. (approx.) ISO notifies market participants of any changes in Final Day-Ahead Schedulesresulting from ancillary services shortfall and Reliability Must-Run generationrequirements.
Hour-Ahead Timeline Hour-Ahead ActivityNot later than 3 hours priorto the dispatch hour
Participants submit energy supply and demand bids to the PX (bids are resourcespecific and are relative to Day-Ahead Final Schedules).
Not later than 2 hours, 50minutes prior to dispatch
PX calculates market clearing prices and quantities, and determines PreferredSchedules.
Not later than 2 hours priorto the dispatch hour
Participants submit Schedule Adjustment Bids and Ancillary Services Bids to thePX, which in turn, submits the Preferred Schedules, Schedule Adjustment Bids, andAncillary Services Bids to the ISO.
Not later than 1 hour priorto dispatch hour
ISO performs congestion management and conducts its Ancillary Services auction.ISO provides PX and other SCs with Final Hour-Ahead Schedules, includingschedules for Ancillary Services, and final Usage Charge rates. PX, in turn,transmits this information to its Participants.
Prior to dispatch hour PX calculates and publishes Zonal Market Clearing Prices.Real-Time Timeline Real-Time ActivityNot later than 60 minutesprior to the start of hour
Participants provide Supplemental Energy Bids to the PX and other SCs.
Not later than 45 minutesprior to the start of hour
PX and other SCs submit Supplemental Energy Bids to the ISO for use in the real-time market.
1 Target timetable; actual performance varies depending on circumstances.

PX Market Report 7
Bidding in multiple marketsMost participants will be eligible to bid in several of the markets. The exact sequence of bidsand responses affects how they will do so. Prior to their 7 a.m. day-ahead bids, generatorsmust make an approximate decision about the split between what they want to offer in theday-ahead and Ancillary Services markets. Bids in the day-ahead energy market are acceptedbefore bids in the AS market need to be placed. If generators want to offer a larger quantity inany AS market, they must offer a smaller quantity in the day-ahead market. They canimplement this directly, or they can offer the smaller quantity at "reasonable" prices, and thenoffer the rest at very high prices. Once the day-ahead market results are revealed at 7:15 a.m.,the generators know how much capacity they can offer to the AS markets.
The method the ISO uses for sequencing the four AS markets also is important. Generatorscan bid simultaneously in all four markets, according to the following hierarchy:¾ Regulation¾ Spinning reserves¾ Non-spinning reserves¾ Replacement reserves.The ISO resolves the four markets in order. Any bid in a lower numbered market that is notaccepted is automatically assumed to be a bid in the higher numbered markets. In this way,the generator does not have to enter separate bids in each market, and the same MW ofphysical capacity can be entered simultaneously into all four markets. If some of the MW arenot purchased in the spinning reserves market, for example, they are automatically offered toserve the non-spinning or replacement reserves markets. Thus, unlike the choice betweenday-ahead and Ancillary Services markets, participants do not need to decide in detail towhich AS market they would like to offer, except insofar as their units are physicallyconstrained to one or another market.
This ability to bid well above the predicted market clearing renders problematic theinterpretation of the "quantity" a participant bids into the market. For example, the ISO'smotion requesting a stay of the FERC's June 30 and July 10 orders states (p 25):
Moreover, the Ancillary Services markets are already depressed by the bidding rules thatgovern the Utility Distribution Companies. They must first bid their available generation intothe Power Exchange. They are not free to hold it out for the Ancillary Services auctions andcan participate in those auctions only if and to the extent that their bids are not accepted by thePower Exchange.
This is technically correct, but irrelevant. By bidding a price of $250/MWh or higher forsome of its capacity, any participant including an IOU can be almost assured that the capacitywill not be accepted in the day-ahead PX market. The capacity will therefore be available forbidding in later markets, including the Ancillary Services and real-time markets. Of course, ifthe IOU is limited to cost-based rates for Ancillary Services, it will probably prefer to sell inthe energy markets, but the choice is its own. In our analysis, we have generally interpretedoffers above $250/MWh as the participant's effectively withdrawing capacity above that pricefrom the day-ahead market.

PX Market Report 8
Market PerformanceDuring the period April 1 through August 11, 1998, the PX has successfully run its day-aheadenergy market and published hourly market clearing prices and quantities every day. Thehour-ahead market opened recently and is functioning properly as well. The overall trends inthe PX markets during this period are summarized below.
Market OverviewThe California electricity market is enormous, representing approximately $22 billion inannual revenues and 246,000 GWh of annual energy consumption, roughly 10% of the totalU.S. market. The three major investor-owned utilities (Southern California Edison, PacificGas & Electric, and San Diego Gas & Electric) account for approximately 70% of the totalCalifornia electricity market on an energy consumption basis, with the balance of the marketserved by municipal and governmental entities. Since the market opened, the PX share of therestructured California electricity market has been approximately 88%.
PX Participants include investor-owned utilities, Federal and municipal entities, independentpower producers, and power marketers, from both within and outside California. There areapproximately 45 Participants certified to trade in the PX markets, with about 35 Participantsactive in the markets on any given day. In addition, there are about 20 entities currently inthe certification process. As a result of generation divestiture, the California IOUs’ share ofthe PX supply market has declined from about 93% in the early months of the market toabout 85% in July.2 On the demand side, the California IOUs are the dominant playerswithin the PX, representing about 95% of the load in the day-ahead energy market.
DemandWhile population and economic activity are major underlying factors determining demand forelectricity, weather is the primary determinant of seasonal and daily variations in load.Temperature patterns and deviations from the expected seasonal trends throughout theWestern System are important for the California market. California and the inland Southwesthave desert climates with substantial air conditioning load, whereas the Northwest andNorthern Rockies have more moderate summer temperatures, but higher heating loads in thewinter.
Temperatures throughout the region during April were mild and continued moderate throughMay and June. As a result, air conditioning loads in the California market were somewhatlower than average. Temperatures in the Northwest were also below average with moreheating degree days in April, May and June than normal, thus increasing nighttime heatingrequirements. In late June and early July, temperatures began to increase somewhat and
2 These percentages are for generation bid by the IOUs. Much of this generation is owned by other parties andbid in at a zero price under provisions such as those for qualifying facilities.

PX Market Report 9
finally gave way to high temperatures in mid-July through early August. Electricity demandin late July and early August was up throughout the region, in some cases to record levels.Since this heat wave had an impact on the Southwest and the Northwest as well as onCalifornia, demand increased throughout the region.
Table 2 shows monthly information on PX market clearing quantities. As expected, thedifference between the maximum hourly and minimum hourly clearing quantities hassignificantly increased since the Spring, from about 10,000 MW to 18,000 MW, therebyincreasing the need for peaking resources.
Table 2 PX Market Clearing Quantities
MonthMaximum
Hourly MCQ(Megawatts)
MinimumHourly MCQ(Megawatts)
AverageHourly MCQ(Megawatts)
April 24,847 14,657 19,914May 23,007 14,542 19,050June 28,499 15,683 21,398July 35,774 16,993 25,393
August* 36,376 18,075 26,784* As of August 11.
SupplyGeneration capacity in the Western region is ample, with total generation in excess of peakdemands. The Western configuration is fortuitous with winter heavy load in the Northwestand Northern Rockies counterbalancing heavy summer loads in California and the Southwest.Because of the importance of the seasonal north to south interregional flows, transmissioncurtailments or de-ratings on the Pacific Interties can have an impact on generation supply tothe California market. Similarly, unit outages, either scheduled for maintenance orunplanned, affect supply availability and thus prices in the California market.
Supply conditions were generally robust during the April through mid-July period. Hydrogeneration conditions in the Northwest have been generally good, with moderate impactsfrom spill requirements associated with salmon restoration efforts. Northern Californiahydroelectric generation has been abundant as the result of higher than usual snow pack andmoderate temperatures.
Pacific Intertie curtailments limiting the flow of power to California in July, coupled withhydro generation concerns in the Northwest in late July, contributed to upward pricepressures during this period. Since late July, extreme temperatures in the Southwest andNorthwest, combined with forced outages at key plants, pushed peak prices upward and led tovoluntary load curtailments in several hours.

PX Market Report 10
Power plant divestitures have also had an impact on the supply picture. Since the opening ofthe market, the California IOUs have divested approximately 12,000 MW of generationresources, mostly natural gas-fired plants. Four separate companies acquired the majority ofthis capacity and are now actively bidding these resources into the California market andother markets in the western states, as discussed in Section IV.
Regulatory Must-Take (RMT) generation is another important factor in the PX market. RMTresources, which include nuclear units, Qualifying Facilities, and run-of-the-river hydro, arebid into the PX at $0/MWh to ensure their selection in the auction process. Other resources,which may not be classified as RMT but which may for operational reasons want to beassured of being dispatched, may also bid into the PX at $0/MWh. These resources typicallyaccount for approximately 20,000 MW of capacity. At lower demand levels, these resourcescan set the market clearing price at zero, as happened in many hours in May and early June.As demand levels increased in July and August, coal units and natural gas units determinedthe market clearing price.
For example, in June, average hourly PX demand was 21,400 MWh, while the average hourlyquantity of generation bid into the PX at zero price was 19,600 MWh, or 92% of PX marketdemand. In July, average hourly demand increased to 25,400 MWh, while the quantity ofzero price generation bids was 19,800 MWh, or 78% of PX demand. In August, the fractionof zero price generation bids decreased to 73% of PX demand. As expected, the percentageof zero price energy bid into the PX relative to total PX demand is higher in the off-peakperiods and lower in the on-peak periods. See Figure 1.
Figure 1 Zero Priced Bids vs Total PX Market Clearing Quantity, July 1998
0
5 000
10 000
15 000
20 000
25 000
30 000
35 000
40 000
1 2 3 4 5 6 7 8 9 10 11 12 13 14 15 16 17 18 19 20 21 22 23 24 25 26 27 28 29 30 31
Operating Date (July)
HourlyQuanti
PX MCQ Zero Priced Bids
The implication of the high volumes of zero priced bids is that the energy markets are"thinner" than they first appear. For example, suppose energy demand is 30,000 MW, zero

PX Market Report 11
bids are 20,000 MW, and one firm controls 3,000 MW of gas-fired capacity. It is moreaccurate to view this firm as having capacity equal to 30% of the price setting portion of thesupply base, rather than 10% of the overall market.
PricesThe following discussion of PX market prices covers the period April 1 through August 11,1998, and concerns PX unconstrained market clearing prices. The impact of transmissioncongestion on the unconstrained market clearing prices is discussed in a subsequent section.
We can roughly divide the period since the market opening into Spring (April, May, June),and July/August. Behavior of prices during the two periods was distinctly different. Table 3summarizes the prices each month and shows the large rise from June to July.
Table 3 Unconstrained PX Market Clearing Prices ($/MWh)
Month Minimum Maximum AverageAverage
Hours 7-22(on peak)
AverageOff-Peak
hoursApril 0.00 36.74 22.64 25.54 17.33May 0.00 37.37 11.63 16.43 6.18June 0.00 38.02 12.09 16.94 5.21July 0.00 151.10 32.42 41.08 21.49
August* 6.79 163.01 43.13 60.93 25.50* Through August 11.
In April, the PX average hourly price was about $23/MWh, with hourly prices varying duringthe month from a low of $0/MWh for three hours, to a high of about $37/MWh, as shown inTable 3. In May and June, average hourly prices fell significantly from the April level, toabout $12/MWh, due to moderate demand caused by mild temperatures and substantial hydroavailability in Northern California. The market clearing price was $0/MWh for 43 hours inMay and 87 hours in June.
Prices began to rise in mid-July as summer temperatures developed and demand levels rose.The PX hourly average price rose to $32/MWh in July and $43/MWh in August, with naturalgas units setting the market-clearing price in most hours. Peak prices rose significantly asmuch of the West went through a severe heat wave with several control areas in Californiareporting all-time record loads. The maximum hourly price rose to $151/MWh in July and$163/MWh in August. In addition, zero prices virtually disappeared, with only nine hours ofzero prices in July and no hours of zero prices in August so far.
Figure 2 is a price duration curve that shows the percentage of time that prices exceeded aparticular level. The lower curve is for the period April 1 through June 30 while the upper

PX Market Report 12
one is for the higher demand period of July 1 through August 11, and illustrates the dramaticchange between the periods. As shown in Figure 2, the maximum price through June did notexceed $40/MWh and price was zero about 6 percent of the time. In July-August, however,prices were above $40/MWh about 25% of the time, and price was zero only briefly.
Figure 2 Comparison of Price-Duration Curves
Price Duration Curves for April-June and July-August .
0
20
40
60
80
100
120
140
160
180
0% 10% 20% 30% 40% 50% 60% 70% 80% 90% 100%
Percent of time Price is Exceeded .
July - August
April - June
Price volatility
Figure 3 shows the relationship between the PX market clearing price and quantity for theperiod April 1 through June 30, 1998. As shown, the maximum hourly quantity was less than30,000 MWh throughout the three month period and the maximum price less than $40/MWh,and there were significant variations in price for a given quantity. Figure 4 presentsequivalent information for the period July 1 through August 11, 1998. It shows that theshape of the price-quantity relationship changed significantly as market clearing quantities(MCQ) exceed 30,000 MWh, as average prices rise steeply with market quantity above30,000.

PX Market Report 13
Figure 3 Market Clearing Price and Quantity for the Period April 1 – June 30
PX Hourly MCQ vs MCP during April 1 - June 30
0
20
40
60
80
100
120
140
0 5000 10000 15000 20000 25000 30000 35000 40000
Hourly MCQ (MWh)
Figure 4 Market Clearing Price and Quantity for the Period July 1 – August 11
PX Hourly MCQ vs MCP during July 1 - August 11
0
20
40
60
80
100
120
140
160
180
0 5000 10000 15000 20000 25000 30000 35000 40000
Hourly MCQ (MWh)

PX Market Report 14
CongestionCongestion on the major transmission paths has increased as electricity demand levels haveincreased. Table 4 shows the number of hours of congestion on the major transmission paths,while Table 5 shows the resulting impact of such congestion on the PX unconstrained marketclearing prices.
Table 4 Congestion charges
Month TransmissionPath
Number ofHours
CongestedISO Transmission Usage Charges
($/MWh)Minimum Average Maximum
April So. Calif – No. Calif 0 0.00 0.00 0.00Calif – Oregon 1 4.14 4.14 4.14Calif – NOB 3 250.00 250.00 250.00Calif – Arizona 0 0.00 0.00 0.00
May So. Calif – No. Calif 0 0.00 0.00 0.00Calif – Oregon 131 0.10 9.34 50.00Calif – NOB 127 0.01 40.80 250.00Calif – Arizona 0 0.00 0.00 0.00
June So. Calif – No. Calif 59 0.14 3.65 25.90Calif – Oregon 119 0.02 4.71 14.30Calif – NOB 82 0.01 2.91 12.51Calif – Arizona 0 0.00 0.00 0.00
July So. Calif – No. Calif 62 0.02 12.45 76.25Calif – Oregon 199 1.01 17.78 58.01Calif – NOB 95 0.01 11.51 11.51Calif – Arizona 0 0.00 0.00 0.00
August* So. Calif – No. Calif 35 0.70 9.55 23.60Calif – Oregon 23 0.63 2.29 3.94Calif – NOB 7 1.87 27.91 80.86Calif – Arizona 0 0.00 0.00 0.00
* As of August 7.
In April and May, there was no congestion on the main transmission link between northernand southern California (Path 15, linking zones NP15 and SP15). In June and July,congestion on this path occurred in a total of 121 hours, or 8% of the time. On theCalifornia-Oregon Intertie (Northwest 1), one of two major transmission links betweenCalifornia and the Northwest, congestion occurred in only one hour during April. In May

PX Market Report 15
through July, however, congestion on this path occurred an average of 150 hours per month.On the California-NOB link, the other major transmission link to the Northwest, congestionoccurred in only three hours in April, and an average of 100 hours per month during Maythrough July. There was no congestion between California and Arizona.
The vast majority of electricity demand in California occurs in Zones NP15 and SP 15,Northern and Southern California respectively. As a result of congestion, the average PXunconstrained market clearing price in NP 15 increased an average of $1/MWh during thecongested hours in the period May through July. During this same period, the averageunconstrained price in SP 15 increased approximately $2/MWh during the congested hours.
Table 5 Average Price Impact on NP15 and SP15 Due to Congestion
MonthPrice Impact
HoursUnconstrainedMarket Price
($/MWh)
Average PriceImpact in SP15
($/MWh)
Average PriceImpact in NP15
($/MWh)April 0 n/a n/a n/aMay 162 16.85 1.86 1.86June 150 21.84 1.20 0.80July 199 42.28 2.75 0.43
August* 68 48.49 -1.41 2.18* As of August 7.
Comparison with bilateral marketsThe PX regularly compares its day-ahead energy market prices with those occurring inbilateral markets, as shown in Table 63. Such comparisons must be viewed carefully sincethe PX prices are derived from individual hourly auctions, whereas bilateral market pricesrepresent a relatively small volume of energy traded in aggregate on-peak and off-peakblocks, and are determined based on a survey of market participants. Nonetheless, thecomparisons are tracked closely by the PX. The two primary hubs for bilateral trades in theCalifornia market are at the California/Oregon border (COB) and at the California/Arizonaborder (Palo Verde).
Table 6 Comparison of PX Unconstrained Prices with Bilateral Market Prices ($/MWh)
On-Peak Off-Peak
Month PXCOB/NOB
PaloVerde PX
COB/NOB
PaloVerde
April 25.54 25.14 25.22 17.33 16.33 14.96May 16.43 14.82 19.62 6.18 7.60 7.97June 16.94 15.65 20.68 5.21 5.97 7.28July 41.08 31.39 43.81 21.49 17.02 17.48August* 60.93 55.31 55.44 25.50 27.91 24.80* As of August 11.
3 Source of bilateral market prices: Energy Market Report.

PX Market Report 16
Comparison with real-time pricesAs shown in Table 7, PX average hourly prices have been slightly above ISO real-timeprices, although real-time prices have been more volatile, as would be expected. During theperiod April 1 through August 11, the PX average hourly price has been $21.67/MWh with astandard deviation of $18.80/MWh, while the average ISO real-time price has been$18.29/MWh with a standard deviation of $23.62/MWh.
Table 7 Comparison of PX Unconstrained Market and ISO Real-Time Prices ($/MWh)
MonthPX AverageHourlyDay-Ahead
ISO AverageHourly Real-Time Price
PX PriceStandardDeviation
ISO PriceStandardDeviation
April 22.64 20.49 6.56 11.26May 11.63 9.33 7.68 10.40June 12.09 8.36 9.36 10.91July 32.42 27.83 20.71 29.69
August* 43.13 42.61 34.97 48.75As of August 11.
PX Hour-Ahead MarketThe PX hour-ahead market has been in operation only a couple of weeks and has had lowvolumes during this initial period. Prices have exhibited significant volatility, as expectedand as does the real-time market. The transaction volume in the hour-ahead market will likelyincrease as market participants gain additional experience with its operation.
IV. Behavior of the key participants in the marketsIn this section we describe and analyze the behavior of the most relevant generatingcompanies. These companies own or at least control gas-fired generating units. Their unitsplay a crucial role since they provide about 17,000 MW of gas-fired capacity, which comes
PX Market Report 17
into play as demand rises above the level that can be met by baseload units. During theafternoon hours in July the zero-bid capacity, mainly from utilities, was greater than 20,000MW while total demand was between 29,000 and 35,000MW. (See the discussion ofregulatory must-take in Section III.) Therefore units of the "key participants" should generallybe at or near the margin and always play a role in determining the market-clearing priceduring these hours. Our analysis, below, of the frequency with which particular participantscomprise the marginal supply supports this characterization.
By examining the behavior of these generators we hope to understand better the behavior ofprices in individual markets as well as the issue of spillovers from one market to the next.
We have limited our detailed analysis to ten weekdays in July: July 6-10 and July 27-31.During the first of these weeks, Ancillary Services prices were not capped, and ReplacementReserve prices reached $5000 per MW for 3 hours. During the July 27-31 period, AncillaryServices prices were capped at $250 per MW. Three of the four Ancillary Services marketshit this cap during some hours of the week. We examined the hours from 12 to 20 (11 a.m. to8 p.m.) each day. These are the hours with the highest demands and highest prices in bothAncillary Services and energy markets.
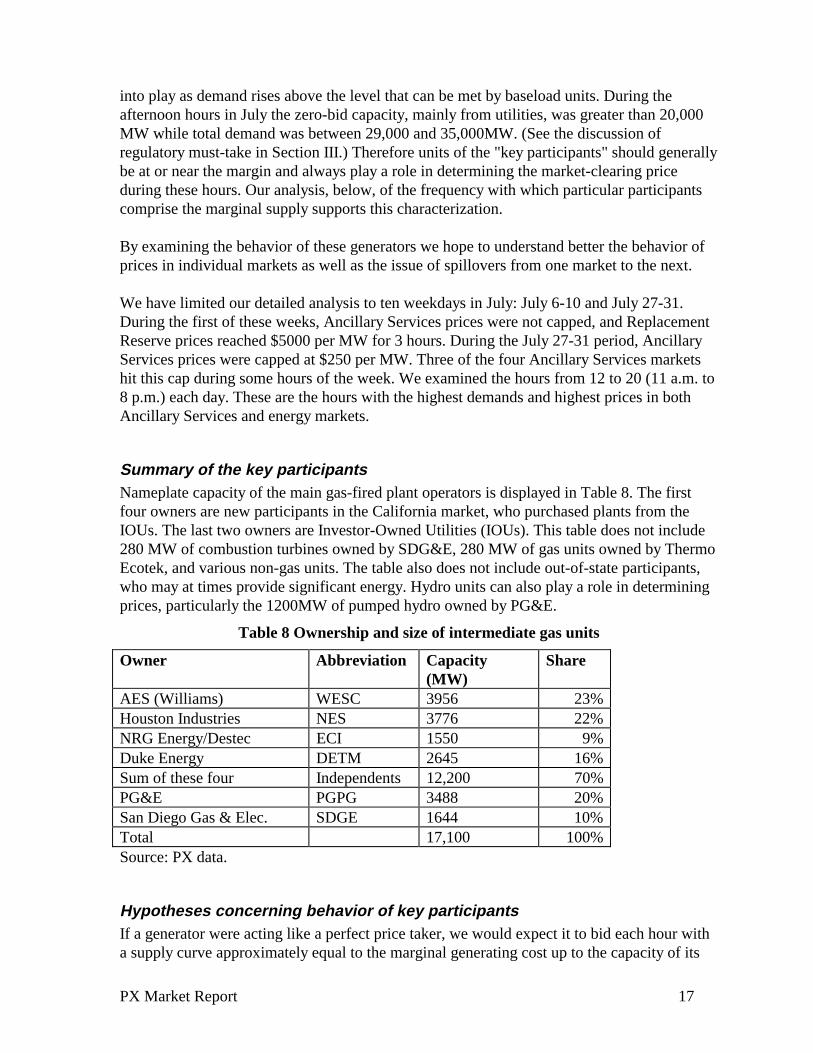
Summary of the key participantsNameplate capacity of the main gas-fired plant operators is displayed in Table 8. The firstfour owners are new participants in the California market, who purchased plants from theIOUs. The last two owners are Investor-Owned Utilities (IOUs). This table does not include280 MW of combustion turbines owned by SDG&E, 280 MW of gas units owned by ThermoEcotek, and various non-gas units. The table also does not include out-of-state participants,who may at times provide significant energy. Hydro units can also play a role in determiningprices, particularly the 1200MW of pumped hydro owned by PG&E.
Table 8 Ownership and size of intermediate gas units
Owner Abbreviation Capacity(MW)
Share
AES (Williams) WESC 3956 23%Houston Industries NES 3776 22%NRG Energy/Destec ECI 1550 9%Duke Energy DETM 2645 16%Sum of these four Independents 12,200 70%PG&E PGPG 3488 20%San Diego Gas & Elec. SDGE 1644 10%Total 17,100 100%Source: PX data.
Hypotheses concerning behavior of key participantsIf a generator were acting like a perfect price taker, we would expect it to bid each hour witha supply curve approximately equal to the marginal generating cost up to the capacity of its

PX Market Report 18
units. For example, with delivered gas prices now about $3 per MMBtu, a generator with aheat rate of 10,000 Btu/kwh would bid slightly above $30 per MWh. Prices would rise abovethe $30 level whenever total demand, including Ancillary Services demand, exceeded thecapacity of baseload (zero bid price) plus gas units. At these times, gas turbines and otherspecial technologies would comprise the marginal supply and, together with demand, jointlydetermine the price. A unit with a marginal running cost of $30/MWh would then receivecontributions to fixed costs whenever prices are above $30 for any reason.
We consider this the "competitive behavior model." Another important attribute of this modelis that the quantity offered by each generator should add up to its capacity. But during the twoJuly weeks we examined, the bidding of the key participants did not always fit thiscompetitive behavior model. The firms behaved rather differently from each other, but only afew followed the predictions of the competitive model just sketched.
The behavior of the six key participants in the PX day-ahead market in July departed in twomain ways from the competitive model. First, they almost never bid to supply their entiregenerating capacity in the PX market. Second, they often bid capacity at prices well above$30/MWh. In fact some firms bid some of their capacity at prices above $100/MWh duringsome hours.
For any given generating company and hour, there are at least five possible explanations whyits bid quantity in the PX day-ahead market might total less than its capacity. They are:• The participant expects one or more units to be unavailable.• It has a bilateral contract to sell energy.• It planned to sell capacity in one of the ISO markets. (Recall that the bids for the PX day-
ahead market must be placed before bids in the Ancillary Services and other markets.)• The participant is trying to push prices up.• The participant hopes that by not bidding a unit, it will be called as a Reliability Must
Run unit, and it will receive a higher price than it would have received in a competitivemarket.
With these explanations in mind, plus the default hypothesis of competitive behavior, weexamined the behavior of each key participant during the hours from 12 to 20 in the weeks ofJuly 6-10 and 27-31. Unfortunately we had very little information about the first twoexplanations: unit availability and bilateral contracts. This limits the inferences we can draw.
Observed behavior of participantsDifferent participants followed different patterns of bidding during the ten days and 90 hourswe examined in detail. Several appeared to be pure price-takers. They bid a flat supply curve

PX Market Report 19
at a price approximately equal to the marginal cost of a gas-fired unit. Others used veryelaborate bid curves that varied by hour and day. Not surprisingly, the latter were often themarginal price setters.
Some of the more elaborate bidding mechanisms used at different times by differentparticipants included the following:
• Finely differentiated upward sloping supply curve.• Hour to hour changes in the supply curve, shifting the curve to the left (less energy offered
at a given price) at times when prices were likely to be higher.• Day to day changes in the supply curve.• Extensive bidding in Ancillary Services markets.• Apparent adjusting of Ancillary Services and supplemental energy (real time) offers in
response to sales in the day-ahead market.
We emphasize that without a full econometric model to explain bidding behavior -- one thataccounts appropriately for exogenous factors and individual units -- and more data, we cannotdraw firm conclusions from this examination. In particular, we cannot easily tell whether agiven participant is "withholding" some of its capacity to force prices up or to induce the ISOto call a unit for Reliability Must Run status. Recall, specifically, the gaps in our data onbilateral contracts. Thus although we often observed PX-market offers and sales significantlybelow nameplate capacity, at this point no definite inferences can be drawn.
Our limited examination of bidding behavior, however, does provide considerable suggestiveevidence that the energy markets are at times thin and not fully competitive. Therefore, anyactions taken by the ISO to improve the Ancillary Services markets should be carefullyscrutinized to be sure they do not adversely affect the energy markets. This is especiallyimportant since the volumes of the energy markets are about ten times larger than thevolumes in the Ancillary Services markets.
It is also possible to over-offer capacity. That is, a participant can make AS bids by 9AMsuch that AS bids plus day-ahead sales exceed its capacity. For example, one afternoon aparticipant sold 80 percent of its capacity in the day-ahead market, and then bid 50 percent ofits capacity in the AS markets. Because of its supply curve (bid prices) about half itsAncillary Services bids were purchased. This led to total commitments of 106% of itscapacity. There is nothing necessarily wrong with this if the participant is willing to "buyback" its day-ahead energy sales in the hourly, real-time, or bilateral markets.
Who determined prices?Since we have data on individual supply curves (bids), we can engage in some sensitivityanalysis to determine which participants had the most effect on prices. In essence we ask thequestion, “At the actual price-quantity intersections in the marketplace, which firms were theones with the most power to alter price by altering their bids?” We estimated this by lookingat the incremental supply curve of the marginal firms, recognizing that several firms might be

PX Market Report 20
on the margin to different degrees in the same hour. This gave us a measure “percent ofincremental energy from participant x.” In a perfectly competitive market with six identicalparticipants, we would expect that each participant would provide approximately 17% of theincremental energy. We interpret a disproportionate share of one firm as meaning that it had alarger opportunity to influence prices. Whether such firms used that opportunity is a separatematter.
We examined the incremental firms over the period July 1 to August 10. Only “high pricedhours,” i.e. those over $75/MWh, were included in the calculation. There were 70 such hours.Of the approximately 30 sellers in the market, only four were important on the margin duringthese 70 hours. Not surprisingly in light of the differences in bidding behavior discussedabove, we found substantial differences in who was on the margin at different prices. Atprices from $75 to $100/MWh, incremental supply was divided rather evenly among fourfirms, with two of the six key participants almost never on the margin. At prices between$100 and $125, one firm was dominant with about three quarters of the incremental energy.When the price was above $125, a different firm was dominant with about three quarters ofthe incremental energy.4
We conclude from these share numbers that at certain levels in the aggregate supply curve, avery small number of firms had the effective ability to determine the prices. In essence theydominate a horizontal slice of the aggregate supply curve, and other firms have verticalsupply curves in those price regions, or bid all their capacity at lower prices. At other levels,many firms are bidding with sloped supply curves, and no one firm dominates. The MarketMonitoring Committee is concerned about market concentration issues, and will monitor itclosely in the future.
V. Interactions between PX and ISO marketsThe prices in three ISO Ancillary Services markets and in the PX Day-ahead market areshown in Figure 5, for hours 12 to 20 on the ten weekdays we studied. All prices are shownon the same scale, which illustrates the wide variations among markets and over time.Corresponding quantities are shown in Figure 6. We show Ancillary Services prices andquantities only for the SP15 region, which is the largest demand region and was moderatelymore subject to high prices than NP15. As the graphs show, different markets had high priceson different days. For example, in the energy market, during these ten days prices exceeded$100/MWh only on Tuesday July 28. That day, non-spinning reserve and replacement reservehit their caps of $250/MW, while the price for spinning reserve was about $10.
4: We took 90% of the original MCPs and calculated the generation from each participant at this price and at theactual MCP. The difference we considered that firm's incremental generation. This number divided by totalincremental generation was the share for that participant in that hour. We then took the weighted average sharefor a participant across all hours in the price range, using the hours' total increments as the weights. There were42 hours with prices between $75 and $100, 14 hours between $100 and $125, and 14 hours over $125.

PX Market Report 21
PX Energy Price ($/MWh)
0
50
100
150
200
6-Jul 7-Jul 8-Jul 9-Jul 10-Jul 27-Jul 28-Jul 29-Jul 30-Jul 31-Jul
Spinning Reserve Price ($/MW)
0
50
100
150
200
250
300
6-Jul 7-Jul 8-Jul 9-Jul 10-Jul 27-Jul 28-Jul 29-Jul 30-Jul 31-Jul
Non-Spinning Reserves Price ($/MW)
0
50
100
150
200
250
300
6-Jul 7-Jul 8-Jul 9-Jul 10-Jul 27-Jul 28-Jul 29-Jul 30-Jul 31-Jul
Replacement Reserves
Price ($/MW)
0
50
100
150
200
250
300
6-Jul 7-Jul 8-Jul 9-Jul 10-Jul 27-Jul 28-Jul 29-Jul 30-Jul 31-Jul
Hour 14: $2,500Hours 15-17: $5,000
Figure 5 Energy and reserve Prices, selected days, hours 12-20

PX Market Report 22
PX Quantity (MWh)
25,000
27,000
29,000
31,000
33,000
35,000
6-Jul 7-Jul 8-Jul 9-Jul 10-Jul 27-Jul 28-Jul 29-Jul 30-Jul 31-Jul
Spinning Reserve Quantity (MW)
0
400
800
1,200
1,600
6-Jul 7-Jul 8-Jul 9-Jul 10-Jul 27-Jul 28-Jul 29-Jul 30-Jul 31-Jul
Non-Spinning Reserve Quantity (MW)
0
400
800
1,200
1,600
6-Jul 7-Jul 8-Jul 9-Jul 10-Jul 27-Jul 28-Jul 29-Jul 30-Jul 31-Jul
Replacement Reserve Quantity (MW)
0
400
800
1,200
1,600
6-Jul 7-Jul 8-Jul 9-Jul 10-Jul 27-Jul 28-Jul 29-Jul 30-Jul 31-Jul
Market suspended 10
July
Figure 6 Energy and reserve Quantities, selected days, hours 12-20

PX Market Report 23
One hypothesis about prices in these markets is that jumps in the Ancillary Services marketprices are due to increases in capacity being used to serve the PX markets, leaving littlecapacity for Ancillary Services..5 During the second week we examined, the $250/MW capswere binding in many hours. We do not have access to the firms' supply curves in theAncillary Services markets, but our examination of the data on the PX energy markets doesnot suggest that the $250/MW caps were hit because of any widespread withdrawal ofcapacity from the Ancillary Services markets in an effort to provide more to the PX market.
Our examination of individual participants' sales in the PX and ISO markets reveals thatsome of them adjust their 9:30 a.m. bids in the Ancillary Services markets based on whatthey sold in the 7:15 a.m. day-ahead market. This is an attempt to make sure that capacity notselected in the day-ahead auction does not sit idle. To the extent this occurs, it helpsequilibrate prices in the different markets. In principle such behavior does create a tradeoffbetween the two markets; more sold in one makes less available to the other. However theeffect, if it exists, is weak.
We intend to study this issue further as more data become available. Prices in AncillaryServices and in energy markets have risen recently, and there is no reason to believe that thelate-July Ancillary Services prices are stable or representative of their long-term behavior.
Comparing Prices: Reserves as OptionsAnother way to compare the various markets is to examine the profit-making opportunities ineach one. If participants are rational, can sell capacity in any market, and have lowtransactions costs, we would expect prices to equilibrate across markets. More precisely, inequilibrium the expected profits from allocating the last MW of capacity to all marketsshould be equal. Participants should move capacity from one market to another until thiscondition holds; until then there would be opportunities to profit from arbitrage across themarkets. Casual observation of Figure 5 suggests that prices are far from this equilibrium.Although energy prices seem to follow a regular pattern, Ancillary Services prices change byan order of magnitude from each other, from day to day, and even from hour to hour.
Spinning, non-spinning and replacement reserves are all theoretically call options that theISO is purchasing. They give the ISO the right to buy energy on a few minutes notice, if it isneeded to respond to a contingency. The payments made by the ISO for reserves are per MWof capacity, and are the cost of buying the options. When these reserves are called upon bythe ISO, there is also an energy payment per MWh, at the real-time price.6
When, for example, the price of reserves is at $250/MW, this option character of reserves hastwo consequences. First, the underlying commodity (energy) has consistently been cheaper
5 Recall that Ancillary Services bids are made after day-ahead energy bids have been resolved. Therefore, theenergy sales matter more than the energy market bids.6 Suppliers are required to include an energy bid with each capacity bid they submit in the reserves markets, butthe energy payments they receive if they are called to provide energy are based on the ISO’s real-time imbalanceprice. They are only called if the real-time price is at or higher than their energy bid. This means that the actual“strike” price is equal to or higher than the energy price submitted by the provider.

PX Market Report 24
than the call option, thereby in principle creating an arbitrage opportunity. Second, whendeciding how much to offer in each market, participants will make more profit by sellingreserves at $250 per MW than by selling energy, even if the energy price reached $250 perMWh. The value of selling a MW as reserves is the expected reserve price plus the expectedvalue of real time price minus marginal running cost. For example, if the reserves price is$200/MW and there is a 40% chance of being called to deliver at a $100/MWh expected RealTime price, the expected revenue is the same as selling in the energy market at $240/MWh.The reserve contract gives about the same profit as an energy price of $258 (if the marginalgenerating cost is $30/MWh).
The maximum price in the PX day-ahead energy market has been about $160/MWh whileAncillary Services prices have often reached the ISO cap of $250/MW. The price of reserveshas exceeded the energy price in many peak hours. Table 9 shows the percentage of hoursthat the price for each reserve service was higher than the PX day-ahead energy price in earlyAugust. Most of the weekday afternoons had such relative prices. The reserve prices averagedclose to $250/MW, because they were usually hitting the ISO's price cap. During such hours,in principle the ISO could have purchased energy and "thrown it away" more cheaply thanbuying the Ancillary Service.
Table 9 also shows the average day-ahead reserves price (option cost) and the real-time ISOenergy price (exercise price for the option) during these high-priced hours. To calculate thetotal payment made to a Supplier who is called upon for reserves, one has to add the cost ofthe option (capacity payment) to the cost of energy when it is called during the affectedhours. For example the first column shows the relevant prices for spinning reserves.

PX Market Report 25
Table 9 Comparison of Revenues from 1 MW in PX and Reserve MarketsAugust 1 - 12, 1998 Spinning
ReserveNon-
spinningReserve
Replace-ment
ReservePercentage of Hours that Reserve Price Exceeded PXPrice
28% 20% 23%
Average PX Price During Such Hours ($/MWh) 63 90 91Average Reserve Price During Such Hours ($/MW) 238 249 238Average Real-Time Price During Such Hours($/MWh)
72 108 111
Payment Above PX if Called for Capacity ReserveOnly ($/MW) 175 159 147Payment Above PX When Also Called for Energy forfull Hour ($/MWh) 247 266 258
As shown in Table 9, the average payment to spinning reserve suppliers in these hours was$310/MWh ($238 + $72). The PX average energy price during the same hours was only$63/MWh. Thus, suppliers of spinning reserve energy received an average payment that was$247/MWh above the average PX price ($310 - $63). Even suppliers who were not calledupon to provide energy received payments that were $175/MW above the average PX price.In a smoothly functioning group of markets, suppliers should have recognized that they couldmake significantly greater profits providing spinning reserves compared to bidding in the PXmarket during these on-peak hours.
Arbitrage should have eliminated the differential profit opportunities. It is apparent that themarkets for Ancillary Services are not in equilibrium with the energy market. Perhapsbecause there are too few players in the Ancillary Services markets, the paradoxical priceinversion persists.
If the cost of buying reserve services is higher than the cost of energy itself the same hour, theISO would be better off buying energy in the PX day-ahead market to meet its reserverequirements. The ISO could even sell such energy to outside control areas at zero prices onthe condition that it could be called back to meet ISO’s reliability requirements -- in essenceexploiting the arbitrage opportunity between the option and the commodity. This might causePX prices to increase, but as reserve prices dropped to equilibrium with the PX market,capacity would shift toward the PX market, thereby compensating for the ISO's purchases inthe market. An entrepreneurial firm could also take advantage of this arbitrage strategy andkeep the profits itself.
VI. Concluding Observations
Based on the information gathered and the study undertaken to date, the Committee has anumber of concluding observations to offer. Before we present them, however, it is

PX Market Report 26
important to emphasize the Committee's strong belief that competitive and efficient marketscan set prices and determine quantities for electricity in California. Although marketexperience to date indicates the desirability of adjusting some of the current structures andprocedures, this does not weaken our belief that properly designed and functioning marketscan do the job. The main goal should be to make long-term changes that will remedy thecurrent deficiencies. But we recognize that the market effects of some defects may be sosevere that temporary interventions are required. It is important, however, to take all stepspossible to ensure that short-term actions do not impede long-term effectiveness of themarkets.
We turn now to more specific observations about the PX energy markets and their relation tothe ISO's ancillary-services markets. These remarks are based on our time-limited studyconcentrating on the performance of the PX market, the behaviors of key participants in thatmarket, and the interactions between the PX market and the ISO's markets for ancillaryservices.
First, the PX Day-Ahead market has functioned smoothly since its inception in April. TheHour-Ahead market is too new to analyze, though we are concerned about how slowlyactivity is developing there. The Day-Ahead market is large with a number of participants. Ithas, however, seen some very high prices during July and August. Our review of the datagives us some cause for concern about the ability of a small number of participants to affectprices at times of high demand. This is an area that we have been watching and will continueto follow carefully, particularly since high prices on the PX market have a larger impact onthe overall cost of electricity in California than do comparable Ancillary Services prices.
Second, while high prices have been of concern in the PX Day-Ahead market, they have beenof even more concern in some of the ISO's Ancillary Services markets. Indeed, the level ofthose prices gave rise to the ISO's request to the FERC, which in turn led the FERC to call forthis report. The very high Ancillary Services prices reflect an insufficiency of supply offersrelative to demand at particular times, which can then bestow significant market power on thegenerators that provide ancillary services. The principal solution to this problem is the entryof new units and new participants into the ancillary services markets. That is, insofar as thesupply-side problem is structural in character, it requires a structural solution.
Steps must be taken to encourage entry in the short and long run. Removing restrictions onwho is allowed to participate in the various markets, as the ISO has recently done with out-of-control-area generators, is one way to enhance entry in the near term. To the extent thatsome loads can be reduced as fast as generators can ramp, encouraging demand-side biddingfor ancillary services is another means to increase supply, perhaps even in the short term.Furthermore, Regulatory Must-Run contracts should be considered in the overall context ofthe provision of system reserves. The incentives in those contracts should be structured sothat owners of such units are not inefficiently induced to withdraw from the energy market orthe ancillary services markets.

PX Market Report 27
While supply-side development is essential to the long-term success of the Ancillary Servicesmarkets, it is also important that the ISO's demand for Ancillary Services be rational andresponsive to economic incentives, while staying within the bounds of regulatory constraintsand reliability objectives. The overall level and composition of ancillary services bought bythe ISO should be determined in an integrated and economic way. System securityconstraints should be met by procuring the least-cost mix of the several ancillary services.For example, the ISO should be able to substitute among types of reserves when a moreflexible type is available at a lower price. When energy prices are below reserves prices,energy too should be considered in the mix. Furthermore when some Ancillary Services'prices are very high, the ISO should continue to make the judgment to purchase less of them,as it apparently did for Replacement Reserves when the price would have reached $10,000per MW.
Third, the current market problems are sufficiently severe that they call for short-termintervention in the market, such as price caps. This will reduce deleterious market outcomesand provide "breathing room" for the development and introduction of long-termimprovements. If generators in the Ancillary Services markets have and exerciseconsiderable market power in the short run it will induce inefficient behavior that will spillover to the energy market. Since the Day-ahead energy market clears before AncillaryServices bids are submitted, a firm wishing to bid in the Ancillary Services markets will haveto offer less capacity in the Day-ahead market. Although most of the time such a bid mightearn little, the prospect of a lottery-type win for a few hours in one or another of the reservemarkets could suffice to make the strategy worthwhile. While we expect that prices wouldeventually equilibrate on average in the different markets, they would do so only withconsiderable distortion among the various markets. Unit commitments and other decisionswould be distorted by the inaccurate price signals. Furthermore, allowing the exercise ofunbridled market power could lead to substantial wealth transfers and cause political pressurefor re-regulation, thereby undermining the possibility of having successful markets in thelong term. In short, the Committee is persuaded of the need for short-term marketinterventions, perhaps in the form of price caps, to cope with serious, market-impairingstructural problems.
It is important, however, to minimize the long-term effects of any short-term intervention thatis made to cope with such market power. For example, the introduction of price caps mayimpede future entry if potential entrants worry about the possible imposition of additionalcaps. The extenuating circumstances justifying the intervention should be made clear anddistinguished from the ordinary course of market events in a well-functioning market, and thetemporary character of the intervention should be emphasized. Maintaining the credibility ofthe market and its institutions is essential.
The price cap level, if that is the intervention chosen, must be carefully selected. The pricecap needs to be set at a level that will provide the entry that we seek as the long-term solutionto the structural problem. Given the linkages among markets, a price cap imposed on oneancillary service market will have an effect on the others and on the several energy markets aswell. A cap that is too high or too low may distort behavior in one of those complementarymarkets. In particular, in setting the price cap, and comparing it with energy prices, it is

PX Market Report 28
important to bear in mind that Ancillary Services give an option to buy energy at the real-time price.
Finally, although the Committee believes that some short-term market interventions, perhapsin the form of price caps, are appropriate, it believes that low, participant-specific price capsconsisting of cost-based rates for Ancillary Services are inappropriate. The cost-based -raterules that are still in effect for some participants set the prices for those suppliers well belowthe prices that generally clear the energy markets during times of high demand. Thus, if thosecost-based rates are imposed on a participant, that agent has an incentive to not offer capacityto Ancillary Services and instead to sell all its capacity in one of the energy markets.Although this restrains prices in the energy markets, it does so at the cost of distorting thesignals about the relative value of ancillary services and energy. With cost-based capsimposed on some participants, inefficient quantities are offered to the Ancillary Servicesmarkets. This in turn could lead the ISO to resort to mandatory orders to generators toprovide such services and further distortions of participant behavior and of prices. Werecommend removing the cost-based rate caps that remain in effect.