Report on EURAMET Bilateral Line-scale … on EURAMET Bilateral Line-scale Comparison EURAMET...
17
Report on EURAMET Bilateral Line-scale Comparison <Euramet #1320> EURAMET L-K7.2014 Final Report J. SALGADO (LNE), Nurul Alfiyati (KIM-LIPI) Paris, June 2015
-
Upload
truongkhanh -
Category
Documents
-
view
239 -
download
3
Transcript of Report on EURAMET Bilateral Line-scale … on EURAMET Bilateral Line-scale Comparison EURAMET...
Report on EURAMET
Bilateral Line-scale Comparison
<Euramet #1320>
EURAMET L-K7.2014
Final Report
J. SALGADO (LNE),
Nurul Alfiyati (KIM-LIPI)
Paris, June 2015
EURAMET L-K7.2014 Line-scale Bilateral Comparison
Pg. 2/17
Contents
1 Document control ................................................................................................................................ 3 2 Introduction ......................................................................................................................................... 3 3 Organization ......................................................................................................................................... 3
3.1 Participants .................................................................................................................................. 3 3.2 Schedule ....................................................................................................................................... 4
4 Artefacts ............................................................................................................................................... 4 4.1 Description of artefacts ............................................................................................................... 4 4.2 Stability of artefacts ..................................................................................................................... 5 4.3 Condition of artefacts at start/end of comparison ..................................................................... 5
5 Measuring instructions ........................................................................................................................ 5 5.1 Measurands ................................................................................................................................. 5
6 Results .................................................................................................................................................. 6 6.1 Results and standard uncertainties as reported by participants................................................. 6 6.2 Measurement uncertainties ........................................................................................................ 8
6.2.1 KIM-LIPI ................................................................................................................................ 8 7 Analysis ................................................................................................................................................ 9
7.1 Calculation of the KCRV ............................................................................................................... 9 7.2 Calculation of Degrees of Equivalence ...................................................................................... 12 7.3 Discussion of results .................................................................................................................. 14 7.4 Linking of result to other comparisons ...................................................................................... 14
8 Appendix A Equipment and measuring processes of the participants .............................................. 14 8.1 LNE ............................................................................................................................................. 14
8.1.1 Leitz Photoelectric microscope .......................................................................................... 15 9 Other measurement conditions ........................................................................................................ 16
9.1 KIM-LIPI ...................................................................................................................................... 17

EURAMET L-K7.2014 Line-scale Bilateral Comparison
Pg. 3/17
1 Document control
Version Draft A.1 Issued on 1 December 2014. Version Draft A.2 Issued on 4 December 2014 Version Draft B.1 Issued on 17 February2015 Final report Issued on 17 June 2015
2 Introduction
The metrological equivalence of national measurement standards and of calibration certificates issued by national metrology institutes is established by a set of key and supplementary comparisons chosen and organized by the Consultative Committees of the CIPM or by the regional metrology organizations in collaboration with the Consultative Committees.
The comparison is organised within the EU-Indonesia Trade Support Programme II, Sub-project Number APE12-06b, “Improvement of traceability of Metrology and Calibration measurements of Puslit KIM”.
Two National Metrology Institutes take part in this comparison: LNE (France) and KIM-LIPI (Indonesia).
LNE is acting as the pilot laboratory and in this function is responsible for providing the travelling standard, the evaluation of the measurement results and the final report.
The comparison will be accomplished in accordance with the EURAMET Guidelines on Conducting Comparisons and BIPM Guidelines for Planning, Organising, Conducting and Reporting Key, Supplementary and Pilot Comparisons.
The comparison was registered in BIPM KCDB; artefact circulation started in August 2014 and was completed in October 2014.
3 Organization
3.1 Participants
Table 1. List of participant laboratories and their contacts.
Laboratory Code
Contact person, Laboratory Phone, Fax, email
LNE Mr. José SALGADO LNE Laboratoire National de Métrologie et d’Essais 1, rue Gaston Boissier F-75015 Paris France
Tel. +33 1 40 43 39 57 Fax +33 1 40 43 37 37 e-mail: [email protected]
KIM-LIPI Ms. Nurul Alfiyati KIM-LIPI: Pusat Penelitian Kalibrasi, Instrumentasi, dan Metrologi Lembaga Ilmu Pengetahuan Indonesia (Puslit KIM-LIPI) Kompleks PUSPIPTEK Gedung 420 Tangerang Selatan, Banten Indonesia
Tel. +62-21-7560533 ext 3078 Fax. +62-21-7560568 e-mail: [email protected]

EURAMET L-K7.2014 Line-scale Bilateral Comparison
Pg. 4/17
3.2 Schedule
Table 2. Schedule of the comparison.
RMO Laboratory Original schedule
Date of measurement
Results received
EURAMET LNE August 2014 August 2014 November 2014
APMP KIM-LIPI September 2014 Sept- Oct 2014 November 2014
EURAMET LNE October 2014 Oct – Nov 2014 November 2014
4 Artefacts
4.1 Description of artefacts
The measurement artefact is a high precision glass scale from HEINDENHAIN belonging to LNE (ref manufacturer 297 634-02, sn 9 026 940) of 300 mm long with a line each millimeter.
Figure 1 : Heindenhain line-scale dimensions.

EURAMET L-K7.2014 Line-scale Bilateral Comparison
Pg. 5/17
The scale is made of glass (B 270) with a given value of CTE α = 9.4.10
-6 K
-1 given by the manufacturer. A
standard uncertainty of 1.10-6 K-1 should be taken for the uncertainty budget.
The graduation line thickness is 4 µm. The overall dimensions on the scale are 330 mm for total length, 30 mm for the width and 20 mm for thickness. The line scale is contained in a wooden box.
4.2 Stability of artefacts
Figure 2. Stability of the line scale: upper graphs, deviation from nominal distance d measured by LNE, on left side from 0 to 300 mm every 10 mm, on the right side from 0 to 10 mm every mm. Lower graphs, the difference between August and November measurements. Error bars show standard uncertainty (k=1).
Acting as pilot, LNE has measured the line-scale twice. First measurement was performed on August 1st; the second measurement was performed on November 7th. The deviation from nominal distance d, is plotted on the upper graphs Figure 2. The differences between second measurement and first measurement is plotted on the lower graphs Figure 2, where the errors bars represents the standard uncertainties (k=1). No significant drift is seen within the reported uncertainties at 95% confidence level (k=2).
4.3 Condition of artefacts at start/end of comparison
No significant damage to the scale has been seen during the comparison.
5 Measuring instructions
5.1 Measurands
Before calibration, the line scale must be inspected for damage. No cleaning of the scale should be tried besides blowing away dust particles using dry, clean air or other clean gases.

EURAMET L-K7.2014 Line-scale Bilateral Comparison
Pg. 6/17
It is recommended to support the measurement object at the Airy points, held only by their gravity forces. If additional clamping of the scale is required during measurement, e.g. because of a fast moving carriage, it is recommended to lightly pinch the scale on the sides at one of the Airy support points. The participants are asked to describe the line scale support.
The measurement result to be reported is the distance from the zero line to the measured line at 20°C according Table 3.
Table 3: Distances to measure
Distance range Pitch
0 mm to 10 mm 1 mm
10 mm to 300 mm 10 mm
The air and material temperatures during measurement should be reported also.
The measurand was the deviation from nominal length at the centre of each line, d = lc - ln
6 Results
6.1 Results and standard uncertainties as reported by participants
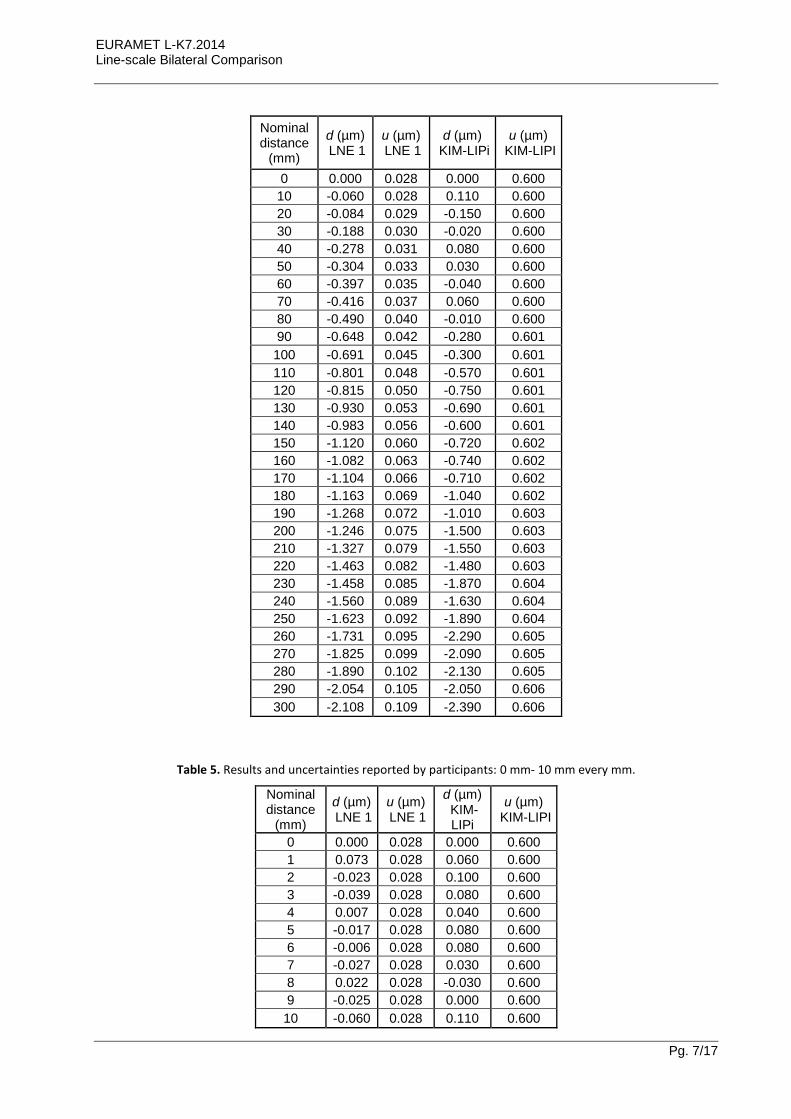
The results reported by the participants are plotted in Figure 3. Values of the deviation from nominal length and measurement uncertainties are given Table 4 and Table 5.
Only first measurement made by LNE is shown, and will be taken into account for assessing the KCRV.
Figure 3: Comparison between LNE and KIM-LIPI results. On the left results for nominal distance 0 mm-10 mm with a pitch of 1 mm. On the right results for 0 mm-300 mm with a pitch of 10 mm. Errors bars corresponds to the standard uncertainty (k=1).
Table 4: Results and uncertainties reported by participants: distance 0 mm- 300mm every 10 mm.
EURAMET L-K7.2014 Line-scale Bilateral Comparison
Pg. 7/17
Nominal distance
(mm)
d (µm) LNE 1
u (µm) LNE 1
d (µm) KIM-LIPi
u (µm) KIM-LIPI
0 0.000 0.028 0.000 0.600
10 -0.060 0.028 0.110 0.600
20 -0.084 0.029 -0.150 0.600
30 -0.188 0.030 -0.020 0.600
40 -0.278 0.031 0.080 0.600
50 -0.304 0.033 0.030 0.600
60 -0.397 0.035 -0.040 0.600
70 -0.416 0.037 0.060 0.600
80 -0.490 0.040 -0.010 0.600
90 -0.648 0.042 -0.280 0.601
100 -0.691 0.045 -0.300 0.601
110 -0.801 0.048 -0.570 0.601
120 -0.815 0.050 -0.750 0.601
130 -0.930 0.053 -0.690 0.601
140 -0.983 0.056 -0.600 0.601
150 -1.120 0.060 -0.720 0.602
160 -1.082 0.063 -0.740 0.602
170 -1.104 0.066 -0.710 0.602
180 -1.163 0.069 -1.040 0.602
190 -1.268 0.072 -1.010 0.603
200 -1.246 0.075 -1.500 0.603
210 -1.327 0.079 -1.550 0.603
220 -1.463 0.082 -1.480 0.603
230 -1.458 0.085 -1.870 0.604
240 -1.560 0.089 -1.630 0.604
250 -1.623 0.092 -1.890 0.604
260 -1.731 0.095 -2.290 0.605
270 -1.825 0.099 -2.090 0.605
280 -1.890 0.102 -2.130 0.605
290 -2.054 0.105 -2.050 0.606
300 -2.108 0.109 -2.390 0.606
Table 5. Results and uncertainties reported by participants: 0 mm- 10 mm every mm.
Nominal distance
(mm)
d (µm) LNE 1
u (µm) LNE 1
d (µm) KIM-LIPi
u (µm) KIM-LIPI
0 0.000 0.028 0.000 0.600
1 0.073 0.028 0.060 0.600
2 -0.023 0.028 0.100 0.600
3 -0.039 0.028 0.080 0.600
4 0.007 0.028 0.040 0.600
5 -0.017 0.028 0.080 0.600
6 -0.006 0.028 0.080 0.600
7 -0.027 0.028 0.030 0.600
8 0.022 0.028 -0.030 0.600
9 -0.025 0.028 0.000 0.600
10 -0.060 0.028 0.110 0.600

EURAMET L-K7.2014 Line-scale Bilateral Comparison
Pg. 8/17
6.2 Measurement uncertainties
Participants had to report their uncertainty budget.
6.2.1 LNE
Table 6: LNE’s uncertainty budget.
Source Distrib. u(xi) unit ni ci = dl/xi ui(dl) /nm
Repeatability of centre line detection SE
/ 25 nm 200 1 25 nm
Air wavelength (including tair,Pair,RH air, CCO2,
l0, formulas)
N 0.06 10-6
L 12 1 0.06 10-6
L
Dl res Interferometer resolution
R 4 nm 200 1 4 nm
Errors of interferometer alignment dlli
R 0.02 10-6 L 50 1 0.02 10-6 L
Errors of scale alignment dlSi
R 0.003 10-6 L 50 1 0.003 10-6 L
Dts scale temperature
N 0.28 10-6 L 12. 1 0.28 10-6 L
az,cr (assumed ± 1 10-6 K-1) N 0.17 10-6 L 50 1 0.17 10-6 L
dlAi Abbe offset N 11 nm 12 1 11 nm
Qu 28 nm 0.35 10-6 L
QU 56 nm 0.70 10-6 L
The expanded uncertainty with a coverage factor (k=2) 95% is: Q[56, 0.7 L] in nm with L in mm.
Remark: This uncertainty is slightly different from LNE’s CMC (Q[50, 0.8 L]), which was assessed for a CTE of 11.5 10-6 K-1 instead of 9.2 10-6 here.
6.2.2 KIM-LIPI
Table 7. Standard uncertainty budget reported by KIM-LIPI.
Constant uncertainty components

EURAMET L-K7.2014 Line-scale Bilateral Comparison
Pg. 9/17
Uncertainty source Unit Distr. Semi-range or Exp.uncert. or Std. dev.
Div. Deg. Of freedom/vi
Std. Unc./ ci
Sens. Coeff/ ci
ci.ui
Repeatability (ls3) µm N. 0.1 3.162 9 0.0316 2 0.063 Display resolution (ls2)
µm Rect 0.05 1.732 10000 0.0289 2 0.058
Calibration of laser interferometer (ls1)
µm N. 0.08 2 10000 0.0410 1 0.041
Line detection (lW) µm Rect 0.5 1.732 200 0.2887 2 0.577 Abbe error (la) µm Rect 0.2 1.732 50 0.115 1 0.115
Combined uncertaity (uc) for constant uncertainty components (µm) 0.5964
Effective degree of freedom 226
Length-dependent uncertainty components
Uncertainty source Unit Distr. Semi-range or Exp.uncert. or Std. dev.
Div. Deg. Of freedom/ vi
Std. Unc. /ci
Sens. Coeff/ ci
ci.ui
Interferometer Calibration of laser interferometer (ls1)
µm N 0.024 L 2 10000 0.012 L 1 0.012 L
Air temperature (tair)
oC N 0.07 2 10000 0.04 9.6E-07 L 3.36E-08 L
Air pressure (pair) Pa N 50 2 10000 25 2.7E-09 L 6.75E-08 L Material
Temperature
Temperature difference (δθ)
oC Rect 0.50 1.732 12.5 0.29 9.4E-06 L 2.71E-06 L
Thermal exp. Cofficient (δα) / oC Rect 2.0E-06 1.732 50 1.15E-
06 0.5 L 5.77E-07 L
Cosine error (IG) µm Rect 0.5 L 1.732 200 0.29 L 1 0.29 L
Combined uncertaity (uc) for length-dependent uncertainty components (µm) 0.289 L
Effective degree of freedom 201
Total combined uncertainty, uc (L in m) Q[0.60, 0.29 L] µm
Expanded Uncertainty at k = 2 (L in m) U = Q[1.2, 0.58 L] µm
KIM-LIPI’s CMC is Q[50, 0.8 L] in µm , L in m. KIM-LIPI have revised their uncertainties to Q[1.3, 1.4 L], which are still in review by APMP.
7 Analysis
7.1 Calculation of the KCRV
Following the recommendations of CCL MRA, we use the weighted mean to compute the reference value. For the following calculations only one of LNE’s (LNE1) results have been taken into account.

EURAMET L-K7.2014 Line-scale Bilateral Comparison
Pg. 10/17
The analysis for each measurand proceeds as follows:
Each laboratory reports a measured value, xi , and its associated standard uncertainty u(xi).
We compute the normalised weight, wi , for the result xi is given by:
21
i
ixu
Cw (1)
where the normalising factor, C, is given by:
2
1
1
1
I
i ixu
C (2)
Then calculate the weighted mean, wx , which is given by:
I
i
iiw xwx1
(3)
The uncertainty of the weighted mean is calculated by:
C
xu
xuI
i i
w
2
1
1
1)( (4)
After deriving the weighted mean and its associated standard uncertainty, the deviation of each laboratory’s result from the weighted mean is determined simply as wi xx . The uncertainty of this deviation is calculated as a combination of the uncertainties of the result, u(xi) , and the uncertainty of the weighted mean )( wxu . The uncertainty of the deviation from the weighted mean is given by equation (5), which includes a minus sign to take into account the correlation between the two uncertainties (it would be a plus sign if dealing with uncorrelated uncertainties, such as when comparing data from two separate laboratories).
2int
2
wiwi xuxuxxu (5)
For the determination of the key comparison reference value KCRV, statistical consistency of the results contributing to the KCRV is required. A check for statistical consistency of the results with their associated uncertainties can be made by calculating the En value for each laboratory’s result, where En is defined as the ratio of the deviation from the weighted mean, divided by the expanded uncertainty of this deviation – the expanded uncertainty is obtained from the standard uncertainty by multiplying by a suitable value of k to obtain a 95 % confidence level.
2int
2
wi
wi
n
xUxU
xxE
(6)
This process is iterated until there are no inconsistent results contributing to the weighted mean.
Sometimes, a situation is reached where there are two results that need to be excluded, but exclusion of one of the results causes the other result to become consistent, and vice versa. The pilot has to
EURAMET L-K7.2014 Line-scale Bilateral Comparison
Pg. 11/17
choose which one to exclude. The choice may require further iterations since it is the largest consistent subset that is required and this may require exploration of both options of which to exclude first.
After reaching consistency, the calculated weighted mean is the KCRV.
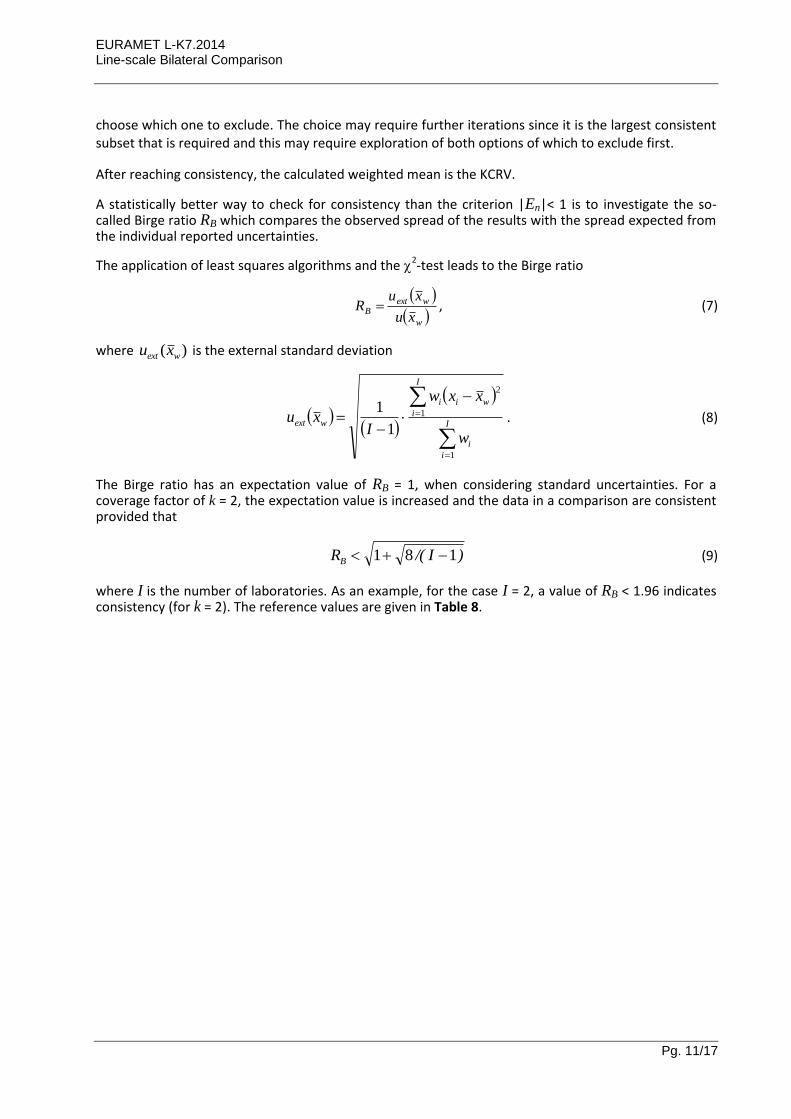
A statistically better way to check for consistency than the criterion |En|< 1 is to investigate the so-called Birge ratio RB which compares the observed spread of the results with the spread expected from the individual reported uncertainties.
The application of least squares algorithms and the 2-test leads to the Birge ratio
w
wextB
xu
xuR , (7)
where )( wext xu is the external standard deviation
I
i
i
I
i
wii
wext
w
xxw
Ixu
1
1
2
1
1. (8)
The Birge ratio has an expectation value of RB = 1, when considering standard uncertainties. For a coverage factor of k = 2, the expectation value is increased and the data in a comparison are consistent provided that
)I/(RB 181 (9)
where I is the number of laboratories. As an example, for the case I = 2, a value of RB < 1.96 indicates consistency (for k = 2). The reference values are given in Table 8.

EURAMET L-K7.2014 Line-scale Bilateral Comparison
Pg. 12/17
Table 8: Key comparison reference value wx and associated standard uncertainty )( wxu and Birge
ratio.
Nominal distance
(mm) wx )( wxu |En|
LNE
|En|
KIM-LIPI RB
0 0.000 0.028 0.00 0.00 0.00
1 0.072 0.028 0.01 0.01 0.02
2 -0.023 0.028 0.10 0.10 0.20
3 -0.039 0.028 0.10 0.10 0.20
4 0.007 0.028 0.03 0.03 0.05
5 -0.017 0.028 0.08 0.08 0.16
6 -0.006 0.028 0.07 0.07 0.14
7 -0.027 0.028 0.05 0.05 0.09
8 0.021 0.028 0.04 0.04 0.09
9 -0.025 0.028 0.02 0.02 0.04
10 -0.060 0.028 0.14 0.14 0.28
20 -0.084 0.029 0.05 0.05 0.11
30 -0.187 0.030 0.14 0.14 0.28
40 -0.277 0.031 0.30 0.30 0.60
50 -0.303 0.033 0.28 0.28 0.56
60 -0.396 0.035 0.30 0.30 0.59
70 -0.414 0.037 0.40 0.40 0.79
80 -0.488 0.040 0.40 0.40 0.80
90 -0.646 0.042 0.31 0.31 0.61
100 -0.689 0.045 0.32 0.32 0.65
110 -0.800 0.047 0.19 0.19 0.38
120 -0.814 0.050 0.05 0.05 0.11
130 -0.928 0.053 0.20 0.20 0.40
140 -0.980 0.056 0.32 0.32 0.63
150 -1.116 0.059 0.33 0.33 0.66
160 -1.078 0.062 0.28 0.28 0.56
170 -1.099 0.065 0.32 0.32 0.65
180 -1.162 0.068 0.10 0.10 0.20
190 -1.264 0.072 0.21 0.21 0.43
200 -1.249 0.075 0.21 0.21 0.42
210 -1.330 0.078 0.18 0.18 0.37
220 -1.464 0.081 0.01 0.01 0.03
230 -1.466 0.084 0.34 0.34 0.68
240 -1.561 0.088 0.06 0.06 0.12
250 -1.629 0.091 0.22 0.22 0.44
260 -1.781 0.094 0.43 0.43 0.85
270 -1.832 0.097 0.22 0.22 0.43
280 -1.897 0.101 0.20 0.20 0.39
290 -2.054 0.104 0.00 0.00 0.01
300 -2.117 0.107 0.23 0.23 0.46
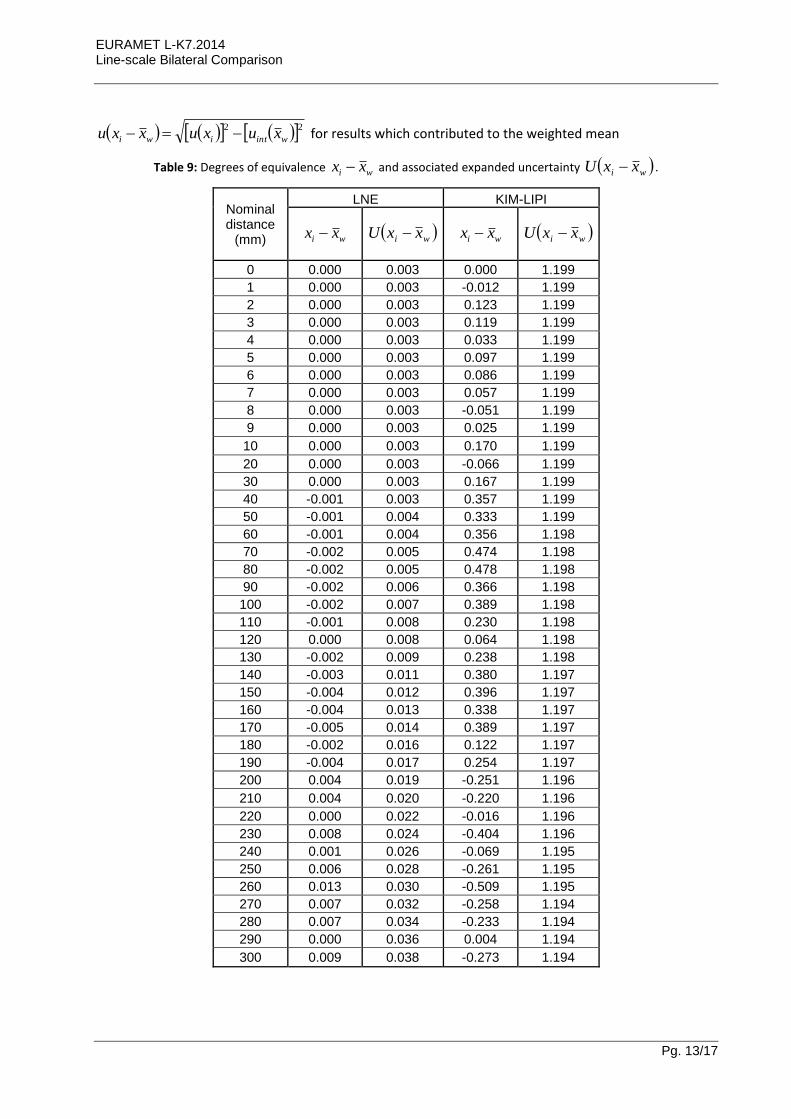
7.2 Calculation of Degrees of Equivalence
The Degree of Equivalence, DoE, for a laboratory result xi is calculated simply as wi xx . The standard
uncertainty of the DoE is calculated using
EURAMET L-K7.2014 Line-scale Bilateral Comparison
Pg. 13/17
22
wintiwi xuxuxxu for results which contributed to the weighted mean
Table 9: Degrees of equivalence wi xx and associated expanded uncertainty wi xxU .
Nominal distance
(mm)
LNE KIM-LIPI
wi xx wi xxU wi xx wi xxU
0 0.000 0.003 0.000 1.199
1 0.000 0.003 -0.012 1.199
2 0.000 0.003 0.123 1.199
3 0.000 0.003 0.119 1.199
4 0.000 0.003 0.033 1.199
5 0.000 0.003 0.097 1.199
6 0.000 0.003 0.086 1.199
7 0.000 0.003 0.057 1.199
8 0.000 0.003 -0.051 1.199
9 0.000 0.003 0.025 1.199
10 0.000 0.003 0.170 1.199
20 0.000 0.003 -0.066 1.199
30 0.000 0.003 0.167 1.199
40 -0.001 0.003 0.357 1.199
50 -0.001 0.004 0.333 1.199
60 -0.001 0.004 0.356 1.198
70 -0.002 0.005 0.474 1.198
80 -0.002 0.005 0.478 1.198
90 -0.002 0.006 0.366 1.198
100 -0.002 0.007 0.389 1.198
110 -0.001 0.008 0.230 1.198
120 0.000 0.008 0.064 1.198
130 -0.002 0.009 0.238 1.198
140 -0.003 0.011 0.380 1.197
150 -0.004 0.012 0.396 1.197
160 -0.004 0.013 0.338 1.197
170 -0.005 0.014 0.389 1.197
180 -0.002 0.016 0.122 1.197
190 -0.004 0.017 0.254 1.197
200 0.004 0.019 -0.251 1.196
210 0.004 0.020 -0.220 1.196
220 0.000 0.022 -0.016 1.196
230 0.008 0.024 -0.404 1.196
240 0.001 0.026 -0.069 1.195
250 0.006 0.028 -0.261 1.195
260 0.013 0.030 -0.509 1.195
270 0.007 0.032 -0.258 1.194
280 0.007 0.034 -0.233 1.194
290 0.000 0.036 0.004 1.194
300 0.009 0.038 -0.273 1.194

EURAMET L-K7.2014 Line-scale Bilateral Comparison
Pg. 14/17
7.3 Discussion of results
From Table 8 we can see that all the reported results are consistent: En values < 1 and RB < 1.96. Since the uncertainties from LNE and KIM-LIPI are very different, the weighted mean gives reference values, which are very close to LNE’s values. No outliers are seen for the 39 deviation to nominal distance, the comparison is successful.
7.4 Linking of result to other comparisons
The results of this comparison will be able to be linked, through LNE, to the coming APMP L-K7 comparison where LNE is participating. Until the results from APMP L-K7 are published no link can be provided, neither if LNE is failing during this comparison.
7.5 Conclusions regarding CMCs
1- LNE’s existing CMCs are supported
2- The revised CMC claims at KIM-LIPI are supported.
8 Appendix A Equipment and measuring processes of the participants
8.1 LNE
In A) a free description can be given including drawings and references, whereas in B) a tabular form has to be filled out. Please add requested line profile image on “0” line under A). A) Description of the measurement methods and instruments

EURAMET L-K7.2014 Line-scale Bilateral Comparison
Pg. 15/17
p la n d e g ra v u re
A B
C
H
d
The X value of the intersection of the optical axis of the microscope with the plane of the lines is known through 3 interferometric axis. Abbe principle could be respected indirectly as the position of the 3 reflectors according to the intersection point is known. B) Tabular description of the measurement methods and instruments Line detection
Parameters Parameters used for the measurement
Microscope type: 8.1.1 Leitz Photoelectric microscope
Light source White light
Wavelength(s) /
Slit length 0,1 mm
Slit width 2 µm
Polarization /
Coherence /
Aperture/magnification 10 x

EURAMET L-K7.2014 Line-scale Bilateral Comparison
Pg. 16/17
Detection mode Position of a line obseved through a vibrating slit
Detection principle The position of the line is detected as the signal given by the photomultiplicator passes by a minimum value.
Detection velocity 5 µm/s
Sampling frequency (image/interferometer)
The microscope deliver a signal as the centre line is detected by the microscope
Edge detection criterion /
Edge detection short term repeatability (1s)
About 40 to 60 nm (depending of line and scale)
Displacement measurement
Parameters Parameters normally used for the measurement equipment
Achievable standard uncertainty for measurands
Interferometer light source / wavelength
633 nm 4 fm
Resolution of displac. Interferometer
0.01 µm
Interferometer medium
Refractive index:
=> refractometer: //
=> Edlen´s formula: Revised Edlen Formulas 1 10-8
Air temperature 20 °C 0.03 °C
Air pressure 1013 mbar 9 Pa
Air humidity 50 % 5 %
CO2-content 300 ppm 60 ppm
Guide error // //
Abbe offset corrected 18 nm
Alignment error:
Interferometer 0 negligible
Scale 0 0.28 10-6 L
9 Other measurement conditions
Parameters Parameters normally used for the measurement equipment
Achievable measurement uncertainty for measurands
Scale temperature 20 °C 0.03 °C
Number of repeat measurements in one scale position
10
Number of scale orientations
1
kind of support Gauge blocks at Airy points
clean room class no

EURAMET L-K7.2014 Line-scale Bilateral Comparison
Pg. 17/17
9.1 KIM-LIPI
The measurement was performed by using SIP 414 length measuring machine with a standard Agilent 5519 B laser interferometer. A standard linear interferometer, an Agilent 10751C air sensor, and 3 material temperature sensors were used. The artefact was placed on the transparent table illuminated from below by light source. An appropriate eyepiece of 81x objective magnification microscope with a central cross wire, were used to determine the line width and line quality of line-scale. The carriage of SIP machine was moved by hand wheel manually. The distance moved was shown from the display of interferometer system.
The length between two graduation lines is determined as the difference between the means of indicated position when the cross wire of the microscope is pointing at the left and right edge of the graduation lines. The measurement was carried out 3 times at each graduation line after 1 series of measurement was completed, except at a few exemplary lines which were measured at least ten times to determine the repeatability of the measurement. The line-scale was supported at the airy points by using gauge blocks with nominal length 5 mm during the measurement. The air temperature during the measurement was (20 ± 0.2) °C, air pressure was (100.51 ± 0.40) kPa, and relative humidity was 50 %.