
Report on Engineering exports to POLAND - eecegypt.org on... · •Egyptian engineering exports to...
20
POLAND Report on Engineering exports to 16 November 2016 1
Transcript of Report on Engineering exports to POLAND - eecegypt.org on... · •Egyptian engineering exports to...

POLANDReport on Engineering exports to
16 November 2016
1

Table of Contents PAGE
• Executive Summary 3
• Comparison between Egypt and POLAND 4
• Overview on POLAND Economy 5
• Overview on Egyptian Economy 9
• Egyptian Engineering Exports to the world 11
• Yearly Egyptian Engineering exports to POLAND 12
• Top Engineering sectors - Egypt exports to POLAND 12
• Top Engineering products – Egypt exports to POLAND 13
• Top Exporters ( countries ) to POLAND from engineering products 14
• POLAND's Engineering imports from the world 14
• Top Engineering Sectors POLAND imports from the world 15
• Top Engineering products POLAND imports from the world 16
• Political and commercial risks assessment 18
• International Conventions 18
• Non Tariff Barriers 19
• Customs Duties and Taxes on Imports 19
• Market Access Requirements 19
• Consumer Behavior 20
• Goods Transport in POLAND 20
2

Executive Summary
• Egyptian engineering exports to POLAND represented 0.1% from the total Egyptian engineering exports to the
world 2015 ( table 1 ).
• The yearly average value of Egyptian engineering exports to POLAND 2.5 Million USD from 2012 to 2015. • The Compound Annual Growth rate for the Egyptian Engineering exports to POLAND = -11% from 2012-2015 ( graph 1 ) • Top Engineering sectors - Egypt exports to POLAND : ( table 3 ) 1- Home Appliances sector represented 42.4% from total engineering exports to POLAND 2015. 2- Car Components sector represented 18.5%. 3- Brown Goods Sector represented 11.8%. 4- Electrical & Electronic Industries Sector represented 10.8%.
• Top ENG. Products Egypt exports to POLAND : ( table 4 ) 1- Electric instantaneous or storage water heaters and immersion heaters 2- Reception apparatus for television, colour, 3- Zinc waste and scrap. 4- Coaxial cable and other coaxial electric conductors, insulated 5- Parts suitable for use solely or principally with the apparatus of heading 8535, 8536 or 8537, n.e.s.. 6- Boards, panels, consoles, desks, cabinets and other bases for the goods of heading 8537, not equipped with their apparatus 7- Machines and mechanical appliances, n.e.s. 8- Boards, cabinets and similar combinations of apparatus for electric control or the distribution of electricity, for a voltage <= 1.000 V
• Top Countries POLAND imports the engineering products from : ( table 5 ) 1- Germany represented 24.1% from the total imports from the engineering products in 2015. 2- China represented 17.8%. 3- Italy represented 6.1%. 4- Czech Republic represented 3.6%.
• The yearly average value of POLAND's engineering imports from the world 91.3 Billion USD from 2012
to 2015. ( graph 3 )
• Top engineering products POLAND is importing from the world : Parts suitable for use solely or principally with transmission and reception apparatus for radio-broadcasting or television - Vessels for the transport of goods and vessels for the transport of both persons and goods - Telephones for cellular networks "mobile telephones" - Motor cars and other motor vehicles principally designed for the transport of persons - Tankers - Data-processing machines, automatic, portable, weighing <= 10 kg, - Parts and accessories of automatic data-processing machines - Electronic integrated circuits as processors and controllers, - Parts and accessories of bodies for Automotive - Road tractors for semi-trailers. ( table 7 )
3

POLANDEgypt VS
POLAND Egypt Source Flag
Map
CIA World Fact book
Capital Warsaw Cairo FITA
Population No. 38.5 Million $ 88.4 Million $ CIA World Fact book
GDP ( official exchange rate )
474.8 Billion $ 286.4 Billion $
World Bank
GDP – per capita 2015
26,500 $ 11,500 $ World Bank
GDP – Real Growth rate 2015
3.7% 4.2% CIA World Fact book
GDP – Composition , by sector of origin 2015
Agriculture : 3.3% Industry : 41.1% Services : 55.6%
Agriculture : 14.3% Industry : 39.6 % Services : 46.1%
CIA World Fact
book
Total exports 2015 194.4 Billion $ 18.6 Billion $ GOEIC/Trade Map Total imports 2015 189.6 Billion $ 65.3 Billion $ Trade Map Total Engineering Exports 2015
109.4 Billion $ 2.4 Billion $ GOEIC/Trade Map
Total Engineering Imports 2015
93.3 Billion $ 20.6 Billion $ Trade Map
GOEIC/Trade Map
Engineering exports to POLAND represent 0.1% from total engineering exports to the world 2015
( Table 1 )
4

Overview on POLAND Economy
World Fact book
Poland has pursued a policy of economic liberalization since 1990 and Poland's economy was the only EU country to avoid a recession through the 2008-09 economic downturn. Although EU membership and access to EU structural funds have provided a major boost to the economy since 2004, GDP per capita remains significantly below the EU average and the unemployment rate is now below the EU average. The government of Prime Minister Donald TUSK steered the Polish economy through the economic downturn by skillfully managing public finances and adopting controversial pension and tax reforms to further shore up public finances. While the Polish economy has performed well over the past five years, growth slowed in 2013 and picked back up in 2014-15. Poland’s new center-right Law and Justice government plans to introduce expansionary economic policies to spur long-term growth, but social spending programs are expected to lead to increased deficit spending over the medium term. Poland faces several challenges, which include addressing some of the remaining deficiencies in its road and rail infrastructure, business environment, rigid labor code, commercial court system, government red tape, and burdensome tax system, especially for entrepreneurs. Additional long-term challenges include diversifying Poland’s energy mix and sources of supply, strengthening investments in innovation, research, and development, and as well as stemming the outflow of educated young Poles to other EU member states, especially in light of a coming demographic contraction due to emigration, persistently low fertility rates, and the aging of the Solidarity-era baby boom generation
.
5

POLAND Source
GDP - composition, by end use 2015
Household consumption : 58.7% Government consumption: 18%
Investment in fixed capital: 20.1% Investment in inventories: -0.4%
Exports of goods and services: 49.4% Imports of goods and services: -46.6%
CIA World Fact book
Industrial production growth rate 2015
5.4% CIA World Fact book
Labor force 17.76 million CIA World Fact book
Labor force - by occupation
Agriculture : 12.6% Industry : 30.4%
Services : 57% 2012 CIA World Fact book
Unemployment rate 2015
10.5% CIA World Fact book
Population below poverty line
17.3% 2012 CIA World Fact book
Budget 2015 revenues: $76.65 Billion
expenditures: $87.95 Billion
CIA World Fact book
Taxes and other revenues 2015
16.1% of GDP CIA World Fact book
Budget surplus (+) or deficit (-)
-2.4 % of GDP CIA World Fact book
Public debt 2015 45% of GDP CIA World Fact book
Inflation rate (consumer prices) 2015
-0.9% CIA World Fact book
Central bank discount rate 31/12/2014
2.5% CIA World Fact book
Debt - external - 31/12/2015
$332.2 billion CIA World Fact book
Exchange rates 2015 zlotych (PLN) per US dollar -
3.7721 (2015 est.) CIA World Fact book
6

0 5 10 15 20 25 30
5,000
10,000
15,000
20,000
25,000
30,000
Institutions
Infrastructure
Macroeconomic environment
Health and primary
education
Higher education and training
Goods market efficiency
Labor market efficiency
Financial market development
Technological readiness
Market size
Business sophistication
Innovation
1
2
3
4
5
6
7
Key indicators, 2014
Population (millions) ........................................ 38.0GDP (US$ billions) ........................................ 546.6GDP per capita (US$) ................................. 14,379GDP (PPP) as share (%) of world total ............ 0.88
Global Competitiveness Index
GCI 2015–2016 ...................................................... 41 ..... 4.5GCI 2014–2015 (out of 144) ..................................... 43 ......4.5GCI 2013–2014 (out of 148) ..................................... 42 ......4.5GCI 2012–2013 (out of 144) ..................................... 41 ......4.5
Basic requirements (26.6%) .......................................44 ......4.91st pillar: Institutions ................................................. 58 ......4.12nd pillar: Infrastructure ............................................ 56 ......4.33rd pillar: Macroeconomic environment .................... 46 ......5.14th pillar: Health and primary education ................... 40 ......6.1
Efficiency enhancers (50.0%) .....................................34 ......4.65th pillar: Higher education and training ................... 31 ......5.16th pillar: Goods market efficiency ............................ 46 ......4.57th pillar: Labor market efficiency ............................. 81 ......4.18th pillar: Financial market development ................... 43 ......4.39th pillar: Technological readiness ............................ 41 ......4.810th pillar: Market size.............................................. 21 ......5.2
Innovation and sophistication factors (23.4%) ...........57 ......3.711th pillar: Business sophistication .......................... 55 ......4.112th pillar: Innovation ............................................... 64 ......3.3
The most problematic factors for doing business
Complexity of tax regulations .............................................21.3
Restrictive labor regulations ...............................................14.7
Tax rates ............................................................................12.8
Inefficient government bureaucracy ...................................11.1
Access to financing .............................................................7.8
Inadequate supply of infrastructure ......................................5.8
Policy instability ...................................................................5.1
Inadequately educated workforce ........................................5.1
Insufficient capacity to innovate ...........................................5.1
Poor work ethic in labor force ..............................................3.7
Poor public health ...............................................................2.5
Corruption ...........................................................................2.3
Government instability/coups ..............................................0.9
Crime and theft ...................................................................0.8
Inflation ................................................................................0.5
Foreign currency regulations ................................................0.4
Poland
Poland Emerging and Developing Europe
GDP (PPP) per capita (int’l $), 1990–2014
Rank Score(out of 140) (1–7)
Score*
2: Country/Economy Profiles
298 | The Global Competitiveness Report 2015–2016
Factordriven
Efficiencydriven
Innovationdriven
1 Transition 1–2 2 Transition
2 –3 3
Stage of development
* From the list of factors, respondents were asked to select the five most problematic for doing business in their country and to rank them between 1 (most problematic) and 5. The score corresponds to the responses weighted according to their rankings.
Poland Emerging and Developing Europe
© 2015 World Economic Forum 7

INDICATOR VALUE RANK/140
6th pillar: Goods market efficiency (cont’d.)6.06 No. procedures to start a business* .......................... 4 ............226.07 No. days to start a business* ............................... 30.0 ..........1126.08 Agricultural policy costs.......................................... 3.5 ............956.09 Prevalence of non-tariff barriers .............................. 4.3 ............656.10 Trade tariffs, % duty* .............................................. 1.2 ..............56.11 Prevalence of foreign ownership ............................. 5.0 ............376.12 Business impact of rules on FDI ............................. 4.6 ............646.13 Burden of customs procedures .............................. 4.4 ............496.14 Imports as a percentage of GDP* ........................ 46.7 ............706.15 Degree of customer orientation .............................. 5.0 ............426.16 Buyer sophistication ............................................... 3.2 ............87
7th pillar: Labor market efficiency7.01 Cooperation in labor-employer relations ................. 4.1 ............977.02 Flexibility of wage determination ............................. 5.6 ............287.03 Hiring and firing practices ....................................... 3.5 ............977.04 Redundancy costs, weeks of salary* .................... 18.8 ............837.05 Effect of taxation on incentives to work .................. 3.1 ..........1157.06 Pay and productivity ............................................... 4.1 ............657.07 Reliance on professional management ................... 4.3 ............637.08 Country capacity to retain talent ............................. 2.7 ..........1167.09 Country capacity to attract talent ........................... 2.4 ..........1267.10 Women in labor force, ratio to men* ..................... 0.82 ............67
8th pillar: Financial market development8.01 Availability of financial services ............................... 4.9 ............438.02 Affordability of financial services ............................. 4.8 ............438.03 Financing through local equity market .................... 3.6 ............688.04 Ease of access to loans ......................................... 2.6 ............898.05 Venture capital availability ....................................... 2.5 ............968.06 Soundness of banks .............................................. 5.4 ............488.07 Regulation of securities exchanges ........................ 4.6 ............488.08 Legal rights index, 0–12 (best)* ................................. 7 ............24
9th pillar: Technological readiness9.01 Availability of latest technologies ............................ 4.6 ............729.02 Firm-level technology absorption ............................ 4.2 ..........1019.03 FDI and technology transfer ................................... 4.5 ............639.04 Individuals using Internet, %* ............................... 66.6 ............469.05 Fixed-broadband Internet subscriptions/100 pop.* 23.8 ............369.06 Int’l Internet bandwidth, kb/s per user* ................ 90.4 ............339.07 Mobile-broadband subscriptions/100 pop.* ......... 62.3 ............40
10th pillar: Market size 10.01 Domestic market size index, 1–7 (best)* ................. 5.0 ............26 10.02 Foreign market size index, 1–7 (best)* .................... 5.7 ............24 10.03 GDP (PPP$ billions)* .......................................... 954.5 ............23 10.04 Exports as a percentage of GDP* ........................ 48.4 ............45
11th pillar: Business sophistication 11.01 Local supplier quantity ........................................... 5.1 ............22 11.02 Local supplier quality .............................................. 4.9 ............36 11.03 State of cluster development .................................. 3.6 ............81 11.04 Nature of competitive advantage ............................ 3.0 ..........100 11.05 Value chain breadth ................................................ 3.9 ............59 11.06 Control of international distribution ......................... 3.6 ............87 11.07 Production process sophistication .......................... 4.2 ............45 11.08 Extent of marketing ................................................ 4.5 ............47 11.09 Willingness to delegate authority ............................ 3.8 ............59
12th pillar: Innovation 12.01 Capacity for innovation ........................................... 3.9 ............72 12.02 Quality of scientific research institutions ................. 3.9 ............63 12.03 Company spending on R&D ................................... 3.1 ............84 12.04 University-industry collaboration in R&D ................. 3.5 ............73 12.05 Gov’t procurement of advanced tech products ...... 3.1 ............91 12.06 Availability of scientists and engineers .................... 4.2 ............53 12.07 PCT patents, applications/million pop.* .................. 8.6 ............40
INDICATOR VALUE RANK/140
1st pillar: Institutions1.01 Property rights ....................................................... 4.3 ............641.02 Intellectual property protection ............................... 4.0 ............651.03 Diversion of public funds ........................................ 3.9 ............481.04 Public trust in politicians ......................................... 2.4 ..........1001.05 Irregular payments and bribes ................................ 4.8 ............401.06 Judicial independence ............................................ 4.2 ............541.07 Favoritism in decisions of government officials ....... 3.1 ............691.08 Wastefulness of government spending ................... 2.9 ............871.09 Burden of government regulation ........................... 2.8 ..........1221.10 Efficiency of legal framework in settling disputes .... 3.7 ............701.11 Efficiency of legal framework in challenging regs. ... 3.1 ............971.12 Transparency of government policymaking ............. 3.6 ..........1061.13 Business costs of terrorism .................................... 5.7 ............431.14 Business costs of crime and violence..................... 5.2 ............391.15 Organized crime ..................................................... 5.4 ............491.16 Reliability of police services .................................... 4.1 ............751.17 Ethical behavior of firms ......................................... 4.1 ............551.18 Strength of auditing and reporting standards ......... 5.0 ............521.19 Efficacy of corporate boards .................................. 4.8 ............661.20 Protection of minority shareholders’ interests ......... 4.1 ............631.21 Strength of investor protection, 0–10 (best)* .......... 6.3 ............32
2nd pillar: Infrastructure2.01 Quality of overall infrastructure ............................... 4.1 ............682.02 Quality of roads ...................................................... 3.8 ............762.03 Quality of railroad infrastructure .............................. 3.1 ............512.04 Quality of port infrastructure ................................... 4.0 ............672.05 Quality of air transport infrastructure....................... 4.1 ............832.06 Available airline seat km/week, millions* ............. 391.0 ............512.07 Quality of electricity supply ..................................... 5.5 ............472.08 Mobile telephone subscriptions/100 pop.* ......... 156.4 ............172.09 Fixed-telephone lines/100 pop.* ........................... 13.2 ............77
3rd pillar: Macroeconomic environment3.01 Government budget balance, % GDP* ................. –3.5 ............783.02 Gross national savings, % GDP* .......................... 19.0 ............783.03 Inflation, annual % change* .................................... 0.0 ............663.04 General government debt, % GDP* ..................... 48.8 ............833.05 Country credit rating, 0–100 (best)* ...................... 73.4 ............31
4th pillar: Health and primary education4.01 Malaria cases/100,000 pop.* ................................M.F. ...........n/a4.02 Business impact of malaria ............................. N/Appl. ...........n/a4.03 Tuberculosis cases/100,000 pop.* ....................... 22.0 ............504.04 Business impact of tuberculosis ............................. 6.1 ............474.05 HIV prevalence, % adult pop.* ............................... 0.1 ..............14.06 Business impact of HIV/AIDS ................................. 6.1 ............404.07 Infant mortality, deaths/1,000 live births* ................ 4.5 ............324.08 Life expectancy, years* ......................................... 76.8 ............444.09 Quality of primary education ................................... 4.3 ............494.10 Primary education enrollment, net %* .................. 96.8 ............45
5th pillar: Higher education and training5.01 Secondary education enrollment, gross %* .......... 97.7 ............455.02 Tertiary education enrollment, gross %*................ 73.2 ............225.03 Quality of the education system ............................. 3.6 ............735.04 Quality of math and science education .................. 4.4 ............515.05 Quality of management schools ............................. 4.1 ............755.06 Internet access in schools ...................................... 4.8 ............465.07 Availability of specialized training services .............. 4.9 ............325.08 Extent of staff training ............................................ 4.0 ............65
6th pillar: Goods market efficiency 6.01 Intensity of local competition .................................. 5.3 ............486.02 Extent of market dominance .................................. 4.7 ............186.03 Effectiveness of anti-monopoly policy ..................... 4.0 ............506.04 Effect of taxation on incentives to invest ................. 3.3 ............966.05 Total tax rate, % profits* ....................................... 38.7 ............72
Poland
Notes: Values are on a 1-to-7 scale unless otherwise annotated with an asterisk (*). For further details and explanation, please refer to the section “How to Read the Country/Economy Profiles” on page 89.
The Global Competitiveness Index in detail
The Global Competitiveness Report 2015–2016 | 299
2: Country/Economy Profiles
© 2015 World Economic Forum8

0 5 10 15 20 25 30
3,000
6,000
9,000
12,000
15,000
Institutions
Infrastructure
Macroeconomic environment
Health and primary
education
Higher education and training
Goods market efficiency
Labor market efficiency
Financial market development
Technological readiness
Market size
Business sophistication
Innovation
1
2
3
4
5
6
7
Key indicators, 2014
Population (millions) ........................................ 86.7GDP (US$ billions) ........................................ 286.4GDP per capita (US$) ................................... 3,304GDP (PPP) as share (%) of world total ............ 0.87
Global Competitiveness Index
GCI 2015–2016 .................................................... 116 ..... 3.7GCI 2014–2015 (out of 144) ................................... 119 ......3.6GCI 2013–2014 (out of 148) ................................... 118 ......3.6GCI 2012–2013 (out of 144) ................................... 107 ......3.7
Basic requirements (40.0%) .....................................115 ......3.81st pillar: Institutions ................................................. 87 ......3.62nd pillar: Infrastructure ............................................ 91 ......3.43rd pillar: Macroeconomic environment .................. 137 ......2.84th pillar: Health and primary education ................... 96 ......5.3
Efficiency enhancers (50.0%) ...................................100 ......3.65th pillar: Higher education and training ................. 111 ......3.26th pillar: Goods market efficiency .......................... 115 ......4.07th pillar: Labor market efficiency ........................... 137 ......3.28th pillar: Financial market development ................. 119 ......3.29th pillar: Technological readiness ............................ 98 ......3.210th pillar: Market size.............................................. 24 ......5.1
Innovation and sophistication factors (10.0%) .........113 ......3.211th pillar: Business sophistication .......................... 89 ......3.712th pillar: Innovation ............................................. 120 ......2.7
The most problematic factors for doing business
Policy instability .................................................................11.8
Inefficient government bureaucracy ...................................10.5
Poor work ethic in labor force ............................................10.4
Inadequately educated workforce ......................................10.1
Access to financing .............................................................9.2
Inadequate supply of infrastructure ......................................7.2
Foreign currency regulations ................................................7.0
Government instability/coups ..............................................6.1
Inflation ................................................................................5.0
Crime and theft ...................................................................4.5
Restrictive labor regulations .................................................4.4
Corruption ...........................................................................4.1
Complexity of tax regulations ...............................................3.9
Tax rates ..............................................................................3.2
Insufficient capacity to innovate ...........................................1.5
Poor public health ...............................................................1.0
Egypt
Egypt Middle East, North Africa, and Pakistan
GDP (PPP) per capita (int’l $), 1990–2014
Rank Score(out of 140) (1–7)
Score*
2: Country/Economy Profiles
160 | The Global Competitiveness Report 2015–2016
Factordriven
Efficiencydriven
Innovationdriven
1 Transition 1–2 2 Transition
2 –3 3
Stage of development
* From the list of factors, respondents were asked to select the five most problematic for doing business in their country and to rank them between 1 (most problematic) and 5. The score corresponds to the responses weighted according to their rankings.
Egypt Middle East, North Africa, and Pakistan
© 2015 World Economic Forum 9

INDICATOR VALUE RANK/140
6th pillar: Goods market efficiency (cont’d.)6.06 No. procedures to start a business* .......................... 7 ............766.07 No. days to start a business* ................................. 8.0 ............426.08 Agricultural policy costs.......................................... 2.9 ..........1296.09 Prevalence of non-tariff barriers .............................. 4.0 ..........1056.10 Trade tariffs, % duty* ............................................ 14.0 ..........1326.11 Prevalence of foreign ownership ............................. 3.4 ..........1256.12 Business impact of rules on FDI ............................. 3.8 ..........1136.13 Burden of customs procedures .............................. 3.8 ............806.14 Imports as a percentage of GDP* ........................ 29.4 ..........1196.15 Degree of customer orientation .............................. 4.9 ............466.16 Buyer sophistication ............................................... 2.8 ..........121
7th pillar: Labor market efficiency7.01 Cooperation in labor-employer relations ................. 4.1 ............927.02 Flexibility of wage determination ............................. 5.0 ............707.03 Hiring and firing practices ....................................... 3.9 ............657.04 Redundancy costs, weeks of salary* .................... 36.9 ..........1307.05 Effect of taxation on incentives to work .................. 3.4 ..........1057.06 Pay and productivity ............................................... 3.2 ..........1267.07 Reliance on professional management ................... 3.1 ..........1337.08 Country capacity to retain talent ............................. 2.9 ..........1017.09 Country capacity to attract talent ........................... 2.7 ..........1087.10 Women in labor force, ratio to men* ..................... 0.33 ..........135
8th pillar: Financial market development8.01 Availability of financial services ............................... 3.4 ..........1298.02 Affordability of financial services ............................. 3.3 ..........1268.03 Financing through local equity market .................... 3.8 ............558.04 Ease of access to loans ......................................... 1.9 ..........1288.05 Venture capital availability ....................................... 2.5 ............918.06 Soundness of banks .............................................. 4.8 ............708.07 Regulation of securities exchanges ........................ 3.7 ..........1028.08 Legal rights index, 0–12 (best)* ................................. 2 ..........106
9th pillar: Technological readiness9.01 Availability of latest technologies ............................ 3.9 ..........1209.02 Firm-level technology absorption ............................ 3.8 ..........1269.03 FDI and technology transfer ................................... 4.4 ............759.04 Individuals using Internet, %* ............................... 31.7 ............959.05 Fixed-broadband Internet subscriptions/100 pop.* .. 3.7 ............919.06 Int’l Internet bandwidth, kb/s per user* .................. 9.3 ..........1019.07 Mobile-broadband subscriptions/100 pop.* ......... 43.5 ............68
10th pillar: Market size 10.01 Domestic market size index, 1–7 (best)* ................. 5.0 ............20 10.02 Foreign market size index, 1–7 (best)* .................... 5.1 ............46 10.03 GDP (PPP$ billions)* .......................................... 943.1 ............25 10.04 Exports as a percentage of GDP* ........................ 16.5 ..........131
11th pillar: Business sophistication 11.01 Local supplier quantity ........................................... 4.5 ............68 11.02 Local supplier quality .............................................. 3.8 ..........109 11.03 State of cluster development .................................. 4.3 ............32 11.04 Nature of competitive advantage ............................ 3.2 ............90 11.05 Value chain breadth ................................................ 3.7 ............73 11.06 Control of international distribution ......................... 3.0 ..........133 11.07 Production process sophistication .......................... 3.2 ..........108 11.08 Extent of marketing ................................................ 3.8 ..........113 11.09 Willingness to delegate authority ............................ 4.2 ............34
12th pillar: Innovation 12.01 Capacity for innovation ........................................... 3.1 ..........133 12.02 Quality of scientific research institutions ................. 2.6 ..........128 12.03 Company spending on R&D ................................... 2.4 ..........133 12.04 University-industry collaboration in R&D ................. 2.4 ..........132 12.05 Gov’t procurement of advanced tech products ...... 3.2 ............80 12.06 Availability of scientists and engineers .................... 4.3 ............45 12.07 PCT patents, applications/million pop.* .................. 0.6 ............77
INDICATOR VALUE RANK/140
1st pillar: Institutions1.01 Property rights ....................................................... 3.9 ............921.02 Intellectual property protection ............................... 3.2 ..........1081.03 Diversion of public funds ........................................ 3.5 ............611.04 Public trust in politicians ......................................... 2.8 ............831.05 Irregular payments and bribes ................................ 4.1 ............601.06 Judicial independence ............................................ 4.5 ............451.07 Favoritism in decisions of government officials ....... 4.1 ............251.08 Wastefulness of government spending ................... 2.2 ..........1271.09 Burden of government regulation ........................... 3.5 ............601.10 Efficiency of legal framework in settling disputes .... 3.4 ............821.11 Efficiency of legal framework in challenging regs. ... 3.4 ............701.12 Transparency of government policymaking ............. 3.7 ............991.13 Business costs of terrorism .................................... 2.7 ..........1381.14 Business costs of crime and violence..................... 2.9 ..........1271.15 Organized crime ..................................................... 3.7 ..........1221.16 Reliability of police services .................................... 3.3 ..........1101.17 Ethical behavior of firms ......................................... 3.8 ............811.18 Strength of auditing and reporting standards ......... 4.3 ............881.19 Efficacy of corporate boards .................................. 3.9 ..........1331.20 Protection of minority shareholders’ interests ......... 3.9 ............821.21 Strength of investor protection, 0–10 (best)* .......... 4.4 ..........113
2nd pillar: Infrastructure2.01 Quality of overall infrastructure ............................... 3.1 ..........1142.02 Quality of roads ...................................................... 3.0 ..........1102.03 Quality of railroad infrastructure .............................. 2.6 ............702.04 Quality of port infrastructure ................................... 4.3 ............552.05 Quality of air transport infrastructure....................... 4.8 ............532.06 Available airline seat km/week, millions* ............. 686.1 ............352.07 Quality of electricity supply ..................................... 3.5 ..........1012.08 Mobile telephone subscriptions/100 pop.* ......... 114.3 ............692.09 Fixed-telephone lines/100 pop.* ............................. 7.6 ............97
3rd pillar: Macroeconomic environment3.01 Government budget balance, % GDP* ............... –13.6 ..........1393.02 Gross national savings, % GDP* .......................... 13.2 ..........1103.03 Inflation, annual % change* .................................. 10.1 ..........1333.04 General government debt, % GDP* ..................... 90.5 ..........1243.05 Country credit rating, 0–100 (best)* ...................... 29.5 ..........105
4th pillar: Health and primary education4.01 Malaria cases/100,000 pop.* ................................. 0.0 ..............14.02 Business impact of malaria .................................... 6.8 ..............14.03 Tuberculosis cases/100,000 pop.* ....................... 16.0 ............354.04 Business impact of tuberculosis ............................. 6.7 ............164.05 HIV prevalence, % adult pop.* ............................... 0.1 ..............14.06 Business impact of HIV/AIDS ................................. 6.9 ..............14.07 Infant mortality, deaths/1,000 live births* .............. 18.6 ............824.08 Life expectancy, years* ......................................... 71.1 ............884.09 Quality of primary education ................................... 2.1 ..........1394.10 Primary education enrollment, net %* .................. 95.1 ............59
5th pillar: Higher education and training5.01 Secondary education enrollment, gross %* .......... 86.3 ............805.02 Tertiary education enrollment, gross %*................ 30.1 ............775.03 Quality of the education system ............................. 2.1 ..........1395.04 Quality of math and science education .................. 2.6 ..........1315.05 Quality of management schools ............................. 2.5 ..........1395.06 Internet access in schools ...................................... 2.6 ..........1325.07 Availability of specialized training services .............. 2.7 ..........1395.08 Extent of staff training ............................................ 2.7 ..........139
6th pillar: Goods market efficiency 6.01 Intensity of local competition .................................. 4.2 ..........1286.02 Extent of market dominance .................................. 3.3 ............996.03 Effectiveness of anti-monopoly policy ..................... 3.6 ............926.04 Effect of taxation on incentives to invest ................. 3.4 ............906.05 Total tax rate, % profits* ....................................... 45.0 ............98
Egypt
Notes: Values are on a 1-to-7 scale unless otherwise annotated with an asterisk (*). For further details and explanation, please refer to the section “How to Read the Country/Economy Profiles” on page 89.
The Global Competitiveness Index in detail
The Global Competitiveness Report 2015–2016 | 161
2: Country/Economy Profiles
© 2015 World Economic Forum 10

Egyptian Engineering Exports to the world :
Country Exports 2012 Exports 2013 Exports 2014 Exports 2015Percentage
2015Accumulated
Percentage1 SAUDI ARABIA 278,575,842 333,442,661 527,897,673 431,256,998 17.3% 17.3%2 UNITED ARAB EMIRATES 210,034,884 136,053,832 318,039,640 399,161,170 16.0% 33.3%3 UNITED KINGDOM 216,868,354 277,234,393 244,525,391 262,206,417 10.5% 43.9%4 ALGERIA 158,437,824 198,066,604 205,662,712 146,499,893 5.9% 49.7%5 QATAR 157,081,609 89,299,447 162,394,273 140,434,473 5.6% 55.4%6 IRAQ 91,369,547 163,228,147 309,519,228 126,957,239 5.1% 60.5%7 GERMANY 109,505,731 114,204,726 100,883,385 93,029,289 3.7% 64.2%8 KUWAIT 61,258,820 73,938,538 68,092,806 69,882,300 2.8% 67.0%9 FRANCE 120,296,055 75,295,335 97,240,087 64,535,612 2.6% 69.6%
10 LEBANON 93,836,305 81,212,833 82,367,083 62,617,753 2.5% 72.1%11 JORDAN 84,315,843 72,281,382 70,181,145 59,664,755 2.4% 74.5%12 MOROCCO 31,106,141 44,830,313 60,902,385 46,264,532 1.9% 76.4%13 TURKEY 51,663,969 41,013,281 26,610,155 43,260,077 1.7% 78.1%14 LIBYA 174,793,178 87,272,934 116,504,859 38,867,596 1.6% 79.7%15 SLOVAKIA 29,215,851 38,680,662 46,906,225 37,937,593 1.5% 81.2%16 SUDAN 59,134,290 49,163,749 31,174,918 35,521,654 1.4% 82.6%17 KENYA 30,782,565 23,793,342 23,167,163 30,135,594 1.2% 83.8%18 NIGERIA 17,433,606 22,698,507 18,138,337 28,961,020 1.2% 85.0%19 ITALY 35,754,176 24,833,014 22,338,928 28,041,558 1.1% 86.1%20 SYRIA 94,096,691 35,587,292 38,202,145 26,802,161 1.1% 87.2%21 TUNISIA 30,227,358 16,647,739 13,803,583 21,638,722 0.9% 88.1%22 SPAIN 18,029,901 24,148,755 23,112,315 21,061,219 0.8% 88.9%23 GHANA 32,736,254 22,638,837 12,041,591 19,567,655 0.8% 89.7%24 ETHIOPIA 4,097,261 12,529,418 18,427,659 18,954,068 0.8% 90.5%25 PAKISTAN 3,309,675 2,489,615 8,405,542 14,594,473 0.6% 91.0%26 INDIA 8,436,696 10,397,133 8,604,841 12,877,925 0.5% 91.6%27 OMAN 17,546,858 9,919,055 6,416,412 10,793,376 0.4% 92.0%28 SOUTH AFRICA 2,147,080 3,947,350 14,891,840 10,691,072 0.4% 92.4%29 CAMEROON 5,753,085 3,455,826 8,777,132 9,984,952 0.4% 92.8%30 UNITED STATES 17,458,563 14,654,298 7,879,425 8,686,673 0.3% 93.2%31 MALAYSIA 884,283 694,462 333,032 8,420,695 0.3% 93.5%32 MALTA 824,492 4,945,032 5,381,727 7,983,132 0.3% 93.8%33 RUSSIAN FEDERATION 1,395,576 2,266,615 7,125,638 7,903,016 0.3% 94.2%34 NETHERLANDS 7,038,072 3,694,693 10,821,261 7,685,987 0.3% 94.5%35 COTE D IVOIRE 2,481,610 3,016,345 3,084,219 7,453,681 0.3% 94.8%36 GREECE 21,132,592 4,832,505 5,341,419 7,235,887 0.3% 95.0%37 PORTUGAL 7,004,937 4,242,926 3,834,564 7,044,354 0.3% 95.3%38 MALI 49,573 147,669 6,250,257 0.3% 95.6%39 PALESTINE 2,986,045 3,784,855 3,425,377 5,628,662 0.2% 95.8%40 NIGER 470,809 949,376 4,888,840 5,354,815 0.2% 96.0%41 SENEGAL 1,081,916 590,068 1,716,241 5,320,859 0.2% 96.2%42 CZECH REPUBLIC 1,878,416 3,841,286 5,053,842 5,250,285 0.2% 96.4%43 CHINA 26,097,088 11,039,866 5,029,910 5,207,879 0.2% 96.7%44 YEMEN 22,881,958 17,960,208 16,883,136 5,184,368 0.2% 96.9%45 ROMANIA 1,748,860 6,796,429 4,071,413 4,194,895 0.2% 97.0%46 VIET NAM 2,028,902 2,068,268 2,763,765 4,107,039 0.2% 97.2%47 AFGHANISTAN 1,474,120 1,137,607 10,450,510 4,036,794 0.2% 97.4%48 IRAN 2,773,236 2,716,423 5,553,246 3,830,300 0.2% 97.5%49 BAHRAIN 4,385,717 4,690,166 3,217,770 3,634,282 0.1% 97.7%50 BRAZIL 8,330,916 14,686,765 6,272,956 3,313,728 0.1% 97.8%51 JAPAN 776,102 464,051 558,744 2,938,407 0.1% 97.9%52 UGANDA 1,968,714 767,928 763,581 2,648,584 0.1% 98.0%53 UKRAINE 4,606,561 6,257,436 9,149,106 2,526,021 0.1% 98.1%54 POLAND 3,401,659 2,258,638 2,429,139 2,389,164 0.1% 98.2%55 SLOVENIA 5,069,677 4,981,092 4,835,190 2,355,332 0.1% 98.3%
2,378,026,269 2,211,691,637 2,816,241,175 2,448,786,243 98.3%150,681,449 108,265,942 115,237,468 42,110,307 1.7% 1.7%
2,528,707,717 2,319,957,578 2,931,478,643 2,490,896,550 100.0% 100.0%
Total Exports to top 55 CountriesRemaining Countries
Total Source : GOEIC / Values in USD ( table 2 ) Egyptian engineering exports to POLAND represented 0.1% from the total Egyptian engineering exports to the world 2015
11

Yearly Egyptian Engineering exports to POLAND :
Source : GOEIC / Values in USD ( graph 1 ) - The yearly average value of Egyptian engineering exports to POLAND 2.5 Million USD from 2012 to 2015. - The Compound Annual Growth rate for the Egyptian Engineering exports to POLAND = -11% from 2012-2015.
Top Engineering sectors - Egypt exports to POLAND :
Sector Exports 2012Exports
2013Exports
2014Exports
2015Percentage
2015Accumulated
Percentage1 Home Appliances 626,954 606,966 1,045,786 1,012,319 42.4% 42.4%2 Car Components 833,586 1,232,019 306,423 441,523 18.5% 60.9%3 Brown Goods 213,113 282,020 11.8% 72.7%4 Electrical & Electronic Industries 420,356 302,141 327,233 257,879 10.8% 83.4%5 Metals 20,403 41,750 253,801 10.6% 94.1%6 Metal Forms 74,664 3.1% 97.2%7 Other Industries Medical & Artistic 61,946 34,504 255,666 54,558 2.3% 99.5%8 Cables 3 12,400 0.5% 100.0%9 Vehicle Industries 1,385,899 10 Pumps, Compressors & Generators 52,516 83,007 145,232 11 Machinery & Equipment 93,936
3,401,659 2,258,638 2,429,139 2,389,164 100.0% 100.0%Total
Source : GOEIC / Values in USD ( table 3 ) Top Engineering sectors - Egypt exports to POLAND : 1- Home Appliances sector represented 42.4% from total engineering exports to POLAND 2015. 2- Car Components sector represented 18.5%. 3- Brown Goods Sector represented 11.8%. 4- Electrical & Electronic Industries Sector represented 10.8%.
-
500,000
1,000,000
1,500,000
2,000,000
2,500,000
3,000,000
3,500,000
2012 2013 2014 2015
3,401,659
2,258,638 2,429,139 2,389,164
Values in USD
12

Source : GOEIC ( graph 2 )
Top Engineering products – Egypt exports to POLAND :
HS Code ProductExports
2013Exports
2014Exports
2015Percentage
2015Accumulated Percentage
1 851610 Electric instantaneous or storage water heaters and immersion heaters 574,666 1,045,786 1,012,319 42.4% 42.4%2 852872 Reception apparatus for television, colour, 213,113 282,020 11.8% 54.2%3 790200 Zinc waste and scrap 41,750 253,801 10.6% 64.8%4 854420 Coaxial cable and other coaxial electric conductors, insulated 26,922 14,351 219,088 9.2% 74.0%
5 853890Parts suitable for use solely or principally with the apparatus of heading 8535,
8536 or 8537, n.e.s.27,936 65,862 2.8% 76.7%
6 853810Boards, panels, consoles, desks, cabinets and other bases for the goods of
heading 8537, not equipped with their apparatus63,248 2.6% 79.4%
7 847989 Machines and mechanical appliances, n.e.s. 58,850 2.5% 81.8%
8 853710Boards, cabinets and similar combinations of apparatus for electric control or the
distribution of electricity, for a voltage <= 1.000 V150,553 262,292 57,130 2.4% 84.2%
9 700711Toughened "tempered" safety glass, of size and shape suitable for incorporation
in motor vehicles, aircraft, spacecraft, vessels and other vehicles21,199 83,812 37,953 1.6% 85.8%
773,341 1,689,040 2,050,271 85.8%1,485,298 740,100 338,892 14.2% 14.2%2,258,638 2,429,139 2,389,164 100.0% 100.0%
Total Exports of top 9 ProductsRemaining Products
Total Source : GOEIC / Values in USD ( table 4 ) Top ENG. Products Egypt exports to POLAND : 1- Electric instantaneous or storage water heaters and immersion heaters 2- Reception apparatus for television, colour, 3- Zinc waste and scrap. 4- Coaxial cable and other coaxial electric conductors, insulated 5- Parts suitable for use solely or principally with the apparatus of heading 8535, 8536 or 8537, n.e.s.. 6- Boards, panels, consoles, desks, cabinets and other bases for the goods of heading 8537, not equipped with their apparatus 7- Machines and mechanical appliances, n.e.s. 8- Boards, cabinets and similar combinations of apparatus for electric control or the distribution of electricity, for a voltage <= 1.000 V,
Home Appliances 42.4%
Car Components 18.5%
Brown Goods 11.8%
Electrical & Electronic Industries
10.8%
Metals 10.6%
Metal Forms 3.1%
Other Industries Medical & Artistic
2.3% Cables 0.5%
Top Sectors 2015
13

Top Exporters ( countries ) to POLAND from engineering products :
Exporters Imports 2012 Imports 2013 Imports 2014 Imports 2015Percentage
2015Accumulated
Percentage1 Germany 19,022,732 21,264,800 23,129,504 22,491,439 24.1% 24.1%2 China 12,315,466 14,096,457 16,645,357 16,572,142 17.8% 41.9%3 Italy 5,583,485 6,186,252 6,682,798 5,657,182 6.1% 47.9%4 Czech Republic 3,095,725 3,440,695 3,738,632 3,388,268 3.6% 51.5%5 United States of America 3,211,628 3,480,904 3,525,061 3,352,612 3.6% 55.1%6 France 3,401,082 3,471,667 3,770,022 3,341,275 3.6% 58.7%7 Netherlands 3,270,082 3,519,502 3,481,822 3,270,302 3.5% 62.2%8 Korea, Republic of 3,768,091 3,420,873 3,445,750 2,571,656 2.8% 65.0%9 United Kingdom 1,966,379 2,176,213 2,335,579 2,310,885 2.5% 67.4%
10 Japan 2,213,446 2,265,299 2,505,164 2,046,701 2.2% 69.6% 57,848,116 63,322,662 69,259,689 65,002,462 69.6% 24,262,260 28,365,823 29,288,016 28,336,582 30.4% 30.4% 82,110,376 91,688,485 98,547,705 93,339,044 100.0% 100.0%
Total Imports from top 10 CountriesRemaining Countries
TotalSource : Trade map / Values in Thousand USD ( table 5 ) Top Countries POLAND imports the engineering products from : 1- Germany represented 24.1% from the total imports from the engineering products in 2015. 2- China represented 17.8%. 3- Italy represented 6.1%. 4- Czech Republic represented 3.6%. POLAND's Engineering imports from the world :
Source : Trade map / Values in Thousand USD ( graph 3 ) - The yearly average value of POLAND's engineering imports from the world 91.3 Billion USD from 2012 to 2015.
-
10,000,000
20,000,000
30,000,000
40,000,000
50,000,000
60,000,000
70,000,000
80,000,000
90,000,000
100,000,000
2012 2013 2014 2015
82,110,376
91,688,485 98,547,705
93,339,044
In Thousand USD
14

Top Engineering Sectors POLAND imports from the world :
Sector 2012 2013 2014 2015Percentage From total
Accumulated Percentage
1 Pumps, Compressors and Generators 8,768,294 10,118,594 10,577,288 9,931,007 10.6% 10.6%2 Brown Goods 8,001,970 9,258,192 9,269,981 8,868,954 9.5% 20.1%3 Vehicle Industry 7,078,156 7,797,165 8,474,107 7,727,098 8.3% 28.4%4 Car components 5,771,895 6,709,123 7,394,581 6,925,229 7.4% 35.8%5 Home appliances - White Goods - 5,170,453 5,962,583 6,634,223 6,243,690 6.7% 42.5%6 Electrical and Electronic industries 4,856,569 5,103,242 5,488,055 5,335,583 5.7% 48.2%7 Ships and Boats 3,204,195 4,446,432 4,108,327 4,382,896 4.7% 52.9%8 Metals 3,776,844 3,976,000 4,116,269 3,603,124 3.9% 56.8%9 Machinery and equipment 3,068,592 3,283,963 3,434,565 3,052,792 3.3% 60.1%10 Agricultural Equipment 2,519,640 2,826,202 2,663,071 2,417,786 2.6% 62.7%
52,216,608 59,481,496 62,160,467 58,488,159 62.7% 29,893,768 32,206,989 36,387,238 34,850,885 37.3% 37.3% 82,110,376 91,688,485 98,547,705 93,339,044 100.0% 100.0%
Total Imports of top 10 SectorsRemaining Sectors
Total
Source : Trade map / Values in Thousand USD ( table 6)
Source: Trade Map ( Graph 4 )
10.6%
9.5%
8.3% 7.4%
6.7%
5.7%
4.7%
3.9% 3.27% 2.6%
Pumps, Compressors andGenerators
Brown Goods
Vehicle Industry
Car components
Home appliances - White Goods -
Electrical and Electronicindustries
Ships and Boats
Metals
Machinery and equipment
Agricultural Equipment
15
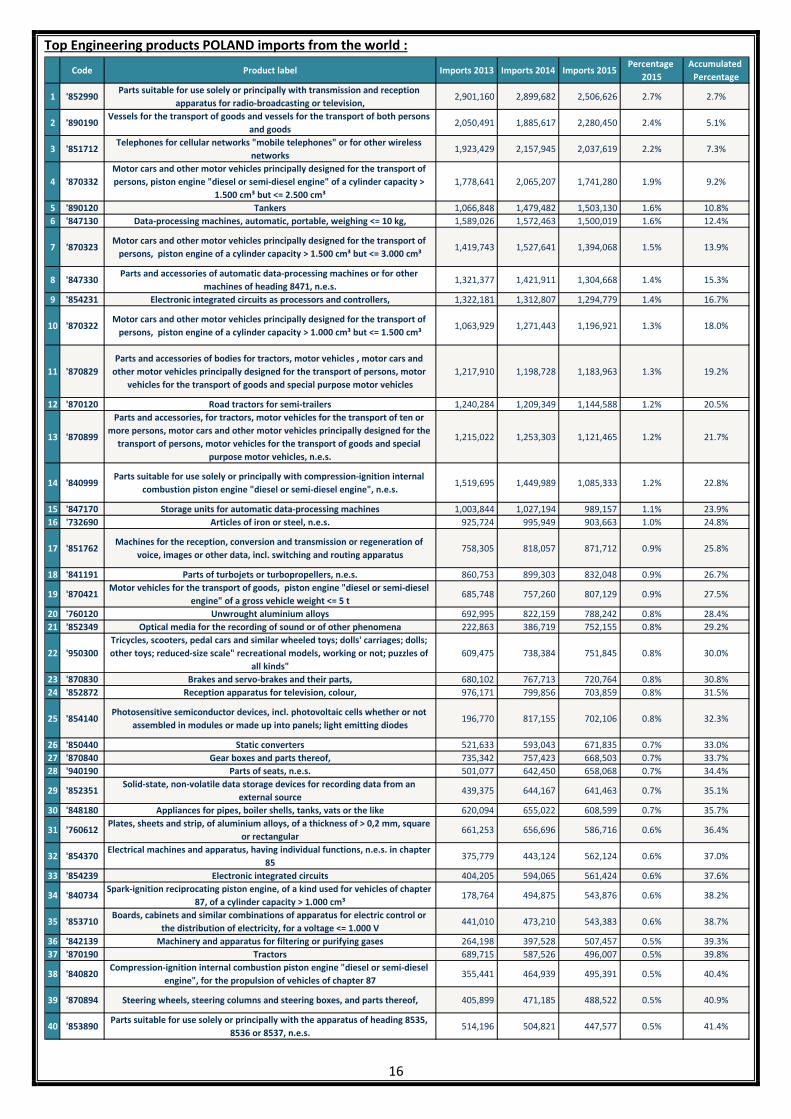
Top Engineering products POLAND imports from the world :
Code Product label Imports 2013 Imports 2014 Imports 2015Percentage
2015Accumulated
Percentage
1 '852990Parts suitable for use solely or principally with transmission and reception
apparatus for radio-broadcasting or television, 2,901,160 2,899,682 2,506,626 2.7% 2.7%
2 '890190Vessels for the transport of goods and vessels for the transport of both persons
and goods 2,050,491 1,885,617 2,280,450 2.4% 5.1%
3 '851712Telephones for cellular networks "mobile telephones" or for other wireless
networks 1,923,429 2,157,945 2,037,619 2.2% 7.3%
4 '870332Motor cars and other motor vehicles principally designed for the transport of persons, piston engine "diesel or semi-diesel engine" of a cylinder capacity >
1.500 cm³ but <= 2.500 cm³ 1,778,641 2,065,207 1,741,280 1.9% 9.2%
5 '890120 Tankers 1,066,848 1,479,482 1,503,130 1.6% 10.8%6 '847130 Data-processing machines, automatic, portable, weighing <= 10 kg, 1,589,026 1,572,463 1,500,019 1.6% 12.4%
7 '870323Motor cars and other motor vehicles principally designed for the transport of
persons, piston engine of a cylinder capacity > 1.500 cm³ but <= 3.000 cm³ 1,419,743 1,527,641 1,394,068 1.5% 13.9%
8 '847330Parts and accessories of automatic data-processing machines or for other
machines of heading 8471, n.e.s. 1,321,377 1,421,911 1,304,668 1.4% 15.3%
9 '854231 Electronic integrated circuits as processors and controllers, 1,322,181 1,312,807 1,294,779 1.4% 16.7%
10 '870322Motor cars and other motor vehicles principally designed for the transport of
persons, piston engine of a cylinder capacity > 1.000 cm³ but <= 1.500 cm³ 1,063,929 1,271,443 1,196,921 1.3% 18.0%
11 '870829Parts and accessories of bodies for tractors, motor vehicles , motor cars and
other motor vehicles principally designed for the transport of persons, motor vehicles for the transport of goods and special purpose motor vehicles
1,217,910 1,198,728 1,183,963 1.3% 19.2%
12 '870120 Road tractors for semi-trailers 1,240,284 1,209,349 1,144,588 1.2% 20.5%
13 '870899
Parts and accessories, for tractors, motor vehicles for the transport of ten or more persons, motor cars and other motor vehicles principally designed for the
transport of persons, motor vehicles for the transport of goods and special purpose motor vehicles, n.e.s.
1,215,022 1,253,303 1,121,465 1.2% 21.7%
14 '840999Parts suitable for use solely or principally with compression-ignition internal
combustion piston engine "diesel or semi-diesel engine", n.e.s. 1,519,695 1,449,989 1,085,333 1.2% 22.8%
15 '847170 Storage units for automatic data-processing machines 1,003,844 1,027,194 989,157 1.1% 23.9%16 '732690 Articles of iron or steel, n.e.s. 925,724 995,949 903,663 1.0% 24.8%
17 '851762Machines for the reception, conversion and transmission or regeneration of
voice, images or other data, incl. switching and routing apparatus 758,305 818,057 871,712 0.9% 25.8%
18 '841191 Parts of turbojets or turbopropellers, n.e.s. 860,753 899,303 832,048 0.9% 26.7%
19 '870421Motor vehicles for the transport of goods, piston engine "diesel or semi-diesel
engine" of a gross vehicle weight <= 5 t 685,748 757,260 807,129 0.9% 27.5%
20 '760120 Unwrought aluminium alloys 692,995 822,159 788,242 0.8% 28.4%21 '852349 Optical media for the recording of sound or of other phenomena 222,863 386,719 752,155 0.8% 29.2%
22 '950300Tricycles, scooters, pedal cars and similar wheeled toys; dolls' carriages; dolls; other toys; reduced-size scale" recreational models, working or not; puzzles of
all kinds" 609,475 738,384 751,845 0.8% 30.0%
23 '870830 Brakes and servo-brakes and their parts, 680,102 767,713 720,764 0.8% 30.8%24 '852872 Reception apparatus for television, colour, 976,171 799,856 703,859 0.8% 31.5%
25 '854140Photosensitive semiconductor devices, incl. photovoltaic cells whether or not
assembled in modules or made up into panels; light emitting diodes 196,770 817,155 702,106 0.8% 32.3%
26 '850440 Static converters 521,633 593,043 671,835 0.7% 33.0%27 '870840 Gear boxes and parts thereof, 735,342 757,423 668,503 0.7% 33.7%28 '940190 Parts of seats, n.e.s. 501,077 642,450 658,068 0.7% 34.4%
29 '852351Solid-state, non-volatile data storage devices for recording data from an
external source 439,375 644,167 641,463 0.7% 35.1%
30 '848180 Appliances for pipes, boiler shells, tanks, vats or the like 620,094 655,022 608,599 0.7% 35.7%
31 '760612Plates, sheets and strip, of aluminium alloys, of a thickness of > 0,2 mm, square
or rectangular 661,253 656,696 586,716 0.6% 36.4%
32 '854370Electrical machines and apparatus, having individual functions, n.e.s. in chapter
85 375,779 443,124 562,124 0.6% 37.0%
33 '854239 Electronic integrated circuits 404,205 594,065 561,424 0.6% 37.6%
34 '840734Spark-ignition reciprocating piston engine, of a kind used for vehicles of chapter
87, of a cylinder capacity > 1.000 cm³ 178,764 494,875 543,876 0.6% 38.2%
35 '853710Boards, cabinets and similar combinations of apparatus for electric control or
the distribution of electricity, for a voltage <= 1.000 V 441,010 473,210 543,383 0.6% 38.7%
36 '842139 Machinery and apparatus for filtering or purifying gases 264,198 397,528 507,457 0.5% 39.3%37 '870190 Tractors 689,715 587,526 496,007 0.5% 39.8%
38 '840820Compression-ignition internal combustion piston engine "diesel or semi-diesel
engine", for the propulsion of vehicles of chapter 87 355,441 464,939 495,391 0.5% 40.4%
39 '870894 Steering wheels, steering columns and steering boxes, and parts thereof, 405,899 471,185 488,522 0.5% 40.9%
40 '853890Parts suitable for use solely or principally with the apparatus of heading 8535,
8536 or 8537, n.e.s. 514,196 504,821 447,577 0.5% 41.4%
16

41 '851770Parts of telephone sets, telephones for cellular networks or for other wireless networks and of other apparatus for the transmission or reception of voice,
images or other data, n.e.s. 409,637 369,882 431,503 0.5% 41.8%
42 '847989 Machines and mechanical appliances, n.e.s. 344,121 442,899 427,921 0.5% 42.3%43 '950450 Video game consoles and machines 100,130 356,034 421,072 0.5% 42.7%
44 '844399Parts and accessories of printers, copying machines and facsimile machines,
n.e.s. 600,313 460,135 406,690 0.4% 43.2%
45 '853690Electrical apparatus for switching electrical circuits, or for making connections
to or in electrical circuits, for a voltage <= 1.000 V 413,525 449,556 404,546 0.4% 43.6%
46 '854449Electric conductors, for a voltage <= 1.000 V, insulated, not fitted with
connectors, n.e.s. 489,648 475,606 399,471 0.4% 44.0%
47 '852580 Television cameras, digital cameras and video camera recorders 407,598 344,333 396,808 0.4% 44.4%
48 '901890Instruments and appliances used in medical, surgical or veterinary sciences,
n.e.s. 353,273 393,136 393,067 0.4% 44.9%
49 '853400 Printed circuits 328,335 379,746 379,008 0.4% 45.3%50 '830242 Base metal mountings, fittings and similar articles suitable for furniture 344,267 446,572 373,373 0.4% 45.7%51 '870880 Suspension systems and parts thereof, incl. shock-absorbers, 400,487 413,620 370,924 0.4% 46.1%52 '903289 Regulating or controlling instruments and apparatus 318,341 391,755 365,339 0.4% 46.5%
53 '854442Electric conductors for a voltage <= 1.000 V, insulated, fitted with connectors,
n.e.s. 342,074 364,091 346,605 0.4% 46.8%
54 '847150Processing units for automatic data-processing machines: storage units, input
units, output units 240,378 295,345 339,551 0.4% 47.2%
55 '854430 Ignition wiring sets and other wiring sets for vehicles, aircraft or ships 264,270 307,885 339,338 0.4% 47.6%56 '760200 Waste and scrap, of aluminium 289,112 325,573 337,692 0.4% 47.9%
57 '840991Parts suitable for use solely or principally with spark-ignition internal
combustion piston engine, n.e.s. 388,910 384,561 332,036 0.4% 48.3%
58 '841330Fuel, lubricating or cooling medium pumps for internal combustion piston
engine 362,026 355,113 331,400 0.4% 48.6%
59 '730890 Structures and parts of structures, of iron or steel, n.e.s. 292,807 336,558 329,473 0.4% 49.0%
60 '870333Motor cars and other motor vehicles principally designed for the transport of persons, piston engine "diesel or semi-diesel engine" of a cylinder capacity >
2.500 cm³ 324,882 378,617 323,255 0.3% 49.3%
61 '851718 Telephone sets 275,647 303,800 320,455 0.3% 49.7%
62 '870331Motor cars and other motor vehicles principally designed for the transport of persons, piston engine "diesel or semi-diesel engine" of a cylinder capacity <=
1.500 cm³ 266,456 289,843 320,119 0.3% 50.0%
43,906,704 48,180,050 46,688,180 50.0%47,781,781 50,367,655 46,650,864 50.0% 50.0%
91,688,485 98,547,705 93,339,044 100.0% 100.0%Total
Total Imports from top 62 ProductsRemaining Products
Source : Trade map / Values in Thousand USD ( table 7 )
Top engineering products POLAND is importing from the world : Parts suitable for use solely or principally with transmission and reception apparatus for radio-broadcasting or television - Vessels for the transport of goods and vessels for the transport of both persons and goods - Telephones for cellular networks "mobile telephones" - Motor cars and other motor vehicles principally designed for the transport of persons - Tankers - Data-processing machines, automatic, portable, weighing <= 10 kg, - Parts and accessories of automatic data-processing machines - Electronic integrated circuits as processors and controllers, - Parts and accessories of bodies for Automotive - Road tractors for semi-trailers.
17

- Risk assessment: - Export Transactions:
Political risk : -1 (short term) :
Low 1 2 3 4 5 6 7 High Risks
um / Long term)Medi(
Low 1 2 3 4 5 6 7 High Risks
(Special Transactions)
Low 1 2 3 4 5 6 7 High Risks
Commercial Risk : -2
Low A B C High Risks
- Direct Investments: (War Risk)
Low 1 2 3 4 5 6 7 High Risks
(Risk of expropriation and government action)
Low 1 2 3 4 5 6 7 High Risks
(Transfer Risk)
Low 1 2 3 4 5 6 7 High Risks
For More Explanation about risks please visit ) risks/rating/-http://www.delcredereducroire.be/en/country(
- International Conventions: Member of World Trade Organisation Member of OECD Party to the Kyoto Protocol Party to the Washington Convention on International Trade in Endangered Species of Wild Fauna and Flora Party to the Basel Convention on the Control of Transboundary Movements of Hazardous Wastes and Their Disposal Party to the Montreal Protocol on Substances That Deplete the Ozone Layer Party to the Wassenaar Arrangement on Export Controls For Conventional Arms and Dual-Use Goods and Technologies Party of the International Coffee Agreement 2001
18

- Main International Economic Cooperation:
- Member of the European Union Member of the European Economic Area which has guaranteed, since 1 January 1993, the free movement of most goods between European countries. Multilateral agreements and bilateral agreements with many countries.
- Non Tariff Barriers:
As it joined the European Union on 1 May 2004, Poland follows the commercial policy of the EU, including anti-dumping or anti-subsidy measures. The import regime of the European Union, especially in the sector of textile goods, is widespread in Poland. If the country integrated much of community legislation the day it joined the EU, a transition period was defined to adapt the rest of community benefits such as, for example, the free movement of salaried workers or coastal navigation services for some member States. In addition, Poland was given time until 2008 to bring up to standard its marketing authorizations for pharmaceutical products. Time was also given until 2005 to bring licenses for medical apparatus up to standard. The EU has a liberal import regime where having to obtain import licenses is uncommon. However, you should ensure that importing a particular product does not need an import license. At the European level, agricultural products are protected within the framework of the common agricultural policy and textile goods coming from China, Belarus, North Korea, Montenegro, Kosovo and Uzbekistan are subject to particular formalities and to import licenses or control procedures (export document, inspection document).
- Customs Duties and Taxes on Imports:
- Transactions carried out inside the EEA are free of duty. The European Union's Common Customs Tariff (CCT) applies to goods from outside Europe. In general, duty is relatively low, especially for industrial goods (4.2% on average).
- Customs Classification:
- The combined Nomenclature of the European Community (EC) integrates the HS nomenclature and has supplementary eight figure subdivisions and its own legal notes created for community purposes.
- Market Access Requirements : - When goods from inside the European community are introduced into Poland, the exporter is obliged to fill in, at the end of the month, a Declaration of Exchange of Goods or Intrastat Declaration. The Customs declaration (SAD) is still in force for trade between Poland and third countries. As part of the "SAFE" standards advocated by the World Customs Organization (WCO), the European Union has set up a new system of import controls, the "Import Control System" (ICS), which aims to secure the flow of goods at the time of their entry into the customs territory of the EU. This control system, part of the Community Program eCustomer, has been in effect since January 1, 2011. Since then, operators are required to pass an Entry Summary Declaration (ENS) to the customs of the country of entry, prior to the introduction of goods into the customs territory of the European Union. A new system, the Modernized Customs Code (MCC) of the European Union, is expected to be fully put into place by 2013 although there are concerns that this deadline may be missed due to the complexity of the project.
19

POLAND Consumer Behavior :
Even if advertising on TV, the Internet and in the press is important, the strongest vector for advertising remains word of mouth. The Polish are used to doing their shopping 7 days a week and at any time of day or night. Many stores stay open very late (10 pm) and even 24/24 (even in the country). Even if there are many big shopping centers and super and hypermarkets, the Polish consumer likes to do his shopping in different general stores and markets or small and medium size local shops. Whether a product is foreign or Polish is not very important.
The average age of the Polish population is 37. The unemployment rate was 11.8% in 2010. There are great differences in salaries according to the region and the sector of employment (the largest in the EU); the official average salary is 727 EUR. Consumer behavior depends on the level of their income. The low income of Polish people (on average EUR 730 gross per month) explains why they pay close attention to prices. But for the middle and upper classes (whose salaries are almost equivalent to the average in the EU 15) quality and brand are becoming more and more important as is service (during and after sales). Sales have become very fashionable.
- Goods Transport in POLAND :
Poland's main ports are Gdansk and Szeczin-Swinoujscie. They have been considerably improved over the last few years with a view to European integration. More than 50 million of tons of maritime freight transit via Poland each year. Goods freight by road represents 74.4 billion tonnes-kms. The Polish rail network is the third-best rail network in Europe for its infrastructures, the second for the volume of goods transported, and is the leading employer in Poland. International lines (Intercity) give excellent service but the regional lines remain poor. Modernization is essential as regards signals and rolling stock, for about 40% of goods traffic is carried out by rail (47,400 million tons-km of freight).
- Ports:
Port of Gdansk Port of Szczecin
- Airports:
Polish Airports
- Sea Transport Organizations:
Ministry of Transport, Construction and Maritime Economy Ministry of Transport
20