Report on budgetary and financial management by the European ...
118
-
Upload
trannguyet -
Category
Documents
-
view
222 -
download
4
Transcript of Report on budgetary and financial management by the European ...


Report on Budgetary and Financial Management
Financial Year 2013


i
Table of Contents Introduction ........................................................................................................................................................1 PART A - Overview: Budget 2013.................................................................................................... 5
A.1 Establishing the Initial Budget ..........................................................................................................7 A.2 Carryover from 2012.......................................................................................................................10 A.3 Amending Budgets 2013.................................................................................................................12 A.4 Transfers 2013 ................................................................................................................................14 A.5 2013 Implementation Overview......................................................................................................17 A.6 RAL-Situation.................................................................................................................................24 PART B - Overview: Budget 2013 by Heading ............................................................................. 27
B.1 Heading 1a: Competitiveness for Growth and Employment ..........................................................29 B.2 Heading 1b: Cohesion for Growth and Employment......................................................................39 B.3 Heading 2: Preservation and Management of Natural Resources...................................................44 B.4 Heading 3a: Freedom, Security and Justice ....................................................................................51 B.5 Heading 3b: Citizenship..................................................................................................................55 B.6 Heading 4: EU as a Global Player...................................................................................................61 B.7 Heading 5: Administration..............................................................................................................71 B.8 Heading 6: Compensations .............................................................................................................87 PART C – Own Resources .............................................................................................................. 89
C.1. Budget Implementation Table.........................................................................................................91 C.2 Legal Basis......................................................................................................................................92 C.3 The Budgetary Forecast of Own Resources....................................................................................93 C.4 The Process of Adopting the Budget ..............................................................................................94 C.5 Budget Forecasts Table 2013 Versus 2012.....................................................................................96 C.6 Breakdown of the Total Amount of Own Resources by Member State..........................................97 C.7 Implementation of Own Resources.................................................................................................98 ANNEXES ........................................................................................................................................ 99
Annex I: Summary Information on 2013 Transfers of Appropriations........................................................101 Annex II Consolidated Community Entitlements grouped according to the date of issue of the Recovery
Order .............................................................................................................................................107 Annex III: Absorption of Oldest Outstanding Commitments in 2013............................................................108

ii

1
INTRODUCTION
Legal basis
The revised Financial Regulation1 entered into application on 1 January 2013. The legal basis for this Report on Budgetary and Financial Management is Article 142, which stipulates that each institution and body shall prepare a report on budgetary and financial management for the financial year.
The present report analyses the appropriations managed by the European Commission in 2013, i.e. the operational appropriations of the European Union and the administrative appropriations of the Commission (including pensions of other institutions). The administrative appropriations of other institutions are included only in some relevant consolidated summary tables.
The Financial Regulation sets out the provisions on including a transfer summary per budget line (Article 142.2) and a list of consolidated recoveries (Article 79 together with Article 84.3 of the Rules of Application2) with the current report. These are presented as Annexes I and II.
The analysis follows the European Union's accounting rule No 16 on the presentation of budget information in annual accounts, based on the International Public Sector Accounting Standard (IPSAS) 24 "Presentation of Budget Information in Financial Statements" issued by the International Public Sector Accounting Standards Board (IPSASB) in December 2006. According to this rule, the comparison of the budget and actual implementation shall be presented, for each heading of the multiannual financial framework separately, on the basis of both the original and the final budget amounts. Changes approved by the Budget Authority (BA) to revise the original budget and the actual implemented amounts shall also be explained.
Content of the 2013 report
PART A of the report analyses the year at budgetary level including:
• a summary of the various stages of the budgetary procedure 2013, explaining how the appropriations for the 2013 financial year were arrived at during the process of budgetary negotiation and the establishment of the budget;
• a description of the main adjustments to this budget during the financial year and reasons for these adjustments, leading to the final appropriations of the year;
• an overview of the implementation of expenditure in 2013;
• an assessment of the evolution of the outstanding commitments (RAL - reste à liquider).
PART B of the report is an analysis of implementation by detailed Multiannual Financial Framework (MFF) headings with tables and text showing the appropriations made available, their implementation and the unused amounts carried forward. The evolution of the RAL in 2013 is integrated in these implementation tables.
1 Regulation (EU, Euratom) No 966/2012 of the European Parliament and of the Council of 25 October 2012 on the Financial
Regulation applicable to the general budget of the Union. OJ L 298, 26.10.2012. 2 Commission Delegated Regulation (EU) No 1268/2012 of 29 October 2012 on the rules of application of Regulation (EU,
Euratom) No 966/2012 of the European Parliament and of the Council on the financial rules applicable to the general budget of the. OJ L 362, 31.12.2012.

2
They are linked to cumulative programme tables showing, for major programmes at the end of the programming period,
• the last programme allocation as submitted to Budget authority in early 2012 corrected with the actual budget amounts for 2012 and 2013;
• the implementation of commitments and payments by year throughout the current programming period;
• the cumulative situation of commitments and payments;
• the volume of outstanding commitments of the current programme, compared to the total RAL of the detailed MFF heading.
PART C of the report is an analysis of the own resources.
The report contains three annexes:
• Annex I transfer summary;
• Annex II consolidated recoveries;
• Annex III on the absorption of the oldest outstanding commitments in 2013.
Definitions applied in this report
The implementation tables consist of:
Total appropriations:
- Initial budget: appropriations voted by the Budget Authority (BA) including the reserves for European Globalisation Adjustment Fund and the Emergency Aid Reserve, but excluding the provisional appropriations entered in article 40 01 40 Administrative reserve or 40 02 41 Differentiated appropriations (in reserves for financial interventions). The release of the provisional appropriations in the course of the budget year is subject to given conditions. Even if put in reserve and not available, the unreleased amounts at year-end are considered as appropriations (voted budget) in calculating the implementation rates, notified via footnotes of the column "Total appropriations".
- Amending budgets (AB).
- Budget Authority transfers: transfers submitted to the BA for decision or for information.
- Commission transfers: transfers decided by the Commission on its own authority.
- Carryover from 2012: refers to budgetary appropriations carried forward by decision or automatically.
- Assigned revenue: In order to harmonise the presentation with the annual accounts of the European Union, total appropriations include assigned revenue. This column includes the appropriations of the year and appropriations carried over from previous year.

3
Implementation
- Actual 2013 and Rate: For the purpose of analysing implementation, a distinction between budget appropriations and assigned revenue is relevant. The nature of the implementation of assigned revenue is different in the sense that their use may be subject to specific conditions: normally for assigned revenue, payments are entered in the budget with an amount corresponding to the commitments, even if it is clear from the outset that payments will be implemented only in later years; furthermore, appropriations that remain unused at the end of the year will not be cancelled, but carried forward automatically (with the exception of refunds carried over).
- Actual 2012: Presented for comparison. The budget nomenclature of 2013 is applied.
- Carryover to 2014: As well as budgetary appropriations carried forward by decision or automatically, this also includes assigned revenue in order to illustrate the actual under-spending.
The terminology is shown in the schematic table on types of appropriation below:
Fund Source Code Concept Financial Regulation Presentation in this report
C1 Initial Budget 7, 9, 10, 13, 14, 15, 86, 177, 178, 203, 210
Voted budget without the reserve (provisional appropriations)
C1 Amending Budget 41 Own column
C1 Transfers 25 to 29, 179, 183§6 Separate columns for Budgetary Authority transfers and Commission transfers
C1 EFTA 21§6 Belongs to assigned revenue
C2 Carry over on decision to be used before 31/12 13§ 2b, 3 Carry over from 2012 to 2013
C3 Carry over on decision to be used before 31/03 13§2a Carry over from 2012 to 2013
C4 Internal assigned revenue 14, 21§3 Belongs to assigned revenue C5 Internal assigned revenue carried over 14 Belongs to assigned revenue
C6 Reimbursement of advances 177 Belongs to assigned revenue
C7 Reconstitutions 178 Considered as carryover of the Structural funds
C8
Automatic carryovers of payment appropriations corresponding to commitments of non-differentiated appropriations
13§4 Carry over from 2012 to 2013
R0 Other external assigned revenue 21§2 Belongs to assigned revenue Pxx PECO participation Belongs to assigned revenue FCA Coal and Steel participation Belongs to assigned revenue TFC JRC revenue 183§2 Belongs to assigned revenue TCA JRC revenue of other services 183§2b Belongs to assigned revenue

4
Budgetary appropriations are C1 (excluding EFTA) + C2 + C3 + C7 + C8. The first item covers 2013 appropriations.
Amounts are generally provided in EUR million or EUR billion after rounding.
Date of extraction
The implementation data is the preliminary data serving as a basis for the provisional accounts at end March 2013.
RAL figures include adjustments (de-commitments, cancellations and re-evaluations) made for the closure of the accounts after the budget year.
Note: The information contained in this report is without prejudice to the content of the official Commission documents on the closure of the accounts. Readers should refer in particular to the final Revenue and Expenditure Account for the official figures on the 2013 budget outturn.

PART A - Overview: Budget 2013

7
A.1 ESTABLISHING THE INITIAL BUDGET
A.1.1 Budgetary Procedure 2013
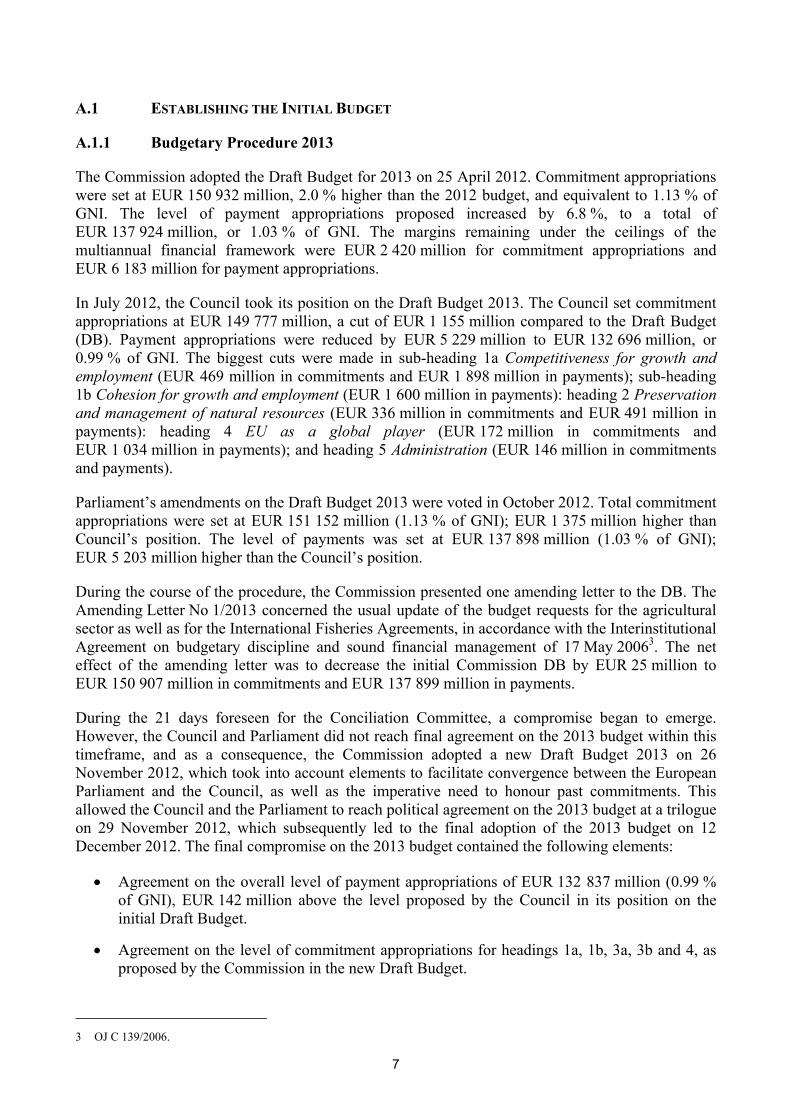
The Commission adopted the Draft Budget for 2013 on 25 April 2012. Commitment appropriations were set at EUR 150 932 million, 2.0 % higher than the 2012 budget, and equivalent to 1.13 % of GNI. The level of payment appropriations proposed increased by 6.8 %, to a total of EUR 137 924 million, or 1.03 % of GNI. The margins remaining under the ceilings of the multiannual financial framework were EUR 2 420 million for commitment appropriations and EUR 6 183 million for payment appropriations.
In July 2012, the Council took its position on the Draft Budget 2013. The Council set commitment appropriations at EUR 149 777 million, a cut of EUR 1 155 million compared to the Draft Budget (DB). Payment appropriations were reduced by EUR 5 229 million to EUR 132 696 million, or 0.99 % of GNI. The biggest cuts were made in sub-heading 1a Competitiveness for growth and employment (EUR 469 million in commitments and EUR 1 898 million in payments); sub-heading 1b Cohesion for growth and employment (EUR 1 600 million in payments): heading 2 Preservation and management of natural resources (EUR 336 million in commitments and EUR 491 million in payments): heading 4 EU as a global player (EUR 172 million in commitments and EUR 1 034 million in payments); and heading 5 Administration (EUR 146 million in commitments and payments).
Parliament’s amendments on the Draft Budget 2013 were voted in October 2012. Total commitment appropriations were set at EUR 151 152 million (1.13 % of GNI); EUR 1 375 million higher than Council’s position. The level of payments was set at EUR 137 898 million (1.03 % of GNI); EUR 5 203 million higher than the Council’s position.
During the course of the procedure, the Commission presented one amending letter to the DB. The Amending Letter No 1/2013 concerned the usual update of the budget requests for the agricultural sector as well as for the International Fisheries Agreements, in accordance with the Interinstitutional Agreement on budgetary discipline and sound financial management of 17 May 20063. The net effect of the amending letter was to decrease the initial Commission DB by EUR 25 million to EUR 150 907 million in commitments and EUR 137 899 million in payments.
During the 21 days foreseen for the Conciliation Committee, a compromise began to emerge. However, the Council and Parliament did not reach final agreement on the 2013 budget within this timeframe, and as a consequence, the Commission adopted a new Draft Budget 2013 on 26 November 2012, which took into account elements to facilitate convergence between the European Parliament and the Council, as well as the imperative need to honour past commitments. This allowed the Council and the Parliament to reach political agreement on the 2013 budget at a trilogue on 29 November 2012, which subsequently led to the final adoption of the 2013 budget on 12 December 2012. The final compromise on the 2013 budget contained the following elements:
• Agreement on the overall level of payment appropriations of EUR 132 837 million (0.99 % of GNI), EUR 142 million above the level proposed by the Council in its position on the initial Draft Budget.
• Agreement on the level of commitment appropriations for headings 1a, 1b, 3a, 3b and 4, as proposed by the Commission in the new Draft Budget.
3 OJ C 139/2006.

8
• Agreement on an increase by EUR 100 million of the (negative) amount for the clearance of accounts item for agriculture under heading 2 as compared to the new Draft Budget, both for commitment and appropriations.
• Agreement on a reduction in commitment and payment appropriations for administration (heading 5) by EUR 76 million as compared to the new Draft Budget, to exclude (with the exception of the European Parliament) the appropriations related to the salary increase of 1.7 %, awaiting the Court of Justice ruling on the salary adjustment for 2011.
A.1.2 The Evolution from Draft Budget to the Voted Budget 2013
A.1.2.1 Commitments (million EUR)
MFF heading Description
Final Budget
2012 (1)
2013 Financial
Framework(2)
2013 New Draft
Budget (3)
Council's position
(4)
Voted Budget
2013 (5)
Difference (5)/(1) = (6)
1a Competitiveness for growth and employment 15 389 15 623 16 105 16 121 16 121 +4.8%
Margin 18 2 2
1b Cohesion for growth and employment 52 753 54 524 54 509 54 509 54 509 +3.3%
Margin 15 15 15
2 Preservation and Management of natural resources 59 850 61 289 60 249 60 149 60 149 +0.5%
Margin 1 140 1 140 1 140 3a Freedom, Security and Justice 1 368 1 661 1 399 1 399 1 399 +2.3%
Margin 262 262 262 3b Citizenship 1 386 715 707 707 707 -49.0%
Margin 8 8 8 4 EU as global player 9 404 9 595 9 583 9 583 9 583 +1.9%
Margin 276 276 276 5 Administration 8 280 9 095 8 507 8 431 8 431 +1.8%
Margin 674 750 750 Total CA 148 428 152 502 151 059 150 898 150 898 +1.7%
Margin 2 294 2 454 2 454
The voted commitment appropriations represent 1.13 % of GNI. A.1.2.2 Payments (million EUR)
MFF heading Description
Final Budget
2012 (1)
2013 New Draft
Budget (2)
Council's position
(3)
Voted Budget
2013 (4)
Difference (4)/(1)= (5)
1a Competitiveness for growth and employment 11 971 13 558 11 886 11 886 -0,7%
1b Cohesion for growth and employment 48 504 48 977 47 199 47 199 -2,7%
2 Preservation and Management of natural resources 58 016 57 900 57 484 57 484 -0,9%
3a Freedom, Security and Justice 867 928 877 877 1,2% 3b Citizenship 1 347 656 638 638 -52,6% 4 EU as global player 6 777 7 272 6 323 6 323 -6,7% 5 Administration 8 278 8 507 8 430 8 430 1,8% Total PA 135 758 137 798 132 837 132 837 -2,2%
Margin 6 309 11 240 11 240
The voted payment appropriations represent 0.99% of GNI.

9
The difference between commitment and payment appropriations was EUR 18 billion.
In the tables above, the analysis of the variation of heading 3b has to take into account the fact that the final 2012 budget includes the European Solidarity Fund which has no initial appropriations, but is mobilised as needed via amending budgets. A.1.2.3 Reserves
The voted budget included the following reserves:
• European Globalisation Adjustment Fund: EUR 500 million in commitment appropriations.
• Emergency Aid Reserve: EUR 264 million in commitment appropriations and EUR 80 million in payment appropriations.
• Provisional appropriations (reserves for administrative expenditure and for financial interventions) of EUR 286 million in commitment appropriations and EUR 195 million in payment appropriations.
The breakdown of the provisional appropriations, which are not included in the concept of initial budget used in this report, was as follows: (million EUR)
MFF Heading Description CA PA
Heading 1a Competitiveness 56 12 Heading 2 Natural Resources 115 114 Heading 3a Freedom Security and Justice 112 67 Heading 5 Administration 3 3 TOTAL 286 195
In addition to the mobilisation of reserves by means of budget transfers, the total level of the provisional appropriations under heading 2 were decreased in Amending Budget 8/2013 by EUR 44 million in payments in relation to the International Fisheries Agreements.

10
A.2 CARRYOVER FROM 2012
A.2.1 Carryover Decision for 2013
The carryover decisions of the Commission, taken on 13 February 20134, concerned non-differentiated commitment appropriations and payment appropriations. There were no structural funds commitments made available again.
The table below summarises the carryover decisions by heading of the multiannual financial framework. (million EUR)
Total of Non Automatic Carryover Per MFF heading MFF
heading Description Carryover by decision CA
Carryover by decision PA
1a Competitiveness for growth and employment 24.4 25.9 1b Cohesion for growth and employment 3.2 2 Preservation and Management of natural resources 1.5 4.3 3a Freedom, Security and Justice 1.1 3b Citizenship 4 EU as global player 2.2 3.6 5 Administration (COM) 1.4 TOTAL 31.3 36.3
A.2.1.1 Carryover of Commitment Appropriations
The table below summarises the commitment appropriations carried over. (million EUR)
Budget Item Heading
Amount carried Over
Balance 31.12.2013
04 05 01 European Globalisation Adjustment Fund (EGF) 24.3
09 03 01 Competitiveness and Innovation Framework Programme – Information and Communication Technologies Policy Support Programme (ICT PSP) 0.1
HEADING 1a – TOTAL 24.4
13 03 29 Preparatory action – The definition of governance model for the European Union Danube Region – better and effective coordination 1.3 0.001
13 03 30 Pilot project – Towards a common regional identity, reconciliation of nations and economic and social cooperation including a Pan-European Expertise and Excellence Platform in the Danube macro-region
2.0
HEADING 1b – TOTAL 3.2 0.001 05 04 05 03 Pilot project – Exchange programme for young farmers 1.5 HEADING 2 – TOTAL 1.5 20 02 01 External trade relations, including access to the markets of third countries 0.2
21 05 01 09 Preparatory action – Enhanced health care for victims of sexual violence in the Democratic Republic of Congo (DRC) 2.0
HEADING 4 – TOTAL 2.2 GRAND TOTAL (Commission) 31.3 0.001
All these commitment appropriations were carried over on the basis of Article 13§2(a) of the Financial Regulation, since most of the preparatory stages of the commitment procedure had been completed by end 2012. A.2.1.2 Carryover of Payment Appropriations
The table below summarises the carryover of payment appropriations by decision, by budget line and shows the amount which remained unimplemented at the year-end.
4 SEC (2013) 888 final.

11
(million EUR) Budget
Item Heading Amount carried over
Balance 31.12.2013
04 05 01 European Globalisation Adjustment Fund (EGF) 24.3 24 02 01 Operational programmes in the fight against fraud 1.0 33 06 02 Gender equality 0.6 HEADING 1a – TOTAL 25.9 05 08 02 Surveys on the structure of agricultural holdings 3.7 1.9 07 03 12 Preparatory action – Future legal base on harmonised EU forest information 0.3 0.1 07 03 16 Pilot project – Development of prevention activities to halt desertification in Europe 0.2 07 03 28 Pilot project – Plastic recycling cycle and marine environmental impact 0.2 HEADING 2 – TOTAL 4.3 2.0 18 02 05 Visa information system (VIS) 1.1 0.2 HEADING 3a – TOTAL 1.1 0.2
07 02 03 Pilot project – Environmental monitoring of the Black Sea Basin and a common European framework programme for the development of the Black Sea region 0.2 0.1
22 02 01 Transition and institution-building assistance to candidate countries 1.3 22 02 02 Transition and institution-building assistance to potential candidate countries 0.7
22 02 04 01 Cross-border cooperation (CBC) between IPA countries and participation in ERDF transnational/interregional programmes and ENPI sea basins programmes 0.4 0.4
22 02 07 02 Evaluation of results of Union aid, follow-up and audit measures 0.3
22 02 07 03 Financial support for encouraging the economic development of the Turkish Cypriot community 0.3
22 02 10 01 Prince – Information and communication 0.1 0.1 22 02 10 02 Information and communication for third countries 0.4 0.1 HEADING 4 – TOTAL 3.6 0.6
24 02 04 Pilot Project - Developing a Union evaluation mechanism in the area of anti-corruption with a particular focus on identifying and reducing the costs of corruption in public procurement involving Union funds
0.8
25 01 10 Preparatory action – Interinstitutional system identifying long-term trends facing the Union 0.2 0.2
25 02 01 01 Historical archives of the European Union 0.1 25 02 04 01 Documentary databases 0.1 25 02 04 02 Digital publications 0.2 HEADING 5 – TOTAL 1.4 0.2 GRAND TOTAL (Commission) 36.3 3.1
A.2.2 Implementation of payment appropriations carried over from 2012
The total implementation of payment appropriations is presented in the table below: (million EUR)
MFF Heading Description PA carryover
by decision Imple-
mented PA automatic
Carryover Imple-
mented Total PA
Imple- mented %
1a Competitiveness 26 26 117 101 143 127 89% 1b Cohesion 14 11 14 11 82% 2 Natural resources 4 2 32 29 36 32 88%
3a Freedom, security, justice 1 1 2 2 3 3 80%
3b Citizenship 5 5 5 5 90% 4 EU as global player 4 3 26 23 30 26 85% 5 Administration (COM) 1 1 298 273 299 274 91% TOTAL 36 33 494 444 530 477 90%

12
A.3 AMENDING BUDGETS 2013
A.3.1 Summary Table of Amending Budgets 20135 (million EUR)
AB Date of adoption Main subject Official
Journal Impact on
CA Impact on PA
1 04/07 Accession of Croatia OJ L 256 – 27/09/2013 +655 +374
2 11/09 Increase of payment appropriations OJ L 327 – 06/12/2013 - +7 300
3 11/09 2012 surplus OJ L 327 – 06/12/2013 - -
4 11/09 Modification of establishment plans in European GNSS agency, EACEA and the Court of Justice
OJ L 327 – 06/12/2013 0 0
5 11/09 Mobilisation of the Solidarity Fund for Slovenia, Croatia and Austria (flooding disaster in autumn 2012)
OJ L 327 – 06/12/2013 +15 +15
6 24/10 Revision of the forecast of Traditional Own Resources, budgeting of other revenue
OJ L 6 - 10/01/2014 - -
7 19/11 European Social Fund (ESF) for FR, IT and ES OJ L 49 - 19/02/2014 +150 -
8 19/11 Increase of payment appropriations (DAB 2 bis) OJ L 49 – 19/02/2014 - + 3 9686
Reserve -44
9 20/11
Mobilisation of the Solidarity Fund for Romania (drought and forest fires in summer 2012 and for Germany, Austria and the Czech Republic (flooding in spring 2013), redeployment of payment appropriations.
OJ L 49 – 19/02/2014 +374 0
The Commission proposed a number of significant draft amending budgets during the course of 2013. The first concerned the amounts needed to accommodate the accession of Croatia from 1 July 2013.
At the end of March, DAB 2 requested a reinforcement of EUR 11 225 million in payment appropriations to tackle the serious shortage of payment appropriations in the 2013 budget. The increases were spread across headings 1a, 1b, 2, 3a, 3b and 4 of the multi-annual financial framework, and were intended to cover outstanding needs to the end of the year, so that obligations stemming from past and current commitments could be honoured, financial penalties avoided, and so that beneficiaries could receive the funds envisaged by the agreed EU policies, for which Parliament and Council had authorised the related commitment appropriations in previous annual budgets.
In the end, the Commission's request was adopted in two steps – AB 2/2013 was approved in September for an amount of EUR 7.3 billion, and AB 8/2013 was approved for a total amount of EUR 3.9 billion in November.
In addition to facilitating the payment of amounts due, the combined effect of these amending budgets also helped to limit the growth of outstanding commitments (‘reste à liquider’, RAL) during 2013 (see section A.6).
With respect to the European Union Solidarity Fund, a total of EUR 415 million was mobilised. However, only EUR 15 million of the related payments came from fresh appropriations (AB 5/2013). In AB 9/2013, EUR 251 million came from redeployment, identified in the annual Global Transfer exercise, and the remaining EUR 150 million was budgeted in 2014.
5 In this table the figure "0" shows the cases where budgetary neutral reallocations between headings were made. 6 In this report the distinction between available appropriations and provisional appropriations is systematically made. Without it,
the total impact of AB 8/2013 to payment appropriations is EUR 3 925 million. This difference is essential, because with this increase and the redeployment from the reserve, the total amount of payment appropriations remained below the financial framework ceiling.
13
See also the Amending Budgets in part C "Own resources" (C.4).
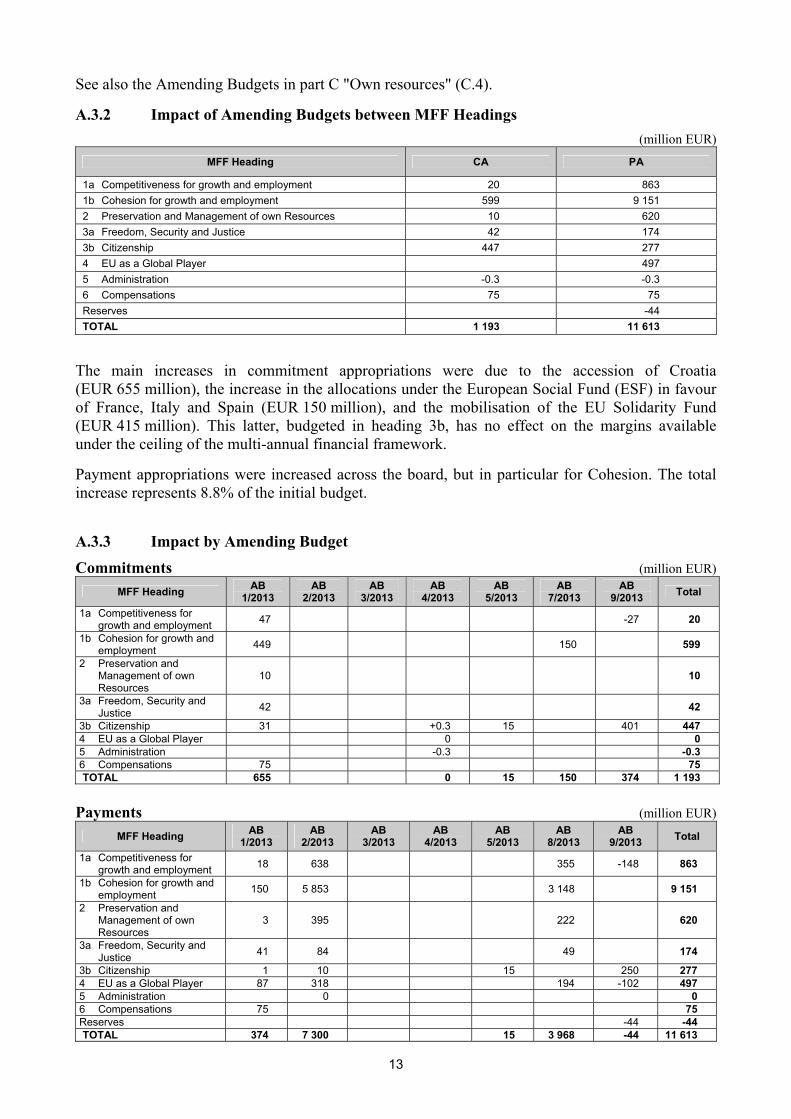
A.3.2 Impact of Amending Budgets between MFF Headings (million EUR)
MFF Heading CA PA
1a Competitiveness for growth and employment 20 863 1b Cohesion for growth and employment 599 9 151 2 Preservation and Management of own Resources 10 620 3a Freedom, Security and Justice 42 174 3b Citizenship 447 277 4 EU as a Global Player 497 5 Administration -0.3 -0.3 6 Compensations 75 75 Reserves -44 TOTAL 1 193 11 613
The main increases in commitment appropriations were due to the accession of Croatia (EUR 655 million), the increase in the allocations under the European Social Fund (ESF) in favour of France, Italy and Spain (EUR 150 million), and the mobilisation of the EU Solidarity Fund (EUR 415 million). This latter, budgeted in heading 3b, has no effect on the margins available under the ceiling of the multi-annual financial framework.
Payment appropriations were increased across the board, but in particular for Cohesion. The total increase represents 8.8% of the initial budget.
A.3.3 Impact by Amending Budget
Commitments (million EUR)
MFF Heading AB 1/2013
AB 2/2013
AB 3/2013
AB 4/2013
AB 5/2013
AB 7/2013
AB 9/2013 Total
1a Competitiveness for growth and employment 47 -27 20
1b Cohesion for growth and employment 449 150 599
2 Preservation and Management of own Resources
10 10
3a Freedom, Security and Justice 42 42
3b Citizenship 31 +0.3 15 401 447 4 EU as a Global Player 0 0 5 Administration -0.3 -0.3 6 Compensations 75 75 TOTAL 655 0 15 150 374 1 193
Payments (million EUR)
MFF Heading AB 1/2013
AB 2/2013
AB 3/2013
AB 4/2013
AB 5/2013
AB 8/2013
AB 9/2013 Total
1a Competitiveness for growth and employment 18 638 355 -148 863
1b Cohesion for growth and employment 150 5 853 3 148 9 151
2 Preservation and Management of own Resources
3 395 222 620
3a Freedom, Security and Justice 41 84 49 174
3b Citizenship 1 10 15 250 277 4 EU as a Global Player 87 318 194 -102 497 5 Administration 0 0 6 Compensations 75 75 Reserves -44 -44 TOTAL 374 7 300 15 3 968 -44 11 613
14
A.4 TRANSFERS 2013
A.4.1 Total Impact of Transfers
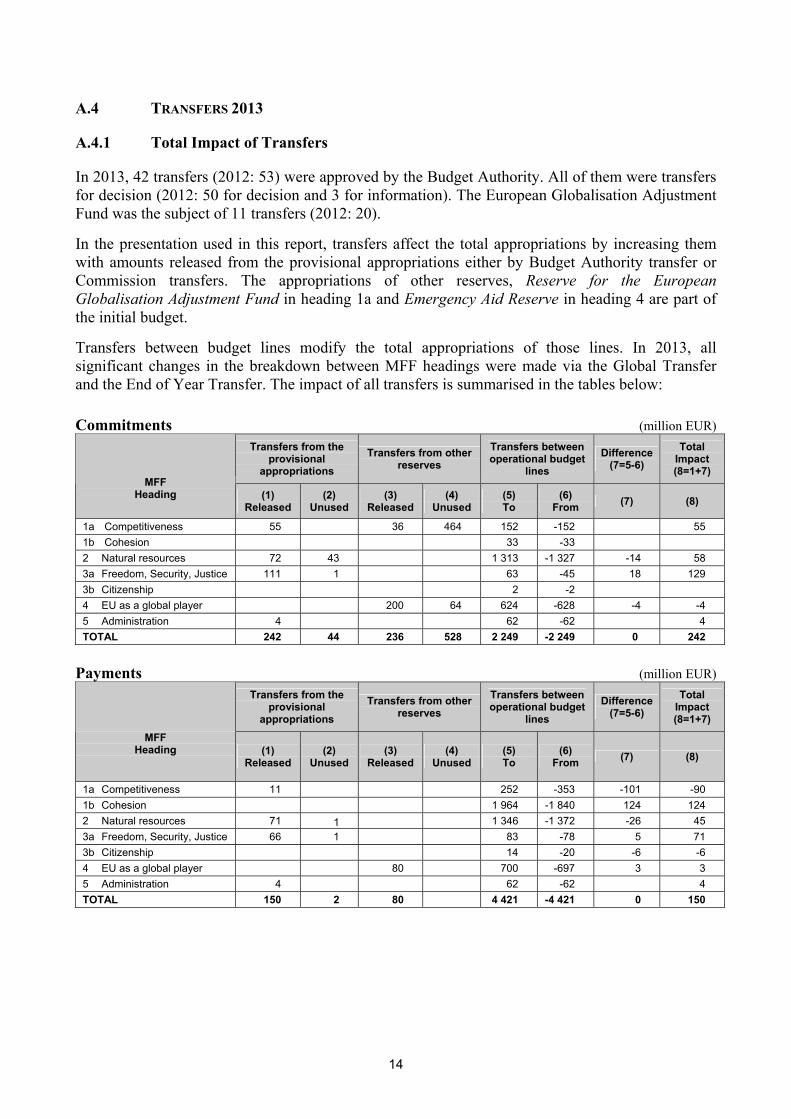
In 2013, 42 transfers (2012: 53) were approved by the Budget Authority. All of them were transfers for decision (2012: 50 for decision and 3 for information). The European Globalisation Adjustment Fund was the subject of 11 transfers (2012: 20).
In the presentation used in this report, transfers affect the total appropriations by increasing them with amounts released from the provisional appropriations either by Budget Authority transfer or Commission transfers. The appropriations of other reserves, Reserve for the European Globalisation Adjustment Fund in heading 1a and Emergency Aid Reserve in heading 4 are part of the initial budget.
Transfers between budget lines modify the total appropriations of those lines. In 2013, all significant changes in the breakdown between MFF headings were made via the Global Transfer and the End of Year Transfer. The impact of all transfers is summarised in the tables below: Commitments (million EUR)
Transfers from the provisional
appropriations Transfers from other
reserves Transfers between operational budget
lines Difference
(7=5-6) Total
Impact (8=1+7)
MFF Heading (1)
Released (2)
Unused (3)
Released (4)
Unused (5) To
(6) From (7) (8)
1a Competitiveness 55 36 464 152 -152 55 1b Cohesion 33 -33 2 Natural resources 72 43 1 313 -1 327 -14 58 3a Freedom, Security, Justice 111 1 63 -45 18 129 3b Citizenship 2 -2 4 EU as a global player 200 64 624 -628 -4 -4 5 Administration 4 62 -62 4 TOTAL 242 44 236 528 2 249 -2 249 0 242
Payments (million EUR)
Transfers from the provisional
appropriations Transfers from other
reserves Transfers between operational budget
lines Difference
(7=5-6) Total
Impact (8=1+7)
MFF Heading (1)
Released (2)
Unused (3)
Released (4)
Unused (5) To
(6) From (7) (8)
1a Competitiveness 11 252 -353 -101 -90 1b Cohesion 1 964 -1 840 124 124 2 Natural resources 71 1 1 346 -1 372 -26 45 3a Freedom, Security, Justice 66 1 83 -78 5 71 3b Citizenship 14 -20 -6 -6 4 EU as a global player 80 700 -697 3 3 5 Administration 4 62 -62 4 TOTAL 150 2 80 4 421 -4 421 0 150

15
After these transfers from the provisional appropriations and the adjustment via Amending Budget 8/2013 for 11 03 01 International fisheries agreement, the following amounts remained unused: (million EUR)
Budget line Heading Description Provisional appropriations CA
Provisional appropriations PA
11 03 01 2 International fisheries agreement 42.9 0.8 18 02 07 3a Schengen evaluation 0.7 0.7 Total 43.6 1.5
A.4.2 The Global Transfer
The Global Transfer exercise is intended to match needs for reinforcements of payment appropriations with availabilities from other areas, should these exist. The Global Transfer for 2013 (DEC 26) was approved on 5 November, and the volume of reinforcements and reductions totalled EUR 109 million (2012: EUR 420 million) broken down by heading as follows: (million EUR)
MFF Heading Reinforcements Reductions Impact between headings
1a Competitiveness 26.2 -42.7 -16.5 2 Natural resources -22.1 -22.1 3a Freedom, security, justice 4.0 -0.5 3.5 3b Citizenship -2.5 -2.5 4 EU as a global player 79.1 -41.3 37.9 5 Administration -0.2 -0.2
TOTAL 109.3 109.3 0
In total, 44 budget lines (2012: 110) were concerned; 9 for reinforcement and 35 for reductions (2012: 65 and 45).
The approved Global Transfer was significantly amended compared to the Commission's original proposal, which had been EUR 400 million higher. The increases refused, allowed the remaining balance to be redeployed in Amending Budget 9/2013 (see section A.3), providing part of the payments for the mobilisation of the EU Solidarity Fund (EUR 251 million), and reinforcing a selection of budget lines of Seventh Research Framework Programme (FP7) (inter alia 15 07 77 People with EUR 63 million, 08 10 01 Ideas with EUR 42 million, 09 04 01 01 Support for research cooperation in the area of information and communication technologies (ICTs – Cooperation) with EUR 41 million).
The major decreases concerned following budget lines: • 08 20 02 Euratom – European Joint Undertaking for ITER – Fusion for Energy (F4E) for
EUR 289 million; • 13 05 01 01 Instrument for Structural Policies for Pre-accession (ISPA) – Completion of
other previous projects (2000 to 2006) for EUR 79 million; • 05 05 02 Instrument for Pre-accession Assistance for Rural Development (IPARD) for
EUR 32 million.
A complete summary on Budget Authority transfers is given in Annex 1.

16
A.4.3 End of Year Transfer for Payment Appropriations
The so-called "End of Year Transfer" is intended to ensure that, insofar as possible, the outstanding requests for additional payments related to funds in shared management, can be met, by making full use of any available payment appropriations, right up to mid-December.
The rules governing this facility are set out in Article 179(2) and 179(3) of the Regulation (EU, EURATOM) No 966/2012 of the European Parliament and of the Council on the financial rules applicable to the general budget of the European Union (Financial Regulation).
The "End of Year Transfer" for 2013 concerned payment appropriations totalling EUR 140 million (2012: EUR 291 million) in total, drawn from 52 budget lines (2012: 102), which can be broken down by heading as follows: (million EUR)
MFF Heading Reductions
1a Competitiveness -85 2 Natural resources -4 3a Freedom, security, justice -5 3b Citizenship -1 4 EU as a global player -45
TOTAL -140
This amount was transferred as follows: • EUR 29 million for 04 02 19 European Social Fund (ESF) - Regional competitiveness and
employment; • EUR 106 million for 13 04 02 Cohesion Fund; • EUR 5 million for 18 02 06 External Borders Fund.

17
A.5 2013 IMPLEMENTATION OVERVIEW
A.5.1 Implementation of authorised appropriations 2013
The implementation table of consolidated authorised appropriations below includes assigned revenue and other institutions. (million EUR)
Consolidated Implementation Table
Initial budget
Carryover from 2012
Amending budgets
BA transfers
Internal transfers
Assigned revenue
Total appropria-
tions7
Actual 2013 Rate Actual
2012 Carry-over to 2014
CA 150 612 31 1 193 190 52 7 687 159 810 155 659 97% 151 284 3 318
PA 132 641 998 11 658 142 8 8 011 153 461 148 469 97% 138 683 4 656
RAL as at 01.01.2013
Payments on RAL
Commitments 2013
Payments on 2013 commitments Decommitments 2013 RAL as at
31.12.2013 Evolution of the
RAL (%)
RAL 217 810 83 611 155 659 64 858 2 591 222 410 +2%
The implementation table of authorised appropriations for the Commission is shown below: (million EUR)
Implementation Table
Initial budget
Carryover from 2012
Amending budgets
BA transfers
COM transfers
Assigned revenue
Total appropria-
tions8
Actual 2013 Rate Actual
2012 Carry-over to 2014
CA 147 085 31 1 193 190 52 7 191 155 788 151 829 97% 147 443 3 257
PA 129 114 530 11 658 142 8 7 509 148 964 144 766 97% 135 087 4 036
RAL as at 01.01.2013
Payments on RAL
Commitments 2013
Payments on 2013 commitments Decommitments 2013 RAL as at
31.12.2013 Evolution of the RAL
(%)
RAL 217 222 83 186 151 829 61 580 2 432 221 853 +2%
These implementation rates are influenced by the inclusion of assigned revenue. The implementation rates for assigned revenue are not comparable to that for the annual voted budgetary appropriations, due to the different nature of these appropriations. The use of assigned revenue may be subject to specific conditions; commitments and payments are entered in the budget of the year for the same amount even if their planned implementation schedule would cover later years; unused appropriations are not cancelled but carried over automatically (with the exception of refunds carried over from the previous year).
Excluding assigned revenue and un-mobilised reserves, the implementation rates of 2013 are 99.7% for commitments and 99.2% for payments.
7 Includes the provisional appropriations CA EUR 44 million and PA EUR 2 million. 8 Includes the provisional appropriations CA EUR 44 million and PA EUR 2 million.

18
The tables below give the 2013 implementation of authorised appropriations by policy area: Commitments
Implementation by Policy area
Commitments made
Title
Polic
y A
rea
Com
mitm
ent
App
ropr
iatio
ns
Aut
horis
ed
From
the
year
's
appr
opria
tions
From
car
ryov
ers
From
ass
igne
d re
venu
e
Tota
l
Rat
e
01 Economic and Financial Affairs 527 488 0 29 517 98% 02 Enterprise 1 269 1 135 0 105 1 241 98% 03 Competition 99 91 0 3 94 95% 04 Employment and Social Affairs 12 823 12 097 24 10 12 131 95% 05 Agriculture and Rural Development 61 226 58 797 2 1368 60 167 98% 06 Mobility and Transport 1 843 1 734 0 73 1 807 98% 07 Environment and Climate Action 518 495 0 11 506 98% 08 Research 8 130 6 874 0 1041 7 915 97% 09 Information Society and Media 2 131 1 810 0 276 2 085 98% 10 Direct Research 1 000 424 0 94 518 52% 11 Maritime Affairs and Fisheries 1 043 995 0 1 997 96% 12 Internal Market 123 104 0 13 117 95% 13 Regional Policy 44 464 44 162 3 5 44 170 99% 14 Taxation and Customs Union 151 144 0 3 147 97% 15 Education and Culture 3 433 2 826 0 477 3 303 96% 16 Communication 275 264 0 5 269 98% 17 Health and Consumer Protection 648 614 0 20 635 98% 18 Area of freedom. security and justice 1 444 1 352 0 68 1 420 98% 19 External Relations 5 088 4 869 0 153 5 023 99% 20 Trade 111 105 0 2 108 97% 21 Development and Relation with ACP States 1 701 1 564 2 99 1 664 98% 22 Enlargement 1 152 1 115 0 31 1 147 100% 23 Humanitarian Aid 1 360 1 326 0 12 1 339 98% 24 Fight against Fraud 79 79 0 0 79 100%
25 Commission's Policy Coordination and Legal Advice 205 188 0 6 194 95%
26 Commission's Administration 1 184 1 028 0 91 1 119 95% 27 Budget 138 129 0 4 134 97% 28 Audit 13 11 0 0 12 93% 29 Statistics 144 126 0 8 134 93% 30 Pensions and Related expenditure 1 401 1 397 0 0 1 397 100% 31 Language services 482 387 0 48 435 90% 32 Energy 818 734 0 48 782 96% 33 Justice 235 216 0 8 225 96%
Total Commission including reserves 155 788 147 684 31 4 114 151 829 97% Other Institutions 4 023 3 396 0 434 3 830 97% TOTAL 159 810 151 080 31 4 548 155 659 97%
19
Payments Implementation by Policy area
Payments made
Title
Polic
y A
rea
Paym
ent A
ppro
pria
tions
A
utho
rised
From
the
year
's
appr
opria
tions
From
car
ryov
ers
From
ass
igne
d re
venu
e
Tota
l
Rat
e
01 Economic and Financial Affairs 411 366 6 26 397 97% 02 Enterprise 1 587 1 359 17 80 1 456 92% 03 Competition 107 84 7 2 93 87% 04 Employment and Social Affairs 14 286 13 672 36 399 14 107 99% 05 Agriculture and Rural Development 59 234 56 815 23 1 501 58 339 98% 06 Mobility and Transport 1 120 990 5 64 1 059 95% 07 Environment and Climate Action 438 377 17 12 406 93% 08 Research 6 556 4 958 23 790 5 771 88% 09 Information Society and Media 2 024 1 539 13 273 1 826 90% 10 Direct Research 959 366 41 89 496 52% 11 Maritime Affairs and Fisheries 831 816 3 1 820 99% 12 Internal Market 127 97 5 13 116 91% 13 Regional Policy 43 960 43 262 10 222 43 494 99% 14 Taxation and Customs Union 140 120 7 3 129 92% 15 Education and Culture 3 301 2 614 12 426 3 052 92% 16 Communication 273 234 14 5 252 92% 17 Health and Consumer Protection 622 574 10 15 599 96% 18 Area of freedom. security and justice 1 053 966 5 64 1 035 98% 19 External Relations 3 354 3 189 11 94 3 295 98% 20 Trade 112 99 4 2 104 93% 21 Development and Relation with ACP States 1 377 1 212 9 124 1 345 98% 22 Enlargement 933 901 6 12 920 99% 23 Humanitarian Aid 1 278 1 230 7 12 1 249 97% 24 Fight against Fraud 83 65 8 0 73 87%
25 Commission's Policy Coordination and Legal Advice 221 175 13 5 193 87%
26 Commission's Administration 1 318 894 125 64 1 082 82% 27 Budget 146 124 8 3 135 92% 28 Audit 13 11 0 0 12 89% 29 Statistics 147 115 5 7 126 86% 30 Pensions and Related expenditure 1 401 1 397 0 0 1 397 100% 31 Language services 506 371 22 44 436 86% 32 Energy 838 734 5 20 758 91% 33 Justice 208 183 3 9 195 94%
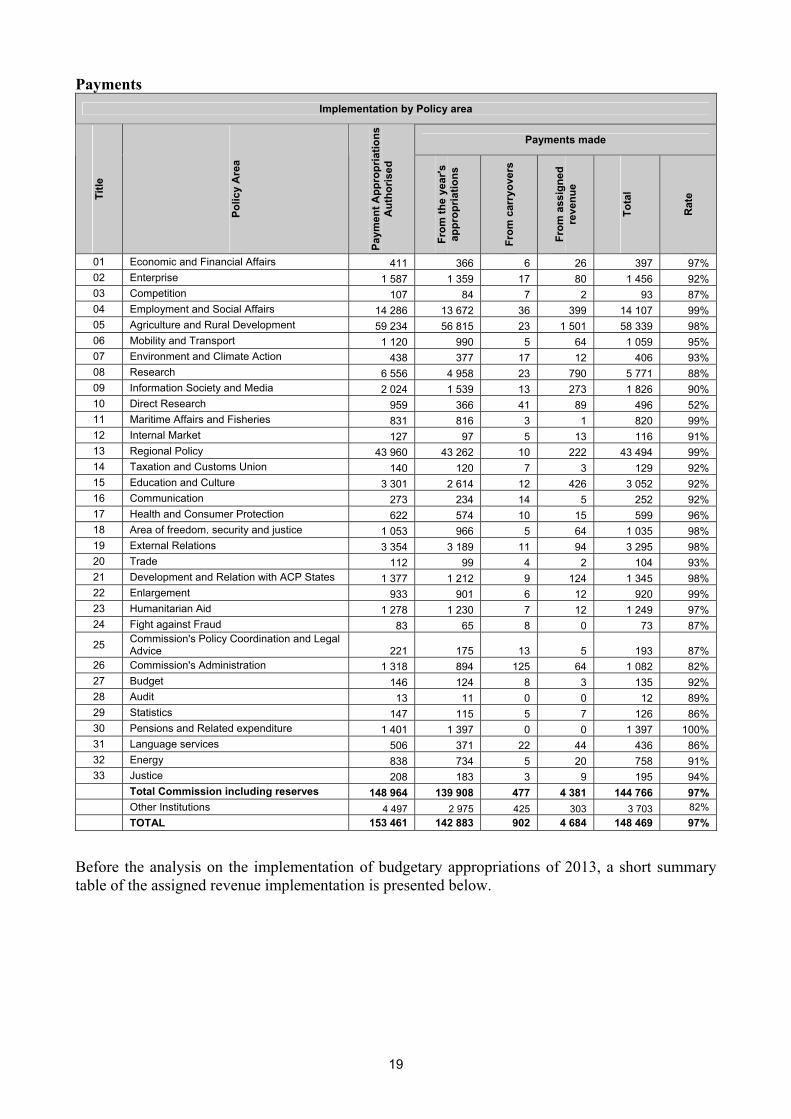
Total Commission including reserves 148 964 139 908 477 4 381 144 766 97% Other Institutions 4 497 2 975 425 303 3 703 82% TOTAL 153 461 142 883 902 4 684 148 469 97%
Before the analysis on the implementation of budgetary appropriations of 2013, a short summary table of the assigned revenue implementation is presented below.
20
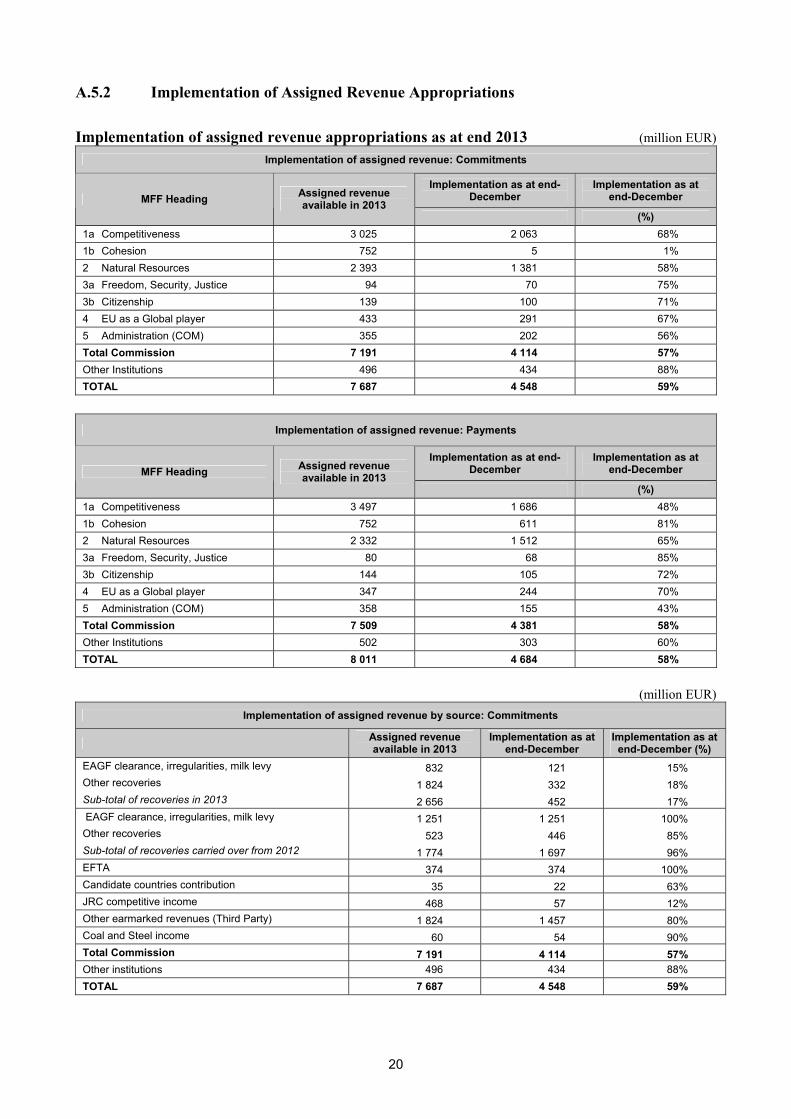
A.5.2 Implementation of Assigned Revenue Appropriations Implementation of assigned revenue appropriations as at end 2013 (million EUR)
Implementation of assigned revenue: Commitments
Implementation as at end-December
Implementation as at end-December MFF Heading Assigned revenue
available in 2013 (%)
1a Competitiveness 3 025 2 063 68% 1b Cohesion 752 5 1% 2 Natural Resources 2 393 1 381 58% 3a Freedom, Security, Justice 94 70 75% 3b Citizenship 139 100 71% 4 EU as a Global player 433 291 67% 5 Administration (COM) 355 202 56% Total Commission 7 191 4 114 57% Other Institutions 496 434 88% TOTAL 7 687 4 548 59%
Implementation of assigned revenue: Payments
Implementation as at end-December
Implementation as at end-December MFF Heading Assigned revenue
available in 2013 (%)
1a Competitiveness 3 497 1 686 48% 1b Cohesion 752 611 81% 2 Natural Resources 2 332 1 512 65% 3a Freedom, Security, Justice 80 68 85% 3b Citizenship 144 105 72% 4 EU as a Global player 347 244 70% 5 Administration (COM) 358 155 43% Total Commission 7 509 4 381 58% Other Institutions 502 303 60% TOTAL 8 011 4 684 58%
(million EUR)
Implementation of assigned revenue by source: Commitments
Assigned revenue available in 2013
Implementation as at end-December
Implementation as at end-December (%)
EAGF clearance, irregularities, milk levy 832 121 15% Other recoveries 1 824 332 18% Sub-total of recoveries in 2013 2 656 452 17% EAGF clearance, irregularities, milk levy 1 251 1 251 100% Other recoveries 523 446 85% Sub-total of recoveries carried over from 2012 1 774 1 697 96% EFTA 374 374 100% Candidate countries contribution 35 22 63% JRC competitive income 468 57 12% Other earmarked revenues (Third Party) 1 824 1 457 80% Coal and Steel income 60 54 90% Total Commission 7 191 4 114 57% Other institutions 496 434 88% TOTAL 7 687 4 548 59%

21
Implementation of assigned revenue by source: Payments
Assigned revenue available in 2013
Implementation as at end-December
Implementation as at end-December
EAGF clearance, irregularities, milk levy 832 122 15% Other recoveries 1 829 1 189 65% Sub-total of recoveries in 2013 2 661 1 311 49% EAGF clearance, irregularities, milk levy 1 246 1 246 100% Other recoveries 284 257 90% Sub-total of recoveries carried over from 2012 1 531 1 503 98% EFTA 293 293 98% Candidate countries contributions 48 15 31% JRC competitive income 367 51 14% Other earmarked revenues (Third Party) 2 548 1 159 46% Coal and Steel income 61 49 80% Total Commission 7 509 4 381 58% Other institutions 502 303 60% TOTAL 8 011 4 684 58%
A complete analysis of the implementation of assigned revenue in 2013 will be presented in the Working document part V of the Draft General Budget of the European Commission for the financial year 2015 Assigned revenue implementation in the previous year.
A.5.3 Implementation of Budgetary Appropriations 2013
A.5.3.1 2013 Implementation Overview Table
The table below gives the implementation of budgetary appropriations of the year 2013 excluding un-mobilised reserves. (million EUR)
Implementation as at 31 December 2013: Commitment and Payment appropriations
Implementation as at end-2013
Implementation as at end-2013 (%)
Balance as at end 2013
Balance after carryover to 2014 Heading
CA PA CA PA CA PA CA PA 1a Competitiveness 15 631 12 495 100% 99% 42 151 24 16 1b Cohesion 54 951 56 309 100% 100% 157 164 7 3 2 Natural Resources 60 080 57 980 100% 100% 22 53 21 18 3a Freedom, Security, Justice 1 455 1 051 100% 100% 3 4 2 1 3b Citizenship 1 152 652 100% 72% 2 257 2 1 4 EU as a Global Player 9 500 6 786 100% 99% 15 37 9 2 5 Administration (COM) 4 838 4 559 99% 93% 66 343 66 65 6 Compensation 75 75 100% 100% 0 0 0 0 Total 147 684 139 908 100% 99% 309 1 010 130 107 Other institutions 3 396 2 975 96% 84% 131 552 131 131
TOTAL 151 080 142 884 99% 99% 440 1 562 261 238
Unspent appropriations carried over from 2013 are treated in item A.2.2, unused reserves in item A.4.1.

22
A.5.3.2 Implementation Compared to Initial Budget 2013
The table below presents the 2013 implementation by detailed MFF heading on initial budget compared to the final budget (budget after adjustments during the year), showing the link between implementation rates and budgetary adjustments.
In this analysis, no distinction is made between appropriations released from the reserve and fresh appropriations. For instance, the initial budget for Fisheries governance and international agreements was initially low, but subsequently amounts from the reserve were transferred to the operational budget line. There were no appropriations for the European Union Solidarity Fund in the initial budget, but during the year EUR 415 million in commitments and EUR 251 in payments were agreed. The impact of amending budgets in heading 3b is such, that excluding the Fund, implementation rates would be 104 % of the initial budget in commitments and 100 % in payments.
Comparison of 2013 Implementation of the Initial Budget and the Final Budget by detailed MFF Heading
CA PA MFF Heading On final
budget On initial budget
On final budget
On initial budget
1a Competitiveness for growth and employment 1.1.1 Seventh Research framework programme 100% 100% 99% 106% 1.1.2 Decommissioning 100% 100% 100% 113% 1.1.3 Trans-European networks 100% 100% 99% 102% 1.1.4 EGNOS & Galileo 99% 99% 99% 105% 1.1.5 Marco Polo 100% 100% 100% 64% 1.1.6 Lifelong Learning 100% 101% 100% 112% 1.1.7 Competitiveness and innovation framework programme (CIP) 100% 100% 99% 121% 1.1.8 Social policy agenda 95% 95% 94% 82% 1.1.9 Customs and Fiscalis 100% 100% 99% 128% 1.1.10 Nuclear decommissioning 100% 100% 100% 99% 1.1.12 EEPR - Energy projects to aid economic recovery n/a n/a 99% 71% TOTAL— Competitiveness 100% 101% 99% 105% 1b Cohesion For Growth And Employment 1.2.1 Structural Funds 100% 101% 100% 117% 1.2.11 Convergence objective 100% 101% 100% 110% 1.2.12 Regional competitiveness and employment objective 98% 100% 100% 145% 1.2.13 European territorial cooperation objective 100% 101% 100% 166% 1.2.14 Technical assistance 94% 95% 80% 86% 1.2.2 Cohesion Fund 100% 101% 99% 131%
TOTAL— Cohesion 100% 101% 100% 119% 2 Preservation and Management of Natural Resources 2.0.1 Market related expenditure and direct aids 100% 100% 100% 100% 2.0.2 Rural development 100% 100% 100% 104% 2.0.3 European Fisheries Fund 100% 101% 100% 117% 2.0.4 Fisheries governance and international agreements 100% 150% 99% 151% 2.0.5 Life+ 100% 100% 94% 99%
TOTAL— Natural Resources 100% 100% 100% 101% 3a. Freedom, Security and Justice 3.1.1 Solidarity and management of migration flows 100% 112% 100% 139% 3.1.2 Security and safeguarding liberties 100% 112% 99% 198% 3.1.3 Fundamental rights and justice 99% 99% 98% 110% TOTAL— Freedom, Security and Justice 100% 113% 100% 130% 3b. Citizenship 3.2.1 Public health and consumer protection programme 100% 100% 100% 106% 3.2.2 Culture 2007 100% 100% 99% 103% 3.2.3 Youth in action 100% 101% 100% 100% 3.2.4 Media 100% 100% 100% 104% 3.2.5 Europe for citizens 100% 100% 99% 98% 3.2.6 Civil protection Financial instrument 97% 96% 99% 91% 3.2.7 Communication actions 100% 100% 97% 93% 3.2.8 EU Solidarity Fund 100% n/a 5% n/a TOTAL— Citizenship 100% 163% 72% 102%

23
Comparison of 2013 Implementation of the Initial Budget and the Final Budget by detailed MFF Heading
CA PA MFF Heading On final
budget On initial budget
On final budget
On initial budget
4. The EU as a global player 4.0.1 Instrument for Pre-Accession (IPA) 100% 100% 99% 105% 4.0.2 European Neighbourhood and Partnership Instrument (ENPI) 100% 100% 100% 107% 4.0.3 Development Cooperation Instrument (DCI) 100% 99% 99% 101% 4.0.4 Instrument for Stability 100% 98% 99% 132% 4.0.5 Humanitarian aid 100% 148% 100% 152% 4.0.6 Macrofinancial Assistance 3% 0% 96% 1% 4.0.7 Common Foreign and Security Policy (CFSP) 98% 86% 100% 95% 4.0.8 EC guarantees for lending operations 100% 100% 100% 100% 4.0.10 Industrialised Countries Instrument 100% 100% 99% 103% 4.0.11 Democracy and Human Rights 100% 100% 98% 109% 4.0.12 Instrument for Nuclear Safety Cooperation 100% 68% 99% 81% 4.0.13 ICI+ 99% 99% 100% 162% TOTAL— EU as a global player 100% 102% 99% 107% 5. Administration 5.0.1 Commission (excluding pensions) 98% 98% 90% 90% 5.0.3 Pensions (all institutions) 100% 100% 100% 100% 5.0.4 European schools 100% 96% 100% 96% TOTAL— Administration 99% 99% 93% 93% 6. Compensations 6.0.1 Compensations 100% n/a 100% n/a TOTAL— Compensations 100% n/a 100% n/a
TOTAL COMMISSION 100% 101% 99% 108% Other institutions 96% 84% 96% 84% GRAND TOTAL 100% 101% 99% 108%

24
A.6 RAL-SITUATION
A.6.1 Consolidated summary of commitments outstanding
The evolution of outstanding commitments is shown in the table below. (million EUR)
Policy Area RAL as at 01.01.2013
Payments on RAL
Commitments 2013
Payments on 2013
Commitments
De-commitments
2013 RAL as at 31.12.2013
Increase in million EUR
1a Competitiveness 26 556 7 859 17 723 6 448 341 29 629 3 073 1b Cohesion 139 715 55 964 54 959 968 681 137 063 -2 652 2 Natural Resources 26 886 13 444 61 463 46 080 396 28 428 1 542 3a Freedom, Security
and Justice 1 807 384 1 525 738 85 2 125 318 3b Citizenship 509 244 1 252 517 48 952 443 4 The EU as a
global player 21 429 5 002 9 793 2 053 854 23 313 1 884 5 Administration 320 289 5 040 4 701 28 342 22 6 Compensations 75 75 TOTAL COMMISSION 217 222 83 186 151 829 61 580 2 432 221 853 4 631 Other Institutions 588 424 3 830 3 278 159 557 -31 TOTAL 217 810 83 611 155 659 64 858 2 591 222 410 4 600
A.6.2 Evolution of the RAL in 2013
Heading Increase in million EUR Evolution in %
1a Competitiveness 3 073 12% 1b Cohesion -2 652 -2% 2 Natural Resources 1 542 6% 3a Freedom, Security and Justice 318 18% 3b Citizenship 443 87% 4 The EU as a global player 1 884 9% 5 Administration 22 7% TOTAL COMMISSION 4 631 2%
The growth of the RAL in 2013 was limited by Amending Budgets which made a further EUR 11.6 billion in payment appropriations available to address outstanding needs. The evolution of the RAL for heading 3b Citizenship reflects a very particular situation at the end of 2013 for the European Union Solidarity Fund. EUR 400 million, mobilised through AB 9/2013 was committed at the end of the year, and appears as outstanding commitments. However, the payments will be fully made in the first part of 2014 on the basis of the amounts carried over (EUR 241 million) and the amounts budgeted in 2014 (EUR 150 million).

25
A.6.3 Main programmes
RAL amount billion EUR As % of RAL As % of 2013
differentiated CA RAL in years of
differentiated CA in final budget 2013
Total Heading 1a* 29.6 13.3% 17.1% 1.7 7th Research Framework Programme 17.2 7.8% 9.8% 1.7 Transport programmes 3.4 1.5% 1.4% 2.3 Total Heading 1b 137.0 61.8% 54.1% 2.5 Convergence objective 80.0 36.1% 32.3% 2.4 Competitiveness objective 19.0 8.6% 7.4% 2.5 Cohesion fund 30.2 13.6% 12.2% 2.4 Total Heading 2 28.4 12.8% 16.2% 1.7 Rural development 24.3 11.0% 15.2% 1.6 Total Heading 3 3.1 1.4% 2.7% 1.1 Total Heading 4 23.3 10.5% 9.2% 2.5 Pre-accession (IPA) 5.3 2.4% 2.4% 2.8 Neighbourhood (ENPI) 5.5 2.8% 2.5% 2.2 Development cooperation (DCI) 7.3 3.3% 2.5% 2.8 Total of main programmes 192.2 88.9% 89.9% 2.2 GRAND TOTAL 221.9 100% 100% 2.2
* Total heading contains all budget lines with differentiated appropriations, so it includes completion lines with no commitment appropriations in 2013. Programme RAL refers only to the operational budget lines of the current programmes.
The RAL of differentiated appropriations corresponds to 2.2 years of commitments and to 2.3 years of payment appropriations at the 2013 level. This is in line with the N+2/N+3 reference of the Cohesion policy (heading 1b) and the N+2 reference of Rural Development and the Fisheries Funds (heading 2), which, as the largest differentiated budget lines, are the main contributors to the RAL. For heading 1b, its relative share in the RAL is somewhat higher than its share in commitment appropriations, but in 2013 the volume of outstanding commitments for Cohesion actually declined for the first time.
In 2013, some EUR 9.6 billion more than in 2012 was paid against outstanding commitments from previous years. The growth of the RAL was limited to less than EUR 4.5 billion (+2%), compared to an initially projected EUR 18 billion increase (difference between voted commitments and voted payments) before de-commitments.

26
A.6.4 Age structure of the RAL (million EUR)
RAL per year of origin by policy area
MFF Heading <2007 2007 2008 2009 2010 2011 2012 2013 Total individual commitments Total RAL
1a Competitiveness 109 48 316 831 3 815 3 792 6 814 9 268 24 993 29 629
1b Cohesion 3 864 63 424 1 799 8 606 23 719 44 367 54 202 137 044 137 0632 Natural
Resources 479 1 49 100 197 2 534 9 442 15 274 28 076 28 428
3a Freedom, Security and Justice
1 47 118 177 325 482 759 1 909 2 125
3b Citizenship 2 2 3 7 22 35 124 703 898 9524 EU as a global
player 589 91 214 481 1 221 2 179 3 973 5 951 14 699 23 313
5 Administration 3 339 342 342
Total Commission 5 041 207 1 053 3 336 14 037 32 585 65 206 86 496 207 961 221 853
Other Institutions 557 557 557
TOTAL 5 041 207 1 053 3 336 14 037 32 585 65 206 87 052 208 517 222 410
For the programming period 2007-2013, the profile of the outstanding individual commitments is in line with the N+2/N+3 reference, as can be seen from the percentage table below.
Year of Commitment % of Total RAL
2007 0.1%
2008 0.5%
2009 2%
2010 6%
2011 15%
2012 29%
2013 39%
To be contracted 6%
Total 97.6%

PART B - Overview: Budget 2013 by Heading


29
B.1 HEADING 1A: COMPETITIVENESS FOR GROWTH AND EMPLOYMENT (million EUR)
Implementation Table
Initial budget
Carryover from 2012
Amending budgets
BA transfers
COM transfers
Assigned revenue
Total appropria-
tions
Actual 2013 Rate Actual
2012 Carry-over to
2014
CA 16 066 24 20 3 52 3 025 19 190 17 723 92% 16 256 981
PA 11 875 143 863 - 98 9 3 497 16 289 14 307 88% 13 094 1 951
RAL as at 01.01.2013
Payments on RAL
Commitments 2013
Payments on 2013 commitments
Decommitments 2013
RAL as at 31.12.2013
Evolution of the RAL (%)
RAL 26 556 7 859 17 723 6 448 341 29 629 12% The implementation rate of available appropriations, excluding assigned revenue, was 100% for commitments and 99% for payments. Payment appropriations were increased via amending budgets by EUR 863 million. This was essential to ensuring that beneficiaries could be paid, and that late interest payments could be avoided, not least in the field of research. The increase in commitments by transfer was mainly due to a Commission transfer of provisional appropriations from the reserve in favour of European Statistical Programme 2013-2017 after the adoption of the basic act. An overview of individual programmes is given below.
B.1.1 Seventh Research Framework Programme (MFF 1.1.1) (million EUR)
Implementation Table
Initial budget
Carryover from 2012
Amending budgets
BA transfers
COM transfers
Assigned revenue
Total appropria-
tions
Actual 2013 Rate Actual
2012 Carry-over to
2014
CA 10 861 0 11 0 0 2 311 13 182 12 439 94% 11 064 742
PA 7 835 93 572 - 19 1 2 795 11 275 9 590 85% 8 539 1 672
RAL as at 01.01.2013
Payments on RAL
Commitments 2013
Payments on 2013 commitments
Decommitments 2013
RAL as at 31.12.2013
Evolution of the RAL (%)
RAL 16 326 5 158 12 439 4 432 181 18 994 16%
The actual implementation of budgetary appropriations was 100% for commitment appropriations and 99% for payment appropriations.
Adjustments were first made through Amending Budget 1/2013 to increase both commitment (EUR 37 million) and payment appropriations (EUR 11 million) in the light of the accession of Croatia on 1 July. However, the most significant increases were made to payment appropriations via Amending Budgets 2/2013 (EUR 441 million) and 8/2013 (EUR 235 million), which was vital to cover the outstanding commitments.
30
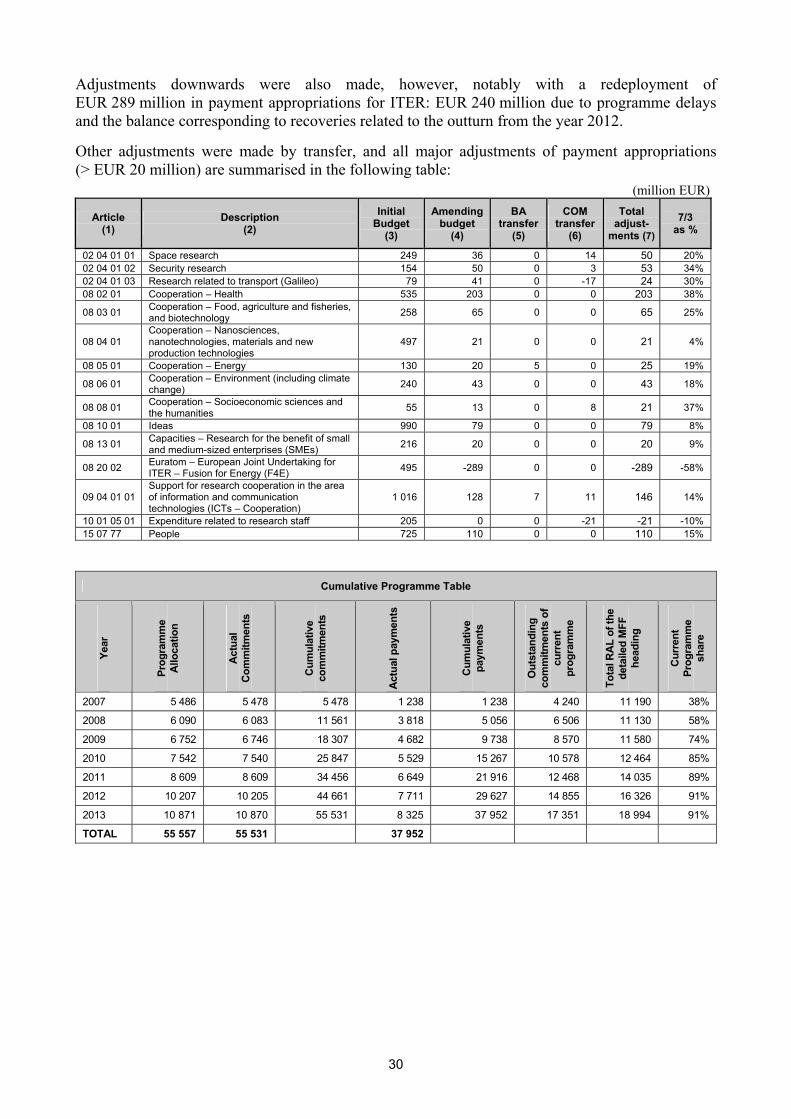
Adjustments downwards were also made, however, notably with a redeployment of EUR 289 million in payment appropriations for ITER: EUR 240 million due to programme delays and the balance corresponding to recoveries related to the outturn from the year 2012.
Other adjustments were made by transfer, and all major adjustments of payment appropriations (> EUR 20 million) are summarised in the following table: (million EUR)
Article (1)
Description (2)
Initial Budget
(3)
Amending budget
(4)
BA transfer
(5)
COM transfer
(6)
Total adjust-
ments (7)
7/3 as %
02 04 01 01 Space research 249 36 0 14 50 20% 02 04 01 02 Security research 154 50 0 3 53 34% 02 04 01 03 Research related to transport (Galileo) 79 41 0 -17 24 30% 08 02 01 Cooperation – Health 535 203 0 0 203 38%
08 03 01 Cooperation – Food, agriculture and fisheries, and biotechnology 258 65 0 0 65 25%
08 04 01 Cooperation – Nanosciences, nanotechnologies, materials and new production technologies
497 21 0 0 21 4%
08 05 01 Cooperation – Energy 130 20 5 0 25 19%
08 06 01 Cooperation – Environment (including climate change) 240 43 0 0 43 18%
08 08 01 Cooperation – Socioeconomic sciences and the humanities 55 13 0 8 21 37%
08 10 01 Ideas 990 79 0 0 79 8%
08 13 01 Capacities – Research for the benefit of small and medium-sized enterprises (SMEs) 216 20 0 0 20 9%
08 20 02 Euratom – European Joint Undertaking for ITER – Fusion for Energy (F4E) 495 -289 0 0 -289 -58%
09 04 01 01 Support for research cooperation in the area of information and communication technologies (ICTs – Cooperation)
1 016 128 7 11 146 14%
10 01 05 01 Expenditure related to research staff 205 0 0 -21 -21 -10% 15 07 77 People 725 110 0 0 110 15%
Cumulative Programme Table
Year
Prog
ram
me
Allo
catio
n
Act
ual
Com
mitm
ents
Cum
ulat
ive
com
mitm
ents
Act
ual p
aym
ents
Cum
ulat
ive
paym
ents
Out
stan
ding
co
mm
itmen
ts o
f cu
rren
t pr
ogra
mm
e
Tota
l RA
L of
the
deta
iled
MFF
he
adin
g
Cur
rent
Pr
ogra
mm
e sh
are
2007 5 486 5 478 5 478 1 238 1 238 4 240 11 190 38%
2008 6 090 6 083 11 561 3 818 5 056 6 506 11 130 58%
2009 6 752 6 746 18 307 4 682 9 738 8 570 11 580 74%
2010 7 542 7 540 25 847 5 529 15 267 10 578 12 464 85%
2011 8 609 8 609 34 456 6 649 21 916 12 468 14 035 89%
2012 10 207 10 205 44 661 7 711 29 627 14 855 16 326 91%
2013 10 871 10 870 55 531 8 325 37 952 17 351 18 994 91%
TOTAL 55 557 55 531 37 952

31
B.1.2 Decommissioning (MFF 1.1.2) (million EUR)
Implementation Table
Initial budget
Carryover from 2012
Amending budgets
BA transfers
COM transfers
Assigned revenue
Total appropria-
tions
Actual 2013 Rate Actual
2012 Carry-over to 2014
CA 31 0 0 0 0 0 31 31 100% 29 0
PA 25 0 4 0 - 1 0 29 29 100% 28 0
RAL as at 01.01.2013
Payments on RAL
Commitments 2013
Payments on 2013 commitments Decommitments 2013 RAL as at
31.12.2013 Evolution of the RAL
(%)
RAL 57 21 31 8 1 59 3%
B.1.3 Trans-European Networks (MFF 1.1.3) (million EUR)
Implementation Table
Initial budget
Carryover from 2012
Amending budgets
BA transfers
COM transfers
Assigned revenue
Total appropria
-tions
Actual 2013 Rate Actual
2012 Carry-over to
2014
CA 1 446 0 0 0 0 53 1 499 1 491 99% 1 402 6
PA 748 2 0 0 16 52 818 810 99% 842 6
RAL as at 01.01.2013
Payments on RAL
Commitments 2013
Payments on 2013 commitments
Decommitments 2013
RAL as at 31.12.2013
Evolution of the RAL (%)
RAL 2 889 778 1 491 31 48 3 523 22%
B.1.3.1 Trans-European Transport Network
(million EUR)
Cumulative Programme Table
Year
Prog
ram
me
Allo
catio
n
Act
ual
Com
mitm
ents
Cum
ulat
ive
com
mitm
ents
Act
ual p
aym
ents
Cum
ulat
ive
paym
ents
Out
stan
ding
co
mm
itmen
ts o
f cu
rren
t pr
ogra
mm
e
Tota
l RA
L of
the
deta
iled
MFF
he
adin
g
Cur
rent
Pr
ogra
mm
e sh
are
2007 931 931 931 4 4 927 1 782 52%
2008 969 969 1 900 670 674 1 226 1 870 66%
2009 935 935 2 835 582 1 256 1 579 1 916 82%
2010 1 062 1 061 3 896 771 2 027 1 861 2 089 89%
2011 1 241 1 241 5 137 775 2 802 2 271 2 424 94%
2012 1 338 1 338 6 475 772 3 574 2 765 2 889 96%
2013 1 424 1 422 7 897 733 4 307 3 412 3 523 97%
TOTAL 7 900 7 897 4 307

32
B.1.4 EGNOS and Galileo (MFF 1.1.4)
(million EUR)
Implementation Table
Initial budget
Carryover from 2012
Amending budgets
BA transfers
COM transfers
Assigned revenue
Total appropria-
tions
Actual 2013 Rate Actual
2012 Carry-over to
2014
CA 1 0 0 0 0 9 10 10 100% 184 0
PA 357 2 20 0 0 18 397 396 100% 406 0
RAL as at 01.01.2013
Payments on RAL
Commitments 2013
Payments on 2013 commitments
Decommitments 2013
RAL as at 31.12.2013
Evolution of the RAL (%)
RAL 767 395 10 2 1 380 -50%
(million EUR)
Cumulative Programme Table
Year
Prog
ram
me
Allo
catio
n
Act
ual
Com
mitm
ents
Cum
ulat
ive
com
mitm
ents
Act
ual p
aym
ents
Cum
ulat
ive
paym
ents
Out
stan
ding
co
mm
itmen
ts o
f cu
rren
t pr
ogra
mm
e
Tota
l RA
L of
the
deta
iled
MFF
he
adin
g
Cur
rent
Pr
ogra
mm
e sh
are
2008 910 909 909 150 150 759 759 100%
2009 830 831 1 740 721 871 869 885 98%
2010 894 894 2 634 442 1 313 1 321 1 355 97%
2011 196 196 2 830 548 1 861 969 990 98%
2012 171 167 2 997 386 2 247 750 767 98%
2013 1 1 2 998 373 2 620 378 380 99%
TOTAL 3 002 2 998 2 620
B.1.5 Marco Polo (MFF 1.15) (million EUR)
Implementation Table
Initial budget
Carryover from 2012
Amending budgets
BA transfers
COM transfers
Assigned revenue
Total appropria-
tions
Actual 2013 Rate Actual
2012 Carry-over to
2014
CA 62 0 0 0 0 15 77 71 93% 66 5
PA 26 0 0 0 - 10 9 26 22 84% 22 4
RAL as at 01.01.2013
Payments on RAL
Commitments 2013
Payments on 2013 commitments
Decommitments 2013
RAL as at 31.12.2013
Evolution of the RAL (%)
RAL 193 20 71 2 1 241 25%

33
(million EUR)
Cumulative Programme Table Ye
ar
Prog
ram
me
Allo
catio
n
Act
ual
Com
mitm
ents
Cum
ulat
ive
com
mitm
ents
Act
ual p
aym
ents
Cum
ulat
ive
paym
ents
Out
stan
ding
co
mm
itmen
ts o
f cu
rren
t pr
ogra
mm
e
Tota
l RA
L of
the
deta
iled
MFF
he
adin
g
Cur
rent
Pr
ogra
mm
e sh
are
2007 56 56 56 1 1 56 117 48%
2008 39 39 95 12 13 84 138 61%
2009 65 65 160 21 34 116 142 82%
2010 64 64 224 27 61 148 157 94%
2011 60 60 284 19 80 147 149 99%
2012 65 58 342 19 99 192 193 100%
2013 62 62 404 17 116 241 241 100%
TOTAL 411 404 116
B.1.6 Lifelong Learning (MFF 1.1.6) (million EUR)
Implementation Table
Initial budget
Carryover from 2012
Amending budgets
BA transfers
COM transfers
Assigned revenue
Total appropria
-tions
Actual 2013 Rate Actual
2012 Carry-over to
2014
CA 1 273 0 10 0 0 346 1 628 1 545 95% 1 494 83
PA 1 132 6 139 0 5 318 1 600 1 524 95% 1 448 75
RAL as at 01.01.2013
Payments on RAL
Commitments 2013
Payments on 2013 commitments
Decommitments 2013
RAL as at 31.12.2013
Evolution of the RAL (%)
RAL 408 228 1 545 1 297 22 406 0%
Payment appropriations were reinforced to allow for past commitments to be honoured, and all voted appropriations of the year were fully implemented.
(million EUR)
Cumulative Programme Table
Year
Prog
ram
me
Allo
catio
n
Act
ual
Com
mitm
ents
Cum
ulat
ive
com
mitm
ents
Act
ual p
aym
ents
Cum
ulat
ive
paym
ents
Out
stan
ding
co
mm
itmen
ts o
f cu
rren
t pr
ogra
mm
e
Tota
l RA
L of
the
deta
iled
MFF
he
adin
g
Cur
rent
Pr
ogra
mm
e sh
are
2007 848 848 848 696 696 152 392 39%
2008 899 899 1 747 836 1 532 215 387 56%
2009 984 984 2 731 918 2 450 281 403 70%
2010 1 009 1 009 3 740 981 3 431 309 410 75%
2011 1 055 1 055 4 795 1 032 4 463 332 381 87%
2012 1 135 1 135 5 930 1 123 5 586 344 408 84%
2013 1 168 1 168 7 098 1 172 6 758 322 406 79%
TOTAL 7 098 7 098 6 758

34
B.1.7 Competitiveness and Innovation Framework Programme (CIP) (MFF 1.1.7) (million EUR)
Implementation Table
Initial budget
Carryover from 2012
Amending budgets
BA transfers
COM transfers
Assigned revenue
Total appropria
-tions
Actual 2013 Rate Actual
2012 Carry-over to
2014
CA 673 0 0 9 - 3 68 748 738 99% 646 10
PA 435 5 86 4 10 75 615 577 94% 417 36
RAL as at 01.01.2013
Payments on RAL
Commitments 2013
Payments on 2013 commitments
Decommitments 2013
RAL as at 31.12.2013
Evolution of the RAL (%)
RAL 1 516 467 738 110 20 1 657 9%
The implementation of budgetary appropriations was 100% in commitments and 99% in payments, including reinforcements made by amending budgets and transfers during the year. The under-implementation relates only to assigned revenue.
(million EUR)
Cumulative Programme Table
Year
Prog
ram
me
Allo
catio
n
Act
ual
Com
mitm
ents
Cum
ulat
ive
com
mitm
ents
Act
ual p
aym
ents
Cum
ulat
ive
paym
ents
Out
stan
ding
co
mm
itmen
ts o
f cu
rren
t pr
ogra
mm
e
Tota
l RA
L of
the
deta
iled
MFF
he
adin
g
Cur
rent
Pr
ogra
mm
e sh
are
2007 388 385 385 93 93 292 705 41%
2008 412 411 796 252 345 451 751 60%
2009 509 507 1 303 187 532 771 949 81%
2010 526 525 1 828 215 747 1 081 1 240 87%
2011 584 583 2 411 451 1 198 1 213 1 313 92%
2012 614 614 3 025 382 1 580 1 430 1 517 94%
2013 680 680 3 705 520 2 100 1 575 1 657 95%
TOTAL 3 713 3 705 2 100
B.1.8 Social policy agenda (MFF 1.1.8) (million EUR)
Implementation Table
Initial budget
Carryover from 2012
Amending budgets
BA transfers
COM transfers
Assigned revenue
Total appropria-
tions
Actual 2013 Rate Actual
2012 Carry-over to
2014
CA 199 0 0 0 0 10 209 194 93% 197 4
PA 156 4 0 - 18 - 2 9 149 135 90% 174 8
RAL as at 01.01.2013
Payments on RAL
Commitments 2013
Payments on 2013 commitments
Decommitments 2013
RAL as at 31.12.2013
Evolution of the RAL (%)
RAL 224 99 194 36 21 263 17%

35
The lower than expected implementation of payment appropriations was mainly a temporary effect of the modification of financial rules resulting in some delays for a number of calls for proposals. As a consequence, a significant amount of pre-financing payments were postponed. The decreases were spread across 10 budget lines. B.1.8.1 Progress Programme
(million EUR)
Cumulative Programme Table
Year
Prog
ram
me
Allo
catio
n
Act
ual
Com
mitm
ents
Cum
ulat
ive
com
mitm
ents
Act
ual p
aym
ents
Cum
ulat
ive
paym
ents
Out
stan
ding
co
mm
itmen
ts o
f cu
rren
t pr
ogra
mm
e
Tota
l RA
L of
the
deta
iled
MFF
he
adin
g
Cur
rent
Pr
ogra
mm
e sh
are
2007 82 94 94 37 37 57 160 36%
2008 96 85 179 52 89 90 171 53%
2009 103 101 280 73 162 115 184 63%
2010 109 106 386 77 239 134 205 65%
2011 94 90 476 79 318 134 225 59%
2012 97 94 570 74 392 138 224 62%
2013 98 98 668 67 459 155 263 59%
TOTAL 679 668 459
B.1.9 Customs and Fiscalis (MFF 1.1.9) (million EUR)
Implementation Table
Initial budget
Carryover from 2012
Amending budgets
BA transfers
COM transfers
Assigned revenue
Total appropria-
tions
Actual 2013 Rate Actual
2012 Carry-over to
2014
CA 84 0 0 0 0 2 87 85 99% 83 1
PA 52 1 15 0 0 2 70 68 97% 68 2
RAL as at 01.01.2013
Payments on RAL
Commitments 2013
Payments on 2013 commitments
Decommitments 2013
RAL as at 31.12.2013
Evolution of the RAL (%)
RAL 83 51 85 18 5 95 14%
The amount implemented remained stable compared to 2012. However, in order to achieve this, the initial budget, set below the level of the implementation of 2012 payments had to be reinforced.

36
(million EUR)
Cumulative Programme Table Ye
ar
Prog
ram
me
Allo
catio
n
Act
ual
Com
mitm
ents
Cum
ulat
ive
com
mitm
ents
Act
ual p
aym
ents
Cum
ulat
ive
paym
ents
Out
stan
ding
co
mm
itmen
ts o
f cu
rren
t pr
ogra
mm
e
Tota
l RA
L of
the
deta
iled
MFF
he
adin
g
Cur
rent
Pr
ogra
mm
e sh
are
2008 64 60 60 16 16 44 80 55% 2009 72 66 126 45 61 64 73 88% 2010 75 71 197 64 125 65 65 100% 2011 82 78 275 61 186 81 81 100% 2012 82 82 357 68 254 83 83 100% 2013 84 84 441 67 321 95 95 100% TOTAL 459 441 321
B.1.10 Nuclear Decommissioning (MFF 1.1.10) (million EUR)
Implementation Table
Initial budget
Carryover from 2012
Amending budgets
BA transfers
COM transfers
Assigned revenue
Total appropria-
tions
Actual 2013 Rate Actual
2012 Carry-over to
2014
CA 267 0 0 0 0 0 267 267 100% 260 0
PA 182 0 0 0 - 1 0 180 180 100% 179 0
RAL as at 01.01.2013
Payments on RAL
Commitments 2013
Payments on 2013 commitments
Decommitments 2013
RAL as at 31.12.2013
Evolution of the RAL (%)
RAL 846 170 267 11 0 933 10%
(million EUR)
Cumulative Programme Table
Year
Prog
ram
me
Allo
catio
n
Act
ual
Com
mitm
ents
Cum
ulat
ive
com
mitm
ents
Act
ual p
aym
ents
Cum
ulat
ive
paym
ents
Out
stan
ding
co
mm
itmen
ts o
f cu
rren
t pr
ogra
mm
e
Tota
l RA
L of
the
deta
iled
MFF
he
adin
g
Cur
rent
Pr
ogra
mm
e sh
are
2007 244 244 244 38 38 206 378 54%
2008 248 248 492 198 236 257 428 60%
2009 255 255 747 110 346 402 573 70%
2010 255 255 1 002 219 565 438 609 72%
2011 258 258 1 260 102 667 594 765 78%
2012 260 260 1 520 179 846 673 846 80%
2013 267 267 1 787 180 1 026 760 933 81%
TOTAL 1 787 1 787 1 026

37
B.1.11 European Globalisation Adjustment Fund (EGF) (MFF 1.1.11) (million EUR)
Implementation Table
Initial budget
Carryover from 2012
Amending budgets
BA transfers
COM transfers
Assigned revenue
Total appropria
-tions
Actual 2013 Rate Actual
2012 Carry-over to
2014
CA 500 24 0 0 0 38 563 42 7% 84 57
PA 50 25 - 5 - 9 0 38 100 42 42% 83 57
RAL as at 01.01.2013
Payments on RAL
Commitments 2013
Payments on 2013 commitments
Decommitments 2013
RAL as at 31.12.2013
Evolution of the RAL (%)
RAL 1 0 42 42 0 1 10%
The assessment of some of the applications in the pipeline took more time than initially expected, as further information and clarification from applicant Member States was required. This left a backlog of cases that can be proposed for approval only in 2014. Furthermore, recoveries made during the course of the year, allowed for the redeployment of payments to other programmes in urgent need of reinforcement.
B.1.12 Energy Projects to Aid Economic Recovery (MFF 1.1.12) (million EUR)
Implementation Table
Initial budget
Carryover from 2012
Amending budgets
BA transfers
COM transfers
Assigned revenue
Total appropria-
tions
Actual 2013 Rate Actual
2012 Carry-over to
2014
CA 0 0 0 0 0 8 8 0 0% 0 8
PA 286 0 0 - 54 - 29 8 210 202 96% 184 8
RAL as at 01.01.2013
Payments on RAL
Commitments 2013
Payments on 2013 commitments
Decommitments 2013
RAL as at 31.12.2013
Evolution of the RAL (%)
RAL 2 606 202 0 0 2 2 402 -8%
Decreases concerned following budget lines due to difficulties in implementation of different main projects:
• 32 04 14 02 Energy projects to aid economic recovery - Carbon Capture and Storage (CCS) for EUR 66 million and
• 32 04 14 03 Energy projects to aid economic recovery - European offshore wind grid system for EUR 27 million.

38
(million EUR)
Cumulative Programme Table Ye
ar
Prog
ram
me
Allo
catio
n
Act
ual
Com
mitm
ents
Cum
ulat
ive
com
mitm
ents
Act
ual p
aym
ents
Cum
ulat
ive
paym
ents
Out
stan
ding
co
mm
itmen
ts o
f cu
rren
t pr
ogra
mm
e
Tota
l RA
L of
the
deta
iled
MFF
he
adin
g
Cur
rent
Pr
ogra
mm
e sh
are
2009 2 000 2 000 2 000 2 000 2 000 100%
2010 1 980 1 833 3 833 701 701 3 132 3 132 100%
2011 146 3 979 488 1 189 2 790 2 790 100%
2012 3 979 184 1 373 2 606 2 606 100%
2013 3 979 202 1 575 2 402 2 402 100%
TOTAL 3 980 3 979 1 575
B.1.13 Others (million EUR)
Implementation Table
Initial budget
Carryover from 2012
Amending budgets
BA transfers
COM transfers
Assigned revenue
Total appropria
-tions
Actual 2013 Rate Actual
2012 Carry-over to
2014
CA 668 0 0 - 6 55 165 883 809 91% 748 65
PA 592 6 32 - 2 18 172 819 732 89% 703 82
RAL as at 01.01.2013
Payments on RAL
Commitments 2013
Payments on 2013 commitments
Decommitments 2013
RAL as at 31.12.2013
Evolution of the RAL (%)
RAL 641 270 809 462 40 677 6%
This category covers, inter alia, agencies and pilot projects and preparatory actions, as well as lines which do not fall within the main programmes.

39
B.2 HEADING 1B: COHESION FOR GROWTH AND EMPLOYMENT (million EUR)
Implementation Table
Initial budget
Carryover from 2012
Amending budgets
BA transfers
COM transfers
Assigned revenue
Total appropria-
tions
Actual 2013 Rate Actual
2012 Carry-over to 2014
CA 54 509 3 599 0 0 752 55 863 54 959 98% 52 744 896
PA 47 199 14 9 151 135 - 11 752 57 238 56 931 99% 48 490 302
RAL as at 01.01.2013
Payments on RAL
Commitments 2013
Payments on 2013 commitments Decommitments 2013 RAL as at
31.12.2013 Evolution of the RAL
(%)
RAL 139 715 55 964 54 959 968 681 137 063 -2%
In 2013, the implementation of payment appropriations, including assigned revenue, for heading 1b was EUR 8.7 billion higher than in 2012. This was made possible by essential reinforcements of some EUR 9.3 billion during the year, almost exclusively via amending budgets, as the possibilities for redeployment by transfer were very limited. The positive consequence of these increases was that for the first time, the RAL of Cohesion declined, as final payment appropriations exceeded commitment appropriations. The latest revision of the Financial Regulation introduced the registration of financial corrections at the closure of programmes as recoveries belonging to assigned revenue. Hence assigned revenue appropriations totalled EUR 752 million in 2013, compared to EUR 4 million in 2012, and to zero in 2011. As the programmes are pre-defined in line with the MFF ceilings, the availability of this assigned revenue is not used in most cases in commitment appropriations but their availability helped to address the shortfall in payment appropriations. Other adjustments during the year concerned the budgeting of the amounts related to the accession of Croatia in Amending Budget 1/2013: EUR 449 million in commitments and EUR 150 million in payments. A further EUR 150 million in commitment appropriations was agreed in Amending Budget 7/2013, to increase the allocation under the European Social Fund (ESF) for France, Italy and Spain. In both cases, it has been necessary to carryover amounts to 2014, as follows:
• For Croatia, all commitments were made in 2013. However, pending the adoption of the necessary Management and Control Systems (MCS), EUR 146.4 million in payment appropriations have been carried over into 2014.
• With respect to the ESF, the amended regulation9 increasing allocations for France, Italy and Spain, was only finalised in December, and the amounts are carried over for use before 30 June.
In spite of the significant increases to the voted appropriations, there was still a growth in the backlog of unpaid claims at the end of 2013 rose to EUR 23.4 billion compared to EUR 16.3 billion at the end of 2012.
9 Regulation (EU) No 1298/2013 of the European Parliament and of the Council of 11 December 2013 amending Council
Regulation (EC) No 1083/2006 as regards the financial allocation for certain Member States from the European Social Fund OJ L 347, 20.12.2013, p. 256–258.
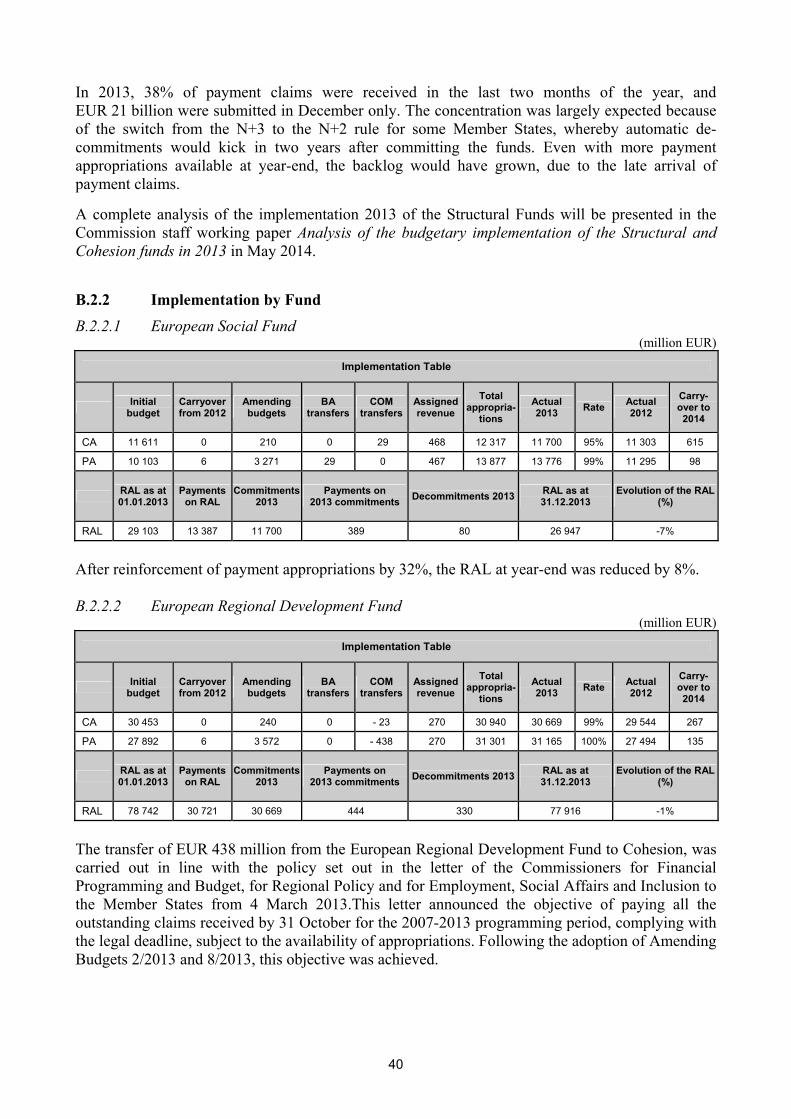
40
In 2013, 38% of payment claims were received in the last two months of the year, and EUR 21 billion were submitted in December only. The concentration was largely expected because of the switch from the N+3 to the N+2 rule for some Member States, whereby automatic de-commitments would kick in two years after committing the funds. Even with more payment appropriations available at year-end, the backlog would have grown, due to the late arrival of payment claims.
A complete analysis of the implementation 2013 of the Structural Funds will be presented in the Commission staff working paper Analysis of the budgetary implementation of the Structural and Cohesion funds in 2013 in May 2014.
B.2.2 Implementation by Fund
B.2.2.1 European Social Fund (million EUR)
Implementation Table
Initial budget
Carryover from 2012
Amending budgets
BA transfers
COM transfers
Assigned revenue
Total appropria-
tions
Actual 2013 Rate Actual
2012 Carry-over to 2014
CA 11 611 0 210 0 29 468 12 317 11 700 95% 11 303 615
PA 10 103 6 3 271 29 0 467 13 877 13 776 99% 11 295 98
RAL as at 01.01.2013
Payments on RAL
Commitments 2013
Payments on 2013 commitments Decommitments 2013 RAL as at
31.12.2013 Evolution of the RAL
(%)
RAL 29 103 13 387 11 700 389 80 26 947 -7%
After reinforcement of payment appropriations by 32%, the RAL at year-end was reduced by 8%. B.2.2.2 European Regional Development Fund
(million EUR) Implementation Table
Initial budget
Carryover from 2012
Amending budgets
BA transfers
COM transfers
Assigned revenue
Total appropria-
tions
Actual 2013 Rate Actual
2012 Carry-over to 2014
CA 30 453 0 240 0 - 23 270 30 940 30 669 99% 29 544 267
PA 27 892 6 3 572 0 - 438 270 31 301 31 165 100% 27 494 135
RAL as at 01.01.2013
Payments on RAL
Commitments 2013
Payments on 2013 commitments Decommitments 2013 RAL as at
31.12.2013 Evolution of the RAL
(%)
RAL 78 742 30 721 30 669 444 330 77 916 -1%
The transfer of EUR 438 million from the European Regional Development Fund to Cohesion, was carried out in line with the policy set out in the letter of the Commissioners for Financial Programming and Budget, for Regional Policy and for Employment, Social Affairs and Inclusion to the Member States from 4 March 2013.This letter announced the objective of paying all the outstanding claims received by 31 October for the 2007-2013 programming period, complying with the legal deadline, subject to the availability of appropriations. Following the adoption of Amending Budgets 2/2013 and 8/2013, this objective was achieved.

41
B.2.3 Cumulative Implementation of Programmes
B.2.3.1 Convergence (MFF 1.2.11) (million EUR)
Cumulative Programme Table10
Year
Prog
ram
me
Allo
catio
n
Act
ual
Com
mitm
ents
Cum
ulat
ive
com
mitm
ents
Act
ual p
aym
ents
Cum
ulat
ive
paym
ents
Out
stan
ding
co
mm
itmen
ts o
f cu
rren
t pr
ogra
mm
e
Tota
l RA
L of
the
deta
iled
MFF
he
adin
g
Cur
rent
Pr
ogra
mm
e sh
are
2007 27 753 27 740 27 740 3 999 3 999 23 741 51 633 46% 2008 29 208 29 221 56 961 6 646 10 645 46 317 59 337 78% 2009 29 723 29 723 86 684 16 110 26 755 59 931 69 091 87% 2010 30 256 30 256 116 940 20 334 47 089 69 853 77 340 90% 2011 31 456 31 456 148 396 25 668 72 757 75 634 81 269 93% 2012 32 303 32 303 180 699 28 671 10 1428 79 264 83 113 95% 2013 33 664 33 648 214 347 32 739 134 167 80 011 81 802 98%
TOTAL 214 363 214 347 134 167
B.2.3.2 Regional Competitiveness (MFF 1.2.12)
(million EUR) Cumulative Programme Table11
Year
Prog
ram
me
Allo
catio
n
Act
ual
Com
mitm
ents
Cum
ulat
ive
com
mitm
ents
Act
ual p
aym
ents
Cum
ulat
ive
paym
ents
Out
stan
ding
co
mm
itmen
ts o
f cu
rren
t pr
ogra
mm
e
Tota
l RA
L of
the
deta
iled
MFF
he
adin
g
Cur
rent
Pr
ogra
mm
e sh
are
2007 9 052 9 051 9 051 1 071 1 071 7 980 18 909 42% 2008 8 592 8 592 17 643 1 740 2 811 14 833 19 977 74% 2009 8 111 8 111 25 754 4 704 7 515 18 239 21 866 83% 2010 7 605 7 605 33 359 6 247 13 762 19 597 21 524 91% 2011 7 087 7 087 40 446 7 240 21 002 19 444 20 791 94% 2012 7 203 7 203 47 649 6 718 27 720 19 922 20 858 96% 2013 7 463 7 329 54 978 8 242 35 962 18 990 19 334 98%
TOTAL 55 113 54 978 35 962
10 Convergence ERDF (budget line 13 03 16) and Convergence ESF (budget line 04 02 17) regional and national programmes
(including performance reserve), including statistical phasing-out. 11 Regional Competitiveness and Employment Objective (including performance reserve): ERDF (budget line 13 03 18) and ESF
(budget line 04 02 19) including phasing-in.

42
B.2.3.3 Territorial Co-operation (MFF 1.2.13) (million EUR)
Cumulative Programme Table
Year
Prog
ram
me
Allo
catio
n
Act
ual
Com
mitm
ents
Cum
ulat
ive
com
mitm
ents
Act
ual p
aym
ents
Cum
ulat
ive
paym
ents
Out
stan
ding
co
mm
itmen
ts o
f cu
rren
t pr
ogra
mm
e
Tota
l RA
L of
the
deta
iled
MFF
he
adin
g
Cur
rent
Pr
ogra
mm
e sh
are
2007 1 034 917 917 134 134 783 2 860 27% 2008 1 214 1 315 2 232 256 390 1 842 2 802 66% 2009 1 199 1 198 3 430 330 720 2 709 3 250 83% 2010 1 243 1 243 4 673 550 1 270 3 402 3 825 89% 2011 1 312 1 327 6 000 1 047 2 317 3 680 4 024 92% 2012 1 354 1 354 7 354 1 176 3 493 3 844 4 006 96% 2013 1 380 1 380 8 734 1 563 5 056 3 621 3 709 98% TOTAL 8 736 8 734 5 056
B.2.4 Cohesion Fund (MFF 1.2.2) (million EUR)
Implementation Table
Initial budget
Carryover from 2012
Amending budgets
BA transfers
COM transfers
Assigned revenue
Total appropria-
tions
Actual 2013 Rate Actual
2012 Carry-over to 2014
CA 12 354 0 150 0 - 1 14 12 517 12 502 100% 11 790 14
PA 9 111 2 2 308 106 438 14 11 980 11 910 99% 9 626 69
RAL as at 01.01.2013
Payments on RAL
Commitments 2013
Payments on 2013 commitments Decommitments 2013 RAL as at
31.12.2013 Evolution of the RAL
(%)
RAL 31 661 11 778 12 502 133 269 31 984 1%
The increase of payments via amending budgets and transfers was 31 % compared to the initial voted budget.
(million EUR) Cumulative Programme Table12
Year
Prog
ram
me
Allo
catio
n
Act
ual
Com
mitm
ents
Cum
ulat
ive
com
mitm
ents
Act
ual p
aym
ents
Cum
ulat
ive
paym
ents
Out
stan
ding
co
mm
itmen
ts o
f cu
rren
t pr
ogra
mm
e
Tota
l RA
L of
the
deta
iled
MFF
he
adin
g
Cur
rent
Pr
ogra
mm
e sh
are
2007 7 126 7 115 7 115 1 583 1 583 5 533 18 119 31% 2008 8 155 8 142 15 257 2 799 4 382 10 875 20 947 52% 2009 9 296 9 287 24 544 4 302 8 684 15 860 23 077 69% 2010 10 192 10 180 34 724 5 635 14 319 20 402 25 234 81% 2011 11 031 11 020 45 744 5 505 19 824 25 916 29 697 87% 2012 11 787 11 786 57 530 8 672 28 496 29 028 31 662 92% 2013 12 498 12 498 70 028 11 215 39 711 30 276 31 984 95%
TOTAL 70 086 70 028 39 711
12 Cohesion Fund: budget line 13 04 02, including Technical Assistance.

43
B.2.5 Others (million EUR)
Implementation Table
Initial budget
Carryover from 2012
Amending budgets
BA transfers
COM transfers
Assigned revenue
Total appropria-
tions
Actual 2013 Rate Actual
2012 Carry-over to 2014
CA 91 3 0 0 -5 0 89 88 99% 107 0
PA 93 0 0 0 -11 1 80 80 100% 75 0
RAL as at 01.01.2013
Payments on RAL
Commitments 2013
Payments on 2013 commitments Decommitments 2013 RAL as at
31.12.2013 Evolution of the RAL
(%)
RAL 209 80 88 2 1 216 3%

44
B.3 HEADING 2: PRESERVATION AND MANAGEMENT OF NATURAL RESOURCES (million EUR)
Implementation Table
Initial budget
Carryover from 2012
Amending budgets
BA transfers
COM transfers
Assigned revenue
Total appropria-
tions
Actual 2013 Rate Actual
2012 Carry-over to 2014
CA 60 034 2 10 58 0 2 393 62 540 61 463 98% 60 817 1 013
PA 57 371 36 620 43 2 2 332 60 404 59 524 99% 59 096 856
RAL as at 01.01.2013
Payments on RAL
Commitments 2013
Payments on 2013 commitments Decommitments 2013 RAL as at
31.12.2013 Evolution of the RAL
(%)
RAL 26 886 13 444 61 463 46 080 396 28 428 6%
B.3.1 Common Agricultural Policy (CAP) (MFF 2.0.1) (million EUR)
Implementation Table
Initial budget
Carryover from 2012
Amending budgets
BA transfers
COM transfers
Assigned revenue
Total appropria-
tions13
Actual 2013 Rate Actual
2012 Carry-over to 2014
CA 43 957 0 0 - 8 0 2 083 46 032 45 302 98% 44 855 712
PA 43 934 20 0 - 11 - 2 2 078 46 019 45 274 98% 44 856 727
RAL as at 01.01.2013
Payments on RAL
Commitments 2013
Payments on 2013 commitments Decommitments 2013 RAL as at
31.12.2013 Evolution of the RAL
(%)
RAL 555 266 45 302 45 008 54 530 -5%
B.3.1.1 Chapter 05 02 Interventions in agricultural markets14
(million EUR) Implementation Table
Initial budget
Carryover from 2012
Amending budgets
BA transfers
COM transfers
Assigned revenue
Total appropria-
tions
Actual 2013 Rate Actual
2012 Carry-over to 2014
CA 2 773 0 0 18 145 532 3 469 3 195 92% 3 516 270
PA 2 773 0 0 17 145 532 3 466 3 193 92% 3 516 270
RAL as at 01.01.2013
Payments on RAL
Commitments 2013
Payments on 2013 commitments Decommitments 2013 RAL as at
31.12.2013 Evolution of the RAL
(%)
RAL 1 1 3 195 3 192 0 3 129%
13 Including unused current reserve of EUR 42.9 million in commitments and EUR 0.8 million in payments. 14 Note AGRI.R.1EM-JGS/ks – ARES (2014) 886499.

45
Article 05 02 04 – Food programmes The slight under-execution of the appropriations foreseen in the 2013 budget for food programmes resulted from the fact that one Member State encountered implementation difficulties towards the end of the budget year. It should be noted that 2013 was the last year of implementing these programmes within the EAGF.
Article 05 02 07 – Textile plants Member States incurred lower payments for the still outstanding balances for the processing aid for flax and hemp fibres for the marketing year 2011/2012 compared to the ones foreseen in the budget.
Article 05 02 08 – Fruits and vegetables The execution level for this article is the net result of the different execution levels of the schemes funded by this article's appropriations. Member States incurred expenditure which was lower than foreseen in the 2013 budget because the payment of balances for the operational funds for the producer organisations’ plans approved in 2012 was smaller than foreseen. Furthermore, the expenditure eventually incurred for the school fruit scheme was lower than the budgetary allocation for the school year 2011/12 foreseen in the 2013 budget. Finally, Member States incurred expenditure for the aids related to the preliminary recognition of producer groups which was significantly higher than the appropriations foreseen for this scheme in the 2013 budget.
Article 05 02 09 – Wine The execution level for this article is due to the slightly lower expenditure incurred by some Member States for both their wine national support programmes compared to their respective budgeted ceiling and for outstanding balances of the grubbing-up scheme which is also funded under this article.
Article 05 02 10 – Promotion Member States did not pay all the amounts foreseen in the budget for promotion activities on the basis of the promotion decisions taken by the Commission.
Article 05 02 11 – Other plants products The under-execution of the budget's appropriations was attributable to POSEI measures for which Member States made lower payments compared to the appropriations foreseen in the 2013 budget for these measures.
Article 05 02 12 – Milk and milk products The under-execution of the 2013 budget’s appropriations was due the smaller expenditure incurred by Member States for the private storage of butter and for the school milk scheme compared to the expenditure foreseen in the budget.
Article 05 02 15 – Pig-meat, eggs, poultry, bee-keeping and other animal products The under-execution is principally due to lower expenditure incurred by Member States for refunds for exported poultry following their final setting at zero in July 2013.

46
B.3.1.2 Chapter 05 03 – Direct aids15 (million EUR)
Implementation Table
Initial budget
Carryover from 2012
Amending budgets
BA transfers
COM transfers
Assigned revenue
Total appropria-
tions
Actual 2013 Rate Actual
2012 Carry-over to 2014
CA 40 932 0 0 - 17 - 350 1 542 42 108 41 658 99% 40 880 440
PA 40 932 0 0 - 17 - 350 1 542 42 108 41 658 99% 40 880 440
RAL as at 01.01.2013
Payments on RAL
Commitments 2013
Payments on 2013 commitments Decommitments 2013 RAL as at
31.12.2013 Evolution of the RAL
(%)
RAL 0 0 41 658 41 658 0 0 0%
Article 05 03 01 01 – Single payment scheme (SPS) The expenditure incurred by the Member States concerned reached 99.1% of the level of the forecasted needs for this scheme in 2013.
Article 05 03 01 02 – Single area payment scheme (SAPS) Improvements in the implementation of this scheme in the Member States concerned led to slightly over-executing the appropriations foreseen in the 2013 budget.
Article 05 03 02 07 – Additional suckler cow premium Member States incurred expenditure for the additional suckler cow premium which was lower than the amount of payments foreseen in the 2013 budget.
Article 05 03 02 21 – Aid for olive groves
Article 05 03 02 26 – Area payment for nuts
Article 05 03 02 36 – Payments for specific types of farming For all the items enumerated above, Member States incurred expenditure for the still outstanding balances of the corresponding coupled direct aids which was lower than the amount foreseen in the 2013 budget.
Article 05 03 02 50 – POSEI – Union support programmes The budget appropriations available for POSEI were over-executed following the adoption of Council Regulation (EC) No 228/2013, which authorised a one-off payment of premium for banana producers in 2013 financial year.
Article 05 03 02 99 – Other Member States did not make any payments for outstanding balances for older coupled direct aids schemes which have been incorporated in the Single Payment Scheme but, on the contrary, they declared recoveries of previously paid expenditure, hence, the negative sign with regard to the execution of this item.
15 Note AGRI.R.1EM-JGS/ks – ARES (2014) 886499.
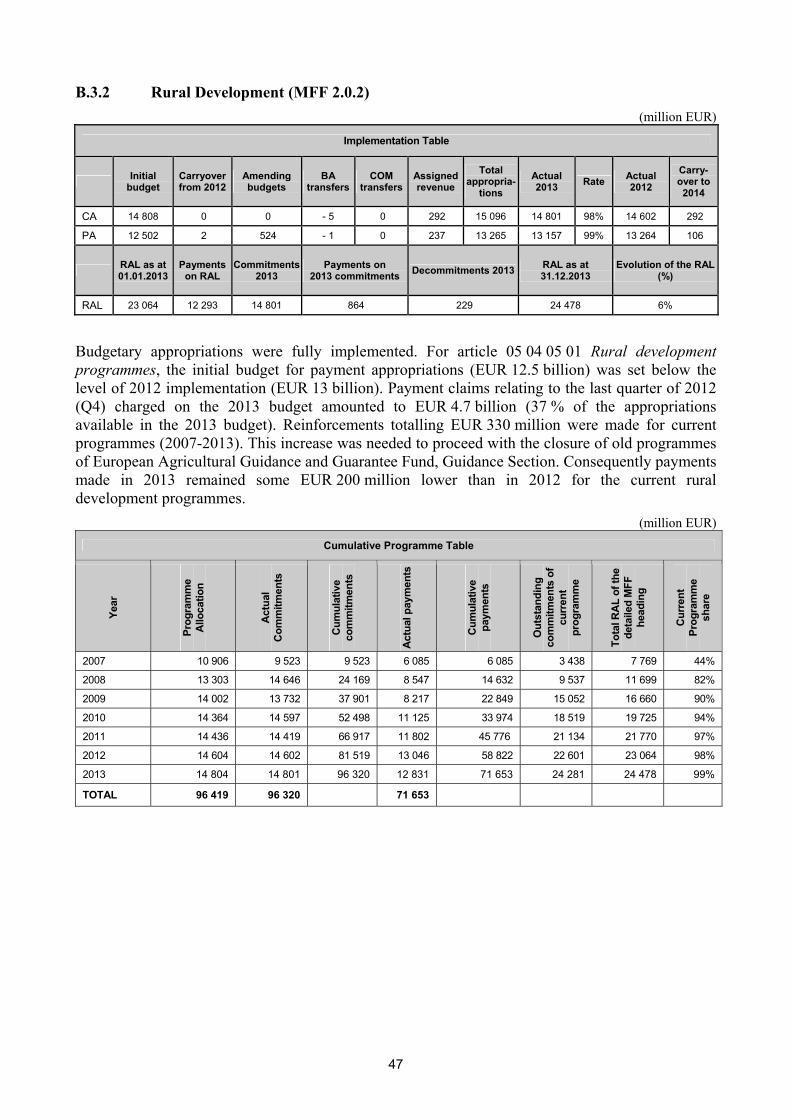
47
B.3.2 Rural Development (MFF 2.0.2) (million EUR)
Implementation Table
Initial budget
Carryover from 2012
Amending budgets
BA transfers
COM transfers
Assigned revenue
Total appropria-
tions
Actual 2013 Rate Actual
2012 Carry-over to 2014
CA 14 808 0 0 - 5 0 292 15 096 14 801 98% 14 602 292
PA 12 502 2 524 - 1 0 237 13 265 13 157 99% 13 264 106
RAL as at 01.01.2013
Payments on RAL
Commitments 2013
Payments on 2013 commitments Decommitments 2013 RAL as at
31.12.2013 Evolution of the RAL
(%)
RAL 23 064 12 293 14 801 864 229 24 478 6%
Budgetary appropriations were fully implemented. For article 05 04 05 01 Rural development programmes, the initial budget for payment appropriations (EUR 12.5 billion) was set below the level of 2012 implementation (EUR 13 billion). Payment claims relating to the last quarter of 2012 (Q4) charged on the 2013 budget amounted to EUR 4.7 billion (37 % of the appropriations available in the 2013 budget). Reinforcements totalling EUR 330 million were made for current programmes (2007-2013). This increase was needed to proceed with the closure of old programmes of European Agricultural Guidance and Guarantee Fund, Guidance Section. Consequently payments made in 2013 remained some EUR 200 million lower than in 2012 for the current rural development programmes.
(million EUR) Cumulative Programme Table
Year
Prog
ram
me
Allo
catio
n
Act
ual
Com
mitm
ents
Cum
ulat
ive
com
mitm
ents
Act
ual p
aym
ents
Cum
ulat
ive
paym
ents
Out
stan
ding
co
mm
itmen
ts o
f cu
rren
t pr
ogra
mm
e
Tota
l RA
L of
the
deta
iled
MFF
he
adin
g
Cur
rent
Pr
ogra
mm
e sh
are
2007 10 906 9 523 9 523 6 085 6 085 3 438 7 769 44%
2008 13 303 14 646 24 169 8 547 14 632 9 537 11 699 82%
2009 14 002 13 732 37 901 8 217 22 849 15 052 16 660 90%
2010 14 364 14 597 52 498 11 125 33 974 18 519 19 725 94%
2011 14 436 14 419 66 917 11 802 45 776 21 134 21 770 97%
2012 14 604 14 602 81 519 13 046 58 822 22 601 23 064 98%
2013 14 804 14 801 96 320 12 831 71 653 24 281 24 478 99%
TOTAL 96 419 96 320 71 653

48
B.3.3 European Fisheries Fund (MFF 2.0.3) (million EUR)
Implementation Table
Initial budget
Carryover from 2012
Amending budgets
BA transfers
COM transfers
Assigned revenue
Total appropria-
tions
Actual 2013 Rate Actual
2012 Carry-over to 2014
CA 687 0 9 0 0 0 696 696 100% 671 0
PA 483 0 83 0 1 0 567 567 100% 481 0
RAL as at 01.01.2013
Payments on RAL
Commitments 2013
Payments on 2013 commitments Decommitments 2013 RAL as at
31.12.2013 Evolution of the RAL
(%)
RAL 1 985 563 696 4 60 2 054 3%
For article 11 06 12 European Fisheries Fund ⎯ Convergence objective, the backlog of unpaid payment claims was equal in volume to the voted 2013 budget. The initial budget of EUR 341 million was reinforced with EUR 90 million leading to a corresponding increase in implementation. In this table, part of the increase does not appear, due to small reductions in other budget lines.
(million EUR) Cumulative Programme Table
Year
Prog
ram
me
Allo
catio
n
Act
ual
Com
mitm
ents
Cum
ulat
ive
com
mitm
ents
Act
ual p
aym
ents
Cum
ulat
ive
paym
ents
Out
stan
ding
co
mm
itmen
ts o
f cu
rren
t pr
ogra
mm
e
Tota
l RA
L of
the
deta
iled
MFF
he
adin
g
Cur
rent
Pr
ogra
mm
e sh
are
2007 432 429 429 229 229 200 1 083 18%
2008 612 609 1 038 251 480 558 1 068 52%
2009 632 631 1 669 177 657 1 013 1 358 74%
2010 644 643 2 312 385 1 042 1 271 1 598 79%
2011 658 657 2 969 445 1 487 1 481 1 806 82%
2012 672 671 3 640 478 1 965 1 663 1 985 84%
2013 696 696 4 336 551 2 516 1 779 2 054 87%
TOTAL 4 346 4 336 2 516

49
B.3.4 Common Fisheries Policy (MFF 2.0.4) (million EUR)
Implementation Table
Initial budget
Carryover from 2012
Amending budgets
BA transfers
COM transfers
Assigned revenue
Total appropria-
tions16
Actual 2013 Rate Actual
2012 Carry-over to 2014
CA 147 0 2 72 0 1 265 221 83% 257 1
PA 122 1 0 63 0 1 189 185 98% 174 2
RAL as at 01.01.2013
Payments on RAL
Commitments 2013
Payments on 2013 commitments Decommitments 2013 RAL as at
31.12.2013 Evolution of the RAL
(%)
RAL 265 54 221 131 40 261 -2%
In total EUR 72 million in commitment appropriations and EUR 69 million in payment appropriations were released from the reserve, via transfer, to article 11 03 01 International fisheries agreements, primarily in favour of Mauritania, but also Ivory Coast, Gabon, Cap Verde and Kiribati.
(million EUR) Cumulative Programme Table
Year
Prog
ram
me
Allo
catio
n
Act
ual
Com
mitm
ents
Cum
ulat
ive
com
mitm
ents
Act
ual p
aym
ents
Cum
ulat
ive
paym
ents
Out
stan
ding
co
mm
itmen
ts o
f cu
rren
t pr
ogra
mm
e
Tota
l RA
L of
the
deta
iled
MFF
he
adin
g
Cur
rent
Pr
ogra
mm
e sh
are
2007 316 216 216 142 142 73 211 35%
2008 318 261 477 208 350 123 219 56%
2009 265 261 738 198 548 166 212 78%
2010 278 254 992 193 741 196 211 93%
2011 263 265 1 257 236 977 202 202 100%
2012 218 219 1 476 172 1 149 227 265 86%17
2013 221 220 1 696 177 1 326 231 261 89%
TOTAL 1 879 1 696 1 326
16 Including unused current reserve of EUR 42.9 million in commitments and EUR 0.8 million in payments. There was full
implementation of commitments excluding the unused reserve. 17 The share is decreased because of a new budget line 11 09 05 Programme to support the further development of the Integrated
Maritime Policy (IMP) not included in the programme allocation.

50
B.3.5 LIFE + (MFF 2.0.5) (million EUR)
Implementation Table
Initial budget
Carryover from 2012
Amending budgets
BA transfers
COM transfers
Assigned revenue
Total appropria-
tions
Actual 2013 Rate Actual
2012 Carry-over to 2014
CA 367 0 0 - 1 - 1 9 374 368 98% 353 7
PA 256 12 13 - 3 4 8 289 269 93% 245 20
RAL as at 01.01.2013
Payments on RAL
Commitments 2013
Payments on 2013 commitments Decommitments 2013 RAL as at
31.12.2013 Evolution of the RAL
(%)
RAL 969 253 368 16 11 1 057 9%
As regards the implementation rate of payments, an amount of EUR 16 million (5.6% of total appropriations) administrative expenditure was carried forward to 2014.
(million EUR) Cumulative Programme Table
Year
Prog
ram
me
Allo
catio
n
Act
ual
Com
mitm
ents
Cum
ulat
ive
com
mitm
ents
Act
ual p
aym
ents
Cum
ulat
ive
paym
ents
Out
stan
ding
co
mm
itmen
ts o
f cu
rren
t pr
ogra
mm
e
Tota
l RA
L of
the
deta
iled
MFF
he
adin
g
Cur
rent
Pr
ogra
mm
e sh
are
2007 240 238 238 12 12 225 537 42%
2008 266 261 499 63 75 422 629 67%
2009 317 313 812 163 238 570 695 82%
2010 307 305 1 117 184 422 676 759 89%
2011 341 341 1 458 184 606 832 870 96%
2012 356 352 1 810 233 839 949 970 98%
2013 365 365 2 175 256 1 095 1 049 1 057 99%
TOTAL 2 192 2 175 1 095
B.3.6 Others (million EUR)
Implementation Table
Initial budget
Carryover from 2012
Amending budgets
BA transfers
COM transfers
Assigned revenue
Total appropria-
tions
Actual 2013 Rate Actual
2012 Carry-over to 2014
CA 68 2 0 - 1 1 8 77 76 98% 79 2
PA 74 1 0 - 5 - 2 8 75 73 96% 77 2
RAL as at 01.01.2013
Payments on RAL
Commitments 2013
Payments on 2013 commitments Decommitments 2013 RAL as at
31.12.2013 Evolution of the RAL
(%)
RAL 48 16 76 57 3 48 0%

51
B.4 HEADING 3A: FREEDOM, SECURITY AND JUSTICE (million EUR)
Implementation Table
Initial budget
Carryover from 2012
Amending budgets
BA transfers
COM transfers
Assigned revenue
Total appropria-
tions18
Actual 2013 Rate Actual
2012 Carry-over to 2014
CA 1 287 0 42 129 0 94 1 552 1 525 98% 1 395 26
PA 810 3 174 69 2 80 1 138 1 122 99% 917 15
RAL as at 01.01.2013
Payments on RAL
Commitments 2013
Payments on 2013 commitments Decommitments 2013 RAL as at
31.12.2013 Evolution of the RAL
(%)
RAL 1 807 384 1 525 738 85 2 125 18%
Not only was the initial voted budget for 2013 fully implemented, but also increases via amending budgets and transfers, in particular for payment appropriations. With respect to transfers, EUR 111 million in commitments and EUR 66 million in payments were released from the reserve, during the course of the year. The increase in commitments arose from Amending Budget 1/2013 (accession of Croatia) and notably concerns the allocation of EUR 40 million to the Schengen Facility, which was matched by the same amount of payment appropriations.
B.4.1 Solidarity and Management of Migration Flows (MFF 3.1.1) (million EUR)
Implementation Table
Initial budget
Carryover from 2012
Amending budgets
BA transfers
COM transfers
Assigned revenue
Total appropria-
tions19
Actual 2013 Rate Actual
2012 Carry-over to 2014
CA 826 0 2 101 1 61 991 980 99% 821 10
PA 402 1 118 19 20 50 610 608 100% 475 2
RAL as at 01.01.2013
Payments on RAL
Commitments 2013
Payments on 2013 commitments Decommitments 2013 RAL as at
31.12.2013 Evolution of the RAL
(%)
RAL 1 268 190 980 418 38 1 603 26%
Reinforcements via transfers concerned EUR 98 million in commitments and EUR 58 million in payments which had been placed in reserve subject to an agreement on Schengen governance. Some EUR 30 million in payment appropriations from budget line 18 02 06 External Borders Fund were transferred to budget lines 18 05 08 Prevention, preparedness and consequence management of terrorism and 08 05 09 Prevention of and fight against crime in order to honour contractual obligations and to avoid interests for late payment. This was intended to be a short-term measure; however, with no viable sources of redeployment, it became impossible to return all these appropriations.
18 Including unused current reserve of EUR 0.7 million in commitments and in payments. 19 Including unused current reserve of EUR 0.7 million in commitments and in payments.

52
All the four Funds (External Borders Fund, European Return Fund, European Fund for the Integration of Third Country Nationals and European Refugee Fund) and European Migration Network were reinforced in payment appropriations via amending budgets.
(million EUR) Cumulative Programme Table
Year
Prog
ram
me
Allo
catio
n
Act
ual
Com
mitm
ents
Cum
ulat
ive
com
mitm
ents
Act
ual p
aym
ents
Cum
ulat
ive
paym
ents
Out
stan
ding
co
mm
itmen
ts o
f cu
rren
t pr
ogra
mm
e
Tota
l RA
L of
the
deta
iled
MFF
he
adin
g
Cur
rent
Pr
ogra
mm
e sh
are
2007 314 303 303 1 1 302 365 83%
2008 386 313 616 159 160 444 488 91%
2009 459 526 1 142 383 543 571 583 98%
2010 510 485 1 627 293 836 736 746 99%
2011 622 646 2 273 401 1 237 971 983 99%
2012 789 788 3 061 423 1 660 1 259 1 268 99%
2013 923 921 3 982 551 2 211 1 595 1 603 100%
TOTAL 4 003 3 982 2 211
B.4.2 Security and Safeguarding Liberties (MFF 3.1.2) (million EUR)
Implementation Table
Initial budget
Carryover from 2012
Amending budgets
BA transfers
COM transfers
Assigned revenue
Total appropria-
tions
Actual 2013 Rate Actual
2012 Carry-over to 2014
CA 53 0 0 13 - 6 5 65 63 98% 143 1
PA 35 0 9 34 - 8 3 73 71 98% 61 1
RAL as at 01.01.2013
Payments on RAL
Commitments 2013
Payments on 2013 commitments Decommitments 2013 RAL as at
31.12.2013 Evolution of the RAL
(%)
RAL 236 70 63 1 13 215 -9%
The most significant transfer of EUR 30 million in payment appropriations is explained in item B.4.1.

53
(million EUR) Cumulative Programme Table
Year
Prog
ram
me
Allo
catio
n
Act
ual
Com
mitm
ents
Cum
ulat
ive
com
mitm
ents
Act
ual p
aym
ents
Cum
ulat
ive
paym
ents
Out
stan
ding
co
mm
itmen
ts o
f cu
rren
t pr
ogra
mm
e
Tota
l RA
L of
the
deta
iled
MFF
he
adin
g
Cur
rent
Pr
ogra
mm
e sh
are
2007 58 58 58 0.3 0.3 57 90 63%
2008 69 67 125 20 20 104 131 79%
2009 91 91 216 40 60 140 147 95%
2010 107 107 323 34 94 195 195 100%
2011 124 122 445 40 134 276 276 100%
2012 143 141 586 57 191 236 236 100%
2013 60 60 646 69 260 215 215 100%
TOTAL 652 646 260
B.4.3 Fundamental Rights and Justice (MFF 3.1.3) (million EUR)
Implementation Table
Initial budget
Carryover from 2012
Amending budgets
BA transfers
COM transfers
Assigned revenue
Total appropria-
tions
Actual 2013 Rate Actual
2012 Carry-over to 2014
CA 82 0 0 0 0 4 86 82 95% 83 3
PA 58 1 0 4 3 3 68 66 96% 63 2
RAL as at 01.01.2013
Payments on RAL
Commitments 2013
Payments on 2013 commitments Decommitments 2013 RAL as at
31.12.2013 Evolution of the RAL
(%)
RAL 123 51 82 14 15 125 1%
(million EUR)
Cumulative Programme Table
Year
Prog
ram
me
Allo
catio
n
Act
ual
Com
mitm
ents
Cum
ulat
ive
com
mitm
ents
Act
ual p
aym
ents
Cum
ulat
ive
paym
ents
Out
stan
ding
co
mm
itmen
ts o
f cu
rren
t pr
ogra
mm
e
Tota
l RA
L of
the
deta
iled
MFF
he
adin
g
Cur
rent
Pr
ogra
mm
e sh
are
2007 72 73 73 1 1 72 82 88%
2008 75 75 148 27 28 103 112 92%
2009 81 81 229 47 75 122 125 98%
2010 78 77 306 52 127 137 138 99%
2011 81 81 387 59 186 127 127 100%
2012 82 82 469 61 247 123 123 100%
2013 82 82 551 64 311 125 125 100%
TOTAL 551 551 311

54
B.4.4 Others (million EUR)
Implementation Table
Initial budget
Carryover from 2012
Amending budgets
BA transfers
COM transfers
Assigned revenue
Total appropria-
tions
Actual 2013 Rate Actual
2012 Carry-over to 2014
CA 327 0 40 15 5 24 411 399 97% 347 11
PA 316 1 46 12 - 13 24 387 377 98% 317 9
RAL as at 01.01.2013
Payments on RAL
Commitments 2013
Payments on 2013 commitments Decommitments 2013 RAL as at
31.12.2013 Evolution of the RAL
(%)
RAL 180 72 399 305 19 182 1%

55
B.5 HEADING 3B: CITIZENSHIP (million EUR)
Implementation Table
Initial budget
Carryover from 2012
Amending budgets
BA transfers
COM transfers
Assigned revenue
Total appropria-
tions
Actual 2013 Rate Actual
2012 Carry-over to 2014
CA 707 0 447 0 0 139 1 293 1 252 97% 1 498 39
PA 638 5 277 - 4 - 2 144 1 058 761 72% 1 457 296
RAL as at 01.01.2013
Payments on RAL
Commitments 2013
Payments on 2013 commitments Decommitments 2013 RAL as at
31.12.2013 Evolution of the RAL
(%)
RAL 509 244 1 252 517 48 952 87%
After the carryover to 2014, full implementation of appropriations was achieved for this heading. The most significant adjustments during the course of the year concerned the mobilisation of the European Union Solidarity Fund (EUSF). This was mobilised in parallel with Amending Budgets 5/2013 and 9/2013 for a total amount of EUR 415 million in commitments and EUR 265 million in payments, as follows:
• Amending Budget 5/2013 concerned the mobilisation of the EUSF for Slovenia, Croatia and Austria, following a flooding disaster in autumn 2012. It led to an increase in commitments and payments in heading 3b of EUR 15 million.
• Amending Budget 9/2013 concerned the mobilisation of the EUSF for Romania (drought and forest fires in summer 2012) and for Germany, Austria and the Czech Republic (flooding in spring 2013). The total amount of the mobilisation was EUR 400.5 million in commitments, but EUR 27 million of this was found through redeployment, so that the net effect on the total budget was EUR 374 million. For payment appropriations, heading 3b was increased by EUR 251 million, but all of this was found through redeployment. The remaining EUR 150 million in payments were budgeted in 2014.
Due to the timing of the adoption of AB 9/2013 on 20 November, it was necessary to carryover the related payment appropriations for implementation in 2014.
B.5.1 Public Health and Consumer Protection (MFF 3.2.1) (million EUR)
Implementation Table
Initial budget
Carryover from 2012
Amending budgets
BA transfers
COM transfers
Assigned revenue
Total appropria-
tions
Actual 2013 Rate Actual
2012 Carry-over to 2014
CA 79 0 0 0 0 3 82 82 100% 82 0
PA 68 2 6 - 1 1 3 78 76 97% 84 2
RAL as at 01.01.2013
Payments on RAL
Commitments 2013
Payments on 2013 commitments Decommitments 2013 RAL as at
31.12.2013 Evolution of the RAL
(%)
RAL 147 56 82 21 17 136 -7%

56
(million EUR)
Cumulative Programme Table Ye
ar
Prog
ram
me
Allo
catio
n
Act
ual
Com
mitm
ents
Cum
ulat
ive
com
mitm
ents
Act
ual p
aym
ents
Cum
ulat
ive
paym
ents
Out
stan
ding
co
mm
itmen
ts o
f cu
rren
t pr
ogra
mm
e
Tota
l RA
L of
the
deta
iled
MFF
he
adin
g
Cur
rent
Pr
ogra
mm
e sh
are
2007 20 20 20 6 6 14 172 8%
2008 71 70 90 21 27 63 181 35%
2009 79 79 169 48 75 94 180 52%
2010 73 73 242 57 132 110 161 72%
2011 75 75 317 56 188 130 164 68%
2012 77 78 395 73 261 131 148 89%
2013 79 79 474 73 334 132 136 97%
TOTAL 475 474 334
B.5.2 Culture 2007 (MFF 3.2.2) (million EUR)
Implementation Table
Initial budget
Carryover from 2012
Amending budgets
BA transfers
COM transfers
Assigned revenue
Total appropria-
tions
Actual 2013 Rate Actual
2012 Carry-over to 2014
CA 60 0 0 0 0 9 68 67 98% 64 2
PA 51 0 2 0 0 10 63 60 96% 57 3
RAL as at 01.01.2013
Payments on RAL
Commitments 2013
Payments on 2013 commitments Decommitments 2013 RAL as at
31.12.2013 Evolution of the RAL
(%)
RAL 70 23 67 37 3 73 5%
(million EUR)
Cumulative Programme Table
Year
Prog
ram
me
Allo
catio
n
Act
ual
Com
mitm
ents
Cum
ulat
ive
com
mitm
ents
Act
ual p
aym
ents
Cum
ulat
ive
paym
ents
Out
stan
ding
co
mm
itmen
ts o
f cu
rren
t pr
ogra
mm
e
Tota
l RA
L of
the
deta
iled
MFF
he
adin
g
Cur
rent
Pr
ogra
mm
e sh
are
2007 48 44 44 20 20 24 48 50%
2008 49 45 89 31 51 38 51 75%
2009 56 52 141 42 93 48 53 91%
2010 58 54 195 42 135 60 60 100%
2011 62 58 253 48 183 66 67 99%
2012 63 59 312 53 236 69 70 99%
2013 60 60 372 53 289 73 73 100%
TOTAL 396 372 289

57
B.5.3 Youth in action (MFF 3.2.3) (million EUR)
Implementation Table
Initial budget
Carryover from 2012
Amending budgets
BA transfers
COM transfers
Assigned revenue
Total appropria-
tions
Actual 2013 Rate Actual
2012 Carry-over to 2014
CA 142 0 2 0 0 103 248 214 87% 188 33
PA 127 1 1 0 - 1 101 229 199 87% 174 29
RAL as at 01.01.2013
Payments on RAL
Commitments 2013
Payments on 2013 commitments Decommitments 2013 RAL as at
31.12.2013 Evolution of the RAL
(%)
RAL 56 27 214 173 14 56 0%
The implementation of the initial budgetary appropriations was 100% in commitments and payments. The under-implementation relates to assigned revenue.
Cumulative Programme Table
Year
Prog
ram
me
Allo
catio
n
Act
ual
Com
mitm
ents
Cum
ulat
ive
com
mitm
ents
Act
ual p
aym
ents
Cum
ulat
ive
paym
ents
Out
stan
ding
co
mm
itmen
ts o
f cu
rren
t pr
ogra
mm
e
Tota
l L o
f the
de
taile
d M
FF
head
ing
Cur
rent
Pr
ogra
mm
e sh
are
2007 120 117 117 91 91 26 87 30%
2008 125 122 239 120 211 28 76 37%
2009 128 125 364 121 332 32 76 42%
2010 128 125 489 122 454 35 63 56%
2011 133 130 619 120 574 45 54 83%
2012 140 140 759 126 700 54 56 96%
2013 144 144 903 127 827 55 56 98%
TOTAL 918 903 827
B.5.4 Media (MFF 3.2.4) (million EUR)
Implementation Table
Initial budget
Carryover from 2012
Amending budgets
BA transfers
COM transfers
Assigned revenue
Total appropria-
tions
Actual 2013 Rate Actual
2012 Carry-over to 2014
CA 113 0 0 0 0 12 125 124 99% 124 1
PA 104 0 2 0 2 18 127 120 95% 114 6
RAL as at 01.01.2013
Payments on RAL
Commitments 2013
Payments on 2013 commitments Decommitments 2013 RAL as at
31.12.2013 Evolution of the RAL
(%)
RAL 95 54 124 66 4 95 0%

58
(million EUR) Cumulative Programme Table
Year
Prog
ram
me
Allo
catio
n
Act
ual
Com
mitm
ents
Cum
ulat
ive
com
mitm
ents
Act
ual p
aym
ents
Cum
ulat
ive
paym
ents
Out
stan
ding
co
mm
itmen
ts o
f cu
rren
t pr
ogra
mm
e
Tota
l RA
L of
the
deta
iled
MFF
he
adin
g
Cur
rent
Pr
ogra
mm
e sh
are
2007 85 85 85 46 46 39 94 41%
2008 103 103 188 80 126 62 89 70%
2009 107 107 295 95 221 74 95 78%
2010 111 102 397 93 314 81 94 86%
2011 114 105 502 99 413 86 91 95%
2012 107 107 609 99 512 89 95 94%
2013 109 109 718 103 615 91 95 96%
TOTAL 736 718 615
B.5.5 Europe for citizens (MFF 3.2.5) (million EUR)
Implementation Table
Initial budget
Carryover from 2012
Amending budgets
BA transfers
COM transfers
Assigned revenue
Total appropria-
tions
Actual 2013 Rate Actual
2012 Carry-over to 2014
CA 27 0 0 0 0 1 27 27 99% 29 0
PA 28 0 0 0 0 1 28 28 98% 29 1
RAL as at 01.01.2013
Payments on RAL
Commitments 2013
Payments on 2013 commitments Decommitments 2013 RAL as at
31.12.2013 Evolution of the RAL
(%)
RAL 27 13 27 15 3 23 -14%
(million EUR)
Cumulative Programme Table
Year
Prog
ram
me
Allo
catio
n
Act
ual
Com
mitm
ents
Cum
ulat
ive
com
mitm
ents
Act
ual p
aym
ents
Cum
ulat
ive
paym
ents
Out
stan
ding
co
mm
itmen
ts o
f cu
rren
t pr
ogra
mm
e
Tota
l RA
L of
the
deta
iled
MFF
he
adin
g
Cur
rent
Pr
ogra
mm
e sh
are
2007 25 22 22 12 12 11 13 85%
2008 30 27 49 18 30 17 22 77%
2009 35 31 80 25 55 22 22 100%
2010 36 32 112 23 78 27 27 100%
2011 36 33 145 27 105 31 31 100%
2012 28 28 173 28 133 27 27 100%
2013 26 26 199 27 160 23 23 100%
TOTAL 216 199 160

59
B.5.6 Civil Protection (MFF 3.2.6) (million EUR)
Implementation Table
Initial budget
Carryover from 2012
Amending budgets
BA transfers
COM transfers
Assigned revenue
Total appropria-
tions
Actual 2013 Rate Actual
2012 Carry-over to 2014
CA 19 0 0 0 0 1 20 19 93% 18 1
PA 15 0 0 0 - 1 1 15 14 95% 17 1
RAL as at 01.01.2013
Payments on RAL
Commitments 2013
Payments on 2013 commitments Decommitments 2013 RAL as at
31.12.2013 Evolution of the RAL
(%)
RAL 28 12 19 2 0 32 14%
The nature of the Civil Protection Instrument is to be a reserve for unpredictable disasters. Nevertheless, the implementation rates were higher than in 2012.
(million EUR) Cumulative Programme Table
Year
Prog
ram
me
Allo
catio
n
Act
ual
Com
mitm
ents
Cum
ulat
ive
com
mitm
ents
Act
ual p
aym
ents
Cum
ulat
ive
paym
ents
Out
stan
ding
co
mm
itmen
ts o
f cu
rren
t pr
ogra
mm
e
Tota
l RA
L of
the
deta
iled
MFF
he
adin
g
Cur
rent
Pr
ogra
mm
e sh
are
2007 15 8 8 2 2 6 15 40%
2008 21 15 23 5 7 16 20 80%
2009 18 14 37 8 15 21 22 95%
2010 18 14 51 9 24 26 26 99%
2011 18 16 67 12 36 28 28 100%
2012 18 18 85 16 52 28 28 100%
2013 18 18 103 14 66 32 32 100%
TOTAL 126 103 66
B.5.7 Communication actions (MFF 3.2.7) (million EUR)
Implementation Table
Initial budget
Carryover from 2012
Amending budgets
BA transfers
COM transfers
Assigned revenue
Total appropria-
tions
Actual 2013 Rate Actual
2012 Carry-over to 2014
CA 95 0 0 0 0 2 97 97 100% 94 0
PA 85 2 0 - 3 - 1 2 85 82 97% 88 2
RAL as at 01.01.2013
Payments on RAL
Commitments 2013
Payments on 2013 commitments Decommitments 2013 RAL as at
31.12.2013 Evolution of the RAL
(%)
RAL 67 50 97 32 4 77 15%

60
B.5.8 EU Solidarity Fund (MFF 3.2.8) (million EUR)
Implementation Table
Initial budget
Carryover from 2012
Amending budgets
BA transfers
COM transfers
Assigned revenue
Total appropria-
tions
Actual 2013 Rate Actual
2012 Carry-over to 2014
CA 0 0 415 0 0 0 415 415 100% 726 0
PA 0 0 265 0 0 0 265 14 5% 726 251
RAL as at 01.01.2013
Payments on RAL
Commitments 2013
Payments on 2013 commitments Decommitments 2013 RAL as at
31.12.2013 Evolution of the RAL
(%)
RAL 0 0 415 14 0 401 0%
See introduction above.
B.5.9 Others (million EUR)
Implementation Table
Initial budget
Carryover from 2012
Amending budgets
BA transfers
COM transfers
Assigned revenue
Total appropria-
tions
Actual 2013 Rate Actual
2012 Carry-over to 2014
CA 173 0 29 0 0 8 210 208 99% 173 1
PA 161 0 1 0 - 1 8 168 166 99% 168 2
RAL as at 01.01.2013
Payments on RAL
Commitments 2013
Payments on 2013 commitments Decommitments 2013 RAL as at
31.12.2013 Evolution of the RAL
(%)
RAL 20 10 208 157 2 59 197%

61
B.6 HEADING 4: EU AS A GLOBAL PLAYER (million EUR)
Implementation Table
Initial budget
Carryover from 2012
Amending budgets
BA transfers
COM transfers
Assigned revenue
Total appropria-
tions
Actual 2013 Rate Actual
2012 Carry-over to 2014
CA 9 583 2 0 - 4 0 433 10 015 9 793 98% 9 753 149
PA 6 323 30 497 - 7 10 346 7 200 7 055 98% 7 064 138
RAL as at 01.01.2013
Payments on RAL
Commitments 2013
Payments on 2013 commitments Decommitments 2013 RAL as at
31.12.2013 Evolution of the RAL
(%)
RAL 21 429 5 002 9 793 2 053 854 23 313 9%
The implementation of budgetary appropriations in 2013 was 100% for commitments, when the un-mobilised part of the Emergency Aid Reserve is excluded, and 99% for payments. This is a similar rate to 2012. Also the volume of commitments and payments made remained at almost the same level. However, the initial budget for payment appropriations was set at a lower level than the implementation of 2012, and reinforcements via amending budgets were needed. Nevertheless the RAL is growing at a high rate in this heading, due to a big gap between budgeted commitments and payments.
B.6.1 Instrument for Pre-Accession (IPA) (MFF 4.0.1) (million EUR)
Implementation Table
Initial budget
Carryover from 2012
Amending budgets
BA transfers
COM transfers
Assigned revenue
Total appropria-
tions
Actual 2013 Rate Actual
2012 Carry-over to 2014
CA 1 864 0 0 0 0 70 1 933 1 893 98% 1 909 39
PA 1 212 7 123 - 45 - 4 51 1 344 1 299 97% 1 256 42
RAL as at 01.01.2013
Payments on RAL
Commitments 2013
Payments on 2013 commitments Decommitments 2013 RAL as at
31.12.2013 Evolution of the RAL
(%)
RAL 5 878 1 177 1 893 122 396 6 076 3%
The main adjustments concerned the following budget lines:
In commitments:
• A decrease of EUR 225 million in 22 02 02 Transition and institution-building assistance to potential candidate countries, of which EUR 156 million transferred to 22 02 01 Transition and institution-building assistance to candidate countries as a result of the granting of candidate country status to Serbia and EUR 69 million to 22 02 07 Regional and Horizontal Programmes;
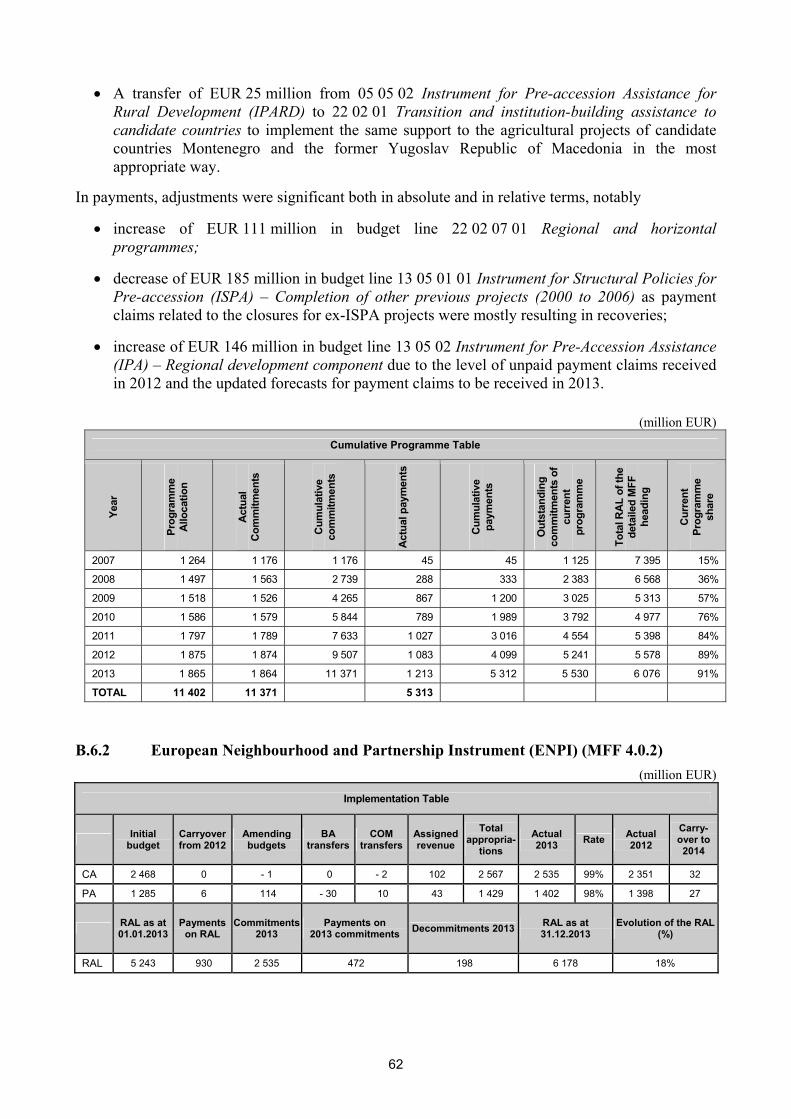
62
• A transfer of EUR 25 million from 05 05 02 Instrument for Pre-accession Assistance for Rural Development (IPARD) to 22 02 01 Transition and institution-building assistance to candidate countries to implement the same support to the agricultural projects of candidate countries Montenegro and the former Yugoslav Republic of Macedonia in the most appropriate way.
In payments, adjustments were significant both in absolute and in relative terms, notably
• increase of EUR 111 million in budget line 22 02 07 01 Regional and horizontal programmes;
• decrease of EUR 185 million in budget line 13 05 01 01 Instrument for Structural Policies for Pre-accession (ISPA) – Completion of other previous projects (2000 to 2006) as payment claims related to the closures for ex-ISPA projects were mostly resulting in recoveries;
• increase of EUR 146 million in budget line 13 05 02 Instrument for Pre-Accession Assistance (IPA) – Regional development component due to the level of unpaid payment claims received in 2012 and the updated forecasts for payment claims to be received in 2013.
(million EUR)
Cumulative Programme Table
Year
Prog
ram
me
Allo
catio
n
Act
ual
Com
mitm
ents
Cum
ulat
ive
com
mitm
ents
Act
ual p
aym
ents
Cum
ulat
ive
paym
ents
Out
stan
ding
co
mm
itmen
ts o
f cu
rren
t pr
ogra
mm
e
Tota
l RA
L of
the
deta
iled
MFF
he
adin
g
Cur
rent
Pr
ogra
mm
e sh
are
2007 1 264 1 176 1 176 45 45 1 125 7 395 15%
2008 1 497 1 563 2 739 288 333 2 383 6 568 36%
2009 1 518 1 526 4 265 867 1 200 3 025 5 313 57%
2010 1 586 1 579 5 844 789 1 989 3 792 4 977 76%
2011 1 797 1 789 7 633 1 027 3 016 4 554 5 398 84%
2012 1 875 1 874 9 507 1 083 4 099 5 241 5 578 89%
2013 1 865 1 864 11 371 1 213 5 312 5 530 6 076 91%
TOTAL 11 402 11 371 5 313
B.6.2 European Neighbourhood and Partnership Instrument (ENPI) (MFF 4.0.2) (million EUR)
Implementation Table
Initial budget
Carryover from 2012
Amending budgets
BA transfers
COM transfers
Assigned revenue
Total appropria-
tions
Actual 2013 Rate Actual
2012 Carry-over to 2014
CA 2 468 0 - 1 0 - 2 102 2 567 2 535 99% 2 351 32
PA 1 285 6 114 - 30 10 43 1 429 1 402 98% 1 398 27
RAL as at 01.01.2013
Payments on RAL
Commitments 2013
Payments on 2013 commitments Decommitments 2013 RAL as at
31.12.2013 Evolution of the RAL
(%)
RAL 5 243 930 2 535 472 198 6 178 18%
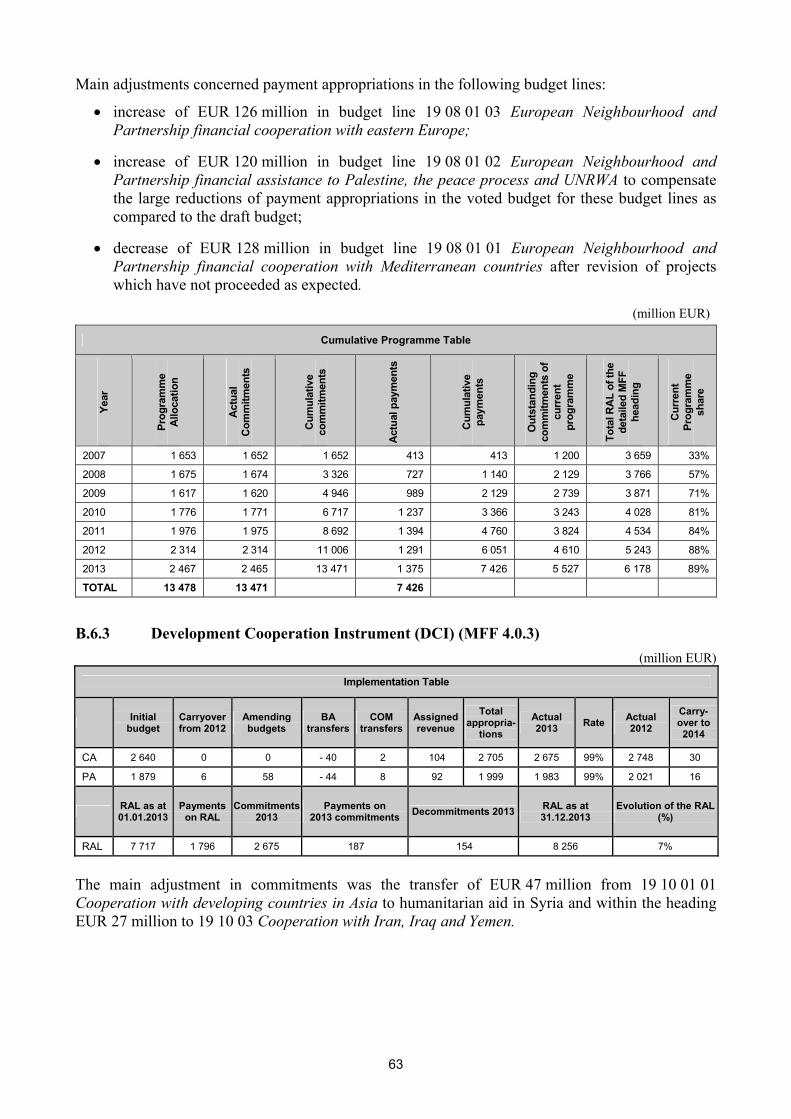
63
Main adjustments concerned payment appropriations in the following budget lines:
• increase of EUR 126 million in budget line 19 08 01 03 European Neighbourhood and Partnership financial cooperation with eastern Europe;
• increase of EUR 120 million in budget line 19 08 01 02 European Neighbourhood and Partnership financial assistance to Palestine, the peace process and UNRWA to compensate the large reductions of payment appropriations in the voted budget for these budget lines as compared to the draft budget;
• decrease of EUR 128 million in budget line 19 08 01 01 European Neighbourhood and Partnership financial cooperation with Mediterranean countries after revision of projects which have not proceeded as expected.
(million EUR)
Cumulative Programme Table
Year
Prog
ram
me
Allo
catio
n
Act
ual
Com
mitm
ents
Cum
ulat
ive
com
mitm
ents
Act
ual p
aym
ents
Cum
ulat
ive
paym
ents
Out
stan
ding
co
mm
itmen
ts o
f cu
rren
t pr
ogra
mm
e
Tota
l RA
L of
the
deta
iled
MFF
he
adin
g
Cur
rent
Pr
ogra
mm
e sh
are
2007 1 653 1 652 1 652 413 413 1 200 3 659 33%
2008 1 675 1 674 3 326 727 1 140 2 129 3 766 57%
2009 1 617 1 620 4 946 989 2 129 2 739 3 871 71%
2010 1 776 1 771 6 717 1 237 3 366 3 243 4 028 81%
2011 1 976 1 975 8 692 1 394 4 760 3 824 4 534 84%
2012 2 314 2 314 11 006 1 291 6 051 4 610 5 243 88%
2013 2 467 2 465 13 471 1 375 7 426 5 527 6 178 89%
TOTAL 13 478 13 471 7 426
B.6.3 Development Cooperation Instrument (DCI) (MFF 4.0.3) (million EUR)
Implementation Table
Initial budget
Carryover from 2012
Amending budgets
BA transfers
COM transfers
Assigned revenue
Total appropria-
tions
Actual 2013 Rate Actual
2012 Carry-over to 2014
CA 2 640 0 0 - 40 2 104 2 705 2 675 99% 2 748 30
PA 1 879 6 58 - 44 8 92 1 999 1 983 99% 2 021 16
RAL as at 01.01.2013
Payments on RAL
Commitments 2013
Payments on 2013 commitments Decommitments 2013 RAL as at
31.12.2013 Evolution of the RAL
(%)
RAL 7 717 1 796 2 675 187 154 8 256 7%
The main adjustment in commitments was the transfer of EUR 47 million from 19 10 01 01 Cooperation with developing countries in Asia to humanitarian aid in Syria and within the heading EUR 27 million to 19 10 03 Cooperation with Iran, Iraq and Yemen.

64
The main adjustments in payments concerned following budget lines:
• decrease of EUR 39 million in budget line 19 10 01 02 Aid for the rehabilitation and reconstruction of Afghanistan;
• increase of EUR 24 million in budget line 19 10 02 Cooperation with developing countries in Central Asia;
• increase of EUR 23 million in budget line 21 03 02 Local authorities in development.
(million EUR)
Cumulative Programme Table
Year
Prog
ram
me
Allo
catio
n
Act
ual
Com
mitm
ents
Cum
ulat
ive
com
mitm
ents
Act
ual p
aym
ents
Cum
ulat
ive
paym
ents
Out
stan
ding
co
mm
itmen
ts o
f cu
rren
t pr
ogra
mm
e
Tota
l RA
L of
the
deta
iled
MFF
he
adin
g
Cur
rent
Pr
ogra
mm
e sh
are
2007 2 179 2 150 2 150 406 406 1 710 6 137 28%
2008 2 250 2 272 4 422 694 1 100 3 273 6 357 51%
2009 2 382 2 383 6 805 1 095 2 195 4 535 6 674 68%
2010 2 441 2 439 9 244 1 390 3 585 5 545 6 960 80%
2011 2 680 2 553 11 797 1 940 5 525 6 158 7 320 84%
2012 2 712 2 712 14 509 1 929 7 454 6 657 7 717 86%
2013 2 640 2 602 17 111 1 871 9 325 7 333 8 256 89%
TOTAL 17 284 17 111 9 325
B.6.4 Instrument for Stability (MFF 4.0.4) (million EUR)
Implementation Table
Initial budget
Carryover from 2012
Amending budgets
BA transfers
COM transfers
Assigned revenue
Total appropria-
tions
Actual 2013 Rate Actual
2012 Carry-over to 2014
CA 325 0 0 - 7 0 6 324 324 100% 294 0
PA 163 2 38 21 - 4 2 223 219 98% 216 3
RAL as at 01.01.2013
Payments on RAL
Commitments 2013
Payments on 2013 commitments Decommitments 2013 RAL as at
31.12.2013 Evolution of the RAL
(%)
RAL 483 154 324 65 10 576 20%
The payment appropriations of budget line 19 06 01 01 Crisis response and preparedness (Instrument for Stability), heavily cut in the budgetary procedure for 2013, were reinforced by EUR 56 million.

65
(million EUR)
Cumulative Programme Table Ye
ar
Prog
ram
me
Allo
catio
n
Act
ual
Com
mitm
ents
Cum
ulat
ive
com
mitm
ents
Act
ual p
aym
ents
Cum
ulat
ive
paym
ents
Out
stan
ding
co
mm
itmen
ts o
f cu
rren
t pr
ogra
mm
e
Tota
l RA
L of
the
deta
iled
MFF
he
adin
g
Cur
rent
Pr
ogra
mm
e sh
are
2007 139 136 136 19 19 113 165 68%
2008 181 176 312 114 133 164 211 78%
2009 186 186 498 137 270 211 249 84%
2010 219 219 717 150 420 261 301 86%
2011 290 290 1 007 174 594 377 413 91%
2012 294 294 1 301 211 805 455 483 94%
2013 318 318 1 619 217 1 022 547 576 95%
TOTAL 1 627 1 619 1 022
B.6.5 Humanitarian Aid (MFF 4.0.5) (million EUR)
Implementation Table
Initial budget
Carryover from 2012
Amending budgets
BA transfers
COM transfers
Assigned revenue
Total appropria-
tions
Actual 2013 Rate Actual
2012 Carry-over to 2014
CA 865 0 0 408 5 26 1 304 1 286 99% 1 243 18
PA 781 5 151 262 1 29 1 229 1 205 98% 1 080 24
RAL as at 01.01.2013
Payments on RAL
Commitments 2013
Payments on 2013 commitments Decommitments 2013 RAL as at
31.12.2013 Evolution of the RAL
(%)
RAL 787 540 1 286 665 0 868 10%
The budget year followed closely the pattern of previous years, with the difference that due to a slightly bigger gap between commitments and payments, payment appropriations had to be increased more and earlier in the year. The pressure on appropriations was also increased by the ongoing crisis in Syria, and reprioritisation from other programmes was necessary during the year. The share of appropriations from the Emergency Aid Reserve in Budget Authority transfers is shown in the table below: (million EUR)
Summary table of Budget Authority transfers:
CA increase From EAR PA increase From EAR Main destination
23 02 01 Humanitarian Aid DEC 05 12 12 4 4 Mali DEC 07 65 65 20 20 Syria DEC 18 248 70 140 37 Syria DEC 19 15 15 8 8 Congo/Central African Republic DEC 26 69 (RAL) DEC 44 30 Philippines/Somalia Total 370 162 241 68 23 02 02 Food Aid DEC 06 38 38 12 12 Sahel/Chad DEC 26 9 (RAL) Total 38 38 21 12 GRAND TOTAL 408 200 262 80

66
EUR 64 million of the Emergency Aid Reserve remained un-mobilised for commitment appropriations.
(million EUR)
Cumulative Programme Table
Year
Prog
ram
me
Allo
catio
n
Act
ual
Com
mitm
ents
Cum
ulat
ive
com
mitm
ents
Act
ual p
aym
ents
Cum
ulat
ive
paym
ents
Out
stan
ding
co
mm
itmen
ts o
f cu
rren
t pr
ogra
mm
e
Tota
l RA
L of
the
deta
iled
MFF
he
adin
g
Cur
rent
Pr
ogra
mm
e sh
are
2007 732 732 732 465 465 266 381 70%
2008 931 931 1 663 801 1 266 383 421 91%
2009 887 886 2 549 773 2 039 474 511 93%
2010 1 044 1 034 3 583 947 2 986 547 579 94%
2011 1 076 1 075 4 658 1 012 3 998 610 626 97%
2012 1 231 1 231 5 889 1 053 5 051 786 787 100%
2013 1 278 1 278 7 167 1 200 6 251 864 868 100%
TOTAL 7 179 7 167 6 251
B.6.6 Macrofinancial Assistance (MFF 4.0.6) (million EUR)
Implementation Table
Initial budget
Carryover from 2012
Amending budgets
BA transfers
COM transfers
Assigned revenue
Total appropria-
tions
Actual 2013 Rate Actual
2012 Carry-over to 2014
CA 95 0 0 - 85 - 5 0 5 0.2 3% 0.5 0
PA 56 0 - 10 - 46 0 0 1 1 96% 30 0
RAL as at 01.01.2013
Payments on RAL
Commitments 2013
Payments on 2013 commitments Decommitments 2013 RAL as at
31.12.2013 Evolution of the RAL
(%)
RAL 11 0 0.2 0 0 10 -3%
The weak implementation of commitments was due to the blockage of the current International Monetary Fund (IMF) programme in Georgia which affected also payments, and to delayed loan agreements with the Kyrgyz Republic. Most of payments were subject to an IMF arrangement in Egypt which did not take place in 2013. However, it was possible to reallocate the amounts concerned in priority to Humanitarian Aid and EUR 30 million commitments appropriations to 19 08 01 European Neighbourhood and Partnership financial cooperation with Mediterranean countries to reinforce the EU's comprehensive response to the Syrian crisis.

67
(million EUR)
Cumulative Programme Table Ye
ar
Prog
ram
me
Allo
catio
n
Act
ual
Com
mitm
ents
Cum
ulat
ive
com
mitm
ents
Act
ual p
aym
ents
Cum
ulat
ive
paym
ents
Out
stan
ding
co
mm
itmen
ts o
f cu
rren
t pr
ogra
mm
e
Tota
l RA
L of
the
deta
iled
MFF
he
adin
g
Cur
rent
Pr
ogra
mm
e sh
are
2007 58 58 58 20 20 38 99 38%
2008 19 18 76 40 60 16 77 20%
2009 82 81 157 16 76 81 131 62%
2010 90 90 247 71 147 100 120 83%
2011 1 1 248 55 202 45 45 100%
2012 0.5 0.5 248 30 232 11 11 100%
2013 5 0.2 248 0.5 232 10 10 100%
TOTAL 256 248 232
B.6.7 Common Foreign and Security Policy (CFSP) (MFF 4.0.7) (million EUR)
Implementation Table
Initial budget
Carryover from 2012
Amending budgets
BA transfers
COM transfers
Assigned revenue
Total appropria-
tions
Actual 2013 Rate Actual
2012 Carry-over to 2014
CA 396 0 0 - 48 0 25 373 353 95% 336 20
PA 317 0 0 - 15 0 25 327 312 96% 265 14
RAL as at 01.01.2013
Payments on RAL
Commitments 2013
Payments on 2013 commitments Decommitments 2013 RAL as at
31.12.2013 Evolution of the RAL
(%)
RAL 239 129 353 183 19 262 9%
The main adjustments were reductions in budget lines
• 19 03 04 Emergency measures (EUR 34 million in commitments and EUR 25 million in payments).This article can be used as an element of flexibility within the CFSP in accordance with the Inter-institutional Agreement of 2006;
• 19 03 01 02 EULEX Kosovo (EUR 33 million in commitments and EUR 18 million in payments) as a result of the mission being currently downsized.
Appropriations went mainly to Humanitarian aid but also to budget line 19 06 01 Crisis response and preparedness (Instrument for Stability).

68
(million EUR)
Cumulative Programme Table Ye
ar
Prog
ram
me
Allo
catio
n
Act
ual
Com
mitm
ents
Cum
ulat
ive
com
mitm
ents
Act
ual p
aym
ents
Cum
ulat
ive
paym
ents
Out
stan
ding
co
mm
itmen
ts o
f cu
rren
t pr
ogra
mm
e
Tota
l RA
L of
the
deta
iled
MFF
he
adin
g
Cur
rent
Pr
ogra
mm
e sh
are
2007 159 157 157 48 48 109 168 65%
2008 285 287 444 191 239 205 252 81%
2009 243 243 687 314 553 129 169 76%
2010 282 281 968 251 804 157 177 88%
2011 327 327 1 295 305 1 109 179 192 93%
2012 332 332 1 627 260 1 369 231 239 97%
2013 348 343 1 970 301 1 670 260 262 99%
TOTAL 1 976 1 970 1 670
B.6.8 EC Guarantees for Lending Operations (MFF 4.0.8) (million EUR)
Implementation Table
Initial budget
Carryover from 2012
Amending budgets
BA transfers
COM transfers
Assigned revenue
Total appropria-
tions
Actual 2013 Rate Actual
2012 Carry-over to 2014
CA 156 0 0 0 0 0 156 156 100% 260 0
PA 156 0 0 0 0 0 156 156 100% 260 0
RAL as at 01.01.2013
Payments on RAL
Commitments 2013
Payments on 2013 commitments Decommitments 2013 RAL as at
31.12.2013 Evolution of the RAL
(%)
RAL 0 0 156 156 0 0 0%
B.6.9 Industrialised Countries Instrument (ICI) (MFF 4.0.10) (million EUR)
Implementation Table
Initial budget
Carryover from 2012
Amending budgets
BA transfers
COM transfers
Assigned revenue
Total appropria-
tions
Actual 2013 Rate Actual
2012 Carry-over to 2014
CA 24 0 0 0 0 0 24 23 99% 28 0
PA 18 0 0 0 1 0 19 19 99% 19 0
RAL as at 01.01.2013
Payments on RAL
Commitments 2013
Payments on 2013 commitments Decommitments 2013 RAL as at
31.12.2013 Evolution of the RAL
(%)
RAL 69 19 23 0 3 70 2%

69
(million EUR)
Cumulative Programme Table Ye
ar
Prog
ram
me
Allo
catio
n
Act
ual
Com
mitm
ents
Cum
ulat
ive
com
mitm
ents
Act
ual p
aym
ents
Cum
ulat
ive
paym
ents
Out
stan
ding
co
mm
itmen
ts o
f cu
rren
t pr
ogra
mm
e
Tota
l RA
L of
the
deta
iled
MFF
he
adin
g
Cur
rent
Pr
ogra
mm
e sh
are
2007 22 22 22 2 2 20 39 51%
2008 28 25 47 8 10 33 46 72%
2009 29 25 72 10 20 48 56 86%
2010 24 24 96 19 39 52 57 91%
2011 25 25 121 20 59 57 61 93%
2012 28 28 149 19 78 64 69 93%
2013 24 23 172 19 97 65 70 93%
TOTAL 181 172 97
B.6.10 Democracy and Human Rights (MFF 4.0.11) (million EUR)
Implementation Table
Initial budget
Carryover from 2012
Amending budgets
BA transfers
COM transfers
Assigned revenue
Total appropria-
tions
Actual 2013 Rate Actual
2012 Carry-over to 2014
CA 177 0 0 0 0 4 181 179 99% 176 2
PA 130 2 20 - 6 0 3 150 147 98% 151 3
RAL as at 01.01.2013
Payments on RAL
Commitments 2013
Payments on 2013 commitments Decommitments 2013 RAL as at
31.12.2013 Evolution of the RAL
(%)
RAL 348 111 179 36 30 350 1%
(million EUR)
Cumulative Programme Table
Year
Prog
ram
me
Allo
catio
n
Act
ual
Com
mitm
ents
Cum
ulat
ive
com
mitm
ents
Act
ual p
aym
ents
Cum
ulat
ive
paym
ents
Out
stan
ding
co
mm
itmen
ts o
f cu
rren
t pr
ogra
mm
e
Tota
l RA
L of
the
deta
iled
MFF
he
adin
g
Cur
rent
Pr
ogra
mm
e sh
are
2007 141 140 140 28 28 110 287 38%
2008 147 147 287 59 87 196 286 69%
2009 157 157 444 101 188 244 308 79%
2010 193 163 607 151 339 245 308 79%
2011 138 167 774 130 469 282 343 82%
2012 175 175 949 148 617 303 348 87%
2013 177 177 1 126 144 761 306 350 87%
TOTAL 1 128 1 126 761

70
B.6.11 Instrument for Nuclear Safety Cooperation (MFF 4.0.12) (million EUR)
Implementation Table
Initial budget
Carryover from 2012
Amending budgets
BA transfers
COM transfers
Assigned revenue
Total appropria-
tions
Actual 2013 Rate Actual
2012 Carry-over to 2014
CA 79 0 0 - 25 0 0 54 54 100% 77 0
PA 66 0 0 - 15 3 0 54 53 99% 68 1
RAL as at 01.01.2013
Payments on RAL
Commitments 2013
Payments on 2013 commitments Decommitments 2013 RAL as at
31.12.2013 Evolution of the RAL
(%)
RAL 221 40 54 13 6 216 -2%
(million EUR)
Cumulative Programme Table
Year
Prog
ram
me
Allo
catio
n
Act
ual
Com
mitm
ents
Cum
ulat
ive
com
mitm
ents
Act
ual p
aym
ents
Cum
ulat
ive
paym
ents
Out
stan
ding
co
mm
itmen
ts o
f cu
rren
t pr
ogra
mm
e
Tota
l RA
L of
the
deta
iled
MFF
he
adin
g
Cur
rent
Pr
ogra
mm
e sh
are
2007 70 70 70 11 11 59 293 20%
2008 73 72 142 18 29 113 278 41%
2009 74 74 216 19 48 168 247 68%
2010 70 70 286 60 108 178 215 83%
2011 76 76 362 64 172 190 215 88%
2012 77 77 439 68 240 195 221 88%
2013 54 54 493 52 292 191 216 88%
TOTAL 494 493 292
B.6.12 Others (million EUR)
Implementation Table
Initial budget
Carryover from 2012
Amending budgets
BA transfers
COM transfers
Assigned revenue
Total appropria-
tions
Actual 2013 Rate Actual
2012 Carry-over to 2014
CA 231 2 1 -7 0 97 324 314 97% 254 6
PA 179 1 3 -9 -5 101 271 261 96% 297 9
RAL as at 01.01.2013
Payments on RAL
Commitments 2013
Payments on 2013 commitments Decommitments 2013 RAL as at
31.12.2013 Evolution of the RAL
(%)
RAL 433 106 315 154 38 449 1%
This category covers, inter alia, agencies and pilot projects and preparatory actions, as well as lines which do not fall within the main programmes (for instance financial support to the Turkish Cypriot community, Cooperation with Greenland, the Facility for rapid response to soaring food prices in developing countries, etc.).

71
B.7 HEADING 5: ADMINISTRATION
B.7.1 Administration (all institutions)
Implementation Table
Initial budget
Carryover from 2012
Amending budgets
BA transfers
COM transfers
Assigned revenue
Total appropria-
tions
Actual 2013 Rate Actual
2012 Carry-over to 2014
CA 8 427 0 0 4 0 851 9 281 8 870 96% 8 822 215
PA 8 426 767 0 4 0 860 10 056 8 693 86% 8 564 1 098
RAL as at 01.01.2013
Payments on RAL
Commitments 2013
Payments on 2013 commitments Decommitments 2013 RAL as at
31.12.2013 Evolution of the RAL
(%)
RAL 909 715 8 870 7 978 187 899 - 1%
B.7.2 Commission Administration
Implementation Table
Initial budget
Carryover from 2012
Amending budgets
BA transfers
COM transfers
Assigned revenue
Total appropria-
tions
Actual 2013 Rate Actual
2012 Carry-over to 2014
CA 4 900 0 0 4 0 355 5 258 5 040 96% 4 981 153
PA 4 899 299 0 4 0 358 5 559 4 990 90% 4 968 478
RAL as at 01.01.2013
Payments on RAL
Commitments 2013
Payments on 2013 commitments Decommitments 2013 RAL as at
31.12.2013 Evolution of the RAL
(%)
RAL 320 289 5 040 4 701 28 342 7%
The appropriations were effectively implemented in accordance with the budget.
The unused amounts (EUR 65 million in commitments and EUR 64 million in payments) arose from the Council's rejection of transfer proposal DEC 43/2013 related to the salary adjustment. Following this rejection, these appropriations could not be used or carried forward, as staff expenditure may not be carried forward according to the art 316 of the TFEU.
Of the payment appropriations carried over automatically from 2012, EUR 25 million remained unused and were cancelled.
EUR 278 million of the year's appropriations, committed in 2013, were carried forward to 2014. The above table indicates a figure for the carryover to 2014 which includes assigned revenue (all commitments and EUR 199 million in payments).

72
B.7.3 Implementation Tables
B.7.3.1 Commission administration (MFF 5.0.1)
Expenditure Related to Staff in Active Employment
Offi
cial
Pos
ition
Des
crip
tion
Initi
al B
udge
t Pa
ymen
ts
Car
ryov
er fr
om
2012
BA
Tra
nsfe
rs
CO
M T
rans
fers
Ass
igne
d re
venu
e
Aut
horis
ed
Impl
emen
tatio
n 20
13
Rat
e
Impl
emen
tatio
n 20
12
Car
ryov
er to
201
4
01 01 01
Expenditure related to staff in active employment of 'Economic and financial affairs' policy area
63.87 0.00 0.00 0.00 3.34 67.21 63.34 94% 54.32 1.88
02 01 01 Expenditure related to staff in active employment of 'Enterprise' policy area
70.53 0.00 0.00 0.00 3.99 74.53 70.26 94% 71.32 2.07
03 01 01 Expenditure related to staff in active employment of 'Competition' policy area
77.09 0.00 0.00 0.00 4.30 81.40 76.73 94% 75.75 2.27
04 01 01
Expenditure related to staff in active employment of 'Employment and social affairs' policy area
60.44 0.00 0.00 0.00 3.39 63.83 60.18 94% 60.01 1.78
05 01 01
Expenditure related to staff in active employment of 'Agriculture and rural development' policy area
100.50 0.00 0.00 0.00 5.66 106.17 100.08 94% 100.82 2.95
06 01 01
Expenditure related to staff in active employment of 'Energy and transport' policy area
35.01 0.00 0.00 0.00 1.95 36.97 34.85 94% 34.41 1.03
07 01 01 Expenditure related to staff in active employment of 'Environment' policy area
61.05 0.00 0.00 0.00 3.44 64.48 60.79 94% 61.00 1.79
08 01 01 Expenditure related to staff in active employment of 'Research' policy area
8.88 0.00 0.00 0.00 0.51 9.39 8.85 94% 9.20 0.26
09 01 01
Expenditure related to staff in active employment of 'Information society and media' policy area
39.55 0.00 0.00 0.00 2.24 41.79 39.40 94% 40.00 1.16
11 01 01
Expenditure related to staff in active employment of 'Maritime affairs and Fisheries' policy area
29.87 0.00 0.00 0.00 1.68 31.55 29.74 94% 29.71 0.88
12 01 01 Expenditure related to staff in active employment of 'Internal market' policy area
49.95 0.00 0.00 0.00 2.73 52.68 49.65 94% 46.83 1.47
13 01 01 Expenditure related to staff in active employment of 'Regional policy' policy area
59.23 0.00 0.00 0.00 3.33 62.57 58.98 94% 59.21 1.74
14 01 01
Expenditure related to staff in active employment of 'Taxation and customs union' policy area
44.30 0.00 0.00 0.00 2.49 46.79 44.11 94% 44.11 1.30
15 01 01
Expenditure related to staff in active employment of 'Education and culture' policy area
52.07 0.00 0.00 0.00 2.91 54.80 51.79 95% 52.32 1.50
16 01 01 01
Expenditure related to staff in active employment of 'Communication' policy area: Headquarters
64.38 0.00 0.00 0.00 3.56 67.94 64.04 94% 61.92 1.89
17 01 01
Expenditure related to staff in active employment of 'Health and consumer protection' policy area
77.70 0.00 0.00 0.00 4.38 82.08 77.37 94% 77.82 2.28

73
Expenditure Related to Staff in Active Employment O
ffici
al P
ositi
on
Des
crip
tion
Initi
al B
udge
t Pa
ymen
ts
Car
ryov
er fr
om
2012
BA
Tra
nsfe
rs
CO
M T
rans
fers
Ass
igne
d re
venu
e
Aut
horis
ed
Impl
emen
tatio
n 20
13
Rat
e
Impl
emen
tatio
n 20
12
Car
ryov
er to
201
4
18 01 01
Expenditure related to staff in active employment of 'Area of freedom. security and justice' policy area
31.08 0.00 0.00 0.00 1.73 32.81 30.93 94% 31.22 0.91
19 01 01 01
Expenditure related to staff in active employment of 'External relations' Directorates-General
7.27 0.00 0.00 0.00 0.41 7.68 7.24 94% 7.39 0.21
19 01 01 02
Expenditure related to staff in active employment of 'External relations' delegations
6.93 0.00 0.00 -0.01 0.00 6.92 6.59 95% 6.37 0.00
20 01 01 01 Expenditure related to staff in active employment of 'Trade' Directorate-General
48.23 0.00 0.00 0.00 2.69 50.92 48.00 94% 47.30 1.42
20 01 01 02 Expenditure related to staff in active employment of 'Trade' delegations
13.87 0.00 0.00 -0.03 0.00 13.84 13.19 95% 13.23 0.00
21 01 01 01
Expenditure related to staff in active employment of 'Development' Directorates-General
75.38 0.00 0.00 0.00 4.26 79.64 75.07 94% 76.08 2.21
21 01 01 02 Expenditure related to staff in active employment of 'Development' delegations
90.14 0.00 0.00 -0.19 0.00 89.95 85.71 95% 82.34 0.00
22 01 01 01
Expenditure related to staff in active employment of 'Enlargement' Directorate-General
22.70 0.00 0.00 0.00 1.30 24.00 22.63 94% 23.42 0.67
22 01 01 02 Expenditure related to staff in active employment of 'Enlargement' delegations
7.82 0.00 0.00 -0.02 0.00 7.81 7.44 95% 8.66 0.00
23 01 01
Expenditure related to staff in active employment of 'Humanitarian aid' policy area
21.19 0.00 0.00 0.00 1.16 22.35 21.07 94% 20.10 0.62
25 01 01 01
Expenditure related to staff in active employment 'Commission's policy coordination and legal advice' policy area
141.67 0.00 0.00 0.00 7.97 149.64 141.07 94% 141.48 4.16
26 01 01
Expenditure related to staff in active employment in 'Commission's administration' policy area
105.04 0.00 0.00 -3.26 5.92 107.71 104.61 97% 105.83 3.07
27 01 01 Expenditure related to staff in active employment of 'Budget' policy area
41.57 0.00 0.00 0.00 2.35 43.92 41.40 94% 41.81 1.22
28 01 01 Expenditure related to staff in active employment of 'Audit' policy area
9.99 0.00 0.00 0.00 0.56 10.55 9.95 94% 9.99 0.29
29 01 01 Expenditure related to staff in active employment of 'Statistics' policy area
63.57 0.00 0.00 0.00 3.59 67.16 63.31 94% 64.02 1.87
31 01 01
Expenditure related to staff in active employment of 'Language services' policy area
319.26 0.01 0.00 0.00 17.98 337.25 317.92 94% 319.47 9.38
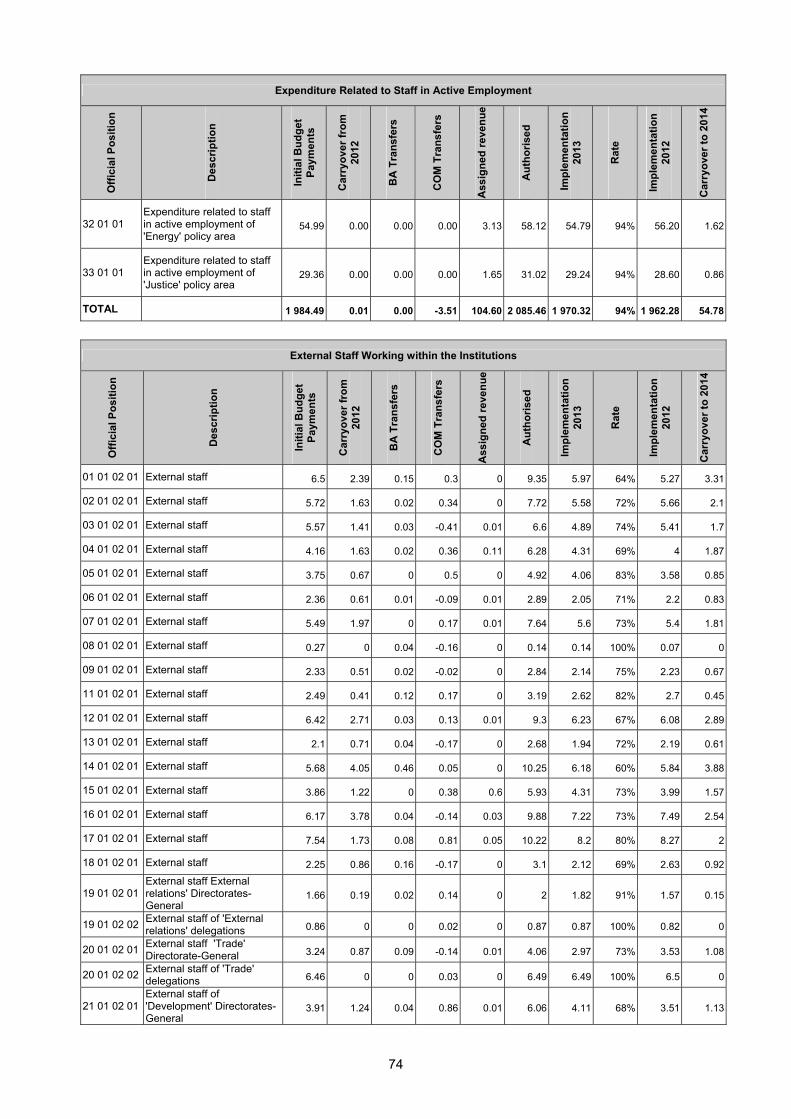
74
Expenditure Related to Staff in Active Employment O
ffici
al P
ositi
on
Des
crip
tion
Initi
al B
udge
t Pa
ymen
ts
Car
ryov
er fr
om
2012
BA
Tra
nsfe
rs
CO
M T
rans
fers
Ass
igne
d re
venu
e
Aut
horis
ed
Impl
emen
tatio
n 20
13
Rat
e
Impl
emen
tatio
n 20
12
Car
ryov
er to
201
4
32 01 01 Expenditure related to staff in active employment of 'Energy' policy area
54.99 0.00 0.00 0.00 3.13 58.12 54.79 94% 56.20 1.62
33 01 01 Expenditure related to staff in active employment of 'Justice' policy area
29.36 0.00 0.00 0.00 1.65 31.02 29.24 94% 28.60 0.86
TOTAL 1 984.49 0.01 0.00 -3.51 104.60 2 085.46 1 970.32 94% 1 962.28 54.78
External Staff Working within the Institutions
Offi
cial
Pos
ition
Des
crip
tion
Initi
al B
udge
t Pa
ymen
ts
Car
ryov
er fr
om
2012
BA
Tra
nsfe
rs
CO
M T
rans
fers
Ass
igne
d re
venu
e
Aut
horis
ed
Impl
emen
tatio
n 20
13
Rat
e
Impl
emen
tatio
n 20
12
Car
ryov
er to
201
4
01 01 02 01 External staff 6.5 2.39 0.15 0.3 0 9.35 5.97 64% 5.27 3.31
02 01 02 01 External staff 5.72 1.63 0.02 0.34 0 7.72 5.58 72% 5.66 2.1
03 01 02 01 External staff 5.57 1.41 0.03 -0.41 0.01 6.6 4.89 74% 5.41 1.7
04 01 02 01 External staff 4.16 1.63 0.02 0.36 0.11 6.28 4.31 69% 4 1.87
05 01 02 01 External staff 3.75 0.67 0 0.5 0 4.92 4.06 83% 3.58 0.85
06 01 02 01 External staff 2.36 0.61 0.01 -0.09 0.01 2.89 2.05 71% 2.2 0.83
07 01 02 01 External staff 5.49 1.97 0 0.17 0.01 7.64 5.6 73% 5.4 1.81
08 01 02 01 External staff 0.27 0 0.04 -0.16 0 0.14 0.14 100% 0.07 0
09 01 02 01 External staff 2.33 0.51 0.02 -0.02 0 2.84 2.14 75% 2.23 0.67
11 01 02 01 External staff 2.49 0.41 0.12 0.17 0 3.19 2.62 82% 2.7 0.45
12 01 02 01 External staff 6.42 2.71 0.03 0.13 0.01 9.3 6.23 67% 6.08 2.89
13 01 02 01 External staff 2.1 0.71 0.04 -0.17 0 2.68 1.94 72% 2.19 0.61
14 01 02 01 External staff 5.68 4.05 0.46 0.05 0 10.25 6.18 60% 5.84 3.88
15 01 02 01 External staff 3.86 1.22 0 0.38 0.6 5.93 4.31 73% 3.99 1.57
16 01 02 01 External staff 6.17 3.78 0.04 -0.14 0.03 9.88 7.22 73% 7.49 2.54
17 01 02 01 External staff 7.54 1.73 0.08 0.81 0.05 10.22 8.2 80% 8.27 2
18 01 02 01 External staff 2.25 0.86 0.16 -0.17 0 3.1 2.12 69% 2.63 0.92
19 01 02 01 External staff External relations' Directorates-General
1.66 0.19 0.02 0.14 0 2 1.82 91% 1.57 0.15
19 01 02 02 External staff of 'External relations' delegations 0.86 0 0 0.02 0 0.87 0.87 100% 0.82 0
20 01 02 01 External staff 'Trade' Directorate-General 3.24 0.87 0.09 -0.14 0.01 4.06 2.97 73% 3.53 1.08
20 01 02 02 External staff of 'Trade' delegations 6.46 0 0 0.03 0 6.49 6.49 100% 6.5 0
21 01 02 01 External staff of 'Development' Directorates-General
3.91 1.24 0.04 0.86 0.01 6.06 4.11 68% 3.51 1.13

75
External Staff Working within the Institutions
Offi
cial
Pos
ition
Des
crip
tion
Initi
al B
udge
t Pa
ymen
ts
Car
ryov
er fr
om
2012
BA
Tra
nsfe
rs
CO
M T
rans
fers
Ass
igne
d re
venu
e
Aut
horis
ed
Impl
emen
tatio
n 20
13
Rat
e
Impl
emen
tatio
n 20
12
Car
ryov
er to
201
4
21 01 02 02 External staff of 'Development' delegations 1.31 0 0 0.48 0 1.79 1.78 100% 1.4 0.01
22 01 02 01 External staff of 'Enlargement' Directorate-General
1.99 0.38 0.01 0.17 0 2.54 2.02 80% 2.77 0.43
22 01 02 02 External staff of 'Enlargement' delegations 1.54 0 0 0.02 0 1.56 1.56 100% 1.59 0
23 01 02 01 External staff 2.09 0.6 0.31 0.36 0 3.36 2.29 68% 2.36 1.01
25 01 02 01 External staff 6.27 0.76 0.11 -0.39 0 6.75 5.37 80% 6.21 1.03
26 01 02 01 External staff 5.82 1.35 0.18 0.67 0.81 8.83 6.54 74% 6.46 2.19
27 01 02 01 External staff 4.33 2.19 0 -0.42 2.29 8.39 5.32 63% 5.54 3.02
27 01 02 09 External staff Non-decentralised management 4.39 0 -3.35 -1.04 0 0 0 0% 0 0
28 01 02 01 External staff 0.72 0.08 -0.03 -0.13 0.13 0.76 0.54 71% 0.69 0.22
29 01 02 01 External staff 5.24 1.84 0 0.45 0.23 7.76 5 64% 5.46 2.3
31 01 02 01 External staff 11.49 0.59 0.14 -0.67 0.6 12.15 11.36 94% 10.83 0.71
32 01 02 01 External staff 2.83 0.75 0 -0.45 0 3.14 2.48 79% 2.58 0.62
33 01 02 01 External staff 3.13 0.81 0.17 0.44 0 4.56 3.11 68% 3.13 0.97
TOTAL 139.95 37.92 -1.08 2.45 4.91 184.02 137.22 75% 137.97 42.87
Other Management Expenditure of the Institutions
Offi
cial
Pos
ition
Des
crip
tion
Initi
al B
udge
t Pa
ymen
ts
Car
ryov
er fr
om
2012
BA
Tra
nsfe
rs
CO
M T
rans
fers
Ass
igne
d re
venu
e
Aut
horis
ed
Impl
emen
tatio
n 20
13
Rat
e
Impl
emen
tatio
n 20
12
Car
ryov
er to
201
4 01 01 02 11 Other management
expenditure 7.81 1.94 0.07 0.16 0.26 10.24 6.44 63% 6.46 3.40
02 01 02 11 Other management expenditure 4.38 1.26 0.00 -0.21 0.01 5.44 4.37 80% 4.37 0.92
03 01 02 11 Other management expenditure 4.68 3.84 1.52 0.29 0.11 10.44 5.53 53% 4.82 3.94
04 01 02 11 Other management expenditure 4.91 1.11 0.40 0.00 0.45 6.87 4.95 72% 5.80 1.74
05 01 02 11 Other management expenditure 8.45 3.08 -0.20 -0.40 0.00 10.92 7.55 69% 7.87 2.59
06 01 02 11 Other management expenditure 2.39 0.73 0.14 0.00 0.05 3.32 2.47 74% 2.53 0.75
07 01 02 11 Other management expenditure 5.96 1.03 0.26 -0.56 0.06 6.75 5.06 75% 6.15 1.40
08 01 02 11 Other management expenditure 0.39 0.06 0.00 0.00 0.00 0.46 0.36 78% 0.38 0.07
09 01 02 11 Other management expenditure 1.68 0.61 0.00 0.00 0.11 2.40 1.88 79% 1.76 0.49
11 01 02 11 Other management expenditure 2.79 0.42 0.12 -0.25 0.00 3.08 2.35 76% 2.54 0.62
12 01 02 11 Other management expenditure 3.53 0.98 0.17 -0.05 0.00 4.62 2.77 60% 3.05 1.39
13 01 02 11 Other management expenditure 3.10 0.74 0.00 0.00 0.00 3.85 2.76 72% 2.58 0.66
14 01 02 11 Other management expenditure 2.84 0.63 0.00 0.34 0.22 4.03 3.02 75% 2.84 0.92

76
Other Management Expenditure of the Institutions O
ffici
al P
ositi
on
Des
crip
tion
Initi
al B
udge
t Pa
ymen
ts
Car
ryov
er fr
om
2012
BA
Tra
nsfe
rs
CO
M T
rans
fers
Ass
igne
d re
venu
e
Aut
horis
ed
Impl
emen
tatio
n 20
13
Rat
e
Impl
emen
tatio
n 20
12
Car
ryov
er to
201
4
15 01 02 11 Other management expenditure 3.33 0.93 -0.58 -0.45 3.21 6.45 4.14 64% 4.66 2.23
16 01 02 11 Other management expenditure 3.37 0.68 0.62 -0.19 0.05 4.53 3.25 72% 3.47 1.14
17 01 02 11 Other management expenditure 9.79 2.88 0.00 -0.83 0.08 11.91 8.13 68% 9.27 3.43
18 01 02 11 Other management expenditure 1.74 0.64 0.00 -0.07 0.06 2.37 1.53 65% 1.73 0.62
19 01 02 11 Other management expenditure 0.59 0.10 0.17 -0.26 0.00 0.60 0.45 75% 0.39 0.14
20 01 02 11 Other management expenditure 4.39 1.21 0.00 0.19 0.04 5.83 4.58 79% 4.30 1.01
21 01 02 11 Other management expenditure 6.38 2.73 0.00 -0.32 0.01 8.79 6.41 73% 6.36 2.12
22 01 02 11 Other management expenditure 1.21 0.66 0.00 -0.06 0.02 1.83 1.24 68% 1.84 0.36
23 01 02 11 Other management expenditure 1.94 0.55 0.07 -0.08 0.07 2.55 1.88 74% 1.96 0.61
25 01 02 11 Other management expenditure 12.84 6.35 0.00 0.92 0.01 20.13 13.28 66% 15.02 6.28
26 01 02 11 Other management expenditure 17.99 12.44 0.96 -1.24 8.24 38.40 20.81 54% 21.37 16.46
27 01 02 11 Other management expenditure 7.91 4.44 -0.93 -0.04 2.08 13.47 9.10 68% 9.45 4.07
27 01 02 19 Other management expenditure 5.95 0.00 -2.09 -3.86 0.00 0.00 0.00 0% 0.00 0.00
28 01 02 11 Other management expenditure 0.54 0.14 0.00 0.07 0.00 0.75 0.46 61% 0.37 0.24
29 01 02 11 Other management expenditure 3.96 1.13 -0.03 -0.09 0.16 5.12 3.37 66% 3.72 1.00
31 01 02 11 Other management expenditure 4.99 1.96 0.00 -0.11 2.53 9.37 6.42 69% 6.77 2.60
32 01 02 11 Other management expenditure 1.99 0.76 0.42 -0.02 0.04 3.19 1.99 62% 2.41 0.91
33 01 02 11 Other management expenditure 1.34 0.48 0.00 0.00 0.10 1.92 1.18 61% 1.30 0.54
TOTAL 143.15 54.53 1.08 -7.09 17.98 209.65 137.74 66% 145.53 62.66
Expenditure related to buildings
Offi
cial
Pos
ition
Des
crip
tion
Initi
al B
udge
t Pa
ymen
ts
Car
ryov
er fr
om
2012
BA
Tra
nsfe
rs
CO
M T
rans
fers
Ass
igne
d re
venu
e
Aut
horis
ed
Impl
emen
tatio
n 20
13
Rat
e
Impl
emen
tatio
n 20
12
Car
ryov
er to
201
4
17 01 03 03
Buildings and related expenditure of 'Health and consumer protection' policy area: Grange
4.70 1.29 0.00 0.00 0.00 5.99 4.11 69% 5.28 1.71
26 01 22 02 Acquisition and renting of buildings in Brussels 203.59 0.92 0.00 20.55 9.12 234.18 208.98 89% 280.03 25.20
26 01 22 03 Expenditure related to buildings in Brussels 71.23 40.77 0.00 0.00 18.09 130.09 85.14 65% 86.87 43.54
26 01 22 04 Expenditure for equipment in Brussels 8.27 7.51 0.00 0.00 2.84 18.62 12.73 68% 8.81 5.54
26 01 22 05 Services and other operating expenditure in Brussels
9.93 5.73 0.00 -0.13 4.38 19.91 13.87 70% 12.66 5.89
26 01 22 06 Guarding of buildings in Brussels 32.50 13.50 0.00 0.00 4.73 50.74 34.43 68% 37.16 15.77

77
Expenditure related to buildings O
ffici
al P
ositi
on
Des
crip
tion
Initi
al B
udge
t Pa
ymen
ts
Car
ryov
er fr
om
2012
BA
Tra
nsfe
rs
CO
M T
rans
fers
Ass
igne
d re
venu
e
Aut
horis
ed
Impl
emen
tatio
n 20
13
Rat
e
Impl
emen
tatio
n 20
12
Car
ryov
er to
201
4
26 01 23 02 Acquisition and renting of buildings in Luxembourg
40.09 0.00 0.00 2.45 4.66 47.20 45.29 96% 49.73 1.91
26 01 23 03 Expenditure related to buildings in Luxembourg 17.48 3.66 0.00 -0.04 0.92 22.03 16.39 74% 18.13 5.26
26 01 23 04 Expenditure for equipment in Luxembourg
1.09 0.30 0.00 0.00 0.10 1.49 0.94 63% 1.07 0.50
26 01 23 05 Services and other operating expenditure in Luxembourg
1.03 0.41 0.00 -0.04 0.05 1.45 0.99 68% 1.13 0.43
26 01 23 06 Guarding of buildings in Luxembourg 5.64 0.92 0.00 0.32 0.06 6.94 6.32 91% 5.81 0.48
26 01 40 Security and monitoring 8.04 4.86 0.00 0.13 1.35 14.39 8.81 61% 8.08 5.39
Total 403.59 79.87 0.00 23.23 46.30 553.03 438.0 79% 515.76 111.62
Expenditure related to ICT
Offi
cial
Pos
ition
Des
crip
tion
Initi
al B
udge
t Pa
ymen
ts
Car
ryov
er fr
om
2012
BA
Tra
nsfe
rs
CO
M T
rans
fers
Ass
igne
d re
venu
e
Aut
horis
ed
Impl
emen
tatio
n 20
13
Rat
e
Impl
emen
tatio
n 20
12
Car
ryov
er to
201
4
01 01 03 01
Expenditure related to information and communication technology equipment and services
4.04 1.67 0.00 0.00 0.88 6.59 4.63 70% 4.14 1.94
02 01 03
Expenditure related to information and communication technology equipment and services
4.46 2.19 0.00 0.00 1.02 7.67 5.49 72% 5.40 2.15
03 01 03
Expenditure related to information and communication technology equipment and services
4.88 2.33 0.00 0.00 1.10 8.31 5.93 71% 5.78 2.35
04 01 03
Expenditure related to information and communication technology equipment and services
3.82 1.84 0.00 0.00 0.87 6.54 4.67 71% 4.55 1.84
05 01 03
Expenditure related to information and communication technology equipment and services
6.36 3.10 0.00 0.00 1.45 10.90 7.80 72% 7.63 3.06
06 01 03
Expenditure related to information and communication technology equipment and services
2.22 1.06 0.00 0.00 0.50 3.77 2.69 71% 2.65 1.07
07 01 03
Expenditure related to information and communication technology equipment and services
3.86 1.87 0.00 0.00 0.88 6.62 4.73 72% 4.61 1.86

78
Expenditure related to ICT O
ffici
al P
ositi
on
Des
crip
tion
Initi
al B
udge
t Pa
ymen
ts
Car
ryov
er fr
om
2012
BA
Tra
nsfe
rs
CO
M T
rans
fers
Ass
igne
d re
venu
e
Aut
horis
ed
Impl
emen
tatio
n 20
13
Rat
e
Impl
emen
tatio
n 20
12
Car
ryov
er to
201
4
08 01 03
Expenditure related to information and communication technology equipment and services
0.56 0.28 0.00 0.00 0.13 0.97 0.70 72% 0.70 0.27
09 01 03
Expenditure related to information and communication technology equipment and services
2.50 1.23 0.00 0.00 0.57 4.30 3.08 72% 3.02 1.21
11 01 03
Expenditure related to information and communication technology equipment and services
1.89 0.91 0.00 0.00 0.43 3.23 2.31 71% 2.25 0.91
12 01 03
Expenditure related to information and communication technology equipment and services
3.16 1.44 0.00 0.00 0.71 5.31 3.77 71% 3.58 1.52
13 01 03
Expenditure related to information and communication technology equipment and services
3.75 1.82 0.00 0.00 0.85 6.42 4.59 72% 4.49 1.81
14 01 03
Expenditure related to information and communication technology equipment and services
2.80 1.36 0.00 0.00 0.64 4.79 3.43 71% 3.33 1.35
15 01 03
Expenditure related to information and communication technology equipment and services
3.29 1.61 0.00 0.00 0.75 5.65 4.04 72% 3.97 1.59
16 01 03 01
Expenditure related to information and communication technology equipment and services
4.07 1.90 0.00 0.00 0.92 6.89 4.91 71% 4.70 1.96
17 01 03 01
Expenditure related to information and communication technology equipment and services
4.92 2.39 0.00 0.00 1.12 8.43 6.03 72% 5.89 2.37
18 01 03
Expenditure related to information and communication technology equipment and services
1.97 0.96 0.00 0.00 0.44 3.37 2.41 72% 3.32 0.95
19 01 03 01
Expenditure related to information and communication technology equipment and services
0.46 0.23 0.00 0.00 0.10 0.79 0.57 72% 0.60 0.22
20 01 03 01
Expenditure related to information and communication technology equipment and services
3.05 1.45 0.00 0.00 0.69 5.20 3.71 71% 3.57 1.47
21 01 03 01
Expenditure related to information and communication technology equipment and services
4.77 2.34 0.00 0.00 1.09 8.19 5.87 72% 5.83 2.30

79
Expenditure related to ICT O
ffici
al P
ositi
on
Des
crip
tion
Initi
al B
udge
t Pa
ymen
ts
Car
ryov
er fr
om
2012
BA
Tra
nsfe
rs
CO
M T
rans
fers
Ass
igne
d re
venu
e
Aut
horis
ed
Impl
emen
tatio
n 20
13
Rat
e
Impl
emen
tatio
n 20
12
Car
ryov
er to
201
4
22 01 03 01
Expenditure related to information and communication technology equipment and services
1.44 0.72 0.00 0.00 0.33 2.49 1.78 72% 1.79 0.69
23 01 03
Expenditure related to information and communication technology equipment and services
1.34 0.62 0.00 0.00 0.30 2.26 1.61 71% 1.52 0.65
25 01 03
Expenditure related to information and communication technology equipment and services
8.97 4.34 0.00 0.00 2.03 15.34 10.97 71% 10.72 4.32
26 01 03
Expenditure related to information and communication technology equipment and services
6.65 3.25 0.00 0.00 1.51 11.41 8.17 72% 8.02 3.20
27 01 03
Expenditure related to information and communication technology equipment and services
2.63 1.28 0.00 0.00 0.60 4.51 3.23 72% 3.22 1.27
28 01 03
Expenditure related to information and communication technology equipment and services
0.63 0.31 0.00 0.00 0.14 1.08 0.77 72% 0.76 0.30
29 01 03
Expenditure related to information and communication technology equipment and services
4.02 1.97 0.00 0.00 0.92 6.91 4.94 72% 4.85 1.94
31 01 03 01
Expenditure related to information and communication technology equipment and services
20.20 9.82 0.00 0.00 4.59 34.61 24.76 72% 24.20 9.73
32 01 03
Expenditure related to information and communication technology equipment and services
3.48 1.73 0.00 0.00 0.79 6.00 4.30 72% 4.21 1.68
33 01 03
Expenditure related to information and communication technology equipment and services
1.86 0.88 0.00 0.00 0.42 3.16 2.25 71% 1.21 0.90
TOTAL 118.07 56.89 0.00 0.00 26.76 201.73 144.14 71% 140.53 56.86

80
Representation Offices O
ffici
al P
ositi
on
Des
crip
tion
Initi
al B
udge
t Pa
ymen
ts
Car
ryov
er fr
om
2012
BA
Tra
nsfe
rs
CO
M T
rans
fers
Ass
igne
d re
venu
e
Aut
horis
ed
Impl
emen
tatio
n 20
13
Rat
e
Impl
emen
tatio
n 20
12
Car
ryov
er to
201
4
16 01 02 03
Local staff of 'Communication' Directorate-General: Representation offices
16.26 0.17 0.00 1.65 0.10 18.18 17.81 98% 16.41 0.35
16 01 03 03
Buildings and related expenditure of 'Communication' Directorate-General: Representation offices
26.53 5.63 0.00 -1.41 0.56 31.31 25.19 80% 24.40 5.59
TOTAL 42.80 5.80 0.00 0.23 0.66 49.48 43.00 87% 40.81 5.94
External Relations Delegations
Offi
cial
Pos
ition
Des
crip
tion
Initi
al B
udge
t Pa
ymen
ts
Car
ryov
er fr
om
2012
BA
Tra
nsfe
rs
CO
M T
rans
fers
Ass
igne
d re
venu
e
Aut
horis
ed
Impl
emen
tatio
n 20
13
Rat
e
Impl
emen
tatio
n 20
12
Car
ryov
er to
201
4
19 01 02 12 Other management expenditure of 'External relations' delegations
0.44 0 0 0 0 0.44 0.43 98% 0.44 0.01
19 01 03 02 Buildings and related expenditure of 'External relations' delegations
3.61 0 0 0 0 3.61 3.61 100% 3.52 0
20 01 02 12 Other management expenditure of 'Trade' delegations
1.54 0.01 0 -0.01 0 1.54 1.51 98% 1.64 0.03
20 01 03 02 Buildings and related expenditure of 'Trade' delegations
12.77 0 0 0 0 12.77 12.77 100% 13.05 0
21 01 02 12
Other management expenditure of 'Development' delegations
4.28 0.02 0 -0.01 0 4.28 4.2 98% 4.34 0.07
21 01 03 02
Buildings and related expenditure of 'Development' delegations
35.42 0 0 0 0 35.42 35.42 100% 34.46 0
22 01 02 12
Other management expenditure of 'Enlargement' delegations
0.57 0 0 0 0 0.57 0.56 98% 0.67 0.01
22 01 03 02
Buildings and related expenditure of 'Enlargement' delegations
4.75 0 0 0 0 4.75 4.75 100% 5.35 0
TOTAL 63.37 0.03 0 -0.02 0 63.38 63.25 100% 63.49 0.11
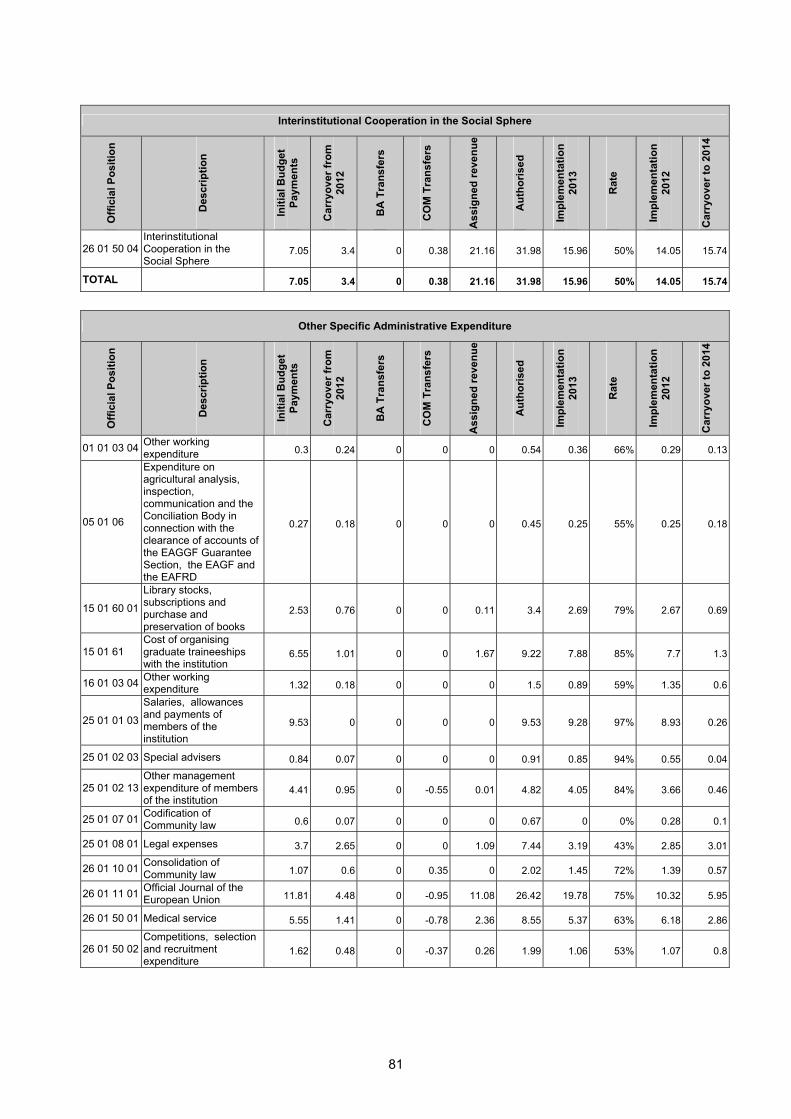
81
Interinstitutional Cooperation in the Social Sphere O
ffici
al P
ositi
on
Des
crip
tion
Initi
al B
udge
t Pa
ymen
ts
Car
ryov
er fr
om
2012
BA
Tra
nsfe
rs
CO
M T
rans
fers
Ass
igne
d re
venu
e
Aut
horis
ed
Impl
emen
tatio
n 20
13
Rat
e
Impl
emen
tatio
n 20
12
Car
ryov
er to
201
4
26 01 50 04 Interinstitutional Cooperation in the Social Sphere
7.05 3.4 0 0.38 21.16 31.98 15.96 50% 14.05 15.74
TOTAL 7.05 3.4 0 0.38 21.16 31.98 15.96 50% 14.05 15.74
Other Specific Administrative Expenditure
Offi
cial
Pos
ition
Des
crip
tion
Initi
al B
udge
t Pa
ymen
ts
Car
ryov
er fr
om
2012
BA
Tra
nsfe
rs
CO
M T
rans
fers
Ass
igne
d re
venu
e
Aut
horis
ed
Impl
emen
tatio
n 20
13
Rat
e
Impl
emen
tatio
n 20
12
Car
ryov
er to
201
4
01 01 03 04 Other working expenditure 0.3 0.24 0 0 0 0.54 0.36 66% 0.29 0.13
05 01 06
Expenditure on agricultural analysis, inspection, communication and the Conciliation Body in connection with the clearance of accounts of the EAGGF Guarantee Section, the EAGF and the EAFRD
0.27 0.18 0 0 0 0.45 0.25 55% 0.25 0.18
15 01 60 01
Library stocks, subscriptions and purchase and preservation of books
2.53 0.76 0 0 0.11 3.4 2.69 79% 2.67 0.69
15 01 61 Cost of organising graduate traineeships with the institution
6.55 1.01 0 0 1.67 9.22 7.88 85% 7.7 1.3
16 01 03 04 Other working expenditure 1.32 0.18 0 0 0 1.5 0.89 59% 1.35 0.6
25 01 01 03
Salaries, allowances and payments of members of the institution
9.53 0 0 0 0 9.53 9.28 97% 8.93 0.26
25 01 02 03 Special advisers 0.84 0.07 0 0 0 0.91 0.85 94% 0.55 0.04
25 01 02 13 Other management expenditure of members of the institution
4.41 0.95 0 -0.55 0.01 4.82 4.05 84% 3.66 0.46
25 01 07 01 Codification of Community law 0.6 0.07 0 0 0 0.67 0 0% 0.28 0.1
25 01 08 01 Legal expenses 3.7 2.65 0 0 1.09 7.44 3.19 43% 2.85 3.01
26 01 10 01 Consolidation of Community law 1.07 0.6 0 0.35 0 2.02 1.45 72% 1.39 0.57
26 01 11 01 Official Journal of the European Union 11.81 4.48 0 -0.95 11.08 26.42 19.78 75% 10.32 5.95
26 01 50 01 Medical service 5.55 1.41 0 -0.78 2.36 8.55 5.37 63% 6.18 2.86
26 01 50 02 Competitions, selection and recruitment expenditure
1.62 0.48 0 -0.37 0.26 1.99 1.06 53% 1.07 0.8

82
Other Specific Administrative Expenditure O
ffici
al P
ositi
on
Des
crip
tion
Initi
al B
udge
t Pa
ymen
ts
Car
ryov
er fr
om
2012
BA
Tra
nsfe
rs
CO
M T
rans
fers
Ass
igne
d re
venu
e
Aut
horis
ed
Impl
emen
tatio
n 20
13
Rat
e
Impl
emen
tatio
n 20
12
Car
ryov
er to
201
4
26 01 50 06
Institution officials temporarily assigned to national civil services, to international organisations or to public or private institutions or undertakings
0.25 0.05 0 0 0 0.3 0.2 65% 0.15 0.08
26 01 50 07 Damages 0.15 0.52 0 0 12 12.67 0.95 7% 3.93 11.72
26 01 50 08 Miscellaneous insurances 0.06 0.01 0 0 0 0.07 0.04 57% 0.04 0.03
26 01 50 09 Language courses 3.52 2.52 0 0 1.37 7.41 3.6 48% 3.7 3.57
27 01 04 Support expenditure for operations of Budget policy area
0.15 0.14 0 0 0 0.29 0.16 55% 0.15 0.1
27 01 12 01 Financial charges 0.39 0.2 0 0 0 0.59 0.29 49% 0.29 0.14
27 01 12 02
Coverage of expenditure incurred in connection with treasury management
0 0.04 0 0 0 0.04 0 0% 0 0
27 01 12 03
Purchase of financial information on the solvency of beneficiaries of European budget funds and of Commission debtors
0.13 0.06 0 0 0 0.19 0.13 70% 0.2 0.05
32 01 06 Euratom contribution for operation of the Supply Agency
0.1 0 0 0 0 0.1 0.1 100% 0.1 0
TOTAL 54.85 16.61 0 -2.3 29.96 99.12 62.56 63% 56.05 32.64
Other Operational Expenditure
Offi
cial
Pos
ition
Des
crip
tion
Initi
al B
udge
t Pa
ymen
ts
Car
ryov
er fr
om
2012
BA
Tra
nsfe
rs
CO
M T
rans
fers
Ass
igne
d re
venu
e
Aut
horis
ed
Impl
emen
tatio
n 20
13
Rat
e
Impl
emen
tatio
n 20
12
Car
ryov
er to
201
4
01 02 02 Coordination and surveillance of economic and monetary union
9.00 0.00 0.00 -0.10 0.06 8.96 8.62 96% 8.74 0.02
03 03 02
Damage requests resulting from legal procedures against the Commission's decisions in the field of competition policy
0.00 0.00 0.00 0.00 0.00 0.00 0.00 0% 0.00 0.00
16 02 04 Operation of radio and television studios and audiovisual equipment
5.55 0.00 0.00 -0.40 0.00 5.15 5.15 100% 6.75 0.00
16 02 06
Preparatory action - European research grants for cross-border investigative journalism
0.38 0.00 0.00 -0.19 0.00 0.19 0.08 45% 0.07 0.00
16 02 07 Pilot project - Connecting Europe 0.50 0.00 0.00 0.59 0.00 1.09 1.09 100% 0.15 0.00
16 03 02 02 European Public Spaces 1.30 0.00 0.00 0.00 0.00 1.30 1.26 97% 1.39 0.00
16 04 02 02 Online summary of legislation (SCAD+) 0.00 0.00 0.00 0.00 0.00 0.00 0.00 0% 0.34 0.00
16 04 04 Written publications for general use 2.10 0.00 0.00 0.00 0.00 2.10 2.10 100% 1.70 0.00

83
Other Operational Expenditure O
ffici
al P
ositi
on
Des
crip
tion
Initi
al B
udge
t Pa
ymen
ts
Car
ryov
er fr
om
2012
BA
Tra
nsfe
rs
CO
M T
rans
fers
Ass
igne
d re
venu
e
Aut
horis
ed
Impl
emen
tatio
n 20
13
Rat
e
Impl
emen
tatio
n 20
12
Car
ryov
er to
201
4
24 02 04
Pilot Project - Developing an EU Evaluation Mechanism in the area of Anti-Corruption with a particular focus on identifying and reducing the costs of corruption in Public Procurement involving EU Funds
0.00 0.75 0.00 0.19 0.00 0.94 0.94 100% 0.40 0.00
25 01 06 01 Impact Assessment Board 0.00 0.00 0.00 0.00 0.00 0.00 0.00 0% 0.00 0.00
25 01 09
Pilot Project – Interinstitutional system identifying long-term trends facing the EU
0.00 0.00 0.00 0.00 0.00 0.00 0.00 0% 0.15 0.00
25 01 10
Preparatory action – Interinstitutional system identifying long-term trends
1.25 0.22 0.00 0.00 0.00 1.47 1.26 86% 0.01 0.00
25 02 01 01 Historical archives of the European Union 2.27 0.06 0.00 0.00 0.00 2.33 2.31 99% 2.09 0.00
25 02 04 01 Documentary databases 0.76 0.12 -0.15 0.00 0.00 0.73 0.43 59% 0.75 0.27
25 02 04 02 Digital publications 0.98 0.24 -0.03 0.00 0.03 1.22 1.04 85% 1.24 0.06
26 01 12 Summaries of Union legislation 0.53 0.00 0.00 0.00 0.82 1.36 0.00 0% 0.00 1.36
26 03 02 PP Erasmus public administration programme
0.00 0.00 0.00 0.00 0.00 0.00 0.00 0% 0.00 0.00
26 03 03 PA Erasmus public administration programme
0.60 0.00 0.00 -0.17 0.00 0.43 0.41 95% 0.26 0.00
27 01 11 Exceptional crisis expenditure 0.00 0.00 0.00 0.00 0.00 0.00 0.00 0% 0.00 0.00
TOTAL 25.22 1.40 -0.18 -0.08 0.91 27.28 24.71 91% 24.06 1.71
Offices
Offi
cial
Pos
ition
Des
crip
tion
Initi
al B
udge
t Pa
ymen
ts
Car
ryov
er fr
om
2012
BA
Tra
nsfe
rs
CO
M T
rans
fers
Ass
igne
d re
venu
e
Aut
horis
ed
Impl
emen
tatio
n 20
13
Rat
e
Impl
emen
tatio
n 20
12
Car
ryov
er to
201
4
24 01 06 European Anti-fraud Office (OLAF) 53.73 8.16 3.93 0 0.03 65.85 55.47 84% 53.21 8.61
26 01 09 01 Publications Office 84.27 6.65 0 -2 13.4 102.32 88.94 87% 91.24 12.1
26 01 20 European Personnel Selection Office 28.54 6.68 0 -0.93 2.16 36.44 25.98 71% 27.81 10.08
26 01 21
Office for the Administration and Payment of Individual Entitlements
36.72 4.53 0 0 11.76 53.02 43.37 82% 39.7 9.56
26 01 22 01 Office for Infrastructure and Logistics in Brussels 69.46 3.94 0 -2.36 15.5 86.54 72.73 84% 73.32 13.53
26 01 23 01 Office for Infrastructure and Logistics in Luxembourg
25.19 1.3 0 -2.11 0.25 24.63 22.49 91% 24.09 2.04
TOTAL 297.9 31.26 3.93 -7.4 43.1 368.8 308.98 84% 309.37 55.91

84
Language Services
Offi
cial
Pos
ition
Des
crip
tion
Initi
al B
udge
t Pa
ymen
ts
Car
ryov
er fr
om
2012
BA
Tra
nsfe
rs
CO
M T
rans
fers
Ass
igne
d re
venu
e
Aut
horis
ed
Impl
emen
tatio
n 20
13
Rat
e
Impl
emen
tatio
n 20
12
Car
ryov
er to
201
4
31 01 03 04 Technical equipment for conference rooms 1.78 2.8 0 2.6 0 7.19 5.08 71% 1.41 2.05
31 01 06 01 Interpreting and conference expenditure 21.01 2.66 0 -2.17 54.34 75.84 49.15 65% 49.27 25.57
31 01 06 02 Training and further training of conference interpreters
0.42 0.38 0 0 1.15 1.95 0.99 50% 1.01 0.83
31 01 06 03
Information technology expenditure of the 'Interpretation' Directorate-General
1.26 1.04 0 0 3.2 5.49 3.06 56% 3.49 2.41
31 01 07 01 Support services for the 'Translation' Directorate-General
14 2.41 0 0.33 0.63 17.37 14.39 83% 12.94 2.95
31 01 07 02 Support expenditure for operations of 'Language services' policy area
1.72 1.38 0 -0.18 0 2.92 2.11 72% 1.78 0.76
31 01 08 01 Interinstitutional cooperation activities in the language field
0.67 0.51 0 0 0.62 1.81 0.99 55% 0.91 0.79
TOTAL 40.87 11.18 0 0.58 59.94 112.57 75.77 67% 70.81 35.36
B.7.3.2 Pensions
Pensions
Offi
cial
Pos
ition
Des
crip
tion
Initi
al B
udge
t Pa
ymen
ts
Car
ryov
er fr
om
2012
BA
Tra
nsfe
rs
CO
M T
rans
fers
Ass
igne
d re
venu
e
Aut
horis
ed
Impl
emen
tatio
n 20
13
Rat
e
Impl
emen
tatio
n 20
12
Car
ryov
er to
201
4
30 01 13 01 Temporary allowances 0.29 0 0 0.1 0 0.38 0.38 99% 1.82 0
30 01 13 02 Pensions of former members and surviving dependants
4.94 0 0 0.14 0 5.08 5.02 99% 4.47 0
30 01 13 03
Weightings and adjustments to pensions and various allowances
0.3 0 0 -0.1 0 0.2 0.2 100% 0.21 0
30 01 14 01
Allowances for staff assigned non-active status, retired in the interests of the service or dismissed
3.91 0 0 -1.37 0 2.54 2.54 100% 4.08 0
30 01 14 02 Insurance against sickness 0.13 0 0 -0.07 0 0.06 0.06 100% 0.1 0
30 01 14 03 Weightings and adjustments to allowances
0.1 0 0 -0.04 0 0.05 0.05 100% 0.07 0
30 01 15 01 Pensions. invalidity allowances and severance grants
1 304.59 0 0 14.88 1.43 1 320.90 1 317.31 100% 1 238.74 1.43
30 01 15 02 Insurance against sickness 43.28 0 0 -0.46 0 42.83 42.82 100% 40.14 0
30 01 15 03
Weightings and adjustments to pensions and allowances
41.93 0 0 -13.07 0 28.86 28.86 100% 28.21 0
TOTAL 1 399.47 0 0 0 1.43 1 400.90 1 397.24 100% 1 317.85 1.43
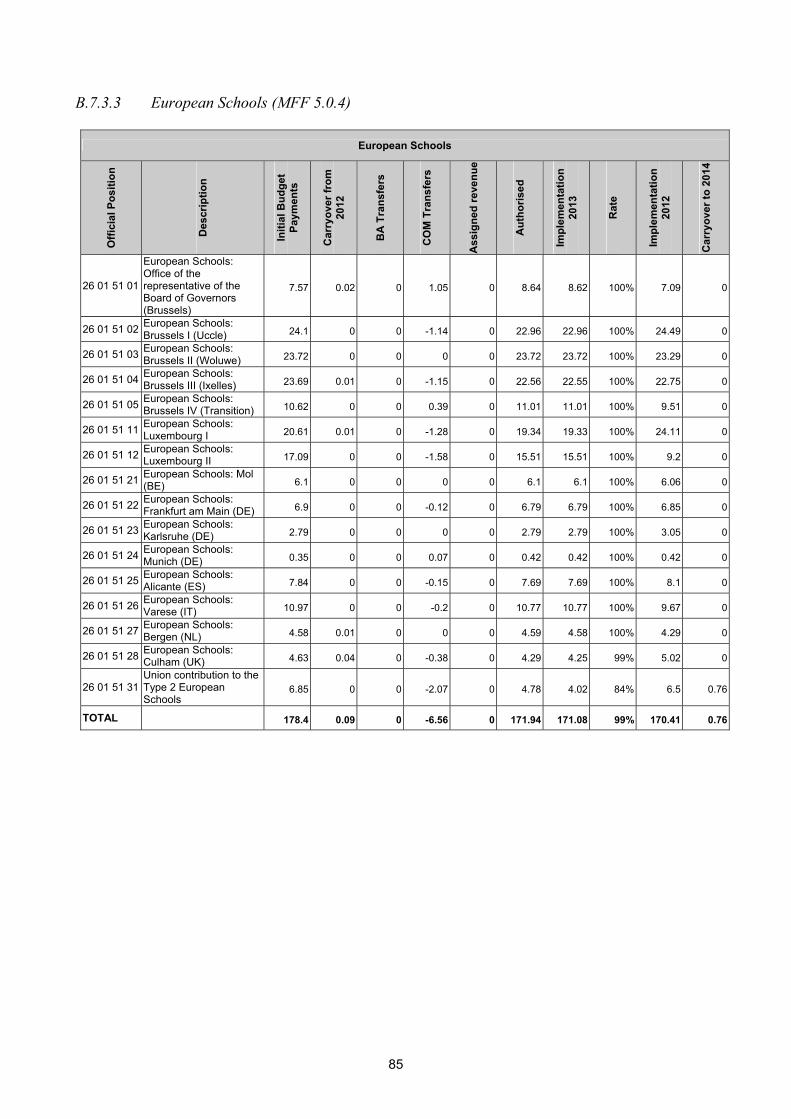
85
B.7.3.3 European Schools (MFF 5.0.4)
European Schools
Offi
cial
Pos
ition
Des
crip
tion
Initi
al B
udge
t Pa
ymen
ts
Car
ryov
er fr
om
2012
BA
Tra
nsfe
rs
CO
M T
rans
fers
Ass
igne
d re
venu
e
Aut
horis
ed
Impl
emen
tatio
n 20
13
Rat
e
Impl
emen
tatio
n 20
12
Car
ryov
er to
201
4
26 01 51 01
European Schools: Office of the representative of the Board of Governors (Brussels)
7.57 0.02 0 1.05 0 8.64 8.62 100% 7.09 0
26 01 51 02 European Schools: Brussels I (Uccle) 24.1 0 0 -1.14 0 22.96 22.96 100% 24.49 0
26 01 51 03 European Schools: Brussels II (Woluwe) 23.72 0 0 0 0 23.72 23.72 100% 23.29 0
26 01 51 04 European Schools: Brussels III (Ixelles) 23.69 0.01 0 -1.15 0 22.56 22.55 100% 22.75 0
26 01 51 05 European Schools: Brussels IV (Transition) 10.62 0 0 0.39 0 11.01 11.01 100% 9.51 0
26 01 51 11 European Schools: Luxembourg I 20.61 0.01 0 -1.28 0 19.34 19.33 100% 24.11 0
26 01 51 12 European Schools: Luxembourg II 17.09 0 0 -1.58 0 15.51 15.51 100% 9.2 0
26 01 51 21 European Schools: Mol (BE) 6.1 0 0 0 0 6.1 6.1 100% 6.06 0
26 01 51 22 European Schools: Frankfurt am Main (DE) 6.9 0 0 -0.12 0 6.79 6.79 100% 6.85 0
26 01 51 23 European Schools: Karlsruhe (DE) 2.79 0 0 0 0 2.79 2.79 100% 3.05 0
26 01 51 24 European Schools: Munich (DE) 0.35 0 0 0.07 0 0.42 0.42 100% 0.42 0
26 01 51 25 European Schools: Alicante (ES) 7.84 0 0 -0.15 0 7.69 7.69 100% 8.1 0
26 01 51 26 European Schools: Varese (IT) 10.97 0 0 -0.2 0 10.77 10.77 100% 9.67 0
26 01 51 27 European Schools: Bergen (NL) 4.58 0.01 0 0 0 4.59 4.58 100% 4.29 0
26 01 51 28 European Schools: Culham (UK) 4.63 0.04 0 -0.38 0 4.29 4.25 99% 5.02 0
26 01 51 31 Union contribution to the Type 2 European Schools
6.85 0 0 -2.07 0 4.78 4.02 84% 6.5 0.76
TOTAL 178.4 0.09 0 -6.56 0 171.94 171.08 99% 170.41 0.76

86
B.7.4 RAL Overview (million EUR)
RAL as at 01.01.2013
Payments on RAL
Commitments 2013
Payment on 2013
commitments Decommit-
ments RAL as at 31.12.2013 Evolution
Staff 0 0 1 970 1 970 0 0
External Staff 38 34 144 103 4 41 8%
Other Mgmt Exp. 55 47 147 90 8 56 2%
Buildings 80 76 459 362 3 98 1%
IT 57 55 139 87 1 52 -9%
Repr. Offices 6 5 43 38 1 6 0%
Delegations 0 0 63 63 0 0
Social Sphere 6 5 19 11 1 9 50%
Other SP. Admin 17 13 67 49 4 18 6%
Other OP. Admin 19 15 26 10 2 19 0%
Offices 32 27 317 282 4 35 9%
Lang. Services 11 10 75 66 1 9 -18%
Pensions 0 0 1 397 1 397 0 0
Schools 0 0 172 171 0 1
TOTAL 320 289 5 040 4 701 28 342 7%

87
B.8 HEADING 6: COMPENSATIONS
Implementation Table
Initial budget
Carryover from 2012
Amending budgets
BA transfers
COM transfers
Assigned revenue
Total appropria-
tions
Actual 2013 Rate Actual
2012 Carry-over to 2014
CA 0 0 75 0 0 0 75 75 100% 0 0
PA 0 0 75 0 0 0 75 75 100% 0 0
RAL as at 01.01.2013
Payments on RAL
Commitments 2013
Payments on 2013 commitments Decommitments 2013 RAL as at
31.12.2013 Evolution of the RAL
(%)
RAL 0 0 75 75 0 0 0%
The Cash-flow Facility, budget line 27 02 02 Temporary and lump-sum compensation for new Member States, is an instrument to help Croatia between the date of accession and the end of 2014 to improve cash-flow in the national budget. The amount of EUR 75 million in both commitment and payment appropriations was included in the 2013 Budget, through AB 1/2013, in accordance with article 32(2) of the Treaty of Accession.

88
PART C – Own Resources


91
C.1. BUDGET IMPLEMENTATION TABLE (EUR)
Own Resources Related to the Financial Year 2013
Title Chapter Budget Heading Budget 2013 Final20 Outturn 201321 Outturn 2012 Difference
Final Budget vs. Outturn
Outturn as % Outturn variation as %
(1) (2) (3) (4) = (2) - (1) (5) = (2) / (1) (6) = (2-3) / (3) 1 Own resources 1 1 - levies and other duties in the sugar sector -34 600 000 201 599 070 192 553 939 236 199 070 -582.66% 4.70% 1 2 - customs duties 14 857 300 000 15 163 722 762 16 260 836 002 306 422 762 102.06% -6.75% 1 3 - own resources accruing from VAT 14 680 052 250 14 542 019 379 14 648 213 839 -138 032 871 99.06% -0.72% 1 4 - own resources based on GNI 110 822 836 159 110 032 395 624 97 856 493 453 -790 440 535 99.29% 12.44%
1 5 - correction of budgetary imbalances granted to UK 0 165 645 823 -73 816 421 165 645 823 - -324.40%
1 6 - gross reduction in the annual GNI-based
contribution granted to the Netherlands and Sweden
0 -5 805 809 1 576 853 -5 805 809 - -468.19%
TOTAL 140 325 588 409 140 099 576 849 128 885 857 664 -226 011 560 99.84% 8.70%
20 The figures in this column correspond to those in the 2013 budget (OJ L 66, 08.03.2013, p.1) plus Amending Budgets No 1/2013 to No 9/2013. 21 Provisional amounts.

92
C.2 LEGAL BASIS
The basic rules of the system of the European Communities' own resources are laid down in Council Decision 2007/436/EC, Euratom.
Own resources are budgeted in Title 1 of the General Statement of Revenue22 (see also the table above) on the basis of a set of forecast data (see next section). The breakdown of the total amount of own resources by type of own resource and by Member State results from the application of the rules laid down in the Council Decision on own resources and its implementing regulations. According to the Decision the total amount of own resources cannot exceed 1.23 % of the gross national income (GNI) of the EU.
Own resources can be divided into the following categories:
• traditional own resources (customs duties and sugar levies);
• the VAT based resource;
• the GNI based resource ("the additional resource"). This resource ensures that total budgeted revenue equals total budgeted expenditure, as required by the principle of equilibrium of the EU budget. It is calculated as the difference between total expenditure and all other budgeted revenue, including the other own resources.
Finally, a gross reduction in the GNI based contributions for the Netherlands and Sweden and a specific mechanism for correcting budgetary imbalances in favour of the United Kingdom (the "UK correction") are also part of the own resources system.
22 The surplus of the previous exercise, which mainly results from the difference between own resources payments and
implemented expenditure of the previous year, is included in Title 3. That title is, however, not examined here.

93
C.3 THE BUDGETARY FORECAST OF OWN RESOURCES
The data necessary for establishing the budgetary forecast of own resources is discussed and adopted at the annual forecasting meeting of the Advisory Committee on Own Resources (ACOR)23. Representatives of the Commission and of Member States participate in the meeting.
The discussions concern the forecasts for the VAT and GNI bases and traditional own resources (customs duties and sugar levies). Furthermore, the Commission presents the results of its calculations of the UK correction, which is also a necessary element for establishing the own resources forecast. Both the forecasts for the draft budget 2014, as well as the updated forecasts for the year 2013 were adopted at the same meeting.
The Commission's forecasts of Member States' GNI and VAT bases are established on the basis of the spring economic forecasts from the Directorate- General for Economic and Financial Affairs, which have themselves been previously discussed with Member States' experts.
Sugar levies are forecasted by the Directorate-General for Agriculture in accordance with Article 51 of Council Regulation (EC) no 1234/2007. Customs duties are forecasted on the basis of the weighted average rate of customs duties applied to import forecasts from the Directorate-General for Economic and Financial Affairs' spring economic forecasts.
The forecasts mentioned above can be modified during the discussions with Member States at the ACOR meeting.
The updated data used for the 2013 own resources forecast were approved at the ACOR forecasts meeting of 16 May 2013 and budgeted in the Amending Budget No 6/2013. The Amending Letter to Amending Budget no 6/2013 updated the budget forecast for traditional own resources a second time on the basis of the trend in actual execution.
23 The ACOR is set up by Council Regulation No 1150/2000 of 22 May 2000 (Title VIII).

94
C.4 THE PROCESS OF ADOPTING THE BUDGET
According to the principle of equilibrium of the EU budget, the amounts of budget revenue and payment appropriations must be in balance.
The amount of expenditure in the adopted budget, signed by the President of the European Parliament on 12 December 2012, was fixed at EUR 132 837 million, which was EUR 4 960.6 million lower than the EUR 137 797.6 million in the DB, presented by the Commission in November 2012. In order to ensure equilibrium between budgeted revenue and expenditure this decrease was compensated by a decrease in the GNI-based resource, which is the "variable" resource that is used for balancing the budget. The forecast amounts of all other own resources remained the same as in the DB.
Budgetary adjustments
The revenue and expenditure estimates in the initial budget are subject to modifications during the budgetary year. Such modifications are budgeted in amending budgets. Adjustments in the Member States GNI-based own resources payments ensure that budgeted revenue exactly matches budgeted expenditure.
In 2013, altogether 9 amending budgets were adopted. Their impact on the revenue side of the 2013 budget is indicated in the next table.

95
Amending Budgets in 2013
Budget Date of Adoption Main Subject Total Revenue
2013 Difference
with Previous Budget
Total Amount of Own
Resources
Difference with Previous
Budget
Budget 2013 12/12/2012 - Final adoption budget 2013 132 836 987 855 131 288 020 848
AB 1/2013 04/07/2013 - Incorporation into the 2013 Budget of the amount of EUR 655.1 million in commitment appropriations and the amount of EUR 374 million in payment appropriations, necessary to cover expenditure related to the accession of the Republic of Croatia to the European Union on 1 July 2013, in full respect of the Treaty concerning the accession of the Republic of Croatia.
133 210 987 855 374 000 000 131 628 020 848 340 000 000
AB 2/2013 11/09/2013
- An increase in the forecast of other revenue stemming from fines and penalties, amounting to EUR 290 million. - An increase of payment appropriations of EUR 7.3 billion across headings 1a, 1b, 2, 3a, 3 b and 4 ofthe multi- annual financial framework (MFF). This is with the aim of meeting outstanding needs to theend of the year, so that obligations stemming from past and current commitments can be honoured,financial penalties avoided, and beneficiaries can receive the funds envisaged by the agreed EU policies, for which Parliament and Council authorised the related commitment appropriations in previous annual budgets. The requested additional payment appropriations will reduce the level of outstanding commitments ('reste à liquider', RAL) as well as the risk of rolling over onto 2014 abnormal levels of unpaid bills.
140 510 987 855 7 300 000 000 138 638 020 848 7 010 000 000
AB 3/2013 11/09/2013 - Budgeting the surplus resulting from the implementation of the budget year 2012. 140 510 987 855 0 137 614 744 322 -1 023 276 526
AB 4/2013 11/09/2013 - Modification of the establishment plan of the European GNSS Agency (GSA), the Education, Audiovisual and Culture Executive Agency (EACEA) and the Court of Justice of the European Union. 140 510 987 855 0 137 614 744 322 0
AB 5/2013 11/09/2013 - The mobilisation of the EU Solidarity Fund for an amount of EUR 14.6 million in commitment and payment appropriations relating to a flooding disaster in Slovenia, Croatia and Austria in autumn 2012. 140 525 595 797 14 607 942 137 629 352 264 14 607 942
AB 6/2013 24/10/2013
- A revision of the forecast of Traditional Own Resources (TOR, i.e. customs duties and sugar sector levies), VAT and GNI bases, the budgeting of the relevant UK corrections as well as their financing and revision of financing of GNI reductions in favour of the Netherlands and Sweden in 2013, resulting in a change in the distribution between Member States of their own resources contributions to the EUbudget. - A revision of the forecast of other revenue, arising from interest and fines of EUR 1 229 million. - Creation of the necessary budgetary structure to accommodate the creation of the Union trust funds foreseen in Article 187 of the Financial regulation.
140 525 595 797 0 136 400 352 264 -1 229 000 000
AB 7/2013 19/11/2013 - Increase of commitment appropriations of EUR 150 million in heading 1b of the multi-annual financial framework (MFF). This is with the aim of addressing certain issues resulting from the final outcome of the negotiations of the MFF for the years 2014-2020, affecting France, Italy and Spain.
140 525 595 797 0 136 400 352 264 0
AB 8/2013 19/11/2013
- Increase of payment appropriations of EUR 3.9 billion across headings 1a, 1b, 2, 3a, 3b and 4 of themulti-annual financial framework (MFF) to the overall level proposed already in DAB 2/2013. This is with the aim of meeting the outstanding needs to the end of the year, so that legal obligationsstemming from past and current commitments can be honoured, financial penalties avoided, and beneficiaries can receive the funds envisaged by the agreed EU policies, for which Parliament and Council authorised the related commitment appropriations in previous annual budgets. The requestedadditional payment appropriations will reduce the level of outstanding commitments ('reste à liquider', RAL) as well as the risk of rolling over onto 2014 abnormally high levels of unpaid bills.
144 450 831 942 3 925 236 145 140 325 588 409 3 925 236 145
AB 9/2013 20/11/2013 - Mobilisation of the EU Solidarity Fund for an amount of EUR 400.5 million in commitment appropriations in favour of Romania in relation to a drought and forest fires in summer 2012, and of Germany, Austria and the Czech Republic in relation to flooding in May and June 2013.
144 450 831 942 0 140 325 588 409 0

96
C.5 BUDGET FORECASTS TABLE 2013 VERSUS 2012 (EUR)
Own Resources Related to the Financial Year 2013
Title Chapter Budget Heading Budget 2013 Initial
Budget 2013 Final24
Budget 2012 Final25
Final Budget vs. Initial Budget
Variation as % (2013)
Variation as % (2013/2012)
(1) (2) (3) (4) = (2) - (1) (5) = (4) / (1) (6) = (2-3) / (3) 1 Own resources 1 1 - levies and other duties in the sugar sector 123 400 000 -34 600 000 123 400 000 -158 000 000 -128.04% -128.04% 1 2 - customs duties 18 631 800 000 14 857 300 000 16 700 800 000 -3 774 500 000 -20.26% -11.04% 1 3 - own resources accruing from VAT 15 029 949 025 14 680 052 250 14 546 298 300 -349 896 775 -2.33% 0.92% 1 4 - own resources based on GNI 97 502 871 823 110 822 836 159 97 284 221 855 13 319 964 336 13.66% 13.92%
1 5 - correction of budgetary imbalances granted to UK 0 0 0 0 - -
1 6 - gross reduction in the annual GNI-based
contribution granted to the Netherlands and Sweden
0 0 0 0 - -
TOTAL 131 288 020 848 140 325 588 409 128 654 720 155 9 037 567 561 6.88% 9.07%
24 The figures of the final budget correspond to those of the Amending Budget No 9/2013. 25 The figures of the final budget correspond to those of the Amending Budget No 6/2012.

97
C.6 BREAKDOWN OF THE TOTAL AMOUNT OF OWN RESOURCES BY MEMBER STATE (EUR)
Member State Initial budget 2013 Final budget 2013
Belgium 5 510 443 714 5 360 691 464
Bulgaria 437 005 538 465 090 646
Czech Republic 1 623 978 090 1 667 308 458
Denmark 2 728 158 040 2 909 676 774
Germany 26 174 240 845 28 460 345 880
Estonia 182 571 535 202 332 579
Ireland 1 416 171 908 1 597 761 402
Greece 1 973 386 637 1 947 195 924
Spain 10 869 016 894 11 706 721 941
France 21 917 307 737 23 379 234 618
Croatia - 243 663 459
Italy 16 512 541 084 17 423 919 791
Cyprus 190 155 310 183 182 769
Latvia 222 664 412 260 506 678
Lithuania 355 149 179 392 390 213
Luxembourg 320 298 436 358 346 941
Hungary 1 043 337 120 1 065 923 026
Malta 68 916 769 78 494 924
Netherlands 6 335 721 003 6 575 616 964
Austria 2 931 927 302 3 221 280 670
Poland 4 114 329 242 4 449 217 277
Portugal 1 659 021 566 1 791 626 445
Romania 1 406 654 949 1 541 861 261
Slovenia 415 588 866 423 930 053
Slovak Republic 796 759 213 826 992 378
Finland 2 088 482 791 2 229 090 757
Sweden 3 720 303 190 4 207 541 222
United Kingdom 16 273 889 478 17 355 643 895
Total 131 288 020 848 140 325 588 409
The figures of the final budget are those of the Amending Budget No 9/2013.

98
C.7 IMPLEMENTATION OF OWN RESOURCES
The custom duties collected amounted to 102.06% of the amounts forecasted. The budgetary estimates were modified by the Amending Budgets No 1/2013 and 6/2013 (they were first increased by EUR 22.4 million and later decreased by EUR 3.8 billion). These adjustments were based on the accession of the Republic of Croatia (AB no 1/2013), on the new macroeconomic forecasts of spring 2013 and on the evolution of the customs duties collection over the first eight months of the year (AB no 6/2013).
The Member States' VAT and GNI payments corresponded closely to the updated budgetary estimates. The difference are mainly explained by the differences in the euro rates used for budgetary purposes (see Article 10 (3) of Regulation No 1150/2000) and the rates in force at the time when the Member States (not part of the EMU) actually made their payments. The changes in the exchange rates during 2013 had a negative impact of EUR 138 million and EUR 790 million for VAT and GNI respectively.
The "UK correction" is financed by the other Member States, so there should be no net effect on the budget. However, a positive amount of EUR 166 million was registered. This was caused by differences in the exchange rates similar to those for the VAT/GNI resources.
The Netherlands and Sweden benefit from a gross reduction in their annual GNI-based contributions for the period 2007-2013. These amount to EUR 605 million and EUR 150 million, respectively, in 2004 prices, are adjusted to current prices by applying the GDP deflator for the EU expressed in Euro and are granted after financing of the UK correction. These gross reductions are also financed by all Member States, so there should be no net effect on the budget. However, a negative amount of EUR 5.8 million was registered, which was caused by differences in the exchange rates similar to those for the VAT/GNI resources.

ANNEXES


101
ANNEX I: SUMMARY INFORMATION ON 2013 TRANSFERS OF APPROPRIATIONS
KEY
H Financial Framework Heading
R Reserve
CA Commitment Appropriations
PA Payment Appropriations
Nr* Article/ Item H R Description CA PA
DEC 001 05 02 05 99 2 N Other measures (sugar) -754 958 586 -754 958 586 DEC 001 05 03 01 01 2 N SPS (single payment scheme) 754 958 586 754 958 586 DEC 002 04 05 01 1a N European Globalisation Adjustment Fund (EGF) 5 037 482 DEC 002 40 02 43 1a Y Reserve for the European Globalisation Adjustment Fund -5 037 482 DEC 003 04 05 01 1a N European Globalisation Adjustment Fund (EGF) 3 689 474 DEC 003 40 02 43 1a Y Reserve for the European Globalisation Adjustment Fund -3 689 474 DEC 004 04 05 01 1a N European Globalisation Adjustment Fund (EGF) 3 941 999 DEC 004 40 02 43 1a Y Reserve for the European Globalisation Adjustment Fund -3 941 999 DEC 005 23 02 01 4 N Humanitarian aid 12 000 000 3 500 000 DEC 005 40 02 42 4 Y Emergency aid reserve -12 000 000 -3 500 000 DEC 006 23 02 02 4 N Food aid 38 000 000 12 000 000 DEC 006 40 02 42 4 Y Emergency aid reserve -38 000 000 -12 000 000 DEC 007 23 02 01 4 N Humanitarian aid 65 000 000 19 500 000 DEC 007 40 02 42 4 Y Emergency aid reserve -65 000 000 -19 500 000
DEC 008 04 01 04 14 1a N European Globalisation Adjustment Fund (EGF) - Expenditure on administrative management 750 000 750 000
DEC 008 04 05 01 1a N European Globalisation Adjustment Fund (EGF) -750 000 DEC 008 40 02 43 1a Y Reserve for the European Globalisation Adjustment Fund -750 000
DEC 009 01 04 04 1a N Competitiveness and Innovation Framework Programme - Entrepreneurship and Innovation Programme 19 600 000
DEC 009 02 02 01 1a N Competitiveness and Innovation Framework Programme - Entrepreneurship and Innovation Programme -19 600 000
DEC 010 01 01 02 01 5 N External staff 154 516 154 516 DEC 010 01 01 02 11 5 N Other management expenditure 68 189 68 189 DEC 010 02 01 02 01 5 N External staff 23 039 23 039 DEC 010 02 01 02 11 5 N Other management expenditure 1 122 1 122 DEC 010 03 01 02 01 5 N External staff 30 902 30 902 DEC 010 03 01 02 11 5 N Other management expenditure 1 516 047 1 516 047 DEC 010 04 01 02 01 5 N External staff 20 284 20 284 DEC 010 04 01 02 11 5 N Other management expenditure 400 000 400 000 DEC 010 05 01 02 11 5 N Other management expenditure -201 066 -201 066 DEC 010 06 01 02 01 5 N External staff 12 723 12 723 DEC 010 06 01 02 11 5 N Other management expenditure 144 150 144 150 DEC 010 07 01 02 11 5 N Other management expenditure 259 937 259 937 DEC 010 08 01 02 01 5 N External staff 35 452 35 452 DEC 010 09 01 02 01 5 N External staff 18 525 18 525 DEC 010 11 01 02 01 5 N External staff 119 083 119 083 DEC 010 11 01 02 11 5 N Other management expenditure 118 900 118 900 DEC 010 12 01 02 01 5 N External staff 29 125 29 125 DEC 010 12 01 02 11 5 N Other management expenditure 170 312 170 312 DEC 010 13 01 02 01 5 N External staff 42 050 42 050 DEC 010 14 01 02 01 5 N External staff 463 053 463 053 DEC 010 15 01 02 11 5 N Other management expenditure -579 033 -579 033
DEC 010 16 01 02 01 5 N External staff of the Directorate-General for Communication: Headquarters 38 662 38 662
DEC 010 16 01 02 11 5 N Other management expenditure of the Directorate-General for Communication: Headquarters 622 730 622 730
DEC 010 17 01 02 01 5 N External staff 83 640 83 640 DEC 010 18 01 02 01 5 N External staff 157 608 157 608 DEC 010 19 01 02 01 5 N External staff of the 'Service for Foreign Policy Instruments' 17 383 17 383
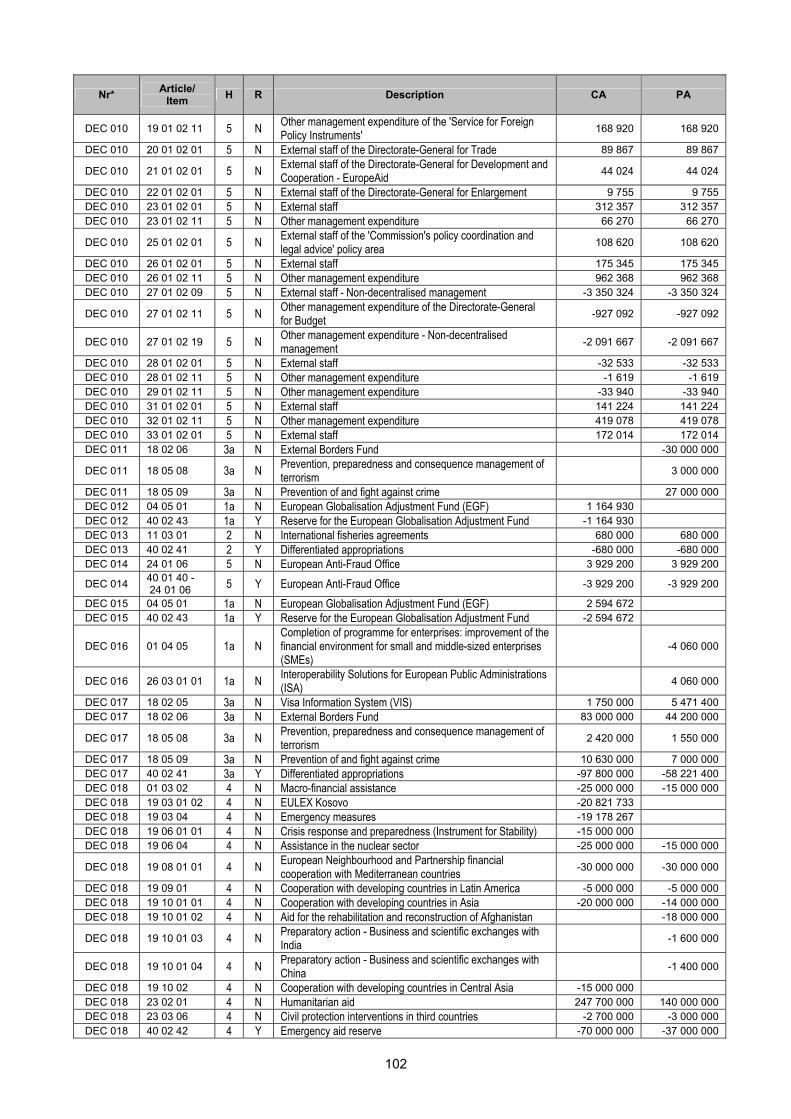
102
Nr* Article/ Item H R Description CA PA
DEC 010 19 01 02 11 5 N Other management expenditure of the 'Service for Foreign Policy Instruments' 168 920 168 920
DEC 010 20 01 02 01 5 N External staff of the Directorate-General for Trade 89 867 89 867
DEC 010 21 01 02 01 5 N External staff of the Directorate-General for Development and Cooperation - EuropeAid 44 024 44 024
DEC 010 22 01 02 01 5 N External staff of the Directorate-General for Enlargement 9 755 9 755 DEC 010 23 01 02 01 5 N External staff 312 357 312 357 DEC 010 23 01 02 11 5 N Other management expenditure 66 270 66 270
DEC 010 25 01 02 01 5 N External staff of the 'Commission's policy coordination and legal advice' policy area 108 620 108 620
DEC 010 26 01 02 01 5 N External staff 175 345 175 345 DEC 010 26 01 02 11 5 N Other management expenditure 962 368 962 368 DEC 010 27 01 02 09 5 N External staff - Non-decentralised management -3 350 324 -3 350 324
DEC 010 27 01 02 11 5 N Other management expenditure of the Directorate-General for Budget -927 092 -927 092
DEC 010 27 01 02 19 5 N Other management expenditure - Non-decentralised management -2 091 667 -2 091 667
DEC 010 28 01 02 01 5 N External staff -32 533 -32 533 DEC 010 28 01 02 11 5 N Other management expenditure -1 619 -1 619 DEC 010 29 01 02 11 5 N Other management expenditure -33 940 -33 940 DEC 010 31 01 02 01 5 N External staff 141 224 141 224 DEC 010 32 01 02 11 5 N Other management expenditure 419 078 419 078 DEC 010 33 01 02 01 5 N External staff 172 014 172 014 DEC 011 18 02 06 3a N External Borders Fund -30 000 000
DEC 011 18 05 08 3a N Prevention, preparedness and consequence management of terrorism 3 000 000
DEC 011 18 05 09 3a N Prevention of and fight against crime 27 000 000 DEC 012 04 05 01 1a N European Globalisation Adjustment Fund (EGF) 1 164 930 DEC 012 40 02 43 1a Y Reserve for the European Globalisation Adjustment Fund -1 164 930 DEC 013 11 03 01 2 N International fisheries agreements 680 000 680 000 DEC 013 40 02 41 2 Y Differentiated appropriations -680 000 -680 000 DEC 014 24 01 06 5 N European Anti-Fraud Office 3 929 200 3 929 200
DEC 014 40 01 40 - 24 01 06 5 Y European Anti-Fraud Office -3 929 200 -3 929 200
DEC 015 04 05 01 1a N European Globalisation Adjustment Fund (EGF) 2 594 672 DEC 015 40 02 43 1a Y Reserve for the European Globalisation Adjustment Fund -2 594 672
DEC 016 01 04 05 1a N Completion of programme for enterprises: improvement of the financial environment for small and middle-sized enterprises (SMEs)
-4 060 000
DEC 016 26 03 01 01 1a N Interoperability Solutions for European Public Administrations (ISA) 4 060 000
DEC 017 18 02 05 3a N Visa Information System (VIS) 1 750 000 5 471 400 DEC 017 18 02 06 3a N External Borders Fund 83 000 000 44 200 000
DEC 017 18 05 08 3a N Prevention, preparedness and consequence management of terrorism 2 420 000 1 550 000
DEC 017 18 05 09 3a N Prevention of and fight against crime 10 630 000 7 000 000 DEC 017 40 02 41 3a Y Differentiated appropriations -97 800 000 -58 221 400 DEC 018 01 03 02 4 N Macro-financial assistance -25 000 000 -15 000 000 DEC 018 19 03 01 02 4 N EULEX Kosovo -20 821 733 DEC 018 19 03 04 4 N Emergency measures -19 178 267 DEC 018 19 06 01 01 4 N Crisis response and preparedness (Instrument for Stability) -15 000 000 DEC 018 19 06 04 4 N Assistance in the nuclear sector -25 000 000 -15 000 000
DEC 018 19 08 01 01 4 N European Neighbourhood and Partnership financial cooperation with Mediterranean countries -30 000 000 -30 000 000
DEC 018 19 09 01 4 N Cooperation with developing countries in Latin America -5 000 000 -5 000 000 DEC 018 19 10 01 01 4 N Cooperation with developing countries in Asia -20 000 000 -14 000 000 DEC 018 19 10 01 02 4 N Aid for the rehabilitation and reconstruction of Afghanistan -18 000 000
DEC 018 19 10 01 03 4 N Preparatory action - Business and scientific exchanges with India -1 600 000
DEC 018 19 10 01 04 4 N Preparatory action - Business and scientific exchanges with China -1 400 000
DEC 018 19 10 02 4 N Cooperation with developing countries in Central Asia -15 000 000 DEC 018 23 02 01 4 N Humanitarian aid 247 700 000 140 000 000 DEC 018 23 03 06 4 N Civil protection interventions in third countries -2 700 000 -3 000 000 DEC 018 40 02 42 4 Y Emergency aid reserve -70 000 000 -37 000 000

103
Nr* Article/ Item H R Description CA PA
DEC 019 23 02 01 4 N Humanitarian aid 15 000 000 8 000 000 DEC 019 40 02 42 4 Y Emergency aid reserve -15 000 000 -8 000 000 DEC 020 18 02 04 3a N Schengen information system (SIS II) 12 750 000 7 500 000 DEC 020 40 02 41 3a Y Differentiated appropriations -12 750 000 -7 500 000 DEC 021 19 03 01 02 4 N EULEX Kosovo -214 000 DEC 021 19 03 02 4 N Non-proliferation and disarmament -451 000 DEC 021 19 03 04 4 N Emergency measures -12 210 178 DEC 021 19 03 05 4 N Preparatory and follow-up measures -1 900 000 DEC 021 19 03 06 4 N European Union Special Representatives -224 822 DEC 021 19 04 03 4 N Electoral observation -6 000 000 DEC 021 19 06 01 01 4 N Crisis response and preparedness (Instrument for Stability) 21 000 000
DEC 022 05 05 02 4 N Instrument for Pre-accession Assistance for Rural Development (IPARD) -18 000 000
DEC 022 22 02 01 4 N Transition and institution-building assistance to candidate countries 18 000 000
DEC 023 11 03 01 2 N International fisheries agreements 1 350 000 1 350 000 DEC 023 40 02 41 2 Y Differentiated appropriations -1 350 000 -1 350 000 DEC 024 12 04 02 01 1a N European Banking Authority - Contribution to Titles 1 and 2 1 500 000 1 500 000 DEC 024 40 02 41 1a Y Differentiated appropriations -1 500 000 -1 500 000 DEC 025 12 02 01 1a N Implementation and development of the internal market 1 500 000 1 500 000 DEC 025 40 02 41 1a Y Differentiated appropriations -1 500 000 -1 500 000
DEC 026 01 02 04 1a N Prince - Communication on the economic and monetary union, including the euro -753 676
DEC 026 01 03 02 4 N Macro-financial assistance -30 790 007
DEC 026 01 04 05 1a N Completion of programme for enterprises: improvement of the financial environment for small and middle-sized enterprises (SMEs)
7 861 000
DEC 026 04 04 15 1a N European Progress Microfinance Facility -1 639 000 DEC 026 05 02 10 02 2 N Promotion measures - Direct payments by the Union -112 000
DEC 026 05 02 17 04 2 N Preparatory action - European farm prices and margins observatory -1 000 000
DEC 026 05 04 03 01 2 N Preparatory action - Union plant and animal genetic resources -600 000
DEC 026 05 04 05 02 2 N Operational technical assistance -750 000 DEC 026 05 04 05 03 2 N Pilot project - Exchange programme for young farmers -750 000
DEC 026 05 05 02 4 N Instrument for Pre-accession Assistance for Rural Development (IPARD) -983 843
DEC 026 05 06 01 4 N International agricultural agreements -2 006 853 DEC 026 05 08 01 2 N Farm Accountancy Data Network (FADN) -186 531
DEC 026 05 08 10 2 N Pilot project - Assessing end-user costs of compliance with Union legislation in the fields of environment, animal welfare and food safety
-29 364
DEC 026 06 06 02 01 1a N Research related to transport (including aeronautics) 5 150 000
DEC 026 07 12 01 2 N Implementation of Union policy and legislation on climate action -1 500 000
DEC 026 08 05 01 1a N Cooperation - Energy 4 527 449 DEC 026 08 07 01 1a N Cooperation - Transport (including aeronautics) -20 425 000
DEC 026 08 22 03 02 1a N Completion of the sixth Euratom framework programme (2003 to 2006) -780 000
DEC 026 09 04 01 01 1a N Support for research cooperation in the area of information and communication technologies (ICTs - Cooperation) 7 066 426
DEC 026 11 02 01 01 2 N Intervention in fishery products - New measures -2 947 624
DEC 026 11 02 01 04 2 N Pilot project - Establishment of a single instrument for commercial designations for fishery and aquaculture products -200 000
DEC 026 11 04 01 2 N Closer dialogue with the fishing industry and those affected by the common fisheries policy -981 114
DEC 026 11 09 05 2 N Programme to support the further development of an integrated maritime policy (IMP) -4 214 830
DEC 026 11 09 06 2 N Preparatory action - Guardians of the Sea -75 500 DEC 026 12 02 01 1a N Implementation and development of the internal market 1 590 811 DEC 026 16 02 02 3b N Multimedia actions -2 500 000 DEC 026 17 03 12 2 N Pilot project - Healthy diet: early years and ageing population -400 000
DEC 026 17 03 13 2 N Pilot project - Developing and implementing successful prevention strategies for type 2 diabetes -200 000
DEC 026 17 03 14 2 N Preparatory action - Antimicrobial resistance (AMR): -200 000

104
Nr* Article/ Item H R Description CA PA
Research on the causes of high and improper antibiotic usage
DEC 026 17 03 19 2 N Preparatory action - Fruit and vegetable consumption -500 000
DEC 026 17 04 02 01 2 N Other measures in the veterinary, animal welfare and public health field - New measures -2 000 000
DEC 026 17 04 03 01 2 N Emergency fund for veterinary complaints and other animal contaminations which are a risk to public health - New measures
-5 500 000
DEC 026 21 06 07 4 N Banana accompanying measures -6 738 204 DEC 026 23 02 01 4 N Humanitarian aid 69 250 719 DEC 026 23 02 02 4 N Food aid 9 000 000 DEC 026 23 02 03 4 N Disaster preparedness 875 984 DEC 026 23 03 06 4 N Civil protection interventions in third countries -753 843 DEC 026 25 02 04 01 5 N Documentary databases -150 000 DEC 026 25 02 04 02 5 N Digital publications -25 000
DEC 026 26 02 01 1a N Procedures for awarding and advertising public supply, works and service contracts -4 200 000
DEC 026 32 06 01 1a N Research related to energy -11 050 000 DEC 026 32 06 04 02 1a N Completion of the sixth framework programme (2003 to 2006) -3 880 000 DEC 026 33 02 05 3a N Fight against violence (Daphne) 4 000 000 DEC 026 33 02 10 3a N Pilot project - European Centre for Press and Media Freedom -500 000 DEC 027 04 05 01 1a N European Globalisation Adjustment Fund (EGF) 840 000 DEC 027 40 02 43 1a Y Reserve for the European Globalisation Adjustment Fund -840 000 DEC 028 04 05 01 1a N European Globalisation Adjustment Fund (EGF) 6 364 643 DEC 028 40 02 43 1a Y Reserve for the European Globalisation Adjustment Fund -6 364 643 DEC 030 11 02 01 01 2 N Intervention in fishery products - New measures 5 000 000
DEC 030 17 04 01 01 2 N Animal disease eradication and monitoring programmes and monitoring of the physical conditions of animals that could pose a public health risk linked to an external factor - New measures
-5 000 000
DEC 031 04 05 01 1a N European Globalisation Adjustment Fund (EGF) 9 810 000 DEC 031 40 02 43 1a Y Reserve for the European Globalisation Adjustment Fund -9 810 000 DEC 032 04 05 01 1a N European Globalisation Adjustment Fund (EGF) 2 305 357 DEC 032 40 02 43 1a Y Reserve for the European Globalisation Adjustment Fund -2 305 357
DEC 033 01 04 04 1a N Competitiveness and Innovation Framework Programme - Entrepreneurship and Innovation Programme 9 373 657
DEC 033 09 02 02 01 1a N Safer Internet programme -199 328
DEC 033 09 02 04 02 1a N Body of European Regulators for Electronic Communications (BEREC) - Office - Contribution to Title 3 -154 519
DEC 033 12 02 06 1a N Pilot project - The promotion of employee ownership and participation -204 751
DEC 033 26 02 01 1a N Procedures for awarding and advertising public supply, works and service contracts -7 000 000
DEC 033 29 02 04 1a N Modernisation of European Enterprise and Trade Statistics (MEETS) -1 815 059
DEC 034 05 05 02 4 N Instrument for Pre-accession Assistance for Rural Development (IPARD) -7 285 467
DEC 034 22 02 01 4 N Transition and institution-building assistance to candidate countries 7 285 467
DEC 035 05 04 05 02 2 N Operational technical assistance -4 500 000 DEC 035 05 06 01 4 N International agricultural agreements -3 500 000
DEC 035 07 02 01 4 N Contribution to multilateral and international environment and climate agreements -400 000
DEC 035 07 03 07 2 N LIFE+ (Financial Instrument for the Environment - 2007 to 2013) -400 000
DEC 035 07 12 01 2 N Implementation of Union policy and legislation on climate action -200 000
DEC 035 17 03 19 2 N Preparatory action - Fruit and vegetable consumption -1 000 000
DEC 035 17 04 01 01 2 N Animal disease eradication and monitoring programmes and monitoring of the physical conditions of animals that could pose a public health risk linked to an external factor - New measures
-5 000 000
DEC 035 17 04 04 01 2 N Plant-health measures - New measures -3 000 000
DEC 035 18 03 04 3a N Emergency measures in the event of mass influxes of refugees 18 000 000

105
Nr* Article/ Item H R Description CA PA
DEC 036 19 03 04 4 N Emergency measures -8 000 000 DEC 036 19 06 01 01 4 N Crisis response and preparedness (Instrument for Stability) 8 000 000 DEC 038 11 03 01 2 N International fisheries agreements 70 000 000 67 000 000 DEC 038 40 02 41 2 Y Differentiated appropriations -70 000 000 -67 000 000 DEC 040 11 03 02 2 N Contributions to international organisations -485 000
DEC 040 11 07 02 2 N Support for the management of fishery resources (improvement of scientific advice) 485 000
DEC 041 11 03 01 2 N International fisheries agreements 332 087 332 087 DEC 041 40 02 41 2 Y Differentiated appropriations -332 087 -332 087 DEC 042 05 02 08 11 2 N Aid to producer groups for preliminary recognition 17 750 000 17 750 000 DEC 042 05 03 02 21 2 N Aid for olive groves -1 700 000 -1 700 000 DEC 042 05 03 02 26 2 N Area payments for nuts -1 150 000 -1 150 000 DEC 042 05 03 02 36 2 N Payments for specific types of farming and quality production -2 600 000 -2 600 000 DEC 042 05 03 02 99 2 N Other (direct aids) -11 400 000 -11 400 000
DEC 042 05 04 01 14 2 N Rural development financed by the EAGGF Guarantee Section - Programming period 2000 to 2006 -900 000 -900 000
DEC 044 01 03 02 4 N Macro-financial assistance -30 000 000 DEC 044 23 02 01 4 N Humanitarian aid 30 000 000
DEC 045 02 04 04 02 1a N Completion of the sixth Community framework programme (2003 to 2006) -101 945
DEC 045 04 02 19 1b N European Social Fund (ESF) - Regional competitiveness and employment 28 919 038
DEC 045 04 03 03 01 1a N Industrial relations and social dialogue -1 000 000
DEC 045 04 03 03 03 1a N Information, consultation and participation of representatives of undertakings -2 500 000
DEC 045 04 03 04 1a N EURES (European Employment Services) -3 700 000
DEC 045 04 03 05 1a N Free movement of workers, coordination of social security systems and measures for migrants, including migrants from third countries
-400 000
DEC 045 04 03 10 1a N Pilot project - Measures for employment maintenance -200 000
DEC 045 04 03 11 1a N Pilot project - Enhancing mobility and integration of workers within the Union -30 000
DEC 045 04 03 12 1a N Pilot project - All-inclusive cooperation between public authorities, commercial firms and not-for-profit enterprises on integrating people into society and employment
-137 633
DEC 045 04 03 13 1a N Preparatory action - Your first EURES Job -383 226
DEC 045 04 03 16 1a N Preparatory action - Information centres for posted workers and migrant workers -250 000
DEC 045 04 04 01 01 1a N Employment -3 600 000 DEC 045 04 04 01 02 1a N Social protection and inclusion -3 100 000 DEC 045 04 04 01 03 1a N Working conditions -1 100 000 DEC 045 04 04 07 1a N Completion of previous programmes -191 693
DEC 045 04 04 08 1a N Pilot project - Encourage conversion of precarious work into work with rights -186 721
DEC 045 04 04 11 1a N Pilot project - Preventing elder abuse -131 854
DEC 045 04 04 12 1a N European Year for Combating Poverty and Social Exclusion 2010 -444 789
DEC 045 04 04 17 1a N Preparatory action - Activation measures targeting young people - implementing the 'Youth on the Move' initiative -553 425
DEC 045 04 04 18 1a N Preparatory action - Social innovation driven by social business and young entrepreneurship -500 000
DEC 045 04 05 01 1a N European Globalisation Adjustment Fund (EGF) -8 839 604 DEC 045 05 02 10 02 2 N Promotion measures - Direct payments by the Union -63 000
DEC 045 05 05 02 4 N Instrument for Pre-accession Assistance for Rural Development (IPARD) -517 960
DEC 045 05 08 01 2 N Farm Accountancy Data Network (FADN) -100 000 DEC 045 05 08 03 2 N Restructuring of systems for agricultural surveys -58 000
DEC 045 07 02 01 4 N Contribution to multilateral and international environment and climate agreements -61 421
DEC 045 07 02 04 4 N Preparatory action - Environmental monitoring of the Black Sea Basin and a common European framework programme for development of the Black Sea region
-29 699
DEC 045 07 12 01 2 N Implementation of Union policy and legislation on climate action -1 800 000
DEC 045 11 03 01 2 N International fisheries agreements -30 274
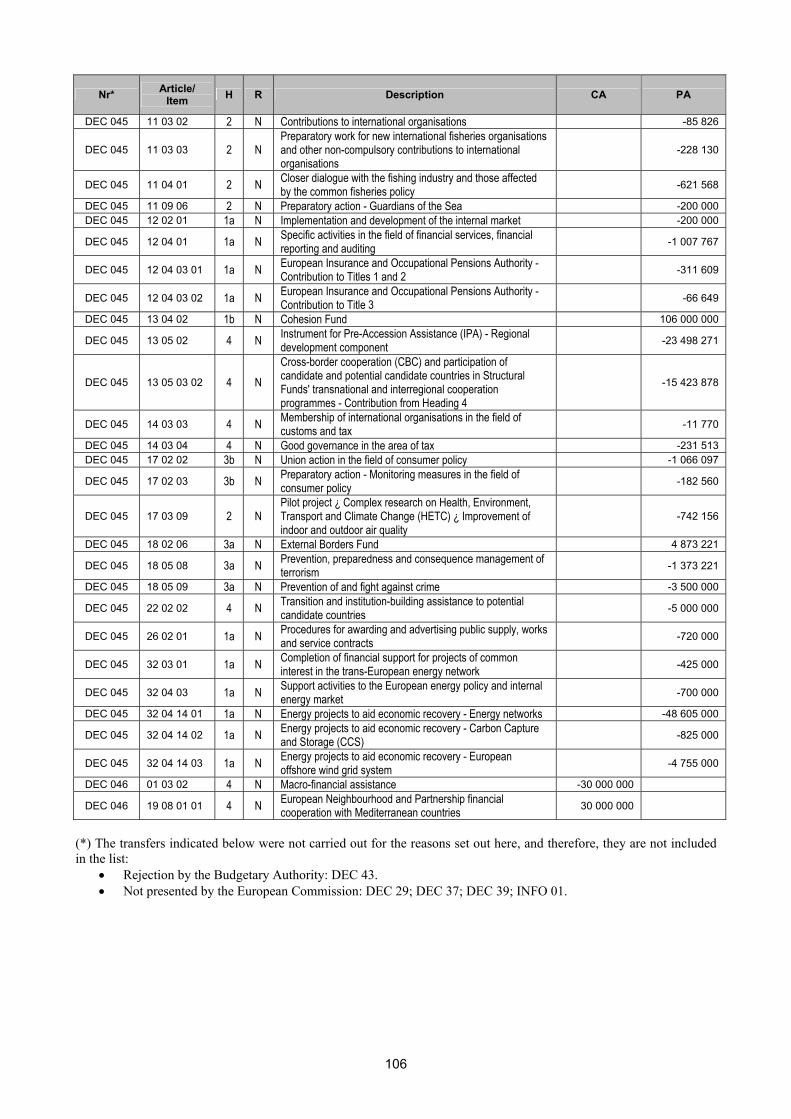
106
Nr* Article/ Item H R Description CA PA
DEC 045 11 03 02 2 N Contributions to international organisations -85 826
DEC 045 11 03 03 2 N Preparatory work for new international fisheries organisations and other non-compulsory contributions to international organisations
-228 130
DEC 045 11 04 01 2 N Closer dialogue with the fishing industry and those affected by the common fisheries policy -621 568
DEC 045 11 09 06 2 N Preparatory action - Guardians of the Sea -200 000 DEC 045 12 02 01 1a N Implementation and development of the internal market -200 000
DEC 045 12 04 01 1a N Specific activities in the field of financial services, financial reporting and auditing -1 007 767
DEC 045 12 04 03 01 1a N European Insurance and Occupational Pensions Authority - Contribution to Titles 1 and 2 -311 609
DEC 045 12 04 03 02 1a N European Insurance and Occupational Pensions Authority - Contribution to Title 3 -66 649
DEC 045 13 04 02 1b N Cohesion Fund 106 000 000
DEC 045 13 05 02 4 N Instrument for Pre-Accession Assistance (IPA) - Regional development component -23 498 271
DEC 045 13 05 03 02 4 N Cross-border cooperation (CBC) and participation of candidate and potential candidate countries in Structural Funds' transnational and interregional cooperation programmes - Contribution from Heading 4
-15 423 878
DEC 045 14 03 03 4 N Membership of international organisations in the field of customs and tax -11 770
DEC 045 14 03 04 4 N Good governance in the area of tax -231 513 DEC 045 17 02 02 3b N Union action in the field of consumer policy -1 066 097
DEC 045 17 02 03 3b N Preparatory action - Monitoring measures in the field of consumer policy -182 560
DEC 045 17 03 09 2 N Pilot project ¿ Complex research on Health, Environment, Transport and Climate Change (HETC) ¿ Improvement of indoor and outdoor air quality
-742 156
DEC 045 18 02 06 3a N External Borders Fund 4 873 221
DEC 045 18 05 08 3a N Prevention, preparedness and consequence management of terrorism -1 373 221
DEC 045 18 05 09 3a N Prevention of and fight against crime -3 500 000
DEC 045 22 02 02 4 N Transition and institution-building assistance to potential candidate countries -5 000 000
DEC 045 26 02 01 1a N Procedures for awarding and advertising public supply, works and service contracts -720 000
DEC 045 32 03 01 1a N Completion of financial support for projects of common interest in the trans-European energy network -425 000
DEC 045 32 04 03 1a N Support activities to the European energy policy and internal energy market -700 000
DEC 045 32 04 14 01 1a N Energy projects to aid economic recovery - Energy networks -48 605 000
DEC 045 32 04 14 02 1a N Energy projects to aid economic recovery - Carbon Capture and Storage (CCS) -825 000
DEC 045 32 04 14 03 1a N Energy projects to aid economic recovery - European offshore wind grid system -4 755 000
DEC 046 01 03 02 4 N Macro-financial assistance -30 000 000
DEC 046 19 08 01 01 4 N European Neighbourhood and Partnership financial cooperation with Mediterranean countries 30 000 000
(*) The transfers indicated below were not carried out for the reasons set out here, and therefore, they are not included in the list:
• Rejection by the Budgetary Authority: DEC 43. • Not presented by the European Commission: DEC 29; DEC 37; DEC 39; INFO 01.

107
ANNEX II CONSOLIDATED COMMUNITY ENTITLEMENTS GROUPED ACCORDING TO THE DATE OF ISSUE OF THE RECOVERY ORDER
Pursuant to Article 84 § 3 of the implementing rules of the Financial Regulation, the Accounting Officer of the Commission shall prepare a consolidated list of Community entitlements grouped according to the date of issue of the recovery order. This list is based on the information provided by the accounting officer of each institution and is added to the Commission's Report on budgetary and financial management. This provision having been introduced by Commission Regulation 478/2007 of 23 April 2007, the seventh list is published hereafter. It consists of the number of open recovery orders at 31 December 2013 by year of origin and amounts. The recovery orders between institutions are not reported.
According to the Financial Regulation, the accounting officer of each institution concerned has to follow up any recovery order that is not reimbursed by the deadline for payment. This follow up consists in reminders, formal notices and, whenever possible, offsetting or call of any guarantee. If this pre-litigation phase is not successful, the accounting officer takes legal action before the competent court or recovers by means of a decision which shall be enforceable within the meaning of Article 256 of the EC Treaty. The nature of the entitlements consists essentially of recovery of undue payments, fines and own resources. (million EUR)
Year of Origin Number of open recovery
orders at 31.12.2013
Amount of the open balance of recovery orders at 31.12.2013
2013 1 485 1 424
2012 374 1 805
2011 276 209
2010 188 922
2009 165 166
2008 144 958
2007 65 247
2006 55 88
2005 59 122
2004 41 30
2003 62 7
2002 29 3
2001 22 2
2000 9 2
<=2000 47 10
TOTAL 3 021 5 995

108
ANNEX III: ABSORPTION OF OLDEST OUTSTANDING COMMITMENTS IN 2013
The basis of the regular monitoring of the oldest outstanding commitments to be kept open in the EU accounts is the Joint Declaration of November 2002 concluded by the Budget Authority and the Commission. The objective was to bring the situation regarding outstanding commitments under control by the end of 2003 by specifically examining the "potentially abnormal" outstanding commitments and to eliminate all cases identified as unjustified.
"Potentially Abnormal RAL (PAR)" was defined in the Declarations as:
• Dormant commitments in respect of which no payment has been made for the last two financial years. and
• Old commitments that have been in the accounts for at least five financial years.
The declaration defines the category of commitments to be monitored. However, it has become clear that in the context of in the normal life cycle of the EU expenditure the criteria do not create a threshold which reliably separates justified old and dormant commitments from abnormal ones. Current monitoring concentrates on old commitments. The objective of the exercise is to assist the Commission services in identifying both unjustified cases, so that they can de-committed, and also justified (still ongoing) cases in order to accelerate their settlement.
The absorption of the RAL is the ultimate objective, but the actual absorption rate is not a satisfactory indicator when the target group contains also normal commitments. A good absorption rate might indicate that easy cases have been kept open in the accounts too long. A very low absorption rate could reflect the situation where all simple cases have been settled long ago and only extremely complicated cases are left.
The following tables illustrate some general absorption trends of the commitments made before the programming period 2007-2013 and show the amounts involved in comparison to the total RAL of EUR 221.9 billion.
At the beginning of the year 2013, the open amount of these commitments was EUR 9 386 million, which represented 4.3% of the total RAL. This was reduced to EUR 4 032 million (absorption rate of 57%) during 2013. In the PAR exercise in April 2013, services classified some 95% of open amounts (but only some half of the volume of cases) as related to normal or ongoing commitments. In spite of their high age, their settlement follows the general pattern of all outstanding commitments.
The commitments are broken down to three age categories (pre-2005, 2005 and 2006 commitments) enabling comparisons with the previous year. The share of normal or ongoing commitments is very similar in all these categories, the share of dispute cases being slightly higher in the oldest category. Table 1 gives the four year absorption profile of pre-2005 commitments, table 2 a three year profile of 2005 commitments and table 3 the absorption of 2006 commitments in 2013. Absorption rates per service are not presented, as the breakdown between normal cases/dispute cases/contracts which can be closed varies considerably.
The tables show that the absorption rate is highest for 2006 commitments. They represented 4/5 of open amounts at the beginning of the year. The ongoing phasing-out process of old Cohesion programmes particularly affects 2006 commitments, whereas 2005 commitments follow the same pattern as older commitments.

109
Table 1: Absorption trend of pre-2005 commitments (million EUR)
Service Open at 31.12.2010
Open at 31.12.2011
Open at 31.12.2012
Remaining as at 31.12.2013
AGRI 6.1 6.0 6.0 0.5
DEVCO 246.0 141.3 68.9 34.6
EAC 18.7 5.1 0.3 0.1
EACEA 0.6 0.3 0.1 0.1
ECFIN 26.2 26.2 23.8 21.8
ELARG 30.9 11.2 5.5 3.0
EMPL 162.1 108.7 100.4 53.4
ENER 5.5 2.5 0.6 0.5
ENTR 4.9 1.3 0.5 0
ENV 9.4 2.8 1.2 0.2
ESTAT 1.7 1.6 1.6 1.5
RELEX/FPIS 5.5 2.5 0.1 0
HOME 3.1 1.3 0.1 0
INFSO 18.5 11.5 4.4 1.3
JRC 0.5 0.2 0.17 0.1
MARE 40.4 33.3 33.1 31.2
MOVE 5.7 2.4 0.8 0.4
PMO/DEVCO 7.1 7 4.8 0.003
REGIO 1 074.9 680.6 475.1 287.7
RTD 209.8 105.1 49.6 25.4
SANCO 1.3 1.2 0.6 0
TENEA 38.0 18.5 1.3 0
TOTAL 1 919.2 1 171.0 779.0 462.0
INDEX 100 61 41 24
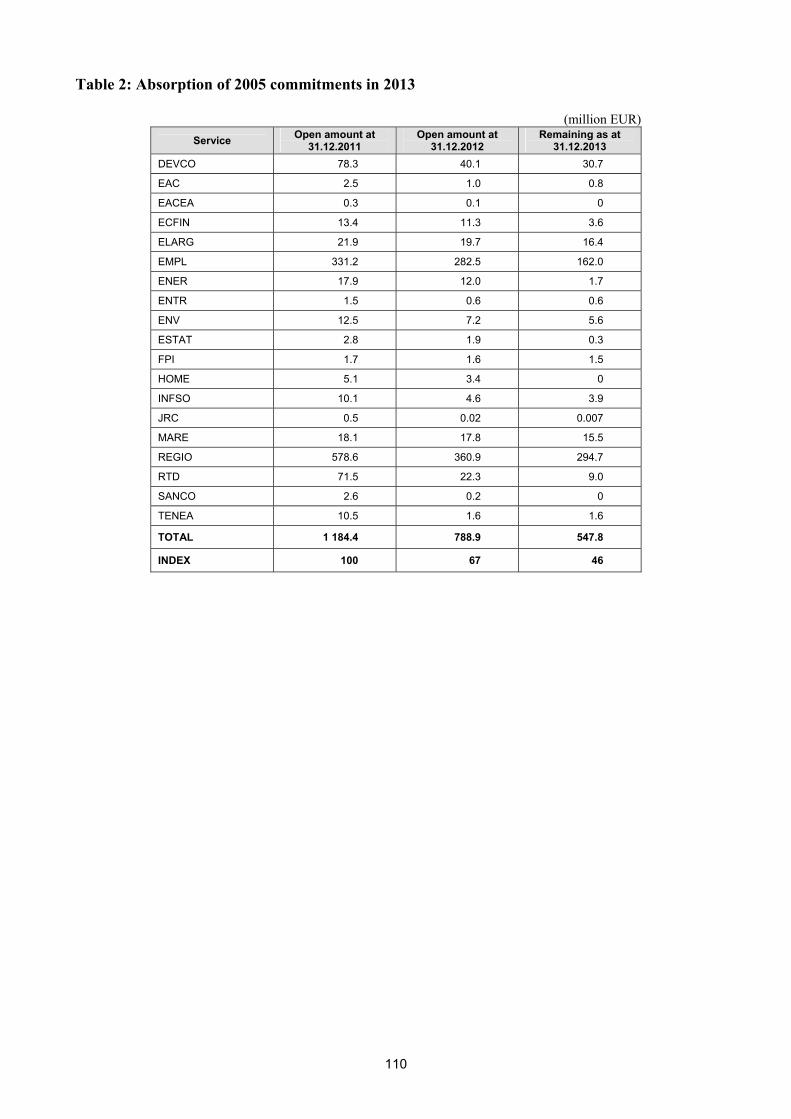
110
Table 2: Absorption of 2005 commitments in 2013 (million EUR)
Service Open amount at 31.12.2011
Open amount at 31.12.2012
Remaining as at 31.12.2013
DEVCO 78.3 40.1 30.7
EAC 2.5 1.0 0.8
EACEA 0.3 0.1 0
ECFIN 13.4 11.3 3.6
ELARG 21.9 19.7 16.4
EMPL 331.2 282.5 162.0
ENER 17.9 12.0 1.7
ENTR 1.5 0.6 0.6
ENV 12.5 7.2 5.6
ESTAT 2.8 1.9 0.3
FPI 1.7 1.6 1.5
HOME 5.1 3.4 0
INFSO 10.1 4.6 3.9
JRC 0.5 0.02 0.007
MARE 18.1 17.8 15.5
REGIO 578.6 360.9 294.7
RTD 71.5 22.3 9.0
SANCO 2.6 0.2 0
TENEA 10.5 1.6 1.6
TOTAL 1 184.4 788.9 547.8
INDEX 100 67 46

111
Table 3: Absorption of 2006 commitments in 2013 (million EUR)
Service Open amount at 31.12.2012
Remaining as at 31.12.2013
AGRI 456.3 195.2
DEVCO 120.3 79.0
EAC 0.005 0
ECHO 0.06 0.06
EACEA 0.4 0
ECFIN 41.3 34.5
ELARG 1.1 0.5
EMPL 1 506.3 456.8
ENER 1.1 0.7
ENTR 1.7 0.05
ENV 11.9 2.7
ESTAT 2.2 0.6
FPI 3.3 0.4
IEEA 0.15 0
HOME 0.005 0
INFSO 6.7 1.5
JRC 3.3 3.3
MARE 271.3 227.9
PHEA 0.15 0.1
MOVE 3.3 1.9
PMO 2.8 2.8
REGIO 5 327.6 3 000.9
RTD 53.1 21.0
SANCO 0.5 0.3
TENEA 3.0 1.8
TOTAL 7 818.0 4 032.0
INDEX 100 52