
Report on a Helicopter-Borne AeroTEM System ... on a Helicopter-Borne AeroTEM System Electromagnetic...
30
Report on a Helicopter-Borne AeroTEM System Electromagnetic & Magnetic Survey Aeroquest Job # 11-014 Leach Basin Fort Irwin Army Base For U.S. Geological Survey MS 964, Building20, Rm. B2208 Box 25046, Denver Federal Center Denver, Colorado 80225 by 7687 Bath Road, Mississauga, ON, L4T 3T1 Tel: (905) 672-9129 Fax: (905) 672-7083 www.aeroquest.ca Report date: April 2011
Transcript of Report on a Helicopter-Borne AeroTEM System ... on a Helicopter-Borne AeroTEM System Electromagnetic...

Report on a Helicopter-Borne AeroTEM System Electromagnetic
& Magnetic Survey
Aeroquest Job # 11-014
Leach Basin Fort Irwin Army Base
For
U.S. Geological Survey
MS 964, Building20, Rm. B2208 Box 25046, Denver Federal Center
Denver, Colorado 80225
by
7687 Bath Road, Mississauga, ON, L4T 3T1
Tel: (905) 672-9129 Fax: (905) 672-7083 www.aeroquest.ca
Report date: April 2011

Report on a Helicopter-Borne AeroTEM System Electromagnetic
& Magnetic Survey
Aeroquest Job # 11-014
Leach Basin Fort Irwin Army Base
For
U.S. Geological Survey MS 964, Building20, Rm. B2208
Box 25046, Denver Federal Center Denver, Colorado 80225
By
7687 Bath Road, Mississauga, ON, L4T 3T1
Tel: (905) 672-9129 Fax: (905) 672-7083 www.aeroquest.ca
Report date: April 2011

Job# 11014
Aeroquest International - Report on a Helicopter-Borne AeroTEM IV Electromagnetic & Magnetic Systems Survey
i
TABLE OF CONTENTS TABLE OF CONTENTS ........................................................................................................................ i
LIST OF FIGURES ................................................................................................................................ 2
LIST OF MAPS SCALE (1:24,000) ...................................................................................................... 2
1. INTRODUCTION .............................................................................................................................. 3
2. SURVEY AREA ................................................................................................................................ 3
3. SURVEY SPECIFICATIONS AND PROCEDURES ....................................................................... 4
3.1. Navigation ................................................................................................................................... 5 3.2. System Drift ................................................................................................................................ 5 3.3. Field QA/QC Procedures ............................................................................................................ 5
4. AIRCRAFT AND EQUIPMENT ....................................................................................................... 6
4.1. Aircraft ........................................................................................................................................ 6 4.2. Magnetometer ............................................................................................................................. 6 4.3. Electromagnetic System .............................................................................................................. 6 4.4. AeroDAS Acquisition System .................................................................................................... 8 4.5. Magnetometer Base Station ...................................................................................................... 10 4.6. Radar Altimeter ......................................................................................................................... 10 4.7. Video Tracking and Recording System .................................................................................... 10 4.8. GPS Navigation System ............................................................................................................ 10 4.9. Digital Acquisition System ....................................................................................................... 11
5. PERSONNEL ................................................................................................................................... 11
6. DELIVERABLES ............................................................................................................................ 11
6.1. Hardcopy Deliverables .............................................................................................................. 11 6.2. Digital Deliverables .................................................................................................................. 12
6.2.1. Final Database of Survey Data (.GDB) ............................................................................. 12 6.2.2. Geosoft Grid files (.GRD) .................................................................................................. 12 6.2.3. Digital Versions of Final Maps (.MAP, .PDF) .................................................................. 12 6.2.4. Google Earth Survey Files (.kmz) ...................................................................................... 12 6.2.5. Free Viewing Software (.EXE) ........................................................................................... 12 6.2.6. Digital Copy of this Document (.PDF) .............................................................................. 13
7. DATA PROCESSING AND PRESENTATION ............................................................................. 13
7.1. Base Map ................................................................................................................................... 13 7.2. Flight Path & Terrain Clearance ............................................................................................... 13 7.3. Electromagnetic Data ................................................................................................................ 14 7.4. Magnetic Data ........................................................................................................................... 14 7.5. Conductivity Data ..................................................................................................................... 15
8. General Comments ........................................................................................................................... 15
8.1. Magnetic Response ................................................................................................................... 15 8.2. EM Anomalies .......................................................................................................................... 15
APPENDIX 1: Survey Boundaries ....................................................................................................... 18
Job# 11014
Aeroquest International - Report on a Helicopter-Borne AeroTEM IV Electromagnetic & Magnetic Systems Survey
ii
APPENDIX 2: Description of Database Fields .................................................................................... 19
APPENDIX 3: AeroTEM Design Considerations ................................................................................ 22
APPENDIX 4: AeroTEM Instrumentation Specification Sheet ........................................................... 28
LIST OF FIGURES Figure 1. Project flight path and location ............................................................................................... 4 Figure 2.Helicopter type used during the survey. ................................................................................... 6 Figure 3.The magnetometer bird (A) and AeroTEM IV EM bird (B) .................................................... 7 Figure 4.Schematic of Transmitter and Receiver waveforms: 90 Hz ..................................................... 7 Figure 5. AeroTEM response to a ‘thin’ vertical conductor ................................................................. 16 Figure 6. AeroTEM response for a ‘thick’ vertical conductor ............................................................. 16 Figure 7. AeroTEM response over a ‘thin’ dipping conductor ............................................................ 17
LIST OF MAPS SCALE (1:24,000) • TMI_IGRF removed – Coloured Total Magnetic Intensity (TMI) with IGRF removed
and line contours • Z1-OFF – AeroTEM Z1 Off-Time grid with line contours • DTM – Digital Terrain Model grid with line contours • EM – AeroTEM Off-Time profiles Z2-Z12 • RES - Apparent Resistivity – Depth Slice grids, 50 – 200 m, with line contours.

Job# 11014
Aeroquest International - Report on a Helicopter-Borne AeroTEM IV Electromagnetic & Magnetic Systems Survey
3
1. INTRODUCTION
This report describes a helicopter-borne geophysical survey carried out on behalf of U.S. Geological Survey over their Leach Basin property located near Fort Irwin Army Base, California. The survey was comprised of one block. The principal geophysical sensor is Aeroquest's exclusive AeroTEM IV (‘Papa’ System) helicopter time domain electromagnetic system which is employed in conjunction with a high-sensitivity caesium vapour magnetometer. Ancillary equipment includes a real-time differential GPS navigation system, radar altimeter, video recorder, and a base station magnetometer. Full-waveform streaming EM data is recorded at 36,000 samples per second. The streaming data comprise the transmitted waveform, and the X component and Z component of the resultant field at the receivers. The streaming EM data along with ancillary data recorded with AeroDAS acquisition system. The total survey coverage for the block was 1785.95 line-km, of which 1747.11 line-km fell within the defined project area (Appendix 1). The survey was flown at 400 and 800 metres line spacing with a 0º/180º flight line direction. The survey flying described in this report took place between December 27th and January 10th, 2010/2011. This report describes the survey logistics, the data processing, presentation, and provides a brief overview of the results.
2. SURVEY AREA
The project area is located at Fort Irwin Army Base, California. The area lies approximately 10 km N of Fort Irwin, California. The project was made up of one block, Leach Basin (724.3 km²). The base of survey operations and crew accommodation was the Fort Irwin Army Base, California. The main area, Leach Basin Block, was flown using an AeroTEM base frequency of 90 Hz.

Job# 11014
Aeroquest International - Report on a Helicopter-Borne AeroTEM IV Electromagnetic & Magnetic Systems Survey
4
Figure 1. Project flight path and location
3. SURVEY SPECIFICATIONS AND PROCEDURES
The survey specifications are summarised in the following table:
Project Name Line Spacing (metres)
Line Direction
Survey Coverage (line-km)
Dates flown
Leach Basin (West) Leach Basin (East)
400 800
0º/180º 0º/180º 1785.95 December 27th -
January10th, 2010/2011
Table 1. Survey specifications summary.
The survey coverage was calculated by adding up the along-line distance of the survey lines and control (tie) lines as presented in the final Geosoft database. The survey was flown with a line spacing of 400 and 800 metres. The control (tie) lines were flown perpendicular to the survey lines with a spacing of 7850 metres.

Job# 11014
Aeroquest International - Report on a Helicopter-Borne AeroTEM IV Electromagnetic & Magnetic Systems Survey
5
The nominal EM bird terrain clearance is 30 metres, but can be higher in more rugged terrain due to safety considerations and the capabilities of the aircraft. The magnetometer sensor is mounted in a smaller bird connected to the tow rope 33.2 metres above the EM bird and 17.1 metres below the helicopter (Figure 3). Nominal survey speed over relatively flat terrain is 75 km/hr and is generally lower in rougher terrain. Scan rates for ancillary data acquisition is 0.1 second for the magnetometer and altimeter, and 0.2 second for the GPS determined position. The EM data is acquired as a data stream at a sampling rate of 36,000 samples per second and is processed to generate final data at 10 samples per second. The 10 samples per second translate to a geophysical reading about every 1.5 to 2.5 metres along the flight path.
3.1. NAVIGATION
Navigation is carried out using a GPS receiver, an AGNAV2 system for navigation control, and AeroDAS data acquisition system which records the GPS coordinates. The x-y-z position of the aircraft, as reported by the GPS, is recorded at 0.2 second intervals. The system has a published accuracy of less than 3 metres. A recent static ground test of the Mid-Tech WAAS GPS yielded a standard deviation in x and y of under 0.6 metres and for z under 1.5 metres over a two-hour period.
3.2. SYSTEM DRIFT
Unlike frequency domain electromagnetic systems, the AeroTEM IV system has negligible drift due to thermal expansion. The operator is responsible for ensuring the instrument is properly warmed up prior to departure and that the instruments are operated properly throughout the flight. The operator maintains a detailed flight log during the survey noting the times of the flight and any unusual geophysical or topographic features. Each flight included at least two high elevation ‘background’ checks. During the high elevation checks, an internal 5 second wide calibration pulse in all EM channels was generated in order to ensure that the gain of the system remained constant and within specifications.
3.3. FIELD QA/QC PROCEDURES
On return of the pilot and operator to the base, usually after each flight, the AeroDAS streaming EM data and ancillary data are carried on removable hard drives and FlashCards, respectively and transferred to the data processing work station. At the end of each day, the base station magnetometer data on FlashCard is retrieved from the base station unit. Data verification and quality control includes a comparison of the acquired GPS data with the flight plan; verification of the base station magnetometer data and conversion to ASCII format XYZ data; and loading, processing and conversion of the steaming EM data from the removable hard drive. All data is then merged to an ASCII XYZ format file which is then imported to an Oasis database for further QA/QC and for the production of EM, magnetic contour, and flight path maps. Survey lines which show excessive deviation from the intended flight path are re-flown. Any line or portion of a line on which the data quality did not meet the contract specification was noted and re-flown.

Job# 11014
Aeroquest International - Report on a Helicopter-Borne AeroTEM IV Electromagnetic & Magnetic Systems Survey
6
4. AIRCRAFT AND EQUIPMENT
4.1. AIRCRAFT
A Eurocopter (Aerospatiale) AS350 B3 "A-Star" helicopter - registration N352SA was used as survey platform. The helicopter was owned and operated by Sinton Helicopters. Installation of the geophysical and ancillary equipment was carried out by Aeroquest Surveys personnel in conjunction with a licensed aircraft engineer. The survey aircraft was flown at a nominal terrain clearance of 80 metres.
Figure 2.Helicopter type used during the survey.
4.2. MAGNETOMETER
The Aeroquest airborne survey system employs the Geometrics G-823A caesium vapour magnetometer sensor installed in a two metre towed bird airfoil attached to the main tow line, 17.1 metres below the helicopter (Figure 3). The sensitivity of the magnetometer is 0.001 nanoTesla at a 0.1 second sampling rate. The nominal ground clearance of the magnetometer bird is 63.2 metres. The magnetic data is recorded at 10 Hz by the AeroDAS system.
4.3. ELECTROMAGNETIC SYSTEM
The electromagnetic system is an Aeroquest AeroTEM IV time domain towed bird system (Figure 3). The current AeroTEM IV transmitter dipole moment is 220 kNIA at 90 HZ. The AeroTEM bird is towed 50.3 metres below the helicopter. More technical details of the system can be found in Appendix 5.

Job# 11014
Aeroquest International - Report on a Helicopter-Borne AeroTEM IV Electromagnetic & Magnetic Systems Survey
7
For the Leach Basin Block the wave-form was triangular with a symmetric transmitter on-time pulse of 1945 µs and a base frequency of 90 Hz (Figure 4) The current alternates polarity every on-time pulse. During every Tx on-off cycle 180 per second, 200 contiguous channels at 90 HZ of raw X and Z component (and a transmitter current monitor, itx) of the received waveform are measured. The channel time widths are defined in Section 4.4 below. This 200 channel data is referred to as the raw streaming data. The AeroTEM system has one EM data recording streams, the newly designed AeroDAS system which records the full waveform (Figure 4).
Figure 3.The magnetometer bird (A) and AeroTEM IV EM bird (B)
Figure 4.Schematic of Transmitter and Receiver waveforms: 90 Hz

Job# 11014
Aeroquest International - Report on a Helicopter-Borne AeroTEM IV Electromagnetic & Magnetic Systems Survey
8
4.4. AERODAS ACQUISITION SYSTEM
The 200 channels at 90 Hz of raw streaming data are recorded by the AeroDAS acquisition system onto a removable hard drive. In addition the magnetic, altimeter and position data are also recorded in it (Figure 5), six channels of real time processed off-time EM decay in the Z direction and one in the X direction can be viewed on a color monitor on board, these channels are derived by a binning, stacking and filtering procedure on the raw streaming data. The primary use of the displayed EM data (Z1 to Z6, X1), magnetic and altimeter is to provide for real-time QA/QC on board.
Figure 5 AreoTEM IV Instrument Rack
The streaming data are processed post-survey to yield 33 stacked and binned on-time and off-time channels at a 10 Hz sample rate. The timing of the final processed EM channels is described in the following tables:

Job# 11014
Aeroquest International - Report on a Helicopter-Borne AeroTEM IV Electromagnetic & Magnetic Systems Survey
9
Average TxOn -21.3880 us Average TxSwitch 990.6583 us Average TxOff 1926.5496 us Average TxPeak 399.0434 A OTC Gate 67 Gate Shift 36 [Channel Data] Channel Sample Range Time Width (us) Time Center (us) Time After TxOn (us) On1 4 - 4 27.8 97.2 118.6 On2 5 - 5 27.8 125.0 146.4 On3 6 - 6 27.8 152.8 174.2 On4 7 - 7 27.8 180.6 201.9 On5 8 - 8 27.8 208.3 229.7 On6 9 - 9 27.8 236.1 257.5 On7 10 - 10 27.8 263.9 285.3 On8 11 - 11 27.8 291.7 313.1 On9 12 - 12 27.8 319.4 340.8 On10 13 - 13 27.8 347.2 368.6 On11 14 - 14 27.8 375.0 396.4 On12 15 - 15 27.8 402.8 424.2 On13 16 - 16 27.8 430.6 451.9 On14 17 - 17 27.8 458.3 479.7 On15 18 - 18 27.8 486.1 507.5 On16 19 - 19 27.8 513.9 535.3 Channel Sample Range Time Width (us) Time Center (us) Time After TxOff (us) Off0 73 - 73 27.8 2013.9 87.3 Off1 74 - 74 27.8 2041.7 115.1 Off2 75 - 75 27.8 2069.4 142.9 Off3 76 - 76 27.8 2097.2 170.7 Off4 77 - 77 27.8 2125.0 198.5 Off5 78 - 78 27.8 2152.8 226.2 Off6 79 - 81 83.3 2208.3 281.8 Off7 82 - 84 83.3 2291.7 365.1 Off8 85 - 87 83.3 2375.0 448.5 Off9 88 - 90 83.3 2458.3 531.8 Off10 91 - 95 138.9 2569.4 642.9 Off11 96 - 100 138.9 2708.3 781.8 Off12 101 - 106 166.7 2861.1 934.6 Off13 107 - 116 277.8 3083.3 1156.8 Off14 117 - 130 388.9 3416.7 1490.1 Off15 131 - 152 611.1 3916.7 1990.1 Off16 153 - 187 972.2 4708.3 2781.8

Job# 11014
Aeroquest International - Report on a Helicopter-Borne AeroTEM IV Electromagnetic & Magnetic Systems Survey
10
4.5. MAGNETOMETER BASE STATION
The base magnetometer was an ENVI/MAG (Scintrex) proton precession magnetometer with internal clock synchronised with GPS time. Data logging and UTC time synchronisation was carried out within the magnetometer. The data logging was configured to measure at 2.0 second intervals. Digital recording resolution was 0.1 nT The sensor was placed on a tripod in an area of low magnetic gradient and free of cultural noise sources. A continuously updated display of the base station values was available for viewing and regularly monitored to ensure acceptable data quality and diurnal variation.
4.6. RADAR ALTIMETER
A Terra TRA 3500/TRI-30 radar altimeter is used to record terrain clearance. The antenna was mounted on the outside of the helicopter beneath the cockpit. Therefore, the recorded data reflect the height of the helicopter above the ground. The Terra altimeter has an altitude accuracy of +/- 1.5 metres.
4.7. VIDEO TRACKING AND RECORDING SYSTEM
A high resolution digital colour 8 mm video camera is used to record the helicopter ground flight path along the survey lines. The video is digitally annotated with GPS position and time and can be used to verify ground positioning information and cultural causes of anomalous geophysical responses.
Figure 6. Digital video camera typical mounting location
4.8. GPS NAVIGATION SYSTEM
The navigation system consists of an Ag-Nav Incorporated AG-NAV2 GPS navigation system comprising a PC-based acquisition system, navigation software, a deviation indicator in front of the aircraft pilot to direct the flight, a full screen display with controls in front of the operator, a Mid-Tech RX400p WAAS-enabled GPS receiver mounted on the instrument rack and an antenna mounted on the magnetometer bird. WAAS (Wide Area Augmentation System) consists of approximately 25 ground reference stations positioned across the United States that monitor GPS satellite data. Two master stations located on the east and west coasts

Job# 11014
Aeroquest International - Report on a Helicopter-Borne AeroTEM IV Electromagnetic & Magnetic Systems Survey
11
collect data from the reference stations and create a GPS correction message. This correction accounts for GPS satellite orbit and clock drift plus signal delays caused by the atmosphere and ionosphere. The corrected differential message is then broadcast through one of two geostationary satellites, or satellites with a fixed position over the equator. The corrected position has a published accuracy of less than 3 metres. Survey co-ordinates are set up prior to the survey and the information is fed into the airborne navigation system. The co-ordinate system employed in the survey design was WGS84 [World] using the UTM zone 11N projection. The real-time differentially corrected GPS positional data was recorded by the AeroDAS system in geodetic coordinates (latitude and longitude using WGS84) at 0.2 s intervals.
4.9. DIGITAL ACQUISITION SYSTEM
The AeroTEM received waveform sampled during on and off-time at 200 channels per decay, 180 times per second (90 Hz) was logged by the proprietary AeroDAS data acquisition system. The channel sampling commences at the start of the Tx cycle and the width of each channel is 27.78 µs. In addition the positional and secondary geophysical data, (i.e. magnetic, radar altimeter, GPS position, and UTC time) was recorded on a removable hard-drive and later backed-up onto DVD-ROM from the field-processing computer.
5. PERSONNEL
The following Aeroquest personnel were involved in the project:
Manager of Operations: Lee Harper Field Data Processors: Thomas Wade Field Operator: John Douglas Data Processing and Reporting: Chris Kahue, Marion Bishop
The survey pilot, Barry Wilson, was employed directly by the helicopter operator – Sinton Helicopters.
6. DELIVERABLES
6.1. HARDCOPY DELIVERABLES
The report includes maps at a scale of 1:24,000. The survey area is covered by one map sheet for both the main area with extension and one map sheet to the infill area, and five geophysical data products are delivered as listed below:
• TMI_IGRF removed – Coloured Total Magnetic Intensity (TMI) with IGRF removed and line contours
• Z1-OFF – AeroTEM Z1 Off-Time grid with line contours • DTM – Digital Terrain Model grid with line contours

Job# 11014
Aeroquest International - Report on a Helicopter-Borne AeroTEM IV Electromagnetic & Magnetic Systems Survey
12
• EM – AeroTEM Off-Time profiles Z2-Z12 • RES - Apparent Resistivity – Depth Slice grids, 50 – 200 m, with line contours.
The coordinate/projection system for the maps is NAD83 – UTM Zone 11N. For reference, the latitude and longitude in WGS84 are noted on the maps.
6.2. DIGITAL DELIVERABLES
6.2.1. Final Database of Survey Data (.GDB)
The geophysical profile data is archived digitally in four Geosoft GDB binary format databases. The first database includes all final data, a second includes all intermediate processed EM data, the third database includes the raw gated and compensated EM data and the fourth includes all CDI data. A description of the contents of the individual channels in each the database can be found in Appendix 2.
6.2.2. Geosoft Grid files (.GRD)
Levelled Grid products used to generate the geophysical map images. Cell size for all grid files is 80 metres. Grid names reflect corresponding channels in the database.
Total Magnetic Intensity (maguf.grd) Total Magnetic Intensity IGRF removed (maguf_igrf.grd) Digital Terrain Model (dtmf.grf) Radar Altimeter (ralt_lag.grd) Laser Altimeter (lalt.grd) AeroTEM Off-Time Channel 1 (zoff_miclev1.grd) Apparent Resistivity Grids, 50 – 200m depth (Resdepthm.grd)
6.2.3. Digital Versions of Final Maps (.MAP, .PDF)
Map files in Geosoft .map and Adobe PDF format.
6.2.4. Google Earth Survey Files (.kmz)
Flight navigation lines, EM anomalies, EM Profiles, geophysical grids and contours in Google earth KMZ format. Double click to view flight lines in Google Earth.
6.2.5. Free Viewing Software (.EXE)
Geosoft Oasis Montaj Viewing Software Adobe Acrobat Reader Google Earth Viewer

Job# 11014
Aeroquest International - Report on a Helicopter-Borne AeroTEM IV Electromagnetic & Magnetic Systems Survey
13
6.2.6. Digital Copy of this Document (.PDF)
Adobe PDF format of this document.
7. DATA PROCESSING AND PRESENTATION
All in-field and post-field data processing was carried out using Aeroquest proprietary data processing software and Geosoft Oasis Montaj software. Maps were generated using 36-inch wide Hewlett Packard ink-jet plotters.
7.1. BASE MAP
The geophysical maps accompanying this report are based on positioning in the NAD83 datum. The survey geodetic GPS positions have been projected using the Universal Transverse Mercator projection in Zone 11 North. A summary of the map datum and projection specifications is given following:
Ellipse: GRS 1980 Ellipse major axis: 6378137m eccentricity: 0.081819191 Datum: North American 1983 - Canada Mean Datum Shifts (x,y,z) : 0, 0, 0 metres Map Projection: Universal Transverse Mercator Zone 11 (Central Meridian 117ºW) Central Scale Factor: 0.9996 False Easting, Northing: 500,000m, 0m
For reference, latitude and longitude ticks in WGS84 are noted on the maps.
7.2. FLIGHT PATH & TERRAIN CLEARANCE
The position of the survey helicopter was directed by use of the Global Positioning System (GPS). Positions were updated five times per second (5 Hz) and expressed as WGS84 latitude and longitude calculated from the raw pseudo range derived from the C/A code signal. The instantaneous GPS flight path, after conversion to UTM co-ordinates, is drawn using linear interpolation between the x/y positions. The terrain clearance was maintained with reference to the radar altimeter. The raw Digital Terrain Model (DTM) was derived by taking the GPS survey elevation and subtracting the radar altimeter terrain clearance values. The calculated topography elevation values are relative and are not tied in to surveyed geodetic heights. Each flight included at least two high elevation ‘background’ checks. These high elevation checks are to ensure that the gain of the system remained constant and within specifications.

Job# 11014
Aeroquest International - Report on a Helicopter-Borne AeroTEM IV Electromagnetic & Magnetic Systems Survey
14
7.3. ELECTROMAGNETIC DATA
The raw streaming data, sampled at a rate of 36,000 Hz was reprocessed using a proprietary software algorithm developed and owned by Aeroquest Surveys. Processing involves the compensation of the X and Z component data for the primary field waveform. Coefficients for this compensation for the system transient are determined and applied to the stream data. The stream data are then pre-filtered with a 3 point filter, stacked utilizing a box-car stacking algorithm of 12 half cycles with a 50% overlap, binned to the 33 on and off-time channels and checked for the effectiveness of the compensation and stacking processes. The stacked data is then filtered with a 19pt de-spiking filter followed by a 21pt Hanning filter. The background levelling picks are then applied when the system was at height and out of ground effect. The data are then split up into the individual line segments. Further base level adjustments may be carried out at this stage. The final field processing step was to merge the processed EM data with the other data sets into a Geosoft GDB file. The EM fiducial is used to synchronize the two datasets. The processed channels are merged into ‘array format; channels in the final Geosoft database as Zon, Zoff, Xon, and Xoff The filtering of the stacked data is designed to remove or minimize high frequency noise that cannot be sourced from the geology. Apparent bedrock EM anomalies were interpreted with the aid of an auto-pick from positive peaks and troughs in the on-time Z channel responses correlated with X channel responses. The auto-picked anomalies were reviewed and edited by a geophysicist on a line by line basis to discriminate between thin and thick conductor types. Anomaly picks locations were migrated and removed as required. This process ensures the optimal representation of the conductor centres on the maps. At each conductor pick, estimates of the off-time conductance have been generated based on a horizontal plate source model for those data points along the line where the response amplitude is sufficient to yield an acceptable estimate. Some of the EM anomaly picks do not display a Tau value; this is due to the inability to properly define the decay of the conductor usually because of low signal amplitudes. Each conductor pick was then classified according to a set of seven ranges of calculated off-time conductance values. For high conductance sources, the on-time conductance values may be used, since it provides a more accurate measure of high-conductance sources. Each symbol is also given an identification letter label, unique to each flight line. Conductor picks that did not yield an acceptable estimate of off-time conductance due to a low amplitude response were classified as a low conductance source. Please refer to the anomaly symbol legend located in the margin of the maps.
7.4. MAGNETIC DATA
Prior to any levelling the magnetic data was subjected to a lag correction of -0.1 seconds and a spike removal filter. The filtered aeromagnetic data were then corrected for diurnal variations using the magnetic base station and the intersections of the tie lines. Corrections for the regional reference field (IGRF) were applied to the corrected profile data and were interpolated on to a grid using bi-directional gridding with a grid cell size of 80 metres. The

Job# 11014
Aeroquest International - Report on a Helicopter-Borne AeroTEM IV Electromagnetic & Magnetic Systems Survey
15
final levelled grid provided the basis for threading the presented contours which have a minimum contour interval of 10nT.
7.5. CONDUCTIVITY DATA
The apparent conductivity is computed using both the on- and off-time z component of dB/dt. Multiple apparent conductivities were calculated from a series of time gates extracted from the levelled EM data at each measurement location. Conductivity values were determined using a table look-up procedure based on the analytical solution over a homogenous halfspace (Huang and Rudd, 2008). The outputted conductivity and depth information were used to create the depth slice images.
8. GENERAL COMMENTS
The survey was successful in mapping the magnetic and conductive properties of the geology throughout the survey area. Below is a brief interpretation of the results. For a detailed interpretation please contact Aeroquest Surveys.
8.1. MAGNETIC RESPONSE
The magnetic data provide a high resolution map of the distribution of the magnetic mineral content of the survey area. This data can be used to interpret the location of geological contacts and other structural features such as faults and zones of magnetic alteration. The sources for anomalous magnetic responses are generally thought to be predominantly magnetite because of the relative abundance and strength of response (high magnetic susceptibility) of magnetite over other magnetic minerals such as pyrrhotite.
8.2. EM ANOMALIES The EM anomalies on the maps are classified by conductance (as described earlier in the report) and also by the thickness of the source. A thin, vertically orientated source produces a double peak anomaly in the z-component response and a positive to negative crossover in the x-component response (Figure 5). For a vertically orientated thick source (say, greater than 10 metres), the response is a single peak in the z-component response and a negative to positive crossover in the x-component response (Figure 6). Because of these differing responses, the AeroTEM system provides discrimination of thin and thick sources and this distinction is indicated on the EM anomaly symbols (N = thin and K = thick). Where multiple, closely spaced conductive sources occur, or where the source has a shallow dip, it can be difficult to uniquely determine the type (thick vs. thin) of the source (Figure 7). In these cases both possible source types may be indicated by picking both thick and thin response styles. For shallow dipping conductors the ‘thin’ pick will be located over the edge of the source, whereas the ‘thick’ pick will fall over the downdip ‘heart’ of the anomaly.

Job# 11014
Aeroquest International - Report on a Helicopter-Borne AeroTEM IV Electromagnetic & Magnetic Systems Survey
16
-15
-10
-5
0
5
10
15
0 100 200 300 400 500 600
50 SConductance
50 mDepth
300 mWidth
300 mLength
50 SConductance
50 mDepth
300 mWidth
300 mLength
Distance (m)RES
PO
NSE
(n
T /s)
Figure 5. AeroTEM response to a ‘thin’ vertical conductor
-150
-100
-50
0
50
100
150
200
250
300
350
0 100 200 300 400 500 600
50 SConductance
50 mDepth
50 mThickness
90oDip
300 mWidth
300 mLength
50 SConductance
50 mDepth
50 mThickness
90oDip
300 mWidth
300 mLength
DISTANCE (m)
RES
PO
NSE
(n
T/s)
Figure 6. AeroTEM response for a ‘thick’ vertical conductor

Job# 11014
Aeroquest International - Report on a Helicopter-Borne AeroTEM IV Electromagnetic & Magnetic Systems Survey
17
-30
-20
-10
0
10
20
30
40
0 100 200 300 400 500 600
50 SConductance
45oDip
50 mDepth
300 mWidth
300 mLength
50 SConductance
45oDip
50 mDepth
300 mWidth
300 mLength
DISTANCE (m)
RES
PO
NS E
(n
T /s )
Figure 7. AeroTEM response over a ‘thin’ dipping conductor
All cases should be considered when analyzing the interpreted picks and prioritizing for follow-up. Specific anomalous responses which remain as high priority should be subjected to numerical modeling prior to drill testing to determine the dip, depth and probable geometry of the source.

Job# 11014
Aeroquest International - Report on a Helicopter-Borne AeroTEM IV Electromagnetic & Magnetic Systems Survey
18
APPENDIX 1: SURVEY BOUNDARIES
The following table presents the block boundaries. All geophysical data presented in this report have been windowed to 100m outside these outlines. X and Y positions are in NAD83 UTM Zone 11. Leach Basin (West) Leach Basin (East) X Y X Y
511406 3945137 547461 3945269 547073 3945254 556850 3945310 547158 3929172 556818 3929205 511427 3929055 547547 3929170

Job# 11014
Aeroquest International - Report on a Helicopter-Borne AeroTEM IV Electromagnetic & Magnetic Systems Survey
19
APPENDIX 2: DESCRIPTION OF DATABASE FIELDS The GDB file is a Geosoft binary database. In the database, the Survey lines and Tie Lines are prefixed with an "L" for "Line" and "T" for "Tie". Structure based on folders within the accompanying DVD. /Data/11-014_LeachBasin.gdb
COLUMN UNITS DESCRIPTOR line Line number flight Flight # emfid AERODAS Fiducial utctime hh:mm:ss.ss UTC time x m UTM Easting (NAD83, Zone 11) y m UTM Northing (NAD83, Zone 11) Lat_wgs84 º Geographic Easting (NAD83, Zone 11) Long_wgs84 º Geographic Northing (NAD83, Zone 11) galt m GPS altitude of Mag bird bheight m Terrain clearance of EM bird dtm m Digital Terrain Model ralt m Radar Altimeter balt m Barometric altitude Lalt M Laser Altimeter Ralt_Gps_Separation m Separation between Radar Altimeter and GPS sensor Tow_Cable_Length m Length of the Tow Cable basemag nT Base station total magnetic intensity Magu_raw nT Raw Magnetic intensity Magu_filt nT Filtered Magnetic intensity Magu nT Diurnally corrected Mag magUf nT Final levelled total magnetic intensity IGRF nT IGRF channel Maguf_Igrf nT Final levelled total magnetic intensity IGRF removed Inclination º Magnetic Inclination Declination º Magnetic Declination lZon nT/s Levelled Streaming On-Time Z component Channels 1-16 lZoff nT/s Levelled Streaming Off-Time Z component Channels 0-16 lXon nT/s Levelled Streaming On-Time X component Channels 1-16 lXoff nT/s Levelled Streaming Off-Time X component Channels 0-16 Zon_raw nT/s Raw Streaming On-Time Z component Channels 1-16 Zoff_raw nT/s Raw Streaming Off-Time Z component Channels 0-16 Xon_raw nT/s Raw Streaming On-Time X component Channels 1-16 Xoff_raw nT/s Raw Streaming Off-Time X component Channels 0-16 Zon_lag nT/s Lagged Streaming On-Time Z component Channels 1-16 Zoff_lag nT/s Lagged Streaming Off-Time Z component Channels 0-16 Xon_lag nT/s Lagged Streaming On-Time X component Channels 1-16 Xoff_lag nT/s Lagged Streaming Off-Time X component Channels 0-16 Zoff_miclev nT/s Micro levelled Streaming Off-Time Z component Channels 0-16

Job# 11014
Aeroquest International - Report on a Helicopter-Borne AeroTEM IV Electromagnetic & Magnetic Systems Survey
20
Zon_miclev nT/s Micro levelled Streaming On-Time Z component Channels 1-16 Zoff_correction nT/s Corrected Off-Time Z component Channels 0-16 Xoff_correction nT/s Corrected Off-Time X component Channels 0-16 Zon_correction nT/s Corrected On-Time Z component Channels 1-16 Xon_correction nT/s Corrected On-Time X component Channels 1-16 ResOff Ohm-m Offtime Apparent Resistivity DepOff m Offtime Depth channel ResXXXm Ohm-m Apparent Resistivity Depth Slice ResOn Ohm-m Ontime Apparent Resistivity DepOn m Ontime Depth channel pwrline powerline monitor data channel Grade Classification from 1-7 based on conductance of conductor pick Anom_labels Alphanumeric label of conductor pick On_AllCon S On-time conductance On_AllTau µs On-time decay constant Anom_ID Anomaly Character (K= thicK, N = thiN) Off_AllCon S Off-time conductance Off_AllTau µs Off-time decay constant TranOff µs Transmission turn-off time TranOn µs Transmission turn-on time TranPeak A Transmission peak current TranSwitch µs Transmission peak current time Off_Pick EM Off time anomaly pick Off_con S Off-time conductance Off_Tau µs Off-time decay constant
/data/11-014_LeachBasin_CDI.gdb
COLUMN UNITS DESCRIPTOR emfid AERODAS Fiducial x m UTM Easting (NAD83, Zone 11) y m UTM Northing (NAD83, Zone 11) bheight m Terrain clearance of EM bird ResOff Ohm-m Offtime Apparent Resistivity DepOff m Offtime Depth channel ResXXXm Ohm-m Apparent Resistivity Depth Slice ResOn Ohm-m Ontime Apparent Resistivity DepOn m Ontime Depth channel
/Raw EM Data/Background Levelled Fight Databases/11-014-Flt#.gdb
COLUMN UNITS DESCRIPTOR Line Line number Flight Flight # Emfid AERODAS Fiducial

Job# 11014
Aeroquest International - Report on a Helicopter-Borne AeroTEM IV Electromagnetic & Magnetic Systems Survey
21
Utctime hh:mm:ss.ss UTC time X m UTM Easting (NAD83, Zone 11) Y m UTM Northing (NAD83, Zone 11) Lat_wgs84 º Geographic Easting (NAD83, Zone 11) Long_wgs84 º Geographic Northing (NAD83, Zone 11) Galt m GPS altitude of Mag bird Bheight m Terrain clearance of EM bird Dtm_lag m Digital Terrain Model Ralt_lag m Radar Altimeter Magu_filt nT Raw Magnetic intensity Zon_lag nT/s Lagged Streaming On-Time Z component Channels 1-16 Zoff_lag nT/s Lagged Streaming Off-Time Z component Channels 0-16 Xon_lag nT/s Lagged Streaming On-Time X component Channels 1-16 Xoff_lag nT/s Lagged Streaming Off-Time X component Channels 0-16 Pwrline powerline monitor data channel TranOff µs Transmission turn-off time TranOn µs Transmission turn-on time TranPeak A Transmission peak current TranSwitch µs Transmission peak current time
/Raw EM Data/Gated Compensated FlightDatabase/11-014-Flt#-gated_compensated_em.gdb COLUMN UNITS DESCRIPTOR emfid AERODAS Fiducial Zon_raw nT/s Raw Streaming On-Time Z component Channels 1-16 Zoff_raw nT/s Raw Streaming Off-Time Z component Channels 0-16 Xon_raw nT/s Raw Streaming On-Time X component Channels 1-16 Xoff_raw nT/s Raw Streaming Off-Time X component Channels 0-16 TranOff µs Transmission turn-off time TranOn µs Transmission turn-on time TranPeak A Transmission peak current TranSwitch µs Transmission peak current time

Job# 11014
Aeroquest International - Report on a Helicopter-Borne AeroTEM IV Electromagnetic & Magnetic Systems Survey
22
APPENDIX 3: AEROTEM DESIGN CONSIDERATIONS
Helicopter-borne EM systems offer an advantage that cannot be matched from a fixed-wing platform. The ability to fly at slower speed and collect data with high spatial resolution, and with great accuracy, means the helicopter EM systems provide more detail than any other EM configuration, airborne or ground-based. Spatial resolution is especially important in areas of complex geology and in the search for discrete conductors. With the advent of helicopter-borne high-moment time domain EM systems the fixed wing platforms are losing their only advantage – depth penetration.
Advantage 1 – Spatial Resolution
The AeroTEM system is specifically designed to have a small footprint. This is accomplished through the use of concentric transmitter-receiver coils and a relatively small diameter transmitter coil (5 m). The result is a highly focused exploration footprint, which allows for more accurate “mapping” of discrete conductors. Consider the transmitter primary field images shown in Figure 1, for AeroTEM versus a fixed-wing transmitter.
The footprint of AeroTEM at the earth’s surface is roughly 50m on either side of transmitter Figure 1. A comparison of the footprint between AeroTEM and a fixed-wing system, highlights the greater resolution that is achievable with a transmitter located closer to the earth’s surface. The AeroTEM footprint is one third that of a fixed-wing system and is symmetric, while the fixed-wing system has even lower spatial resolution along the flight line because of the separated transmitter and receiver configuration.
At first glance one may want to believe that a transmitter footprint that is distributed more evenly over a larger area is of benefit in mineral exploration. In fact, the opposite is true; by energizing a larger surface area, the ability to energize and detect discrete conductors is reduced. Consider, for example, a comparison between AeroTEM and a fixed-wing system over the Mesamax Deposit (1,450,000 tonnes of 2.1% Ni, 2.7% Cu, 5.2 g/t Pt/Pd). In a test survey over three flight lines spaced 100 m apart, AeroTEM detected the Deposit on all three flight lines. The fixed-wing system detected the Deposit only on two flight lines. In exploration programs that seek to expand the flight line spacing in an effort to reduce the cost of the airborne survey, discrete conductors such as the Mesamax Deposit can go undetected. The argument often put forward in favour of using fixed-wing systems is that because of their larger footprint, the flight line spacing can indeed be widened. Many fixed-wing surveys are flown at 200 m or 400 m. Much of the survey work performed by Aeroquest has been to survey in areas that were previously flown at these wider line spacings. One of the reasons for AeroTEM’s impressive discovery record has been the strategy of flying closely spaced lines and finding all the discrete near-surface conductors. These higher resolution surveys are being flown within existing mining camps, areas that improve the chances of discovery.
The footprint of a fixed-wing system is roughly 150 m on either side of the transmitter

Job# 11014
Aeroquest International - Report on a Helicopter-Borne AeroTEM IV Electromagnetic & Magnetic Systems Survey
23
Figure 2. Fixed-wing (upper) and AeroTEM (lower) comparison over the eastern limit of the Mesamax Deposit, a Ni-Cu-PGE zone located in the Raglan nickel belt and owned by Canadian Royalties. Both systems detected the Deposit further to the west where it is closer to surface.
The small footprint of AeroTEM combined with the high signal to noise ratio (S/N) makes the system more

Job# 11014
Aeroquest International - Report on a Helicopter-Borne AeroTEM IV Electromagnetic & Magnetic Systems Survey
24
suitable to surveying in areas where local infrastructure produces electromagnetic noise, such as power lines and railways. In 2002 Aeroquest flew four exploration properties in the Sudbury Basin that were under option by FNX Mining Company Inc. from Inco Limited. One such property, the Victoria Property, contained three major power line corridors.
The resulting AeroTEM survey identified all the known zones of Ni-Cu-PGE mineralization, and detected a response between two of the major power line corridors but in an area of favorable geology. Three boreholes were drilled to test the anomaly, and all three intersected sulphide. The third borehole encountered 1.3% Ni, 6.7% Cu, and 13.3 g/t TPMs over 42.3 ft. The mineralization was subsequently named the Powerline Deposit.
The success of AeroTEM in Sudbury highlights the advantage of having a system with a small footprint, but also one with a high S/N. This latter advantage is achieved through a combination of a high-moment (high signal) transmitter and a rigid geometry (low noise). Figure 3 shows the Powerline Deposit response and the response from the power line corridor at full scale. The width of power line response is less than 75 m.
Figure 3. The Powerline Deposit is located between two major power line corridors, which make EM surveying problematic. Despite the strong response from the power line, the anomaly from the Deposit is clearly detected. Note the thin formational conductor located to the south. The only way to distinguish this response from that of two closely spaced conductors is by interpreting the X-axis coil response.
Advantage 2 – Conductance Discrimination
The AeroTEM system features full waveform recording and as such is able to measure the on-time response due to high conductance targets. Due to the processing method (primary field removal), there is attenuation of the response with increasing conductance, but the AeroTEM on-time measurement is still superior to systems that rely on lower base frequencies to detect high conductance targets, but do not measure in the on-time.
The peak response of a conductive target to an EM system is a function of the target conductance and the EM system base frequency. For time domain EM systems that measure only in the off-time, there is a drop in the peak response of a target as the base frequency is lowered for all conductance values below the peak system
Job# 11014
Aeroquest International - Report on a Helicopter-Borne AeroTEM IV Electromagnetic & Magnetic Systems Survey
25
response. For example, the AeroTEM peak response occurs for a 10 S conductor in the early off-time and 100 S in the late off-time for a 150 Hz base frequency. Because base frequency and conductance form a linear relationship when considering the peak response of any EM system, a drop in base frequency of 50% will double the conductance at which an EM system shows its peak response. If the base frequency were lowered from 150 Hz to 30 Hz there would be a fivefold increase in conductance at which the peak response of an EM occurred.
However, in the search for highly conductive targets, such as pyrrhotite-related Ni-Cu-PGM deposits, a fivefold increase in conductance range is a high price to pay because the signal level to lower conductance targets is reduced by the same factor of five. For this reason, EM systems that operate with low base frequencies are not suitable for general exploration unless the target conductance is more than 100 S, or the target is covered by conductive overburden.
Despite the excellent progress that has been made in modeling software over the past two decades, there has been little work done on determining the optimum form of an EM system for mineral exploration. For example, the optimum configuration in terms of geometry, base frequency and so remain unknown. Many geophysicists would argue that there is no single ideal configuration, and that each system has its advantages and disadvantages. We disagree.
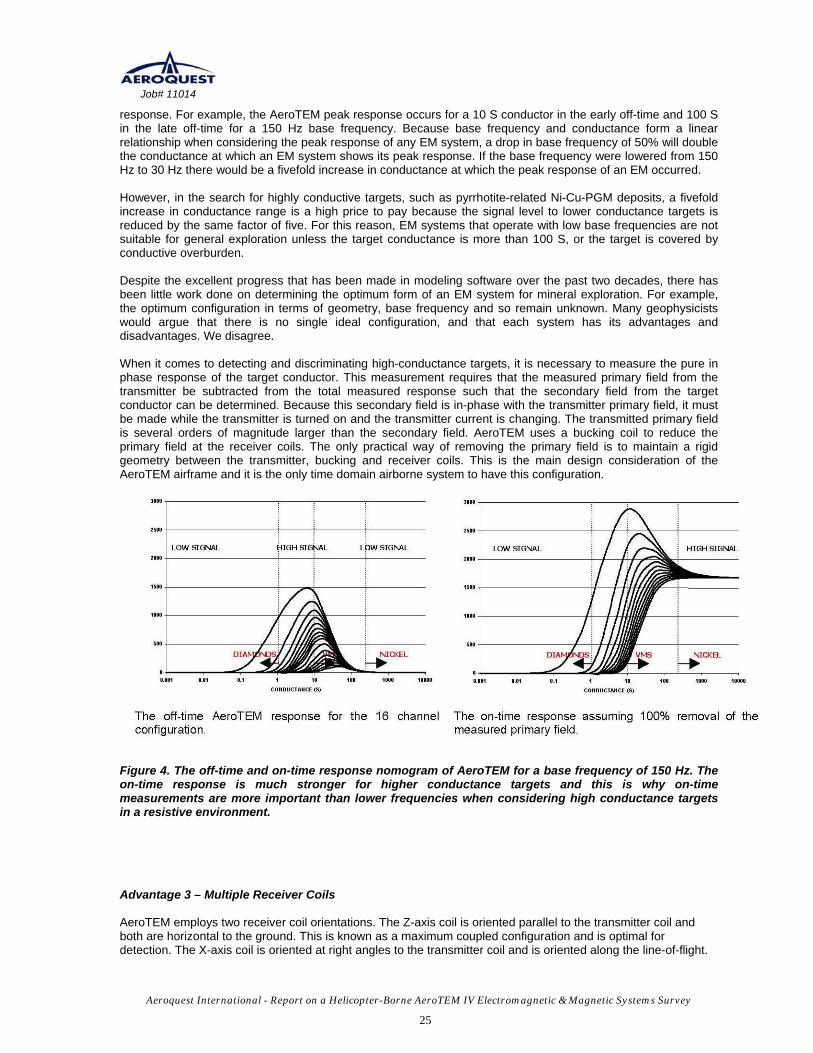
When it comes to detecting and discriminating high-conductance targets, it is necessary to measure the pure in phase response of the target conductor. This measurement requires that the measured primary field from the transmitter be subtracted from the total measured response such that the secondary field from the target conductor can be determined. Because this secondary field is in-phase with the transmitter primary field, it must be made while the transmitter is turned on and the transmitter current is changing. The transmitted primary field is several orders of magnitude larger than the secondary field. AeroTEM uses a bucking coil to reduce the primary field at the receiver coils. The only practical way of removing the primary field is to maintain a rigid geometry between the transmitter, bucking and receiver coils. This is the main design consideration of the AeroTEM airframe and it is the only time domain airborne system to have this configuration.
Figure 4. The off-time and on-time response nomogram of AeroTEM for a base frequency of 150 Hz. The on-time response is much stronger for higher conductance targets and this is why on-time measurements are more important than lower frequencies when considering high conductance targets in a resistive environment.
Advantage 3 – Multiple Receiver Coils
AeroTEM employs two receiver coil orientations. The Z-axis coil is oriented parallel to the transmitter coil and both are horizontal to the ground. This is known as a maximum coupled configuration and is optimal for detection. The X-axis coil is oriented at right angles to the transmitter coil and is oriented along the line-of-flight.

Job# 11014
Aeroquest International - Report on a Helicopter-Borne AeroTEM IV Electromagnetic & Magnetic Systems Survey
26
This is known as a minimum coupled configuration, and provides information on conductor orientation and thickness. These two coil configurations combined provide important information on the position, orientation, depth, and thickness of a conductor that cannot be matched by the traditional geometries of the HEM or fixed-wing systems. The responses are free from a system geometric effect and can be easily compared to model type curves in most cases. In other words, AeroTEM data is very easy to interpret. Consider, for example, the following modeled profile:
Figure 5. Measured (lower) and modeled (upper) AeroTEM responses are compared for a thin steeply dipping conductor. The response is characterized by two peaks in the Z-axis coil, and a cross-over in the X-axis coil that is centered between the two Z-axis peaks. The conductor dips toward the higher amplitude Z-axis peak. Using the X-axis cross-over is the only way of differentiating the Z-axis response from being two closely spaced conductors.
HEM versus AeroTEM
Traditional helicopter EM systems operate in the frequency domain and benefit from the fact that they use narrowband as opposed to wide-band transmitters. Thus all of the energy from the transmitter is concentrated in

Job# 11014
Aeroquest International - Report on a Helicopter-Borne AeroTEM IV Electromagnetic & Magnetic Systems Survey
27
a few discrete frequencies. This allows the systems to achieve excellent depth penetration (up to 100 m) from a transmitter of modest power. The Aeroquest Impulse system is one implementation of this technology.
The AeroTEM system uses a wide-band transmitter and delivers more power over a wide frequency range. This frequency range is then captured into 16 time channels, the early channels containing the high frequency information and the late time channels containing the low frequency information down to the system base frequency. Because frequency domain HEM systems employ two coil configurations (coplanar and coaxial) there are only a maximum of three comparable frequencies per configuration, compared to 16 AeroTEM off-time and 12 AeroTEM on-time channels.
Figure 6 shows a comparison between the Dighem HEM system (900 Hz and 7200 Hz coplanar) and AeroTEM (Z-axis) from surveys flown in Raglan, in search of highly conductive Ni-Cu-PGM sulphide. In general, the AeroTEM peaks are sharper and better defined, in part due to the greater S/N ratio of the AeroTEM system over HEM, and also due to the modestly filtered AeroTEM data compared to HEM. The base levels are also better defined in the AeroTEM data. AeroTEM filtering is limited to spike removal and a 5-point smoothing filter. Clients are also given copies of the raw, unfiltered data.
Figure 6. Comparison between Dighem HEM (upper) and AeroTEM (lower) surveys flown in the Raglan area. The AeroTEM responses appear to be more discrete, suggesting that the data is not as heavily filtered as the HEM data. The S/N advantage of AeroTEM over HEM is about 5:1.
Aeroquest Surveys is grateful to the following companies for permission to publish some of the data from their respective surveys: Wolfden Resources, FNX Mining Company Inc, Canadian Royalties, Nova West Resources, Aurogin Resources, Spectrem Air. Permission does not imply an endorsement of the AeroTEM system by these companies.

Job# 11014
Aeroquest International - Report on a Helicopter-Borne AeroTEM IV Electromagnetic & Magnetic Systems Survey
28
APPENDIX 4: AEROTEM INSTRUMENTATION SPECIFICATION SHEET
AEROTEM Helicopter Electromagnetic System
System Characteristics
• Transmitter: Triangular Pulse Shape Base Frequency 90 Hz • Tx On Time – 1,900 (90 Hz) µs • Tx Off Time – 3,600 (90 Hz) µs • Loop Diameter - 12 m • Peak Current - 410 A • Peak Moment – 220,000 NIA • Typical Z Axis Noise at Survey Speed = 10 nT/s peak to peak • Sling Weight: 1200 lb • Length of Tow Cable: 50.1 m • Bird Survey Height: 30 m nominal
Receiver
• Two Axis Receiver Coils (x, z) positioned at a horizontal offset of 1m and 4.8 m from the centre of transmitter loop, respectively.
• Selectable Time Delay to start of first channel 28 , 55, or 83 ms
Display & Acquisition
• AERODAS Digital recording at 36000 samples per second (27.778 µs channel width) • Recording & Display Rate = 10 readings per second. • On-board display - six channels Z-component and 1 X-component
System Considerations
Comparing a fixed-wing time domain transmitter with a typical moment of 500,000 NIA flying at an altitude of 120 m with a Helicopter TDEM at 30 m, notwithstanding the substantial moment loss in the airframe of the fixed wing, the same penetration by the lower flying helicopter system would only require a sixty-fourth of the moment. Clearly the AeroTEM system with 220,000 NIA has more than sufficient moment. The airframe of the fixed wing presents a response to the towed bird, which requires dynamic compensation. This problem is non-existent for AeroTEM since transmitter and receiver positions are fixed. The AeroTEM system is completely portable, and can be assembled at the survey site within half a day.


