
Report on · PDF file · 2017-12-163.1 Questionnaire Building Process 15 3.1.1...
123
Assessment of Customer perception of Service and Implementation & Punjab Service Area Effectiveness of Telecom Consumers Protection and Redressal of Grievances Regulations October 2013 1 441, (Basement), Jangpura, Mathura Road, New Delhi – 110014, India Email: [email protected], URL: www.consumer-voice.org Report on i) Assessment of Customer perception of Service and ii) Implementation and Effectiveness of Various regulations, directions and orders issued by TRAI in the interest of consumers PUNJAB SERVICE AREA October, 2013 Submitted to: Telecom Regulatory Authority of India Submitted by: VOICE O-45 Basement Ring Road, Lajpat Nagar II New Delhi-110024
Transcript of Report on · PDF file · 2017-12-163.1 Questionnaire Building Process 15 3.1.1...

Assessment of Customer perception of Service and Implementation & Punjab Service Area
Effectiveness of Telecom Consumers Protection and Redressal of Grievances Regulations October 2013
1
441, (Basement), Jangpura, Mathura Road, New Delhi – 110014, India
Email: [email protected], URL: www.consumer-voice.org
Report on
i) Assessment of Customer perception of Service and ii) Implementation and Effectiveness of Various regulations, directions and orders
issued by TRAI in the interest of consumers
PUNJAB SERVICE AREA
October, 2013
Submitted to:
Telecom Regulatory Authority of India
Submitted by:
VOICE O-45 Basement Ring Road, Lajpat Nagar II New Delhi-110024
Assessment of Customer perception of Service and Implementation & Punjab Service Area
Effectiveness of Telecom Consumers Protection and Redressal of Grievances Regulations October 2013
2
441, (Basement), Jangpura, Mathura Road, New Delhi – 110014, India
Email: [email protected], URL: www.consumer-voice.org
CONTENTS
Chapter Title Page Executive Summary 4 Basic Wire-line Service 4 Cellular Service 5 Broadband Service 8 1. Introduction 10 2. Objective of the Study 12
Part A 3. Methodology 15 3.1 Questionnaire Building Process 15 3.1.1 Methodology to Calculate Customer Satisfaction on Broad Parameters 18 3.2 Sampling Methodology 19 3.2.1 Basic Wire-line Service 19 3.2.2 Cellular Service 21 3.2.3 Broadband Service 24 3.3 Sample Characteristics 26 4. Customer Perception of Telecom Service-Detail Report 34 4.1 Performance Compliance 35 4.1.1 Basic Wire-line Service 35 4.1.2 Cellular Service 36 4.1.3 Broadband Service 37 4.2 Graphical Presentation 38 4.2.1 Basic Wire-line Service 39 4.2.2 Cellular Service 42 4.2.3 Broadband Service 47 5. Assessment of TRAI Regulations and Directions 51 5.1 Basic Wire-line Service 52 5.2 Cellular Service 57 5.3 Broadband Service 72 6. Conclusions and Recommendations 77
Assessment of Customer perception of Service and Implementation & Punjab Service Area
Effectiveness of Telecom Consumers Protection and Redressal of Grievances Regulations October 2013
3
441, (Basement), Jangpura, Mathura Road, New Delhi – 110014, India
Email: [email protected], URL: www.consumer-voice.org
ANNEXURES 81 Annexure A. Output Tables 82 A.1. Basic Wire-line Service 82 A.2. Cellular Service 92 A.3. Broadband Service 108 Annexure B. Questionnaires 117

Assessment of Customer perception of Service and Implementation & Punjab Service Area
Effectiveness of Telecom Consumers Protection and Redressal of Grievances Regulations October 2013
4
441, (Basement), Jangpura, Mathura Road, New Delhi – 110014, India
Email: [email protected], URL: www.consumer-voice.org
EXECUTIVE SUMMARY
1 Customer Satisfaction Survey -Basic Service (Wireline)
Subscribers’ perception of Basic (wireline) service was assessed for “7” defined parameters through 22 questions and Implementation and Effectiveness of Telecom Consumers Protection and Redressal of Grievances Regulations, 2012 through 11 questions. Altogether Four operators – Airtel, BSNL, HFCL and Reliance – were covered in Punjab Service Area for the Basic Service. As regard to the performance of all the operators in Punjab Service Area, all of the four operators were able to meet almost all of the prescribed parameters of performance. The findings with respect to major parameters on quality of service are as follows:
1.1: Customer satisfaction with overall services (Benchmark >90%).
The customer perception of overall satisfaction level is very good in Punjab service area as all of the four
operators in urban and in rural areas could meet the benchmark of 90%.
In terms of customers satisfied, the achievement level of the operators ranged from 97.8% to 98.9% in rural area and 97.6% to 99.8% in urban area of Punjab.
The highest percentages of customers satisfied were found with BSNL and Reliance in rural and Reliance in urban area.
The lowest percentages of customers satisfied were found with Airtel and HFCL in rural and BSNL in urban area.
1.2: Network Performance (Benchmark >95%)
The customer perception of the parameter network performance is good in Punjab service area as All of the four operators except BSNL in Urban area, met the benchmark of >95% - both in rural and urban Punjab.
In terms of customers satisfied, the achievement level of the operators ranged from 97.4% to 99.1% in rural area and 93.6% to 97.9% in urban area.
The highest percentage of customers satisfied was found with Reliance in rural as well as in urban area.
The lowest percentage of customers satisfied was found with BSNL in rural as well as urban area.
1.3: Billing (Benchmark >95%)
None of the service providers had prepaid customers in Punjab. Hence, the survey was conducted only
for post-paid customers. All the four operators (Airtel, BSNL, HFCL and Reliance) met the benchmark
of 95% both in rural and urban areas.
In terms of customer satisfaction level, the achievement level of the operators ranged from 96.0% to 98.7% in rural and 98.1% to 99.6% in urban areas.
The highest percentage of satisfied consumers with billing services was achieved by HFCL in rural and Airtel in urban areas.
The lowest percentage of satisfied consumers with billing service was achieved by BSNL both in urban and rural areas and by Reliance in Urban.

Assessment of Customer perception of Service and Implementation & Punjab Service Area
Effectiveness of Telecom Consumers Protection and Redressal of Grievances Regulations October 2013
5
441, (Basement), Jangpura, Mathura Road, New Delhi – 110014, India
Email: [email protected], URL: www.consumer-voice.org
1.4: Maintainability (Benchmark >95%)
The customer perception of the parameter maintainability is also good for the basic services in Punjab
as all of the operators, in rural and urban areas, met the benchmark of 95%.
In terms of customers satisfied, the achievement level of the operators ranged from 96.7% to 98.3% in rural area and 97.2% to 98.6% in urban area.
The highest percentage of customers satisfied were found with Reliance in rural and Airtel in urban areas.
The lowest percentage of customers satisfied was found with BSNL both in rural and urban areas.
1.5: Help Services/ Customer Care (Benchmark >90%)
The customer perception of the parameter help service/ customer care is very good in Punjab. All the
four operators were able to meet the benchmark of 90% in Urban as well as in Rural area.
In terms of customers satisfied, the achievement level of the operators ranged from 94.9% to 99.7% in rural area and 93.1% to 97.9% in urban area.
The highest percentage of customers satisfied was found with Airtel in rural and Reliance in urban area.
The lowest percentage of customers satisfied was found again with BSNL in both the rural as well as urban areas.
1.6: Consumers Protection and Redressal of Grievances
In Punjab, awareness about the redressal mechanism is quite low as subscribers are only aware
about the toll free number of customer care. Awareness about higher stage of redressal
mechanism is almost negligent.
Around 16% of consumers had lodged their complaint through toll free numbers – 18.3% in rural
area and 15.1% in urban area.
Satisfaction with the manner of addressing the complaint by service providers was recorded at
4.92 on a scale of 1 to 7 where 1 is absolutely dissatisfied and 7 is absolutely satisfied.
Only 7.6% of the subscribers had registered their number for not receiving/ blocking unsolicited
commercial calls.
2 Customer Satisfaction Survey (Cellular Mobile)
Subscribers’ perception of cellular service was assessed for “7” defined parameters through 23 questions and Implementation and Effectiveness of Telecom Consumers Protection and Redressal of Grievances Regulations, 2007 through 16 questions. Altogether Eight operators – Airtel, BSNL, HFCL, Reliance, TTSL, Idea cellular, Vodafone and Aircel – were covered in Punjab Service Area for the Basic Service .As regard to the performance of operators in Punjab service area, very few of the operators are meeting the few of the prescribed parameters’ benchmark with respect to quality of service. None of the operators were able to meet all the prescribed parameters of performance. The findings with respect to major parameters on quality of service are as follows:
2.1: Customer satisfaction with overall services (Benchmark >90%)
Assessment of Customer perception of Service and Implementation & Punjab Service Area
Effectiveness of Telecom Consumers Protection and Redressal of Grievances Regulations October 2013
6
441, (Basement), Jangpura, Mathura Road, New Delhi – 110014, India
Email: [email protected], URL: www.consumer-voice.org
The customer perception of overall satisfaction level is good in rural area but very poor in urban areas of
Punjab. In rural area only one operator (Ideal Cellular) was not able to meet the the benchmark of 90%.
In urban area, however, only three operators (BSNL, HFCL and Reliance) had met the benchmark of
90%.
In terms of customers satisfied, the achievement level of the operators ranged from 82.2% to 97.8% in
rural areas and from 71.4% to 98.6% in urban areas.
The highest percentages of customers satisfied were found with Vodafone in rural and Reliance in urban areas.
The lowest percentages of customers satisfied were found with Idea in rural area and Aircel in urban areas.
2.2: Network Performance (Benchmark >95%)
The customer perception of the network performance parameter is poor in Punjab Service Area as a
whole as only two (Airtel and BSNL) of the eight operators in rural and only one (BSNL) out of eight in
urban area met the benchmark of 95%.
In terms of customers satisfied, the achievement level of the operators ranged from 80.2% to 97.6% in rural areas and from 60.6% to 95.2% in urban areas.
The highest percentages of customers satisfied were found with Airtel in rural area and BSNL in urban area.
The lowest percentages of customers satisfied were found with Aircel in rural area and TTSL in urban area.
2.3: Billing (Benchmark >95%)
The survey was conducted separately for pre-paid and post-paid customers. In the case of pre paid services in Rural area only three (HFCL, Idea Cellular and TTSL) out of eight operators were found to be meeting the benchmark of >95%. In urban Area, however, none were meeting the benchmark. In the case of post paid service, the situation is fair in rural area as four (Airtel, BSNL, Idea and TTSL) of the seven operators met the benchmark of >95%. In urban area the situation is critical as none of the seven could meet this benchmark.
In terms of customers satisfied, the achievement level of the operators, in the case of pre-paid segment, ranged from 89.3% to 96.0% in rural area and 65.3% to 92.6% in urban area. Whereas in the case of post-paid, it ranged from 79.2% to 100.0% in rural areas and from 66.7% to 91.5% in urban areas.
The highest percentage of satisfied consumers with billing services, in pre-paid segment was achieved by HFCL in rural areas and BSNL in urban area. In the case of post paid segment the highest percentage of satisfied consumer was attained by Airtel, BSNL, Idea and TTSL (all 100%) in rural areas and Reliance in urban areas.
The lowest percentage of satisfied consumers with billing service in the pre-paid segment was achieved by Aircel in rural and by TTSL in urban areas. In the case of post-paid segment the lowest percentage of consumers was attained Vodafone in rural and TTSL in urban areas.

Assessment of Customer perception of Service and Implementation & Punjab Service Area
Effectiveness of Telecom Consumers Protection and Redressal of Grievances Regulations October 2013
7
441, (Basement), Jangpura, Mathura Road, New Delhi – 110014, India
Email: [email protected], URL: www.consumer-voice.org
2.4: Maintainability (Benchmark >95%)
While recording the customer perception on maintainability (fault repair service) parameter in Punjab
Service Area, it was found that only one (Airtel) out of eight in rural area and none in the urban area
were able to meet the benchmark of 95%.
In terms of customers satisfied, the achievement level of the operators ranged from 85.8% to 96.1% in rural areas and 67.0% to 94.3% in urban areas.
The highest percentage of customer satisfied was found with Airtel in rural and Reliance in urban areas.
The lowest percentages of customer satisfied were found with Idea in rural area and TTSL in Urban area.
2.5: Help Services/ Customer Care (Benchmark >90%)
The customer perception of the parameter help service/ customer care is good in the rural areas of
Punjab as five (Airtel, BSNL, HFCL, TTSL and Vodafone) out of the eight operators managed to meet
the benchmark of 90%. The situation in urban area is below average as three (BSNL, HFCL and Reliance)
were able to meet the benchmark.
In terms of customers satisfied, the achievement level of the operators ranged from 76.3% to 95.6% in rural areas and 62.9% to 94.9% in urban areas.
The highest percentage of customers satisfied was found with Airtel in rural areas and BSNL in urban areas.
The lowest percentage of customers satisfied was found with Aircel in rural as well as in urban areas.
2.6: Supplementary services (Benchmark >90%)
The customer perception of the supplementary services parameter is somewhat good in rural areas as
five operators (Airtel, BSNL, HFCL, TTSL and Vodafone) out of eight managed to meet the benchmark of
90%. In urban areas of Punjab only two operators (Idea and Reliance) could meet this benchmark.
In terms of customers satisfied, the achievement level of the operators ranged from 74.2% to 98.3% in
rural areas and from 75.9% to 94.5% in urban areas
The highest percentages of customers satisfied were found with Airtel in rural area and Reliance in urban areas.
The lowest percentages of customers satisfied were found with Idea in rural and TTSL in urban areas.
2.7: Consumers Protection and Redressal of Grievances
Around 90% of consumers in Punjab were aware about toll free consumer care number, 88% in rural and 90% in urban areas.
However, the awareness about contact detail of the Appellate Authority was found amongst only 2.5% with almost no awareness in rural areas (10, 0.7%). Awareness was, however, found quite high in the case of Idea subscribers (16.5%), but mostly in the urban area (22.9%).

Assessment of Customer perception of Service and Implementation & Punjab Service Area
Effectiveness of Telecom Consumers Protection and Redressal of Grievances Regulations October 2013
8
441, (Basement), Jangpura, Mathura Road, New Delhi – 110014, India
Email: [email protected], URL: www.consumer-voice.org
Higher number of complaints to the consumer care number was made by rural subscribers (70.4%). In urban area also almost three out of five subscribers had put up their complaints. It was much higher in the case of Idea Cellular (80%), both in rural and urban areas..
Overall 7.6% had utilised MNP facility almost similar trend was found in rural and urban areas.
3. Customer Satisfaction Survey –Broadband Services
Subscribers’ perception of Broadband service was assessed for “7” defined parameters through 21 questions and Implementation and Effectiveness of Telecom Consumers Protection and Redressal of Grievances Regulations, 2012 through 8 questions. Altogether Four operators – Airtel, BSNL, HFCL and Reliance – were covered in Punjab Service Area for the Basic Service. As regard to the performance of all the operators in Punjab Service Area, all of the four operators were able to meet almost all of the prescribed parameters of performance. The findings with respect to major parameters on quality of service are as follows:
3.1: Customer satisfaction with overall services (Benchmark >85%).
The customer perception of overall satisfaction level is Good in Punjab service area as all the four operators were found to be meeting the benchmark of >85% in both Rural area and Urban area. In terms of customers satisfied, the achievement level of the operators ranged from 87.2% to 91.1% in
rural area and 89.1% to 90.7% in urban area of Punjab.
The highest percentages of customers satisfied were found with Reliance in rural and in urban area too.
The lowest percentages of customers satisfied were found with BSNL in rural and in urban area too.
3.2: Network Performance (Benchmark >85%)
The customer perception of the parameter network performance is also good in Punjab service area as all the four operators were found to be meeting the benchmark of >85% in both Rural area and Urban area.
In terms of customers satisfied, the achievement level of the operators ranged from 89.7% to 96.9% in rural area and 90.3% to 96.0% in urban area.
The highest percentage of customers satisfied was found with Reliance in urban as well as in rural area and in urban Bharti Airtel too.
The lowest percentage of customers satisfied was found with HFCL in rural as well as urban area.
3.3: Billing (Benchmark >90%)
None of the service providers had prepaid customers in Punjab. Hence, the survey was conducted only for post-paid customers. All the four operators in rural and urban area were found to be meeting the benchmark of >90%.
In terms of customer satisfaction level, the achievement level of the operators ranged from 94.3% to 96.5% in rural and 95.7% to 96.7% in urban areas.
Assessment of Customer perception of Service and Implementation & Punjab Service Area
Effectiveness of Telecom Consumers Protection and Redressal of Grievances Regulations October 2013
9
441, (Basement), Jangpura, Mathura Road, New Delhi – 110014, India
Email: [email protected], URL: www.consumer-voice.org
The highest percentage of satisfied consumers with billing services was achieved by Bharti Airtel in rural and Reliance in urban areas.
The lowest percentage of satisfied consumers with billing service was achieved by HFCL both in urban and rural areas.
3.4: Maintainability (Benchmark >85%)
The customer perception of the parameter maintainability is very good for the Broadband services in Punjab as all the four operators were found to be meeting the benchmark of >85% in both Rural area and Urban area.
In terms of customers satisfied, the achievement level of the operators ranged from 86.7% to 97.5% in
rural area and 87.0% to 95.7% in urban area.
The highest percentage of customers satisfied were found with Reliance in rural and Bharti Airtel in urban areas.
The lowest percentage of customers satisfied was found with HFCL both in rural and urban areas.
3.5: Help Services/ Customer Care (Benchmark >90%)
The customer perception of the parameter help service/ customer care is quite good in Punjab. Three
(Bharti Airtel, BSNL and Reliance) out of the four operators in both Rural and Urban area met the
benchmark of >90%.
In terms of customers satisfied, the achievement level of the operators ranged from 85.8% to 95.8% in rural area and 87.0% to 94.7% in urban area.
The highest percentage of customers satisfied was found with Reliance in rural and Bharti Airtel in urban area.
The lowest percentage of customers satisfied was found again with HFCL in both the rural as well as urban areas.
3. 6: Consumers Protection and Redressal of Grievances
In Punjab, awareness about the redressal mechanism is quite low as only 70% subscribers are
aware about the toll free number of customer care. Awareness about higher stage of redressal,
however, was found at nearly 11%. Similarly 11% were also aware about web based complaint
monitoring system.
Around three out of five 62.6%) consumers had lodged their complaint through toll free
numbers – 57.1% in rural area and 65% in urban area.
Satisfaction with the manner of addressing the complaint by service providers was recorded at
3.75 on a scale of 1 to 7 where 1 is absolutely dissatisfied and 7 is absolutely satisfied.
8.5% of the subscribers, who were aware of the Appellate Authority had filed their appeal,
mostly from Airtel subscribers.

Assessment of Customer perception of Service and Implementation & Punjab Service Area
Effectiveness of Telecom Consumers Protection and Redressal of Grievances Regulations October 2013
10
441, (Basement), Jangpura, Mathura Road, New Delhi – 110014, India
Email: [email protected], URL: www.consumer-voice.org
1. INTRODUCTION
Provision of world class telecommunication infrastructure and information is the key to rapid economic
and social development of the country. While expansion in number of subscribers and growth of tele-
density are important quantitative goals in this sector, it is important to pay attention to the Quality of
Service to customers through regulatory mechanism.
The Telecom Regulatory Authority of India was established in 1997 through an Act of Parliament
namely, the Telecom Regulatory Authority of India Act 1997 as amended by TRAI (Amendment) Act
2000. The Framework for consumer protection is to “Lay down the standards of quality of service to be
provided by the Operator and ensure the quality of service and conduct the periodical survey of such
service provided by the Operator so as to protect interest of the customers of telecommunication
service”1.
While the TRAI is the regulatory body under the Act, TDSAT is the body responsible for settlement of
telecom disputes. However, individual consumer complaints do not come under the purview of either
TRAI or TDSAT. Considering the fact that individual customers can not seek redressal from TRAI or
TDSAT, TRAI has taken number of steps to issue various directions, regulations and orders as measures
to protect the interest of the customers.
In this concern, TRAI initiates study to assess the quality of telecom services every year. The study covers
the whole India comprising four metros and three circles for Basic Wireline and Cellular services.
The main aim is to assess the quality of Basic service (Wireline) and Cellular Mobile services as per “The
Standard of Quality of Service of Basic Telephone Service (Wireline) and Cellular Mobile Telephone
Service Regulation, 2009”, notified by TRAI on 20th March 2009 and Quality of Service of Broadband
Service Regulation, 2006 (11 of 2006) dated 6th Oct 2006.
In May 2007, TRAI had passed a regulation titled, “Telecom Protection and Redressal of Grievances
Regulation, 2007”. The main objective of this regulation is to lay down the norms for the Operator of
Basic service (Wireline), Cellular Mobile and Broadband services in order to handle the complaints of
aggrieved customers.
The salient features of this regulation are listed below:
I. Each Telecom Operators would be required: a. To set up 24x7 Toll Free Call Centre b. To appoint one or more Nodal Officer in each licensed service area c. To appoint one or more Appellate Authority in each licensed service area.
1 www.trai.gov.in
Assessment of Customer perception of Service and Implementation & Punjab Service Area
Effectiveness of Telecom Consumers Protection and Redressal of Grievances Regulations October 2013
11
441, (Basement), Jangpura, Mathura Road, New Delhi – 110014, India
Email: [email protected], URL: www.consumer-voice.org
II. The information as above and also contact details of Nodal Officers and Appellate Authority to be widely publicized in national and local newspaper, sales outlets, web-site and back side of their Invoice/ Bills being sent to customers.
III. Each Operator will be required to publish abridged version of “Manual of Practices” for their customers and also make available the same on their web-sites.
IV. The call centre, Nodal Officers and Appellate Authorities would follow the time lines as given in TRAI regulations for redressal of the complaints.
Voluntary Organization in the interest of Consumer Education (VOICE), with registered office at, 441,
Jangpura, Mathura Road, New Delhi was awarded the contract for the North Zone comprising four
circles – Delhi, Haryana, Rajasthan, Punjab, Jammu & Kashmir, Himachal Pradesh, UP (E) and UP (W) by
Telecom Regulatory Authority of India (TRAI) on Jan 2013.
The present report covers the Punjab service Area for all the three services
Assessment of Customer perception of Service and Implementation & Punjab Service Area
Effectiveness of Telecom Consumers Protection and Redressal of Grievances Regulations October 2013
12
441, (Basement), Jangpura, Mathura Road, New Delhi – 110014, India
Email: [email protected], URL: www.consumer-voice.org
2. OBJECTIVE OF THE STUDY
TRAI had laid down the Quality of Service standards for Basic Telephone Service (Wireline) and Cellular
Mobile Telephone Service through the Standards of Quality of Service of Basic Telephone Service
(Wireline) and Cellular Mobile Telephone Service Regulations, 2009 (7 of 2009) dated the 20th March
2009. These regulations were amended by issuing the Standards of Quality of Service of Basic Telephone
Service (Wireline) and Cellular Mobile Telephone service (Amendment) Regulations, 2012 (10 of 2012)
dated the 7th May, 2012. Likewise, TRAI had laid down the Quality of Service Standards for Broadband
Service through the Quality of Service of Broadband Service Regulations, 2006 (11 of 2006) dated the
6th October, 2006. Keeping in view the need to ensure the Quality of Service provided by the service
providers and to protect the interests of the consumers by making these regulations more effective, it is
felt that the Quality of Service of Broadband Service Regulations, 2006 (11 of 2006) dated the 6th
October, 2006 need to be amended to introduce financial disincentive in relation to the performance of
service providers with regard to the Quality of Service benchmarks. The draft amendments to the
Standards of Quality of Service of Broadband Service Regulations, 2006 (11 of 2006) on financial
disincentives were released on 26.10.2012.
The regulations - The Standards of Quality of Service of Basic Telephone Service (Wireline) and Cellular
Mobile Telephone Service Regulations, 2009 (7 of 2009) dated the 20th March, 2009 and Quality of
Service of Broadband Service Regulations, 2006 (11 of 2006) dated the 6th Oct. 2006 provide for
benchmarks for the parameters on customer perception of service to be achieved by service providers.
In order to monitor the compliance of prescribed standards/benchmarks, TRAI conducts periodic survey
through independent agencies across the country.
Thus, the main objective of this customer satisfaction survey is to assess the:
(i) implementation and effectiveness of the Telecom Consumers Complaint Redressal
Regulations, 2012 (1 of 2012) dated 5th January 2012,the Telecom Consumer Protection
Regulations 2012 dated 6th January 2012 and the Telecom Commercial Communications
Customer Preference Regulation, 2010 dated 1st December 2010
(ii) Customer’s perception of service provided by basic telephone service (wireline), cellular
mobile telephone service and broadband service providers in each of the telecom circles/
service areas under the respective Zone.
The scope of the survey also include assessment of implementation/ effectiveness of various orders/
directions/regulations issued by TRAI to protect the interest of consumers, particularly issues
relating to tariff, billing including information to be included in the telephone bills, termination of
service, redressal of grievances and provision of value added services and premium rate services.
The Zones comprise of the following Telecom Circle/ Service Areas:
North Zone: Delhi, Jammu & Kashmir, Himachal Pradesh, Punjab, Haryana, Rajasthan, Uttar Pradesh-
East and Uttar Pradesh-West (including Uttarakhand). For the cellular mobile telephone service the
service area of Delhi includes Ghaziabad, Faridabad, Noida and Gurgaon.
Assessment of Customer perception of Service and Implementation & Punjab Service Area
Effectiveness of Telecom Consumers Protection and Redressal of Grievances Regulations October 2013
13
441, (Basement), Jangpura, Mathura Road, New Delhi – 110014, India
Email: [email protected], URL: www.consumer-voice.org
South Zone: Chennai, Andhra Pradesh, Karnataka, Tamil Nadu (excluding Chennai) and Kerala.
West Zone: Delhi, Maharashtra (including Goa and excluding Delhi), Gujarat and Madhya Pradesh
(including Chhattisgarh).
East Zone: Kolkata, West Bengal (including Andaman & Nicobar, Sikkim and excluding Kolkata), Bihar
(including Jharkhand), Orissa, Assam and North East which includes Arunachal Pradesh, Meghalaya,
Mizoram, Nagaland, Manipur and Tripura.
With regard to the afore-mentioned survey, VOICE has been commissioned by Telecom Regulatory
Authority of India (TRAI) to conduct a Customer Satisfaction Survey (CSS) among Basic Wire-line Service,
Cellular Mobile Telephone Service and Broadband Service customers, in North Zone.
Of the eight service areas allotted to VOICE, VOICE carried out the survey in four telecom circles/service
areas, namely, Delhi, Rajasthan, Haryana and Punjab in the first half year. The remaining four service
areas, viz., Jammu and Kashmir, Himachal Pradesh and Uttar Pradesh-East and Uttar Pradesh - West
(including Uttarakhand) will be treated in the second half year.
The Survey period extends from July 2013 to September 2013.
The report deals with the main objective of the study wherein we are assessing whether the service
providers are meeting the benchmarks laid down by TRAI on different set of parameters and also
assessing the implementation/ effectiveness of various orders/ directions/regulations issued by TRAI to
protect the interest of consumers.

Assessment of Customer perception of Service and Implementation & Punjab Service Area
Effectiveness of Telecom Consumers Protection and Redressal of Grievances Regulations October 2013
14
441, (Basement), Jangpura, Mathura Road, New Delhi – 110014, India
Email: [email protected], URL: www.consumer-voice.org
Assessment of Customer perception of Service and Implementation & Punjab Service Area
Effectiveness of Telecom Consumers Protection and Redressal of Grievances Regulations October 2013
15
441, (Basement), Jangpura, Mathura Road, New Delhi – 110014, India
Email: [email protected], URL: www.consumer-voice.org
3. METHODOLOGY
3.1 Questionnaire Building Process
The TRAI entrusted the task of developing the questionnaire to all the three successful bidders – VOICE
for North Zone, IMRB for South and East Zone and Mott Mac Donald for West Zone. The objective was
to design a questionnaire which will cover all the benchmark standards set up by the TRAI based on
regulations mentioned above in the objectives of the study. . Hence, all three survey agencies submitted
their draft questionnaires to TRAI in the month of March 2013. TRAI organised consultation with all the
successful bidders and accordingly all three sets of questionnaires for the year 2013 were formed.
These set of questionnaires were based on SERVPERF model developed by Cronin and Taylor (1992),
which is a refined version of SERVQUAL model developed by Parasuraman et al, (1988). The major
difference between SERQUAL and Servperf is the exclusion of expectations portion in the SERPERF
model. While developing the SERPERF model Cronin et al had argued that only the performance
dimension can better predict the behavioural intention of the customers as against the ‘performance
minus expectation’ model of SERVQUAL. The SERVPERF model is based on five dimensions which are
used as the basis for service quality measurement tool. These dimensions are- Tangibility, Reliability,
Responsiveness, Assurance and Empathy.
Keeping in mind the TRAI regulations, it was proposed by the survey agencies to include three more
dimensions, namely, Network/technical quality, Economy and Convenience, in addition to the five
dimensions (tangibles, reliability, responsiveness, assurance and empathy) used in the SERQUAL and
SERVPERF models.
The table below shows the dimensions and corresponding variables which have been covered in the
study:

Assessment of Customer perception of Service and Implementation & Punjab Service Area
Effectiveness of Telecom Consumers Protection and Redressal of Grievances Regulations October 2013
16
441, (Basement), Jangpura, Mathura Road, New Delhi – 110014, India
Email: [email protected], URL: www.consumer-voice.org
Dimensions (Parameters) and variables used in the study
Tangibility (TA)
TA 1 Availability of suitable plans Service Provision
TA 2 Provision of information on SIM Card, recharge cards etc. Service Provision
TA 3 Provision of visually attractive material – starter pack, reload card Service Provision
TA 4 Provision of variety of entertainment facility – apps etc. Supplementary services
Reliability (RL)
RL 1 Provision of service accuracy and dependable Billing
RL 2 Transparent & Accuracy of bill/ charges Billing
RL 3 Customer friendly staff Help services
Responsiveness (RS)
RS 1 Provision of timely service Service Provision
RS 2 Effective handling of downtime (maintaining a service) Maintainability
RS 3 Prompt handling of complaint Grievance redress
RS 4 Effective grievance redressal mechanism, customer service Grievance redress
Assurance (AS)
AS 1 Competency of the staff/ services/ problem solving ability Help services
AS 2 Feedback mechanism Grievance redress
Convenience (CV)
CV 1 Ease of access to Customer help line numbers Help services
CV 2 Ease of activating & deactivating any service (VAS)/ any other Supplementary services
CV 3 Ease of registering for unwanted calls/ SMS Supplementary services
Empathy (EM)
EM 1 Provision of service manual, complete tariff plan at the time of subscription Service Provision
EM 2 Having convenient periods and terms for activation, recharge and account suspension ,
free call times Billing
EM 3 Ease of taking a connection Service Provision
EM 4 Ease of recharging process (pre paid) Billing
EM 5 24 x 7 customer care service Help services
Network/ Technical Quality (NT)
NT 1 Availability of signal in your area (cell)/ working phone(basic)/ uptime (broadband) Network Performance
NT 2 Ability to make and receive call / uninterrupted Network Performance
NT 3 Clear Voice quality Network Performance
Economy (EC)
EC 1 Availability of recharging cards in various denomination Billing
EC 2 Economical call charges per minute/ second Billing
Total variables = 26
Questionnaire: Based on the dimensions and corresponding variables, the Basic service (Wireline)
questionnaire (see Annexure 1.1) is based on 7 broad parameters and 22 questions related to consumer
perception on quality of services and other 10 questions were related to consumer perception on

Assessment of Customer perception of Service and Implementation & Punjab Service Area
Effectiveness of Telecom Consumers Protection and Redressal of Grievances Regulations October 2013
17
441, (Basement), Jangpura, Mathura Road, New Delhi – 110014, India
Email: [email protected], URL: www.consumer-voice.org
Assessment of Implementation and Effectiveness of Various regulations and directions issued by TRAI.
The cellular mobile questionnaire contained 23 questions related to quality of service whereas 17
questions on Implementation and Effectiveness of Various regulations and directions issued by TRAI. In
the case of Broadband, questionnaire was based on 7 broad parameters and 21 questions related to
consumer perception on quality of service and 8 questions on Implementation and Effectiveness of
Various regulations and directions issued by TRAI.
The parameters and benchmarks relating to customer perception of service for basic telephone service
(wireline), cellular mobile telephone services and broadband service provided in the regulations are
given below:
3.1.1 Basic Service (Wireline) and Cellular Mobile Telephone Service
Customer perception of service Benchmark
(i) Customers satisfied with provision of services 90%
(ii) Customers satisfied with billing performance 95%
(iii) Customers satisfied with help services including customer grievance
redressal 90%
(iv) Customers satisfied with network performance, reliability and availability 95%
(v) Customers satisfied with maintainability 95%
(vi) Customers satisfied with supplementary and value added services 90%
(vii) Customers satisfied with overall service quality 90%
3.1.2 Broadband Service
Customer perception of service Benchmark
(i) Customers satisfied with provision of services 90%
(ii) Customers satisfied with billing performance 90%
(iii) Customers satisfied with help services 90%
(iv) Customers satisfied with network performance, reliability and availability 85%
(v) Customers satisfied with maintainability 85%
(vi) Customer satisfaction with offered supplementary services such as allocation of static / fixed IP addresses, email Ids etc.
85%
(vii) Customers satisfied Overall customer satisfaction 85%

Assessment of Customer perception of Service and Implementation & Punjab Service Area
Effectiveness of Telecom Consumers Protection and Redressal of Grievances Regulations October 2013
18
441, (Basement), Jangpura, Mathura Road, New Delhi – 110014, India
Email: [email protected], URL: www.consumer-voice.org
3.1.1 Methodology to Calculate Customer Satisfaction on Broad Parameters.
On each of the above mentioned parameters, the respondents were asked to rate their satisfaction on a
scale of 1 to 7, where 1 implies ‘extremely dissatisfied’ and 7 implies ‘extremely satisfied’. To measure
the percentage of consumers satisfied on various QoS parameters, top 4 box scores are taken into
account thereby not considering the respondents who are actively dissatisfied with the services. The
neutral score of 4 is therefore considered as not dissatisfied. Therefore, the proportion of sum total of
consumers who had given a score of 4 (Not dissatisfied), 5 (Satisfied), 6 (Very Satisfied) and 7 (Extremely
Satisfied) were taken out from the total number of valid responses on the all questions of each of the
broad parameter.
Consumers satisfied are ascertained using the following formula(s):
CS = (A / N) *100
Where:
CS = % of satisfied consumers
A = sum total of no. of subscribers who were “Not dissatisfied” + “Satisfied” + “Very Satisfied” +
“Extremely Satisfied” on each of the broad parameter
N = Total sample size achieved
This implies that if all the customers are either “Not dissatisfied”, “Satisfied”, “Very Satisfied” or
“Extremely Satisfied”, the operator can get a rating of 100%. On the other hand, if all the customers are
“Dissatisfied”, “Very Dissatisfied” or “Extremely dissatisfied” the operator gets a score of 0%.
Comparison with the Benchmarking During the consultation with the TRAI, it was agreed that comparison with the benchmarks will be done
on the basis of percentage of customers satisfied as described above.
The survey in the Punjab Service Area, of all the three services, was done between July 2013 and
September 2013.

Assessment of Customer perception of Service and Implementation & Punjab Service Area
Effectiveness of Telecom Consumers Protection and Redressal of Grievances Regulations October 2013
19
441, (Basement), Jangpura, Mathura Road, New Delhi – 110014, India
Email: [email protected], URL: www.consumer-voice.org
3.2 Sampling Methodology
3.2.1 Basic Wire line Service
As per the tender document, survey agency was supposed to cover a total sample of 2,400 subscribers,
to be divided among the four operators. This is shown in the table below.
Name of the Operators Target Sample* Covered Sample
Airtel 600 601
Bharat Sanchar Nigam Limited (BSNL) 600 602
Infotel Connect (HFCL) 600 603
Rel Communication (Rel Com) 600 603
Total 2400 2409
*The above sample represents the total operator wise subscribers in Punjab Service Area with 95% confidence level and 4%
interval.
As per the tender document, survey agencies with the help of TRAI officials would select 10% of the
SDCAs and 5% of the total exchanges in a services area. Altogether, Punjab Service Area is divided in to
56 SDCAs and 1473 exchanges. Thus, 6 SDCAs and 74 exchanges were selected for the survey. Operator
wise achieved sample is shown in the table below:
Punjab Basic: Achieved Sample
Amritsar Bhatinda Chandigarh Firozepur Hoshiarpur Ludhiana Total
Airtel Urban
173
248 421
Rural
72
108 180
BSNL Urban 88 50 34 72 56 122 422
Rural 37 21 14 31 24 53 180
HFCL Urban 87 50 35 72 56 123 423
Rural 38 21 14 31 24 52 180
Rel Comm Urban
180
243 423
Rural
102
78 180
All SPs Urban 175 100 422 144 112 736 1689
Rural 75 42 202 62 48 291 720
Airtel and Rel Comm have presence only in Chandigarh and Ludhiana and hence the sample has been
covered from these two SDCAs.
3.2.1.1 Mode of interview
As discussed above, two modes of interview were selected to cover the entire sample. While in rural
areas, only In-person interviews were conducted, in urban areas half of the survey was conducted
through telephonic interviews and remaining half through face to face interviews. Hence, minimum
65% of the sample was to be covered through In-person (Face to Face) and rest 35% were to be

Assessment of Customer perception of Service and Implementation & Punjab Service Area
Effectiveness of Telecom Consumers Protection and Redressal of Grievances Regulations October 2013
20
441, (Basement), Jangpura, Mathura Road, New Delhi – 110014, India
Email: [email protected], URL: www.consumer-voice.org
covered through Computer Assisted Telephonic Interviews (CATI). The table below shows the actual
sample breakup achieved with both the modes of interviews:
Punjab Service Area: Operator wise sample distribution with mode of interview
Operator Mode In Person CATI Total
Count Row N % Count Row N % Count
Airtel
Urban 211 50% 210 50% 421
Rural 180 100%
180
Total 391 65% 210 35% 601
BSNL
Urban 211 50% 211 50% 422
Rural 180 100%
180
Total 391 65% 211 35% 602
HFCL
Urban 211 50% 212 50% 423
Rural 180 100%
180
Total 391 65% 212 35% 603
Rel Comm
Urban 213 50% 210 50% 423
Rural 180 100%
180
Total 393 65% 210 35% 603
Total
Urban 846 50% 843 50% 1689
Rural 720 100%
720
Total 1566 65% 843 35% 2409
3.2.1.2 Type wise sample distribution
None of the Service Providers had prepaid customers for their Basic Wire-line service. Hence all the
postpaid customers were covered during the survey for each of the service providers.
3.2.1.3 Area wise sample distribution
As per the discussions with TRAI document, survey agencies were required to cover at least 30% of
the total sample rural areas. The following table shows the actual sample covered, based on that
the operator wise rural sample exchanges:
Punjab: AREA wise sample distribution
Urban Rural Total
Count Row N % Count Row N % Count
Airtel 421 70% 180 30% 601
BSNL 422 70% 180 30% 602
HFCL 423 70% 180 30% 603
Rel Comm 423 70% 180 30% 603
Total 1689 70% 720 30% 2409
Assessment of Customer perception of Service and Implementation & Punjab Service Area
Effectiveness of Telecom Consumers Protection and Redressal of Grievances Regulations October 2013
21
441, (Basement), Jangpura, Mathura Road, New Delhi – 110014, India
Email: [email protected], URL: www.consumer-voice.org
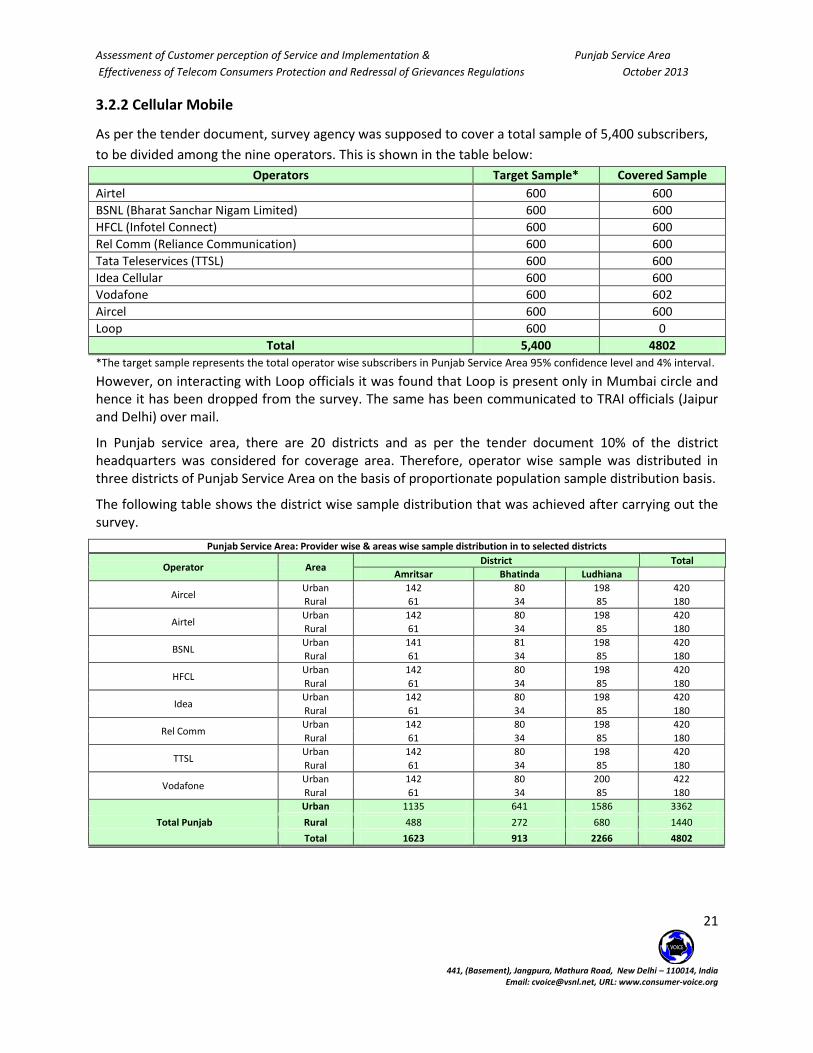
3.2.2 Cellular Mobile
As per the tender document, survey agency was supposed to cover a total sample of 5,400 subscribers,
to be divided among the nine operators. This is shown in the table below:
Operators Target Sample* Covered Sample
Airtel 600 600
BSNL (Bharat Sanchar Nigam Limited) 600 600
HFCL (Infotel Connect) 600 600
Rel Comm (Reliance Communication) 600 600
Tata Teleservices (TTSL) 600 600
Idea Cellular 600 600
Vodafone 600 602
Aircel 600 600
Loop 600 0
Total 5,400 4802
*The target sample represents the total operator wise subscribers in Punjab Service Area 95% confidence level and 4% interval.
However, on interacting with Loop officials it was found that Loop is present only in Mumbai circle and hence it has been dropped from the survey. The same has been communicated to TRAI officials (Jaipur and Delhi) over mail.
In Punjab service area, there are 20 districts and as per the tender document 10% of the district headquarters was considered for coverage area. Therefore, operator wise sample was distributed in three districts of Punjab Service Area on the basis of proportionate population sample distribution basis.
The following table shows the district wise sample distribution that was achieved after carrying out the survey.
Punjab Service Area: Provider wise & areas wise sample distribution in to selected districts
Operator Area District Total
Amritsar Bhatinda Ludhiana
Aircel Urban 142 80 198 420
Rural 61 34 85 180
Airtel Urban 142 80 198 420
Rural 61 34 85 180
BSNL Urban 141 81 198 420
Rural 61 34 85 180
HFCL Urban 142 80 198 420
Rural 61 34 85 180
Idea Urban 142 80 198 420
Rural 61 34 85 180
Rel Comm Urban 142 80 198 420
Rural 61 34 85 180
TTSL Urban 142 80 198 420
Rural 61 34 85 180
Vodafone Urban 142 80 200 422
Rural 61 34 85 180
Total Punjab
Urban 1135 641 1586 3362
Rural 488 272 680 1440
Total 1623 913 2266 4802
Assessment of Customer perception of Service and Implementation & Punjab Service Area
Effectiveness of Telecom Consumers Protection and Redressal of Grievances Regulations October 2013
22
441, (Basement), Jangpura, Mathura Road, New Delhi – 110014, India
Email: [email protected], URL: www.consumer-voice.org
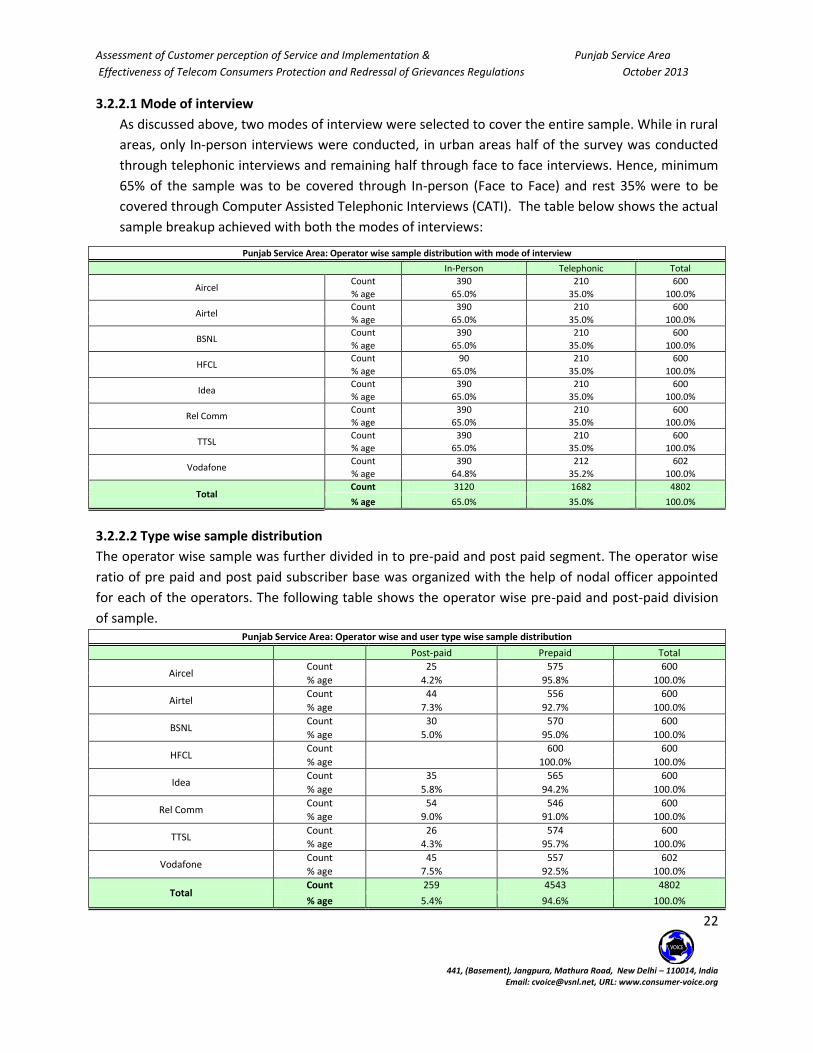
3.2.2.1 Mode of interview
As discussed above, two modes of interview were selected to cover the entire sample. While in rural
areas, only In-person interviews were conducted, in urban areas half of the survey was conducted
through telephonic interviews and remaining half through face to face interviews. Hence, minimum
65% of the sample was to be covered through In-person (Face to Face) and rest 35% were to be
covered through Computer Assisted Telephonic Interviews (CATI). The table below shows the actual
sample breakup achieved with both the modes of interviews:
Punjab Service Area: Operator wise sample distribution with mode of interview
In-Person Telephonic Total
Aircel Count 390 210 600
% age 65.0% 35.0% 100.0%
Airtel Count 390 210 600
% age 65.0% 35.0% 100.0%
BSNL Count 390 210 600
% age 65.0% 35.0% 100.0%
HFCL Count 90 210 600
% age 65.0% 35.0% 100.0%
Idea Count 390 210 600
% age 65.0% 35.0% 100.0%
Rel Comm Count 390 210 600
% age 65.0% 35.0% 100.0%
TTSL Count 390 210 600
% age 65.0% 35.0% 100.0%
Vodafone Count 390 212 602
% age 64.8% 35.2% 100.0%
Total Count 3120 1682 4802
% age 65.0% 35.0% 100.0%
3.2.2.2 Type wise sample distribution
The operator wise sample was further divided in to pre-paid and post paid segment. The operator wise
ratio of pre paid and post paid subscriber base was organized with the help of nodal officer appointed
for each of the operators. The following table shows the operator wise pre-paid and post-paid division
of sample. Punjab Service Area: Operator wise and user type wise sample distribution
Post-paid Prepaid Total
Aircel Count 25 575 600
% age 4.2% 95.8% 100.0%
Airtel Count 44 556 600
% age 7.3% 92.7% 100.0%
BSNL Count 30 570 600
% age 5.0% 95.0% 100.0%
HFCL Count
600 600
% age
100.0% 100.0%
Idea Count 35 565 600
% age 5.8% 94.2% 100.0%
Rel Comm Count 54 546 600
% age 9.0% 91.0% 100.0%
TTSL Count 26 574 600
% age 4.3% 95.7% 100.0%
Vodafone Count 45 557 602
% age 7.5% 92.5% 100.0%
Total Count 259 4543 4802
% age 5.4% 94.6% 100.0%

Assessment of Customer perception of Service and Implementation & Punjab Service Area
Effectiveness of Telecom Consumers Protection and Redressal of Grievances Regulations October 2013
23
441, (Basement), Jangpura, Mathura Road, New Delhi – 110014, India
Email: [email protected], URL: www.consumer-voice.org
3.2.2.3 Area wise distribution As per the discussions with TRAI officials, rural areas within the radius of 20 km from the district headquarters were to be covered. Based on that the operator wise rural sample covered is shown in the table below:
Punjab service area: Operator wise and area wise sample distribution
Rural Urban Total
Aircel Count 420 180 600
% age 70.0% 30.0% 100.0%
Airtel Count 420 180 600
% age 70.0% 30.0% 100.0%
BSNL Count 420 180 600
% age 70.0% 30.0% 100.0%
HFCL Count 420 180 600
% age 70.0% 30.0% 100.0%
Idea Count 420 180 600
% age 70.0% 30.0% 100.0%
Rel Comm Count 420 180 600
% age 70.0% 30.0% 100.0%
TTSL Count 420 180 600
% age 70.0% 30.0% 100.0%
Vodafone Count 422 180 602
% age 70.1% 29.9% 100.0%
Total Count 3362 1440 4802
% age 70.0% 30.0% 100.0%

Assessment of Customer perception of Service and Implementation & Punjab Service Area
Effectiveness of Telecom Consumers Protection and Redressal of Grievances Regulations October 2013
24
441, (Basement), Jangpura, Mathura Road, New Delhi – 110014, India
Email: [email protected], URL: www.consumer-voice.org
3.2.3 Broadband
In the case of Broadband, survey agency was required to obtain from Broadband operators, Central ISP
Node and total number of subscribers in each circle and then work out the sample to be covered. Based
on the number of subscribers the sample size was ascertained on the basis 95% confidence level and 3%
confidence interval.
Operators Target Sample* Covered Sample
Airtel 600 601
Bharat Sanchar Nigam Ltd. (BSNL) 600 602
Infotel Connect (HFCL) 600 602
Rel Communications (Rel Comm) 600 600
Total 2,400 2405
*The target sample represents the total operator wise subscribers in the Punjab with 95% confidence level and 4% confidence
interval.
Operator wise achieved sample is shown in the table below:
Punjab Broadband: Achieved Sample
Amritsar Bhatinda Chandigarh Firozepur Hoshiarpur Ludhiana Total
Airtel Urban
146
275 421
Rural
108
72 180
BSNL Urban 88 49 34 72 57 122 422
Rural 37 22 14 31 23 53 180
HFCL Urban 88 50 34 72 56 122 422
Rural 37 21 14 31 24 53 180
Rel Comm Urban
203
217 420
Rural
68
112 180
All SPs Urban 176 99 417 144 113 736 1685
Rural 74 43 204 62 47 290 720
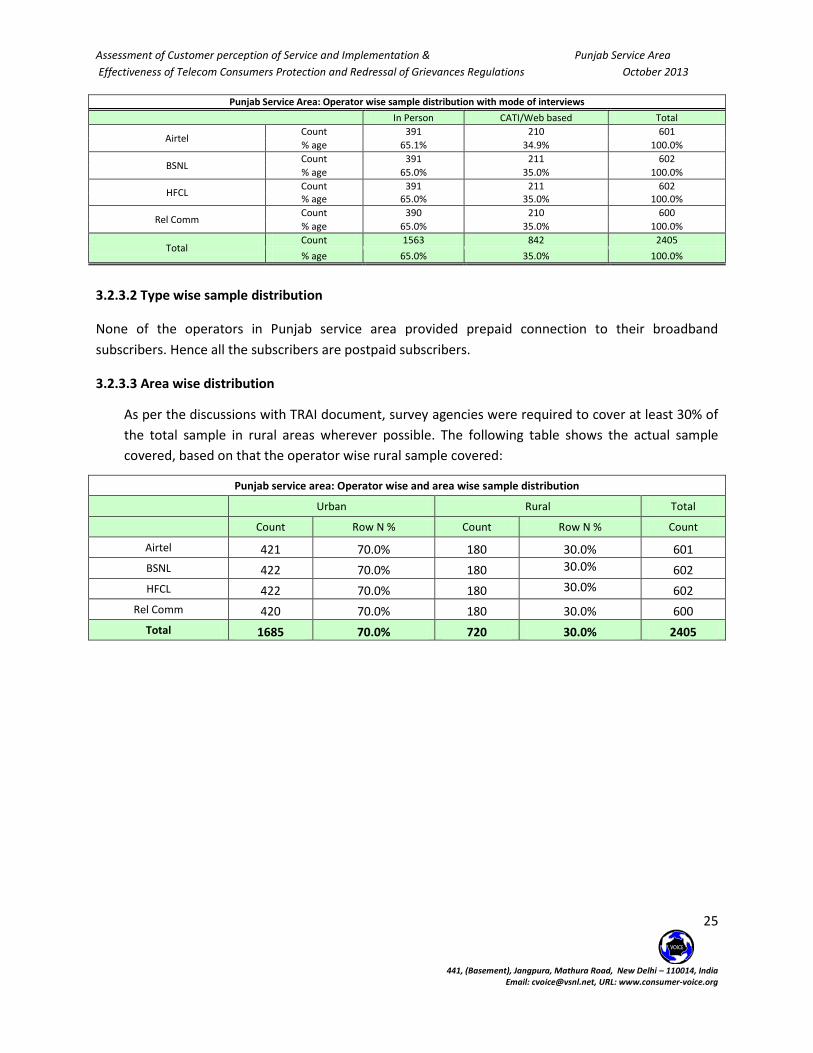
3.2.3.1 Mode of Interview: As per the tender document, in the urban areas at least 50% of the
observations/ interviews shall be based on personal interview basis and up to 50% through email or by
developing web based applications. VOICE, accordingly sent emails to the database of the operator wise
subscribers received from few operators and also the VOICE internal data base. However, as the number
of responses to the email sent was very low, it was mutually decided with the consultation of TRAI
officials that instead of sending e-mails, CATI would be used for the remaining interviews. The following
table shows the actual operators wise sample covered with the mode of interview.
Assessment of Customer perception of Service and Implementation & Punjab Service Area
Effectiveness of Telecom Consumers Protection and Redressal of Grievances Regulations October 2013
25
441, (Basement), Jangpura, Mathura Road, New Delhi – 110014, India
Email: [email protected], URL: www.consumer-voice.org
Punjab Service Area: Operator wise sample distribution with mode of interviews
In Person CATI/Web based Total
Airtel Count 391 210 601
% age 65.1% 34.9% 100.0%
BSNL Count 391 211 602
% age 65.0% 35.0% 100.0%
HFCL Count 391 211 602 % age 65.0% 35.0% 100.0%
Rel Comm Count 390 210 600
% age 65.0% 35.0% 100.0%
Total Count 1563 842 2405
% age 65.0% 35.0% 100.0%
3.2.3.2 Type wise sample distribution
None of the operators in Punjab service area provided prepaid connection to their broadband
subscribers. Hence all the subscribers are postpaid subscribers.
3.2.3.3 Area wise distribution
As per the discussions with TRAI document, survey agencies were required to cover at least 30% of
the total sample in rural areas wherever possible. The following table shows the actual sample
covered, based on that the operator wise rural sample covered:
Punjab service area: Operator wise and area wise sample distribution
Urban Rural Total
Count Row N % Count Row N % Count
Airtel 421 70.0% 180 30.0% 601
BSNL 422 70.0% 180 30.0% 602
HFCL 422 70.0% 180 30.0% 602
Rel Comm 420 70.0% 180 30.0% 600
Total 1685 70.0% 720 30.0% 2405

Assessment of Customer perception of Service and Implementation & Punjab Service Area
Effectiveness of Telecom Consumers Protection and Redressal of Grievances Regulations October 2013
26
441, (Basement), Jangpura, Mathura Road, New Delhi – 110014, India
Email: [email protected], URL: www.consumer-voice.org
3.3 Sample Characteristics
3.3.1 Basic Wire-line Service
3.3.1.1 Gender Profile Punjab Basic: Gender Profile
Male Female Total
Count % Count % Count
Airtel
Urban 256 60.8% 165 39.2% 421
Rural 163 90.6% 17 9.4% 180
Total 419 69.7% 182 30.3% 601
BSNL
Urban 355 84.1% 67 15.9% 422
Rural 144 80.0% 36 20.0% 180
Total 499 82.9% 103 17.1% 602
HFCL
Urban 384 90.8% 39 9.2% 423
Rural 162 90.0% 18 10.0% 180
Total 546 90.5% 57 9.5% 603
Rel Comm
Urban 336 79.4% 87 20.6% 423
Rural 159 88.3% 21 11.7% 180
Total 495 82.1% 108 17.9% 603
Total
Urban 1331 78.8% 358 21.2% 1689
Rural 628 87.2% 92 12.8% 720
Total 1959 81.3% 450 18.7% 2409
Altogether 2409 basic wire-line subscribers were covered in Punjab Service Area – 1689 in urban and 720 in rural areas.
Amongst 2409 basic wire-line subscribers 1959 (81.3%) were males and remaining 450 (18.7%) were females.
Highest percentage of females was found in urban area for Airtel (39.2%) and BSNL (20.0%) in rural area.
3.3.1.2 Age Profile Punjab Basic: Age Profile (in years)
Less than 25 years 25-34 years 35-44 years More than 45 years Total
Count % Count % Count % Count % Count
Airtel
Urban 41 9.7% 60 14.3% 119 28.3% 201 47.7% 421
Rural 0 0.0% 8 4.4% 87 48.3% 85 47.2% 180
Total 41 6.8% 68 11.3% 206 34.3% 286 47.6% 601
BSNL
Urban 27 6.4% 50 11.8% 141 33.4% 204 48.3% 422
Rural 8 4.4% 36 20.0% 56 31.1% 80 44.4% 180
Total 35 5.8% 86 14.3% 197 32.7% 284 47.2% 602
HFCL
Urban 20 4.7% 117 27.7% 169 40.0% 117 27.7% 423
Rural 6 3.3% 49 27.2% 91 50.6% 34 18.9% 180
Total 26 4.3% 166 27.5% 260 43.1% 151 25.0% 603
Rel Comm
Urban 22 5.2% 141 33.3% 143 33.8% 117 27.7% 423
Rural 4 2.2% 43 23.9% 81 45.0% 52 28.9% 180
Total 26 4.3% 184 30.5% 224 37.1% 169 28.0% 603
Total
Urban 110 6.5% 368 21.8% 572 33.9% 639 37.8% 1689
Rural 18 2.5% 136 18.9% 315 43.8% 251 34.9% 720
Total 128 5.3% 504 20.9% 887 36.8% 890 36.9% 2409
Majority belonged to the age group of over 45 years (36.9%), followed by 35-44 years (36.8%)
However in rural areas majorly were in age group of 35-44 years (43.8%)
In urban area, maximum respondents(37.8%) were from the age group of more than 45 years

Assessment of Customer perception of Service and Implementation & Punjab Service Area
Effectiveness of Telecom Consumers Protection and Redressal of Grievances Regulations October 2013
27
441, (Basement), Jangpura, Mathura Road, New Delhi – 110014, India
Email: [email protected], URL: www.consumer-voice.org
3.3.1.3 Occupational Structure Punjab Basic: Occupational structure
Service
Business/Self Employed
Student Housewife Retired Others Total
Count % Count % Count % Count % Count % Count % Count
Airtel
Urban 182 43.2% 66 15.7% 22 5.2% 120 28.5% 28 6.7% 3 0.7% 421
Rural 120 66.7% 31 17.2% 0 0.0% 16 8.9% 2 1.1% 11 6.1% 180
Total 302 50.2% 97 16.1% 22 3.7% 136 22.6% 30 5.0% 14 2.3% 601
BSNL
Urban 147 34.8% 188 44.5% 12 2.8% 53 12.6% 13 3.1% 9 2.1% 422
Rural 50 27.8% 93 51.7% 4 2.2% 24 13.3% 3 1.7% 6 3.3% 180
Total 197 32.7% 281 46.7% 16 2.7% 77 12.8% 16 2.7% 15 2.5% 602
HFCL
Urban 142 33.6% 222 52.5% 1 0.2% 30 7.1% 12 2.8% 16 3.8% 423
Rural 61 33.9% 95 52.8% 0 0.0% 9 5.0% 2 1.1% 13 7.2% 180
Total 203 33.7% 317 52.6% 1 0.2% 39 6.5% 14 2.3% 29 4.8% 603
Rel Comm
Urban 155 36.6% 164 38.8% 9 2.1% 65 15.4% 9 2.1% 21 5.0% 423
Rural 40 22.2% 105 58.3% 1 0.6% 9 5.0% 5 2.8% 20 11.1% 180
Total 195 32.3% 269 44.6% 10 1.7% 74 12.3% 14 2.3% 41 6.8% 603
Total
Urban 626 37.1% 640 37.9% 44 2.6% 268 15.9% 62 3.7% 49 2.9% 1689
Rural 271 37.6% 324 45.0% 5 0.7% 58 8.1% 12 1.7% 50 6.9% 720
Total 897 37.2% 964 40.0% 49 2.0% 326 13.5% 74 3.1% 99 4.1% 2409
Majority of the covered respondents were in business (40.0%) and service (37.2%). Around 13.5% were housewives 3.1% retired and 2.0% were students.
3.3.1.4 Usage Type Punjab Basic: Usage type
Residential Commercial Total
Count % Count % Count
Airtel
Urban 421 100.0% 0 0.0% 421
Rural 180 100.0% 0 0.0% 180
Total 601 100.0% 0 0.0% 601
BSNL
Urban 383 90.8% 39 9.2% 422
Rural 162 90.0% 18 10.0% 180
Total 545 90.5% 57 9.5% 602
HFCL
Urban 361 85.3% 62 14.7% 423
Rural 178 98.9% 2 1.1% 180
Total 539 89.4% 64 10.6% 603
Rel Comm
Urban 422 99.8% 1 0.2% 423
Rural 180 100.0% 0 0.0% 180
Total 602 99.8% 1 0.2% 603
Total
Urban 1587 94.0% 102 6.0% 1689
Rural 700 97.2% 20 2.8% 720
Total 2287 94.9% 122 5.1% 2409
The basic wire line service was mainly used for residential purpose in Punjab Service Area as it was reported by 94.9% of the total sample covered.
Airtel was not at all being used for commercial purpose in Punjab service area followed by very less (0.2%) for Rel comm.

Assessment of Customer perception of Service and Implementation & Punjab Service Area
Effectiveness of Telecom Consumers Protection and Redressal of Grievances Regulations October 2013
28
441, (Basement), Jangpura, Mathura Road, New Delhi – 110014, India
Email: [email protected], URL: www.consumer-voice.org
3.3.2 Cellular Service
3.3.2.1 Gender Profile
Punjab Cellular: Gender Profile
Male Female
Count % Count % Count
Aircel
Urban 367 87.4% 53 12.6% 420
Rural 163 90.6% 17 9.4% 180
Total 530 88.3% 70 11.7% 600
Airtel
Urban 335 79.8% 85 20.2% 420
Rural 156 86.7% 24 13.3% 180
Total 491 81.8% 109 18.2% 600
BSNL
Urban 354 84.3% 66 15.7% 420
Rural 171 95.0% 9 5.0% 180
Total 525 87.5% 75 12.5% 600
HFCL
Urban 402 95.7% 18 4.3% 420
Rural 168 93.3% 12 6.7% 180
Total 570 95.0% 30 5.0% 600
Idea
Urban 359 85.5% 61 14.5% 420
Rural 164 91.1% 16 8.9% 180
Total 523 87.2% 77 12.8% 600
Reliance
Urban 382 91.0% 38 9.0% 420
Rural 167 92.8% 13 7.2% 180
Total 549 91.5% 51 8.5% 600
TTSL
Urban 356 84.8% 64 15.2% 420
Rural 150 83.3% 30 16.7% 180
Total 506 84.3% 94 15.7% 600
Vodafone
Urban 339 80.3% 83 19.7% 422
Rural 154 85.6% 26 14.4% 180
Total 493 81.9% 109 18.1% 602
Total
Urban 2894 86.1% 468 13.9% 3362
Rural 1293 89.8% 147 10.2% 1440
Total 4187 87.2% 615 12.8% 4802
Altogether 4802 cellular customers were covered in Punjab Service Area.
Of them 4187 (87.2%) were males and remaining 615 (12.8%) were females.
Highest percentage of female sample was covered in the case of Airtel (18.2%).
In the case of rural area highest female sample came from TTSL (16.7%) and in urban area from Airtel (20.2%)

Assessment of Customer perception of Service and Implementation & Punjab Service Area
Effectiveness of Telecom Consumers Protection and Redressal of Grievances Regulations October 2013
29
441, (Basement), Jangpura, Mathura Road, New Delhi – 110014, India
Email: [email protected], URL: www.consumer-voice.org
3.3.2.2 Age Profile
Punjab Cellular : Age profile (in years)
Less than 25 years 25-34 years 35-44 years More than 45 years Total
Count % Count % Count % Count % Count
Aircel
Urban 134 31.9% 167 39.8% 74 17.6% 45 10.7% 420
Rural 35 19.4% 70 38.9% 30 16.7% 45 25.0% 180
Total 169 28.2% 237 39.5% 104 17.3% 90 15.0% 600
Airtel
Urban 111 26.4% 162 38.6% 95 22.6% 52 12.4% 420
Rural 37 20.6% 47 26.1% 65 36.1% 31 17.2% 180
Total 148 24.7% 209 34.8% 160 26.7% 83 13.8% 600
BSNL
Urban 37 8.8% 110 26.2% 146 34.8% 127 30.2% 420
Rural 14 7.8% 50 27.8% 59 32.8% 57 31.7% 180
Total 51 8.5% 160 26.7% 205 34.2% 184 30.7% 600
HFCL
Urban 27 6.4% 139 33.1% 138 32.9% 116 27.6% 420
Rural 17 9.4% 55 30.6% 63 35.0% 45 25.0% 180
Total 44 7.3% 194 32.3% 201 33.5% 161 26.8% 600
Idea
Urban 70 16.7% 91 21.7% 89 21.2% 170 40.5% 420
Rural 19 10.6% 46 25.6% 77 42.8% 38 21.1% 180
Total 89 14.8% 137 22.8% 166 27.7% 208 34.7% 600
Reliance
Urban 79 18.8% 145 34.5% 120 28.6% 76 18.1% 420
Rural 8 4.4% 35 19.4% 87 48.3% 50 27.8% 180
Total 87 14.5% 180 30.0% 207 34.5% 126 21.0% 600
TTSL
Urban 108 25.7% 142 33.8% 115 27.4% 55 13.1% 420
Rural 13 7.2% 45 25.0% 71 39.4% 51 28.3% 180
Total 121 20.2% 187 31.2% 186 31.0% 106 17.7% 600
Vodafone
Urban 143 33.9% 126 29.9% 79 18.7% 74 17.5% 422
Rural 44 24.4% 65 36.1% 38 21.1% 33 18.3% 180
Total 187 31.1% 191 31.7% 117 19.4% 107 17.8% 602
Total
Urban 709 21.1% 1082 32.2% 856 25.5% 715 21.3% 3362
Rural 187 13.0% 413 28.7% 490 34.0% 350 24.3% 1440
Total 896 18.7% 1495 31.1% 1346 28.0% 1065 22.2% 4802
Majority of respondents belonged to the age group 25-34 years (31.1%), followed by 35-44 years (28.0%)
In urban areas maximum respondents (32.2%) belonged to the age group of 25-34 years whereas in rural areas majority of the respondents (34.0%) belonged to the age group of 35-44 years.
Assessment of Customer perception of Service and Implementation & Punjab Service Area
Effectiveness of Telecom Consumers Protection and Redressal of Grievances Regulations October 2013
30
441, (Basement), Jangpura, Mathura Road, New Delhi – 110014, India
Email: [email protected], URL: www.consumer-voice.org
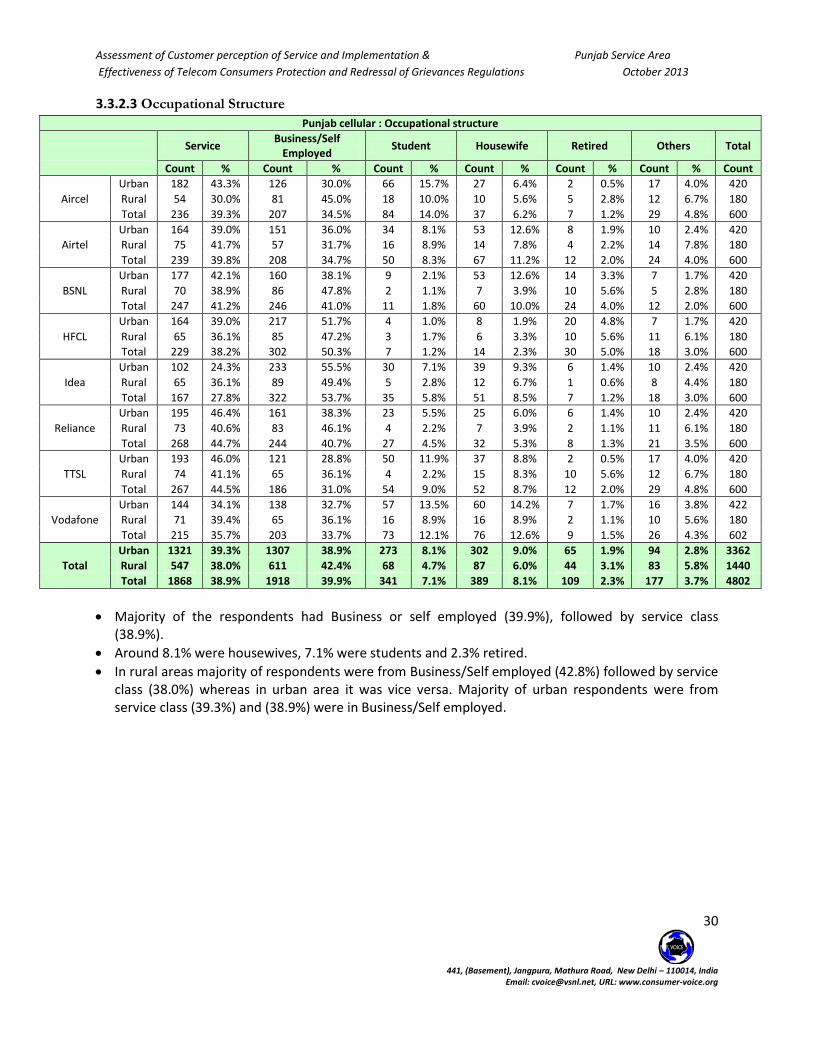
3.3.2.3 Occupational Structure
Punjab cellular : Occupational structure
Service
Business/Self Employed
Student Housewife Retired Others Total
Count % Count % Count % Count % Count % Count % Count
Aircel
Urban 182 43.3% 126 30.0% 66 15.7% 27 6.4% 2 0.5% 17 4.0% 420
Rural 54 30.0% 81 45.0% 18 10.0% 10 5.6% 5 2.8% 12 6.7% 180
Total 236 39.3% 207 34.5% 84 14.0% 37 6.2% 7 1.2% 29 4.8% 600
Airtel
Urban 164 39.0% 151 36.0% 34 8.1% 53 12.6% 8 1.9% 10 2.4% 420
Rural 75 41.7% 57 31.7% 16 8.9% 14 7.8% 4 2.2% 14 7.8% 180
Total 239 39.8% 208 34.7% 50 8.3% 67 11.2% 12 2.0% 24 4.0% 600
BSNL
Urban 177 42.1% 160 38.1% 9 2.1% 53 12.6% 14 3.3% 7 1.7% 420
Rural 70 38.9% 86 47.8% 2 1.1% 7 3.9% 10 5.6% 5 2.8% 180
Total 247 41.2% 246 41.0% 11 1.8% 60 10.0% 24 4.0% 12 2.0% 600
HFCL
Urban 164 39.0% 217 51.7% 4 1.0% 8 1.9% 20 4.8% 7 1.7% 420
Rural 65 36.1% 85 47.2% 3 1.7% 6 3.3% 10 5.6% 11 6.1% 180
Total 229 38.2% 302 50.3% 7 1.2% 14 2.3% 30 5.0% 18 3.0% 600
Idea
Urban 102 24.3% 233 55.5% 30 7.1% 39 9.3% 6 1.4% 10 2.4% 420
Rural 65 36.1% 89 49.4% 5 2.8% 12 6.7% 1 0.6% 8 4.4% 180
Total 167 27.8% 322 53.7% 35 5.8% 51 8.5% 7 1.2% 18 3.0% 600
Reliance
Urban 195 46.4% 161 38.3% 23 5.5% 25 6.0% 6 1.4% 10 2.4% 420
Rural 73 40.6% 83 46.1% 4 2.2% 7 3.9% 2 1.1% 11 6.1% 180
Total 268 44.7% 244 40.7% 27 4.5% 32 5.3% 8 1.3% 21 3.5% 600
TTSL
Urban 193 46.0% 121 28.8% 50 11.9% 37 8.8% 2 0.5% 17 4.0% 420
Rural 74 41.1% 65 36.1% 4 2.2% 15 8.3% 10 5.6% 12 6.7% 180
Total 267 44.5% 186 31.0% 54 9.0% 52 8.7% 12 2.0% 29 4.8% 600
Vodafone
Urban 144 34.1% 138 32.7% 57 13.5% 60 14.2% 7 1.7% 16 3.8% 422
Rural 71 39.4% 65 36.1% 16 8.9% 16 8.9% 2 1.1% 10 5.6% 180
Total 215 35.7% 203 33.7% 73 12.1% 76 12.6% 9 1.5% 26 4.3% 602
Total
Urban 1321 39.3% 1307 38.9% 273 8.1% 302 9.0% 65 1.9% 94 2.8% 3362
Rural 547 38.0% 611 42.4% 68 4.7% 87 6.0% 44 3.1% 83 5.8% 1440
Total 1868 38.9% 1918 39.9% 341 7.1% 389 8.1% 109 2.3% 177 3.7% 4802
Majority of the respondents had Business or self employed (39.9%), followed by service class (38.9%).
Around 8.1% were housewives, 7.1% were students and 2.3% retired.
In rural areas majority of respondents were from Business/Self employed (42.8%) followed by service class (38.0%) whereas in urban area it was vice versa. Majority of urban respondents were from service class (39.3%) and (38.9%) were in Business/Self employed.

Assessment of Customer perception of Service and Implementation & Punjab Service Area
Effectiveness of Telecom Consumers Protection and Redressal of Grievances Regulations October 2013
31
441, (Basement), Jangpura, Mathura Road, New Delhi – 110014, India
Email: [email protected], URL: www.consumer-voice.org
3.3.2.4 Usage Type
Punjab cellular: Usage type
Residential Commercial Total
Count % Count % Count
Aircel
Urban 403 96.0% 17 4.0% 420
Rural 176 97.8% 4 2.2% 180
Total 579 96.5% 21 3.5% 600
Airtel
Urban 387 92.1% 33 7.9% 420
Rural 174 96.7% 6 3.3% 180
Total 561 93.5% 39 6.5% 600
BSNL
Urban 409 97.4% 11 2.6% 420
Rural 153 85.0% 27 15.0% 180
Total 562 93.7% 38 6.3% 600
HFCL
Urban 407 96.9% 13 3.1% 420
Rural 178 98.9% 2 1.1% 180
Total 585 97.5% 15 2.5% 600
Idea
Urban 395 94.0% 25 6.0% 420
Rural 166 92.2% 14 7.8% 180
Total 561 93.5% 39 6.5% 600
Reliance
Urban 396 94.3% 24 5.7% 420
Rural 178 98.9% 2 1.1% 180
Total 574 95.7% 26 4.3% 600
TTSL
Urban 403 96.0% 17 4.0% 420
Rural 178 98.9% 2 1.1% 180
Total 581 96.8% 19 3.2% 600
Vodafone
Urban 383 90.8% 39 9.2% 422
Rural 167 92.8% 13 7.2% 180
Total 550 91.4% 52 8.6% 602
Total
Urban 3183 94.7% 179 5.3% 3362
Rural 1370 95.1% 70 4.9% 1440
Total 4553 94.8% 249 5.2% 4802
Only 5.2% (249) were found to be using for commercial purpose (usage type). Maximum belonged to
Vodafone subscribers – (8.6%, 52).

Assessment of Customer perception of Service and Implementation & Punjab Service Area
Effectiveness of Telecom Consumers Protection and Redressal of Grievances Regulations October 2013
32
441, (Basement), Jangpura, Mathura Road, New Delhi – 110014, India
Email: [email protected], URL: www.consumer-voice.org
3.3.3 Broadband service
3.3.3.1 Gender Profile Punjab Broadband: Gender Profile
Service Provider Male Female Total
Count % Count % Count
Airtel
Urban 265 62.9% 156 37.1% 421
Rural 170 94.4% 10 5.6% 180
Total 435 72.4% 166 27.6% 601
BSNL
Urban 365 86.5% 57 13.5% 422
Rural 168 93.3% 12 6.7% 180
Total 533 88.5% 69 11.5% 602
HFCL
Urban 408 96.7% 14 3.3% 422
Rural 176 97.8% 4 2.2% 180
Total 584 97.0% 18 3.0% 602
Reliance
Urban 352 83.8% 68 16.2% 420
Rural 163 90.6% 17 9.4% 180
Total 515 85.8% 85 14.2% 600
Total
Urban 1390 82.5% 295 17.5% 1685
Rural 677 94.0% 43 6.0% 720
Total 2067 85.9% 338 14.1% 2405
Altogether 2405 broadband subscribers were covered in Punjab Service Area – 1685 in urban and 720 in rural areas.
Amongst them 2067 (85.9%) were males and remaining 338 (14.1%) were females.
Highest percentage of females was from Airtel (37.1%) in urban areas and Rel Comm (19.4%) in rural area.
3.3.3.2 Age Profile Punjab Broadband: Age Profile( in years)
Service Provider Less than 25 years 25-34 years 35-44 years More than 45 years Total
Count % Count % Count % Count % Count
Airtel
Urban 36 8.6% 54 12.8% 113 26.8% 218 51.8% 421
Rural 0 0.0% 11 6.1% 74 41.1% 95 52.8% 180
Total 36 6.0% 65 10.8% 187 31.1% 313 52.1% 601
BSNL
Urban 2 0.5% 29 6.9% 164 38.9% 227 53.8% 422
Rural 0 0.0% 5 2.8% 100 55.6% 75 41.7% 180
Total 2 0.3% 34 5.6% 264 43.9% 302 50.2% 602
HFCL
Urban 19 4.5% 147 34.8% 130 30.8% 126 29.9% 422
Rural 5 2.8% 49 27.2% 77 42.8% 49 27.2% 180
Total 24 4.0% 196 32.6% 207 34.4% 175 29.1% 602
Reliance
Urban 38 9.0% 182 43.3% 109 26.0% 91 21.7% 420
Rural 23 12.8% 75 41.7% 46 25.6% 36 20.0% 180
Total 61 10.2% 257 42.8% 155 25.8% 127 21.2% 600
Total
Urban 95 5.6% 412 24.5% 516 30.6% 662 39.3% 1685
Rural 28 3.9% 140 19.4% 297 41.2% 255 35.4% 720
Total 123 5.1% 552 23.0% 813 33.8% 917 38.1% 2405
Majority belonged to the age group of more than 45 years (38.1%), followed by 35-44 years (33.8%).
In rural areas maximum customers were from the age group of 35-44 years (41.2%) and More than 45 years for urban areas (39.3%)

Assessment of Customer perception of Service and Implementation & Punjab Service Area
Effectiveness of Telecom Consumers Protection and Redressal of Grievances Regulations October 2013
33
441, (Basement), Jangpura, Mathura Road, New Delhi – 110014, India
Email: [email protected], URL: www.consumer-voice.org
3.3.1.3 Occupational Structure Punjab Broadband: Occupation structure
Service Provider Service
Business/Self Employed
Student Housewife Retired Others Total
Count % Count % Count % Count % Count % Count % Count
Airtel
Urban 178 42.3% 73 17.3% 19 4.5% 121 28.7% 24 5.7% 6 1.4% 421
Rural 114 63.3% 47 26.1% 0 0.0% 9 5.0% 4 2.2% 6 3.3% 180
Total 292 48.6% 120 20.0% 19 3.2% 130 21.6% 28 4.7% 12 2.0% 601
BSNL
Urban 232 55.0% 127 30.1% 1 0.2% 51 12.1% 6 1.4% 5 1.2% 422
Rural 85 47.2% 76 42.2% 0 0.0% 12 6.7% 1 0.6% 6 3.3% 180
Total 317 52.7% 203 33.7% 1 0.2% 63 10.5% 7 1.2% 11 1.8% 602
HFCL
Urban 109 25.8% 279 66.1% 11 2.6% 10 2.4% 2 0.5% 11 2.6% 422
Rural 56 31.1% 111 61.7% 8 4.4% 0 0.0% 1 0.6% 4 2.2% 180
Total 165 27.4% 390 64.8% 19 3.2% 10 1.7% 3 0.5% 15 2.5% 602
Reliance
Urban 230 54.8% 89 21.2% 14 3.3% 54 12.9% 3 0.7% 30 7.1% 420
Rural 109 60.6% 36 20.0% 3 1.7% 17 9.4% 0 0.0% 15 8.3% 180
Total 339 56.5% 125 20.8% 17 2.8% 71 11.8% 3 0.5% 45 7.5% 600
Total
Urban 749 44.5% 568 33.7% 45 2.7% 236 14.0% 35 2.1% 52 3.1% 1685
Rural 364 50.6% 270 37.5% 11 1.5% 38 5.3% 6 0.8% 31 4.3% 720
Total 1113 46.3% 838 34.8% 56 2.3% 274 11.4% 41 1.7% 83 3.5% 2405
Majority of the covered respondents were in service (46.3%) and business (34.8%). Around 11.4% were housewives, Students (2.3%) and (1.7%)retired.
3.3.3.4 Usage Type Punjab Broadband: Usage type
Service Provider Residential Commercial Total
Count Row N % Count Row N % Count
Airtel
Urban 405 96.2% 16 3.8% 421
Rural 179 99.4% 1 0.6% 180
Total 584 97.2% 17 2.8% 601
BSNL
Urban 416 98.6% 6 1.4% 422
Rural 180 100.0% 0 0.0% 180
Total 596 99.0% 6 1.0% 602
HFCL
Urban 422 100.0% 0 0.0% 422
Rural 180 100.0% 0 0.0% 180
Total 602 100.0% 0 0.0% 602
Reliance
Urban 418 99.5% 2 0.5% 420
Rural 180 100.0% 0 0.0% 180
Total 598 99.7% 2 0.3% 600
Total
Urban 1661 98.6% 24 1.4% 1685
Rural 719 99.9% 1 0.1% 720
Total 2380 99.0% 25 1.0% 2405
Overall, 99.0% of the respondents were using their broadband service for residential purpose in Punjab Service Area and 1.0% for commercial purpose.

Assessment of Customer perception of Service and Implementation & Punjab Service Area
Effectiveness of Telecom Consumers Protection and Redressal of Grievances Regulations October 2013
34
441, (Basement), Jangpura, Mathura Road, New Delhi – 110014, India
Email: [email protected], URL: www.consumer-voice.org
4
CUSTOMER PERCEPTION OF TELECOM SERVICE
DETAIL REPORT

Assessment of Customer perception of Service and Implementation & Punjab Service Area
Effectiveness of Telecom Consumers Protection and Redressal of Grievances Regulations October 2013
35
441, (Basement), Jangpura, Mathura Road, New Delhi – 110014, India
Email: [email protected], URL: www.consumer-voice.org
4.1 PERFORMANCE COMPLIANCE 4.1.1 PERFORMANCE COMPLIANCE CSS – Basic Service (Wireline), Punjab Service Area The following table shows the performance of Basic service operators in the service area of Punjab on various parameters.
CSS Wireline (SERVICE AREA -Punjab) - Parameter Based Performance Compliance
Operator Area
Sample
Size
Customers
Satisfied
With
Provision
of service
Customers satisfied
with Billing
performance Customers
satisfied
with Help
Services
Customers
satisfied
with
Network
performance
reliability
and
availability
Customers
satisfied
with
Maintain-
ability
Customers
Satisfied
with
Supple-
mentary
services
Customers
satisfied
with
overall
services Post-paid
Pre-
paid
Benchmark >90% >95% >95% >90% >95% >95% >90% >90%
SERVICE AREA – Punjab
Airtel
Urban 421 98.9% 99.6% NA 96.3% 97.4% 98.6% 79.1% 99.3%
Rural 180 99.6% 98.5% NA 99.7% 98.3% 97.8% 90.2% 97.8%
Overall 601 99.1% 95.1% NA 97.3% 97.7% 98.3% 82.5% 98.8%
BSNL
Urban 422 96.1% 98.1% NA 93.1% 93.6% 97.2% 59.5% 97.6%
Rural 180 98.0% 96.0% NA 94.9% 97.4% 96.7% 73.6% 98.9%
Overall 602 96.7% 98.4% NA 93.6% 94.7% 97.0% 62.5% 98.0%
HFCL
Urban 423 99.5% 99.4% NA 96.5% 97.6% 97.3% 76.7% 98.6%
Rural 180 99.8% 98.7% NA 99.4% 98.5% 98.1% 83.0% 97.8%
Overall 603 99.6% 98.4% NA 97.4% 97.9% 97.5% 79.5% 98.3%
Reliance
Urban 423 99.5% 98.1% NA 97.9% 97.9% 97.9% 63.2% 99.8%
Rural 180 98.5% 98.3% NA 99.0% 99.1% 98.3% 90.5% 98.9%
Overall 603 99.2% 97.5% NA 98.2% 98.2% 98.0% 67.4% 99.5%
The Condition of basic telecom services, in terms of consumer perception is good in Punjab. All the operators (Airtel, BSNL, HFCL and Reliance) were able to meet the TRAI prescribed benchmark on almost all of the parameters – in rural as well as urban areas.
All the four operators met the benchmark on Provision of Services, Postpaid Services, Help Services, Network Availability, Maintainability and Overall Services. However except Airtel and Reliance in Rural Area no other could meet the benchmark for Supplementary Services.
The performance of Airtel and Reliance on Supplementary Services had met the benchmark of 90% in Rural area. However, on given parameters it could not meet the benchmark only in Urban area.
The analysis reveals that the quality of service of nearly both operators Airtel and Reliance in Punjab service area is quite better than the other two BSNL and HFCL, as per the TRAI benchmark standards.

Assessment of Customer perception of Service and Implementation & Punjab Service Area
Effectiveness of Telecom Consumers Protection and Redressal of Grievances Regulations October 2013
36
441, (Basement), Jangpura, Mathura Road, New Delhi – 110014, India
Email: [email protected], URL: www.consumer-voice.org
4.1.2 PERFORMANCE COMPLIANCE (CSS) – Cellular Mobile, PUNJAB Service Area
The following table shows the performance of cellular operators in PUNJAB Service Area on various parameters.
CSS Cellular (SERVICE AREA - Punjab) - Parameter Based Performance Compliance
Operator Area
Sample Size
Customers Satisfied With Provision of service
Customers satisfied with Billing performance
Customers satisfied with Help Services
Customers satisfied with Network performance reliability and availability
Customers satisfied with Maintain-ability
CustomerSatisfied with Supple-mentary services
Customers satisfied with overall services
Post-paid
Pre-paid
Benchmark >90% >95% >95% >90% >95% >95% >90% >90%
SERVICE AREA – Punjab
Aircel
Urban 420 70.4% 74.7% 74.2% 62.9% 61.3% 79.8% 78.2% 71.4%
Rural 180 97.0%
89.3% 76.3% 80.2% 89.7% 77.9% 93.3%
Total 600 78.4% 74.7% 79.0% 66.9% 66.9% 82.8% 78.1% 78.0%
Airtel
Urban 420 83.9% 87.5% 81.0% 78.6% 82.0% 89.2% 82.9% 84.3%
Rural 180 94.6% 100.0% 89.9% 95.6% 97.6% 96.1% 98.3% 97.2%
Total 600 87.1% 88.6% 83.8% 83.7% 86.7% 91.3% 87.1% 88.2%
BSNL
Urban 420 98.2% 81.0% 92.6% 94.9% 95.2% 93.0% 82.0% 95.7%
Rural 180 99.1% 100.0% 92.3% 91.8% 96.3% 92.8% 92.9% 98.3%
Total 600 98.4% 82.2% 92.5% 94.0% 95.6% 92.9% 84.6% 96.5%
HFCL
Urban 420 94.9%
89.8% 92.9% 92.9% 93.7% 87.6% 96.7%
Rural 180 98.9%
96.0% 91.0% 93.3% 94.7% 95.5% 96.1%
Total 600 96.1%
91.7% 92.3% 93.0% 94.0% 90.2% 96.5%
Idea
Urban 420 88.7% 83.3% 87.6% 82.7% 79.8% 87.9% 90.8% 83.8%
Rural 180 98.7% 100.0% 95.1% 88.9% 86.7% 85.8% 74.2% 82.2%
Total 600 91.7% 83.8% 90.0% 84.6% 81.8% 87.3% 86.2% 83.3%
Reliance
Urban 420 95.6% 91.5% 85.7% 91.0% 90.9% 94.3% 94.5% 98.6%
Rural 180 95.7% 81.0% 92.6% 84.9% 85.2% 91.1% 78.6% 95.6%
Total 600 95.6% 90.1% 87.9% 89.1% 89.2% 93.3% 91.3% 97.7%
TTSL
Urban 420 70.6% 66.7% 65.3% 64.5% 60.6% 67.0% 75.9% 79.0%
Rural 180 97.6% 100.0% 95.7% 94.9% 91.7% 91.9% 97.1% 92.2%
Total 600 78.7% 67.9% 74.8% 73.6% 69.9% 74.5% 83.7% 83.0%
Vodafone
Urban 422 78.9% 79.3% 74.4% 65.5% 74.6% 86.0% 76.7% 84.8%
Rural 180 97.0% 79.2% 94.8% 94.3% 94.8% 94.4% 98.1% 97.8%
Total 602 84.3% 79.3% 80.7% 74.1% 80.7% 88.5% 83.3% 88.7%
The analysis reveals that in terms of meeting the benchmark, none of the eight operators were able to meet the benchmark on all the standards prescribed by TRAI.
BSNL was the only operator to meet the benchmark on Help services and availability and reliability of network.
HFCL could meet the benchmark on Help services. Whereas, Vodafone performance on help services attained good performance in rural areas.
None of the operators could meet benchmark on maintainability of services – fault repair services. On billing service, the performance of almost all the operators, esp in the urban area of Punjab were below the prescribed benchmark
On satisfaction with overall services only BSNL, HFCL and Reliance could meet the benchmark. The analysis reveals that, BSNL is the only operator whose services are apparently better than other seven operators in Punjab Service Area. However its performance on billing service is critical

Assessment of Customer perception of Service and Implementation & Punjab Service Area
Effectiveness of Telecom Consumers Protection and Redressal of Grievances Regulations October 2013
37
441, (Basement), Jangpura, Mathura Road, New Delhi – 110014, India
Email: [email protected], URL: www.consumer-voice.org
4.1 PERFORMANCE COMPLIANCE 4.1.3 PERFORMANCE COMPLIANCE CSS – Broadband, Punjab Service Area The following table shows the performance of Broadband service operators in the service area of Punjab on various parameters.
CSS Wireline (SERVICE AREA -Punjab) - Parameter Based Performance Compliance
Operator Area
Sample
Size
Customers
Satisfied
With
Provision
of service
Customers satisfied
with Billing
performance Customers
satisfied
with Help
Services
Customers
satisfied
with
Network
performance
reliability
and
availability
Customers
satisfied
with
Maintain-
ability
Customers
Satisfied
with
Supple-
mentary
services
Customers
satisfied
with overall
services Post-paid
Pre-
paid
Benchmark 90% 90% 90% 90% 85% 85% 85% 85%
SERVICE AREA – Punjab
BHARTI
AIRTEL
Urban 421 99.5% 96.4% NA 94.7% 96.0% 95.7% 30.4% 90.3%
Rural 180 98.7% 96.5% NA 91.5% 92.5% 93.1% 30.9% 88.3%
Overall 601 99.3% 96.4% NA 93.8% 94.9% 94.9% 30.5% 89.7%
BSNL
Urban 422 96.6% 95.8% NA 89.9% 92.5% 91.0% 34.8% 89.1%
Rural 180 95.6% 95.9% NA 90.1% 91.4% 90.0% 29.7% 87.2%
Overall 602 96.3% 95.8% NA 90.0% 92.2% 90.7% 32.7% 88.5%
HFCL
Urban 422 98.7% 95.7% NA 87.0% 90.3% 87.0% 100.0% 89.3%
Rural 180 98.7% 94.3% NA 85.8% 89.7% 86.7% 100.0% 90.0%
Overall 602 98.7% 95.2% NA 86.7% 90.1% 86.9% 100.0% 89.5%
Reliance
Urban 420 91.9% 96.7% NA 94.5% 96.0% 94.9% 55.6% 90.7%
Rural 180 96.7% 96.1% NA 95.8% 96.9% 97.5% 23.6% 91.1%
Overall 600 93.3% 96.6% NA 94.9% 96.3% 95.7% 44.8% 90.8%
The Condition of Broadband services, in terms of consumer perception is good in Punjab. All the operators (Bharti Airtel, BSNL, HFCL and Reliance) were able to meet the TRAI prescribed benchmark on most of the parameters – in rural as well as urban areas.
All the operators (Bharti Airtel, BSNL, HFCL and Reliance) met the benchmark on Provision of Services, Postpaid Services, Help Services, Network Availability, Maintainability and Overall Services in both Urban and Rural area. However HFCL couldn’t meet the benchmark on Help Services in both Rural and Urban area.
The performance of Bharti Airtel, BSNL and Reliance on Supplementary Services could not meet the benchmark of 85% in Rural as well as in Urban area. However, on the given parameter only HFCL was able to meet the benchmark in both Urban and Rural area.
The analysis reveals that the satisfaction from the quality of service of all the operators (Bharti Airtel, BSNL, HFCL and Reliance) is nearly same, as per the TRAI benchmark standards.
Assessment of Customer perception of Service and Implementation & Punjab Service Area
Effectiveness of Telecom Consumers Protection and Redressal of Grievances Regulations October 2013
38
441, (Basement), Jangpura, Mathura Road, New Delhi – 110014, India
Email: [email protected], URL: www.consumer-voice.org
4.2 GRAPHICAL PRESENTATION

Assessment of Customer perception of Service and Implementation & Punjab Service Area
Effectiveness of Telecom Consumers Protection and Redressal of Grievances Regulations October 2013
39
441, (Basement), Jangpura, Mathura Road, New Delhi – 110014, India
Email: [email protected], URL: www.consumer-voice.org
4.2.1 BASIC WIRE LINE – Punjab Service Area
4.2.1.1 CUSTOMERS SATISFIED WITH PROVISION OF SERVICES
Source: Q1.1, Q1.2 and Q1.3 of the qnr
Audit was conducted for four operators providing basic wire-line services in Punjab Service Area
All the four operators were found to be meeting the benchmark of >90% in both Rural area and Urban area.
Percentage of consumers satisfied with the provision of services attained by both the operators ranged from 98.0% (BSNL) to 99.8% (HFCL) in rural areas and 96.1% (BSNL) to 99.5% (Reliance and HFCL) in urban areas.
4.2.1.2A CUSTOMERS SATISFIED WITH PREPAID BILLING SERVICES Out of the four service providers covered during the survey, none had prepaid customers for their basic wire-line service
4.2.1.2B CUSTOMERS SATISFIED WITH POSTPAID BILLING SERVICES
Source: Q2.5, Q2.6 and Q2.7 of the qnr
All the four operators in rural and urban area were found to be meeting the benchmark of >95%
Percentage of satisfied consumers by both operators ranged from 96.0% (BSNL) to 98.7% (HFCL) in rural area and 98.1% (BSNL and Reliance) to 99.6% (Airtel) in urban area.
98
.9%
96
.1%
99
.5%
99
.5%
99
.6%
98
.0%
99
.8%
98
.5%
99
.1%
96
.7%
99
.6%
99
.2%
90% 90% 90% 90%
50.0%
60.0%
70.0%
80.0%
90.0%
100.0%
Airtel BSNL HFCL Reliance
Urban Rural Total Benchmark
99
.6%
98
.1%
99
.4%
98
.1%
98
.5%
96
.0%
98
.7%
98
.3%
95
.1%
98
.4%
98
.4%
97
.5%
95% 95% 95% 95%
50.0%
60.0%
70.0%
80.0%
90.0%
100.0%
Airtel BSNL HFCL Reliance
Urban Rural Total Benchmark

Assessment of Customer perception of Service and Implementation & Punjab Service Area
Effectiveness of Telecom Consumers Protection and Redressal of Grievances Regulations October 2013
40
441, (Basement), Jangpura, Mathura Road, New Delhi – 110014, India
Email: [email protected], URL: www.consumer-voice.org
4.2.1.3 CUSTOMERS SATISFIED WITH HELP SERVICES
Source: Q3.1, Q3.2, Q3.3 and Q3.4 of the qnr
All the four operators in Rural and Urban area met the benchmark of >90%.
Percentage of consumer satisfied by both the operators ranged from 94.9% (BSNL) to 99.7% (Airtel) in rural area and 93.1% (BSNL) to 97.9% (Reliance) in urban area.
4.2.1.4 CUSTOMERS SATISFIED WITH NETWORK PERFORMANCE
Source: Q4.1, Q4.2 and Q4.3 of the qnr
All the four operators except BSNL in Urban area, met the benchmark of >95% - both in rural and urban Punjab.
Percentages of customers satisfied by both the operators ranged from 97.4% (BSNL) to 99.1% (Reliance) in rural areas and 93.6% (BSNL) to 97.9% (Reliance) in urban area.
96
.3%
93
.1%
96
.5%
97
.9%
99
.7%
94
.9%
99
.4%
99
.0%
97
.3%
93
.6%
97
.4%
98
.2%
50.0%
55.0%
60.0%
65.0%
70.0%
75.0%
80.0%
85.0%
90.0%
95.0%
100.0%
Airtel BSNL HFCL Reliance
Urban Rural Total Benchmark
97
.4%
93
.6%
97
.6%
97
.9%
98
.3%
97
.4%
98
.5%
99
.1%
97
.7%
94
.7%
97
.9%
98
.2%
95% 95% 95% 95%
40.0% 45.0% 50.0% 55.0% 60.0% 65.0% 70.0% 75.0% 80.0% 85.0% 90.0% 95.0%
100.0%
Airtel BSNL HFCL Reliance
Urban Rural Total Benchmark

Assessment of Customer perception of Service and Implementation & Punjab Service Area
Effectiveness of Telecom Consumers Protection and Redressal of Grievances Regulations October 2013
41
441, (Basement), Jangpura, Mathura Road, New Delhi – 110014, India
Email: [email protected], URL: www.consumer-voice.org
4.2.1.5 CUSTOMERS SATISFIED WITH MAINTAINABILITY
Source: Q5.1 and Q5.2 of the qnr
All of the four operators in rural and also in urban areas were found to be meeting the benchmark of >95%.
Percentage of satisfied consumers by both the operators ranged from 96.7% (BSNL) to 98.3% (Reliance) in rural area and 97.2% (BSNL) to 98.6% (Airtel) in urban areas.
4.2.1.6 CUSTOMERS SATISFIED WITH SUPPLEMENTRY SERVICES
Source: Q6.1 and Q6.2 of the qnr
None of the four operators in Urban area and only two (Airtel and Reliance) in Rural area had met the benchmark of >90%.
Percentage of consumers satisfied by both the operators ranged from 59.5% (BSNL) to 79.1% (Airtel) in Urban area and 73.6% (BSNL) to 90.5% (Reliance) in Rural area.
98
.6%
97
.2%
97
.3%
97
.9%
97
.8%
96
.7%
98
.1%
98
.3%
98
.3%
97
.0%
97
.5%
98
.0%
95% 95% 95% 95%
40.0% 45.0% 50.0% 55.0% 60.0% 65.0% 70.0% 75.0% 80.0% 85.0% 90.0% 95.0%
100.0%
Airtel BSNL MTS Rel Comm
Urban Rural Total Benchmark
79
.1%
59
.5%
76
.7%
63
.2%
90
.2%
73
.6%
83
.0%
90
.5%
82
.5%
62
.5%
79
.5%
67
.4%
90% 90% 90% 90%
50.0%
55.0%
60.0%
65.0%
70.0%
75.0%
80.0%
85.0%
90.0%
95.0%
100.0%
Airtel BSNL HFCL Reliance
Urban Rural Total Benhmark

Assessment of Customer perception of Service and Implementation & Punjab Service Area
Effectiveness of Telecom Consumers Protection and Redressal of Grievances Regulations October 2013
42
441, (Basement), Jangpura, Mathura Road, New Delhi – 110014, India
Email: [email protected], URL: www.consumer-voice.org
4.2.1.7 CUSTOMERS SATISFIED WITH OVERALL SERVICES
Source: Q7 of the qnr
All the four operators in rural area and in urban area had met the benchmark of >90%.
Percentage of customers satisfied by both the operators ranged from 97.8% (Airtel and HFCL) to 98.9% (BSNL and Reliance) in rural area and 97.6% (BSNL) to 99.8% (Reliance) in urban area.
99
.3%
97
.6%
98
.6%
99
.8%
97
.8%
98
.9%
97
.8%
98
.9%
98
.8%
98
.0%
98
.3%
99
.5%
90% 90%
50.0% 55.0% 60.0% 65.0% 70.0% 75.0% 80.0% 85.0% 90.0% 95.0%
100.0%
Airtel BSNL HFCL Reliance
Urban Rural Total Benchmark

Assessment of Customer perception of Service and Implementation & Punjab Service Area
Effectiveness of Telecom Consumers Protection and Redressal of Grievances Regulations October 2013
43
441, (Basement), Jangpura, Mathura Road, New Delhi – 110014, India
Email: [email protected], URL: www.consumer-voice.org
4.2.2 CELLULAR SERVICE - METRO CIRCLE (PUNJAB)
4.2.2.1 CUSTOMERS SATISFIED WITH PROVISION OF SERVICES
Source: Q1.1, Q1.2 and Q1.3 of the qnr
Audit was conducted for 8 operators providing cellular services in Punjab. In rural area, all operators were found to be meeting the benchmark of >90% but in urban area only three – BSNL, HFCL and Reliance - out of eight were meeting the benchmark.
Percentage of consumers satisfied with the provision of services attained by all the eight operators ranged from 94.6% (Airtel) to 99.1% (BSNL) in rural area and 70.4% (Aircel) to 98.2% (BSNL) in urban area.
4.2.2.2A CUSTOMERS SATISFIED WITH PREPAID BILLING SERVICES
Source: Q2.1, Q2.2, Q2.3 and Q2.4 of the qnr
In Rural area only three (HFCL, Ideal Cellular and TTSL) out of eight operators were found to be meeting the benchmark of >95%. However, none of the operators were meeting the benchmark in urban area.
70
.4%
83
.9%
98
.2%
94
.9%
88
.7%
95
.6%
70
.6%
78
.9%
97
.0%
94
.6%
99
.1%
98
.9%
98
.7%
95
.7%
97
.6%
97
.0%
78
.4%
87
.1%
98
.4%
96
.1%
91
.7%
95
.6%
78
.7%
84
.3%
90% 90% 90% 90% 90% 90% 90% 90%
50.0% 55.0% 60.0% 65.0% 70.0% 75.0% 80.0% 85.0% 90.0% 95.0%
100.0%
Aircel Airtel BSNL HFCL Idea Reliance TTSL Vodafone
Urban Rural Total Benchmark 7
4.2
%
81
.0%
92
.6%
89
.8%
87
.6%
85
.7%
65
.3%
74
.4%
89
.3%
89
.9%
92
.3%
96
.0%
95
.1%
92
.6%
95
.7%
94
.8%
79
.0%
83
.8%
92
.5%
91
.7%
90
.0%
87
.9%
74
.8%
80
.7%
95% 95% 95% 95% 95% 95% 95% 95%
50.0% 55.0% 60.0% 65.0% 70.0% 75.0% 80.0% 85.0% 90.0% 95.0%
100.0%
Aircel Airtel BSNL HFCL Idea Reliance TTSL Vodafone
Urban Rural Total Benchmark

Assessment of Customer perception of Service and Implementation & Punjab Service Area
Effectiveness of Telecom Consumers Protection and Redressal of Grievances Regulations October 2013
44
441, (Basement), Jangpura, Mathura Road, New Delhi – 110014, India
Email: [email protected], URL: www.consumer-voice.org
Percentages of satisfied consumer by all the operators ranged from 89.3% (Aircel) to 96.0% (HFCL) in rural area and 65.3% (TTSL) to 92.6% (BSNL) in urban area.
4.2.2.2B CUSTOMERS SATISFIED WITH POSTPAID BILLING SERVICES
*Aircel does not provide postpaid cellular services in Rural Area *HFCL does not provide postpaid cellular services in any Rural or Urban Area Source: Q2.5, Q2.6 and Q2.7 of the qnr
Four (Airtel, BSNL, Idea and TTSL) of the seven operators providing post paid service in rural area and none in the urban area were found to be meeting the benchmark of >95%
Percentage of satisfied consumers by all the seven operators ranged from 79.2% (Vodafone) to 100.0% (Airtel, BSNL, Idea and TTSL) in rural area and 66.7% (TTSL) to 91.5% (Reliance) in urban area.
4.2.2.3 CUSTOMERS SATISFIED WITH HELP SERVICES
Source: Q3.1, Q3.2, Q3.3 and Q3.4 of the qnr
Five (Airtel, BSNL, HFCL, TTSL and Vodafone) out of eight operators in rural area met the benchmark of >90%. In urban only three (BSNL, HFCL and Reliance) could meet the benchmark.
Percentage of consumer satisfied by all eight operators ranged from 76.3% (Aircel) to 95.6% (Airtel) in rural area and 62.9% (Aircel) to 94.9% (BSNL) in urban area.
74
.7%
87
.5%
81
.0%
83
.3%
91
.5%
66
.7%
79
.3%
10
0.0
%
10
0.0
%
10
0.0
%
81
.0%
10
0.0
%
79
.2%
74
.7%
88
.6%
82
.2%
83
.8%
90
.1%
67
.9%
79
.3%
95% 95% 95% 95% 95% 95%
50.0% 55.0% 60.0% 65.0% 70.0% 75.0% 80.0% 85.0% 90.0% 95.0%
100.0%
Aircel Airtel BSNL Idea Reliance TTSL Vodafone
Urban Rural Total Benchmark 6
2.9
%
78
.6%
94
.9%
92
.9%
82
.7%
91
.0%
64
.5%
65
.5%
76
.3%
95
.6%
91
.8%
91
.0%
88
.9%
84
.9%
94
.9%
94
.3%
66
.9%
83
.7%
94
.0%
92
.3%
84
.6%
89
.1%
73
.6%
74
.1%
90% 90% 90% 90% 90% 90% 90% 90%
50.0%
55.0%
60.0%
65.0%
70.0%
75.0%
80.0%
85.0%
90.0%
95.0%
100.0%
Aircel Airtel BSNL HFCL Idea Reliance TTSL Vodafone
Urban Rural Total Benchmark

Assessment of Customer perception of Service and Implementation & Punjab Service Area
Effectiveness of Telecom Consumers Protection and Redressal of Grievances Regulations October 2013
45
441, (Basement), Jangpura, Mathura Road, New Delhi – 110014, India
Email: [email protected], URL: www.consumer-voice.org
4.2.2.4 CUSTOMERS SATISFIED WITH NETWORK PERFORMANCE
Source: Q4.1, Q4.2 and Q4.3 of the qnr
Airtel and BSNL were the only two out of eight operators in rural area only BSNL in urban area were found to be meeting the benchmark of >95%. Although performance of Vodafone was also good (94.8%) in rural area, However, in urban it was very critical (74.6%).
Percentages of customers satisfied by all the operators ranged from 80.2% (Aircel) to 97.6% (Airtel) in rural area and 60.6% (TTSL) to 95.2% (BSNL) in urban area.
4.2.2.5 CUSTOMERS SATISFIED WITH MAINTAINABILITY
Source: Q5.1 and Q5.2 of the qnr
Out of eight operators covered in Punjab, Airtel was the only operators to meet the benchmark of >95%, in rural area. None was able to meet this benchmark in urban area.
Percentage of satisfied consumers by all the eight operators ranged from 85.8% (Idea) to 96.1% (Airtel) in rural area and 67.0% (TTSL) to 94.3% (Reliance) in urban area.
61
.3%
82
.0%
95
.2%
92
.9%
79
.8%
90
.9%
60
.6%
74
.6%
80
.2%
97
.6%
96
.3%
93
.3%
86
.7%
85
.2%
91
.7%
94
.8%
66
.9%
86
.7%
95
.6%
93
.0%
81
.8%
89
.2%
69
.9%
80
.7%
95% 95% 95% 95% 95%
50.0% 55.0% 60.0% 65.0% 70.0% 75.0% 80.0% 85.0% 90.0% 95.0%
100.0%
Aircel Airtel BSNL HFCL Idea Reliance TTSL Vodafone
Urban Rural Total Benchmark
79
.8%
89
.2%
93
.0%
93
.7%
87
.9%
94
.3%
67
.0%
86
.0%
89
.7%
96
.1%
92
.8%
94
.7%
85
.8%
91
.1%
91
.9%
94
.4%
82
.8%
91
.3%
92
.9%
94
.0%
87
.3%
93
.3%
74
.5%
88
.5%
95% 95% 95% 95% 95% 95% 95% 95%
50.0% 55.0% 60.0% 65.0% 70.0% 75.0% 80.0% 85.0% 90.0% 95.0%
100.0%
Aircel Airtel BSNL HFCL Idea Reliance TTSL Vodafone
Urban Rural Total Benchmark

Assessment of Customer perception of Service and Implementation & Punjab Service Area
Effectiveness of Telecom Consumers Protection and Redressal of Grievances Regulations October 2013
46
441, (Basement), Jangpura, Mathura Road, New Delhi – 110014, India
Email: [email protected], URL: www.consumer-voice.org
4.2.2.6 CUSTOMERS SATISFIED WITH SUPPLEMENTRY SERVICES
Source: Q6.1 and Q6.2 of the qnr
Five (Airtel, BSNL, HFCL, TTSL and Vodafone) out of eight operators in rural area and only two (Idea and Reliance) in urban area were found to be meeting the benchmark of >90%.
Percentage of consumers satisfied by all eight operators ranged from 74.2% (Idea) to 98.3% (Airtel) in rural area and 75.9% (TTSL) to 94.5% (Reliance) in urban area.
4.2.2.7 CUSTOMERS SATISFIED WITH OVERALL SERVICES
Source: Q7 of the qnr
Surprisingly, all except one (Idea Cellular) of the eight operators in rural area were able to meet the benchmark of >90%. However, in urban area only three operators were able to meet this benchmark. They are – BSNL, HFCL and Reliance.
Percentage of customers satisfied by all the operators ranged from 82.2% (Idea) to 97.8% (Vodafone) in rural area and 71.4% (Aircel) to 98.6% (Reliance) in urban area.
78
.2%
82
.9%
82
.0%
87
.6%
90
.8%
94
.5%
75
.9%
76
.7%
77
.9%
98
.3%
92
.9%
95
.5%
74
.2%
78
.6%
97
.1%
98
.1%
78
.1%
87
.1%
84
.6%
90
.2%
86
.2%
91
.3%
83
.7%
83
.3%
90% 90% 90% 90% 90% 90% 90% 90%
50.0%
55.0%
60.0%
65.0%
70.0%
75.0%
80.0%
85.0%
90.0%
95.0%
100.0%
Aircel Airtel BSNL HFCL Idea Reliance TTSL Vodafone
Urban Rural Total Benchmark
71
.4%
84
.3%
95
.7%
96
.7%
83
.8%
98
.6%
79
.0%
84
.8%
93
.3%
97
.2%
98
.3%
96
.1%
82
.2%
95
.6%
92
.2%
97
.8%
78
.0%
88
.2%
96
.5%
96
.5%
83
.3%
97
.7%
83
.0%
88
.7%
90% 90% 90% 90% 90% 90% 90% 90%
50.0%
60.0%
70.0%
80.0%
90.0%
100.0%
Aircel Airtel BSNL HFCL Idea Reliance TTSL Vodafone
Urban Rural Total Benchmark

Assessment of Customer perception of Service and Implementation & Punjab Service Area
Effectiveness of Telecom Consumers Protection and Redressal of Grievances Regulations October 2013
47
441, (Basement), Jangpura, Mathura Road, New Delhi – 110014, India
Email: [email protected], URL: www.consumer-voice.org
4.2.3 BROADBAND – Punjab Service Area
4.2.3.1 CUSTOMERS SATISFIED WITH PROVISION OF SERVICES
Source: Q1.1, Q1.2 and Q1.3 of the qnr
Audit was conducted for four operators providing Broadband services in Punjab Service Area
All the four operators were found to be meeting the benchmark of >90% in both Rural area and Urban area.
Percentage of consumers satisfied with the provision of services attained by both the operators ranged from 95.6% (BSNL) to 98.7% (Bharti Airtel and HFCL) in rural areas and 91.9% (Reliance) to 99.5% (Bharti Airtel) in urban areas.
4.2.3.2A CUSTOMERS SATISFIED WITH PREPAID BILLING SERVICES Out of the four service providers covered during the survey, none had prepaid customers for their Broadband service
99.5% 96.6% 98.7%
91.9%
98.7% 95.6%
98.7% 96.7% 99.3%
96.3% 98.7% 93.3%
90% 90% 90% 90%
50.0% 55.0% 60.0% 65.0% 70.0% 75.0% 80.0% 85.0% 90.0% 95.0%
100.0%
BHARTI AIRTEL BSNL HFCL Reliance
Urban Rural Total Benchmark
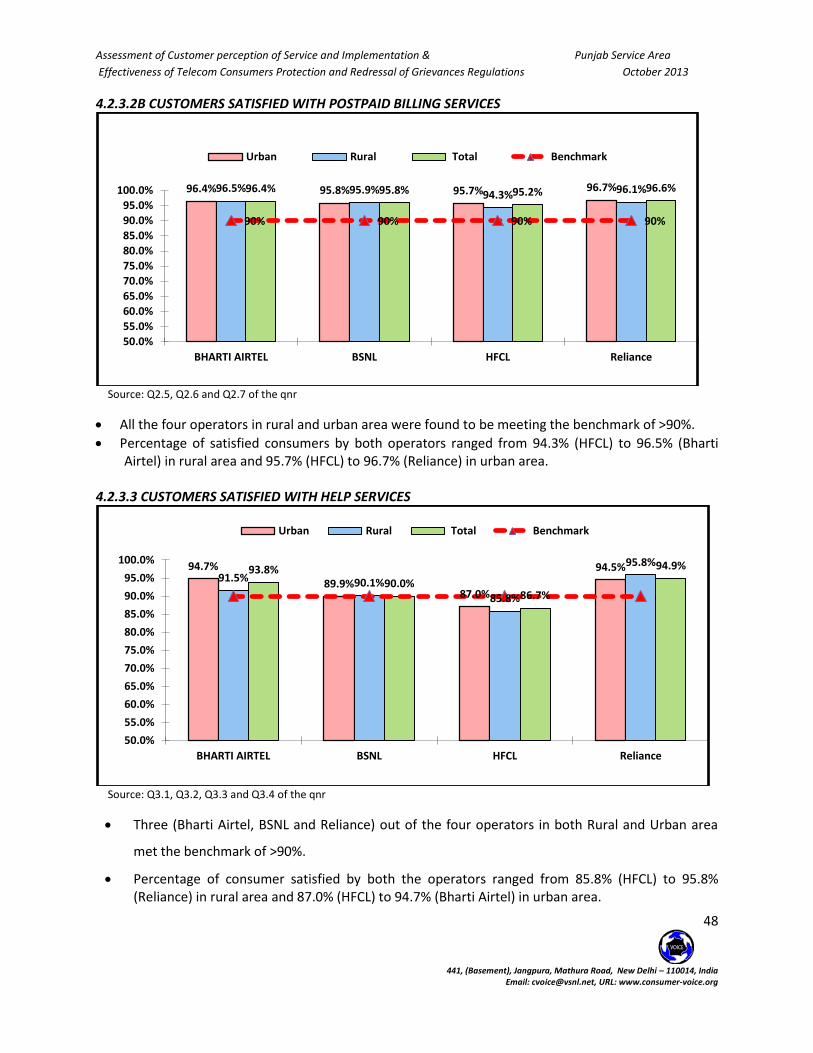
Assessment of Customer perception of Service and Implementation & Punjab Service Area
Effectiveness of Telecom Consumers Protection and Redressal of Grievances Regulations October 2013
48
441, (Basement), Jangpura, Mathura Road, New Delhi – 110014, India
Email: [email protected], URL: www.consumer-voice.org
4.2.3.2B CUSTOMERS SATISFIED WITH POSTPAID BILLING SERVICES
Source: Q2.5, Q2.6 and Q2.7 of the qnr
All the four operators in rural and urban area were found to be meeting the benchmark of >90%.
Percentage of satisfied consumers by both operators ranged from 94.3% (HFCL) to 96.5% (Bharti Airtel) in rural area and 95.7% (HFCL) to 96.7% (Reliance) in urban area.
4.2.3.3 CUSTOMERS SATISFIED WITH HELP SERVICES
Source: Q3.1, Q3.2, Q3.3 and Q3.4 of the qnr
Three (Bharti Airtel, BSNL and Reliance) out of the four operators in both Rural and Urban area
met the benchmark of >90%.
Percentage of consumer satisfied by both the operators ranged from 85.8% (HFCL) to 95.8% (Reliance) in rural area and 87.0% (HFCL) to 94.7% (Bharti Airtel) in urban area.
96.4% 95.8% 95.7% 96.7% 96.5% 95.9% 94.3% 96.1% 96.4% 95.8% 95.2% 96.6%
90% 90% 90% 90%
50.0%
55.0%
60.0%
65.0%
70.0%
75.0%
80.0%
85.0%
90.0%
95.0%
100.0%
BHARTI AIRTEL BSNL HFCL Reliance
Urban Rural Total Benchmark
94.7%
89.9% 87.0%
94.5% 91.5% 90.1%
85.8%
95.8% 93.8%
90.0% 86.7%
94.9%
50.0%
55.0%
60.0%
65.0%
70.0%
75.0%
80.0%
85.0%
90.0%
95.0%
100.0%
BHARTI AIRTEL BSNL HFCL Reliance
Urban Rural Total Benchmark

Assessment of Customer perception of Service and Implementation & Punjab Service Area
Effectiveness of Telecom Consumers Protection and Redressal of Grievances Regulations October 2013
49
441, (Basement), Jangpura, Mathura Road, New Delhi – 110014, India
Email: [email protected], URL: www.consumer-voice.org
4.2.3.4 CUSTOMERS SATISFIED WITH NETWORK PERFORMANCE
Source: Q4.1and Q4.2 of the qnr
All the four operators were found to be meeting the benchmark of >85% in both Rural area and Urban area.
Percentages of customers satisfied by both the operators ranged from 89.7% (HFCL) to 96.9% (Reliance) in rural areas and 90.3% (HFCL) to 96.0% (Bharti Airtel and Reliance) in urban area.
4.2.3.5 CUSTOMERS SATISFIED WITH MAINTAINABILITY
Source: Q5.1 and Q5.2 of the qnr
All the four operators were found to be meeting the benchmark of >85% in both Rural area and Urban area.
Percentage of satisfied consumers by both the operators ranged from 86.7% (HFCL) to 97.5% (Reliance) in rural area and 87.0% (HFCL) to 95.7% (Bharti Airtel) in urban areas.
96.0% 92.5% 90.3%
96.0% 92.5% 91.4% 89.7%
96.9% 94.9% 92.2% 90.1%
96.3%
85% 85% 85% 85%
40.0% 45.0% 50.0% 55.0% 60.0% 65.0% 70.0% 75.0% 80.0% 85.0% 90.0% 95.0%
100.0%
BHARTI AIRTEL BSNL HFCL Reliance
Urban Rural Total Benchmark
95.7% 91.0%
87.0%
94.9% 93.1% 90.0%
86.7%
97.5% 94.9%
90.7% 86.9%
95.7%
85% 85% 85% 85%
40.0% 45.0% 50.0% 55.0% 60.0% 65.0% 70.0% 75.0% 80.0% 85.0% 90.0% 95.0%
100.0%
BHARTI AIRTEL BSNL HFCL Reliance
Urban Rural Total Benchmark

Assessment of Customer perception of Service and Implementation & Punjab Service Area
Effectiveness of Telecom Consumers Protection and Redressal of Grievances Regulations October 2013
50
441, (Basement), Jangpura, Mathura Road, New Delhi – 110014, India
Email: [email protected], URL: www.consumer-voice.org
4.2.3.6 CUSTOMERS SATISFIED WITH SUPPLEMENTRY SERVICES
Source: Q6.1 and Q6.2 of the qnr *HFCL sample size Urban(8) and Rural area(3)
Only one (HFCL) of the four operators both in Urban and in Rural area had met the benchmark of >85%.
Percentage of consumers satisfied by both the operators ranged from 23.6% (Reliance) to 100.0% (HFCL) in Rural area and 30.4% (Bharti Airtel) to 100.0% (HFCL) in Urban area.
4.2.3.7 CUSTOMERS SATISFIED WITH OVERALL SERVICES
Source: Q7 of the qnr
All the four operators were found to be meeting the benchmark of >85% in both Rural area and Urban area.
Percentage of customers satisfied by the operators ranged from 87.2% (BSNL) to 91.1% (Reliance) in rural area and 89.1% (BSNL) to 90.7% (Reliance) in urban area.
30
.4%
34
.8%
10
0.0
%
55
.6%
30
.9%
29
.7%
10
0.0
%
23
.6%
30
.5%
32
.7%
10
0.0
%
44
.8%
85% 85% 85% 85%
20.0%
30.0%
40.0%
50.0%
60.0%
70.0%
80.0%
90.0%
100.0%
BHARTI AIRTEL BSNL HFCL Reliance
Urban Rural Total Benhmark
90.3% 89.1% 89.3% 90.7% 88.3% 87.2%
90.0% 91.1% 89.7% 88.5% 89.5% 90.8%
85% 85%
50.0%
55.0%
60.0%
65.0%
70.0%
75.0%
80.0%
85.0%
90.0%
95.0%
100.0%
BHARTI AIRTEL BSNL HFCL Reliance
Urban Rural Total Benchmark

Assessment of Customer perception of Service and Implementation & Punjab Service Area
Effectiveness of Telecom Consumers Protection and Redressal of Grievances Regulations October 2013
51
441, (Basement), Jangpura, Mathura Road, New Delhi – 110014, India
Email: [email protected], URL: www.consumer-voice.org
5. ASSESSMENT OF TRAI REGULATIONS & DIRECTIONS

Assessment of Customer perception of Service and Implementation & Punjab Service Area
Effectiveness of Telecom Consumers Protection and Redressal of Grievances Regulations October 2013
52
441, (Basement), Jangpura, Mathura Road, New Delhi – 110014, India
Email: [email protected], URL: www.consumer-voice.org
5.1 BASIC (WIRELINE) SERVICE – PUNJAB SERVICE AREA
5.1.1: Registration for blocking unsolicited commercial calls/SMSs: Altogether 2409 wireline subscribers of four operators (Airtel, BSNL, HFCL and Reliance) in Punjab were targeted and of them only 182 (7.6%) had registered for not receiving or blocking unsolicited commercial calls/SMSs. Maximum percentage of people who registered their number were Airtel subscribers from Rural area(11.1%) and HFCL subscribers from Urban area(8.7%).
1. Have you registered your number for not receiving/blocking unsolicited commercial calls / SMSs?
Service Provider Yes No Total
Count %age Count %age Count
Airtel
Urban 33 7.8% 388 92.2% 421 Rural 20 11.1% 160 88.9% 180 Total 53 8.8% 548 91.2% 601
BSNL
Urban 23 5.5% 399 94.5% 422 Rural 16 8.9% 164 91.1% 180 Total 39 6.5% 563 93.5% 602
HFCL
Urban 37 8.7% 386 91.3% 423 Rural 18 10.0% 162 90.0% 180 Total 55 9.1% 548 90.9% 603
Reliance
Rural 25 5.9% 398 94.1% 423 Urban 10 5.6% 170 94.4% 180 Total 35 5.8% 568 94.2% 603
Total
Urban 118 7.0% 1571 93.0% 1689 Rural 64 8.9% 656 91.1% 720 Total 182 7.6% 2227 92.4% 2409
Source: Q1 of the Implementationa and Effectiveness part of the qnr
5.1.2: Satisfaction on effectiveness of blocking of unsolicited commercial calls on your number: The average satisfaction level attained by 182 subscribers who had registered their number for not
receiving or blocking unsolicited commercial calls / SMSs, on a scale of 1 to 7 where 1 is highly
dissatisfied and 7 is highly satisfied, was 4.42 in rural areas and 3.92 in urban area. It was Maximum in case of Reliance 4.16 in the Urban area followed by Airtel with mean 4.06. In rural area it was Maximum 4.40 of Reliance.
2. Satisfaction with the effectiveness of blocking
Operator Area Mean N
Airtel
Urban 4.06 33
Rural 4.30 20
Total 4.15 53
BSNL
Urban 3.96 23
Rural 4.81 16
Total 4.31 39
HFCL
Urban 3.62 37
Rural 4.22 18
Total 3.82 55
Reliance
Urban 4.16 25
Rural 4.40 10
Total 4.23 35
Total
Urban 3.92 118
Rural 4.42 64
Total 4.10 182
Source: Q2 of the Implementationa and Effectiveness part

Assessment of Customer perception of Service and Implementation & Punjab Service Area
Effectiveness of Telecom Consumers Protection and Redressal of Grievances Regulations October 2013
53
441, (Basement), Jangpura, Mathura Road, New Delhi – 110014, India
Email: [email protected], URL: www.consumer-voice.org
5.1.3 Consumers’ complaints about services: Of the 182 subscribers who had registered for not receiving or blocking the unsolicited commercial calls, 39 (21.4%) had made complaints as the unsolicited call/SMS had not stopped in spite of registration for the same. In the case of BSNL 12 out of 39 (30.8%) had made the complaint which seems quite high.
3. Have you ever registered a complaint, in case the unsolicited call/SMS have not had not stopped in spite of registration for the same?
Service Provider Yes No Total
Count %age Count %age Count
Airtel
Urban 9 27.3% 24 72.7% 33 Rural 3 15.0% 17 85.0% 20 Total 12 22.6% 41 77.4% 53
BSNL
Urban 5 21.7% 18 78.3% 23 Rural 7 43.8% 9 56.3% 16 Total 12 30.8% 27 69.2% 39
HFCL
Urban 4 10.8% 33 89.2% 37 Rural 2 11.1% 16 88.9% 18 Total 6 10.9% 49 89.1% 55
Reliance
Urban 7 28.0% 18 72.0% 25 Rural 2 20.0% 8 80.0% 10 Total 9 25.7% 26 74.3% 35
Total
Urban 25 21.2% 93 78.8% 118 Rural 14 21.9% 50 78.1% 64 Total 39 21.4% 143 78.6% 182
Source: Q3 of the Implementation and Effectiveness
5.1.4&5 Satisfaction on ease of lodging the complaint and action thereupon: Since only 39 subscribers had lodged complaint, satisfaction level on ease of lodging complaint and with the action should not be qualitative comparison. The average satisfaction level was 5.00 and 5.08 in Rural and Urban Area which is insignificant. On both the aspects, the mean is bit higher in urban area as compared to the rural area.
4 &5: Satisfaction on ease of lodging complain and action thereupon
Operator Area_rev ease of lodging complaint
action taken on complain
COUNT
Airtel
Urban 5.22 5.44 9
Rural 5.00 5.00 3
Total 5.17 5.33 12
BSNL
Urban 5.00 5.20 5
Rural 5.00 5.00 7
Total 5.00 5.08 12
HFCL
Urban 5.00 5.50 4
Rural 5.00 5.00 2
Total 5.00 5.33 6
Reliance
Urban 5.00 5.00 7
Rural 5.00 5.00 2
Total 5.00 5.00 9
Total
Urban 5.08 5.28 25 Rural 5.00 5.00 14 Total 5.05 5.18 39
Source: Q4 & 5 of the Implementationa and Effectiveness part of the qnr

Assessment of Customer perception of Service and Implementation & Punjab Service Area
Effectiveness of Telecom Consumers Protection and Redressal of Grievances Regulations October 2013
54
441, (Basement), Jangpura, Mathura Road, New Delhi – 110014, India
Email: [email protected], URL: www.consumer-voice.org
5.1.6 Awareness about the grievance redressal mechanisms: Of the three different modes of grievance redressal mechanisms set up by different service providers, it was found that in Punjab out of 2219 consumers surveyed almost all were aware of toll free consumer care number. But they were hardly aware of web based complaint monitoring system and none were aware about Appellate Authority. Altogether only 2 were about Appellate Authority – 1 from HFCL and 1 from BSNL.
6. Which all grievance redressal mechanisms set up by your telecom service provider based on the TRAI regulations are you aware of?
Service Provider
Toll Free Consumer Care Number
Appellate Authority Web based complaint monitoring system
Total
Count %age Count %age Count %age Count
Airtel
Urban 380 100.0% 0 0.0% 0 0.0% 380 Rural 167 100.0% 0 0.0% 0 0.0% 167 Total 547 100.0% 0 0.0% 0 0.0% 547
BSNL
Urban 387 98.5% 0 0.0% 6 1.5% 393 Rural 151 98.1% 1 0.6% 2 1.3% 154 Total 538 98.4% 1 0.2% 8 1.5% 547
HFCL
Urban 363 93.3% 1 0.3% 25 6.4% 389 Rural 156 99.4% 0 0.0% 1 0.6% 157 Total 519 95.1% 1 0.2% 26 4.8% 546
Reliance
Urban 405 100.0% 0 0.0% 0 0.0% 405 Rural 174 100.0% 0 0.0% 0 0.0% 174 Total 579 100.0% 0 0.0% 0 0.0% 579
Total
Urban 1535 98.0% 1 0.1% 31 2.0% 1567 Rural 648 99.4% 1 0.2% 3 0.5% 652
Total 2183 98.4% 2 0.1% 34 1.5% 2219
* Multiple response answers, percentages may not add up to 100 Source: Q6 of the Implementationa and Effectiveness part of the qnr
5.1.7 Consumers’ complaints to toll free consumer care number: Around one sixth (16.1%) had reported they had made complaint to toll free consumer care number – 18.3% by rural subscribers and 15.1% by urban subscribers. In rural area it was reported by over 41% of BSNL subscribers and in urban 23.4% of HFCL contacted during the survey.
7. Have you made any complaint to the toll free Consumer Care Number?
Service Provider Yes No Total
Count %age Count %age Count
Airtel
Urban 54 12.8% 367 87.2% 421 Rural 17 9.4% 163 90.6% 180
Total 71 11.8% 530 88.2% 601
BSNL
Urban 74 17.5% 348 82.5% 422 Rural 74 41.1% 106 58.9% 180
Total 148 24.6% 454 75.4% 602
HFCL
Urban 99 23.4% 324 76.6% 423
Rural 32 17.8% 148 82.2% 180 Total 131 21.7% 472 78.3% 603
Reliance
Urban 28 6.6% 395 93.4% 423
Rural 9 5.0% 171 95.0% 180 Total 37 6.1% 566 93.9% 603
Total
Urban 255 15.1% 1434 84.9% 1689 Rural 132 18.3% 588 81.7% 720 Total 387 16.1% 2022 83.9% 2409
Source: Q7 of the Implementationa and Effectiveness part of the qnr

Assessment of Customer perception of Service and Implementation & Punjab Service Area
Effectiveness of Telecom Consumers Protection and Redressal of Grievances Regulations October 2013
55
441, (Basement), Jangpura, Mathura Road, New Delhi – 110014, India
Email: [email protected], URL: www.consumer-voice.org
5.1.8 Satisfaction with manner in which the complaint was handled in consumer care: 387 customers who had lodged their complaints at the toll free consumer care number, average satisfaction level on a scale of 1 to 7, where 1 is highly dissatisfied and 7 is highly satisfied, was 4.90 in the urban and 4.96 in the rural areas of Punjab. Therefore the difference in the satisfaction level was not much in rural and urban areas. It was recorded highest in the case of Airtel (5.07) in the urban areas and HFCL (5.16) in the rural area.
8: Satisfaction on on the manner of addressing the complant such as docket number, redressal etc.
Operator Area satisfaction level COUNT
Airtel
Urban 5.07 54
Rural 5.12 17
Total 5.08 71
BSNL
Urban 4.69 74
Rural 4.82 74
Total 4.76 148
HFCL
Urban 5.04 99
Rural 5.16 32
Total 5.07 131
Reliance
Urban 4.64 28
Rural 5.11 9
Total 4.76 37
Total
Urban 4.90 255
Rural 4.96 132
Total 4.92 387
Source: Q8 of the Implementationa and Effectiveness part of the qnr
5.2.9 & 10: Consumers’ appeal to Appellate Authority and Satisfaction with manner in which your appeal was addressed: None of the two complainants who were aware of the TRAI regulation on Appellate Authority had filed appeal at the time of the survey. Therefore satisfaction level on this aspect could not be ascertained.

Assessment of Customer perception of Service and Implementation & Punjab Service Area
Effectiveness of Telecom Consumers Protection and Redressal of Grievances Regulations October 2013
56
441, (Basement), Jangpura, Mathura Road, New Delhi – 110014, India
Email: [email protected], URL: www.consumer-voice.org
5.2.11: OVERALL SCORE – BASIC SERVICE The following table shows the provider wise score on various provisions of the Telecom Consumer Protection and Redressal of Grievances Act in the case of Basic Service in Punjab.
S.N. Sub Parameters Area All SPs Airtel BSNL HFCL Relince
1 Registration for blocking unsolicited commercial calls/SMSs
Urban 7.00% 7.80% 5.50% 8.70% 5.90%
Rural 8.90% 11.10% 8.90% 10.00% 5.60%
Total 7.60% 8.80% 6.50% 9.10% 5.80%
2
Complaint lodged in case unsolicited call/SMS have not stopped in spite of registration for the same
Urban 21.20% 27.30% 21.70% 10.80% 28.00%
Rural 21.90% 15.00% 43.80% 11.10% 20.00%
Total 21.40% 22.60% 30.80% 10.90% 25.70%
3 Awareness about toll free Consumer Care Number
Urban 98.00% 100.00% 98.50% 93.30% 100.00%
Rural 99.40% 100.00% 98.10% 99.40% 100.00%
Total 98.40% 100.00% 98.40% 95.10% 100.00%
4 Complaint to toll free Consumer Care Number for redressing grievances
Urban 15.10% 12.80% 17.50% 23.40% 6.60%
Rural 18.30% 9.40% 41.10% 17.80% 5.00%
Total 16.10% 11.80% 24.60% 21.70% 6.10%
5 Awareness about appellate authority
Urban 0.10% 0.00% 0.00% 0.30% 0.00%
Rural 0.20% 0.00% 0.60% 0.00% 0.00%
Total 0.10% 0.00% 0.20% 0.20% 0.00%
6 Appeal to the appellate authority for redressing grievances
Urban Nil Nil Nil Nil Nil
Rural Nil Nil Nil Nil Nil
Total Nil Nil Nil Nil Nil
Registration for blocking unsolicited commercial calls/SMSs was found high in the case of HFCL (9.10%) as compared to others.
Lodging complaint in case unsolicited call/SMS have not stopped in spite of registration for the
same was highest in the case of BSNL, where 30.8% customers revealed that they have lodged a
complaint as the calls/SMSes have not stopped even after registering for the same.
Almost all the respondents were found to be aware of the toll free consumer care number.
Complaint to the toll free consumer care number for redressing grievances was Highest reported by
24.6% of BSNL subscribers.
Overall awareness of the appellate authority was found to be low as it was reported by only 2
subscribers in Punjab Service Area – 1 from BSNL and only 1 from HFCL. None of them had filed
appeal at the time of survey.

Assessment of Customer perception of Service and Implementation & Punjab Service Area
Effectiveness of Telecom Consumers Protection and Redressal of Grievances Regulations October 2013
57
441, (Basement), Jangpura, Mathura Road, New Delhi – 110014, India
Email: [email protected], URL: www.consumer-voice.org
5.2 CELLULAR – Punjab Service Area
5.2.1: Registration for blocking unsolicited commercial calls/SMSs: Altogether 4802 cellular consumers of eight operators in Punjab were targeted and of them 1084 (22.6%) had registered for not receiving or blocking unsolicited commercial calls/SMSes. The highest percentages of registered subscribers were found in the case of Idea Cellular (26.2%) – in rural area it higher at 35.5%, whereas in urban it was 17% only. In rural area it was highest in the case of TTSL (47.2%) where as in urban are it was in the case of Idea (18.8%).
1. Have you registered your number for not receiving/blocking unsolicited commercial calls / SMSs?
Service Provider Yes No Total
Count %age Count %age Count
Aircel
Urban 76 18.1% 344 81.9% 420
Rural 76 42.2% 104 57.8% 180
Total 152 25.3% 448 74.7% 600
Airtel
Urban 74 17.6% 346 82.4% 420
Rural 59 32.8% 121 67.2% 180
Total 133 22.2% 467 77.8% 600
BSNL
Urban 68 16.2% 352 83.8% 420
Rural 43 23.9% 137 76.1% 180
Total 111 18.5% 489 81.5% 600
HFCL
Urban 74 17.6% 346 82.4% 420
Rural 45 25.0% 135 75.0% 180
Total 119 19.8% 481 80.2% 600
Idea
Urban 79 18.8% 341 81.2% 420
Rural 78 43.3% 102 56.7% 180
Total 157 26.2% 443 73.8% 600
Reliance
Urban 66 15.7% 354 84.3% 420
Rural 65 36.1% 115 63.9% 180
Total 131 21.8% 469 78.2% 600
TTSL
Urban 65 15.5% 355 84.5% 420
Rural 85 47.2% 95 52.8% 180
Total 150 25.0% 450 75.0% 600
Vodafone
Urban 71 16.8% 351 83.2% 422
Rural 60 33.3% 120 66.7% 180
Total 131 21.8% 471 78.2% 602
Total
Urban 573 17.0% 2789 83.0% 3362
Rural 511 35.5% 929 64.5% 1440
Total 1084 22.6% 3718 77.4% 4802
Source: Q1 of the Implementationa and Effectiveness part of the qnr

Assessment of Customer perception of Service and Implementation & Punjab Service Area
Effectiveness of Telecom Consumers Protection and Redressal of Grievances Regulations October 2013
58
441, (Basement), Jangpura, Mathura Road, New Delhi – 110014, India
Email: [email protected], URL: www.consumer-voice.org
5.2.2: Satisfaction on effectiveness of blocking of unsolicited commercial calls on your number: The average satisfaction level attained by 1084 subscribers, on a scale of 1 to 7 where 1 is highly dissatisfied and 7 is highly satisfied, was 4.89 in urban areas and 4.75 in rural area. It was highest in the case of Vodafone, both in urban (5.04) and rural (5.15) areas.
2. Satisfaction with the effectiveness of blocking of unsolicited commercial calls
Operator Area Mean N
Aircel
Urban 4.79 76
Rural 4.5 76
Total 4.64 152
Airtel
Urban 4.77 74
Rural 4.83 59
Total 4.8 133
BSNL
Urban 4.81 68
Rural 4.91 43
Total 4.85 111
HFCL
Urban 4.99 74
Rural 5.07 45
Total 5.02 119
Idea
Urban 4.95 79
Rural 4.5 78
Total 4.73 157
Reliance
Urban 4.88 66
Rural 4.55 65
Total 4.72 131
TTSL
Urban 4.89 65
Rural 4.79 85
Total 4.83 150
Vodafone
Urban 5.04 71
Rural 5.15 60
Total 5.09 131
Total
Urban 4.89 573
Rural 4.75 511
Total 4.83 1084
Source: Q2 of the Implementationa and Effectiveness part of the qnr
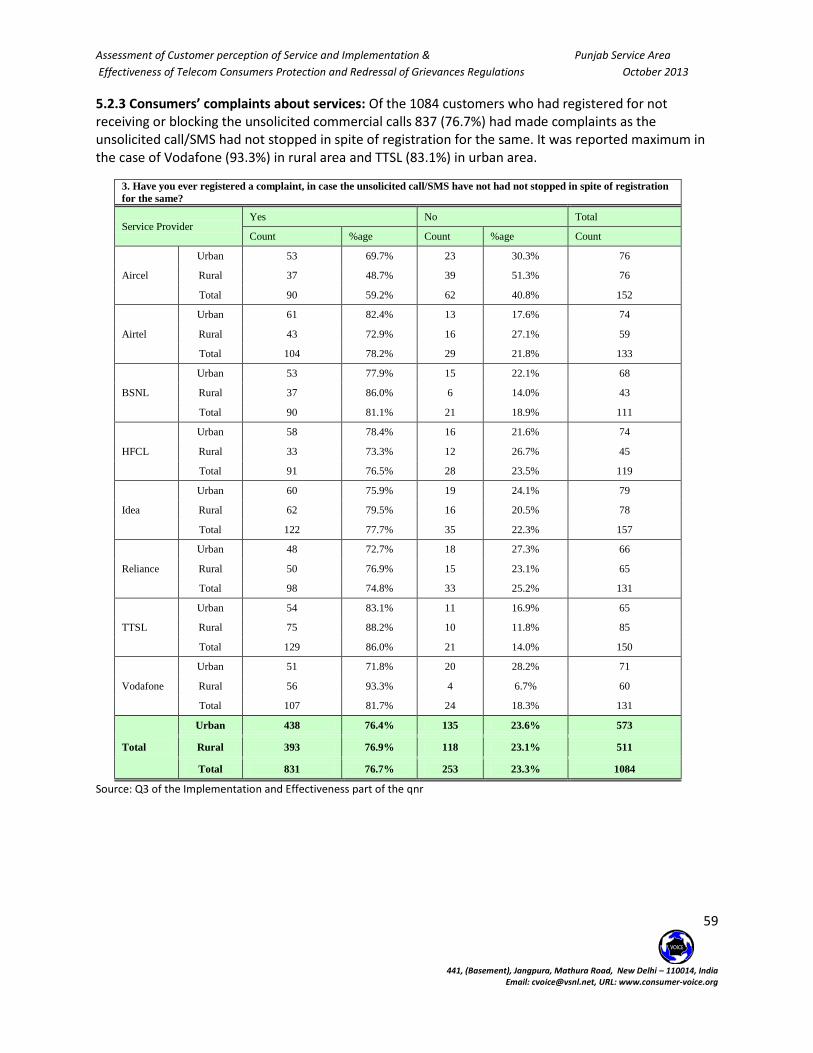
Assessment of Customer perception of Service and Implementation & Punjab Service Area
Effectiveness of Telecom Consumers Protection and Redressal of Grievances Regulations October 2013
59
441, (Basement), Jangpura, Mathura Road, New Delhi – 110014, India
Email: [email protected], URL: www.consumer-voice.org
5.2.3 Consumers’ complaints about services: Of the 1084 customers who had registered for not receiving or blocking the unsolicited commercial calls 837 (76.7%) had made complaints as the unsolicited call/SMS had not stopped in spite of registration for the same. It was reported maximum in the case of Vodafone (93.3%) in rural area and TTSL (83.1%) in urban area.
3. Have you ever registered a complaint, in case the unsolicited call/SMS have not had not stopped in spite of registration
for the same?
Service Provider Yes No Total
Count %age Count %age Count
Aircel
Urban 53 69.7% 23 30.3% 76
Rural 37 48.7% 39 51.3% 76
Total 90 59.2% 62 40.8% 152
Airtel
Urban 61 82.4% 13 17.6% 74
Rural 43 72.9% 16 27.1% 59
Total 104 78.2% 29 21.8% 133
BSNL
Urban 53 77.9% 15 22.1% 68
Rural 37 86.0% 6 14.0% 43
Total 90 81.1% 21 18.9% 111
HFCL
Urban 58 78.4% 16 21.6% 74
Rural 33 73.3% 12 26.7% 45
Total 91 76.5% 28 23.5% 119
Idea
Urban 60 75.9% 19 24.1% 79
Rural 62 79.5% 16 20.5% 78
Total 122 77.7% 35 22.3% 157
Reliance
Urban 48 72.7% 18 27.3% 66
Rural 50 76.9% 15 23.1% 65
Total 98 74.8% 33 25.2% 131
TTSL
Urban 54 83.1% 11 16.9% 65
Rural 75 88.2% 10 11.8% 85
Total 129 86.0% 21 14.0% 150
Vodafone
Urban 51 71.8% 20 28.2% 71
Rural 56 93.3% 4 6.7% 60
Total 107 81.7% 24 18.3% 131
Total
Urban 438 76.4% 135 23.6% 573
Rural 393 76.9% 118 23.1% 511
Total 831 76.7% 253 23.3% 1084
Source: Q3 of the Implementation and Effectiveness part of the qnr
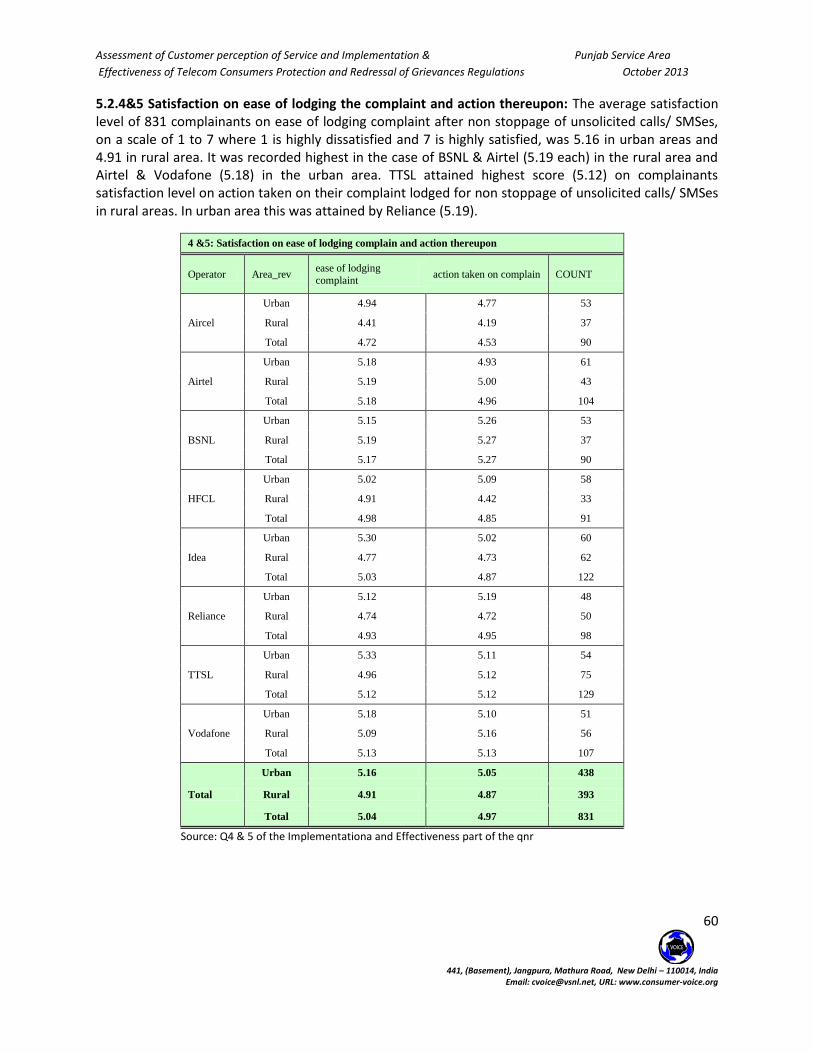
Assessment of Customer perception of Service and Implementation & Punjab Service Area
Effectiveness of Telecom Consumers Protection and Redressal of Grievances Regulations October 2013
60
441, (Basement), Jangpura, Mathura Road, New Delhi – 110014, India
Email: [email protected], URL: www.consumer-voice.org
5.2.4&5 Satisfaction on ease of lodging the complaint and action thereupon: The average satisfaction level of 831 complainants on ease of lodging complaint after non stoppage of unsolicited calls/ SMSes, on a scale of 1 to 7 where 1 is highly dissatisfied and 7 is highly satisfied, was 5.16 in urban areas and 4.91 in rural area. It was recorded highest in the case of BSNL & Airtel (5.19 each) in the rural area and Airtel & Vodafone (5.18) in the urban area. TTSL attained highest score (5.12) on complainants satisfaction level on action taken on their complaint lodged for non stoppage of unsolicited calls/ SMSes in rural areas. In urban area this was attained by Reliance (5.19).
4 &5: Satisfaction on ease of lodging complain and action thereupon
Operator Area_rev ease of lodging
complaint action taken on complain COUNT
Aircel
Urban 4.94 4.77 53
Rural 4.41 4.19 37
Total 4.72 4.53 90
Airtel
Urban 5.18 4.93 61
Rural 5.19 5.00 43
Total 5.18 4.96 104
BSNL
Urban 5.15 5.26 53
Rural 5.19 5.27 37
Total 5.17 5.27 90
HFCL
Urban 5.02 5.09 58
Rural 4.91 4.42 33
Total 4.98 4.85 91
Idea
Urban 5.30 5.02 60
Rural 4.77 4.73 62
Total 5.03 4.87 122
Reliance
Urban 5.12 5.19 48
Rural 4.74 4.72 50
Total 4.93 4.95 98
TTSL
Urban 5.33 5.11 54
Rural 4.96 5.12 75
Total 5.12 5.12 129
Vodafone
Urban 5.18 5.10 51
Rural 5.09 5.16 56
Total 5.13 5.13 107
Total
Urban 5.16 5.05 438
Rural 4.91 4.87 393
Total 5.04 4.97 831
Source: Q4 & 5 of the Implementationa and Effectiveness part of the qnr

Assessment of Customer perception of Service and Implementation & Punjab Service Area
Effectiveness of Telecom Consumers Protection and Redressal of Grievances Regulations October 2013
61
441, (Basement), Jangpura, Mathura Road, New Delhi – 110014, India
Email: [email protected], URL: www.consumer-voice.org
5.2.6 Satisfaction with the information received at the time of activation of various vouchers: The average satisfaction level of 4543 prepaid subscribers with the information, received through SMS at the time of
activation of various vouchers,, on a scale of 1 to 7 where 1 is highly dissatisfied and 7 is highly satisfied, was 4.39 in urban areas and in rural area it was 4.84. It was recorded highest in the case of HFCL , both in urab (4.83) rural (4.98) areas.
6. How satisfied are you with the information, received through SMS at the time of activation of various
vouchers, such as amount charged, processing fee, taxes deducted, title of the plan, validity etc?
Operator Area Mean N
Aircel
Urban 3.96 395
Rural 4.76 180
Total 4.21 575
Airtel
Urban 4.36 380
Rural 4.70 176
Total 4.47 556
BSNL
Urban 4.73 392
Rural 4.98 178
Total 4.81 570
HFCL
Urban 4.83 420
Rural 4.98 180
Total 4.87 600
Idea
Urban 4.35 386
Rural 4.70 179
Total 4.46 565
Reliance
Urban 4.71 373
Rural 4.73 173
Total 4.72 546
TTSL
Urban 3.95 395
Rural 4.87 179
Total 4.24 574
Vodafone
Urban 4.18 385
Rural 5.02 172
Total 4.44 557
Total
Urban 4.39 3126
Rural 4.84 1417
Total 4.53 4543
Source: Q6 of the Implementationa and Effectiveness part of the qnr

Assessment of Customer perception of Service and Implementation & Punjab Service Area
Effectiveness of Telecom Consumers Protection and Redressal of Grievances Regulations October 2013
62
441, (Basement), Jangpura, Mathura Road, New Delhi – 110014, India
Email: [email protected], URL: www.consumer-voice.org
5.2.7 Satisfaction with the information provided after every usage: Overall the prepaid subscribers’ satisfaction with the information provided after every usage, such as duration of call, charges deducted, balance in
account etc, on a scale of 1 to 7 where 1 is highly dissatisfied and 7 is highly satisfied, was 5.00 in rural and 4.53 in urban areas. It was recorded highest in the case of Vodafone (5.31) in the rural area and Reliance (4.76 ) in the urban area.
7. How satisfied are you with the information provided to you after every usage,
such as duration of call, charges deducted, balance in account etc?
Operator Area Mean N
Aircel
Urban 4.07 395
Rural 4.71 180
Total 4.27 575
Airtel
Urban 4.56 380
Rural 5.21 176
Total 4.77 556
BSNL
Urban 4.90 392
Rural 5.25 178
Total 5.01 570
HFCL
Urban 4.80 420
Rural 4.93 180
Total 4.84 600
Idea
Urban 4.52 386
Rural 4.90 179
Total 4.64 565
Reliance
Urban 4.76 373
Rural 4.72 173
Total 4.75 546
TTSL
Urban 4.22 395
Rural 5.01 179
Total 4.47 574
Vodafone
Urban 4.38 385
Rural 5.31 172
Total 4.67 557
Total
Urban 4.53 3126
Rural 5.00 1417
Total 4.68 4543
Source: Q7 of the Implementationa and Effectiveness part of the qnr

Assessment of Customer perception of Service and Implementation & Punjab Service Area
Effectiveness of Telecom Consumers Protection and Redressal of Grievances Regulations October 2013
63
441, (Basement), Jangpura, Mathura Road, New Delhi – 110014, India
Email: [email protected], URL: www.consumer-voice.org
5.2.8: Request for item-wise usage bill: Out of 4543 pre paid subscribers of eight operators covered, 600(13.2%) had requested for item wise usage bill within 45 days – 18.3% by rural subscribers and 10.9% by urban subscribers. In rural area the maximum request was by TTSL subscribers (26.3%) and in urban area it was from Aircel subscribers (13.9%).
8. A prepaid customer can get an item-wise usage bill within 45 days of making such request. Have you ever requested for it?
Service Provider Yes No Total
Count %age Count %age Count
Aircel
Urban 54 13.7% 341 86.3% 395
Rural 20 11.1% 160 88.9% 180
Total 74 12.9% 501 87.1% 575
Airtel
Urban 49 12.9% 331 87.1% 380
Rural 30 17.0% 146 83.0% 176
Total 79 14.2% 477 85.8% 556
BSNL
Urban 44 11.2% 348 88.8% 392
Rural 32 18.0% 146 82.0% 178
Total 76 13.3% 494 86.7% 570
HFCL
Urban 41 9.8% 379 90.2% 420
Rural 21 11.7% 159 88.3% 180
Total 62 10.3% 538 89.7% 600
Idea
Urban 32 8.3% 354 91.7% 386
Rural 39 21.8% 140 78.2% 179
Total 71 12.6% 494 87.4% 565
Reliance
Urban 32 8.6% 341 91.4% 373
Rural 25 14.5% 148 85.5% 173
Total 57 10.4% 489 89.6% 546
TTSL
Urban 48 12.2% 347 87.8% 395
Rural 47 26.3% 132 73.7% 179
Total 95 16.6% 479 83.4% 574
Vodafone
Urban 41 10.6% 344 89.4% 385
Rural 45 26.2% 127 73.8% 172
Total 86 15.4% 471 84.6% 557
Total
Urban 341 10.9% 2785 89.1% 3126
Rural 259 18.3% 1158 81.7% 1417
Total 600 13.2% 3943 86.8% 4543
Source: Q8 of the Implementationa and Effectiveness part of the qnr

Assessment of Customer perception of Service and Implementation & Punjab Service Area
Effectiveness of Telecom Consumers Protection and Redressal of Grievances Regulations October 2013
64
441, (Basement), Jangpura, Mathura Road, New Delhi – 110014, India
Email: [email protected], URL: www.consumer-voice.org
5.2.9 Satisfaction with the timely receipt and completeness of the item-wise usage bill on request: Overall 600 prepaid subscribers had made request for item-wise usage bill. Overall the satisfaction on this aspect was 5.11 on a scale of 1 to 7, where 1 is highly dissatisfied and 7 is highly satisfied.
9. If Yes, how satisfied are you with the timely receipt and completeness of the item-wise usage bill
on request?
Operator Area Mean COUNT
Aircel
Urban 4.91 54
Rural 4.85 20
Total 4.89 74
Airtel
Urban 5.06 49
Rural 5.20 30
Total 5.11 79
BSNL
Urban 5.14 44
Rural 4.91 32
Total 5.04 76
HFCL
Urban 5.27 41
Rural 5.38 21
Total 5.31 62
Idea
Urban 5.59 32
Rural 4.97 39
Total 5.25 71
Reliance
Urban 5.38 32
Rural 4.80 25
Total 5.12 57
TTSL
Urban 5.02 48
Rural 5.19 47
Total 5.11 95
Vodafone
Urban 5.07 41
Rural 5.09 45
Total 5.08 86
Total
Urban 5.15 341
Rural 5.06 259
Total 5.11 600
Source: Q9 of the Implementationa and Effectiveness part of the qnr

Assessment of Customer perception of Service and Implementation & Punjab Service Area
Effectiveness of Telecom Consumers Protection and Redressal of Grievances Regulations October 2013
65
441, (Basement), Jangpura, Mathura Road, New Delhi – 110014, India
Email: [email protected], URL: www.consumer-voice.org
5.2.10 Awareness about the grievance redressal mechanisms: Of the three different modes of grievance redressal mechanisms set up by different service providers, it was found that in Punjab 89% were aware of toll free number. 2.5% and 1.5% were also aware of Appellate Authority and web based complaint monitoring system of their service providers respectively. Awareness of Appellate Authority was found relatively more in urban area. Operator wise anlaysis shows that percentages of subscribers knowing about Appellate Authority were found quite high in the case of Idea Cellular (16.5%), mainly urban subscribers (23%).
10. Which all grievance redressal mechanisms set up by your telecom service provider based on the TRAI regulations are you
aware of?
Service Provider None
Toll Free Consumer Care
Number
Appellate
Authority
Web based complaint
monitoring system Total
Count %age Count %age Count %age Count %age Count
Aircel
Urban 17 4.0% 400 95% 3 0.7% 0 0.0% 420
Rural 2 1.1% 171 95% 4 2.2% 3 1.7% 180
Total 19 3.20% 571 95% 7 1.2% 3 0.5% 600
Airtel
Urban 38 9.0% 375 89% 2 0.5% 5 1.2% 420
Rural 26 14.4% 154 86% 0 0.0% 0 0.0% 180
Total 64 10.7% 529 88% 2 0.3% 5 0.8% 600
BSNL
Urban 15 3.6% 396 94% 4 1.0% 5 1.2% 420
Rural 12 6.7% 147 82% 0 0.0% 21 11.7% 180
Total 27 4.5% 543 91% 4 0.7% 26 4.3% 600
HFCL
Urban 66 15.7% 353 84% 1 0.2% 0 0.0% 420
Rural 68 37.8% 112 62% 0 0.0% 0 0.0% 180
Total 134 22.3% 465 78% 1 0.2% 0 0.0% 600
Idea
Urban 4 1.0% 306 73% 96 22.9% 14 3.3% 420
Rural 1 0.6% 174 97% 3 1.7% 2 1.1% 180
Total 5 0.8% 480 80% 99 16.5% 16 2.7% 600
Reliance
Urban 21 5.0% 396 94% 0 0.0% 3 0.7% 420
Rural 2 1.1% 176 98% 0 0.0% 2 1.1% 180
Total 23 3.8% 572 95% 0 0.0% 5 0.8% 600
TTSL
Urban 8 1.9% 397 95% 3 0.7% 12 2.9% 420
Rural 1 0.6% 176 98% 2 1.1% 1 0.6% 180
Total 9 1.5% 573 96% 5 0.8% 13 2.2% 600
Vodafone
Urban 27 6.4% 389 92% 1 0.2% 5 1.2% 422
Rural 18 10.0% 160 89% 1 0.6% 1 0.6% 180
Total 45 7.5% 549 91% 2 0.3% 6 1.0% 602
Total
Urban 196 5.8% 3012 90% 110 3.3% 44 1.3% 3362
Rural 130 9.0% 1270 88% 10 0.7% 30 2.1% 1440
Total 326 6.8% 4282 89% 120 2.5% 74 1.5% 4802
Source: Q10 of the Implementationa and Effectiveness part of the qnr
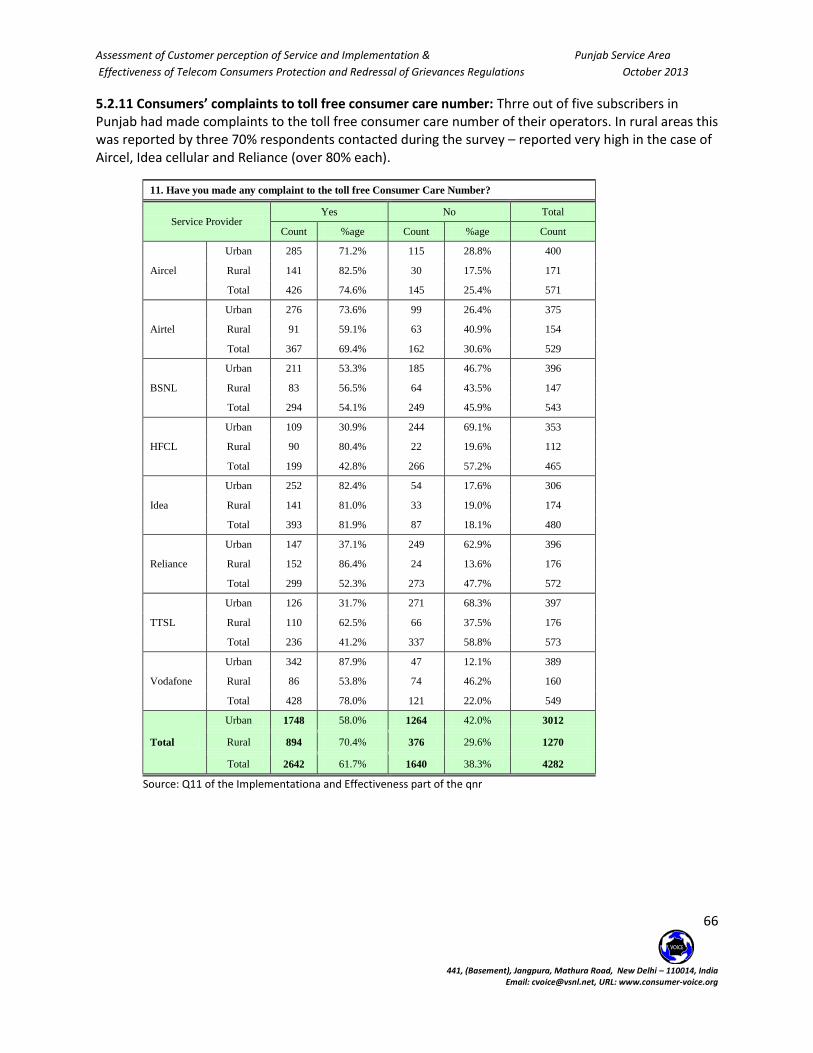
Assessment of Customer perception of Service and Implementation & Punjab Service Area
Effectiveness of Telecom Consumers Protection and Redressal of Grievances Regulations October 2013
66
441, (Basement), Jangpura, Mathura Road, New Delhi – 110014, India
Email: [email protected], URL: www.consumer-voice.org
5.2.11 Consumers’ complaints to toll free consumer care number: Thrre out of five subscribers in Punjab had made complaints to the toll free consumer care number of their operators. In rural areas this was reported by three 70% respondents contacted during the survey – reported very high in the case of Aircel, Idea cellular and Reliance (over 80% each).
11. Have you made any complaint to the toll free Consumer Care Number?
Service Provider Yes No Total
Count %age Count %age Count
Aircel
Urban 285 71.2% 115 28.8% 400
Rural 141 82.5% 30 17.5% 171
Total 426 74.6% 145 25.4% 571
Airtel
Urban 276 73.6% 99 26.4% 375
Rural 91 59.1% 63 40.9% 154
Total 367 69.4% 162 30.6% 529
BSNL
Urban 211 53.3% 185 46.7% 396
Rural 83 56.5% 64 43.5% 147
Total 294 54.1% 249 45.9% 543
HFCL
Urban 109 30.9% 244 69.1% 353
Rural 90 80.4% 22 19.6% 112
Total 199 42.8% 266 57.2% 465
Idea
Urban 252 82.4% 54 17.6% 306
Rural 141 81.0% 33 19.0% 174
Total 393 81.9% 87 18.1% 480
Reliance
Urban 147 37.1% 249 62.9% 396
Rural 152 86.4% 24 13.6% 176
Total 299 52.3% 273 47.7% 572
TTSL
Urban 126 31.7% 271 68.3% 397
Rural 110 62.5% 66 37.5% 176
Total 236 41.2% 337 58.8% 573
Vodafone
Urban 342 87.9% 47 12.1% 389
Rural 86 53.8% 74 46.2% 160
Total 428 78.0% 121 22.0% 549
Total
Urban 1748 58.0% 1264 42.0% 3012
Rural 894 70.4% 376 29.6% 1270
Total 2642 61.7% 1640 38.3% 4282
Source: Q11 of the Implementationa and Effectiveness part of the qnr

Assessment of Customer perception of Service and Implementation & Punjab Service Area
Effectiveness of Telecom Consumers Protection and Redressal of Grievances Regulations October 2013
67
441, (Basement), Jangpura, Mathura Road, New Delhi – 110014, India
Email: [email protected], URL: www.consumer-voice.org
5.2.12 Satisfaction with manner in which the complaint was handled in consumer care: Satisfaction level of 2642 complainants with the resolution on a scale of 1 to 7 where 1 is highly dissatisfied and 7 is highly satisfied, was 3.90 in the urban and 50.3 in the rural area of Punjab. It was recorded highest in the case of TTSL both in rural (5.30) and urban (5.09) areas.
12: Satisfaction on on the manner of addressing the complant such as docket number, redressal
etc.
Operator Area satisfaction level COUNT
Aircel
Urban 3.53 285
Rural 4.66 141
Total 3.91 426
Airtel
Urban 3.53 276
Rural 5.19 91
Total 3.93 367
BSNL
Urban 4.45 211
Rural 5.20 83
Total 4.69 294
HFCL
Urban 5.87 109
Rural 5.21 90
Total 5.58 199
Idea
Urban 3.30 252
Rural 5.01 141
Total 3.79 393
Reliance
Urban 4.97 147
Rural 4.94 152
Total 4.95 299
TTSL
Urban 5.09 126
Rural 5.30 110
Total 5.18 236
Vodafone
Urban 3.24 342
Rural 4.94 86
Total 3.58 428
Total
Urban 3.90 1748
Rural 5.03 894
Total 4.27 2642
Source: Q12 of the Implementationa and Effectiveness part of the qnr

Assessment of Customer perception of Service and Implementation & Punjab Service Area
Effectiveness of Telecom Consumers Protection and Redressal of Grievances Regulations October 2013
68
441, (Basement), Jangpura, Mathura Road, New Delhi – 110014, India
Email: [email protected], URL: www.consumer-voice.org
5.2.13 & 14 Consumers’ appeal to Appellate Authority and Satisfaction with manner in which your appeal was addressed: Only six of the subscribers in Punjab Service Area, who were aware of the Appellate Authority, had filed appeal. The average satisfaction level was 5.17 on a scale of 1 to 7, where 1 is highly dissatisfied and 7 is highly satisfied.
13. Have you filed any appeal with the appellate authority?
Service Provider Yes No Total
Count %age Count %age Count
Aircel
Urban 1 33.3% 2 66.7% 3
Rural 2 50.0% 2 50.0% 4
Total 3 42.9% 4 57.1% 7
Airtel
Urban 0 0.0% 2 100.0% 2
Rural 0 0.0% 0 0.0% 0
Total 0 0.0% 2 100.0% 2
BSNL
Urban 0 0.0% 4 100.0% 4
Rural 0 0.0% 0 0.0% 0
Total 0 0.0% 4 100.0% 4
HFCL
Urban 1 100.0% 0 0.0% 1
Rural 0 0.0% 0 0.0% 0
Total 1 100.0% 0 0.0% 1
Idea
Urban 1 1.0% 95 99.0% 96
Rural 0 0.0% 3 100.0% 3
Total 1 1.0% 98 99.0% 99
Reliance
Urban 0 0.0% 0 0.0% 0
Rural 0 0.0% 0 0.0% 0
Total 0 0.0% 0 0.0% 0
TTSL
Urban 0 0.0% 3 100.0% 3
Rural 0 0.0% 2 100.0% 2
Total 0 0.0% 5 100.0% 5
Vodafone
Urban 1 100.0% 0 0.0% 1
Rural 0 0.0% 1 100.0% 1
Total 1 50.0% 1 50.0% 2
Total
Urban 4 3.6% 106 96.4% 110
Rural 2 20.0% 8 80.0% 10
Total 6 5.0% 114 95.0% 120
14: Satisfaction with Appellate authority
Operator Area_rev satisfaction
level COUNT
Aircel
Urban 5.00 1
Rural 6.00 2
Total 5.67 3
HFCL
Urban 4.00 1
Rural
Total 4.00 1
Idea
Urban 7.00 1
Rural
Total 7.00 1
Vodafone
Urban 3.00 1
Rural
Total 3.00 1
Total
Urban 4.75 4
Rural 6.00 2
Total 5.17 6

Assessment of Customer perception of Service and Implementation & Punjab Service Area
Effectiveness of Telecom Consumers Protection and Redressal of Grievances Regulations October 2013
69
441, (Basement), Jangpura, Mathura Road, New Delhi – 110014, India
Email: [email protected], URL: www.consumer-voice.org
5.2.15 Utilization of Mobile Number Portability service: Of the total 4802 consumers contacted during the survey in Punjab Service Area, altogether 364 (7.6%) had utilized the MNP service of their service providers. Usage of MNP was reported highest by the current subscribers of BSNL in urban area (29.3%) area.
15. Have you utilized the service of Mobile number portability for changing your
operator?
Operator Area Yes No Total
Count Row N % Count Row N % Count
Aircel
Urban 29 6.9% 391 93.1% 420
Rural 16 8.9% 164 91.1% 180
Total 45 7.5% 555 92.5% 600
Airtel
Urban 16 3.8% 404 96.2% 420
Rural 20 11.1% 160 88.9% 180
Total 36 6.0% 564 94.0% 600
BSNL
Urban 123 29.3% 297 70.7% 420
Rural 7 3.9% 173 96.1% 180
Total 130 21.7% 470 78.3% 600
HFCL
Urban 14 3.3% 406 96.7% 420
Rural 9 5.0% 171 95.0% 180
Total 23 3.8% 577 96.2% 600
Idea
Urban 18 4.3% 402 95.7% 420
Rural 13 7.2% 167 92.8% 180
Total 31 5.2% 569 94.8% 600
Reliance
Urban 8 1.9% 412 98.1% 420
Rural 8 4.4% 172 95.6% 180
Total 16 2.7% 584 97.3% 600
TTSL
Urban 22 5.2% 398 94.8% 420
Rural 17 9.4% 163 90.6% 180
Total 39 6.5% 561 93.5% 600
Vodafone
Urban 27 6.4% 395 93.6% 422
Rural 17 9.4% 163 90.6% 180
Total 44 7.3% 558 92.7% 602
Total
Urban 257 7.6% 3105 92.4% 3362
Rural 107 7.4% 1333 92.6% 1440
Total 364 7.6% 4438 92.4% 4802
Source: Q15 of the Implementationa and Effectiveness part of the qnr
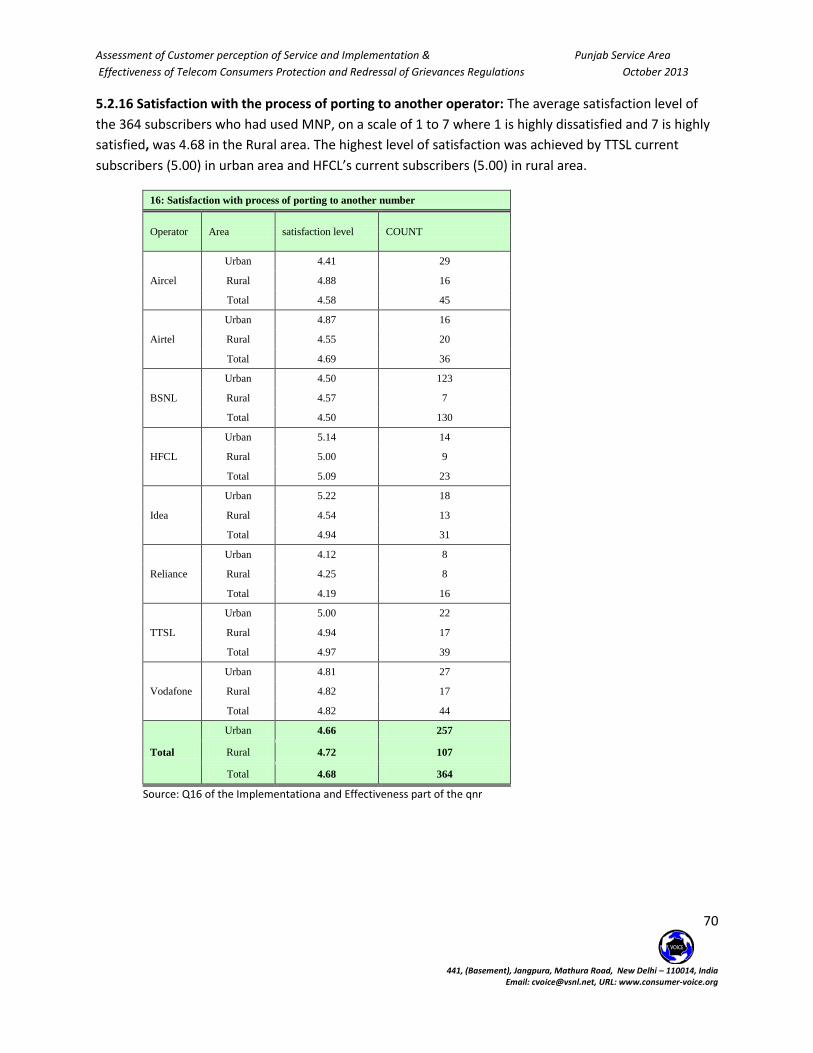
Assessment of Customer perception of Service and Implementation & Punjab Service Area
Effectiveness of Telecom Consumers Protection and Redressal of Grievances Regulations October 2013
70
441, (Basement), Jangpura, Mathura Road, New Delhi – 110014, India
Email: [email protected], URL: www.consumer-voice.org
5.2.16 Satisfaction with the process of porting to another operator: The average satisfaction level of
the 364 subscribers who had used MNP, on a scale of 1 to 7 where 1 is highly dissatisfied and 7 is highly
satisfied, was 4.68 in the Rural area. The highest level of satisfaction was achieved by TTSL current
subscribers (5.00) in urban area and HFCL’s current subscribers (5.00) in rural area.
16: Satisfaction with process of porting to another number
Operator Area satisfaction level COUNT
Aircel
Urban 4.41 29
Rural 4.88 16
Total 4.58 45
Airtel
Urban 4.87 16
Rural 4.55 20
Total 4.69 36
BSNL
Urban 4.50 123
Rural 4.57 7
Total 4.50 130
HFCL
Urban 5.14 14
Rural 5.00 9
Total 5.09 23
Idea
Urban 5.22 18
Rural 4.54 13
Total 4.94 31
Reliance
Urban 4.12 8
Rural 4.25 8
Total 4.19 16
TTSL
Urban 5.00 22
Rural 4.94 17
Total 4.97 39
Vodafone
Urban 4.81 27
Rural 4.82 17
Total 4.82 44
Total
Urban 4.66 257
Rural 4.72 107
Total 4.68 364
Source: Q16 of the Implementationa and Effectiveness part of the qnr

Assessment of Customer perception of Service and Implementation & Punjab Service Area
Effectiveness of Telecom Consumers Protection and Redressal of Grievances Regulations October 2013
71
441, (Basement), Jangpura, Mathura Road, New Delhi – 110014, India
Email: [email protected], URL: www.consumer-voice.org
5.2.17: OVERALL SCORE - CELLULAR (MOBILE) The following table shows the provider wise score on various provisions of the Telecom Consumer Protection and Redressal of Grievances Act.
S.N. Sub Parameters Area All SPs Aircel Airtel BSNL HFCL Idea Reliance TTSL Vodafone
1 Registration for blocking unsolicited commercial calls/SMSs
Urban 17.0% 18.1% 17.6% 16.2% 17.6% 18.8% 15.7% 15.5% 16.8%
Rural 35.5% 42.2% 32.8% 23.9% 25.0% 43.3% 36.1% 47.2% 33.3%
Total 22.6% 25.3% 22.2% 18.5% 19.8% 26.2% 21.8% 25.0% 21.8%
2 Complaint lodged in case unsolicited call/SMS have not stopped
Urban 76.4% 69.7% 82.4% 77.9% 78.4% 75.9% 72.7% 83.1% 71.8%
Rural 76.9% 48.7% 72.9% 86.0% 73.3% 79.5% 76.9% 88.2% 93.3%
Total 76.7% 59.2% 78.2% 81.1% 76.5% 77.7% 74.8% 86.0% 81.7%
3 Awareness about toll free Consumer Care Number
Urban 89.6% 95.2% 89.3% 94.3% 84.0% 72.9% 94.3% 94.5% 92.2%
Rural 88.2% 95.0% 85.6% 81.7% 62.2% 96.7% 97.8% 97.8% 88.9%
Total 89.2% 95.2% 88.2% 90.5% 77.5% 80.0% 95.3% 95.5% 91.2%
4 Complaint to toll free Consumer Care Number for redressing grievances
Urban 58.0% 71.2% 73.6% 53.3% 30.9% 82.4% 37.1% 31.7% 87.9%
Rural 70.4% 82.5% 59.1% 56.5% 80.4% 81.0% 86.4% 62.5% 53.8%
Total 61.7% 74.6% 69.4% 54.1% 42.8% 81.9% 52.3% 41.2% 78.0%
5 Awareness about appellate authority
Urban 3.3% 0.7% 0.5% 1.0% 0.2% 22.9% 0.0% 0.7% 0.2%
Rural 0.7% 2.2% 0.0% 0.0% 0.0% 1.7% 0.0% 1.1% 0.6%
Total 2.5% 1.2% 0.3% 0.7% 0.2% 16.5% 0.0% 0.8% 0.3%
6 MNP utilized
Urban 7.6% 6.9% 3.8% 29.3% 3.3% 4.3% 1.9% 5.2% 6.4%
Rural 7.4% 8.9% 11.1% 3.9% 5.0% 7.2% 4.4% 9.4% 9.4%
Total 7.6% 7.5% 6.0% 21.7% 3.8% 5.2% 2.7% 6.5% 7.3%
Overall registration for blocking unsolicited commercial calls/SMSs was 22.6%- much higher in the case of rural areas (35.5%) in comparison to the urban area (17%). This shows that there was a huge difference in the rural and urban areas.
Lodging complaint in case unsolicited call/SMS have not stopped in spite of registration for the
same was found to be at 76.7%. This shows the ineffectiveness of this service
All 90% were aware of the toll free consumer care number.
Complaint to the toll free consumer care number for redressing grievances higher in rural areas
(70.4%) as compared to urban areas (58%).
Overall awareness of the appellate authority was found to be 3.3% in urban area and only 0.7% in
rural area.
A similar trend was observed in the case of MNP utilisation in rural (7.4%) and urban (7.6%) areas.
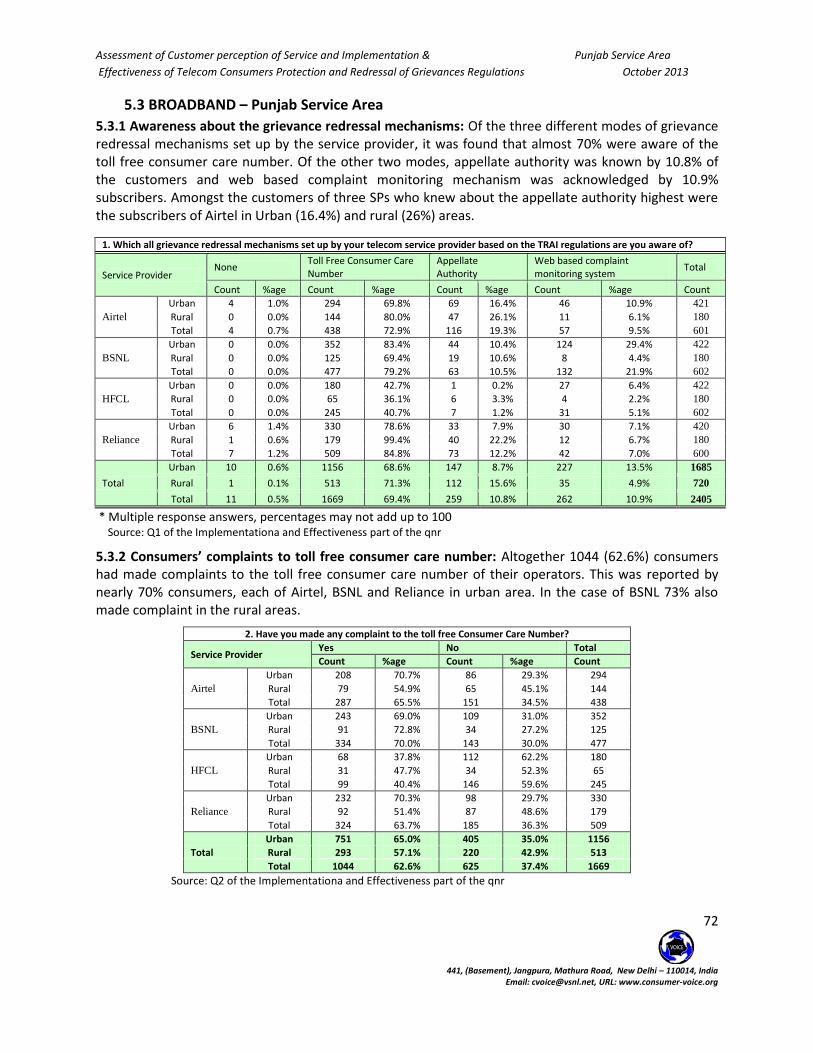
Assessment of Customer perception of Service and Implementation & Punjab Service Area
Effectiveness of Telecom Consumers Protection and Redressal of Grievances Regulations October 2013
72
441, (Basement), Jangpura, Mathura Road, New Delhi – 110014, India
Email: [email protected], URL: www.consumer-voice.org
5.3 BROADBAND – Punjab Service Area
5.3.1 Awareness about the grievance redressal mechanisms: Of the three different modes of grievance redressal mechanisms set up by the service provider, it was found that almost 70% were aware of the toll free consumer care number. Of the other two modes, appellate authority was known by 10.8% of the customers and web based complaint monitoring mechanism was acknowledged by 10.9% subscribers. Amongst the customers of three SPs who knew about the appellate authority highest were the subscribers of Airtel in Urban (16.4%) and rural (26%) areas.
1. Which all grievance redressal mechanisms set up by your telecom service provider based on the TRAI regulations are you aware of?
Service Provider None
Toll Free Consumer Care Number
Appellate Authority
Web based complaint monitoring system
Total
Count %age Count %age Count %age Count %age Count
Airtel
Urban 4 1.0% 294 69.8% 69 16.4% 46 10.9% 421
Rural 0 0.0% 144 80.0% 47 26.1% 11 6.1% 180
Total 4 0.7% 438 72.9% 116 19.3% 57 9.5% 601
BSNL
Urban 0 0.0% 352 83.4% 44 10.4% 124 29.4% 422
Rural 0 0.0% 125 69.4% 19 10.6% 8 4.4% 180
Total 0 0.0% 477 79.2% 63 10.5% 132 21.9% 602
HFCL
Urban 0 0.0% 180 42.7% 1 0.2% 27 6.4% 422
Rural 0 0.0% 65 36.1% 6 3.3% 4 2.2% 180
Total 0 0.0% 245 40.7% 7 1.2% 31 5.1% 602
Reliance
Urban 6 1.4% 330 78.6% 33 7.9% 30 7.1% 420
Rural 1 0.6% 179 99.4% 40 22.2% 12 6.7% 180
Total 7 1.2% 509 84.8% 73 12.2% 42 7.0% 600
Total
Urban 10 0.6% 1156 68.6% 147 8.7% 227 13.5% 1685
Rural 1 0.1% 513 71.3% 112 15.6% 35 4.9% 720
Total 11 0.5% 1669 69.4% 259 10.8% 262 10.9% 2405
* Multiple response answers, percentages may not add up to 100 Source: Q1 of the Implementationa and Effectiveness part of the qnr
5.3.2 Consumers’ complaints to toll free consumer care number: Altogether 1044 (62.6%) consumers had made complaints to the toll free consumer care number of their operators. This was reported by nearly 70% consumers, each of Airtel, BSNL and Reliance in urban area. In the case of BSNL 73% also made complaint in the rural areas.
2. Have you made any complaint to the toll free Consumer Care Number?
Service Provider Yes No Total
Count %age Count %age Count
Airtel
Urban 208 70.7% 86 29.3% 294
Rural 79 54.9% 65 45.1% 144
Total 287 65.5% 151 34.5% 438
BSNL
Urban 243 69.0% 109 31.0% 352
Rural 91 72.8% 34 27.2% 125
Total 334 70.0% 143 30.0% 477
HFCL
Urban 68 37.8% 112 62.2% 180
Rural 31 47.7% 34 52.3% 65
Total 99 40.4% 146 59.6% 245
Reliance
Urban 232 70.3% 98 29.7% 330
Rural 92 51.4% 87 48.6% 179
Total 324 63.7% 185 36.3% 509
Total
Urban 751 65.0% 405 35.0% 1156
Rural 293 57.1% 220 42.9% 513
Total 1044 62.6% 625 37.4% 1669
Source: Q2 of the Implementationa and Effectiveness part of the qnr

Assessment of Customer perception of Service and Implementation & Punjab Service Area
Effectiveness of Telecom Consumers Protection and Redressal of Grievances Regulations October 2013
73
441, (Basement), Jangpura, Mathura Road, New Delhi – 110014, India
Email: [email protected], URL: www.consumer-voice.org
5.3.3 Satisfaction with manner in which the complaint was handled in consumer care: 1044 customers who had made lodged their complaints at the toll free consumer care no, average satisfaction level on a scale of 1 to 7 where 1 is highly dissatisfied and 7 is highly satisfied, was 3.56 in the rural and 3.82 in the urban area of Punjab. It was recorded highest in the case of HFCL, both in urban (4.45) and rural (4.39) areas.
3: Satisfaction on the manner of addressing the complaint such as docket number, redressal etc.
Operator Area satisfaction level COUNT
Airtel
Urban 3.01 208
Rural 3.45 79
Total 3.15 287
BSNL
Urban 3.99 243
Rural 3.56 91
Total 3.86 334
HFCL
Urban 4.45 68
Rural 4.39 31
Total 4.43 99
Reliance
Urban 3.75 232
Rural 2.63 92
Total 3.47 324
Total
Urban 3.82 751
Rural 3.56 293
Total 3.75 1044
Source: Q3 of the Implementationa and Effectiveness part of the qnr
5.3.4 Consumers’ appeal to Appellate Authority: Of the 259 consumers who were aware of the appellate authority, 22 (8.5%) had appealed to the appellate authority set up by their operators. This was found highest in the case of HFCL (16.7%), all from rural area. In the urab area it was recorded highest in the case of Reliance (12.1%).
4. Have you made any appeal to Appellate Authority
Yes No Total
Count %age Count %age Count
Airtel
Urban 5 7.2% 64 92.8% 69
Rural 5 10.6% 42 89.4% 47
Total 10 8.6% 106 91.4% 116
BSNL
Urban 2 4.5% 42 95.5% 44
Rural 2 10.5% 17 89.5% 19
Total 4 6.3% 59 93.7% 63
HFCL
Urban 0 0.0% 1 100.0% 1
Rural 1 16.7% 5 83.3% 6
Total 1 14.3% 6 85.7% 7
Reliance
Urban 4 12.1% 29 87.9% 33
Rural 3 7.5% 37 92.5% 40
Total 7 9.6% 66 90.4% 73
Total
Urban 11 7.5% 136 92.5% 147
Rural 11 9.8% 101 90.2% 112
Total 22 8.5% 237 91.5% 259
Source: Q4 of the Implementationa and Effectiveness part of the qnr

Assessment of Customer perception of Service and Implementation & Punjab Service Area
Effectiveness of Telecom Consumers Protection and Redressal of Grievances Regulations October 2013
74
441, (Basement), Jangpura, Mathura Road, New Delhi – 110014, India
Email: [email protected], URL: www.consumer-voice.org
5.3.5 Satisfaction with manner in which your appeal was addressed: 22 customers who had made apppeal at the Appellate Authority, average satisfaction level on a scale of 1 to 7 where 1 is highly dissatisfied and 7 is highly satisfied, was 2.91 in the rural and 3.45 in the urban area of Punjab. BSNL and HFCL, both recorded a satisfaction score of 5.00.
5: Satisfaction with Appellate authority
Operator Area satisfaction level
COUNT
Airtel
Urban 2.00 5
Rural 2.00 5
Total 2.00 10
BSNL
Urban 5.00 2
Rural 5.00 2
Total 5.00 4
HFCL
Urban
Rural 5.00 1
Total 5.00 1
Reliance
Urban 4.50 4
Rural 2.33 3
Total 3.57 7
Total
Urban 3.45 11
Rural 2.91 11
Total 3.18 22
Source: Q5 of the Implementationa and Effectiveness part of the qnr
5.3.6 Satisfaction under Fair Usage Policy (FUP): Average satisfaction level, with the fair usage policy of the broadband operators, on a scale of 1 to 7 where 1 is highly dissatisfied and 7 is highly satisfied, was 4.27 in the rural and 4.35 in the urban area of Punjab. Therefore the difference in the satisfaction level was not much in rural and urban area. It was recorded highest in the case of HFCL, both in rural (4.73) and urban (5.12) areas.
6: Satisfaction with information provided under FUP
Operator Area satisfaction level COUNT
Airtel
Urban 3.57 421
Rural 4.00 180
Total 3.70 601
BSNL
Urban 4.49 422
Rural 4.39 180
Total 4.46 602
HFCL
Urban 5.12 422
Rural 4.73 180
Total 5.01 602
Reliance
Urban 4.21 420
Rural 3.95 180
Total 4.13 600
Total
Urban 4.35 1685
Rural 4.27 720
Total 4.32 2405
Source: Q6 of the Implementationa and Effectiveness part of the qnr

Assessment of Customer perception of Service and Implementation & Punjab Service Area
Effectiveness of Telecom Consumers Protection and Redressal of Grievances Regulations October 2013
75
441, (Basement), Jangpura, Mathura Road, New Delhi – 110014, India
Email: [email protected], URL: www.consumer-voice.org
5.3.7 Satisfaction with the facility to measure the broadband connection speed: Average satisfaction level, with the facility provided for measuring broadband speed by the operators in Punjab, on a scale of 1 to 7 where 1 is highly dissatisfied and 7 is highly satisfied, was recorded low at 3.94 – not much difference in rural and urban areas. It was rated highest by the subscribers of HFCL (4.98) and lowest by the subscribers of Airtel (3.15).
7: Satisfaction with facility provided to measure broadband speed
Operator Area_rev satisfaction level COUNT
Airtel
Urban 2.94 421
Rural 3.64 180
Total 3.15 601
BSNL
Urban 4.21 422
Rural 3.85 180
Total 4.10 602
HFCL
Urban 5.10 422
Rural 4.71 180
Total 4.98 602
Reliance
Urban 3.60 420
Rural 3.27 180
Total 3.50 600
Total
Urban 3.96 1685
Rural 3.87 720
Total 3.94 2405
Source: Q7 of the Implementationa and Effectiveness part of the qnr
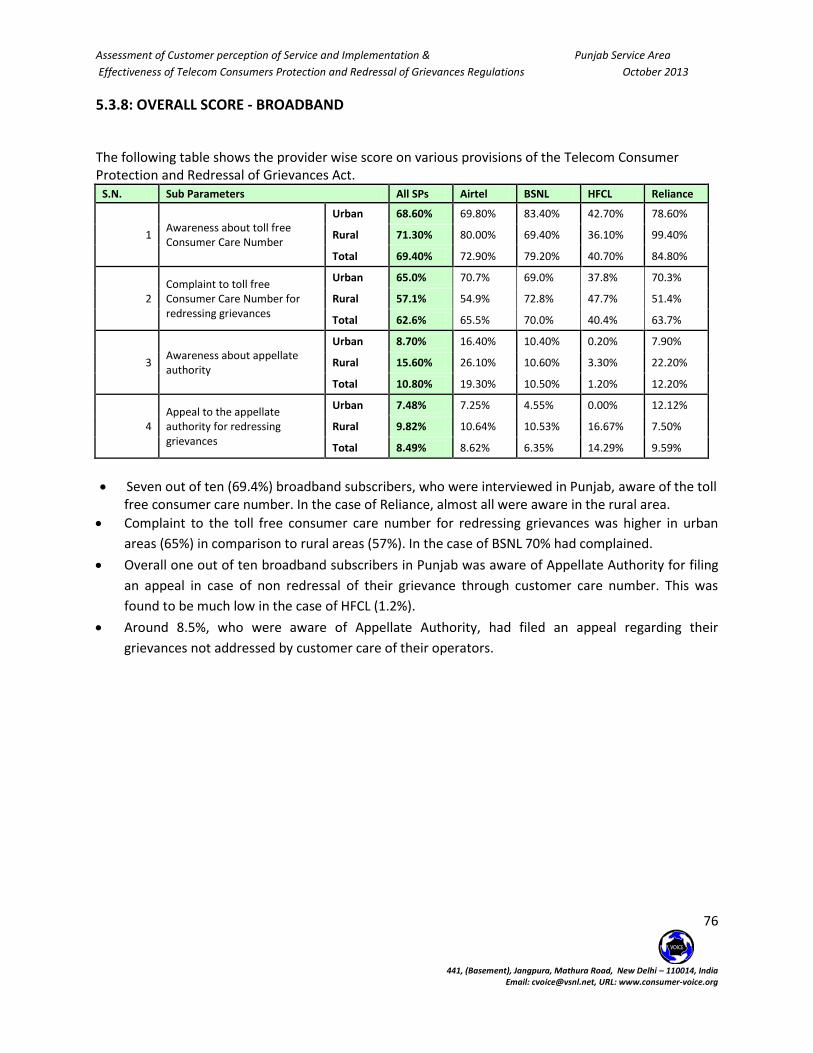
Assessment of Customer perception of Service and Implementation & Punjab Service Area
Effectiveness of Telecom Consumers Protection and Redressal of Grievances Regulations October 2013
76
441, (Basement), Jangpura, Mathura Road, New Delhi – 110014, India
Email: [email protected], URL: www.consumer-voice.org
5.3.8: OVERALL SCORE - BROADBAND
The following table shows the provider wise score on various provisions of the Telecom Consumer Protection and Redressal of Grievances Act.
S.N. Sub Parameters All SPs Airtel BSNL HFCL Reliance
1 Awareness about toll free Consumer Care Number
Urban 68.60% 69.80% 83.40% 42.70% 78.60%
Rural 71.30% 80.00% 69.40% 36.10% 99.40%
Total 69.40% 72.90% 79.20% 40.70% 84.80%
2 Complaint to toll free Consumer Care Number for redressing grievances
Urban 65.0% 70.7% 69.0% 37.8% 70.3%
Rural 57.1% 54.9% 72.8% 47.7% 51.4%
Total 62.6% 65.5% 70.0% 40.4% 63.7%
3 Awareness about appellate authority
Urban 8.70% 16.40% 10.40% 0.20% 7.90%
Rural 15.60% 26.10% 10.60% 3.30% 22.20%
Total 10.80% 19.30% 10.50% 1.20% 12.20%
4 Appeal to the appellate authority for redressing grievances
Urban 7.48% 7.25% 4.55% 0.00% 12.12%
Rural 9.82% 10.64% 10.53% 16.67% 7.50%
Total 8.49% 8.62% 6.35% 14.29% 9.59%
Seven out of ten (69.4%) broadband subscribers, who were interviewed in Punjab, aware of the toll free consumer care number. In the case of Reliance, almost all were aware in the rural area.
Complaint to the toll free consumer care number for redressing grievances was higher in urban
areas (65%) in comparison to rural areas (57%). In the case of BSNL 70% had complained.
Overall one out of ten broadband subscribers in Punjab was aware of Appellate Authority for filing
an appeal in case of non redressal of their grievance through customer care number. This was
found to be much low in the case of HFCL (1.2%).
Around 8.5%, who were aware of Appellate Authority, had filed an appeal regarding their
grievances not addressed by customer care of their operators.

Assessment of Customer perception of Service and Implementation And Effectiveness of Various regulations, directions and orders issued
by TRAI in the interest of consumers October 2013
O-45 (Basement), Lajpat Nagar-II, Ring Road – 110024, India
Email: [email protected], URL: www.consumer-voice.org Page 77
6. CONCLUSION AND RECOMMENDATIONS
Assessment of Customer perception of Service and Implementation And Effectiveness of Various regulations, directions and orders issued
by TRAI in the interest of consumers October 2013
O-45 (Basement), Lajpat Nagar-II, Ring Road – 110024, India
Email: [email protected], URL: www.consumer-voice.org Page 78
6. Conclusion and Recommendations
As discussed in Chapter 1 of the report, the main objective of the study was to:
1. To assess the Implementation and Effectiveness of Telecom Consumers Protection and
Redressal of Grievances Regulations, 2012
2. To Assess Customer perception of Service as defined in Regulations on quality of service of
Basic, Cellular and Broadband Service.
Therefore, the present report deals with the subject matter as listed above of the three services –
Basic service (Wireline), Cellular Mobile and Broadband – in Rajasthan Service Area.
Altogether 7 parameters were considered to assess the customer perception of services. The
consumers were asked to ranked the services on the defined parameter on a likert scale of 1 to 7,
where, 7 means extremely satisfied and 1 means extremely dissatisfied. To measure the percentage
of consumers satisfied on various QoS parameters, top 4 box scores are taken into account thereby
not considering the respondents who are actively dissatisfied with the services. The neutral score of
4 is therefore considered as not dissatisfied. Therefore, the proportion of sum total of “Not
dissatisfied”, “Satisfied”, “Very Satisfied” and “Extremely Satisfied” consumers were taken out from
the total number of valid responses on the all questions of each of the broad parameter.
Consumers satisfied are ascertained using the following formula(s):
CS = (A / N) *100
Where:
CS = % of satisfied consumers
A = sum total of no. of subscribers who were “Not dissatisfied” + “Satisfied” + “Very Satisfied” +
“Extremely Satisfied” on each of the broad parameter
N = Total sample size achieved
6.1 Key Takeout 6.1.1 Basic Service (Wireline):
1) The quality of Basic telecom service in Punjab is good. All the four operators operators
(Airtel, BSNL, HFCL and Reliance) were able to meet the TRAI prescribed benchmark on
almost all of the parameters – in rural as well as urban areas.
2) With regard to the implementation and effectiveness of grievance redressal, most of the consumers are aware of only call centre. It is the Appellate Authority on which the awareness level is still low.
Assessment of Customer perception of Service and Implementation And Effectiveness of Various regulations, directions and orders issued
by TRAI in the interest of consumers October 2013
O-45 (Basement), Lajpat Nagar-II, Ring Road – 110024, India
Email: [email protected], URL: www.consumer-voice.org Page 79
3) Satisfaction level on registration for blocking or not receiving unsolicited call/SMS were found to be too low.
6.1.2 Cellular Mobile
1) Overall, the performance of all the operators was quite low and none of the eight operators were able to meet the benchmark on all the standards prescribed by TRAI. BSNL was the only operator to meet the benchmark on Help services and availability and reliability of network.
2) With regard to the implementation and effectiveness of grievance redressal, around one fifth had requested for blocking or not receiving the unsolicited calls and SMSes. But consumer satisfaction level on this aspect was low at 4.83. Over 75% had complained on the ineffective of working of DNC services. Prepaid subscribers were not so happy with the information provided after usage of service such as charges being deducted, balance in account etc. Only 2.5% were aware about the Appellate Authority and 5% of them have used this service.
6.1.3 Broadband 1. In the case of broadband, the performance of Airtel ad Reliance was found to be better than
BSNL and HFCL in Punjab Service Area. However, their services with regard to supplementary service was found to be below prescribed benchmark.
4. With regard to the implementation and effectiveness of grievance redressal mechanism, almost 70% were aware about toll free customer care number of their operator and of these 63% had put their complaints on deficiency of some services. In urban area the problem was more serious.
Assessment of Customer perception of Service and Implementation And Effectiveness of Various regulations, directions and orders issued
by TRAI in the interest of consumers October 2013
O-45 (Basement), Lajpat Nagar-II, Ring Road – 110024, India
Email: [email protected], URL: www.consumer-voice.org Page 80
6.2 Recommendations 6.2.1 Basic Service (Wireline):
1) Help service need to further improved and ISO standards for maintaining the Quality of service such as ISO 10,000 or others should be explored for desired result.
2) In order to spread the awareness level about the redressal mechanism, more drastic step should be adopted. Although the awareness of toll free consumer number is found to be high, all the service providers need to work for spreading the awareness about appellate authority.
3) Do not Call facity should be regularly monitored and keeping in mind the request of individual customers.
6.2.2 Cellular Mobile
1) Billing, Network availability and Maintainability are serious concerns for almost all the service providers. All of them should adopt effective mechanism to deal with these issues as none of the seven operators were able to meet the benchmark. In fact Videocon was far below the prescribed benchmark standard.
2) With the tremendous growth in number of subscribers, the operators should introduce more effective customer care service. This will take care of more effective mechanism to handle the concerns of their customers. Also they need to improve their infrastructure facility as the number of subscribers with all the operators is increasing every day. Regulator should evolve a mechanism where to measure the delivering capacity of each of the provider and at regular interval. Call drop incidences should be more stringently monitored. The operators should do investment on skilled man power in order to avoid the repeat complaints on the same issue.
3) ISO standards for maintaining the Quality of service such as ISO 10,000 or others should be explored for desired result.
6.2.3 Broadband
1) All the three service providers need to improve their services on help and network availability especially in the rural area of Punjab.
2) ISO standards for maintaining the Quality of service such as ISO 10,000 or others should be explored for desired result.

Assessment of Customer perception of Service and Implementation And Effectiveness of Various regulations, directions and orders issued
by TRAI in the interest of consumers October 2013
O-45 (Basement), Lajpat Nagar-II, Ring Road – 110024, India
Email: [email protected], URL: www.consumer-voice.org Page 81
ANNEXURES

Assessment of Customer perception of Service and Implementation And Effectiveness of Various regulations, directions and orders issued
by TRAI in the interest of consumers October 2013
O-45 (Basement), Lajpat Nagar-II, Ring Road – 110024, India
Email: [email protected], URL: www.consumer-voice.org Page 82
ANNEXURE A. OUTPUT TABLES
A1. BASIC WIRELINE
1. Provision of Services
1.1 How satisfied are you with the ease of taking a connection?
Service Provider 1 2 3 4 5 6 7 Total
Count Count Count Count Count Count Count Count
Airtel
Urban 0 0 6 63 285 51 16 421
Rural 0 0 0 4 129 47 0 180
Total 0 0 6 67 414 98 16 601
BSNL
Urban 0 0 15 105 193 63 46 422
Rural 0 1 5 21 87 31 35 180
Total 0 1 20 126 280 94 81 602
HFCL
Urban 0 0 2 38 220 136 27 423
Rural 0 0 1 20 124 29 6 180
Total 0 0 3 58 344 165 33 603
Reliance
Urban 0 0 1 53 260 104 5 423
Rural 0 0 3 7 104 66 0 180
Total 0 0 4 60 364 170 5 603
Total
Urban 0 0 24 259 958 354 94 1689
Rural 0 1 9 52 444 173 41 720
Total 0 1 33 311 1402 527 135 2409
1.2 How satisfied are you with the provision and understanding of all relevant information related to tariff
plans & charges?
Service Provider 1 2 3 4 5 6 7 Total
Count Count Count Count Count Count Count Count
Airtel
Urban 0 0 5 79 247 82 8 421
Rural 0 1 1 5 95 78 0 180
Total 0 1 6 84 342 160 8 601
BSNL
Urban 0 1 18 123 170 86 24 422
Rural 0 1 3 24 79 53 20 180
Total 0 2 21 147 249 139 44 602
HFCL
Urban 0 1 1 47 197 157 20 423
Rural 0 0 0 18 113 43 6 180
Total 0 1 1 65 310 200 26 603
Reliance
Urban 0 0 3 60 242 115 3 423
Rural 0 0 2 13 97 67 1 180
Total 0 0 5 73 339 182 4 603
Total
Urban 0 2 27 309 856 440 55 1689
Rural 0 2 6 60 384 241 27 720
Total 0 4 33 369 1240 681 82 2409
1.3 How satisfied are you with the availability of suitable plans/recharge vouchers as per your
requirement?
Service Provider 1 2 3 4 5 6 7 Total
Count Count Count Count Count Count Count Count
Airtel
Urban 0 0 3 76 274 60 8 421
Rural 0 0 0 6 136 38 0 180
Total 0 0 3 82 410 98 8 601
BSNL
Urban 0 0 15 108 190 93 16 422
Rural 0 0 1 28 80 45 26 180
Total 0 0 16 136 270 138 42 602
HFCL
Urban 0 0 2 43 243 121 14 423
Rural 0 0 0 24 124 28 4 180
Total 0 0 2 67 367 149 18 603
Reliance
Urban 0 0 2 58 261 98 4 423
Rural 0 0 3 11 120 46 0 180
Total 0 0 5 69 381 144 4 603
Total
Urban 0 0 22 285 968 372 42 1689
Rural 0 0 4 69 460 157 30 720
Total 0 0 26 354 1428 529 72 2409

Assessment of Customer perception of Service and Implementation And Effectiveness of Various regulations, directions and orders issued
by TRAI in the interest of consumers October 2013
O-45 (Basement), Lajpat Nagar-II, Ring Road – 110024, India
Email: [email protected], URL: www.consumer-voice.org Page 83
Provision of Services: Calculation of satisfaction Score
code 1 2 3 4 5 6 7 Total,
N Benchmark
Overall
Weighted Satisfaction
Airtel
Urban 0 0 14 218 806 193 32 1263 90% 98.9%
Rural 0 1 1 15 360 163 0 540 90% 99.6%
Total 0 1 15 233 1166 356 32 1803 90% 99.1%
BSNL
Urban 0 1 48 336 553 242 86 1266 90% 96.1%
Rural 0 2 9 73 246 129 81 540 90% 98.0%
Total 0 3 57 409 799 371 167 1806 90% 96.7%
HFCL
Urban 0 1 5 128 660 414 61 1269 90% 99.5%
Rural 0 0 1 62 361 100 16 540 90% 99.8%
Total 0 1 6 190 1021 514 77 1809 90% 99.6%
Reliance
Urban 0 0 6 171 763 317 12 1269 90% 99.5%
Rural 0 0 8 31 321 179 1 540 90% 98.5%
Total 0 0 14 202 1084 496 13 1809 90% 99.2%
Total
Urban 0 2 73 853 2782 1166 191 5067 90% 98.5%
Rural 0 3 19 181 1288 571 98 2160 90% 99.0%
Total 0 5 92 1034 4070 1737 289 7227 90% 98.7%
2. Billing Related (only for postpaid customers) 2.5 How satisfied are you with the charges levied per call?
Service Provider 1 2 3 4 5 6 7 Total
Count Count Count Count Count Count Count Count
Airtel
Urban 0 0 9 116 249 32 15 421
Rural 0 0 1 35 113 31 0 180
Total 0 0 10 151 362 63 15 601
BSNL
Urban 0 1 18 141 177 53 32 422
Rural 0 2 3 31 88 25 31 180
Total 0 3 21 172 265 78 63 602
HFCL
Urban 1 1 5 101 199 90 26 423
Rural 0 0 0 43 114 15 8 180
Total 1 1 5 144 313 105 34 603
Reliance
Urban 0 0 5 99 230 85 4 423
Rural 0 0 6 46 96 32 0 180
Total 0 0 11 145 326 117 4 603
Total
Urban 1 2 37 457 855 260 77 1689
Rural 0 2 10 155 411 103 39 720
Total 1 4 47 612 1266 363 116 2409
2.6 How satisfied are you with the overall accuracy & completeness of the bills?
Service Provider 1 2 3 4 5 6 7 Total
Count Count Count Count Count Count Count Count
Airtel
Urban 0 0 4 97 245 66 9 421
Rural 0 0 0 23 125 32 0 180
Total 0 0 4 120 370 98 9 601
BSNL
Urban 1 2 18 125 166 87 23 422
Rural 0 0 1 26 72 64 17 180
Total 1 2 19 151 238 151 40 602
HFCL
Urban 1 2 3 72 232 92 21 423
Rural 0 0 1 29 114 30 6 180
Total 1 2 4 101 346 122 27 603
Reliance
Urban 0 0 5 88 232 98 0 423
Rural 0 0 0 33 114 33 0 180
Total 0 0 5 121 346 131 0 603
Total
Urban 2 4 30 382 875 343 53 1689
Rural 0 0 2 111 425 159 23 720
Total 2 4 32 493 1300 502 76 2409

Assessment of Customer perception of Service and Implementation And Effectiveness of Various regulations, directions and orders issued
by TRAI in the interest of consumers October 2013
O-45 (Basement), Lajpat Nagar-II, Ring Road – 110024, India
Email: [email protected], URL: www.consumer-voice.org Page 84
2.7 How satisfied are you with the clarity of the bills in terms of transparency and understandability?
Service Provider 1 2 3 4 5 6 7 Total
Count Count Count Count Count Count Count Count
Airtel
Urban 0 0 12 92 249 64 4 421
Rural 0 0 1 29 118 32 0 180
Total 0 0 13 121 367 96 4 601
BSNL
Urban 0 2 20 129 185 73 13 422
Rural 0 0 4 23 86 53 14 180
Total 0 2 24 152 271 126 27 602
HFCL
Urban 1 2 4 75 230 95 16 423
Rural 0 0 2 41 98 33 6 180
Total 1 2 6 116 328 128 22 603
Reliance
Urban 0 0 10 85 232 94 2 423
Rural 0 0 4 29 117 30 0 180
Total 0 0 14 114 349 124 2 603
Total
Urban 1 4 46 381 896 326 35 1689
Rural 0 0 11 122 419 148 20 720
Total 1 4 57 503 1315 474 55 2409
Billibg service: Calculation of satisfaction score
code 1 2 3 4 5 6 7 Total,
N Benchmark
Overall
Weighted Satisfaction
Airtel
Urban 0 0 25 305 743 162 28 1263 95% 98.0%
Rural 0 0 2 87 356 95 0 540 95% 99.6%
Total 0 0 27 392 1099 257 28 1803 95% 98.5%
BSNL
Urban 1 5 56 395 528 213 68 1266 95% 95.1%
Rural 0 2 8 80 246 142 62 540 95% 98.1%
Total 1 7 64 475 774 355 130 1806 95% 96.0%
HFCL
Urban 3 5 12 248 661 277 63 1269 95% 98.4%
Rural 0 0 3 113 326 78 20 540 95% 99.4%
Total 3 5 15 361 987 355 83 1809 95% 98.7%
Reliance
Urban 0 0 20 272 694 277 6 1269 95% 98.4%
Rural 0 0 10 108 327 95 0 540 95% 98.1%
Total 0 0 30 380 1021 372 6 1809 95% 98.3%
Total
Urban 4 10 113 1220 2626 929 165 5067 95% 97.5%
Rural 0 2 23 388 1255 410 82 2160 95% 98.8%
Total 4 12 136 1608 3881 1339 247 7227 95% 97.9%
3. Help Services
3.1 How satisfied are you with the availability of customer care services (consumer care
number and general information number)?
Service Provider 1 2 3 4 5 6 7 Total
Count Count Count Count Count Count Count Count
Airtel
Urban 1 2 7 126 259 23 3 421
Rural 0 0 1 43 110 26 0 180
Total 1 2 8 169 369 49 3 601
BSNL
Urban 1 2 18 157 175 65 4 422
Rural 1 1 6 40 91 34 7 180
Total 2 3 24 197 266 99 11 602
HFCL
Urban 0 4 6 99 224 75 15 423
Rural 0 0 0 48 116 16 0 180
Total 0 4 6 147 340 91 15 603
Reliance
Urban 0 0 5 93 259 66 0 423
Rural 0 0 1 37 116 26 0 180
Total 0 0 6 130 375 92 0 603
Total
Urban 2 8 36 475 917 229 22 1689
Rural 1 1 8 168 433 102 7 720
Total 3 9 44 643 1350 331 29 2409

Assessment of Customer perception of Service and Implementation And Effectiveness of Various regulations, directions and orders issued
by TRAI in the interest of consumers October 2013
O-45 (Basement), Lajpat Nagar-II, Ring Road – 110024, India
Email: [email protected], URL: www.consumer-voice.org Page 85
3.2 How satisfied are you with the ease of access to a consumer care executive through the IVR
menu?
Service Provider 1 2 3 4 5 6 7 Total
Count Count Count Count Count Count Count Count
Airtel
Urban 0 3 11 120 255 29 3 421
Rural 0 0 0 50 113 17 0 180
Total 0 3 11 170 368 46 3 601
BSNL
Urban 3 2 30 143 177 55 12 422
Rural 1 2 5 25 92 40 15 180
Total 4 4 35 168 269 95 27 602
HFCL
Urban 3 2 8 99 240 55 16 423
Rural 0 0 1 52 113 13 1 180
Total 3 2 9 151 353 68 17 603
Reliance
Urban 0 0 8 92 255 68 0 423
Rural 0 0 2 32 122 24 0 180
Total 0 0 10 124 377 92 0 603
Total
Urban 6 7 57 454 927 207 31 1689
Rural 1 2 8 159 440 94 16 720
Total 7 9 65 613 1367 301 47 2409
3.3 How satisfied are you with the customer friendly approach of the customer care executive?
Service Provider 1 2 3 4 5 6 7 Total
Count Count Count Count Count Count Count Count
Airtel
Urban 1 1 14 132 251 21 1 421
Rural 0 0 0 48 116 16 0 180
Total 1 1 14 180 367 37 1 601
BSNL
Urban 3 1 24 150 186 51 7 422
Rural 1 0 9 36 97 28 9 180
Total 4 1 33 186 283 79 16 602
HFCL
Urban 0 6 10 87 252 63 5 423
Rural 0 0 2 58 107 12 1 180
Total 0 6 12 145 359 75 6 603
Reliance
Urban 0 0 10 103 248 62 0 423
Rural 0 0 1 39 116 24 0 180
Total 0 0 11 142 364 86 0 603
Total
Urban 4 8 58 472 937 197 13 1689
Rural 1 0 12 181 436 80 10 720
Total 5 8 70 653 1373 277 23 2409

Assessment of Customer perception of Service and Implementation And Effectiveness of Various regulations, directions and orders issued
by TRAI in the interest of consumers October 2013
O-45 (Basement), Lajpat Nagar-II, Ring Road – 110024, India
Email: [email protected], URL: www.consumer-voice.org Page 86
3.4 How satisfied are you with the competency level/problem solving ability of the customer
care executive?
Service Provider 1 2 3 4 5 6 7 Total
Count Count Count Count Count Count Count Count
Airtel
Urban 0 1 21 114 241 42 2 421
Rural 0 0 1 58 104 17 0 180
Total 0 1 22 172 345 59 2 601
BSNL
Urban 1 5 27 147 182 51 9 422
Rural 0 4 7 19 89 49 12 180
Total 1 9 34 166 271 100 21 602
HFCL
Urban 1 2 17 90 223 81 9 423
Rural 0 0 1 60 107 10 2 180
Total 1 2 18 150 330 91 11 603
Reliance
Urban 0 0 13 89 244 76 1 423
Rural 0 0 3 27 114 36 0 180
Total 0 0 16 116 358 112 1 603
Total
Urban 2 8 78 440 890 250 21 1689
Rural 0 4 12 164 414 112 14 720
Total 2 12 90 604 1304 362 35 2409
Help service: Calculation of satisfaction score
code 1 2 3 4 5 6 7 Total,
N
Benchmar
k
Overall Weighted
Satisfactio
n
Airtel
Urban 2 7 53 492 1006 115 9 1684 90% 96.3%
Rural 0 0 2 199 443 76 0 720 90% 99.7%
Total 2 7 55 691 1449 191 9 2404 90% 97.3%
BSNL
Urban 8 10 99 597 720 222 32 1688 90% 93.1%
Rural 3 7 27 120 369 151 43 720 90% 94.9%
Total 11 17 126 717 1089 373 75 2408 90% 93.6%
HFCL
Urban 4 14 41 375 939 274 45 1692 90% 96.5%
Rural 0 0 4 218 443 51 4 720 90% 99.4%
Total 4 14 45 593 1382 325 49 2412 90% 97.4%
Reliance
Urban 0 0 36 377 1006 272 1 1692 90% 97.9%
Rural 0 0 7 135 468 110 0 720 90% 99.0%
Total 0 0 43 512 1474 382 1 2412 90% 98.2%
Total
Urban 14 31 229 1841 3671 883 87 6756 90% 95.9%
Rural 3 7 40 672 1723 388 47 2880 90% 98.3%
Total 17 38 269 2513 5394 1271 134 9636 90% 96.6%

Assessment of Customer perception of Service and Implementation And Effectiveness of Various regulations, directions and orders issued
by TRAI in the interest of consumers October 2013
O-45 (Basement), Lajpat Nagar-II, Ring Road – 110024, India
Email: [email protected], URL: www.consumer-voice.org Page 87
4. Network performance, Reliability and Availability 4.1 How satisfied are you with the dial tone availability on your phone?
Service Provider 1 2 3 4 5 6 7 Total
Count Count Count Count Count Count Count Count
Airtel
Urban 0 1 8 161 213 31 7 421
Rural 0 0 2 52 104 22 0 180
Total 0 1 10 213 317 53 7 601
BSNL
Urban 1 1 24 161 149 61 25 422
Rural 1 1 1 64 61 32 20 180
Total 2 2 25 225 210 93 45 602
HFCL
Urban 0 0 9 95 206 101 12 423
Rural 0 0 2 64 97 10 7 180
Total 0 0 11 159 303 111 19 603
Reliance
Urban 0 0 7 112 229 74 1 423
Rural 0 0 1 43 101 35 0 180
Total 0 0 8 155 330 109 1 603
Total
Urban 1 2 48 529 797 267 45 1689
Rural 1 1 6 223 363 99 27 720
Total 2 3 54 752 1160 366 72 2409
4.2 How satisfied are you with the network of your service provider in terms of ability to make
or receive calls easily?
Service Provider 1 2 3 4 5 6 7 Total
Count Count Count Count Count Count Count Count
Airtel
Urban 0 1 8 161 213 31 7 421
Rural 0 0 2 52 104 22 0 180
Total 0 1 10 213 317 53 7 601
BSNL
Urban 1 1 24 161 149 61 25 422
Rural 1 1 1 64 61 32 20 180
Total 2 2 25 225 210 93 45 602
HFCL
Urban 0 0 9 95 206 101 12 423
Rural 0 0 2 64 97 10 7 180
Total 0 0 11 159 303 111 19 603
Reliance
Urban 0 0 7 112 229 74 1 423
Rural 0 0 1 43 101 35 0 180
Total 0 0 8 155 330 109 1 603
Total
Urban 1 2 48 529 797 267 45 1689
Rural 1 1 6 223 363 99 27 720
Total 2 3 54 752 1160 366 72 2409
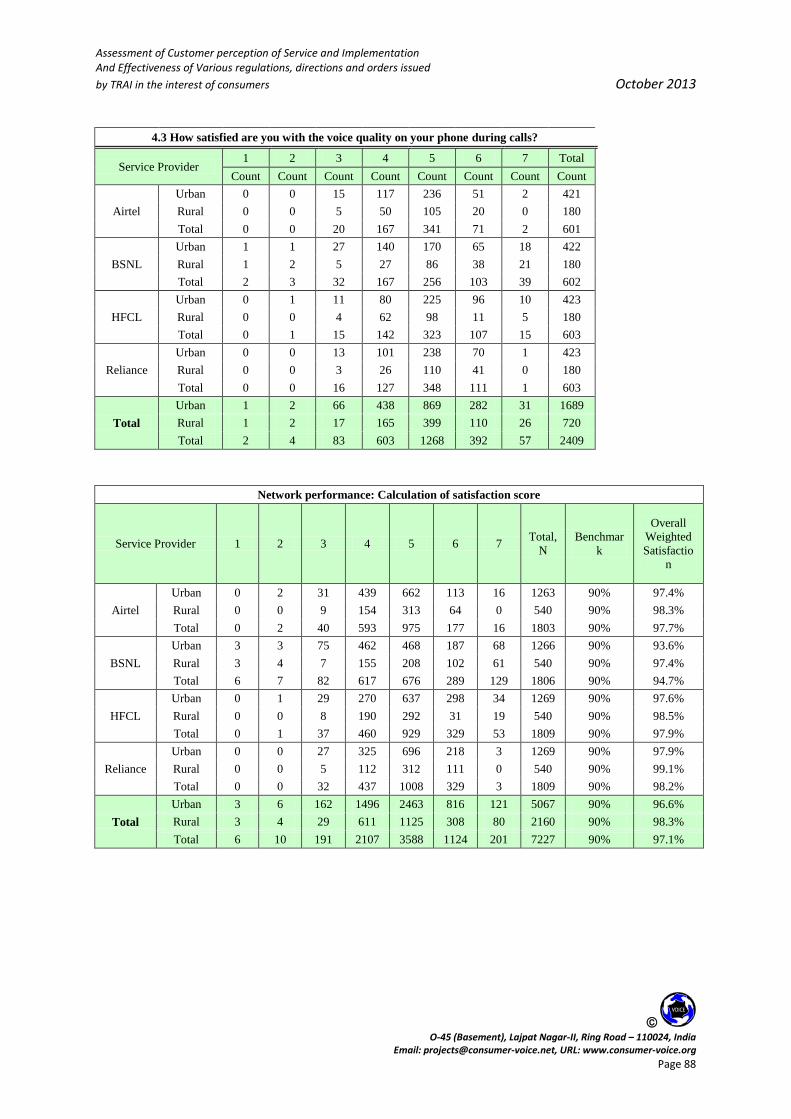
Assessment of Customer perception of Service and Implementation And Effectiveness of Various regulations, directions and orders issued
by TRAI in the interest of consumers October 2013
O-45 (Basement), Lajpat Nagar-II, Ring Road – 110024, India
Email: [email protected], URL: www.consumer-voice.org Page 88
4.3 How satisfied are you with the voice quality on your phone during calls?
Service Provider 1 2 3 4 5 6 7 Total
Count Count Count Count Count Count Count Count
Airtel
Urban 0 0 15 117 236 51 2 421
Rural 0 0 5 50 105 20 0 180
Total 0 0 20 167 341 71 2 601
BSNL
Urban 1 1 27 140 170 65 18 422
Rural 1 2 5 27 86 38 21 180
Total 2 3 32 167 256 103 39 602
HFCL
Urban 0 1 11 80 225 96 10 423
Rural 0 0 4 62 98 11 5 180
Total 0 1 15 142 323 107 15 603
Reliance
Urban 0 0 13 101 238 70 1 423
Rural 0 0 3 26 110 41 0 180
Total 0 0 16 127 348 111 1 603
Total
Urban 1 2 66 438 869 282 31 1689
Rural 1 2 17 165 399 110 26 720
Total 2 4 83 603 1268 392 57 2409
Network performance: Calculation of satisfaction score
Service Provider 1 2 3 4 5 6 7 Total,
N
Benchmar
k
Overall
Weighted
Satisfactio
n
Airtel
Urban 0 2 31 439 662 113 16 1263 90% 97.4%
Rural 0 0 9 154 313 64 0 540 90% 98.3%
Total 0 2 40 593 975 177 16 1803 90% 97.7%
BSNL
Urban 3 3 75 462 468 187 68 1266 90% 93.6%
Rural 3 4 7 155 208 102 61 540 90% 97.4%
Total 6 7 82 617 676 289 129 1806 90% 94.7%
HFCL
Urban 0 1 29 270 637 298 34 1269 90% 97.6%
Rural 0 0 8 190 292 31 19 540 90% 98.5%
Total 0 1 37 460 929 329 53 1809 90% 97.9%
Reliance
Urban 0 0 27 325 696 218 3 1269 90% 97.9%
Rural 0 0 5 112 312 111 0 540 90% 99.1%
Total 0 0 32 437 1008 329 3 1809 90% 98.2%
Total
Urban 3 6 162 1496 2463 816 121 5067 90% 96.6%
Rural 3 4 29 611 1125 308 80 2160 90% 98.3%
Total 6 10 191 2107 3588 1124 201 7227 90% 97.1%
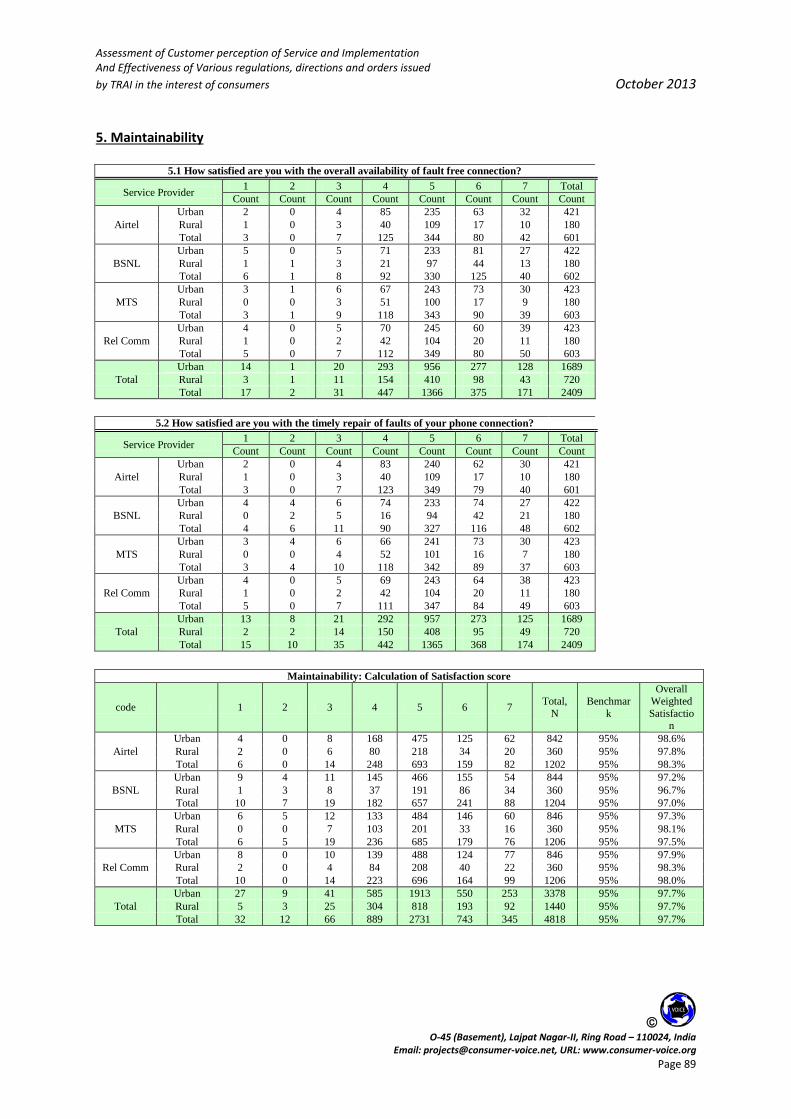
Assessment of Customer perception of Service and Implementation And Effectiveness of Various regulations, directions and orders issued
by TRAI in the interest of consumers October 2013
O-45 (Basement), Lajpat Nagar-II, Ring Road – 110024, India
Email: [email protected], URL: www.consumer-voice.org Page 89
5. Maintainability
5.1 How satisfied are you with the overall availability of fault free connection?
Service Provider 1 2 3 4 5 6 7 Total
Count Count Count Count Count Count Count Count
Airtel
Urban 2 0 4 85 235 63 32 421
Rural 1 0 3 40 109 17 10 180
Total 3 0 7 125 344 80 42 601
BSNL
Urban 5 0 5 71 233 81 27 422
Rural 1 1 3 21 97 44 13 180
Total 6 1 8 92 330 125 40 602
MTS
Urban 3 1 6 67 243 73 30 423
Rural 0 0 3 51 100 17 9 180
Total 3 1 9 118 343 90 39 603
Rel Comm
Urban 4 0 5 70 245 60 39 423
Rural 1 0 2 42 104 20 11 180
Total 5 0 7 112 349 80 50 603
Total
Urban 14 1 20 293 956 277 128 1689
Rural 3 1 11 154 410 98 43 720
Total 17 2 31 447 1366 375 171 2409
5.2 How satisfied are you with the timely repair of faults of your phone connection?
Service Provider 1 2 3 4 5 6 7 Total
Count Count Count Count Count Count Count Count
Airtel
Urban 2 0 4 83 240 62 30 421
Rural 1 0 3 40 109 17 10 180
Total 3 0 7 123 349 79 40 601
BSNL
Urban 4 4 6 74 233 74 27 422
Rural 0 2 5 16 94 42 21 180
Total 4 6 11 90 327 116 48 602
MTS
Urban 3 4 6 66 241 73 30 423
Rural 0 0 4 52 101 16 7 180
Total 3 4 10 118 342 89 37 603
Rel Comm
Urban 4 0 5 69 243 64 38 423
Rural 1 0 2 42 104 20 11 180
Total 5 0 7 111 347 84 49 603
Total
Urban 13 8 21 292 957 273 125 1689
Rural 2 2 14 150 408 95 49 720
Total 15 10 35 442 1365 368 174 2409
Maintainability: Calculation of Satisfaction score
code 1 2 3 4 5 6 7 Total,
N
Benchmar
k
Overall
Weighted
Satisfaction
Airtel
Urban 4 0 8 168 475 125 62 842 95% 98.6%
Rural 2 0 6 80 218 34 20 360 95% 97.8%
Total 6 0 14 248 693 159 82 1202 95% 98.3%
BSNL
Urban 9 4 11 145 466 155 54 844 95% 97.2%
Rural 1 3 8 37 191 86 34 360 95% 96.7%
Total 10 7 19 182 657 241 88 1204 95% 97.0%
MTS
Urban 6 5 12 133 484 146 60 846 95% 97.3%
Rural 0 0 7 103 201 33 16 360 95% 98.1%
Total 6 5 19 236 685 179 76 1206 95% 97.5%
Rel Comm
Urban 8 0 10 139 488 124 77 846 95% 97.9%
Rural 2 0 4 84 208 40 22 360 95% 98.3%
Total 10 0 14 223 696 164 99 1206 95% 98.0%
Total
Urban 27 9 41 585 1913 550 253 3378 95% 97.7%
Rural 5 3 25 304 818 193 92 1440 95% 97.7%
Total 32 12 66 889 2731 743 345 4818 95% 97.7%

Assessment of Customer perception of Service and Implementation And Effectiveness of Various regulations, directions and orders issued
by TRAI in the interest of consumers October 2013
O-45 (Basement), Lajpat Nagar-II, Ring Road – 110024, India
Email: [email protected], URL: www.consumer-voice.org Page 90
6. Supplementary services and Value Added services
6.1 Have you ever subscribed to any supplementary services like call
waiting/forwarding, voice mail / Value added services?
Service Provider Yes No Total
Count %age Count %age Count
Airtel
Urban 278 66.0% 143 34.0% 421
Rural 123 68.3% 57 31.7% 180
Total 401 66.7% 200 33.3% 601
BSNL
Urban 200 47.4% 222 52.6% 422
Rural 53 29.4% 127 70.6% 180
Total 253 42.0% 349 58.0% 602
HFCL
Urban 202 47.8% 221 52.2% 423
Rural 159 88.3% 21 11.7% 180
Total 361 59.9% 242 40.1% 603
Reliance
Urban 351 83.0% 72 17.0% 423
Rural 63 35.0% 117 65.0% 180
Total 414 68.7% 189 31.3% 603
Total
Urban 1031 61.0% 658 39.0% 1689
Rural 398 55.3% 322 44.7% 720
Total 1429 59.3% 980 40.7% 2409
6.2 How satisfied are you with the supplementary services / value added service provided including
activation, deactivation, charges etc?
Service Provider 1 2 3 4 5 6 7 Total
Count Count Count Count Count Count Count Count
Airtel
Urban 0 2 56 164 53 3 0 278
Rural 0 0 12 76 34 1 0 123
Total 0 2 68 240 87 4 0 401
BSNL
Urban 0 38 43 105 10 3 1 200
Rural 0 3 11 27 7 4 1 53
Total 0 41 54 132 17 7 2 253
HFCL
Urban 0 1 46 96 59 0 0 202
Rural 0 1 26 109 22 1 0 159
Total 0 2 72 205 81 1 0 361
Reliance
Urban 0 68 61 150 71 1 0 351
Rural 0 0 6 18 38 1 0 63
Total 0 68 67 168 109 2 0 414
Total
Rural 0 109 206 515 193 7 1 1031
Urban 0 4 55 230 101 7 1 398
Total 0 113 261 745 294 14 2 1429
Supplementary Serices: Calculation of satisfaction score
code 1 2 3 4 5 6 7 Total,
N
Benchmar
k
Overall
Weighted
Satisfaction
Airtel
Urban 0 2 56 164 53 3 0 278 90% 79.1%
Rural 0 0 12 76 34 1 0 123 90% 90.2%
Total 0 2 68 240 87 4 0 401 90% 82.5%
BSNL
Urban 0 38 43 105 10 3 1 200 90% 59.5%
Rural 0 3 11 27 7 4 1 53 90% 73.6%
Total 0 41 54 132 17 7 2 253 90% 62.5%
HFCL
Urban 0 1 46 96 59 0 0 202 90% 76.7%
Rural 0 1 26 109 22 1 0 159 90% 83.0%
Total 0 2 72 205 81 1 0 361 90% 79.5%
Reliance
Urban 0 68 61 150 71 1 0 351 90% 63.2%
Rural 0 0 6 18 38 1 0 63 90% 90.5%
Total 0 68 67 168 109 2 0 414 90% 67.4%
Total
Urban 0 109 206 515 193 7 1 1031 90% 69.4%
Rural 0 4 55 230 101 7 1 398 90% 85.2%
Total 0 113 261 745 294 14 2 1429 90% 73.8%
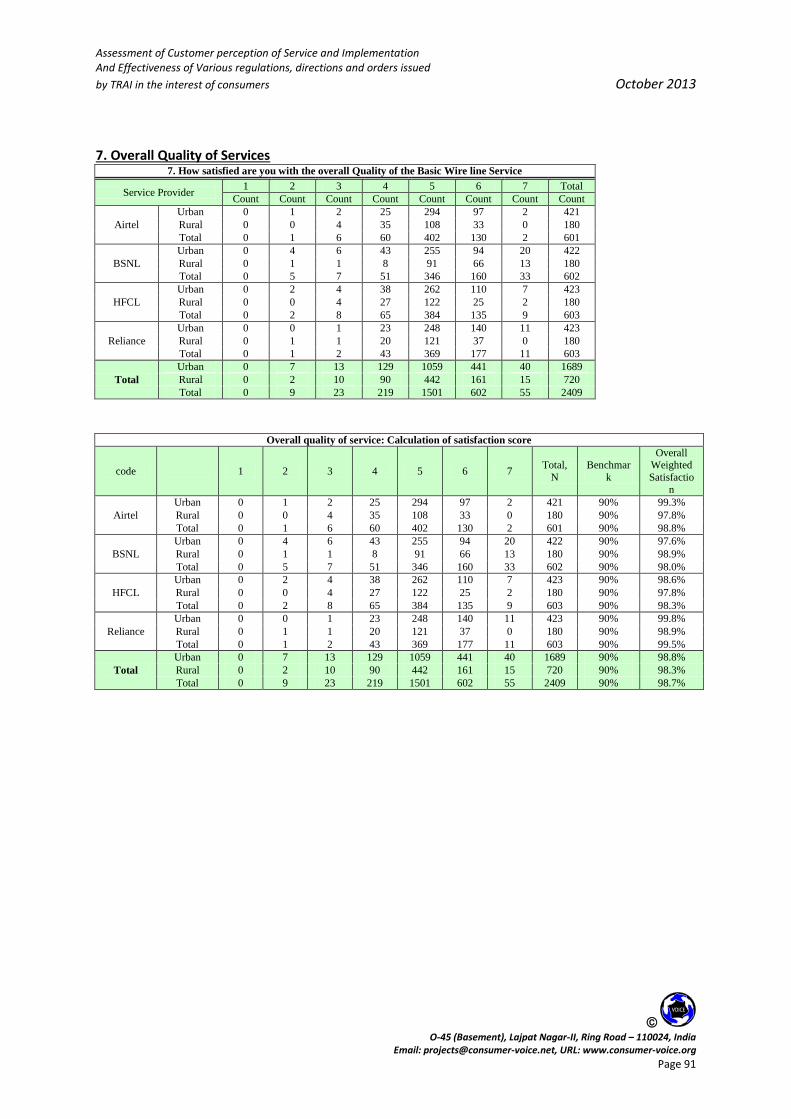
Assessment of Customer perception of Service and Implementation And Effectiveness of Various regulations, directions and orders issued
by TRAI in the interest of consumers October 2013
O-45 (Basement), Lajpat Nagar-II, Ring Road – 110024, India
Email: [email protected], URL: www.consumer-voice.org Page 91
7. Overall Quality of Services
7. How satisfied are you with the overall Quality of the Basic Wire line Service
Service Provider 1 2 3 4 5 6 7 Total
Count Count Count Count Count Count Count Count
Airtel
Urban 0 1 2 25 294 97 2 421
Rural 0 0 4 35 108 33 0 180
Total 0 1 6 60 402 130 2 601
BSNL
Urban 0 4 6 43 255 94 20 422
Rural 0 1 1 8 91 66 13 180
Total 0 5 7 51 346 160 33 602
HFCL
Urban 0 2 4 38 262 110 7 423
Rural 0 0 4 27 122 25 2 180
Total 0 2 8 65 384 135 9 603
Reliance
Urban 0 0 1 23 248 140 11 423
Rural 0 1 1 20 121 37 0 180
Total 0 1 2 43 369 177 11 603
Total
Urban 0 7 13 129 1059 441 40 1689
Rural 0 2 10 90 442 161 15 720
Total 0 9 23 219 1501 602 55 2409
Overall quality of service: Calculation of satisfaction score
code 1 2 3 4 5 6 7 Total,
N
Benchmar
k
Overall Weighted
Satisfactio
n
Airtel
Urban 0 1 2 25 294 97 2 421 90% 99.3%
Rural 0 0 4 35 108 33 0 180 90% 97.8%
Total 0 1 6 60 402 130 2 601 90% 98.8%
BSNL
Urban 0 4 6 43 255 94 20 422 90% 97.6%
Rural 0 1 1 8 91 66 13 180 90% 98.9%
Total 0 5 7 51 346 160 33 602 90% 98.0%
HFCL
Urban 0 2 4 38 262 110 7 423 90% 98.6%
Rural 0 0 4 27 122 25 2 180 90% 97.8%
Total 0 2 8 65 384 135 9 603 90% 98.3%
Reliance
Urban 0 0 1 23 248 140 11 423 90% 99.8%
Rural 0 1 1 20 121 37 0 180 90% 98.9%
Total 0 1 2 43 369 177 11 603 90% 99.5%
Total
Urban 0 7 13 129 1059 441 40 1689 90% 98.8%
Rural 0 2 10 90 442 161 15 720 90% 98.3%
Total 0 9 23 219 1501 602 55 2409 90% 98.7%
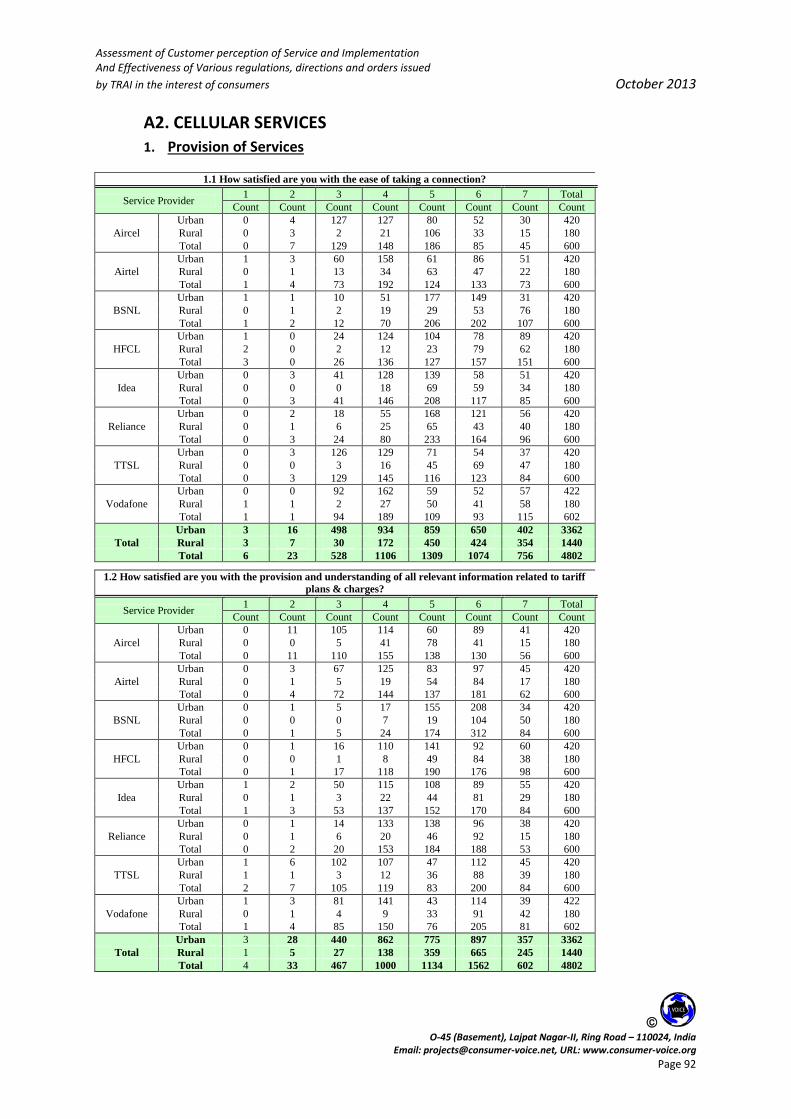
Assessment of Customer perception of Service and Implementation And Effectiveness of Various regulations, directions and orders issued
by TRAI in the interest of consumers October 2013
O-45 (Basement), Lajpat Nagar-II, Ring Road – 110024, India
Email: [email protected], URL: www.consumer-voice.org Page 92
A2. CELLULAR SERVICES
1. Provision of Services
1.1 How satisfied are you with the ease of taking a connection?
Service Provider 1 2 3 4 5 6 7 Total
Count Count Count Count Count Count Count Count
Aircel
Urban 0 4 127 127 80 52 30 420
Rural 0 3 2 21 106 33 15 180
Total 0 7 129 148 186 85 45 600
Airtel
Urban 1 3 60 158 61 86 51 420
Rural 0 1 13 34 63 47 22 180
Total 1 4 73 192 124 133 73 600
BSNL
Urban 1 1 10 51 177 149 31 420
Rural 0 1 2 19 29 53 76 180
Total 1 2 12 70 206 202 107 600
HFCL
Urban 1 0 24 124 104 78 89 420
Rural 2 0 2 12 23 79 62 180
Total 3 0 26 136 127 157 151 600
Idea
Urban 0 3 41 128 139 58 51 420
Rural 0 0 0 18 69 59 34 180
Total 0 3 41 146 208 117 85 600
Reliance
Urban 0 2 18 55 168 121 56 420
Rural 0 1 6 25 65 43 40 180
Total 0 3 24 80 233 164 96 600
TTSL
Urban 0 3 126 129 71 54 37 420
Rural 0 0 3 16 45 69 47 180
Total 0 3 129 145 116 123 84 600
Vodafone
Urban 0 0 92 162 59 52 57 422
Rural 1 1 2 27 50 41 58 180
Total 1 1 94 189 109 93 115 602
Total
Urban 3 16 498 934 859 650 402 3362
Rural 3 7 30 172 450 424 354 1440
Total 6 23 528 1106 1309 1074 756 4802
1.2 How satisfied are you with the provision and understanding of all relevant information related to tariff
plans & charges?
Service Provider 1 2 3 4 5 6 7 Total
Count Count Count Count Count Count Count Count
Aircel
Urban 0 11 105 114 60 89 41 420
Rural 0 0 5 41 78 41 15 180
Total 0 11 110 155 138 130 56 600
Airtel
Urban 0 3 67 125 83 97 45 420
Rural 0 1 5 19 54 84 17 180
Total 0 4 72 144 137 181 62 600
BSNL
Urban 0 1 5 17 155 208 34 420
Rural 0 0 0 7 19 104 50 180
Total 0 1 5 24 174 312 84 600
HFCL
Urban 0 1 16 110 141 92 60 420
Rural 0 0 1 8 49 84 38 180
Total 0 1 17 118 190 176 98 600
Idea
Urban 1 2 50 115 108 89 55 420
Rural 0 1 3 22 44 81 29 180
Total 1 3 53 137 152 170 84 600
Reliance
Urban 0 1 14 133 138 96 38 420
Rural 0 1 6 20 46 92 15 180
Total 0 2 20 153 184 188 53 600
TTSL
Urban 1 6 102 107 47 112 45 420
Rural 1 1 3 12 36 88 39 180
Total 2 7 105 119 83 200 84 600
Vodafone
Urban 1 3 81 141 43 114 39 422
Rural 0 1 4 9 33 91 42 180
Total 1 4 85 150 76 205 81 602
Total
Urban 3 28 440 862 775 897 357 3362
Rural 1 5 27 138 359 665 245 1440
Total 4 33 467 1000 1134 1562 602 4802

Assessment of Customer perception of Service and Implementation And Effectiveness of Various regulations, directions and orders issued
by TRAI in the interest of consumers October 2013
O-45 (Basement), Lajpat Nagar-II, Ring Road – 110024, India
Email: [email protected], URL: www.consumer-voice.org Page 93
1.3 How satisfied are you with the availability of suitable plans/recharge vouchers as per your
requirement?
Service Provider 1 2 3 4 5 6 7 Total
Count Count Count Count Count Count Count Count
Aircel
Urban 0 7 119 118 81 70 25 420
Rural 0 1 5 44 90 33 7 180
Total 0 8 124 162 171 103 32 600
Airtel
Urban 0 7 62 135 70 107 39 420
Rural 1 0 8 35 71 57 8 180
Total 1 7 70 170 141 164 47 600
BSNL
Urban 0 0 5 44 202 150 19 420
Rural 0 0 2 10 37 82 49 180
Total 0 0 7 54 239 232 68 600
HFCL
Urban 0 1 21 117 113 123 45 420
Rural 0 0 1 4 40 97 38 180
Total 0 1 22 121 153 220 83 600
Idea
Urban 0 2 43 136 119 84 36 420
Rural 0 1 2 24 56 62 35 180
Total 0 3 45 160 175 146 71 600
Reliance
Urban 0 2 19 116 98 147 38 420
Rural 0 0 9 29 68 51 23 180
Total 0 2 28 145 166 198 61 600
TTSL
Urban 0 5 127 102 83 78 25 420
Rural 0 1 4 15 48 78 34 180
Total 0 6 131 117 131 156 59 600
Vodafone
Urban 0 2 88 154 71 72 35 422
Rural 0 1 6 28 53 57 35 180
Total 0 3 94 182 124 129 70 602
Total
Urban 0 26 484 922 837 831 262 3362
Rural 1 4 37 189 463 517 229 1440
Total 1 30 521 1111 1300 1348 491 4802
Provision of Services: Calculation of satisfaction Score
Service Provider 1 2 3 4 5 6 7 Total,
N Benchmar
k
Overall
Weighted Satisfactio
n
Aircel
Urban 0 22 351 359 221 211 96 1260 90% 70.4%
Rural 0 4 12 106 274 107 37 540 90% 97.0%
Total 0 26 363 465 495 318 133 1800 90% 78.4%
Airtel
Urban 1 13 189 418 214 290 135 1260 90% 83.9%
Rural 1 2 26 88 188 188 47 540 90% 94.6%
Total 2 15 215 506 402 478 182 1800 90% 87.1%
BSNL
Urban 1 2 20 112 534 507 84 1260 90% 98.2%
Rural 0 1 4 36 85 239 175 540 90% 99.1%
Total 1 3 24 148 619 746 259 1800 90% 98.4%
HFCL
Urban 1 2 61 351 358 293 194 1260 90% 94.9%
Rural 2 0 4 24 112 260 138 540 90% 98.9%
Total 3 2 65 375 470 553 332 1800 90% 96.1%
Idea
Urban 1 7 134 379 366 231 142 1260 90% 88.7%
Rural 0 2 5 64 169 202 98 540 90% 98.7%
Total 1 9 139 443 535 433 240 1800 90% 91.7%
Reliance
Urban 0 5 51 304 404 364 132 1260 90% 95.6%
Rural 0 2 21 74 179 186 78 540 90% 95.7%
Total 0 7 72 378 583 550 210 1800 90% 95.6%
TTSL
Urban 1 14 355 338 201 244 107 1260 90% 70.6%
Rural 1 2 10 43 129 235 120 540 90% 97.6%
Total 2 16 365 381 330 479 227 1800 90% 78.7%
Vodafone
Urban 1 5 261 457 173 238 131 1266 90% 78.9%
Rural 1 3 12 64 136 189 135 540 90% 97.0%
Total 2 8 273 521 309 427 266 1806 90% 84.3%
Total
Urban 6 70 1422 2718 2471 2378 1021 10086 90% 85.1%
Rural 5 16 94 499 1272 1606 828 4320 90% 97.3%
Total 11 86 1516 3217 3743 3984 1849 14406 90% 88.8%
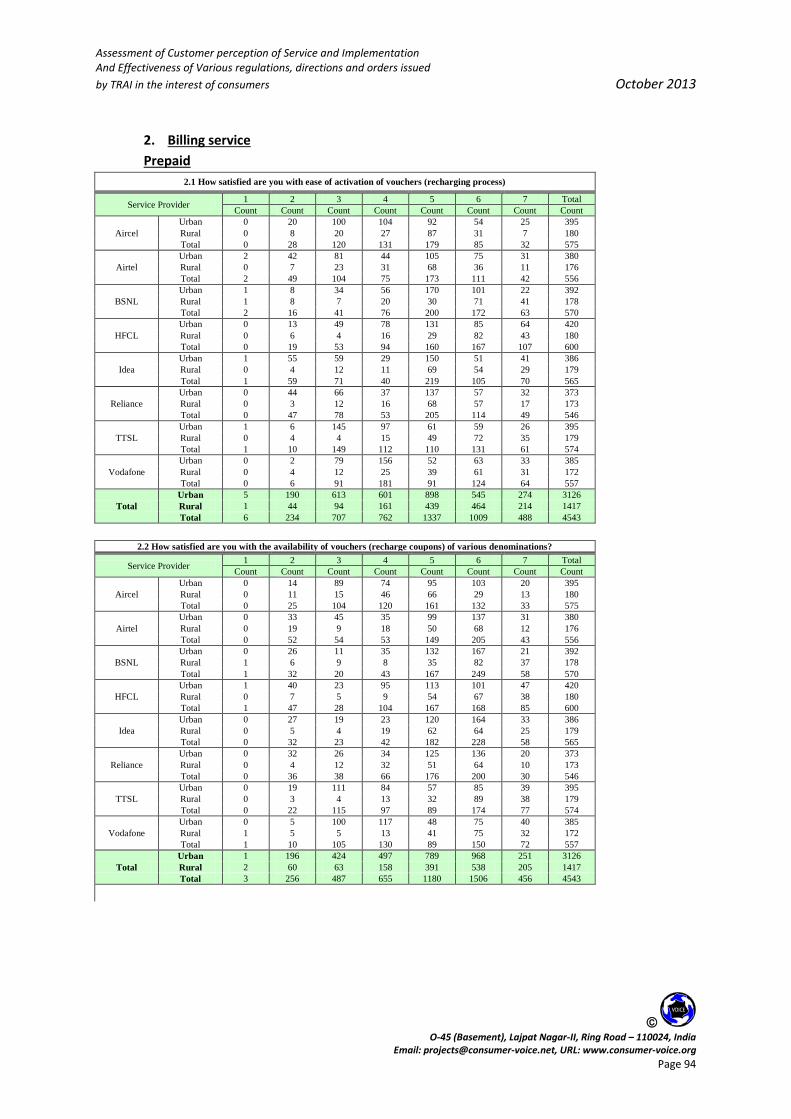
Assessment of Customer perception of Service and Implementation And Effectiveness of Various regulations, directions and orders issued
by TRAI in the interest of consumers October 2013
O-45 (Basement), Lajpat Nagar-II, Ring Road – 110024, India
Email: [email protected], URL: www.consumer-voice.org Page 94
2. Billing service
Prepaid
2.1 How satisfied are you with ease of activation of vouchers (recharging process)
Service Provider 1 2 3 4 5 6 7 Total
Count Count Count Count Count Count Count Count
Aircel
Urban 0 20 100 104 92 54 25 395
Rural 0 8 20 27 87 31 7 180
Total 0 28 120 131 179 85 32 575
Airtel
Urban 2 42 81 44 105 75 31 380
Rural 0 7 23 31 68 36 11 176
Total 2 49 104 75 173 111 42 556
BSNL
Urban 1 8 34 56 170 101 22 392
Rural 1 8 7 20 30 71 41 178
Total 2 16 41 76 200 172 63 570
HFCL
Urban 0 13 49 78 131 85 64 420
Rural 0 6 4 16 29 82 43 180
Total 0 19 53 94 160 167 107 600
Idea
Urban 1 55 59 29 150 51 41 386
Rural 0 4 12 11 69 54 29 179
Total 1 59 71 40 219 105 70 565
Reliance
Urban 0 44 66 37 137 57 32 373
Rural 0 3 12 16 68 57 17 173
Total 0 47 78 53 205 114 49 546
TTSL
Urban 1 6 145 97 61 59 26 395
Rural 0 4 4 15 49 72 35 179
Total 1 10 149 112 110 131 61 574
Vodafone
Urban 0 2 79 156 52 63 33 385
Rural 0 4 12 25 39 61 31 172
Total 0 6 91 181 91 124 64 557
Total
Urban 5 190 613 601 898 545 274 3126
Rural 1 44 94 161 439 464 214 1417
Total 6 234 707 762 1337 1009 488 4543
2.2 How satisfied are you with the availability of vouchers (recharge coupons) of various denominations?
Service Provider 1 2 3 4 5 6 7 Total
Count Count Count Count Count Count Count Count
Aircel
Urban 0 14 89 74 95 103 20 395
Rural 0 11 15 46 66 29 13 180
Total 0 25 104 120 161 132 33 575
Airtel
Urban 0 33 45 35 99 137 31 380
Rural 0 19 9 18 50 68 12 176
Total 0 52 54 53 149 205 43 556
BSNL
Urban 0 26 11 35 132 167 21 392
Rural 1 6 9 8 35 82 37 178
Total 1 32 20 43 167 249 58 570
HFCL
Urban 1 40 23 95 113 101 47 420
Rural 0 7 5 9 54 67 38 180
Total 1 47 28 104 167 168 85 600
Idea
Urban 0 27 19 23 120 164 33 386
Rural 0 5 4 19 62 64 25 179
Total 0 32 23 42 182 228 58 565
Reliance
Urban 0 32 26 34 125 136 20 373
Rural 0 4 12 32 51 64 10 173
Total 0 36 38 66 176 200 30 546
TTSL
Urban 0 19 111 84 57 85 39 395
Rural 0 3 4 13 32 89 38 179
Total 0 22 115 97 89 174 77 574
Vodafone
Urban 0 5 100 117 48 75 40 385
Rural 1 5 5 13 41 75 32 172
Total 1 10 105 130 89 150 72 557
Total
Urban 1 196 424 497 789 968 251 3126
Rural 2 60 63 158 391 538 205 1417
Total 3 256 487 655 1180 1506 456 4543
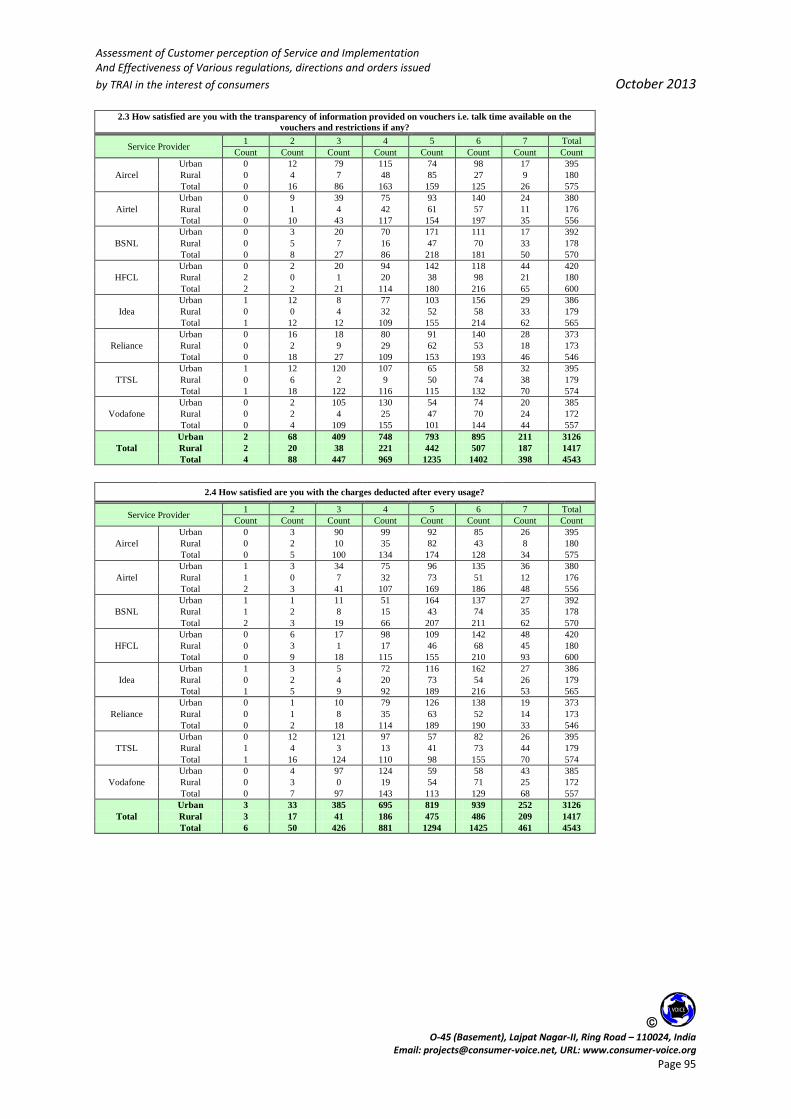
Assessment of Customer perception of Service and Implementation And Effectiveness of Various regulations, directions and orders issued
by TRAI in the interest of consumers October 2013
O-45 (Basement), Lajpat Nagar-II, Ring Road – 110024, India
Email: [email protected], URL: www.consumer-voice.org Page 95
2.3 How satisfied are you with the transparency of information provided on vouchers i.e. talk time available on the
vouchers and restrictions if any?
Service Provider 1 2 3 4 5 6 7 Total
Count Count Count Count Count Count Count Count
Aircel
Urban 0 12 79 115 74 98 17 395
Rural 0 4 7 48 85 27 9 180
Total 0 16 86 163 159 125 26 575
Airtel
Urban 0 9 39 75 93 140 24 380
Rural 0 1 4 42 61 57 11 176
Total 0 10 43 117 154 197 35 556
BSNL
Urban 0 3 20 70 171 111 17 392
Rural 0 5 7 16 47 70 33 178
Total 0 8 27 86 218 181 50 570
HFCL
Urban 0 2 20 94 142 118 44 420
Rural 2 0 1 20 38 98 21 180
Total 2 2 21 114 180 216 65 600
Idea
Urban 1 12 8 77 103 156 29 386
Rural 0 0 4 32 52 58 33 179
Total 1 12 12 109 155 214 62 565
Reliance
Urban 0 16 18 80 91 140 28 373
Rural 0 2 9 29 62 53 18 173
Total 0 18 27 109 153 193 46 546
TTSL
Urban 1 12 120 107 65 58 32 395
Rural 0 6 2 9 50 74 38 179
Total 1 18 122 116 115 132 70 574
Vodafone
Urban 0 2 105 130 54 74 20 385
Rural 0 2 4 25 47 70 24 172
Total 0 4 109 155 101 144 44 557
Total
Urban 2 68 409 748 793 895 211 3126
Rural 2 20 38 221 442 507 187 1417
Total 4 88 447 969 1235 1402 398 4543
2.4 How satisfied are you with the charges deducted after every usage?
Service Provider 1 2 3 4 5 6 7 Total
Count Count Count Count Count Count Count Count
Aircel
Urban 0 3 90 99 92 85 26 395
Rural 0 2 10 35 82 43 8 180
Total 0 5 100 134 174 128 34 575
Airtel
Urban 1 3 34 75 96 135 36 380
Rural 1 0 7 32 73 51 12 176
Total 2 3 41 107 169 186 48 556
BSNL
Urban 1 1 11 51 164 137 27 392
Rural 1 2 8 15 43 74 35 178
Total 2 3 19 66 207 211 62 570
HFCL
Urban 0 6 17 98 109 142 48 420
Rural 0 3 1 17 46 68 45 180
Total 0 9 18 115 155 210 93 600
Idea
Urban 1 3 5 72 116 162 27 386
Rural 0 2 4 20 73 54 26 179
Total 1 5 9 92 189 216 53 565
Reliance
Urban 0 1 10 79 126 138 19 373
Rural 0 1 8 35 63 52 14 173
Total 0 2 18 114 189 190 33 546
TTSL
Urban 0 12 121 97 57 82 26 395
Rural 1 4 3 13 41 73 44 179
Total 1 16 124 110 98 155 70 574
Vodafone
Urban 0 4 97 124 59 58 43 385
Rural 0 3 0 19 54 71 25 172
Total 0 7 97 143 113 129 68 557
Total
Urban 3 33 385 695 819 939 252 3126
Rural 3 17 41 186 475 486 209 1417
Total 6 50 426 881 1294 1425 461 4543

Assessment of Customer perception of Service and Implementation And Effectiveness of Various regulations, directions and orders issued
by TRAI in the interest of consumers October 2013
O-45 (Basement), Lajpat Nagar-II, Ring Road – 110024, India
Email: [email protected], URL: www.consumer-voice.org Page 96
Billing services, prepaid customers: Calculation of satisfaction score
Service Provider 1 2 3 4 5 6 7 Total, N Benchmark
Overall
Weighted
Satisfaction
Aircel
Urban 0 49 358 392 353 340 88 1580 95% 74.2%
Rural 0 25 52 156 320 130 37 720 95% 89.3%
Total 0 74 410 548 673 470 125 2300 95% 79.0%
Airtel
Urban 3 87 199 229 393 487 122 1520 95% 81.0%
Rural 1 27 43 123 252 212 46 704 95% 89.9%
Total 4 114 242 352 645 699 168 2224 95% 83.8%
BSNL
Urban 2 38 76 212 637 516 87 1568 95% 92.6%
Rural 3 21 31 59 155 297 146 712 95% 92.3%
Total 5 59 107 271 792 813 233 2280 95% 92.5%
HFCL
Urban 1 61 109 365 495 446 203 1680 95% 89.8%
Rural 2 16 11 62 167 315 147 720 95% 96.0%
Total 3 77 120 427 662 761 350 2400 95% 91.7%
Idea
Urban 3 97 91 201 489 533 130 1544 95% 87.6%
Rural 0 11 24 82 256 230 113 716 95% 95.1%
Total 3 108 115 283 745 763 243 2260 95% 90.0%
Reliance
Urban 0 93 120 230 479 471 99 1492 95% 85.7%
Rural 0 10 41 112 244 226 59 692 95% 92.6%
Total 0 103 161 342 723 697 158 2184 95% 87.9%
TTSL
Urban 2 49 497 385 240 284 123 1580 95% 65.3%
Rural 1 17 13 50 172 308 155 716 95% 95.7%
Total 3 66 510 435 412 592 278 2296 95% 74.8%
Vodafone
Urban 0 13 381 527 213 270 136 1540 95% 74.4%
Rural 1 14 21 82 181 277 112 688 95% 94.8%
Total 1 27 402 609 394 547 248 2228 95% 80.7%
Total
Urban 11 487 1831 2541 3299 3347 988 12504 95% 81.4%
Rural 8 141 236 726 1747 1995 815 5668 95% 93.2%
Total 19 628 2067 3267 5046 5342 1803 18172 95% 85.1%
Post paid
2.5 How satisfied are you with the charges levied per call?
Service Provider 1 2 3 4 5 6 7 Total
Count Count Count Count Count Count Count Count
Aircel
Urban 0 0 8 6 8 3 0 25
Rural
Total 0 0 8 6 8 3 0 25
Airtel
Urban 0 1 6 17 8 5 3 40
Rural 0 0 0 1 2 1 0 4
Total 0 1 6 18 10 6 3 44
BSNL
Urban 0 1 2 6 11 8 0 28
Rural 0 0 0 0 1 1 0 2
Total 0 1 2 6 12 9 0 30
Idea
Urban 0 0 7 11 11 3 2 34
Rural 0 0 0 0 0 1 0 1
Total 0 0 7 11 11 4 2 35
Reliance
Urban 1 0 5 4 13 21 3 47
Rural 0 3 0 1 0 3 0 7
Total 1 3 5 5 13 24 3 54
TTSL
Urban 0 0 8 11 0 4 2 25
Rural 0 0 0 0 0 0 1 1
Total 0 0 8 11 0 4 3 26
Vodafone
Urban 0 2 7 5 10 10 3 37
Rural 0 2 0 0 1 3 2 8
Total 0 4 7 5 11 13 5 45
Total
Urban 1 4 43 60 61 54 13 236
Rural 0 5 0 2 4 9 3 23
Total 1 9 43 62 65 63 16 259
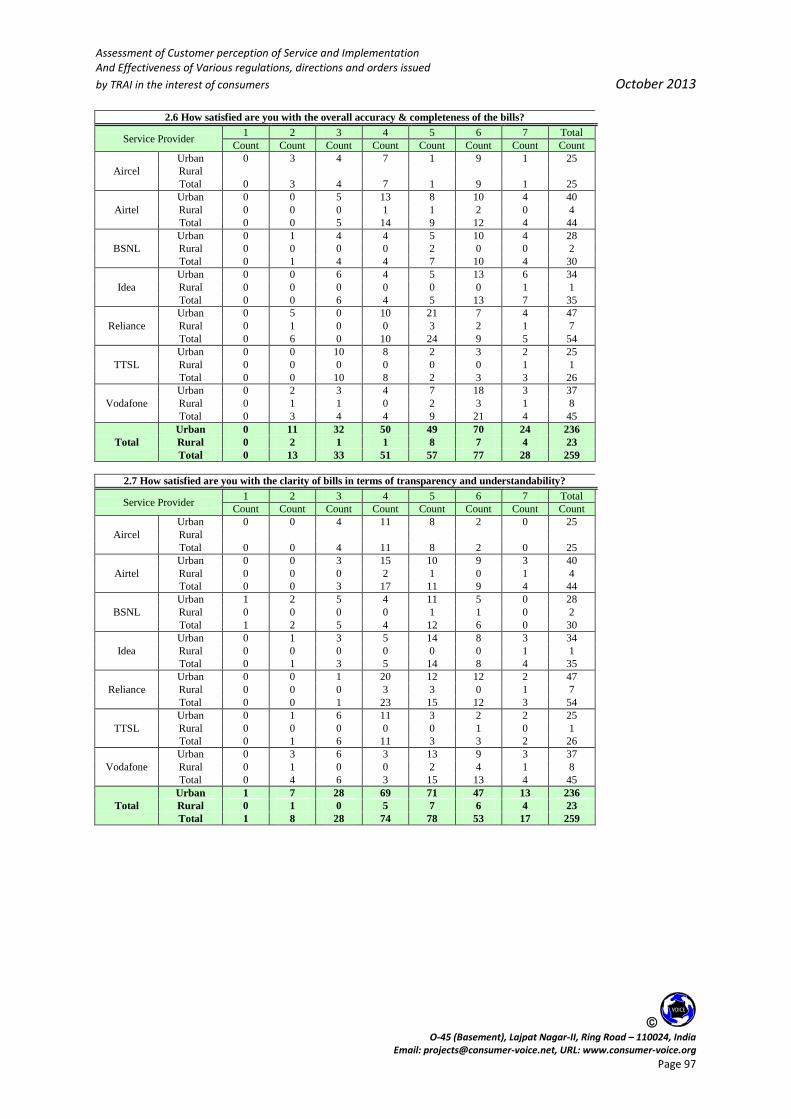
Assessment of Customer perception of Service and Implementation And Effectiveness of Various regulations, directions and orders issued
by TRAI in the interest of consumers October 2013
O-45 (Basement), Lajpat Nagar-II, Ring Road – 110024, India
Email: [email protected], URL: www.consumer-voice.org Page 97
2.6 How satisfied are you with the overall accuracy & completeness of the bills?
Service Provider 1 2 3 4 5 6 7 Total
Count Count Count Count Count Count Count Count
Aircel
Urban 0 3 4 7 1 9 1 25
Rural
Total 0 3 4 7 1 9 1 25
Airtel
Urban 0 0 5 13 8 10 4 40
Rural 0 0 0 1 1 2 0 4
Total 0 0 5 14 9 12 4 44
BSNL
Urban 0 1 4 4 5 10 4 28
Rural 0 0 0 0 2 0 0 2
Total 0 1 4 4 7 10 4 30
Idea
Urban 0 0 6 4 5 13 6 34
Rural 0 0 0 0 0 0 1 1
Total 0 0 6 4 5 13 7 35
Reliance
Urban 0 5 0 10 21 7 4 47
Rural 0 1 0 0 3 2 1 7
Total 0 6 0 10 24 9 5 54
TTSL
Urban 0 0 10 8 2 3 2 25
Rural 0 0 0 0 0 0 1 1
Total 0 0 10 8 2 3 3 26
Vodafone
Urban 0 2 3 4 7 18 3 37
Rural 0 1 1 0 2 3 1 8
Total 0 3 4 4 9 21 4 45
Total
Urban 0 11 32 50 49 70 24 236
Rural 0 2 1 1 8 7 4 23
Total 0 13 33 51 57 77 28 259
2.7 How satisfied are you with the clarity of bills in terms of transparency and understandability?
Service Provider 1 2 3 4 5 6 7 Total
Count Count Count Count Count Count Count Count
Aircel
Urban 0 0 4 11 8 2 0 25
Rural
Total 0 0 4 11 8 2 0 25
Airtel
Urban 0 0 3 15 10 9 3 40
Rural 0 0 0 2 1 0 1 4
Total 0 0 3 17 11 9 4 44
BSNL
Urban 1 2 5 4 11 5 0 28
Rural 0 0 0 0 1 1 0 2
Total 1 2 5 4 12 6 0 30
Idea
Urban 0 1 3 5 14 8 3 34
Rural 0 0 0 0 0 0 1 1
Total 0 1 3 5 14 8 4 35
Reliance
Urban 0 0 1 20 12 12 2 47
Rural 0 0 0 3 3 0 1 7
Total 0 0 1 23 15 12 3 54
TTSL
Urban 0 1 6 11 3 2 2 25
Rural 0 0 0 0 0 1 0 1
Total 0 1 6 11 3 3 2 26
Vodafone
Urban 0 3 6 3 13 9 3 37
Rural 0 1 0 0 2 4 1 8
Total 0 4 6 3 15 13 4 45
Total
Urban 1 7 28 69 71 47 13 236
Rural 0 1 0 5 7 6 4 23
Total 1 8 28 74 78 53 17 259
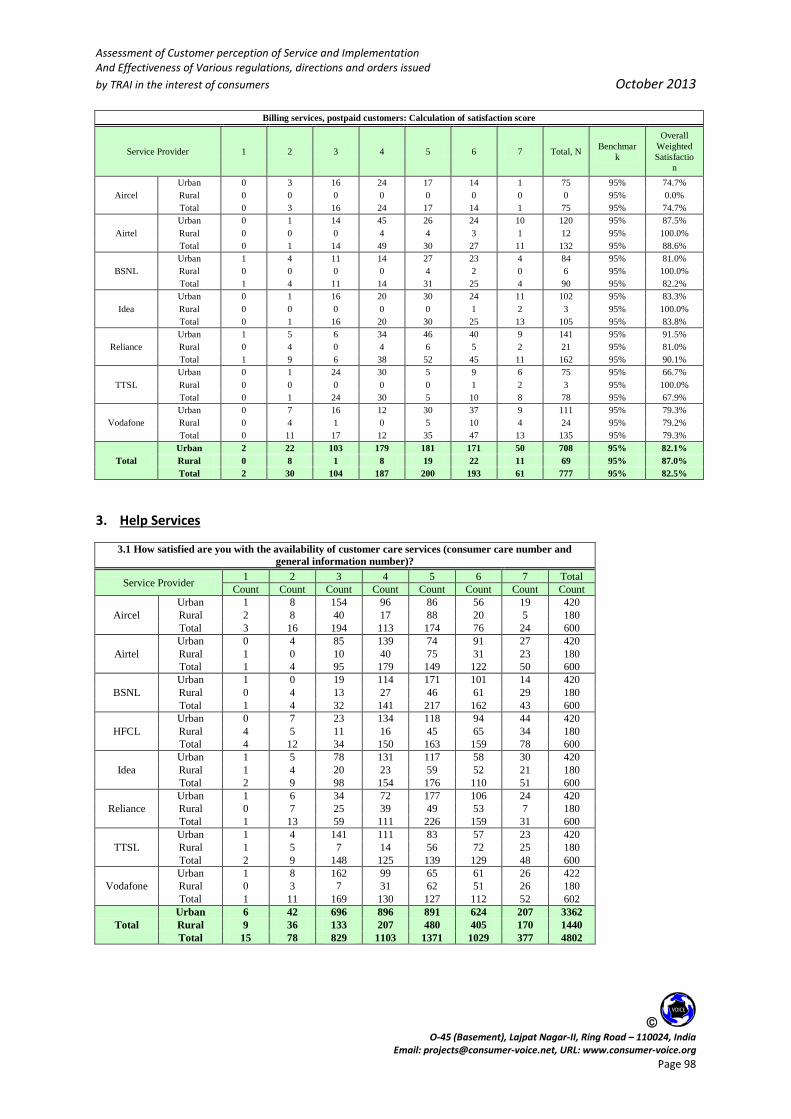
Assessment of Customer perception of Service and Implementation And Effectiveness of Various regulations, directions and orders issued
by TRAI in the interest of consumers October 2013
O-45 (Basement), Lajpat Nagar-II, Ring Road – 110024, India
Email: [email protected], URL: www.consumer-voice.org Page 98
Billing services, postpaid customers: Calculation of satisfaction score
Service Provider 1 2 3 4 5 6 7 Total, N Benchmar
k
Overall
Weighted
Satisfactio
n
Aircel
Urban 0 3 16 24 17 14 1 75 95% 74.7%
Rural 0 0 0 0 0 0 0 0 95% 0.0%
Total 0 3 16 24 17 14 1 75 95% 74.7%
Airtel
Urban 0 1 14 45 26 24 10 120 95% 87.5%
Rural 0 0 0 4 4 3 1 12 95% 100.0%
Total 0 1 14 49 30 27 11 132 95% 88.6%
BSNL
Urban 1 4 11 14 27 23 4 84 95% 81.0%
Rural 0 0 0 0 4 2 0 6 95% 100.0%
Total 1 4 11 14 31 25 4 90 95% 82.2%
Idea
Urban 0 1 16 20 30 24 11 102 95% 83.3%
Rural 0 0 0 0 0 1 2 3 95% 100.0%
Total 0 1 16 20 30 25 13 105 95% 83.8%
Reliance
Urban 1 5 6 34 46 40 9 141 95% 91.5%
Rural 0 4 0 4 6 5 2 21 95% 81.0%
Total 1 9 6 38 52 45 11 162 95% 90.1%
TTSL
Urban 0 1 24 30 5 9 6 75 95% 66.7%
Rural 0 0 0 0 0 1 2 3 95% 100.0%
Total 0 1 24 30 5 10 8 78 95% 67.9%
Vodafone
Urban 0 7 16 12 30 37 9 111 95% 79.3%
Rural 0 4 1 0 5 10 4 24 95% 79.2%
Total 0 11 17 12 35 47 13 135 95% 79.3%
Total
Urban 2 22 103 179 181 171 50 708 95% 82.1%
Rural 0 8 1 8 19 22 11 69 95% 87.0%
Total 2 30 104 187 200 193 61 777 95% 82.5%
3. Help Services
3.1 How satisfied are you with the availability of customer care services (consumer care number and
general information number)?
Service Provider 1 2 3 4 5 6 7 Total
Count Count Count Count Count Count Count Count
Aircel
Urban 1 8 154 96 86 56 19 420
Rural 2 8 40 17 88 20 5 180
Total 3 16 194 113 174 76 24 600
Airtel
Urban 0 4 85 139 74 91 27 420
Rural 1 0 10 40 75 31 23 180
Total 1 4 95 179 149 122 50 600
BSNL
Urban 1 0 19 114 171 101 14 420
Rural 0 4 13 27 46 61 29 180
Total 1 4 32 141 217 162 43 600
HFCL
Urban 0 7 23 134 118 94 44 420
Rural 4 5 11 16 45 65 34 180
Total 4 12 34 150 163 159 78 600
Idea
Urban 1 5 78 131 117 58 30 420
Rural 1 4 20 23 59 52 21 180
Total 2 9 98 154 176 110 51 600
Reliance
Urban 1 6 34 72 177 106 24 420
Rural 0 7 25 39 49 53 7 180
Total 1 13 59 111 226 159 31 600
TTSL
Urban 1 4 141 111 83 57 23 420
Rural 1 5 7 14 56 72 25 180
Total 2 9 148 125 139 129 48 600
Vodafone
Urban 1 8 162 99 65 61 26 422
Rural 0 3 7 31 62 51 26 180
Total 1 11 169 130 127 112 52 602
Total
Urban 6 42 696 896 891 624 207 3362
Rural 9 36 133 207 480 405 170 1440
Total 15 78 829 1103 1371 1029 377 4802
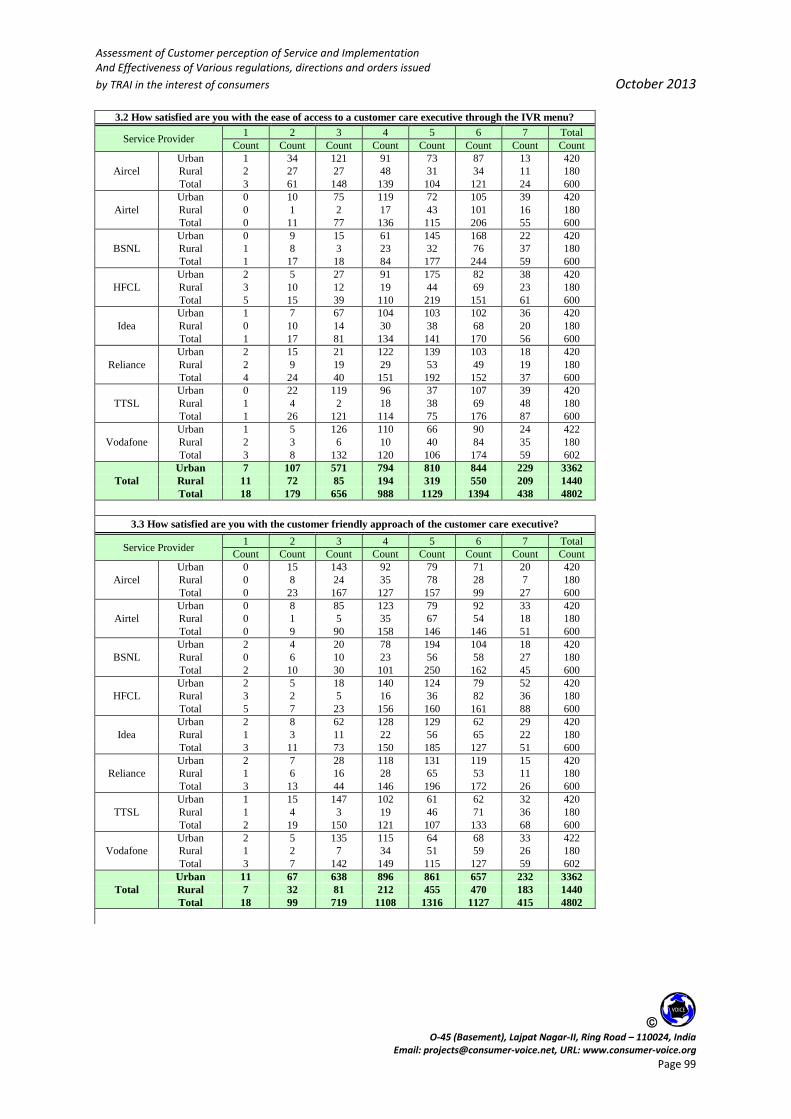
Assessment of Customer perception of Service and Implementation And Effectiveness of Various regulations, directions and orders issued
by TRAI in the interest of consumers October 2013
O-45 (Basement), Lajpat Nagar-II, Ring Road – 110024, India
Email: [email protected], URL: www.consumer-voice.org Page 99
3.2 How satisfied are you with the ease of access to a customer care executive through the IVR menu?
Service Provider 1 2 3 4 5 6 7 Total
Count Count Count Count Count Count Count Count
Aircel
Urban 1 34 121 91 73 87 13 420
Rural 2 27 27 48 31 34 11 180
Total 3 61 148 139 104 121 24 600
Airtel
Urban 0 10 75 119 72 105 39 420
Rural 0 1 2 17 43 101 16 180
Total 0 11 77 136 115 206 55 600
BSNL
Urban 0 9 15 61 145 168 22 420
Rural 1 8 3 23 32 76 37 180
Total 1 17 18 84 177 244 59 600
HFCL
Urban 2 5 27 91 175 82 38 420
Rural 3 10 12 19 44 69 23 180
Total 5 15 39 110 219 151 61 600
Idea
Urban 1 7 67 104 103 102 36 420
Rural 0 10 14 30 38 68 20 180
Total 1 17 81 134 141 170 56 600
Reliance
Urban 2 15 21 122 139 103 18 420
Rural 2 9 19 29 53 49 19 180
Total 4 24 40 151 192 152 37 600
TTSL
Urban 0 22 119 96 37 107 39 420
Rural 1 4 2 18 38 69 48 180
Total 1 26 121 114 75 176 87 600
Vodafone
Urban 1 5 126 110 66 90 24 422
Rural 2 3 6 10 40 84 35 180
Total 3 8 132 120 106 174 59 602
Total
Urban 7 107 571 794 810 844 229 3362
Rural 11 72 85 194 319 550 209 1440
Total 18 179 656 988 1129 1394 438 4802
3.3 How satisfied are you with the customer friendly approach of the customer care executive?
Service Provider 1 2 3 4 5 6 7 Total
Count Count Count Count Count Count Count Count
Aircel
Urban 0 15 143 92 79 71 20 420
Rural 0 8 24 35 78 28 7 180
Total 0 23 167 127 157 99 27 600
Airtel
Urban 0 8 85 123 79 92 33 420
Rural 0 1 5 35 67 54 18 180
Total 0 9 90 158 146 146 51 600
BSNL
Urban 2 4 20 78 194 104 18 420
Rural 0 6 10 23 56 58 27 180
Total 2 10 30 101 250 162 45 600
HFCL
Urban 2 5 18 140 124 79 52 420
Rural 3 2 5 16 36 82 36 180
Total 5 7 23 156 160 161 88 600
Idea
Urban 2 8 62 128 129 62 29 420
Rural 1 3 11 22 56 65 22 180
Total 3 11 73 150 185 127 51 600
Reliance
Urban 2 7 28 118 131 119 15 420
Rural 1 6 16 28 65 53 11 180
Total 3 13 44 146 196 172 26 600
TTSL
Urban 1 15 147 102 61 62 32 420
Rural 1 4 3 19 46 71 36 180
Total 2 19 150 121 107 133 68 600
Vodafone
Urban 2 5 135 115 64 68 33 422
Rural 1 2 7 34 51 59 26 180
Total 3 7 142 149 115 127 59 602
Total
Urban 11 67 638 896 861 657 232 3362
Rural 7 32 81 212 455 470 183 1440
Total 18 99 719 1108 1316 1127 415 4802

Assessment of Customer perception of Service and Implementation And Effectiveness of Various regulations, directions and orders issued
by TRAI in the interest of consumers October 2013
O-45 (Basement), Lajpat Nagar-II, Ring Road – 110024, India
Email: [email protected], URL: www.consumer-voice.org Page 100
3.4 How satisfied are you with the competency level/problem solving ability of the customer care executive?
Service Provider 1 2 3 4 5 6 7 Total
Count Count Count Count Count Count Count Count
Aircel
Urban 0 24 123 99 89 69 16 420
Rural 3 5 25 34 72 33 8 180
Total 3 29 148 133 161 102 24 600
Airtel
Urban 1 10 81 130 82 71 45 420
Rural 1 1 10 31 71 46 20 180
Total 2 11 91 161 153 117 65 600
BSNL
Urban 0 2 13 77 196 106 26 420
Rural 0 7 7 30 41 67 28 180
Total 0 9 20 107 237 173 54 600
HFCL
Urban 3 2 25 91 163 93 43 420
Rural 1 4 5 19 51 72 28 180
Total 4 6 30 110 214 165 71 600
Idea
Urban 1 6 52 128 127 73 33 420
Rural 1 3 12 23 68 45 28 180
Total 2 9 64 151 195 118 61 600
Reliance
Urban 2 5 29 80 168 117 19 420
Rural 0 3 21 35 64 43 14 180
Total 2 8 50 115 232 160 33 600
TTSL
Urban 1 20 125 94 90 56 34 420
Rural 2 4 3 15 51 60 45 180
Total 3 24 128 109 141 116 79 600
Vodafone
Urban 2 5 131 115 72 65 32 422
Rural 1 1 8 20 58 70 22 180
Total 3 6 139 135 130 135 54 602
Total
Urban 10 74 579 814 987 650 248 3362
Rural 9 28 91 207 476 436 193 1440
Total 19 102 670 1021 1463 1086 441 4802
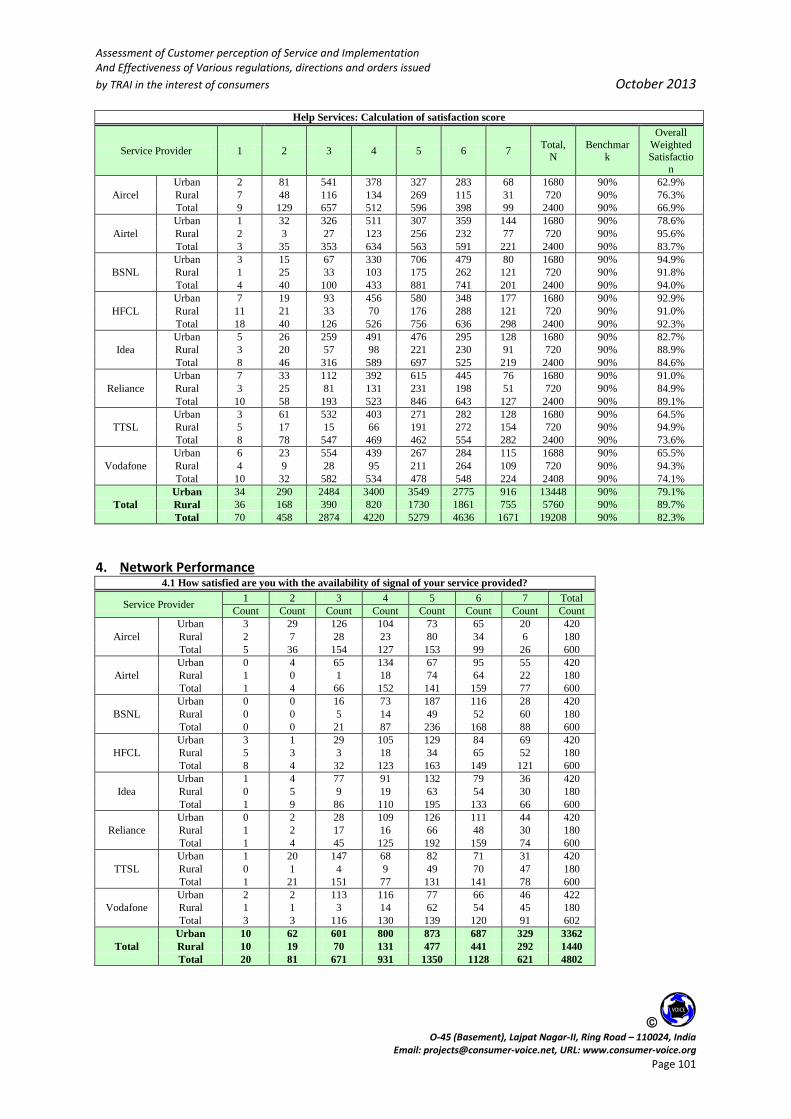
Assessment of Customer perception of Service and Implementation And Effectiveness of Various regulations, directions and orders issued
by TRAI in the interest of consumers October 2013
O-45 (Basement), Lajpat Nagar-II, Ring Road – 110024, India
Email: [email protected], URL: www.consumer-voice.org Page 101
Help Services: Calculation of satisfaction score
Service Provider 1 2 3 4 5 6 7 Total,
N Benchmar
k
Overall
Weighted Satisfactio
n
Aircel
Urban 2 81 541 378 327 283 68 1680 90% 62.9%
Rural 7 48 116 134 269 115 31 720 90% 76.3%
Total 9 129 657 512 596 398 99 2400 90% 66.9%
Airtel
Urban 1 32 326 511 307 359 144 1680 90% 78.6%
Rural 2 3 27 123 256 232 77 720 90% 95.6%
Total 3 35 353 634 563 591 221 2400 90% 83.7%
BSNL
Urban 3 15 67 330 706 479 80 1680 90% 94.9%
Rural 1 25 33 103 175 262 121 720 90% 91.8%
Total 4 40 100 433 881 741 201 2400 90% 94.0%
HFCL
Urban 7 19 93 456 580 348 177 1680 90% 92.9%
Rural 11 21 33 70 176 288 121 720 90% 91.0%
Total 18 40 126 526 756 636 298 2400 90% 92.3%
Idea
Urban 5 26 259 491 476 295 128 1680 90% 82.7%
Rural 3 20 57 98 221 230 91 720 90% 88.9%
Total 8 46 316 589 697 525 219 2400 90% 84.6%
Reliance
Urban 7 33 112 392 615 445 76 1680 90% 91.0%
Rural 3 25 81 131 231 198 51 720 90% 84.9%
Total 10 58 193 523 846 643 127 2400 90% 89.1%
TTSL
Urban 3 61 532 403 271 282 128 1680 90% 64.5%
Rural 5 17 15 66 191 272 154 720 90% 94.9%
Total 8 78 547 469 462 554 282 2400 90% 73.6%
Vodafone
Urban 6 23 554 439 267 284 115 1688 90% 65.5%
Rural 4 9 28 95 211 264 109 720 90% 94.3%
Total 10 32 582 534 478 548 224 2408 90% 74.1%
Total
Urban 34 290 2484 3400 3549 2775 916 13448 90% 79.1%
Rural 36 168 390 820 1730 1861 755 5760 90% 89.7%
Total 70 458 2874 4220 5279 4636 1671 19208 90% 82.3%
4. Network Performance 4.1 How satisfied are you with the availability of signal of your service provided?
Service Provider 1 2 3 4 5 6 7 Total
Count Count Count Count Count Count Count Count
Aircel
Urban 3 29 126 104 73 65 20 420
Rural 2 7 28 23 80 34 6 180
Total 5 36 154 127 153 99 26 600
Airtel
Urban 0 4 65 134 67 95 55 420
Rural 1 0 1 18 74 64 22 180
Total 1 4 66 152 141 159 77 600
BSNL
Urban 0 0 16 73 187 116 28 420
Rural 0 0 5 14 49 52 60 180
Total 0 0 21 87 236 168 88 600
HFCL
Urban 3 1 29 105 129 84 69 420
Rural 5 3 3 18 34 65 52 180
Total 8 4 32 123 163 149 121 600
Idea
Urban 1 4 77 91 132 79 36 420
Rural 0 5 9 19 63 54 30 180
Total 1 9 86 110 195 133 66 600
Reliance
Urban 0 2 28 109 126 111 44 420
Rural 1 2 17 16 66 48 30 180
Total 1 4 45 125 192 159 74 600
TTSL
Urban 1 20 147 68 82 71 31 420
Rural 0 1 4 9 49 70 47 180
Total 1 21 151 77 131 141 78 600
Vodafone
Urban 2 2 113 116 77 66 46 422
Rural 1 1 3 14 62 54 45 180
Total 3 3 116 130 139 120 91 602
Total
Urban 10 62 601 800 873 687 329 3362
Rural 10 19 70 131 477 441 292 1440
Total 20 81 671 931 1350 1128 621 4802

Assessment of Customer perception of Service and Implementation And Effectiveness of Various regulations, directions and orders issued
by TRAI in the interest of consumers October 2013
O-45 (Basement), Lajpat Nagar-II, Ring Road – 110024, India
Email: [email protected], URL: www.consumer-voice.org Page 102
4.2 How satisfied are you with the network of your service provider in terms of ability to make or receive
calls easily?
Service Provider 1 2 3 4 5 6 7 Total
Count Count Count Count Count Count Count Count
Aircel
Urban 3 41 116 86 90 68 16 420
Rural 2 12 24 20 73 38 11 180
Total 5 53 140 106 163 106 27 600
Airtel
Urban 0 10 59 117 88 108 38 420
Rural 0 2 0 23 82 53 20 180
Total 0 12 59 140 170 161 58 600
BSNL
Urban 0 1 14 76 180 119 30 420
Rural 0 1 1 13 45 85 35 180
Total 0 2 15 89 225 204 65 600
HFCL
Urban 1 3 22 119 126 82 67 420
Rural 3 4 6 10 37 77 43 180
Total 4 7 28 129 163 159 110 600
Idea
Urban 1 5 73 96 120 85 40 420
Rural 0 6 12 18 65 63 16 180
Total 1 11 85 114 185 148 56 600
Reliance
Urban 0 6 22 90 138 133 31 420
Rural 0 7 10 20 78 49 16 180
Total 0 13 32 110 216 182 47 600
TTSL
Urban 0 36 119 76 78 69 42 420
Rural 0 4 2 14 35 90 35 180
Total 0 40 121 90 113 159 77 600
Vodafone
Urban 1 4 96 125 63 89 44 422
Rural 0 3 1 17 53 75 31 180
Total 1 7 97 142 116 164 75 602
Total
Urban 6 106 521 785 883 753 308 3362
Rural 5 39 56 135 468 530 207 1440
Total 11 145 577 920 1351 1283 515 4802
4.3 How satisfied are you with the voice quality on your phone during calls?
Service Provider 1 2 3 4 5 6 7 Total
Count Count Count Count Count Count Count Count
Aircel
Urban 1 32 137 105 91 46 8 420
Rural 3 3 26 40 74 29 5 180
Total 4 35 163 145 165 75 13 600
Airtel
Urban 0 7 82 152 91 63 25 420
Rural 0 0 9 31 86 36 18 180
Total 0 7 91 183 177 99 43 600
BSNL
Urban 0 8 21 112 196 71 12 420
Rural 0 2 11 36 69 44 18 180
Total 0 10 32 148 265 115 30 600
HFCL
Urban 0 2 29 108 129 99 53 420
Rural 3 3 6 21 40 84 23 180
Total 3 5 35 129 169 183 76 600
Idea
Urban 1 14 79 124 138 48 16 420
Rural 1 10 29 44 71 20 5 180
Total 2 24 108 168 209 68 21 600
Reliance
Urban 0 7 50 120 166 70 7 420
Rural 0 7 36 49 74 13 1 180
Total 0 14 86 169 240 83 8 600
TTSL
Urban 2 28 143 102 94 37 14 420
Rural 0 10 24 41 68 27 10 180
Total 2 38 167 143 162 64 24 600
Vodafone
Urban 0 3 100 161 82 49 27 422
Rural 0 6 13 42 77 31 11 180
Total 0 9 113 203 159 80 38 602
Total
Urban 4 101 641 984 987 483 162 3362
Rural 7 41 154 304 559 284 91 1440
Total 11 142 795 1288 1546 767 253 4802
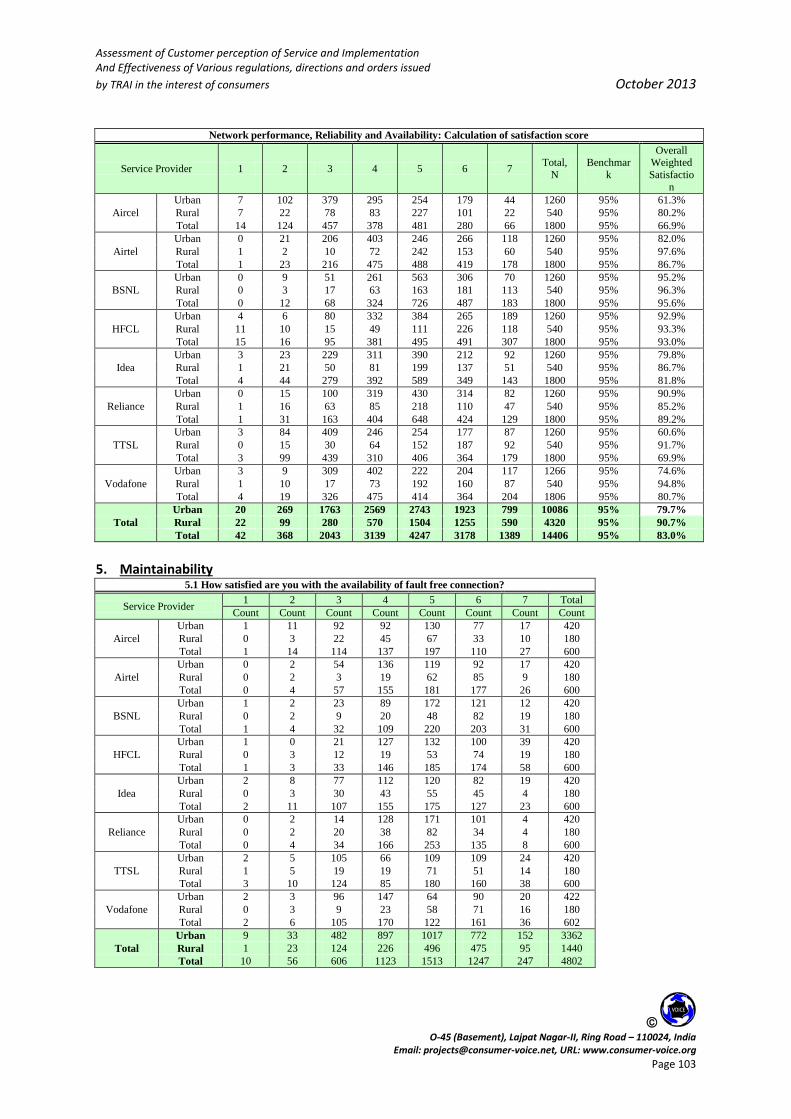
Assessment of Customer perception of Service and Implementation And Effectiveness of Various regulations, directions and orders issued
by TRAI in the interest of consumers October 2013
O-45 (Basement), Lajpat Nagar-II, Ring Road – 110024, India
Email: [email protected], URL: www.consumer-voice.org Page 103
Network performance, Reliability and Availability: Calculation of satisfaction score
Service Provider 1 2 3 4 5 6 7 Total,
N
Benchmar
k
Overall Weighted
Satisfactio
n
Aircel
Urban 7 102 379 295 254 179 44 1260 95% 61.3%
Rural 7 22 78 83 227 101 22 540 95% 80.2%
Total 14 124 457 378 481 280 66 1800 95% 66.9%
Airtel
Urban 0 21 206 403 246 266 118 1260 95% 82.0%
Rural 1 2 10 72 242 153 60 540 95% 97.6%
Total 1 23 216 475 488 419 178 1800 95% 86.7%
BSNL
Urban 0 9 51 261 563 306 70 1260 95% 95.2%
Rural 0 3 17 63 163 181 113 540 95% 96.3%
Total 0 12 68 324 726 487 183 1800 95% 95.6%
HFCL
Urban 4 6 80 332 384 265 189 1260 95% 92.9%
Rural 11 10 15 49 111 226 118 540 95% 93.3%
Total 15 16 95 381 495 491 307 1800 95% 93.0%
Idea
Urban 3 23 229 311 390 212 92 1260 95% 79.8%
Rural 1 21 50 81 199 137 51 540 95% 86.7%
Total 4 44 279 392 589 349 143 1800 95% 81.8%
Reliance
Urban 0 15 100 319 430 314 82 1260 95% 90.9%
Rural 1 16 63 85 218 110 47 540 95% 85.2%
Total 1 31 163 404 648 424 129 1800 95% 89.2%
TTSL
Urban 3 84 409 246 254 177 87 1260 95% 60.6%
Rural 0 15 30 64 152 187 92 540 95% 91.7%
Total 3 99 439 310 406 364 179 1800 95% 69.9%
Vodafone
Urban 3 9 309 402 222 204 117 1266 95% 74.6%
Rural 1 10 17 73 192 160 87 540 95% 94.8%
Total 4 19 326 475 414 364 204 1806 95% 80.7%
Total
Urban 20 269 1763 2569 2743 1923 799 10086 95% 79.7%
Rural 22 99 280 570 1504 1255 590 4320 95% 90.7%
Total 42 368 2043 3139 4247 3178 1389 14406 95% 83.0%
5. Maintainability
5.1 How satisfied are you with the availability of fault free connection?
Service Provider 1 2 3 4 5 6 7 Total
Count Count Count Count Count Count Count Count
Aircel
Urban 1 11 92 92 130 77 17 420
Rural 0 3 22 45 67 33 10 180
Total 1 14 114 137 197 110 27 600
Airtel
Urban 0 2 54 136 119 92 17 420
Rural 0 2 3 19 62 85 9 180
Total 0 4 57 155 181 177 26 600
BSNL
Urban 1 2 23 89 172 121 12 420
Rural 0 2 9 20 48 82 19 180
Total 1 4 32 109 220 203 31 600
HFCL
Urban 1 0 21 127 132 100 39 420
Rural 0 3 12 19 53 74 19 180
Total 1 3 33 146 185 174 58 600
Idea
Urban 2 8 77 112 120 82 19 420
Rural 0 3 30 43 55 45 4 180
Total 2 11 107 155 175 127 23 600
Reliance
Urban 0 2 14 128 171 101 4 420
Rural 0 2 20 38 82 34 4 180
Total 0 4 34 166 253 135 8 600
TTSL
Urban 2 5 105 66 109 109 24 420
Rural 1 5 19 19 71 51 14 180
Total 3 10 124 85 180 160 38 600
Vodafone
Urban 2 3 96 147 64 90 20 422
Rural 0 3 9 23 58 71 16 180
Total 2 6 105 170 122 161 36 602
Total
Urban 9 33 482 897 1017 772 152 3362
Rural 1 23 124 226 496 475 95 1440
Total 10 56 606 1123 1513 1247 247 4802

Assessment of Customer perception of Service and Implementation And Effectiveness of Various regulations, directions and orders issued
by TRAI in the interest of consumers October 2013
O-45 (Basement), Lajpat Nagar-II, Ring Road – 110024, India
Email: [email protected], URL: www.consumer-voice.org Page 104
5.2 How satisfied are you with the timely repair of faults of your phone connection?
Service Provider 1 2 3 4 5 6 7 Total
Count Count Count Count Count Count Count Count
Aircel
Urban 0 22 44 194 53 65 42 420
Rural 1 1 10 16 62 61 29 180
Total 1 23 54 210 115 126 71 600
Airtel
Urban 3 8 24 186 90 78 31 420
Rural 0 3 6 20 61 55 35 180
Total 3 11 30 206 151 133 66 600
BSNL
Urban 1 5 27 179 123 64 21 420
Rural 0 2 13 19 62 61 23 180
Total 1 7 40 198 185 125 44 600
HFCL
Urban 2 3 26 140 143 71 35 420
Rural 1 0 3 11 51 69 45 180
Total 3 3 29 151 194 140 80 600
Idea
Urban 2 3 10 232 74 54 45 420
Rural 2 3 13 17 65 53 27 180
Total 4 6 23 249 139 107 72 600
Reliance
Urban 1 5 26 85 148 116 39 420
Rural 1 2 7 25 75 49 21 180
Total 2 7 33 110 223 165 60 600
TTSL
Urban 1 22 142 73 53 77 52 420
Rural 0 1 3 14 52 63 47 180
Total 1 23 145 87 105 140 99 600
Vodafone
Urban 1 4 12 235 70 68 32 422
Rural 2 2 4 21 58 55 38 180
Total 3 6 16 256 128 123 70 602
Total
Urban 11 72 311 1324 754 593 297 3362
Rural 7 14 59 143 486 466 265 1440
Total 18 86 370 1467 1240 1059 562 4802
Maintainability: Calculation of satisfaction score
Service Provider 1 2 3 4 5 6 7 Total,
N
Benchmar
k
Overall
Weighted
Satisfaction
Aircel
Urban 1 33 136 286 183 142 59 840 95% 79.8%
Rural 1 4 32 61 129 94 39 360 95% 89.7%
Total 2 37 168 347 312 236 98 1200 95% 82.8%
Airtel
Urban 3 10 78 322 209 170 48 840 95% 89.2%
Rural 0 5 9 39 123 140 44 360 95% 96.1%
Total 3 15 87 361 332 310 92 1200 95% 91.3%
BSNL
Urban 2 7 50 268 295 185 33 840 95% 93.0%
Rural 0 4 22 39 110 143 42 360 95% 92.8%
Total 2 11 72 307 405 328 75 1200 95% 92.9%
HFCL
Urban 3 3 47 267 275 171 74 840 95% 93.7%
Rural 1 3 15 30 104 143 64 360 95% 94.7%
Total 4 6 62 297 379 314 138 1200 95% 94.0%
Idea
Urban 4 11 87 344 194 136 64 840 95% 87.9%
Rural 2 6 43 60 120 98 31 360 95% 85.8%
Total 6 17 130 404 314 234 95 1200 95% 87.3%
Reliance
Urban 1 7 40 213 319 217 43 840 95% 94.3%
Rural 1 4 27 63 157 83 25 360 95% 91.1%
Total 2 11 67 276 476 300 68 1200 95% 93.3%
TTSL
Urban 3 27 247 139 162 186 76 840 95% 67.0%
Rural 1 6 22 33 123 114 61 360 95% 91.9%
Total 4 33 269 172 285 300 137 1200 95% 74.5%
Vodafone
Urban 3 7 108 382 134 158 52 844 95% 86.0%
Rural 2 5 13 44 116 126 54 360 95% 94.4%
Total 5 12 121 426 250 284 106 1204 95% 88.5%
Total
Urban 20 105 793 2221 1771 1365 449 6724 95% 86.3%
Rural 8 37 183 369 982 941 360 2880 95% 92.1%
Total 28 142 976 2590 2753 2306 809 9604 95% 88.1%

Assessment of Customer perception of Service and Implementation And Effectiveness of Various regulations, directions and orders issued
by TRAI in the interest of consumers October 2013
O-45 (Basement), Lajpat Nagar-II, Ring Road – 110024, India
Email: [email protected], URL: www.consumer-voice.org Page 105
6. Supplementary Services and Value Added Services
6.1 Have you subscribed to any supplementary services like call forwarding, call diverting and value added services
Service Provider Yes No Total
Count % Count % Count
Aircel
Urban 142 33.8% 278 66.2% 420
Rural 68 37.8% 112 62.2% 180
Total 210 35.0% 390 65.0% 600
Airtel
Urban 158 37.6% 262 62.4% 420
Rural 59 32.8% 121 67.2% 180
Total 217 36.2% 383 63.8% 600
BSNL
Urban 89 21.2% 331 78.8% 420
Rural 28 15.6% 152 84.4% 180
Total 117 19.5% 483 80.5% 600
HFCL
Urban 89 21.2% 331 78.8% 420
Rural 44 24.4% 136 75.6% 180
Total 133 22.2% 467 77.8% 600
Idea
Urban 163 38.8% 257 61.2% 420
Rural 62 34.4% 118 65.6% 180
Total 225 37.5% 375 62.5% 600
Reliance
Urban 110 26.2% 310 73.8% 420
Rural 28 15.6% 152 84.4% 180
Total 138 23.0% 462 77.0% 600
TTSL
Urban 116 27.6% 304 72.4% 420
Rural 68 37.8% 112 62.2% 180
Total 184 30.7% 416 69.3% 600
Vodafone
Urban 116 27.5% 306 72.5% 422
Rural 52 28.9% 128 71.1% 180
Total 168 27.9% 434 72.1% 602
Total
Urban 983 29.2% 2379 70.8% 3362
Rural 409 28.4% 1031 71.6% 1440
Total 1392 29.0% 3410 71.0% 4802
6.2 How satisfied are you with the supplementary services / value added service provided
Service Provider 1 2 3 4 5 6 7 Total
Count Count Count Count Count Count Count Count
Aircel
Urban 0 8 23 43 47 16 5 142
Rural 0 4 11 10 26 15 2 68
Total 0 12 34 53 73 31 7 210
Airtel
Urban 1 2 24 50 38 39 4 158
Rural 0 0 1 18 22 15 3 59
Total 1 2 25 68 60 54 7 217
BSNL
Urban 0 4 12 19 31 22 1 89
Rural 0 0 2 4 9 10 3 28
Total 0 4 14 23 40 32 4 117
HFCL
Urban 1 0 10 9 28 37 4 89
Rural 0 0 2 2 9 23 8 44
Total 1 0 12 11 37 60 12 133
Idea
Urban 0 5 10 47 67 25 9 163
Rural 0 8 8 3 25 13 5 62
Total 0 13 18 50 92 38 14 225
Reliance
Urban 0 1 5 16 52 33 3 110
Rural 0 0 6 6 13 3 0 28
Total 0 1 11 22 65 36 3 138
TTSL
Urban 1 6 21 15 33 32 8 116
Rural 0 0 2 8 29 26 3 68
Total 1 6 23 23 62 58 11 184
Vodafone
Urban 1 2 24 23 32 29 5 116
Rural 0 0 1 12 16 20 3 52
Total 1 2 25 35 48 49 8 168
Total
Urban 4 28 129 222 328 233 39 983
Rural 0 12 33 63 149 125 27 409
Total 4 40 162 285 477 358 66 1392

Assessment of Customer perception of Service and Implementation And Effectiveness of Various regulations, directions and orders issued
by TRAI in the interest of consumers October 2013
O-45 (Basement), Lajpat Nagar-II, Ring Road – 110024, India
Email: [email protected], URL: www.consumer-voice.org Page 106
Supplementary services and Value Added services: Calculation of satisfaction score
Service Provider 1 2 3 4 5 6 7 Total,
N Benchmark
Overall
Weighted
Satisfaction
Aircel
Urban 0 8 23 43 47 16 5 142 90% 78.2%
Rural 0 4 11 10 26 15 2 68 90% 77.9%
Total 0 12 34 53 73 31 7 210 90% 78.1%
Airtel
Urban 1 2 24 50 38 39 4 158 90% 82.9%
Rural 0 0 1 18 22 15 3 59 90% 98.3%
Total 1 2 25 68 60 54 7 217 90% 87.1%
BSNL
Urban 0 4 12 19 31 22 1 89 90% 82.0%
Rural 0 0 2 4 9 10 3 28 90% 92.9%
Total 0 4 14 23 40 32 4 117 90% 84.6%
HFCL
Urban 1 0 10 9 28 37 4 89 90% 87.6%
Rural 0 0 2 2 9 23 8 44 90% 95.5%
Total 1 0 12 11 37 60 12 133 90% 90.2%
Idea
Urban 0 5 10 47 67 25 9 163 90% 90.8%
Rural 0 8 8 3 25 13 5 62 90% 74.2%
Total 0 13 18 50 92 38 14 225 90% 86.2%
Reliance
Urban 0 1 5 16 52 33 3 110 90% 94.5%
Rural 0 0 6 6 13 3 0 28 90% 78.6%
Total 0 1 11 22 65 36 3 138 90% 91.3%
TTSL
Urban 1 6 21 15 33 32 8 116 90% 75.9%
Rural 0 0 2 8 29 26 3 68 90% 97.1%
Total 1 6 23 23 62 58 11 184 90% 83.7%
Vodafone
Urban 1 2 24 23 32 29 5 116 90% 76.7%
Rural 0 0 1 12 16 20 3 52 90% 98.1%
Total 1 2 25 35 48 49 8 168 90% 83.3%
Total
Urban 4 28 129 222 328 233 39 983 90% 83.6%
Rural 0 12 33 63 149 125 27 409 90% 89.0%
Total 4 40 162 285 477 358 66 1392 90% 85.2%
7. Overall Services
7. How satisfied are you with the overall Quality of the Cellular Service?
Service Provider 1 2 3 4 5 6 7 Total
Count Count Count Count Count Count Count Count
Aircel
Urban 0 0 120 198 81 20 1 420
Rural 0 5 7 42 82 37 7 180
Total 0 5 127 240 163 57 8 600
Airtel
Urban 0 0 66 206 107 34 7 420
Rural 0 1 4 9 67 63 36 180
Total 0 1 70 215 174 97 43 600
BSNL
Urban 3 5 10 59 130 154 59 420
Rural 0 2 1 11 48 78 40 180
Total 3 7 11 70 178 232 99 600
HFCL
Urban 0 0 14 84 85 125 112 420
Rural 1 2 4 6 31 80 56 180
Total 1 2 18 90 116 205 168 600
Idea
Urban 0 2 66 194 100 50 8 420
Rural 1 3 28 21 66 34 27 180
Total 1 5 94 215 166 84 35 600
Reliance
Urban 0 1 5 30 112 193 79 420
Rural 1 1 6 21 73 74 4 180
Total 1 2 11 51 185 267 83 600
TTSL
Urban 0 0 88 74 151 79 28 420
Rural 1 0 13 27 57 67 15 180
Total 1 0 101 101 208 146 43 600
Vodafone
Urban 0 0 64 147 161 49 1 422
Rural 1 1 2 14 61 81 20 180
Total 1 1 66 161 222 130 21 602
Total
Urban 3 8 433 992 927 704 295 3362
Rural 5 15 65 151 485 514 205 1440
Total 8 23 498 1143 1412 1218 500 4802
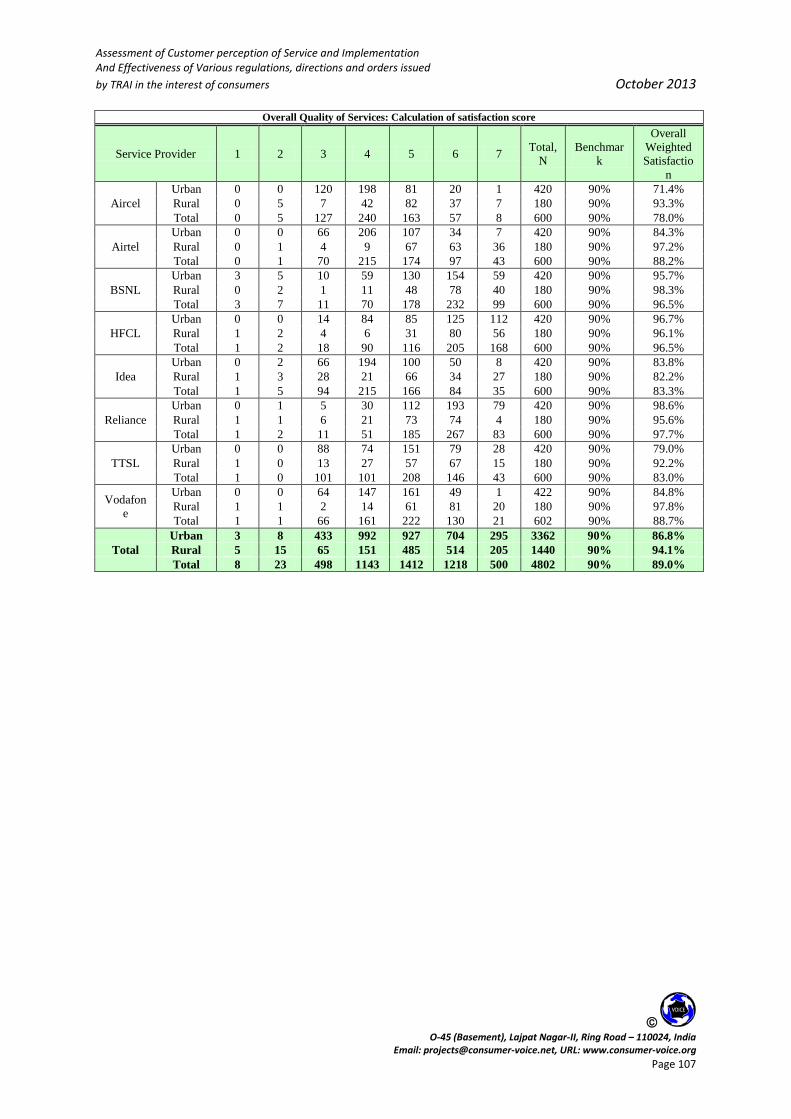
Assessment of Customer perception of Service and Implementation And Effectiveness of Various regulations, directions and orders issued
by TRAI in the interest of consumers October 2013
O-45 (Basement), Lajpat Nagar-II, Ring Road – 110024, India
Email: [email protected], URL: www.consumer-voice.org Page 107
Overall Quality of Services: Calculation of satisfaction score
Service Provider 1 2 3 4 5 6 7 Total,
N
Benchmar
k
Overall
Weighted
Satisfactio
n
Aircel
Urban 0 0 120 198 81 20 1 420 90% 71.4%
Rural 0 5 7 42 82 37 7 180 90% 93.3%
Total 0 5 127 240 163 57 8 600 90% 78.0%
Airtel
Urban 0 0 66 206 107 34 7 420 90% 84.3%
Rural 0 1 4 9 67 63 36 180 90% 97.2%
Total 0 1 70 215 174 97 43 600 90% 88.2%
BSNL
Urban 3 5 10 59 130 154 59 420 90% 95.7%
Rural 0 2 1 11 48 78 40 180 90% 98.3%
Total 3 7 11 70 178 232 99 600 90% 96.5%
HFCL
Urban 0 0 14 84 85 125 112 420 90% 96.7%
Rural 1 2 4 6 31 80 56 180 90% 96.1%
Total 1 2 18 90 116 205 168 600 90% 96.5%
Idea
Urban 0 2 66 194 100 50 8 420 90% 83.8%
Rural 1 3 28 21 66 34 27 180 90% 82.2%
Total 1 5 94 215 166 84 35 600 90% 83.3%
Reliance
Urban 0 1 5 30 112 193 79 420 90% 98.6%
Rural 1 1 6 21 73 74 4 180 90% 95.6%
Total 1 2 11 51 185 267 83 600 90% 97.7%
TTSL
Urban 0 0 88 74 151 79 28 420 90% 79.0%
Rural 1 0 13 27 57 67 15 180 90% 92.2%
Total 1 0 101 101 208 146 43 600 90% 83.0%
Vodafon
e
Urban 0 0 64 147 161 49 1 422 90% 84.8%
Rural 1 1 2 14 61 81 20 180 90% 97.8%
Total 1 1 66 161 222 130 21 602 90% 88.7%
Total
Urban 3 8 433 992 927 704 295 3362 90% 86.8%
Rural 5 15 65 151 485 514 205 1440 90% 94.1%
Total 8 23 498 1143 1412 1218 500 4802 90% 89.0%

Assessment of Customer perception of Service and Implementation And Effectiveness of Various regulations, directions and orders issued
by TRAI in the interest of consumers October 2013
O-45 (Basement), Lajpat Nagar-II, Ring Road – 110024, India
Email: [email protected], URL: www.consumer-voice.org Page 108
A3. BROADBAND SERVICES
1. Provision of Service
1.1 How satisfied are you with the ease of taking a connection?
Service Provider 1 2 3 4 5 6 7 Total
Count Count Count Count Count Count Count Count
BHARTI
AIRTEL
Urban 0 0 0 92 230 59 40 421
Rural 0 0 1 46 68 35 30 180
Total 0 0 1 138 298 94 70 601
BSNL
Urban 24 0 3 49 141 110 95 422
Rural 18 0 2 22 66 43 29 180
Total 42 0 5 71 207 153 124 602
HFCL
Urban 0 0 0 46 111 147 118 422
Rural 0 0 2 23 49 63 43 180
Total 0 0 2 69 160 210 161 602
Reliance
Urban 83 0 6 67 154 67 43 420
Rural 1 0 7 53 93 19 7 180
Total 84 0 13 120 247 86 50 600
Total
Urban 107 0 9 254 636 383 296 1685
Rural 19 0 12 144 276 160 109 720
Total 126 0 21 398 912 543 405 2405
1.2 How satisfied are you with the provision and understanding of all relevant information related to
tariff plans & charges?
Service Provider 1 2 3 4 5 6 7 Total
Count Count Count Count Count Count Count Count
BHARTI
AIRTEL
Urban 0 1 4 105 232 72 7 421
Rural 0 0 4 34 99 41 2 180
Total 0 1 8 139 331 113 9 601
BSNL
Urban 0 3 8 59 199 148 5 422
Rural 0 0 3 22 97 55 3 180
Total 0 3 11 81 296 203 8 602
HFCL
Urban 0 2 10 46 190 166 8 422
Rural 0 1 3 25 90 58 3 180
Total 0 3 13 71 280 224 11 602
Reliance
Urban 0 1 7 79 213 116 4 420
Rural 0 0 5 46 107 20 2 180
Total 0 1 12 125 320 136 6 600
Total
Urban 0 7 29 289 834 502 24 1685
Rural 0 1 15 127 393 174 10 720
Total 0 8 44 416 1227 676 34 2405
1.3 How satisfied are you with the availability of suitable plans/recharge vouchers as per your
requirement?
Service Provider 1 2 3 4 5 6 7 Total
Count Count Count Count Count Count Count Count
BHARTI
AIRTEL
Urban 0 0 1 86 236 82 16 421
Rural 0 1 1 33 97 41 7 180
Total 0 1 2 119 333 123 23 601
BSNL
Urban 0 3 2 51 181 156 29 422
Rural 0 0 1 23 85 62 9 180
Total 0 3 3 74 266 218 38 602
HFCL
Urban 0 2 3 45 162 174 36 422
Rural 0 1 0 19 68 77 15 180
Total 0 3 3 64 230 251 51 602
Reliance
Urban 0 1 4 79 203 120 13 420
Rural 0 0 5 37 108 29 1 180
Total 0 1 9 116 311 149 14 600
Total
Urban 0 6 10 261 782 532 94 1685
Rural 0 2 7 112 358 209 32 720
Total 0 8 17 373 1140 741 126 2405

Assessment of Customer perception of Service and Implementation And Effectiveness of Various regulations, directions and orders issued
by TRAI in the interest of consumers October 2013
O-45 (Basement), Lajpat Nagar-II, Ring Road – 110024, India
Email: [email protected], URL: www.consumer-voice.org Page 109
Provision of Services: Calculation of satisfaction Score
code 1 2 3 4 5 6 7 Total,
N Benchmark
Overall
Weighted
Satisfaction
BHARTI
AIRTEL
Urban 0 1 5 283 698 213 63 1263 90% 99.5%
Rural 0 1 6 113 264 117 39 540 90% 98.7%
Total 0 2 11 396 962 330 102 1803 90% 99.3%
BSNL
Urban 24 6 13 159 521 414 129 1266 90% 96.6%
Rural 18 0 6 67 248 160 41 540 90% 95.6%
Total 42 6 19 226 769 574 170 1806 90% 96.3%
HFCL
Urban 0 4 13 137 463 487 162 1266 90% 98.7%
Rural 0 2 5 67 207 198 61 540 90% 98.7%
Total 0 6 18 204 670 685 223 1806 90% 98.7%
Reliance
Urban 83 2 17 225 570 303 60 1260 90% 91.9%
Rural 1 0 17 136 308 68 10 540 90% 96.7%
Total 84 2 34 361 878 371 70 1800 90% 93.3%
Total
Urban 107 13 48 804 2252 1417 414 5055 90% 96.7%
Rural 19 3 34 383 1027 543 151 2160 90% 97.4%
Total 126 16 82 1187 3279 1960 565 7215 90% 96.9%
2. Billing related:
Post Paid Services
2.5 How satisfied are you with the charges levied per call?
Service Provider 1 2 3 4 5 6 7 Total
Count Count Count Count Count Count Count Count
BHARTI AIRTEL
Urban 0 2 12 135 188 61 23 421
Rural 0 0 4 62 75 32 7 180
Total 0 2 16 197 263 93 30 601
BSNL
Urban 0 11 11 74 121 149 56 422
Rural 0 4 5 40 76 42 13 180
Total 0 15 16 114 197 191 69 602
HFCL
Urban 0 4 13 127 151 99 28 422
Rural 0 7 7 37 52 53 24 180
Total 0 11 20 164 203 152 52 602
Reliance
Urban 0 3 14 131 155 88 29 420
Rural 0 0 5 57 83 28 7 180
Total 0 3 19 188 238 116 36 600
Total
Urban 0 20 50 467 615 397 136 1685
Rural 0 11 21 196 286 155 51 720
Total 0 31 71 663 901 552 187 2405
2.6 How satisfied are you with the overall accuracy & completeness of the bills?
Service Provider 1 2 3 4 5 6 7 Total
Count Count Count Count Count Count Count Count
BHARTI AIRTEL
Urban 0 1 18 95 244 54 9 421
Rural 0 0 7 47 107 17 2 180
Total 0 1 25 142 351 71 11 601
BSNL
Urban 0 5 5 70 222 99 21 422
Rural 0 3 4 31 103 33 6 180
Total 0 8 9 101 325 132 27 602
HFCL
Urban 0 2 18 86 244 62 10 422
Rural 0 4 6 32 88 42 8 180
Total 0 6 24 118 332 104 18 602
Reliance
Urban 0 0 13 92 232 66 17 420
Rural 0 0 10 42 98 23 7 180
Total 0 0 23 134 330 89 24 600
Total
Urban 0 8 54 343 942 281 57 1685
Rural 0 7 27 152 396 115 23 720
Total 0 15 81 495 1338 396 80 2405

Assessment of Customer perception of Service and Implementation And Effectiveness of Various regulations, directions and orders issued
by TRAI in the interest of consumers October 2013
O-45 (Basement), Lajpat Nagar-II, Ring Road – 110024, India
Email: [email protected], URL: www.consumer-voice.org Page 110
2.7 How satisfied are you with the clarity of the bills in terms of transparency and understandability?
Service Provider 1 2 3 4 5 6 7 Total
Count Count Count Count Count Count Count Count
BHARTI AIRTEL
Urban 0 0 13 110 219 62 17 421
Rural 0 0 8 50 93 23 6 180
Total 0 0 21 160 312 85 23 601
BSNL
Urban 0 1 20 53 158 141 49 422
Rural 0 1 5 42 82 37 13 180
Total 0 2 25 95 240 178 62 602
HFCL
Urban 0 0 18 113 183 80 28 422
Rural 0 1 6 33 68 53 19 180
Total 0 1 24 146 251 133 47 602
Reliance
Urban 0 0 11 103 199 73 34 420
Rural 0 0 6 52 84 29 9 180
Total 0 0 17 155 283 102 43 600
Total
Urban 0 1 62 379 759 356 128 1685
Rural 0 2 25 177 327 142 47 720
Total 0 3 87 556 1086 498 175 2405
Billibg service: Calculation of satisfaction score
code 1 2 3 4 5 6 7 Total,
N Benchmark
Overall
Weighted
Satisfaction
BHARTI
AIRTEL
Urban 0 3 43 340 651 177 49 1263 90% 96.4%
Rural 0 0 19 159 275 72 15 540 90% 96.5%
Total 0 3 62 499 926 249 64 1803 90% 96.4%
BSNL
Urban 0 17 36 197 501 389 126 1266 90% 95.8%
Rural 0 8 14 113 261 112 32 540 90% 95.9%
Total 0 25 50 310 762 501 158 1806 90% 95.8%
HFCL
Urban 0 6 49 326 578 241 66 1266 90% 95.7%
Rural 0 12 19 102 208 148 51 540 90% 94.3%
Total 0 18 68 428 786 389 117 1806 90% 95.2%
Reliance
Urban 0 3 38 326 586 227 80 1260 90% 96.7%
Rural 0 0 21 151 265 80 23 540 90% 96.1%
Total 0 3 59 477 851 307 103 1800 90% 96.6%
Total
Urban 0 29 166 1189 2316 1034 321 5055 90% 96.1%
Rural 0 20 73 525 1009 412 121 2160 90% 95.7%
Total 0 49 239 1714 3325 1446 442 7215 90% 96.0%
3. Help Services
3.1 How satisfied are you with the availability of customer care services (consumer care number and
general information number)?
Service Provider 1 2 3 4 5 6 7 Total
Count Count Count Count Count Count Count Count
BHARTI
AIRTEL
Urban 4 4 18 110 236 42 7 421
Rural 3 2 13 43 89 27 3 180
Total 7 6 31 153 325 69 10 601
BSNL
Urban 6 8 39 94 175 86 14 422
Rural 3 6 15 39 79 34 4 180
Total 9 14 54 133 254 120 18 602
HFCL
Urban 8 10 54 81 155 96 18 422
Rural 7 6 21 40 63 34 9 180
Total 15 16 75 121 218 130 27 602
Reliance
Urban 3 7 17 101 218 68 6 420
Rural 0 1 6 51 102 19 1 180
Total 3 8 23 152 320 87 7 600
Total
Urban 21 29 128 386 784 292 45 1685
Rural 13 15 55 173 333 114 17 720
Total 34 44 183 559 1117 406 62 2405
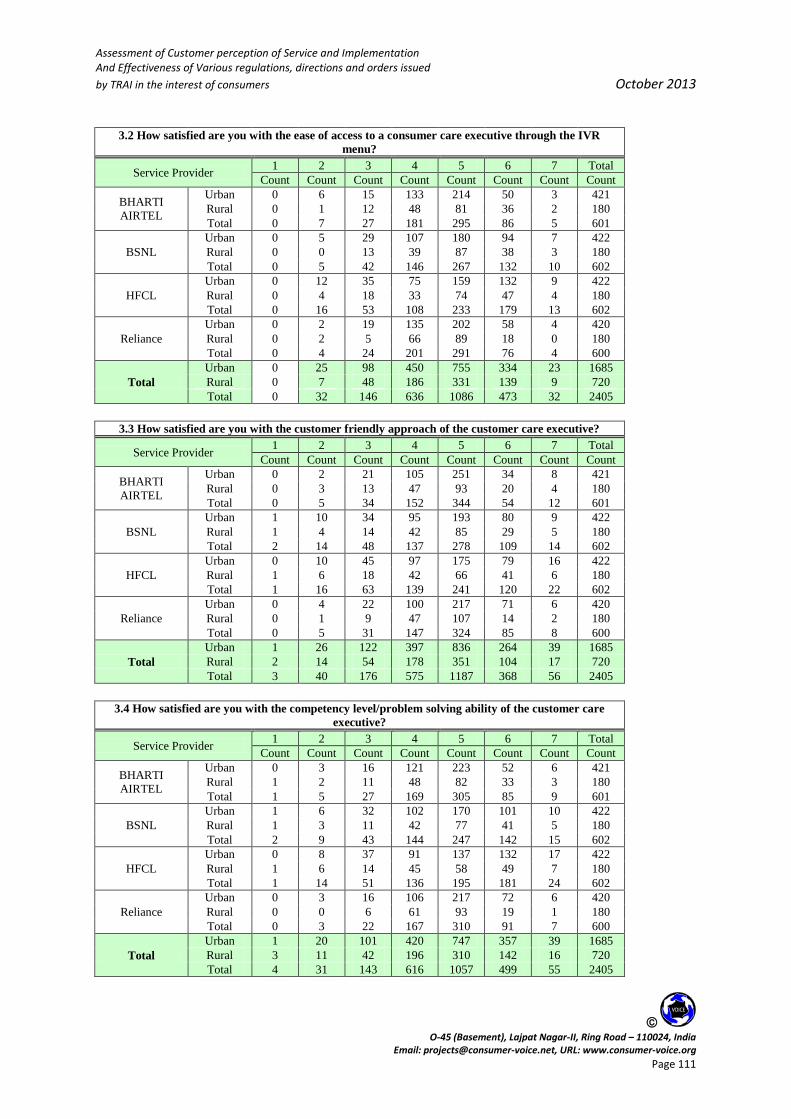
Assessment of Customer perception of Service and Implementation And Effectiveness of Various regulations, directions and orders issued
by TRAI in the interest of consumers October 2013
O-45 (Basement), Lajpat Nagar-II, Ring Road – 110024, India
Email: [email protected], URL: www.consumer-voice.org Page 111
3.2 How satisfied are you with the ease of access to a consumer care executive through the IVR
menu?
Service Provider 1 2 3 4 5 6 7 Total
Count Count Count Count Count Count Count Count
BHARTI
AIRTEL
Urban 0 6 15 133 214 50 3 421
Rural 0 1 12 48 81 36 2 180
Total 0 7 27 181 295 86 5 601
BSNL
Urban 0 5 29 107 180 94 7 422
Rural 0 0 13 39 87 38 3 180
Total 0 5 42 146 267 132 10 602
HFCL
Urban 0 12 35 75 159 132 9 422
Rural 0 4 18 33 74 47 4 180
Total 0 16 53 108 233 179 13 602
Reliance
Urban 0 2 19 135 202 58 4 420
Rural 0 2 5 66 89 18 0 180
Total 0 4 24 201 291 76 4 600
Total
Urban 0 25 98 450 755 334 23 1685
Rural 0 7 48 186 331 139 9 720
Total 0 32 146 636 1086 473 32 2405
3.3 How satisfied are you with the customer friendly approach of the customer care executive?
Service Provider 1 2 3 4 5 6 7 Total
Count Count Count Count Count Count Count Count
BHARTI
AIRTEL
Urban 0 2 21 105 251 34 8 421
Rural 0 3 13 47 93 20 4 180
Total 0 5 34 152 344 54 12 601
BSNL
Urban 1 10 34 95 193 80 9 422
Rural 1 4 14 42 85 29 5 180
Total 2 14 48 137 278 109 14 602
HFCL
Urban 0 10 45 97 175 79 16 422
Rural 1 6 18 42 66 41 6 180
Total 1 16 63 139 241 120 22 602
Reliance
Urban 0 4 22 100 217 71 6 420
Rural 0 1 9 47 107 14 2 180
Total 0 5 31 147 324 85 8 600
Total
Urban 1 26 122 397 836 264 39 1685
Rural 2 14 54 178 351 104 17 720
Total 3 40 176 575 1187 368 56 2405
3.4 How satisfied are you with the competency level/problem solving ability of the customer care
executive?
Service Provider 1 2 3 4 5 6 7 Total
Count Count Count Count Count Count Count Count
BHARTI
AIRTEL
Urban 0 3 16 121 223 52 6 421
Rural 1 2 11 48 82 33 3 180
Total 1 5 27 169 305 85 9 601
BSNL
Urban 1 6 32 102 170 101 10 422
Rural 1 3 11 42 77 41 5 180
Total 2 9 43 144 247 142 15 602
HFCL
Urban 0 8 37 91 137 132 17 422
Rural 1 6 14 45 58 49 7 180
Total 1 14 51 136 195 181 24 602
Reliance
Urban 0 3 16 106 217 72 6 420
Rural 0 0 6 61 93 19 1 180
Total 0 3 22 167 310 91 7 600
Total
Urban 1 20 101 420 747 357 39 1685
Rural 3 11 42 196 310 142 16 720
Total 4 31 143 616 1057 499 55 2405

Assessment of Customer perception of Service and Implementation And Effectiveness of Various regulations, directions and orders issued
by TRAI in the interest of consumers October 2013
O-45 (Basement), Lajpat Nagar-II, Ring Road – 110024, India
Email: [email protected], URL: www.consumer-voice.org Page 112
Help service: Calculation of satisfaction score
code 1 2 3 4 5 6 7 Total,
N Benchmark
Overall
Weighted Satisfaction
BHARTI
AIRTEL
Urban 4 15 70 469 924 178 24 1684 90% 94.7%
Rural 4 8 49 186 345 116 12 720 90% 91.5%
Total 8 23 119 655 1269 294 36 2404 90% 93.8%
BSNL Urban 8 29 134 398 718 361 40 1688 90% 89.9%
Rural 5 13 53 162 328 142 17 720 90% 90.1%
Total 13 42 187 560 1046 503 57 2408 90% 90.0%
HFCL Urban 8 40 171 344 626 439 60 1688 90% 87.0%
Rural 9 22 71 160 261 171 26 720 90% 85.8%
Total 17 62 242 504 887 610 86 2408 90% 86.7%
Reliance Urban 3 16 74 442 854 269 22 1680 90% 94.5%
Rural 0 4 26 225 391 70 4 720 90% 95.8%
Total 3 20 100 667 1245 339 26 2400 90% 94.9%
Total
Urban 23 100 449 1653 3122 1247 146 6740 90% 91.5%
Rural 18 47 199 733 1325 499 59 2880 90% 90.8%
Total 41 147 648 2386 4447 1746 205 9620 90% 91.3%
4. Network Services
4.1 How satisfied are you with the availability of signal of your service provider?
Service Provider 1 2 3 4 5 6 7 Total
Count Count Count Count Count Count Count Count
Airtel
Urban 0 2 13 105 226 57 18 421
Rural 0 2 9 38 86 33 12 180
Total 0 4 22 143 312 90 30 601
BSNL
Urban 0 7 17 71 178 99 50 422
Rural 0 4 7 33 78 43 15 180
Total 0 11 24 104 256 142 65 602
HFCL
Urban 0 10 17 49 163 128 55 422
Rural 0 4 9 28 65 49 25 180
Total 0 14 26 77 228 177 80 602
Reliance
Urban 0 3 12 106 205 73 21 420
Rural 0 0 7 57 89 23 4 180
Total 0 3 19 163 294 96 25 600
Total
Urban 0 22 59 331 772 357 144 1685
Rural 0 10 32 156 318 148 56 720
Total 0 32 91 487 1090 505 200 2405

Assessment of Customer perception of Service and Implementation And Effectiveness of Various regulations, directions and orders issued
by TRAI in the interest of consumers October 2013
O-45 (Basement), Lajpat Nagar-II, Ring Road – 110024, India
Email: [email protected], URL: www.consumer-voice.org Page 113
4.2 How satisfied are you with the network of your service provider in terms of speed of
broadband connection?
Service Provider 1 2 3 4 5 6 7 Total
Count Count Count Count Count Count Count Count
Airtel
Urban 5 2 12 127 215 52 8 421
Rural 4 3 9 48 82 30 4 180
Total 9 5 21 175 297 82 12 601
BSNL
Urban 10 8 21 97 162 106 18 422
Rural 5 2 13 39 71 45 5 180
Total 15 10 34 136 233 151 23 602
HFCL
Urban 17 10 28 93 132 126 16 422
Rural 8 2 14 36 56 53 11 180
Total 25 12 42 129 188 179 27 602
Reliance
Urban 6 2 11 107 196 89 9 420
Rural 0 0 4 49 105 19 3 180
Total 6 2 15 156 301 108 12 600
Total
Urban 38 22 72 424 705 373 51 1685
Rural 17 7 40 172 314 147 23 720
Total 55 29 112 596 1019 520 74 2405
Network performance: Calculation of satisfaction score
Service Provider 1 2 3 4 5 6 7 Total,
N
Benchmar
k
Overall
Weighted
Satisfactio
n
Airtel
Urban 5 4 25 232 441 109 26 842 85% 96.0%
Rural 4 5 18 86 168 63 16 360 85% 92.5%
Total 9 9 43 318 609 172 42 1202 85% 94.9%
BSNL
Urban 10 15 38 168 340 205 68 844 85% 92.5%
Rural 5 6 20 72 149 88 20 360 85% 91.4%
Total 15 21 58 240 489 293 88 1204 85% 92.2%
HFCL
Urban 17 20 45 142 295 254 71 844 85% 90.3%
Rural 8 6 23 64 121 102 36 360 85% 89.7%
Total 25 26 68 206 416 356 107 1204 85% 90.1%
Reliance
Urban 6 5 23 213 401 162 30 840 85% 96.0%
Rural 0 0 11 106 194 42 7 360 85% 96.9%
Total 6 5 34 319 595 204 37 1200 85% 96.3%
Total
Urban 38 44 131 755 1477 730 195 3370 85% 93.7%
Rural 17 17 72 328 632 295 79 1440 85% 92.6%
Total 55 61 203 1083 2109 1025 274 4810 85% 93.4%
5. Maintainability 5.1 How satisfied are you with the time for which service is up and working?
Service Provider 1 2 3 4 5 6 7 Total
Count Count Count Count Count Count Count Count
Airtel
Urban 0 0 18 61 269 62 11 421
Rural 0 0 11 31 93 40 5 180
Total 0 0 29 92 362 102 16 601
BSNL
Urban 0 1 32 77 175 116 21 422
Rural 0 1 16 37 78 44 4 180
Total 0 2 48 114 253 160 25 602
MTS
Urban 0 0 45 64 125 162 26 422
Rural 0 1 21 28 69 52 9 180
Total 0 1 66 92 194 214 35 602
Rel Comm
Urban 0 0 22 85 232 72 9 420
Rural 0 0 7 47 109 15 2 180
Total 0 0 29 132 341 87 11 600
Total
Urban 0 1 117 287 801 412 67 1685
Rural 0 2 55 143 349 151 20 720
Total 0 3 172 430 1150 563 87 2405
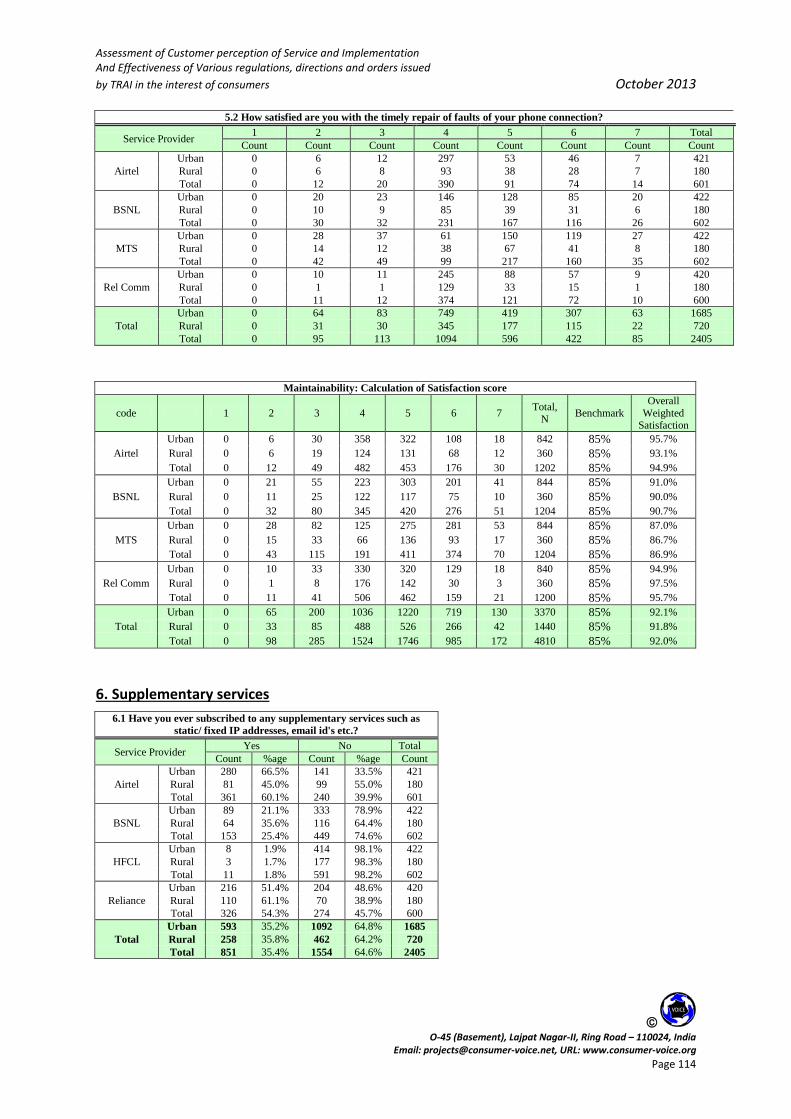
Assessment of Customer perception of Service and Implementation And Effectiveness of Various regulations, directions and orders issued
by TRAI in the interest of consumers October 2013
O-45 (Basement), Lajpat Nagar-II, Ring Road – 110024, India
Email: [email protected], URL: www.consumer-voice.org Page 114
5.2 How satisfied are you with the timely repair of faults of your phone connection?
Service Provider 1 2 3 4 5 6 7 Total
Count Count Count Count Count Count Count Count
Airtel
Urban 0 6 12 297 53 46 7 421
Rural 0 6 8 93 38 28 7 180
Total 0 12 20 390 91 74 14 601
BSNL
Urban 0 20 23 146 128 85 20 422
Rural 0 10 9 85 39 31 6 180
Total 0 30 32 231 167 116 26 602
MTS
Urban 0 28 37 61 150 119 27 422
Rural 0 14 12 38 67 41 8 180
Total 0 42 49 99 217 160 35 602
Rel Comm
Urban 0 10 11 245 88 57 9 420
Rural 0 1 1 129 33 15 1 180
Total 0 11 12 374 121 72 10 600
Total
Urban 0 64 83 749 419 307 63 1685
Rural 0 31 30 345 177 115 22 720
Total 0 95 113 1094 596 422 85 2405
Maintainability: Calculation of Satisfaction score
code 1 2 3 4 5 6 7 Total,
N Benchmark
Overall
Weighted Satisfaction
Airtel
Urban 0 6 30 358 322 108 18 842 85% 95.7%
Rural 0 6 19 124 131 68 12 360 85% 93.1%
Total 0 12 49 482 453 176 30 1202 85% 94.9%
BSNL
Urban 0 21 55 223 303 201 41 844 85% 91.0%
Rural 0 11 25 122 117 75 10 360 85% 90.0%
Total 0 32 80 345 420 276 51 1204 85% 90.7%
MTS
Urban 0 28 82 125 275 281 53 844 85% 87.0%
Rural 0 15 33 66 136 93 17 360 85% 86.7%
Total 0 43 115 191 411 374 70 1204 85% 86.9%
Rel Comm
Urban 0 10 33 330 320 129 18 840 85% 94.9%
Rural 0 1 8 176 142 30 3 360 85% 97.5%
Total 0 11 41 506 462 159 21 1200 85% 95.7%
Total
Urban 0 65 200 1036 1220 719 130 3370 85% 92.1%
Rural 0 33 85 488 526 266 42 1440 85% 91.8%
Total 0 98 285 1524 1746 985 172 4810 85% 92.0%
6. Supplementary services
6.1 Have you ever subscribed to any supplementary services such as
static/ fixed IP addresses, email id's etc.?
Service Provider Yes No Total
Count %age Count %age Count
Airtel
Urban 280 66.5% 141 33.5% 421
Rural 81 45.0% 99 55.0% 180
Total 361 60.1% 240 39.9% 601
BSNL
Urban 89 21.1% 333 78.9% 422
Rural 64 35.6% 116 64.4% 180
Total 153 25.4% 449 74.6% 602
HFCL
Urban 8 1.9% 414 98.1% 422
Rural 3 1.7% 177 98.3% 180
Total 11 1.8% 591 98.2% 602
Reliance
Urban 216 51.4% 204 48.6% 420
Rural 110 61.1% 70 38.9% 180
Total 326 54.3% 274 45.7% 600
Total
Urban 593 35.2% 1092 64.8% 1685
Rural 258 35.8% 462 64.2% 720
Total 851 35.4% 1554 64.6% 2405

Assessment of Customer perception of Service and Implementation And Effectiveness of Various regulations, directions and orders issued
by TRAI in the interest of consumers October 2013
O-45 (Basement), Lajpat Nagar-II, Ring Road – 110024, India
Email: [email protected], URL: www.consumer-voice.org Page 115
6.2 If yes, How satisfied are you with the quality of these supplementary services including activation,
deactivation, charges etc?
Service Provider 1 2 3 4 5 6 7 Total
Count Count Count Count Count Count Count Count
Airtel
Urban 151 0 44 78 7 0 0 280
Rural 46 0 10 23 2 0 0 81
Total 197 0 54 101 9 0 0 361
BSNL
Urban 58 0 0 8 19 4 0 89
Rural 44 0 1 6 11 2 0 64
Total 102 0 1 14 30 6 0 153
HFCL
Urban 0 0 0 0 8 0 0 8
Rural 0 0 0 0 3 0 0 3
Total 0 0 0 0 11 0 0 11
Reliance
Urban 78 0 18 55 52 13 0 216
Rural 73 0 11 24 2 0 0 110
Total 151 0 29 79 54 13 0 326
Total
Rural 287 0 62 141 86 17 0 593
Urban 163 0 22 53 18 2 0 258
Total 450 0 84 194 104 19 0 851
Supplementary Serices: Calculation of satisfaction score
code 1 2 3 4 5 6 7 Total,
N Benchmark
Overall
Weighted
Satisfaction
Airtel
Urban 151 0 44 78 7 0 0 280 85% 30.4%
Rural 46 0 10 23 2 0 0 81 85% 30.9%
Total 197 0 54 101 9 0 0 361 85% 30.5%
BSNL
Urban 58 0 0 8 19 4 0 89 85% 34.8%
Rural 44 0 1 6 11 2 0 64 85% 29.7%
Total 102 0 1 14 30 6 0 153 85% 32.7%
HFCL
Urban 0 0 0 0 8 0 0 8 85% 100.0%
Rural 0 0 0 0 3 0 0 3 85% 100.0%
Total 0 0 0 0 11 0 0 11 85% 100.0%
Reliance
Urban 78 0 18 55 52 13 0 216 85% 55.6%
Rural 73 0 11 24 2 0 0 110 85% 23.6%
Total 151 0 29 79 54 13 0 326 85% 44.8%
Total
Urban 287 0 62 141 86 17 0 593 85% 41.1%
Rural 163 0 22 53 18 2 0 258 85% 28.3%
Total 450 0 84 194 104 19 0 851 85% 37.3%

Assessment of Customer perception of Service and Implementation And Effectiveness of Various regulations, directions and orders issued
by TRAI in the interest of consumers October 2013
O-45 (Basement), Lajpat Nagar-II, Ring Road – 110024, India
Email: [email protected], URL: www.consumer-voice.org Page 116
7. Overall services
7. How satisfied are you with the overall Quality of the Basic Wire line Service
Service Provider 1 2 3 4 5 6 7 Total
Count Count Count Count Count Count Count Count
Airtel
Urban 0 3 38 126 151 98 5 421
Rural 0 4 17 56 63 38 2 180
Total 0 7 55 182 214 136 7 601
BSNL
Urban 0 7 39 91 156 119 10 422
Rural 0 5 18 57 63 32 5 180
Total 0 12 57 148 219 151 15 602
HFCL
Urban 0 15 30 82 160 127 8 422
Rural 0 4 14 32 81 44 5 180
Total 0 19 44 114 241 171 13 602
Reliance
Urban 0 4 35 126 173 76 6 420
Rural 0 0 16 67 61 34 2 180
Total 0 4 51 193 234 110 8 600
Total
Urban 0 29 142 425 640 420 29 1685
Rural 0 13 65 212 268 148 14 720
Total 0 42 207 637 908 568 43 2405
Overall quality of service: Calculation of satisfaction score
code 1 2 3 4 5 6 7 Total,
N Benchmark
Overall
Weighted
Satisfaction
Airtel
Urban 0 3 38 126 151 98 5 421 85% 90.3%
Rural 0 4 17 56 63 38 2 180 85% 88.3%
Total 0 7 55 182 214 136 7 601 85% 89.7%
BSNL
Urban 0 7 39 91 156 119 10 422 85% 89.1%
Rural 0 5 18 57 63 32 5 180 85% 87.2%
Total 0 12 57 148 219 151 15 602 85% 88.5%
HFCL
Urban 0 15 30 82 160 127 8 422 85% 89.3%
Rural 0 4 14 32 81 44 5 180 85% 90.0%
Total 0 19 44 114 241 171 13 602 85% 89.5%
Reliance
Urban 0 4 35 126 173 76 6 420 85% 90.7%
Rural 0 0 16 67 61 34 2 180 85% 91.1%
Total 0 4 51 193 234 110 8 600 85% 90.8%
Total
Urban 0 29 142 425 640 420 29 1685 85% 89.9%
Rural 0 13 65 212 268 148 14 720 85% 89.2%
Total 0 42 207 637 908 568 43 2405 85% 89.6%

Assessment of Customer perception of Service and Implementation And Effectiveness of Various regulations, directions and orders issued
by TRAI in the interest of consumers October 2013
O-45 (Basement), Lajpat Nagar-II, Ring Road – 110024, India
Email: [email protected], URL: www.consumer-voice.org Page 117
ANNEXURE B: QUESTIONNAIRE

TELECOM REGULATORY AUTHORITY OF INDIA CUSTOMER PERCEPTION STUDY (North Zone)
(Basic Wire line Service)
REF No. CC S. No. Interview Date Interviewer’s Name
SDCA Exchange
Mode of Interview 1 In Person 2 Telephonic
Good morning/ afternoon/ evening. We are currently doing a survey on satisfaction among Basic wire line users. This survey is being carried out on behalf of Telecom Regulatory Authority Of India (TRAI), a body set up by the government so that customers like you get better services in future. We would appreciate if you could spare some of your valuable time to answer a few questions. Thank you.
CUSTOMER DETAILS
Respondent’s Name Gender 1 Male 2 Female
Age: 1 <25 2 25-34 3 35-44 4 >45 Area 1 Urban 2 Rural
Occupation 1 Service 2 Business/Self Employed 3 Student 4 Housewife 5 Retired 6 Others
Registered Customer’s Name (If different from respondent)
Address
District State
Mobile no. STD Code Tel No.
Service Provider 1 BSNL 2 MTNL 3 Tata Teleservices 4 Reliance Comm
5 IDEA 6 Vodafone 7 Bharti Airtel 8 HFCL
Usage Type 1 Residential 2 Commercial User Type 1 Post Paid 2 Pre Paid
PERFORMANCE PERCEPTION OF ATTRIBUTES RELATED TO SERVICE QUALITY PARAMETERS
In your opinion, how satisfied are you with your basic services in terms of following dimensions, on a scale of 1 to 7 (1 = Extremely Dissatisfied, 7 = Extremely Satisfied)
Parameters and Attributes Ratings
1. Provision of Service
1.1 How satisfied are you with the ease of taking a connection? (EM 3) 1 2 3 4 5 6 7
1.2 How satisfied are you with the provision and understanding of all relevant information related to tariff plans & charges? (EM 1)
1 2 3 4 5 6 7
1.3 How satisfied are you with the availability of suitable plans/recharge vouchers as per your requirement? (TA 1)
1 2 3 4 5 6 7
2. Billing Related (Only for Prepaid Customers)
2.1 How satisfied are you with ease of recharging process/activation of vouchers? (EM 4) 1 2 3 4 5 6 7
2.2 How satisfied are you with the availability of recharging cards/vouchers of various denominations? (EC 1)
1 2 3 4 5 6 7
2.3 How satisfied are you with the transparency of recharge offer/voucher i.e. talk time available on the recharge card/voucher? (RL 2)
1 2 3 4 5 6 7
2.4 How satisfied are you with the charges deducted for every call i.e. amount deducted on every usage? (EC 2)
1 2 3 4 5 6 7
Billing Related (Only for Postpaid Customers)
2.5 How satisfied are you with the charges levied per call? (EC2 1 2 3 4 5 6 7
2.6 How satisfied are you with the overall accuracy & completeness of the bills? (RL 1) 1 2 3 4 5 6 7
2.7 How satisfied are you with the clarity of the bills in terms of transparency and understandability? (RL2)
1 2 3 4 5 6 7
3. Help Services
3.1 How satisfied are you with the availability of customer care services (consumer care number and general information number)? (EM 5)
1 2 3 4 5 6 7
3.2 How satisfied are you with the ease of access to a consumer care executive through the IVR menu? (CV1)
1 2 3 4 5 6 7

3.3 How satisfied are you with the customer friendly approach of the customer care executive? (RL 3) 1 2 3 4 5 6 7
3.4 How satisfied are you with the competency level/problem solving ability of the customer care executive? (AS 1)
1 2 3 4 5 6 7
4. NETWORK PERFORMANCE, RELIABILITY AND AVAILABILITY
4.1 How satisfied are you with the dial tone availability on your phone? (NT 1) 1 2 3 4 5 6 7
4.2 How satisfied are you with the network of your service provider in terms of ability to make or receive calls easily? (NT2)
1 2 3 4 5 6 7
4.3 How satisfied are you with the voice quality on your phone during calls? (NT3) 1 2 3 4 5 6 7
5. Maintainability
5.1 How satisfied are you with the overall availability of fault free connection? (RS 2) 1 2 3 4 5 6 7
5.2 How satisfied are you with the timely repair of faults of your phone connection? (RS 2) 1 2 3 4 5 6 7
6. SUPPLEMENTARY SERVICES AND VALUE ADDED SERVICES
6.1 Have you ever subscribed to any supplementary services like call waiting/forwarding, voice mail / Value added services?
1 Yes 2 No
6.2 How satisfied are you with the supplementary services / value added service provided including activation, deactivation, charges etc? (CV 2)
1 2 3 4 5 6 7
7. How satisfied are you with the overall Quality of the Basic Wire line Service 1 2 3 4 5 6 7
IMPLEMENTATION AND EFFECTIVENESS OF VARIOUS REGULATIONS AND DIRECTIONS ISSUED BY TRAI
1. Have you registered your number for not receiving/blocking unsolicited commercial calls / SMSs? 1 Yes 2 No
2. If Yes, how satisfied are you with the effectiveness of blocking of unsolicited commercial calls on your number?
1 2 3 4 5 6 7
3. Have you ever registered a complaint, in case the unsolicited call/SMS have not had not stopped in spite of registration for the same?
1 Yes 2 No
4. If Yes, how satisfied are you with the ease of lodging the complaint? 1 2 3 4 5 6 7
5. If Yes, how satisfied are you with the action taken on your complaint? 1 2 3 4 5 6 7
6. Which all grievance redressal mechanisms set up by your telecom service provider based on the TRAI regulations are you aware of?
1 Toll Free Consumer Care Number for making complaints
2 Appellate Authority for filing appeal in case not satisfied with redressal of complaint
3 Web based complaint monitoring system
7. Have you made any complaint to the toll free Consumer Care Number? 1 Yes 2 No
8. If yes, how satisfied are you with the manner in which your complaint was addressed to such intimation of docket number and likely time for redressal of complaint, intimation of action taken on the complaint?
1 2 3 4 5 6 7
9. Have you filed any appeal with the appellate authority? 1 Yes 2 No
10. If yes, how satisfied are you with the manner in which your appeal was addressed to such as acknowledgement of appeal, intimation of decision taken etc..?
1 2 3 4 5 6 7
11. How likely is it that you would recommend your service provider to your relatives or friends? (On scale of 0 to 10, where 10 means ‘Extremely Likely’ & 0 means ‘Not At All Likely’)
0 1 2 3 4 5 6 7 8 9 10
******** Thank You ***********
Name of the interviewer: __________________ Date: __________________
Name of the scrutinizer: __________________ Date: __________________
Back-check done by:______________________ Date of back-check: __________________
Name of Operation Manager: __________________

TELECOM REGULATORY AUTHORITY OF INDIA CUSTOMER PERCEPTION STUDY (North Zone)
(Cellular Mobile)
REF No. CC SR.No. Interview Date Interviewer’s Name
Mode of Interview 1 In Person 2 Telephonic
Good morning/ afternoon/ evening. We are currently doing a survey on satisfaction among Cellular users. This survey is being carried out on behalf of Telecom Regulatory Authority Of India (TRAI), a body set up by the government so that customers like you get better services in future. We would appreciate if you could spare some of your valuable time to answer a few questions. Thank you.
CUSTOMER DETAILS
Respondent’s Name Gender 1 Male 2 Female
Age: 1 <25 2 25-34 3 35-44 4 >45 Area 1 Urban 2 Rural
Occupation 1 Service 2 Business/Self Employed 3 Student 4 Housewife 5 Retired 6 Other
Address
District State Mobile Number
Service Provider
1 BSNL 2 MTNL 3 TTSL 4 Reliance Comm 5 IDEA
6 Vodafone 7 Bharti Airtel 8 Uninor 9 Sistema Shyam 10 Videocon
11 S. Tel 12 HFCL 13 Aircel
Usage Type 1 Residential 2 Commercial User Type 1 Post Paid 2 Pre Paid
PERFORMANCE PERCEPTION OF ATTRIBUTES RELATED TO SERVICE QUALITY PARAMETERS
In your opinion, how satisfied are you with your cellular services in terms of following dimensions, on a scale of 1 to 7 (1 = Extremely Dissatisfied, 7 = Extremely Satisfied)
Parameters and Attributes Ratings
1. Provision of Service
1.1 How satisfied are you with the ease of activating a connection? (EM 3) 1 2 3 4 5 6 7
1.2 How satisfied are you with the understanding of all relevant information related to tariff plans & charges? (EM 1)
1 2 3 4 5 6 7
1.3 How satisfied are you with the availability of suitable plans/ recharge vouchers such as top-up, special tariff voucher, combo voucher, plan voucher as per your requirement? (TA 1)
1 2 3 4 5 6 7
2. Billing Related (Only for Prepaid Customers)
2.1 How satisfied are you with ease of activation of vouchers (recharging process)? (EM 4) 1 2 3 4 5 6 7
2.2 How satisfied are you with the availability of vouchers (recharge coupons) of various denominations? (EC 1)
1 2 3 4 5 6 7
2.3 How satisfied are you with the transparency of information provided on vouchers i.e. talk time available on the vouchers and restrictions if any? (RL 2)
1 2 3 4 5 6 7
2.4 How satisfied are you with the charges deducted after every usage? (EC 2) 1 2 3 4 5 6 7
Billing Related (Only for Postpaid Customers)
2.5 How satisfied are you with the charges levied per call? (EC2 1 2 3 4 5 6 7
2.6 How satisfied are you with the overall accuracy & completeness of the bills? (RL 1) 1 2 3 4 5 6 7
2.7 How satisfied are you with the clarity of bills in terms of transparency and understandability? (RL2) 1 2 3 4 5 6 7
3. Help Services
3.1 How satisfied are you with the availability of customer care services (consumer care number and general information number)? (EM 5)
1 2 3 4 5 6 7
3.2 How satisfied are you with the ease of access to a customer care executive through the IVR menu? (CV1)
1 2 3 4 5 6 7
3.3 How satisfied are you with the customer friendly approach of the customer care executive? (RL 3) 1 2 3 4 5 6 7
3.4 How satisfied are you with the competency level/problem solving ability of the customer care executive? (AS 1)
1 2 3 4 5 6 7
3.5 How satisfied are you with the availability of customer care services (consumer care number and general information number)? (EM 5)
1 2 3 4 5 6 7
4. NETWORK PERFORMANCE, RELIABILITY AND AVAILABILITY
4.1 How satisfied are you with the availability of signal of your service provided? (NT 1) 1 2 3 4 5 6 7
4.2 How satisfied are you with the network of your service provider in terms of ability to make or receive 1 2 3 4 5 6 7

calls easily? (NT2)
4.3 How satisfied are you with the voice quality on your phone during calls? (NT3) 1 2 3 4 5 6 7
5. Maintainability
5.1 How satisfied are you with the availability of fault free connection? (RS 2) 1 2 3 4 5 6 7
5.2 How satisfied are you with the timely repair of faults of your phone connection? (RS 2)
6. SUPPLEMENTARY SERVICES AND VALUE ADDED SERVICES
6.1 Have you subscribed to any supplementary services like call forwarding, call diverting and value added services like ring tone, alerts, GPRS, e-mail, voice mail or any other such services, in the last 6 months?
1 Yes 2 No
6.2 How satisfied are you with the supplementary services / value added service provided including activation, deactivation, charges etc? (CV 2)
1 2 3 4 5 6 7
7. How satisfied are you with the overall Quality of the Cellular Service? 1 2 3 4 5 6 7
IMPLEMENTATION AND EFFECTIVENESS OF VARIOUS REGULATIONS AND DIRECTIONS ISSUED BY TRAI
1. Have you registered your number for not receiving/blocking unsolicited commercial calls / SMSs? 1 Yes 2 No
2. If Yes, how satisfied are you with the effectiveness of blocking of unsolicited commercial calls on your number?
1 2 3 4 5 6 7
3. Have you ever registered a complaint, in case the unsolicited call/SMS have not stopped in spite of registration for the same?
1 Yes 2 No
4. If Yes, how satisfied are you with the ease of lodging the complaint? 1 2 3 4 5 6 7
5. If Yes, how satisfied are you with the action taken on your complaint? 1 2 3 4 5 6 7
Question Number 6-9 are for Prepaid Customers Only
6. How satisfied are you with the information, received through SMS at the time of activation of various vouchers, such as amount charged, processing fee, taxes deducted, title of the plan, validity etc?
1 2 3 4 5 6 7
7. How satisfied are you with the information provided to you after every usage, such as duration of call, charges deducted, balance in account etc?
1 2 3 4 5 6 7
8. A pre paid customer can get an item-wise usage bill within 45 days of making such request. Have you ever requested for it?
1 Yes 2 No
9. If Yes, how satisfied are you with the timely receipt and completeness of the item-wise usage bill on request?
1 2 3 4 5 6 7
10. Which all grievance redressal mechanisms set up by your telecom service provider based on the TRAI regulations are you aware of?
1 Toll Free Consumer Care Number for making complaints
2 Appellate Authority for filing appeal in case not satisfied with redressal of complaint
3 Web based complaint monitoring system
11. Have you made any complaint to the toll free Consumer Care Number? 1 Yes 2 No
12. If yes, how satisfied are you with the manner in which your complaint was addressed to such intimation of docket number and likely time for redressal of complaint, intimation of action taken on the complaint?
1 2 3 4 5 6 7
13. Have you filed any appeal with the appellate authority? 1 Yes 2 No
14. If yes, how satisfied are you with the manner in which your appeal was addressed to such as acknowledgement of appeal, intimation of decision taken etc..?
1 2 3 4 5 6 7
15. Have you utilized the service of Mobile number portability for changing your operator? 1 Yes 2 No
16. If, yes are you satisfied with the process of porting to another operator? 1 2 3 4 5 6 7
17. How likely is it that you would recommend your service provider to your relatives or friends? (On scale of 0 to 10, where 10 means ‘Extremely Likely’ & 0 means ‘Not At All Likely’)
0 1 2 3 4 5 6 7 8 9 10
******** Thank You ***********
Name of the interviewer: __________________ Date: __________________
Name of the scrutinizer: __________________ Date: __________________
Back-check done by:______________________ Date of back-check: __________________
Name of Operation Manager: __________________

TELECOM REGULATORY AUTHORITY OF INDIA CUSTOMER PERCEPTION STUDY (North Zone)
(Broadband)
REF No. CC SR.No. Interview Date Interviewer’s Name
POP Mode of Interview 1 In Person 2 Telephonic 3 E-mail 4 Web/Online
Good morning/ afternoon/ evening. We are currently doing a survey on satisfaction among broadband users. This survey is being carried out on behalf of Telecom Regulatory Authority Of India (TRAI), a body set up by the government so that customers like you get better services in future. We would appreciate if you could spare some of your valuable time to answer a few questions. Thank you.
CUSTOMER DETAILS
Respondent’s Name Gender 1 Male 2 Female
Age: 1 <25 2 25-34 3 35-44 4 >45 Area 1 Urban 2 Rural
Occupation 1 Service 2 Business/Self Employed 3 Student 4 Housewife 5 Retired 6 Others
Registered Customer’s Name (If different from respondent)
Address
District State
STD Code Tel No. Mobile
Service Provider
1 BSNL 6 MTNL 11 Five Network
2 Hath way 7 You Broadband 12 Tata Communication
3 Reliance Comm 8 Spectra Net 13 Bharti Airtel
4 Reliance 9 Tikona 14 HFCL
5 Sify 10 Tata Teleservices
Usage Type 1 Residential 2 Commercial User Type 1 Post Paid 2 Pre Paid
PERFORMANCE PERCEPTION OF ATTRIBUTES RELATED TO SERVICE QUALITY PARAMETERS
In your opinion, how satisfied are you with your broadband services in terms of following dimensions, on a scale of 1 to 7 (1 = Extremely Dissatisfied, 7 = Extremely Satisfied)
Parameters and Attributes Ratings
1. Provision of Service
1.1 How satisfied are you with the ease of taking a connection? (EM 3) 1 2 3 4 5 6 7
1.2 How satisfied are you with the provision and understanding of all relevant information related to tariff plans & charges? (EM 1)
1 2 3 4 5 6 7
1.3 How satisfied are you with the availability of suitable plans/recharge vouchers as per your requirement? (TA 1)
1 2 3 4 5 6 7
2. Billing Related (Only for Prepaid Customers)
2.1 How satisfied are you with ease of recharging process/activation of vouchers? (EM 4) 1 2 3 4 5 6 7
2.2 How satisfied are you with the availability of recharging cards/voucher of various denominations? (EC 1)
1 2 3 4 5 6 7
2.3 How satisfied are you with the transparency of recharge offer/voucher i.e. internet usage available on the recharge card? (RL 2)
1 2 3 4 5 6 7
2.4 How satisfied are you with the charges deducted for internet usage? (EC 2) 1 2 3 4 5 6 7
Billing Related (Only for Postpaid Customers)
2.5 How satisfied are you with the charges levied for every internet usage? (EC2) 1 2 3 4 5 6 7
2.6 How satisfied are you with the overall accuracy & completeness of the bills? (RL 1) 1 2 3 4 5 6 7
2.7 How satisfied are you with the clarity of the bills in terms of transparency and understandability? (RL2)
1 2 3 4 5 6 7
3. Help Services
3.1 How satisfied are you with the availability of customer care services (consumer care number and general information number)? (EM 5)
1 2 3 4 5 6 7
3.2 How satisfied are you with the ease of access to a customer care executive through the IVR menu? 1 2 3 4 5 6 7

(CV1)
3.3 How satisfied are you with the customer friendly approach of the customer care executive? (RL 3) 1 2 3 4 5 6 7
3.4 How satisfied are you with the competency level/problem solving ability of the customer care executive? (AS 1)
1 2 3 4 5 6 7
4. NETWORK PERFORMANCE, RELIABILITY AND AVAILABILITY
4.1 How satisfied are you with the availability of signal of your service provider? (NT 1) 1 2 3 4 5 6 7
4.2 How satisfied are you with the network of your service provider in terms speed of broadband connection? (NT2)
1 2 3 4 5 6 7
5. Maintainability
5.1 How satisfied are you with the time for which service is up and working? (NT3) 1 2 3 4 5 6 7
5.2 How satisfied are you with the timely repair of faults of your connection? (RS 2) 1 2 3 4 5 6 7
6. SUPPLEMENTARY SERVICES AND VALUE ADDED SERVICES
6.1 Have you ever subscribed to any supplementary services such as Static/fixed IP addresses, e-mail id’s etc.?
1 Yes 2 No
6.2 If Yes, how satisfied are you with quality of these supplementary services including activation, deactivation, charges etc? (CV 2)
1 2 3 4 5 6 7
7. How satisfied are you with the overall Quality of the Broadband Service? 1 2 3 4 5 6 7
IMPLEMENTATION AND EFFECTIVENESS OF VARIOUS REGULATIONS AND DIRECTIONS ISSUED BY TRAI
1. Which all grievance redressal mechanisms set up by your telecom service provider based on the TRAI regulations are you aware of?
1 Toll Free Consumer Care Number for making complaints
2 Appellate Authority for filing appeal in case not satisfied with redressal of complaint
3 Web based complaint monitoring system
2. Have you made any complaint to the toll free Consumer Care Number? 1 Yes 2 No
3. If yes, how satisfied are you with the manner in which your complaint was addressed to such intimation of docket number and likely time for redressal of complaint, intimation of action taken on the complaint?
1 2 3 4 5 6 7
4. Have you filed any appeal with the appellate authority? 1 Yes 2 No
5. If yes, how satisfied are you with the manner in which your appeal was addressed to such as acknowledgement of appeal, intimation of decision taken etc..?
1 2 3 4 5 6 7
6. How satisfied are you with the information, provided by your service provider under the fair usage
policy (FUP) such as data usage limit with higher speed and speed of connection up to or beyond data usage limit?
1 2 3 4 5 6 7
7. How satisfied are you with the facility to measure the broadband connection speed provided by your service provider?
1 2 3 4 5 6 7
8. How likely is it that you would recommend your service provider to your relatives or friends? (On scale of 0 to 10, where 10 means ‘Extremely Likely’ & 0 means ‘Not At All Likely’)
0 1 2 3 4 5 6 7 8 9 10
******** Thank You ***********
Name of the interviewer: __________________ Date: __________________
Name of the scrutinizer: __________________ Date: __________________
Back-check done by:______________________ Date of back-check: __________________
Name of Operation Manager: __________________