Report of the Public Private Partnerships for Water Safety ...
77
Report of the Public Private Partnerships for Water Safety in Hyderabad (2006-07) Report Series - RP 43/2007 THE INSTITUTE OF HEALTH SYSTEMS
Transcript of Report of the Public Private Partnerships for Water Safety ...
Report of the Public Private Partnerships forWater Safety in Hyderabad (2006-07)
Report Series - RP 43/2007
THE INSTITUTE OF HEALTH SYSTEMS
Report of the Public Private Partnerships forWater Safety in Hyderabad (2006-07)
C K GeorgeSaritha K
THE INSTITUTE OF HEALTH SYSTEMS
Copyright © 2007 The Institute of Health Systems (IHS), Hyderabad AP India.
All rights reserved. No part of this book may be reproduced, stored in a retrieval system,transmitted or utilised in any form or by any means, electronic, mechanical, photocopying,recording or otherwise without permission in writing from the Publishers.
The Institute of Health SystemsHACA Bhavan, Hyderabad, AP - 500 004, IndiaPh: 91-40-23210136/9,23211013/4; Fax:91-40-23241567;Email: [email protected]; http://www.ihsnet.org.in
Printed in Hyderabad, 2007
IHS Library Cataloguing-in-Publication DataReport of the Public Private Partnerships for Water Safety in Hyderabad (2006-07):1stEdition\C K George, Saritha K
ISBN 978-81-7934-041-7
Includes bibliographic references1.Water Quality Monitoring, Reservoirs, Monitoring, Urban Slums, Public PrivatePartnershipsI. C K George, Saritha K
INR: 240US$ 12
Chapter One: Introduction
I. BackgroundThe provision of an adequate supply of safe water was one of the eight components of
primary health care identified by the International Conference on Primary Health Care in
Alma-Ata in 19781. Poor quality drinking water and inadequate sanitation are among the world's
major preventable causes of early mortality, disease and economic burden for individuals and
communities. While access to drinking water in India has increased over the past decade, the
tremendous adverse impact of unsafe water on health continues. It is estimated that 21% of
communicable diseases in India are water related. Of these diseases, diarrhoea alone killed over
700,000 Indians in 19992.
Despite investments in water and sanitation infrastructure, many low-income
communities in India and other developing countries continue to lack access to safe drinking
water. Poverty, poor sanitation, lack of sufficient and good quality drinking water, malnutrition,
crowded living, lack of access to health care, poor hygienic practices etc., contribute to
perpetuation of waterborne diseases in such communities, especially urban slums. Ensuring
adequate and safe supply of water, therefore plays a crucial role in interrupting this vicious cycle
of waterborne disease epidemics. A key preventive measure is therefore to periodically check
water quality and conduct sanitary surveys in slum and other high risk areas. Given that principal
risks to human health associated with consumption of polluted water are microbiological in
nature, it is critical that quality of water supplied for drinking purposes be continuously
monitored, at the minimum, for indicators of fecal pollution, turbidity, and disinfection of water
(residual chlorine)3.
In Hyderabad, The Hyderabad Metropolitan Water Supply and Sewerage Board
(HMWSSB), provides water supply that caters to the drinking water needs of about 6 million
persons, including those living in about 800 slums. The HMWSSB has in-house testing facilities.
Other additional facilities in Hyderabad include the Institute of Preventive Medicine (IPM) as
well as a few private laboratories. Since existing mechanisms for drinking water quality testing
The Institute of Health Systems , HACA Bhavan, Hyderabad, AP 500004 Page 1 of 74
3 Guidelines for drinking- water quality, Surveillance and control of community supplies, Second edition, Vol.3, WHO1997.
2 Combating diarrhoeal disease in India through safe drinking water Justin DeNormandie and Janette Sunita,Population Services International (PSI) Delhi, India: WHO 2002
1 Guidelines for drinking- water quality, Surveillance and control of community supplies, Second edition, Vol.3,WHO1997.

within the public sector are not enough to meet the challenges of such a large city, the feasibility
of a Public Private Partnership (P3) model to monitor water quality in the city was explored. As a
first step, the HMWSSB entrusted the Institute of Health Systems the responsibility of
conducting a pilot study in Attagutta slum. Incorporating lessons learned from the pilot, a more
systematic public-private partnership model is currently being implemented in Hyderabad since
February 2005 to monitor water quality and associated risks in high priority areas such as urban
slums and the distribution system. The Hyderabad Metropolitan Water Supply and Sewerage
Board and the Institute of Health Systems are the key partners representing the public and private
side of the partnership, respectively. This report cover activities in the second year of the
partnership, i.e. April 2006 to March 2007
II. ObjectivesThe main objectives of the partnership are:-
1. To augment the HMWSSB’s quality control mechanisms as a third party check
2. To expand water testing capacity in Hyderabad and to supplement testing done by theHMWSSB in high priority areas such as reservoirs and urban slums
3. To identify risks to water safety in the high priority areas.
4. To systematize drinking water quality monitoring based on a Public Private Partnershipmodel and to develop the required data and experience for planning and implementation ofsimilar projects
III. Scope of Work1. Monitoring of quality of water supplied from reservoirs identifying risks to water safety
at the reservoir level
2. Monitoring of quality of water supplied to residents in urban slums.
3. Monitoring of quality of bore well/ hand pump water in and around the slum areas
4. Testing of stored household water samples in urban slums for bacteriological quality.
5. Monitoring quality of water supplied by hotels and street vendors in and around slumareas
6. Monitoring of sewerage overflows in identified slum areas
7. Enumeration of health care providers in the identified slum areas
8. Empowering slum residents for prevention of waterborne infections
The Institute of Health Systems , HACA Bhavan, Hyderabad, AP 500004 Page 2 of 74

IV. The PPP Model: Methodology
A. Monitoring at Reservoir PointsIHS personnel visits the reservoirs daily and collects water samples from designated
sampling points. All samples are tested for “Residual Chlorine” using Diethyl Phenylene
Diamine (DPD) method at the site itself. If water supplied at a sampling point has Nil Residual
Chlorine (RC), a sample is collected for Microbiological analysis at the IHS laboratory. In
addition to RC test results, the IHS personnel also record their observations pertaining to any
circumstances at the reservoir site that could have an impact on water quality, such as: improper
functioning of chlorine machines, availability of chlorine cylinders, absence of operators, power
failures, damage to pipes etc.
B. Monitoring at Urban SlumsThe slums to be monitored are assigned by the Board on a daily or weekly basis
depending on information regarding risks to water quality. The following work is carried out in
urban slums identified by the HMWSSB.
1. Monitoring Quality of Water Supplied to Residents in Urban Slums
The residents of slums receive water for drinking purpose, predominantly from
HMWSSB sources. Sometimes utilize water from other private sources. Sources of drinking
water in urban slums include:
i. House Taps or HTs
ii. Public Stand Posts or PSPs
iii. Pit Taps or PTs
iv. Metro Water Tanker or MWT
v. Metro Bore wells or MB
Metro WaterTankers
Hand pump
House Tap - Above Ground
Pit Tap - Below Ground
Public Stand Post
The Institute of Health Systems , HACA Bhavan, Hyderabad, AP 500004 Page 3 of 74
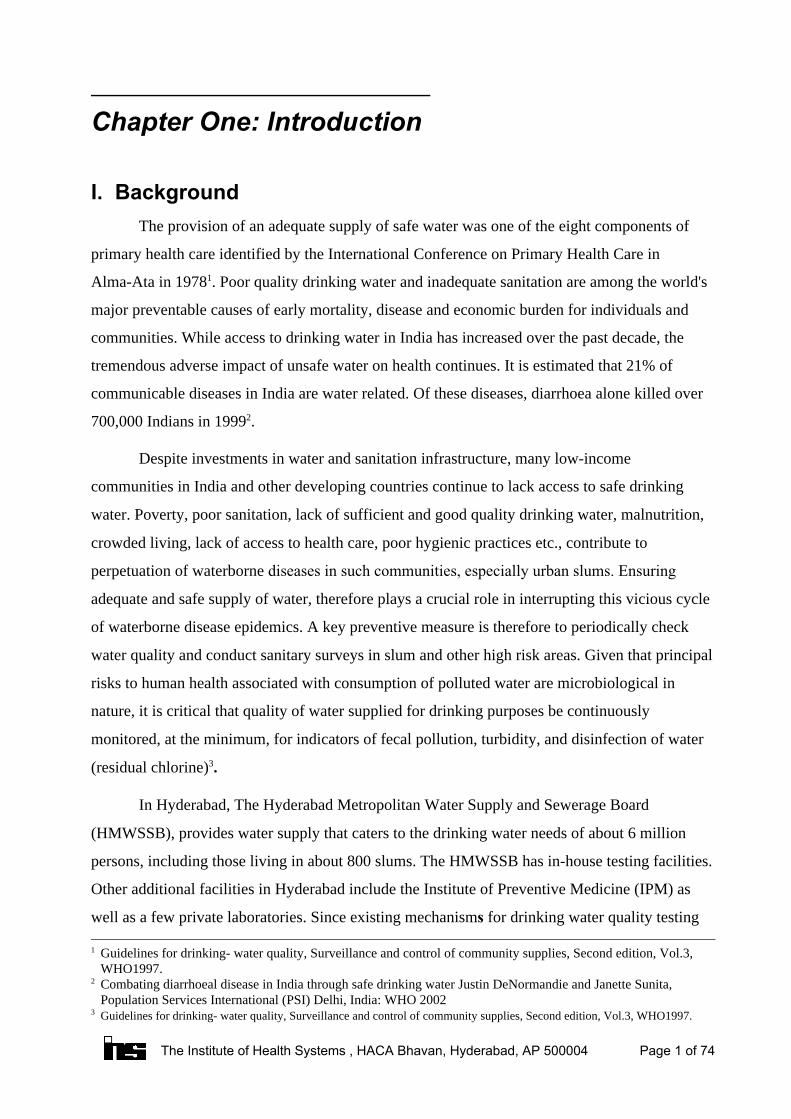
Residual chlorine of piped water supplied by the Board in identified slums were
monitored in each slum. Water samples were collected as per the algorithm in Figure -2. Direct
samples were collected from (a) All public stand posts (b) All pit taps (c) 5% of the house taps,
which are randomly selected , and (d) if the selected public stand posts and pit taps did not have
water supply on the day of survey, a stored water sample was also collected
Water Sample
Physicochemical Parameters
Within Normal Limits
Yes No
Physico Chemical Analysis is to be
Conducted
Residual Chlorine is Nil
Yes
Likely to becontaminated by Coliform
bacteria. Bacterial analysis is to be
conducted
No
Bacterial Contamination Unlikely
Figure 2: Algorithm followed for conducting water analysis
Residual chlorine was tested, using DPD (N,N-Diethyl paraphenylene diamine), as
recommended by the World Health Organization, at the site itself. If the residual chlorine levels
are within normal limits (0.2 - 0.5 PPM), the water sample is unlikely to be contaminated with
bacteria and hence considered bacteriologically satisfactory for drinking purpose. If the residual
chlorine levels are less than normal limits or the supply is unchlorinated, water could be
bacteriologically contaminated and hence a sample was collected for bacteriological analysis.
Further, even in the presence of satisfactory levels of chlorine, a sample was collected for
bacteriological analysis when the tap is located in very close vicinity to manholes, sewerage
overflows and drainage pipelines. If the general appearance, odour and turbidity of the water was
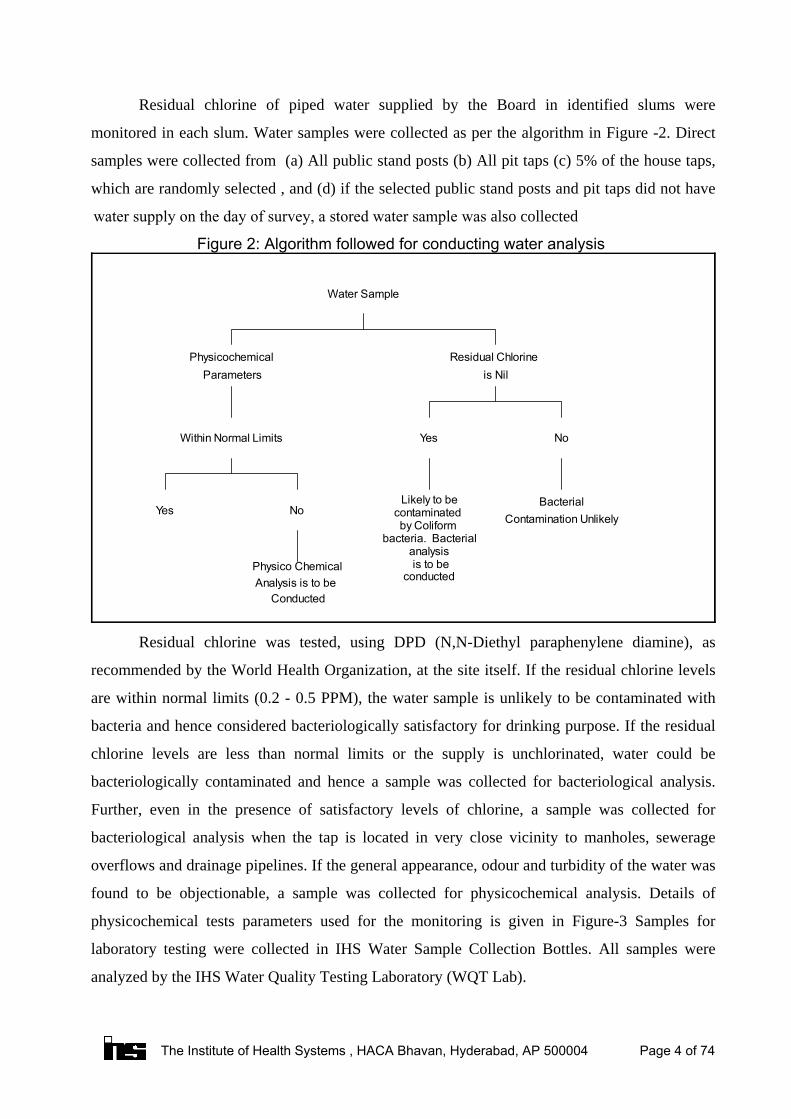
found to be objectionable, a sample was collected for physicochemical analysis. Details of
physicochemical tests parameters used for the monitoring is given in Figure-3 Samples for
laboratory testing were collected in IHS Water Sample Collection Bottles. All samples were
analyzed by the IHS Water Quality Testing Laboratory (WQT Lab).
The Institute of Health Systems , HACA Bhavan, Hyderabad, AP 500004 Page 4 of 74
Physico-Chemical Analysis
Physical Chemical
Parameter Parameter Maximum permisiible limitMaximum permisiible limit
Color 25
Tubidity 10
Odor Unobjectionable
pH at 25 C 6.5 - 8.5
Alkanlinity (as Caco3 ) i. Phenolpthalein Alkalinity (as CaCo3)ii.Total Alkalinity (as Caco3)�
600
Total Hardness (as Caco3) 600
Calcium (as Caco3)
Magnesium (as Caco3)
Ammonia (as N)
Nitrite (as N)
Nitrate (as N)
Chloride (as Cl)
Fluoride (as F)
Sulphates (as So4)
200
100NilNil
100
1,000
1.5
400
o
Electrical Conductivity 1,500 ( Siemens) at 25 C o
( All the results are expressed in mg/litre)
Figure-3: Physical and Chemical Parameters for Drinking Water Quality Monitoringand their Maximum Permissible Limits
In addition to RC test results, the IHS personnel also record their observations pertaining
to any circumstances at the slum site that could have an impact on water quality, such as: leakage
of the tap, damage of the sewerage pipelines, cross connections with sewerage pipes, cracked or
eroded tap stand, presence of open defecation in the near vicinity, presence of farm animals or
industrial pollution.
2. Monitoring Quality of Bore-well or Hand-pump Water
Water samples are collected from the functional hand pumps and bore wells utilized by
residents for drinking and other domestic purposes, in and around the selected slums. Samples
are tested for bacteriological quality and physiochemical parameters like color, odor, taste,
turbidity, PH , conductivity, TDS, total hardness, estimation of dissolved mineral contents like
fluoride, calcium, magnesium ,and natural pollutants like nitrites, nitrates, ammonia and
sulphates.
The Institute of Health Systems , HACA Bhavan, Hyderabad, AP 500004 Page 5 of 74
3. Monitoring Quality of Water Supplied by Hotels and Street Vendors
Water samples are collected from hotels, permanent eateries, street vendors,etc.,
operating in and around the selected slums. Samples are tested for bacteriological quality and all
samples for physiochemical parameters like color, odor, taste, turbidity, PH , conductivity, TDS,
total hardness, estimation of dissolved mineral contents like fluoride, calcium, magnesium ,and
natural pollutants like nitrites, nitrates, ammonia and sulphates. Results are communicated to the
Board and the respective establishments.
4. Sanitary Surveys and Monitoring of Sewerage Overflows
Sanitary survey of the piped water lines was done during the residual chlorine
monitoring. Factors like eroded or cracked over head tank , logged tap stand, leakage in the
pipeline, sewerage line, crisis crossing of sewerage lines, presence of fecal matter adjacent to the
tap stand, etc., were identified. An ‘on-site inspection is done by IHS personnel to identify any
sewerage overflows in the selected slums. The Board is notified of all such sewerage overflows,
with exact address. When the overflows are from within houses, respective households are
informed of their potential health hazards. The status of these overflows is followed up during
repeat visits.
5. Enumeration of Health Care Providers
During the field visits IHS personnel enumerate health care providers in and around the
slums. The personnel also interact with them to enquire whether any increase in incidence of
gastroenteritis was observed among their patients.
6. Empowering Slum Residents for Prevention of Water Borne Diseases.
IHS personnel conduct the Focus Group Discussions in selected slums where the RC is
monitored for a regular period of time, after informing the residents well in advance. During
these discussions the residents are informed about the potential health hazards such as pit taps,
sewerage outflows, unsanitary surroundings etc., and educated about good hygiene practices and
measures to prevent water contamination. The discussions also serve to get feedback from the
community regarding quantity and quality of water supplied, storage and handling practices,
sewerage system, awareness and their awareness regarding prevention of water borne infections.
The residents are also informed of whom to contact when there is a problem with water supply or
sewerage system.
The Institute of Health Systems , HACA Bhavan, Hyderabad, AP 500004 Page 6 of 74
V. Periodicity of ReportingThe test results are communicated to the Board daily. In addition consolidated weekly,
monthly and annual reports are also submitted to the Board. This summary report pertains to the
test results and other findings for the period between March 2006 and March 2007.
References1. Public- Private Partnership: Water Quality Monitoring in Urban slums of Hyderabad, Report
2005-06, Institute of Health Systems, Hyderabad
2. Justin DeNormandie and Janette Sunita. Combating diarrhoeal disease in India through safe
drinking water, Population Services International (PSI) Delhi, India
3. Water Safety Plans: Managing drinking-water quality from catchment to consumer. World
Health Organization, Geneva, 2005.
4. Guidelines for drinking- water quality, Surveillance and control of community supplies,
Second edition, Vol.3, World Health Organization, Geneva, 1997
5. Guidelines for drinking- water quality, Health criteria and other supporting information,
Second edition, Vol.2. World Health Organization, Geneva, 1997
The Institute of Health Systems , HACA Bhavan, Hyderabad, AP 500004 Page 7 of 74
Chapter Two: Results and Findings
I. Monitoring at Reservoir PointsA. Residual Chlorine Test Results
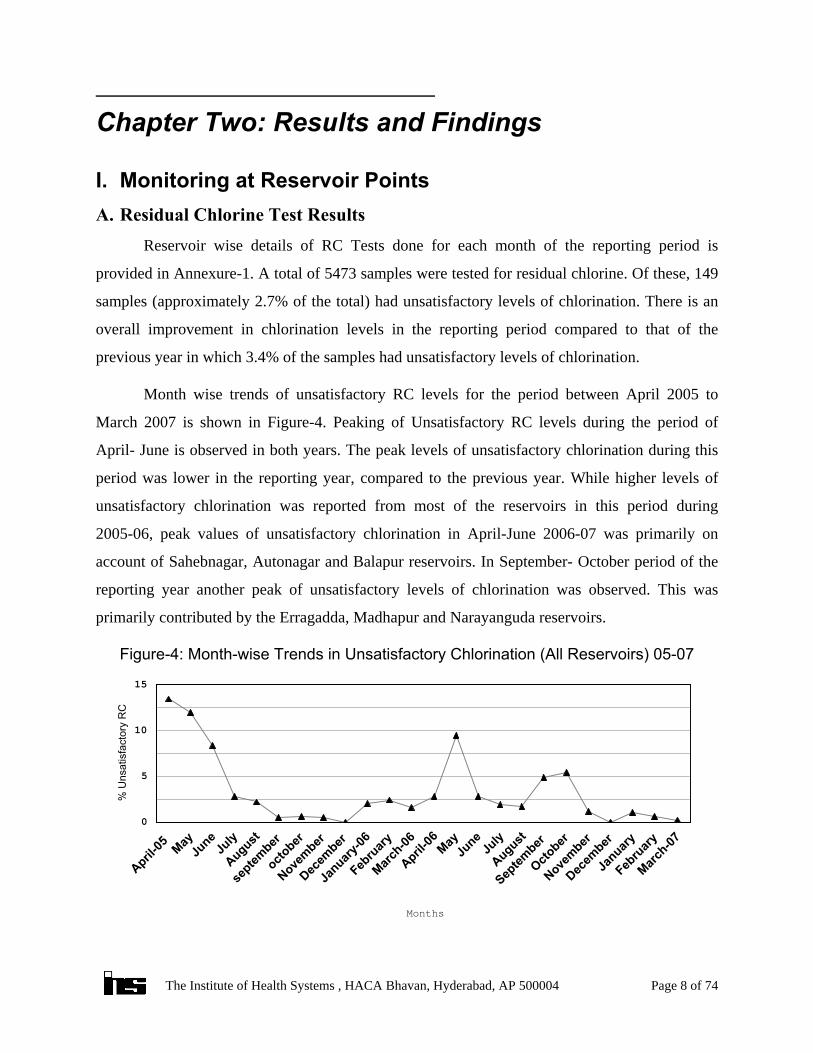
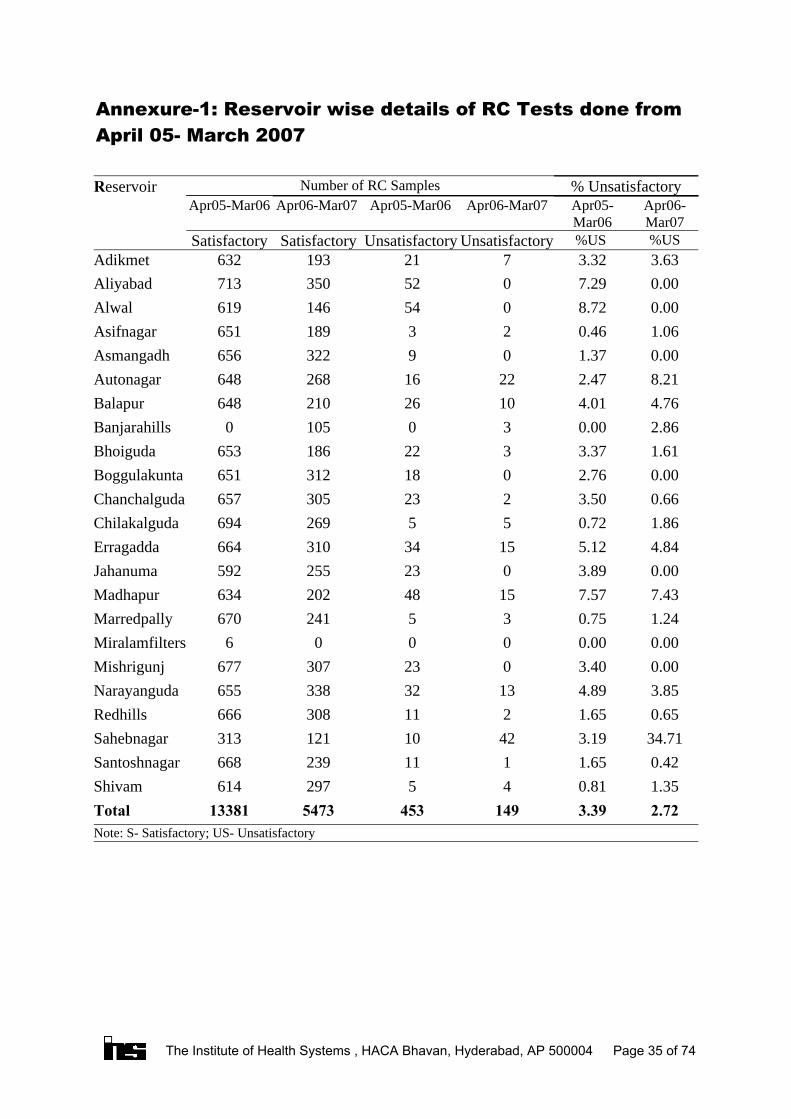
Reservoir wise details of RC Tests done for each month of the reporting period is
provided in Annexure-1. A total of 5473 samples were tested for residual chlorine. Of these, 149
samples (approximately 2.7% of the total) had unsatisfactory levels of chlorination. There is an
overall improvement in chlorination levels in the reporting period compared to that of the
previous year in which 3.4% of the samples had unsatisfactory levels of chlorination.
Month wise trends of unsatisfactory RC levels for the period between April 2005 to
March 2007 is shown in Figure-4. Peaking of Unsatisfactory RC levels during the period of
April- June is observed in both years. The peak levels of unsatisfactory chlorination during this
period was lower in the reporting year, compared to the previous year. While higher levels of
unsatisfactory chlorination was reported from most of the reservoirs in this period during
2005-06, peak values of unsatisfactory chlorination in April-June 2006-07 was primarily on
account of Sahebnagar, Autonagar and Balapur reservoirs. In September- October period of the
reporting year another peak of unsatisfactory levels of chlorination was observed. This was
primarily contributed by the Erragadda, Madhapur and Narayanguda reservoirs.
April-05 May
June
July
August
septem
ber
october
November
Decem
ber
January
-06
February
March-06
April-06 May
June
July
August
Septem
ber
October
November
Decem
ber
January
February
March-07
Months
0
5
10
15
% U
nsat
isfa
ctor
y R
C
Figure-4: Month-wise Trends in Unsatisfactory Chlorination (All Reservoirs) 05-07
The Institute of Health Systems , HACA Bhavan, Hyderabad, AP 500004 Page 8 of 74
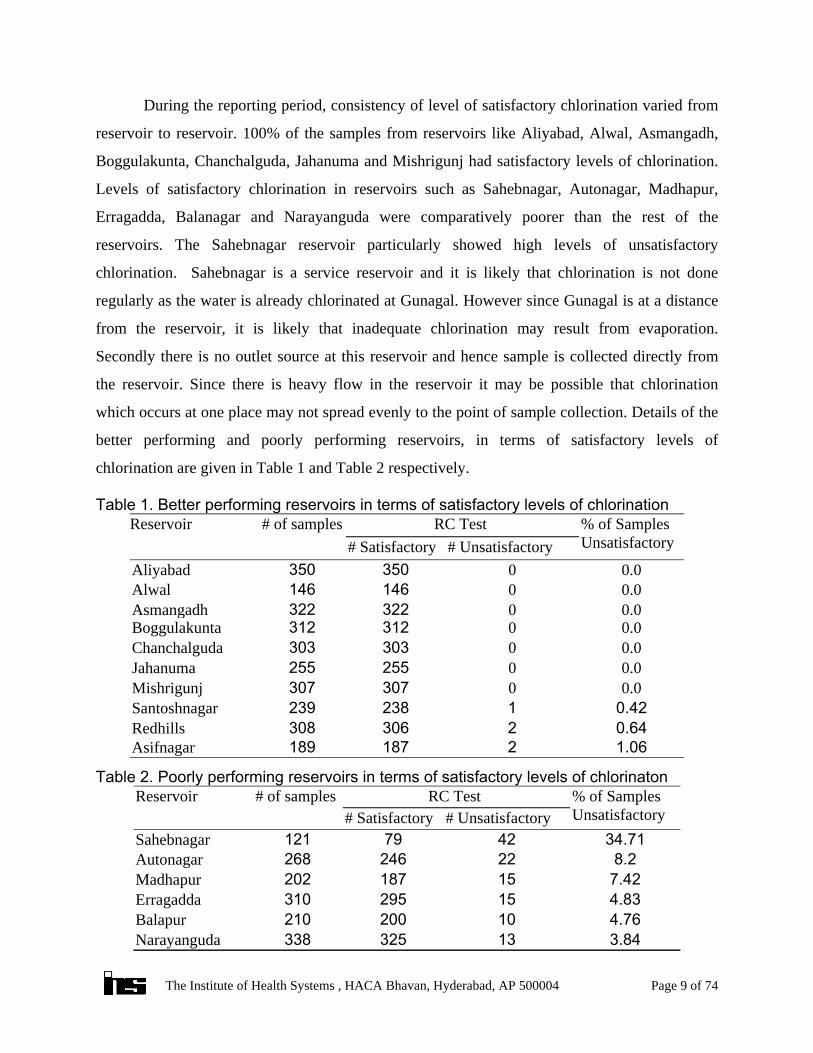
During the reporting period, consistency of level of satisfactory chlorination varied from
reservoir to reservoir. 100% of the samples from reservoirs like Aliyabad, Alwal, Asmangadh,
Boggulakunta, Chanchalguda, Jahanuma and Mishrigunj had satisfactory levels of chlorination.
Levels of satisfactory chlorination in reservoirs such as Sahebnagar, Autonagar, Madhapur,
Erragadda, Balanagar and Narayanguda were comparatively poorer than the rest of the
reservoirs. The Sahebnagar reservoir particularly showed high levels of unsatisfactory
chlorination. Sahebnagar is a service reservoir and it is likely that chlorination is not done
regularly as the water is already chlorinated at Gunagal. However since Gunagal is at a distance
from the reservoir, it is likely that inadequate chlorination may result from evaporation.
Secondly there is no outlet source at this reservoir and hence sample is collected directly from
the reservoir. Since there is heavy flow in the reservoir it may be possible that chlorination
which occurs at one place may not spread evenly to the point of sample collection. Details of the
better performing and poorly performing reservoirs, in terms of satisfactory levels of
chlorination are given in Table 1 and Table 2 respectively.
Table 1. Better performing reservoirs in terms of satisfactory levels of chlorination
1.062187189Asifnagar0.642306308Redhills0.421238239Santoshnagar0.00307307Mishrigunj0.00255255Jahanuma0.00303303Chanchalguda0.00312312Boggulakunta0.00322322Asmangadh0.00146146Alwal0.00350350Aliyabad
# Unsatisfactory# Satisfactory% of SamplesUnsatisfactory
RC Test # of samplesReservoir
Table 2. Poorly performing reservoirs in terms of satisfactory levels of chlorinaton
3.8413325338Narayanguda4.7610200210Balapur4.8315295310Erragadda7.4215187202Madhapur8.222246268Autonagar
34.714279121Sahebnagar# Unsatisfactory# Satisfactory
% of SamplesUnsatisfactory
RC Test # of samples Reservoir
The Institute of Health Systems , HACA Bhavan, Hyderabad, AP 500004 Page 9 of 74
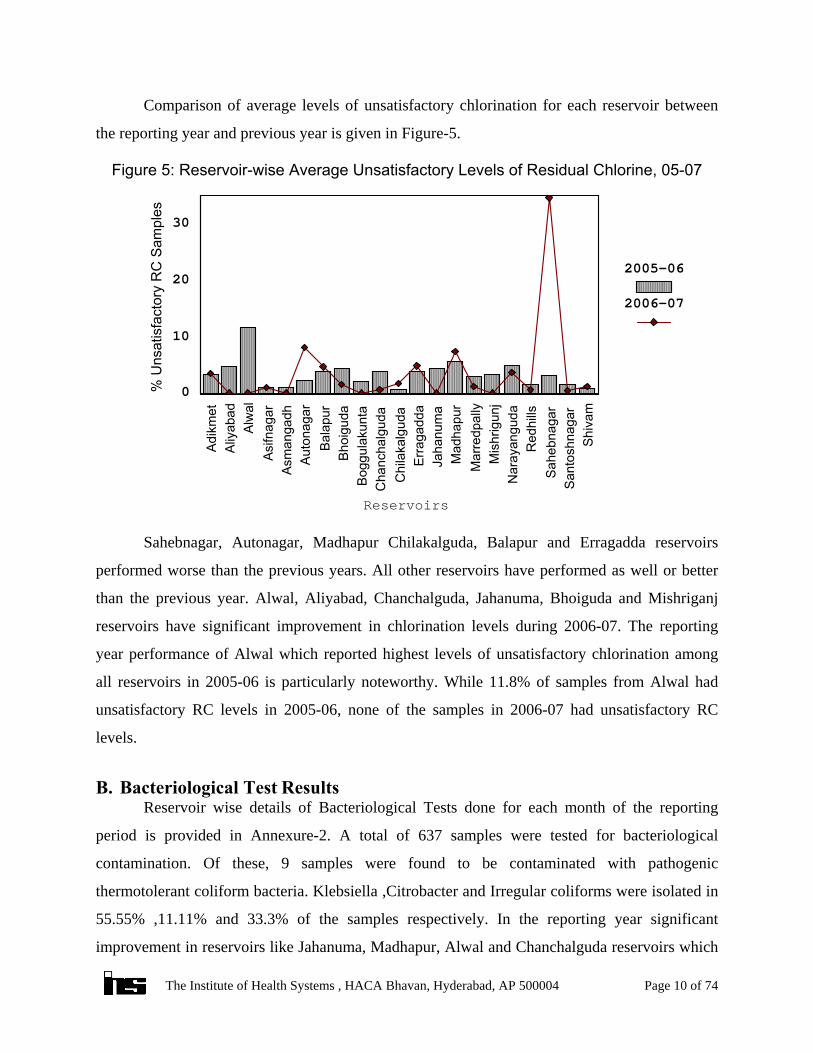
Comparison of average levels of unsatisfactory chlorination for each reservoir between
the reporting year and previous year is given in Figure-5.
��������������
��������������
������������������������������������������ �������
��������������
��������������
��������������
��������������
���������������������
��������������
��������������
���������������������
��������������
��������������
����������������������������
��������������������� �������
Adik
met
Aliy
abad
Alw
alAs
ifnag
arAs
man
gadh
Auto
naga
rBa
lapu
rBh
oigu
daBo
ggul
akun
taC
hanc
halg
uda
Chi
laka
lgud
aEr
raga
dda
Jaha
num
aM
adha
pur
Mar
redp
ally
Mis
hrig
unj
Nar
ayan
guda
Red
hills
Sahe
bnag
arSa
ntos
hnag
arSh
ivam
Reservoirs
0
10
20
30
% U
nsat
isfa
ctor
y R
C S
ampl
es
������������������������������
2005-06
2006-07
Figure 5: Reservoir-wise Average Unsatisfactory Levels of Residual Chlorine, 05-07
Sahebnagar, Autonagar, Madhapur Chilakalguda, Balapur and Erragadda reservoirs
performed worse than the previous years. All other reservoirs have performed as well or better
than the previous year. Alwal, Aliyabad, Chanchalguda, Jahanuma, Bhoiguda and Mishriganj
reservoirs have significant improvement in chlorination levels during 2006-07. The reporting
year performance of Alwal which reported highest levels of unsatisfactory chlorination among
all reservoirs in 2005-06 is particularly noteworthy. While 11.8% of samples from Alwal had
unsatisfactory RC levels in 2005-06, none of the samples in 2006-07 had unsatisfactory RC
levels.
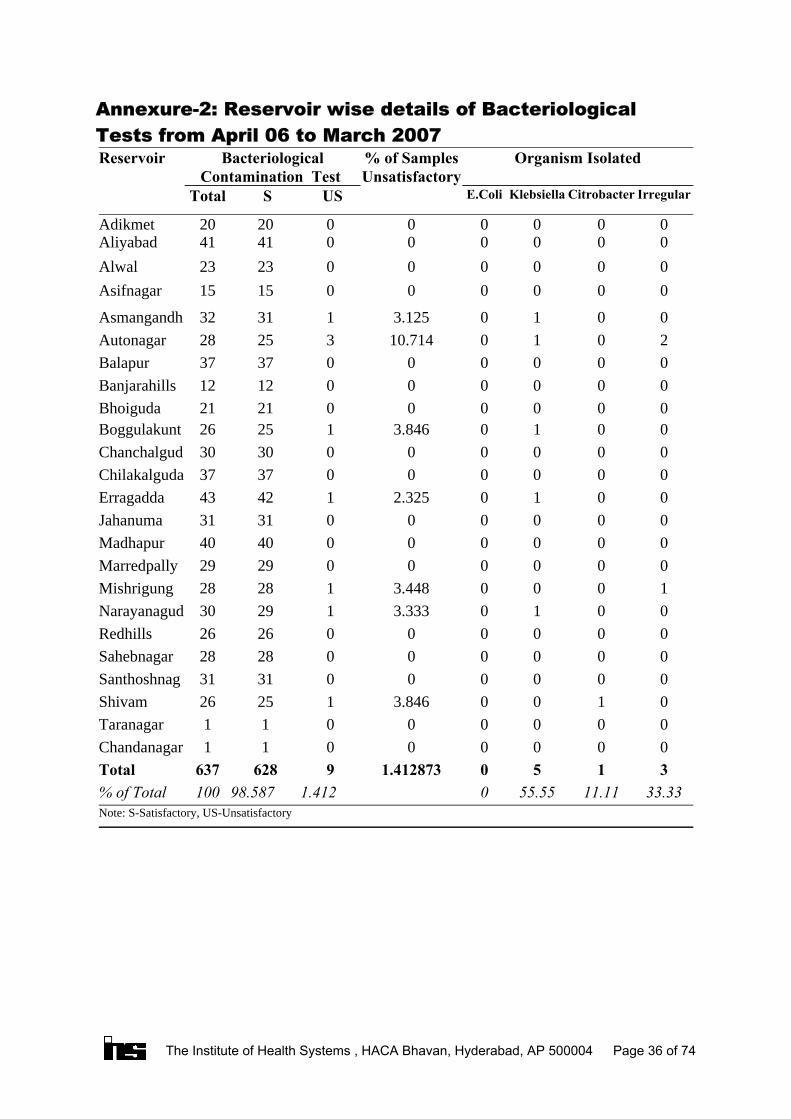
B. Bacteriological Test ResultsReservoir wise details of Bacteriological Tests done for each month of the reporting
period is provided in Annexure-2. A total of 637 samples were tested for bacteriological
contamination. Of these, 9 samples were found to be contaminated with pathogenic
thermotolerant coliform bacteria. Klebsiella ,Citrobacter and Irregular coliforms were isolated in
55.55% ,11.11% and 33.3% of the samples respectively. In the reporting year significant
improvement in reservoirs like Jahanuma, Madhapur, Alwal and Chanchalguda reservoirs which
The Institute of Health Systems , HACA Bhavan, Hyderabad, AP 500004 Page 10 of 74

had comparatively higher prevalence of bacteriological contamination in the previous year was
observed. E-Coli, a major indicator organism of faecal pollution was not detected this year.
Table 3: Bacteriological Contamination in Reservoirs 2006-07
33.311.1155.5According to Organism in %
0012.3314243Erragadda
0013.1313132Asmangandh
0013.3312930Narayanaguda
1003.4512829Mishrigung
0013.8512526Boggulakunta
0103.8612526Shivam
20110.7132528Autonagar
Irregular
CitrobacterKlebsiella
UnsatisfactorySatisfactoryTotal
Organism Isolated% SamplesUnsatisfactory
Samples for Bacteriological TestingReservoir
C. Physico-Chemical Analysis ResultsA total of 359 samples were tested for physico-chemical analysis from each reservoir
from different source points. Of these 17 samples were from Public Stand Post, 13 from Pump,
139 from Tap, 119 from Tankers, 10 from Booster, 4 from Tanker Filling Point and 3 directly
from the reservoir. Details of Physico-chemical tests done is given in Figure-3. All the samples
tested had were within the permissible range.
The Institute of Health Systems , HACA Bhavan, Hyderabad, AP 500004 Page 11 of 74
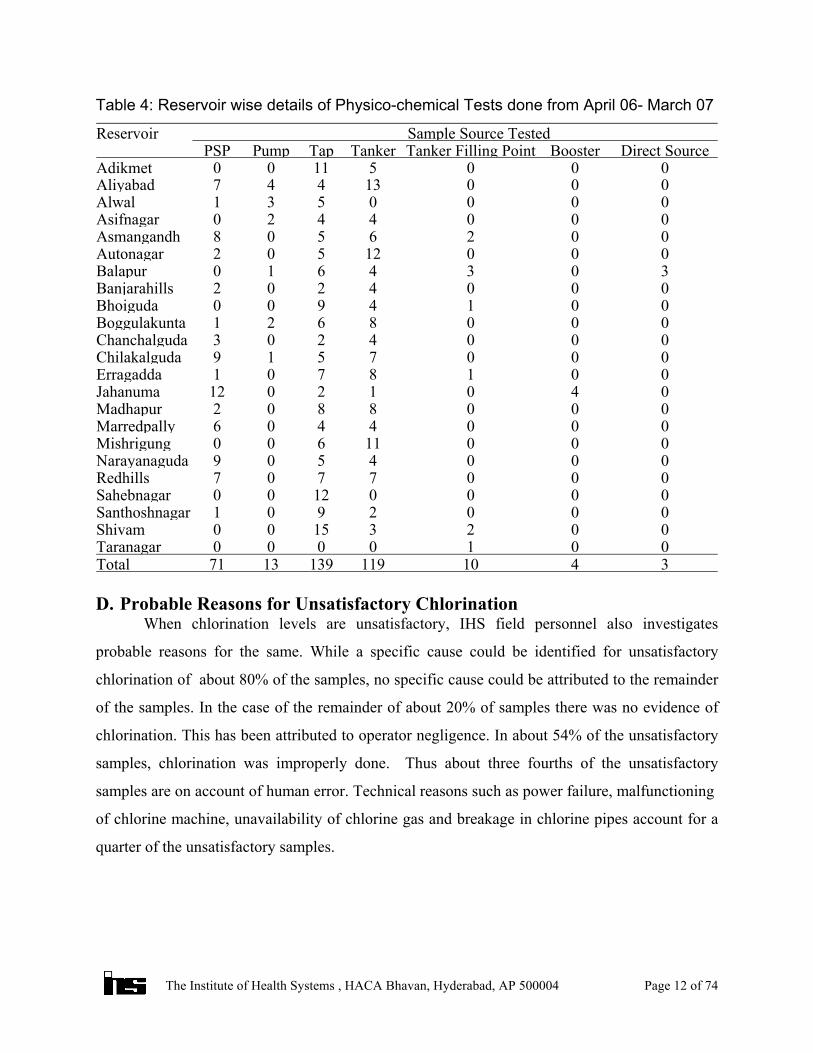
Table 4: Reservoir wise details of Physico-chemical Tests done from April 06- March 07
34101191391371Total0010000Taranagar00231500Shivam0002901Santhoshnagar00001200Sahebnagar0007707Redhills0004509Narayanaguda00011600Mishrigung0004406Marredpally0008802Madhapur04012012Jahanuma0018701Erragadda0007519Chilakalguda0004203Chanchalguda0008621Boggulakunta0014900Bhoiguda0004202Banjarahills3034610Balapur00012502Autonagar0026508Asmangandh0004420Asifnagar0000531Alwal00013447Aliyabad00051100Adikmet
Direct SourceBoosterTanker Filling PointTankerTapPumpPSPSample Source TestedReservoir
D. Probable Reasons for Unsatisfactory ChlorinationWhen chlorination levels are unsatisfactory, IHS field personnel also investigates
probable reasons for the same. While a specific cause could be identified for unsatisfactory
chlorination of about 80% of the samples, no specific cause could be attributed to the remainder
of the samples. In the case of the remainder of about 20% of samples there was no evidence of
chlorination. This has been attributed to operator negligence. In about 54% of the unsatisfactory
samples, chlorination was improperly done. Thus about three fourths of the unsatisfactory
samples are on account of human error. Technical reasons such as power failure, malfunctioning
of chlorine machine, unavailability of chlorine gas and breakage in chlorine pipes account for a
quarter of the unsatisfactory samples.
The Institute of Health Systems , HACA Bhavan, Hyderabad, AP 500004 Page 12 of 74
ckgeorge
Sticky Note
Marked set by ckgeorge
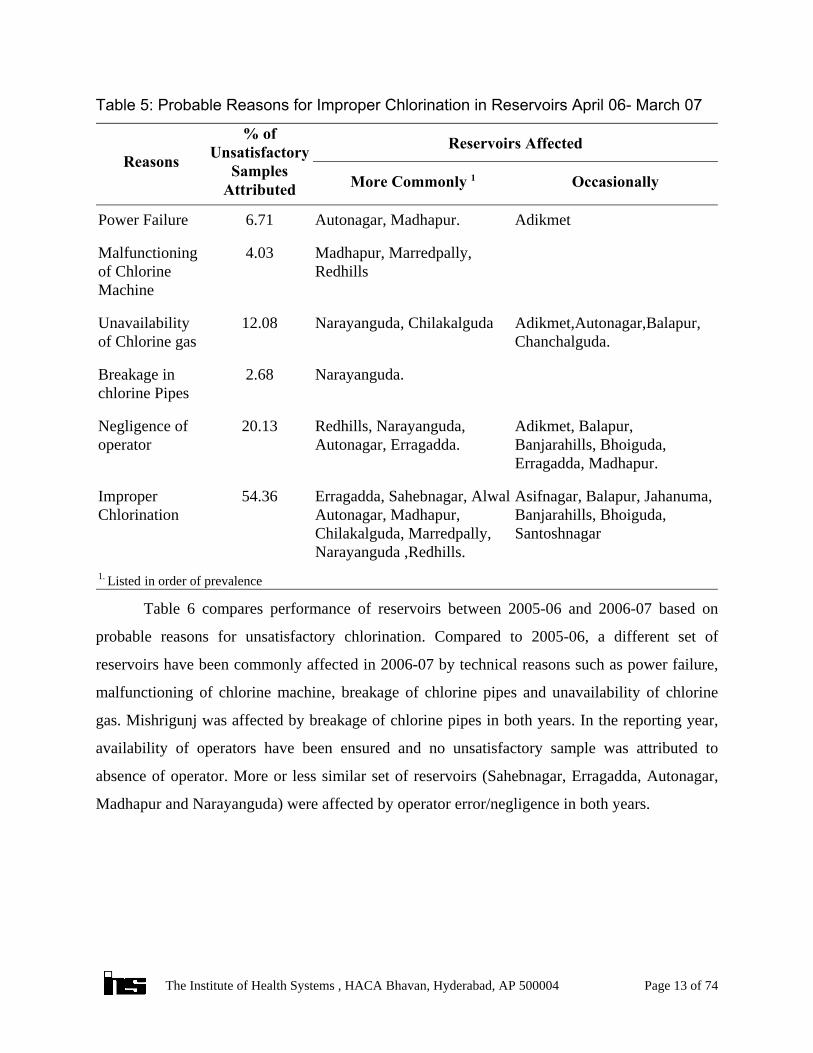
Table 5: Probable Reasons for Improper Chlorination in Reservoirs April 06- March 07
1. Listed in order of prevalence
Asifnagar, Balapur, Jahanuma,Banjarahills, Bhoiguda,Santoshnagar
Erragadda, Sahebnagar, AlwalAutonagar, Madhapur,Chilakalguda, Marredpally,Narayanguda ,Redhills.
54.36ImproperChlorination
Adikmet, Balapur,Banjarahills, Bhoiguda,Erragadda, Madhapur.
Redhills, Narayanguda,Autonagar, Erragadda.
20.13Negligence ofoperator
Narayanguda.2.68Breakage inchlorine Pipes
Adikmet,Autonagar,Balapur,Chanchalguda.
Narayanguda, Chilakalguda12.08Unavailabilityof Chlorine gas
Madhapur, Marredpally,Redhills
4.03Malfunctioningof ChlorineMachine
AdikmetAutonagar, Madhapur.6.71Power Failure
OccasionallyMore Commonly 1
Reservoirs Affected% ofUnsatisfactory
SamplesAttributed
Reasons
Table 6 compares performance of reservoirs between 2005-06 and 2006-07 based on
probable reasons for unsatisfactory chlorination. Compared to 2005-06, a different set of
reservoirs have been commonly affected in 2006-07 by technical reasons such as power failure,
malfunctioning of chlorine machine, breakage of chlorine pipes and unavailability of chlorine
gas. Mishrigunj was affected by breakage of chlorine pipes in both years. In the reporting year,
availability of operators have been ensured and no unsatisfactory sample was attributed to
absence of operator. More or less similar set of reservoirs (Sahebnagar, Erragadda, Autonagar,
Madhapur and Narayanguda) were affected by operator error/negligence in both years.
The Institute of Health Systems , HACA Bhavan, Hyderabad, AP 500004 Page 13 of 74

Table 6: Comparison of Performance of Reservoirs between 2005-06 and 2006-07based on probable reasons for unsatisfactory chlorination
Sahebnagar,Erragadda,Autonagar,Madhapur,Narayanguda
Alwal,Aliyabad,Erragadda, Madhapur,Narayanguda,Sahebnagar, Autonagar
74.564.24Negligence of operator/ ImproperChlorination
AdikmetMisirigunj,Narayanguda.
02.79Absence of operator
NarayangudaMisrigunj2.681.95Breakage in chlorine Pipes
Narayanguda,Erraguda
Aliyabad,Asmangadh, Madhapur.
12.086.69Unavailability of Chlorine gas
Maredpally, Red Hills, Madhapur
Alwal,Asmangadh,Boggulakunta.
4.038.08Malfunctioning of ChlorineMachine
Autonagar Madhapur
Alwal,Balapur,Missirigunj,Madhapur, Jahanuma.
6.7112.26Power Failure2006-072005-062006-072005-06
Reservoirs Commonly Affected% Share of US Samples Reasons
E. Maintenance of Distribution System 1. Residual chlorine levels are required to be monitored on an hourly basis and results recorded
in a log register. It was observed that not much attention was given to proper recording and
maintenance of the log registers in any of the reservoirs.
2. While satisfactory levels of chlorination are generally maintained during community supply
hours, the same is not the case outside this time. However, it has been observed that tankers
and PSP’s present in the reservoir premises were being supplied with water after the regular
supply hours.
3. Distribution networks are especially vulnerable to contamination when the pressure falls,
particularly in the case of intermittent supply. Therefore it is always recommended to clean
the reservoirs twice a year. However, cleaning of reservoirs is not regularly done. Actual date
The Institute of Health Systems , HACA Bhavan, Hyderabad, AP 500004 Page 14 of 74
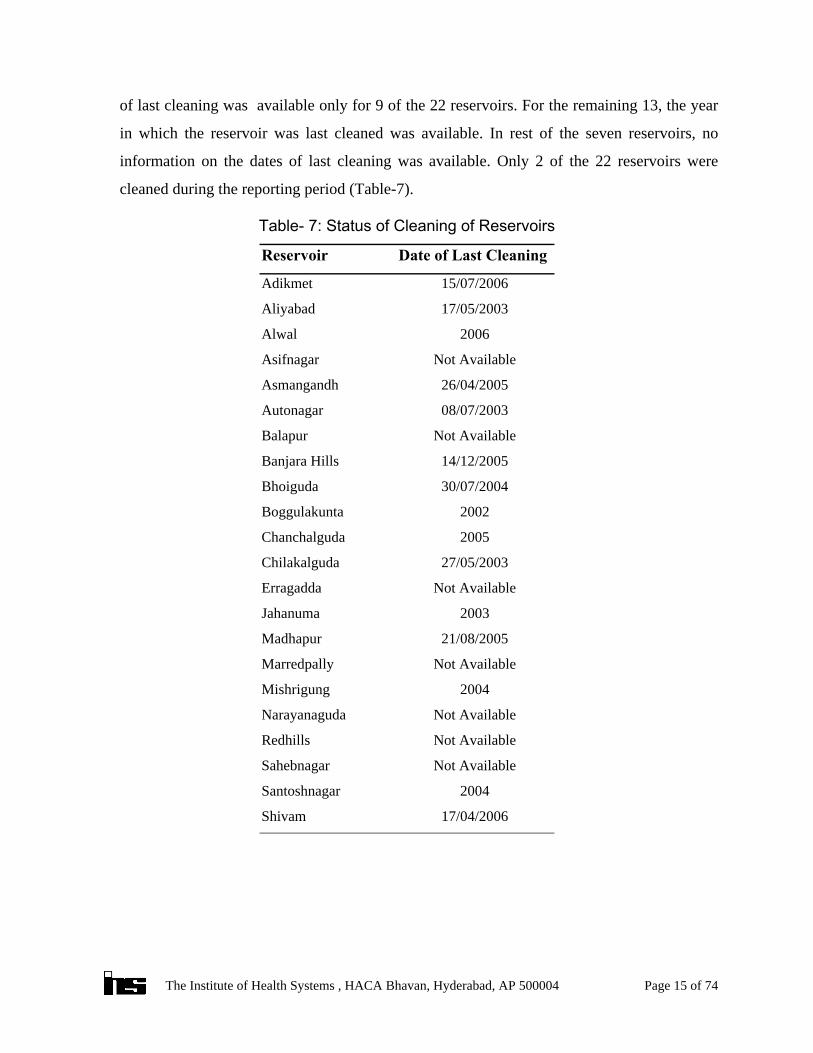
of last cleaning was available only for 9 of the 22 reservoirs. For the remaining 13, the year
in which the reservoir was last cleaned was available. In rest of the seven reservoirs, no
information on the dates of last cleaning was available. Only 2 of the 22 reservoirs were
cleaned during the reporting period (Table-7).
Table- 7: Status of Cleaning of Reservoirs
17/04/2006Shivam
2004Santoshnagar
Not AvailableSahebnagar
Not AvailableRedhills
Not AvailableNarayanaguda
2004Mishrigung
Not AvailableMarredpally
21/08/2005Madhapur
2003Jahanuma
Not AvailableErragadda
27/05/2003Chilakalguda
2005Chanchalguda
2002Boggulakunta
30/07/2004Bhoiguda
14/12/2005Banjara Hills
Not AvailableBalapur
08/07/2003Autonagar
26/04/2005Asmangandh
Not AvailableAsifnagar
2006Alwal
17/05/2003Aliyabad
15/07/2006Adikmet
Date of Last Cleaning Reservoir
The Institute of Health Systems , HACA Bhavan, Hyderabad, AP 500004 Page 15 of 74
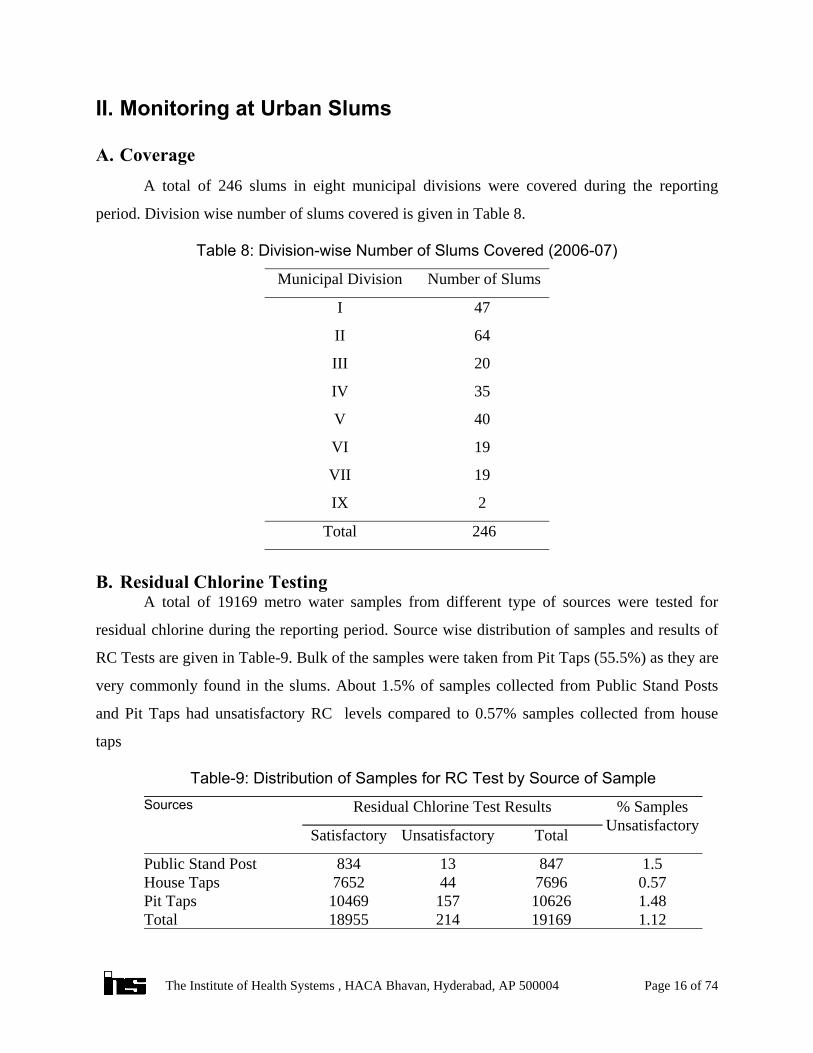
II. Monitoring at Urban Slums
A. CoverageA total of 246 slums in eight municipal divisions were covered during the reporting
period. Division wise number of slums covered is given in Table 8.
Table 8: Division-wise Number of Slums Covered (2006-07)
246Total
2IX
19VII
19VI
40V
35IV
20III
64II
47I
Number of SlumsMunicipal Division
B. Residual Chlorine TestingA total of 19169 metro water samples from different type of sources were tested for
residual chlorine during the reporting period. Source wise distribution of samples and results of
RC Tests are given in Table-9. Bulk of the samples were taken from Pit Taps (55.5%) as they are
very commonly found in the slums. About 1.5% of samples collected from Public Stand Posts
and Pit Taps had unsatisfactory RC levels compared to 0.57% samples collected from house
taps
1.121916921418955Total1.481062615710469Pit Taps0.577696447652House Taps1.584713834Public Stand Post
TotalUnsatisfactorySatisfactory
% SamplesUnsatisfactory
Residual Chlorine Test ResultsSources
Table-9: Distribution of Samples for RC Test by Source of Sample
The Institute of Health Systems , HACA Bhavan, Hyderabad, AP 500004 Page 16 of 74
Overall there has been a significant improvement in chlorination levels in slum areas in
the reporting year, compared to the previous year. In the year 2005-06 about 6.72% of the
samples collected from slums were found to be unsatisfactorily chlorinated, compared to 1.2% in
the reporting year. Slum wise and month wise details of RC Tests done is provided in
Annexure-3. While most slums received water supply with adequate chlorination consistently
some slums fared poorly in terms of satisfactory levels of chlorination. These include Baggi
Khana, Amber Nagar, Madannapet Mandi and Mader basthi slums. Unsatisfactory chlorination in the
distribution system at slums may be on account of improper chlorination at the reservoir level or
pollution at the local level. Possible causes for unsatisfactory chlorination have been identified
division-wise in Annexure-4.
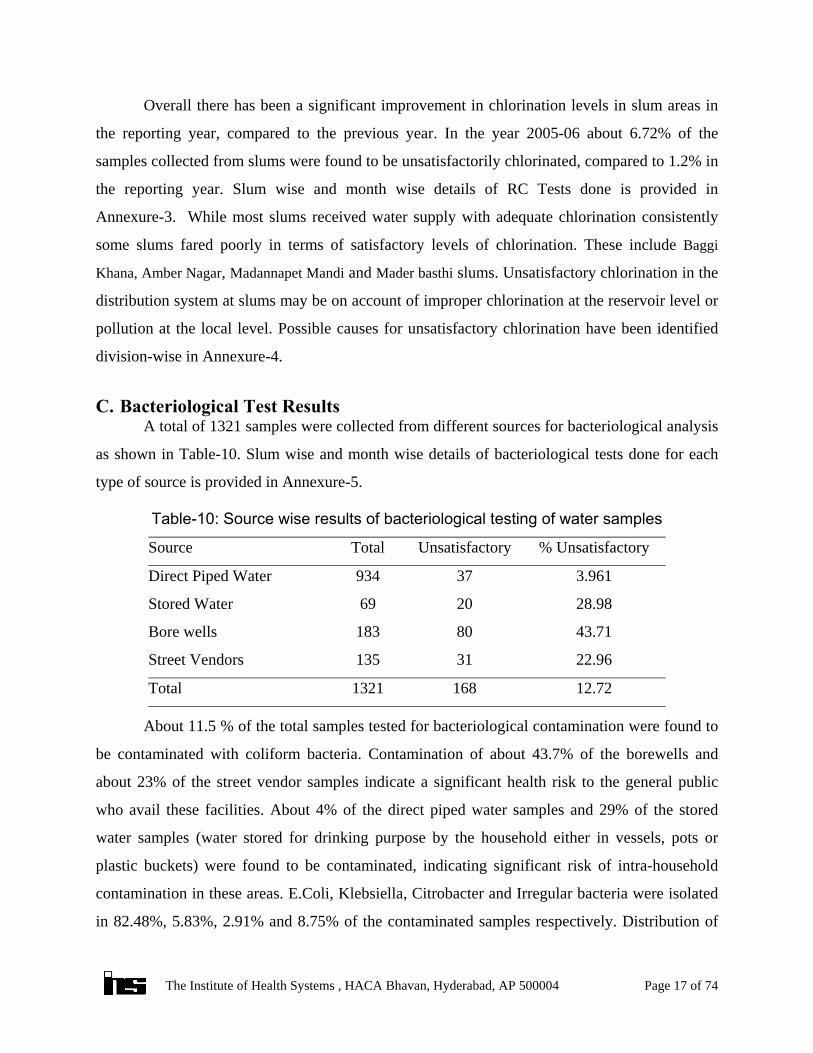
C. Bacteriological Test Results A total of 1321 samples were collected from different sources for bacteriological analysis
as shown in Table-10. Slum wise and month wise details of bacteriological tests done for each
type of source is provided in Annexure-5.
12.721681321Total
22.9631135Street Vendors
43.7180183Bore wells
28.982069Stored Water
3.96137934Direct Piped Water
% UnsatisfactoryUnsatisfactoryTotalSource
Table-10: Source wise results of bacteriological testing of water samples
About 11.5 % of the total samples tested for bacteriological contamination were found to
be contaminated with coliform bacteria. Contamination of about 43.7% of the borewells and
about 23% of the street vendor samples indicate a significant health risk to the general public
who avail these facilities. About 4% of the direct piped water samples and 29% of the stored
water samples (water stored for drinking purpose by the household either in vessels, pots or
plastic buckets) were found to be contaminated, indicating significant risk of intra-household
contamination in these areas. E.Coli, Klebsiella, Citrobacter and Irregular bacteria were isolated
in 82.48%, 5.83%, 2.91% and 8.75% of the contaminated samples respectively. Distribution of
The Institute of Health Systems , HACA Bhavan, Hyderabad, AP 500004 Page 17 of 74
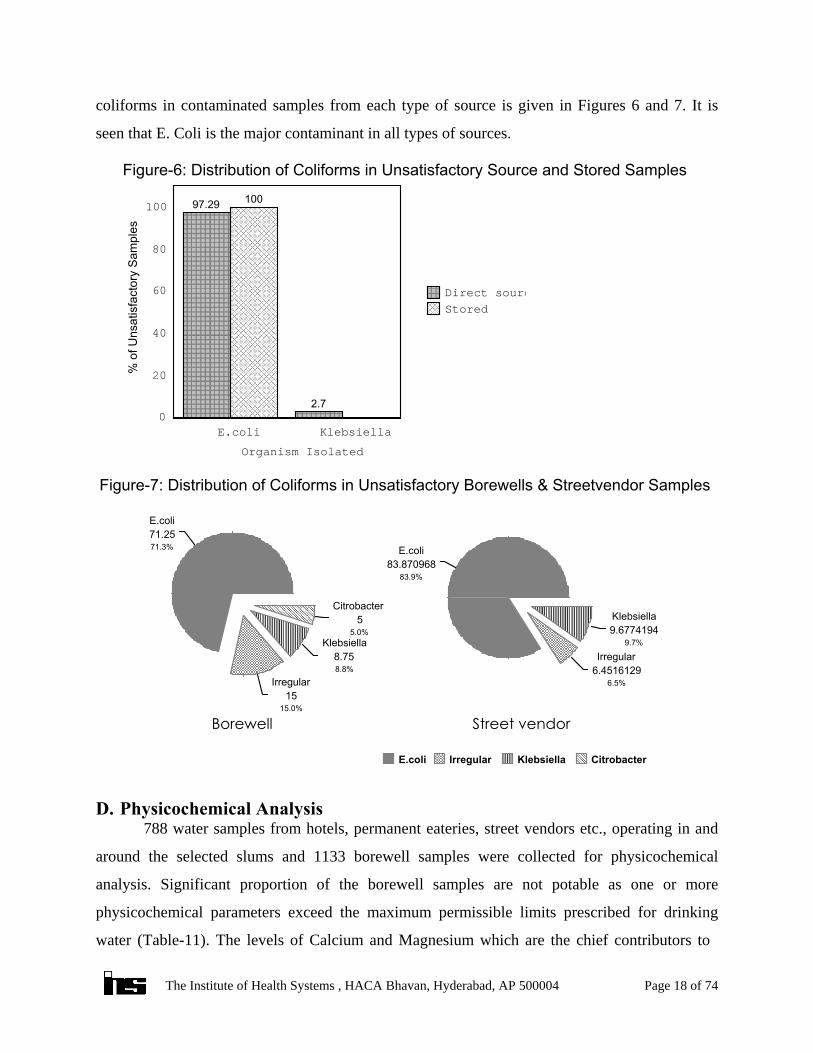
coliforms in contaminated samples from each type of source is given in Figures 6 and 7. It is
seen that E. Coli is the major contaminant in all types of sources.
���������������������������������������������������������������������������������������������������������������������������������������������������������������������������������������������������������������������������������������������������������������������������������������������
��������������������������������������
������������������������������������������������������������������������������������������������������������������������������������������������������������������������������������������������������������������������������������������������������������������������������������������������������������
10097.29
2.7
E.coli Klebsiella
Organism Isolated
0
20
40
60
80
100
% o
f Uns
atis
fact
ory
Sam
ples
����������
Direct sourc����������
Stored
Figure-6: Distribution of Coliforms in Unsatisfactory Source and Stored Samples
��������������������������������������������������
������������������������������������������������������������������������������������������������
��������������������������������������������������������������������������������������������������������������
E.coli71.2571.3%
Irregular15
15.0%
Klebsiella8.758.8%
Citrobacter5
5.0%
Borewell
���������������������������������������������������������������������������
��������������������������������������������������������������������������������
E.coli83.870968
83.9%
Irregular6.4516129
6.5%
Klebsiella9.6774194
9.7%
Street vendor
E.coli�����
Irregular�����
Klebsiella�����
Citrobacter
Figure-7: Distribution of Coliforms in Unsatisfactory Borewells & Streetvendor Samples
D. Physicochemical Analysis788 water samples from hotels, permanent eateries, street vendors etc., operating in and
around the selected slums and 1133 borewell samples were collected for physicochemical
analysis. Significant proportion of the borewell samples are not potable as one or more
physicochemical parameters exceed the maximum permissible limits prescribed for drinking
water (Table-11). The levels of Calcium and Magnesium which are the chief contributors to
The Institute of Health Systems , HACA Bhavan, Hyderabad, AP 500004 Page 18 of 74
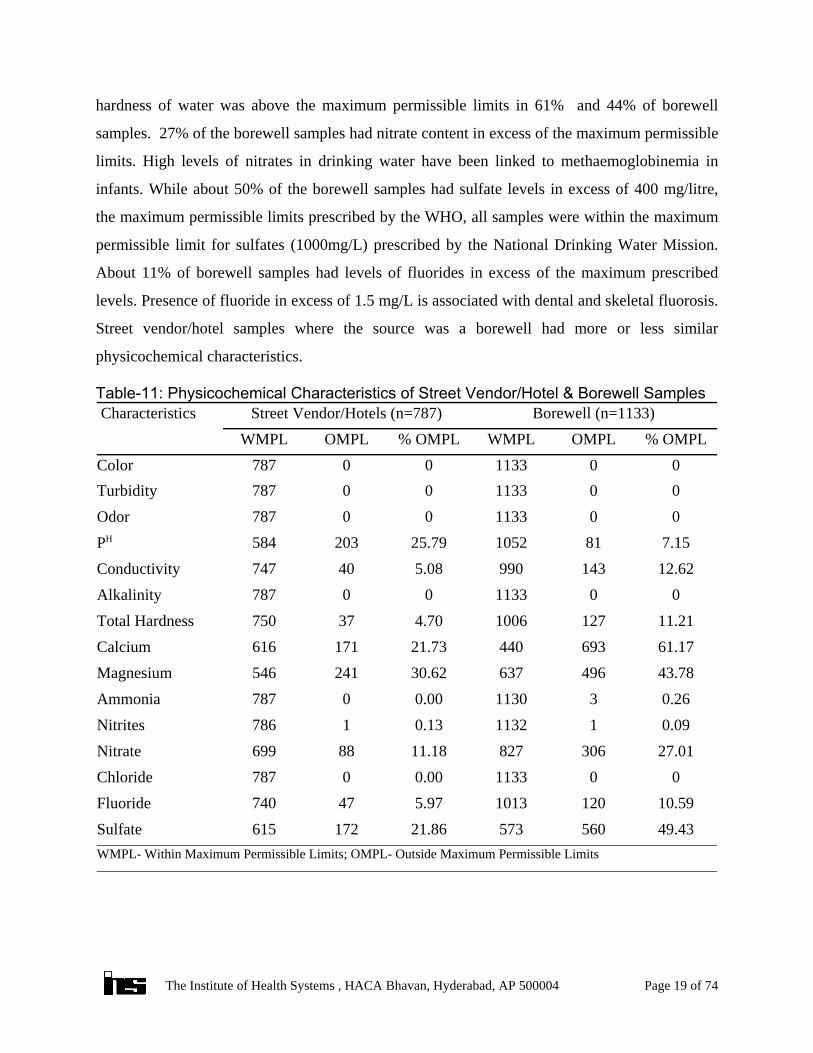
hardness of water was above the maximum permissible limits in 61% and 44% of borewell
samples. 27% of the borewell samples had nitrate content in excess of the maximum permissible
limits. High levels of nitrates in drinking water have been linked to methaemoglobinemia in
infants. While about 50% of the borewell samples had sulfate levels in excess of 400 mg/litre,
the maximum permissible limits prescribed by the WHO, all samples were within the maximum
permissible limit for sulfates (1000mg/L) prescribed by the National Drinking Water Mission.
About 11% of borewell samples had levels of fluorides in excess of the maximum prescribed
levels. Presence of fluoride in excess of 1.5 mg/L is associated with dental and skeletal fluorosis.
Street vendor/hotel samples where the source was a borewell had more or less similar
physicochemical characteristics.
Table-11: Physicochemical Characteristics of Street Vendor/Hotel & Borewell Samples
WMPL- Within Maximum Permissible Limits; OMPL- Outside Maximum Permissible Limits
49.4356057321.86172615Sulfate10.5912010135.9747740Fluoride
0011330.000787Chloride27.0130682711.1888699Nitrate0.09111320.131786Nitrites0.26311300.000787Ammonia43.7849663730.62241546Magnesium61.1769344021.73171616Calcium11.2112710064.7037750Total Hardness
00113300787Alkalinity12.621439905.0840747Conductivity7.1581105225.79203584PH
00113300787Odor00113300787Turbidity00113300787Color
% OMPLOMPLWMPL% OMPLOMPLWMPLBorewell (n=1133)Street Vendor/Hotels (n=787) Characteristics
The Institute of Health Systems , HACA Bhavan, Hyderabad, AP 500004 Page 19 of 74
E. Monitoring Sewerage OverflowsSewerage overflows from manholes, household drainage pipes, drainage pipes of the
Metro Board, open sewerage drains, storm drains etc., were observed in slums. 175 instances of
sewerage overflows were identified during the reporting period (Annex-6). Sewerage overflows
were reported in higher numbers from Divisions I, II, 1V and V especially during monsoon
season. More instances of sewerage overflows were identified in Gowlipura (25), Sultanshahi
(23) and Yakutpura (14) slums. These slums reported more number of overflows in the previous
years also. The Board was notified of all such sewerage overflows, with exact address. When the
overflows were from within houses, respective households are informed of their potential health
hazards. The status these overflows was followed up during repeat visits. In most instances, it
was observed that sewerage overflows were rectified following communication to the Board. In
some instances, where the sewerage overflow posed a significant public health risk, the matter
was taken up directly with higher Board officials.
F. Enumeration of Health Care ProvidersDuring the field visits IHS personnel interact with medical practitioners working in and
around the slums to ascertain whether there has been any reported cases of gastroenteritis. The
medical practitioners are requested to provide clients with information regarding good hygiene
practices and measures to prevent water borne diseases. Support of 27 health care practitioners
was enlisted during the reporting period. (See Annex-7 for details). The local health care
practitioners are generally responsive and interested in participating in the awareness programs
conducted by the NGO’s. They are willing to distribute chlorine liquid or tablets to their patients
if the necessary supplies are provided to them.
G. Empowering Slum Residents for Prevention of Water Borne DiseasesEffective and sustainable programmes for water safery require the active support of local
communities, who should be involved at all stages in such programmes including initial surveys;
monitoring and surveillance of water supplies; reporting faults, carrying out maintenance and
taking remedial action; and supportive actions including sanitation and hygiene practices. Focus
Group Discussions were conducted in slum areas monitored for daily RC by the IHS field staff,
to get feedback and provide information on water quality, water use practices, hygiene practices
The Institute of Health Systems , HACA Bhavan, Hyderabad, AP 500004 Page 20 of 74
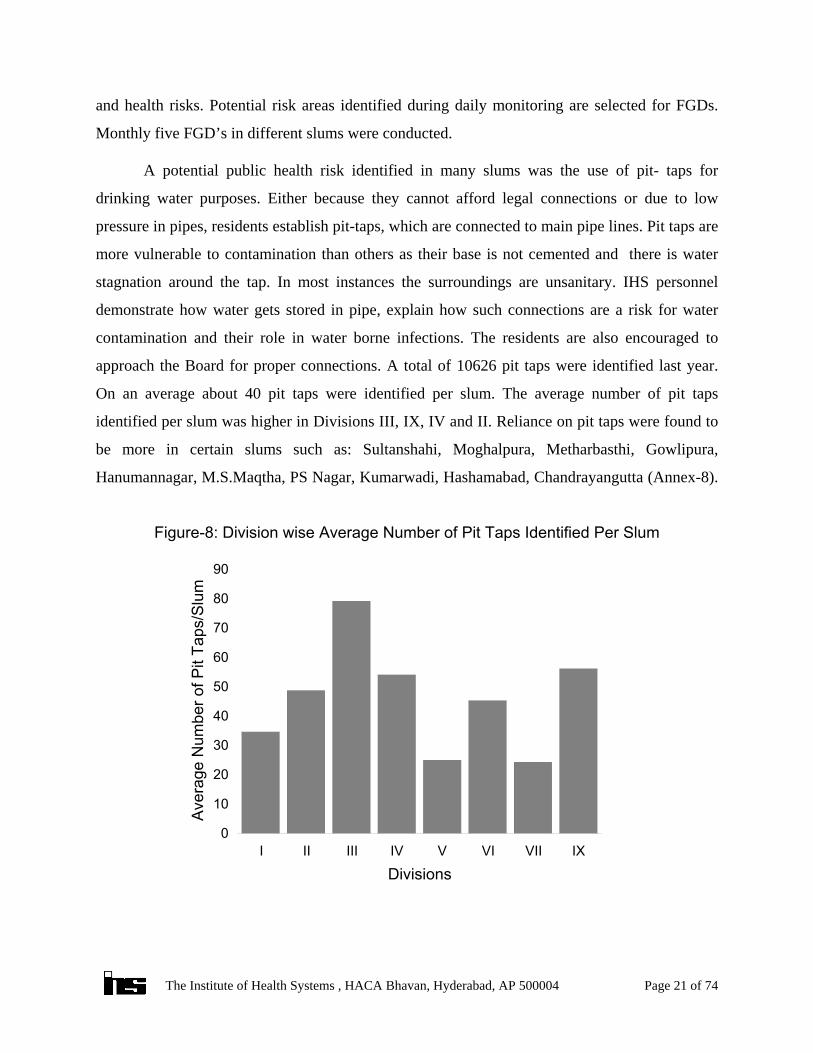
and health risks. Potential risk areas identified during daily monitoring are selected for FGDs.
Monthly five FGD’s in different slums were conducted.
A potential public health risk identified in many slums was the use of pit- taps for
drinking water purposes. Either because they cannot afford legal connections or due to low
pressure in pipes, residents establish pit-taps, which are connected to main pipe lines. Pit taps are
more vulnerable to contamination than others as their base is not cemented and there is water
stagnation around the tap. In most instances the surroundings are unsanitary. IHS personnel
demonstrate how water gets stored in pipe, explain how such connections are a risk for water
contamination and their role in water borne infections. The residents are also encouraged to
approach the Board for proper connections. A total of 10626 pit taps were identified last year.
On an average about 40 pit taps were identified per slum. The average number of pit taps
identified per slum was higher in Divisions III, IX, IV and II. Reliance on pit taps were found to
be more in certain slums such as: Sultanshahi, Moghalpura, Metharbasthi, Gowlipura,
Hanumannagar, M.S.Maqtha, PS Nagar, Kumarwadi, Hashamabad, Chandrayangutta (Annex-8).
I II III IV V VI VII IX
Divisions
0
10
20
30
40
50
60
70
80
90
Aver
age
Num
ber o
f Pit
Taps
/Slu
m
Figure-8: Division wise Average Number of Pit Taps Identified Per Slum
The Institute of Health Systems , HACA Bhavan, Hyderabad, AP 500004 Page 21 of 74
Focus group discussions were held with women in slum population to learn about their
water usage, storage and handling practices, health status, difficulties encountered in accessing
potable water and to educate them on good hygiene practices and measures to prevent
water-borne diseases. Residents were found to be generally receptive to such interactions. A
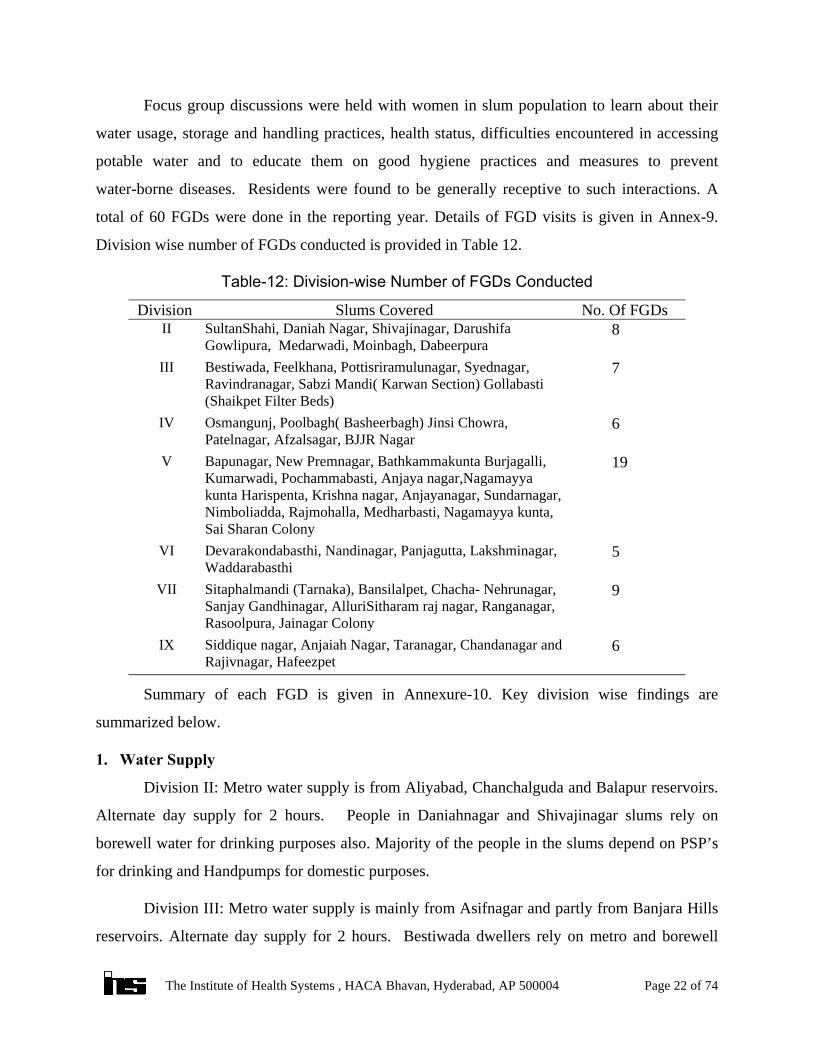
total of 60 FGDs were done in the reporting year. Details of FGD visits is given in Annex-9.
Division wise number of FGDs conducted is provided in Table 12.
6Siddique nagar, Anjaiah Nagar, Taranagar, Chandanagar andRajivnagar, Hafeezpet
IX
9Sitaphalmandi (Tarnaka), Bansilalpet, Chacha- Nehrunagar,Sanjay Gandhinagar, AlluriSitharam raj nagar, Ranganagar,Rasoolpura, Jainagar Colony
VII
5Devarakondabasthi, Nandinagar, Panjagutta, Lakshminagar,Waddarabasthi
VI
19Bapunagar, New Premnagar, Bathkammakunta Burjagalli,Kumarwadi, Pochammabasti, Anjaya nagar,Nagamayyakunta Harispenta, Krishna nagar, Anjayanagar, Sundarnagar,Nimboliadda, Rajmohalla, Medharbasti, Nagamayya kunta,Sai Sharan Colony
V
6Osmangunj, Poolbagh( Basheerbagh) Jinsi Chowra,Patelnagar, Afzalsagar, BJJR Nagar
IV
7Bestiwada, Feelkhana, Pottisriramulunagar, Syednagar,Ravindranagar, Sabzi Mandi( Karwan Section) Gollabasti(Shaikpet Filter Beds)
III
8SultanShahi, Daniah Nagar, Shivajinagar, DarushifaGowlipura, Medarwadi, Moinbagh, Dabeerpura
IINo. Of FGDsSlums CoveredDivision
Table-12: Division-wise Number of FGDs Conducted
Summary of each FGD is given in Annexure-10. Key division wise findings are
summarized below.
1. Water Supply
Division II: Metro water supply is from Aliyabad, Chanchalguda and Balapur reservoirs.
Alternate day supply for 2 hours. People in Daniahnagar and Shivajinagar slums rely on
borewell water for drinking purposes also. Majority of the people in the slums depend on PSP’s
for drinking and Handpumps for domestic purposes.
Division III: Metro water supply is mainly from Asifnagar and partly from Banjara Hills
reservoirs. Alternate day supply for 2 hours. Bestiwada dwellers rely on metro and borewell
The Institute of Health Systems , HACA Bhavan, Hyderabad, AP 500004 Page 22 of 74
water for drinking as the water is supplied on the alternate days is inadequate and the supply in
the designated time is intermittent.
Division IV: Metro water supply is from Boggulakunta and Redhills reservoirs. Alternate
day supply for 2 hours. In Patel Nagar many rely on borewell water for drinking as the water
supplied is over chlorinated. In Osmangunj many depend on borewells due to inadequate supply
of water
Division V: Water supply is from Adikmet, Chilkalguda, Narayanaguda and Shivam
reservoirs. Bathakammakunta Nagamayyakunta, Burjagalli, Sundarnagar, Bapunagar have 24X7
since few months Other slums have alternate day supply for 2 hours. In 24X7 supply areas
people do not depend on borewell water now
Division VI: Water supply is from Banjara Hills and Erragadda reservoirs. Alternate day
supply for 2 hours. The people of the lower Panjagutta slum depend mostly on PSPs for drinking
purposes Some residents of Panjagutta slum collect water from hand pump located in MLA
quarters when there is insufficient water. Many residents of Nandinagar depend on tanker water
due to insufficient supply. In Devarakondabasthi people rely on borewells also.
Division VII: Water supply is from Marredpally and Bhoiguda reservoirs.Alternate day
supply for 1-2 hours. Rasoolpura has very few house taps and residents depend mostly on PSP’s,
Tankers, Handpumps and Sintex tanks even for drinking. All other slums depend on borewells
for their domestic purposes only.
Division IX: Water supply is from Serlingampally Municipality and Madhapur reservoir.
Alternate day supply for about 2 hours. In Hafeezpet area people mostly depend on tanker or
borewells. A large number of bore wells were were not in working condition.
2. Water Handling and Storage Practices
Knowledge of safe water handling and storage practices was generally limited. As most
of the residents are daily wage laborers, in many instances collection of water is the
responsibility of children. Water is generally collected in steel, plastic and brass pots. Water is
mostly consumed without any treatment process. In few slums use of nylon net, cloth, candle and
steel water filters was reported. Some boil water during rainy season. Residents reported that
they treat only if any color change appears or during rainy season.
The Institute of Health Systems , HACA Bhavan, Hyderabad, AP 500004 Page 23 of 74
3. Perceptions Regarding Quality of Water
Division II: Respondents in Daniahnagar and Shivajinagar slums complained about
inadequate water supply. Most of the dwellers here complained to the board about the quality of
water supplied. Many people including the Metro line man in this division perceive that quality
of water is not good and many had fallen sick since Krishna water supply started.
Division III: Residents of Sabzi Mandi and Feelkhana Slums were generally satisfied
with the quality of the water supplied by the board. PS Nagar residents complained about
excessive chlorination and pungent odour of water. Respondents in Ravindranagar had
complaints about the inadequate and irregular timings of water supply and very low pressure of
water . They said that despite numerous complaints no action was taken. Close proximity of pipe
lines with sewerage lines were a worrying factor for residents of First Lancer in Syed Nagar
slum
Division IV: Residents of Jinsi Chowra slum depend almost entirely on HMWSSB water
for their drinking purposes. They say that the water they get does not need any prior treatment as
it was clear and fine. Patel Nagar slum respondents informed that they get cloudy water with
heavy odour of chlorine and that the water is not at all safe for drinking purposes. Residents of
Osmangunj complained of inadequate water supply which forces them to depend on borewell
water. They said that the water supplied here is dirty and muddy and causes serious health
problems. The residents of the Affzal Sagar slum also complained about insufficient and poor
quality water. Though they had given complaints no action had yet been taken.
Division V: Residents of Pochamma Basthi and Krishna Nagar Slums felt that water is
safe for drinking and no prior treatment was required. However they complained that the water
supply was excessively chlorinated and unclear. Similarly the residents of the Nimboliadda slum
had no problem with the water supply but complained of excessive chlorination. Anjayanagar
slum residents complained of the inadequate and unclean water supply in August 2006. However
in a repeat FGD in February residents informed that the water quality and supply had improved
Division VI: Residents of . Lakshminagar slum and Waddarabasthi slums were satisfied
with quality and supply of water. In Panjagutta people complained that they were getting
drainage water in the initial period of water supply. Residents of Nandinagar informed that they
The Institute of Health Systems , HACA Bhavan, Hyderabad, AP 500004 Page 24 of 74
had to depend on tanker water due to insufficient metro supply. Devarakondabasthi residents
complained of very low pressure in the water supply.
Division VII: Residents of Ranga Nagar complained of excessive chlorination of water
which causes burning of the throat and the intestine. At times, the water is dirty ,with foul smell.
The people of the Sithaphalmandi complained that the water supplied was dirty and foamy with
dirt settling upon storage. Residents of Jainagar colony also informed that the water they
received was highly polluted and dirty.
Division IX: The residents of Siddique Nagar were satisfied with the quality of water but
complained of the low pressure in the system. Residents of Anjaiah Nagar face similar problem.
At times of inadequate water supply, people here rely on Bore well water and tankers for
drinking water. The water is supplied only to some part of Hafeezpet area. The immediate source
of water there is a newly laid hand pump. A large number of bore wells in this area are not in a
working condition.
4. Other Factors that may have an Impact on Water Quality
Division II: Hygienic practices were observed to be poor especially in Medarwadi,
Darushifa, Shivajinagar slums. Excessive reliance on Pit Taps especially in Gowlipura and
SultanShahi. Many of the pit taps were observed to be filled with dirty water. Sewerage
overflows were frequently observed in Sultan Shahi, Gowlipura, Medarwadi Dabeerpura and
Moinbagh. Dairy farms in Medarwadi and rearing of pigs in Dabeerpura and Darushifa slums
contribute to unsanitary conditions
Division III: Hygienic practices were observed to be poor especially in Feelkhana and
Gollabasti. Excessive reliance on Pit Taps especially in Gollabasti, Syednagar and Devarakonda
basthi. In PS Nagar many house tap connections has been converted to pit taps as water pressure
is low. Sewerage overflows were occasionally observed in Syednagar and Gollabasti. Presence
of dairy farms contributes to the unsanitary conditions in Gollabasti slum. Residents complain of
foul smell due to cows and buffaloes. The streets of Gollabasti and PS Nagar are narrow and
congested with water logging in the low lying houses. Electrical conductivity and total hardness
of water in borewells in this area is more than maximum permissible limits.
The Institute of Health Systems , HACA Bhavan, Hyderabad, AP 500004 Page 25 of 74

Division IV: The sanitary conditions in the streets and also of the anganwadi in the
Afzalsagar area was found to be very poor. Open defecation and MCH garbage was found in
adjacent to the Anganwadi school. Excessive reliance on pit taps in Osmangunj. The people of
the BJJR Nagar, though satisfied with quality of water supplied were worried of the open sewage
lines which overflows during the rainy season. Some PSPs in Afzalsagar were found to be not
in working condition. In Poolbagh Slum many residents depend on PSPs which is shared by
more than 50 families
Division V: Sewerage overflows were noticed in Harispenta, New Premnagar,
Medharbasti, Anjayanagar. Excessive reliance on pit taps were found in Bathakammakunta
Nimboliadda, Bapujinagar and Rajmohalla. Bapunagar slum face a lot of problem with the open
drainage system. The sanitary condition of the slum was very poor with household waste and
garbage dumped all over. The garbage is not cleaned, causing major health problems especially
during the rainy season. Anjaya nagar slum is located beside a railway track and a lot of waste
material was dumped there, emitting out foul smell.
Division VI: Nandinagar has a mix of very old irregular and newly laid pipelines. The
surroundings are unhygienic with garbage overflowing from open garbage bins in Nandinagar.
Though the sewer lines in Panjagutta are laid properly sewerage over flows are common.
Sanitary conditions are seen to significantly deteriorate during rainy seasons. Over reliance of pit
taps in Nandinagar and Waddarabasthi
Division VII: In Bansilalpet garbage is not collected regularly and sanitary conditions are
very poor. Over reliance of pit taps in Bansilalpet and Ranganagar. Sewerage overflows in
rainy season is observed in these areas. The Alluri Sitharam Rajnagar slum is full of dirt and
garbage with pools of stagnant water. The smell is unbearable
Division IX: The residents of Siddiquenagar and Anjaiah nagar have reasonably good
knowledge about proper water use and hygiene practices compared to those of Hafeezpet. No Pit
taps were found in this division. Hafeezpet does not have a properly laid drainage system and
open defecation was observed.
The Institute of Health Systems , HACA Bhavan, Hyderabad, AP 500004 Page 26 of 74

5. Health Care Providers
Slum residents access a variety of providers for health care. These are predominantly
private providers and include: RMPs, allopathic and AYUSH practitioners, private clinics and
hospitals. A list of key private providers in these areas is given in Annex-7. Government
facilities commonly accessed include: Fever Hospital, Gandhi Medical College, Osmania
Medical College, Niloufer Hospital, Erragadda Hospital, Clinic in MLA Quarters and ESI
Hospitals
The Institute of Health Systems , HACA Bhavan, Hyderabad, AP 500004 Page 27 of 74
Chapter Three. Analysis and Recommendations:
1. Water Quality in Reservoirs1. There has been an overall improvement in levels of satisfactory chlorination in the reporting
year. Some of the poorly performing reservoirs last year such as Alwal, Aliyabad,
Chanchalguda, Jahanuma, Bhoiguda and Mishriganj which were highlighted for special
focus have significantly improved their performance in the reporting year. In the reporting
year, availability of operators have been ensured and no unsatisfactory sample was attributed
to absence of operator. This indicates that the Board has been vigilant and some focussed
attention has been paid in rectifying errors in many of the poorly performing reservoirs.
2. Reservoirs such as Sahebnagar, Autonagar, Madhapur Chilakalguda, Balapur and Erragadda
reservoirs performed worse than the previous years. These reservoirs requires increased
attention based on the reasons identified for unsatisfactory levels of chlorination. The
Sahebnagar reservoir particularly showed high levels of unsatisfactory chlorination. Probably
because Sahebnagar is a service reservoir that feeds other reservoirs there appears to be a
tendency of not paying much attention to chlorination.
3. Data from two years clearly indicate an increase in levels of unsatisfactory chlorination
during April and May. This rise is mostly on account of improper chlorination and may be
because of the effect of higher temperature on chlorine. More vigilance is required during
this period to ensure that satisfactory chlorination is carried out.
4. Residual chlorine levels are required to be monitored on an hourly basis and results recorded
in a log register. It was observed that not much attention was given to proper recording and
maintenance of the log registers in any of the reservoirs. About three quarters of the
unsatisfactorily chlorinated samples is likely to be on account of human factors. Even when
operator was present and chlorination was done, the process was not implemented properly
resulting in unsatisfactory levels of chlorination. Therefore there is a need for improving
skills, motivation and accountability of operators and supervising staff.
The Institute of Health Systems , HACA Bhavan, Hyderabad, AP 500004 Page 28 of 74
5. Malfunctioning of chlorine machine, unavailability of chlorine gas and breakage of chlorine
pipes also contribute to unsatisfactory levels of chlorination in reservoirs. There is need for:
periodic maintenance, repairs and replacement of non-working machines and parts;and
improvement of the system to ensure continuos supply of consumables and respond to
emergencies.
6. Power failure continues to be a cause for disruption of the chlorination process, especially in
Autonagar, Madhapur and sometimes in Adikmet. Better coordination with Electricity
Department and/or alternative arrangements for power may be considered to ensure
consistent supply of power.
7. Availability of liquid chlorine at reservoirs has to be ensured and necessary skills to use the
same for chlorination at times of emergency due to technical failure, needs to be imparted to
the operators.
8. For multiple reasons Sahebnagar, Autonagar, Madhapur, Narayanguda and Erragadda are
comparatively poorly performing reservoirs. Their performance has been consistently poor
during the last two years and hence may require a special attention as about 60% of the total
number of unsatisfactory samples from all the reservoirs are contributed by them.
9. While satisfactory levels of chlorination are generally maintained during community supply
hours, the same is not the case outside this time. However, it has been observed that tanker
supply and PSP’s present in the reservoir premises were being supplied with water after the
regular supply hours. It was observed that significant proportion of the samples having
unsatisfactory chlorine levels were taken from the tankers. Chlorine levels need to
maintained throughout to service such requirements.
10. Cleaning of reservoirs are not regularly done. Actual date of last cleaning was available only
for 9 of the 22 reservoirs. For the remaining 13, the year in which the reservoir was last
cleaned was available. In rest of the seven reservoirs, no information on the dates of last
cleaning was available. Only 2 of the 22 reservoirs were cleaned during the reporting period.
Distribution networks are especially vulnerable to contamination when the pressure falls,
particularly in the case of intermittent supply. Therefore it is recommended that the
reservoirs are cleaned twice a year and actual dates of cleaning displayed at the reservoir.
The Institute of Health Systems , HACA Bhavan, Hyderabad, AP 500004 Page 29 of 74
II. Water Quality in Slums1. Overall there has been a significant improvement in chlorination levels in slum areas in the
reporting year, compared to the previous year. In the year 2005-06 about 6.72% of the
samples collected from slums were found to be unsatisfactorily chlorinated, compared to
1.2% in the reporting year. The measures taken by the Board for quality control and
monitoring including third party checks, appears to have played a role in ensuring improved
chlorination in the reporting period.
2. While most slums received water supply with adequate chlorination, some slums consistently
fared poorly in terms of satisfactory levels of chlorination. These include Baggi Khana,
Amber Nagar, Madannapet Mandi and Mader basthi slums. These have been identified and
reported to the Board. Special attention may be required at the concerned reservoir level and
distribution system at the slum level to address this issue
3. It needs to be noted that there is variance in level of chlorination at different supply points of
a slum, during the same period of supply. Unsatisfactory chlorine levels at some of the
supply points may be because they are the distant or end endpoints of the distribution system.
In some instances, this may be because of concurrent online supply of water, which was
generally observed to be improperly chlorinated and in others due to local pollution on
account of criss-crossing of the pipe lines or unhygienic practices of the house hold. Overt
pollution of water has been reported by residents of slums such as Affzal Sagar, Panjagutta,
Sithaphalmandi, Osmangunj, Anjayanagar andPatel Nagar. Other possible causes for
unsatisfactory chlorination have been identified division-wise in Annexure- 4. Therefore, in
addition to ensuring chlorination at the reservoir level, necessary steps need to be taken to
ensure that adequate residual chlorine levels is maintained through out the entire distribution.
4. Some of the slums such as PS Nagar, Patel Nagar, Nimboliadda, Ranga Nagar reported very
high levels of chlorination rendering water aesthetically unpleasant and not safe for
consumption. Some of the residents attributed gastrointestinal symptoms in these areas to
high levels of chlorination. While it is required that water is chlorinated it needs to be
ensured that chlorine levels are within permissible limits throughout the distribution system.
The Institute of Health Systems , HACA Bhavan, Hyderabad, AP 500004 Page 30 of 74
5. Residents of slums such as Ravindranagar, Osmangunj, Affzal Sagar, Anjayanagar,
Nandinagar, Devarakondabasthi, Siddique Nagar, Anjaiah Nagar, Hafeezpet, Sultanshahi,
Moghalpura, Metharbasthi, Gowlipura, Hanumannagar, M.S.Maqtha, PS Nagar, Kumarwadi,
Hashamabad, Chandrayangutta, Daniahnagar and Shivajinagar complained of inadequate
water supply and low pressure in the water distribution system. Residents often resort to pit
taps due to low water pressure in the distribution system. Excessive reliance on pit taps was
seen in many of these areas particularly those falling under in Divisions III, IX, IV and II.
The utilization of pit taps is a potential public health risk. Pit taps are more vulnerable to
contamination than others, as the taps are not surrounded by cement compound and water
stagnates around the taps. In many instances these taps are near to open defecation and
drainage lines. Direct tapping of water from the metro water pipe line presents risk of
contamination of local distribution system, especially during monsoons and epidemics. These
pit taps have been identified and reported. The Board needs to address this issue on a priority
basis. The pit taps need to be phased out by providing reliable alternate water supply.
6. Sewerage overflows from manholes, household drainage pipes, drainage pipes of the Metro
Board, open sewerage drains, storm drains etc., were observed in slums. Sewerage
overflows were reported in higher numbers from Divisions I, II, 1V and V especially during
monsoon season. More instances of sewerage overflows were identified in Gowlipura,
Sultanshahi, and Yakutpura slums. These slums reported more number of overflows in the
previous years also. Sewerage overflows in Medarwadi, Dabeerpura, Moinbagh, Syednagar,
Gollabasti, BJJR Nagar, BJJR Nagar, Harispenta, New Premnagar, Medharbasti,
Anjayanagar and Bapunagar slums also constitute a significant public health risk. The Board
was notified of all such sewerage overflows, with exact address (Annex-6). In many
instances, it was observed that sewerage overflows were rectified following communication
to the Board. However in significant number of cases these measures are temporary and
further instances of overflows are noted from same areas especially in monsoon season.
Structural changes in the drainage system may be required to provide a more permanent
solution.
7. The living conditions in the slums are generally poor. Factors such as garbage accumulation,
presence of dairy farms, pig rearing and open defecation further worsen sanitary conditions
The Institute of Health Systems , HACA Bhavan, Hyderabad, AP 500004 Page 31 of 74
in slums such as Medarwadi, Darushifa, Shivajinagar, Feelkhana, Gollabasti, PS Nagar
Afzalsagar, Anjaya nagar Nandinagar, Alluri Sitharam Rajnagar, Hafeezpet. Such unsanitary
conditions contribute significantly to risk of water contamination. Coordinated action is
required with the Municipal Corporation to ensure daily collection of garbage and better
sanitary conditions.
8. About 43.71% of bore wells found to be bacteriologically contaminated and over three
quarters of the borewells had at least one physicochemical parameter outside maximum
permissible limits. The levels of Calcium and Magnesium which are the chief contributors to
hardness of water was above the maximum permissible limits in 61% and 44% of borewell
samples. 27% of the borewell samples had nitrate content in excess of the maximum
permissible limits. High levels of nitrates in drinking water have been linked to
methaemoglobinemia in infants. While about 50% of the borewell samples had sulfate levels
in excess of 400 mg/litre, the maximum permissible limits prescribed by the WHO, all
samples were within the maximum permissible limit for sulfates (1000mg/L) prescribed by
the National Drinking Water Mission. About 11% of borewell samples had levels of
fluorides in excess of the maximum prescribed levels. Presence of fluoride in excess of 1.5
mg/L is associated with dental and skeletal fluorosis. The contaminated bore-wells have been
identified and reported. Where feasible, the Board may take steps to decontaminate such bore
wells. In other cases, residents need to be informed of the potential health hazards of using
water from such bore-wells and alternate water supply be provided.
9. About 22.96% of street vendor samples collected from hotels and other eateries were found
to be contaminated with pathogenic bacteria, mostly E.Coli. In about one third of the
samples, almost all of them from borewells, one or more physicochemical parameters
exceeded the maximum permissible limits prescribed for drinking water. Nearly 30% of the
household stored water samples tested, were found to be contaminated with fecal indicator
E.Coli. This may be due to improper collection, handling and storage practices at the
household level. Thus even when the water supplied by the Board is potable, risk of
contamination exists due to lack of awareness regarding hygiene practices and use of
alternate sources of water for drinking purposes within the household and in hotels. The
The Institute of Health Systems , HACA Bhavan, Hyderabad, AP 500004 Page 32 of 74

Board may consider involving local civil society organizations in spreading awareness
regarding water use and hygiene practices.
10. Focus group discussions was found to be a useful mechanism to understand problems of slum
dwellers related to water supply and sanitation which would not have been possible in the
course of routine monitoring. Feedback received during these interactions have been
communicated to the Board and in many cases action was taken by the Board to address
these issues. Further the focus group discussions provide an opportunity to provide
information on water use and hygiene practices and other health related information.
11. Support of 27 health care practitioners was enlisted during the reporting period. (See
Annex-7 for details). The local health care practitioners are generally responsive and
interested in participating in the awareness programs conducted by the NGO’s. They are
willing to distribute chlorine liquid or tablets to their patients if the necessary supplies are
provided to them. The Board may consider involving them in its campaign to provide safe
water. They are potentially useful resources that could augment the mechanisms for
surveillance of waterborne diseases, health education and other preventive measures.
III.Conclusions and Suggested Future Steps The above findings indicate that public-private partnerships has immense potential for:
1. Augmenting HMWSSBs’s effots to provide safe drinking water to urban slums.
The presence of external monitoring and direct reporting of findings to senior most level
of Board management, has to a great extent ensured that lower level staff are more vigilant and
prompt in carrying out their routine work. Data indicate that there has been an overall
improvement in levels of chlorination of water supplied to the slums, during the reporting period.
Further, communication of findings on a real time basis to the officers of Board, ensures prompt
response in taking corrective measures.
2. Empowerment
Data indicate that water used by residents may be contaminated even when potable water
is supplied by the Board. This may be due to improper collection, storage and handling practices
and unsanitary surroundings at the household level. Therefore, there is need to empower
The Institute of Health Systems , HACA Bhavan, Hyderabad, AP 500004 Page 33 of 74

residents with the necessary knowledge about good hygiene practices and measures to prevent
waterborne diseases. The monitoring provides opportunity for direct contact and interaction with
the residents on these issues. Focus Group Discussions further helps to understand problems of
slum dwellers related to water supply and sanitation, and provide information regarding
prevention of waterborne diseases It was found that the residents were generally very receptive
towards such interactions and health related information. In addition to empowering slum
residents with knowledge, the focus group discussions serve as a useful mechanism in
communicating their feedback on water quality and sanitation to the Board.
3. Further Systematization and Expansion
The public-private partnerships have a number of components. There is need for further
expansion in terms of coverage and resources deployed for a more systematic implementation of
all key components. Additional resources are to be deployed for further (1) monitoring pit taps
and sewerage over flows which are potentially at risk for contamination. (2) interaction with
residents for improving awareness and communicating their feedback on water quality and
sanitation (3) monitoring of quality of borewells (4) enlistment of local health care providers
The Institute of Health Systems , HACA Bhavan, Hyderabad, AP 500004 Page 34 of 74
Annexure-1: Reservoir wise details of RC Tests done fromApril 05- March 2007
Note: S- Satisfactory; US- Unsatisfactory2.723.39149453547313381Total1.350.8145297614Shivam0.421.65111239668Santoshnagar34.713.194210121313Sahebnagar0.651.65211308666Redhills3.854.891332338655Narayanguda0.003.40023307677Mishrigunj0.000.000006Miralamfilters1.240.7535241670Marredpally7.437.571548202634Madhapur0.003.89023255592Jahanuma4.845.121534310664Erragadda1.860.7255269694Chilakalguda0.663.50223305657Chanchalguda0.002.76018312651Boggulakunta1.613.37322186653Bhoiguda2.860.00301050Banjarahills4.764.011026210648Balapur8.212.472216268648Autonagar0.001.3709322656Asmangadh1.060.4623189651Asifnagar0.008.72054146619Alwal0.007.29052350713Aliyabad3.633.32721193632Adikmet%US%US UnsatisfactoryUnsatisfactorySatisfactorySatisfactory
Apr06-Mar07
Apr05-Mar06
Apr06-Mar07Apr05-Mar06 Apr06-Mar07 Apr05-Mar06% UnsatisfactoryNumber of RC SamplesReservoir
The Institute of Health Systems , HACA Bhavan, Hyderabad, AP 500004 Page 35 of 74
Annexure-2: Reservoir wise details of BacteriologicalTests from April 06 to March 2007
Note: S-Satisfactory, US-Unsatisfactory33.3311.1155.5501.41298.587100% of Total
31501.4128739628637Total00000011Chandanagar00000011Taranagar01003.84612526Shivam0000003131Santhoshnag0000002828Sahebnagar0000002626Redhills00103.33312930Narayanagud10003.44812828Mishrigung0000002929Marredpally0000004040Madhapur0000003131Jahanuma00102.32514243Erragadda0000003737Chilakalguda0000003030Chanchalgud00103.84612526Boggulakunt0000002121Bhoiguda0000001212Banjarahills0000003737Balapur201010.71432528Autonagar00103.12513132Asmangandh
0000001515Asifnagar0000002323Alwal0000004141Aliyabad0000002020Adikmet
IrregularCitrobacterKlebsiellaE.Coli US STotal
Organism Isolated% of SamplesUnsatisfactory
BacteriologicalContamination Test
Reservoir
The Institute of Health Systems , HACA Bhavan, Hyderabad, AP 500004 Page 36 of 74
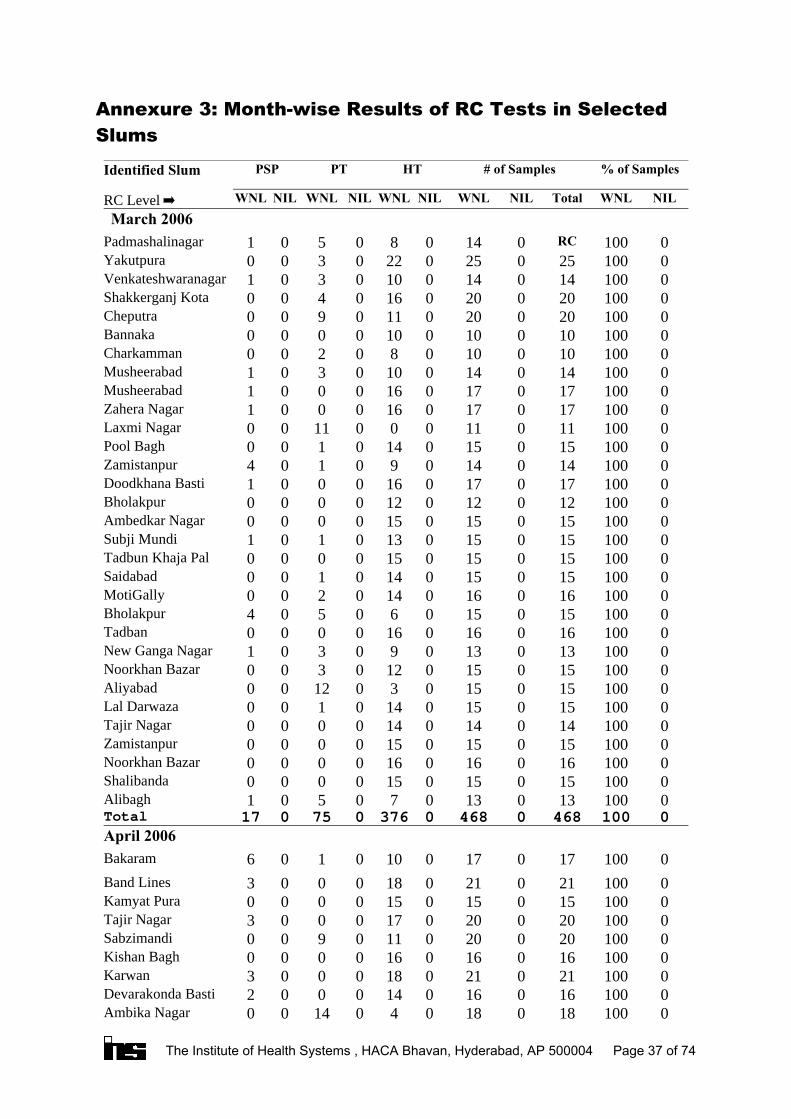
Annexure 3: Month-wise Results of RC Tests in SelectedSlums
0100180180401400Ambika Nagar0100160160140002Devarakonda Basti0100210210180003Karwan0100160160160000Kishan Bagh0100200200110900Sabzimandi 0100200200170003Tajir Nagar0100150150150000Kamyat Pura0100210210180003Band Lines0100170170100106Bakaram
April 2006010046804680376075017Total010013013070501Alibagh0100150150150000Shalibanda0100160160160000Noorkhan Bazar0100150150150000Zamistanpur0100140140140000Tajir Nagar0100150150140100Lal Darwaza0100150150301200Aliyabad0100150150120300Noorkhan Bazar010013013090301New Ganga Nagar0100160160160000Tadban010015015060504Bholakpur0100160160140200MotiGally0100150150140100Saidabad0100150150150000Tadbun Khaja Pal0100150150130101Subji Mundi0100150150150000Ambedkar Nagar0100120120120000Bholakpur0100170170160001Doodkhana Basti010014014090104Zamistanpur0100150150140100Pool Bagh0100110110001100Laxmi Nagar0100170170160001Zahera Nagar0100170170160001Musheerabad0100140140100301Musheerabad010010010080200Charkamman0100100100100000Bannaka0100200200110900Cheputra0100200200160400Shakkerganj Kota0100140140100301Venkateshwaranagar0100250250220300Yakutpura0100RC014080501Padmashalinagar
March 2006NILWNLTotalNILWNLNILWNLNILWNLNILWNL
% of Samples# of SamplesHTPTPSPIdentified Slum
RC Level
The Institute of Health Systems , HACA Bhavan, Hyderabad, AP 500004 Page 37 of 74
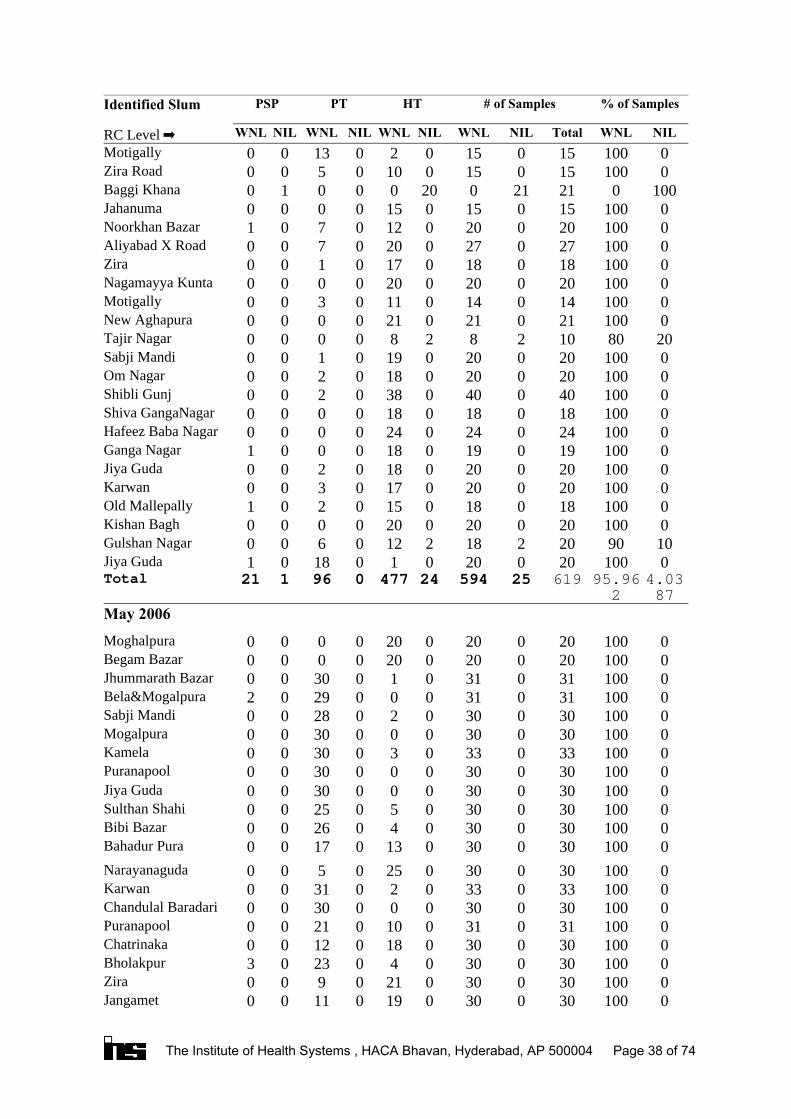
01003003001901100Jangamet0100300300210900Zira0100300300402303Bholakpur01003003001801200Chatrinaka01003103101002100Puranapool0100300300003000Chandulal Baradari0100330330203100Karwan0100300300250500Narayanaguda01003003001301700Bahadur Pura0100300300402600Bibi Bazar0100300300502500Sulthan Shahi0100300300003000Jiya Guda0100300300003000Puranapool0100330330303000Kamela0100300300003000Mogalpura0100300300202800Sabji Mandi0100310310002902Bela&Mogalpura0100310310103000Jhummarath Bazar0100200200200000Begam Bazar0100200200200000Moghalpura
May 2006
4.0387
95.962
6192559424477096121Total0100200200101801Jiya Guda1090202182120600Gulshan Nagar0100200200200000Kishan Bagh0100180180150201Old Mallepally0100200200170300Karwan0100200200180200Jiya Guda0100190190180001Ganga Nagar0100240240240000Hafeez Baba Nagar0100180180180000Shiva GangaNagar0100400400380200Shibli Gunj0100200200180200Om Nagar0100200200190100Sabji Mandi20801028280000Tajir Nagar0100210210210000New Aghapura0100140140110300Motigally0100200200200000Nagamayya Kunta0100180180170100Zira0100270270200700Aliyabad X Road0100200200120701Noorkhan Bazar0100150150150000Jahanuma
1000212102000010Baggi Khana0100150150100500Zira Road0100150150201300Motigally
NILWNLTotalNILWNLNILWNLNILWNLNILWNL
% of Samples# of SamplesHTPTPSPIdentified Slum
RC Level
The Institute of Health Systems , HACA Bhavan, Hyderabad, AP 500004 Page 38 of 74
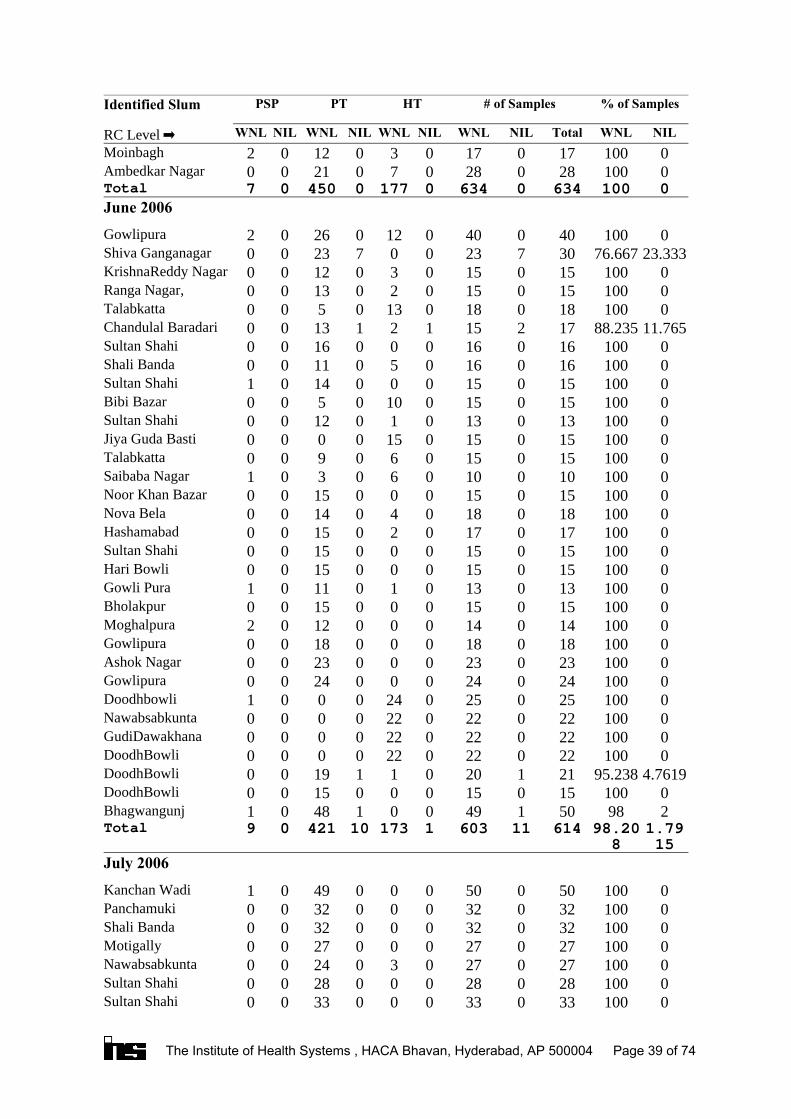
0100330330003300Sultan Shahi0100280280002800Sultan Shahi0100270270302400Nawabsabkunta0100270270002700Motigally0100320320003200Shali Banda0100320320003200Panchamuki0100500500004901Kanchan Wadi
July 2006
1.7915
98.208
6141160311731042109Total298501490014801Bhagwangunj0100150150001500DoodhBowli
4.761995.238211200111900DoodhBowli0100220220220000DoodhBowli0100220220220000GudiDawakhana0100220220220000Nawabsabkunta0100250250240001Doodhbowli0100240240002400Gowlipura0100230230002300Ashok Nagar0100180180001800Gowlipura0100140140001202Moghalpura0100150150001500Bholakpur 0100130130101101Gowli Pura0100150150001500Hari Bowli0100150150001500Sultan Shahi0100170170201500Hashamabad0100180180401400Nova Bela0100150150001500Noor Khan Bazar010010010060301Saibaba Nagar010015015060900Talabkatta0100150150150000Jiya Guda Basti0100130130101200Sultan Shahi0100150150100500Bibi Bazar0100150150001401Sultan Shahi0100160160501100Shali Banda0100160160001600Sultan Shahi
11.76588.235172151211300Chandulal Baradari0100180180130500Talabkatta0100150150201300Ranga Nagar,0100150150301200KrishnaReddy Nagar
23.33376.667307230072300Shiva Ganganagar01004004001202602Gowlipura
June 2006010063406340177045007Total0100280280702100Ambedkar Nagar0100170170301202Moinbagh
NILWNLTotalNILWNLNILWNLNILWNLNILWNL
% of Samples# of SamplesHTPTPSPIdentified Slum
RC Level
The Institute of Health Systems , HACA Bhavan, Hyderabad, AP 500004 Page 39 of 74

0100320320202901Ms.Maqtha0100330330330000New Maisaram0100250250002500Shakargunj Kota
19.04880.952214170241500Nandi Nagar0100500500005000Gowlipura0100360360360000Chandhanagar
2.77797.222351341340000Bibi bazar0100350350003500Laldarwaza
4.347895.652231221220000Tadban0100360360350001Moghalpura0100330330003300Talabkatta0100350350350000TheegalKunta0100280280901702Nandi Nagar01005105103501204DevarakondaBasti0100330330103101Ms.Maqtha0100310310003001Imly Bazar0100400400310207Bansillalpet0100440440104201Bakshi Bazar0100340340003301Addagutta0100410410003506Bansilalpet 0100450450004500Jahanuma0100350350003500Edibazar0100250250202300Kalapathar01003703701202302Nandi Nagar0100270270202401Raj Nagar
5.40594.595372352350000Jangamet0100400400380200Yakatpura0100320320402404Davarakonda basti01002802801301500BudugajugamBasti0100350350003500Bibi bazar0100400400400000Phishal Banda0100340340003301Ms.Maqtha0100400400400000Yakatpura0100460460460000Yakatpura0100370370000037Chanchcalguda0100190190001108Addagutta0100360360003600Laldarwaza0100350350330200Alija Kotla010014014020606Bholakpur0100350350350000Chamman Yakatpura0100400400004000Shali Banda0100350350280700Yakatpura
1000353500035000Madanapet Mandi0100270270301707Bholakpur0100350350280700Errakunta0100310310003001Bapuji Nagar0100350350350000Yakat Pura
NILWNLTotalNILWNLNILWNLNILWNLNILWNL
% of Samples# of SamplesHTPTPSPIdentified Slum
RC Level
The Institute of Health Systems , HACA Bhavan, Hyderabad, AP 500004 Page 40 of 74
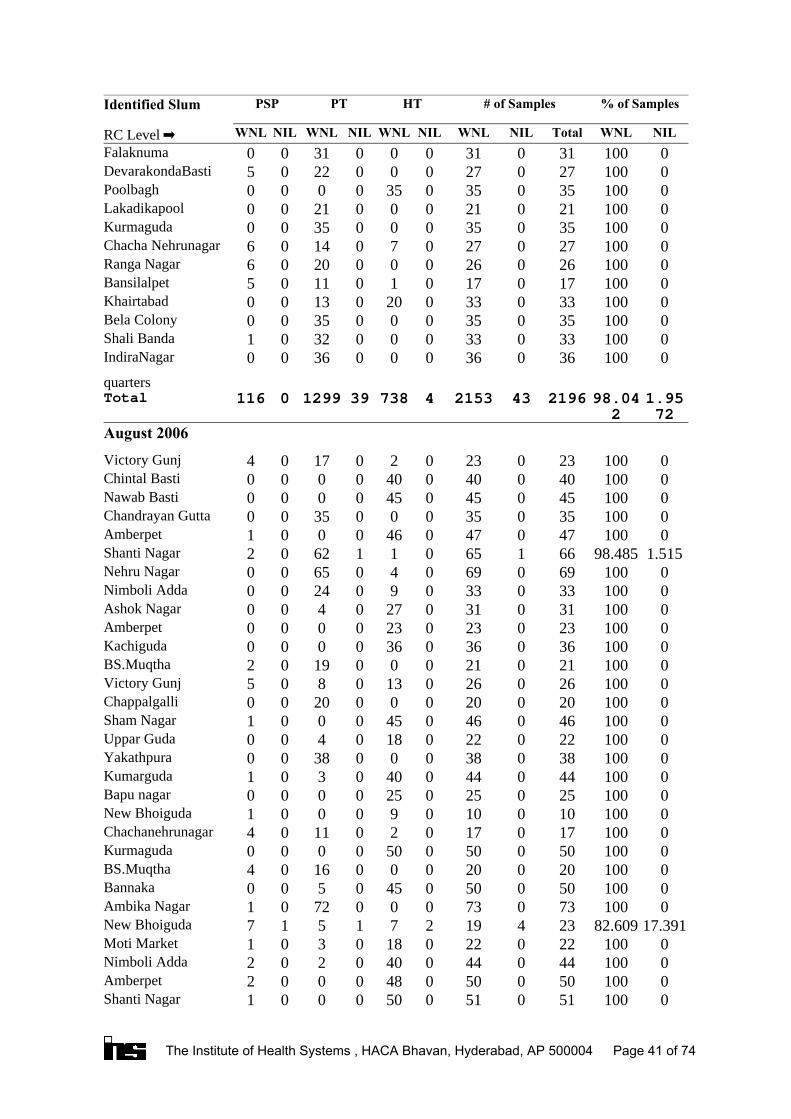
0100510510500001Shanti Nagar0100500500480002Amberpet0100440440400202Nimboli Adda0100220220180301Moti Market
17.39182.60923419271517New Bhoiguda0100730730007201Ambika Nagar0100500500450500Bannaka0100200200001604BS.Muqtha0100500500500000Kurmaguda0100170170201104Chachanehrunagar010010010090001New Bhoiguda0100250250250000Bapu nagar0100440440400301Kumarguda0100380380003800Yakathpura0100220220180400Uppar Guda0100460460450001Sham Nagar0100200200002000Chappalgalli0100260260130805Victory Gunj0100210210001902BS.Muqtha0100360360360000Kachiguda0100230230230000Amberpet0100310310270400Ashok Nagar0100330330902400Nimboli Adda0100690690406500Nehru Nagar
1.51598.485661650116202Shanti Nagar0100470470460001Amberpet0100350350003500Chandrayan Gutta0100450450450000Nawab Basti0100400400400000Chintal Basti0100230230201704Victory Gunj
August 2006
1.9572
98.042
219643215347383912990116Total
0100360360003600IndiraNagar
quarters
0100330330003201Shali Banda0100350350003500Bela Colony01003303302001300Khairtabad0100170170101105Bansilalpet0100260260002006Ranga Nagar0100270270701406Chacha Nehrunagar0100350350003500Kurmaguda0100210210002100Lakadikapool0100350350350000Poolbagh0100270270002205DevarakondaBasti0100310310003100Falaknuma
NILWNLTotalNILWNLNILWNLNILWNLNILWNL
% of Samples# of SamplesHTPTPSPIdentified Slum
RC Level
The Institute of Health Systems , HACA Bhavan, Hyderabad, AP 500004 Page 41 of 74

3.333396.667301291270200Dabeerpura0100440440440000Yasab Nagar0100440440420002Ali Nagar0100440440004400Jamal Nagar0100440440104102Mekala Banda0100350350340100Old Malakpet
6.81893.182443413410000Bhanu Nagar0100400400004000Dhobighat0100440440603602Resddy Basti0100210210002100Indra Nagar01004404401702601Chappal Bazar0100350350003302Warasi Guda01004404401502900Sithapal Mandi
3.22596.774311300013000Jiyaguda0100330330003300Balaganze01004404401003301Sabji Mandi0100320320320000Idha Nagar0100440440004301Karwan0100480480460002Riyasat Nagar0100400400004000D.Sangi bai nagar0100340340003400Edi Bazar0100550550005500Prem Nagar
September 2006
0.429
99.5718658185731033
3753271Total0100310310310000Boggulakunta0100500500004901Poolbagh0100440440440000Sundar nagar0100550550530002Durga Nagar0100450450450000Azad nagar0100420420004200Amberpet0100440440104102Ramnaspura0100220220102001Bapuji Nagar010018018090702DrAmbedkarnagar0100450450004500Nimboli Adda0100440440004301Haribowli
23.07776.92313310101812Jai Nagar colony0100220220210001Harespenta0100220220200002Shamnagar0100270270260001Goshamahal0100350350602306Arundhathi Nagar0100470470004700Kumarwadi Basti010011011000506Jai Nagar colony0100303000201Bholakpur0100440440430001Kurmaguda0100550550540001Theegal Kunta0100460460360802Esamiya Bazar
NILWNLTotalNILWNLNILWNLNILWNLNILWNL
% of Samples# of SamplesHTPTPSPIdentified Slum
RC Level
The Institute of Health Systems , HACA Bhavan, Hyderabad, AP 500004 Page 42 of 74
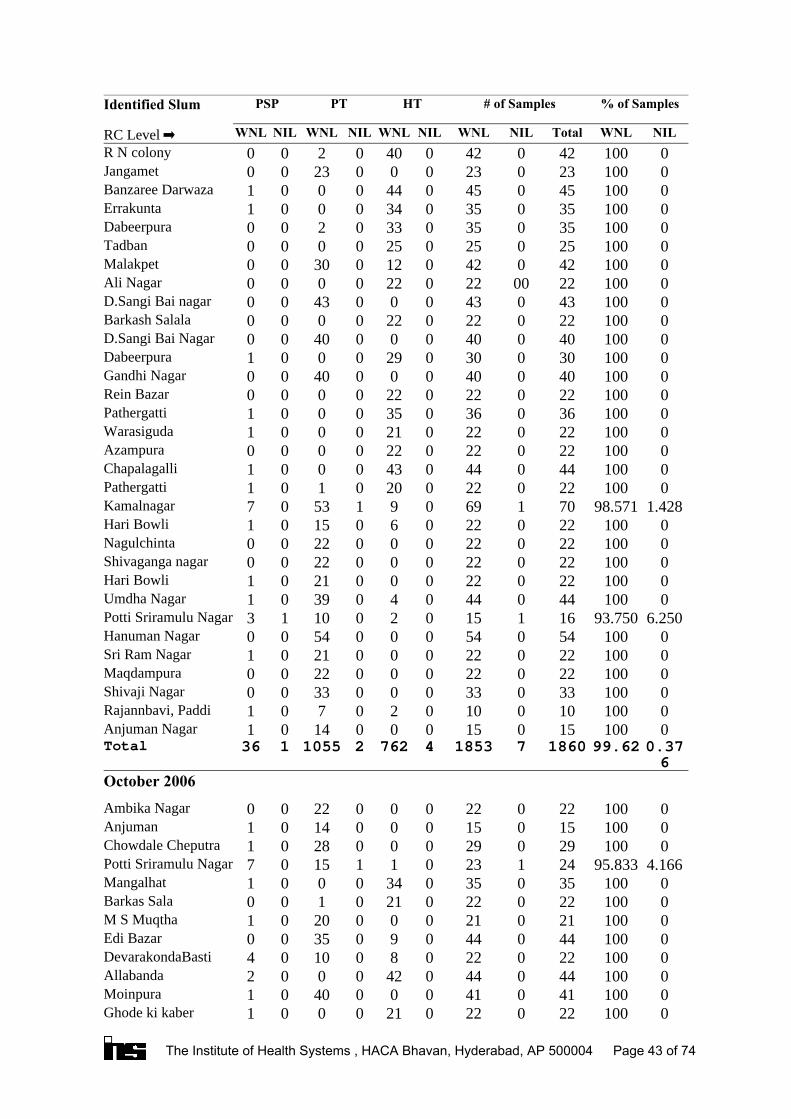
0100220220210001Ghode ki kaber0100410410004001Moinpura0100440440420002Allabanda0100220220801004DevarakondaBasti0100440440903500Edi Bazar0100210210002001M S Muqtha0100220220210100Barkas Sala0100350350340001Mangalhat
4.16695.833241230111507Potti Sriramulu Nagar0100290290002801Chowdale Cheputra0100150150001401Anjuman0100220220002200Ambika Nagar
October 2006
0.376
99.62186071853476221055136Total0100150150001401Anjuman Nagar010010010020701Rajannbavi, Paddi0100330330003300Shivaji Nagar0100220220002200Maqdampura0100220220002101Sri Ram Nagar0100540540005400Hanuman Nagar
6.25093.750161150201013Potti Sriramulu Nagar0100440440403901Umdha Nagar0100220220002101Hari Bowli0100220220002200Shivaganga nagar0100220220002200Nagulchinta0100220220601501Hari Bowli
1.42898.571701690915307Kamalnagar0100220220200101Pathergatti0100440440430001Chapalagalli0100220220220000Azampura0100220220210001Warasiguda0100360360350001Pathergatti0100220220220000Rein Bazar0100400400004000Gandhi Nagar0100300300290001Dabeerpura0100400400004000D.Sangi Bai Nagar0100220220220000Barkash Salala0100430430004300D.Sangi Bai nagar01002200220220000Ali Nagar01004204201203000Malakpet0100250250250000Tadban0100350350330200Dabeerpura0100350350340001Errakunta0100450450440001Banzaree Darwaza0100230230002300Jangamet0100420420400200R N colony
NILWNLTotalNILWNLNILWNLNILWNLNILWNL
% of Samples# of SamplesHTPTPSPIdentified Slum
RC Level
The Institute of Health Systems , HACA Bhavan, Hyderabad, AP 500004 Page 43 of 74
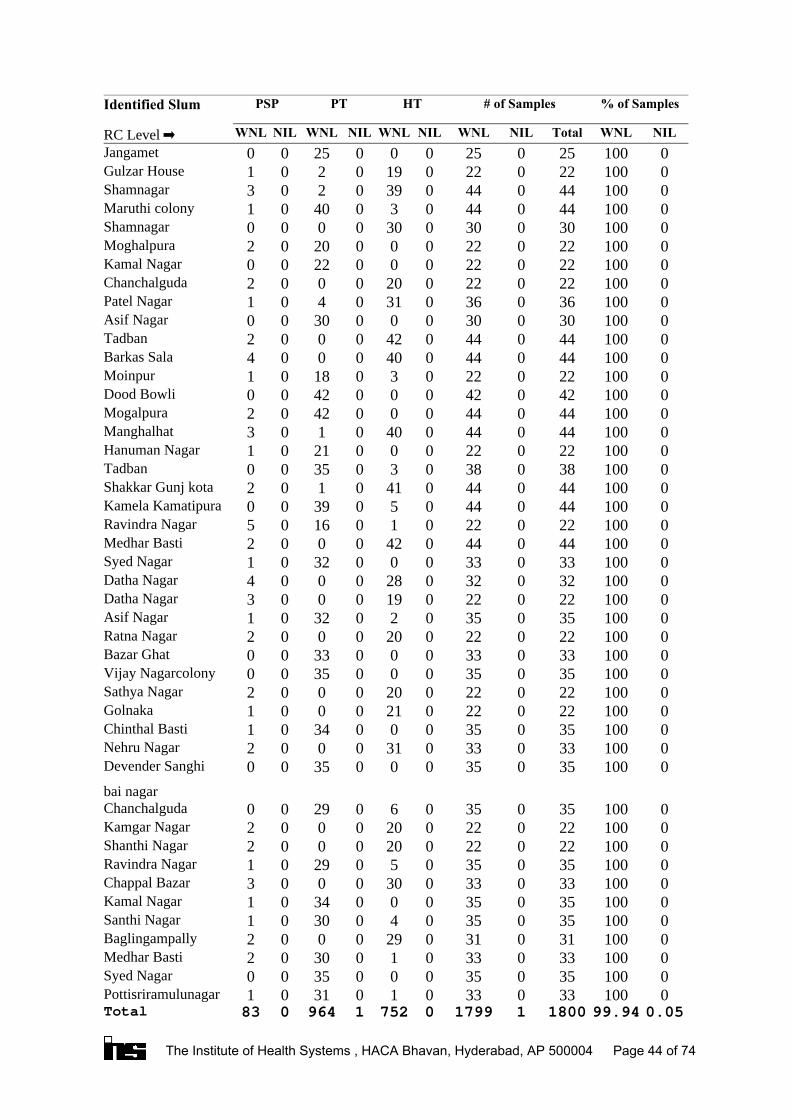
0.0599.9418001179907521964083Total0100330330103101Pottisriramulunagar0100350350003500Syed Nagar0100330330103002Medhar Basti0100310310290002Baglingampally0100350350403001Santhi Nagar0100350350003401Kamal Nagar0100330330300003Chappal Bazar0100350350502901Ravindra Nagar0100220220200002Shanthi Nagar0100220220200002Kamgar Nagar0100350350602900Chanchalguda
0100350350003500Devender Sanghi
bai nagar
0100330330310002Nehru Nagar0100350350003401Chinthal Basti0100220220210001Golnaka0100220220200002Sathya Nagar0100350350003500Vijay Nagarcolony0100330330003300Bazar Ghat0100220220200002Ratna Nagar0100350350203201Asif Nagar0100220220190003Datha Nagar0100320320280004Datha Nagar0100330330003201Syed Nagar0100440440420002Medhar Basti0100220220101605Ravindra Nagar0100440440503900Kamela Kamatipura0100440440410102Shakkar Gunj kota0100380380303500Tadban0100220220002101Hanuman Nagar0100440440400103Manghalhat0100440440004202Mogalpura0100420420004200Dood Bowli0100220220301801Moinpur0100440440400004Barkas Sala0100440440420002Tadban0100300300003000Asif Nagar0100360360310401Patel Nagar0100220220200002Chanchalguda0100220220002200Kamal Nagar0100220220002002Moghalpura0100300300300000Shamnagar0100440440304001Maruthi colony0100440440390203Shamnagar0100220220190201Gulzar House0100250250002500Jangamet
NILWNLTotalNILWNLNILWNLNILWNLNILWNL
% of Samples# of SamplesHTPTPSPIdentified Slum
RC Level
The Institute of Health Systems , HACA Bhavan, Hyderabad, AP 500004 Page 44 of 74
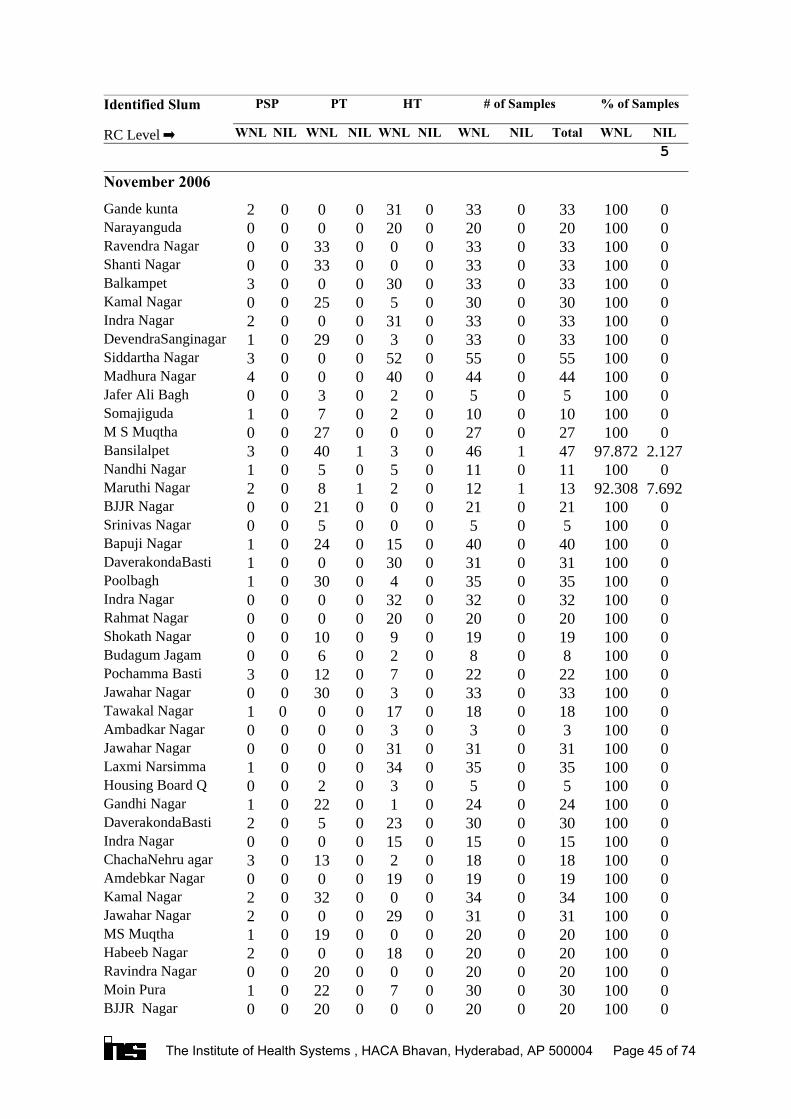
0100200200002000BJJR Nagar0100300300702201Moin Pura0100200200002000Ravindra Nagar0100200200180002Habeeb Nagar0100200200001901MS Muqtha0100310310290002Jawahar Nagar0100340340003202Kamal Nagar0100190190190000Amdebkar Nagar0100180180201303ChachaNehru agar0100150150150000Indra Nagar0100300300230502DaverakondaBasti0100240240102201Gandhi Nagar0100505030200Housing Board Q0100350350340001Laxmi Narsimma 0100310310310000Jawahar Nagar0100303030000Ambadkar Nagar010018018017000 1Tawakal Nagar0100330330303000Jawahar Nagar0100220220701203Pochamma Basti0100808020600Budagum Jagam0100190190901000Shokath Nagar0100200200200000Rahmat Nagar0100320320320000Indra Nagar0100350350403001Poolbagh0100310310300001DaverakondaBasti01004004001502401Bapuji Nagar0100505000500Srinivas Nagar0100210210002100BJJR Nagar
7.69292.30813112021802Maruthi Nagar010011011050501Nandhi Nagar
2.12797.872471460314003Bansilalpet0100270270002700M S Muqtha010010010020701Somajiguda0100505020300Jafer Ali Bagh0100440440400004Madhura Nagar0100550550520003Siddartha Nagar0100330330302901DevendraSanginagar0100330330310002Indra Nagar0100300300502500Kamal Nagar0100330330300003Balkampet0100330330003300Shanti Nagar0100330330003300Ravendra Nagar0100200200200000Narayanguda0100330330310002Gande kunta
November 2006
5NILWNLTotalNILWNLNILWNLNILWNLNILWNL
% of Samples# of SamplesHTPTPSPIdentified Slum
RC Level
The Institute of Health Systems , HACA Bhavan, Hyderabad, AP 500004 Page 45 of 74
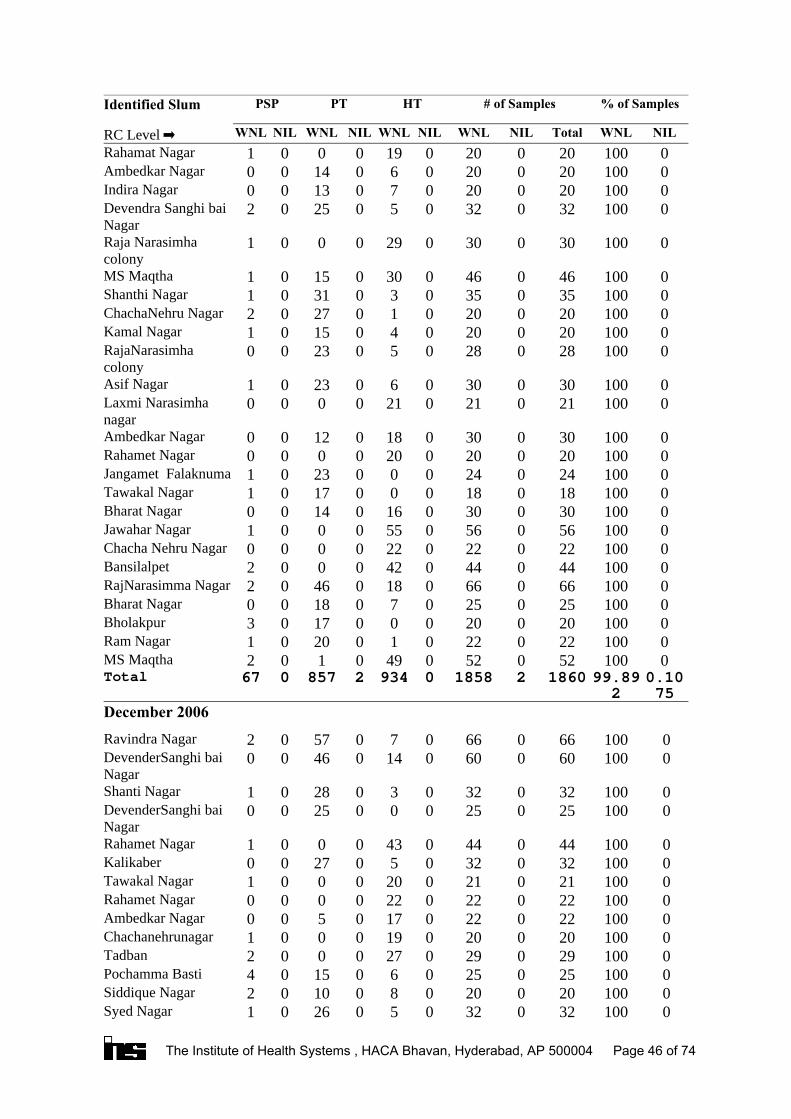
0100320320502601Syed Nagar 0100200200801002Siddique Nagar 0100250250601504Pochamma Basti 0100290290270002Tadban 0100200200190001Chachanehrunagar 0100220220170500Ambedkar Nagar 0100220220220000Rahamet Nagar 0100210210200001Tawakal Nagar 0100320320502700Kalikaber 0100440440430001Rahamet Nagar
0100250250002500DevenderSanghi baiNagar
0100320320302801Shanti Nagar
01006006001404600DevenderSanghi baiNagar
0100660660705702Ravindra Nagar
December 2006
0.1075
99.892
18602185809342857067Total0100520520490102MS Maqtha0100220220102001Ram Nagar0100200200001703Bholakpur0100250250701800Bharat Nagar01006606601804602RajNarasimma Nagar0100440440420002Bansilalpet0100220220220000Chacha Nehru Nagar0100560560550001Jawahar Nagar01003003001601400Bharat Nagar0100180180001701Tawakal Nagar0100240240002301Jangamet Falaknuma0100200200200000Rahamet Nagar01003003001801200Ambedkar Nagar
0100210210210000Laxmi Narasimhanagar
0100300300602301Asif Nagar
0100280280502300RajaNarasimhacolony
0100200200401501Kamal Nagar0100200200102702ChachaNehru Nagar0100350350303101Shanthi Nagar01004604603001501MS Maqtha
0100300300290001Raja Narasimhacolony
0100320320502502Devendra Sanghi baiNagar
0100200200701300Indira Nagar0100200200601400Ambedkar Nagar0100200200190001Rahamat Nagar
NILWNLTotalNILWNLNILWNLNILWNLNILWNL
% of Samples# of SamplesHTPTPSPIdentified Slum
RC Level
The Institute of Health Systems , HACA Bhavan, Hyderabad, AP 500004 Page 46 of 74
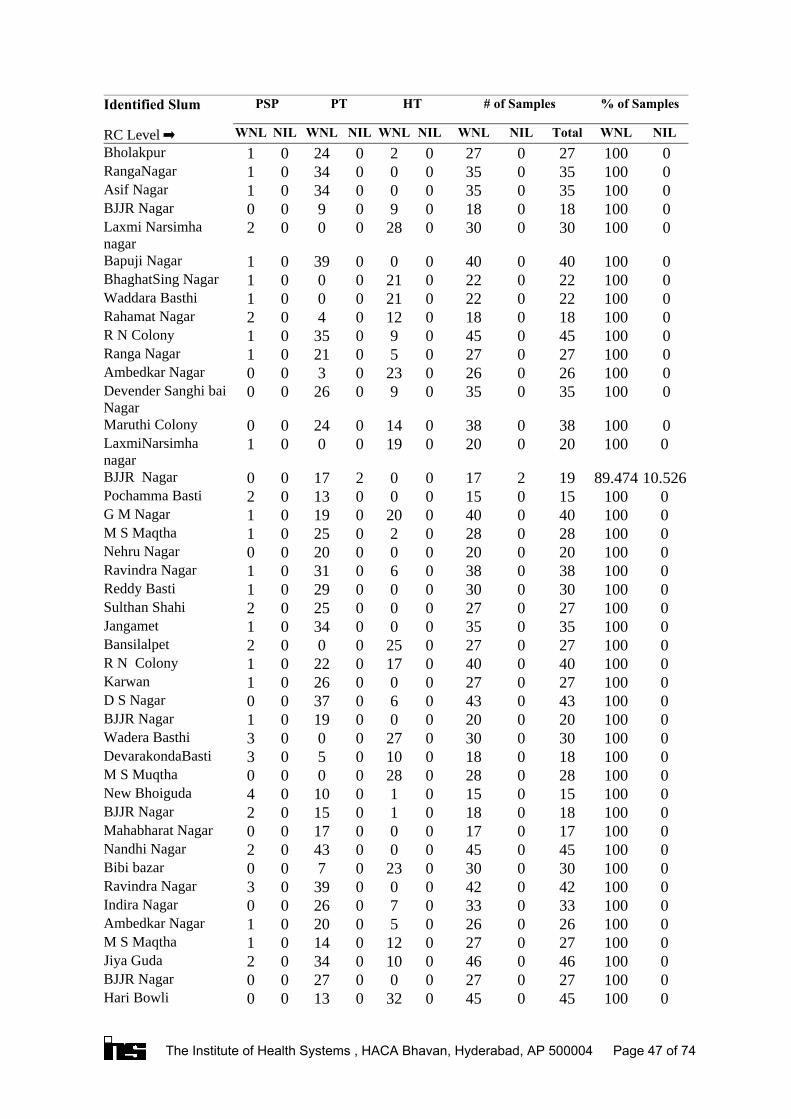
01004504503201300Hari Bowli0100270270002700BJJR Nagar01004604601003402Jiya Guda01002702701201401M S Maqtha0100260260502001Ambedkar Nagar0100330330702600Indira Nagar0100420420003903Ravindra Nagar0100300300230700Bibi bazar0100450450004302Nandhi Nagar0100170170001700Mahabharat Nagar0100180180101502BJJR Nagar0100150150101004New Bhoiguda0100280280280000M S Muqtha0100180180100503DevarakondaBasti0100300300270003Wadera Basthi0100200200001901BJJR Nagar0100430430603700D S Nagar0100270270002601Karwan01004004001702201R N Colony0100270270250002Bansilalpet0100350350003401Jangamet0100270270002502Sulthan Shahi0100300300002901Reddy Basti0100380380603101Ravindra Nagar0100200200002000Nehru Nagar0100280280202501M S Maqtha01004004002001901G M Nagar0100150150001302Pochamma Basti
10.52689.474192170021700BJJR Nagar
0100200200190001LaxmiNarsimhanagar
01003803801402400Maruthi Colony
0100350350902600Devender Sanghi baiNagar
0100260260230300Ambedkar Nagar 0100270270502101Ranga Nagar 0100450450903501R N Colony 0100180180120402Rahamat Nagar 0100220220210001Waddara Basthi 0100220220210001BhaghatSing Nagar 0100400400003901Bapuji Nagar
0100300300280002Laxmi Narsimhanagar
010018018090900BJJR Nagar 0100350350003401Asif Nagar 0100350350003401RangaNagar 0100270270202401Bholakpur
NILWNLTotalNILWNLNILWNLNILWNLNILWNL
% of Samples# of SamplesHTPTPSPIdentified Slum
RC Level
The Institute of Health Systems , HACA Bhavan, Hyderabad, AP 500004 Page 47 of 74
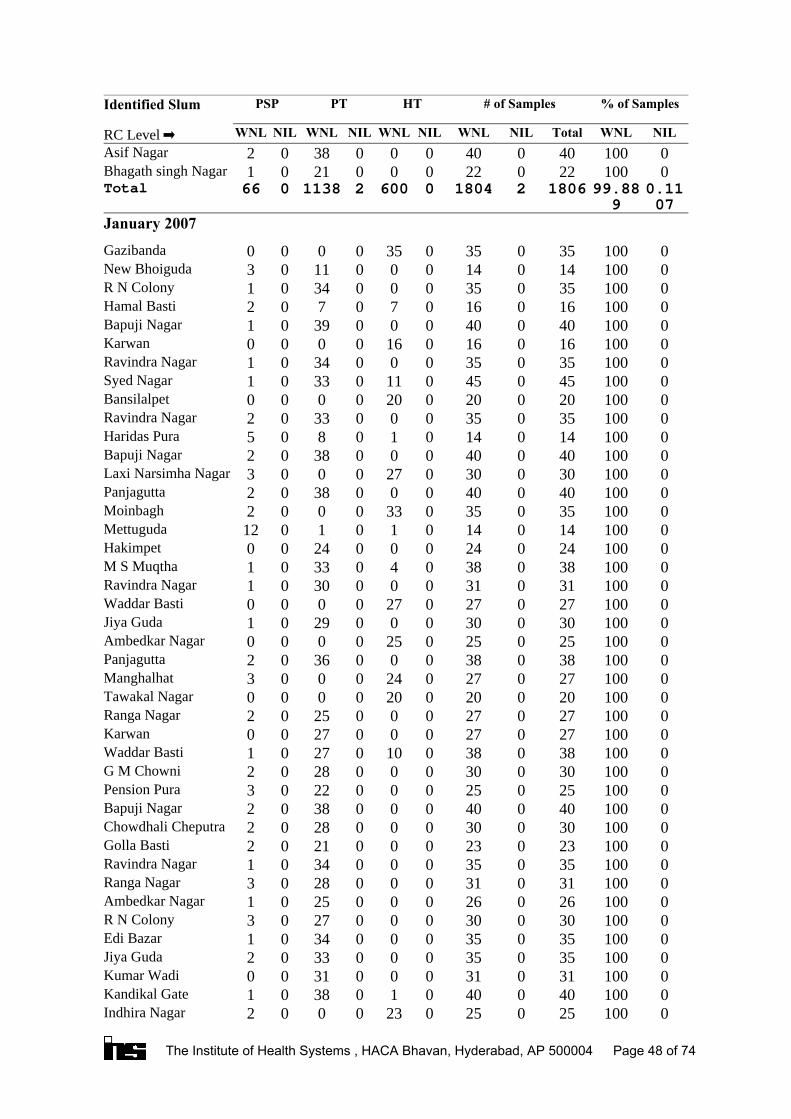
0100250250230002Indhira Nagar0100400400103801Kandikal Gate0100310310003100Kumar Wadi0100350350003302Jiya Guda0100350350003401Edi Bazar0100300300002703R N Colony0100260260002501Ambedkar Nagar0100310310002803Ranga Nagar0100350350003401Ravindra Nagar0100230230002102Golla Basti0100300300002802Chowdhali Cheputra0100400400003802Bapuji Nagar0100250250002203Pension Pura0100300300002802G M Chowni01003803801002701Waddar Basti0100270270002700Karwan0100270270002502Ranga Nagar0100200200200000Tawakal Nagar0100270270240003Manghalhat0100380380003602Panjagutta0100250250250000Ambedkar Nagar0100300300002901Jiya Guda0100270270270000Waddar Basti0100310310003001Ravindra Nagar0100380380403301M S Muqtha0100240240002400Hakimpet 0100140140101012Mettuguda0100350350330002Moinbagh0100400400003802Panjagutta0100300300270003Laxi Narsimha Nagar0100400400003802Bapuji Nagar010014014010805Haridas Pura0100350350003302Ravindra Nagar0100200200200000Bansilalpet01004504501103301Syed Nagar0100350350003401Ravindra Nagar0100160160160000Karwan0100400400003901Bapuji Nagar010016016070702Hamal Basti0100350350003401R N Colony0100140140001103New Bhoiguda0100350350350000Gazibanda
January 2007
0.1107
99.889
180621804060021138066Total0100220220002101Bhagath singh Nagar0100400400003802Asif Nagar
NILWNLTotalNILWNLNILWNLNILWNLNILWNL
% of Samples# of SamplesHTPTPSPIdentified Slum
RC Level
The Institute of Health Systems , HACA Bhavan, Hyderabad, AP 500004 Page 48 of 74

0100510510005100Indhira Nagar01003103101501600Fathesh Nagar0100440440703700Habib Nagar01002402401012011Addagutta0100260260250001Waddar Basti0100120120100002Burjji Galli0100400400003802Bapuji Nagar0100350350003203Riyasat Nagar0100350350103400Indhira Nagar0100350350003104Ranga Nagar0100380380003503Ravindra Nagar0100250250150901Kumar Wadi0100210210190002BathakammaKunta01004004001502500Raksha Puram
0100310310003100Mahatma GandhiNagar
0100220220002200Indhira Nagar0100310310003001Maisaram0100310310202801Moin Bagh0100350350003104Riyasat Nagar0100380380003602Chadharght0100310310302602Gowlipura0100330330602601Maruthi Colony01002702701501002Bujji Galli0100400400003802Ambika Nagar0100330330003102Bholakpur0100330330003102Bapuji Nagar
February 2007
0.0547
99.945
1829118280507112170104Total0100280280002701R N Colony0100330330003003Syed Nagar0100280280270001New Khilwat0100620620500903Jahanuma01004004001602400Kali Khabar0100300300702201Ranga Nagar0100620620560303Moin Bagh01005005002202602Gazemeleli colony0100310310003100Shaikpet0100400400003703Bapuji Nagar
3.84696.154261250311804Panjagutta01003003001901001Kumar Wadi0100210210201900M S Maqtha0100570570005403Kumar Wadi010010010000901BJJR Nagar0100909050103I D H Colony0100200200150302Kumar Wadi
NILWNLTotalNILWNLNILWNLNILWNLNILWNL
% of Samples# of SamplesHTPTPSPIdentified Slum
RC Level
The Institute of Health Systems , HACA Bhavan, Hyderabad, AP 500004 Page 49 of 74
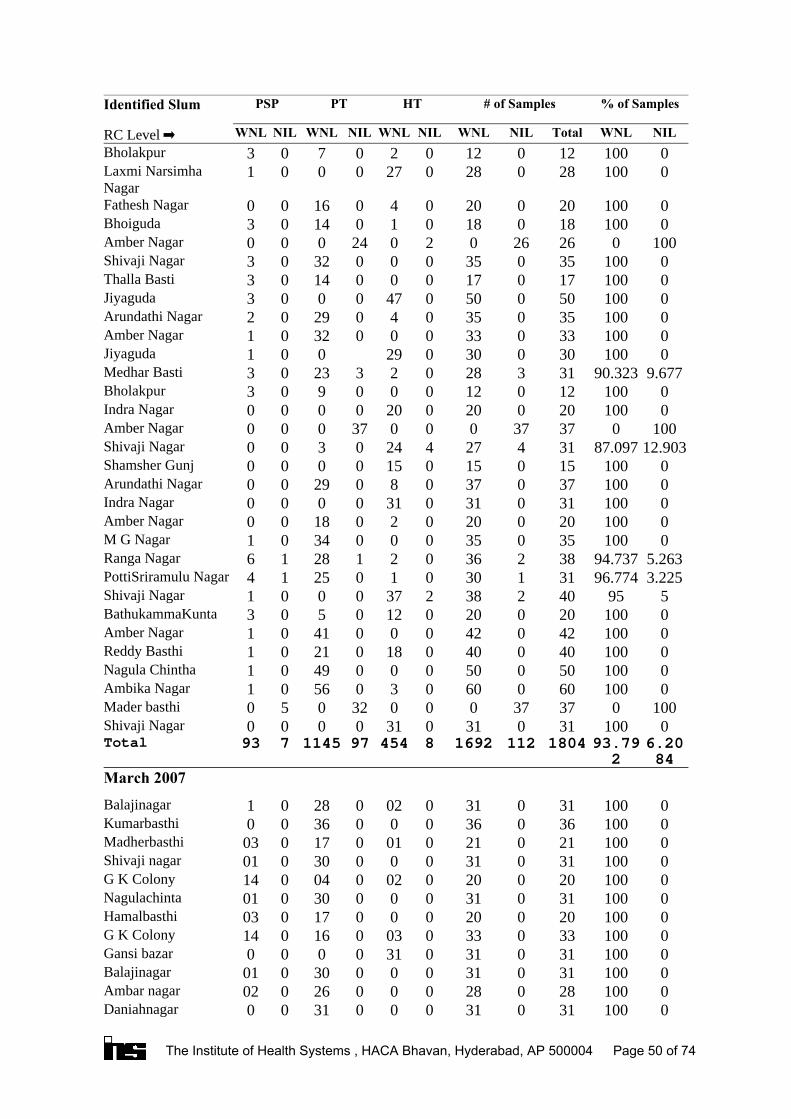
0100310310003100Daniahnagar 01002802800026002Ambar nagar01003103100030001Balajinagar0100310310310000Gansi bazar010033033003016014G K Colony01002002000017003Hamalbasthi01003103100030001Nagulachinta010020020002004014G K Colony01003103100030001Shivaji nagar010021021001017003Madherbasthi0100360360003600Kumarbasthi01003103100202801Balajinagar
March 2007
6.2084
93.792
180411216928454971145793Total0100310310310000Shivaji Nagar
1000373700032050Mader basthi0100600600305601Ambika Nagar0100500500004901Nagula Chintha01004004001802101Reddy Basthi0100420420004101Amber Nagar0100200200120503BathukammaKunta595402382370001Shivaji Nagar
3.22596.774311300102514PottiSriramulu Nagar5.26394.737382360212816Ranga Nagar
0100350350003401M G Nagar0100200200201800Amber Nagar0100310310310000Indra Nagar0100370370802900Arundathi Nagar0100150150150000Shamsher Gunj
12.90387.097314274240300Shivaji Nagar1000373700037000Amber Nagar0100200200200000Indra Nagar010012012000903Bholakpur
9.67790.323313280232303Medhar Basti010030030029001Jiyaguda0100330330003201Amber Nagar0100350350402902Arundathi Nagar0100500500470003Jiyaguda0100170170001403Thalla Basti0100350350003203Shivaji Nagar
1000262602024000Amber Nagar0100180180101403Bhoiguda0100200200401600Fathesh Nagar
0100280280270001Laxmi NarsimhaNagar
010012012020703BholakpurNILWNLTotalNILWNLNILWNLNILWNLNILWNL
% of Samples# of SamplesHTPTPSPIdentified Slum
RC Level
The Institute of Health Systems , HACA Bhavan, Hyderabad, AP 500004 Page 50 of 74
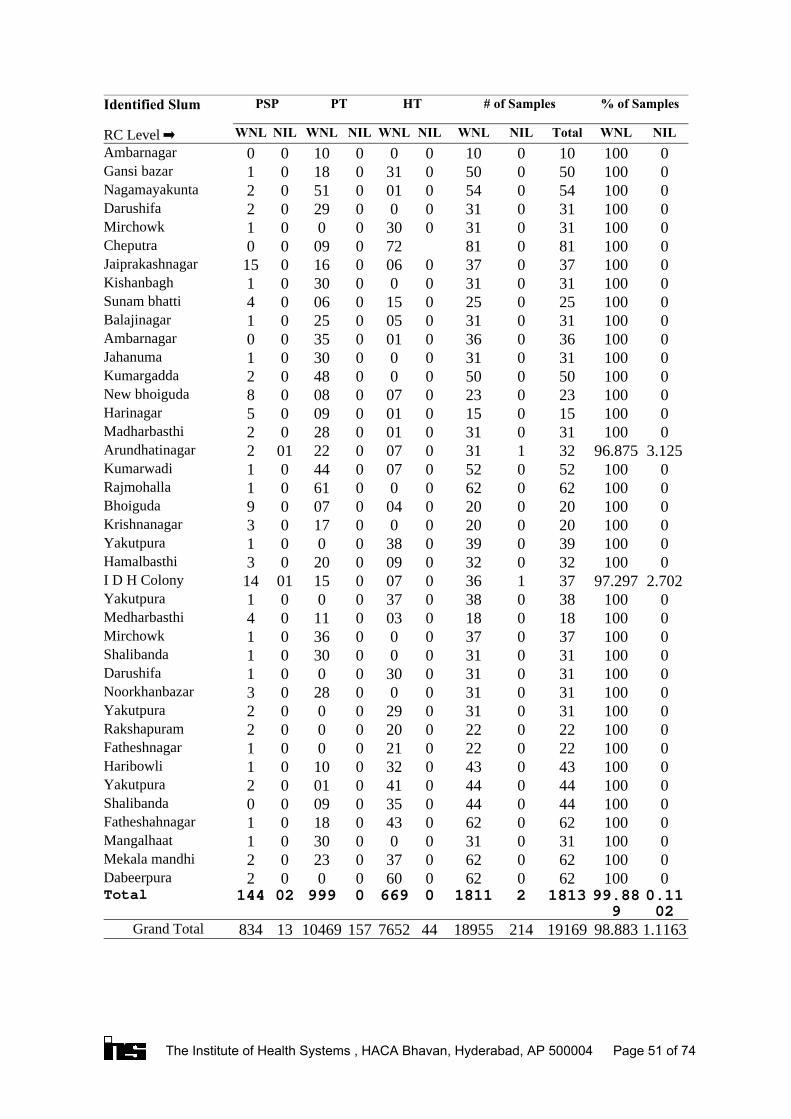
1.116398.88319169214189554476521571046913834Grand Total
0.1102
99.889
1813218110669099902144Total0100620620600002Dabeerpura01006206203702302Mekala mandhi0100310310003001Mangalhaat01006206204301801Fatheshahnagar01004404403500900Shalibanda01004404404100102Yakutpura01004304303201001Haribowli0100220220210001Fatheshnagar0100220220200002Rakshapuram0100310310290002Yakutpura0100310310002803Noorkhanbazar0100310310300001Darushifa0100310310003001Shalibanda0100370370003601Mirchowk01001801800301104Medharbasthi0100380380370001Yakutpura
2.70297.297371360070150114I D H Colony01003203200902003Hamalbasthi0100390390380001Yakutpura0100200200001703Krishnanagar01002002000400709Bhoiguda0100620620006101Rajmohalla01005205200704401Kumarwadi
3.12596.87532131007022012Arundhatinagar01003103100102802Madharbasthi01001501500100905Harinagar01002302300700808New bhoiguda0100500500004802Kumargadda0100310310003001Jahanuma01003603600103500Ambarnagar01003103100502501Balajinagar01002502501500604Sunam bhatti0100310310003001Kishanbagh010037037006016015Jaiprakashnagar0100810817200900Cheputra0100310310300001Mirchowk 0100310310002902Darushifa01005405400105102Nagamayakunta01005005003101801Gansi bazar0100100100001000Ambarnagar
NILWNLTotalNILWNLNILWNLNILWNLNILWNL
% of Samples# of SamplesHTPTPSPIdentified Slum
RC Level
The Institute of Health Systems , HACA Bhavan, Hyderabad, AP 500004 Page 51 of 74

Annexure-4: Possible Causes of UnsatisfactoryChlorination in the Distribution System of Slums
H.No# 1-4-554/8/A, 1-4-551/27. There is very low
houses get the water after other households which use
Tajir NagarII
There is intermittent supply in this area, The water
There are two houses with door no's 18-3-146/A and
water from home
Shiva GanganagarII
Improper chlorination, informed at Asifnagar Filter Bedsand has been rectified
Madannapet MandiIIPollution at H.No#15-6-670 Pit tapKamalnagarI
Pit tap H.No#5-7-80/1. The initially supplied water isturbid with no chlorine, subsequently monitored houseshad satisfactory chlorine levels
BhagwangunjIPollution at Pit Tap in H.No#23-2-350/ABibi bazarI
chlorine was found in H.No#.17-4-264, Trace RC withturbid water in H.No#.17-4-268,17-4-288
DabeerpuraIthe second time to the section manager
PottiSriramulu NagarIthe section manager
Potti Sriramulu NagarI
The supply is from miralam filters 19-2-220. There is greatfall of chlorine level during the end of supply
TadbanI
The water supplied here is turbid with bad smell. Thehouse number 19-1-591/A/2 has a pit tap which may be
very high number of sewerage overflows. During thesupply hours the water flows on to the roads causinginconvenience to the pedestrians
DoodhBowliI
There is a PSP which is not showing chlorine whenever
informed that the tap will be changed very soon
Potti Sriramulu NagarI
Many people here complained of the quality of watersupplied and illnesses they had. When RC was checkedafter 20 minutes of supply two points were found tounsatisfactory
Gulshan NagarI
Pollution at Pit Taps in H.No#. 19-2-248/33,19-2-248/36/B
Chandulal BaradariI
Possible Cause of PollutionIdentified SlumDivision
The Institute of Health Systems , HACA Bhavan, Hyderabad, AP 500004 Page 52 of 74
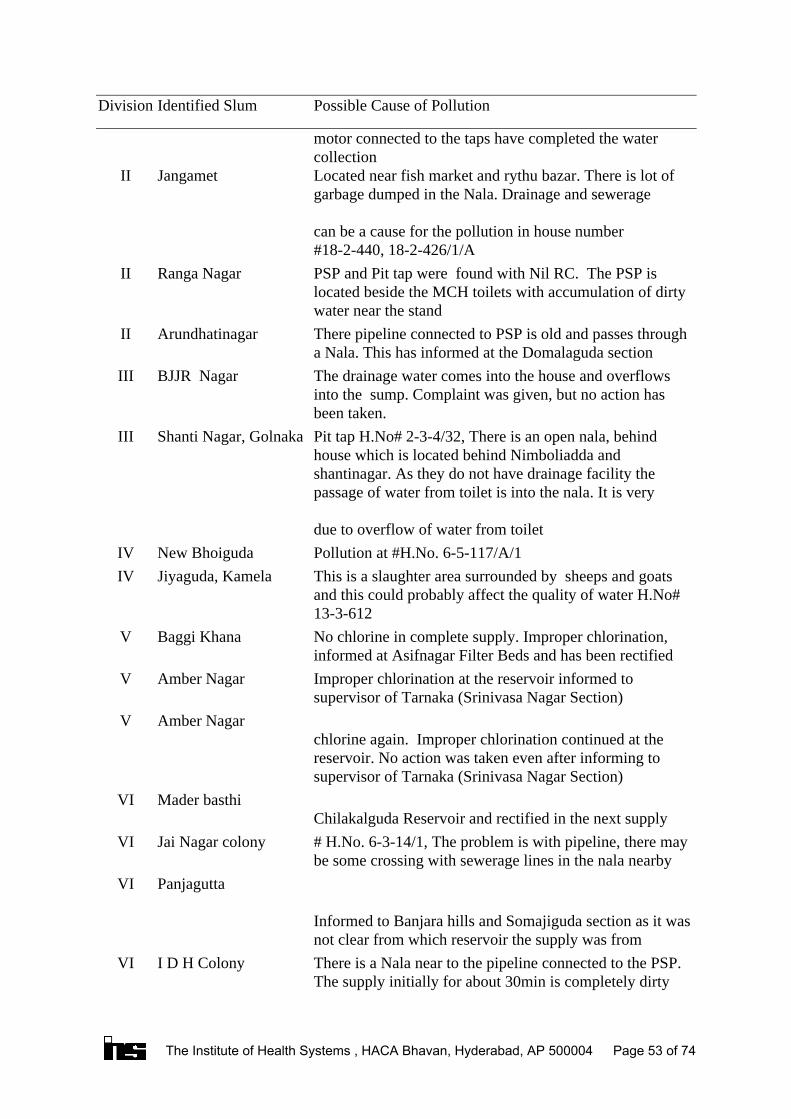
There is a Nala near to the pipeline connected to the PSP.The supply initially for about 30min is completely dirty
I D H ColonyVI
Informed to Banjara hills and Somajiguda section as it wasnot clear from which reservoir the supply was from
PanjaguttaVI
# H.No. 6-3-14/1, The problem is with pipeline, there maybe some crossing with sewerage lines in the nala nearby
Jai Nagar colonyVIChilakalguda Reservoir and rectified in the next supply
Mader basthiVI
chlorine again. Improper chlorination continued at thereservoir. No action was taken even after informing tosupervisor of Tarnaka (Srinivasa Nagar Section)
Amber NagarV
Improper chlorination at the reservoir informed tosupervisor of Tarnaka (Srinivasa Nagar Section)
Amber NagarV
No chlorine in complete supply. Improper chlorination,informed at Asifnagar Filter Beds and has been rectified
Baggi KhanaV
This is a slaughter area surrounded by sheeps and goatsand this could probably affect the quality of water H.No# 13-3-612
Jiyaguda, KamelaIVPollution at #H.No. 6-5-117/A/1New BhoigudaIV
Pit tap H.No# 2-3-4/32, There is an open nala, behindhouse which is located behind Nimboliadda andshantinagar. As they do not have drainage facility thepassage of water from toilet is into the nala. It is very
due to overflow of water from toilet
Shanti Nagar, GolnakaIII
The drainage water comes into the house and overflowsinto the sump. Complaint was given, but no action hasbeen taken.
BJJR NagarIII
There pipeline connected to PSP is old and passes througha Nala. This has informed at the Domalaguda section
ArundhatinagarII
PSP and Pit tap were found with Nil RC. The PSP islocated beside the MCH toilets with accumulation of dirtywater near the stand
Ranga NagarII
Located near fish market and rythu bazar. There is lot ofgarbage dumped in the Nala. Drainage and sewerage
can be a cause for the pollution in house number#18-2-440, 18-2-426/1/A
JangametII
motor connected to the taps have completed the watercollection
Possible Cause of PollutionIdentified SlumDivision
The Institute of Health Systems , HACA Bhavan, Hyderabad, AP 500004 Page 53 of 74
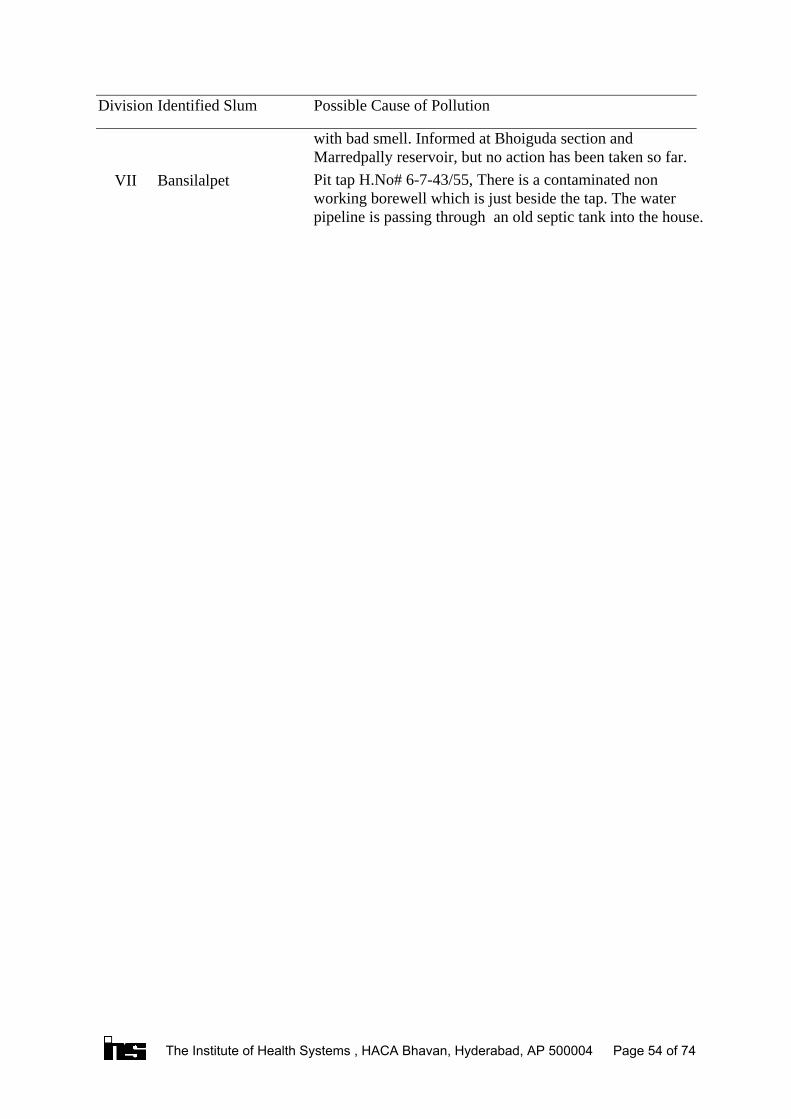
Pit tap H.No# 6-7-43/55, There is a contaminated nonworking borewell which is just beside the tap. The waterpipeline is passing through an old septic tank into the house.
BansilalpetVII
with bad smell. Informed at Bhoiguda section andMarredpally reservoir, but no action has been taken so far.
Possible Cause of PollutionIdentified SlumDivision
The Institute of Health Systems , HACA Bhavan, Hyderabad, AP 500004 Page 54 of 74
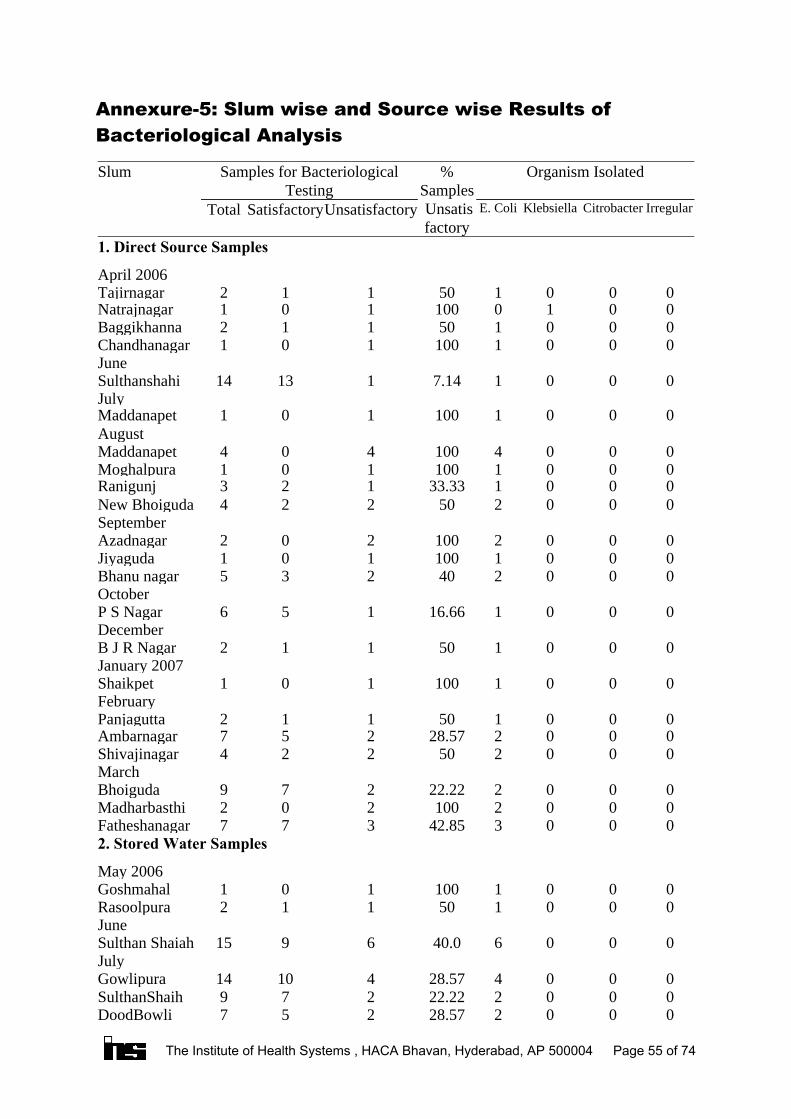
Annexure-5: Slum wise and Source wise Results ofBacteriological Analysis
000228.57257DoodBowli000222.22279SulthanShaih000428.5741014Gowlipura
July000640.06915Sulthan Shaiah
June000150112Rasoolpura0001100101Goshmahal
May 2006
2. Stored Water Samples000342.85377Fatheshanagar0002100202Madharbasthi000222.22279Bhoiguda
March 000250224Shivajinagar000228.57257Ambarnagar000150112Panjagutta
February0001100101Shaikpet
January 2007000150112B J R Nagar
December000116.66156P S Nagar
October000240235Bhanu nagar0001100101Jiyaguda 0002100202Azadnagar
September000250224New Bhoiguda000133.33123Ranigunj0001100101Moghalpura0004100404Maddanapet
August0001100101Maddanapet
July00017.1411314Sulthanshahi
June0001100101Chandhanagar000150112Baggikhanna0010100101Natrajnagar000150112Tajirnagar
April 2006
1. Direct Source Samples
IrregularCitrobacterKlebsiellaE. ColiUnsatisfactorySatisfactoryTotal
Organism Isolated%Samples Unsatisfactory
Samples for BacteriologicalTesting
Slum
The Institute of Health Systems , HACA Bhavan, Hyderabad, AP 500004 Page 55 of 74

February00000044Ravindranagar00000033Lakshmi00000044Bapujinagar000125134Mettuguda
January 20070003100303Ahmednagar0001100101Nehrunagar000480.0415Pochammabast
October0004100404Indranagar000150112Mallepally0001100101Begumpet
September0001100101Mathajinagar000150112Bramanwadi000150112Ambedkarnagar0011100202B S Mqtha0001100101Zaheranagar 0001100101Moghalpura000266.66213Fathe Maidhan
August1001100202Jahangirnagar1001100202Gowlipura1000100101Saidabad1111100404Maddannapet
July000116.6156Moghalpura1001100202Goshmahal1000100101Jimratbazar
May100275.0314Chandhanagar1000100101Goshmahal1002100303Jhangirnagar1000100101Bapujinagar1001100202Gowlipura0100100101Saidabad120588.88819Maddannapet000150112Laldarwaza0001100101Sulthan shahi
April 2006
3. Borewell Samples000150112Sulthan shahi
August0002100202Maharajgunj000150112Nawasabkunta
IrregularCitrobacterKlebsiellaE. ColiUnsatisfactorySatisfactoryTotal
Organism Isolated%Samples Unsatisfactory
Samples for BacteriologicalTesting
Slum
The Institute of Health Systems , HACA Bhavan, Hyderabad, AP 500004 Page 56 of 74

0010100101Biramalguda0020100202Darusalam0010100101Osmangunj100166.66213Khairthabad0010100101Lakdikapool101066.66213Karmanghat300150448Jiyaguda100020145Chandrayangutt200050224Falaknuma
May001050112Chandhanagar1001100202Chandrayangutt1011100303M S Maqtha1012100404Khairthabad100050112Jiyaguda1000100101Goshmahal0001100101Yakutpura1000100101Gowlipura200040235Nampally100050112Mehdipatnam100050101Gudimalkpur000150101Talabkatta0010100101M J Market000325314Afzalgunj0001100101Laldarwaza000150112saidabad100016.66156Aliyabad0012100303I S Sadan
April0001100101Alibagh2000100202Haffezbabanag101066.66213Musherabad000150112Chinthal basthi1000100101Bela1000100101Uppuguda0001100134Laldarwaza
March 2006
4. Street Vendor Samples0021100303Dhanaihnagar000787.5718Kattelamandhi000125134Parsigutta
March 0001100112Kumarwadibast0010100101Pamulabasthi0020100202Pochammabast0007100707Bagh Amberpet
IrregularCitrobacterKlebsiellaE. ColiUnsatisfactorySatisfactoryTotal
Organism Isolated%Samples Unsatisfactory
Samples for BacteriologicalTesting
Slum
The Institute of Health Systems , HACA Bhavan, Hyderabad, AP 500004 Page 57 of 74
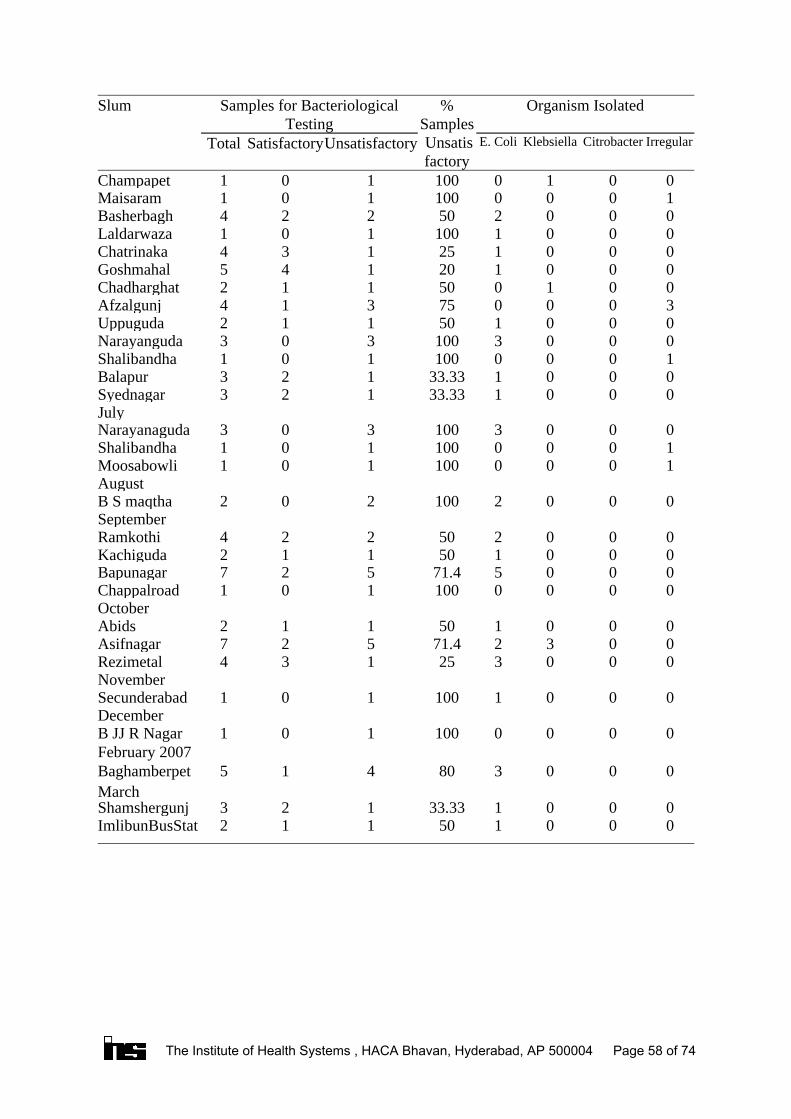
000150112ImlibunBusStat000133.33123Shamshergunj
March000380415Baghamberpet
February 2007 0000100101B JJ R Nagar
December0001100101Secunderabad
November000325134Rezimetal003271.4527Asifnagar000150112Abids
October0000100101Chappalroad000571.4527Bapunagar000150112Kachiguda000250224Ramkothi
September0002100202B S maqtha
August1000100101Moosabowli1000100101Shalibandha0003100303Narayanaguda
July000133.33123Syednagar000133.33123Balapur1000100101Shalibandha0003100303Narayanguda000150112Uppuguda300075314Afzalgunj001050112Chadharghat000120145Goshmahal000125134Chatrinaka0001100101Laldarwaza000250224Basherbagh1000100101Maisaram0010100101Champapet
IrregularCitrobacterKlebsiellaE. ColiUnsatisfactorySatisfactoryTotal
Organism Isolated%Samples Unsatisfactory
Samples for BacteriologicalTesting
Slum
The Institute of Health Systems , HACA Bhavan, Hyderabad, AP 500004 Page 58 of 74

Annexure-6 : List of Sewerage Overflows Identified
1 -388Moghalpura I1 #19-4-270/B/48 Nawabsabkuntta I2 #19-4-280,20-7-573 Doodbowli I
3 #18-7-640,18-7-656/15,18-7-65613.
Chatrinaka II219-1-801,19-1-759. Doodhbowli I
3#18-2-60/83/1,18-2-60/81,20-7-700/A,
Ambedkar nagar II
3#23-6-852/13,23-6-877,23-4-940/a,
Shalibanda I
12#23-6-132/1,23-6-130,20-5-109,20-5-36/A/1,23-6-543/A,23-4-305/1,23-4-296,23-4-281,23-3-563,23-3-499,
Gowlipura I
1318-9--9/49,18-7-181/22,18-7-173,18-7-181/34,18-7-78,18-7-82,18-7-656/12/A,18-6-1119/1,18-6-1122/1,18-6-1122/A,18-6-1115,18-6-1119/1/A
Gowlipura II38-4-310/A,18-4-322,18-9-54 Sultanshahi II
2023-4-195,,20-5-26,23-4-12,23-4-27/A,23-1-852,23-1-846,23-4-65,23-4-173,23-4-49,23-4-237,23-4-449/450,23-4-178,23-4-162,23-4-724,23-4-165,23-3-459/1,23-4-1/1/37,23-4-229,234-229
Sultanshahi IJune2 23-6-904,23-6-655 ChandulalBaradari I1 NewReservoir(Opp) Bholakpur VII2 13-4-274,13-4-312/1 JiyagudaIIIMay
2 BesideNewSaharaDrivingSchool (Opp),BesideBoystownSchool
Jahanuma I1 -531 Kothi IV1 1-4-554/441B(Opp) Tajirnagar V
2 #14-1-187/1,NrHanumanTemple,13-1-749/1, HanumanTemple
Karwan III1 SunnyGarden(Opp) Poolbagh IVApril1 Opp.Bustop Ngl.X Road Bus Stop II
1 Opp.Bustop Lothkunta Bus Stop
XII1 #1-4-35/A/310 Bholakpur VII1 NearAPSEB Chanchalguda II1 #19-2-81/E/1/1 Kajapahad I1 #19-2-21/53/2 Jahanuma IMarch-06
No of SewerageOverflows
Address Slum DivisionMonth
The Institute of Health Systems , HACA Bhavan, Hyderabad, AP 500004 Page 59 of 74
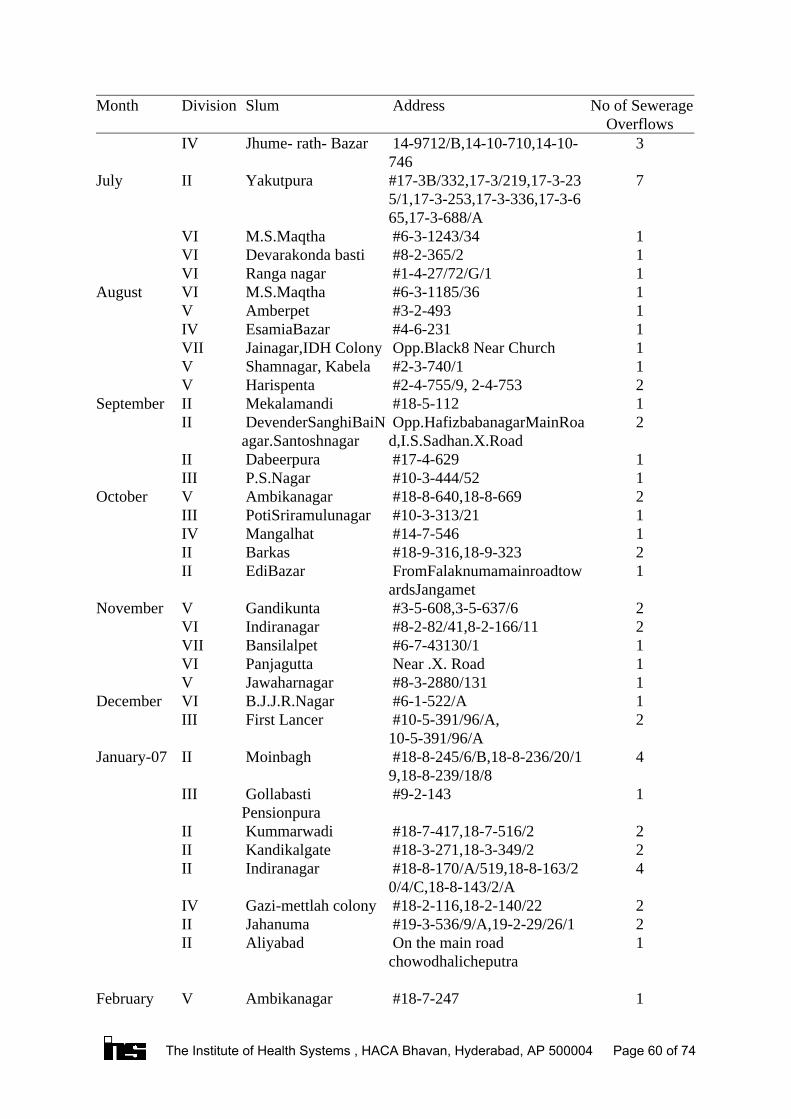
1 #18-7-247 Ambikanagar VFebruary
1 On the main roadchowodhalicheputra
Aliyabad II2 #19-3-536/9/A,19-2-29/26/1 Jahanuma II2 #18-2-116,18-2-140/22 Gazi-mettlah colony IV
4 #18-8-170/A/519,18-8-163/20/4/C,18-8-143/2/A
Indiranagar II2 #18-3-271,18-3-349/2 Kandikalgate II2 #18-7-417,18-7-516/2 Kummarwadi II
1 #9-2-143 GollabastiPensionpura
III
4 #18-8-245/6/B,18-8-236/20/19,18-8-239/18/8
Moinbagh IIJanuary-07
2 #10-5-391/96/A,10-5-391/96/A
First Lancer III1 #6-1-522/A B.J.J.R.Nagar VIDecember1 #8-3-2880/131 Jawaharnagar V1 Near .X. Road Panjagutta VI1 #6-7-43130/1 Bansilalpet VII2 #8-2-82/41,8-2-166/11 Indiranagar VI2 #3-5-608,3-5-637/6 Gandikunta VNovember
1 FromFalaknumamainroadtowardsJangamet
EdiBazar II2 #18-9-316,18-9-323 Barkas II1 #14-7-546 Mangalhat IV1 #10-3-313/21 PotiSriramulunagar III2 #18-8-640,18-8-669 Ambikanagar VOctober1 #10-3-444/52 P.S.Nagar III1 #17-4-629 Dabeerpura II
2 Opp.HafizbabanagarMainRoad,I.S.Sadhan.X.Road
DevenderSanghiBaiNagar.Santoshnagar
II1 #18-5-112 Mekalamandi IISeptember2 #2-4-755/9, 2-4-753 Harispenta V1 #2-3-740/1 Shamnagar, Kabela V1 Opp.Black8 Near Church Jainagar,IDH Colony VII1 #4-6-231 EsamiaBazar IV1 #3-2-493 Amberpet V1 #6-3-1185/36 M.S.Maqtha VIAugust1 #1-4-27/72/G/1 Ranga nagar VI1 #8-2-365/2 Devarakonda basti VI1 #6-3-1243/34 M.S.Maqtha VI
7#17-3B/332,17-3/219,17-3-235/1,17-3-253,17-3-336,17-3-665,17-3-688/A
Yakutpura IIJuly
3 14-9712/B,14-10-710,14-10-746
Jhume- rath- Bazar IV
No of SewerageOverflows
Address Slum DivisionMonth
The Institute of Health Systems , HACA Bhavan, Hyderabad, AP 500004 Page 60 of 74
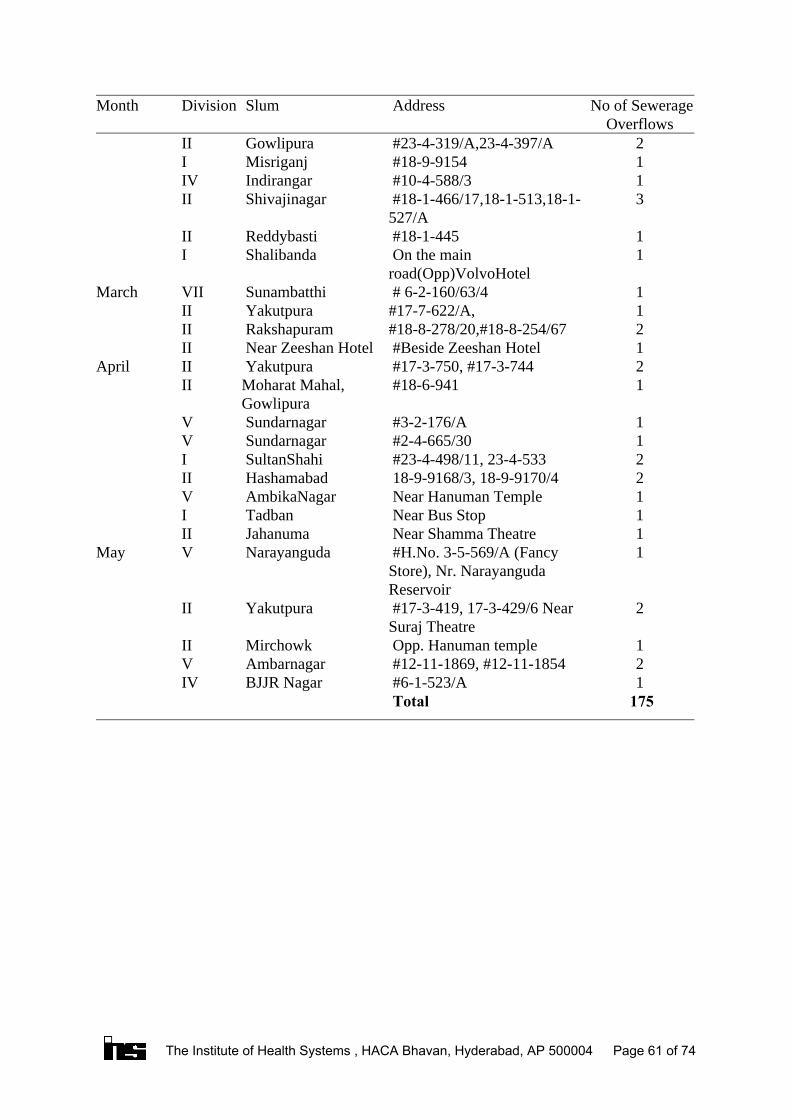
175 Total 1 #6-1-523/A BJJR Nagar IV2 #12-11-1869, #12-11-1854 Ambarnagar V1 Opp. Hanuman temple Mirchowk II
2 #17-3-419, 17-3-429/6 NearSuraj Theatre
Yakutpura II
1 #H.No. 3-5-569/A (FancyStore), Nr. NarayangudaReservoir
Narayanguda VMay 1 Near Shamma Theatre Jahanuma II1 Near Bus Stop Tadban I1 Near Hanuman Temple AmbikaNagar V2 18-9-9168/3, 18-9-9170/4 Hashamabad II2 #23-4-498/11, 23-4-533 SultanShahi I1 #2-4-665/30 Sundarnagar V1 #3-2-176/A Sundarnagar V
1 #18-6-941Moharat Mahal,Gowlipura
II2 #17-3-750, #17-3-744 Yakutpura IIApril1 #Beside Zeeshan Hotel Near Zeeshan Hotel II2#18-8-278/20,#18-8-254/67 Rakshapuram II1#17-7-622/A, Yakutpura II1 # 6-2-160/63/4 Sunambatthi VIIMarch
1 On the mainroad(Opp)VolvoHotel
Shalibanda I1 #18-1-445 Reddybasti II
3 #18-1-466/17,18-1-513,18-1-527/A
Shivajinagar II1 #10-4-588/3 Indirangar IV1 #18-9-9154 Misriganj I2 #23-4-319/A,23-4-397/A Gowlipura II
No of SewerageOverflows
Address Slum DivisionMonth
The Institute of Health Systems , HACA Bhavan, Hyderabad, AP 500004 Page 61 of 74
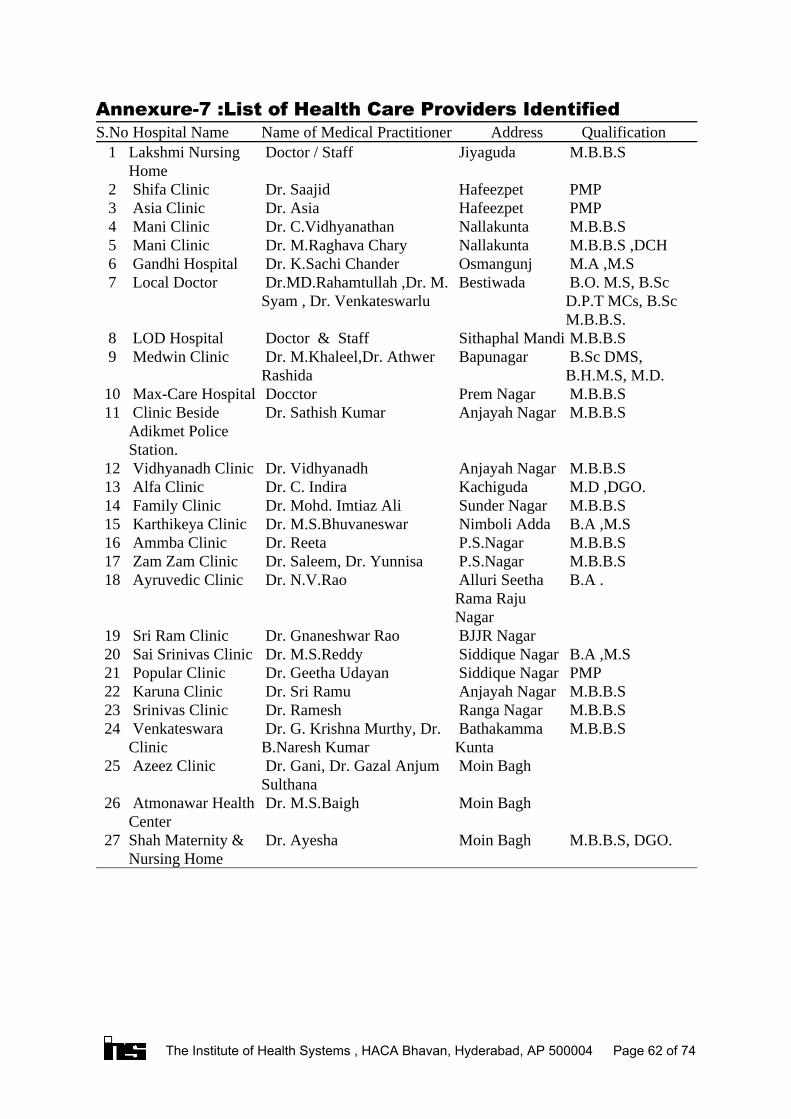
Annexure-7 :List of Health Care Providers Identified
M.B.B.S, DGO. Moin Bagh Dr. AyeshaShah Maternity &Nursing Home
27
Moin Bagh Dr. M.S.Baigh Atmonawar HealthCenter
26
Moin Bagh Dr. Gani, Dr. Gazal AnjumSulthana
Azeez Clinic25
M.B.B.S BathakammaKunta
Dr. G. Krishna Murthy, Dr.B.Naresh Kumar
VenkateswaraClinic
24 M.B.B.S Ranga Nagar Dr. Ramesh Srinivas Clinic23 M.B.B.S Anjayah Nagar Dr. Sri Ramu Karuna Clinic22 PMP Siddique Nagar Dr. Geetha Udayan Popular Clinic21 B.A ,M.S Siddique Nagar Dr. M.S.Reddy Sai Srinivas Clinic20
BJJR Nagar Dr. Gnaneshwar Rao Sri Ram Clinic19
B.A . Alluri SeethaRama RajuNagar
Dr. N.V.Rao Ayruvedic Clinic18 M.B.B.S P.S.Nagar Dr. Saleem, Dr. Yunnisa Zam Zam Clinic17 M.B.B.S P.S.Nagar Dr. Reeta Ammba Clinic16 B.A ,M.S Nimboli Adda Dr. M.S.Bhuvaneswar Karthikeya Clinic15 M.B.B.S Sunder Nagar Dr. Mohd. Imtiaz Ali Family Clinic14 M.D ,DGO. Kachiguda Dr. C. Indira Alfa Clinic13 M.B.B.S Anjayah Nagar Dr. Vidhyanadh Vidhyanadh Clinic12
M.B.B.S Anjayah Nagar Dr. Sathish Kumar Clinic BesideAdikmet PoliceStation.
11 M.B.B.S Prem Nagar Docctor Max-Care Hospital10
B.Sc DMS,B.H.M.S, M.D.
Bapunagar Dr. M.Khaleel,Dr. AthwerRashida
Medwin Clinic9 M.B.B.S Sithaphal Mandi Doctor & Staff LOD Hospital8
B.O. M.S, B.ScD.P.T MCs, B.ScM.B.B.S.
Bestiwada Dr.MD.Rahamtullah ,Dr. M.Syam , Dr. Venkateswarlu
Local Doctor7 M.A ,M.S Osmangunj Dr. K.Sachi Chander Gandhi Hospital6 M.B.B.S ,DCH Nallakunta Dr. M.Raghava Chary Mani Clinic5 M.B.B.S Nallakunta Dr. C.Vidhyanathan Mani Clinic4 PMP Hafeezpet Dr. Asia Asia Clinic3 PMP Hafeezpet Dr. Saajid Shifa Clinic2
M.B.B.S Jiyaguda Doctor / StaffLakshmi NursingHome
1 Qualification AddressName of Medical Practitioner Hospital NameS.No
The Institute of Health Systems , HACA Bhavan, Hyderabad, AP 500004 Page 62 of 74
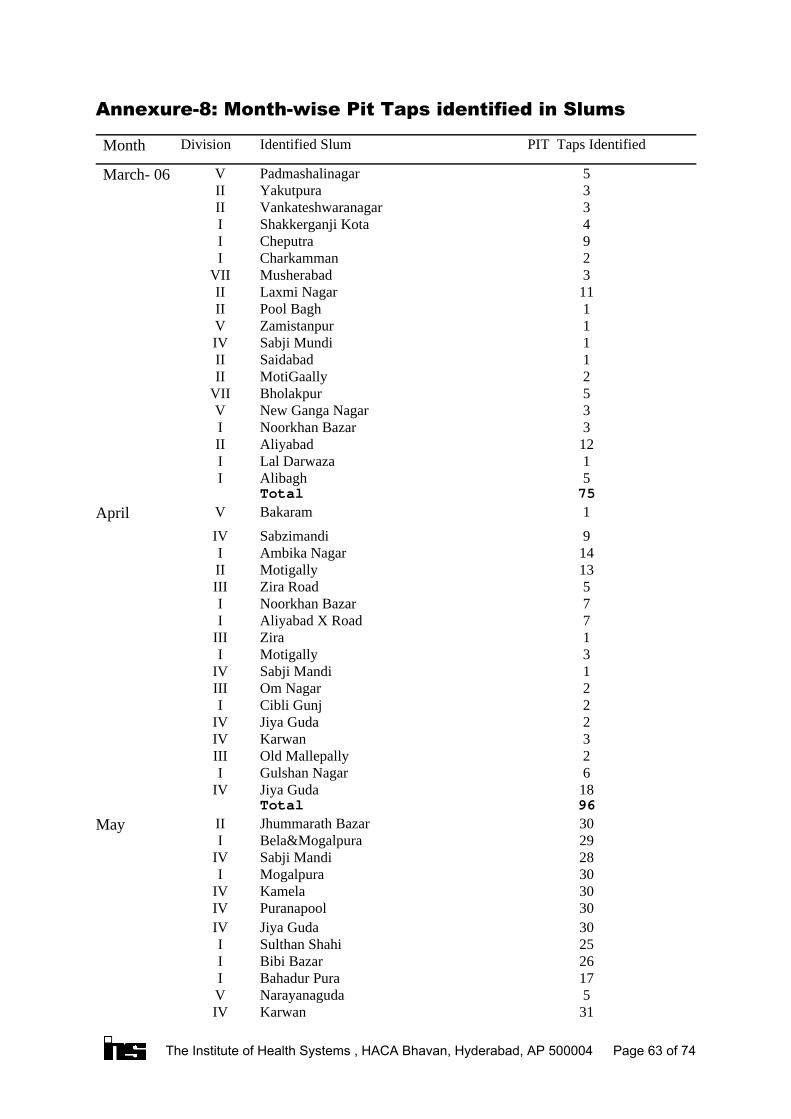
Annexure-8: Month-wise Pit Taps identified in Slums
31KarwanIV5NarayanagudaV
17Bahadur PuraI26Bibi BazarI25Sulthan ShahiI30Jiya GudaIV30PuranapoolIV30KamelaIV30MogalpuraI28Sabji MandiIV29Bela&MogalpuraI30Jhummarath BazarIIMay96Total18Jiya GudaIV6Gulshan NagarI2Old MallepallyIII3KarwanIV2Jiya GudaIV2Cibli GunjI2Om NagarIII1Sabji MandiIV3MotigallyI1ZiraIII7Aliyabad X RoadI7Noorkhan BazarI5Zira RoadIII
13Motigally II14Ambika NagarI9Sabzimandi IV
1BakaramVApril75Total5AlibaghI1Lal DarwazaI
12AliyabadII3Noorkhan BazarI3New Ganga NagarV5BholakpurVII2MotiGaallyII1SaidabadII1Sabji MundiIV1ZamistanpurV1Pool BaghII
11Laxmi NagarII3MusherabadVII2CharkammanI9CheputraI4Shakkerganji KotaI3VankateshwaranagarII3YakutpuraII5PadmashalinagarVMarch- 06
PIT Taps IdentifiedIdentified SlumDivisionMonth
The Institute of Health Systems , HACA Bhavan, Hyderabad, AP 500004 Page 63 of 74
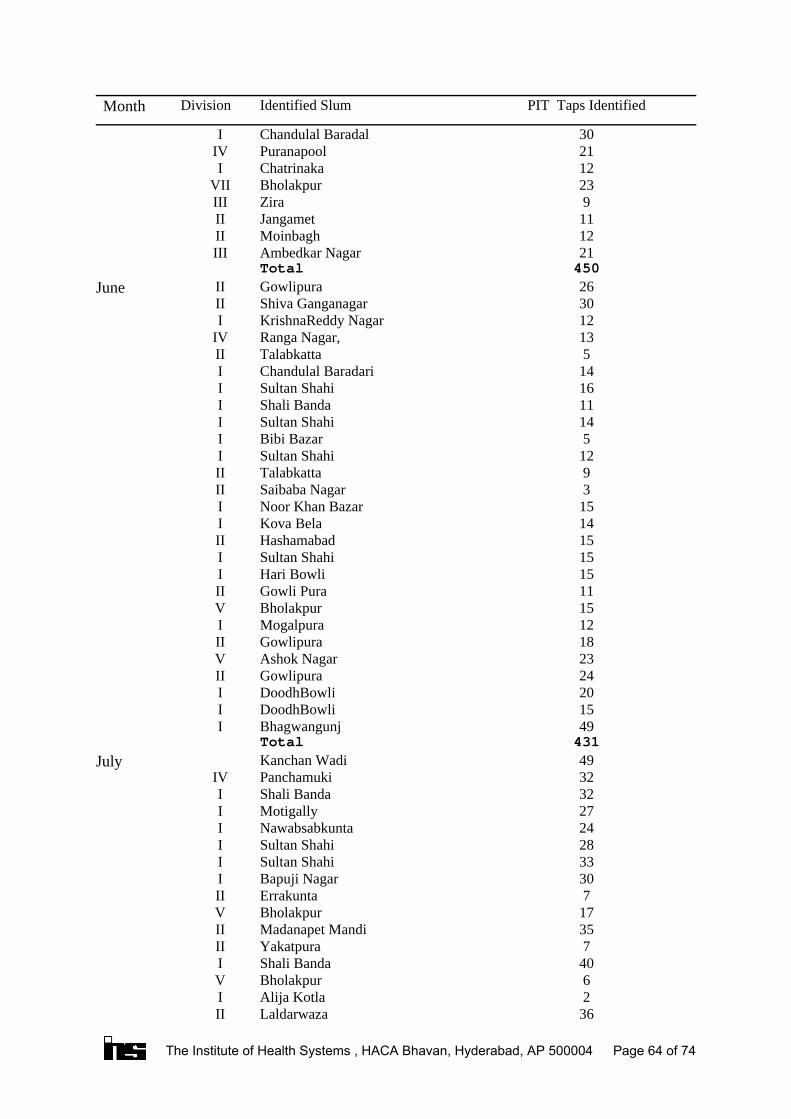
36LaldarwazaII2Alija KotlaI6BholakpurV
40Shali BandaI7YakatpuraII
35Madanapet MandiII17BholakpurV7ErrakuntaII
30Bapuji NagarI33Sultan ShahiI28Sultan ShahiI24NawabsabkuntaI27MotigallyI32Shali BandaI32PanchamukiIV49Kanchan WadiJuly
431Total49BhagwangunjI15DoodhBowliI20DoodhBowliI24GowlipuraII23Ashok NagarV18GowlipuraII12MogalpuraI15Bholakpur V11Gowli PuraII15Hari BowliI15Sultan ShahiI15HashamabadII14Kova BelaI15Noor Khan BazarI3Saibaba NagarII9TalabkattaII
12Sultan ShahiI5Bibi BazarI
14Sultan ShahiI11Shali BandaI16Sultan ShahiI14Chandulal BaradariI5TalabkattaII
13Ranga Nagar,IV12KrishnaReddy NagarI30Shiva GanganagarII26GowlipuraIIJune
450Total21Ambedkar NagarIII12MoinbaghII11JangametII9ZiraIII
23BholakpurVII12ChatrinakaI21PuranapoolIV30Chandulal BaradalI
PIT Taps IdentifiedIdentified SlumDivisionMonth
The Institute of Health Systems , HACA Bhavan, Hyderabad, AP 500004 Page 64 of 74
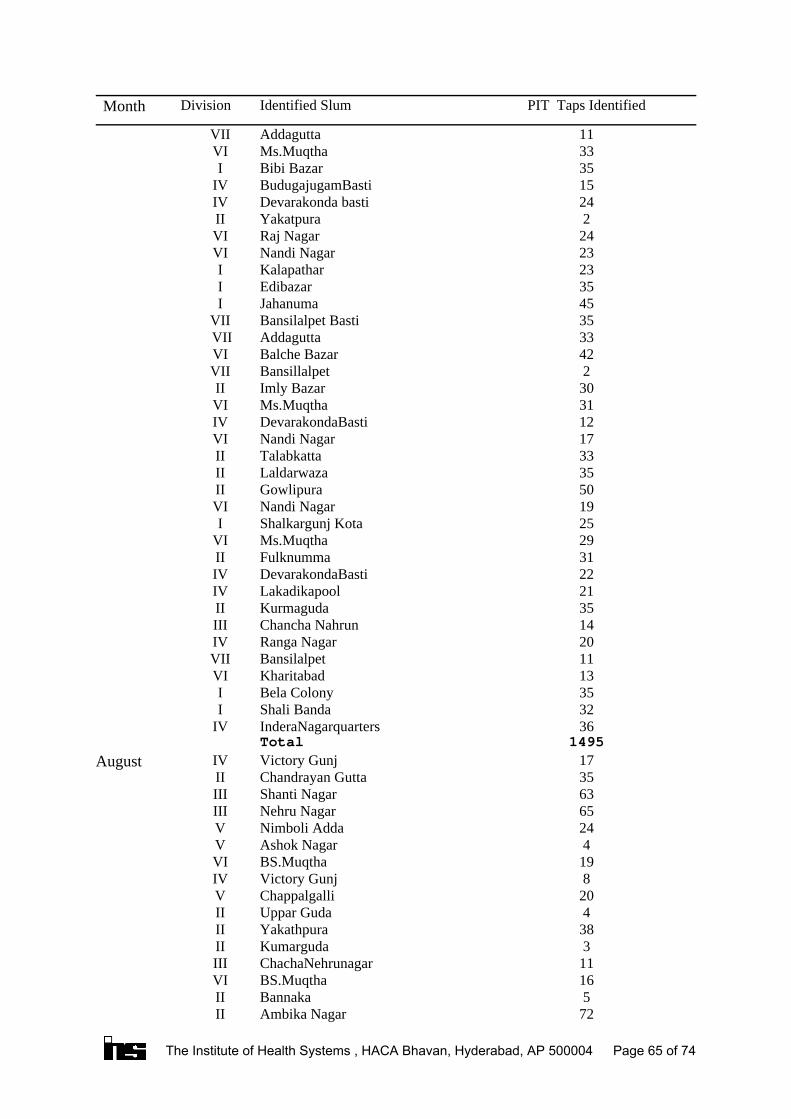
72Ambika NagarII5BannakaII
16BS.MuqthaVI11ChachaNehrunagarIII3KumargudaII
38YakathpuraII4Uppar GudaII
20ChappalgalliV8Victory GunjIV
19BS.MuqthaVI4Ashok NagarV
24Nimboli AddaV65Nehru NagarIII63Shanti NagarIII35Chandrayan GuttaII17Victory GunjIVAugust
1495Total36InderaNagarquartersIV32Shali BandaI35Bela ColonyI13KharitabadVI11BansilalpetVII20Ranga NagarIV14Chancha NahrunIII35KurmagudaII21LakadikapoolIV22DevarakondaBastiIV31FulknummaII29Ms.MuqthaVI25Shalkargunj KotaI19Nandi NagarVI50GowlipuraII35LaldarwazaII33TalabkattaII17Nandi NagarVI12DevarakondaBastiIV31Ms.MuqthaVI30Imly BazarII2BansillalpetVII
42Balche BazarVI33Addagutta VII35Bansilalpet BastiVII45JahanumaI35EdibazarI23KalapatharI23Nandi NagarVI24Raj NagarVI2YakatpuraII
24Devarakonda bastiIV15BudugajugamBastiIV35Bibi BazarI33Ms.MuqthaVI11AddaguttaVII
PIT Taps IdentifiedIdentified SlumDivisionMonth
The Institute of Health Systems , HACA Bhavan, Hyderabad, AP 500004 Page 65 of 74
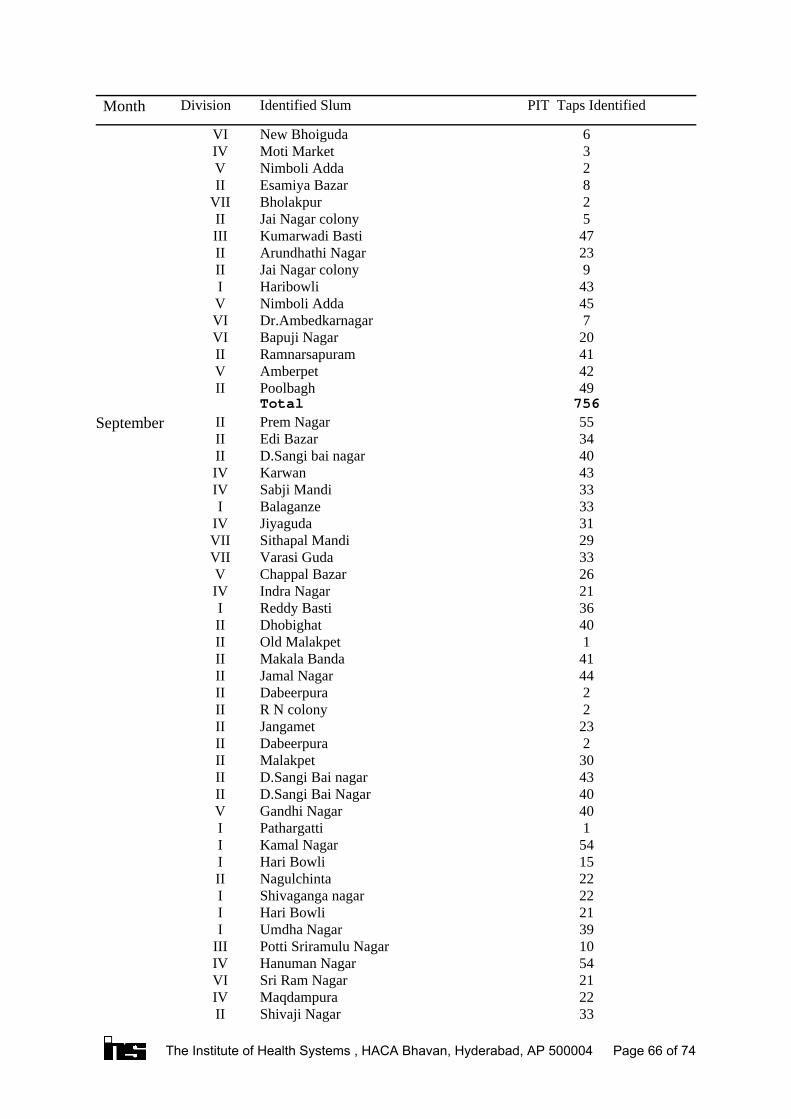
33Shivaji NagarII22MaqdampuraIV21Sri Ram NagarVI54Hanuman NagarIV10Potti Sriramulu NagarIII39Umdha NagarI21Hari BowliI22Shivaganga nagarI22NagulchintaII15Hari BowliI54Kamal NagarI1PathargattiI
40Gandhi NagarV40D.Sangi Bai NagarII43D.Sangi Bai nagarII30MalakpetII2DabeerpuraII
23JangametII2R N colonyII2DabeerpuraII
44Jamal NagarII41Makala BandaII1Old MalakpetII
40DhobighatII36Reddy BastiI21Indra NagarIV26Chappal BazarV33Varasi GudaVII29Sithapal MandiVII31JiyagudaIV33BalaganzeI33Sabji MandiIV43KarwanIV40D.Sangi bai nagarII34Edi BazarII55Prem NagarIISeptember
756Total49PoolbaghII42AmberpetV41RamnarsapuramII20Bapuji NagarVI7Dr.AmbedkarnagarVI
45Nimboli AddaV43HaribowliI9Jai Nagar colonyII
23Arundhathi NagarII47Kumarwadi BastiIII5Jai Nagar colonyII2BholakpurVII8Esamiya BazarII2Nimboli AddaV3Moti MarketIV6New BhoigudaVI
PIT Taps IdentifiedIdentified SlumDivisionMonth
The Institute of Health Systems , HACA Bhavan, Hyderabad, AP 500004 Page 66 of 74
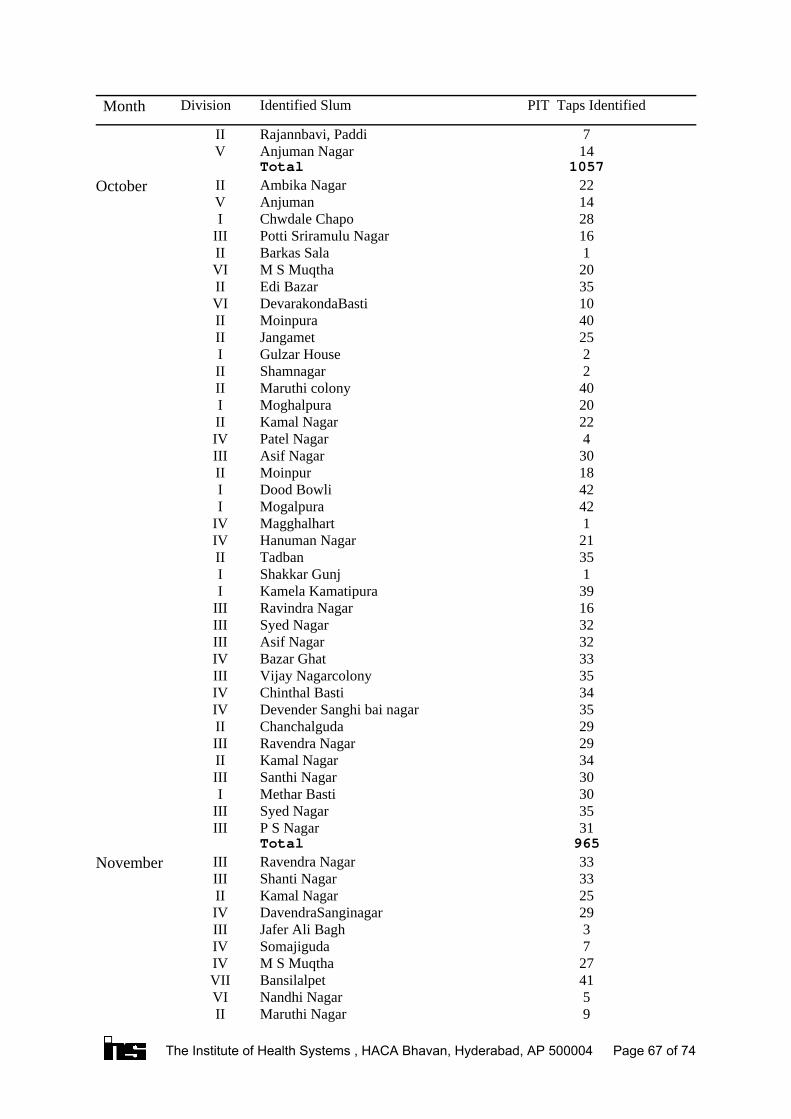
9Maruthi NagarII5Nandhi NagarVI
41BansilalpetVII27M S MuqthaIV7SomajigudaIV3Jafer Ali BaghIII
29DavendraSanginagarIV25Kamal NagarII33Shanti NagarIII33Ravendra NagarIIINovember
965Total31P S NagarIII35Syed NagarIII30Methar BastiI30Santhi NagarIII34Kamal NagarII29Ravendra NagarIII29ChanchalgudaII35Devender Sanghi bai nagar IV34Chinthal BastiIV35Vijay NagarcolonyIII33Bazar GhatIV32Asif NagarIII32Syed NagarIII16Ravindra NagarIII39Kamela KamatipuraI1Shakkar GunjI
35TadbanII21Hanuman NagarIV1MagghalhartIV
42MogalpuraI42Dood BowliI18MoinpurII30Asif NagarIII4Patel NagarIV
22Kamal NagarII20MoghalpuraI40Maruthi colonyII2ShamnagarII2Gulzar HouseI
25JangametII40MoinpuraII10DevarakondaBastiVI35Edi BazarII20M S MuqthaVI1Barkas SalaII
16Potti Sriramulu NagarIII28Chwdale ChapoI14AnjumanV22Ambika NagarIIOctober
1057Total14Anjuman NagarV7Rajannbavi, PaddiII
PIT Taps IdentifiedIdentified SlumDivisionMonth
The Institute of Health Systems , HACA Bhavan, Hyderabad, AP 500004 Page 67 of 74
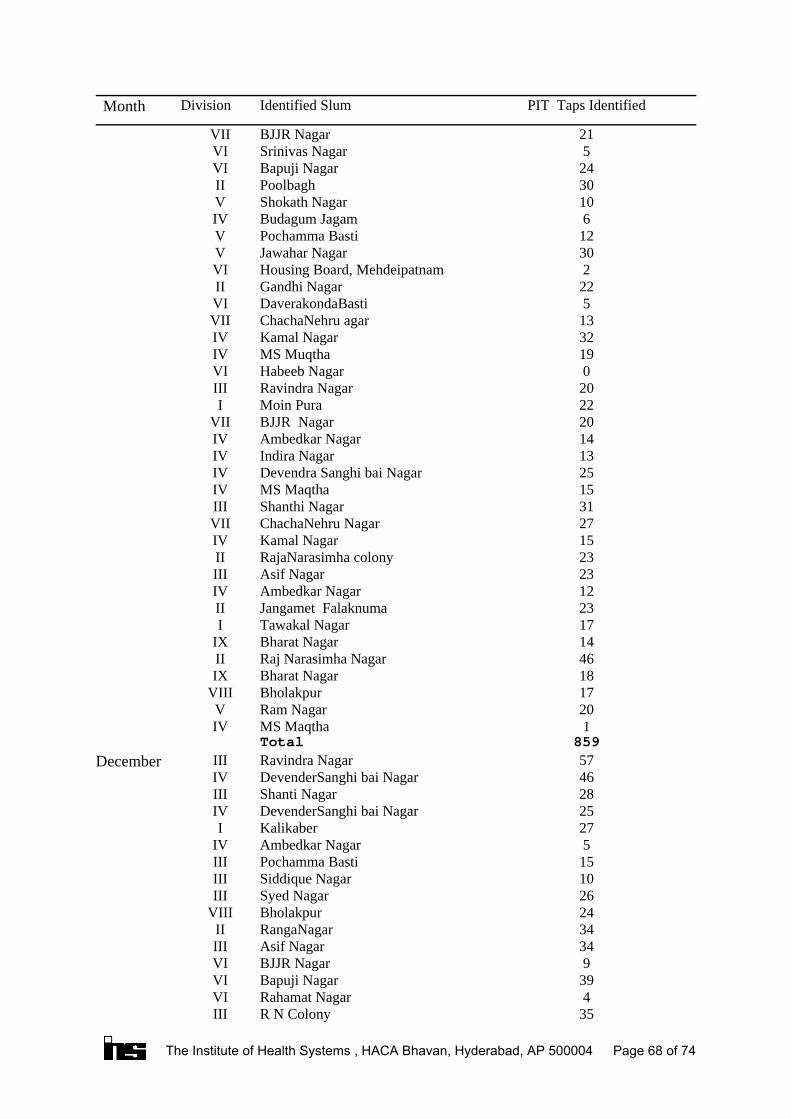
35R N ColonyIII4Rahamat NagarVI
39Bapuji NagarVI9BJJR NagarVI
34Asif NagarIII34RangaNagarII24BholakpurVIII26Syed NagarIII10Siddique NagarIII15Pochamma BastiIII5Ambedkar NagarIV
27KalikaberI25DevenderSanghi bai NagarIV28Shanti NagarIII46DevenderSanghi bai NagarIV57Ravindra NagarIIIDecember
859Total1MS MaqthaIV
20Ram NagarV17BholakpurVIII18Bharat NagarIX46Raj Narasimha NagarII14Bharat NagarIX17Tawakal NagarI23Jangamet FalaknumaII12Ambedkar NagarIV23Asif NagarIII23RajaNarasimha colonyII15Kamal NagarIV27ChachaNehru NagarVII31Shanthi NagarIII15MS MaqthaIV25Devendra Sanghi bai NagarIV13Indira NagarIV14Ambedkar NagarIV20BJJR NagarVII22Moin PuraI20Ravindra NagarIII0Habeeb NagarVI
19MS MuqthaIV32Kamal NagarIV13ChachaNehru agarVII5DaverakondaBastiVI
22Gandhi NagarII2Housing Board, MehdeipatnamVI
30Jawahar NagarV12Pochamma BastiV6Budagum JagamIV
10Shokath NagarV30PoolbaghII24Bapuji NagarVI5Srinivas NagarVI
21BJJR NagarVII
PIT Taps IdentifiedIdentified SlumDivisionMonth
The Institute of Health Systems , HACA Bhavan, Hyderabad, AP 500004 Page 68 of 74
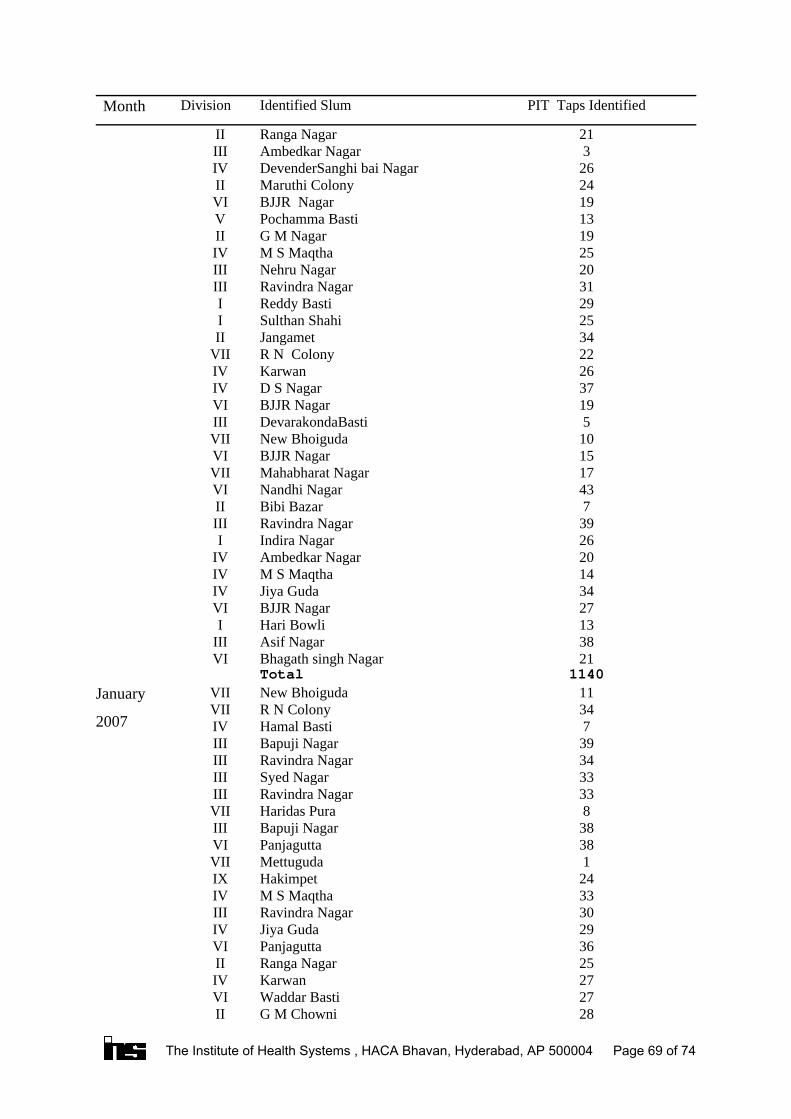
28G M ChowniII27Waddar BastiVI27KarwanIV25Ranga NagarII36PanjaguttaVI29Jiya GudaIV30Ravindra NagarIII33M S MaqthaIV24Hakimpet IX1MettugudaVII
38PanjaguttaVI38Bapuji NagarIII8Haridas PuraVII
33Ravindra NagarIII33Syed NagarIII34Ravindra NagarIII39Bapuji NagarIII7Hamal BastiIV
34R N ColonyVII11New BhoigudaVIIJanuary
2007
1140Total21Bhagath singh NagarVI38Asif NagarIII13Hari BowliI27BJJR NagarVI34Jiya GudaIV14M S MaqthaIV20Ambedkar NagarIV26Indira NagarI39Ravindra NagarIII7Bibi BazarII
43Nandhi NagarVI17Mahabharat NagarVII15BJJR NagarVI10New BhoigudaVII5DevarakondaBastiIII
19BJJR NagarVI37D S NagarIV26KarwanIV22R N ColonyVII34JangametII25Sulthan ShahiI29Reddy BastiI31Ravindra NagarIII20Nehru NagarIII25M S MaqthaIV19G M NagarII13Pochamma BastiV19BJJR NagarVI24Maruthi ColonyII26DevenderSanghi bai NagarIV3Ambedkar NagarIII
21Ranga NagarII
PIT Taps IdentifiedIdentified SlumDivisionMonth
The Institute of Health Systems , HACA Bhavan, Hyderabad, AP 500004 Page 69 of 74
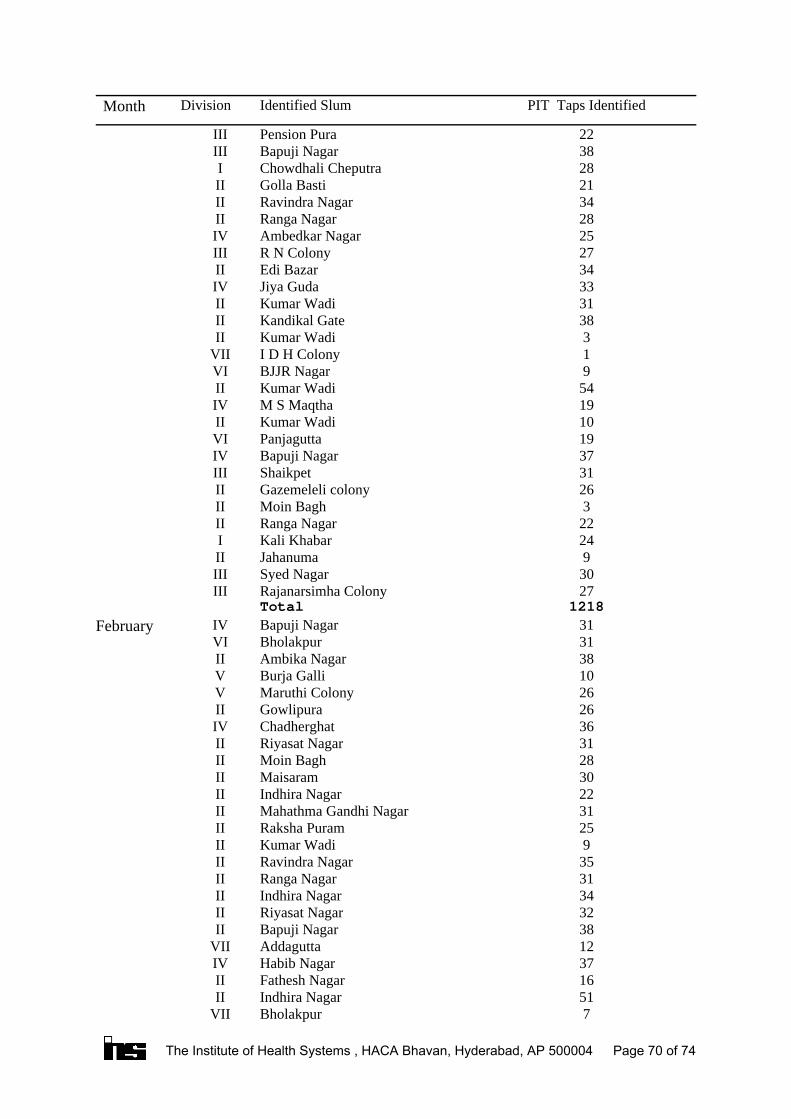
7BholakpurVII51Indhira NagarII16Fathesh NagarII37Habib NagarIV12AddaguttaVII38Bapuji NagarII32Riyasat NagarII34Indhira NagarII31Ranga NagarII35Ravindra NagarII9Kumar WadiII
25Raksha PuramII31Mahathma Gandhi NagarII22Indhira NagarII30MaisaramII28Moin BaghII31Riyasat NagarII36ChadherghatIV26GowlipuraII26Maruthi ColonyV10Burja GalliV38Ambika NagarII31BholakpurVI31Bapuji NagarIVFebruary
1218Total27Rajanarsimha ColonyIII30Syed NagarIII9JahanumaII
24Kali KhabarI22Ranga NagarII3Moin BaghII
26Gazemeleli colonyII31ShaikpetIII37Bapuji NagarIV19PanjaguttaVI10Kumar WadiII19M S MaqthaIV54Kumar WadiII9BJJR NagarVI1I D H ColonyVII3Kumar WadiII
38Kandikal GateII31Kumar WadiII33Jiya GudaIV34Edi BazarII27R N ColonyIII25Ambedkar NagarIV28Ranga NagarII34Ravindra NagarII21Golla BastiII28Chowdhali CheputraI38Bapuji NagarIII22Pension PuraIII
PIT Taps IdentifiedIdentified SlumDivisionMonth
The Institute of Health Systems , HACA Bhavan, Hyderabad, AP 500004 Page 70 of 74
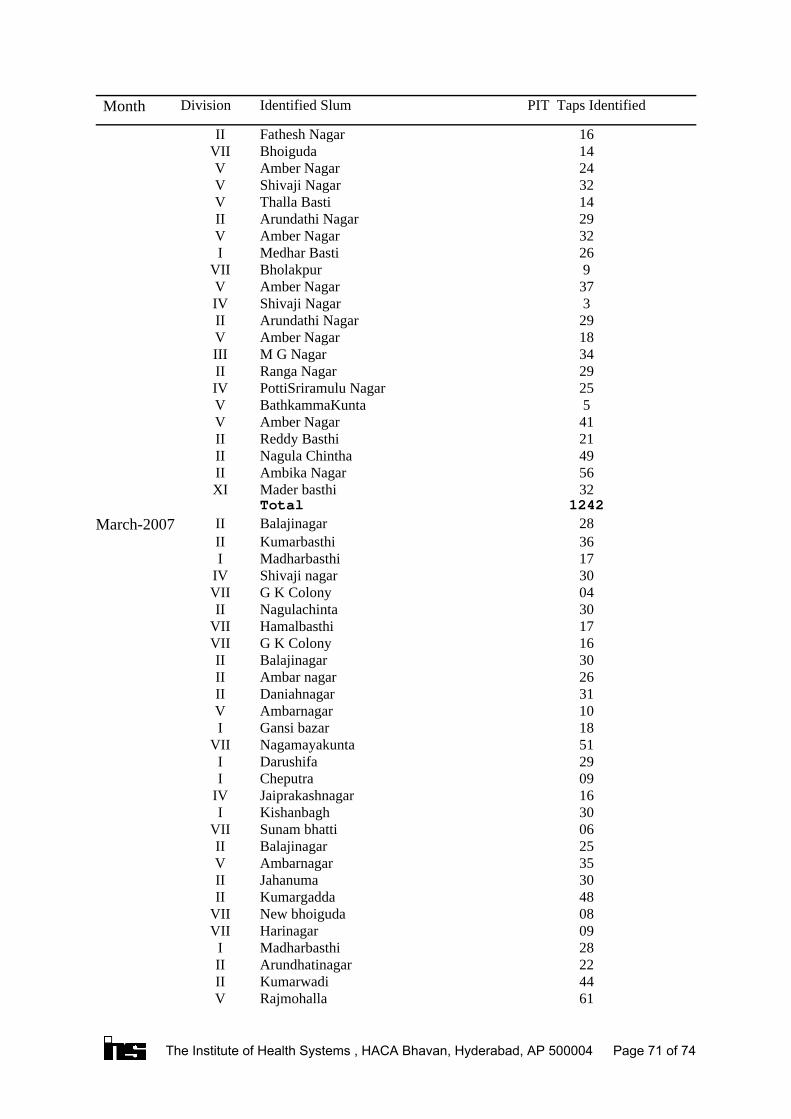
61RajmohallaV44KumarwadiII22ArundhatinagarII28MadharbasthiI09HarinagarVII08New bhoigudaVII48KumargaddaII30JahanumaII35AmbarnagarV25BalajinagarII06Sunam bhattiVII30KishanbaghI16JaiprakashnagarIV09CheputraI29DarushifaI51NagamayakuntaVII18Gansi bazarI10AmbarnagarV31Daniahnagar II26Ambar nagarII30BalajinagarII16G K ColonyVII17HamalbasthiVII30NagulachintaII04G K ColonyVII30Shivaji nagarIV17MadharbasthiI36KumarbasthiII28BalajinagarIIMarch-2007
1242Total32Mader basthiXI56Ambika NagarII49Nagula ChinthaII21Reddy BasthiII41Amber NagarV5BathkammaKuntaV
25PottiSriramulu NagarIV29Ranga NagarII34M G NagarIII18Amber NagarV29Arundathi NagarII3Shivaji NagarIV
37Amber NagarV9BholakpurVII
26Medhar BastiI32Amber NagarV29Arundathi NagarII14Thalla BastiV32Shivaji NagarV24Amber NagarV14BhoigudaVII16Fathesh NagarII
PIT Taps IdentifiedIdentified SlumDivisionMonth
The Institute of Health Systems , HACA Bhavan, Hyderabad, AP 500004 Page 71 of 74
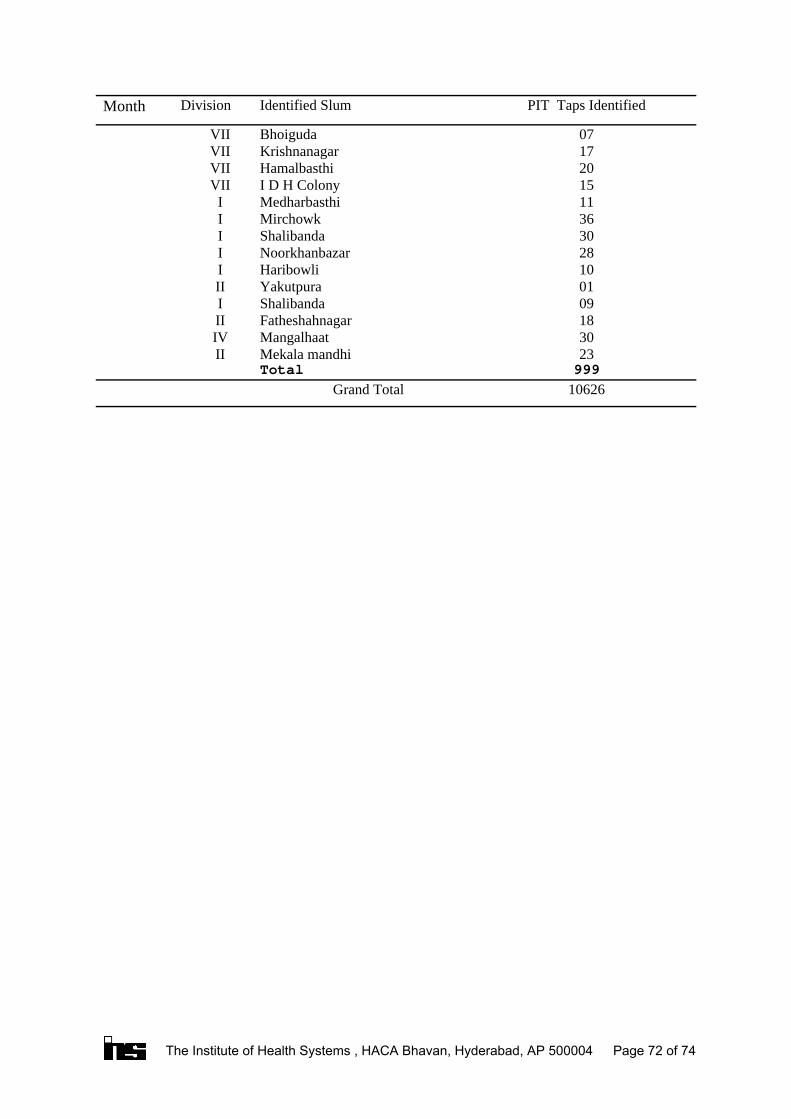
10626Grand Total999Total23Mekala mandhiII30MangalhaatIV18FatheshahnagarII09ShalibandaI01YakutpuraII10HaribowliI28NoorkhanbazarI30ShalibandaI36MirchowkI11MedharbasthiI15I D H ColonyVII20HamalbasthiVII17KrishnanagarVII07BhoigudaVII
PIT Taps IdentifiedIdentified SlumDivisionMonth
The Institute of Health Systems , HACA Bhavan, Hyderabad, AP 500004 Page 72 of 74
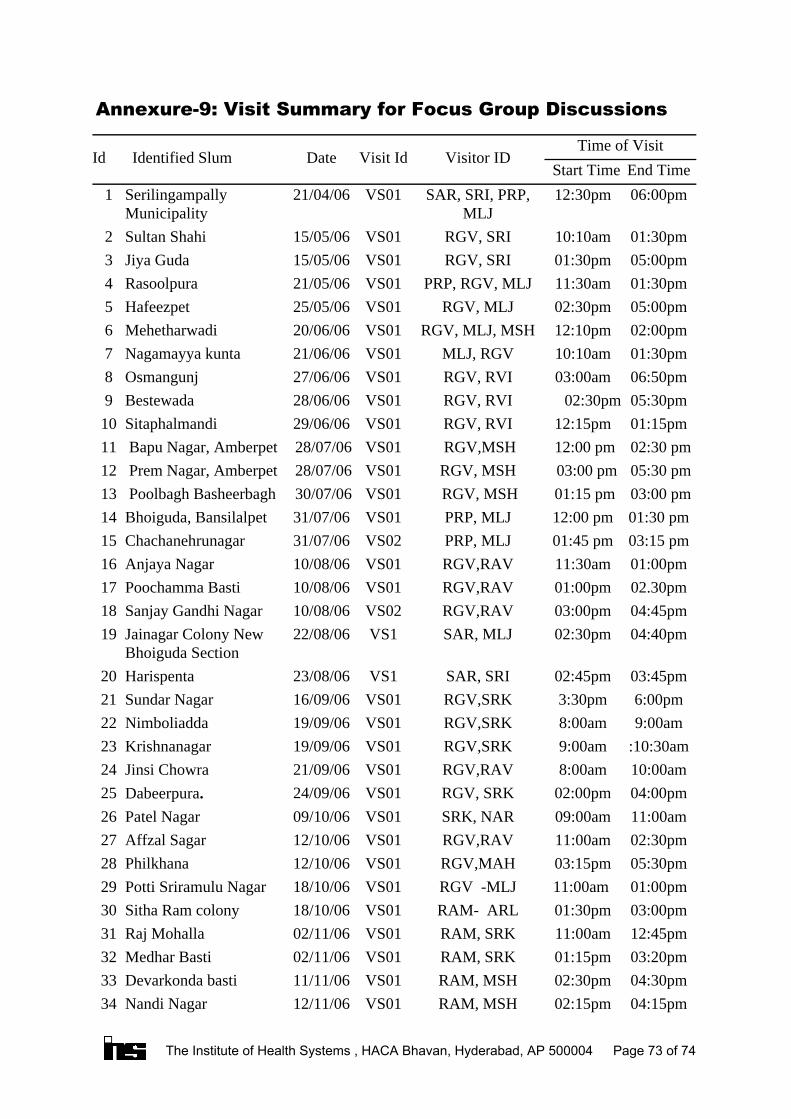
Annexure-9: Visit Summary for Focus Group Discussions
04:15pm02:15pmRAM, MSHVS0112/11/06Nandi Nagar3404:30pm02:30pmRAM, MSHVS0111/11/06Devarkonda basti3303:20pm01:15pmRAM, SRKVS0102/11/06Medhar Basti3212:45pm11:00amRAM, SRKVS0102/11/06Raj Mohalla3103:00pm01:30pmRAM- ARLVS0118/10/06Sitha Ram colony3001:00pm11:00am RGV -MLJVS0118/10/06Potti Sriramulu Nagar2905:30pm03:15pmRGV,MAHVS0112/10/06Philkhana2802:30pm11:00amRGV,RAVVS0112/10/06Affzal Sagar2711:00am09:00amSRK, NARVS0109/10/06Patel Nagar2604:00pm02:00pmRGV, SRKVS0124/09/06Dabeerpura.2510:00am8:00amRGV,RAVVS0121/09/06Jinsi Chowra24:10:30am9:00amRGV,SRKVS0119/09/06Krishnanagar239:00am8:00amRGV,SRKVS0119/09/06Nimboliadda226:00pm3:30pmRGV,SRKVS0116/09/06Sundar Nagar2103:45pm02:45pmSAR, SRIVS123/08/06Harispenta20
04:40pm02:30pmSAR, MLJVS122/08/06Jainagar Colony NewBhoiguda Section
1904:45pm03:00pmRGV,RAVVS0210/08/06Sanjay Gandhi Nagar1802.30pm01:00pmRGV,RAVVS0110/08/06Poochamma Basti1701:00pm11:30amRGV,RAVVS0110/08/06Anjaya Nagar1603:15 pm01:45 pmPRP, MLJVS0231/07/06Chachanehrunagar1501:30 pm12:00 pmPRP, MLJVS0131/07/06Bhoiguda, Bansilalpet14 03:00 pm 01:15 pm RGV, MSHVS01 30/07/06 Poolbagh Basheerbagh13 05:30 pm 03:00 pmRGV, MSHVS01 28/07/06 Prem Nagar, Amberpet12 02:30 pm 12:00 pm RGV,MSHVS01 28/07/06 Bapu Nagar, Amberpet1101:15pm12:15pmRGV, RVIVS0129/06/06Sitaphalmandi1005:30pm 02:30pmRGV, RVIVS0128/06/06Bestewada906:50pm03:00amRGV, RVIVS0127/06/06Osmangunj801:30pm10:10amMLJ, RGVVS0121/06/06Nagamayya kunta702:00pm12:10pmRGV, MLJ, MSHVS0120/06/06Mehetharwadi605:00pm02:30pmRGV, MLJVS0125/05/06Hafeezpet501:30pm11:30amPRP, RGV, MLJVS0121/05/06Rasoolpura405:00pm01:30pmRGV, SRIVS0115/05/06Jiya Guda301:30pm10:10amRGV, SRIVS0115/05/06Sultan Shahi2
06:00pm12:30pmSAR, SRI, PRP,MLJ
VS0121/04/06SerilingampallyMunicipality
1End TimeStart Time
Time of VisitVisitor IDVisit IdDateIdentified SlumId
The Institute of Health Systems , HACA Bhavan, Hyderabad, AP 500004 Page 73 of 74
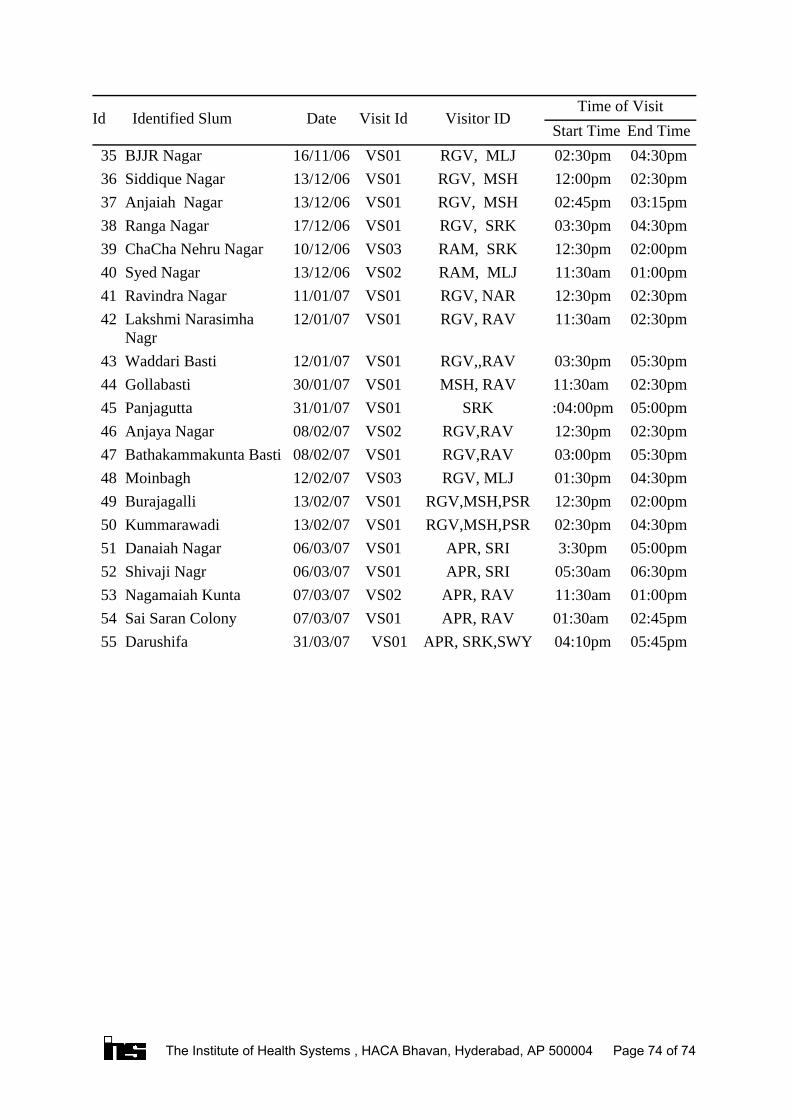
05:45pm04:10pmAPR, SRK,SWY VS0131/03/07Darushifa 5502:45pm01:30am APR, RAVVS0107/03/07Sai Saran Colony 5401:00pm11:30amAPR, RAVVS0207/03/07Nagamaiah Kunta5306:30pm05:30amAPR, SRIVS0106/03/07Shivaji Nagr5205:00pm3:30pmAPR, SRIVS0106/03/07Danaiah Nagar5104:30pm02:30pmRGV,MSH,PSRVS0113/02/07Kummarawadi5002:00pm12:30pmRGV,MSH,PSRVS0113/02/07Burajagalli4904:30pm01:30pmRGV, MLJVS0312/02/07Moinbagh4805:30pm03:00pmRGV,RAVVS0108/02/07Bathakammakunta Basti4702:30pm12:30pmRGV,RAVVS0208/02/07Anjaya Nagar4605:00pm:04:00pmSRKVS0131/01/07Panjagutta4502:30pm11:30am MSH, RAVVS0130/01/07Gollabasti 4405:30pm03:30pmRGV,,RAVVS0112/01/07Waddari Basti43
02:30pm11:30amRGV, RAVVS0112/01/07Lakshmi NarasimhaNagr
4202:30pm12:30pmRGV, NARVS0111/01/07Ravindra Nagar4101:00pm11:30amRAM, MLJVS0213/12/06Syed Nagar4002:00pm12:30pmRAM, SRKVS0310/12/06ChaCha Nehru Nagar3904:30pm03:30pmRGV, SRKVS0117/12/06Ranga Nagar3803:15pm02:45pmRGV, MSHVS0113/12/06Anjaiah Nagar3702:30pm12:00pmRGV, MSHVS0113/12/06Siddique Nagar3604:30pm02:30pmRGV, MLJVS0116/11/06BJJR Nagar35End TimeStart Time
Time of VisitVisitor IDVisit IdDateIdentified SlumId
The Institute of Health Systems , HACA Bhavan, Hyderabad, AP 500004 Page 74 of 74