Report of the President and Chief Executive Officer
69
Report to Shareholders for the Second Quarter, 2021 www.cibc.com May 27, 2021 Report of the President and Chief Executive Officer Overview of results CIBC today announced its financial results for the second quarter ended April 30, 2021. Second quarter highlights Q2/21 Q2/20 Q1/21 YoY Variance QoQ Variance Reported Net Income $1,651 million $392 million $1,625 million +321% +2% Adjusted Net Income (1) $1,666 million $441 million $1,640 million +278% +2% Reported Diluted Earnings Per Share (EPS) $3.55 $0.83 $3.55 +328% 0% Adjusted Diluted EPS (1) $3.59 $0.94 $3.58 +282% 0% Reported Return on Common Shareholders’ Equity (ROE) 17.1% 4.0% 17.0% Adjusted ROE (1) 17.3% 4.5% 17.2% Common Equity Tier 1 Ratio 12.4% 11.3% 12.3% Results for the second quarter of 2021 were affected by the following item of note aggregating to a negative impact of $0.04 per share: $20 million ($15 million after-tax) amortization of acquisition-related intangible assets. Our Common Equity Tier 1 ratio was 12.4% at April 30, 2021 compared with 12.3% at the end of the prior quarter. CIBC’s leverage ratio at April 30, 2021 was 4.7%. Our strong performance in the second quarter of 2021 is a result of executing on our client-focused growth strategy. We are delivering results by building on the momentum we have established in our Canadian consumer franchise, further accelerating our performance in areas where we have strength, and simplifying and transforming our bank to enable reinvestment for growth. Core business performance Canadian Personal and Business Banking reported net income of $603 million for the second quarter, up $440 million or 270% from the second quarter a year ago mainly due to lower provisions for credit losses. Adjusted pre-provision, pre-tax earnings (1) were up $19 million or 2% from a year ago mainly due to robust volume growth and lower expenses, partially offset by narrower margins as a result of changes in the interest rate environment. Canadian Commercial Banking and Wealth Management reported net income of $399 million for the second quarter, up $193 million or 94% from the second quarter a year ago, primarily due to lower provisions for credit losses and higher revenues across all businesses, partially offset by higher expenses. Pre-provision, pre-tax earnings (1) were up $61 million or 13% compared with the second quarter a year ago, primarily due to higher fee revenue and strong volume growth in commercial banking, while wealth management revenue benefitted from significant growth in asset balances driven by market appreciation and strong mutual fund sales, in addition to increased investment activity by clients. Higher expenses were primarily driven by revenue-based variable compensation reflecting favourable business results. U.S. Commercial Banking and Wealth Management reported net income of $216 million for the second quarter, up $201 million or 1340% from the second quarter a year ago. Excluding items of note, adjusted net income (1) was $229 million, up $197 million or 616% from the second quarter a year ago, due to lower provisions for credit losses and higher U.S. dollar revenue, partially offset by the impact of foreign exchange translation. In U.S. dollars, adjusted pre-provision, pre-tax earnings (1) were up US$48 million or 27% (CAD$36 million or 15%) from the second quarter a year ago due to higher revenue, partially offset by higher expenses. Higher revenue was primarily driven by strong volume growth and higher fees, while higher expenses reflect increased performance-based compensation. Capital Markets reported net income of $495 million for the second quarter, up $318 million or 180% from the second quarter a year ago, primarily due to higher revenue and a lower provision for credit losses, partially offset by higher expenses. Pre-provision, pre-tax earnings (1) were up 38% from a year ago, driven by higher revenues across trading and corporate and investment banking, partially offset by higher performance-based compensation. (1) For additional information, see the “Non-GAAP measures” section. Pre-provision, pre-tax earnings is revenue net of non-interest expenses and is a non-GAAP measure. Adjusted pre-provision, pre-tax earnings is revenue net of non-interest expenses adjusted for items of note and is a non-GAAP measure.
Transcript of Report of the President and Chief Executive Officer

Report to Shareholders for the Second Quarter, 2021 www.cibc.com May 27, 2021
Report of the President and Chief Executive Officer
Overview of results
CIBC today announced its financial results for the second quarter ended April 30, 2021.
Second quarter highlights
Q2/21 Q2/20 Q1/21 YoY
Variance
QoQ
Variance
Reported Net Income $1,651 million $392 million $1,625 million +321% +2%
Adjusted Net Income (1) $1,666 million $441 million $1,640 million +278% +2%
Reported Diluted Earnings Per Share (EPS) $3.55 $0.83 $3.55 +328% 0%
Adjusted Diluted EPS (1) $3.59 $0.94 $3.58 +282% 0%
Reported Return on Common Shareholders’ Equity (ROE) 17.1% 4.0% 17.0%
Adjusted ROE (1) 17.3% 4.5% 17.2%
Common Equity Tier 1 Ratio 12.4% 11.3% 12.3%
Results for the second quarter of 2021 were affected by the following item of note aggregating to a negative impact of $0.04 per share:
� $20 million ($15 million after-tax) amortization of acquisition-related intangible assets.
Our Common Equity Tier 1 ratio was 12.4% at April 30, 2021 compared with 12.3% at the end of the prior quarter. CIBC’s leverage ratio at April 30, 2021
was 4.7%.
Our strong performance in the second quarter of 2021 is a result of executing on our client-focused growth strategy. We are delivering results by
building on the momentum we have established in our Canadian consumer franchise, further accelerating our performance in areas where we have
strength, and simplifying and transforming our bank to enable reinvestment for growth.
Core business performance Canadian Personal and Business Banking reported net income of $603 million for the second quarter, up $440 million or 270% from the second
quarter a year ago mainly due to lower provisions for credit losses. Adjusted pre-provision, pre-tax earnings(1) were up $19 million or 2% from a year ago
mainly due to robust volume growth and lower expenses, partially offset by narrower margins as a result of changes in the interest rate environment.
Canadian Commercial Banking and Wealth Management reported net income of $399 million for the second quarter, up $193 million or 94% from
the second quarter a year ago, primarily due to lower provisions for credit losses and higher revenues across all businesses, partially offset by higher
expenses. Pre-provision, pre-tax earnings(1) were up $61 million or 13% compared with the second quarter a year ago, primarily due to higher fee revenue
and strong volume growth in commercial banking, while wealth management revenue benefitted from significant growth in asset balances driven by
market appreciation and strong mutual fund sales, in addition to increased investment activity by clients. Higher expenses were primarily driven by
revenue-based variable compensation reflecting favourable business results.
U.S. Commercial Banking and Wealth Management reported net income of $216 million for the second quarter, up $201 million or 1340% from
the second quarter a year ago. Excluding items of note, adjusted net income(1) was $229 million, up $197 million or 616% from the second quarter a
year ago, due to lower provisions for credit losses and higher U.S. dollar revenue, partially offset by the impact of foreign exchange translation. In U.S.
dollars, adjusted pre-provision, pre-tax earnings(1) were up US$48 million or 27% (CAD$36 million or 15%) from the second quarter a year ago due to
higher revenue, partially offset by higher expenses. Higher revenue was primarily driven by strong volume growth and higher fees, while higher
expenses reflect increased performance-based compensation.
Capital Markets reported net income of $495 million for the second quarter, up $318 million or 180% from the second quarter a year ago, primarily due
to higher revenue and a lower provision for credit losses, partially offset by higher expenses. Pre-provision, pre-tax earnings(1) were up 38% from a year
ago, driven by higher revenues across trading and corporate and investment banking, partially offset by higher performance-based compensation.
(1) For additional information, see the “Non-GAAP measures” section. Pre-provision, pre-tax earnings is revenue net of non-interest expenses and is a non-GAAP measure. Adjusted pre-provision, pre-tax
earnings is revenue net of non-interest expenses adjusted for items of note and is a non-GAAP measure.

Making a difference in our communities
At CIBC, we are committed to strengthening our communities and giving back is deeply embedded in our culture. This quarter, investments in our
communities included:
�
Announced an additional $1 million investment aimed at supporting the next generation of leaders and changemakers from the Black community,
including creating a scholarship program through a partnership with the BlackNorth Initiative;
� Celebrated International Women’s Day with a focus on shared stories of strength and resiliency by hosting a client webinar and launching our
partnership with The Prosperity Project and their Canadian Household survey;
� Opened applications for the second year of the CIBC Future Heroes Bursary program with the goal to help post-secondary students achieve their
ambitions of pursuing a career in healthcare. 125 bursaries valued at $2,500 will be awarded to students entering their first year of an eligible
healthcare undergraduate, certificate or diploma program; and
� Celebrated National Volunteer Week by doubling the reward dollars we donate when team members volunteer their time to a cause they are
passionate about.
Victor G. Dodig
President and Chief Executive Officer
CIBC SECOND QUARTER 2021 ii

Enhanced Disclosure Task Force
The Enhanced Disclosure Task Force (EDTF), established by the Financial Stability Board, released its report “Enhancing the Risk Disclosures of Banks” in
2012, which included thirty-two disclosure recommendations. The index below provides the listing of these disclosures, along with their locations. EDTF
disclosures are located in our 2020 Annual Report, quarterly Report to Shareholders, and supplementary packages, which may be found on our website
(www.cibc.com). No information on CIBC’s website, including the supplementary packages, should be considered incorporated herein by reference.
Topics Recommendations Disclosures
Second quarter, 2021
2020
Annual
Report
Management’s
discussion
and analysis
Consolidated
financial
statements
Pillar 3 report and
Supplementaryregulatory
capital disclosure
Page references
General 1 Index of risk information – current page
2 Risk terminology and measures (1) 69–70
3 Top and emerging risks 20 50
4 Key future regulatory ratio requirements 18, 33, 34 61 9, 16 36, 39, 76, 78, 166
Risk governance,
risk management
and business
model
5 Risk management structure 44, 45
6 Risk culture and appetite 43, 46, 47
7 Risks arising from business activities 23 48, 53
8 Bank-wide stress testing 26 31, 49, 57 71, 74
Capital adequacy and risk-
weighted assets
9 Minimum capital requirements 16 61 31, 166
10 Components of capital and reconciliation to the consolidated regulatory balance sheet
8–11 36
11 Regulatory capital flow statement 12 37
12 Capital management and planning 39, 166
13 Business activities and risk-weighted assets
23 4 38, 53
14 Risk-weighted assets and capital requirements
4 33, 38
15 Credit risk by major portfolios 27–36 56–61
16 Risk-weighted assets flow statement 4, 5 38
17 Back-testing of models 67, 68 48, 57, 70
Liquidity 18 Liquid assets 32 75
Funding 19 Encumbered assets 33 75
20 Contractual maturities of assets, liabilities and off-balance sheet instruments
37 79
21 Funding strategy and sources 35 77
Market risk 22 Reconciliation of trading and non-trading portfolios to the consolidated balance sheet
29 69
23 Significant trading and non-trading market risk factors
30–31 69–73
24 Model assumptions, limitations and validation procedures
69–73
25 Stress testing and scenario analysis 31, 71
Credit risk 26 Analysis of credit risk exposures 24–28 6–7, 63–66 58–67, 138–145, 186
27 Impaired loan and forbearance policies 24, 27 55, 65, 85, 116
28 Reconciliation of impaired loans and the allowance for credit losses
27 54 65, 139
29 Counterparty credit risk arising from derivatives
26 66, 35 (2) 55, 59, 156–157
30 Credit risk mitigation 24 20, 51, 66 55, 61, 156–157
Other risks 31 Other risks 38 80–82
32 Discussion of publicly known risk events 63 80, 179
(1) A detailed glossary of our risk and capital terminology is included on page 198 to 202 of our 2020 Annual Report.
(2) Included in our supplementary financial information package.
CIBC SECOND QUARTER 2021 iii

Management’s discussion and analysis Management’s discussion and analysis (MD&A) is provided to enable readers to assess CIBC’s financial condition and results of operations as at and
for the quarter and six months ended April 30, 2021 compared with corresponding periods. The MD&A should be read in conjunction with our 2020
Annual Report and the unaudited interim consolidated financial statements included in this report. Unless otherwise indicated, all financial information
in this MD&A has been prepared in accordance with International Financial Reporting Standards (IFRS or GAAP) and all amounts are expressed in
Canadian dollars. Certain disclosures in the MD&A have been shaded as they form an integral part of the interim consolidated financial statements.
The MD&A is current as of May 26, 2021. Additional information relating to CIBC is available on SEDAR at www.sedar.com and on the U.S. Securities
and Exchange Commission’s (SEC) website at www.sec.gov. No information on CIBC’s website (www.cibc.com) should be considered incorporated
herein by reference. A glossary of terms used throughout this quarterly report can be found on pages 196 to 202 of our 2020 Annual Report.
Contents
2 Second quarter financial highlights
3 External reporting changes
3 Financial performance overview
3 Economic outlook
4 Significant events
4 Financial results review
6 Review of quarterly financial information
7 Non-GAAP measures
9 Strategic business units overview
9 Canadian Personal and Business Banking
10 Canadian Commercial Banking and Wealth Management
11 U.S. Commercial Banking and Wealth Management
12 Capital Markets
13 Corporate and Other
15 Financial condition
15 Review of condensed consolidated balance sheet
16 Capital management
19 Off-balance sheet arrangements
20 Management of risk
20 Risk overview
20 Top and emerging risks
24 Credit risk
29 Market risk
32 Liquidity risk
38 Other risks
38 Accounting and control matters
38 Critical accounting policies and estimates
38 Accounting developments
39 Other regulatory developments
39 Controls and procedures
39 Related-party transactions
A NOTE ABOUT FORWARD-LOOKING STATEMENTS: From time to time, we make written or oral forward-looking statements within the meaning of certain securities laws,
including in this report, in other filings with Canadian securities regulators or the SEC and in other communications. All such statements are made pursuant to the “safe
harbour” provisions of, and are intended to be forward-looking statements under applicable Canadian and U.S. securities legislation, including the U.S. Private Securities
Litigation Reform Act of 1995. These statements include, but are not limited to, statements made in the “Financial performance overview – Economic outlook”, “Financial
performance overview – Significant events”, “Financial performance overview – Financial results review”, “Financial performance overview – Review of quarterly financial
information”, “Financial condition – Capital management”, “Management of risk – Risk overview”, “Management of risk – Top and emerging risks”, “Management of risk –
Credit risk”, “Management of risk – Market risk”, “Management of risk – Liquidity risk”, “Accounting and control matters – Critical accounting policies and estimates”,
“Accounting and control matters – Accounting developments”, and “Accounting and control matters – Other regulatory developments” sections of this report and other
statements about our operations, business lines, financial condition, risk management, priorities, targets, ongoing objectives, strategies, the regulatory environment in which
we operate and outlook for calendar year 2021 and subsequent periods. Forward-looking statements are typically identified by the words “believe”, “expect”, “anticipate”,
“intend”, “estimate”, “forecast”, “target”, “objective” and other similar expressions or future or conditional verbs such as “will”, “should”, “would” and “could”. By their nature,
these statements require us to make assumptions, including the economic assumptions set out in the “Financial performance overview – Economic outlook” section of this
report, and are subject to inherent risks and uncertainties that may be general or specific. Given the continuing impact of the coronavirus (COVID-19) pandemic on the global
economy, financial markets, and our business, results of operations, reputation and financial condition and continued pressure on oil prices, there is inherently more
uncertainty associated with our assumptions as compared to prior periods. A variety of factors, many of which are beyond our control, affect our operations, performance and
results, and could cause actual results to differ materially from the expectations expressed in any of our forward-looking statements. These factors include: the occurrence,
continuance or intensification of public health emergencies, such as the COVID-19 pandemic, and any related government policies and actions; credit, market, liquidity,
strategic, insurance, operational, reputation, conduct and legal, regulatory and environmental risk; currency value and interest rate fluctuations, including as a result of market
and oil price volatility; the effectiveness and adequacy of our risk management and valuation models and processes; legislative or regulatory developments in the jurisdictions
where we operate, including the Organisation for Economic Co-operation and Development Common Reporting Standard, and regulatory reforms in the United Kingdom and
Europe, the Basel Committee on Banking Supervision’s global standards for capital and liquidity reform, and those relating to bank recapitalization legislation and the
payments system in Canada; amendments to, and interpretations of, risk-based capital guidelines and reporting instructions, and interest rate and liquidity regulatory
guidance; the resolution of legal and regulatory proceedings and related matters; the effect of changes to accounting standards, rules and interpretations; changes in our
estimates of reserves and allowances; changes in tax laws; changes to our credit ratings; political conditions and developments, including changes relating to economic or
trade matters; the possible effect on our business of international conflicts and terrorism; natural disasters, disruptions to public infrastructure and other catastrophic events;
reliance on third parties to provide components of our business infrastructure; potential disruptions to our information technology systems and services; increasing cyber
security risks which may include theft or disclosure of assets, unauthorized access to sensitive information, or operational disruption; social media risk; losses incurred as a
result of internal or external fraud; anti-money laundering; the accuracy and completeness of information provided to us concerning clients and counterparties; the failure of
third parties to comply with their obligations to us and our affiliates or associates; intensifying competition from established competitors and new entrants in the financial
services industry including through internet and mobile banking; technological change; global capital market activity; changes in monetary and economic policy; general
business and economic conditions worldwide, as well as in Canada, the U.S. and other countries where we have operations, including increasing Canadian household debt
levels and global credit risks; our success in developing and introducing new products and services, expanding existing distribution channels, developing new distribution
channels and realizing increased revenue from these channels; changes in client spending and saving habits; our ability to attract and retain key employees and executives;
our ability to successfully execute our strategies and complete and integrate acquisitions and joint ventures; the risk that expected benefits of an acquisition, merger or
divestiture will not be realized within the expected time frame or at all; and our ability to anticipate and manage the risks associated with these factors. This list is not
exhaustive of the factors that may affect any of our forward-looking statements. These and other factors should be considered carefully and readers should not place undue
reliance on our forward-looking statements. Any forward-looking statements contained in this report represent the views of management only as of the date hereof and are
presented for the purpose of assisting our shareholders and financial analysts in understanding our financial position, objectives and priorities and anticipated financial
performance as at and for the periods ended on the dates presented, and may not be appropriate for other purposes. We do not undertake to update any forward-looking
statement that is contained in this report or in other communications except as required by law.
CIBC SECOND QUARTER 2021 1

Second quarter financial highlights
Unaudited
As at or for the three months ended
As at or for the six months ended
2021 Apr. 30
2021 Jan. 31
2020 Apr. 30
2021 Apr. 30
2020 Apr. 30
Financial results ($ millions) Net interest income $ 2,747 $ 2,839 $ 2,762 $ 5,586 $ 5,523 Non-interest income 2,185 2,124 1,816 4,309 3,910
Total revenue 4,932 4,963 4,578 9,895 9,433 Provision for credit losses 32 147 1,412 179 1,673 Non-interest expenses 2,756 2,726 2,704 5,482 5,769
Income before income taxes 2,144 2,090 462 4,234 1,991 Income taxes 493 465 70 958 387
Net income $ 1,651 $ 1,625 $ 392 $ 3,276 $ 1,604
Net income (loss) attributable to non-controlling interests $ 4 $ 4 $ (8) $ 8 $ (1)
Preferred shareholders 51 30 30 81 61 Common shareholders 1,596 1,591 370 3,187 1,544
Net income attributable to equity shareholders $ 1,647 $ 1,621 $ 400 $ 3,268 $ 1,605
Financial measures Reported efficiency ratio 55.9 % 54.9 % 59.1 %
55.4 % 61.2 %
Operating leverage 5.8 % 13.3 % (3.7)% 9.9 % (4.3)%Loan loss ratio (1) 0.24 % 0.22 % 0.34 % 0.23 % 0.29 %Reported return on common shareholders’ equity (2) 17.1 % 17.0 % 4.0 % 17.1 % 8.5 %Net interest margin 1.42 % 1.41 % 1.55 % 1.41 % 1.58 %
Net interest margin on average interest-earning assets (3) 1.59 % 1.58 % 1.77 % 1.59 % 1.78 %Return on average assets (4) 0.85 % 0.81 % 0.22 % 0.83 % 0.46 %Return on average interest-earning assets (3)(4) 0.95 % 0.91 % 0.25 % 0.93 % 0.52 %Reported effective tax rate 23.0 % 22.2 % 15.3 % 22.6 % 19.5 %
Common share information Per share ($) – basic earnings $ 3.56 $ 3.56 $ 0.83 $ 7.12 $ 3.47
– reported diluted earnings 3.55 3.55 0.83 7.10 3.46 – dividends 1.46 1.46 1.46 2.92 2.90 – book value 86.70 85.24 83.67 86.70 83.67
Closing share price ($) 127.78 108.98 82.48 127.78 82.48 Shares outstanding (thousands) – weighted-average basic 448,455 447,281 444,739 447,859 444,997
– weighted-average diluted 449,345 447,929 445,188 448,621 445,610 – end of period 449,093 447,850 445,133 449,093 445,133
Market capitalization ($ millions) $ 57,385 $ 48,807 $ 36,715 $ 57,385 $ 36,715
Value measures Total shareholder return 18.62 % 11.11 % (22.21)%
31.80 % (24.26)%Dividend yield (based on closing share price) 4.7 % 5.3 % 7.2 % 4.6 % 7.1 %
Reported dividend payout ratio 41.0 % 41.1 % 176.0 % 41.0 % 83.6 %Market value to book value ratio 1.47 1.28 0.99 1.47 0.99
Selected financial measures – adjusted (5)
Adjusted efficiency ratio (6) 54.9 % 53.9 % 57.2 %
54.4 % 56.1 %
Adjusted operating leverage 4.4 % 2.0 % (2.0)% 3.1 % (1.6)%Adjusted return on common shareholders’ equity (2) 17.3 % 17.2 % 4.5 % 17.2 % 10.3 %Adjusted effective tax rate 23.0 % 22.3 % 15.1 % 22.6 % 20.3 %Adjusted diluted earnings per share $ 3.59 $ 3.58 $ 0.94 $ 7.17 $ 4.18 Adjusted dividend payout ratio 40.7 % 40.7 % 155.4 % 40.7 % 69.2 %
On- and off-balance sheet information ($ millions) Cash, deposits with banks and securities $ 202,319 $ 213,786 $ 189,277 $ 202,319 $ 189,277 Loans and acceptances, net of allowance 432,120 420,975 420,579 432,120 420,579 Total assets 782,878 782,908 759,136 782,878 759,136 Deposits 576,563 573,927 543,788 576,563 543,788 Common shareholders’ equity 38,935 38,177 37,244 38,935 37,244 Average assets 795,373 799,948 725,701 797,698 702,362 Average interest-earning assets (3) 709,463 711,470 633,233 710,483 621,423 Average common shareholders’ equity 38,189 37,067 37,386 37,619 36,520 Assets under administration (AUA) (7)(8)(9) 2,783,059 2,518,517 2,283,749 2,783,059 2,283,749 Assets under management (AUM) (8)(9) 293,488 280,303 246,564 293,488 246,564
Balance sheet quality and liquidity measures Risk-weighted assets (RWA) ($ millions) $ 257,997 $ 256,119 $ 261,763 $ 257,997 $ 261,763 Common Equity Tier 1 (CET1) ratio (10) 12.4 % 12.3 % 11.3 %
12.4 % 11.3 %
Tier 1 capital ratio (10) 13.9 % 13.8 % 12.5 % 13.9 % 12.5 %Total capital ratio (10) 16.2 % 15.8 % 14.5 % 16.2 % 14.5 %Leverage ratio 4.7 % 4.7 % 4.5 % 4.7 % 4.5 %Liquidity coverage ratio (LCR) 134 % 142 % 131 % n/a n/a
Other information Full-time equivalent employees 44,066 43,890 44,204 44,066 44,204
(1) The ratio is calculated as the provision for credit losses on impaired loans to average loans and acceptances, net of allowance for credit losses.
(2) Annualized.
(3) Average interest-earning assets include interest-bearing deposits with banks, interest-bearing demand deposits with Bank of Canada, securities, cash collateral on securities borrowed, securities
purchased under resale agreements, loans net of allowances, and certain sublease-related assets.
(4) Net income expressed as a percentage of average assets or average interest-earning assets.
(5) Adjusted measures are non-GAAP measures. Adjusted measures are calculated in the same manner as reported measures, except that financial information included in the calculation of adjusted
measures is adjusted to exclude the impact of items of note. For additional information and a reconciliation of reported results to adjusted results, see the “Non-GAAP measures” section.
(6) Calculated on a tax equivalent basis (TEB).
(7) Includes the full contract amount of AUA or custody under a 50/50 joint venture between CIBC and The Bank of New York Mellon of $2,212.3 billion (January 31, 2021: $1,977.7 billion; April 30, 2020:
$1,801.5 billion).
(8) AUM amounts are included in the amounts reported under AUA.
(9) Certain prior period information has been restated.
(10) Effective beginning in the second quarter of 2020, ratios reflect the expected credit loss (ECL) transitional arrangement announced by OSFI on March 27, 2020.
n/a Not applicable.
CIBC SECOND QUARTER 2021 2

External reporting changes Changes made to our business segments
The following external reporting changes were made in the first quarter of 2021:
� Simplii Financial and CIBC Investor’s Edge, previously reported in Canadian Personal and Business Banking, are now part of the newly-created
Direct Financial Services line of business in Capital Markets, along with certain other direct payment services that were previously in Capital
Markets. This change was made to align with the mandates of the relevant strategic business units (SBUs).
� The financial results associated with U.S. treasury activities in U.S. Commercial Banking and Wealth Management are now included within Treasury
in Corporate and Other. In addition, the transfer pricing methodology between U.S. Commercial Banking and Wealth Management and Treasury in
Corporate and Other has been enhanced. Both changes align the treatment of U.S. Commercial Banking and Wealth Management with our other
SBUs, and allow for better management of interest rate and liquidity risks.
Prior period amounts have been revised accordingly. The changes impacted the results of our SBUs and how we measure the performance of our SBUs.
There was no impact on our consolidated financial results from these changes.
Financial performance overview Economic outlook Although global economic activity has accelerated this year, the COVID-19 pandemic continues to have a significant adverse impact on the extent of
that rebound. Restrictions imposed by governments around the world to limit the impact of the infection, such as travel restrictions, physical distancing
measures, and the closure of certain businesses, continue to disrupt the global economy, and will limit the scope of the recovery until the rollout of the
vaccination programs in most major markets is near completion and proven to be effective in controlling the virus. While vaccination of targeted groups
has progressed across much of the world, uncertainty remains about how quickly a large enough majority of the population can be effectively
immunized to reduce subsequent rates of infection, including in response to emerging variants of the virus. Our outlook assumes that effective mass
vaccinations will continue in many countries over the spring and summer and that the vaccination programs will be able to effectively respond to the
emerging variants, allowing for stronger global recovery in the latter half of the calendar year. Until then, we assume that temporary restraints on activity
in response to the current wave of infections and the new variants will be in place to varying degrees across our target markets. Growth will continue in
sectors less impacted by physical distancing measures, but other sectors will experience periods of disruption when regulations are tightened in
response to new waves and strains of the virus. We generally expect to see stronger performance in the goods sector of the economy, but continued
slack in the services sector. While global demand for fuel is growing, a rebound in supply from overseas producers should see crude prices stabilize
near current levels over the balance of the calendar year.
In Canada, after a drop of 5.4% in calendar 2020, real gross domestic product (GDP) is expected to advance by approximately 5.7% in calendar
2021, with a deceleration in the second quarter and a resumption of faster growth in the second half of the calendar year. We expect that the
unemployment rate will average approximately 7.7% in calendar 2021, well above full-employment levels. Both businesses and households will benefit
from ongoing government fiscal support, which will reduce the impact of slower economic growth on insolvencies, business and household credit
growth and retail transaction volumes relative to what would have occurred absent these measures. Government bond issuance will remain elevated to
cover the resulting federal and provincial deficits. The Bank of Canada will maintain short-term interest rates at their current levels through calendar
2021, although longer-term rates will drift higher as economic growth accelerates, and the central bank eases up on its asset purchase program.
In the U.S., real GDP is expected to grow by approximately 6.6% in calendar 2021, after declining by almost 3.5% in the prior calendar year.
Unemployment is expected to average approximately 5.3% in calendar 2021, still about one percentage point above full-employment levels. Large scale
stimulus bills already enacted will boost demand, and provide enhanced support for households and businesses impacted by the pandemic, reducing
its impact on insolvencies. We expect that the Federal Reserve will maintain near-zero short-term interest rates and continue to engage in asset
purchases to slow the climb in long-term rates.
The economic challenges from the COVID-19 pandemic impact all our SBUs. From a credit perspective, while our outlook has improved as a result
of better-than-expected growth over the past two quarters, we continue to expect that our loan portfolios will be negatively impacted by the constrained
economic activity associated with measures taken to contain the spread of the infection, partially mitigated by large-scale government support programs
targeting both individuals and businesses. Deposit growth is likely to decelerate as the flow of government support payments to households and
businesses slows. The persistent low interest environment is expected to continue to have a negative impact on the net interest margins for all our SBUs.
For Canadian Personal and Business Banking, mortgage demand growth could decelerate slightly due to the new B-20 rules and affordability
constraints, but will continue to remain well supported by low rates, while we expect to see a modest return to growth in non-mortgage credit demand as
vaccination rates increase and pandemic-related constraints begin to ease. Continued demand for business lending products is anticipated as small
businesses look to weather the impact of the economic slowdown.
Our Canadian and U.S. wealth management businesses are expected to benefit from a further economic recovery, with investors looking for
alternatives to low rates on savings deposits.
Our Capital Markets business is expected to benefit from merger and acquisition activity as corporate consolidations increase as a result of the
pandemic, as well as increased equity issuance, but could be negatively impacted by lower corporate bond issuance and lower trading revenues from
the highs in 2020.
Loan demand in our Canadian and U.S. commercial banking businesses moderated in recent quarters, but will be supported by further economic
recovery in the second half of the calendar year.
The economic outlook described above reflects numerous assumptions and uncertainties regarding the economic impact of the COVID-19 pandemic,
which will ultimately depend on the speed at which the vaccination programs can be completed and the extent to which they will be effective at controlling
both existing and emerging variants of the virus, and the ability of governments, businesses and health-care systems to effectively limit the epidemiological
and economic impacts of the current and future resurgences of the virus, including its variants, in the intervening period. The extent to which public health
policies restrict economic activity, and the level and effectiveness of government support during this intervening period are material to our expectations for
the scale and timing of a further economic rebound later in calendar 2021. Expectations reflect currently available information and are subject to change
as new information on transmissibility and epidemiology becomes available. As a result, actual experience may differ materially from expectations.
CIBC SECOND QUARTER 2021 3

While we continue to support our clients through the pandemic, the need for and level of our client relief programs has reduced over the recent quarters.
See “CIBC client relief programs in response to COVID-19” and “Government lending programs in response to COVID-19” for further details regarding
the client relief and government support programs we are involved in. COVID-19 and the low interest rate environment continue to impact our business
and results of operations. See “Financial results review” and “Strategic business units overview” for further details. Despite these pressures, our financial
condition and our regulatory capital and liquidity positions continue to be strong. See “Capital management” and “Liquidity risk” for further details. The
impact of the pandemic on our risk environment is discussed in “Top and emerging risks”. Changes in the level of economic uncertainty arising from the
pandemic continue to impact key accounting estimates and assumptions, particularly the estimation of ECLs. See “Accounting and control matters”, as
well as Note 2 and Note 6 to our interim consolidated financial statements for further details.
Significant events Sale of FirstCaribbean International Bank Limited
On November 8, 2019, we announced that we had entered into a definitive agreement to sell 66.73% of the outstanding shares of FirstCaribbean
International Bank Limited (CIBC FirstCaribbean) to GNB Financial Group Limited (GNB), subject to regulatory approvals, as discussed in Note 4 to the
consolidated financial statements included in our 2020 Annual Report.
As a result of the lengthy regulatory review process, the worsening impact of the COVID-19 pandemic on the Caribbean economy and our revised
expectations concerning the likelihood and timing of a potential transaction, we discontinued the application of held for sale accounting of CIBC
FirstCaribbean in the fourth quarter of 2020 and recorded a goodwill impairment charge of $220 million. On February 3, 2021, we announced that the
proposed sale of CIBC FirstCaribbean to GNB did not receive approval from CIBC FirstCaribbean’s regulators and that the transaction will not proceed.
Financial results review Reported net income for the quarter was $1,651 million, compared with $392 million for the same quarter last year, and $1,625 million for the prior
quarter.
Adjusted net income(1) for the quarter was $1,666 million, compared with $441 million for the same quarter last year, and $1,640 million for the prior
quarter.
Reported diluted earnings per share (EPS) for the quarter was $3.55, compared with $0.83 for the same quarter last year, and $3.55 for the prior
quarter.
Adjusted diluted EPS(1) for the quarter was $3.59, compared with $0.94 for the same quarter last year, and $3.58 for the prior quarter.
In the current quarter, the following item of note increased non-interest expenses by $20 million, decreased income taxes by $5 million and decreased
net income by $15 million:
� $20 million ($15 million after-tax) amortization of acquisition-related intangible assets ($13 million after-tax in U.S. Commercial Banking and Wealth
Management and $2 million after-tax in Corporate and Other).
Net interest income(2)
Net interest income was down $15 million or 1% from the same quarter last year, primarily due to narrower margins, the impact of foreign exchange
translation, one fewer day this quarter and interest income related to the settlement of certain income tax matters in the same quarter last year, partially
offset by volume growth across our businesses and higher trading income.
Net interest income was down $92 million or 3% from the prior quarter, primarily due to fewer days in the current quarter and lower trading income,
partially offset by volume growth across our businesses.
Net interest income for the six months ended April 30, 2021 was up $63 million or 1% from the same period in 2020, primarily due to volume growth
across our businesses and higher trading income, partially offset by narrower margins as a result of changes in the interest rate environment, lower
revenue from Treasury and the impact of foreign exchange translation.
Non-interest income(2)
Non-interest income was up $369 million or 20% from the same quarter last year, primarily due to higher underwriting and advisory fees and higher
fee-based revenue driven by higher average AUA and AUM reflecting market appreciation. The previous period also included the impact of
unfavourable credit valuation adjustments (CVA) and funding valuation adjustments (FVA).
Non-interest income was up $61 million or 3% from the prior quarter, primarily due to higher underwriting and advisory fees, partially offset by lower
trading income.
Non-interest income for the six months ended April 30, 2021 was up $399 million or 10% from the same period in 2020, primarily due to higher fee-
based revenue driven by higher average AUM and AUA, underwriting and advisory fees and credit fees. The previous period also included the impact
of unfavourable CVA and FVA.
(1) Adjusted measures are non-GAAP measures. For additional information, see the “Non-GAAP measures” section.
(2) Trading activities and related risk management strategies can periodically shift trading income between net interest income and non-interest income. Therefore, we view total trading income as the
most appropriate measure of trading performance.
CIBC SECOND QUARTER 2021 4

Provision for credit losses
$ millions
For the three months ended
For the six months ended
2021 Apr. 30
2021 Jan. 31
2020 Apr. 30 (1)
2021 Apr. 30
2020 Apr. 30 (1)
Provision for (reversal of) credit losses – impaired
Canadian Personal and Business Banking $ 206 $ 109 $ 201 $ 315 $ 390
Canadian Commercial Banking and Wealth Management (8) 19 62 11 96
U.S. Commercial Banking and Wealth Management 23 48 20 71 36
Capital Markets 8 42 43 50 41
Corporate and Other 17 18 17 35 24
246 236 343 482 587
Provision for (reversal of) credit losses – performing
Canadian Personal and Business Banking (141) (55) 439 (196) 461
Canadian Commercial Banking and Wealth Management (10) 14 124 4 125
U.S. Commercial Banking and Wealth Management (35) (3) 210 (38) 209
Capital Markets (19) (37) 193 (56) 189
Corporate and Other (9) (8) 103 (17) 102
(214) (89) 1,069 (303) 1,086
$ 32 $ 147 $ 1,412 $ 179 $ 1,673
(1) Certain prior period information has been revised. See the “External reporting changes” section for additional details.
Provision for credit losses was down $1,380 million or 98% from the same quarter last year. Provision for credit losses on performing loans was down
$1,283 million as the same quarter last year included increases to reflect the unfavourable change in our economic outlook at the onset of the COVID-19
pandemic, while the current quarter included a reversal resulting from an improvement in our economic outlook as well as higher transfers of performing
loans to impaired mainly in Canadian Personal and Business Banking. Provision for credit losses on impaired loans was down $97 million from the same
quarter last year, primarily due to lower impairments net of reversals in Canadian Commercial Banking and Wealth Management, and Capital Markets.
Provision for credit losses was down $115 million or 78% from the prior quarter. The reversal of provision for credit losses on performing loans was
up $125 million mainly due to further favourable changes in our economic outlook impacting most of our SBUs and higher transfers of performing loans
to impaired in Canadian Personal and Business Banking. Provision for credit losses on impaired loans was comparable with the prior quarter.
Provision for credit losses for the six months ended April 30, 2021 was down $1,494 million or 89% from the same period in 2020. Provision for
credit losses on both performing loans and impaired loans was down $1,389 million and $105 million, respectively, as the same period last year was
adversely impacted by the onset of the COVID-19 pandemic, while the current period reflected an improvement in our economic outlook.
Non-interest expenses
Non-interest expenses were up $52 million or 2% from the same quarter last year, primarily due to higher performance-based compensation, partially
offset by a favourable commodity tax adjustment. The prior year also included a goodwill impairment charge, shown as an item of note.
Non-interest expenses were up $30 million or 1% from the prior quarter, primarily due to higher spending on strategic initiatives and performance-
based compensation, partially offset by a favourable commodity tax adjustment.
Non-interest expenses for the six months ended April 30, 2021 were down $287 million or 5% from the same period in 2020, as the prior period
included a restructuring charge primarily related to employee severance, shown as an item of note. The current period included a favourable commodity
tax adjustment.
Income taxes
Income tax expense was up $423 million or 604% from the same quarter last year, and up $28 million or 6% from the prior quarter, primarily due to
higher income.
Income tax expense for the six months ended April 30, 2021 was up $571 million or 148% from the same period in 2020, primarily due to higher
income.
In prior years, the Canada Revenue Agency (CRA) issued reassessments disallowing the deduction of Enron settlement payments and related legal
expenses (the “Enron expenses”). In January 2019, CIBC entered into a settlement agreement (the “Agreement”) with the CRA that provides certainty
with respect to the portion of the Enron expenses deductible in Canada. The Agreement resulted in the recognition of a net $38 million tax recovery in
the first quarter of 2019. This recovery was determined after taking into account taxable refund interest in Canada and also the portion of the Enron
expenses that are expected to be deductible in the United States (the “U.S. deduction”). The U.S. deduction has not been agreed to by the Internal
Revenue Service. It is possible that adjustments may be required to the amount of tax benefits recognized in the U.S.
The CRA has reassessed CIBC approximately $1,115 million of additional income tax by denying the tax deductibility of certain 2011 to 2015
Canadian corporate dividends on the basis that they were part of a “dividend rental arrangement”. In addition, the CRA has proposed to reassess
$305 million for 2016. The dividends that were subject to the reassessments and proposed reassessment for 2016 are similar to those prospectively
addressed by the rules in the 2015 and 2018 Canadian federal budgets. It is possible that subsequent years may be reassessed for similar activities.
CIBC is confident that its tax filing positions were appropriate and intends to defend itself vigorously. Accordingly, no amounts have been accrued in the
interim consolidated financial statements.
CIBC SECOND QUARTER 2021 5

Foreign exchange
The following table provides the estimated impact of U.S. dollar translation on key lines of our interim consolidated statement of income, as a result of
changes in average exchange rates.
$ millions, except per share amounts
For the three months ended
For the six months ended
Apr. 30, 2021 vs.
Apr. 30, 2020
Apr. 30, 2021 vs.
Jan. 31, 2021
Apr. 30, 2021 vs.
Apr. 30, 2020
Estimated increase (decrease) in:
Total revenue $ (109) $ (26) $ (137)
Provision for credit losses 3 1 2
Non-interest expenses (50) (12) (63)
Income taxes (8) (2) (10)
Net income (54) (13) (66)
Impact on EPS:
Basic $ (0.12) $ (0.03) $ (0.15)
Diluted (0.12) (0.03) (0.15)
Average USD depreciation relative to CAD (9.3) % (2.4) % (6.0) %
Review of quarterly financial information
$ millions, except per share amounts, for the three months ended 2021 2020 2019
Apr. 30 Jan. 31 Oct. 31 Jul. 31 Apr. 30 Jan. 31 Oct. 31 Jul. 31
Revenue Canadian Personal and Business Banking (1) $ 1,941 $ 2,025 $ 1,997 $ 1,910 $ 1,936 $ 2,079 $ 2,095 $ 2,108 Canadian Commercial Banking and Wealth
Management 1,135 1,088 1,028 1,013 1,025 1,055 1,026 1,019 U.S. Commercial Banking and Wealth Management (1)(2) 532 561 519 512 511 501 492 494 Capital Markets (1)(2) 1,194 1,174 934 1,146 967 1,006 870 884 Corporate and Other (1)(2) 130 115 122 127 139 214 289 227
Total revenue $ 4,932 $ 4,963 $ 4,600 $ 4,708 $ 4,578 $ 4,855 $ 4,772 $ 4,732
Net interest income $ 2,747 $ 2,839 $ 2,792 $ 2,729 $ 2,762 $ 2,761 $ 2,801 $ 2,694 Non-interest income 2,185 2,124 1,808 1,979 1,816 2,094 1,971 2,038
Total revenue 4,932 4,963 4,600 4,708 4,578 4,855 4,772 4,732 Provision for credit losses 32 147 291 525 1,412 261 402 291 Non-interest expenses 2,756 2,726 2,891 2,702 2,704 3,065 2,838 2,670
Income before income taxes 2,144 2,090 1,418 1,481 462 1,529 1,532 1,771 Income taxes 493 465 402 309 70 317 339 373
Net income $ 1,651 $ 1,625 $ 1,016 $ 1,172 $ 392 $ 1,212 $ 1,193 $ 1,398
Net income (loss) attributable to: Non-controlling interests $ 4 $ 4 $ 1 $ 2 $ (8) $ 7 $ 8 $ 6 Equity shareholders 1,647 1,621 1,015 1,170 400 1,205 1,185 1,392
EPS – basic $ 3.56 $ 3.56 $ 2.21 $ 2.56 $ 0.83 $ 2.64 $ 2.59 $ 3.07 – diluted 3.55 3.55 2.20 2.55 0.83 2.63 2.58 3.06
(1) Certain prior period information has been revised. See the “External reporting changes” section for additional details.
(2) Capital Markets revenue and income taxes are reported on a TEB with an equivalent offset in the revenue and income taxes of Corporate and Other.
Our quarterly results are modestly affected by seasonal factors. The second quarter has fewer days as compared with the other quarters, generally
leading to lower earnings. The summer months (July – third quarter and August – fourth quarter) typically experience lower levels of market activity,
which affects our brokerage, investment management, and Capital Markets activities.
Revenue
Revenue in our lending and deposit-taking businesses are generally driven by the interest rate environment, volume growth and fees related to client
transaction activity. Our wealth management businesses are driven by market conditions and net sales activity impacting AUA and AUM. Capital
Markets revenue is also influenced, to a large extent, by market conditions affecting client trading and underwriting activity. The COVID-19 pandemic
beginning in the second quarter of 2020 and the lower interest rate environment continue to impact revenue for all our SBUs.
Canadian Personal and Business Banking revenue has been negatively impacted by the lower interest rate environment and lower client
transaction activity as a result of the COVID-19 pandemic, partially offset by volume growth.
Canadian Commercial Banking and Wealth Management has benefitted from volume growth in both loans and deposits. While loan growth has
been muted as a result of the economic uncertainty arising from the pandemic, it is starting to show signs of a recovery. This has been partially offset by
the lower interest rate environment. Wealth management AUA and AUM growth has been driven by a continued market recovery and strong sales
momentum subsequent to the market volatility noted in the second quarter of 2020.
U.S. Commercial Banking and Wealth Management revenue has benefitted from volume growth and growth in fee income. Wealth management
AUA and AUM growth has been driven by a continued market recovery and strong sales momentum subsequent to the market volatility noted in the
second quarter of 2020. In addition, deposit growth has outpaced loan growth resulting in net interest margin expansion in the past several quarters.
The second and fourth quarters of 2020 included lower trading revenue in Capital Markets.
Corporate and Other included the impact of changes relating to our adoption of IFRS 16 “Leases” commencing in the first quarter of 2020 that were
largely offset in non-interest expenses. Commencing in the second quarter of 2020, the COVID-19 pandemic led to excess liquidity costs that negatively
impacted revenue, while the interest rate environment and narrower margins have negatively impacted revenue in international banking. The fourth
quarter of 2019 included interest income related to the settlement of certain income tax matters.
CIBC SECOND QUARTER 2021 6

Provision for credit losses
Provision for credit losses is dependent upon the credit cycle in general, on the credit performance of the loan portfolios, and changes in economic
outlook. As a result of the impact of the COVID-19 pandemic beginning in the second quarter of 2020, our loan portfolios were negatively impacted by
the decline in economic activity associated with physical distancing measures as well as a decline in consumer spending, mitigated to an extent by
large-scale government support and relief programs targeting both individuals and businesses. There is considerable judgment involved in the
estimation of credit losses in the current environment. The ultimate impact of the COVID-19 pandemic will depend on the speed at which the vaccination
programs currently underway can be administered on a mass scale to effectively limit the spread of COVID-19 and its related variants, and the ability of
governments, businesses and health-care systems to effectively limit the epidemiological and economic impacts of expected resurgences of the virus,
including variants thereof, in the intervening period. The extent to which public health measures restrict economic activity and the level and effectiveness
of government support during this intervening period are material to our expectations for a continued economic rebound in 2021 and our resulting
provision for credit losses.
The significant increase in provision for credit losses on performing loans in the second and, to a lesser extent, third quarters of 2020 reflect the
onset of the COVID-19 pandemic and continued pressure on oil prices, and impacted all our SBUs. The first half of 2021 reflects a moderate
improvement in our outlook. We also recognized provisions on performing loans throughout 2019, reflective of the impact of certain unfavourable
changes to our economic outlook over that period.
In Canadian Personal and Business Banking, the fourth quarter of 2019 included higher provisions on impaired loans in the personal lending
portfolio. The third and fourth quarters of 2020 and the first quarter of 2021 included lower insolvencies and write-offs in credit cards. The decrease in
insolvencies was in line with the national Canadian trend. The low level of write-offs was impacted by the assistance offered to clients from our payment
deferral programs, lower client spending as well as government support. The second quarter of 2021 included higher write-offs in credit cards, mainly
attributable to a relatively small segment of client balances that were previously in the payment deferral programs, that continued to underperform and
eventually were written off after exiting the programs.
In Canadian Commercial Banking and Wealth Management, the first and third quarters of 2020 and the fourth quarter of 2019 included provisions
on one fraud-related impairment.
In U.S. Commercial Banking and Wealth Management, the first quarters of 2020 and 2021, the second half of 2020 and the third quarter of 2019
included higher provisions on impaired loans. Impaired loan provisions in the U.S. remain elevated.
In Capital Markets, the second and third quarters of 2020, and the second half of 2019 included higher provisions on impaired loans in the oil and
gas sector.
In Corporate and Other, provisions on impaired loans remained low and stable over the past two years.
Non-interest expenses
Non-interest expenses have fluctuated over the period largely due to changes in employee compensation expenses, investments in strategic initiatives
and movement in foreign exchange rates. The fourth quarter of 2019 and the second and fourth quarters of 2020 included goodwill impairment charges
related to our controlling interest in CIBC FirstCaribbean. The fourth quarter of 2019 and the third quarter of 2020 included increases in legal provisions
in Corporate and Other, both shown as items of note. The first quarter of 2020 included a restructuring charge associated with ongoing efforts to
transform our cost structure and simplify our bank. The fourth quarter of 2020 included a charge related to the consolidation of our real estate portfolio as
a result of our upcoming move to our new global headquarters and a gain as a result of plan amendments related to pension and other post-employment
plans.
Income taxes
Income taxes vary with changes in income subject to tax, and the jurisdictions in which the income is earned. Taxes can also be affected by the impact
of significant items and the level of tax-exempt income.
Non-GAAP measures
We use a number of financial measures to assess the performance of our business lines as described below. Some measures are calculated in
accordance with GAAP (IFRS), while other measures do not have a standardized meaning under GAAP, and accordingly, these measures may not be
comparable to similar measures used by other companies. Investors may find these non-GAAP measures useful in understanding how management
views underlying business performance.
Management assesses results on a reported and adjusted basis and considers both as useful measures of performance. Adjusted results remove
items of note from reported results and are used to calculate our adjusted measures. Adjusted measures represent non-GAAP measures.
For a more detailed discussion on our non-GAAP measures, see page 16 of our 2020 Annual Report.
CIBC SECOND QUARTER 2021 7

The following table provides a reconciliation of GAAP (reported) results to non-GAAP (adjusted) results.
$ millions
For the three months ended
For the six months ended
2021 Apr. 30
2021 Jan. 31
2020 Apr. 30
2021 Apr. 30
2020 Apr. 30
Operating results – reported Total revenue $ 4,932 $ 4,963 $ 4,578 $ 9,895 $ 9,433 Provision for credit losses 32 147 1,412 179 1,673 Non-interest expenses 2,756 2,726 2,704 5,482 5,769
Income before income taxes 2,144 2,090 462 4,234 1,991 Income taxes 493 465 70 958 387
Net income 1,651 1,625 392 3,276 1,604
Net income (loss) attributable to non-controlling interests 4 4 (8) 8 (1) Net income attributable to equity shareholders 1,647 1,621 400 3,268 1,605
Diluted EPS ($) $ 3.55 $ 3.55 $ 0.83 $ 7.10 $ 3.46
Impact of items of note (1)
Non-interest expenses Amortization of acquisition-related intangible assets (2) $ (20) $ (20) $ (29) $ (40) $ (56) Restructuring charge (3) – – – – (339) Goodwill impairment (4) – – (28) – (28)
Impact of items of note on non-interest expenses (20) (20) (57) (40) (423)
Total pre-tax impact of items of note on net income 20 20 57 40 423
Amortization of acquisition-related intangible assets (2) 5 5 8 10 14 Restructuring charge (3) – – – – 89
Impact of items of note on income taxes 5 5 8 10 103
Total after-tax impact of items of note on net income 15 15 49 30 320
Impact of items of note on diluted EPS ($) (5) $ 0.04 $ 0.03 $ 0.11 $ 0.07 $ 0.72
Operating results – adjusted (6)
Total revenue (7) $ 4,932 $ 4,963 $ 4,578 $ 9,895 $ 9,433 Provision for credit losses 32 147 1,412 179 1,673 Non-interest expenses 2,736 2,706 2,647 5,442 5,346
Income before income taxes 2,164 2,110 519 4,274 2,414 Income taxes 498 470 78 968 490
Net income 1,666 1,640 441 3,306 1,924
Net income (loss) attributable to non-controlling interests 4 4 (8) 8 (1) Net income attributable to equity shareholders 1,662 1,636 449 3,298 1,925
Adjusted diluted EPS ($) $ 3.59 $ 3.58 $ 0.94 $ 7.17 $ 4.18
(1)
Reflects the impact of items of note on our adjusted results as compared with our reported results.
(2) Amortization of acquisition-related intangible assets is recognized in the SBU of the acquired business or Corporate and Other. A summary is provided in the table below.
Canadian Personal and Business Banking (pre-tax) $ – $ – $ (2) $ – $ (4) Canadian Personal and Business Banking (after-tax) – – (1) – (3)
U.S. Commercial Banking and Wealth Management (pre-tax) (18) (17) (23) (35) (45) U.S. Commercial Banking and Wealth Management (after-tax) (13) (12) (17) (25) (33)
Corporate and Other (pre-tax) (2) (3) (4) (5) (7) Corporate and Other (after-tax) (2) (3) (3) (5) (6)
(3) Restructuring charge associated with ongoing efforts to transform our cost structure and simplify our bank. This charge consists primarily of employee severance and related costs and was
recognized in Corporate and Other.
(4) Goodwill impairment charge related to our controlling interest in CIBC FirstCaribbean recognized in Corporate and Other.
(5) Includes the impact of rounding differences between diluted EPS and adjusted diluted EPS.
(6) Adjusted to exclude the impact of items of note.
(7) Excludes a TEB adjustment of $51 million (January 31, 2021: $54 million; April 30, 2020: $46 million) and $105 million for the six months ended April 30, 2021 (April 30, 2020: $95 million). Our
adjusted efficiency ratio is calculated on a TEB.
The table below provides a summary of adjusted results by SBU(1).
$ millions, for the three months ended
Canadian Personal and
Business Banking
Canadian Commercial
Banking and Wealth
Management
U.S. Commercial
Banking and Wealth
Management Capital
Markets Corporate and Other
CIBC Total
2021 Apr. 30
Reported net income (loss) $ 603 $ 399 $ 216 $ 495 $ (62) $ 1,651 After-tax impact of items of note (1) – – 13 – 2 15
Adjusted net income (loss) (2) $ 603 $ 399 $ 229 $ 495 $ (60) $ 1,666
2021 Jan. 31
Reported net income (loss) $ 652 $ 354 $ 188 $ 493 $ (62) $ 1,625 After-tax impact of items of note (1) – – 12 – 3 15
Adjusted net income (loss) (2) $ 652 $ 354 $ 200 $ 493 $ (59) $ 1,640
2020 Apr. 30 (3)
Reported net income (loss) $ 163 $ 206 $ 15 $ 177 $ (169) $ 392 After-tax impact of items of note (1) 1 – 17 – 31 49
Adjusted net income (loss) (2) $ 164 $ 206 $ 32 $ 177 $ (138) $ 441
$ millions, for the six months ended
2021 Apr. 30
Reported net income (loss) $ 1,255 $ 753 $ 404 $ 988 $ (124) $ 3,276 After-tax impact of items of note (1) – – 25 – 5 30
Adjusted net income (loss) (2) $ 1,255 $ 753 $ 429 $ 988 $ (119) $ 3,306
2020 Apr. 30 (3)
Reported net income (loss) $ 738 $ 542 $ 180 $ 555 $ (411) $ 1,604 After-tax impact of items of note (1) 3 – 33 – 284 320
Adjusted net income (loss) (2) $ 741 $ 542 $ 213 $ 555 $ (127) $ 1,924
(1) Reflects the impact of items of note described above.
(2) Non-GAAP measure.
(3) Certain prior period information has been revised. See the “External reporting changes” section for additional details.
8 CIBC SECOND QUARTER 2021

Strategic business units overview CIBC has four SBUs – Canadian Personal and Business Banking, Canadian Commercial Banking and Wealth Management, U.S. Commercial Banking
and Wealth Management, and Capital Markets. These SBUs are supported by the following functional groups – Technology, Infrastructure and
Innovation, Risk Management, People, Culture and Brand, Finance and Enterprise Strategy, as well as other support groups, which all form part of
Corporate and Other. The expenses of these functional and support groups are generally allocated to the business lines within the SBUs. The majority of
the functional and support costs of CIBC Bank USA are recognized directly in the U.S. Commercial Banking and Wealth Management SBU. Corporate
and Other also includes the results of CIBC FirstCaribbean and other strategic investments, as well as other income statement and balance sheet items
not directly attributable to the business lines. The key methodologies and assumptions used in reporting the financial results of our SBUs are provided
on page 19 of our 2020 Annual Report.
External reporting changes were made in the first quarter of 2021, which affected the results of our SBUs. See the “External reporting changes” section
for additional details.
Canadian Personal and Business Banking
Canadian Personal and Business Banking provides personal and business clients across Canada with financial advice, products and services
through banking centre, digital, mobile and remote channels.
Results(1)
$ millions
For the three months ended
For the six months ended
2021 Apr. 30
2021 Jan. 31
2020 Apr. 30 (2)
2021 Apr. 30
2020 Apr. 30 (2)
Revenue $ 1,941 $ 2,025 $ 1,936 $ 3,966 $ 4,015
Provision for (reversal of) credit losses
Impaired 206 109 201 315 390
Performing (141) (55) 439 (196) 461
Total provision for credit losses 65 54 640 119 851
Non-interest expenses 1,058 1,086 1,074 2,144 2,160
Income before income taxes 818 885 222 1,703 1,004
Income taxes 215 233 59 448 266
Net income $ 603 $ 652 $ 163 $ 1,255 $ 738
Net income attributable to:
Equity shareholders $ 603 $ 652 $ 163 $ 1,255 $ 738
Efficiency ratio 54.5 % 53.6 % 55.5 %
54.1 % 53.8 %
Return on equity (3) 37.9 % 39.9 % 9.8 % 38.9 % 22.3 %
Average allocated common equity (3) $ 6,530 $ 6,480 $ 6,734 $ 6,504 $ 6,641
Full-time equivalent employees 12,525 12,594 12,399 12,525 12,399
(1) For additional segmented information, see the notes to the interim consolidated financial statements.
(2) Certain prior period information has been revised. See the “External reporting changes” section for additional details.
(3) For additional information, see the “Non-GAAP measures” section.
Financial overview
Net income for the quarter was $603 million, up $440 million from the same quarter last year, primarily due to a lower provision for credit losses.
Net income was down $49 million from the prior quarter, primarily due to lower revenue, partially offset by lower non-interest expenses.
Net income for the six months ended April 30, 2021 was $1,255 million, up $517 million from the same period in 2020, primarily due to a lower
provision for credit losses, partially offset by lower revenue.
Revenue
Revenue was up $5 million from the same quarter last year, primarily due to volume growth and higher fees, partially offset by narrower margins largely
as a result of changes in the interest rate environment and the impact of one fewer day in the current quarter.
Revenue was down $84 million or 4% from the prior quarter, primarily due to fewer days in the current quarter and lower fee income.
Revenue for the six months ended April 30, 2021 was down $49 million or 1% from the same period in 2020, primarily due to narrower margins
largely as a result of changes in the interest rate environment, lower fee income, and the impact of one fewer day in the current period, partially offset by
volume growth.
Provision for credit losses
Provision for credit losses was down $575 million from the same quarter last year. The current quarter included a provision reversal on performing loans
due to a favourable change in our economic outlook and the transfer of accounts to impaired, while the same quarter last year included a provision for
credit losses due to an unfavourable change in our economic outlook relating to the onset of the COVID-19 pandemic. Provision for credit losses on
impaired loans was comparable with the same quarter last year.
Provision for credit losses was up $11 million from the prior quarter. Provision reversal on performing loans was up due to a favourable change in
our economic outlook, and higher transfers of performing loans to impaired. Provision for credit losses on impaired loans was up due to higher write-offs
in credit cards and a model parameter update in the residential mortgage portfolio.
Provision for credit losses for the six months ended April 30, 2021 was down $732 million from the same period in 2020. Provision for credit losses
on both performing loans and impaired loans was down, as the same period in 2020 was adversely impacted by the onset of the COVID-19 pandemic.
CIBC SECOND QUARTER 2021 9

Non-interest expenses
Non-interest expenses were down $16 million or 1% from the same quarter last year and down $28 million or 3% from the prior quarter, primarily due to a
favourable commodity tax adjustment, partially offset by higher spending on strategic initiatives and employee-related compensation.
Non-interest expenses for the six months ended April 30, 2021 were down $16 million or 1% from the same period in 2020, primarily due to a
favourable commodity tax adjustment, partially offset by higher spending on strategic initiatives and employee-related compensation.
Income taxes
Income taxes were up $156 million from the same quarter last year, primarily due to higher income.
Income taxes were down $18 million from the prior quarter, primarily due to lower income.
Income taxes for the six months ended April 30, 2021 were up $182 million from the same period in 2020, primarily due to higher income.
Canadian Commercial Banking and Wealth Management
Canadian Commercial Banking and Wealth Management provides high-touch, relationship-oriented banking and wealth management services to
middle-market companies, entrepreneurs, high-net-worth individuals and families across Canada, as well as asset management services to institutional
investors.
Results(1)
$ millions
For the three months ended
For the six months ended
2021 Apr. 30
2021 Jan. 31
2020 Apr. 30
2021 Apr. 30
2020 Apr. 30
Revenue
Commercial banking $ 435 $ 428 $ 414 $ 863 $ 837
Wealth management 700 660 611 1,360 1,243
Total revenue 1,135 1,088 1,025 2,223 2,080
Provision for (reversal of) credit losses
Impaired (8) 19 62 11 96
Performing (10) 14 124 4 125
Total provision for (reversal of) credit losses (18) 33 186 15 221
Non-interest expenses 608 572 559 1,180 1,120
Income before income taxes 545 483 280 1,028 739
Income taxes 146 129 74 275 197
Net income $ 399 $ 354 $ 206 $ 753 $ 542
Net income attributable to:
Equity shareholders $ 399 $ 354 $ 206 $ 753 $ 542
Efficiency ratio 53.5 % 52.6 % 54.5 %
53.1 % 53.8 %
Return on equity (2) 24.4 % 21.4 % 13.0 % 22.9 % 17.2 %
Average allocated common equity (2) $ 6,704 $ 6,568 $ 6,448 $ 6,635 $ 6,336
Full-time equivalent employees 5,136 5,036 5,080 5,136 5,080
(1) For additional segmented information, see the notes to the interim consolidated financial statements.
(2) For additional information, see the “Non-GAAP measures” section.
Financial overview
Net income for the quarter was $399 million, up $193 million from the same quarter last year, and up $45 million from the prior quarter, primarily due to a
provision reversal compared with a provision for credit losses in the prior year and higher revenue, partially offset by higher non-interest expenses.
Net income for the six months ended April 30, 2021 was $753 million, up $211 million from the same period in 2020, primarily due to a provision
reversal in the current period compared with a provision for credit losses in the prior period and higher revenue, partially offset by higher non-interest
expenses.
Revenue
Revenue was up $110 million or 11% from the same quarter last year.
Commercial banking revenue was up $21 million, primarily due to higher fees and volume growth, partially offset by narrower margins and the
impact of one fewer day in the current quarter.
Wealth management revenue was up $89 million, primarily due to higher fee-based revenue driven by higher average AUA and AUM reflecting
market appreciation and net sales, and higher commission revenue from increased client activity.
Revenue was up $47 million or 4% from the prior quarter.
Commercial banking revenue was up $7 million, primarily due to wider margins, higher fees and volume growth, partially offset by the impact of
fewer days in the current quarter.
Wealth management revenue was up $40 million, primarily due to higher commission revenue from increased client activity and higher fee-based
revenue driven by higher average AUA and AUM reflecting market appreciation and net sales.
Revenue for the six months ended April 30, 2021 was up $143 million or 7% from the same period in 2020.
Commercial banking revenue was up $26 million, primarily due to higher fees and volume growth, partially offset by narrower margins and the
impact of one fewer day in the current period.
Wealth management revenue was up $117 million, primarily due to higher fee-based revenue driven by higher average AUA and AUM reflecting
market appreciation and net sales, and higher commission revenue from increased client activity.
10 CIBC SECOND QUARTER 2021

Provision for (reversal of) credit losses
Provision for credit losses was down $204 million from the same quarter last year. The current quarter included a provision reversal on performing loans
due to a favourable change in our economic outlook, while the same quarter last year included a provision for credit losses due to an unfavourable
change in our economic outlook relating to the onset of the COVID-19 pandemic. Provision for credit losses on impaired loans was down due to lower
provisions in the business services, and retail and wholesale sectors.
Provision for credit losses was down $51 million from the prior quarter. The current quarter included a provision reversal on performing loans due to
a favourable change in our economic outlook, while the prior quarter included a provision for credit losses reflective of unfavourable credit migration.
The current quarter also included a provision reversal on impaired loans while the prior quarter included a provision for credit losses relating to the
education, health and social services sectors.
Provision for credit losses for the six months ended April 30, 2021 was down $206 million from the same period in 2020. Provision for credit losses
on both performing loans and impaired loans were down, as the same period in 2020 was adversely impacted by the onset of the COVID-19 pandemic.
Non-interest expenses
Non-interest expenses were up $49 million or 9% from the same quarter last year, and up $36 million or 6% from the prior quarter, primarily due to higher
performance-based compensation.
Non-interest expenses for the six months ended April 30, 2021 were up $60 million or 5% from the same period in 2020, primarily due to higher
performance-based compensation.
Income taxes
Income taxes were up $72 million from the same quarter last year and up $17 million from the prior quarter, primarily due to higher income.
Income taxes for the six months ended April 30, 2021 were up $78 million from the same period in 2020, primarily due to higher income.
U.S. Commercial Banking and Wealth Management U.S. Commercial Banking and Wealth Management provides commercial banking and private wealth services across the U.S., as well as personal
and small business banking services in four U.S. Midwestern markets and focuses on middle-market and mid-corporate companies and high-net worth
individuals and families.
Results(1)
$ millions
For the three months ended
For the six months ended
2021 Apr. 30
2021 Jan. 31
2020 Apr. 30 (2)
2021 Apr. 30
2020 Apr. 30 (2)
Revenue Commercial banking $ 347 $ 381 $ 357 $ 728 $ 697 Wealth management (4) 185 180 154 365 315
Total revenue (3) 532 561 511 1,093 1,012 Provision for (reversal of) credit losses
Impaired 23 48 20 71 36 Performing (35) (3) 210 (38) 209
Total provision for (reversal of) credit losses (12) 45 230 33 245 Non-interest expenses 271 280 291 551 589
Income before income taxes 273 236 (10) 509 178 Income taxes 57 48 (25) 105 (2)
Net income $ 216 $ 188 $ 15 $ 404 $ 180
Net income attributable to: Equity shareholders $ 216 $ 188 $ 15 $ 404 $ 180
Efficiency ratio 51.0 % 49.9 % 57.0 % 50.4 % 58.2 % Return on equity (5) 9.9 % 8.2 % 0.6 % 9.0 % 4.0 % Average allocated common equity (5) $ 8,974 $ 9,105 $ 9,316 $ 9,041 $ 9,083 Full-time equivalent employees 2,105 2,090 2,029 2,105 2,029
(1) For additional segmented information, see the notes to the interim consolidated financial statements. (2) Certain prior period information has been revised. See the “External reporting changes” section for additional details. (3) Included $5 million of income relating to the accretion of the acquisition date fair value discount on the acquired loans of The PrivateBank for the quarter ended April 30, 2021 (January 31, 2021:
$4 million; April 30, 2020: $4 million) and $9 million for the six months ended April 30, 2021 (April 30, 2020: $10 million). (4) Includes revenue related to the U.S. Paycheck Protection Program. (5) For additional information, see the “Non-GAAP measures” section.
Financial overview
Net income for the quarter was $216 million, up $201 million from the same quarter last year, primarily due to a provision reversal in the current quarter
compared with a provision for credit losses in the prior year.
Net income was up $28 million from the prior quarter, primarily due to a provision reversal in the current quarter compared with a provision for credit
losses in the prior quarter, partially offset by lower revenue.
Net income for the six months ended April 30, 2021 was $404 million, up $224 million from the same period in 2020, primarily due to lower provision
for credit losses and higher revenue.
Revenue
Revenue was up $21 million or 4% from the same quarter last year as the negative impact of foreign exchange translation was more than offset by higher
U.S. dollar revenue.
Commercial banking revenue was down $10 million, as higher U.S. dollar revenue was more than offset by the impact of foreign exchange
translation. The higher U.S. dollar revenue was the result of volume growth and higher fees, partially offset by narrower margins.
Wealth management revenue was up $31 million, primarily due to higher U.S. dollar revenue from higher fees driven by higher average AUA and
AUM reflecting market appreciation and net sales, volume growth and other fees, partially offset by the impact of foreign exchange translation.
CIBC SECOND QUARTER 2021 11

Revenue was down $29 million or 5% from the prior quarter as a result of the negative impact of foreign exchange translation and lower U.S. dollar revenue.
Commercial banking revenue was down $34 million, primarily due to lower U.S. dollar revenue from the impact of fewer days in the quarter and
lower syndication fees, and the impact of foreign exchange translation.
Wealth management revenue was up $5 million, primarily due to higher U.S. dollar revenue from higher fees driven by higher average AUA and
AUM reflecting market appreciation and net sales, partially offset by the impact of foreign exchange translation.
Revenue for the six months ended April 30, 2021 was up $81 million or 8% from the same period in 2020, as a result of higher U.S. dollar revenue,
partially offset by the negative impact of foreign exchange translation.
Commercial banking revenue was up $31 million, primarily due to higher U.S. dollar revenue from volume growth and higher fees, partially offset by
the impact of foreign exchange translation.
Wealth management revenue was up $50 million, primarily due to higher U.S. dollar revenue from higher fees driven by higher average AUA and
AUM reflecting market appreciation and net sales, and volume growth, partially offset by the impact of foreign exchange translation.
Provision for (reversal of) credit losses
Provision for credit losses was down $242 million from the same quarter last year. The current quarter included a provision reversal on performing loans
primarily due to a favourable change in our economic outlook, while the same quarter last year included a provision for credit losses due to an
unfavourable change in our economic outlook relating to the onset of the COVID-19 pandemic. Provision for credit losses on impaired loans was
comparable with the same quarter last year.
Provision for credit losses was down $57 million from the prior quarter. Provision reversal on performing loans was up mainly due to a favourable
change in our economic outlook. Provision for credit losses on impaired loans was down mainly due to lower provisions in the real estate sector.
Provision for credit losses for the six months ended April 30, 2021 was down $212 million from the same period in 2020. Provision for credit losses
on performing loans was down, as the same period in 2020 was adversely impacted by the onset of the COVID-19 pandemic. Provision for credit losses
on impaired loans was up mainly attributable to the real estate sector.
Non-interest expenses
Non-interest expenses were down $20 million or 7% from the same quarter last year, primarily due to the impact of foreign exchange translation. U.S.
dollar expenses were marginally higher due to performance-based compensation, partially offset by lower business development costs.
Non-interest expenses were down $9 million or 3% from the prior quarter, primarily due to the impact of foreign exchange translation. U.S. dollar
expenses were comparable as higher employee compensation in the prior quarter, driven by seasonality associated with certain benefits and
performance-based awards, were offset by higher technology expenses and variable commissions in the current quarter.
Non-interest expenses for the six months ended April 30, 2021 were down $38 million or 6% from the same period in 2020, primarily due to the
impact of foreign exchange translation. U.S. dollar expenses were comparable as lower business development costs were offset by higher employee
compensation.
Income taxes
Income taxes were up $82 million from the same quarter last year and up $9 million from the prior quarter, primarily due to higher income.
Income taxes for the six months ended April 30, 2021 were up $107 million from the same period in 2020, primarily due to higher income.
Capital Markets
Capital Markets provides integrated global markets products and services, investment banking advisory and execution, corporate banking solutions
and top-ranked research to our clients around the world. It includes Direct Financial Services which focuses on expanding CIBC’s digitally-enabled
capabilities to provide a cohesive set of direct banking, direct investing and innovative multi-currency payment solutions for CIBC’s clients.
Results(1)
$ millions
For the three months ended
For the six months ended
2021 Apr. 30
2021Jan. 31
2020 Apr. 30 (2)
2021 Apr. 30
2020 Apr. 30 (2)
Revenue Global markets $ 539 $ 614 $ 462 $ 1,153 $ 962 Corporate and investment banking 448 358 329 806 659 Direct financial services 207 202 176 409 352
Total revenue (3) 1,194 1,174 967 2,368 1,973 Provision for (reversal of) credit losses
Impaired 8 42 43 50 41 Performing (19) (37) 193 (56) 189
Total provision for (reversal of) credit losses (11) 5 236 (6) 230 Non-interest expenses 538 522 492 1,060 984
Income before income taxes 667 647 239 1,314 759 Income taxes (3) 172 154 62 326 204
Net income $ 495 $ 493 $ 177 $ 988 $ 555
Net income attributable to: Equity shareholders $ 495 $ 493 $ 177 $ 988 $ 555
Efficiency ratio 45.0 % 44.5 % 50.9 % 44.8 % 49.9 %Return on equity (4) 29.0 % 28.0 % 10.2 % 28.5 % 16.2 %Average allocated common equity (4) $ 7,003 $ 6,991 $ 7,062 $ 6,997 $ 6,878 Full-time equivalent employees (5) 2,120 1,943 1,888
2,120 1,888
(1) For additional segmented information, see the notes to the interim consolidated financial statements. (2) Certain prior period information has been revised. See the “External reporting changes” section for additional details. (3) Revenue and income taxes are reported on a TEB. Accordingly, revenue and income taxes include a TEB adjustment of $51 million for the quarter ended April 30, 2021 (January 31, 2021: $54 million;
April 30, 2020: $46 million) and $105 million for the six months ended April 30, 2021 (April 30, 2020: $95 million). The equivalent amounts are offset in the revenue and income taxes of Corporate and Other. (4) For additional information, see the “Non-GAAP measures” section. (5) In the second quarter of 2021, 79 full-time equivalent employees related to Simplii Financial’s call centre operations were transferred to Capital Markets from Corporate and Other, with no financial
impact as the costs were previously allocated to direct financial services.
12 CIBC SECOND QUARTER 2021

Financial overview
Net income for the quarter was $495 million, up $318 million from the same quarter last year, primarily due to higher revenue, and a provision reversal in
the current quarter compared to a provision for credit losses in the prior year, partially offset by higher non-interest expenses.
Net income was comparable with the prior quarter.
Net income for the six months ended April 30, 2021 was $988 million, up $433 million from the same period in 2020, primarily due to higher
revenue, and a provision reversal in the current period compared to a provision for credit losses in the prior period, partially offset by higher non-interest
expenses.
Revenue
Revenue was up $227 million or 23% from the same quarter last year.
Global markets revenue was up $77 million, primarily due to higher equities and commodities trading revenue, partially offset by lower foreign
exchange and fixed income trading revenue. The previous period also included the impact of unfavourable CVA and FVA.
Corporate and investment banking revenue was up $119 million, primarily due to higher equity underwriting activity, higher advisory revenue and
higher corporate banking revenue.
Direct financial services revenue was up $31 million, primarily due to higher direct brokerage trading volumes and higher revenue from foreign
exchange and global money transfers.
Revenue was up $20 million or 2% from the prior quarter.
Global markets revenue was down $75 million, primarily due to lower revenue from our fixed income and foreign exchange businesses.
Corporate and investment banking revenue was up $90 million, primarily due to higher debt and equity underwriting activity and advisory revenue.
Direct financial services revenue was up $5 million, primarily due to higher direct brokerage trading volumes.
Revenue for the six months ended April 30, 2021 was up $395 million or 20% from the same period in 2020.
Global markets revenue was up $191 million, primarily due to higher revenue from our equities and commodities trading businesses, partially offset
by lower foreign exchange and fixed income trading revenue. The previous period also included the impact of unfavourable CVA and FVA.
Corporate and investment banking revenue was up $147 million, primarily due to higher equity and debt underwriting activity and higher advisory
revenue.
Direct financial services revenue was up $57 million, primarily due to higher direct brokerage trading volumes.
Provision for (reversal of) credit losses
Provision for credit losses was down $247 million from the same quarter last year. The current quarter included a provision reversal on performing loans
due to a favourable change in our economic outlook, while the same quarter last year included a provision for credit losses due to an unfavourable
change in our economic outlook relating to the onset of the COVID-19 pandemic. Provision for credit losses on impaired loans was down due to lower
provisions in the oil and gas sectors.
Provision for credit losses was down $16 million from the prior quarter. Provision reversal on performing loans was down as the prior quarter had
higher transfers of performing loans to impaired. Provision for credit losses on impaired loans was down due to lower provisions in the utilities sector.
Provision for credit losses for the six months ended April 30, 2021 was down $236 million from the same period in 2020. Provision for credit losses
on performing loans was down, as the same period in 2020 was adversely impacted by the onset of the COVID-19 pandemic. Provision for credit losses
on impaired loans was up due to higher provisions in the utilities sector, partially offset by lower provisions in the oil and gas sector.
Non-interest expenses
Non-interest expenses were up $46 million or 9% from the same quarter last year, primarily due to higher performance-based compensation and
investments in strategic initiatives.
Non-interest expenses were up $16 million or 3% from the prior quarter, primarily due to higher employee-related compensation and investments in
strategic initiatives, partially offset by lower performance-based compensation.
Non-interest expenses for the six months ended April 30, 2021 were up $76 million or 8% from the same period in 2020, primarily due to higher
performance-based compensation and investments in strategic initiatives.
Income taxes
Income taxes were up $110 million from the same quarter last year and up $18 million from the prior quarter, primarily due to higher income.
Income taxes for the six months ended April 30, 2021 were up $122 million from the same period in 2020, primarily due to higher income.
Corporate and Other
Corporate and Other includes the following functional groups – Technology, Infrastructure and Innovation, Risk Management, People, Culture and
Brand, Finance and Enterprise Strategy, as well as other support groups. The expenses of these functional and support groups are generally allocated
to the business lines within the SBUs. The majority of the functional and support costs of CIBC Bank USA are recognized directly in the U.S. Commercial
Banking and Wealth Management SBU. Corporate and Other also includes the results of CIBC FirstCaribbean and other strategic investments, as well
as other income statement and balance sheet items not directly attributable to the business lines.
CIBC SECOND QUARTER 2021 13

Results(1)
$ millions
For the three months ended
For the sixmonths ended
2021 Apr. 30
2021 Jan. 31
2020 Apr. 30 (2)
2021Apr. 30
2020 Apr. 30 (2)
Revenue International banking $ 168 $ 174 $ 170 $ 342 $ 376 Other (38) (59) (31) (97) (23)
Total revenue (3) 130 115 139 245 353 Provision for (reversal of) credit losses
Impaired 17 18 17 35 24 Performing (9) (8) 103 (17) 102
Total provision for credit losses 8 10 120 18 126 Non-interest expenses 281 266 288 547 916
Loss before income taxes (159) (161) (269) (320) (689) Income taxes (3) (97) (99) (100) (196) (278)
Net income (loss) $ (62) $ (62) $ (169) $ (124) $ (411)
Net income (loss) attributable to: Non-controlling interests $ 4 $ 4 $ (8) $ 8 $ (1) Equity shareholders (66) (66) (161) (132) (410)
Full-time equivalent employees 22,180 22,227 22,808
22,180 22,808
(1) For additional segmented information, see the notes to the interim consolidated financial statements. (2) Certain prior period information has been revised. See the “External reporting changes” section for additional details. (3) Revenue and income taxes of Capital Markets are reported on a TEB. The equivalent amounts are offset in the revenue and income taxes of Corporate and Other. Accordingly, revenue and income
taxes include a TEB adjustment of $51 million for the quarter ended April 30, 2021 (January 31, 2021: $54 million; April 30, 2020: $46 million) and $105 million for the six months ended April 30, 2021 (April 30, 2020: $95 million).
Financial overview
Net loss for the quarter was $62 million, compared with a net loss of $169 million in the same quarter last year, as the current quarter included a lower
provision for credit losses.
Net loss for the quarter was comparable with the prior quarter, as the current quarter included higher expenses, offset by higher revenue.
Net loss for the six months ended April 30, 2021 was $124 million, compared with a net loss of $411 million for the same period in 2020, as the prior
period included a restructuring charge, shown as an item of note. The current period also included a lower provision for credit losses, offset by lower revenue.
Revenue Revenue was down $9 million or 6% from the same quarter last year.
International banking revenue was comparable with the prior year, as higher U.S. dollar revenue in CIBC FirstCaribbean was largely offset by the
impact of foreign exchange translation. The higher U.S. dollar revenue was the result of the higher ECL charges on debt securities in the prior period,
partially offset by lower margins in the current quarter.
Other revenue was down $7 million, as the prior year included interest income related to the settlement of certain income tax matters and higher
treasury revenue.
Revenue was up $15 million or 13% from the prior quarter.
International banking revenue was down $6 million primarily due to the impact of foreign exchange translation. U.S. dollar revenue in CIBC
FirstCaribbean was comparable to the prior quarter.
Other revenue was up $21 million primarily due to higher treasury revenue and a lower TEB adjustment.
Revenue for the six months ended April 30, 2021 was down $108 million or 31% from the same period in 2020.
International banking revenue was down $34 million, primarily due to the impact of foreign exchange translation and lower U.S. dollar revenue in
CIBC FirstCaribbean driven by narrower margins, partially offset by higher ECL charges on debt securities in the prior period.
Other revenue was down $74 million, primarily due to lower treasury revenue largely as a result of excess liquidity costs. The prior period included
interest income related to the settlement of certain income tax matters as noted above.
Provision for (reversal of) credit losses Provision for credit losses was down $112 million from the same quarter last year. The current quarter included a provision reversal on performing loans
due to favourable credit migration, while the same quarter last year included a provision for credit losses due to an unfavourable change in our economic
outlook relating to the onset of the COVID-19 pandemic. Provision for credit losses on impaired loans was comparable with the same quarter last year.
Provision for credit losses was comparable with the prior quarter.
Provision for credit losses for the six months ended April 30, 2021 was down $108 million from the same period in 2020. Provision for credit losses
on performing loans was down, as the same period in 2020 was adversely impacted by the onset of the COVID-19 pandemic. Provision for credit losses
on impaired loans was up due to higher provisions in CIBC FirstCaribbean.
Non-interest expenses Non-interest expenses were down $7 million or 2% from the same quarter last year, as the same quarter last year included a goodwill impairment
charge, shown as an item of note, partially offset by higher unallocated corporate support costs in the current quarter.
Non-interest expenses were up $15 million or 6% from the prior quarter, primarily due to higher unallocated corporate support costs and higher
expenses in CIBC FirstCaribbean, partially offset by the timing of spending on strategic initiatives.
Non-interest expenses for the six months ended April 30, 2021 were down $369 million or 40% from the same period in 2020, as the prior period
included a restructuring charge and a goodwill impairment charge, both shown as items of note.
Income taxes Income tax benefit was comparable to the same quarter last year even with a lower loss, as the ECL provisions in CIBC FirstCaribbean in the same
quarter in the prior year resulted in limited tax benefits.
Income tax benefit was comparable to the prior quarter.
Income tax benefit for the six months ended April 30, 2021 was down $82 million from the same period in 2020, primarily due to a lower loss.
14 CIBC SECOND QUARTER 2021

Financial condition
Review of condensed consolidated balance sheet
$ millions, as at
2021
Apr. 30
2020
Oct. 31
Assets
Cash and deposits with banks $ 47,197 $ 62,518
Securities 155,122 149,046
Securities borrowed and purchased under resale agreements 74,679 74,142
Loans and acceptances, net of allowance 432,120 416,388
Derivative instruments 35,313 32,730
Other assets 38,447 34,727
$ 782,878 $ 769,551
Liabilities and equity
Deposits $ 576,563 $ 570,740
Obligations related to securities lent, sold short and under repurchase agreements 89,594 89,440
Derivative instruments 34,121 30,508
Other liabilities 34,267 31,816
Subordinated indebtedness 5,653 5,712
Equity 42,680 41,335
$ 782,878
$ 769,551
Assets
As at April 30, 2021, total assets were up $13.3 billion or 2% from October 31, 2020, net of a decrease of approximately $18 billion due to the
depreciation of the U.S. dollar.
Cash and deposits with banks decreased by $15.3 billion or 25%, primarily due to lower short-term placements in Treasury.
Securities increased by $6.1 billion or 4%, primarily due to increases in corporate equity and corporate debt, partially offset by decreases in debt
securities in Canadian governments and U.S. Treasury and other agencies.
Securities borrowed and purchased under resale agreements increased by $0.5 billion or 1%, primarily due to client-driven activities.
Loans and acceptances, net of allowance, increased by $15.7 billion or 4%, primarily due to increases in Canadian residential mortgages and
business and government loans, partially offset by a decrease in U.S. business and government loans due to foreign exchange translation.
Derivative instruments increased by $2.6 billion or 8%, largely driven by increases in foreign exchange and equity derivatives valuation, partially
offset by a decrease in interest rate derivatives valuation.
Other assets increased by $3.7 billion or 11%, primarily due to increases in collateral pledged for derivatives and precious metals.
Liabilities
As at April 30, 2021, total liabilities were up $12.0 billion or 2% from October 31, 2020, net of a decrease of approximately $18 billion due to the
depreciation of the U.S. dollar.
Deposits increased by $5.8 billion or 1%, primarily due to domestic retail volume growth and increased wholesale funding. Further details on the
composition of deposits are provided in Note 7 to our interim consolidated financial statements.
Obligations related to securities lent, sold short and under repurchase agreements were comparable to the prior period.
Derivative instruments increased by $3.6 billion or 12%, largely driven by increases in equity and foreign exchange derivatives valuation, partially
offset by decreases in interest rate and other commodity derivatives valuation.
Other liabilities increased by $2.5 billion or 8%, primarily due to increases in acceptances and collateral received for derivatives.
Subordinated indebtedness decreased by $0.1 billion or 1%. In the prior quarter we redeemed subordinated indebtedness and in the current
quarter we issued subordinated indebtedness. For further details see the “Capital management” section.
Equity
As at April 30, 2021, equity increased by $1.3 billion or 3% from October 31, 2020, primarily due to a net increase in retained earnings, partially offset by
a decrease in accumulated other comprehensive income.
CIBC SECOND QUARTER 2021 15

Capital management We actively manage our capital to maintain a strong and efficient capital base that provides balance sheet strength, enables our businesses to grow and
execute on our strategy, and meets regulatory requirements. For additional details on capital management, see pages 31 to 42 of our 2020 Annual Report.
Regulatory capital requirements under Basel III
Our regulatory capital requirements are determined in accordance with guidelines issued by the Office of the Superintendent of Financial Institutions
(OSFI), which are based upon the capital standards developed by the Basel Committee on Banking Supervision (BCBS).
Regulatory capital consists of CET1, Tier 1 and Tier 2 capital. The tiers of regulatory capital indicate increasing quality/permanence and the ability
to absorb losses. The major components of our regulatory capital are summarized as follows:
Higher
quality
Lower
quality
CET1 capital � Common equity (retained earnings, common shares and stock surplus)
� Accumulated other comprehensive income (AOCI)(1)
� Qualifying instruments issued by a consolidated banking subsidiary to third parties
� Certain eligible general allowance resulting from expected credit loss provisioning(2)
� Less regulatory deductions for items such as:
Goodwill and other intangible assets
Deferred tax assets
Net assets related to defined benefit pension plans
Certain investments
Additional Tier 1 (AT1) capital � Non-viability contingent capital (NVCC) preferred shares
� Limited recourse capital notes
�
Qualifying instruments issued by a consolidated subsidiary to third parties
� Innovative Tier 1 notes subject to phase-out rules for capital instruments
Tier 2 capital � NVCC subordinated indebtedness
� Non-qualifying subordinated indebtedness subject to phase-out rules for capital instruments
� Eligible general allowance under the standardized approach(2)
� Qualifying instruments issued by a consolidated subsidiary to third parties
Tie
r 1 c
ap
ital
To
tal c
ap
ital
(1) Excluding AOCI relating to cash flow hedges and changes to fair value option (FVO) liabilities attributable to changes in own credit risk.
(2) In response to the COVID-19 pandemic, OSFI has provided regulatory flexibility by implementing transitional arrangements for the treatment of expected loss provisioning, such that part of the
allowances that would otherwise be included in Tier 2 capital will instead qualify for inclusion in CET1 capital subject to certain scalars and limitations until fiscal 2022. See the “Continuous
enhancement to regulatory capital requirements” section for additional details.
Qualifying regulatory capital instruments must be capable of absorbing loss at the point of non-viability of the financial institution. Non-qualifying Tier 1
and Tier 2 capital instruments are excluded from regulatory capital at a rate of 10% per annum until November 1, 2021, at which point they will have no
regulatory value.
OSFI requires all institutions to achieve target capital ratios which include buffers. Targets may be higher for certain institutions at OSFI’s discretion.
CIBC, along with Bank of Montreal, Bank of Nova Scotia, National Bank of Canada, Royal Bank of Canada, and the Toronto-Dominion Bank, have been
designated by OSFI as domestic systemically important banks (D-SIBs) in Canada. D-SIBs are subject to a CET1 surcharge equal to 1.0% of RWA and a
Domestic Stability Buffer (DSB) requirement intended to address Pillar 2 risks that are not adequately captured in the Pillar 1 capital requirements. The
DSB is currently set at 1.0% but can range from 0% to 2.5% of RWA, see the “Continuous enhancement to regulatory capital requirements” section for
further details. Additionally, banks need to hold an incremental countercyclical capital buffer equal to their weighted-average buffer requirement in
Canada and across certain other jurisdictions where they have private sector credit exposures. OSFI’s current targets are summarized below:
As at April 30, 2021 Minimum
Capital conservation
buffer D-SIB buffer
Pillar 1 targets (1)
Domestic Stability
Buffer
Target including all buffer
requirements
CET1 ratio 4.5 % 2.5 % 1.0 % 8.0 % 1.0 % 9.0 %
Tier 1 capital ratio 6.0 % 2.5 % 1.0 % 9.5 % 1.0 % 10.5 %
Total capital ratio 8.0 % 2.5 % 1.0 % 11.5 % 1.0 % 12.5 %
(1) The countercyclical capital buffer applicable to CIBC is insignificant as at April 30, 2021.
Capital adequacy requirements are applied on a consolidated basis consistent with our financial statements, except for our insurance subsidiaries
(CIBC Cayman Reinsurance Limited and CIBC Life Insurance Company Limited), which are excluded from the regulatory scope of consolidation. The
basis of consolidation applied to our financial statements is described in Note 1 to the consolidated financial statements included in our 2020 Annual
Report. CIBC Life Insurance Company Limited is subject to OSFI’s Life Insurance Capital Adequacy Test.
16 CIBC SECOND QUARTER 2021

Continuous enhancement to regulatory capital requirements
The BCBS and OSFI have published a number of proposals for changes to the existing regulatory capital requirements to strengthen the regulation,
supervision, and practices of banks with the overall objective of enhancing financial stability (see pages 34 to 35 of our 2020 Annual Report). The
discussion below provides a summary of BCBS and OSFI publications that have been issued since our 2020 Annual Report.
On March 15, 2021, OSFI published an update to its July 18, 2020 capital ruling on Limited Recourse Capital Notes (LRCNs). The July 18, 2020
capital ruling assessed LRCNs relative to the eligibility criteria set out in the Capital Adequacy Requirements (CAR) guideline, and provided that the
LRCNs can qualify as Additional Tier 1 regulatory capital, subject to certain limitations and disclosure requirements. The 2021 revisions provide
clarification on the ruling’s conditions and limitations on the permitted investor base, and the cap on the amount of LRCN issuances that may be
included in regulatory capital.
On March 16, 2021, OSFI announced that the temporary COVID-19-related reduction of stressed value-at-risk multipliers used in the determination
of market risk capital should be unwound effective May 1, 2021.
Transitional arrangements for the capital treatment of expected loss provisioning In response to the COVID-19 pandemic, OSFI introduced transitional arrangements for ECL provisioning that are available under the Basel Framework.
These transitional arrangements were effective immediately upon being announced by OSFI on March 27, 2020 and result in a portion of allowances that
would otherwise be included in Tier 2 capital qualifying for inclusion in CET1 capital. The amount of ECL allowances eligible for inclusion in CET1 capital
is determined based on the increase in stage 1 and stage 2 allowances relative to balances as at January 31, 2020 as a baseline. This amount is then
adjusted for tax effects and is subject to a scaling factor that will decrease over time. The scaling factor has been set at 70% for fiscal 2020, 50% for
fiscal 2021, and 25% for fiscal 2022. For exposures under the internal ratings-based (IRB) approach, the lower of this amount and excess allowances
otherwise eligible for inclusion in Tier 2 capital is included as CET1 capital under the transitional arrangements.
Basel III reforms In March 2021, OSFI launched a public consultation on the implementation of the final Basel III reforms into its capital, leverage and related disclosure
guidelines. OSFI’s proposals are in line with the BCBS standards, with considerations given to the Canadian market. OSFI’s proposed changes include:
� revisions to both the Internal Rating-based Approach (IRB) and Standardized Approach to credit risk;
� revised operational, market risk, and CVA frameworks;
� updated CET1 capital deductions for certain assets;
� an updated capital output floor based on the revised Standardized Approach noted above, with the phase-in of the floor factor over 3 years
beginning in 2023; and
� modification to the Leverage Ratio framework, including a buffer requirement for D-SIBs.
The proposed implementation date for the changes is the first quarter of 2023, with the exceptions of revisions to the CVA and market risk frameworks,
which are targeted for the first quarter of 2024.
Domestic Stability Buffer In response to the COVID-19 pandemic and market conditions, OSFI announced an immediate reduction in the DSB requirement from 2.0% to 1.0% for
all D-SIBs effective March 13, 2020. This reduction decreased OSFI’s target capital ratios, including all buffers, for CET1, Tier 1 and Total capital to
9.0%, 10.5% and 12.5%, respectively. On December 8, 2020, OSFI again announced that the DSB would remain unchanged at 1.0%.
Capital treatment of federal program supporting highly affected sectors In January 2021, OSFI provided direction on the capital treatment of the government-guaranteed loans made under the Business Development Bank
of Canada (BDC) Highly Affected Sectors Credit Availability Program (HASCAP) loan guarantee program. The loans will be considered sovereign risk
based on the BDC guarantee, and the relevant risk weight under the CAR Guideline will be applied accordingly. The entire amount of the loan is to be
included in the exposure measure used for calculating the leverage ratio. See “Government lending programs in response to COVID-19” for further
details.
Total loss absorbing capacity requirements Beginning in the first quarter of 2022, D-SIBs will be required to maintain a supervisory target total loss absorbing capacity requirements (TLAC) ratio
(which comprises a minimum risk-based TLAC ratio of 21.5% plus the then-applicable DSB) and a minimum TLAC leverage ratio of 6.75%. TLAC is
required to ensure that a non-viable bank will have sufficient loss absorbing capacity, through its regulatory capital and bail-in eligible instruments, to
support its recapitalization. In accordance with the Department of Finance’s Bank recapitalization (Bail-in) conversion regulations, senior debt issued by
D-SIBs on or after September 23, 2018, with an original term to maturity of more than 400 days (including explicit or embedded options) that is
unsecured or partially secured is subject to bail-in. Consumer deposits, certain derivatives, covered bonds, and certain structured notes are not eligible
for bail-in.
We continue to monitor and prepare for developments impacting regulatory capital requirements and disclosures.
CIBC SECOND QUARTER 2021 17

Regulatory capital
Our regulatory capital levels and ratios are summarized below:
$ millions, as at
2021
Apr. 30
2020
Oct. 31
CET1 capital (1) $ 31,915 $ 30,876
Tier 1 capital 35,759 34,775
Total capital 41,826 40,969
RWA consist of:
Credit risk 219,292 218,694
Market risk 7,937 5,858
Operational risk 30,768 30,319
Total RWA 257,997 254,871
CET1 ratio 12.4 % 12.1 %
Tier 1 capital ratio 13.9 % 13.6 %
Total capital ratio 16.2 % 16.1 %
(1) Includes the impact of the ECL transitional arrangement announced by OSFI on March 27, 2020. The transitional arrangement results in a portion of ECL allowances that would otherwise be included
in Tier 2 capital qualifying for inclusion in CET1 capital. The amount is subject to certain adjustments and limitations until fiscal 2022.
CET1 ratio The CET1 ratio at April 30, 2021 increased 0.3% from October 31, 2020, driven by the increase in CET1 capital, partially offset by the impact of an
increase in RWA.
The increase in CET1 capital was primarily the result of internal capital generation (net income less dividends), partially offset by a decrease in
AOCI (largely due to the impact of currency translation adjustments). The increase in RWA was primarily due to increases in book size, market risk levels
and model updates, partially offset by the impact of foreign exchange translation, improved credit quality and methodology changes. Overall the impact
of foreign exchange translation on the CET1 ratio was minimal.
The combined impact of our expected loss calculation for regulatory capital purposes and credit risk RWA could act as a headwind to the positive
impact of earnings on our CET1 ratio in future periods to the extent balances increase, utilization and delinquency rates increase and risk ratings and
other credit scores deteriorate in line with our forward-looking information.
Tier 1 capital ratio The Tier 1 capital ratio at April 30, 2021 increased 0.3% from October 31, 2020 primarily due to the factors affecting the CET1 ratio noted above.
Total capital ratio The Total capital ratio at April 30, 2021 increased 0.1% from October 31, 2020. Total capital was favourably impacted by the factors affecting the Tier 1
capital ratio noted above, while being negatively impacted by a decrease in the applicable cap related to the inclusion of non-qualifying instruments.
The negative impact of a redemption of subordinated indebtedness during the first quarter was offset by the issuance of subordinated indebtedness
during the second quarter (see “Significant capital management activity” for additional details).
Leverage ratio
The Basel III capital standards include a non-risk-based capital metric, the leverage ratio, to supplement risk-based capital requirements. The leverage
ratio is defined as Tier 1 capital divided by the leverage ratio exposure. The leverage ratio exposure is defined under the rules as the sum of:
(i) On-balance sheet assets less Tier 1 capital regulatory adjustments;
(ii) Derivative exposures;
(iii) Securities financing transaction exposures; and
(iv) Off-balance sheet exposures (such as commitments, direct credit substitutes, letters of credit, and securitization exposures).
OSFI expects federally regulated deposit-taking institutions to have leverage ratios that meet or exceed 3.0%. This minimum may be higher for certain
institutions at OSFI’s discretion.
$ millions, as at 2021
Apr. 30 2020
Oct. 31
Tier 1 capital $ 35,759 $ 34,775
Leverage ratio exposure (1) 767,391 741,760
Leverage ratio 4.7 % 4.7 %
(1) Includes the impact of regulatory flexibility provided by OSFI in respect of exposures arising from central bank reserves and sovereign-issued securities that qualify as high quality liquid assets. The
treatment specified by OSFI permits these items to be excluded from the leverage ratio exposure measure.
The leverage ratio at April 30, 2021 was comparable with October 31, 2020, as the impact of an increase in Tier 1 capital was offset by the impact of an
increase in leverage ratio exposure. The increase in leverage ratio exposure was primarily driven by an increase in on-balance sheet exposures.
18 CIBC SECOND QUARTER 2021

Significant capital management activity
In conjunction with OSFI’s March 13, 2020 announcement to decrease the DSB to 1.0% in response to COVID-19, OSFI also announced that it expects
all federally regulated financial institutions to cease dividend increases and share buybacks for the time being, in order to ensure that the additional
capital available is used to support Canadian lending activities. The following were the main capital initiatives undertaken in 2021:
Shareholder investment plan Pursuant to the shareholder investment plan, we issued 259,931 common shares for consideration of $33 million for the current quarter and 554,095 common
shares for consideration of $65 million for the six months ended April 30, 2021.
Subordinated indebtedness On January 26, 2021, we redeemed all $1.0 billion of our 3.42% Debentures due January 26, 2026. In accordance with their terms, the Debentures
were redeemed at 100% of their principal amount, plus accrued and unpaid interest thereon.
On April 19, 2021, we issued $1.0 billion principal amount of 1.96% Debentures due April 21, 2031 (subordinated indebtedness). The Debentures
bear interest at a fixed rate of 1.96% per annum (paid semi-annually) until April 21, 2026, and at three-month CDOR plus 0.56% per annum (paid
quarterly) thereafter until maturity on April 21, 2031.
Outstanding share data The table below provides a summary of our outstanding shares, Non-Viability Contingent Capital (NVCC) instruments, and the maximum number of
common shares issuable on conversion/exercise:
$ millions, except number of shares and per share amounts, as at April 30, 2021
Shares outstanding Minimum
conversion price per
common share
Maximum number of common
shares issuable on conversion
Number of shares
Par value
Preferred shares (1)(2)
Series 39 (NVCC) 16,000,000 $ 400 $ 5.00 80,000,000 Series 41 (NVCC) 12,000,000 300 5.00 60,000,000 Series 43 (NVCC) 12,000,000 300 5.00 60,000,000 Series 45 (NVCC) 32,000,000 800 5.00 160,000,000 Series 47 (NVCC) 18,000,000 450 5.00 90,000,000 Series 49 (NVCC) 13,000,000 325 5.00 65,000,000 Series 51 (NVCC) 10,000,000 250 5.00 50,000,000
Limited recourse capital notes
4.375% Limited recourse capital notes Series 1 (NVCC)
(2)(3)
n/a 750 5.00 150,000,000
Subordinated indebtedness (2)(4)
3.45% Debentures due April 4, 2028 (NVCC) n/a 1,500 5.00 450,000,000 2.95% Debentures due June 19, 2029 (NVCC) n/a 1,500 5.00 450,000,000 2.01% Debentures due July 21, 2030 (NVCC) n/a 1,000 5.00 300,000,000 1.96% Debentures due April 21, 2031 (NVCC) n/a 1,000 5.00 300,000,000
Total $ 8,575 2,215,000,000
(1) Upon the occurrence of a Trigger Event, each share is convertible into a number of common shares, determined by dividing the par value of $25.00 plus declared and unpaid dividends by the
average common share price (as defined in the relevant prospectus supplement) subject to a minimum price per share (subject to adjustment in certain events as defined in the relevant prospectus
supplement). Preferred shareholders do not have the right to convert their shares into common shares.
(2) The maximum number of common shares issuable on conversion excludes the impact of declared but unpaid dividends and accrued interest.
(3) Upon the occurrence of a Trigger Event, the Series 53 Preferred Shares held in the Limited Recourse Trust in support of the limited recourse capital notes are convertible into a number of common
shares, determined by dividing the par value of $1,000 by the average common share price (as defined in the relevant prospectus supplement) subject to a minimum price per common share
(subject to adjustment in certain events as defined in the relevant prospectus supplement).
(4) Upon the occurrence of a Trigger Event, the Debentures are convertible into a number of common shares, determined by dividing 150% of the par value plus accrued and unpaid interest by the
average common share price (as defined in the relevant prospectus supplement) subject to a minimum price per common share (subject to adjustment in certain events as defined in the relevant
prospectus supplement).
n/a Not applicable.
The occurrence of a “Trigger Event” would result in conversion of all of the outstanding NVCC instruments described above, which would represent a
dilution impact of 83% based on the number of CIBC common shares outstanding as at April 30, 2021. As described in the CAR Guideline, a Trigger
Event occurs when OSFI determines the bank is or is about to become non-viable and, if after conversion of all contingent instruments and consideration
of any other relevant factors or circumstances, it is reasonably likely that its viability will be restored or maintained; or if the bank has accepted or agreed
to accept a capital injection or equivalent support from a federal or provincial government, without which OSFI would have determined the bank to be
non-viable.
In addition to the potential dilution impacts related to the NVCC instruments discussed above, as at April 30, 2021, $23.9 billion (October 31, 2020:
$19.9 billion) of our outstanding liabilities were subject to conversion under the bail-in regime. Under the bail-in regime there is no fixed and
pre-determined contractual conversion ratio for the conversion of the specified eligible shares and liabilities of CIBC that are subject to a bail-in
conversion into common shares, nor are there specific requirements regarding whether liabilities subject to a bail-in conversion are converted into
common shares of CIBC or any of its affiliates. Canada Deposit Insurance Corporation (CDIC) determines the timing of the bail-in conversion, the portion
of the specified eligible shares and liabilities to be converted and the terms and conditions of the conversion, subject to parameters set out in the bail-in
regime. See the “Total loss absorbing capacity requirements” section for further details.
Off-balance sheet arrangements We enter into off-balance sheet arrangements in the normal course of our business. Details of our off-balance sheet arrangements are provided on
page 41 of our 2020 Annual Report and also in Note 7 and Note 22 to the consolidated financial statements included in our 2020 Annual Report.
CIBC SECOND QUARTER 2021 19

Management of risk
Our approach to management of risk has not changed significantly from that described on pages 43 to 82 of our 2020 Annual Report.
Risk overview CIBC faces a wide variety of risks across all of its areas of business. Identifying and understanding risks and their impact allows CIBC to frame its risk
appetite and risk management practices. Defining acceptable levels of risk, and establishing sound principles, policies and practices for managing
risks, is fundamental to achieving consistent and sustainable long-term performance, while remaining within our risk appetite.
Our risk appetite defines tolerance levels for various risks. This is the foundation for our risk management culture and our risk management framework.
Our risk management framework includes:
� CIBC, SBU and functional group-level risk appetite statements;
� Risk frameworks, policies, procedures and limits to align activities with our risk appetite;
� Regular risk reports to identify and communicate risk levels;
� An independent control framework to identify and test the design and operating effectiveness of our key controls;
� Stress testing to consider the potential impact of changes in the business environment on capital, liquidity and earnings;
� Proactive consideration of risk mitigation options in order to optimize results; and
Oversight through our risk-focused committees and governance structure. �
Managing risk is a shared responsibility at CIBC. Business units and risk management professionals work in collaboration to ensure that business
strategies and activities are consistent with our risk appetite. CIBC’s approach to enterprise-wide risk management aligns with the three lines of defence
model:
(i) As the first line of defence, CIBC’s SBUs and functional groups own the risks and are accountable and responsible for identifying and assessing
risks inherent in their activities in accordance with the CIBC risk appetite. In addition, they establish and maintain controls to mitigate such risks.
The first line of defence may include governance groups within the relevant area to facilitate the control framework and other risk-related processes.
Control groups provide subject matter expertise to the business lines and/or implement and maintain enterprise-wide control programs and
activities. While control groups collaborate with the lines of business in identifying and managing risk, they also challenge risk decisions and risk
mitigation strategies.
(ii) The second line of defence is independent from the first line of defence and provides an enterprise-wide view of specific risk types, guidance and
effective challenge to risk and control activities. Risk Management is the primary second line of defence. Risk Management may leverage or rely
on subject matter expertise of other groups (e.g., third parties or control groups) to better inform their independent assessments, as appropriate.
(iii) As the third line of defence, CIBC’s internal audit function provides reasonable assurance to senior management and the Audit Committee of the
Board of Directors (the Board) on the effectiveness of CIBC’s governance practices, risk management processes, and internal controls as a part
of its risk-based audit plan and in accordance with its mandate as described in the Internal Audit Charter.
A strong risk culture and communication between the three lines of defence are important characteristics of effective risk management.
We continuously monitor our risk profile against our defined risk appetite and related limits, taking action as needed to maintain an appropriate balance
of risk and return. Monitoring our risk profile includes forward-looking analysis of sensitivity to local and global market factors, economic conditions, and
geo-political and regulatory environments that influence our overall risk profile.
Regular and transparent risk reporting and discussion at senior management committees facilitates communication of risks and discussion of risk
management strategies across the organization.
Top and emerging risks We monitor and review top and emerging risks that may affect our future results and take action to mitigate potential risks. We perform in-depth
analyses, which can include stress testing our exposures relative to the risks, and provide updates and related developments to the Board on a regular
basis. Top and emerging risks are those that we consider to have potential negative implications that are material for CIBC. See pages 50 to 53 of our
2020 Annual Report for details regarding the following top and emerging risks:
�
Disintermediation risk
� Anti-money laundering
� U.S. banking regulation
� Technology, information and cyber security risk
� Third party risk
� Climate risk
� Corporate transactions
The remainder of this section describes top and emerging risks that have been updated for developments that have occurred since the issuance of our
2020 Annual Report, as well as regulatory and accounting developments that are material for CIBC.
20 CIBC SECOND QUARTER 2021

Pandemic outbreaks
The COVID-19 pandemic and the restrictions imposed by governments around the world to limit its impact have disrupted the global economy, financial
markets, supply chains and business productivity in unprecedented and unpredictable ways, and have limited economic activity in Canada, the U.S.
and other regions where we operate. While measures to slow the spread of infection, including lockdowns, have negatively impacted economic activity
and our short-term expectations, our medium-term outlook is supported by the assumption that the rollout of mass vaccination programs over the spring
and summer will be able to effectively control the spread of the virus, including the emerging variants.
We are closely monitoring the evolving impacts of the pandemic. COVID-19 has adversely affected our business and uncertainty remains as to the
full impact of COVID-19 on the global economy, financial markets, and our business, results of operations, reputation and financial condition, including
our regulatory capital, liquidity positions and our ability to meet regulatory and other requirements. The ultimate impacts will depend on future
developments that are highly uncertain, such as the scope, severity and duration of the pandemic, including the ongoing fallout from the current wave,
subsequent resurgences of infection including from new variants, actions taken by governments, monetary authorities, regulators, financial institutions
and other third parties in response to subsequent waves, the extent of physical distancing measures, as well as business closures and travel restrictions
mandated by governments. The rollout of vaccines has created positive momentum through the beginning of 2021, although this is likely to be tempered
by growth in the number of cases, especially those seen in other countries, the efficacy of vaccines against emerging variants, and further government
restrictions, such as deeper lockdowns and travel and border restrictions.
A substantial amount of our business involves extending credit or otherwise providing financial resources to individuals, companies, industries or
governments that have likely been adversely impacted by the pandemic, hindering their ability to meet original loan terms and potentially impacting their
ability to repay their loans. While our estimate of ECL on performing loans considers the likelihood and extent of future defaults and impairments, given
the inherent uncertainty caused by COVID-19, actual experience may differ materially from our current estimates. To the extent that business activity
does not increase in line with our expectations due to the impact of the current and subsequent waves, or if unemployment does not decline in line with
our expectations and clients default on loans beyond our current expectations, we may recognize further credit losses beyond those reflected in the
current quarter’s ECLs. The effectiveness of various government support programs in place for individuals and businesses as well as the timing of
completion of the vaccination programs impacts our expectations. Similarly, because of changing economic and market conditions, we may be required
to recognize losses, impairments, or reductions in other comprehensive income (OCI) in future periods relating to other assets that we hold.
Net interest income is significantly impacted by market interest rates. Interest rate cuts by the Bank of Canada and the U.S. Federal Reserve in
response to COVID-19 have negatively impacted our net interest income. The overall effect of lower, or potentially negative, interest rates cannot be
predicted and depends on future actions that the Bank of Canada and the U.S. Federal Reserve may take to increase or reduce targeted rates in
response to COVID-19 or other factors.
We have taken multiple steps to support our clients through these challenging times (see the “CIBC client relief programs in response to COVID-19”
section for further details). Governments, monetary authorities, regulators and financial institutions have also taken actions to support the economy,
increase liquidity, mitigate unemployment, provide temporary financial assistance and regulatory flexibility, and implement other measures intended to
mitigate or counterbalance the adverse economic consequences of the pandemic. We continue to work with regulators and governments across the
jurisdictions in which we operate to support and facilitate government programs assisting our clients. The unprecedented nature, scope and speed of
these actions, while essential to mitigate the economic damage of the crisis, present additional risks for CIBC.
The possibility of widespread illness amongst our clients and team members poses additional business and operational risk. We continue to adapt
our operating model to the resurgence of COVID-19 cases, with a focus on the continued safety of our team members, especially those working on-site.
Remote work arrangements continue to be in place where possible, with our return to office strategy evolving in line with government and public health
authorities’ guidelines.
Overall, our organization has adapted well. Relevant operational risk metrics continue to track at an acceptable level, while uncertainty remains
around the operational impact of the prolonged pandemic. Operational resilience and sustainability remain key areas of focus. We will continue to
monitor our risk posture and trends to ensure operational risks are managed appropriately and in a timely manner.
If the COVID-19 pandemic is prolonged beyond our expectations, or further variants continue to emerge that give rise to similar effects that
vaccines are not able to effectively mitigate in a timely manner, the adverse impact on the economy could deepen and result in further volatility and
declines in financial markets. Moreover, it remains uncertain how the macroeconomic environment, societal and business norms will be impacted
following this pandemic. Unexpected developments in financial markets, regulatory environments, or consumer behaviour and confidence may have
adverse impacts on our business, results of operations, reputation and financial condition, for a substantial period of time.
Commodity prices
Within the past year, we have observed high volatility and historic lows in the price of crude oil driven by excess supply owing to a price war and
constrained global activity impacting demand as the COVID-19 pandemic took hold. In recent months, we have seen a strong recovery in the price of oil,
with West Texas Intermediate now trading above $60 per barrel, reflecting expectations of a return to economic growth as vaccination programs are well
underway, along with a commitment from producers to restrict output. However, future price volatility remains a concern as considerable uncertainty
remains associated with the pandemic recovery and the ongoing cooperation of the Organization of the Petroleum Exporting Countries (OPEC), and
other major producers such as Saudi Arabia and Russia. In addition, we observed disruptions caused by a ransomware attack on the largest U.S. fuel
pipeline, Colonial, causing operations to temporarily shut down as well as Michigan’s order to shut down Enbridge’s Line 5 pipeline; however, no
material impacts to prices have been observed to date. Across the globe, and most notably in the U.S. under the Biden administration, we have seen a
renewed focus of late on green energy policies with significant levels of infrastructure spending proposed to curb carbon emissions along with a
recommitment to the goals of the Paris Agreement. These efforts, if sustained, are likely to have long-term impacts on the oil industry. Clients in our oil
and gas portfolio continue to be assessed on the basis of our enhanced risk metrics that reflect the current environment. Other commodities including
iron ore, lumber, copper and other base metals all reached multi-year highs recently amidst increased demand from Europe and China, vast fiscal
stimulus announcements in the U.S., and increased green investments across the world economy. We continue to closely monitor our overall commodity
exposure in a prudent manner.
CIBC SECOND QUARTER 2021 21

Geo-political risk
The level of geo-political risk escalates at certain points in time. While the specific impact on the global economy and on global credit and capital
markets would depend on the nature of the event, in general, any major event could result in instability and volatility, leading to widening spreads,
declining equity valuations, flight to safe-haven currencies and increased purchases of gold. In the short run, market disruption could hurt the net
income of our trading and non-trading market risk positions. Geo-political risk could reduce economic growth, and in combination with the potential
impacts on commodity prices and the recent rise of protectionism, could have serious negative implications for general economic and banking activities.
Current areas of concern include:
� Global uncertainty and market repercussions pertaining to the spread of COVID-19, including concerns related to the current and subsequent
waves of infection as well as the growing case counts in other countries, the spread of the variants of concern, and the vaccine rollout programs;
� Ongoing U.S. and China relations and trade issues;
� Diplomatic tensions and the trade dispute between Canada and China;
� Implications of the U.S. “Buy American” policy;
� Relations between the U.S. and Iran;
� Escalating tensions in the Middle East;
� Civil unrest associated with the anti-government protests in Hong Kong; and
� Concerns following the agreed-upon Brexit deal.
While it is impossible to predict where new geo-political disruption will occur, we do pay particular attention to markets and regions with existing or
recent historical instability to assess the impact of these environments on the markets and businesses in which we operate.
Canadian consumer debt and the housing market
Regulatory measures that include revised mortgage underwriting guidelines (B-20 guidelines) and taxes on foreign ownership, combined with a previous
low unemployment environment, had their intended effect as debt-to-income ratios flattened in 2018–2019. To counter the economic impact due to
COVID-19, the government put in place several support programs, the Bank of Canada cut interest rates and CIBC assisted clients by offering
temporary relief across all retail products. The housing market continues to appreciate in the midst of continued economic and employment uncertainty.
Currently, we qualify variable rate mortgage borrowers using the Bank of Canada five-year fixed benchmark rate, which is typically higher than the
variable rate by approximately two percentage points and is required as part of the B-20 guidelines. Effective June 1, 2021, OSFI and the Department of
Finance announced that the minimum qualifying rate for uninsured and insured mortgages will be the higher of the mortgage contract rate plus 2%, or
5.25%, effectively replacing the Bank of Canada’s five-year fixed benchmark as the minimum floor. We run our enterprise-wide statistical stress tests at
lower home prices to determine potential direct losses and have also conducted stress tests to assess the impact of rising unemployment rates on
borrowers’ ability to repay loan obligations.
Interbank Offered Rate (IBOR) transition
Interest rate benchmarks including the London Interbank Offered Rate (LIBOR) and other similar benchmarks, are being reformed and replaced by new
risk-free rates that are largely based on traded markets. The U.K.’s Financial Conduct Authority (FCA) originally announced in July 2017 that it would not
compel banks to submit LIBOR rates after December 2021. In March 2021, the FCA and the ICE Benchmark Administrator (IBA) announced the dates
for the cessation or loss of representativeness of various LIBOR rates including that certain non-USD LIBORs will cease on December 31, 2021 and that
most USD LIBOR tenors will cease on June 30, 2023. As IBORs are widely referenced by large volumes of derivative, loan and cash products, the
transition presents a number of risks to CIBC, and the industry as a whole. These transition risks include market risk (in the eventuality that new basis
risks emerge), model risk, operational risk (as processes are changed or newly introduced), legal risk (as contracts are revised) and conduct risk (in
ensuring clients are adequately informed/prepared). CIBC has established a comprehensive enterprise-wide program to manage and coordinate all
aspects of the transition, including the identification and mitigation of these risks. See the “Other regulatory developments” section for further details.
Regulatory developments
See the “Capital management”, “Credit risk”, “Liquidity risk” and “Accounting and control matters” sections for additional information on regulatory
developments.
Accounting developments
See the “Accounting and control matters” section and Note 1 to our interim consolidated financial statements for additional information on accounting
developments.
22 CIBC SECOND QUARTER 2021

Risks arising from business activities The chart below shows our business activities and related risk measures based upon regulatory RWA and allocated common equity as at April 30, 2021:
CIBC
Corporate and Other
SBUs Canadian Personal and Business Banking
Canadian Commercial Banking and Wealth
Management
U.S. Commercial Banking and Wealth Management
Capital Markets
Business activities
� Deposits � Commercial banking � Commercial banking � Credit products � International banking � Residential mortgages � Full-service brokerage � Asset management � Global markets � Investment portfolios � Personal loans � Asset management � Private wealth management � Investment banking � Joint ventures � Credit cards � Private wealth management � Personal and small business
banking � Investment portfolios � Direct financial services
� Functional and support groups (see page 13)� Business lending
� Insurance
Balance sheet
($ millions) ($ millions) ($ millions) ($ millions) ($ millions)Average assets 266,763 Average assets 67,969 Average assets 46,364 Average assets 250,627 Average assets 163,650 Average deposits 185,733 Average deposits 79,839 Average deposits 40,718 Average deposits 85,124 Average deposits 195,196
RWA ($ millions) ($ millions) ($ millions) ($ millions)Credit risk Credit risk Credit risk (1) Credit risk (2) Credit risk (3) 19,439 Market risk
($ millions)50,160
11,568 - Market risk Market risk Market risk Market risk 365
Operational risk Operational risk
51,552 -
6,664 Operational risk
44,260 29
3,541 Operational risk
53,881 7,543 7,933 Operational risk 1,062
Allocated common equity
(%) (%) (%) (%) (%) 17Proportion of total CIBC
76
Proportion of total CIBC Proportion of total CIBC 2418 Proportion of total CIBC 18 Proportion of total CIBC 23
-
6 18
75 -
15 10
51 -
45 4
78 10
1 11
73 2
17 8
Comprising:Credit risk Market risk Operational risk Other (4)
Comprising:Credit risk Market risk Operational risk Other (4)
Comprising:Credit risk Market risk Operational risk Other (4)
Comprising:Credit risk Market risk Operational risk Other (4)
Comprising:Credit risk Market risk Operational risk Other (4)
Risk profile We are exposed to credit, market, liquidity, operational, and other risks, which primarily include strategic, insurance, technology, information and cyber security, reputation and legal, regulatory compliance, and environmental and social risks.
(1) Includes counterparty credit risk of $118 million, which comprises derivatives and repo-style transactions.
(2) Includes counterparty credit risk of $16,381 million, which comprises derivatives and repo-style transactions.
(3) Includes counterparty credit risk of $126 million, which comprises derivatives and repo-style transactions.
(4) Represents allocated common equity relating to capital deductions, such as goodwill and intangible assets, in accordance with the rules in OSFI’s CAR Guideline.
CIBC SECOND QUARTER 2021 23

Credit risk
Credit risk is the risk of financial loss due to a borrower or counterparty failing to meet its obligations in accordance with contractual terms.
Credit risk arises out of the lending businesses in each of our SBUs. Other sources of credit risk consist of our trading activities, which include
our over-the-counter (OTC) derivatives, debt securities, and our repo-style transaction activity. In addition to losses on the default of a borrower or
counterparty, unrealized gains or losses may occur due to changes in the credit spread of the counterparty, which could impact the carrying or fair
value of our assets.
Exposure to credit risk
$ millions, as at
2021 Apr. 30
2020 Oct. 31
Business and government portfolios – advanced internal ratings-based approach (AIRB) Drawn $ 231,091 $ 248,265 Undrawn commitments 64,009 59,379 Repo-style transactions 221,772 202,809 Other off-balance sheet 78,971 75,399 OTC derivatives 17,521 18,850
Gross exposure at default (EAD) on business and government portfolios 613,364 604,702 Less: Collateral held for repo-style transactions 204,935 187,832
Net EAD on business and government portfolios 408,429 416,870
Retail portfolios – AIRB approach Drawn 279,121 265,097 Undrawn commitments 92,093 87,294 Other off-balance sheet 335 306
Gross EAD on retail portfolios 371,549 352,697
Standardized portfolios (1) 79,639 79,350 Securitization exposures – AIRB approach 10,396 12,276
Gross EAD $ 1,074,948 $ 1,049,025
Net EAD $ 870,013 $ 861,193
(1) Includes $69.0 billion relating to business and government loans (October 31, 2020: $69.7 billion), $5.9 billion (October 31, 2020: $6.2 billion) relating to retail portfolios, and $4.8 billion (October 31,
2020: $3.5 billion) relating to securitization exposures. Our business and government loans under the standardized approach consist of $43.3 billion (October 31, 2020: $45.7 billion) to corporates,
$24.1 billion (October 31, 2020: $22.7 billion) to sovereigns, and $1.6 billion (October 31, 2020: $1.3 billion) to banks.
Forbearance policy
We employ forbearance techniques to manage client relationships and to minimize credit losses due to default, foreclosure or repossession. In certain
circumstances, it may be necessary to modify a loan for reasons related to a borrower’s financial difficulties, reducing the potential for default. Total debt
restructurings are subject to our normal quarterly impairment review which considers, amongst other factors, covenants and/or payment delinquencies.
Loan loss provisions are adjusted as appropriate.
In retail lending, forbearance techniques include interest capitalization, amortization amendments and debt consolidations. We have a set of
eligibility criteria which allow our Client Account Management team to determine suitable remediation strategies and propose products based on each
borrower’s situation.
The solutions available to corporate and commercial clients vary based on the individual nature of the client’s situation and are undertaken
selectively where it has been determined that the client has or is likely to have repayment difficulties servicing its obligations. Covenants often reveal
changes in the client’s financial situation before there is a change in payment behaviour and typically allow for a right to reprice or accelerate payments.
Solutions may be temporary in nature or may involve other special management options.
CIBC client relief programs in response to COVID-19
We have been actively engaged in lending activities to support our clients who are experiencing financial hardship caused by the COVID-19 pandemic.
Further details about the client relief programs offered are described on page 62 of our 2020 Annual Report and in Note 6 to the consolidated financial
statements in our 2020 Annual Report. The number of clients under these payment deferral programs has continued to decline considerably relative to
the second and third quarters of 2020. Following the expiry of their payment deferral terms, the majority of these clients have returned to making regular
payments on their loans with a relatively small segment of client accounts written off. As at April 30, 2021, the gross outstanding balance of loans for
which CIBC provided payment deferrals was not significant for retail loans and products in Canada and the Caribbean (October 31, 2020: $3.3 billion)
and $0.5 billion for business and government loans (October 31, 2020: $2.5 billion), including $0.1 billion in Canada and the U.S. (October 31, 2020:
$1.0 billion) and $0.4 billion in the Caribbean (October 31, 2020: $1.5 billion). In addition to the loans that are under payment deferral programs in the
Caribbean, an additional $0.6 billion of loans are expected to be restructured in the near term.
Government lending programs in response to COVID-19
During 2020, CIBC was engaged in a number of Government of Canada lending programs, including the Canada Emergency Business Account (CEBA)
program and the Business Credit Availability Program (BCAP), that were introduced to improve access to credit and financing for Canadian businesses
facing operational cash flow and liquidity challenges during the period of significant uncertainty caused by the COVID-19 pandemic. In addition, the
U.S. federal government introduced government-backed loans and other funding programs for small and medium-sized businesses, including the U.S.
Paycheck Protection Program (PPP) under the Coronavirus Aid, Relief, and Economic Security Act (CARES Act). Further details about the programs are
described on page 62 of our 2020 Annual Report and in Note 2 to the consolidated financial statements in our 2020 Annual Report.
On January 26, 2021, the Government of Canada launched the HASCAP, which is a new loan program that is 100% guaranteed by the BDC and
is available to small and medium-sized businesses that have been hardest hit by the pandemic. Application by eligible businesses commenced on
February 1, 2021. Loans provided by CIBC under the HASCAP will be recognized on our consolidated balance sheet when funded.
As at April 30, 2021, loans of $4.4 billion (October 31, 2020: $2.9 billion) have been provided to our clients under the CEBA, which are accounted
for off-balance sheet. In addition, funded loans outstanding on our interim consolidated balance sheet under the BCAP and HASCAP programs were
$0.2 billion (October 31, 2020: $0.2 billion), while loans outstanding under the PPP in the U.S. were US$1.8 billion (October 31, 2020: US$1.9 billion).
24 CIBC SECOND QUARTER 2021

Real estate secured personal lending
Real estate secured personal lending comprises residential mortgages, and personal loans and lines secured by residential property. This portfolio is
low risk, as we have a first charge on the majority of the properties and a second lien on only a small portion of the portfolio. We use the same lending
criteria in the adjudication of both first lien and second lien loans.
The following table provides details on our residential mortgage and home equity line of credit (HELOC) portfolios:
$ billions, as at April 30, 2021
Residential mortgages (1) HELOC (2) Total
Insured Uninsured Uninsured Insured Uninsured
Ontario (3) $ 27.5 23 % $ 93.0 77 % $ 10.0 100 % $ 27.5 21 % $ 103.0 79 % British Columbia and territories (4) 9.5 21 36.4 79 3.9 100 9.5 19 40.3 81 Alberta 13.3 51 12.8 49 2.2 100 13.3 47 15.0 53 Quebec 5.8 34 11.5 66 1.2 100 5.8 31 12.7 69 Central prairie provinces 3.6 48 3.9 52 0.6 100 3.6 44 4.5 56 Atlantic provinces 3.9 46 4.6 54 0.7 100 3.9 42 5.3 58
Canadian portfolio (5)(6) 63.6 28 162.2 72 18.6 100 63.6 26 180.8 74 U.S. portfolio (5) – – 1.9 100 – – – – 1.9 100 Other international portfolio (5) – – 2.3 100 – – – – 2.3 100
Total portfolio $ 63.6 28 % $ 166.4 72 % $ 18.6 100 % $ 63.6 26 % $ 185.0 74 %
October 31, 2020 $ 67.0 31 % $ 149.0 69 % $ 19.6 100 % $ 67.0 28 % $ 168.6 72 %
(1) Balances reflect principal values.
(2) We did not have any insured HELOCs as at April 30, 2021 and October 31, 2020.
(3) Includes $12.8 billion (October 31, 2020: $13.8 billion) of insured residential mortgages, $59.8 billion (October 31, 2020: $53.4 billion) of uninsured residential mortgages, and $5.8 billion (October 31,
2020: $6.1 billion) of HELOCs in the Greater Toronto Area (GTA).
(4) Includes $4.2 billion (October 31, 2020: $4.5 billion) of insured residential mortgages, $25.2 billion (October 31, 2020: $22.9 billion) of uninsured residential mortgages, and $2.4 billion (October 31,
2020: $2.5 billion) of HELOCs in the Greater Vancouver Area (GVA).
(5) Geographic location is based on the address of the property.
(6) 67% (October 31, 2020: 71%) of insurance on Canadian residential mortgages is provided by Canada Mortgage and Housing Corporation (CMHC) and the remaining by two private Canadian
insurers, both rated at least AA (low) by DBRS Limited (DBRS).
The average loan-to-value (LTV) ratios(1) for our uninsured residential mortgages and HELOCs originated and acquired during the quarter and six
months ended April 30, 2021 are provided in the following table.
For the three
months ended
For the six
months ended
2021
Apr. 30
2021
Jan. 31
2020
Apr. 30
2021
Apr. 30
2020
Apr. 30
Residential
mortgages HELOC
Residential
mortgages HELOC
Residential
mortgages HELOC
Residential
mortgages HELOC
Residential
mortgages HELOC
Ontario (2) 63 % 68 % 63 % 68 % 64 % 67 % 63 % 68 % 63 % 67 %
British Columbia and territories (3) 60 66 59 66 60 64 60 66 60 64
Alberta 68 74 66 73 69 73 67 73 69 72
Quebec 68 73 68 74 68 73 68 73 68 72
Central prairie provinces 68 75 68 75 69 74 68 75 69 74
Atlantic provinces 70 75 68 75 72 75 69 75 72 74
Canadian portfolio (4) 63 % 69 % 63 % 69 % 64 % 68 % 63 % 69 % 64 % 68 %
U.S. portfolio (4) 64 % 71 % 63 % 63 % 67 % 68 % 62 % 67 % 66 % 65 %
Other international portfolio (4) 76 % n/m 76 % n/m 73 % n/m 76 % n/m 71 % n/m
(1) LTV ratios for newly originated residential mortgages and HELOCs are calculated based on weighted average.
(2) Average LTV ratios for our uninsured GTA residential mortgages originated during the quarter were 63% (January 31, 2021: 63%; April 30, 2020: 62%) and 63% for the six months ended April 30,
2021 (April 30, 2020: 61%).
(3) Average LTV ratios for our uninsured GVA residential mortgages originated during the quarter were 58% (January 31, 2021: 57%; April 30, 2020: 58%) and 58% for the six months ended April 30,
2021 (April 30, 2020: 57%).
(4) Geographic location is based on the address of the property.
n/m Not meaningful.
The following table provides the average LTV ratios on our total Canadian residential mortgage portfolio:
Insured Uninsured
April 30, 2021 (1)(2) 54 % 51 %
October 31, 2020 (1)(2) 55 % 52 %
(1) LTV ratios for residential mortgages are calculated based on weighted average. The house price estimates for April 30, 2021 and October 31, 2020 are based on the Forward Sortation Area level
indices from the Teranet – National Bank National Composite House Price Index (Teranet) as of March 31, 2021 and September 30, 2020, respectively. Teranet is an independent estimate of the rate
of change in Canadian home prices.
(2) Average LTV ratio on our uninsured GTA residential mortgage portfolio was 49% (October 31, 2020: 48%). Average LTV ratio on our uninsured GVA residential mortgage portfolio was 47%
(October 31, 2020: 46%).
CIBC SECOND QUARTER 2021 25

The tables below summarize the remaining amortization profile of our total Canadian, U.S. and other international residential mortgages. The first table
provides the remaining amortization periods based on the minimum contractual payment amounts. The second table provides the remaining
amortization periods based upon current customer payment amounts, which incorporate payments other than the minimum contractual amount and/or a
different frequency of payments.
Contractual payment basis 0–5
years >5–10 years
>10–15 years
>15–20 years
>20–25 years
>25–30 years
>30–35 years
>35 years
Canadian portfolio April 30, 2021 – % – % 2 % 7 % 56 % 35 % – % – % October 31, 2020 – % 1 % 2 % 7 % 54 % 36 % – % – %
U.S. portfolio April 30, 2021 – % 1 % 1 % 1 % 9 % 88 % – % – % October 31, 2020 – % 1 % 1 % 1 % 8 % 89 % – % – %
Other international portfolio April 30, 2021 14 % 15 % 23 % 23 % 18 % 8 % – % – % October 31, 2020 11 % 15 % 23 % 23 % 18 % 10 % – % – %
Current customer payment basis 0–5
years >5–10 years
>10–15 years
>15–20 years
>20–25 years
>25–30 years
>30–35 years
>35 years
Canadian portfolio April 30, 2021 1 % 4 % 7 % 18 % 44 % 26 % – % – % October 31, 2020 2 % 4 % 7 % 18 % 44 % 25 % – % – %
U.S. portfolio April 30, 2021 1 % 3 % 7 % 10 % 9 % 70 % – % – % October 31, 2020 2 % 3 % 7 % 10 % 10 % 68 % – % – %
Other international portfolio April 30, 2021 7 % 13 % 22 % 23 % 19 % 15 % 2 % – % October 31, 2020 7 % 13 % 22 % 23 % 19 % 14 % 2 % – %
We have two types of condominium exposures in Canada: mortgages and developer loans. Both are primarily concentrated in the Toronto and
Vancouver areas. As at April 30, 2021, our Canadian condominium mortgages were $31.4 billion (October 31, 2020: $28.1 billion) of which 28%
(October 31, 2020: 31%) were insured. Our drawn developer loans were $1.4 billion (October 31, 2020: $1.4 billion) or 1.0% (October 31, 2020: 1.0%) of
our business and government portfolio, and our related undrawn exposure was $4.5 billion (October 31, 2020: $4.5 billion). The condominium developer
exposure is diversified across 104 projects.
We stress test our mortgage and HELOC portfolio to determine the potential impact of different economic events. Our stress tests can use variables such
as unemployment rates, debt service ratios and housing price changes, to model potential outcomes for a given set of circumstances. The stress testing
involves variables that could behave differently in certain situations. Our main tests use economic variables in a similar range or more conservative to
historical events when Canada experienced economic downturns. Our results show that in an economic downturn, our strong capital position should be
sufficient to absorb mortgage and HELOC losses.
On May 20, 2021, OSFI and the Department of Finance announced that effective June 1, 2021, the minimum qualifying rate for uninsured and insured
mortgages will be the higher of the mortgage contract rate plus 2%, or 5.25%, as a minimum floor. The 5.25% replaces the Bank of Canada’s five-year
benchmark posted mortgage rate that is currently applied, and OSFI as well as the Department of Finance will revisit it at least annually to ensure it
remains appropriate for risks in the environment.
Trading credit exposure
We have trading credit exposure (also called counterparty credit exposure) that arises from our OTC derivatives and our repo-style transactions. The
nature of our derivatives exposure and how it is mitigated is described in Note 13 to the consolidated financial statements included in our 2020 Annual
Report. Our repo-style transactions consist of our securities bought or sold under repurchase agreements, and our securities borrowing and lending
activity.
The following table shows the rating profile of OTC derivative mark-to-market (MTM) receivables:
$ billions, as at
2021 Apr. 30
2020 Oct. 31 (1)
Exposure (2)
Investment grade $ 8.67 77.0 % $ 7.45 74.8 % Non-investment grade 2.48 22.0 2.40 24.1 Watch list 0.10 0.9 0.10 1.0 Default 0.01 0.1 0.01 0.1
$ 11.26 100.0 % $ 9.96 100.0 %
(1) Restated from amounts previously presented.
(2) MTM of OTC derivative contracts is after the impact of master netting agreements, but before any collateral.
26 CIBC SECOND QUARTER 2021

Impaired loans
The following table provides details of our impaired loans and allowance for credit losses:
$ millions
As at or for the three months ended
As at or for the six months ended
2021 Apr. 30
2021 Jan. 31
2020 Apr. 30
2021 Apr. 30
2020 Apr. 30
Business and government
loans Consumer
loans Total
Business and government
loans Consumer
loans Total
Business and government
loans Consumer
loans Total
Business and government
loans Consumer
loans Total
Business and government
loans Consumer
loans Total
Gross impaired loans Balance at beginning of period $ 1,476 $ 979 $ 2,455 $ 1,359 $ 990 $ 2,349 $ 907 $ 995 $ 1,902 $ 1,359 $ 990 $ 2,349 $ 911 $ 955 $ 1,866
Classified as impaired during the period 192 534 726 407 433 840 316 558 874 599 967 1,566 460 1,083 1,543
Transferred to performing during the period (33) (152) (185) (68) (201) (269) (10) (94) (104) (101) (353) (454) (20) (199) (219)
Net repayments (118) (159) (277) (126) (84) (210) (79) (155) (234) (244) (243) (487) (179) (307) (486) Amounts written off (66) (250) (316) (70) (150) (220) (16) (228) (244) (136) (400) (536) (56) (457) (513) Recoveries of loans and advances
previously written off – – – – – – – – – – – – – – – Disposals of loans (31) – (31) – – – – – – (31) – (31) – – – Purchased credit-impaired loans – – – – – – – – – – – – – – – Foreign exchange and other (29) (9) (38) (26) (9) (35) 26 12 38 (55) (18) (73) 28 13 41
Balance at end of period $ 1,391 $ 943 $ 2,334 $ 1,476 $ 979 $ 2,455 $ 1,144 $ 1,088 $ 2,232 $ 1,391 $ 943 $ 2,334 $ 1,144 $ 1,088 $ 2,232
Allowance for credit losses – impaired loans
Balance at beginning of period $ 686 $ 266 $ 952 $ 650 $ 264 $ 914 $ 391 $ 267 $ 658 $ 650 $ 264 $ 914 $ 376 $ 268 $ 644 Amounts written off (1) (66) (250) (316) (70) (150) (220) (16) (228) (244) (136) (400) (536) (56) (457) (513) Recoveries of amounts written off in
previous periods 5 50 55 3 45 48 3 42 45 8 95 103 6 91 97 Charge to income statement (2) 15 231 246 121 117 238 134 209 343 136 348 484 192 395 587 Interest accrued on impaired loans (5) (6) (11) (6) (5) (11) (3) (6) (9) (11) (11) (22) (8) (12) (20) Foreign exchange and other (15) (5) (20) (12) (5) (17) 10 4 14 (27) (10) (37) 9 3 12
Balance at end of period $ 620 $ 286 $ 906 $ 686 $ 266 $ 952 $ 519 $ 288 $ 807 $ 620 $ 286 $ 906 $ 519 $ 288 $ 807
Net impaired loans (3)
Balance at beginning of period $ 790 $ 713 $ 1,503 $ 709 $ 726 $ 1,435 $ 516 $ 728 $ 1,244 $ 709 $ 726 $ 1,435 $ 535 $ 687 $ 1,222 Net change in gross impaired (85) (36) (121) 117 (11) 106 237 93 330 32 (47) (15) 233 133 366 Net change in allowance 66 (20) 46 (36) (2) (38) (128) (21) (149) 30 (22) 8 (143) (20) (163)
Balance at end of period $ 771 $ 657 $ 1,428 $ 790 $ 713 $ 1,503 $ 625 $ 800 $ 1,425 $ 771 $ 657 $ 1,428 $ 625 $ 800 $ 1,425
Net impaired loans as a percentage of net loans and acceptances 0.33 % 0.36 % 0.34 % 0.33 % 0.34 %
(1) Includes the amount of allowance for credit losses on impaired loans that is written off on disposals of loans.
(2) Excludes provision for credit losses on impaired undrawn credit facilities and other off-balance sheet exposures.
(3) Net impaired loans are gross impaired loans net of stage 3 allowance for credit losses.
Gross impaired loans As at April 30, 2021, gross impaired loans were $2,334 million, up $102 million from the same quarter last year, primarily due to increases in the real
estate and construction, and utilities sectors, partially offset by a decrease in the Canadian residential mortgages portfolio and the impact of foreign
exchange translation.
Gross impaired loans were down $121 million from the prior quarter, primarily due to decreases in the real estate and construction, and oil and gas
sectors, the impact of foreign exchange translation, residential mortgages portfolio, and retail and wholesale sector, partially offset by increases in the
financial institutions and utilities sectors.
58% of gross impaired loans related to Canada, of which the residential mortgages and personal lending portfolios, retail and wholesale, and
utilities sectors accounted for the majority.
28% of gross impaired loans related to the U.S., of which the real estate and construction, oil and gas, and financial institutions sectors accounted
for the majority.
The remaining gross impaired loans related to CIBC FirstCaribbean, of which the residential mortgages and personal lending portfolios, and the
real estate and construction sector accounted for the majority.
Allowance for credit losses – impaired loans Allowance for credit losses on impaired loans was $906 million, up $99 million from the same quarter last year, primarily due to increases in the utilities,
real estate and construction, and retail and wholesale sectors, partially offset by a decrease driven by foreign exchange translation.
Allowance for credit losses on impaired loans was down $46 million from the prior quarter, primarily due to decreases in the oil and gas, and real estate
and construction sectors, and the impact of foreign exchange translation, partially offset by an increase in the Canadian residential mortgages portfolio.
Loans contractually past due but not impaired
This comprises loans where repayment of principal or payment of interest is contractually in arrears. The following table provides an aging analysis of
the contractually past due loans. Most risk rated business and government loans that were contractually past due at the time relief was provided
pursuant to payment deferral programs were presented in the aging category that applied at the time deferrals were granted during the period of the
deferral. Other business and government loans, credit cards, personal loans and residential mortgages that were subject to a payment deferral program
were generally presented in the aging category that applied as at March 31, 2020 during the period of the deferral, which approximated the time when
the majority of the deferrals were granted. Loans that have exited a deferral program generally continue to age based on the status that was applied at
the beginning of the program to the extent a payment has not been made.
$ millions, as at
2021 Apr. 30
2020 Oct. 31 (1)
31 to 90 days
Over 90 days Total Total
Residential mortgages $ 672 $ – $ 672 $ 1,152 Personal 159 – 159 222 Credit card 125 78 203 321 Business and government 301 – 301 281
$ 1,257 $ 78 $ 1,335 $ 1,976
(1) Excludes loans past due less than 30 days as such loans are not generally indicative of the borrowers’ ability to repay.
CIBC SECOND QUARTER 2021 27

Exposure to certain countries and regions
Europe The following table provides our exposure to European countries, both within and outside the Eurozone.
Our direct exposures presented in the tables below comprise (A) funded – on-balance sheet loans (stated at amortized cost net of stage 3
allowance for credit losses, if any), deposits with banks (stated at amortized cost net of stage 3 allowance for credit losses, if any) and securities (stated
at carrying value); (B) unfunded – unutilized credit commitments, letters of credit, and guarantees (stated at notional amount net of stage 3 allowance for
credit losses, if any); and (C) derivative MTM receivables (stated at fair value) and repo-style transactions (stated at fair value).
Of our total direct exposures to Europe, approximately 39% (January 31, 2021: 43%) is to entities in countries with Aaa/AAA ratings from at least
one of Moody’s Investors Service, Inc. (Moody’s) or Standard & Poor’s (S&P).
The following table provides a summary of our positions in this business:
Direct exposures
$ millions, as at April 30, 2021
Funded Unfunded
Derivative MTM receivables
and repo-style transactions (1)
Corporate Sovereign Banks
Total
funded
(A) Corporate Banks
Total
unfunded
(B) Corporate Sovereign Banks
Net
exposure
(C)
Total direct
exposure
(A)+(B)+(C)
Austria $ – $ 529 $ 57 $ 586 $ – $ 4 $ 4 $ – $ – $ – $ – $ 590
Finland 51 1 406 458 119 6 125 – – – – 583
France 19 42 80 141 357 52 409 – 3 38 41 591
Germany 451 1,267 228 1,946 180 106 286 48 – 36 84 2,316
Greece – – – – – – – – – – – –
Ireland 226 – 101 327 42 – 42 10 – 230 240 609
Luxembourg 135 – 2,266 2,401 86 45 131 3 26 40 69 2,601
Netherlands 297 485 186 968 400 241 641 32 – 3 35 1,644
Norway 205 332 89 626 596 – 596 – 3 – 3 1,225
Spain 93 – 8 101 8 27 35 – – – – 136
Sweden 383 900 145 1,428 160 – 160 18 – 4 22 1,610
Switzerland 99 – 9 108 162 – 162 4 – 94 98 368
United Kingdom 2,637 1,881 1,545 6,063 3,163 310 3,473 508 9 620 1,137 10,673
Other European countries 62 63 62 187 12 92 104 1,995 – 6 2,001 2,292
Total Europe $ 4,658 $ 5,500 $ 5,182 $ 15,340 $ 5,285 $ 883 $ 6,168 $ 2,618 $ 41 $ 1,071 $ 3,730 $ 25,238
October 31, 2020 $ 4,275 $ 3,598 $ 5,157 $ 13,030 $ 5,063 $ 968 $ 6,031 $ 788 $ 92 $ 835 $ 1,715 $ 20,776
(1) The amounts shown are net of CVA and collateral. Collateral on derivative MTM receivables was $1.6 billion (October 31, 2020: $1.8 billion), collateral on repo-style transactions was $33.3 billion
(October 31, 2020: $30.3 billion), and both comprise cash and investment grade debt securities.
We have $2,024 million (January 31, 2021: $1,953 million) of indirect exposure to European entities, as we hold debt or equity securities issued by
European entities as collateral for our derivatives transactions and securities borrowing and lending activity from counterparties that are not in Europe.
28 CIBC SECOND QUARTER 2021

Market risk
Market risk is the risk of economic or financial loss in our trading and non-trading portfolios from adverse changes in underlying market factors, including
interest rates, foreign exchange rates, equity market prices, commodity prices, credit spreads, and customer behaviour for retail products. Market risk
arises in CIBC’s trading and treasury activities, and encompasses all market-related positioning and market-making activity.
The trading book consists of positions in financial instruments and commodities held to meet the near-term needs of our clients.
The non-trading book consists of positions in various currencies that are related to asset/liability management and investment activities.
Risk measurement
The following table provides balances on the interim consolidated balance sheet that are subject to market risk. Certain differences between accounting
and risk classifications are detailed in the footnotes below:
$ millions, as at
2021
Apr. 30
2020
Oct. 31
Subject to market risk (1) Subject to market risk (1)
Consolidated
balance
sheet Trading
Non-
trading
Not
subject to
market risk
Consolidated
balance
sheet Trading
Non-
trading
Not
subject to
market risk
Non-traded risk
primary risk
sensitivity
Cash and non-interest-bearing
deposits with banks $ 26,924 $ – $ 2,660 $ 24,264 $ 43,531 $ – $ 2,445 $ 41,086 Foreign exchange
Interest-bearing deposits with banks 20,273 134 20,139 – 18,987 75 18,912 – Interest rate
Securities 155,122 55,822 99,300 – 149,046 45,825 103,221 – Interest rate, equity
Cash collateral on securities borrowed 11,573 – 11,573 – 8,547 – 8,547 – Interest rate
Securities purchased under resale
agreements 63,106 – 63,106 – 65,595 – 65,595 – Interest rate
Loans
Residential mortgages 234,747 – 234,747 – 221,165 – 221,165 – Interest rate
Personal 42,371 – 42,371 – 42,222 – 42,222 – Interest rate
Credit card 10,633 – 10,633 – 11,389 – 11,389 – Interest rate
Business and government 136,567 22,086 (2) 114,481 – 135,546 22,643 (2) 112,903 – Interest rate
Allowance for credit losses (3,200) – (3,200) – (3,540) – (3,540) – Interest rate
Derivative instruments 35,313 33,214 2,099 – 32,730 31,244 1,486 – Interest rate,
foreign exchange
Customers’ liability under
acceptances 11,002 – 11,002 – 9,606 – 9,606 – Interest rate
Other assets 38,447 4,056 24,225 10,166 34,727 3,364 20,613 10,750 Interest rate, equity,
foreign exchange
$ 782,878 $ 115,312 $ 633,136 $ 34,430 $ 769,551 $ 103,151 $ 614,564 $ 51,836
Deposits $ 576,563 $ 567 (3) $ 508,396 $ 67,600 $ 570,740 $ 484 (3) $ 510,788 $ 59,468 Interest rate
Obligations related to securities
sold short 20,269 18,803 1,466 – 15,963 13,795 2,168 – Interest rate
Cash collateral on securities lent 3,205 – 3,205 – 1,824 – 1,824 – Interest rate
Obligations related to securities sold
under repurchase agreements 66,120 – 66,120 – 71,653 – 71,653 – Interest rate
Derivative instruments 34,121 32,819 1,302 – 30,508 29,436 1,072 – Interest rate,
foreign exchange
Acceptances 11,071 – 11,071 – 9,649 – 9,649 – Interest rate
Other liabilities 23,196 1,947 11,851 9,398 22,167 2,386 10,926 8,855 Interest rate
Subordinated indebtedness 5,653 – 5,653 – 5,712 – 5,712 – Interest rate
$ 740,198 $ 54,136 $ 609,064 $ 76,998 $ 728,216 $ 46,101 $ 613,792 $ 68,323
(1) FVA are excluded from trading activities for regulatory capital purposes, with related derivative hedges to these FVA also excluded.
(2) Excludes $241 million (October 31, 2020: $291 million) of loans that are warehoused for future securitization purposes. These are considered non-trading for market risk purposes.
(3) Comprises FVO deposits which are considered trading for market risk purposes.
CIBC SECOND QUARTER 2021 29

Trading activities
We hold positions in traded financial contracts to meet client investment and risk management needs. Trading revenue (net interest income or
non-interest income) is generated from these transactions. Trading instruments are recorded at fair value and include debt and equity securities, as well
as interest rate, foreign exchange, equity, commodity, and credit derivative products.
Value-at-risk Our value-at-risk (VaR) methodology is a statistical technique that measures the potential overnight loss at a 99% confidence level. We use a full
revaluation historical simulation methodology to compute VaR, stressed VaR and other risk measures.
The following three tables show VaR, stressed VaR and incremental risk charge (IRC) for our trading activities based on risk type under an internal
models approach.
Average total VaR for the three months ended April 30, 2021 was down $1.0 million from the prior quarter, driven primarily by an increase in
diversification benefit and a decrease in foreign exchange risk, partially offset by an increase in interest rate and credit spread risks.
Average stressed total VaR for the three months ended April 30, 2021 was down $0.9 million from the prior quarter, driven by a decrease in foreign
exchange risk. For the periods presented, our Stressed VaR windows were in the 2008-2009 Global Financial Crisis period. This historical period
exhibited not only increased volatility in interest rates but also increased volatility in equity prices, combined with a reduction in the level of interest rates,
and an increase in credit spreads.
Average IRC for the three months ended April 30, 2021 was up $27.0 million from the prior quarter, partially due to an increase in inventory of
corporate bonds.
VaR by risk type – trading portfolio
$ millions
As at or for the three
months ended
As at or for the six
months ended
2021
Apr. 30
2021
Jan. 31
2020
Apr. 30
2021
Apr. 30
2020
Apr. 30
High Low As at Average As at Average As at Average Average Average
Interest rate risk $ 12.0 $ 4.1 $ 10.3 $ 7.5 $ 5.2 $ 6.6 $ 7.4 $ 5.3 $ 7.1 $ 5.9 Credit spread risk 11.8 6.1 9.4 8.9 8.8 8.0 8.7 6.4 8.5 4.1 Equity risk 5.3 3.0 3.3 3.7 3.7 3.4 4.7 5.0 3.5 3.7 Foreign exchange risk 1.7 0.7 1.1 1.2 1.4 1.7 1.7 1.4 1.4 2.0 Commodity risk 5.2 1.1 1.1 3.1 3.2 3.1 7.9 2.6 3.1 2.8 Debt specific risk 5.7 2.1 3.5 3.5 4.1 3.2 2.5 2.2 3.3 2.1 Diversification effect (1) n/m n/m (21.5) (21.1) (19.4) (18.2) (19.8) (11.0) (19.6) (11.7)
Total VaR (one-day measure) $ 10.0 $ 4.6 $ 7.2 $ 6.8 $ 7.0 $ 7.8 $ 13.1 $ 11.9 $ 7.3 $ 8.9
(1) Total VaR is less than the sum of the VaR of the different market risk types due to risk offsets resulting from a portfolio diversification effect.
n/m Not meaningful. It is not meaningful to compute a diversification effect because the high and low may occur on different days for different risk types.
Stressed VaR by risk type – trading portfolio
$ millions
As at or for the three
months ended
As at or for the six
months ended
2021
Apr. 30
2021
Jan. 31
2020
Apr. 30
2021
Apr. 30
2020
Apr. 30
High Low As at Average As at Average As at Average Average Average
Interest rate risk $ 39.8 $ 13.6 $ 31.3 $ 23.7 $ 25.7 $ 24.4 $ 18.2 $ 17.7 $ 24.0 $ 22.7 Credit spread risk 12.1 5.7 6.8 8.9 10.2 9.8 9.2 10.1 9.3 10.1 Equity risk 14.8 2.5 6.4 8.1 13.6 8.9 3.7 7.2 8.5 4.7 Foreign exchange risk 12.1 0.2 2.1 2.4 15.7 10.7 11.8 6.7 6.5 8.9 Commodity risk 11.1 1.5 2.6 3.1 2.0 2.3 3.6 4.4 2.7 5.4 Debt specific risk 6.8 4.1 5.5 5.2 6.3 5.8 4.6 5.4 5.5 5.2 Diversification effect (1) n/m n/m (27.5) (25.2) (43.5) (34.8) (28.8) (29.8) (29.9) (36.7)
Stressed total VaR (one-day measure) $ 40.0 $ 17.6 $ 27.2 $ 26.2 $ 30.0 $ 27.1 $ 22.3 $ 21.7 $ 26.6 $ 20.3
(1) Stressed total VaR is less than the sum of the VaR of the different market risk types due to risk offsets resulting from a portfolio diversification effect.
n/m Not meaningful. It is not meaningful to compute a diversification effect because the high and low may occur on different days for different risk types.
Incremental risk charge – trading portfolio
$ millions
As at or for the three
months ended
As at or for the six
months ended
2021
Apr. 30
2021
Jan. 31
2020
Apr. 30
2021
Apr. 30
2020
Apr. 30
High Low As at Average As at Average As at Average Average Average
Default risk $ 208.8 $ 113.5 $ 152.3 $ 144.2 $ 130.5 $ 113.1 $ 128.9 $ 146.9 $ 128.9 $ 152.2 Migration risk 74.9 43.5 67.5 55.0 50.5 59.1 79.7 82.3 57.0 76.3
IRC (one-year measure) (1) $ 266.4 $ 164.3 $ 219.8 $ 199.2 $ 181.0 $ 172.2 $ 208.6 $ 229.2 $ 185.9 $ 228.5
(1) High and low IRC are not equal to the sum of the constituent parts, because the highs and lows of the constituent parts may occur on different days.
30 CIBC SECOND QUARTER 2021

Trading revenue Trading revenue (TEB) comprises both trading net interest income and non-interest income and excludes underwriting fees and commissions. Trading
revenue (TEB) in the chart below excludes certain exited portfolios.
The trading revenue (TEB) versus VaR graph below shows the current quarter and the three previous quarters’ daily trading revenue (TEB) against
the close of business day VaR measures.
During the quarter, trading revenue (TEB) was positive for 100% of the days. The largest gain of $14.2 million occurred on March 4, 2021, and it
was attributed to normal course activity within the global markets line of business. Average daily trading revenue (TEB) was $7.1 million during the
quarter, and the average daily TEB was $0.8 million.
Trading revenue (TEB)(1) versus VaR(2)
$ millions
(20)
(15)
(10)
(5)
0
5
10
15
20
25
30
35
Trading Revenue (TEB) VaR
May-20 Jun-20 Jul-20 Aug-20 Sep-20 Oct-20 Nov-20 Dec-20 Jan-21 Feb-21 Mar-21 Apr-21
(1) Excludes certain month-end transfer pricing and other miscellaneous adjustments.
(2) FVA are excluded from trading activities for regulatory capital purposes, with related derivative hedges to these FVA also excluded.
Non-trading activities Structural interest rate risk (SIRR) SIRR primarily consists of the risk arising due to mismatches in assets and liabilities, which do not arise from trading and trading-related businesses. The
objective of SIRR management is to lock in product margins and deliver stable and predictable net interest income over time, while managing the risk to
the economic value of our assets arising from changes in interest rates.
SIRR results from differences in the maturities or repricing dates of assets and liabilities, both on- and off-balance sheet, as well as from embedded
optionality in retail products, and other product features that could affect the expected timing of cash flows, such as options to pre-pay loans or redeem
term deposits prior to contractual maturity. A number of assumptions affecting cash flows, product re-pricing and the administration of rates underlie the
models used to measure SIRR. The key assumptions pertain to the expected funding profile of mortgage rate commitments, fixed rate loan prepayment
behaviour, term deposit redemption behaviour, the treatment of non-maturity deposits and equity. All assumptions are derived empirically based on
historical client behaviour, balance sheet composition and product pricing with the consideration of possible forward-looking changes. All models and
assumptions used to measure SIRR are subject to independent oversight by Risk Management. A variety of cash instruments and derivatives, primarily
interest rate swaps, are used to manage these risks.
The following table shows the potential before-tax impact of an immediate and sustained 100 basis points increase and 25 basis points decrease in
interest rates on projected 12-month net interest income and economic value of equity for our structural balance sheet, assuming no subsequent
hedging. While an immediate and sustained shock of 100 basis points is typically applied, and notwithstanding the possibility of negative rates, due to
the low interest rate environment in both Canada and the U.S. at the end of the quarter, an immediate downward shock of 25 basis points was applied
while maintaining a floor on market and client interest rates at zero.
Structural interest rate sensitivity – measures
$ millions (pre-tax), as at
2021
Apr. 30
2021
Jan. 31
2020
Apr. 30
CAD (1) USD CAD (1) USD CAD (1) USD
100 basis point increase in interest rates
Increase (decrease) in net interest income $ 362 $ 77 $ 384 $ 42 $ 296 $ 47
Increase (decrease) in present value of shareholders’ equity (608) (288) (564) (365) (579) (257)
25 basis point decrease in interest rates
Increase (decrease) in net interest income (148) (50) (122) (66) (92) (70)
Increase (decrease) in present value of shareholders’ equity 83 27 77 40 107 (12)
(1) Includes CAD and other currency exposures.
CIBC SECOND QUARTER 2021 31

Liquidity risk
Liquidity risk is the risk of having insufficient cash or its equivalent in a timely and cost-effective manner to meet financial obligations as they come due.
Common sources of liquidity risk inherent in banking services include unanticipated withdrawals of deposits, the inability to replace maturing debt, credit
and liquidity commitments, and additional pledging or other collateral requirements.
CIBC’s approach to liquidity risk management supports our business strategy, aligns with our risk appetite and adheres to regulatory expectations.
Our management strategies, objectives and practices are regularly reviewed to align with changes to the liquidity environment, including
regulatory, business and/or market developments. Liquidity risk remains within CIBC’s risk appetite.
Governance and management
We manage liquidity risk in a manner that enables us to withstand a liquidity stress event without an adverse impact on the viability of our operations.
Actual and anticipated cash flows generated from on- and off-balance sheet exposures are routinely measured and monitored to ensure compliance
with established limits. CIBC incorporates stress testing into its management and measurement of liquidity risk. Stress test results assist with the
development of our liquidity assumptions, identification of potential constraints to funding planning, and contribute to the design of CIBC’s contingency
funding plan.
The Global Asset Liability Committee (GALCO) governs CIBC’s liquidity risk management, ensuring the liquidity risk management methodologies,
assumptions, and key metrics such as the Liquidity Horizon, are regularly reviewed and consider CIBC’s business activities. The Liquidity Risk
Management Committee, a subcommittee of GALCO, is responsible for ensuring that CIBC’s liquidity risk profile is comprehensively measured and
managed in alignment with CIBC’s strategic direction, risk appetite and regulatory requirements.
The Risk Management Committee (RMC) approves CIBC’s liquidity risk management policy and recommends liquidity risk tolerance to the Board
through the risk appetite statement.
Liquid assets
Available liquid assets include unencumbered cash and marketable securities from on- and off-balance sheet sources that can be used to access
funding in a timely fashion. Encumbered liquid assets, composed of assets pledged as collateral and those assets that are deemed restricted due to
legal, operational, or other purposes, are not considered as sources of available liquidity when measuring liquidity risk.
Encumbered and unencumbered liquid assets from on- and off-balance sheet sources are summarized as follows:
$ millions, as at
Bank owned
liquid assets
Securities received
as collateral
Total liquid
assets
Encumbered
liquid assets
Unencumbered
liquid assets (1)
2021
Apr. 30
Cash and deposits with banks $ 47,197 $ – $ 47,197 $ 283 $ 46,914
Securities issued or guaranteed by sovereigns, central
banks, and multilateral development banks 109,774 99,748 209,522 126,679 82,843
Other debt securities 4,779 3,969 8,748 2,401 6,347
Equities 36,398 20,191 56,589 23,667 32,922
Canadian government guaranteed National Housing Act
mortgage-backed securities 37,459 317 37,776 13,577 24,199
Other liquid assets (2) 14,409 3,164 17,573 8,013 9,560
$ 250,016 $ 127,389 $ 377,405 $ 174,620 $ 202,785
2020
Oct. 31
Cash and deposits with banks $ 62,518 $ – $ 62,518 $ 133 $ 62,385
Securities issued or guaranteed by sovereigns, central
banks, and multilateral development banks 112,403 92,202 204,605 108,425 96,180
Other debt securities 4,798 4,288 9,086 2,603 6,483
Equities 27,169 15,924 43,093 21,449 21,644
Canadian government guaranteed National Housing Act
mortgage-backed securities 40,592 895 41,487 13,084 28,403
Other liquid assets (2) 10,909 2,109 13,018 5,441 7,577
$ 258,389 $ 115,418 $ 373,807 $ 151,135 $ 222,672
(1) Unencumbered liquid assets are defined as on-balance sheet assets, assets borrowed or purchased under resale agreements, and other off-balance sheet collateral received less encumbered liquid
assets.
(2) Includes cash pledged as collateral for derivatives transactions, select asset-backed securities and precious metals.
The following table summarizes unencumbered liquid assets held by CIBC (parent) and its domestic and foreign subsidiaries:
$ millions, as at
2021 Apr. 30
2020 Oct. 31
CIBC (parent) $ 145,170 $ 170,936 Domestic subsidiaries 14,324 12,355 Foreign subsidiaries 43,291 39,381
$ 202,785 $ 222,672
Asset haircuts and monetization depth assumptions under a liquidity stress scenario are applied to determine asset liquidity value. Haircuts take into
consideration those margins applicable at central banks – such as the Bank of Canada and the U.S. Federal Reserve Bank – historical observations, and
securities characteristics including asset type, issuer, credit ratings, currency and remaining term to maturity, as well as available regulatory guidance.
Our unencumbered liquid assets decreased by $19.9 billion since October 31, 2020, as a result of forecasted funding repayments from available
cash positions.
Furthermore, CIBC maintains access eligibility to the Bank of Canada’s Emergency Lending Assistance program and the U.S. Federal Reserve
Bank’s Discount Window.
32 CIBC SECOND QUARTER 2021

Asset encumbrance
In the course of CIBC’s day-to-day operations, securities and other assets are pledged to secure obligations, participate in clearing and settlement
systems and other collateral management purposes.
The following table provides a summary of our on- and off-balance sheet encumbered and unencumbered assets:
$ millions, as at
Encumbered Unencumbered Total assets
Pledged as collateral Other (1)
Available as collateral Other (2)
2021 Apr. 30
Cash and deposits with banks $ – $ 283 $ 46,914 $ – $ 47,197 Securities 146,363 2,087 130,065 – 278,515 Loans, net of allowance (3) 1,916 40,758 31,245 347,199 421,118 Other assets 7,697 – 3,776 73,289 84,762
$ 155,976 $ 43,128 $ 212,000 $ 420,488 $ 831,592
2020 Oct. 31
Cash and deposits with banks $ – $ 133 $ 62,385 $ – $ 62,518 Securities 127,974 678 132,493 – 261,145 Loans, net of allowance (3) 7,946 42,291 34,103 322,441 406,781 Other assets 4,950 – 2,731 69,382 77,063
$ 140,870 $ 43,102 $ 231,712 $ 391,823 $ 807,507
(1) Includes assets supporting CIBC’s long-term funding activities and assets restricted for legal or other reasons, such as restricted cash.
(2) Other unencumbered assets are not subject to any restrictions on their use to secure funding or as collateral, however they are not considered immediately available to existing borrowing programs.
(3) Loans included as available as collateral represent the loans underlying National Housing Act mortgage-backed securities and Federal Home Loan Banks eligible loans.
Restrictions on the flow of funds
Our subsidiaries are not subject to significant restrictions that would prevent transfers of funds, dividends or capital distributions. However, certain
subsidiaries have different capital and liquidity requirements, established by applicable banking and securities regulators.
We monitor and manage our capital and liquidity requirements across these entities to ensure that resources are used efficiently and entities are in
compliance with local regulatory and policy requirements.
Liquidity coverage ratio The objective of the LCR is to promote short-term resilience of a bank’s liquidity risk profile, ensuring that it has adequate unencumbered high quality
liquid resources to meet its liquidity needs in a 30-day acute stress scenario. Canadian banks are required to achieve a minimum LCR value of 100%.
CIBC is in compliance with this requirement.
In accordance with the calibration methodology contained in OSFI’s Liquidity Adequacy Requirements (LAR) Guideline, CIBC reports the LCR to
OSFI on a monthly basis. The ratio is calculated as the total of unencumbered high quality liquid assets (HQLA) over the total net cash outflows in the
next 30 calendar days.
The LCR’s numerator consists of unencumbered HQLA, which follow an OSFI-defined set of eligibility criteria that considers fundamental and
market-related characteristics, and the relative ability to operationally monetize assets on a timely basis during a period of stress. CIBC’s centrally
managed liquid asset portfolio includes those liquid assets reported in the HQLA, such as central government treasury bills and bonds, central bank
deposits and high-rated sovereign, agency, provincial, and corporate securities. Asset eligibility limitations inherent in the LCR metric do not necessarily
reflect CIBC’s internal assessment of its ability to monetize its marketable assets under stress.
The ratio’s denominator reflects net cash outflows expected in the LCR’s stress scenario over the 30-calendar-day period. Expected cash outflows
represent LCR-defined withdrawal or draw-down rates applied against outstanding liabilities and off-balance sheet commitments, respectively.
Significant contributors to CIBC’s LCR outflows include business and financial institution deposit run-off, draws on undrawn lines of credit and unsecured
debt maturities. Cash outflows are partially offset by cash inflows, which are calculated at LCR-prescribed inflow rates, and include performing loan
repayments and maturing non-HQLA marketable assets.
Furthermore, CIBC reports the LCR to OSFI in multiple currencies, and thus measures the extent of potential currency mismatch under the ratio.
CIBC predominantly operates in major currencies with deep and fungible foreign exchange markets.
During a period of financial stress, institutions may use their stock of HQLA, thereby falling below 100%, as maintaining the LCR at 100% under
such circumstances could produce undue negative effects on the institution and other market participants.
CIBC SECOND QUARTER 2021 33

The LCR is disclosed using a standard OSFI-prescribed disclosure template.
$ millions, average of the three months ended April 30, 2021 Total unweighted value (1) Total weighted value (2)
HQLA
1 HQLA n/a $ 178,970
Cash outflows
2 Retail deposits and deposits from small business customers, of which: $ 206,139 15,381
3 Stable deposits 89,438 2,683
4 Less stable deposits 116,701 12,698
5 Unsecured wholesale funding, of which: 200,614 99,741
6 Operational deposits (all counterparties) and deposits in networks of cooperative banks 69,363 16,777
7 Non-operational deposits (all counterparties) 106,286 57,999
8 Unsecured debt 24,965 24,965
9 Secured wholesale funding n/a 5,054
10 Additional requirements, of which: 124,908 28,853
11 Outflows related to derivative exposures and other collateral requirements 19,026 10,125
12 Outflows related to loss of funding on debt products 2,219 2,219
13 Credit and liquidity facilities 103,663 16,509
14 Other contractual funding obligations 3,223 3,223
15 Other contingent funding obligations 314,255 6,193
16 Total cash outflows n/a 158,445
Cash inflows
17 Secured lending (e.g. reverse repos) 80,356 12,300
18 Inflows from fully performing exposures 18,345 9,295
19 Other cash inflows 3,630 3,630
20 Total cash inflows $ 102,331 $ 25,225
Total adjusted value
21 Total HQLA n/a $ 178,970
22 Total net cash outflows n/a $ 133,220
23 LCR n/a 134 %
$ millions, average of the three months ended January 31, 2021 Total adjusted value
24 Total HQLA n/a $ 190,484
25 Total net cash outflows n/a $ 133,693
26 LCR n/a 142 %
(1) Unweighted inflow and outflow values are calculated as outstanding balances maturing or callable within 30 days of various categories or types of liabilities, off-balance sheet items or contractual
receivables.
(2) Weighted values are calculated after the application of haircuts (for HQLA) and inflow and outflow rates prescribed by OSFI.
n/a Not applicable as per the LCR common disclosure template.
Our average LCR as at April 30, 2021 decreased to 134% from 142% in the prior quarter, largely due to forecasted term funding repayments from cash
and liquid assets.
Net stable funding ratio (NSFR) Derived from the BCBS’s Basel III framework and incorporated into OSFI’s LAR Guideline, the NSFR standard aims to promote long-term resilience of the
financial sector by requiring banks to maintain a sustainable funding profile in relation to the composition of their assets and off-balance sheet activities.
Canadian D-SIBs are required to maintain a minimum NSFR value of 100% on a consolidated bank basis. CIBC is in compliance with this requirement.
In accordance with the calibration methodology contained in OSFI’s LAR Guideline, CIBC reports the NSFR to OSFI on a quarterly basis. The ratio
is calculated as total available stable funding (ASF) over the total required stable funding (RSF).
The numerator consists of the portion of capital and liabilities considered reliable over a one-year time horizon. The NSFR considers longer-term
sources of funding to be more stable than short-term funding and deposits from retail and commercial customers to be behaviourally more stable than
wholesale funding of the same maturity. In accordance with CIBC’s funding strategy, key drivers of CIBC’s ASF include client deposits supplemented by
secured and unsecured wholesale funding, and capital instruments.
The ratio’s denominator represents the amount of stable funding required based on the OSFI-defined liquidity characteristics and residual
maturities of assets and off-balance sheet exposures. The NSFR ascribes varying degrees of RSF such that HQLA and short-term exposures are
assumed to have a lower funding requirement than less liquid and longer-term exposures. CIBC’s RSF is largely driven by retail, commercial and
corporate lending, investments in liquid assets, derivative exposures, and undrawn lines of credit and liquidity.
The ASF and RSF may be adjusted to zero for certain liabilities and assets that are determined to be interdependent if they meet the NSFR-defined
criteria, which take into account the purpose, amount, cash flows, tenor and counterparties among other aspects to ensure the institution is acting solely
as a pass-through unit for the underlying transactions. CIBC reports the liabilities arising from the Canada Mortgage Bonds (CMB) program and the
corresponding encumbered assets as interdependent.
34 CIBC SECOND QUARTER 2021

The NSFR is disclosed using an OSFI-prescribed disclosure template, which captures the key quantitative information based on liquidity characteristics
unique to the NSFR as defined in the LAR Guideline. As a result, amounts presented in the below table may not allow for direct comparison with the
interim consolidated financial statements.
$ millions, as at April 30, 2021
a b c d e
Unweighted value by residual maturity
No
maturity
<6
months
6 months
to <1 year >1 year
Weighted
value
ASF item 1 Capital $ 44,043 $ – $ – $ 5,051 $ 49,093
2 Regulatory capital 44,043 – – 5,051 49,093
3 Other capital instruments – – – – –
4 Retail deposits and deposits from small business customers 188,423 27,025 11,827 10,133 219,254
5 Stable deposits 88,493 10,889 7,405 6,532 107,980
6 Less stable deposits 99,930 16,136 4,422 3,601 111,274
7 Wholesale funding 142,622 148,904 30,076 57,352 159,513
8 Operational deposits 68,518 6,547 – – 37,533
9 Other wholesale funding 74,104 142,357 30,076 57,352 121,980
10 Liabilities with matching interdependent assets – 2,239 1,627 14,384 –
11 Other liabilities – 78,700 (1) 6,203
12 NSFR derivative liabilities 6,599 (1)
13 All other liabilities and equity not included in the above categories – 48,494 133 23,474 6,203
14 Total ASF 434,063
RSF item
15 Total NSFR HQLA 14,464
16 Deposits held at other financial institutions for operational purposes – 2,410 – 233 1,439
17 Performing loans and securities 57,299 94,763 40,418 271,811 298,455
18 Performing loans to financial institutions secured by Level 1 HQLA – 20,487 3,239 127 2,983
19 Performing loans to financial institutions secured by non-Level 1 HQLA and unsecured performing loans to financial institutions 390 29,215 3,852 7,966 13,531
20 Performing loans to non-financial corporate clients, loans to retail and small business customers, and loans to sovereigns, central banks and public sector entities, of which: 26,462 31,003 17,193 95,110 127,622
21 With a risk weight of less than or equal to 35% under the Basel II standardized approach for credit risk – – – – –
22 Performing residential mortgages, of which: 17,879 12,944 15,505 164,744 139,480
23 With a risk weight of less than or equal to 35% under the Basel II standardized approach for credit risk 17,879 12,869 15,433 160,503 135,801
24 Securities that are not in default and do not qualify as HQLA, including exchange-traded equities 12,568 1,114 629 3,864 14,839
25 Assets with matching interdependent liabilities – 2,239 1,627 14,384 –
26 Other assets 13,049 78,042 (1) 42,918
27 Physical traded commodities, including gold 3,776 3,209
28 Assets posted as initial margin for derivative contracts and contributions to default funds of central counterparties 7,692 (1) 6,538
29 NSFR derivative assets 10,379 (1) 3,780
30 NSFR derivative liabilities before deduction of variation margin posted 17,794 (1) 890
31 All other assets not included in the above categories 9,273 36,678 317 5,182 28,501
32 Off-balance sheet items 316,801 (1) 10,979
33 Total RSF $ 368,255
34 NSFR 118 %
$ millions, as at January 31, 2021
Weighted
value
35 Total ASF $ 434,977
36 Total RSF $ 356,746
37 NSFR 122 %
(1) No assigned time period per disclosure template design.
Our NSFR as at April 30, 2021 decreased to 118% from 122% in the prior quarter, due to an increase in lending in line with strategic business growth,
partially offset by an increase in long-term funding.
CIBC considers the impact of its business decisions on the LCR, NSFR and other liquidity risk metrics that it regularly monitors as part of a robust
liquidity risk management function. Variables that can impact the metrics month-over-month include, but are not limited to, items such as wholesale
funding activities and maturities, strategic balance sheet initiatives, and transactions and market conditions affecting collateral.
Reporting of the LCR and NSFR is calibrated centrally by CIBC Treasury, in conjunction with CIBC’s SBUs and other functional groups.
Funding
CIBC funds its operations with client-sourced deposits, supplemented with a wide range of wholesale funding.
CIBC’s principal approach aims to fund its consolidated balance sheet with deposits primarily raised from personal and commercial banking
channels. CIBC maintains a foundation of relationship-based core deposits, whose stability is regularly evaluated through internally developed statistical
assessments.
We routinely access a range of short-term and long-term secured and unsecured funding sources diversified by geography, depositor type,
instrument, currency and maturity. We raise long-term funding from existing programs including covered bonds, asset securitizations and unsecured debt.
CIBC SECOND QUARTER 2021 35

CIBC continuously evaluates opportunities to diversify into new funding products and investor segments in an effort to maximize funding flexibility
and minimize concentration and financing costs. We regularly monitor wholesale funding levels and concentrations to internal limits consistent with our
desired liquidity risk profile.
GALCO and RMC review and approve CIBC’s funding plan, which incorporates projected asset and liability growth, funding maturities, and output
from our liquidity position forecasting.
The following table provides the contractual maturity profile of CIBC’s wholesale funding sources at their carrying values:
$ millions, as at April 30, 2021
Less than 1 month
1–3 months
3–6 months
6–12 months
Less than 1 year total
1–2 years
Over 2 years Total
Deposits from banks (1) $ 4,364 $ 684 $ 280 $ 93 $ 5,421 $ – $ – $ 5,421 Certificates of deposit and commercial paper 8,160 14,985 20,528 16,547 60,220 – – 60,220 Bearer deposit notes and bankers’ acceptances 226 1,011 1,052 189 2,478 – – 2,478 Asset-backed commercial paper – – – – – – – – Senior unsecured medium-term notes (2) – 1,930 1,540 3,644 7,114 9,101 26,331 42,546 Senior unsecured structured notes 31 – 220 – 251 – 98 349 Covered bonds/asset-backed securities
Mortgage securitization – 1,832 413 1,641 3,886 2,570 12,071 18,527 Covered bonds – 2,160 200 1,060 3,420 9,541 6,116 19,077 Cards securitization 790 – – – 790 – 800 1,590
Subordinated liabilities – – – – – – 5,653 5,653 Other – – – – – 246 8 254
$ 13,571 $ 22,602 $ 24,233 $ 23,174 $ 83,580 $ 21,458 $ 51,077 $ 156,115
Of which: Secured $ 790 $ 3,992 $ 613 $ 2,701 $ 8,096 $ 12,111 $ 18,987 $ 39,194 Unsecured 12,781 18,610 23,620 20,473 75,484 9,347 32,090 116,921
$ 13,571 $ 22,602 $ 24,233 $ 23,174 $ 83,580 $ 21,458 $ 51,077 $ 156,115
October 31, 2020 $ 17,139 $ 15,400 $ 12,670 $ 35,224 $ 80,433 $ 17,648 $ 54,253 $ 152,334
(1) Includes non-negotiable term deposits from banks.
(2) Includes wholesale funding liabilities which are subject to conversion under bail-in regulations. See the “Capital management” section for additional details.
CIBC’s wholesale funding is diversified by currency as demonstrated in the table that follows:
$ billions, as at
2021
Apr. 30
2020
Oct. 31
CAD $ 46.5 30 % $ 50.8 33 %
USD 83.9 54 75.4 50
Other 25.7 16 26.1 17
$ 156.1 100 % $ 152.3 100 %
We manage liquidity risk in a manner that enables us to withstand severe liquidity stress events. Wholesale funding may present a higher risk of run-off in stress
situations, and we maintain significant portfolios of unencumbered liquid assets to mitigate this risk. See the “Liquid assets” section for additional details.
Credit ratings CIBC’s access to and cost of wholesale funding are dependent on multiple factors, among them credit ratings provided by rating agencies. Rating
agencies’ opinions are based upon internal methodologies, and are subject to change based on factors including, but not limited to, financial strength,
competitive position, macroeconomic backdrop and liquidity positioning.
Our credit ratings are summarized in the following table:
As at April 30, 2021 DBRS Fitch Moody’s S&P
Deposit/Counterparty (1) AA AA Aa2 A+
Legacy senior debt (2) AA AA Aa2 A+
Senior debt (3) AA(L) AA- A2 BBB+
Subordinated indebtedness A(H) A Baa1 BBB+
Subordinated indebtedness – NVCC (4) A(L) A Baa1 BBB
Limited recourse capital notes – NVCC (4) BBB(H) n/a Baa3 BB+
Preferred shares – NVCC (4) Pfd-2 n/a Baa3 P-3(H)
Short-term debt R-1(H) F1+ P-1 A-1
Outlook Stable Negative Stable Stable
(1) DBRS Long-Term Issuer Rating; Moody’s Long-Term Deposit and Counterparty Risk Assessment Rating; S&P’s Issuer Credit Rating; Fitch Ratings Inc. (Fitch) Long-Term Deposit Rating and Derivative
Counterparty Rating.
(2) Includes senior debt issued prior to September 23, 2018 as well as senior debt issued on or after September 23, 2018 which is not subject to bail-in regulations.
(3) Comprises liabilities which are subject to conversion under bail-in regulations. See the “Capital management” section for additional details.
(4) Comprises instruments which are treated as NVCC in accordance with OSFI’s CAR Guideline.
n/a Not applicable.
36 CIBC SECOND QUARTER 2021

Additional collateral requirements for rating downgrades
We are required to deliver collateral to certain derivative counterparties in the event of a downgrade to our current credit risk rating. The collateral
requirement is based on MTM exposure, collateral valuations, and collateral arrangement thresholds, as applicable. The following table presents the
additional cumulative collateral requirements for rating downgrades:
$ billions, as at
2021
Apr. 30
2020
Oct. 31
One-notch downgrade $ 0.1 $ 0.1
Two-notch downgrade 0.2 0.2
Three-notch downgrade 0.3 0.3
Regulatory developments concerning liquidity
On March 27, 2020, as a COVID-19 support measure, OSFI had allowed a temporary increase to the covered bond limit from 5.5% to 10% of total assets
to facilitate greater access to the Bank of Canada facilities. The temporary increase in the limit targeted covered bonds pledged directly to the Bank of
Canada, with the limit relating to market instruments remaining at 5.5%. Effective April 6, 2021, as a result of improvements to liquidity and access to
term funding, OSFI announced the unwinding of the temporary increase of the covered bond limit for deposit-taking institutions. CIBC remains compliant
with the stipulated requirements.
Contractual obligations
Contractual obligations give rise to commitments of future payments affecting our short- and long-term liquidity and capital resource needs. These
obligations include financial liabilities, credit and liquidity commitments, and other contractual obligations.
Assets and liabilities The following table provides the contractual maturity profile of our on-balance sheet assets, liabilities and equity at their carrying values. Contractual
analysis is not representative of CIBC’s liquidity risk exposure, however this information serves to inform CIBC’s management of liquidity risk, and
provide input when modelling a behavioural balance sheet.
$ millions, as at April 30, 2021
Less than
1 month
1–3
months
3–6
months
6–9
months
9–12
months
1–2
years
2–5
years
Over
5 years
No
specified
maturity Total
Assets Cash and non-interest-bearing deposits
with banks (1) $ 26,924 $ – $ – $ – $ – $ – $ – $ – $ – $ 26,924 Interest-bearing deposits with banks 20,273 – – – – – – – – 20,273 Securities 3,936 4,605 5,353 5,118 5,010 17,231 45,282 31,337 37,250 155,122 Cash collateral on securities borrowed 11,573 – – – – – – – – 11,573 Securities purchased under resale agreements 33,633 18,345 6,273 2,191 2,652 12 – – – 63,106 Loans
Residential mortgages 1,825 4,714 11,214 10,898 9,583 46,977 141,895 7,641 – 234,747 Personal 1,171 832 1,112 1,051 1,251 500 3,498 3,874 29,082 42,371 Credit card 223 447 670 670 670 2,679 5,274 – – 10,633 Business and government 18,864 6,566 5,682 6,230 8,696 24,331 41,967 15,999 8,232 136,567 Allowance for credit losses – – – – – – – – (3,200) (3,200)
Derivative instruments 2,078 4,225 3,603 3,902 1,636 4,355 7,313 8,201 – 35,313 Customers’ liability under acceptances 9,795 1,171 20 – 16 – – – – 11,002 Other assets – – – – – – – – 38,447 38,447
$ 130,295 $ 40,905 $ 33,927 $ 30,060 $ 29,514 $ 96,085 $ 245,229 $ 67,052 $ 109,811 $ 782,878
October 31, 2020 (2) $ 141,033 $ 32,738 $ 41,413 $ 32,267 $ 28,499 $ 101,338 $ 224,276 $ 69,248 $ 98,739 $ 769,551
Liabilities Deposits (3) $ 29,851 $ 37,172 $ 35,218 $ 27,150 $ 23,102 $ 32,181 $ 47,244 $ 13,743 $ 330,902 $ 576,563 Obligations related to securities sold short 20,269 – – – – – – – – 20,269 Cash collateral on securities lent 3,205 – – – – – – – – 3,205 Obligations related to securities sold under
repurchase agreements 47,141 14,725 1,285 407 2,217 345 – – – 66,120 Derivative instruments 3,271 4,834 4,342 3,168 1,574 2,951 6,182 7,799 – 34,121 Acceptances 9,864 1,171 20 – 16 – – – – 11,071 Other liabilities 24 51 78 73 73 305 609 471 21,512 23,196 Subordinated indebtedness – – – – – – – 5,653 – 5,653 Equity – – – – – – – – 42,680 42,680
$ 113,625 $ 57,953 $ 40,943 $ 30,798 $ 26,982 $ 35,782 $ 54,035 $ 27,666 $ 395,094 $ 782,878
October 31, 2020 $ 98,552 $ 40,528 $ 58,834 $ 43,919 $ 26,555 $ 33,273 $ 58,938 $ 26,416 $ 382,536 $ 769,551
(1) Cash includes interest-bearing demand deposits with Bank of Canada.
(2) Restated from amounts previously presented.
(3) Comprises $207.0 billion (October 31, 2020: $202.2 billion) of personal deposits; $352.5 billion (October 31, 2020: $351.6 billion) of business and government deposits and secured borrowings; and
$17.1 billion (October 31, 2020: $17.0 billion) of bank deposits.
The changes in the contractual maturity profile were primarily due to the natural migration of maturities and also reflect the impact of our regular business
activities.
CIBC SECOND QUARTER 2021 37

Credit-related commitments
The following table provides the contractual maturity of notional amounts of credit-related commitments. Since a significant portion of commitments are
expected to expire without being drawn upon, the total of the contractual amounts is not representative of future liquidity requirements.
$ millions, as at April 30, 2021
Less than
1 month
1–3
months
3–6
months
6–9
months
9–12
months
1–2
years
2–5
years
Over
5 years
No
specified
maturity (1) Total
Unutilized credit commitments $ 1,182 $ 11,857 $ 3,578 $ 6,001 $ 5,125 $ 24,173 $ 45,924 $ 3,325 $ 181,930 $ 283,095 Securities lending (2) 40,200 3,919 4,977 – – – – – – 49,096 Standby and performance letters of credit 2,782 2,606 2,500 3,030 2,578 575 667 66 – 14,804 Backstop liquidity facilities 369 136 672 10,071 241 181 36 – – 11,706 Documentary and commercial letters of credit 46 83 34 14 3 5 9 – – 194 Other 1,160 – – – – – – – – 1,160
$ 45,739 $ 18,601 $ 11,761 $ 19,116 $ 7,947 $ 24,934 $ 46,636 $ 3,391 $ 181,930 $ 360,055
October 31, 2020 $ 39,474 $ 24,451 $ 11,188 $ 8,798 $ 6,427 $ 20,638 $ 51,245 $ 1,714 $ 173,157 $ 337,092
(1) Includes $136.7 billion (October 31, 2020: $131.3 billion) of personal, home equity and credit card lines, which are unconditionally cancellable at our discretion.
(2) Excludes securities lending of $3.2 billion (October 31, 2020: $1.8 billion) for cash because it is reported on the interim consolidated balance sheet.
Other contractual obligations
The following table provides the contractual maturities of other contractual obligations affecting our funding needs:
$ millions, as at April 30, 2021
Less than
1 month
1–3
months
3–6
months
6–9
months
9–12
months
1–2
years
2–5
years
Over
5 years Total
Purchase obligations (1) $ 90 $ 251 $ 181 $ 156 $ 118 $ 428 $ 423 $ 318 $ 1,965
Future lease commitments – 1 7 10 11 52 92 1,316 1,489
Investment commitments – 2 2 1 – – 5 265 275
Underwriting commitments 210 – – – – – – – 210
Pension contributions (2) 135 – – – – – – – 135
$ 435 $ 254 $ 190 $ 167 $ 129 $ 480 $ 520 $ 1,899 $ 4,074
October 31, 2020 $ 211 $ 243 $ 231 $ 239 $ 204 $ 488 $ 795 $ 1,625 $ 4,036
(1) Obligations that are legally binding agreements whereby we agree to purchase products or services with specific minimum or baseline quantities defined at fixed, minimum or variable prices over a specified period of time are defined as purchase obligations. Purchase obligations are included through to the termination date specified in the respective agreements, even if the contract is renewable. Many of the purchase agreements for goods and services include clauses that would allow us to cancel the agreement prior to expiration of the contract within a specific notice period. However, the amount above includes our obligations without regard to such termination clauses (unless actual notice of our intention to terminate the agreement has been communicated to the counterparty). The table excludes purchases of debt and equity instruments that settle within standard market time frames.
(2) Includes estimated minimum funding contributions for our funded defined benefit pension plans in Canada, the U.S., the U.K., and the Caribbean. Estimated minimum funding contributions are included only for the next annual period ending October 31, 2021 as the minimum contributions are affected by various factors, such as market performance and regulatory requirements, and therefore are subject to significant variability.
Other risks We also have policies and processes to measure, monitor and control other risks, including strategic, reputation, environmental and social, and
operational risks, such as insurance, technology, information and cyber security, and regulatory compliance. These risks and related policies and
processes have not changed significantly from those described on pages 80 to 82 of our 2020 Annual Report.
Accounting and control matters Critical accounting policies and estimates The interim consolidated financial statements have been prepared in accordance with International Accounting Standard (IAS) 34 “Interim Financial
Reporting” using IFRS as issued by the International Accounting Standards Board (IASB). A summary of significant accounting policies is presented in
Note 1 to the consolidated financial statements included in our 2020 Annual Report. The interim consolidated financial statements have been prepared
using the same accounting policies as CIBC’s consolidated financial statements as at and for the year ended October 31, 2020, except that CIBC
adopted the “Conceptual Framework for Financial Reporting” (Conceptual Framework) and early adopted the “Interest Rate Benchmark Reform: Phase 2
Amendments to IFRS 9, IAS 39, IFRS 7, IFRS 4 and IFRS 16” (Phase 2 amendments) effective November 1, 2020.
There was no impact from the adoption of the Conceptual Framework.
The early adoption of the Phase 2 amendments as discussed under the “Other regulatory developments” section below required us to provide
additional disclosure in Note 1 to our interim consolidated financial statements.
Certain accounting policies require us to make judgments and estimates, some of which relate to matters that are uncertain. The COVID-19
pandemic continues to result in increased level of judgment as discussed on pages 83 to 88 of our 2020 Annual Report, and could have a material
impact on our financial results, particularly in regard to the estimation of ECLs.
During the six months ended April 30, 2021, improvements in our economic outlook resulted in a relatively moderate reduction in our stage 1 and
stage 2 performing ECLs. Significant judgment was inherent in the forecasting of forward-looking information, including with regard to our base case
assumption that the vaccination programs will continue on a mass scale in many countries over the spring and summer and that the vaccinations will be
able to effectively respond to the emerging variants, allowing for stronger global recovery in the latter half of the year.
Changes in the judgments and estimates related to IFRS 9 can have a significant impact on the level of ECL allowance recognized and the period-
over-period volatility of the provision for credit losses. See Note 6 to our consolidated financial statements in our 2020 Annual Report, and Note 6 to our
interim consolidated financial statements for more information concerning the high level of judgment inherent in the estimation of ECL allowance,
including the impact of COVID-19.
Accounting developments For details on future accounting policy changes, refer to Note 1 to our interim consolidated financial statements and Note 32 to the consolidated financial
statements included in our 2020 Annual Report.
38 CIBC SECOND QUARTER 2021

Other regulatory developments Reforms to interest rate benchmarks
Various interest rate and other indices that are deemed to be “benchmarks” (including LIBOR) are the subject of international regulatory guidance and
proposals for reform. Regulators in various jurisdictions have pushed for the transition from Interbank Offered Rates (IBORs) to alternative benchmark
rates (alternative rates), based upon risk-free rates determined using actual market transactions. The U.K.’s FCA originally announced in July 2017 that it
would not compel banks to submit LIBOR rates after December 2021. In March 2021, the FCA and the ICE Benchmark Administrator (IBA) announced
the dates for the cessation or loss of representativeness of various LIBOR rates including that GBP, EUR, CHF and JPY LIBORs will cease on
December 31, 2021 and that most USD LIBOR tenors will cease on June 30, 2023. This announcement results in a fixed spread between the LIBOR rate
and the alternative rate for a given tenor which will apply on the cessation of the relevant LIBOR rates. The extension for most USD LIBOR tenors until
June 30, 2023 would allow many legacy contracts to mature before the cessation date, however, originations of new USD LIBOR-linked products would
cease after the end of 2021.
The transition from current reference rates to alternative rates may adversely affect the value of, return on, or trading market for contracts linked to
existing benchmarks. These developments may cause some LIBOR and other benchmarks to be discontinued.
A significant number of our derivative, securities, lending and deposit contracts reference various interest rate benchmarks, including contracts
with maturity dates that extend beyond the cessation dates announced by the FCA in March 2021. In response to the proposed reforms to interest rate
benchmarks, we have established an Enterprise IBOR Transition Program (Program) to manage and coordinate all aspects of the transition. Further
details on the Program are included as part of the “Other regulatory developments” section of our 2020 Annual Report.
As a part of the Program, we have begun to transition existing IBOR based contracts to those that reference the new alternative rates, and are
developing business processes to support the transition. We have started to remediate our non-USD LIBOR referenced contracts by incorporating
appropriate fallback language, and have ceased the issuance of certain new GBP LIBOR referencing products that mature after the end of 2021 based
upon the guidelines provided by regulators. We have adhered to the International Swaps and Derivatives Association (ISDA) 2020 IBOR Fallbacks
Protocol to facilitate the transition of the contractual rate for derivatives with counterparties who have also adhered to the ISDA Protocol. Such transition
will be effective on the occurrence of certain prescribed trigger events. We have continued to develop contract remediation plans for our LIBOR
referencing products and have continued to make information available to clients, advising them on developments.
We continue to assess the impact of IBOR reform on our operations, engage with industry associations on ongoing developments on the transition
to risk-free rates, and continue to incorporate recent developments into our project plan. The Program provides regular updates to senior management
including the Executive Committee, and the Board.
Current accounting policy changes relating to the interest rate benchmark reform The IASB addressed interest rate benchmark reform and its effects on financial reporting in two phases. The first phase focuses on issues affecting
financial reporting in the period before the interest rate benchmark reform, while the second phase focuses on the issues that affect financial reporting
once the existing rate is replaced with an alternative rate. In September 2019, the IASB finalized the first phase through the issuance of “Interest Rate
Benchmark Reform: Amendments to IFRS 9, IAS 39 and IFRS 7” (Phase 1 amendments). We elected to early-adopt the Phase 1 amendments effective
November 1, 2019. The financial accounting and reporting impact of the early adoption of the Phase 1 amendments was described in Note 1 to our 2020
Annual Report.
In August 2020, the IASB finalized the second phase through the issuance of “Interest Rate Benchmark Reform: Phase 2 Amendments to IFRS 9,
IAS 39, IFRS 7, IFRS 4 and IFRS 16” (Phase 2 amendments), which addresses the issues that affect financial reporting once the existing rate is replaced
with an alternative rate and provides specific disclosure requirements. The Phase 2 amendments are effective for annual periods beginning on or after
January 1, 2021. As we elected to continue to apply the hedge accounting requirements of IAS 39 upon the adoption of IFRS 9, the Phase 2
amendments to IAS 39, IFRS 7, IFRS 4 and IFRS 16 will apply to us, mandatorily effective on November 1, 2021, with earlier application permitted. We
elected to early adopt the Phase 2 amendments effective November 1, 2020. As a result, we have provided additional disclosures related to our
exposures to significant benchmark rates subject to the reform in Note 1 to our interim consolidated financial statements.
Controls and procedures Disclosure controls and procedures
CIBC’s management, with the participation of the President and Chief Executive Officer and the Chief Financial Officer, has evaluated the effectiveness
of CIBC’s disclosure controls and procedures as at April 30, 2021 (as defined in the rules of the SEC and the Canadian Securities Administrators).
Based on that evaluation, the President and Chief Executive Officer and the Chief Financial Officer have concluded that such disclosure controls and
procedures were effective.
Changes in internal control over financial reporting
There have been no changes in CIBC’s internal control over financial reporting during the quarter ended April 30, 2021 that have materially affected, or
are reasonably likely to materially affect, our internal control over financial reporting.
Related-party transactions There have been no significant changes to CIBC’s procedures and policies regarding related-party transactions since October 31, 2020. For additional
information, refer to pages 90 and 183 of our 2020 Annual Report.
CIBC SECOND QUARTER 2021 39

Interim consolidated financial statements (Unaudited)
Contents
41 Consolidated balance sheet
42 Consolidated statement of income
43 Consolidated statement of comprehensive income
44 Consolidated statement of changes in equity
45 Consolidated statement of cash flows
46 Notes to the interim consolidated financial statements
46 Note 1 – Changes in accounting policies
47 Note 2 – Impact of COVID-19
48 Note 3 – Fair value measurement
52 Note 4 – Significant transactions
52 Note 5 – Securities
54 Note 6 – Loans
60 Note 7 – Deposits
60 Note 8 – Subordinated indebtedness
61 Note 9 – Share capital
61 Note 10 – Post-employment benefits
62 Note 11 – Income taxes
62 Note 12 – Earnings per share
63 Note 13 – Contingent liabilities and provisions
64 Note 14 – Interest income and expense
64 Note 15 – Segmented information
40 CIBC SECOND QUARTER 2021

Consolidated balance sheet
Unaudited, millions of Canadian dollars, as at
2021
Apr. 30
2020
Oct. 31
ASSETS
Cash and non-interest-bearing deposits with banks $ 26,924 $ 43,531
Interest-bearing deposits with banks 20,273 18,987
Securities (Note 5) 155,122 149,046
Cash collateral on securities borrowed 11,573 8,547
Securities purchased under resale agreements 63,106 65,595
Loans (Note 6)
Residential mortgages 234,747 221,165
Personal 42,371 42,222
Credit card 10,633 11,389
Business and government 136,567 135,546
Allowance for credit losses (3,200) (3,540)
421,118 406,782
Other
Derivative instruments 35,313 32,730
Customers’ liability under acceptances 11,002 9,606
Property and equipment 2,826 2,997
Goodwill 4,928 5,253
Software and other intangible assets 1,944 1,961
Investments in equity-accounted associates and joint ventures 641 658
Deferred tax assets 433 650
Other assets 27,675 23,208
84,762 77,063
$ 782,878 $ 769,551
LIABILITIES AND EQUITY
Deposits (Note 7)
Personal $ 207,028 $ 202,152
Business and government 313,201 311,426
Bank 17,140 17,011
Secured borrowings 39,194 40,151
576,563 570,740
Obligations related to securities sold short 20,269 15,963
Cash collateral on securities lent 3,205 1,824
Obligations related to securities sold under repurchase agreements 66,120 71,653
Other
Derivative instruments 34,121 30,508
Acceptances 11,071 9,649
Deferred tax liabilities 35 33
Other liabilities 23,161 22,134
68,388 62,324
Subordinated indebtedness 5,653 5,712
Equity
Preferred shares and other equity instruments 3,575 3,575
Common shares (Note 9) 14,130 13,908
Contributed surplus 119 117
Retained earnings 24,003 22,119
Accumulated other comprehensive income (AOCI) 683 1,435
Total shareholders’ equity 42,510 41,154
Non-controlling interests 170 181
Total equity 42,680 41,335
$ 782,878 $ 769,551
The accompanying notes and shaded sections in “MD&A – Management of risk” are an integral part of these interim consolidated financial statements.
CIBC SECOND QUARTER 2021 41

Consolidated statement of income
For the three
months ended
For the six
months ended
Unaudited, millions of Canadian dollars, except as noted
2021
Apr. 30
2021
Jan. 31
2020
Apr. 30
2021
Apr. 30
2020
Apr. 30
Interest income (Note 14) (1)
Loans $ 2,934 $ 3,071 $ 3,658 $ 6,005 $ 7,644
Securities 529 569 698 1,098 1,428
Securities borrowed or purchased under resale agreements 79 90 278 169 642
Deposits with banks 31 41 68 72 170
3,573 3,771 4,702 7,344 9,884
Interest expense (Note 14)
Deposits 666 755 1,608 1,421 3,591
Securities sold short 62 56 63 118 138
Securities lent or sold under repurchase agreements 55 71 207 126 502
Subordinated indebtedness 28 35 44 63 90
Other 15 15 18 30 40
826 932 1,940 1,758 4,361
Net interest income 2,747 2,839 2,762 5,586 5,523
Non-interest income
Underwriting and advisory fees 231 134 116 365 242
Deposit and payment fees 187 195 197 382 419
Credit fees 278 287 240 565 494
Card fees 104 123 85 227 207
Investment management and custodial fees 390 373 339 763 689
Mutual fund fees 427 424 384 851 793
Insurance fees, net of claims 81 97 95 178 197
Commissions on securities transactions 120 103 110 223 191
Gains (losses) from financial instruments measured/designated at fair value
through profit or loss (FVTPL), net 178 213 73 391 338
Gains (losses) from debt securities measured at fair value through other
comprehensive income (FVOCI) and amortized cost, net 22 36 (16) 58 (5)
Foreign exchange other than trading (FXOTT) 78 69 68 147 126
Income from equity-accounted associates and joint ventures 16 16 24 32 42
Other 73 54 101 127 177
2,185 2,124 1,816 4,309 3,910
Total revenue 4,932 4,963 4,578 9,895 9,433
Provision for credit losses (Note 6) 32 147 1,412 179 1,673
Non-interest expenses
Employee compensation and benefits 1,598 1,564 1,479 3,162 3,376
Occupancy costs 194 193 215 387 421
Computer, software and office equipment 507 467 479 974 949
Communications 87 79 82 166 157
Advertising and business development 50 45 72 95 149
Professional fees 57 47 49 104 99
Business and capital taxes 27 31 29 58 65
Other 236 300 299 536 553
2,756 2,726 2,704 5,482 5,769
Income before income taxes 2,144 2,090 462 4,234 1,991
Income taxes 493 465 70 958 387
Net income $ 1,651 $ 1,625 $ 392 $ 3,276 $ 1,604
Net income (loss) attributable to non-controlling interests $ 4 $ 4 $ (8) $ 8 $ (1)
Preferred shareholders and other equity instrument holders $ 51 $ 30 $ 30 $ 81 $ 61
Common shareholders 1,596 1,591 370 3,187 1,544
Net income attributable to equity shareholders $ 1,647 $ 1,621 $ 400 $ 3,268 $ 1,605
Earnings per share (in dollars) (Note 12)
Basic $ 3.56 $ 3.56 $ 0.83 $ 7.12 $ 3.47
Diluted 3.55 3.55 0.83 7.10 3.46
Dividends per common share (in dollars) 1.46 1.46 1.46 2.92 2.90
(1) Interest income included $3.2 billion for the quarter ended April 30, 2021 (January 31, 2021: $3.4 billion; April 30, 2020: $4.2 billion) and $6.5 billion for the six months ended April 30, 2021 (April 30,
2020: $8.9 billion) calculated based on the effective interest rate method.
The accompanying notes and shaded sections in “MD&A – Management of risk” are an integral part of these interim consolidated financial statements.
42 CIBC SECOND QUARTER 2021

Consolidated statement of comprehensive income
Unaudited, millions of Canadian dollars
For the three
months ended
For the six
months ended
2021
Apr. 30
2021
Jan. 31
2020
Apr. 30
2021
Apr. 30
2020
Apr. 30
Net income $ 1,651 $ 1,625 $ 392 $ 3,276 $ 1,604
Other comprehensive income (loss) (OCI), net of income tax, that is subject to subsequent reclassification to net income
Net foreign currency translation adjustments
Net gains (losses) on investments in foreign operations (1,438) (1,417) 1,795 (2,855) 1,957
Net gains (losses) on hedges of investments in foreign operations 843 798 (990) 1,641 (1,075)
(595) (619) 805 (1,214) 882
Net change in debt securities measured at FVOCI
Net gains (losses) on securities measured at FVOCI (72) 56 47 (16) 91
Net (gains) losses reclassified to net income (16) (26) (4) (42) (10)
(88) 30 43 (58) 81
Net change in cash flow hedges
Net gains (losses) on derivatives designated as cash flow hedges 30 124 43 154 32
Net (gains) losses reclassified to net income (38) (148) 150 (186) 164
(8) (24) 193 (32) 196
OCI, net of income tax, that is not subject to subsequent reclassification to net income
Net gains (losses) on post-employment defined benefit plans 327 199 248 526 143
Net gains (losses) due to fair value change of fair value option (FVO) liabilities
attributable to changes in credit risk 20 (35) 37 (15) 15
Net gains (losses) on equity securities designated at FVOCI 21 24 (38) 45 (2)
368 188 247 556 156
Total OCI (1) (323) (425) 1,288 (748) 1,315
Comprehensive income $ 1,328 $ 1,200 $ 1,680 $ 2,528 $ 2,919
Comprehensive income (loss) attributable to non-controlling interests $ 4 $ 4 $ (8) $ 8 $ (1)
Preferred shareholders and other equity instrument holders $ 51 $ 30 $ 30 $ 81 $ 61
Common shareholders 1,273 1,166 1,658 2,439 2,859
Comprehensive income attributable to equity shareholders $ 1,324 $ 1,196 $ 1,688 $ 2,520 $ 2,920
(1) Includes $25 million of losses for the quarter ended April 30, 2021 (January 31, 2021: $6 million of losses; April 30, 2020: $28 million of gains) and $31 million of losses for the six months ended
April 30, 2021 (April 30, 2020: $24 million of gains), relating to our investments in equity-accounted associates and joint ventures.
Unaudited, millions of Canadian dollars
For the three
months ended
For the six
months ended
2021
Apr. 30
2021
Jan. 31
2020
Apr. 30
2021
Apr. 30
2020
Apr. 30
Income tax (expense) benefit allocated to each component of OCI
Subject to subsequent reclassification to net income
Net foreign currency translation adjustments
Net gains (losses) on investments in foreign operations $ 42 $ 11 $ (14) $ 53 $ (15)
Net gains (losses) on hedges of investments in foreign operations (46) (15) 22 (61) 22
(4) (4) 8 (8) 7
Net change in debt securities measured at FVOCI
Net gains (losses) on securities measured at FVOCI 12 (25) 1 (13) (11)
Net (gains) losses reclassified to net income 6 9 2 15 4
18 (16) 3 2 (7)
Net change in cash flow hedges
Net gains (losses) on derivatives designated as cash flow hedges (10) (45) (15) (55) (11)
Net (gains) losses reclassified to net income 13 53 (54) 66 (59)
3 8 (69) 11 (70)
Not subject to subsequent reclassification to net income
Net gains (losses) on post-employment defined benefit plans (117) (71) (88) (188) (52)
Net gains (losses) due to fair value change of FVO liabilities attributable
to changes in credit risk (8) 13 (14) 5 (6)
Net gains (losses) on equity securities designated at FVOCI (7) (8) 13 (15) –
(132) (66) (89) (198) (58)
$ (115) $ (78) $ (147) $ (193) $ (128)
The accompanying notes and shaded sections in “MD&A – Management of risk” are an integral part of these interim consolidated financial statements.
CIBC SECOND QUARTER 2021 43
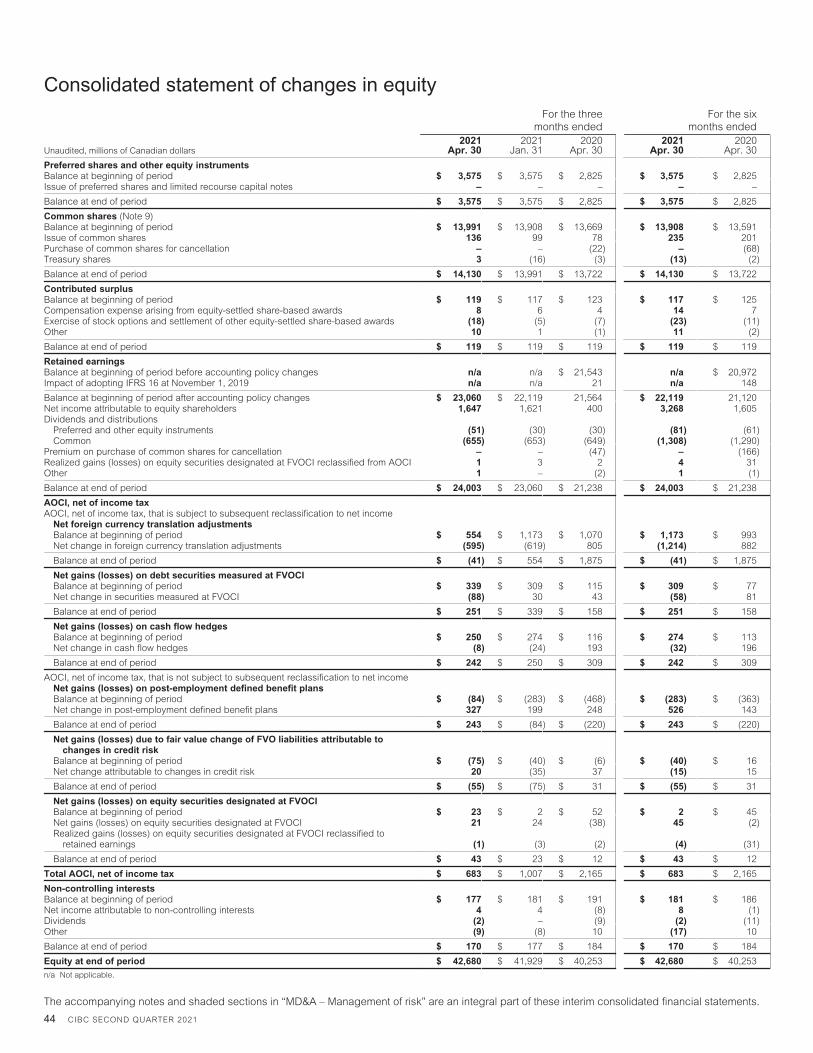
Consolidated statement of changes in equity
Unaudited, millions of Canadian dollars
For the three
months ended
For the six
months ended
2021 Apr. 30
2021 Jan. 31
2020 Apr. 30
2021 Apr. 30
2020 Apr. 30
Preferred shares and other equity instruments Balance at beginning of period $ 3,575 $ 3,575 $ 2,825 $ 3,575 $ 2,825 Issue of preferred shares and limited recourse capital notes – – – – –
Balance at end of period $ 3,575 $ 3,575 $ 2,825 $ 3,575 $ 2,825
Common shares (Note 9) Balance at beginning of period $ 13,991 $ 13,908 $ 13,669 $ 13,908 $ 13,591 Issue of common shares 136 99 78 235 201 Purchase of common shares for cancellation – – (22) – (68) Treasury shares 3 (16) (3) (13) (2)
Balance at end of period $ 14,130 $ 13,991 $ 13,722 $ 14,130 $ 13,722
Contributed surplus Balance at beginning of period $ 119 $ 117 $ 123 $ 117 $ 125 Compensation expense arising from equity-settled share-based awards 8 6 4 14 7 Exercise of stock options and settlement of other equity-settled share-based awards (18) (5) (7) (23) (11) Other 10 1 (1) 11 (2)
Balance at end of period $ 119 $ 119 $ 119 $ 119 $ 119
Retained earnings Balance at beginning of period before accounting policy changes n/a n/a $ 21,543 n/a $ 20,972 Impact of adopting IFRS 16 at November 1, 2019 n/a n/a 21 n/a 148
Balance at beginning of period after accounting policy changes $ 23,060 $ 22,119 21,564 $ 22,119 21,120 Net income attributable to equity shareholders 1,647 1,621 400 3,268 1,605 Dividends and distributions
Preferred and other equity instruments (51) (30) (30) (81) (61) Common (655) (653) (649) (1,308) (1,290)
Premium on purchase of common shares for cancellation – – (47) – (166) Realized gains (losses) on equity securities designated at FVOCI reclassified from AOCI 1 3 2 4 31 Other 1 – (2) 1 (1)
Balance at end of period $ 24,003 $ 23,060 $ 21,238 $ 24,003 $ 21,238
AOCI, net of income tax AOCI, net of income tax, that is subject to subsequent reclassification to net income
Net foreign currency translation adjustments Balance at beginning of period $ 554 $ 1,173 $ 1,070 $ 1,173 $ 993 Net change in foreign currency translation adjustments (595) (619) 805 (1,214) 882
Balance at end of period $ (41) $ 554 $ 1,875 $ (41) $ 1,875
Net gains (losses) on debt securities measured at FVOCI Balance at beginning of period $ 339 $ 309 $ 115 $ 309 $ 77 Net change in securities measured at FVOCI (88) 30 43 (58) 81
Balance at end of period $ 251 $ 339 $ 158 $ 251 $ 158
Net gains (losses) on cash flow hedges Balance at beginning of period $ 250 $ 274 $ 116 $ 274 $ 113 Net change in cash flow hedges (8) (24) 193 (32) 196
Balance at end of period $ 242 $ 250 $ 309 $ 242 $ 309
AOCI, net of income tax, that is not subject to subsequent reclassification to net income Net gains (losses) on post-employment defined benefit plans Balance at beginning of period $ (84) $ (283) $ (468) $ (283) $ (363) Net change in post-employment defined benefit plans 327 199 248 526 143
Balance at end of period $ 243 $ (84) $ (220) $ 243 $ (220)
Net gains (losses) due to fair value change of FVO liabilities attributable to changes in credit risk
Balance at beginning of period $ (75) $ (40) $ (6) $ (40) $ 16Net change attributable to changes in credit risk 20 (35) 37 (15) 15
Balance at end of period $ (55) $ (75) $ 31 $ (55) $ 31
Net gains (losses) on equity securities designated at FVOCI Balance at beginning of period $ 23 $ 2 $ 52 $ 2 $ 45Net gains (losses) on equity securities designated at FVOCI 21 24 (38) 45 (2) Realized gains (losses) on equity securities designated at FVOCI reclassified to
retained earnings (1) (3) (2) (4) (31)
Balance at end of period $ 43 $ 23 $ 12 $ 43 $ 12
Total AOCI, net of income tax $ 683 $ 1,007 $ 2,165 $ 683 $ 2,165
Non-controlling interests Balance at beginning of period $ 177 $ 181 $ 191 $ 181 $ 186 Net income attributable to non-controlling interests 4 4 (8) 8 (1) Dividends (2) – (9) (2) (11) Other (9) (8) 10 (17) 10
Balance at end of period $ 170 $ 177 $ 184 $ 170 $ 184
Equity at end of period $ 42,680 $ 41,929 $ 40,253 $ 42,680 $ 40,253
n/a Not applicable.
The accompanying notes and shaded sections in “MD&A – Management of risk” are an integral part of these interim consolidated financial statements.
44 CIBC SECOND QUARTER 2021

Consolidated statement of cash flows
Unaudited, millions of Canadian dollars
For the three
months ended
For the six
months ended
2021
Apr. 30
2021
Jan. 31
2020
Apr. 30
2021
Apr. 30
2020
Apr. 30
Cash flows provided by (used in) operating activities
Net income $ 1,651 $ 1,625 $ 392 $ 3,276 $ 1,604
Adjustments to reconcile net income to cash flows provided by (used in) operating activities:
Provision for credit losses 32 147 1,412 179 1,673
Amortization and impairment (1) 249 237 280 486 526
Stock options and restricted shares expense 8 6 4 14 7
Deferred income taxes (29) 43 (67) 14 (160)
Losses (gains) from debt securities measured at FVOCI and amortized cost (22) (36) 16 (58) 5
Net losses (gains) on disposal of property and equipment – – 3 – 4
Other non-cash items, net 430 82 (624) 512 (692)
Net changes in operating assets and liabilities
Interest-bearing deposits with banks 34 (1,320) (1,726) (1,286) (4,184)
Loans, net of repayments (11,056) (4,177) (18,853) (15,233) (22,969)
Deposits, net of withdrawals 1,479 1,628 43,555 3,107 56,273
Obligations related to securities sold short 793 3,513 (2,487) 4,306 (696)
Accrued interest receivable 7 132 (98) 139 53
Accrued interest payable (125) (159) 3 (284) (109)
Derivative assets (1,159) (1,440) (15,084) (2,599) (16,440)
Derivative liabilities 1,952 1,688 15,675 3,640 15,927
Securities measured at FVTPL (6,288) (3,864) 5,859 (10,152) (3,150)
Other assets and liabilities measured/designated at FVTPL 1,833 1,727 879 3,560 (171)
Current income taxes 154 62 (26) 216 1,216
Cash collateral on securities lent 1,460 (79) (50) 1,381 (250)
Obligations related to securities sold under repurchase agreements (10,402) 4,869 22,637 (5,533) 27,976
Cash collateral on securities borrowed (16) (3,010) 896 (3,026) (2,068)
Securities purchased under resale agreements 1,290 1,199 (8,414) 2,489 (9,221)
Other, net (2) (35) (3,983) (21) (4,018) (215)
(17,760) (1,110) 44,161 (18,870) 44,939
Cash flows provided by (used in) financing activities
Issue of subordinated indebtedness 1,000 – – 1,000 –
Redemption/repurchase/maturity of subordinated indebtedness – (1,008) – (1,008) –
Issue of common shares for cash 85 62 35 147 118
Purchase of common shares for cancellation – – (69) – (234)
Net sale (purchase) of treasury shares 3 (16) (3) (13) (2)
Dividends and distributions paid (673) (651) (643) (1,324) (1,279)
Repayment of lease liabilities (74) (74) (77) (148) (152)
341 (1,687) (757) (1,346) (1,549)
Cash flows provided by (used in) investing activities
Purchase of securities measured/designated at FVOCI and amortized cost (12,052) (9,954) (17,997) (22,006) (27,818)
Proceeds from sale of securities measured/designated at FVOCI and amortized cost 7,379 6,812 1,621 14,191 5,378
Proceeds from maturity of debt securities measured at FVOCI and amortized cost 6,301 5,676 6,028 11,977 13,173
Net sale (purchase) of property, equipment, software and other intangibles (2) (175) (184) (171) (359) (336)
1,453 2,350 (10,519) 3,803 (9,603)
Effect of exchange rate changes on cash and non-interest-bearing deposits with banks (96) (98) 129 (194) 141
Net increase (decrease) in cash and non-interest-bearing deposits with banks
during the period (16,062) (545) 33,014 (16,607) 33,928
Cash and non-interest-bearing deposits with banks at beginning of period 42,986 43,531 4,754 43,531 3,840
Cash and non-interest-bearing deposits with banks at end of period (3) $ 26,924 $ 42,986 $ 37,768 $ 26,924 $ 37,768
Cash interest paid $ 951 $ 1,091 $ 1,937 $ 2,042 $ 4,470
Cash interest received 3,323 3,659 4,384 6,982 9,523
Cash dividends received 257 244 220 501 414
Cash income taxes paid (received) 368 360 163 728 (669)
(1) Comprises amortization and impairment of buildings, right-of-use assets, furniture, equipment, leasehold improvements, and software and other intangible assets.
(2) Restated from amounts previously presented.
(3) Includes restricted cash of $492 million (January 31, 2021: $493 million; April 30, 2020: $698 million) and interest-bearing demand deposits with Bank of Canada.
The accompanying notes and shaded sections in “MD&A – Management of risk” are an integral part of these interim consolidated financial statements.
CIBC SECOND QUARTER 2021 45

Notes to the interim consolidated financial statements (Unaudited)
The interim consolidated financial statements of CIBC are prepared in accordance with Section 308(4) of the Bank Act (Canada), which states that,
except as otherwise specified by the Office of the Superintendent of Financial Institutions (OSFI), the financial statements are to be prepared in
accordance with International Financial Reporting Standards (IFRS) as issued by the International Accounting Standards Board (IASB). There are no
accounting requirements of OSFI that are exceptions to IFRS.
These interim consolidated financial statements have been prepared in accordance with International Accounting Standard (IAS) 34 “Interim
Financial Reporting” and do not include all of the information required for full annual consolidated financial statements. Except as indicated below, these
interim consolidated financial statements follow the same accounting policies and methods of application as CIBC’s consolidated financial statements as
at and for the year ended October 31, 2020.
All amounts in these interim consolidated financial statements are presented in Canadian dollars, unless otherwise indicated. These interim
consolidated financial statements were authorized for issue by the Board of Directors on May 26, 2021.
Note 1. Changes in accounting policies
(a) Current period changes in accounting policies
Interest Rate Benchmark Reform: Phase 2 Amendments to IFRS 9, IAS 39, IFRS 7, IFRS 4 and IFRS 16 Various interest rate and other indices that are deemed to be “benchmarks” (including LIBOR) are the subject of international regulatory guidance and
proposals for reform. Regulators in various jurisdictions have pushed for the transition from Interbank Offered Rates (IBORs) to alternative benchmark
rates (alternative rates), based upon risk-free rates determined using actual market transactions. The U.K.’s Financial Conduct Authority (FCA) originally
announced in July 2017 that it would not compel banks to submit LIBOR rates after December 2021. In March 2021, the FCA and the ICE Benchmark
Administrator (IBA) announced the dates for the cessation or loss of representativeness of various LIBOR rates including that GBP, EUR, CHF and JPY
LIBORs will cease on December 31, 2021 and that most USD LIBOR tenors will cease on June 30, 2023. This announcement results in a fixed spread
between the LIBOR rate and the alternative rate for a given tenor which will apply on the cessation of the relevant LIBOR rates. The extension for most
USD LIBOR tenors until June 30, 2023 would allow many legacy contracts to mature before the cessation date, however, originations of new USD
LIBOR-linked products would cease after the end of 2021.
In response to interest rate benchmark reform, the IASB issued “Interest Rate Benchmark Reform: Phase 2 Amendments to IFRS 9, IAS 39, IFRS 7,
IFRS 4, and IFRS 16” (Phase 2 amendments) in August 2020. These amendments address issues that affect financial reporting once an existing rate is
replaced with an alternative rate and concludes the IASB’s amendments to financial reporting standards due to the effects of interest rate benchmark
reform. While the Phase 2 amendments are effective for annual periods beginning on or after January 1, 2021, we elected to early adopt the Phase 2
amendments effective November 1, 2020. Only the amendments to IAS 39 “Financial Instruments: Recognition and Measurement” (IAS 39), IFRS 7
“Financial Instruments: Disclosures”, IFRS 4 “Insurance Contracts”, and IFRS 16 “Leases” apply to us because we elected to continue to apply the
hedge accounting requirements of IAS 39 upon the adoption of IFRS 9 “Financial Instruments” (IFRS 9).
The Phase 2 amendments permit modifications of amortized cost financial assets and financial liabilities, and lessee lease liabilities that are made
as a direct consequence of IBOR reform, and on an economically equivalent basis to be accounted for by updating the effective interest rate
prospectively with no immediate gain or loss recognition. The amendments also provide temporary relief that allows for hedging relationships to continue
upon the replacement of an existing interest rate benchmark with an alternative rate under certain qualifying conditions, including the amendment of the
hedge designation and documentation to reflect the new rate, and permits new hedging relationships that are in the scope of the Phase 2 amendments.
The IASB had previously issued “Interest Rate Benchmark Reform: Amendments to IFRS 9, IAS 39 and IFRS 7” (Phase 1 amendments) in
September 2019. The Phase 1 amendments provide relief for specific hedge accounting requirements to address uncertainties in the period before the
interest rate benchmark reform, and provide specific disclosure requirements for the affected hedging relationships. We adopted the Phase 1
amendments effective November 1, 2019 and the disclosure can be found in Note 1 to the consolidated financial statements included in our 2020
Annual Report.
As IBORs are widely referenced by large volumes of derivative, loan and cash products, the transition presents a number of risks to us, and the
industry as a whole. These transition risks include market risk (in the eventuality that new basis risks emerge), model risk, operational risk (as processes
are changed or newly introduced), legal risk (as contracts are revised) and conduct risk (in ensuring clients are adequately informed/prepared). In
response to the proposed reforms to interest rate benchmarks, we have established an Enterprise IBOR Transition Program (Program), which is
supported by a formal governance structure and dedicated working groups that include stakeholders from frontline businesses as well as functional
groups such as Treasury, Technology and Operations, Risk Management, Legal and Finance, to manage and coordinate all aspects of the transition,
including the identification and mitigation of the risks. An IBOR Steering Committee has been established with responsibility for oversight and execution
of the Program. The IBOR Steering Committee manages the impact of the transition risks through appropriate mitigating actions. We also continue to
engage with industry associations to incorporate recent developments into our project plan. The Program provides regular updates to the senior
management including the Executive Committee, and the Board of Directors.
As a part of the Program, we have begun to transition existing IBOR based contracts to those that reference the new alternative rates, and are
developing business processes to support the transition. We have started to remediate our non-USD LIBOR referenced contracts by incorporating
appropriate fallback language, and have ceased the issuance of certain new GBP LIBOR products that mature after the end of 2021 based upon the
guidelines provided by the regulators. We have adhered to the International Swaps and Derivatives Association (ISDA) 2020 IBOR Fallbacks Protocol to
facilitate the transition of the contractual rate for derivatives with counterparties who have also adhered to the ISDA Protocol. Such transition will be
effective on the occurrence of certain prescribed trigger events. We have continued to develop contract remediation plans for our LIBOR referencing
products and have continued to make information available to clients, advising them on developments.
46 CIBC SECOND QUARTER 2021

The following table presents the approximate notional amounts of our derivatives and the gross outstanding balances of our non-derivative financial
assets and financial liabilities that are indexed to USD LIBOR, GBP LIBOR and other benchmark rates as at November 1, 2020 with a maturity date
beyond December 31, 2021, that are expected to be affected by IBOR reform.
$ billions, as at November 1, 2020
Notional/gross outstanding amounts (1)(2)(3)
USD LIBOR GBP LIBOR Others (4)
Maturing after December 31, 2021 and
before June 30, 2023 Maturing after June 30, 2023 (5)
Maturing after December 31, 2021
Non-derivative financial assets
Securities $ 4.0 $ 1.9 $ – $ –
Loans 18.6 21.2 2.4 –
22.6 23.1 2.4 –
Non-derivative financial liabilities
Secured borrowing deposits and subordinated indebtedness – 0.1 1.1 –
Other deposits 0.8 1.0 – –
0.8 1.1 1.1 –
Derivatives 276.4 463.3 70.4 33.3
(1) Excludes financial instruments which reference rates in multi-rate jurisdictions, including Canadian Dollar Offered Rate (CDOR), Euro Interbank Offered Rate (EURIBOR) and Australian Bank Bill Swap
Rate. While the 6-month and 12-month tenors of CDOR discontinued on May 17, 2021, we did not hold material positions referencing these tenors as at November 1, 2020. Other tenors of CDOR are
expected to continue.
(2) The table excludes undrawn loan commitments. As at November 1, 2020, the total outstanding undrawn loan commitments that are potentially subject to the transition with a maturity date beyond
December 31, 2021 are estimated to be $53.1 billion, including $52.1 billion which can be drawn in USD LIBOR and $1.0 billion which can be drawn in GBP LIBOR.
(3) For cross currency swaps for which both legs reference benchmark rates that are subject to transition, the relevant notional amount for each leg has been included in the table above.
(4) Includes exposures indexed to JPY LIBOR, CHF LIBOR and EUR LIBOR.
(5) As at April 30, 2021, our USD LIBOR exposure excluding undrawn commitments, with a maturity date beyond June 30, 2023 was approximately $614.9 billion. In addition, undrawn loan commitments
which can potentially be drawn in USD LIBOR with a maturity date beyond June 30, 2023 were approximately $31.1 billion.
Conceptual Framework for Financial Reporting (Conceptual Framework) The Conceptual Framework sets out the fundamental concepts that underlie the preparation and presentation of financial statements and serves to guide
the IASB in developing IFRS standards. The Conceptual Framework is effective for annual periods beginning on or after January 1, 2020. As a result,
CIBC adopted the Conceptual Framework as at November 1, 2020.
There was no impact to our consolidated financial statements and no changes in our accounting policies as a result of adopting the Conceptual
Framework.
(b) Future accounting policy changes
For details on future accounting policy changes, refer to Note 32 to the consolidated financial statements included in our 2020 Annual Report. We are
continuing to evaluate the impact of standards that are effective for us after fiscal 2021.
Note 2. Impact of COVID-19
Although global economic activity has accelerated this year, the COVID-19 pandemic continues to have a significant adverse impact on the extent of
that rebound. Continuing uncertainty related to economic growth and unemployment in Canada, the U.S. and other regions where we operate will
ultimately only be resolved when the rollout of vaccination programs is near completion and is proven to be effective against new variants. As a result,
we continue to operate in an uncertain macroeconomic environment.
Impact on estimates and assumptions
As disclosed in our 2020 Annual Report, the preparation of the consolidated financial statements in accordance with IFRS requires management to make
estimates and assumptions that affect the recognized and measured amounts of assets, liabilities, net income, comprehensive income and related
disclosures. Significant estimates and assumptions are made in the areas of the valuation of financial instruments, allowance for credit losses, the
evaluation of whether to consolidate structured entities, asset impairment, income taxes, provisions and contingent liabilities, post-employment and other
long-term benefit plan assumptions and valuation of self-managed loyalty points programs.
Further, the COVID-19 pandemic continues to give rise to heightened uncertainty as it relates to accounting estimates and assumptions and
increases the need to apply judgment in evaluating the economic and market environment and its impact on significant estimates. This particularly
impacts estimates and assumptions relating to the allowance for credit losses.
During the six months ended April 30, 2021, improvements in our economic outlook resulted in a relatively moderate reduction in our stage 1 and
stage 2 performing expected credit losses (ECLs). Significant judgment was inherent in the forecasting of forward-looking information, including with
regard to our base case assumption that the vaccinations programs will continue on a mass scale in many countries over the spring and summer and
that the vaccinations will be able to effectively respond to the emerging variants, allowing for stronger global recovery in the latter half of the year.
Changes in the judgments and estimates related to IFRS 9 can have a significant impact on the level of ECL allowance recognized and the period-
over-period volatility of the provision for credit losses. Actual results could differ from these estimates and assumptions. See Note 6 to our consolidated
financial statements in our 2020 Annual Report, and Note 6 to our interim consolidated financial statements for more information concerning the high
level of judgment inherent in the estimation of ECL allowance, including the impact of COVID-19.
CIBC SECOND QUARTER 2021 47

Note 3. Fair value measurement
Fair value of financial instruments
$ millions, as at
Carrying value
Fair value
Fair value over (under)
carrying value Amortized
cost
Mandatorily measured at FVTPL
Designated at FVTPL
Fair value through
OCI Total
2021
Apr. 30
Financial assets
Cash and deposits with banks $ 46,543 $ 654 $ – $ – $ 47,197 $ 47,197 $ –
Securities 32,848 72,772 73 49,429 155,122 155,577 455
Cash collateral on securities borrowed 11,573 – – – 11,573 11,573 –
Securities purchased under resale agreements 56,934 6,172 – – 63,106 63,106 –
Loans
Residential mortgages 234,368 29 – – 234,397 235,236 839
Personal 41,631 – – – 41,631 41,663 32
Credit card 10,048 – – – 10,048 10,048 –
Business and government 111,535 23,116 391 – 135,042 135,157 115
Derivative instruments – 35,313 – – 35,313 35,313 –
Customers’ liability under acceptances 11,002 – – – 11,002 11,002 –
Other assets 19,006 – – – 19,006 19,006 –
Financial liabilities
Deposits
Personal $ 200,688 $ – $ 6,340 $ – $ 207,028 $ 207,180 $ 152
Business and government 302,623 – 10,578 – 313,201 314,165 964
Bank 17,140 – – – 17,140 17,140 –
Secured borrowings 38,225 – 969 – 39,194 39,543 349
Derivative instruments – 34,121 – – 34,121 34,121 –
Acceptances 11,071 – – – 11,071 11,071 –
Obligations related to securities sold short – 20,269 – – 20,269 20,269 –
Cash collateral on securities lent 3,205 – – – 3,205 3,205 –
Obligations related to securities sold under
repurchase agreements (1) 64,195 – 1,925 – 66,120 66,120 –
Other liabilities 16,395 119 26 – 16,540 16,540 –
Subordinated indebtedness 5,653 – – – 5,653 5,952 299
2020
Oct. 31
Financial assets
Cash and deposits with banks $ 61,570 $ 948 $ – $ – $ 62,518 $ 62,518 $ –
Securities 31,800 62,576 117 54,553 149,046 149,599 553
Cash collateral on securities borrowed 8,547 – – – 8,547 8,547 –
Securities purchased under resale agreements 58,090 7,505 – – 65,595 65,595 –
Loans
Residential mortgages 220,739 63 – – 220,802 222,920 2,118
Personal 41,390 – – – 41,390 41,452 62
Credit card 10,722 – – – 10,722 10,722 –
Business and government 110,220 23,291 357 – 133,868 134,097 229
Derivative instruments – 32,730 – – 32,730 32,730 –
Customers’ liability under acceptances 9,606 – – – 9,606 9,606 –
Other assets 15,940 – – – 15,940 15,940 –
Financial liabilities
Deposits
Personal $ 199,593 $ – $ 2,559 $ – $ 202,152 $ 202,345 $ 193
Business and government 301,546 – 9,880 – 311,426 312,279 853
Bank 17,011 – – – 17,011 17,011 –
Secured borrowings 39,560 – 591 – 40,151 40,586 435
Derivative instruments – 30,508 – – 30,508 30,508 –
Acceptances 9,649 – – – 9,649 9,649 –
Obligations related to securities sold short – 15,963 – – 15,963 15,963 –
Cash collateral on securities lent 1,824 – – – 1,824 1,824 –
Obligations related to securities sold under
repurchase agreements (1) 54,617 – 17,036 – 71,653 71,653 –
Other liabilities 15,282 133 9 – 15,424 15,424 –
Subordinated indebtedness 5,712 – – – 5,712 5,993 281
(1) Includes obligations related to securities sold under repurchase agreements supported by bearer deposit notes that are pledged as collateral under the Bank of Canada Term Repo Facility.
48 CIBC SECOND QUARTER 2021
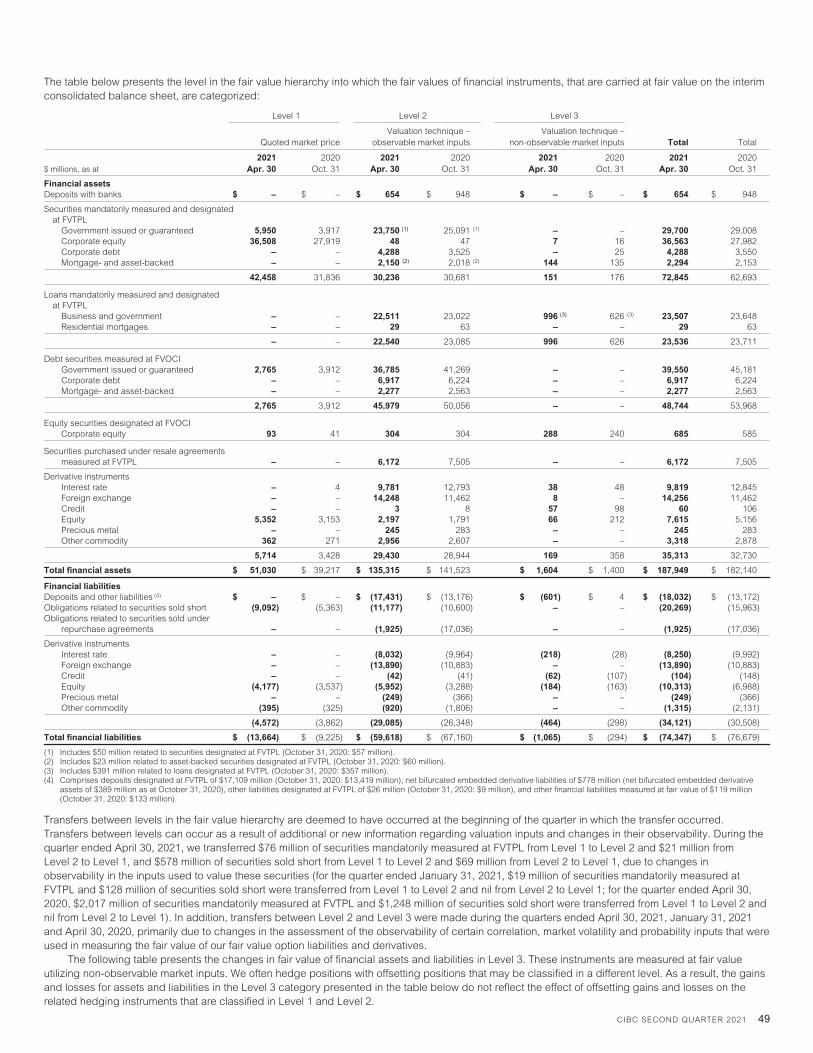
The table below presents the level in the fair value hierarchy into which the fair values of financial instruments, that are carried at fair value on the interim
consolidated balance sheet, are categorized:
Level 1 Level 2 Level 3
Total Total Quoted market price
Valuation technique –
observable market inputs
Valuation technique –
non-observable market inputs
$ millions, as at
2021
Apr. 30
2020
Oct. 31
2021
Apr. 30
2020
Oct. 31
2021
Apr. 30
2020
Oct. 31
2021
Apr. 30
2020
Oct. 31
Financial assets
Deposits with banks $ – $ – $ 654 $ 948 $ – $ – $ 654 $ 948
Securities mandatorily measured and designated
at FVTPL
Government issued or guaranteed 5,950 3,917 23,750 (1) 25,091 (1) – – 29,700 29,008
Corporate equity 36,508 27,919 48 47 7 16 36,563 27,982
Corporate debt – – 4,288 3,525 – 25 4,288 3,550
Mortgage- and asset-backed – – 2,150 (2) 2,018 (2) 144 135 2,294 2,153
42,458 31,836 30,236 30,681 151 176 72,845 62,693
Loans mandatorily measured and designated
at FVTPL
Business and government – – 22,511 23,022 996 (3) 626 (3) 23,507 23,648
Residential mortgages – – 29 63 – – 29 63
– – 22,540 23,085 996 626 23,536 23,711
Debt securities measured at FVOCI
Government issued or guaranteed 2,765 3,912 36,785 41,269 – – 39,550 45,181
Corporate debt – – 6,917 6,224 – – 6,917 6,224
Mortgage- and asset-backed – – 2,277 2,563 – – 2,277 2,563
2,765 3,912 45,979 50,056 – – 48,744 53,968
Equity securities designated at FVOCI
Corporate equity 93 41 304 304 288 240 685 585
Securities purchased under resale agreements
measured at FVTPL – – 6,172 7,505 – – 6,172 7,505
Derivative instruments
Interest rate – 4 9,781 12,793 38 48 9,819 12,845
Foreign exchange – – 14,248 11,462 8 – 14,256 11,462
Credit – – 3 8 57 98 60 106
Equity 5,352 3,153 2,197 1,791 66 212 7,615 5,156
Precious metal – – 245 283 – – 245 283
Other commodity 362 271 2,956 2,607 – – 3,318 2,878
5,714 3,428 29,430 28,944 169 358 35,313 32,730
Total financial assets $ 51,030 $ 39,217 $ 135,315 $ 141,523 $ 1,604 $ 1,400 $ 187,949 $ 182,140
Financial liabilities
Deposits and other liabilities (4) $ – $ – $ (17,431) $ (13,176) $ (601) $ 4 $ (18,032) $ (13,172)
Obligations related to securities sold short (9,092) (5,363) (11,177) (10,600) – – (20,269) (15,963)
Obligations related to securities sold under
repurchase agreements – – (1,925) (17,036) – – (1,925) (17,036)
Derivative instruments
Interest rate – – (8,032) (9,964) (218) (28) (8,250) (9,992)
Foreign exchange – – (13,890) (10,883) – – (13,890) (10,883)
Credit – – (42) (41) (62) (107) (104) (148)
Equity (4,177) (3,537) (5,952) (3,288) (184) (163) (10,313) (6,988)
Precious metal – – (249) (366) – – (249) (366)
Other commodity (395) (325) (920) (1,806) – – (1,315) (2,131)
(4,572) (3,862) (29,085) (26,348) (464) (298) (34,121) (30,508)
Total financial liabilities $ (13,664) $ (9,225) $ (59,618) $ (67,160) $ (1,065) $ (294) $ (74,347) $ (76,679)
(1) Includes $50 million related to securities designated at FVTPL (October 31, 2020: $57 million).
(2) Includes $23 million related to asset-backed securities designated at FVTPL (October 31, 2020: $60 million).
(3) Includes $391 million related to loans designated at FVTPL (October 31, 2020: $357 million).
(4) Comprises deposits designated at FVTPL of $17,109 million (October 31, 2020: $13,419 million), net bifurcated embedded derivative liabilities of $778 million (net bifurcated embedded derivative
assets of $389 million as at October 31, 2020), other liabilities designated at FVTPL of $26 million (October 31, 2020: $9 million), and other financial liabilities measured at fair value of $119 million
(October 31, 2020: $133 million).
Transfers between levels in the fair value hierarchy are deemed to have occurred at the beginning of the quarter in which the transfer occurred.
Transfers between levels can occur as a result of additional or new information regarding valuation inputs and changes in their observability. During the
quarter ended April 30, 2021, we transferred $76 million of securities mandatorily measured at FVTPL from Level 1 to Level 2 and $21 million from
Level 2 to Level 1, and $578 million of securities sold short from Level 1 to Level 2 and $69 million from Level 2 to Level 1, due to changes in
observability in the inputs used to value these securities (for the quarter ended January 31, 2021, $19 million of securities mandatorily measured at
FVTPL and $128 million of securities sold short were transferred from Level 1 to Level 2 and nil from Level 2 to Level 1; for the quarter ended April 30,
2020, $2,017 million of securities mandatorily measured at FVTPL and $1,248 million of securities sold short were transferred from Level 1 to Level 2 and
nil from Level 2 to Level 1). In addition, transfers between Level 2 and Level 3 were made during the quarters ended April 30, 2021, January 31, 2021
and April 30, 2020, primarily due to changes in the assessment of the observability of certain correlation, market volatility and probability inputs that were
used in measuring the fair value of our fair value option liabilities and derivatives.
The following table presents the changes in fair value of financial assets and liabilities in Level 3. These instruments are measured at fair value
utilizing non-observable market inputs. We often hedge positions with offsetting positions that may be classified in a different level. As a result, the gains
and losses for assets and liabilities in the Level 3 category presented in the table below do not reflect the effect of offsetting gains and losses on the
related hedging instruments that are classified in Level 1 and Level 2.
CIBC SECOND QUARTER 2021 49

$ millions, for the three months ended
Opening
balance
Net gains (losses)
included in income (1)
Net unrealized
gains (losses)
included in OCI (4)
Transfer
in to
Level 3
Transfer
out of
Level 3
Purchases/
Issuances
Sales/
Settlements
Closing
balance Realized (2) Unrealized (2)(3)
Apr. 30, 2021 Securities mandatorily measured and designated
at FVTPL Corporate equity $ 19 $ – $ (6) $ – $ – $ – $ 23 $ (29) $ 7 Corporate debt 30 – 8 – – – – (38) – Mortgage- and asset-backed 102 – – – – – 44 (2) 144
Loans mandatorily measured and designated at FVTPL Business and government 879 – (1) (33) – – 180 (29) 996
Debt securities measured at FVOCI Corporate debt – – – – – – – – –
Equity securities designated at FVOCI Corporate equity 269 – – 17 – – 10 (8) 288
Derivative instruments Interest rate 45 – (8) – – – 1 – 38 Foreign exchange – – 16 – (8) – – – 8 Credit 101 (6) (38) – – – – – 57 Equity 61 – – – – (1) 6 – 66
Total assets $ 1,506 $ (6) $ (29) $ (16) $ (8) $ (1) $ 264 $ (106) $ 1,604
Deposits and other liabilities (5) $ (367) $ 6 $ (257) $ – $ (13) $ (3) $ (38) $ 71 $ (601) Derivative instruments
Interest rate (74) – (90) – (28) – (29) 3 (218) Credit (113) 6 44 – – – – 1 (62) Equity (137) – (62) – – 8 (15) 22 (184)
Total liabilities $ (691) $ 12 $ (365) $ – $ (41) $ 5 $ (82) $ 97 $ (1,065)
Jan. 31, 2021 Securities mandatorily measured and designated
at FVTPL Corporate equity $ 16 $ – $ 3 $ – $ – $ – $ – $ – $ 19 Corporate debt 25 – 5 – – – – – 30 Mortgage- and asset-backed 135 – – – – – – (33) 102
Loans mandatorily measured and designated at FVTPL Business and government 626 – – (25) – – 278 – 879
Equity securities designated at FVOCI Corporate equity 240 – – 19 – – 17 (7) 269
Derivative instruments Interest rate 48 – (4) – – – – 1 45 Credit 98 (6) 9 – – – – – 101 Equity 212 – 15 – – – – (166) 61
Total assets $ 1,400 $ (6) $ 28 $ (6) $ – $ – $ 295 $ (205) $ 1,506
Deposits and other liabilities (5) $ 4 $ – $ (387) $ – $ (2) $ (5) $ (2) $ 25 $ (367) Derivative instruments
Interest rate (28) – (47) – – – – 1 (74) Credit (107) 6 (8) – – – – (4) (113) Equity (163) – (44) – – – – 70 (137)
Total liabilities $ (294) $ 6 $ (486) $ – $ (2) $ (5) $ (2) $ 92 $ (691)
Apr. 30, 2020 Securities mandatorily measured and designated
at FVTPL Corporate equity $ 14 $ – $ (7) $ – $ – $ – $ – $ – $ 7 Corporate debt 23 – 2 – – – – – 25 Mortgage- and asset-backed 160 – – – – – 118 – 278
Loans mandatorily measured at FVTPL Business and government 506 – – 17 – – 574 (179) 918
Debt securities measured at FVOCI Corporate debt 23 – – (6) – – 1 – 18
Equity securities designated at FVOCI Corporate equity 283 – – (44) – – 10 (6) 243
Derivative instruments Interest rate 47 – 21 – – – – 8 76 Credit 104 (4) 5 – – – – – 105 Equity 266 – (36) – – – 1 (10) 221
Total assets $ 1,426 $ (4) $ (15) $ (33) $ – $ – $ 704 $ (187) $ 1,891
Deposits and other liabilities (5) $ (647) $ – $ 679 $ – $ (6) $ 29 $ 53 $ 49 $ 157 Derivative instruments
Interest rate – – – – – – – – – Credit (112) 4 (5) – – – – – (113) Equity (121) – 34 – – – (29) 5 (111)
Total liabilities $ (880) $ 4 $ 708 $ – $ (6) $ 29 $ 24 $ 54 $ (67)
(1) Cumulative AOCI gains or losses related to equity securities designated at FVOCI are reclassified from AOCI to retained earnings at the time of disposal or derecognition.
(2) Includes foreign currency gains and losses related to debt securities measured at FVOCI.
(3) Comprises unrealized gains and losses relating to the assets and liabilities held at the end of the reporting period.
(4) Foreign exchange translation on loans mandatorily measured at FVTPL held by foreign operations and denominated in the same currency as the foreign operations is included in OCI.
(5) Includes deposits designated at FVTPL of $13 million (January 31, 2021: $136 million; April 30, 2020: $146 million), net bifurcated embedded derivative liabilities of $562 million (net bifurcated
embedded derivative liabilities of $231 million as at January 31, 2021 and net bifurcated embedded derivative assets of $303 million as at April 30, 2020) and other liabilities designated at FVTPL of
$26 million (January 31, 2021: nil; April 30, 2020: nil).
50 CIBC SECOND QUARTER 2021

$ millions, for the six months ended
Opening
balance
Net gains (losses)
included in income (1)
Net unrealized
gains (losses)
included in OCI (4)
Transfer
in to
Level 3
Transfer
out of
Level 3
Purchases/
Issuances
Sales/
Settlements
Closing
balance Realized (2) Unrealized (2)(3)
Apr. 30, 2021 Securities mandatorily measured and designated
at FVTPL Corporate equity $ 16 $ – $ (3) $ – $ – $ – $ 23 $ (29) $ 7 Corporate debt 25 – 13 – – – – (38) – Mortgage- and asset-backed 135 – – – – – 44 (35) 144
Loans mandatorily measured and designated at FVTPL Business and government 626 – (1) (58) – – 458 (29) 996
Debt securities measured at FVOCI Corporate debt – – – – – – – – –
Equity securities designated at FVOCI Corporate equity 240 – – 36 – – 27 (15) 288
Derivative instruments Interest rate 48 – (12) – – – 1 1 38 Foreign exchange – – 16 – (8) – – – 8 Credit 98 (12) (29) – – – – – 57 Equity 212 – 15 – – (1) 6 (166) 66
Total assets $ 1,400 $ (12) $ (1) $ (22) $ (8) $ (1) $ 559 $ (311) $ 1,604
Deposits and other liabilities (5) $ 4 $ 6 $ (644) $ – $ (15) $ (8) $ (40) $ 96 $ (601) Derivative instruments
Interest rate (28) – (137) – (28) – (29) 4 (218) Foreign exchange – – – – – – – – – Credit (107) 12 36 – – – – (3) (62) Equity (163) – (106) – – 8 (15) 92 (184)
Total liabilities $ (294) $ 18 $ (851) $ – $ (43) $ – $ (84) $ 189 $ (1,065)
Apr. 30, 2020 Securities mandatorily measured and designated
at FVTPL Corporate equity $ 7 $ – $ (7) $ – $ 7 $ – $ – $ – $ 7 Corporate debt 23 – 2 – – – – – 25 Mortgage- and asset-backed 173 – – – – – 118 (13) 278
Loans mandatorily measured at FVTPL Business and government 831 – – 21 – – 574 (508) 918
Debt securities measured at FVOCI Corporate debt – – – (3) 20 – 1 – 18
Equity securities designated at FVOCI Corporate equity 291 – – 5 – – 20 (73) 243
Derivative instruments Interest rate 56 – 24 – – – 1 (5) 76 Credit 104 (5) 6 – – – – – 105 Equity 252 – (24) – – – 45 (52) 221
Total assets $ 1,737 $ (5) $ 1 $ 23 $ 27 $ – $ 759 $ (651) $ 1,891
Deposits and other liabilities (5) $ (601) $ – $ 627 $ – $ (43) $ 60 $ (49) $ 163 $ 157 Derivative instruments
Interest rate (1) – (2) – – – – 3 – Credit (112) 5 (6) – – – – – (113) Equity (155) – 55 – – – (39) 28 (111)
Total liabilities $ (869) $ 5 $ 674 $ – $ (43) $ 60 $ (88) $ 194 $ (67)
(1) Cumulative AOCI gains or losses related to equity securities designated at FVOCI are reclassified from AOCI to retained earnings at the time of disposal or derecognition.
(2) Includes foreign currency gains and losses related to debt securities measured at FVOCI.
(3) Comprises unrealized gains and losses relating to these assets and liabilities held at the end of the reporting period.
(4) Foreign exchange translation on loans mandatorily measured at FVTPL held by foreign operations and denominated in the same currency as the foreign operations is included in OCI.
(5) Includes deposits designated at FVTPL of $13 million (April 30, 2020: $146 million), net bifurcated embedded derivative liabilities of $562 million (April 30, 2020: net bifurcated embedded derivative
assets of $303 million) and other liabilities designated at FVTPL of $26 million (April 30, 2020: nil).
Financial instruments designated at FVTPL (fair value option)
A net gain of $14 million, net of hedges for the three months ended April 30, 2021 (a net gain of $19 million and a net gain of $36 million for the three
months ended January 31, 2021 and April 30, 2020, respectively), which is included in the interim consolidated statement of income under Gains
(losses) from financial instruments measured/designated at FVTPL, net was recognized for FVO assets and FVO liabilities. A net gain of $33 million, net
of hedges for the six months ended April 30, 2021 was recognized for FVO assets and FVO liabilities (a net gain of $42 million for the six months ended
April 30, 2020).
The fair value of a FVO liability reflects the credit risk relating to that liability. For those FVO liabilities for which we believe changes in our credit risk
would impact the fair value from the note holders’ perspective, the related fair value changes were recognized in OCI.
CIBC SECOND QUARTER 2021 51

Note 4. Significant transactions
Sale of FirstCaribbean International Bank Limited
On November 8, 2019, we announced that we had entered into a definitive agreement to sell 66.73% of the outstanding shares of FirstCaribbean
International Bank Limited (CIBC FirstCaribbean) to GNB Financial Group Limited (GNB), subject to regulatory approvals, as discussed in Note 4 to the
consolidated financial statements included in our 2020 Annual Report.
As a result of the lengthy regulatory review process, the worsening impact of the COVID-19 pandemic on the Caribbean economy and our revised
expectations concerning the likelihood and timing of a potential transaction, we discontinued the application of held for sale accounting of CIBC
FirstCaribbean in the fourth quarter of 2020 and recorded a goodwill impairment charge of $220 million. On February 3, 2021, we announced that the
proposed sale of CIBC FirstCaribbean to GNB did not receive approval from CIBC FirstCaribbean’s regulators and that the transaction will not proceed.
Note 5. Securities
Securities
$ millions, as at
2021 Apr. 30
2020 Oct. 31
Carrying amount
Debt securities measured at FVOCI $ 48,744 $ 53,968 Equity securities designated at FVOCI 685 585 Securities measured at amortized cost (1) 32,848 31,800 Securities mandatorily measured and designated at FVTPL 72,845 62,693
$ 155,122 $ 149,046
(1) There were no sales of securities measured at amortized cost during the quarter (October 31, 2020: nil).
Fair value of debt securities measured and equity securities designated at FVOCI
$ millions, as at
2021 Apr. 30
2020 Oct. 31
Amortized cost (1)
Gross unrealized
gains
Gross unrealized
losses Fair
value Amortized
cost (1)
Gross unrealized
gains
Gross unrealized
losses Fair
value
Securities issued or guaranteed by: Canadian federal government $ 9,498 $ 38 $ (1) $ 9,535 $ 11,379 $ 32 $ (2) $ 11,409 Other Canadian governments 12,998 143 (1) 13,140 15,187 128 – 15,315 U.S. Treasury and agencies 10,884 40 (1) 10,923 12,533 63 – 12,596 Other foreign governments 5,922 33 (3) 5,952 5,825 38 (2) 5,861
Mortgage-backed securities 1,845 38 – 1,883 2,320 49 (1) 2,368 Asset-backed securities 395 – (1) 394 197 – (2) 195 Corporate debt 6,898 21 (2) 6,917 6,194 31 (1) 6,224
48,440 313 (9) 48,744 53,635 341 (8) 53,968
Corporate public equity (2) 67 28 – 95 30 15 (3) 42 Corporate private equity 556 68 (34) 590 546 43 (46) 543
623 96 (34) 685 576 58 (49) 585
$ 49,063 $ 409 $ (43) $ 49,429 $ 54,211 $ 399 $ (57) $ 54,553
(1) Net of allowance for credit losses for debt securities measured at FVOCI of $18 million (October 31, 2020: $22 million).
(2) Includes restricted stock.
The fair value of equity securities designated at FVOCI that were disposed of during the three months ended April 30, 2021 was nil ($7 million and nil for
the three months ended January 31, 2021 and April 30, 2020, respectively) and $7 million for the six months ended April 30, 2021 (April 30, 2020: nil).
Net realized cumulative after-tax gains resulting from dispositions of equity securities designated at FVOCI and return on capital distributions from
limited partnerships designated at FVOCI of $1 million were reclassified from AOCI to retained earnings for the three months ended April 30, 2021
($3 million and $2 million for the three months ended January 31, 2021 and April 30, 2020, respectively) and $4 million for the six months ended April 30,
2021 (April 30, 2020: $31 million).
Dividend income recognized on equity securities designated at FVOCI that were still held as at April 30, 2021 was $1 million ($1 million and
$1 million for the three months ended January 31, 2021 and April 30, 2020, respectively) and $2 million for the six months ended April 30, 2021 (April 30,
2020: $5 million). Dividend income recognized on equity securities designated at FVOCI that were disposed of as at April 30, 2021 was nil (nil and nil for
the three months ended January 31, 2021 and April 30, 2020, respectively) and nil for the six months ended April 30, 2021 (April 30, 2020: nil).
52 CIBC SECOND QUARTER 2021

Allowance for credit losses
The following table provides a reconciliation of the opening balance to the closing balance of the ECL allowance for debt securities measured at FVOCI:
$ millions, as at or for the three months ended
Stage 1 Stage 2 Stage 3
Collective provision 12-month ECL
performing
Collective provision lifetime ECL performing
Collective and individual provision
lifetime ECL credit-impaired Total
2021 Apr. 30
Debt securities measured at FVOCI Balance at beginning of period $ 1 $ 3 $ – $ 20
Provision for (reversal of) credit losses (1) (2) 1 – (1) Write-offs
7
– – – – Foreign exchange and other (1) – – (1)
Balance at end of period $ 14 $ 4 $ – $ 18
2021 Jan. 31
Debt securities measured at FVOCI Balance at beginning of period $ 18 $ 4 $ – $ 22
Provision for (reversal of) credit losses (1) (1) (1) – (2) Write-offs – – – – Foreign exchange and other – – – –
Balance at end of period $ 17 $ 3 $ – $ 20
2020 Apr. 30
Debt securities measured at FVOCI Balance at beginning of period $ 14 $ 2 $ 6 $ 22
Provision for (reversal of) credit losses (1)(2) 5 4 – 9 Write-offs – – – – Foreign exchange and other – – 1 1
Balance at end of period $ 19 $ 6 $ 7 $ 32
(1) Included in gains (losses) from debt securities measured at FVOCI and amortized cost, net on our interim consolidated statement of income.
(2) Excludes stage 3 provisions for credit loss of $13 million for the three months ended April 30, 2020 for originated credit-impaired amortized cost securities that are recognized in the gains (losses)
from debt securities measured at FVOCI and amortized cost, net on our interim consolidated statement of income.
$ millions, as at or for the six months ended
Stage 1 Stage 2 Stage 3
Collective provision 12-month ECL
performing
Collective provision lifetime ECL performing
Collective and individual provision
lifetime ECL credit-impaired Total
2021 Apr. 30
Debt securities measured at FVOCI Balance at beginning of period $ 18 $ 4 $ – $ 22
Provision for (reversal of) credit losses (1) (3) –
– (3) Write-offs – – – – Foreign exchange and other (1) – – (1)
Balance at end of period $ 14 $ 4 $ – $ 18
2020 Apr. 30
Debt securities measured at FVOCI Balance at beginning of period $ 14 $ 3 $ 6 $ 23
Provision for (reversal of) credit losses (1)(2) 4 4 – 8 Write-offs – – – – Foreign exchange and other 1 (1) 1 1
Balance at end of period $ 19 $ 6 $ 7 $ 32
(1) Included in gains (losses) from debt securities measured at FVOCI and amortized cost, net on our interim consolidated statement of income.
(2) Excludes stage 3 provisions for credit loss of $13 million for the six months ended April 30, 2020 for originated credit-impaired amortized cost securities that are recognized in the gains (losses) from
debt securities measured at FVOCI and amortized cost, net on our interim consolidated statement of income.
CIBC SECOND QUARTER 2021 53

Note 6. Loans
Allowance for credit losses
The following table provides a reconciliation of the opening balance to the closing balance of the ECL allowance:
$ millions, as at or for the three months ended 2021
Apr. 30
Stage 1 Stage 2 Stage 3
Collective provision 12-month
ECL performing
Collectiveprovision
lifetimeECL
performing
Collective and individual provision
lifetime ECL credit-impaired Total
Residential mortgages Balance at beginning of period $ 52 $ 136 $ 148 $ 336
Originations net of repayments and other derecognitions 6 (2) (3) 1 Changes in model – – 16 16 Net remeasurement (1) (25) 13 28 16 Transfers (1)
– to 12-month ECL 31 (26) (5) – – to lifetime ECL performing (2) 7 (5) – – to lifetime ECL credit-impaired – (6) 6 –
Provision for (reversal of) credit losses (2) 10 (14) 37 33 Write-offs – – (6) (6) Recoveries – – 1 1 Interest income on impaired loans – – (5) (5) Foreign exchange and other (2) (3) (4) (9)
Balance at end of period $ 60 $ 119 $ 171 $ 350
Personal Balance at beginning of period $ 181 $ 535 $ 118 $ 834
Originations net of repayments and other derecognitions 11 (14) (2) (5) Changes in model (4) – (1) (5) Net remeasurement (1) (98) 49 46 (3) Transfers (1)
– to 12-month ECL 75 (73) (2) – – to lifetime ECL performing (8) 13 (5) – – to lifetime ECL credit-impaired – (15) 15 –
Provision for (reversal of) credit losses (2) (24) (40) 51 (13) Write-offs – – (70) (70) Recoveries – – 18 18 Interest income on impaired loans – – (1) (1) Foreign exchange and other (2) – (1) (3)
Balance at end of period $ 155 $ 495 $ 115 $ 765
Credit card Balance at beginning of period $ 116 $ 574 $ – $ 690
Originations net of repayments and other derecognitions – (18) – (18) Changes in model – – – – Net remeasurement (1) (45) 104 26 85 Transfers (1)
– to 12-month ECL 98 (98) – – – to lifetime ECL performing (6) 6 – – – to lifetime ECL credit-impaired – (117) 117 –
Provision for (reversal of) credit losses (2) 47 (123) 143 67 Write-offs – – (174) (174) Recoveries – – 31 31 Interest income on impaired loans – – – – Foreign exchange and other – – – –
Balance at end of period $ 163 $ 451 $ – $ 614
Business and government Balance at beginning of period $ 462 $ 623 $ 686 $ 1,771
Originations net of repayments and other derecognitions 5 (2) (3) – Changes in model – – – – Net remeasurement (1) (103) 34 14 (55) Transfers (1)
– to 12-month ECL 42 (36) (6) – – to lifetime ECL performing (22) 27 (5) – – to lifetime ECL credit-impaired (2) (13) 15 –
Provision for (reversal of) credit losses (2) (80) 10 15 (55) Write-offs – – (66) (66) Recoveries – – 5 5 Interest income on impaired loans – – (5) (5) Foreign exchange and other (12) (14) (15) (41)
Balance at end of period $ 370 $ 619 $ 620 $ 1,609
Total ECL allowance (3) $ 748 $ 1,684 $ 906 $ 3,338
Comprises: Loans $ 665 $ 1,629 $ 906 $ 3,200 Undrawn credit facilities and other off-balance sheet exposures (4) 83 55 – 138
(1) Transfers represent stage movements of prior period ECL allowances to the current period stage classification. Net remeasurement represents the current period change in ECL allowances for
transfers, net write-offs, changes in forecasts of forward-looking information, parameter updates, and partial repayments in the period.
(2) Provision for (reversal of) credit losses for loans and undrawn credit facilities and other off-balance sheet exposures is presented as Provision for (reversal of) credit losses on our interim consolidated
statement of income.
(3) See Note 5 for the ECL allowance on debt securities measured at FVOCI. The table above excludes the ECL allowance on debt securities classified at amortized cost of $15 million as at April 30,
2021 (January 31, 2021: $16 million; April 30, 2020: $15 million), $13 million of which was a stage 3 ECL allowance on originated credit-impaired amortized cost debt securities (January 31, 2021:
$13 million; April 30, 2020: $13 million). The ECL allowances for other financial assets classified at amortized cost were immaterial as at April 30, 2021 and were excluded from the table above.
Financial assets other than loans that are classified at amortized cost are presented on our interim consolidated balance sheet net of ECL allowances.
(4) Included in Other liabilities on our interim consolidated balance sheet.
(5) Includes the ECL allowance for purchased credit-impaired loans from the acquisition of The PrivateBank.
54 CIBC SECOND QUARTER 2021

$ millions, as at or for the three months ended
2021 Jan. 31
2020 Apr. 30
Stage 1 Stage 2 Stage 3 Stage 1 Stage 2 Stage 3
Collective provision 12-month
ECL performing
Collective provision
lifetime ECL
performing
Collective and individual provision
lifetime ECL credit-impaired Total
Collective provision 12-month
ECL performing
Collective provision
lifetime ECL
performing
Collective and individual provision
lifetime ECL credit-impaired Total (5)
Residential mortgages Balance at beginning of period $ 51 $ 161 $ 151 $ 363 $ 28 $ 40 $ 146 $ 214
Originations net of repayments and other derecognitions 4 (6) (4) (6) 2 (2) (5) (5) Changes in model – – – – (1) 2 – 1 Net remeasurement (1) (32) 7 22 (3) 23 35 25 83 Transfers (1)
– to 12-month ECL 33 (27) (6) – 8 (6) (2) – – to lifetime ECL performing (3) 10 (7) – (10) 14 (4) – – to lifetime ECL credit-impaired – (5) 5 – – (2) 2 –
Provision for (reversal of) credit losses (2) 2 (21) 10 (9) 22 41 16 79 Write-offs – – (6) (6) – – (3) (3) Recoveries – – 1 1 – – 1 1 Interest income on impaired loans – – (4) (4) – – (4) (4) Foreign exchange and other (1) (4) (4) (9) – 1 2 3
Balance at end of period $ 52 $ 136 $ 148 $ 336 $ 50 $ 82 $ 158 $ 290
Personal Balance at beginning of period $ 204 $ 546 $ 113 $ 863 $ 182 $ 268 $ 121 $ 571
Originations net of repayments and other derecognitions 11 (15) (2) (6) 8 (9) (4) (5) Changes in model 1 1 – 2 (44) 79 – 35 Net remeasurement (1) (110) 84 61 35 31 168 81 280 Transfers (1)
– to 12-month ECL 87 (84) (3) – 43 (42) (1) – – to lifetime ECL performing (11) 16 (5) – (35) 40 (5) – – to lifetime ECL credit-impaired – (13) 13 – – (20) 20 –
Provision for (reversal of) credit losses (2) (22) (11) 64 31 3 216 91 310 Write-offs – – (74) (74) – – (97) (97) Recoveries – – 17 17 – – 15 15 Interest income on impaired loans – – (1) (1) – – (2) (2) Foreign exchange and other (1) – (1) (2) – – 2 2
Balance at end of period $ 181 $ 535 $ 118 $ 834 $ 185 $ 484 $ 130 $ 799
Credit card Balance at beginning of period $ 136 $ 572 $ – $ 708 $ 159 $ 347 $ – $ 506
Originations net of repayments and other derecognitions (1) (26) – (27) (2) (28) – (30) Changes in model – – – – (19) 54 – 35 Net remeasurement (1) (88) 117 23 52 (7) 264 43 300 Transfers (1)
– to 12-month ECL 79 (79) – – 45 (45) – – – to lifetime ECL performing (10) 10 – – (31) 31 – – – to lifetime ECL credit-impaired – (20) 20 – – (59) 59 –
Provision for (reversal of) credit losses (2) (20) 2 43 25 (14) 217 102 305 Write-offs – – (70) (70) – – (128) (128) Recoveries – – 27 27 – – 26 26 Interest income on impaired loans – – – – – – – – Foreign exchange and other – – – – – 1 – 1
Balance at end of period $ 116 $ 574 $ – $ 690 $ 145 $ 565 $ – $ 710
Business and government Balance at beginning of period $ 453 $ 683 $ 652 $ 1,788 $ 231 $ 163 $ 393 $ 787
Originations net of repayments and other derecognitions 17 (23) (5) (11) 24 (1) (5) 18 Changes in model – – – – 14 (5) – 9 Net remeasurement (1) (62) 55 118 111 314 246 131 691 Transfers (1)
– to 12-month ECL 81 (75) (6) – 13 (11) (2) – – to lifetime ECL performing (12) 14 (2) – (131) 133 (2) – – to lifetime ECL credit-impaired (2) (12) 14 – – (12) 12 –
Provision for (reversal of) credit losses (2) 22 (41) 119 100 234 350 134 718 Write-offs – – (70) (70) – – (16) (16) Recoveries – – 3 3 – – 3 3 Interest income on impaired loans – – (6) (6) – – (3) (3) Foreign exchange and other (13) (19) (12) (44) 9 4 10 23
Balance at end of period $ 462 $ 623 $ 686 $ 1,771 $ 474 $ 517 $ 521 $ 1,512
Total ECL allowance (3) $ 811 $ 1,868 $ 952 $ 3,631 $ 854 $ 1,648 $ 809 $ 3,311
Comprises: Loans $ 724 $ 1,808 $ 952 $ 3,484 $ 704 $ 1,553 $ 807 $ 3,064 Undrawn credit facilities and other off-balance sheet exposures (4) 87 60 – 147 150 95 2 247
See previous page for footnote references.
CIBC SECOND QUARTER 2021 55

$ millions, as at or for the six months ended
2021 Apr. 30
2020 Apr. 30
Stage 1 Stage 2 Stage 3 Stage 1 Stage 2 Stage 3
Collective provision 12-month
ECL performing
Collective provision
lifetime ECL
performing
Collective and individual provision
lifetime ECL credit-impaired Total
Collective provision 12-month
ECL performing
Collective provision
lifetime ECL
performing
Collective and individual provision
lifetime ECL credit-impaired (5) Total
Residential mortgages Balance at beginning of period $ 51 $ 161 $ 151 $ 363 $ 28 $ 43 $ 140 $ 211
Originations net of repayments and other derecognitions 10 (8) (7) (5) 3 (5) (10) (12) Changes in model – – 16 16 (2) 2 – – Net remeasurement (1) (57) 20 50 13 11 42 47 100 Transfers (1)
– to 12-month ECL 64 (53) (11) – 20 (16) (4) – – to lifetime ECL performing (5) 17 (12) – (11) 19 (8) – – to lifetime ECL credit-impaired – (11) 11 – – (4) 4 –
Provision for (reversal of) credit losses (2) 12 (35) 47 24 21 38 29 88 Write-offs – – (12) (12) – – (6) (6) Recoveries – – 2 2 – – 2 2 Interest income on impaired loans – – (9) (9) – – (9) (9) Foreign exchange and other (3) (7) (8) (18) 1 1 2 4
Balance at end of period $ 60 $ 119 $ 171 $ 350 $ 50 $ 82 $ 158 $ 290
Personal Balance at beginning of period $ 204 $ 546 $ 113 $ 863 $ 174 $ 271 $ 128 $ 573
Originations net of repayments and other derecognitions 22 (29) (4) (11) 17 (22) (7) (12) Changes in model (3) 1 (1) (3) (33) 72 – 39 Net remeasurement (1) (208) 133 107 32 (40) 258 145 363 Transfers (1)
– to 12-month ECL 162 (157) (5) – 110 (107) (3) – – to lifetime ECL performing (19) 29 (10) – (43) 51 (8) – – to lifetime ECL credit-impaired – (28) 28 – – (39) 39 –
Provision for (reversal of) credit losses (2) (46) (51) 115 18 11 213 166 390 Write-offs – – (144) (144) – – (197) (197) Recoveries – – 35 35 – – 35 35 Interest income on impaired loans – – (2) (2) – – (3) (3) Foreign exchange and other (3) – (2) (5) – – 1 1
Balance at end of period $ 155 $ 495 $ 115 $ 765 $ 185 $ 484 $ 130 $ 799
Credit card Balance at beginning of period $ 136 $ 572 $ – $ 708 $ 145 $ 340 $ – $ 485
Originations net of repayments and other derecognitions (1) (44) – (45) (2) (45) – (47) Changes in model – – – – (6) 59 – 53 Net remeasurement (1) (133) 221 49 137 (84) 420 83 419 Transfers (1)
– to 12-month ECL 177 (177) – – 132 (132) – – – to lifetime ECL performing (16) 16 – – (40) 40 – – – to lifetime ECL credit-impaired – (137) 137 – – (117) 117 –
Provision for (reversal of) credit losses (2) 27 (121) 186 92 – 225 200 425 Write-offs – – (244) (244) – – (254) (254) Recoveries – – 58 58 – – 54 54 Interest income on impaired loans – – – – – – – – Foreign exchange and other – – – – – – – –
Balance at end of period $ 163 $ 451 $ – $ 614 $ 145 $ 565 $ – $ 710
Business and government Balance at beginning of period $ 453 $ 683 $ 652 $ 1,788 $ 239 $ 158 $ 378 $ 775
Originations net of repayments and other derecognitions 22 (25) (8) (11) 31 (6) (10) 15 Changes in model – – – – 14 (1) (1) 12 Net remeasurement (1) (165) 89 132 56 285 268 190 743 Transfers (1)
– to 12-month ECL 123 (111) (12) – 37 (33) (4) – – to lifetime ECL performing (34) 41 (7) – (142) 145 (3) – – to lifetime ECL credit-impaired (4) (25) 29 – – (20) 20 –
Provision for (reversal of) credit losses (2) (58) (31) 134 45 225 353 192 770 Write-offs – – (136) (136) – – (56) (56) Recoveries – – 8 8 – – 6 6 Interest income on impaired loans – – (11) (11) – – (8) (8) Foreign exchange and other (25) (33) (27) (85) 10 6 9 25
Balance at end of period $ 370 $ 619 $ 620 $ 1,609 $ 474 $ 517 $ 521 $ 1,512
Total ECL allowance (3) $ 748 $ 1,684 $ 906 $ 3,338 $ 854 $ 1,648 $ 809 $ 3,311
Comprises: Loans $ 665 $ 1,629 $ 906 $ 3,200 $ 704 $ 1,553 $ 807 $ 3,064 Undrawn credit facilities and other off-balance sheet exposures (4) 83 55 – 138 150 95 2 247
See previous page for footnote references.
56 CIBC SECOND QUARTER 2021

Inputs, assumptions and model techniques
The uncertainties inherent in the COVID-19 pandemic have increased the level of judgment applied in estimating ECLs. See Note 6 to our consolidated
financial statements in our 2020 Annual Report for more information concerning the significant estimates and credit judgment inherent in the estimation
of ECL allowances.
The forecasting of forward-looking information and the determination of scenario weightings in the COVID-19 pandemic continued to require a
heightened application of judgment in a number of areas as our forecast reflects numerous assumptions and uncertainties regarding the economic
impact of the COVID-19 pandemic. The following tables provide the base case, upside case and downside case scenario forecasts for select forward-
looking information variables used to estimate our ECL.
As at April 30, 2021
Base case Upside case Downside case
Average value over
the next 12 months
Average value over
the remaining forecast period (1)
Average value over
the next 12 months
Average value over
the remaining forecast period (1)
Average value over
the next 12 months
Average value over
the remaining forecast period (1)
Real GDP year-over-year growth
Canada (2) 5.3 % 2.5 % 7.0 % 3.3 % 3.4 % 1.7 %
United States 5.6 % 2.8 % 7.2 % 3.9 % 2.2 % 1.0 %
Unemployment rate
Canada (2) 7.2 % 6.1 % 6.7 % 5.4 % 8.4 % 7.0 %
United States 4.9 % 4.0 % 4.4 % 3.3 % 7.1 % 6.3 %
Canadian Housing Price Index growth (2) 4.7 % 4.0 % 8.5 % 5.6 % (2.8) % 1.4 %
Standard and Poor’s (S&P) 500 Index growth rate 5.0 % 5.0 % 10.7 % 8.8 % (7.2) % (5.8) %
West Texas Intermediate Oil Price (US$) $ 59 $ 61 $ 70 $ 75 $ 46 $ 48
As at January 31, 2021
Base case Upside case Downside case
Average value over
the next 12 months
Average value over
the remaining forecast period (1)
Average value over
the next 12 months
Average value over
the remaining forecast period (1)
Average value over
the next 12 months
Average value over
the remaining forecast period (1)
Real GDP year-over-year growth
Canada (2) 4.0 % 3.9 % 6.0 % 4.4 % 2.5 % 2.1 %
United States 4.1 % 3.2 % 5.8 % 4.5 % 1.8 % 1.9 %
Unemployment rate
Canada (2) 7.8 % 6.1 % 7.3 % 5.7 % 8.6 % 7.4 %
United States 5.9 % 4.1 % 4.5 % 3.4 % 7.4 % 5.8 %
Canadian Housing Price Index growth (2) 1.5 % 3.2 % 12.2 % 10.2 % (9.9)% 0.3 %
S&P 500 Index growth rate 5.0 % 5.0 % 13.0 % 10.8 % (5.5)% (2.9)%
West Texas Intermediate Oil Price (US$) $ 50 $ 55 $ 54 $ 62 $ 41 $ 46
As at October 31, 2020
Base case Upside case Downside case
Average value over
the next 12 months
Average value over
the remaining forecast period (1)
Average value over
the next 12 months
Average value over
the remaining forecast period (1)
Average value over
the next 12 months
Average value over
the remaining forecast period (1)
Real GDP year-over-year growth
Canada (2) 1.6 % 3.8 % 3.6 % 4.6 % 0.03 % 2.0 %
United States 1.7 % 3.5 % 3.0 % 4.2 % (0.6)% 1.7 %
Unemployment rate
Canada (2) 8.7 % 6.7 % 7.4 % 5.9 % 9.5 % 8.4 %
United States 7.4 % 4.7 % 5.1 % 3.5 % 9.2 % 7.3 %
Canadian Housing Price Index growth (2) 2.4 % 3.0 % 11.2 % 10.4 % (6.9)% (0.8)%
S&P 500 Index growth rate 5.6 % 4.8 % 11.2 % 7.7 % (3.5)% (5.3)%
West Texas Intermediate Oil Price (US$) $ 42 $ 53 $ 51 $ 60 $ 34 $ 39
(1) The remaining forecast period is generally two to four years.
(2) National-level forward-looking forecasts are presented in the table above, which represent the aggregation of the provincial-level forecasts used to estimate our ECL. Housing Price Index growth rates
are also forecasted at the municipal level in some cases. As a result, the forecasts for individual provinces or municipalities reflected in our ECL will differ from the national forecasts presented above.
As required, the forward-looking information used to estimate ECLs reflects our expectations as at April 30, 2021, January 31, 2021 and October 31,
2020, respectively, and does not reflect changes in expectation as a result of economic forecasts that may have subsequently emerged. The base case,
upside case and downside case amounts shown represent the average value of the forecasts over the respective projection horizons. Our economic
forecasts are made in the context of the recovery currently underway from the severe downturn experienced in the second calendar quarter of 2020. As
at April 30, 2021, our underlying base case projection for Canada is characterized by a deceleration in economic activity and a brief rise in the
unemployment rate in the second calendar quarter of 2021 due to temporary restrictions on activity in response to the current wave of infections and the
new variants, followed by faster growth in the second half of 2021 as our outlook assumes that effective mass vaccinations will be underway over the
spring and summer and that the vaccination programs will be able to effectively respond to the emerging variants. Our base case projection assumes
that economic activity will return to pre-COVID-19 levels in Canada just before the end of calendar year 2021, and that the unemployment rate will reach
pre-pandemic levels in mid-2022. Due to the faster rollout of mass vaccinations in the U.S. relative to Canada, our base case assumes that the U.S. will
experience full economic recovery before Canada.
While vaccination of targeted groups have commenced across much of the world, uncertainty remains about how quickly a large enough majority of the
population can be effectively immunized to reduce subsequent rates of infection, including in response to emerging variants of the virus. The downside
case forecast still reflects a recovery from the severe low experienced in the second calendar quarter of 2020, but to a much lower level of sustained
economic activity. Meanwhile, the upside scenario continues to reflect a quicker recovery with the pre-pandemic level of activity reached in the third
calendar quarter of 2021.
CIBC SECOND QUARTER 2021 57

While there has been a modest overall improvement in our outlook over the past six months, the improvement relative to the October 31, 2020 forecast is
not as significant as implied by the annualized forecasts above as a result of the current period’s forecast being less impacted by the more significant
downturn experienced in 2020.
The graphs below compare the actual and forecasted base case real GDP levels in Canada and the U.S. on a calendar quarter basis to the forecasts
from the first quarter of 2021 for the forecasted periods through 2022:
Q1-
2020
Q2-
2020
Q3-
2020
Q4-
2020
Q1-
2021
Q2-
2021
Q3-
2021
Q4-
2021
Q1-
2022
Q2-
2022
Q3-
2022
Q4-
2022
Q1-
2020
Q2-
2020
Q3-
2020
Q4-
2020
Q1-
2021
Q2-
2021
Q3-
2021
Q4-
2021
Q1-
2022
Q2-
2022
Q3-
2022
Q4-
2022
Canadian Real GDP
(Millions of Chained 2012 Canadian Dollars)
2,250,000
2,200,000
2,150,000
2,100,000
2,050,000
2,000,000
1,950,000
1,900,000
1,850,000
1,800,000
Projection as at Q2 2021 Projection as at Q1 2021 Actual Canadian Real GDP
U.S. Real GDP
(Millions of Chained 2012 U.S. Dollars)
21,000,000
20,500,000
20,000,000
19,500,000
19,000,000
18,500,000
18,000,000
17,500,000
17,000,000
Projection as at Q2 2021 Projection as at Q1 2021 Actual US Real GDP
As indicated above, forecasting forward-looking information for multiple scenarios and determining the probability weighting of the scenarios involves a
high degree of management judgment, particularly in light of the COVID-19 pandemic. Assumptions concerning the timing and effectiveness of mass
vaccination programs to control the spread of COVID-19 and its variants such that severe restrictions will no longer need to be imposed by governments
to limit the impact of subsequent waves of infection, are material to these forecasts.
If we were to only use our base case scenario for the measurement of ECL for our performing loans, our ECL allowance would be $262 million lower than
the recognized ECL as at April 30, 2021 (October 31, 2020: $204 million). If we were to only use our downside case scenario for the measurement of
ECL for our performing loans, our ECL allowance would be $615 million higher than the recognized ECL as at April 30, 2021 (October 31, 2020:
$938 million). This sensitivity is isolated to the measurement of ECL and therefore did not consider changes in the migration of exposures between stage
1 and stage 2 from the determination of the significant increase in credit risk that would have resulted in a 100% base case scenario or a 100%
downside case scenario. As a result, our ECL allowance on performing loans could exceed the amount implied by the 100% downside case scenario
from the migration of additional exposures from stage 1 to stage 2. Actual credit losses could differ materially from those reflected in our estimates.
58 CIBC SECOND QUARTER 2021

The following tables provide the gross carrying amount of loans, and the contractual amounts of undrawn credit facilities and other off-balance sheet
exposures based on the application of our 12-month point-in-time probability of default (PD) under IFRS 9 to our risk management PD bands for retail
exposures, and based on our internal risk ratings for business and government exposures. Refer to the “Credit risk” section of our 2020 Annual Report
for details on the CIBC risk categories.
Loans(1)
$ millions, as at 2021
Apr. 30 2020
Oct. 31
Stage 1 Stage 2 Stage 3 (2) Total Stage 1 Stage 2 Stage 3 (2) Total
Residential mortgages
– Exceptionally low $ 159,840 $ 4 $ – $ 159,844 $ 146,139 $ 2 $ – $ 146,141
– Very low 46,632 1,939 – 48,571 45,678 1,166 – 46,844
– Low 10,724 6,253 – 16,977 12,491 6,042 – 18,533
– Medium 190 5,039 – 5,229 232 4,924 – 5,156
– High 122 793 – 915 – 1,054 – 1,054
– Default – – 590 590 – – 654 654
– Not rated 1,890 562 169 2,621 1,810 818 155 2,783
Gross residential mortgages (3)(4) 219,398 14,590 759 234,747 206,350 14,006 809 221,165
ECL allowance 60 119 171 350 51 161 151 363
Net residential mortgages 219,338 14,471 588 234,397 206,299 13,845 658 220,802
Personal
– Exceptionally low 21,020 – – 21,020 23,302 – – 23,302
– Very low 3,974 151 – 4,125 1,618 157 – 1,775
– Low 8,993 2,305 – 11,298 8,662 2,497 – 11,159
– Medium 1,559 2,447 – 4,006 1,265 2,768 – 4,033
– High 280 826 – 1,106 331 769 – 1,100
– Default – – 138 138 – – 140 140
– Not rated 529 103 46 678 513 159 41 713
Gross personal (4) 36,355 5,832 184 42,371 35,691 6,350 181 42,222
ECL allowance 134 491 115 740 179 540 113 832
Net personal 36,221 5,341 69 41,631 35,512 5,810 68 41,390
Credit card
– Exceptionally low 3,279 – – 3,279 3,285 – – 3,285
– Very low 1,344 – – 1,344 1,388 – – 1,388
– Low 2,199 – – 2,199 2,340 – – 2,340
– Medium 2,022 1,327 – 3,349 1,778 1,973 – 3,751
– High – 333 – 333 – 472 – 472
– Default – – – – – – – –
– Not rated 116 13 – 129 135 18 – 153
Gross credit card 8,960 1,673 – 10,633 8,926 2,463 – 11,389
ECL allowance 153 432 – 585 125 542 – 667
Net credit card 8,807 1,241 – 10,048 8,801 1,921 – 10,722
Business and government (5)
– Investment grade 56,264 407 – 56,671 50,691 307 – 50,998
– Non-investment grade 81,132 5,059 – 86,191 80,471 7,319 – 87,790
– Watchlist 164 2,949 – 3,113 447 4,291 – 4,738
– Default – – 1,391 1,391 – – 1,359 1,359
– Not rated 159 44 – 203 218 49 – 267
Gross business and government (3)(6) 137,719 8,459 1,391 147,569 131,827 11,966 1,359 145,152
ECL allowance 318 587 620 1,525 380 648 650 1,678
Net business and government 137,401 7,872 771 146,044 131,447 11,318 709 143,474
Total net amount of loans $ 401,767 $ 28,925 $ 1,428 $ 432,120 $ 382,059 $ 32,894 $ 1,435 $ 416,388
(1) The table excludes debt securities measured at FVOCI, for which ECL allowances of $18 million (October 31, 2020: $22 million) were recognized in AOCI. In addition, the table excludes debt
securities classified at amortized cost, for which ECL allowances of $15 million were recognized as at April 30, 2021 (October 31, 2020: $16 million), $13 million of which was stage 3 ECL allowance
on originated credit-impaired amortized cost debt securities (October 31, 2020: $14 million). Other financial assets classified at amortized cost were also excluded from the table above as their ECL
allowances were immaterial as at April 30, 2021 and October 31, 2020. Financial assets other than loans that are classified as amortized cost are presented on our interim consolidated balance sheet
net of ECL allowances.
(2) Excludes foreclosed assets of $22 million (October 31, 2020: $23 million) which were included in Other assets on our interim consolidated balance sheet.
(3) Includes $29 million (October 31, 2020: $63 million) of residential mortgages and $23,116 million (October 31, 2020: $23,291 million) of business and government loans that are measured at FVTPL.
(4) The internal risk rating grades presented for residential mortgages and certain personal loans do not take into account loan guarantees or insurance issued by the Canadian government (federal or
provincial), Canadian government agencies, or private insurers, as the determination of whether a significant increase in credit risk has occurred for these loans is based on relative changes in the
loans’ lifetime PD without considering collateral or other credit enhancements.
(5) Certain prior period amounts were restated.
(6) Includes customers’ liability under acceptances of $11,002 million (October 31, 2020: $9,606 million).
CIBC SECOND QUARTER 2021 59

Undrawn credit facilities and other off-balance sheet exposures
$ millions, as at
2021 Apr. 30
2020 Oct. 31
Stage 1 Stage 2 Stage 3 Total Stage 1 Stage 2 Stage 3 Total
Retail
– Exceptionally low $ 132,460 $ 4 $ – $ 132,464 $ 124,690 $ 8 $ – $ 124,698
– Very low 7,354 137 – 7,491 6,632 137 – 6,769
– Low 8,712 497 – 9,209 8,703 416 – 9,119
– Medium 906 597 – 1,503 909 692 – 1,601
– High 96 435 – 531 263 503 – 766
– Default – – 30 30 – – 28 28
– Not rated 393 13 – 406 411 23 – 434
Gross retail 149,921 1,683 30 151,634 141,608 1,779 28 143,415
ECL allowance 31 23 – 54 36 36 – 72
Net retail 149,890 1,660 30 151,580 141,572 1,743 28 143,343
Business and government (1)
– Investment grade 97,809 117 – 97,926 89,883 149 – 90,032
– Non-investment grade 56,261 2,144 – 58,405 55,910 3,679 – 59,589
– Watchlist 15 1,118 – 1,133 91 1,665 – 1,756
– Default – – 119 119 – – 129 129
– Not rated 556 26 – 582 795 41 – 836
Gross business and government 154,641 3,405 119 158,165 146,679 5,534 129 152,342
ECL allowance 52 32 – 84 73 35 2 110
Net business and government 154,589 3,373 119 158,081 146,606 5,499 127 152,232
Total net undrawn credit facilities and other
off-balance sheet exposures $ 304,479 $ 5,033 $ 149 $ 309,661 $ 288,178 $ 7,242 $ 155 $ 295,575
(1) Certain prior period amounts were restated.
Note 7. Deposits(1)(2)
$ millions, as at
2021 Apr. 30
2020 Oct. 31
Payable on demand (3)
Payable after notice (4)
Payable on a fixed date (5)(6) Total Total
Personal $ 15,493 $ 139,262 $ 52,273 $ 207,028 $ 202,152 Business and government (7) 90,153 76,422 146,626 313,201 311,426 Bank 9,095 477 7,568 17,140 17,011 Secured borrowings (8) – – 39,194 39,194 40,151
$ 114,741 $ 216,161 $ 245,661 $ 576,563 $ 570,740
Comprised of: Held at amortized cost $ 559,454 $ 557,321 Designated at fair value 17,109 13,419
$ 576,563 $ 570,740
Total deposits include (9): Non-interest-bearing deposits
Canada $ 80,976 $ 71,122 U.S. 13,779 13,833 Other international 5,098 5,798
Interest-bearing deposits Canada 380,765 389,439 U.S. 71,960 66,399 Other international 23,985 24,149
$ 576,563 $ 570,740
(1) Includes deposits of $195.6 billion (October 31, 2020: $185.2 billion) denominated in U.S. dollars and deposits of $30.9 billion (October 31, 2020: $30.2 billion) denominated in other foreign
currencies.
(2) Net of purchased notes of $3.7 billion (October 31, 2020: $3.1 billion).
(3) Includes all deposits for which we do not have the right to require notice of withdrawal. These deposits are generally chequing accounts.
(4) Includes all deposits for which we can legally require notice of withdrawal. These deposits are generally savings accounts.
(5) Includes all deposits that mature on a specified date. These deposits are generally term deposits, guaranteed investment certificates, and similar instruments.
(6) Includes $23.9 billion (October 31, 2020: $19.9 billion) of deposits which are subject to the bank recapitalization (bail-in) conversion regulations issued by the Department of Finance Canada. These
regulations provide certain statutory powers to the Canada Deposit Insurance Corporation (CDIC), including the ability to convert specified eligible shares and liabilities of CIBC into common shares
in the event that CIBC is determined to be non-viable.
(7) Includes $301 million (October 31, 2020: $303 million) of Notes issued to CIBC Capital Trust.
(8) Comprises liabilities issued by, or as a result of, activities associated with the securitization of residential mortgages, covered bond programme, and consolidated securitization vehicles.
(9) Classification is based on geographical location of the CIBC office.
Note 8. Subordinated indebtedness
On January 26, 2021, we redeemed all $1.0 billion of our 3.42% Debentures due January 26, 2026. In accordance with their terms, the Debentures
were redeemed at 100% of their principal amount, plus accrued and unpaid interest thereon.
On April 19, 2021, we issued $1.0 billion principal amount of 1.96% Debentures due April 21, 2031 (subordinated indebtedness). The Debentures
bear interest at a fixed rate of 1.96% per annum (paid semi-annually) until April 21, 2026, and at three-month CDOR plus 0.56% per annum (paid
quarterly) thereafter until maturity on April 21, 2031.
60 CIBC SECOND QUARTER 2021

Note 9. Share capital
Common shares
$ millions, except number of shares
For the three
months ended
For the six
months ended
2021
Apr. 30
2021
Jan. 31
2020
Apr. 30
2021
Apr. 30
2020
Apr. 30
Number
of shares Amount
Number
of shares Amount
Number
of shares Amount
Number
of shares Amount
Number
of shares Amount
Balance at beginning of period 447,849,605 $ 13,991 447,085,329 $ 13,908 444,981,533 $ 13,669 447,085,329 $ 13,908 445,341,675 $ 13,591
Issuance pursuant to:
Equity-settled share-based
compensation plans (1) 643,481 66 294,626 29 71,409 8 938,107 95 546,357 59
Shareholder investment plan 259,931 33 294,164 32 454,791 36 554,095 65 788,795 72
Employee share purchase plan 309,137 37 346,076 38 376,684 34 655,213 75 700,963 70
449,062,154 $ 14,127 448,020,195 $ 14,007 445,884,417 $ 13,747 449,232,744 $ 14,143 447,377,790 $ 13,792
Purchase of common shares for
cancellation – – – – (710,800) (22) – – (2,208,600) (68)
Treasury shares 30,972 3 (170,590) (16) (40,261) (3) (139,618) (13) (35,834) (2)
Balance at end of period 449,093,126 $ 14,130 447,849,605 $ 13,991 445,133,356 $ 13,722 449,093,126 $ 14,130 445,133,356 $ 13,722
(1) Includes the settlement of contingent consideration related to prior acquisitions.
Regulatory capital and leverage ratios
Our capital ratios and leverage ratio are presented in the table below:
$ millions, as at
2021
Apr. 30
2020
Oct. 31
Common Equity Tier 1 (CET1) capital (1) $ 31,915 $ 30,876
Tier 1 capital A 35,759 34,775
Total capital 41,826 40,969
Total risk-weighted assets (RWA) 257,997 254,871
CET1 ratio 12.4 % 12.1 %
Tier 1 capital ratio 13.9 % 13.6 %
Total capital ratio 16.2 % 16.1 %
Leverage ratio exposure (2) B $ 767,391 $ 741,760
Leverage ratio A/B 4.7 % 4.7 %
(1) Includes the impact of the ECL transitional arrangement announced by OSFI on March 27, 2020. The transitional arrangement results in a portion of ECL allowances that would otherwise be included
in Tier 2 capital qualifying for inclusion in CET1 capital. The amount is subject to certain adjustments and limitations until fiscal 2022.
(2) Includes the impact of regulatory flexibility provided by OSFI in respect of exposures arising from central bank reserves and sovereign-issued securities that qualify as high quality liquid assets. The
treatment specified by OSFI permits these items to be excluded from the leverage ratio exposure measure.
Our regulatory capital requirements are determined in accordance with guidelines issued by OSFI, which are based upon the capital standards
developed by the Basel Committee on Banking Supervision.
CIBC has been designated by OSFI as a domestic systemically important bank (D-SIB) in Canada, and is subject to a CET1 surcharge equal to
1.0% of RWA. OSFI also currently expects D-SIBs to hold a 1.0% Domestic Stability Buffer (DSB). This results in current targets, including all buffer
requirements, for CET1, Tier 1 and Total capital ratios of 9.0%, 10.5%, and 12.5%, respectively. These targets may be higher for certain institutions at
OSFI’s discretion.
During the quarter ended April 30, 2021, we have complied with OSFI’s regulatory capital requirements.
Note 10. Post-employment benefits
The following tables provide details on the post-employment benefit expense recognized in the interim consolidated statement of income and on the
remeasurements recognized in the interim consolidated statement of comprehensive income:
Defined benefit plan expense
$ millions
For the three months ended
For the six months ended
2021 Apr. 30
2021 Jan. 31
2020 Apr. 30
2021 Apr. 30
2021 Jan. 31
2020 Apr. 30
2021 Apr. 30
2020 Apr. 30
2021 Apr. 30
2020 Apr. 30
Pension plansOther
post-employment plans Pension plans Other
post-employment plans
Current service cost $ 70 $ 71 $ 70 $ 2 $ 2 $ 4 $ 141 $ 138 $ 4 $ 7
Past service cost (1) – – – – – – – (32) – (1)
Net interest (income) expense (4) (4) (2) 4 4 5 (8) (5) 8 10
Special termination benefits (1) – – – – – – – 9 – –
Plan administration costs 2 2 2 – – – 4 4 – –
Net defined benefit plan expense
recognized in net income $ 68 $ 69 $ 70 $ 6 $ 6 $ 9 $ 137 $ 114 $ 12 $ 16
(1) Includes amounts related to the restructuring recognized in 2020.
CIBC SECOND QUARTER 2021 61

Defined contribution plan expense
$ millions
For the three months ended
For the six months ended
2021 Apr. 30
2021 Jan. 31
2020 Apr. 30
2021 Apr. 30
2020 Apr. 30
Defined contribution pension plans $ 13 $ 11 $ 8 $ 24 $ 17
Government pension plans (1)
38 36 37 74 72
Total defined contribution plan expense $ 51 $ 47 $ 45 $ 98 $ 89
(1) Includes Canada Pension Plan, Quebec Pension Plan, and U.S. Federal Insurance Contributions Act.
Remeasurement of employee defined benefit plans(1)
$ millions
For the three months ended
For the six months ended
2021 Apr. 30
2021 Jan. 31
2020 Apr. 30
2021 Apr. 30
2021 Jan. 31
2020 Apr. 30
2021 Apr. 30
2020 Apr. 30
2021 Apr. 30
2020 Apr. 30
Pension plans Other
post-employment plans Pension plans Other
post-employment plans
Net actuarial gains (losses) on defined benefit obligation $ 674 $ 60 $ 487 $ 37 $ 3 $ 30 $ 734 $ 59 $ 40 $ 1
Net actuarial gains (losses) on plan assets (267) 207 (178) – – – (60) 137 – –
Changes in asset ceiling excluding interest income – – (3) – – – – (2) – –
Net remeasurement gains (losses) recognized in OCI $ 407 $ 267 $ 306 $ 37 $ 3 $ 30 $ 674 $ 194 $ 40 $ 1
(1) The Canadian post-employment defined benefit plans are remeasured on a quarterly basis for changes in the discount rate and for actual asset returns. All other Canadian plans’ actuarial
assumptions and foreign plans’ actuarial assumptions are updated at least annually.
Note 11. Income taxes
Enron
In prior years, the Canada Revenue Agency (CRA) issued reassessments disallowing the deduction of Enron settlement payments and related legal
expenses (the “Enron expenses”). In January 2019, CIBC entered into a settlement agreement (the “Agreement”) with the CRA that provides certainty
with respect to the portion of the Enron expenses deductible in Canada. The Agreement resulted in the recognition of a net $38 million tax recovery in
the first quarter of 2019. This recovery was determined after taking into account taxable refund interest in Canada and also the portion of the Enron
expenses that are expected to be deductible in the United States (the “U.S. deduction”). The U.S. deduction has not been agreed to by the Internal
Revenue Service. It is possible that adjustments may be required to the amount of tax benefits recognized in the U.S.
Dividend Received Deduction
The CRA has reassessed CIBC approximately $1,115 million of additional income tax by denying the tax deductibility of certain 2011 to 2015 Canadian
corporate dividends on the basis that they were part of a “dividend rental arrangement”. In addition, the CRA has proposed to reassess $305 million for
2016. The dividends that were subject to the reassessments and proposed reassessment for 2016 are similar to those prospectively addressed by the
rules in the 2015 and 2018 Canadian federal budgets. It is possible that subsequent years may be reassessed for similar activities. CIBC is confident
that its tax filing positions were appropriate and intends to defend itself vigorously. Accordingly, no amounts have been accrued in the interim
consolidated financial statements.
Note 12. Earnings per share
$ millions, except number of shares and per share amounts
For the three
months ended
For the six
months ended
2021
Apr. 30
2021
Jan. 31
2020
Apr. 30
2021
Apr. 30
2020
Apr. 30
Basic earnings per share Net income attributable to equity shareholders $ 1,647 $ 1,621 $ 400 $ 3,268 $ 1,605 Less: Preferred share dividends and distributions on other equity instruments 51 30 30 81 61
Net income attributable to common shareholders $ 1,596 $ 1,591 $ 370 $ 3,187 $ 1,544
Weighted-average common shares outstanding (thousands) 448,455 447,281 444,739 447,859 444,997
Basic earnings per share $ 3.56 $ 3.56 $ 0.83 $ 7.12 $ 3.47
Diluted earnings per share Net income attributable to common shareholders $ 1,596 $ 1,591 $ 370 $ 3,187 $ 1,544
Weighted-average common shares outstanding (thousands) 448,455 447,281 444,739 447,859 444,997 Add: Stock options potentially exercisable (1) (thousands) 796 502 302 628 439 Add: Equity-settled consideration (thousands) 94 146 147 134 174
Weighted-average diluted common shares outstanding (thousands) 449,345 447,929 445,188 448,621 445,610
Diluted earnings per share $ 3.55 $ 3.55 $ 0.83 $ 7.10 $ 3.46
(1) Excludes average options outstanding of nil (January 31, 2021: 3,840,348; April 30, 2020: 4,839,980) with a weighted-average exercise price of nil (January 31, 2021: $112.71; April 30, 2020:
$108.08) for the quarter ended April 30, 2021, and average options outstanding of 737,167 (April 30, 2020: 3,681,010) with a weighted-average price of $120.02 (April 30, 2020: $111.56) for the six
months ended April 30, 2021, as the options’ exercise prices were greater than the average market price of CIBC’s common shares.
62 CIBC SECOND QUARTER 2021

Note 13. Contingent liabilities and provisions
Legal proceedings and other contingencies
In the ordinary course of its business, CIBC is a party to a number of legal proceedings, including regulatory investigations, in which claims for
substantial monetary damages are asserted against CIBC and its subsidiaries. Legal provisions are established if, in the opinion of management, it is
both probable that an outflow of economic benefits will be required to resolve the matter, and a reliable estimate can be made of the amount of the
obligation. If the reliable estimate of probable loss involves a range of potential outcomes within which a specific amount appears to be a better
estimate, that amount is accrued. If no specific amount within the range of potential outcomes appears to be a better estimate than any other amount, the
mid-point in the range is accrued. In some instances, however, it is not possible either to determine whether an obligation is probable or to reliably
estimate the amount of loss, in which case no accrual can be made.
While there is inherent difficulty in predicting the outcome of legal proceedings, based on current knowledge and in consultation with legal counsel,
we do not expect the outcome of these matters, individually or in aggregate, to have a material adverse effect on our interim consolidated financial
statements. However, the outcome of these matters, individually or in aggregate, may be material to our operating results for a particular reporting
period. We regularly assess the adequacy of CIBC’s litigation accruals and make the necessary adjustments to incorporate new information as it
becomes available.
The provisions disclosed in Note 22 to the consolidated financial statements included in our 2020 Annual Report included all of CIBC’s accruals for
legal matters as at that date, including amounts related to the significant legal proceedings described in that note and to other legal matters.
CIBC considers losses to be reasonably possible when they are neither probable nor remote. It is reasonably possible that CIBC may incur losses
in addition to the amounts recorded when the loss accrued is the mid-point of a range of reasonably possible losses, or the potential loss pertains to a
matter in which an unfavourable outcome is reasonably possible but not probable.
CIBC believes the estimate of the aggregate range of reasonably possible losses, in excess of the amounts accrued, for its significant legal
proceedings, where it is possible to make such an estimate, is from nil to approximately $1.2 billion as at April 30, 2021. This estimated aggregate range
of reasonably possible losses is based upon currently available information for those significant proceedings in which CIBC is involved, taking into
account CIBC’s best estimate of such losses for those cases for which an estimate can be made. CIBC’s estimate involves significant judgment, given
the varying stages of the proceedings and the existence of multiple defendants in many of such proceedings whose share of the liability has yet to be
determined. The range does not include potential punitive damages and interest. The matters underlying the estimated range as at April 30, 2021,
consist of the significant legal matters disclosed in Note 22 to the consolidated financial statements included in our 2020 Annual Report as updated
below. The matters underlying the estimated range will change from time to time, and actual losses may vary significantly from the current estimate. For
certain matters, CIBC does not believe that an estimate can currently be made as many of them are in preliminary stages and certain matters have no
specific amount claimed. Consequently, these matters are not included in the range.
The following developments related to our significant legal proceedings occurred since the issuance of our 2020 annual consolidated financial
statements:
� Credit card class actions – Interchange fees litigation: Five of the seven actions have been settled subject to court approval and the remaining two
actions will be stayed. CIBC will contribute towards a proposed settlement.
� Pilon v. Amex Bank of Canada, et al.: The plaintiff’s appeal of the decision denying certification was heard in February 2021. In March 2021, the
court dismissed the plaintiff’s appeal. In May 2021, the plaintiff filed a motion seeking leave to appeal to the Supreme Court of Canada.
� Simplii privacy class actions: The Bannister and Steinman actions have been settled subject to court approval. Pursuant to the proposed
settlement, CIBC will pay $2 million to settle these actions. In April 2021, the court approved the proposed settlement.
� Order Execution Only class actions: The certification motion in Frayce is scheduled for August 2022, and the Michaud action has been stayed.
� Pope v. CIBC and CIBC Trust: In December 2020, CIBC Asset Management Inc. was added as a defendant. The certification motion is scheduled
for August 2021.
� Fresco v. Canadian Imperial Bank of Commerce: The Court of Appeal hearing is scheduled for September 2021.
� Salko v. CIBC Investor Services Inc. et al: In March 2021, a proposed class action was commenced in Quebec against CIBC Investor Services Inc.
and several other financial institutions. The plaintiff subsequently added CIBC World Markets Inc. and additional financial institutions as defendants.
The action seeks the reimbursement of currency conversion fees alleged to have been unlawfully charged to class members and concealed by the
defendants, as well as exemplary and punitive damages. The plaintiff seeks reimbursement of fees charged to clients since March 15, 2018, as well
as punitive damages in the amount of 5% of the total sum of fees charged to class members, plus interest.
� The RRSP of J.T.G v. Her Majesty The Queen: CIBC Trust Corporation is the trustee of a self-directed RRSP that has been the subject of
proceedings in the Tax Court of Canada. The proceedings arise from appeals of tax assessments made by the Minister of National Revenue
against the RRSP for the 2004 to 2009 taxation years under Parts I and XI.1 of the Income Tax Act (Canada). At the time they were made in March
2013, the Part I assessment amounted to approximately $139 million and the Part XI.1 reassessment totalled approximately $144 million, in each
case including all taxes, penalties and interest. In April 2021, the Tax Court of Canada released a decision allowing the appeal in part of the
assessment under Part I and dismissing the appeal of the reassessment under Part XI.1. The RRSP has appealed this decision to the Federal Court
of Appeal. To the extent there is a shortfall in the RRSP’s ability to satisfy any of the Part XI.1 reassessment that may be upheld by the courts, CIBC
Trust may be liable to pay a portion of that reassessment.
Other than the items described above, there are no significant developments in the matters identified in Note 22 to the consolidated financial statements
included in our 2020 Annual Report, and no new significant legal proceedings have arisen since the issuance of our 2020 annual consolidated financial
statements.
CIBC SECOND QUARTER 2021 63

Note 14. Interest income and expense
The table below provides the consolidated interest income and expense by accounting categories.
$ millions
For the three
months ended
For the six
months ended
2021
Apr. 30
2021
Jan. 31
2020
Apr. 30
2021
Apr. 30
2020
Apr. 30
Interest
income
Interest
expense
Interest
income
Interest
expense
Interest
income
Interest
expense
Interest
income
Interest
expense
Interest
income
Interest
expense
Measured at amortized cost (1) $ 3,098 $ 703 $ 3,256 $ 814 $ 3,998 $ 1,858 $ 6,354 $ 1,517 $ 8,433 $ 4,184 Debt securities measured at FVOCI (1) 83 n/a 98 n/a 206 n/a 181 n/a 446 n/a Other (2) 392 123 417 118 498 82 809 241 1,005 177
Total $ 3,573 $ 826 $ 3,771 $ 932 $ 4,702 $ 1,940 $ 7,344 $ 1,758 $ 9,884 $ 4,361
(1) Interest income for financial instruments that are measured at amortized cost and debt securities that are measured at FVOCI is calculated using the effective interest rate method.
(2) Includes interest income and expense and dividend income for financial instruments that are mandatorily measured and designated at FVTPL and equity securities designated at FVOCI.
n/a Not applicable.
Note 15. Segmented information
CIBC has four strategic business units (SBUs) – Canadian Personal and Business Banking, Canadian Commercial Banking and Wealth Management,
U.S. Commercial Banking and Wealth Management, and Capital Markets. These SBUs are supported by Corporate and Other.
Canadian Personal and Business Banking provides personal and business clients across Canada with financial advice, products and services
through banking centre, digital, mobile and remote channels.
Canadian Commercial Banking and Wealth Management provides high-touch, relationship-oriented banking and wealth management services to
middle-market companies, entrepreneurs, high-net-worth individuals and families across Canada, as well as asset management services to institutional
investors.
U.S. Commercial Banking and Wealth Management provides commercial banking and private wealth services across the U.S., as well as personal
and small business banking services in four U.S. Midwestern markets and focuses on middle-market and mid-corporate companies and high-net-worth
individuals and families.
Capital Markets provides integrated global markets products and services, investment banking advisory and execution, corporate banking
solutions and top-ranked research to our clients around the world. It includes Direct Financial Services which focuses on expanding CIBC’s digitally-
enabled capabilities to provide a cohesive set of direct banking, direct investing and innovative multi-currency payment solutions for CIBC’s clients.
Corporate and Other includes the following functional groups – Technology, Infrastructure and Innovation, Risk Management, People, Culture and
Brand, Finance and Enterprise Strategy, as well as other support groups. The expenses of these functional and support groups are generally allocated
to the business lines within the SBUs. The majority of the functional and support costs of CIBC Bank USA are recognized directly in the U.S. Commercial
Banking and Wealth Management SBU. Corporate and Other also includes the results of CIBC FirstCaribbean and other strategic investments, as well
as other income statement and balance sheet items not directly attributable to the business lines.
Changes made to our business segments The following changes were made in the first quarter of 2021:
� Simplii Financial and CIBC Investor’s Edge, previously reported in Canadian Personal and Business Banking, are now part of the newly-created
Direct Financial Services line of business in Capital Markets, along with certain other direct payment services that were previously in Capital
Markets. This change was made to align with the mandates of the relevant SBUs.
� The financial results associated with U.S. treasury activities in U.S. Commercial Banking and Wealth Management are now included within Treasury
in Corporate and Other. In addition, the transfer pricing methodology between U.S. Commercial Banking and Wealth Management and Treasury in
Corporate and Other has been enhanced. Both changes align the treatment of U.S. Commercial Banking and Wealth Management with our other
SBUs, and allow for better management of interest rate and liquidity risks.
These changes impacted the results of our SBUs. Prior period amounts were revised accordingly. There was no impact on consolidated net income
resulting from these changes.
64 CIBC SECOND QUARTER 2021

$ millions, for the three months ended
Canadian Personal
and Business Banking
Canadian Commercial
Banking and Wealth
Management
U.S. Commercial
Banking and Wealth
Management Capital
Markets Corporate and Other
CIBC Total
2021 Apr. 30
Net interest income (1) $ 1,425 $ 305 $ 351 $ 662 $ 4 $ 2,747 Non-interest income (2) 516 830 181 532 126 2,185
Total revenue (1) 1,941 1,135 532 1,194 130 4,932 Provision for (reversal of) credit losses 65 (18) (12) (11) 8 32 Amortization and impairment (3) 53 7 27 3 159 249 Other non-interest expenses 1,005 601 244 535 122 2,507
Income (loss) before income taxes 818 545 273 667 (159) 2,144 Income taxes (1) 215 146 57 172 (97) 493
Net income (loss) $ 603 $ 399 $ 216 $ 495 $ (62) $ 1,651
Net income (loss) attributable to: Non-controlling interests $ – $ – $ – $ – $ 4 $ 4 Equity shareholders 603 399 216 495 (66) 1,647
Average assets (4) $ 266,763 $ 67,969 $ 46,364 $ 250,627 $ 163,650 $ 795,373
2021 Jan. 31
Net interest income (1) $ 1,483 $ 298 $ 374 $ 682 $ 2 $ 2,839 Non-interest income (2) 542 790 187 492 113 2,124
Total revenue (1) 2,025 1,088 561 1,174 115 4,963 Provision for credit losses 54 33 45 5 10 147 Amortization and impairment (3) 53 7 28 2 147 237 Other non-interest expenses 1,033 565 252 520 119 2,489
Income (loss) before income taxes 885 483 236 647 (161) 2,090 Income taxes (1) 233 129 48 154 (99) 465
Net income (loss) $ 652 $ 354 $ 188 $ 493 $ (62) $ 1,625
Net income (loss) attributable to: Non-controlling interests $ – $ – $ – $ – $ 4 $ 4 Equity shareholders 652 354 188 493 (66) 1,621
Average assets (4) $ 261,542 $ 65,774 $ 47,501 $ 250,418 $ 174,713 $ 799,948
2020 Apr. 30 (5)
Net interest income (1) $ 1,432 $ 321 $ 370 $ 568 $ 71 $ 2,762 Non-interest income (2) 504 704 141 399 68 1,816
Total revenue (1) 1,936 1,025 511 967 139 4,578 Provision for credit losses 640 186 230 236 120 1,412 Amortization and impairment (3) 57 7 34 2 180 280 Other non-interest expenses 1,017 552 257 490 108 2,424
Income (loss) before income taxes 222 280 (10) 239 (269) 462 Income taxes (1) 59 74 (25) 62 (100) 70
Net income (loss) $ 163 $ 206 $ 15 $ 177 $ (169) $ 392
Net income (loss) attributable to: Non-controlling interests $ – $ – $ – $ – $ (8) $ (8) Equity shareholders 163 206 15 177 (161) 400
Average assets (4) $ 251,898 $ 66,931 $ 49,182 $ 235,064 $ 122,626 $ 725,701
(1) Capital Markets net interest income and income taxes includes a taxable equivalent basis (TEB) adjustment of $51 million for the three months ended April 30, 2021 (January 31, 2021: $54 million; April 30, 2020: $46 million) with an equivalent offset in Corporate and Other.
(2) Includes intersegment revenue, which represents internal sales commissions and revenue allocations under the Manufacturer / Customer Segment / Distributor Management Model. (3) Comprises amortization and impairment of buildings, right-of-use assets, furniture, equipment, leasehold improvements, software and other intangible assets. The three months ended April 30, 2020
includes goodwill impairment. (4) Assets are disclosed on an average basis as this measure is most relevant to a financial institution and is the measure reviewed by management. (5) Certain prior period information has been revised. See the “Changes made to our business segments” section for additional details.
$ millions, for the six months ended
Canadian Personal
and Business Banking
Canadian Commercial
Banking and Wealth
Management
U.S. Commercial
Banking and Wealth
Management Capital
Markets Corporate and Other
CIBC Total
2021 Apr. 30
Net interest income (1) $ 2,908 $ 603 $ 725 $ 1,344 $ 6 $ 5,586 Non-interest income (2) 1,058 1,620 368 1,024 239 4,309
Total revenue (1) 3,966 2,223 1,093 2,368 245 9,895 Provision for (reversal of) credit losses 119 15 33 (6) 18 179 Amortization and impairment (3) 106 14 55 5 306 486 Other non-interest expenses 2,038 1,166 496 1,055 241 4,996
Income (loss) before income taxes 1,703 1,028 509 1,314 (320) 4,234 Income taxes (1) 448 275 105 326 (196) 958
Net income (loss) $ 1,255 $ 753 $ 404 $ 988 $ (124) $ 3,276
Net income (loss) attributable to: Non-controlling interests $ – $ – $ – $ – $ 8 $ 8 Equity shareholders 1,255 753 404 988 (132) 3,268
Average assets (4) $ 264,109 $ 66,853 $ 46,942 $ 250,521 $ 169,273 $ 797,698
2020 Apr. 30 (5)
Net interest income (1) $ 2,937 $ 636 $ 712 $ 1,066 $ 172 $ 5,523 Non-interest income (2) 1,078 1,444 300 907 181 3,910
Total revenue (1) 4,015 2,080 1,012 1,973 353 9,433 Provision for credit losses 851 221 245 230 126 1,673 Amortization and impairment (3) 114 14 66 5 327 526 Other non-interest expenses 2,046 1,106 523 979 589 5,243
Income (loss) before income taxes 1,004 739 178 759 (689) 1,991 Income taxes (1) 266 197 (2) 204 (278) 387
Net income (loss) $ 738 $ 542 $ 180 $ 555 $ (411) $ 1,604
Net income (loss) attributable to: Non-controlling interests $ – $ – $ – $ – $ (1) $ (1) Equity shareholders 738 542 180 555 (410) 1,605
Average assets (4) $ 251,745 $ 66,085 $ 46,972 $ 223,998 $ 113,562 $ 702,362
(1) Capital Markets net interest income and income taxes includes a TEB adjustment of $105 million, for the six months ended April 30, 2021 (April 30, 2020: $95 million) with an equivalent offset in Corporate and Other.
(2) Includes intersegment revenue, which represents internal sales commissions and revenue allocations under the Manufacturer / Customer Segment / Distributor Management Model. (3) Comprises amortization and impairment of buildings, right-of-use assets, furniture, equipment, leasehold improvements, software and other intangible assets. The six months ended April 30, 2020
includes goodwill impairment. (4) Assets are disclosed on an average basis as this measure is most relevant to a financial institution and is the measure reviewed by management. (5) Certain prior period information has been revised. See the “Changes made to our business segments” section for additional details.
CIBC SECOND QUARTER 2021 65

TO REACH US:
Corporate Secretary: Shareholders may call 416-980-3096, or e-mail: [email protected]
Investor Relations: Financial analysts, portfolio managers and other investors requiring financial information may call 416-813-3743, or e-mail:
Communications and Public Affairs: Financial, business and trade media may e-mail: [email protected]
CIBC Telephone Banking: As part of our commitment to our clients, information about CIBC products and services is available by calling
1-800-465-2422 toll-free across Canada.
Online Investor Presentations: Supplementary financial information, Pillar 3 Report and Supplementary regulatory capital disclosure, and a
presentation to investors and analysts are available at www.cibc.com; About CIBC.
Earnings Conference Call: CIBC’s second quarter conference call with analysts and investors will take place on Thursday, May 27, 2021 at
7:30 a.m. (ET). The call will be available in English (416-340-2217, or toll-free 1-800-806-5484, passcode 8335491#) and French (514-392-1587, or
toll-free 1-877-395-0279, passcode 7008374#). A telephone replay of the conference call will be available in English and French until 11:59 p.m. (ET)
June 20, 2021. To access the replay in English, call 905-694-9451 or 1-800-408-3053, passcode 1725009#. To access the replay in French, call
514-861-2272 or 1-800-408-3053, passcode 8504384#.
Audio Webcast: A live audio webcast of CIBC’s second quarter results conference call will take place on Thursday, May 27, 2021 at 7:30 a.m. (ET) in
English and French. To access the audio webcast, go to www.cibc.com; About CIBC. An archived version of the audio webcast will also be available in
English and French following the call on www.cibc.com; About CIBC.
Annual Meeting: CIBC’s next Annual Meeting of Shareholders will be held on April 7, 2022.
Regulatory Capital: Information on CIBC’s regulatory capital instruments and regulatory capital position may be found at www.cibc.com; About CIBC;
Investor Relations; Regulatory Capital Instruments.
Bail-in Debt: Information on CIBC’s bail-in debt and TLAC instruments may be found at www.cibc.com; About CIBC; Investor Relations; Debt
Information; Bail-in Debt.
Nothing in CIBC’s website www.cibc.com should be considered incorporated herein by reference.
DIRECT DIVIDEND DEPOSIT SERVICE
Canadian-resident holders of common shares may have their dividends
deposited directly into their account at any financial institution which is a
member of Payments Canada. To arrange, please write to AST Trust
Company (Canada), P.O. Box 700 Postal Station B, Montreal, QC H3B 3K3
or e-mail: [email protected]
SHAREHOLDER INVESTMENT PLAN
Registered holders of CIBC common shares wishing to acquire
additional common shares may participate in the Shareholder
Investment Plan and pay no brokerage commissions or service charges.
For a copy of the offering circular, contact AST Trust Company (Canada)
at 416-682-3860, toll-free at 1-800-258-0499, or by e-mail at
PURCHASE PRICE OF COMMON SHARES
UNDER THE
SHAREHOLDER INVESTMENT PLAN
Date
Share
purchase
option
Dividend
reinvestment & stock
dividend options
Feb. 1/21 $109.86
Mar. 1/21 $116.97
Apr. 1/21 $124.82
Apr. 28/21 $126.02
Canadian Imperial Bank of Commerce
Head Office: Commerce Court, Toronto, Ontario, M5L 1A2, Canada
www.cibc.com