Report of the Performance and Asset Management Advisory Council ...
49
Presented by: Performance and Asset Management Advisory Council Patricia Leavenworth, P.E., Chair January 15, 2016 Report of the Performance and Asset Management Advisory Council: Progress by MassDOT Highway Division on Integrated Asset Management
Transcript of Report of the Performance and Asset Management Advisory Council ...

Presented by: Performance and Asset Management Advisory Council Patricia Leavenworth, P.E., Chair January 15, 2016
Report of the Performance and Asset Management Advisory Council:
Progress by MassDOT Highway Division on Integrated Asset Management

2016 | Highway Division Asset Management

2016 | Highway Division Asset Management
Performance and Asset Management Advisory Council
Ruth Bonsignore, MassDOT Board Member Pat Ciaramella, Old Colony Planning Council
Dennis Dizoglio, Merrimack Valley Planning Commission Christopher Hennessey, Cohen Kinne Valicenti & Cook LLP
David Knowlton, City of Salem MA Patricia Leavenworth, Chief Engineer, MassDOT (Chair)
Robert Moylan, MassDOT Board Member John Pourbaix, Construction Industries of Massachusetts Victoria Sclafani, Massachusetts Municipal Association

2016 | Highway Division Asset Management
TITLE VI NOTICE
The Massachusetts Department of Transportation (MassDOT) fully complies with Title VI of the Civil Rights Act of 1964 and related state laws. MassDOT offers a variety of resources/services in Spanish, Portuguese, Haitian Creole, Khmer, Chinese and Vietnamese, among others, free of charge. Services include but are not limited to the following: oral interpreters, written language services and translations of vital documents. If you need help understanding this document because you do not speak English or have a disability which impacts your ability to read the text, please contact MassDOT’s Office for Diversity and Civil Rights at (857) 368-8580 or (617) 368-7306 (TTY) or via our website at www.massdot.gov. If you believe that you or anyone in a specific class of persons has been subjected to discrimination prohibited by Title VI and other nondiscrimination laws based on race, color, national origin, sex, age, disability or gender, you or your representative may file a complaint with MassDOT, which we can help you to complete. A complaint must be filed no later than 180 days after the date of the alleged discrimination. If you require further information, please contact MassDOT’s Office for Diversity and Civil Rights at (857) 368-8580 or (857)-266-0603 (TTY) or via our website at www.massdot.gov.
AVISO DE TÍTULO VI
El Departamento de Transporte de Massachusetts (MassDOT) cumple plenamente con el Título VI de la Ley de Derechos Civiles de 1964 y las leyes estatales relacionadas al mismo. MassDOT ofrece una variedad de recursos/servicios en español, portugués, criollo haitiano, camboyano, chino y vietnamita, entre otros, libre de costo. Entre varios servicios se encuentran los siguientes: intérpretes orales, servicios de lengua escrita y traducción de documentos vitales. Si usted necesita ayuda para entender este documento ya que no habla inglés o tiene una incapacidad que afecta su habilidad de leer el texto, por favor contacte a la Oficina para la Diversidad y Derechos Civiles de MassDOT al (857) 368-8580 o el (617) 368-7306 (TTY) o a través de nuestro sitio web en www.massdot.gov. Si cree que usted o cualquier otro individuo perteneciente a una clase específica de personas ha sufrido discriminación prohibida por el Título VI y otras leyes antidiscriminatorias basada en raza, color, origen nacional, sexo, edad, incapacidad o género, usted o su representante puede presentar una queja a Mass- DOT, la cual podemos ayudarle a llenar. Se debe presentar la queja a más tardar 180 días después de la fecha de la discriminación alegada. Si necesita más información, por favor contacte a la Oficina para la Diversidad y Derechos Civiles de MassDOT al (857) 368-8580 o (857)-266-0603 (TTY) o a través de nuestro sitio web en www.massdot.gov.
Caso esta informação seja necessária em outro idioma, favor contar o Especialista em Título VI do MassDOT pelo telefone 857-368-8580.
如果需要使用其它语言了解信息,请联系马萨诸塞州交通部(MassDOT)《民权法案》第六章专员,电话
857-368-8580。
如果需要使用其它語言了解信息,請聯繫馬薩諸塞州交通部(MassDOT)《民權法案》第六章專員,電話
857-368-8580。
Если Вам необходима данная информация на любом другом языке, пожалуйста, свяжитесь со cпециалистом по Титулу VI Департамента Транспорта штата Массачусетс (MassDOT) по тел: 857-368-8580.

2016 | Highway Division Asset Management
Si yon moun vle genyen enfòmasyon sa yo nan yon lòt lang, tanpri kontakte Espesyalis MassDOT Title VI la nan nimewo 857-368-8580.
Nếu quý vị cần thông tin này bằng tiếng khác, vui lòng liên hệ Chuyên viên Luật VI của MassDOT theo số điện thoại 857-368-8580.
Si vous avez besoin d'obtenir une copie de la présente dans une autre langue, veuillez contacter le spécialiste du Titre VI de MassDOT en composant le 857-368-8580.
Se ha bisogno di ricevere queste informazioni in un’altra lingua si prega di contattare lo Specialista MassDOT del Titolo VI al numero 857-368-8580.
របសនេបើេ�ក-អ�ករត�វ�របកែរបពត�នេនះ សម�កទកអ�កឯកេទសេលើជពកទ6 របសMassDot �មរយៈេលខទរសព� 857-368-8580
8580-368-857 إلى ھذه المعلومات بلغة أخرى، یرجى االتصال بأخصائي الفقرة السادسة على الھاتف إن كنت بحاجة
2016 | Highway Division Asset Management
Performance and Asset Management Advisory Council
January 15, 2016
The Honorable Karen E. Spilka Chairwoman Senate Committee on Ways and Means State House, Room 212 Boston, MA 02133
The Honorable Brian S. Dempsey Chairman House Committee on Ways and Means State House, Room 243 Boston, MA 02133
The Honorable Thomas M. McGee Senate Chairman Joint Committee on Transportation State House, Room 109C Boston, MA 02133
The Honorable William M. Straus House Chairman Joint Committee on Transportation State House, Room 134 Boston, MA 02133
Members of the General Court:
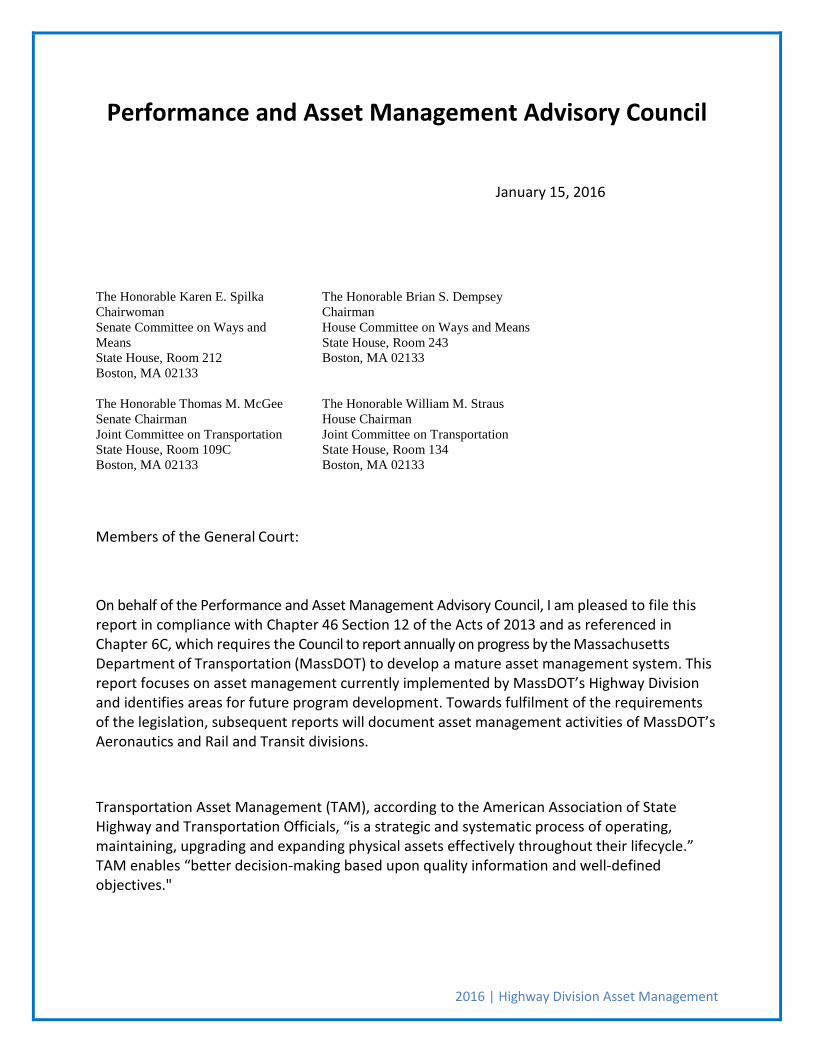
On behalf of the Performance and Asset Management Advisory Council, I am pleased to file this report in compliance with Chapter 46 Section 12 of the Acts of 2013 and as referenced in Chapter 6C, which requires the Council to report annually on progress by the Massachusetts Department of Transportation (MassDOT) to develop a mature asset management system. This report focuses on asset management currently implemented by MassDOT’s Highway Division and identifies areas for future program development. Towards fulfilment of the requirements of the legislation, subsequent reports will document asset management activities of MassDOT’s Aeronautics and Rail and Transit divisions.
Transportation Asset Management (TAM), according to the American Association of State Highway and Transportation Officials, “is a strategic and systematic process of operating, maintaining, upgrading and expanding physical assets effectively throughout their lifecycle.” TAM enables “better decision-making based upon quality information and well-defined objectives."

2016 | Highway Division Asset Management
The Council can report progress toward meeting the requirements set by the Legislature. TAM is helping MassDOT’s Highway Division to more comprehensively understand its asset portfolio, including existing and forecasted needs, and adopt a strategic and cohesive approach to asset life-cycle management. Program governance now incorporates personnel from all areas of the Highway Division, including headquarters, district offices, and the planning, design, construction and maintenance departments. For bridge and pavement inventories, the Division currently operates comprehensive and mature asset management systems, which provide data and analysis for sound investment decisions. The Division has developed a strategic plan to guide the implementation of asset management across all areas. Work is currently underway to inventory and assess a broader set of priority assets, including traffic signals, signs, sidewalks, pedestrian ramps, culverts and overhead structures. In addition to describing progress toward developing and implementing TAM across the Highway Division, the Council can report these additional findings:
• The Highway Division provides stewardship for a road and bridge asset portfolio worth approximately $33 billion.
• With respect to the current condition of our roads and bridges: o 81 percent of state-owned, non-Turnpike Interstate pavements are in good or
excellent condition; o 64 percent of state-owned, non-Interstate pavements are in good to excellent
condition; o Significant progress through the Accelerated Bridge Program (ABP), along with
federally-aided bridge projects, has reduced the number of structurally deficient bridges within the non-revenue bridge population (about 90 percent of all bridges) by 24 percent, from 543 to 415 structures, as of November 1, 2015. (The final ABP contract is scheduled to be advertised this summer).
• Preliminary 10-year forecasts of asset conditions, assuming the current level of investment, indicate that:
o 94 percent of state-owned Interstate highways will be in good to excellent condition;
o Approximately 20 percent of state-owned non-Interstate roads will be in good to excellent condition;
o The Commonwealth will experience a return to growth in the statewide number of structurally deficient bridges.
These data and analyses provide valuable input to on-going investment decision-making and the development of MassDOT’s five-year the Capital Investment Plan (CIP), which is currently underway.

2016 | Highway Division Asset Management
While we are proud of our progress, not all legislative requirements have been achieved. In addition to the integration of all assets, MassDOT is working to reach consensus on multimodal performance metrics, benchmarks, and a multi-year list of projects as part of its CIP development. Furthermore, MassDOT is still finalizing data on receipts and disbursements of road/highway and transit funds. In the upcoming year, the Council will also be working on these issues, as well as trying to better understand the availability of asset management data and issues at the municipal level.
The Council looks forward to its continued work with both MassDOT and the Legislature to ensure that integrated asset management continues to progress, and that the value of these management tools are fully realized by the residents and businesses of the Commonwealth.
Respectfully submitted,
Patricia Leavenworth, P.E., Chair

2016 | Highway Division Asset Management
TABLE OF CONTENTS
1. BACKGROUND ......................................................................................................................................... 1
2. HIGHWAY DIVISION............................................................................................................................... 2
3. TRANSPORTATION ASSET MANAGEMENT ............................................................................................ 3
3.1 Statutory Requirement ................................................................................................................. 4
3.2 Strategic Plan ................................................................................................................................ 4
3.2.1 Best Practices ............................................................................................................................ 4
3.2.2 Business Needs ......................................................................................................................... 5
3.2.3 Current State ............................................................................................................................. 5
3.2.4 Gap Analysis .............................................................................................................................. 5
3.2.5 Implementation Plan................................................................................................................. 5
3.3 MassDOT TAM Program Governance .................................................................................................. 5
3.4 TAM Work in Progress ...................................................................................................................... 6
3.4.1 Maintenance Management ...................................................................................................... 6
3.4.2 Information Technology ............................................................................................................ 7
3.4.3 Geographic Information Systems .............................................................................................. 7
3.4.4 Proof of Concept ....................................................................................................................... 7
4. HIGHWAY DIVISION ASSETS .................................................................................................................. 8
4.1 Data Catalog .................................................................................................................................. 8
4.2 Inventory ....................................................................................................................................... 8
4.3 Condition ....................................................................................................................................... 9
5. PAVEMENT .......................................................................................................................................... 10
5.1 Inventory ..................................................................................................................................... 10
5.2 Pavement Asset Value ................................................................................................................ 12
5.3 Data Collection, Management, and Reporting ........................................................................... 13
5.4 Current Pavement Condition ...................................................................................................... 14
5.5 Pavement System Needs ............................................................................................................ 17

2016 | Highway Division Asset Management
5.6 Pavement Management Program - Project Selection ................................................................ 20
6. BRIDGE ASSETS .................................................................................................................................... 22
6.1 Bridge Inventory .......................................................................................................................... 22
6.2 Bridge Asset Value ...................................................................................................................... 24
6.3 Bridge Data Collection, Management, and Reporting ................................................................ 24
6.4 Current Bridge Condition Rating ................................................................................................. 26
6.5 Bridge Needs ............................................................................................................................... 27
6.6 Bridge Management Program - Project Selection ...................................................................... 29
7. TUNNELS ............................................................................................................................................. 31
7.1 Inventory ..................................................................................................................................... 31
7.2 Inspection .................................................................................................................................... 31
7.3 Tunnel Condition ........................................................................................................................ 32
8. OTHER ASSETS ..................................................................................................................................... 33
8.1 Ancillary Structures ..................................................................................................................... 33
8.2 Curb Ramps ................................................................................................................................. 34
8.3 Traffic Signs ................................................................................................................................. 35
8.4 Traffic Signals .............................................................................................................................. 36
9. CONCLUSION ....................................................................................................................................... 37
10. APPENDIX ........................................................................................................................................ 38
10. 1 Additional Tables ............................................................................................................................ 38

1
1. BACKGROUND
Public transportation infrastructure exists to enhance the quality of life and economic competiveness of the population to which it serves. Under the leadership of Secretary and Chief Executive Officer Stephanie Pollack, and governed by the Transportation Board of Directors, MassDOT’s four operating divisions operate within this broader context.
With a multimodal approach, the Divisions transparently plan, prioritize and strategically invest, based on future needs and fiscal constraints, and maintain & modernize assets while minimizing life cycle costs with the goal of better serving system users.
Four goals form the core of
MassDOT’s Guiding Principles:
Transportation Asset Management (TAM) promotes key business practices to support all four principles. The American Association of State Highway and Transportation Officials' (AASHTO's) Subcommittee on Asset Management describes TAM as “a strategic and systematic process of operating, maintaining, upgrading and expanding physical assets effectively through their life cycle”. The intent of this report is to document Asset Management processes currently implemented at MassDOT, and identify goals to inform future program development. This report has been
Serve our Customers Invest in the Commonwealth’s transportation system
Plan and Prioritize
Maintain and modernize our assets
Highway Rail and Transit Registry of Motor Vehicles
Aeronautics

2
2016 | Highway Division Asset Management
prepared with oversight of the Performance and Asset Management Advisory Council, in accordance with Massachusetts General Law Chapter 46 Section 12 of the Acts of 213. While assets and performance measures differ for individual MassDOT divisions, the principles of asset management are consistent. This year’s report focuses on the Highway Division TAM program as it exists presently. Subsequent annual reports will document the cohesive asset management activities of Aeronautics, Highway and Rail and Transit. In addition to reporting progress on the Highway Division’s asset management efforts, this report will help inform MassDOT’s upcoming Capital Investment Plan.
2. HIGHWAY DIVISION
MassDOT’s Highway Division was created in 2009 as part of the merger of Massachusetts Highway Department, the Massachusetts Turnpike Authority, the Tobin Bridge (formerly owned by Massport), and certain transportation assets previously owned by the Department of Conservation and Recreation (all motor vehicle bridges and eight named parkways).
With a team of skilled workers, managers, engineers, scientists, accountants, lawyers, information technology (IT) experts, safety inspectors, planners, communication personnel, construction inspectors, and managers, The Highway Division plans, constructs and maintains state-owned highway infrastructure (“assets”)
Tobin Bridge Transportation Assets

3
2016 | Highway Division Asset Management
across the Commonwealth of Massachusetts. MassDOT also oversees the design and construction of municipal projects where federal financing is involved. The Division is organized with its headquarters in Boston and six geographical districts across the state. The six districts operate 130 satellite maintenance depots statewide.
3. TRANSPORTATION ASSET MANAGEMENT
Figure 1 depicts the Asset Management process and how it specifically relates to investment decisions faced by MassDOT. Agency goals are informed by desired asset performance and apparent fiscal
realities. Plans to reach these goals are developed by modeling asset inventory and condition with various investment scenarios.
Once a plan has been implemented, outcomes are compared to the initial objectives, and the process is reinitiated for the next cycle.
A similar process is used to balance investments between assets.
Goals & Objectives
Asset Inventory
Condition Assessment & Performance Modeling
Alternatives Evaluation & Program Optimization
Short and Long Range Plans
Program Implementation
Performance Monitoring
Budget / Allocations
Figure 1 - TAM Decision Making Process

4
2016 | Highway Division Asset Management
3.1 Statutory Requirement
3.2 Strategic Plan
While asset management makes good business sense, state and federal legislation also stipulates its use. Moving Ahead for Progress in the 21st Century (MAP-21), the 2012 federal transportation law, requires that state transportation agencies develop asset management plans to improve and preserve The National Highway System (‘§119). Similarly, MassDOT’s founding legislation, Chapter 25 of the Acts of 2009, codified asset management as the unifying business process for coordination of asset maintenance, preservation, reconstruction and investment. State Highway DOTs must develop and submit Transportation Asset Management Plan for federal review. The plan shall include, at minimum:
a summary of National Highway System (NHS) bridges and pavements within the respective state
identification of program objectives and measures identification of performance gaps lifecycle costs and risk management analysis a financial plan investment strategies
The Federal Highway Administration (FHWA) is providing guidance in the form of a series of rulemaking notices, which will be summarized in a final rule making publication expected later this year. Once the final rules are posted, state DOTs have 18 months to submit TAM plans, which are to be updated periodically and will be subject to review every four years.
In 2013, MassDOT began developing a formal strategy to implement TAM. Executive and Steering committees were established and staffed by Highway Division personnel. The Executive Committee included the Chief Engineer and Highway Administrator, who provided guidance and support for the program. The Steering Committee, comprised of highway division asset owners, maintenance staff, Information Technology (IT) experts and district personnel, was charged with the day-to-day tasks of organizing, coordinating and directing the program.
An asset management Consultant was retained to advise, facilitate and develop a Strategic Planning document. The plan was developed with the following steps:
3.2.1 Best Practices This effort documented MAP-21 requirements, research performed on various asset management guides and case studies, and best practices garnered from surveys of 10 state Departments of Transportation.

5
2016 | Highway Division Asset Management
3.2.2 Business Needs The task involved a series of interviews, online surveys and workshops staffed by representatives from across the Highway Division.
3.2.3 Current State An intensive assessment of the various IT systems currently supporting MassDOT’s management of assets was performed. The findings indicated that the bridge and pavement sections currently operate systems and processes congruent with nation-wide best practices. It also noted that while numerous asset management-related efforts are underway; there is a need for more communication and integration within the Division.
3.2.4 Gap Analysis A gap analysis was performed to analyze shortfalls preventing the Division from reaching best practice.
3.2.5 Implementation Plan Finally, recommendations were made to develop specific business and technological areas, including technological architecture, data governance and data collection.
3.3 MassDOT TAM Program Governance
The Strategic planning process was substantially completed in fall of 2015, and efforts have now turned toward implementation. Technical Working Groups (TWG) have been established to represent specific areas of expertise, with each group evaluating asset management from its unique perspective. The working groups are:
Asset Information Portal Development: Responsible for collecting requirements for an asset management web site to provide access to published asset management information and to consolidate links to online data sources across the Highway Division.
Inventory and Asset Data: Responsible for writing the Data Governance Manual, the Enterprise GIS Strategic Plan, and for developing an initial inventory and condition dataset.
Maintenance: Responsible for developing standard maintenance measures and condition ratings for all assets.
Business Process and Asset Reporting: Responsible for collecting, mapping, and where necessary standardizing business processes for asset management and fiscal tracking.
Systems and Architecture: Responsible for advancing MassDOT’s IT strategy, advancing system prioritization, drafting documentation for all systems, reviewing business / data requirements and recommending technical solutions, assessing hosting design considerations, and developing a plan for mobile-enabled workforce.

6
2016 | Highway Division Asset Management
3.4 TAM Work in Progress
3.4.1 Maintenance Management The Division’s Maintenance Section has an important role in asset management. Timely preventative maintenance extends the life of an asset, and a responsive maintenance section allows for speedy repairs of unsafe conditions. Each District manages maintenance staff and equipment out of strategically located depots. To supplement in-house forces, contracts for bridge, pavement resurfacing and repair, general highway assets (such as guardrails and drainage) and traffic (signs and traffic signals) are maintained by each District.
Because maintenance of existing assets is a high priority for MassDOT, the Highway Division is constantly assessing and improving its approach to work. The size of the in-house labor force, current funding for maintenance contracts and an aging infrastructure require that work be prioritized. The Highway Division is developing a summary of maintenance measures, goals and gaps to better articulate needs and priorities.
Figure 2 - TAM Program Governance Structure

7
2016 | Highway Division Asset Management
3.4.2 Information Technology IT infrastructure is being revamped to meet the needs of the asset management program. Construction costs are central to the evaluation of asset life-cycles, and considerable success in this area has been realized with the MassDOT Contract Management System (CMS). Launched in 2015, CMS is custom-built software used for procurement and tracking of construction contracts. Work is currently underway on subsequent phases of the software, which will enhance functionality for District and field staff.
3.4.3 Geographic Information Systems Geographic Information Systems (GIS) have long been utilized in the planning of transportation infrastructure. The technology pairs the interface of a map with the storage capability of a database, linking location and information. MassDOT’s planning department has recently upgraded to a new GIS platform that offers enterprise-level exposure. The new system provides a platform for collaboration and the Highway Division is partnering with MassDOT planning to maximize the functionality available for TAM.
3.4.4 Proof of Concept “Attenuators and end treatments” are assets within the traffic and safety asset class and are used to absorb the force and/or redirect an errant vehicle prior to collision with guardrail or a fixed object. These assets were selected as a proof-of-concept (POC) to evaluate the viability of the group structure.
The proof-of-concept will develop the policies, business processes and technology solution to implement full life-cycle management of the end treatments. Practically speaking, this will require the standardization of asset data, including location, type, condition, maintenance history and costs into a data model. The entities responsible for the various phases of the asset will be identified and assigned responsibility for their respective piece of the model.
The proof-of-concept will develop a standard framework through which assets can be integrated within the TAM program. Program governance will be modified based on lessons from the POC.

8
2016 | Highway Division Asset Management
4. HIGHWAY DIVISION ASSETS
The following sections describe the general organization of asset data (asset data governance) within the Highway Division. Chapters 5 through 8 provide specific information on mature assets.
4.1 Data Catalog
In developing its TAM Strategic Plan, MassDOT created a draft asset data catalog that summarizes the objects of value within the Highway-built environment. MassDOT Highway Division has currently identified 74 unique assets, categorized within 12 asset classes.
Asset Class # of Assets Ancillary Structures 4 Bridges 3 Drainage 9 Equipment 4 Facilities 14 ITS and Tolling 7 Pavement 2 Roadway 9 Traffic and Safety 12 Tunnels - Structures 1 Tunnels - Sub-Systems 6 Bicycle & Pedestrian 3
Total 74 The catalog also indicates where the asset data is stored (if it currently exists) and who is responsible for data quality. The responsible section or individual also determines the pieces of information, or attributes, to be stored for the asset.
4.2 Inventory
Completion of a full inventory for all assets in the catalog is a long-term goal. The first step will be to prioritize the assets based on anticipated benefits from an inventory. Benefits include savings from enhanced preservation, importance to public safety, value to the project development process and importance to modal-equity goals.

9
2016 | Highway Division Asset Management
High-ranking assets without an existing data set will be targeted with a deliberate inventory effort. In most cases, this involves a level of field inspection which, depending upon the asset, can be expensive and time-consuming.
A more efficient means of collecting asset data is to capture the information at time of construction. Changes to MassDOT’s Standard Specifications for the Highway Division are being made so that electronic “as-builts” will be provided as a contract deliverable. The contractor will provide data summarizing any changes to the MassDOT inventory.
4.3 Condition
To fully enable management of an asset, condition must be tracked against work performed (investments). The frequency and detail of inspection will again be considered given anticipated benefits. In some cases, a representative sample of an asset will be inspected and the results applied to the greater population.

10
2016 | Highway Division Asset Management
5. PAVEMENT
5.1 Inventory
The MassDOT Office of Transportation Planning (OTP) maintains the GIS-based Massachusetts Road Inventory File. The file contains the digitized centerline of all public roads within the
Commonwealth. A report is published annually by MassDOT, which contains up–to-date information on road mileage, functional classification and jurisdiction. Road inventories are typically described in one of two manners; centerline miles or lane miles. For illustration purposes, one centerline mile of a four-lane highway has four lane miles. This report uses lane miles. The latest Road Inventory identifies more than 72,000 lane miles of roadway within Massachusetts. Of this total, MassDOT owns miles; most of the remaining 9,578 lane miles fall under the jurisdiction of municipalities (small portions are within the jurisdiction of other state or federal agencies).
This MassDOT inventory includes the Western Turnpike and the Metropolitan Highway System. These facilities are accounted for in the roadway inventory, but will not be included in the backlog or modeling in this report.
The Western Turnpike (WT) consists of the Massachusetts Turnpike sections within Districts 1, 2 and 3. The WT accounts for 153, 143 and 230 Interstate lane miles in Districts 1, 2, and 3, respectively.
The Metropolitan Highway System (MHS) consists of the Sumner and Callahan Tunnels, the Boston Extension of the Massachusetts Turnpike (I-90), the Central Artery North Area (CANA)
MassDOT 9,578 13%
City/Town 56,124
78%
Other 6,675
9%
Figure 3-Road Ownership - By Lane Miles

11
2016 | Highway Division Asset Management
Tunnel and the Central Artery/Tunnel System. The MHS is entirely within District 6 and totals 215 lane miles of roadway.
The MassDOT roadway system accounts for many of the higher volume thoroughfares in the Commonwealth. Based on traffic volume data, the MassDOT roadway inventory accounts for about 13 percent of public lane miles but processes 58 percent of the annual vehicle miles travelled in the Commonwealth. Similarly, Interstate lane miles represent only 4.5 percent of the statewide inventory yet process 33 percent of annual vehicle miles travelled.
Figure 4 shows the distribution of the 9,578 MassDOT-owned lanes miles across the six Districts, categorized by functional classification, which is a measure of the traffic service that a roadway is intended to provide.
Figure 4 - MassDOT Functional Classification
0
500
1000
1500
2000
2500
3000
District 1 District 2 District 3 District 4 District 5 District 6
Lane
Mile
s
Local Collector Arterial Interstate

12
2016 | Highway Division Asset Management
5.2 Pavement Asset Value
The value of the pavement assets being managed by the Highway Division was determined by estimating their current replacement costs. Replacement costs per mile of road are dependent on many factors, including geographic location (i.e., urban/rural), type of construction, number of lanes and lane width and number of bridges. The Federal Highway Administration Elemental Capital Improvement Costs were used to estimate pavement replacement cost. The values for “Pavement Reconstruction” were selected and a factor has been applied to account for shoulders and breakdown lanes.
Table 1 – Assumptions used for System Replacement Costs - $/Lane Mile
Interstate Arterial Collector Local Rural $1,223,898 $946,150 $870,160 $870,160 Urban $3,493,155 $2,505,630 $1,725,330 $1,275,935
Table 2- State Owned Roadway Replacement Cost, By Functional Classification, By District
Interstate Arterial Collector Local Total District 1 $0 $836,414,779 $133,374,078 $18,994,784 $988,783,640 District 2 $880,186,100 $1,479,316,608 $82,306,597 $24,832,074 $2,466,641,379 District 3 $2,081,954,482 $2,669,186,525 $43,305,065 $50,409,650 $4,844,855,722 District 4 $2,742,371,524 $2,678,788,290 $45,547,626 $20,623,973 $5,487,331,412 District 5 $2,045,032,406 $5,040,554,405 $86,968,861 $65,017,750 $7,237,573,422 District 6 $539,377,996 $913,703,036 $6,556,254 $16,610,775 $1,476,248,061 Statewide $8,288,922,507 $13,617,963,642 $398,058,480 $196,489,006 $22,501,433,636 Note: Table 2 was developed by applying these assumptions against the center line mile inventory of the road inventory file.
Based on this analysis, the Highway Division is responsible for managing approximately $22.5 Billion of pavement assets.

13
2016 | Highway Division Asset Management
5.3 Data Collection, Management, and Reporting
The Pavement Management Section of the Highway Division is charged with the collection and reporting of roadway condition data in one and two year cycles. Currently, all roadways along the National Highway System (NHS) are surveyed, in addition to all MassDOT owned non-NHS roads.
Data is collected at highway speeds in a specially equipped vehicle using a data collection application by Pathways Services Inc. The application, Highway Inventory and Collection and Management System, measures pavement roughness and detects indicators of pavement distress including cracking, rutting and raveling. Condition data is stored using the route and measuring conventions of the Road Inventory File.
Pavement Condition data on the NHS is provided to the FHWA for integration within the national Highway Performance Monitoring System. The Pavement Management Section is also responsible for planning the Interstate Management and NHS Pavement Preservation annual programs, the review of project pavement designs, and acceptance of installed pavement in construction.
Raw pavement data are analyzed and characterized by an overall pavement condition indicator, the Pavement Serviceability Index (PSI).
Condition PSI Range
Interstate Non-Interstate
Excellent 3.5-5.0 3.5-5.0
Good 3.0-3.5 2.8-3.5
Fair 2.5-3.0 2.3-2.8
Poor 0.0-2.5 0.0-2.3
This metric evaluates pavement condition in a range from 0 to 5, where 0 is considered impassable and 5 is a brand new roadway.
Figure 5- Pavement Management Vehicle

14
2016 | Highway Division Asset Management
MassDOT-owned roads are analyzed for condition in two major categories: Interstate and non-Interstate. A separate scale is used for each category, with more stringent grading of the Interstates, which is reflective of the higher speeds and regional importance. The threshold for pavements considered to be in good condition is a PSI of 3.0 for Interstate and 2.8 for non-Interstate facilities.
5.4 Current Pavement Condition
Pavement conditions described in this report are based on condition data collected in 2014. For this report, Turnpike and MHS sections are excluded from the condition data. Independent Triennial inspection reports filed in the fall of 2015 evaluated the condition of both Western Turnpike and MHS, including pavement conditions, while also identifying maintenance needs.
Figure 6 provides the percent of MassDOT-owned, non-turnpike, Interstate pavement in excellent, good fair and poor condition.
Figure 6 – MassDOT-owned, Non-Turnpike, Interstate Pavement Condition (2014 Data)
0%
10%
20%
30%
40%
50%
60%
70%
80%
90%
100%
District 1 District 2 District 3 District 4 District 5 District 6 Overall
% R
oadw
ay In
vent
ory
Poor Fair Good Excellent
(None)

15
2016 | Highway Division Asset Management
Statewide, 81 percent of the MassDOT-owned, non-turnpike Interstate system in Massachusetts is considered to be in good or excellent condition. There is some variability across the Districts, with 89.7 percent of District 4’s total lane miles in excellent/good condition and 56.4 percent of District 2’s lane miles assessed in excellent/good condition.
Figure 7 provides the percent of MassDOT-owned non-Interstate pavement in excellent, good fair and poor condition.
Figure 7 – MassDOT-owned, Non-Interstate Pavement Condition (2014 Data)
Overall, 64 percent of non-Interstate roadways are in good or excellent condition, with variability across Districts. About 72 percent of District 2 lane miles are at excellent/good condition and 52.5 percent of District 4 lane miles are at excellent/good condition.
Another measure of current pavement condition is repair backlog, which can be determined by applying the respective treatment costs to the percent of lane miles in fair or poor condition in the overall road inventory. To calculate backlog, a separate lane mile cost is used for the Interstate and non-Interstate inventory. MassDOT rarely advertises projects with scope of work limited solely to pavement.
0%
10%
20%
30%
40%
50%
60%
70%
80%
90%
100%
District 1 District 2 District 3 District 4 District 5 District 6 Overall
% R
oadw
ay In
vent
ory
Poor Fair Good Excellent
16
2016 | Highway Division Asset Management
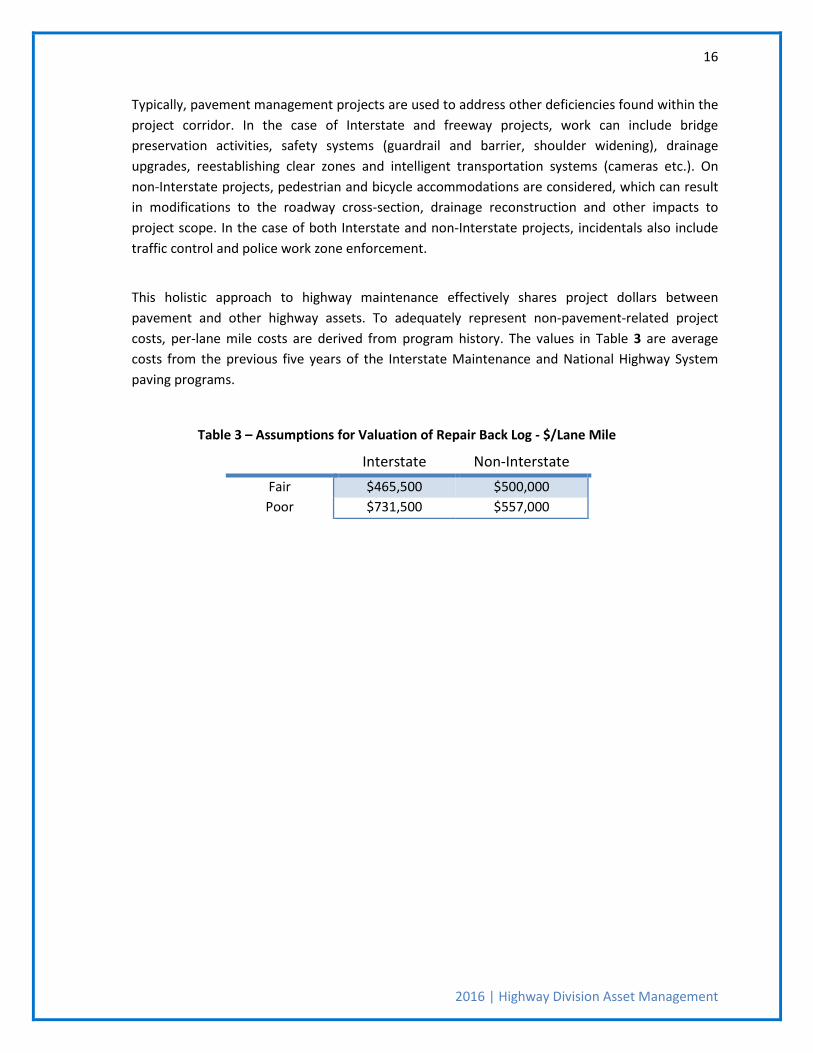
Typically, pavement management projects are used to address other deficiencies found within the project corridor. In the case of Interstate and freeway projects, work can include bridge preservation activities, safety systems (guardrail and barrier, shoulder widening), drainage upgrades, reestablishing clear zones and intelligent transportation systems (cameras etc.). On non-Interstate projects, pedestrian and bicycle accommodations are considered, which can result in modifications to the roadway cross-section, drainage reconstruction and other impacts to project scope. In the case of both Interstate and non-Interstate projects, incidentals also include traffic control and police work zone enforcement.
This holistic approach to highway maintenance effectively shares project dollars between pavement and other highway assets. To adequately represent non-pavement-related project costs, per-lane mile costs are derived from program history. The values in Table 3 are average costs from the previous five years of the Interstate Maintenance and National Highway System paving programs.
Table 3 – Assumptions for Valuation of Repair Back Log - $/Lane Mile
Interstate Non-Interstate Fair $465,500 $500,000 Poor $731,500 $557,000

17
2016 | Highway Division Asset Management
Figure 8 applies the corresponding repair costs in Table 3 to the percentage of MassDOT roads currently in fair or poor condition. The costs are organized by Interstate and non-Interstate, and also by district.
Figure 8 – Estimated Pavement Repair Backlog, MassDOT-owned Roads (2014 data)
The current total estimated pavement repair backlog is $1.44 billion, with $240 million required for the Interstates and $1.2 billion for the non-Interstate network. This number represents an order of magnitude estimate to bring all MassDOT-owned roadways to good or excellent condition today.
5.5 Pavement System Needs
The Pavement backlog is addressed in a programmatic manner, with planned annual investments. A pavement management software program, Deighton’s Total Infrastructure
Management System or dTIMS®, is used to model the performance of MassDOT pavement over time and under different funding scenarios. The system uses the Highway Inventory and Collection and Management System output and performance and deterioration models to dynamically assess pavement performance over a set horizon. The Pavement Management Section selects a suite of preservation and rehabilitation
$0
$50
$100
$150
$200
$250
$300
$350
$400
$450
District 1 District 2 District 3 District 4 District 5 District 6
Repa
ir Ba
cklo
g Va
lue
(mill
ions
of d
olla
rs)
Non Interstate Interstate

18
2016 | Highway Division Asset Management
treatments, which are matched with native costs based on previous projects. Once a funding level is established, the system works to optimize available funding by selecting pavement treatments at the most advantageous time.
Figure 9 demonstrates the value of well-timed investment in pavements (or any other asset). Investments in preservation prior to advanced deterioration will prolong useful life and delay comparatively more costly rehabilitation or reconstruction.
Figure 9 - Pavement Deterioration Curve (Source FHWA)

19
2016 | Highway Division Asset Management
Figure 10 depicts performance modeling of the Interstate highway network at three investment levels. The modeling was performed in December 2015 using 2014 pavement condition data.
Figure 10 – Interstate Pavement Network Performance Outcomes Given Varying Investment Levels (December 2015 Model, 2014 Pavement Data)
The current annual funding for the Interstate system is $65 million (shown in the top curve). At the current funding level, current models show the Interstate system will continue to improve and at the end of a ten year horizon, 94 percent of the network will be in excellent/good condition.
50
55
60
65
70
75
80
85
90
95
100
2014 2015 2016 2017 2018 2019 2020 2021 2022 2023 2024 2025
% G
ood
or E
xcel
lent
Year
65 Million (Current) 52 Million 35 Million

20
2016 | Highway Division Asset Management
Figure 11 depicts performance modeling of the non-Interstate highway network at six investment levels. The modeling was performed in December 2015 using 2014 pavement condition data.
Figure 11 - Non-Interstate Pavement Network Performance Outcomes Given Varying Investment Levels (December 2015 Model, 2014 Pavement Data)
The current annual non-Interstate system investment is approximately $54 million. At this level of investment, current models show that pavement condition will continue to decline over time; approximately 40 percent of the network will fall from good to fair/poor condition.
5.6 Pavement Management Program - Project Selection
The majority of pavement work is performed under the Interstate Maintenance and National Highway System Pavement Preservation Programs. MassDOT’s Office of Transportation Planning provides spending targets for each State Transportation Improvement Program (STIP) year. A multi-year optimization is run based on incremental benefit costs.
0.00
10.00
20.00
30.00
40.00
50.00
60.00
70.00
80.00
90.00
100.00
2014 2015 2016 2017 2018 2019 2020 2021 2022 2023 2024 2025
% G
ood
or E
xcel
lent
Year
300 Milllion
225 Million
200 Million
150 Million
100 Million
54 Million (Current)
21
2016 | Highway Division Asset Management
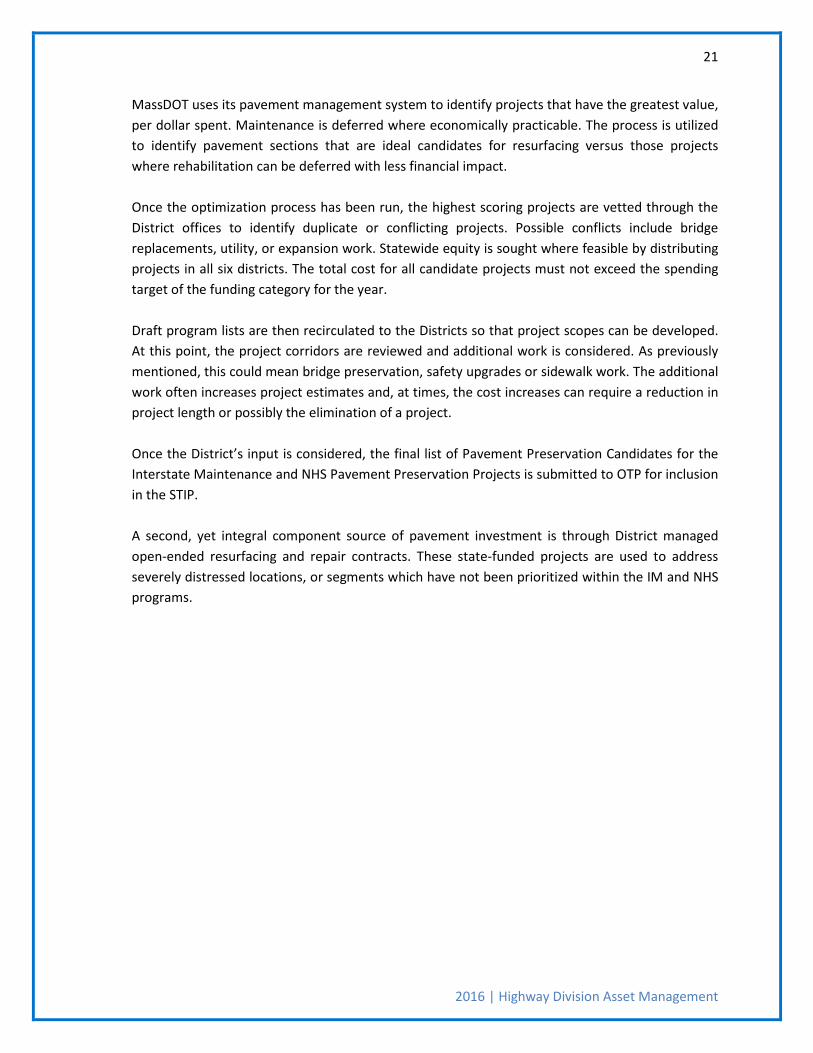
MassDOT uses its pavement management system to identify projects that have the greatest value, per dollar spent. Maintenance is deferred where economically practicable. The process is utilized to identify pavement sections that are ideal candidates for resurfacing versus those projects where rehabilitation can be deferred with less financial impact.
Once the optimization process has been run, the highest scoring projects are vetted through the District offices to identify duplicate or conflicting projects. Possible conflicts include bridge replacements, utility, or expansion work. Statewide equity is sought where feasible by distributing projects in all six districts. The total cost for all candidate projects must not exceed the spending target of the funding category for the year. Draft program lists are then recirculated to the Districts so that project scopes can be developed. At this point, the project corridors are reviewed and additional work is considered. As previously mentioned, this could mean bridge preservation, safety upgrades or sidewalk work. The additional work often increases project estimates and, at times, the cost increases can require a reduction in project length or possibly the elimination of a project. Once the District’s input is considered, the final list of Pavement Preservation Candidates for the Interstate Maintenance and NHS Pavement Preservation Projects is submitted to OTP for inclusion in the STIP. A second, yet integral component source of pavement investment is through District managed open-ended resurfacing and repair contracts. These state-funded projects are used to address severely distressed locations, or segments which have not been prioritized within the IM and NHS programs.

22
2016 | Highway Division Asset Management
6. BRIDGE ASSETS
6.1 Bridge Inventory
The FHWA administered National Bridge Inventory defines a bridge as a structure with a span length over twenty feet. More than 5000 structures within the Commonwealth which meet or exceed this requirement. Efforts are
ongoing to perform a full inventory and inspection of structures with spans between 10 and 20 feet, which are institutionally referred to as BRI structures. Of an estimated 1,824 such BRIs, 1,270 are believed to be municipally owned. The BRI structures are not addressed in this year’s report. Also unaccounted for in this report are 73 bridges under the stewardship of the MBTA. The full inventory of bridges is inspected per National Bridge Inspection Standards (NBIS) biennially, by MassDOT and consultant Inspection crews. Similar to the state
roadway network, bridge ownership is shared across federal, state and municipal entities. Almost seventy percent of Massachusetts bridges are owned by MassDOT. Highway Division bridges can be further organized into revenue and non-revenue facilities. Part of the 3,475 MassDOT bridges, the Western Turnpike is comprised of 248 bridges and the Metropolitan Highway System includes 228 bridges.
The 5,000 plus bridges vary in age, type and condition. At more than 250 years old, the 72-foot Choate Bridge is nationally recognized as one of the oldest surviving bridges in North America. Though modified to increase capacity, the Masonry Arch structure remains a stable means of transport today, ably carrying South Main Street (Route 1A/133) in Ipswich over the river by the same name.
Figure 13 -Choate Bridge (1764)
MassDOT, 3475, 69%
City/Town, 1,581,
31%
Figure 12 – Bridge Inventory Ownership
23
2016 | Highway Division Asset Management
An example of a newer structure is the Kenneth F. Burns Memorial Bridge, an 870-foot deck arch spanning Lake Quinsigamond, between Worcester and Shrewsbury. The five-span structure, which was dedicated in 2015, carries six lanes of vehicular traffic, bicycle-friendly shoulders, and wide sidewalks for pedestrians. The structure also features a customizable LED lighting system, which complements both the built and natural environment. A bridge’s age is determined by the oldest structural element remaining in use. For example, should a bridge undergo a major rehabilitation, and the superstructure (deck and beams) are replaced and foundation elements are retained, the built year attribute will continue to reference the original construction date. A separate data field is maintained to track major reconstructions of bridges.
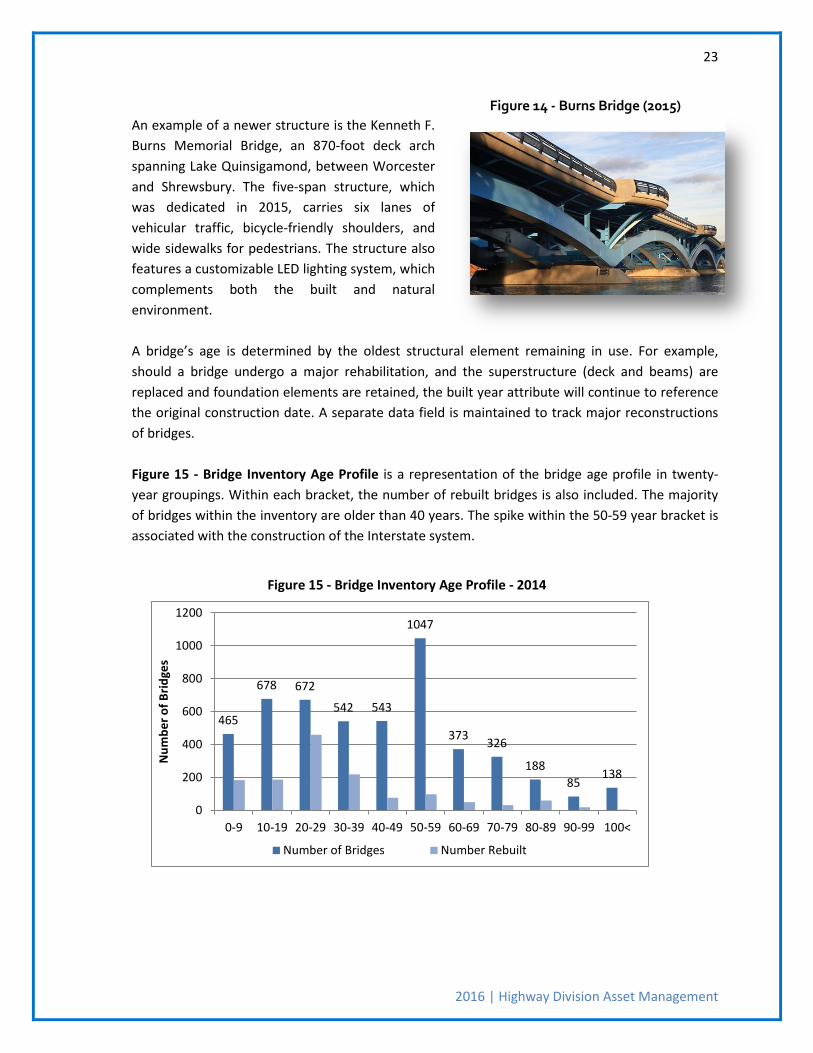
Figure 15 - Bridge Inventory Age Profile is a representation of the bridge age profile in twenty-year groupings. Within each bracket, the number of rebuilt bridges is also included. The majority of bridges within the inventory are older than 40 years. The spike within the 50-59 year bracket is associated with the construction of the Interstate system.
Figure 15 - Bridge Inventory Age Profile - 2014
465
678 672
542 543
1047
373 326
188 85
138
0
200
400
600
800
1000
1200
0-9 10-19 20-29 30-39 40-49 50-59 60-69 70-79 80-89 90-99 100<
Num
ber o
f Brid
ges
Number of Bridges Number Rebuilt
Figure 14 - Burns Bridge (2015)

24
2016 | Highway Division Asset Management
6.2 Bridge Asset Value
Table 4- Bridge Asset Value Based on Deck Replacement Cost
(2014 data, analyzed December 2015)
To estimate the value of the bridges managed by MassDOT, an average deck area replacement unit cost was utilized, based on the previous years’ bridge construction contracts. The value is collected per FHWA guidance, and maintained
nationwide, and excludes specific costs, including demolition of existing structures, maintenance of traffic, right-of-way, utility relocation and contingencies. Separate numbers are maintained for on and off-system structures (NHS/Non-NHS), with NHS cost at $208/SF and non-NHS at $383/SF. Based on this analysis, the Highway Division is responsible for managing approximately $10.8 billion of bridge assets.
6.3 Bridge Data Collection, Management, and Reporting
The Bridge inspection program at MassDOT is comprised of specialized staff at headquarters and district levels. Headquarters provides program planning, management of consultant contracts, maintenance of the bridge inspection database, and is responsible for quality assurance. The District Bridge Inspection Units, each headed by a District Bridge Inspection Engineer, have between two and five two-person inspection teams, based on the number of bridges in the District. These in-house teams, supplemented by consultants, perform approximately 2400 above-water bridge inspections per year. Except where special conditions require more frequent monitoring, bridges are inspected biennially. An Underwater Operations Unit is staffed with full and part time-divers, specially trained to inspect submerged bridge elements.
Count of Bridges Cost
District 1 703 $664,369,843 District 2 834 $1,749,951,764 District 3 1158 $1,777,150,981 District 4 827 $2,163,678,725 District 5 858 $1,769,606,870 District 6 682 $2,636,699,296
Statewide 5,062 $10,761,457,479

25
2016 | Highway Division Asset Management
Bridge inspection data are recorded in the MassDOT Bridge Inspection Management System. The database, and the inspection data which populates it, is modeled on the National Bridge Inventory System (NBIS).
Figure 16 - NBIS Structural Evaluation Scale
9 8 7 6 5 4 3 2 1 0 Good Fair Poor
The conditions of the bridge structural elements (deck, superstructure, and substructure) are recorded using the NBIS Structural Evaluation scale. Should an element be rated a four or less, the bridge is considered to be structurally deficient (SD).

26
2016 | Highway Division Asset Management
6.4 Current Bridge Condition Rating
Since 2008, the number of structurally deficient bridges under former MassHighway (excluding WT & MHS structures) and Department of Conservation and Recreation (DCR) jurisdiction has fallen from 543 to 415. This reduction was made possible by the $3 billion Accelerated Bridge Program (ABP). The program matched an aggressive investment with an equally aggressive approach to bridge project development and construction. As of September 1, 2015, 159 construction contracts have repaired or replaced over 270 bridges. An additional 39 contracts affected maintenance or preservation across the bridge system. The final ABP contract is expected to be awarded in 2016. The next chart depicts the decline of the SD bridge inventory under the performance of the ABP and projects the rise in SD inventory had the program not been undertaken.
Figure 17 – Structurally Deficient Bridge Inventory
Based on year-end 2014 inspection data, there are currently 440 structurally deficient bridges (including revenue-generating Western Turnpike and Metropolitan Highway System bridges, which were excluded from ABP and above chart).

27
2016 | Highway Division Asset Management
6.5 Bridge Needs
Figure 18 provides the outcome of SD bridges for five funding scenarios through 2027. The current model includes capital investments, in the form of replacement of SD bridges, and preservation investments, in the form of maintenance on existing fair bridges. Current funding level is depicted in dark blue.
Figure 18 - SD TRENDS BASED ON CAPITAL AND PRESERVATION SPENDING, 4% INFLATION
(2014 Bridge Inspection Data, December 2015 Model)
At current funding levels, this model predicts that the number of structurally deficient bridges within the Commonwealth will increase over a ten-year horizon.
0
100
200
300
400
500
600
700
800
900
2013 2014 2015 2016 2017 2018 2019 2020 2021 2022 2023 2024 2025 2026 2027
Stru
ctur
ally
Def
icie
nt B
ridge
s
YEAR $173,756,530 (Current) $200,000,000.00 $240,000,000.00
$290,000,000.00 $395,000,000.00

28
2016 | Highway Division Asset Management
Figure 19 isolates the preservation component and demonstrates the effect of maintenance spending on the inventory. Reducing the number of fair bridges and maintaining structures in good condition prevents a further increase in the number of SD bridges. Current investment levels are shown in blue.
Figure 19 - FAIR BRIDGE GROWTH TRENDS BY PRESERVATION SPENDING, 4% INFLATION
This model predicts that based on current funding, the number of fair bridges in the Commonwealth will increase over a ten-year horizon.
0
200
400
600
800
1000
1200
1400
1600
2015 2016 2017 2018 2019 2020 2021 2022 2023 2024 2025 2026 2027
Num
ber o
f FAI
R Br
idge
s
$44,000,000.00 $145,000,000.00 $245,000,000.00

29
2016 | Highway Division Asset Management
6.6 Bridge Management Program - Project Selection
MassDOT Highway Division uses special software as part of its Bridge Prioritization System to rank all federal-aid bridges in the Commonwealth. This system uses three criteria to rank a bridge:
• Condition Loss, which is the difference between the average of a bridge’s current NBIS Condition Rankings and that of a perfect bridge; • Health Index (HI) Change. The Health Index is the ratio of the composite value of all the bridge’s CORE elements in their current condition states to that of a bridge in perfect condition. The Prioritization System uses the software’s deterioration models to predict what the bridge’s HI would be after a period of 15 years. The Health Index change is the percent change from the current HI to that of the predicted future HI. The greater the change, the more rapid the predicted deterioration; • Highway Evaluation Factor is based on parameters such as the traffic carried by the bridge, the detour length if the bridge were to close, the functional classification of the roadway carried by the bridge, the load posting of the bridge and how well the width of the roadway on the bridge meets modern standards.
A numerical value is determined for each criteria based on the data described above and the three criteria are combined to arrive at a final rank value. Sorting bridges based on this rank value determines the statewide rank of the bridge. The bridge with the highest rank value receives a statewide rank of 1. The bridges are then further sorted by MassDOT Highway District to arrive at the District ranking. The Bridge Prioritization System is used to identify candidate projects for the STIP Capital Program that will contribute to MassDOT’s goal of reducing the number of Structurally Deficient bridges. First, the District bridge ranking lists are sorted by SD and non-SD categories. Then, the SD bridges are further sorted by the federal-aid funding category for which they are eligible: Off-system (i.e., local bridges) and on-system (principal routes, Interstate bridges, etc.). The MassDOT Office of Transportation Planning provides spending targets for these funding categories for each STIP year. A preliminary project cost is calculated for each bridge on the Prioritization lists. First step: A draft candidate list is prepared by selecting bridges based on their District priority within each funding category. Geographic diversity is considered by attempting to select candidates from each of the Districts. The total project cost for all candidates selected within a funding category must not exceed the spending target for that category for that year. Candidates may be delayed to a subsequent year if needed to achieve fiscal constraint. Second step: MassDOT Districts are consulted on the draft candidate list for their input on local issues that are not captured in the overall Prioritization Ranking. These issues typically include, for example: local transportation connectivity, emergency response access, impact on the local

30
2016 | Highway Division Asset Management
economy (such as access to places of business, etc.), and maintenance expenditures. Based on the District input, a higher ranked candidate may be replaced on the list by a lower one if the local need for this bridge outweighs the local need for the other one; however, every effort is made to follow the prioritization order. Final step: Once the District’s input is considered, the final list of bridge candidates for the STIP is prepared and submitted to the MassDOT Office of Transportation Planning.

31
2016 | Highway Division Asset Management
Figure 20 - MassDOT Tunnel System
7. TUNNELS
7.1 Inventory
MassDOT currently maintains seven tunnels including the Sumner (1A south), Callahan (1A north), Prudential (I-90), the City Square Tunnel (Central Artery North Area (CANA)), Ted Williams (I-90), Tip O’Neill (I-93), and I-90 Connector Tunnel. The tunnel system, which is considered part of the MHS, is serviced by 15 ventilation and support buildings that provide air circulation and electricity. There are over 60,000 lighting fixtures throughout the tunnel system. Tunnel drainage is facilitated by 41 pump stations located throughout the network.
7.2 Inspection
The MassDOT Tunnel inspection program complies with the National Tunnel Inspection Standards released in August 2015. Biennial inspections evaluate structural, mechanical and electrical features. Similar to bridges, unique condition states may cause frequencies of inspections to be increased. Internal policy directives require inspection of overhead elements, such as ceiling hangers and panels, at a frequency of no more than one year, while the inspection and testing of ventilation and life safety functions is performed at a frequency of no more than six months.

32
2016 | Highway Division Asset Management
7.3 Tunnel Condition
NTIS-based inspection data is incomplete and collection is underway for the entire network. The major inspection items under the NTIS are structural, roadway, ceiling overhead and air ducts. Current inspection data is provided below.
Per the provisions of the Trust Agreement by which the MHS is financed and operated, an independent consultant was retained to inspect the Metropolitan Highway System and verify that the assets are in safe and good repair and provide recommendations for proper maintenance and repair. The Consultant has filed a summary report with findings, entitled The Metropolitan Highway System 2015 Triennial Inspection. The report can be found on the MassDOT website.

33
2016 | Highway Division Asset Management
8. OTHER ASSETS
8.1 Ancillary Structures
The Highway Division’s Bridge Section has initiated a program to inventory, inspect and perform non-destructive testing of the ancillary structure asset class. This class includes full and cantilever-span overhead signs, variable message sign (VMS) support structures, traffic signal support structures and lighting structures.
This is the first round of inspections of this kind. Three separate consultant contracts are performing inspections; to-date, 2686 distinct structures have been recorded in the inspection database. The program has resulted in numerous instances of proactive repairs or removals of deteriorated structures. Costly and time consuming, lane closures are required to inspect many of the locations. Once the full inventory has been collected, inspection processes will be reviewed and a risk-based schedule for inspection will most likely be developed. This methodology will consider age, material and type of construction when determining prioritization and frequency of future rounds of inspection.

34
2016 | Highway Division Asset Management
8.2 Curb Ramps
0%10%20%30%40%50%60%70%80%90%
100%
1 2 3 4 5 6 overall
% In
vent
ory
District
80-100 60-80 40-60 20-40 0-20
Figure 22 - Curb Ramp Condition
MassDOT has initiated a program to inventory,
assess, prioritize and reconstruct pedestrian ramp locations across the state. A web-based application has been developed for use in the program. During inspection, the application can be operated in the field from a tablet and provides standardized input of up 23 different measurements, which MassDOT uses to evaluate ramps. In the office, the map-based tool allows review and editing of survey data and allows the user to run customizable queries to prioritize repair work. Community data (i.e., schools, hospitals, parks, etc.) can be integrated into the application to assist in prioritization.
Figure 21 – Curb Ramp Inventory, by District
D1 1587
D2 2546
D3 3161
D4 7903
D5 6960
D6 3518
This innovative approach helps MassDOT meet its federal obligation to provide an ADA Transition Plan.
The ramp score is based on a 100 point standard, with a 0 signifying full compliance and 100 indicating a missing or completely unusable ramp. Figure 22 depicts
the ramp score distribution statewide and among the districts. As this process evolves, the Division is building features into the software to allow MassDOT to identify remediated ramps. This also provides a tool to better manage the ramp inventory. MassDOT’s vision is to expand the Curb Ramp Assessment Tool by offering it to municipalities as a way to have a statewide ADA network.

35
2016 | Highway Division Asset Management
8.3 Traffic Signs
Per the 2009 Manual of Uniform Traffic Control Devices, public agencies or controlling officials are required to maintain a minimum level of retro reflectivity for regulatory and warning signs within their jurisdiction.
To meet this requirement, MassDOT is conducting inventory and assessment of all signs along state-owned roads. Signs will be located, identified and evaluated for condition. The information is recorded using a map-based sign management and inventory system (SMAIS), which will also be used to track future installations, inspections and repairs.
The inventory approach utilizes a vehicle-based remote sensing that uses light and radar technology, in conjunction with high definition photography, which is then manually processed to extract sign locations. Retro reflectivity on regulatory and warning signs is assessed visually measured at night.
Historically, for primary roads, sign panels have been replaced every 17 to 20 years. This means that approximately 5 percent of all sign panels are replaced on an annual basis. The replacement schedule assumes a typical deterioration rate of the sign sheeting material. The SMAIS will be used to confirm these assumptions. For secondary roads, sign replacement has historically been performed as needed. SMAIS data will now be used to identify for replacement the signs which are below acceptable levels for daytime condition or nighttime retro reflectivity considerations. Initial data suggests approximately 5 percent of the state’s secondary signs are not satisfactory and will need to be replaced.
The ultimate goal is to use SMAIS to predict likely deterioration by tracking age, type of sheeting, geographic location, color and direction of sign face. This will enable the Division to better maintain the sign asset class in a safe and efficient cost-effective manner.

36
2016 | Highway Division Asset Management
8.4 Traffic Signals
There are 1,400 traffic state-owned traffic signals in the Commonwealth. Signals are replaced during roadway reconstruction projects, intersection safety projects and mitigation related to adjacent private development. MassDOT electricians and signal betterment contracts provide District offices with the means to repair, maintain and make upgrades. To better manage the asset class, the Division’s traffic section completed an inventory of all state-owned traffic signal locations. A detailed inspection was performed to identify signal structure, hardware, accessibility and controller systems. The data, which now resides in a module of the software used for sign management, will similarly track future installations, inspections and repairs.
By industry standard, traffic signals are typically replaced every 20 years. The new traffic signal inventory system enables MassDOT Traffic to accurately track all investments in the asset, record signal condition through inspection and tracking of issues and develop new strategies for repair should they be determined necessary.

37
2016 | Highway Division Asset Management
9. CONCLUSION
The Performance and Asset Management Advisory Council has met some legislative requests, including the following information in the 2015 TAM report:
• Performance metrics for the Highway Division’s two main assets, bridge and pavement • Processes and tools to implement the asset management system
• Minimum standards and guidelines that set standardized data for bridge and pavement. The minimum standards include: • accurate and uniform records • mileage and condition of each state owned road and bridge system
While the Highway Division has comprehensively inventoried bridges and pavement, the Council understands that there is still significant work that needs to be done in order to meet the full charge of the Legislature. As this report only outlines the Highway Division’s assets, it does not include the performance and asset management systems for transit, aeronautics, water and ports, and municipal roadways. Considering that this is a new effort, this report also does not include economic development impacts and performance benchmarks against other states and countries.
In the future, the Council intends to include the asset management systems for all MassDOT divisions and municipalities, economic development impacts and performance benchmarks against other states and countries, accurate and uniform records of all real transportation assets, mileage and condition of each road and bridge system under various jurisdictions, and receipts and disbursements of road & highway and transit funds.
The Council is now developing a long-term work plan to accomplish these tasks.

38
2016 | Highway Division Asset Management
10. APPENDIX
10. 1 Additional Tables
Table 4 – State-owned Roadway Lane Miles, By Functional Classification, By District
Interstate Arterial Collector Local Total District 1 0 570.92 153.01 17.87 741.8 District 2 317.86 740.25 85.91 17.32 1161.34 District 3 620.28 1102.09 34.18 27.3 1783.85 District 4 790.67 1069.45 29.18 9.61 1898.91 District 5 585.44 2023.66 79.17 32.02 2720.29 District 6 154.41 364.66 3.8 7.74 530.61 Statewide 2468.66 5871.03 385.25 111.86 8836.8
Table 5- PSI Interstate
Excellent Good Fair Poor District 1 NA NA NA NA District 2 44% 12% 31% 13% District 3 68% 8% 23% 1% District 4 84% 6% 10% 0% District 5 78% 6% 16% 0% District 6 78% 10% 8% 4% Statewide 73.40% 7.63% 16.74% 2.22%
Table 6- PSI Non-Interstate MassDOT Owned
Excellent Good Fair Poor District 1 32% 34% 21% 13% District 2 41% 32% 19% 9% District 3 34% 29% 20% 17% District 4 26% 27% 30% 17% District 5 31% 36% 22% 11% District 6 27% 33% 26% 14% Statewide 31.95% 32.01% 22.68% 13.37%

39
2016 | Highway Division Asset Management
Table 7 - Pavement Backlog
Interstate Non Interstate Fair Poor Fair Poor Total District 1 $0 $0 $77,380,000 $51,602,200 $128,982,200 District 2 $44,180,605 $28,645,540 $79,150,000 $42,949,800 $194,925,945 District 3 $62,139,595 $4,059,825 $114,560,000 $112,090,950 $292,850,370 District 4 $37,174,830 $1,155,770 $168,615,000 $105,752,175 $312,697,775 District 5 $42,532,735 $424,270 $234,040,000 $134,647,400 $411,644,405 District 6 $9,770,845 $6,517,665 $49,465,000 $28,309,850 $94,063,360 Statewide $195,798,610 $40,803,070 $723,210,000 $475,352,375 $1,435,164,055