Report of the ON - agmp.nic.in GSSA/Link Material/Audit Reports/ATIR_LOCAL... · ULBs comprises of...
137
Transcript of Report of the ON - agmp.nic.in GSSA/Link Material/Audit Reports/ATIR_LOCAL... · ULBs comprises of...


Report of the
Comptroller and Auditor General of India
ON
LOCAL BODIES
for the year ended 31 March 2016
Government of Madhya Pradesh Report No. 4 of the year 2017

Table of Contents
Paragraph
no.
Page
no.
Preface - v
Overview - vii
PART – A: PANCHAYATI RAJ INSTITUTIONS
Chapter I: An Overview of the Functioning,
Accountability Mechanism and Financial Reporting issues of the
Panchayati Raj Institutions
Introduction 1.1 1
Organisational set up of PRIs 1.2 1
Functioning of PRIs 1.3 2
Audit arrangement 1.4 4
Response to audit observations 1.5 5
Social Audit 1.6 5
Sources of funds 1.7 6
Budgetary allocation and expenditure of PRIs 1.8 7
Accounting arrangement 1.9 7
Bank reconciliation statement not prepared 1.10 8
Temporary advances not adjusted 1.11 8
Fourteenth Finance Commission Grants 1.12 9
Chapter II: Compliance Audit
Asset Management in PRIs 2.1 11
Avoidable liability of interest and penalty 2.2.1 23
Deposit of interest to Government Account 2.2.2 24
Suspected embezzlement 2.2.3 25
PART – B: URBAN LOCAL BODIES
Chapter III: An Overview of the Functioning,
Accountability Mechanism and Financial Reporting issues of the
Urban Local Bodies
Introduction 3.1 27
Organisational set up of ULBs 3.2 27
Functioning of ULBs 3.3 28
Audit arrangement 3.4 29
Response to audit observations 3.5 30
Sources of funds 3.6 31
Budgetary allocation and expenditure of ULBs 3.7 31
Accounting arrangement 3.8 32

Audit Report on Local Bodies for the year ended 31 March 2016
ii
Paragraph
no.
Page
no.
Bank reconciliation statement not prepared 3.9 33
Tax revenue/non-tax revenue not realised 3.10 33
Temporary advances not adjusted 3.11 34
Fourteenth Finance Commission Grants 3.12 34
Chapter IV: Performance Audit
Management of own fund by Municipal Corporations and Municipal Councils including collection of revenue
4.1 37
Chapter V: Compliance Audit
Setting up and management of Fire Services by Urban Local Bodies
5.1 57
Short-realisation of supervision fee 5.2.1 70
Avoidable payment of penalty and interest 5.2.2 71
Short-realisation of shelter fee 5.2.3 72

Table of contents
iii
LIST OF APPENDIX
Appendix Subject Page no.
1.1 List of test-checked PRIs during 2015-16 75
1.2 Difference in Cash Book balance and Pass Book Balances on 31.03.2015
76
1.3 Outstanding temporary advances as on 31.03.2015 80
2.1 List of test checked Gram Panchayats 82
2.2 Statement of Assets not being utilised for intended purposes
83
2.3 List of Theft Items in Gram Panchayats 85
2.4 Statement showing deposit of interest to Government account
86
3.1 Statement showing devolution of functions to Urban Local Bodies
88
3.2 List of test-checked ULBs during 2015-16 89
3.3 Bank reconciliation statement not prepared 90
3.4 Statement showing unrealised tax revenue (Property tax, composite tax, education cess, urban development cess, market fees, show tax)
91
3.5 Statement showing details of unrelised rent and premium
93
3.6 Statement showing of details non-tax revenue (water charges, license fee, land and building rent etc) not realised
95
3.7 Details of unadjusted temporary advance 97
4.1 Statement showing demand and collection of property tax by test checked MCs
98
4.2 Statement showing demand and collection of composite tax by test checked MCs
101
4.3 Statement showing demand and collection of user charges (water tax)
104
4.4(A) Statement showing preparation of unrealistic budget estimates
107
4.4(B) Statement showing preparation of unrealistic budget estimates
109
4.5 Statement showing difference in closing balances as per cash book and bank pass book as on 31.03.2016
111
4.6 Statement showing short deposit of money in reserve fund
112
4.7 Statement showing delays in remitting taxes deducted at source to respective authority
114
4.8 Statement showing short remittance of State’s share of urban development cess in Government account
115
4.9 Statement showing sanctioned, working and vacant posts in revenue department
117

Audit Report on Local Bodies for the year ended 31 March 2016
iv
Appendix Subject Page no.
5.1 Details of dimensions of accommodations of fire stations of BMC
118
5.2 Details of availability of personal protective equipment in test checked ULBs
119
5.3 Details of sanctioned strength of fire staff and men-in-position
120
5.4 Short realisation of supervision fee 121

P R E F A C E
This Report for the year ended March 2016 has been prepared for
submission to the Governor of Madhya Pradesh under the Comptroller
and Auditor General’s (Duties, Powers and Conditions of Service)
Act, 1971.
The Report contains significant results of the audit of Panchayati Raj
Institutions and Urban Local Bodies in the State including the
Departments concerned.
The issues noticed in the course of test audit for the period 2015-16 as
well as those issues which came to notice in earlier years, but could not
be dealt with in the previous Reports have also been included, wherever
necessary.
The audit has been conducted in conformity with auditing standards
issued by the Comptroller and Auditor General of India.


OVERVIEW
This Report contains five chapters. The first and third Chapters provide an overview of the functioning, accountability mechanism and financial reporting issues of Panchayati Raj Institutions (PRIs) and Urban Local Bodies (ULBs) respectively. The fourth Chapter contains one Performance Audit report on ULBs. The second and fifth Chapters contain Compliance Audit Paragraphs and six Audit Paragraphs on PRIs and ULBs respectively. A summary of the important findings is presented in this overview.
Chapter I: An Overview of the Functioning, Accountability Mechanism
and Financial Reporting Issues of the Panchayati Raj
Institutions
• The Third State Finance Commission recommended (accepted by State Government in February 2010) that four per cent of divisible fund of the State Government should be devolved to PRIs. However, there was short devolution of ` 247.78 crore to PRIs during 2015-16.
(Paragraph 1.7)
• The funds allocated to PRIs by State Government through State budget increased from ` 7,911.12 crore during 2011-12 to ` 21,155.33 crore during the year 2015-16. However, PRIs could not spend the entire allocated grants and savings ranged from six per cent to 30 per cent during the period 2011-16 mainly due to considerable unspent balances in the Revenue Head.
(Paragraph 1.8)
• State Government received ` 1,463.61 crore of Fourteenth Finance Commission (14th FC) basic grant as per entitlement from Government of India in two instalments of ` 731.81 crore (July 2015) and ` 731.80 crore (February 2016). However, State Government delayed the release of first instalment of grants to Gram Panchayats (GPs). As a result of delays, State Government sanctioned ` 5.17 crore as interest, which was not released to GPs along with instalments as recommended by 14th FC.
(Paragraph 1.12)
Chapter II: Compliance Audit
2.1 Asset Management in Panchayati Raj Institutions
The assets of PRIs include movable and immovable assets historically owned by them and those acquired from time to time. A compliance audit on ‘Asset Management in PRIs’ in two districts, Anuppur and Dewas revealed the following:
• The annual plan and annual budget for economic development of panchayat areas and maintenance of assets was not prepared. GPs did not prioritise the maintenance of existing assets, which led to deterioration of assets.
(Paragraphs 2.1.2 and 2.1.3)
• GPs did not earmark fund for maintenance of assets under Panch Permeshwar scheme, which resulted in short utilisation of ` 4.55 crore on maintenance of assets. None of the GPs maintained separate bank account

Audit Report on Local Bodies for the year ended 31 March 2016
viii
for executing maintenance works, though required as per instructions of State Government. PRIs incurred inadmissible expenditure of ` 46.69 lakh, out of 13th Finance Commission Performance Grants released for construction of infrastructure development work. Audit noticed cases of suspected misappropriation and diversion of fund.
(Paragraphs 2.1.3, 2.1.3.1, 2.1.3.2 and 2.1.3.3)
• Due to lackadaisical approach of test checked PRIs, 1,764 works remained incomplete despite lapse of two to ten years which resulted in unfruitful expenditure of ` 55.72 crore on these works. Further, ` 6.00 crore received for construction of stadiums in rural areas was lying unutilised in ZPs Anuppur and Dewas despite the lapse of 15 to 36 months. The executing agency, Madhya Pradesh Laghu Udyog Nigam, did not construct/hand over e-panchayat rooms despite release of ` 6.24 crore in advance by Zila Panchayats in December 2012 and January 2014. Community assets in test checked GPs were not utilised for intended purposes.
(Paragraphs 2.1.4.1, 2.1.4.2, 2.1.4.3 and 2.1.4.4)
• Code wise database regarding immovable assets of GPs was not prepared and Geographical Information System (GIS) mapping of the infrastructure of the GPs was also not done despite recommendations of Third State Finance Commission. Internal control mechanism in the PRIs was not effective and essential records were not maintained.
(Paragraph 2.1.5)
2.2 Compliance Audit Paragraphs
• Zila Panchayat, Tikamgarh failed to deposit the Employer’s and Employees’ contributions under Employee’s Provident Fund Scheme within prescribed time, which resulted in avoidable liability of ` 26.21 lakh as interest and penalty.
(Paragraph 2.2.1)
• Interest amounting to ` 35.29 lakh received on account of Madhya Pradesh Assembly Constituency Area Development Scheme was not deposited in the Government Account, out of which ` 24.06 lakh was deposited on being pointed out by Audit.
(Paragraph 2.2.2)
• Government money amounting to ` 0.10 lakh was embezzled in Janpad Panchayat, Manawar by fraudulently inserting ten thousands digit in the invoice presented for payment.
(Paragraph 2.2.3)
Chapter III: An overview of the Functioning, Accountability Mechanism
and Financial Reporting Issues of Urban Local Bodies
• The Third State Finance Commission recommended (accepted by State Government in February 2010) that one per cent of divisible fund of the State Government should be devolved to ULBs. However, there was short devolution of ` 18.14 crore to ULBs during 2015-16.
(Paragraph 3.6)

Overview
ix
• The funds allocated to ULBs by State Government through State budget increased from ` 4,356.30 crore during 2011-12 to ` 9,262.96 crore during the year 2015-16. However, ULBs could not spend the entire allocated grants and savings ranged from eight per cent to 22 per cent during the period 2011-16 mainly due to considerable unspent balances in the Revenue Head.
(Paragraph 3.7)
• State Government published Madhya Pradesh Municipal Accounting Manual (MPMAM) for adoption of accrual basis accounting system by ULBs from 1 April 2008. However, out of 379 ULBs in the State, only 154 ULBs (41 per cent) could implement MPMAM as on August 2016.
(Paragraph 3.8.1)
Chapter IV: Performance Audit
4.1 Management of own fund by Municipal Corporations and
Municipal Councils including collection of revenue
Under MP Municipal Corporation Act, 1956 and MP Municipalities Act 1961, all moneys received by or on behalf of Corporation or Council are credited into Municipal Fund, which are applied for the purposes specified in the Act. The performance audit of Management of own fund by Municipal Corporations and Municipal Councils including collection of revenue for the period 2011-12 to 2015-16 was conducted in four Municipal Corporations and ten Municipal Councils of the State. The audit findings were as under:
• There was no mechanism available at State level to capture revenue resources and expenditure of Urban Local Bodies. The revenue raised by test checked MCs was insufficient to meet out their expenditure. The share of own revenue remained between 37 per cent and 69 per cent of total expenditure in test checked Municipal Corporations, whereas in test checked Municipal Councils, it remained between 24 per cent and 64 per cent.
(Paragraph 4.1.6)
• Property Tax Board was constituted (March 2011) to assist MCs in determination and collection of Property Tax. However, the Board did not perform its mandated duties, as there was no manpower in the Board. The collection of Property Tax, Composite Tax and user charges for water supply was significantly less than the respective demands during 2011-16. The outstanding collection in test checked MCs was ` 145.38 crore in respect of Property Tax, ` 142.69 crore in respect of Composite Tax and ` 243.65 crore in respect of user charges for water supply as on March 2016.
(Paragraphs 4.1.7 and 4.1.8)
• MC Indore failed to auction shops from last 18 to 25 years, which resulted in loss of revenue and encroachment. Further, an amount of ` 7.06 crore was outstanding for recovery on account of rent/premium of shops in test checked MCs as on 31 March 2016.
(Paragraph 4.1.10)

Audit Report on Local Bodies for the year ended 31 March 2016
x
• Budget and Accounts were not prepared as per provisions of MP Municipal Accounts Manual. Bank Reconciliation was not carried out in test checked MCs, which was fraught with the risk of misutilisation of fund.
(Paragraphs 4.1.12.1 and 4.1.12.3)
• MCs did not comply with the orders of State Government for maintaining Reserve Fund and the short credit in the Reserve Fund was ` 162.53 crore during 2011-16. Funds were drawn from Reserve Fund without sanction of competent authority.
(Paragraph 4.1.12.4)
• State Government was deprived of revenue of ` 18.60 crore due to failure of MCs to remit the State’s share of Urban Development Cess in Government Account. Further, MCs did not deposit ` 7.66 crore of taxes deducted at source (TDS) in respect of Value Added Tax, Royalty, Labour Welfare Cess and Income Tax, which was utilised by MCs for their regular expenses.
(Paragraphs 4.1.12.6 and 4.1.12.9)
• There was acute shortage of staff in Revenue Department of MCs, which adversely affected the revenue recovery process. Further, demands of taxes were not monitored on the basis of Geographical Information System Survey.
(Paragraph 4.1.13)
Chapter V : Compliance Audit
5.1 Setting up and management of Fire Services by ULBs
The Fire Services have been included as a Municipal function under Article 243 (W) in the XII Schedule of the Constitution of India. Under Madhya Pradesh Municipal Corporations Act 1956 and Madhya Pradesh Municipalities Act 1961, ULBs are responsible for establishment and maintenance of fire brigade and arrangement for the prevention and extinction of fire. The setting up and management of fire services by ULBs in the State covering period from 2011-12 to 2015-16 was examined in audit, which revealed the following:
• State Government did not prepare comprehensive plan for strengthening and management of fire services. Fire Act was not enacted in the State, despite NDMA guidelines 2012 required it be enacted within a year. Test checked ULBs did not frame regulations/bylaws to regulate fire services as envisaged under the respective Municipal Acts. Compliance of norms of National Building Code in respect of installation of fire fighting system in the buildings was not ensured by ULBs and State Fire Authority.
(Paragraphs 5.1.2 and 5.1.4.7)
• Test checked ULBs did not utilise even the realised fire tax for strengthening of fire services. The requirements of manpower and equipment for the entire State was not worked out for requesting fund in the State Plan. As a result, fire services could not be strengthened in the State and there

Overview
xi
remained large gaps in basic requirements, viz. fire stations, essential equipment and manpower.
(Paragraph 5.1.3)
• No fire station was established in test checked ULBs, except in Bhopal Municipal Corporation (BMC) and Jabalpur Municipal Corporation (JMC) which also lacked sufficient number of fire stations. Due to lack of fund, BMC and JMC did not implement fire mitigation plan published by State Government in compliance of 13th Finance Commission recommendations. There was inadequacy of essential equipment and personal protective equipment.
(Paragraphs 5.1.4.1, 5.1.4.2, 5.1.4.3 and 5.1.4.4)
• ULBs lacked firefighting manpower significantly. No recruitment against the sanctioned posts of fireman was done during 2011-16. Out of 285 personnel engaged in fire service, only 94 personnel (33 per cent) were employed on regular basis and remaining 191 personnel were either on daily wages or contract basis. No initiatives were taken for capacity building as neither any fire training centre was established by State Government nor any training programs/ courses for fire personnel was organised by ULBs.
(Paragraphs 5.1.5.1 and 5.1.5.2)
• Response time to attend fire calls was not recorded by any of the test checked ULBs. Public awareness program for fire prevention was not organised. No monitoring mechanism was in place at State level as well as at test checked ULBs level in respect of periodic inspection of fire stations/equipment and its reporting. Fire call register was not maintained properly due to which efficiency of fire services could not be assessed in audit.
(Paragraphs 5.1.4.6 and 5.1.6)
5.2 Compliance Audit Paragraphs
• Supervision fee amounting to ` 78.82 lakh was short realised from six colonizers by Municipal Council, Badnawar, district Dhar
(Paragraph 5.2.1)
• MC, Ujjain failed to deposit statutory dues in respect of Employees Provident Funds and Miscellaneous Provisions Act 1952, which resulted in avoidable payment of penalty and interest of ` 65.55 lakh.
(Paragraph 5.2.2)
• Shelter fees amounting to ` 36.37 lakh was not realised/short realised from colonizers in Municipal Corporation, Rewa.
(Paragraph 5.2.3)

Chapter I: An overview of the functioning, accountability mechanism and
financial reporting issues of Panchayati Raj Institutions
An overview of the functioning of the Panchayati Raj Institutions in the
State
1.1 Introduction
Constitution (Seventy-third Amendment) Act, 1992 conferred Constitutional status to Panchayats and provided inter alia for constitution of Panchayats at village, intermediate and district levels, fixing tenure for Panchayats and regular election, devolution by the State Legislature of powers and responsibilities upon the Panchayats and sound finance of the Panchayats. Consequent to this amendment, Madhya Pradesh State Legislature enacted the Madhya Pradesh Panchayat Raj Avam Gram Swaraj Adhiniyam, 1993 with a view to ensure effective involvement of the Panchayati Raj Institutions (PRIs) in the local administration and development activities.
The administrative set up of Panchayats in the State consists of a three tier system: Zila Panchayat (ZP) at district level, Janpad Panchayat (JP) at block level and Gram Panchayat (GP) at village level. There were 51 ZPs, 313 JPs and 22,825 GPs in the State as of March 2016.
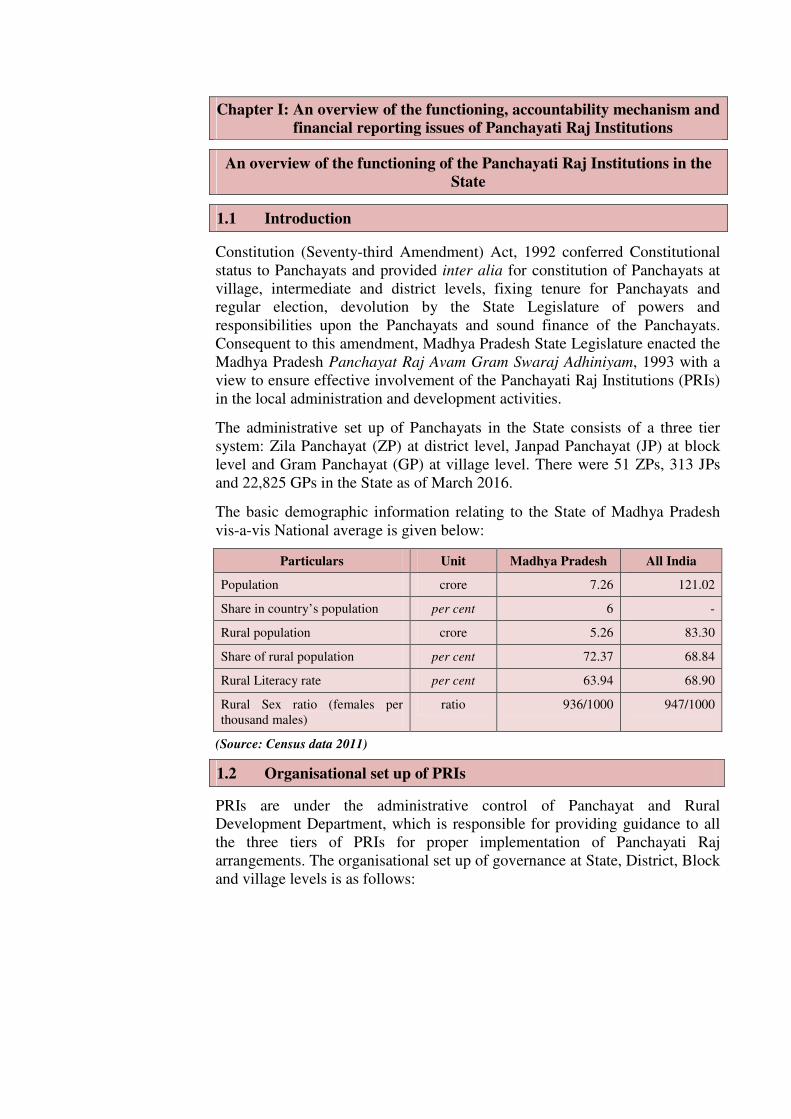
The basic demographic information relating to the State of Madhya Pradesh vis-a-vis National average is given below:
Particulars Unit Madhya Pradesh All India
Population crore 7.26 121.02
Share in country’s population per cent 6 -
Rural population crore 5.26 83.30
Share of rural population per cent 72.37 68.84
Rural Literacy rate per cent 63.94 68.90
Rural Sex ratio (females per thousand males)
ratio 936/1000 947/1000
(Source: Census data 2011)
1.2 Organisational set up of PRIs
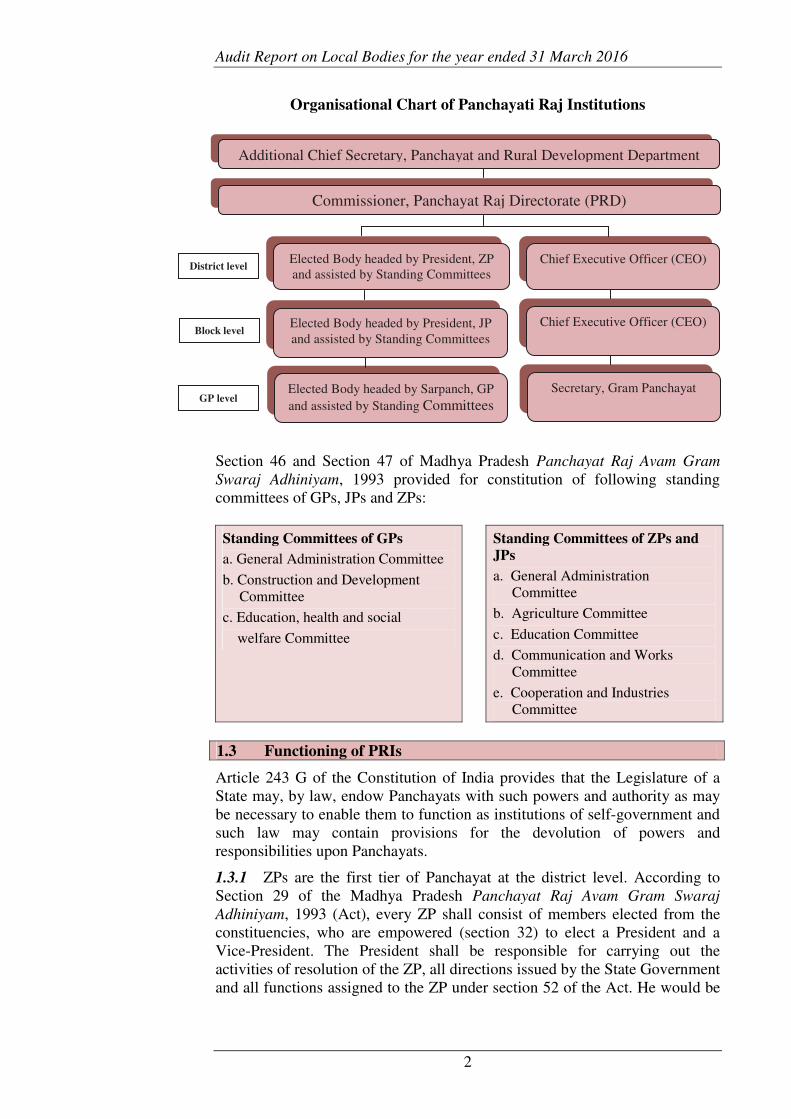
PRIs are under the administrative control of Panchayat and Rural Development Department, which is responsible for providing guidance to all the three tiers of PRIs for proper implementation of Panchayati Raj arrangements. The organisational set up of governance at State, District, Block and village levels is as follows:
Audit Report on Local Bodies for the year ended 31 March 2016
2
Organisational Chart of Panchayati Raj Institutions
Section 46 and Section 47 of Madhya Pradesh Panchayat Raj Avam Gram
Swaraj Adhiniyam, 1993 provided for constitution of following standing committees of GPs, JPs and ZPs:
1.3 Functioning of PRIs
Article 243 G of the Constitution of India provides that the Legislature of a State may, by law, endow Panchayats with such powers and authority as may be necessary to enable them to function as institutions of self-government and such law may contain provisions for the devolution of powers and responsibilities upon Panchayats.
1.3.1 ZPs are the first tier of Panchayat at the district level. According to Section 29 of the Madhya Pradesh Panchayat Raj Avam Gram Swaraj
Adhiniyam, 1993 (Act), every ZP shall consist of members elected from the constituencies, who are empowered (section 32) to elect a President and a Vice-President. The President shall be responsible for carrying out the activities of resolution of the ZP, all directions issued by the State Government and all functions assigned to the ZP under section 52 of the Act. He would be
Standing Committees of GPs
a. General Administration Committee
b. Construction and Development Committee
c. Education, health and social
welfare Committee
Standing Committees of ZPs and
JPs
a. General Administration Committee
b. Agriculture Committee
c. Education Committee
d. Communication and Works Committee
e. Cooperation and Industries Committee
Chapter I: An overview of functioning of the Panchayati Raj Institutions
3
responsible to ensure proper maintenance of records and registers, authorise payments, issue of cheque and refunds etc.
Further, Section 69 (3) states that the State Government shall appoint for every ZP a Chief Executive Officer (CEO) and may also appoint one or more Additional Chief Executive Officers, who shall discharge such functions and perform such duties as may be assigned to them by the CEO. The CEO is the administrative head and assisted by Departments like Public Health, Public Works, Rural Engineering etc. CEO, ZP is responsible to take action for resolution of ZP, supervise and control the execution of all activities of ZP. He is authorised to draw and disburse money out of the ZP fund as per the financial rule in this regard.
The CEO, ZP is responsible for preparing the budget for the planned development of the district and utilisation of the resources, drawing up annual plans for the economic development of the district and social justice and ensuring their implementation. CEO, ZP is also responsible for co-ordination, evaluation and monitoring of the schemes entrusted by the Central or State Government, appropriation of the grants received from the Central or State Governments to the JPs and GPs in accordance with the specified criteria.
1.3.2 Janpad Panchayats (JPs) are the intermediate tier of PRIs at the Block level. As per section 22 of the Act, every Janpad Panchayat (JP) shall consist of members elected from the constituencies, who are empowered (Section 25) to elect a President and a Vice-President. The president shall be responsible for carrying out the activities of resolution of the JP, all direction issued by the State Government and all functions assigned to the JP under Section 50 of the Act. He would be responsible to ensure proper maintenance of records and registers, authorise payments, issue of cheque and refunds, etc.
Further, Section 69(2) states that the State Government shall appoint for every JP a Chief Executive Officer (CEO) as the administrative head and may also appoint one or more Additional Chief Executive Officers, who shall discharge such functions and perform such duties as may be assigned to them by the CEO. The CEO, JP shall be assisted by Block Extension Officer, Accounts Officer, technical staffs like Assistant Engineers and other administrative staff. CEO, JP shall be responsible to take action for implementation of resolution of JP, supervise and control the execution of all activites of JP. He is authorised to draw and disburse money out the JP fund as per the financial rules in this regard.
1.3.3 Gram Panchayats (GPs) are the last tier of PRIs at the grass root level. As per Section 13 of the Act, every Gram Panchayat shall consist of elected Panches and a Sarpanch. The Sarpanch is elected as per the provisions envisaged in Section 17 of the Act. The Sarpanch shall be responsible for carrying out the activities of resolutions of the GP, all directions issued by the State Government and all functions assigned to the GP under Section 49 of the Act. He would be responsible to ensure proper maintenance of records and registers, authorise payments, issue of cheque and refunds etc.
Further, Section 69 of the Act provides that the State Government or the prescribed authority may appoint a Secretary for a Gram Panchayat or group of two or more Gram Panchayats. As per Gram Panchayat (Powers and function of the Secretary) Rules, 1990, it is the duty of the Secretary of the GP to convene and record the proceedings of Gram Sabha and meeting of GP,

Audit Report on Local Bodies for the year ended 31 March 2016
4
regulate the functioning of GP, maintain all the official records in GP, prepare annual plan of GP, prepare estimates of revenue and expenditure and recover taxes and other dues of GP. Secretary is also responsible for maintaining cleanliness and hygiene, maintenance and upkeep of water resources, lighting and construction of village roads, promotion of youth welfare, implementation of programmes for social welfare and any other activities entrusted by the State Government, ZP or JP.
1.4 Audit arrangement
The State Government has appointed (November 2001) Director, Local Fund Audit (DLFA) for audit of accounts of Panchayats and who shall work under the Technical Guidance and Support (TGS) of the Comptroller and Auditor General (C&AG) of India. As per the standard terms and conditions of TGS, C&AG of India has the right to conduct such test check of the accounts and to comment on and supplement the report of the Statutory Auditor, as he may deem fit. Further, the C&AG of India or his representative has the right to report to State Legislature, the result of audit at his discretion.
Madhya Pradesh State Legislative Assembly has constituted (April 2016) Local Bodies and Panchayatiraj Accounts Committee (LBPAC) for the year 2016-17 for examination of Appropriation Accounts of local bodies in the State. LBPAC is also responsible for examination of reports of C&AG laid on the table of the Legislative Assembly.
• Technical Guidance and Support provided by Indian Audit and
Accounts Department
Section 152 of Regulations on Audit and Accounts, 2007 envisages the following arrangements regarding technical guidance and support to PRIs:
• Local Fund Auditor would prepare an annual audit plan for audit of PRIs and forward it to the Accountant General (Audit) of the State.
• The audit methodology and procedure for audit of PRIs by the Local Fund Auditor would be as per various Acts and Statutes enacted by the State and guidelines prescribed by the C&AG.
• Copies of inspection reports in respect of selected local bodies shall be forwarded by the Local Fund Auditor to the Accountant General (Audit) for advice on system improvements.
The Annual Audit Plan for 2015-16 was prepared by DLFA, which was forwarded to the Accountant General (Audit). DLFA followed the methodology and procedure as suggested by the AG (General and Social Sectors Audit), Madhya Pradesh from time to time. Inspection reports were forwarded to the AG (G&SSA) Madhya Pradesh for vetting. However, Audit noticed (March 2017) that DLFA was not maintaining the consolidated information on number of PRIs audited by them during 2015-16.
• Audit Report on Local Bodies
Para 10.121 of the recommendations of Thirteenth Finance Commission envisages that Annual Technical Inspection Report of C&AG as well as the Annual Report of DLFA should be placed before the State Legislature. Accordingly, Section 129 of the MP Panchayat Raj Avam Gram Swaraj
Adhiniyam, 1993 was amended in July 2011, which lays down that the Annual

Chapter I: An overview of functioning of the Panchayati Raj Institutions
5
Audit report of DLFA on Panchayats along with the Annual Technical Inspection Report of the C&AG of India shall be submitted to the Governor, who shall cause the reports to be laid on the table of the Legislative Assembly.
Report of Comptroller and Auditor General of India on Local Bodies for the year ended 31 March 2015 was tabled in the Legislative Assembly of Madhya Pradesh in July 2016. However, reports of DLFA for the year 2012-13 and onwards are under process for laying before the State Legislative Assembly (February 2017).
1.5 Response to audit observations
During 2015-16, compliance audit of 24 out of 51 ZPs, 88 out of 313 JPs and 1,020 out of 22,825 GPs were conducted by the office of the Accountant General (General and Social Sector Audit) Madhya Pradesh, Gwalior (Appendix-1.1). For providing technical guidance and support under TGS arrangement, Inspection Reports (IRs) of Accountant General (G&SSA), Madhya Pradesh were sent to DLFA. As per TGS arrangements, DLFA was to follow up compliance with the audit paragraphs of IRs in the same manner as if these are his own reports. A total number of 32,388 paragraphs in 5,441 IRs, including 9,786 paragraphs in 1,087 IRs issued during 2015-16, were pending for settlement as on January 2017, as detailed in Table 1.1.
Table-1.1: Status of outstanding IRs and Paragraphs as on January 2017
Sl.
No.
Year Opening balance and addition during
the year
Settled during
the year
Closing Balance
OB
IRs Addition
IRs
OB
Paras
Addition
Paras
No of
IRs
No of
Paras
No of
IRs
No of
Paras
1 Up to 2011-12 3,027 -- 15,646 -- 6 357 3,021 15,289 2 2012-13 3,021 573 15,289 3,290 0 126 3,594 18,453 3 2013-14 3,594 500 18,453 3,516 0 74 4,094 21,895 4 2014-15 4,094 425 21,895 3,148 71 1,188 4,448 23,855 5 2015-16 4,448 1,087 23,855 9,786 94 1,253 5,441 32,388
(Source: Monthly Arrear Reports compiled by AG (G&SSA), Madhya Pradesh)
1.6 Social Audit
To promote transparency and accountability in the implementation of a programme and providing a collective platform such as Social Audit Gram Sabha for people to express their needs and grievances, Social Audit Unit ‘M.P. State Samajik Sampariksha Samiti’ (MPSSSS), an independent agency, was established (January 2013) in the State, which was registered under M.P. State Society Registration Act 1973. MPSSSS is responsible to build capacities of Gram Sabhas for conducting social audit and facilitate verification of records of works done under Mahatma Gandhi National Rural Employment Guarantee Scheme (MGNREGS) by primary stakeholders.
MPSSSS informed (March 2017) that 506 social audits were conducted during 2015-16. Audit noticed that Social Audits were not conducted in the State with the prescribed frequencies during 2012-13 to 2015-16, as detailed in Table 1.2.

Audit Report on Local Bodies for the year ended 31 March 2016
6
Table-1.2: Year wise status of Social Audit
(Source: Information provided by Director, MPSSSS)
Thus, the coverage of Social Audit ranged between 0.18 per cent and 3.6 per cent of the required number of Social Audits to be conducted during 2012-13 to 2015-16. Further, the number of Social Audits conducted decreased from 1,662 GPs in 2013-14 to 931 and 506 GPs during 2014-15 and 2015-16 respectively. MPSSSS informed (March 2017) that the required number of Social Audit would be conducted after recruitment against vacant posts, which was under progress.
Financial reporting issues
1.7 Sources of funds
There are mainly two sources of fund for the PRIs i.e. Government grants and own tax revenues. The Government grants include:
• grant assigned under the Fourteenth Finance Commission of India; and
• devolution of four per cent of divisible tax revenue of previous year of the State Government as per the recommendations of Third State Finance Commission.
The Third State Finance Commission recommended (accepted by State Government in February 2010) that four per cent of divisible fund1 of the State Government should be devolved to PRIs. During the year 2015-16, the devolution of SFC grants by the Finance Department to PRIs is shown in the Table 1.3.
Table - 1.3: Devolution of funds to PRIs
(`̀̀̀ in crore)
Year Divisible funds of
State Government
Funds were to
be devolved
Funds actually
devolved
Short
devolved
2015-16 28,944.50 1,157.78 910.00 247.78
(Source: Information provided by Finance Department and PRD)
It can be seen from Table 1.3 that Finance Department short devolved funds to the tune of ` 247.78 crore to PRIs during 2015-16. The Finance Department informed (October 2016) that reason for short release would be intimated after finalisation of accounts.
1 Divisible Fund: Total tax revenue of previous year minus ten per cent of expenditure
for collection of taxes and deduction of assigned revenue to PRIs and ULBs.
Sl.
No.
Year Total no
of GPs
Total no of Social
Audit to be conducted
twice in a year
Coverage of Social Audit (per
cent with reference to no. of
Social audit to be conducted)
1 2012-13 23,010 46,020 81(0.18)
2 2013-14 23,006 46,012 1,662 (3.6)
3 2014-15 22,823 45,646 931 (2.04)
4 2015-16 22,825 45,650 506 (1.11)
Total 91,664 1,83,328 3,180

Chapter I: An overview of functioning of the Panchayati Raj Institutions
7
1.8 Budgetary allocation and expenditure of PRIs
Funds (share of tax revenue of the State and grants for implementation of schemes) allocated to PRIs by the State Government through State Budget during last five years were as shown in the Table 1.4.
Table – 1.4: Statement showing receipt and expenditure of PRIs (`̀̀̀ in crore)
(Source: Appropriation Accounts Grant No. 15, 52, 62 and 74)
As evident from Table 1.4, the grant allocation increased by 167 per cent for PRIs during the year 2015-16 as compared to the year 2011-12. However, PRIs could not spend the entire allocated grants and savings ranged from six per cent to 30 per cent during the period 2011-16 mainly due to considerable unspent balances in the Revenue Head.
In reply, PRD stated (January 2017) that instructions in respect of less expenditure had been issued to PRIs.
1.9 Accounting arrangement
1.9.1 Maintenance of Accounts
Comptroller and Auditor General (C&AG) of India and Ministry of Panchayati Raj, Government of India (GoI) developed an accounting framework and codification pattern consistent with the Model Panchayat Accounting System (MPAS), which was to be introduced from 1 April 2010. MPAS provides for preparation of Receipt and Payment accounts, Consolidation abstract register, Statement of receivable and payable, Register of movable property, Register of immovable property, Inventory register, Demand and collection register etc. Government of Madhya Pradesh (GoMP) adopted MPAS with effect from August 2010.
Test check of 1,132 PRIs during the year 2015-16 revealed that none of the PRIs (24 ZPs, 88 JPs, and 1,020 GPs) was maintaining the accounts in MPAS formats. However, their accounts were maintained as per existing Accounting Rule of MP Panchayat Raj Avam Gram Swaraj Adhiniyam, 1993. Further, it was also noticed that PRD was not maintaining consolidated information regarding finalisation of annual accounts of PRIs.
In reply, PRD stated (January 2017) that instructions would be issued for maintaining the accounts in MPAS formats. However, at present, accounts were also maintained on Panchayat Darpan Website Portal.
Fact remains that none of the test checked PRIs was maintaining the accounts in MPAS formats, though adopted by GoMP with effect from August 2010.
Grants in aid Actual expenditure Unspent
funds (4-7)
Percentage
of unspent
fund Year Revenue Capital Total Revenue Capital Total
2011-12 7,670.04 241.08 7,911.12 6,697.87 365.29 7,063.16 847.96 11
2012-13 8,948.74 345.78 9,294.52 8,385.85 345.30 8,731.15 563.37 6
2013-14 10,752.72 213.70 10,966.42 9,151.26 91.10 9,242.36 1,724.06 16
2014-15 18,871.32 76.60 18,947.92 13,209.32 12.66 13,221.98 5,725.94 30
2015-16 21,044.83 110.50 21,155.33 15,272.97 1.94 15,274.91 5,880.42 28
Total 67,287.65 987.66 68,275.31 52,717.27 816.29 53,533.56 14,741.75

Audit Report on Local Bodies for the year ended 31 March 2016
8
1.9.2 Annual Budget of PRIs
As per provisions of Section 73 of MP Panchayat Raj Avam Gram Swaraj
Adhiniyam, 1993, every Panchayat shall prepare Annual Budget. The time schedule for presentation of budget was also prescribed.
Test-check of 1,132 PRIs during the year 2015-16 revealed that 253 PRIs did not prepare Annual Budget. Further, 34 PRIs prepared their budget, but not within the prescribed time. The remaining 835 PRIs (ZPs-17, JPs-44 and GPs-774) did not produce relevant records/information to Audit. Details are as shown in Table 1.5.
Table – 1.5: Status of preparation of Annual Budget
PRI No. of test
checked
PRIs
Scheduled time for
budget approval
by respective PRIs
No. of PRIs,
which did not
prepare budget
No. of PRIs, which
prepared budgets
with delays
ZP 24 20 January 02 04 (02 to 305 days)
JP 88 30 January 13 29 (6 to 526 days)
GP 1,020 21 February 238 1 (314 days)
(Source: Information compiled from test checked PRIs)
Thus, the rules for preparation of Annual Budget were not complied by the test checked PRIs.
Madhya Pradesh Panchayat Accounting Rules prescribe for reconciliation of any difference between the balances of cash book and bank accounts on monthly basis.
Test check of records 1,132 PRIs, revealed that 91 PRIs (ZPs-12, JPs-57 and GPs-22) did not prepare bank reconciliation. There were unreconciled differences in the closing balances of cash books and bank books of these 91 PRIs as of March 2015, as detailed in Appendix-1.2. Further, 107 PRIs (JPs-6 and GPs-101) did not produce relevant information/records. Failure of PRIs to reconcile the differences between balances of cash books and bank books was fraught with the risk of misuse of funds.
The CEOs of respective ZPs/JPs and Secretary of respective GPs stated (2015-16) that the bank reconciliation of difference between the balances of cash book and bank accounts would be carried out. In reply, PRD stated (January 2017) that instructions would be issued for bank reconciliation by PRIs.
1.11 Temporary advances not adjusted
Rule 52 of the MP Zila Panchayat (Accounts) Rules, 1999 and Rule 49 of MP Janpad Panchayat (Accounts) Rules, 1999 stipulate that it would be the responsibility of the person who took advance, to submit the details of expenditure immediately after the completion of purpose for which the advance was taken failing which entire amount of advance would be deducted from the next salary or other sums payable to him.
Test check of records of 1,132 PRIs revealed that temporary advances of ` 92.90 lakh provided by 44 PRIs to individuals since 1983-84, remained outstanding as on 31 March 2015. Details are given in Appendix-1.3.
1.10 Bank reconciliation statement not prepared

Chapter I: An overview of functioning of the Panchayati Raj Institutions
9
The CEOs of the concerned PRIs stated (2015-16) that the recovery of advances would be made. In reply, PRD stated (January 2017) that instructions would be issued PRIs for adjustment of temporary advance.
1.12 Fourteenth Finance Commission Grants
Fourteenth Finance Commission (14th FC) Grants-in aid were released to the State in the form of Basic Grants during 2015-16. As per 14th FC recommendations, allocations to Gram Panchayats (GPs) within the State were to be made by the respective States. Further, States were required to release the grants to the GPs within fifteen days of it being credited to their accounts by the Union Government. In case of delay, the State Government must release the instalment along with interest at the bank rate of Reserve Bank of India paid from its own funds.
Audit scrutiny revealed that State Government received ` 1,463.61 crore of basic grant as per entitlement from Government of India (GoI) in two instalments of ` 731.81 crore (July 2015) and ` 731.80 crore (February 2016). However, State Government delayed the release of first instalment of grants to GPs, as detailed in Table 1.6.
Table - 1.6: Entitlement and release of 14th
FC Basic Grant during 2015-16
(` ` ` ` in crore)
Entitlement
of State
Receipt from GoI Release to GPs Delayed
(Days)
Interest
Date Amount Date Amount
1,463.61 13.07.2015 731.81 25.08.2015 575.00 27 3.51
14.09.2015 156.81 47 1.66
18.02.2016 731.80 02.03.2016 438.79 - -
03.03.2016 293.01 - -
(Source: Information provided by Finance Department and PRD)
As a result of delays in release of grants to GPs, State Government sanctioned ` 5.17 crore as interest. However, the interest was not released to GPs along with instalments as recommended by 14th FC.
In reply, PRD stated (September 2016) that the interest could not be disbursed due to unavailability of budget in the Head ‘Interest’.
Fact remains that the failure of State Government to release Basic Grants received from GoI within the prescribed time to GPs resulted in additional liability of ` 5.17 crore towards interest.


Chapter II: Compliance Audit
PANCHAYAT AND RURAL DEVELOPMENT DEPARTMENT
2.1 Asset Management in Panchayati Raj Institutions
2.1.1 Introduction
The assets of Panchayati Raj Institutions (PRIs) include movable and immovable assets historically owned by them and those acquired from time to time, such as panchayat bhavan, block resource centre, school building, anganwadi centre, sub health centre, community well, stop dam, approach road including culvert, etc. Under Madhya Pradesh Gram Panchayat (Powers and Functions of the Secretary) Rules, 1999, the Secretary of Gram Panchayat (GP) is responsible to keep account of movable and immovable property of Gram Panchayat, pay attention on their security and maintenance and remain vigilant to avoid encroachment on immovable properties of GP. Similarly, Chief Executive Officers (CEOs) of Zila Panchayat (ZP) and Janpad Panchayat (JP) are responsible for management of the assets of Panchayats concerned.
Asset Management includes planning and decision making in creation, acquisition, proper accounting, utilisation, maintenance and disposal of assets. Two districts, Anuppur (Tribal district) and Dewas (Non-Tribal) were selected for the audit of asset management in PRIs on the basis of data of population by using Simple Random Sampling System without Replacement method. The records of CEOs ZPs Anuppur and Dewas with all the JPs of these two districts (four JPs of district Anuppur and six JPs of district Dewas) for the period from 2011-12 to 2015-16 were test checked in the audit. Within each JP, ten GPs were selected by Systematic Random Sample method. Accordingly, 100 GPs were selected for audit (Appendix-2.1).
An entry conference was held with the Secretary, Panchayat and Rural Development Department (PRDD), Government of Madhya Pradesh on 30 March 2016 to discuss the audit objectives, scope, criteria and methodology. The Exit conference was conducted with Principal Secretary, PRDD on 20 January 2017 to discuss the audit findings. The replies of Government are suitably incorporated in the report.
Audit findings
2.1.2 Planning
As per instructions of PRDD (April 2006), Gram Sabha/GP is responsible for watch and maintenance of properties of Gram Sabha and Government Departments in the rural areas. GPs were required to prepare annual plan and budget for maintenance of building, drainage, internal roads, drinking water sources, etc., which should be submitted for approval of Gram Sabha.
Further, as per section 49(A), section 50 and section 52(1) of Madhya Pradesh Panchayat Raj Avam Gram Swaraj Adhiniyam, 1993, GPs were responsible to prepare annual plans for economic development of Panchayat area and submission thereof to the JP within the prescribed time for integration with the JP plan. Further, JP was responsible to consider and consolidate annual plans

Audit Report on Local Bodies for the year ended 31 March 2016
12
of GPs for submission to ZP for consolidation in the annual plan of the district.
Audit scrutiny revealed that none of the test checked GPs prepared annual plan and annual budget. Secretaries of these GPs replied (April-July 2016) that annual plan would be prepared and provision for maintenance of asset would be made in future. Thus, GPs failed to comply with the provisions of Madhya Pradesh Panchayat Raj Avam Gram Swaraj Adhiniyam, 1993 for preparation of annual plan and instructions of PRDD for preparation of annual maintenance plan for assets in rural areas.
During exit conference (January 2017), Government replied that participative planning with GPs would be ensured from next year and for this purpose directions would be issued to PRIs.
2.1.3 Fund ManagementFund ManagementFund ManagementFund Management
For creation of assets of Panchayats, State Government provided fund to ZPs/JPs as grants-in-aid under various schemes, such as, MGNREGS, Performance Grant, Vidhayak Nidhi, Sansad Nidhi, Jan Bhagidari, etc. As per the delegation of financial powers, GPs were executing agency for works up to ` 10 lakh in respect of State sponsored scheme and up to ` 15 lakh in case of Central sponsored scheme. The works beyond above limit were being executed by Rural Engineering Services, which is an agency of PRDD. The total receipts and expenditure out of fund for creation of assets in the test checked ZPs and JPs were as detailed in Table 2.1Table 2.1Table 2.1Table 2.1....
Table – 2.1: Year wise receipt and expenditure for creation of assets in test
checked ZPs and JPs under Central and State Schemes (` ` ` ` in crore)
Year Opening
balance
Receipt including
interest and other
Total Expenditure Closing
balance
2011-12 23.43 46.29 69.72 30.21 39.51
2012-13 39.51 157.24 196.75 136.61 60.14
2013-14 60.14 181.39 241.53 147.79 93.74
2014-15 93.74 131.78 225.52 122.13 103.39
2015-16 103.39 93.17 196.56 101.17 95.39
(Source: Information collected from test checked ZPs and JPs)
Thus, the grants for creation of assets was increased over the years 2011-12 to 2015-16. However, ZPs/JPs were not able to utilise the grants for creation of assets and the unutilised balances during these years ranged between ` 39.51 crore to ` 103.39 crore.
In addition to above, State Government also released fund directly to GPs for assets creation under Panch Parmeshwar scheme, which was launched during the year 2011-12. Under the scheme, fund from various grants-in-aid schemes, such as 13th/14th Finance Commission, State Finance Commission, grants for strengthening Gram Sabha and grants to PRIs for maintenance of assets, were transferred in a lump sum by State Government directly to the bank account of GPs.
As per scheme guideline, fund received under Panch Parmeshwar scheme was to be utilised for construction of internal roads/drainage, construction of building for Anganwadi Centre and e-Panchayat room. Further, 20 per cent of the fund under the scheme was to be incurred for maintenance of assets.
Annual plan for economic economic economic economic development of development of development of development of Panchayat areaPanchayat areaPanchayat areaPanchayat areas s s s and maintenance and maintenance and maintenance and maintenance of assets not of assets not of assets not of assets not preparedpreparedpreparedprepared

Chapter II: Compliance Audit
13
During 2011-16, ` 196.16 crore were released to 777 GPs under the test checked ZPs, Anuppur (` 71.93 crore) and Dewas (` 124.23 crore) under Panch Parmeshwar scheme. As against this, total expenditure of ` 162.48 crore (` 60.07 crore and ` 102.41 crore in Anuppur and Dewas respectively) was incurred by GPs. However, audit scrutiny revealed that test checked GPs did not utilise 20 per cent of the scheme fund on maintenance of assets though envisaged under the scheme guidelines, as detailed in Table Table Table Table 2.22.22.22.2.
TableTableTableTable ---- 2.2.2.2.2222: U: U: U: Utilisation of fund for maintenance of assets tilisation of fund for maintenance of assets tilisation of fund for maintenance of assets tilisation of fund for maintenance of assets underunderunderunder Panch
Parmeshwar sssschemechemechemecheme in test checkin test checkin test checkin test checked GPsed GPsed GPsed GPs ((((` ` ` ` in crorein crorein crorein crore))))
Year Fund received under
Panch Parmeshwar
Scheme
20 per cent of total
release, to be utilised
for maintenance of
assets
Actual
expenditure on
maintenance
of assets
short
utilisation on
maintenance
of assets
2011-12 6.01 1.20 0.06 1.14
2012-13 6.03 1.20 0.14 1.06
2013-14 6.46 1.29 0.25 1.04
2014-15 3.45 0.69 0.32 0.37
2015-16 6.40 1.28 0.34 0.94
TotalTotalTotalTotal 28.3528.3528.3528.35 5.665.665.665.66 1.111.111.111.11 4.554.554.554.55
(Source: Information collected from PRD and test checked GPs)
Thus, there was short utilisation of ` 4.55 crore on maintenance of assets during 2011-16 under Panch Parmeshwar scheme. Audit scrutiny revealed that out of 100 test checked GPs, 32 to 84 GPs did not incur any expenditure on maintenance of assets during the period 2011-16. Further scrutiny revealed that none of the GPs maintained separate bank account for executing maintenance works, though it was required under instructions of PRDD (April 2006).
Audit scrutiny revealed that out of 70 Community Sanitary Complex1 (CSC)
constructed in the GPs of ZP Anuppur and Dewas, 65 CSCs2 were defunct due to lack of maintenance. It was further noticed that GPs were also not levying any user charges for cleaning and maintenance of CSCs. CEOs of respective JPs replied (June 2016) that CSCs became defunct due to unavailability of fund for maintenance. Thus, maintenance of assets was not prioritised by these GPs despite provided under Panch Parmeshwar scheme, which led to deterioration of assets of Panchayats.
During exit conference (January 2017), Government replied that it was not compulsory to incur 20 per cent of grants-in-aid under Panch Parmeshwar
scheme for expenditure on maintenance of asset, as it was the maximum limit. It further replied that instructions would be issued to PRIs for repair of CSCs.
Reply of Government is not acceptable, as the guidelines of Panch Parmeshwar Scheme provided for earmarking of 20 per cent of fund for maintenance of assets.
1 24 in GPs of ZP Anuppur and 46 in GPs of ZP Dewas 2 22 in GPs of Anuppur and 43 in GPs of ZP Dewas
GPs Short utilised
` ` ` ` 4.55 crore for
maintenance of
assets under
Panch
Parmeshwar
scheme

Audit Report on Local Bodies for the year ended 31 March 2016
14
2.1.3.1 Diversion of 13th
Finance Commission Performance Grant
As per Panchayat Raj Margdarshika issued by PRDD, 13th Finance Commission performance grant released to ZPs and JPs was to be utilised for construction of infrastructure development works, such as, e-Panchayats and Panchayat Bhavan in GPs, cement concrete roads, drainage, culverts, public urinals, creation of basic amenities like furnishing office buildings of Panchayats and extension of Panchayat Bhavans, construction of boundary walls, etc.
Scrutiny of records revealed that out of 13th Finance Commission Performance Grants, ZP Anuppur, JP Bagli and JP Khategaon incurred expenditure of ` 46.69 lakh (Table 2.3) for construction of Janpad Panchayat Bhavan, Staff Quarters and shops, which was inadmissible expenditure as per guidelines issued by PRDD in Panchayat Raj Margdarshika.
Table 2.3: Works other than specific purpose executed from performance
grant (` ` ` ` in lakh)
Sl.
No.
ZP/JP Name of works Total
works
Sanctioned
amount
Expenditure
incurred as on
May 2016
1 Zp Anuppur Janpad Panchayat Bhavan and Staff Quarters
2 51.90 35.49
2 JP Bagli Construction of shops 16 11.83 09.70
3 JP Khategaon Construction of shop 1 1.50 1.50
Total 19 65.23 46.69
(Source: Information collected from test checked ZPs and JPs)
During exit conference (January 2017), Government replied that expenditure was incurred to meet out the basic requirements and in accordance with the guidelines.
The reply is not acceptable, as the sanctioned works were not the specified works of infrastructure development as detailed in the guidelines.
2.1.3.2 Suspected misappropriation of fund
Section 92(1) of Panchayat and Gram Swaraj Act envisaged that in opinion of competent authority, if any amount/article/record is kept in unauthorised way by any person then competent authority would issue written order for the recovery of the same.
Scrutiny of records relating to execution of works as well as joint physical verification of the works revealed suspected misappropriation of ` 4.24 lakh in three GPs, as detailed in the Table 2.4.
Table – 2.4: Cases of suspected misappropriation of scheme fund
Sl.
No.
Executing agency
of works
Audit observation
1. GP Juhili of JP Pushprajgarh Distt. Anuppur
Fund of ` 5.00 lakh and ` 2.50 lakh were released in April 2013 and December 2013 respectively against the sanctioned cost of ` 10 lakh (` 5 lakh each) for construction of Samudayik
Bhavan and e-Panchayat room under Backward Region Grant Fund (BRGF). Sarpanch and Secretary withdrew ` 7.49 lakh during 2013-15 for these works, whereas value of work
PRIs incurred
inadmissible
expenditure of
`̀̀̀ 46.69 lakh out
of 13th
FC
performance
grant

Chapter II: Compliance Audit
15
Sl.
No.
Executing agency
of works
Audit observation
executed was only ` 4.70 lakh as per the measurement book. Thus, fund amounting to ` 2.79 lakh was withdrawn in excess of actual execution of works. In reply (April 2016), GP stated that the amount was withdrawn by former Sarpanch and Secretary from the bank account and the work was stopped since December 2014 (in respect of Samudayik Bhavan) and December 2015 (in respect of e-panchayat room). Fact remains that the withdrawal of ` 2.79 lakh in excess of work done indicated that Government money may have been embezzled.
2 GP Choubarajagir of JP Sonkachha (Dewas)
Manglik Bhavan costing ` 1.00 lakh was sanctioned (March 2010) from Sansad Nidhi against which ` 0.90 lakh (` 0.50 lakh in June 2010 and ` 0.40 lakh in June 2014) were released. Audit noticed that ` 0.70 lakh was withdrawn for the work by Secretary and Sarpanch. However, the value of work executed was only ` 0.44 lakh as per the measurement book. In reply (June 2016), GP stated that the work was executed by former Secretary till roof level and stopped thereafter. Thus, there was suspected misappropriation of ` 0.26 lakh.
3 GP Dhaturiya JP Tonk-Khurd (Dewas)
A Manglik Bhavan in Anusuchit Basti Vikas Yojana was sanctioned for ` 5.00 lakh in 2010-11. JP Tonk-Khurd released an amount of ` 4.00 lakh in two instalments, each of ` 2.00 lakh in December 2011 and January 2014, against which ` 3.65 lakh was withdrawn up to 2013-14 by Sarpanch and Secretary. However, the value of work executed was only ` 2.46 lakh as per measurement book. Thus, there was suspected misappropriation of ` 1.19 lakh. In reply (July 2016), GP stated that former Sarpanch and Secretary withdrew ` 3.65 lakh and the work was stopped due to withdrawal of fund and cost escalation.
During exit conference (January 2017), Government stated that matter would be examined and accordingly misappropriated fund would be recovered.
2.1.3.3 Diversion of grants-in-aid received for maintenance of assets
State Government released ` 61.37 lakh to the test checked ZPs/JPs during 2010-11 to 2012-13 for maintenance of assets of GPs. Out of ten test checked JPs, only JP Kotma (ZP Anuppur) released the entire grant-in-aid of ` 1.21 lakh to GPs. Six other JPs3 diverted grants-in-aid amounting to ` 38.47 lakh for expenditure on general purposes, i.e., salary of staff and other expenditure and construction of new works. In ZP Anuppur, JP Dewas and JP Jaithari, the entire grants-in-aid of ` 22.39 lakh was lying unutilised, despite lapse of more than three years of receipt of fund. JP Anuppur surrendered the grant-in-aid amounting to ` 2.10 lakh after keeping it unutilised for three years. Thus, ZPs/JPs did not utilise the specific purpose grants-in-aid received for maintenance of assets of GPs.
During exit conference (January 2017), Government replied that instruction would be issued to utilise the specific grants for the intended purposes.
3 Bagli, Kannod, Khategaon, Pushprajgarh, Sonkachha and Tonkkhurd
PRIs diverted
`̀̀̀ 38.47 lakh
received for
maintenance of
assets to
expenditure on
general purposes

Audit Report on Local Bodies for the year ended 31 March 2016
16
However, the fact remains that six JPs unauthorisedly diverted specific purpose grants-in-aid for purposes other than for which it was sanctioned, which required regularisation.
2.1.4 Creation, utilisation and maintenance of assets
2.1.4.1 Unfruitful expenditure on incomplete works
Scrutiny of records revealed that 1764 works sanctioned under various schemes during 2006-07 to 2013-14 in test checked PRIs were incomplete despite the lapse of two to ten years, as detailed in Table 2.Table 2.Table 2.Table 2.5. 5. 5. 5. These works included construction of samudayik bhavan, sanskritik bhavan, sub health centres, e-panchayat bhavan, rain basera, yatri pratikshalaya, kitchen sheds in schools, anganwadi centres, chabutra nirman, road connectivity, etc. As a result, expenditure of ` 55.72 crore incurred on these works remained unfruitful.
Table Table Table Table ------------ 2.5: 2.5: 2.5: 2.5: Details of incomplete works in test checked PRIs
(`̀̀̀ in lakh)
Year of sanction No. of incomplete works Expenditure incurred on incomplete works
2005-06 1 0.20 2006-07 21 12.60 2007-08 17 10.12 2008-09 14 10.68 2009-10 324 194.70 2010-11 115 77.46 2011-12 85 548.01 2012-13 75 515.25 2013-14 1,112 4,202.73 1,764 5,571.75
(Source: Information collected from test checked ZPs and JPs)(Source: Information collected from test checked ZPs and JPs)(Source: Information collected from test checked ZPs and JPs)(Source: Information collected from test checked ZPs and JPs)
In reply (July 2016), CEOs of ZPs and JPs stated that works remained incomplete due to reluctant attitude of Sarpanchs and Secretaries of GPs and they would be directed to complete these works soon.
During exit conference (January 2017), Government stated that instruction would be issued to ensure the completion of works within prescribed time frame.
2.1.4.2 Unutilised grants-in-aid of infrastructure development works
Performance grant of ` 2.40 crore (` 1.50 crore in July 2014 and ` 0.90 crore in March 2015) and ` 4.00 crore (` 2.50 crore in July 2014 and ` 1.50 crore in March 2015) was released to ZPs Anuppur and Dewas respectively for construction of eight Stadiums4 in rural area. Further, an amount of ` 10 lakh was released (July 2013) to ZP Dewas for preparation of Detailed Project Report (DPR) for Haat Bazar under Mukhya Mantri Haat Bazar Scheme.
Audit scrutiny revealed that ZP Anuppur did not incur any expenditure out of grants-in-aid of ` 2.40 crore as on March 2016. Further, fund amounting to ` 3.50 crore pertaining to construction of Stadiums and ` 10 lakh for preparation of DPR for Haat Bazar were lying unutilised with ZP Dewas as on June 2016.
4 three in District Anuppur and five in District Dewas
Expenditure of
`̀̀̀ 55.72 crore
incurred on
1764 incomplete
works remained
unfruitful
Chapter II: Compliance Audit
17
CEO of ZP Anuppur replied (April 2016) that administrative sanction of the work was issued but the fund was not released to implementing agency due to uncompleted tendering process. CEO of ZP Dewas replied (June 2016) that the first installments of two works were released to implementing agency and the process for other works were under progress. Regarding fund pertaining to
preparation of DPR for Haat Bazar, CEO of ZP Dewas stated (June 2016) that fund would be released after preparation of DPR.
During exit conference (January 2017), Government stated that instructions would be issued for expediting the tender and other process to ensure the utilisation of fund.
Fact remains that infrastructure development fund amounting to ` 6.00 crore was lying unutilised despite the lapse of 15 to 36 months.
2.1.4.3 Construction of pre-fabricated e-Panchayat rooms
For the construction of pre-fabricated e-Panchayats rooms in GPs, State Government entered into rate contract (November 2011) with Madhya Pradesh Laghu Udyog Nigam (MPLUN) and directed (May 2012) CEOs of ZPs to depute MPLUN as agency for execution of work. Scrutiny of records relating to construction of pre-fabricated e-Panchayats rooms in test checked districts revealed the following:
• ZP Anuppur issued work order (December 2012) for 200 pre-fabricated e-Panchayat rooms under Integrated Action Plan (IAP) scheme to MPLUN at the rate contract finalised by the State Government. The ZP deposited ` 2.52 crore with MPLUN as an advance (December 2012), which was 25 per cent of the total cost amounting to ` 10.08 crore of work. As per the work order, construction was to be completed within three months.
Due to slow progress of work, the ZP cancelled 150 works (May 2013) and directed MPLUN to finish the remaining 50 works in three months. However, MPLUN could complete only 14 works valuing ` 0.71 crore, but the completed works were not handed over to GPs (August 2016). Audit further noticed that ZP Anuppur had directed (May 2016) MPLUN to refund the balance advance of ` 1.81 crore.
• ZP Dewas issued work order (September 2013) for 304 pre-fabricated e-Panchayat rooms to MPLUN from stamp-duty fund. Advance payment of ` 3.72 crore was also deposited (January 2014) with MPLUN, which was 25 per cent of the total cost amounting to ` 10.08 crore of work. Construction was to be completed by March 2014. However, ZP cancelled 233 works during March 2014 to December 2014 due to failure of MPLUN to commence the work. Audit noticed that only 37 works valuing ` 1.81 crore was completed and 34 works were neither completed nor the fund pertaining to these works were refunded as on July 2016. Further, 37 completed works were not handed over to GPs as the joint physical verification was not conducted by the team of Executive Engineer RES, Sub Engineer MPLUN and CEO JP.
Thus, MPLUN failed to construct e-panchayat rooms despite advance of ` 6.24 crore deposited by ZPs, Anuppur and Dewas in December 2012 and January 2014 respectively. The cost of constructed e-panchayat rooms worked out ` 2.52 crore. Thus, ` 3.72 crore was lying with MPLUN, which resulted in undue financial benefit to MPLUN.
MPLUN did not
construct/handed
over e-panchayat
rooms, despite
release ` ` ` ` 6.24 6.24 6.24 6.24 crore in advance crore in advance crore in advance crore in advance in in in in December 2012 December 2012 December 2012 December 2012 and January 2014and January 2014and January 2014and January 2014

Audit Report on Local Bodies for the year ended 31 March 2016
18
During exit conference (January 2017), Government replied that instructions would be issued to MPLUN and CEOs of respective ZPs and JPs to conduct the physical verification of the constructed e-Panchayat rooms and complete the process of handing over to respective GPs.
2.1.4.4 Assets not being utilised for intended purposes
Audit scrutiny revealed that 18 community assets in four JPs and 12 GPs, consisting of four Block Resource Centres, seven Samudayik Bhavan, five e-Panchayat Rooms, One Sub Health Centre and One GP Bhavan, were either remained untilised or being used for other than intended purpose as shown in Appendix-2.2.
During exit conference (January 2017), Government stated that instructions would be issued to PRIs to ensure the utilisation of assets for the intended purposes.
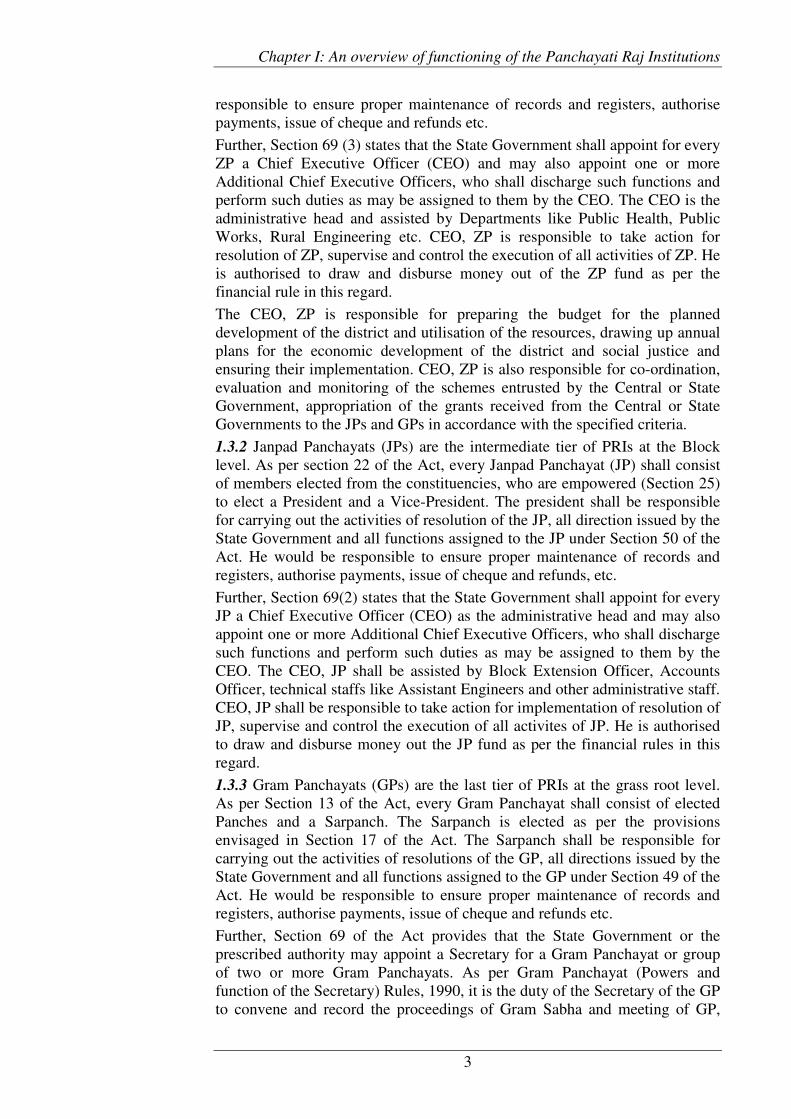
Case study of e-Panchayat Bhavan, GP Harnavda PRDD directed (May 2012) to all ZPs for construction of e-Panchayats as additional room in the Panchayat Bhavan. Audit scrutiny revealed that e-Panchayat Bhavan, GP Harnavda (JP Tonk Khurd, ZP Dewas) was completed at cost of ` 4.35 lakh in August 2015. However, joint physical verification (July 2016) revealed that e-Panchayat Bhavan was lying empty, as can be seen from photograph:
In reply, Secretary of GP stated (July 2016) that constructed e-Panchayat Bhavan was not in use as the structure is far from Panchayat Bhavan. Thus, due to failure of GP to follow the instruction of PRDD for construction of e-panchayats as an additional room in the Panchayat Bhavan, the investment of government money in the e-Panchayat, Harnavda remained unfruitful, as it was not utilised for intended purpose and the facilities expected from e-panchayat, i.e., providing common internet service center to villagers including rail e-ticketing, were not provided.

Chapter II: Compliance Audit
19
2.1.4.5 Computer peripherals not utilised for providing services to
villagers
As per guidelines of e-Panchayat Scheme, all the GPs were to be connected directly with nationwide and Statewide network so that GPs could be able to facilitate villagers a common service centre wherein villagers were to be provided facilities like rail e-ticketing and other facilities which could be directly provided to villagers through computer and internet. For this purpose State Government provided computer peripherals and LED TVs to all the GPs of the State.
Audit scrutiny revealed that out of 100 test checked GPs, only 60 GPs had electricity connection and 22 GPs had net connectivity. During joint physical verification, audit noticed that computer peripherals were kept by Sarpanch and Gram Rozgar Sahayak at their homes in 11 GPs5, in three GPs6 at Janpad Panchayat office and in GP Singavada at primary school. In two other GPs, Barbuspur and Juhili, computer peripherals and LED TVs were kept idle in Gram Panchayat Bhavan since June 2014 due to lack of electric connection/net connectivity in both GPs.
5 Dhumma, Harad, Pyari No-2, Baihatola, Budasa, Kanheriya, Pandi, Jamli,
Rolupipaliya, Khajuriyajagir and Lohari 6 Chaplasha, Raipura and Sonkhedi
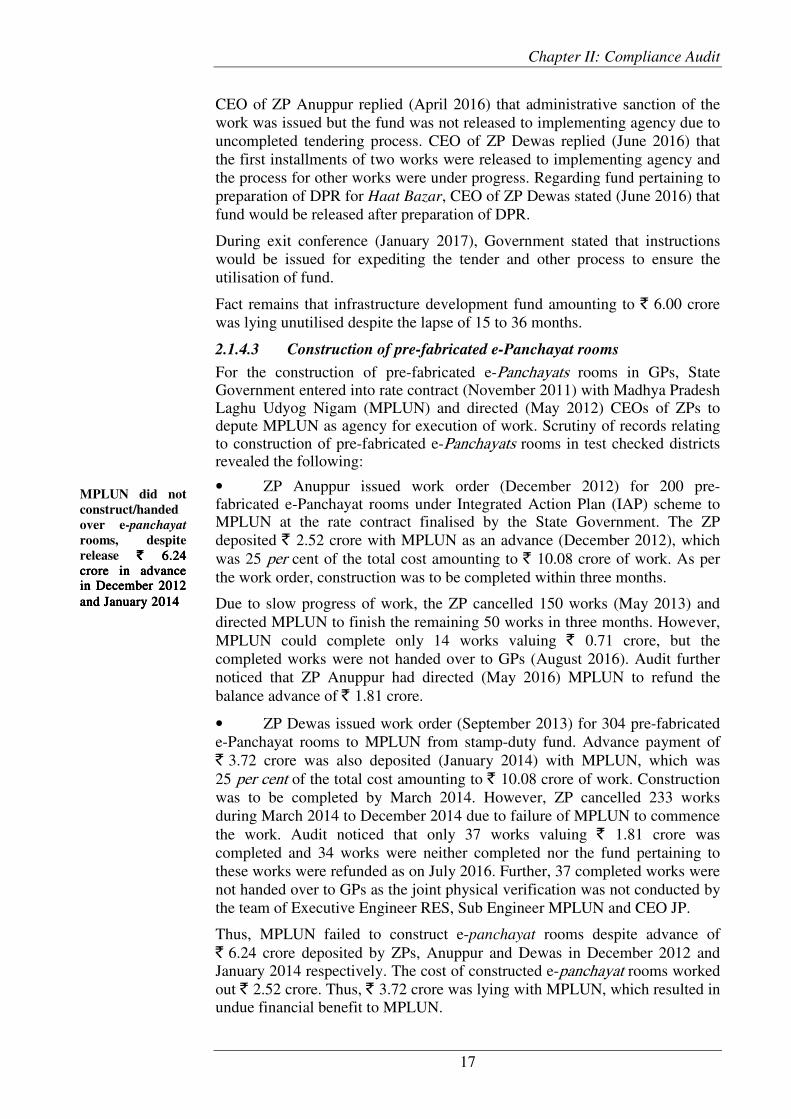
Case StudyCase StudyCase StudyCase Study ofofofof Samudayik Bhavan of GP Harri (Jaithari, Anuppur)
A Samudayik Bhavan was constructed (April 2012) in GP Harri (JP Jaithari, ZP Anuppur) at a cost of ` five lakh under Backward Region Grant Fund (BRGF) Scheme. Joint physical verification (April 2016) revealed that the Samudayik Bhavan was occupied by a Fair Price shop of Public Distribution System (PDS) managed by a cooperative society, as can be seen from photograph:
On being pointed out, secretary of GP stated (April 2016) that the building was given for PDS shop as per oral order of District Collector/CEO, ZP. However, GP was not getting any rent for operating the PDS shop. The reply was not acceptable, as GP could not produce any evidence in support of its reply and the use of Samudayik Bhavan for PDS shop was unauthorised.

Audit Report on Local Bodies for the year ended 31 March 2016
20
During exit conference (January 2017), Government replied that works of electrification and net connectivity in GPs were in progress and these facilities would be provided soon to those GPs where presently these facilities were not being provided.
2.1.4.6 Theft of Computer peripherals and LED TVs due to improper
security arrangements (`̀̀̀ 23.59 lakh)
As per Gram Panchayat Lekha Niyam 1999 Secretary of GP or any office bearer assigned with the charge of store would be responsible for the custody of the store.
Audit scrutiny revealed that computer peripherals and LED TVs costing ` 23.59 lakh were stolen in 43 GPs of seven test checked JPs of both the test checked ZPs as shown in AppendixAppendixAppendixAppendix----2.2.2.2.3333....
During exit conference (January 2017), Government stated that instructions would be issued to PRIs for making proper security arrangements of computer peripherals and other movable assets.
2.1.4.7 Annual inspection of buildings and structure not conducted
As per para 3.063 to 3.065 of MP Works Manual, the soundness of every public building and structure should be examined at least once in a calendar year. Audit scrutiny revealed that 129 GP Bhavan of ZP Dewas were reported (December 2015) in unsound condition by the CEO ZP to State Government. Similarly, ZP Anuppur reported (January 2016) 76 GP Bhavan in unsound condition. However, annual inspection of buildings and structures within the jurisdiction of theses ZPs was not conducted through any technical team and any estimate to repair the deficient building was not prepared.
During exit conference (January 2017), Government stated that directions for annual inspection of buildings and structures would be given to PRIs.
2.1.5 Internal control Mechanism
2.1.5.1 Unavailability of documents regarding transfer of assets to GPs
As per circular of PRDD (2003), all Government assets constructed in the villages and pertaining to subjects enshrined in Eleventh Schedule of Constitution were to be handed over to GPs to assign them the ownership of those assets. List of handed over assets were to be prepared in three copies and one copy of the same were to be kept in respective GPs and JPs
Audit scrutiny revealed that documents regarding transfer of community assets were not available with ZPs, JPs and GPs. Secretaries and CEOs of GPs and JPs, ZPs respectively stated that though the assets were in possession of GPs, but the copies of handing over documents were not available with them.
During exit conference (January 2017), Government stated that instructions would be issued for documentation of assets transferred to GPs from other Departments and keeping the copy of the same at respective ZPs and JPs.
2.1.5.2 Essential records not maintained
• State Government directed (April 2006) to all CEOs of ZP, GPs were required to prepare an Asset Maintenance Register wherein time to time entries regarding repairing of assets were to be recorded by Secretaries of the GPs. However, none of the GP prepared Asset Maintenance Register.
ZPs did not
conduct annual
inspection of
buildings and
structures to
prepare estimates
of repair for the
deficient building

Chapter II: Compliance Audit
21
• As per Rule 56 of Zila Panchayat Lekha Niyam 1999, Rule 53 of Janpad Panchayat Lekha Niyam 1999 and Rule 55 of Gram Panchayat Lekha Niyam 1999, all the immovable assets with ZP, JP and GP should be recorded in the prescribed format. However, none of the test checked ZP and JP was maintaining the immovable asset registers. Out of 100 test checked GPs, 24 GPs were maintaining the asset registers but the same were neither in the prescribed format nor were these updated. Remaining 76 GPs test checked were not maintaining the asset register.
• According to Rule 58 of ZP Lekha Niyam 1999, Rule 55 of JP Lekha Niyam 1999 and Rule 56 of GP Lekha Niyam 1999, stock register should be maintained in the prescribed format and physical verification of same should be conducted at least twice in a year by each ZP/JP. Audit scrutiny revealed that all test checked ZPs and JPs stock registers maintained, but physical verification was not done except in JP Tonkkhurd. However, none of the test checked GPs were maintaining stock registers.
During the exit conference (January 2017), Government replied that instructions would be issued to ensure the maintenance of respective registers and periodic physical verification of the stock.
2.1.5.3 Database of assets and Geographical Information System (GIS)
mapping of the assets of PRIs not maintained.
As per recommendation of Third State Finance Commission, each infrastructure of the village is to be mapped and in view of the e- governance, a database of assets available is to be prepared at GPs after conducting the survey with the help of GIS. State Government directed (April 2006) all JPs and ZPs to prepare a codewise registration of database of the assets to have the information of the available assets and to link the information with Panchlekha Software System.
Scrutiny of records of all test checked ZPs and JPs revealed that codewise database of assets of GPs was not prepared. Directorate, Panchayat Raj informed (February 2016) that the GIS mapping of the infrastructures of the GPs was not done.
During exit conference (January 2017), Government stated that presently details of newly created assets were being uploaded in Panchayat Darpan Portal. Decision regarding GIS mapping of assets of GPs would be taken at Government level.
The reply is not acceptable, as the database regarding the number and nature of assets with PRIs, their locations and conditions was neither available at State level nor at PRIs level.
2.1.5.4 Inspection registers in GPs not maintained and inspection
notes/reports not issued
As per circular (August 2003) of PRDD, works would be supervised by the technical officers from time to time. The officers would put their remarks in the inspection register.
Data base of
assets of GPs was
not maintained
in any of the test
checked ZPs and
JPs
Essential
records were
not
maintained by
PRIs

Audit Report on Local Bodies for the year ended 31 March 2016
22
Audit scrutiny revealed that only one GP Juhili kept inspection register, but the entries regarding inspection of works were not found. Further, documents regarding inspections conducted, viz., inspection diaries and inspection note/reports and compliance report were not available at any test checked ZPs and JPs.
During exit conference (January 2017), Government stated that direction would be given to PRIs for compliance of earlier instructions regarding inspection and monitoring of the construction works.
2.1.5.5 Social Audit of works other than MGNREGS not conducted
As per PRDD circular (April 2006), social audit of development and maintenance works was to be conducted. Audit noticed that social audit of MGNREGS works of all 80 GPs under JP Jaithari of ZP Anuppur was conducted during 2013-14. However, social audit of MGNREGS works in other GPs and development/repair/maintenance works under other schemes were not conducted.
During the exit conference (January 2017), Government stated PRIs would be directed to ensure the social audit of works constructed under all scheme fund.
2.1.6 Summary of conclusions and recommendations
• The annual plan and annual budget for economic development of panchayat areas and maintenance of assets was not prepared. GPs did not prioritise the maintenance of existing assets, which led to deterioration of assets.
Recommendation: State Government should ensure that GPs comply with the provisions for preparation of annual plan for economic development of panchayat areas and maintenance of assets.
• GPs did not earmark fund for maintenance of assets under Panch
Permeshwar scheme, which resulted in short utilisation of ` 4.55 crore for maintenance of assets. None of the GPs maintained separate bank account for executing maintenance works, though required as per instructions of State Government. PRIs incurred inadmissible expenditure of ` 46.69 lakh, out of 13th Finance Commission performance grant released for construction of infrastructure development work. Audit noticed cases of suspected misappropriation and diversion of fund.
Recommendation: State Government should ensure proper utilisation of grants-in-aid released to PRIs for maintenance of assets. Responsibility should be fixed for diversion and misappropriation of fund. Fund for maintenance of assets should be earmarked and kept in separate bank account.
• Due to lackadaisical approach of test checked PRIs, 1,764 works remained incomplete despite lapse of two to ten years which resulted in unfruitful expenditure of ` 55.72 crore on these works. Further, ` 6.00 crore received for construction of stadiums in rural areas was lying unutilised in ZPs Anuppur and Dewas despite the lapse of 15 to 36 months. The executing agency, MPLUN, did not construct/hand over e-panchayat rooms despite release of ` 6.24 crore in advance in

Chapter II: Compliance Audit
23
December 2012 and January 2014. Community assets in test checked GPs were not utilised for intended purposes.
Recommendation: Fund should be released to executing agencies on the basis of progress of works and penalty for delays should be imposed. Needs assessment for creation of rural infrastructure should be done prior to sanction of the works so as to ensure the optimum utilisation of assets.
• Code wise database regarding immovable assets of GPs was not prepared and GIS mapping of the infrastructure of the GPs was also not done despite recommendations of Third State Finance Commission. Internal control mechanism in the PRIs was not effective and essential records were not maintained.
Recommendation: PRIs should ensure maintenance the records of immovable and movable assets in the prescribed format and keep them updated. State Government should ensure that GIS mapping of assets of GPs and their code wise database are prepared on priority and kept online in Panchyat Darpan.
2.2 Compliance Audit Paragraphs
PANCHAYAT AND RURAL DEVELOPMENT DEPARTMENT
2.2.1 Avoidable liability of interest and penalty
Zila Panchayat, Tikamgarh failed to deposit the Employer’s and
Employees’ contributions under Employee’s Provident Fund Scheme
within prescribed time, which resulted in avoidable liability of `̀̀̀ 26.21
lakh as interest and penalty.
The Employees Provident Funds and Miscellaneous Provisions Act 1952 (EPF Act), which was enacted by Parliament, provides for the institution of provident fund for employees in factories and other establishments. Under the provisions of the Employee’s Provident Fund Scheme, 1952, which was framed by the Central Government under the EPF Act, the employer shall deduct the employee’s contribution from his wages which together with his own contribution shall be deposited to the fund within fifteen days of the close of every month. In case of default in payment of contribution, the employer may be liable to pay penalty and interest at the rate specified under EPF Act.
Panchayat and Rural Development Department (PRDD), Government of Madhya Pradesh ordered (December 2008) for deduction of EPF contribution in respect of contractual employees working in PRDD and its subordinate organisations.
Scrutiny of records of Chief Executive Officer (CEO) Zila Panchayat (ZP), Tikamgarh (February 2016) revealed that ZP deducted EPF contribution amounting to ` 20.60 lakh as employer’s and employees’ contribution for the period from January 2009 to January 2015 in respect of contractual employees appointed under various schemes, viz., Total Sanitation Campaign (TSC), District Rural Development Authority (DRDA), Backward Region Grant Fund (BRGF) and Mid-Day Meal (MDM). However, ZP, Tikamgarh did not deposit

Audit Report on Local Bodies for the year ended 31 March 2016
24
these EPF deductions together with employer’s contribution to Employees Provident Fund Organisation (EPFO) till the date of audit.
In reply, ZP, Tikamgarh stated (February 2016) that the amount would be deposited to EPFO after receiving allotment under DRDA. Audit further noticed that the entire deduction of ` 20.60 lakh was deposited to EPFO in April 2016. However, EPFO had levied interest of ` 9.59 lakh and penalty ` 16.62 lakh on ZP, Tikamgarh due to delays in depositing the EPF contributions, which was yet to be paid by the ZP (February 2017).
In the exit conference (January 2017), the Government stated that instructions were being issued to all Zila/Janpad Panchayats for depositing the deducted EPF amount in the EPF account of employees concerned within prescribed period. ZP Tikamgarh had taken action. Besides, watch would be kept over depositing the EPF deductions within time.
Fact remains that the failure of ZP, Tikamgarh to comply the provisions of the EPF Act resulted in creation of an avoidable liability of penalty and interest of ` 26.21 lakh.
2.2.2 Deposit of interest to Government Account
According to para 3.6 of Madhya Pradesh Assembly Constituency Area Development Scheme (MPACADS) guidelines issued by Planning, Economic and Statistics Department, Government of Madhya Pradesh, MPACADS work would be executed through Public Works Department, Panchayat and Rural Development Department, Agriculture Department etc. Further according to para 3.7 and 3.9 of the guidelines and subsequent order of State Planning Commission (January 2008), the amount received as interest on account of MPACADS fund was to be deposited in Government Account under Head “0049-Interest Receipt”.
Test check of records (between April 2015 and February 2016) of Chief Executive Officers (CEOs) of 13 Janpad Panchayats (JPs)7 revealed that in the MPACADS fund accounts of these JPs, interest amounting to ` 35.29 lakh (Appendix-2.4) was received during the period from 2011-12 to 2014-15. The CEOs concerned had not remitted the same to the Government Account under Head “0049-Interest Receipt”. Thus, the Government was deprived of Revenue of ` 35.29 lakh due to interest not being deposited into the Government Account.
7 Janpad Panchayat : Amarwara (Chhindwara), Bairasia (Bhopal), Bichhua
(Chhindwara), Chachora (Guna), Essagarh (Ashok Nagar), Gohaparu (Shahdol), Khaknar (Burhanpur), Mandla (Mandla), Maihar (Satna), Nainpur (Mandla), Sanchi (Raisen), Shajapur (Shajapur) and Sheopur (Sheopur)
Interest amounting to `̀̀̀ 35.29 lakh received on account of Madhya
Pradesh Assembly Constituency Area Development Scheme was not
deposited in the Government Account, out of which `̀̀̀ 24.06 lakh was
deposited on being pointed out by Audit.
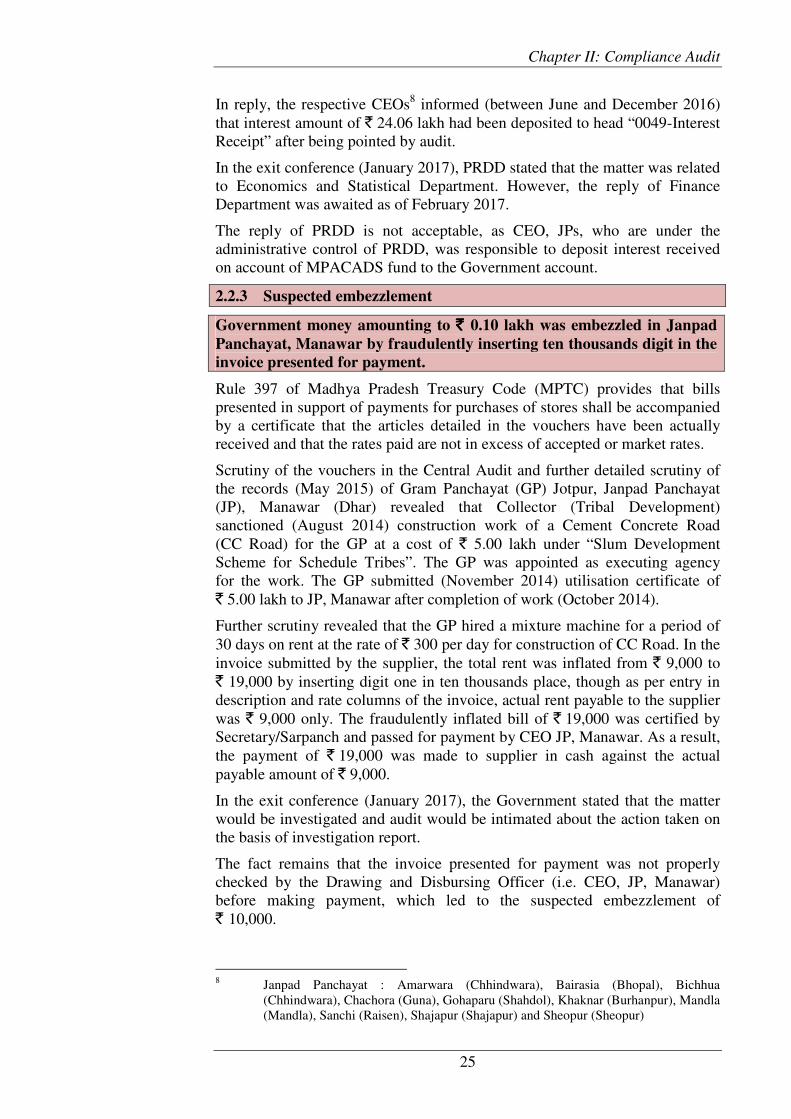
Chapter II: Compliance Audit
25
In reply, the respective CEOs8 informed (between June and December 2016) that interest amount of ` 24.06 lakh had been deposited to head “0049-Interest Receipt” after being pointed by audit.
In the exit conference (January 2017), PRDD stated that the matter was related to Economics and Statistical Department. However, the reply of Finance Department was awaited as of February 2017.
The reply of PRDD is not acceptable, as CEO, JPs, who are under the administrative control of PRDD, was responsible to deposit interest received on account of MPACADS fund to the Government account.
2.2.3 Suspected embezzlement
Rule 397 of Madhya Pradesh Treasury Code (MPTC) provides that bills presented in support of payments for purchases of stores shall be accompanied by a certificate that the articles detailed in the vouchers have been actually received and that the rates paid are not in excess of accepted or market rates.
Scrutiny of the vouchers in the Central Audit and further detailed scrutiny of the records (May 2015) of Gram Panchayat (GP) Jotpur, Janpad Panchayat (JP), Manawar (Dhar) revealed that Collector (Tribal Development) sanctioned (August 2014) construction work of a Cement Concrete Road (CC Road) for the GP at a cost of ` 5.00 lakh under “Slum Development Scheme for Schedule Tribes”. The GP was appointed as executing agency for the work. The GP submitted (November 2014) utilisation certificate of ` 5.00 lakh to JP, Manawar after completion of work (October 2014).
Further scrutiny revealed that the GP hired a mixture machine for a period of 30 days on rent at the rate of ` 300 per day for construction of CC Road. In the invoice submitted by the supplier, the total rent was inflated from ` 9,000 to ` 19,000 by inserting digit one in ten thousands place, though as per entry in description and rate columns of the invoice, actual rent payable to the supplier was ` 9,000 only. The fraudulently inflated bill of ` 19,000 was certified by Secretary/Sarpanch and passed for payment by CEO JP, Manawar. As a result, the payment of ` 19,000 was made to supplier in cash against the actual payable amount of ` 9,000.
In the exit conference (January 2017), the Government stated that the matter would be investigated and audit would be intimated about the action taken on the basis of investigation report.
The fact remains that the invoice presented for payment was not properly checked by the Drawing and Disbursing Officer (i.e. CEO, JP, Manawar) before making payment, which led to the suspected embezzlement of ` 10,000.
8 Janpad Panchayat : Amarwara (Chhindwara), Bairasia (Bhopal), Bichhua
(Chhindwara), Chachora (Guna), Gohaparu (Shahdol), Khaknar (Burhanpur), Mandla (Mandla), Sanchi (Raisen), Shajapur (Shajapur) and Sheopur (Sheopur)
Government money amounting to `̀̀̀ 0.10 lakh was embezzled in Janpad
Panchayat, Manawar by fraudulently inserting ten thousands digit in the
invoice presented for payment.


Chapter III: An overview of the functioning, accountability mechanism
and financial reporting issues of Urban Local Bodies
An overview of the functioning of the Urban Local Bodies (ULBs) in
the State
3.1 Introduction
Constitution (Seventy-fourth Amendment) Act, 1992 conferred Constitutional status to Urban Local Bodies (ULBs) and established a system of uniform structure, regular election and regular flow of funds through Finance Commission etc. As a follow up, the States are required to entrust these bodies with powers, functions and responsibilities so as to enable them to function as institutions of Self-Government.
Article 243Q of the Constitution envisages that there shall be constituted in every State, Municipal Corporation for large urban areas; Municipal Councils for smaller urban areas; and Nagar Parishads for areas in transition from a rural to an urban area. There are 16 Municipal Corporations, 98 Municipal Councils and 265 Nagar Parishads in the State as of March 2016.
The basic demographic information relating to the State of Madhya Pradesh vis-a-vis National average is given below:
Particulars Unit Madhya
Pradesh
All India
Population crore 7.26 121.02
Share in country’s population per cent 6 -
Urban population crore 2 37.70
Share of urban population per cent 27.63 31.16
Urban literacy rate per cent 82.85 85.00
Urban sex ratio (females per thousand males) ratio 918/1000 926/1000
(Source: Census data 2011)
3.2 Organisational set up of ULBs
All the ULBs are empowered to discharge the functions devolved under the provisions of Madhya Pradesh Municipal Corporation Act, 1956 and Madhya Pradesh Municipalities Act, 1961, subject to monitoring powers vested in State authorities provided therein. At the Government level, Urban Development and Housing Department (UDHD) is the administrative Department for ULBs. The organisational set up of governance of ULBs is as under:

Audit Report on Local Bodies for the year ended 31 March 2016
28
Organisational Chart of ULBs
3.3 Functioning of ULBs
Article 243W envisaged that the Legislature of a State may, by law, endow the Municipalities with such powers and authorities as may be necessary to enable them to function as institutions of Self Government and such law may contain provisions for devolution of powers and responsibilities upon Municipalities, including 18 functions listed in the Twelfth Schedule.
The State Government devolved all 18 functions (Appendix-3.1), enshrined in Twelfth schedule of the constitution, to ULBs. However, Urban Administration and Development Directorate (UADD) informed (August 2016) that funds and functionaries were yet to be transferred to ULBs.
Article 243X of the Constitution of India envisages that State Legislature may, by law, vest power in ULBs to impose various taxes for revenue collection. This constitutional provision has been incorporated in Clause 132 of Madhya Pradesh Municipal Corporation Act, 1956 and Clause 127 of Madhya Pradesh Municipalities Act, 1961. ULBs receive funds on monthly basis under Chungi
Compensation Grant and Passenger Tax Special Grant by the State Government. In addition to this, at the ULBs level various types of taxes have been imposed including Property tax, Composite tax, Water tax, Market fee, Export tax etc.
3.3.1 Municipal Corporation
According to Section 9 of Madhya Pradesh Municipal Corporation Act, 1956, a Municipal Corporation shall consist of a Mayor and Councilors directly elected from the Municipal Corporation area. Section 37 of Act provides that there shall be a Mayor-in-Council for every Municipal Corporation constituted by the Mayor from amongst the elected Councilors to discharge the functions and conduct of business of the Mayor-in-Council, as may be prescribed.
According to Section 25 of Madhya Pradesh Municipal Corporation Act, 1956, the Mayor shall have administrative control over the officers and staff of his office and exercise such powers and perform such functions as described in the Act and Rule made thereunder.

Chapter III: An overview of the functioning of Urban Local Bodies
29
The Commissioner of a Corporation shall be appointed by the State Government who is the Principal Executive Officer of the Corporation and shall have the right to speak at, and otherwise take part in any meeting of the Corporation or any committee thereof, but shall not be entitled to vote or to move any proposition. The office of the Commissioner shall have the administrative staff for the functions and duties as prescribed under the rules. Commissioner shall perform all the duties imposed or conferred upon him by this Act and exercise supervision and control over the acts and proceedings of all municipal officers.
3.3.2 Municipal Council and Nagar Parishad
As per Section 19 of Madhya Pradesh Municipalities Act, 1961, a Municipal Council, for a smaller urban area and Nagar Parishad, for a transitional urban area, shall gave a President and Councilors elected from the respective areas by direct election. Under Section 70 of the Act, there shall be a President-in-Council (PIC) for every Municipal Council/Nagar Parishad, which shall be constituted by the President from amongst the elected councilors to discharge the functions and conduct of business of the PIC, as may be prescribed. The President of the Municipal Council/Nagar Parishad, who is the President of PIC, shall preside over all meetings, watch over the financial and executive administration and perform such executive functions as may be allotted under the Act.
As per Section 87 of the Act, the Chief Municipal Officer of a Council shall be appointed by the State Government, who shall be the Principal Executive Officer of the Municipal Council/Nagar Parishad and shall have such powers and perform such functions as described in the Act and Rule made thereunder.
Under Section 92 of the Act, Chief Municipal Officer of a Municipal Council/Nagar Parishad subject to the general control of the President, watch over the financial and executive administration of the Council and perform all the duties and exercise all the powers specially imposed or conferred upon him, by or delegated to him, under this Act.
3.4 Audit arrangement
The State Government has appointed (November 2001) Director, Local Fund Audit (DLFA) for audit of accounts of ULBs and who shall work under the Technical Guidance and Support (TGS) of the Comptroller and Auditor General (C&AG) of India. As per the standard terms and conditions of TGS, C&AG of India has the right to conduct such test check of the accounts and to comment on and supplement the report of the Statutory Auditor, as he may deem fit. Further, the C&AG of India or his representative has the right to report to State Legislature, the result of audit at his discretion.
Madhya Pradesh State Legislative Assembly has constituted (April 2016) Local Bodies and Panchayatiraj Accounts Committee (LBPAC) for examination of Appropriation Accounts of local bodies in the State. LBPAC is also responsible for examination of reports of C&AG laid on the table of the Legislative Assembly.

Audit Report on Local Bodies for the year ended 31 March 2016
30
• Technical Guidance and Support provided by Indian Audit and
Accounts Department Section 152 of Regulations on Audit and Accounts, 2007 envisages the following arrangements regarding technical guidance and support to ULBs:
• Local Fund Auditor would prepare an annual audit plan for audit of ULBs and forward it to the Accountant General (Audit) of the State.
• The audit methodology and procedure for audit of ULBs by the Local Fund Auditor would be as per various Acts and Statutes enacted by the State and guidelines prescribed by the C&AG.
• Copies of inspection reports in respect of selected local bodies shall be forwarded by the Local Fund Auditor to the Accountant General (Audit) for advice on system improvements.
The Annual Audit Plan for 2015-16 was prepared by DLFA, which was forwarded to the Accountant General (Audit). DLFA followed the methodology and procedure as suggested by the AG (General and Social Sectors Audit), Madhya Pradesh from time to time. Inspection reports were forwarded to the AG (G&SSA) Madhya Pradesh for vetting.
• Audit Report on Local Bodies
Para 10.121 of the recommendations of Thirteenth Finance Commission (ThFC) envisages that Annual Technical Inspection Report of C&AG as well as the Annual Report of DLFA should be placed before the State Legislature. Accordingly, amendments were made (January 2012) in the Madhya Pradesh Municipal Corporation Act, 1956 and Madhya Pradesh Municipalities Act, 1961, which lays down that the Annual Audit report of DLFA on Local Bodies along with the Annual Technical Inspection Report of the C&AG of India shall be submitted to the Governor, who shall cause the reports to be laid on the table of the Legislative Assembly.
The report of the Comptroller and Auditor General of India on Local Bodies for the year ended 31 March 2015 was tabled in the Legislative Assembly of Madhya Pradesh in July 2016. However, reports of DLFA for the year 2012-13 and onwards are under process for laying before the State Legislative Assembly (February 2017).
3.5 Response to audit observations
During 2015-16, compliance audit of six out of 16 Municipal Corporations, 18 out of 98 Municipal Councils and 39 out of 265 Nagar Parishads were conducted by the office of the Accountant General (General and Social Sector Audit) Madhya Pradesh, Gwalior (Appendix-3.2). For providing technical guidance and Support under TGS arrangement, Inspection Reports (IRs) of Accountant General (G&SSA), Madhya Pradesh were sent to DLFA. As per TGS arrangements, DLFA was to follow up compliance with the audit paragraphs of IRs. However, 3,954 paragraphs in 757 IRs, including 1,023 paragraphs in 96 IRs issued during 2015-16 were pending for settlement as of January 2017, as detailed in Table 3.1.

Chapter III: An overview of the functioning of Urban Local Bodies
31
Table - 3.1: Status of outstanding Inspection Reports and Paragraphs
Sl.
No.
Year Opening balance and addition during
the year
Settled during
the year
Closing balance
OB
IRs
Addition
IRs
OB
Paras
Addition
paras
No of
IRs
No of
Paras
No of
IRs
No of
Paras
1 Up to 2011-12 530 -- 3,265 -- 2 139 528 3,126 2 2012-13 528 59 3,126 448 2 143 585 3,431 3 2013-14 585 69 3,431 682 4 301 650 3,812 4 2014-15 650 67 3,812 805 55 1,633 662 2,984 5 2015-16 662 96 2,984 1,023 1 53 757 3,954
(Source: Monthly Arrear Reports compiled by the AG (G&SSA), Madhya Pradesh)
Financial reporting issues
3.6 Sources of funds
As per provisions of Section 105 of MP Municipalities Act, 1961 and Section 87 of MP Municipal Corporation Act, 1956, there are mainly two sources of revenue for ULBs, viz. Government grants and own revenue. The Government grants include:
• grants assigned under the Fourteenth Finance Commission of India; and,
• devolution of one per cent of divisible tax revenue1 of the State Government as per recommendations of the Third State Finance Commission (SFC).
The Third State Finance Commission (SFC) recommended (accepted by State Government in February 2010) that one per cent of divisible tax revenue of the State Government should be devolved to ULBs. During the year 2015-16, the devolution of SFC grants by the Finance Department to ULBs is shown in Table 3.2.
Table - 3.2: Devolution of funds to ULBs (`̀̀̀ in crore)
Year Divisible funds of
State Government
Funds were to
be devolved
Funds actually
devolved
Short
devolved
1 2 3 4 (4-3)
2015-16 28,944.50 289.45 271.31 18.14 (Source: Information provided by Finance Department and UADD)
It can be seen from Table 3.2 that there was short devolutions of ` 18.14 crore to ULBs during 2015-16. The Finance Department informed (October 2016) that reason for short release would be intimated after finalisation of accounts.
3.7 Budgetary allocation and expenditure of ULBs
Funds (share of tax revenue of the State and grants for implementation of schemes) allocated to ULBs by the State Government through State budget during last five years were as follows:
1 Divisible Fund: Total tax revenue of previous year minus ten per cent of expenditure
for collection of taxes and deduction of assigned revenue to PRIs and ULBs.
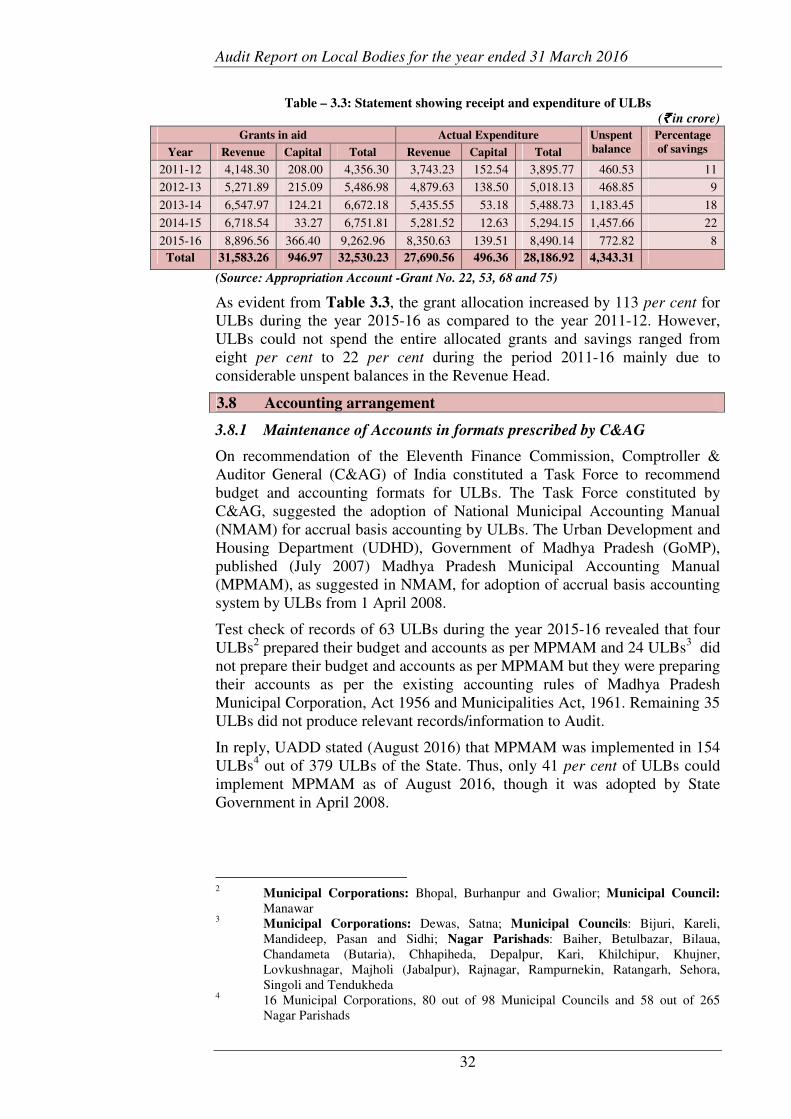
Audit Report on Local Bodies for the year ended 31 March 2016
32
Table – 3.3: Statement showing receipt and expenditure of ULBs
(`̀̀̀ in crore)
Grants in aid Actual Expenditure Unspent
balance
Percentage
of savings Year Revenue Capital Total Revenue Capital Total
2011-12 4,148.30 208.00 4,356.30 3,743.23 152.54 3,895.77 460.53 11
2012-13 5,271.89 215.09 5,486.98 4,879.63 138.50 5,018.13 468.85 9
2013-14 6,547.97 124.21 6,672.18 5,435.55 53.18 5,488.73 1,183.45 18
2014-15 6,718.54 33.27 6,751.81 5,281.52 12.63 5,294.15 1,457.66 22
2015-16 8,896.56 366.40 9,262.96 8,350.63 139.51 8,490.14 772.82 8
Total 31,583.26 946.97 32,530.23 27,690.56 496.36 28,186.92 4,343.31
(Source: Appropriation Account -Grant No. 22, 53, 68 and 75)
As evident from Table 3.3, the grant allocation increased by 113 per cent for ULBs during the year 2015-16 as compared to the year 2011-12. However, ULBs could not spend the entire allocated grants and savings ranged from eight per cent to 22 per cent during the period 2011-16 mainly due to considerable unspent balances in the Revenue Head.
3.8 Accounting arrangement
3.8.1 Maintenance of Accounts in formats prescribed by C&AG
On recommendation of the Eleventh Finance Commission, Comptroller & Auditor General (C&AG) of India constituted a Task Force to recommend budget and accounting formats for ULBs. The Task Force constituted by C&AG, suggested the adoption of National Municipal Accounting Manual (NMAM) for accrual basis accounting by ULBs. The Urban Development and Housing Department (UDHD), Government of Madhya Pradesh (GoMP), published (July 2007) Madhya Pradesh Municipal Accounting Manual (MPMAM), as suggested in NMAM, for adoption of accrual basis accounting system by ULBs from 1 April 2008.
Test check of records of 63 ULBs during the year 2015-16 revealed that four ULBs2 prepared their budget and accounts as per MPMAM and 24 ULBs3 did not prepare their budget and accounts as per MPMAM but they were preparing their accounts as per the existing accounting rules of Madhya Pradesh Municipal Corporation, Act 1956 and Municipalities Act, 1961. Remaining 35 ULBs did not produce relevant records/information to Audit.
In reply, UADD stated (August 2016) that MPMAM was implemented in 154 ULBs4 out of 379 ULBs of the State. Thus, only 41 per cent of ULBs could implement MPMAM as of August 2016, though it was adopted by State Government in April 2008.
2 Municipal Corporations: Bhopal, Burhanpur and Gwalior; Municipal Council:
Manawar 3 Municipal Corporations: Dewas, Satna; Municipal Councils: Bijuri, Kareli,
Mandideep, Pasan and Sidhi; Nagar Parishads: Baiher, Betulbazar, Bilaua, Chandameta (Butaria), Chhapiheda, Depalpur, Kari, Khilchipur, Khujner, Lovkushnagar, Majholi (Jabalpur), Rajnagar, Rampurnekin, Ratangarh, Sehora, Singoli and Tendukheda
4 16 Municipal Corporations, 80 out of 98 Municipal Councils and 58 out of 265 Nagar Parishads

Chapter III: An overview of the functioning of Urban Local Bodies
33
3.8.2 Annual Budget of ULBs
As per Section 98 of Madhya Pradesh Municipal Corporation Act, 1956 and Section 116 of Madhya Pradesh Municipalities Act, 1961, every ULB shall prepare budget estimates covering all receipts and expenditure and send the same to the State Government.
Test check of records of 63 ULBs revealed that 34 ULBs prepared their budget estimates. However, 22 ULBs out of 34 ULBs did not send their budget estimates to State Government as envisaged in the Act. The remaining 29 ULBs did not furnish relevant information/records.
In reply, UADD stated (January 2017) that instructions would be issued to all ULBs from State level.
3.9 Bank reconciliation statement not prepared
Madhya Pradesh Municipal Accounting Rules prescribe for reconciliation of any difference between the balances of cash book and bank accounts on monthly basis.
Test check of records of 63 ULBs revealed that 33 ULBs5 did not prepare bank reconciliation. There were unreconciled differences in the closing balances of cash books and bank books of these 33 ULBs as of March 2015, as detailed in (Appendix-3.3). Failure to reconcile the differences was fraught with the risk of misuse of funds.
The Commissioner/CMO of respective Municipal Corporation/Councils and Nagar Parishads stated (2015-16) that the bank reconciliation of difference between the balances of cash book and bank accounts would be carried out.
In reply, UADD stated (January 2017) that commercial audit of ULBs had been started from this year. Conversion to double entry system was under process and monitoring was being done from State level. Instructions would be issued to concerned ULBs to prepare bank reconciliation statement.
3.10 Tax revenue/non-tax revenue not realised
As per Section 87 of MP Municipal Corporation Act, 1956 and Section 105 of MP Municipalities Act, 1961, the source of own revenue of ULBs are through taxes, rent, fees, issue of licenses etc. In case of unrealised tax and non-tax revenue, the Municipal Corporations are required to take necessary action for recovery as envisaged in section 173 to 183 of the MP Municipal Corporation Act, 1956.
Audit observed that in 50 ULBs out of test checked 63 ULBs, tax revenue of ` 101.95 crore imposed up to March 2015 remained unrealised. Remaining 13 ULBs did not furnish information to Audit. The amount included ` 93.60 crore on account of property tax, composite tax, education cess, urban development cess, market fees and show tax imposed in 50 ULBs (Appendix-3.4) and ` 8.35 crore on account of rent and premium imposed by 40 ULBs as detailed in Appendix–3.5.
5 Municipal Corporation: 1 Municipal Council: 11 Nagar Parishad: 21

Audit Report on Local Bodies for the year ended 31 March 2016
34
Similarly, non-tax revenue (water charges, license fees, land and building rent etc.) amounting to ` 77.60 crore remained unrealised in 50 ULBs (Appendix–3.6). Remaining 13 ULBs did not furnish information to Audit.
In reply, the Commissioner/CMOs of respective Municipal Corporations/ Councils and Nagar Parishads stated (2015-16) that effort would be made to recover unrealised revenues of ULBs. UADD stated (January 2017) that instructions would be issued to concerned ULBs from state level for recovery.
Diversion of Education cess for purchase of electrical items
As per instruction of UADD (October 2012), ULBs had to utilise education cess on maintenance of government schools with ensuring pure drinking water and toilet facilities within the jurisdiction of ULBs. Audit scrutiny revealed that Gwalior Municipal Corporation utilised education cess amounting to ` 7.85 lakh on procurement of ACs, fans and other electrical items for new building of the Corporation.
In reply, the Commissioner stated (October 2015) that the electrical items were purchased as per order of the Mayor in Council (MIC).
The reply is not acceptable, as the utilisation of education cess on procurement for the buildings of Corporation was in violation of instructions of UADD.
3.11 Temporary advances not adjusted
Rule 112 (2) of the MP Municipal Accounts Rules, 1971 stipulates that no advance shall be drawn unless expenditure is likely to be incurred within one month. The CMO/Accounts Officer of Municipalities would review unadjusted advance quarterly and submit before Finance Committee/Standing Committee of ULBs.
During test check of records of 63 ULBs, audit noticed that temporary advances of ` 1.15 crore provided by 19 ULBs to individuals remained outstanding as on 31 March 2015, as detailed in Appendix-3.7. In 8 ULBs no temporary advance was outstanding, whereas remaining 36 ULBs did not furnish the relevant information to Audit.
The Commissioner/CMOs of the concerned ULBs stated (2015-16) that instructions for recovery and adjustment of outstanding advances had been issued. In reply, UADD stated (January 2017) that instructions would be issued to concerned ULBs for recovery.
3.12 Fourteenth Finance Commission Grants
Fourteenth Finance Commission (14th FC) Grants-in aid were released to the State in the form of Basic Grants during 2015-16. As per 14th FC recommendations, allocations among various ULBs within the State were to be made by the respective States. Further, States were required to release the grants to the ULBs within fifteen days of it being credited to their accounts by the Union Government. In case of delay, the State Government must release the instalment along with interest at the bank rate of Reserve Bank of India paid from its own funds.
Audit scrutiny revealed that State Government received ` 496.79 crore of basic grant as per entitlement from Government of India (GoI) in two equal instalments of ` 248.395 crore in July 2015 and March 2016. However, State

Chapter III: An overview of the functioning of Urban Local Bodies
35
Government delayed the release of first instalment of grants to ULBs, as detailed in Table 3.4.
Table – 3.4: Entitlement and release of 14th
FC Basic Grant during 2015-16
(`̀̀̀ in crore)
Entitlement
of State
Receipt from GoI Release to ULBs Delayed
(Days)
Interest
Date Amount Date Amount
496.79 13.07.2015 248.395 05.08.2015 248.395 8 0.45
02.03.2016 248.395 05.03.2016 248.395 - -
(Source: Information provided by Finance Department and UADD)
As a result of delays in release of grants to ULBs, State Government sanctioned ` 44.92 lakh as interest. However, the interest was not released to ULBs along with instalments as recommended by 14th FC.
In reply, UADD stated (September 2016) that sanction order for the interest amount was issued by Finance Department but interest was not received. It further informed (January 2017) that efforts would be made to disburse the 14th FC grant within schedule time.
Fact remains that the failure of State Government to release Basic Grants received from GoI within the prescribed time to ULBs resulted in additional liability of ` 44.92 lakh towards interest.


Chapter IV: Performance Audit
Urban Development and Housing Department
4.1. Management of own fund by Municipal Corporations and
Municipal Councils including collection of revenue
Executive Summary
Urban Local Bodies (ULBs), viz., Municipal Corporations, Municipal Councils and Nagar Parishads provide basic civic facilities, which include functions like lighting public places, water supply, sewerage, garbage collection and disposal, construction and maintenance of roads and other public works, street lighting and taking measures to prevent the out-break, spread or recurrence of infectious diseases. Municipal Corporations/Municipal Councils (MCs) raise revenue in the form of taxes, fees and fines from the public.
Under MP Municipal Corporation Act, 1956 and MP Municipalities Act 1961, all moneys received by or on behalf of Corporation or Council are credited into Municipal Fund, which are applied for the purposes specified in the Act. The performance audit of Management of own fund by Municipal Corporations and Municipal Councils including collection of revenue for the period 2011-12 to 2015-16 was conducted in four Municipal Corporations and ten Municipal Councils of the State. The audit findings were as under:
• There was no mechanism available at State level to capture revenue resources and expenditure of Urban Local Bodies. The revenue raised by test checked ULBs was insufficient to meet out their expenditure. The share of own revenue remained between 37 per cent and 69 per cent of total expenditure in test checked Municipal Corporations, whereas in test checked Municipal Councils, it remained between 24 per cent and 64 per cent.
(Paragraph 4.1.6)
• Property Tax Board was constituted (March 2011) to assist MCs in determination and collection of Property Tax. However, the Board did not perform its mandated duties, as there was no manpower in the Board. Thus, the establishment of Board remained just a mere formality.
(Paragraph 4.1.7.1)
• The collection of Property Tax, Composite Tax and user charges for water supply was significantly less than the respective demands during 2011-16. The outstanding collection in test checked MCs was ` 145.38 crore in respect of Property Tax, ` 142.69 crore in respect of Composite Tax and ` 243.65 crore in respect of user charges for water supply as on March 2016.
(Paragraphs 4.1.7.2, 4.1.7.3 and 4.1.8)
• MC Indore failed to auction shops from last 18 to 25 years, which resulted in loss of revenue and encroachment. Further, an amount of ` 7.06 crore was outstanding for recovery on account of rent/premium of shops in test checked MCs as on 31 March 2016.
(Paragraph 4.1.10)

Audit Report on Local Bodies for the year ended 31 March 2016
38
• Budget and Accounts were not prepared as per provisions of MP Municipal Accounts Manual. Bank Reconciliation was not carried out in test checked MCs, which was fraught with the risk of misutilisation of fund.
(Paragraphs 4.1.12.1 and 4.1.12.3)
• MCs did not comply with the orders of State Government for maintaining Reserve Fund and the short credit in the Reserve fund was ` 162.53 crore during 2011-16. Funds were drawn from Reserve Fund without sanction of competent authority.
(Paragraph 4.1.12.4)
• State Government was deprived of revenue of ` 18.60 crore due to failure of MCs to remit the State’s share of Urban Development Cess in Government Account. Further, MCs did not deposit ` 7.66 crore of taxes deducted at source (TDS) in respect of Value Added Tax, Royalty, Labour Welfare Cess and Income Tax, which was utilised by MCs for their regular expenses.
(Paragraphs 4.1.12.6 and 4.1.12.9)
• There was acute shortage of staff in Revenue Department of MCs, which adversely affected the revenue recovery process. Further, demand of taxes were not monitored on the basis of Geographical Information System (GIS) Survey.
(Paragraph 4.1.13)
4.1.1 Introduction
Urban Local Bodies (ULBs), viz., Municipal Corporations, Municipal Councils and Nagar Parishads provide basic civic facilities, which include functions like lighting public places, water supply, sewerage, garbage collection and disposal, construction and maintenance of roads and other public works, street lighting and taking measures to prevent the out-break, spread or recurrence of infectious diseases. ULBs raise revenue in the form of taxes, fees and fines from the public. Under MP Municipal Corporation Act, 1956 and MP Municipal Council Act 1961, all moneys received by or on behalf of Corporation or Council are credited into Municipal Fund, which are applied for the purposes specified in the Act.
Despite the important role that ULBs play in the democratic process and in meeting the basic requirements of the people, the financial resources generated by ULBs fall far short of their requirements. The ULBs are heavily dependent on State Government and Grants-in-aid from Government of India for financial inflows, since the own income of ULBs are inadequate to meet their obligations both due to their inherent nature and inefficiency in collecting them.
4.1.2 Organisational set-up
Mayor-in-Council (MIC) headed by Mayor in Municipal Corporations and President in Council (PIC) headed by President in Municipal Councils are the elected bodies to govern the MCs. Commissioner, Municipal Corporation and Chief Municipal Officer (CMO), Municipal Council are the administrative

Chapter IV: Performance Audit
39
heads of MCs concerned. In Municipal Corporations, Commissioner is assisted by Additional Commissioner, Deputy Commissioner and Assistant Commissioner depending on population of the town.
In Municipal Councils, Revenue Officer and in Municipal Corporations, Additional Commissioner (Revenue) is head of the Revenue Department. At field level, Revenue Officer, assisted by Revenue Inspectors and Assistant Revenue Inspectors are responsible for collection of various types of taxes, rent and fee levied by MCs. The revenue collected by Revenue Department is credited into Municipal Fund. Expenditure out of Municipal Fund is governed by delegated financial powers under the Act.
4.1.3 Audit objectives
The objectives of the Performance Audit were to assess whether:
• the taxes, fees, rent etc., were assessed, imposed and collected for strengthening the revenue regime of Municipal Corporations and Municipal Councils (MCs);
• budgetary and accounting system was efficient and Municipal Fund was appropriated properly for the priorities, purposes and norms as laid down under the Act and Rules; and,
• role of the Government in mobilisation of revenue resources of MCs was adequate and monitoring mechanism existed for improving the revenue raising capabilities.
4.1.4 Audit scope and methodology
For the Performance Audit, four Municipal Corporations1 out of 16 Municipal Corporations and ten Municipal Councils2 out of 98 Municipal Councils of the State were selected on the basis of Simple Random Sampling without Replacement method. Records of Urban Administration and Development Directorate (UADD) and sampled Municipal Corporations and Municipal Councils for the period of 2011-12 to 2015-16 were test checked in the performance audit.
The Entry Conference was held with the Additional Commissioner, UADD on 17 March 2016 to discuss the audit objectives, scope and methodology. The draft report was issued to Government in October 2016. The audit findings were also discussed in the Exit Conference held with the Additional Commissioner, UADD, Bhopal on 06 January 2017. The replies of Government and views expressed during exit conference have been suitably incorporated in the report.
4.1.5 Audit Criteria
Following were the audit criteria for the performance audit:
• MP Municipal Corporation Act 1956 and Rules made thereunder;
1 Dewas, Indore Ratlam and Rewa
2 Amla (district Betul), Anuppur (district Anuppur), Badwah (district Khargone), Begumganj (district Raisen), Garhakota (district Sagar), Junnordeo (district Chhindwara), Pandhurna (district Chhindwara), Harda (district Harda), Nainpur (district Mandla), and Porsa (district Morena)

Audit Report on Local Bodies for the year ended 31 March 2016
40
• MP Municipalities Act 1961 and Rules made thereunder;
• Madhya Pradesh Municipal Accounting Manual; and,
• Instructions and circulars issued by the State Government.
Audit findings
4.1.6 Financial Resources of Municipal Corporations/Councils
As per provisions of Section 87 of MP Municipal Corporation Act, 1956 and Section 105 of MP Municipalities Act, 1961, there are mainly two sources of revenue for ULBs, viz. own revenue and Government grants. Own revenue of ULBs comprises of receipts from tax and non-tax revenue. The source of revenue of Municipal Corporations and Municipal Councils under MP Municipal Corporation Act, 1956 and MP Municipal Council Act 1961 includes:
• Property Tax which is a tax payable by owners of buildings or lands situated within the city with reference to gross annual letting value of the buildings or lands;
• a general sanitary cess, for construction and maintenance of public latrines and for removal and disposal of refuse and general cleanliness of the city;
• a general lighting tax, where lighting of public streets and places is undertaken by the Corporation or Council;
• a general fire tax for the conduct and management of fire services and for the protection of life and property in case of fire;
• user charges for services namely water supply, sewerage and management of solid waste; and,
• earning from Municipal enterprises like land, markets, shops etc., rent from hoardings and license and renewal fee for erecting cellular mobile towers.
Audit noticed that there was no mechanism available at State level to capture revenue resources and expenditure of ULBs. As a result, the information on financial resources and expenditure of ULBs in the State during 2011-16 was not available with the State Government. Thus, State Government did not monitor the financial management of resources of ULBs.
The financial resources of test checked ULBs vis-à-vis their expenditure during the period 2011-12 to 2015-16 was as detailed in Table 4.1.
Table - 4.1: Details of financial resources of test checked MCs
(`̀̀̀ in crore)
Name of
MC
Own
Revenue
Government
Grants
Total
financial
resources
Total
Expenditure
Share of own
revenue in
total financial
resources
(per cent)
Share of own
revenue out of
total expenditure
(per cent)
Municipal Corporations
Dewas 203.62 265.50 469.12 543.88 43 37 Indore 2,600.96 1227.34 3,828.30 3,796.04 68 69

Chapter IV: Performance Audit
41
Name of
MC
Own
Revenue
Government
Grants
Total
financial
resources
Total
Expenditure
Share of own
revenue in
total financial
resources
(per cent)
Share of own
revenue out of
total expenditure
(per cent)
Ratlam 201.60 137.85 339.45 391.80 59 51 Rewa 174.37 192.56 366.93 296.65 47 59
Municipal Councils
Amla 15.24 13.54 28.78 31.28 54 49 Anuppur 9.49 34.90 44.39 39.11 21 24 Badwah 18.33 12.29 30.62 28.96 60 63 Begumganj 15.29 25.71 41.00 32.99 37 46 Garhakota 11.30 27.94 39.24 32.06 29 35 Harda 57.26 33.38 90.64 89.13 63 64 Junnordeo 12.45 31.74 44.19 51.00 28 24 Nainpur 12.42 9.52 21.94 23.82 57 52 Pandhurna 35.68 35.61 71.29 97.49 50 37 Porsa 18.75 25.99 44.74 32.95 42 57
(Source: Information collected from test checked MCs)
Thus, the share of own revenue in total financial resources of test checked Municipal Corporations remained between 43 per cent (Dewas) and 68 per
cent (Indore) and in test checked Municipal Councils, it remained between 21 per cent (Anuppur) and 63 per cent (Harda). During 2011-16, own revenue remained between 37 per cent and 69 per cent of total expenditure of test checked Municipal Corporations, whereas in test checked Municipal Councils, it remained between 24 per cent and 64 per cent. The revenue raised by test checked ULBs was insufficient to meet out their expenditure.
The comparison of own revenue and total expenditure of test checked Municipal Corporation and Municipal Councils during 2011-16 is depicted in Charts 4.1 and 4.2 respectively.
Chart - 4.1: Own revenue and total expenditure of test checked Municipal Corporations
(` ` ` ` in crore)

Audit Report on Local Bodies for the year ended 31 March 2016
42
Chart - 4.2: Own revenue and total expenditure of test checked Municipal Councils
(` ` ` ` in crore)
As evident from above, the collection of own revenue increased by ` 281.94 crore in test checked Municipal Corporations and ` 14.40 crore in Municipal Councils from 2011-12 to 2015-16. Further scrutiny revealed that the major increase in own revenue was attributed to increased grants-in-aid from State Government for compensation in lieu of Octroi and Passenger Tax, which increased by ` 203.06 crore in Municipal Corporations and ` 12.20 crore in Municipal Councils. There was no proportionate increase in own tax collection of MCs. The comparison of collection of major tax and non-tax receipts of test checked MCs during 2011-12 and 2015-16 are depicted in Charts 4.3 and 4.4.
Chart - 4.3: Comparison of major tax and non-tax receipts of test checked Municipal
Corporations during 2011-12 and 2015-16
(` in crore)

Chapter IV: Performance Audit
43
Chart - 4.4: Comparison of major tax and non-tax receipts of test checked Municipal
Councils during 2011-12 and 2015-16
(` in lakh)
Evidently, grants-in-aid from State Government for compensation in lieu of Octroi and Passenger Tax was the main source own revenues for MC. Out of ` 771.49 crore of own revenue collected by four test checked Municipal Corporations during 2015-16, ` 417.02 crore (54 per cent) was received from Octroi and Passenger Tax only. Similarly, in ten test checked Municipal Councils, ` 48.53 crore of own revenue was collected, which comprised of ` 35.76 crore (74 per cent) of Octroi and Passenger Tax and ` 12.77 crore from other source of revenue.
In reply, Government stated (January 2017) that GIS survey of properties was being conducted and data of GIS survey would be linked with data of properties for enhancing the revenue raising capacity. To fulfill the condition of 14th Finance Commission, instructions had been issued to ULBs to increase their revenue. With these activities, dependency of ULBs on grant would get reduced.
4.1.7 Property Tax and Composite Tax
As per Section 132 of MP Municipal Corporation Act, 1956 and Section 127 of MP Municipalities Act, 1961, MCs shall levy and collect Property Tax and Composite Tax from all households of municipal area. Composite Tax comprises of general sanitary cess, general lighting tax and general fire tax, which is levied and collected along with property tax. These Acts further envisaged that assessees were liable for payment of taxes and other demands within 15 days from the presentation of bill by MCs. In case of failure, such demands with all cost of recovery may be recovered under a warrant signed by the Commissioner/CMO by attachment of rent or sale of the immovable property.
4.1.7.1 Constitution and functioning of Property Tax Board
Thirteenth Finance Commission had recommended for establishment of a Property Tax Board to assist the ULBs in determination and collection of Property Tax. In compliance, a Property Tax Board was constituted in Madhya

Audit Report on Local Bodies for the year ended 31 March 2016
44
Pradesh as per Gazette Notification of Government of Madhya Pradesh (March 2011). Commissioner, UADD was appointed as the Chairperson with five other members in Property Tax Board.
Audit scrutiny, however, revealed that Property Tax Board was not functional. After its constitution on 25 March 2011, meetings of Property Tax Board were held only four times in December 2011, July 2012, September 2012 and May 2014. There was no manpower available in the Board and the Directorate informed (July 2016) that the recruitment was to be initiated. As a result, the Board did not perform its mandated duties, such as, to review the property tax system to suggest suitable basis for capital valuation of properties, to recommend tax rate of different classes of buildings or area or zone of the municipalities, to recommend for determining market value guidelines for the purpose of levying and collecting of property tax, and to undertake training of officers and employees of MCs for capacity building related to property tax.
In reply, Government stated (January 2017) that efforts were being made to strengthen Property Tax Board and its functioning.
Thus, State Government failed to strengthen the Property Tax Board and its establishment remained just a mere formality as it could not assist ULBs in revenue realisation.
4.1.7.2 Levy and collection of Property Tax
Scrutiny of records revealed that test checked MCs raised current year’s demand for ` 300.91 crore of Property Tax (Appendix 4.1) during the period 2011-12 to 2015-16 against which collection was only ` 184.01 crore (61 per cent). The status of collection against the current year’s demand of Property Tax in test checked Municipal Corporations and Municipal Councils during 2011-12 to 2015-16 was as depicted in Table 4.2.
Table 4.2: Status of current year's demand and collection of Property Tax in test
checked MCs during 2011-12 to 2015-16
(` in crore)
Year 2011-12 2012-13 2013-14 2014-15 2015-16
Municipal Corporations
Current Year’s Demand 49.66 51.14 60.16 63.66 70.19
Collection 29.88 29.89 35.15 37.32 47.43
Collection percentage 60 58 58 59 68
Municipal Councils
Current Year’s Demand 1.09 1.06 1.15 1.23 1.56
Collection 0.74 0.74 0.86 0.90 1.11
Collection percentage 68 70 75 73 71
Thus, MCs could not realise the current year’s demand and the percentage of collection during 2011-12 to 2015-16 ranged between 58 per cent and 68 per cent in case of Municipal Corporations and between 68 per cent and 75 per cent in case of Municipal Councils. Further, there was collection of ` 88.65 crore against the outstanding demand of previous years leaving a cumulative unrealised Property Tax of ` 145.38 crore as of March 2016.
Further scrutiny revealed that MC Indore had outstanding recovery of ` 140.41 crore, which was 97 per cent of realisable outstanding Property Tax
There was no
manpower in
Property Tax
Board and its
establishment
remained a mere
formality

Chapter IV: Performance Audit
45
of 14 test checked MCs. MC, Indore attributed (June 2016) the large outstanding collections of Property Tax to shortage of staff, dispute by assesse and court cases.
Audit further noticed that the closing balances of demand of previous year were not correctly carried forward as opening balance of next year in test checked MCs, except in case of Dewas and Begumganj. Thus, the figures of actual outstanding demand were not reliable.
In reply, Government stated (January 2017) that efforts were being made to realise outstanding taxes by organising recovery camps and other measures. However, the reply was silent on inaccuracy of data maintained by MCs for outstanding arrears of Property Tax.
Fact remains that MCs failed to collect Property Tax, which was the main source of their own revenue, from households after raising demand. Due to poor collection of Property Tax against demand together with inoperative Property Tax Board, MCs failed to exploit the potential of revenue collection in their jurisdiction.
4.1.7.3 Levy and collection of Composite Tax
During the period 2011-12 to 2015-16, test checked MCs raised demand of ` 230.03 crore for Composite Tax (Appendix 4.2) against which collection was only ` 127.07 crore (55 per cent). Further, collection against the demand of previous years during this period was ` 58.20 crore. As of March 2016, there was outstanding recovery of ` 142.69 crore of Composite Tax in test checked MCs. Status of collection against current year’s demand of Composite Tax during 2011-16 was as depicted in Table 4.3.
Table - 4.3: Status of current year's demand and collection of Composite Tax in test
checked MCs during 2011-12 to 2015-16
(` in crore)
Year 2011-12 2012-13 2013-14 2014-15 2015-16
Municipal Corporations
Current Year’s Demand 38.65 41.22 46.76 47.94 51.52
Collection 21.35 21.70 24.36 26.13 31.72
Collection percentage 55 53 52 55 62
Municipal Councils
Current Year’s Demand 0.69 0.74 0.79 0.80 0.92
Collection 0.31 0.33 0.35 0.34 0.48
Collection percentage 45 45 44 43 52
Thus, collection of Composite Tax against current year’s demand ranged between 52 per cent and 62 per cent in Municipal Corporations and between 43 per cent and 52 per cent in Municipal Councils. Out of total outstanding recovery of ` 142.69 crore of Composite Tax, ` 135.82 crore was due for recovery from MC Indore only, which was 95 per cent of realisable outstanding Composite Tax of 14 test checked MCs.
Audit further noticed that except in case of MCs Dewas and Begumganj, the closing balances of demand of previous years were not correctly carried forward as opening balance of next year. Thus, the figures of actual outstanding demand of Composite Tax was not reliable.
MCs could
collect only 55
per cent of
Composite Tax
against the
current year’s
demand

Audit Report on Local Bodies for the year ended 31 March 2016
46
In reply, Government stated (January 2017) that efforts were being made to realise outstanding taxes by organising recovery camps and other measures. However, the reply was silent on inaccuracy of data maintained by MCs for outstanding arrears of Composite Tax.
4.1.7.4 Failure of MCs to realise obligatory taxes
• As per orders of UDHD (October 1999), Education Cess was to be levied with Property Tax on lands/buildings, other than those lands/buildings which were exempted from property tax within the municipal area, at a rate not exceeding five per cent of annual letting value of the land/building. Test check of records (April 2016 to July 2016) revealed that Municipal Council, Porsa did neither determine the rate of cess nor levy the Education Cess during 2011-16. Further, Municipal Councils, Begumganj and Garhakota did not levy Education Cess during the years 2011-12 and 2012-13.
• UDHD, GoMP issued orders (November 2010) to levy Urban Development Cess at a rate of two per cent of annual letting value of land/building within the municipal area. Test check of records (April 2016) revealed that Municipal Council Porsa did not levy Urban Development Cess during the 2011-12 to 2015-16.
In reply, Government stated (January 2017) that instructions would be issued to concerned ULB to levy and realise obligatory taxes.
4.1.8 Water charges
4.1.8.1 User charges for water supply from individual connections
As per Section 221 of MP Municipal Corporation Act, 1956, the Commissioner may supply water for any purpose on receiving a written application specifying the purpose for which such supply is required and the quantity likely to be consumed. As per Section 222 of the Act, the Commissioner shall provide a water meter and charge rent for the same. Further, under Section 127-B of MP Municipalities Act, 1961, Municipal Council shall impose user charges for water supply in respect of lands or building in which a water supply is furnished by Council.
Audit scrutiny revealed that none of the test checked MCs fixed water meters to measure consumption of water and collection of user charges accordingly. The water charges were collected on monthly rates fixed by MCs. Thus, MCs failed to levy water charges on the basis of actual consumption recorded in the water meters.
Scrutiny of records revealed that test checked MCs raised current year’s demand of ` 227.75 crore for water user charges during the period 2011-12 to 2015-16 against which the collection was ` 102.75 (45 per cent), as detailed in Appendix-4.3. Further, there was collection of ` 51.99 crore against the outstanding demand of previous years leaving a cumulative unrealised water user charge of ` 243.65 crore in test checked MCs as of March 2016. Out of total outstanding recovery of ` 243.65 crore, 94 per cent (` 229 crore) was outstanding for recovery in MC Indore only. Further, in MC Indore, there were 1,829 water connections where outstanding dues of user charges for water supply was above ` 50,000.
User charges
amounting to
`̀̀̀ 243.65 crore for
water supply
remained
outstanding as on
31 March 16
MCs Porsa,
Begumganj and
Garhakota
failed to levy
obligatory taxes

Chapter IV: Performance Audit
47
Audit noticed that outstanding demand of previous year was not correctly carried forward in the following year by any test checked MCs. In Municipal Council Junnardeo, the demand of current year of user charges for water supply remained constant at ` 8.15 lakh during 2011-12 to 2015-16. Thus, the figures of levy and collection of user charges for water supply were not realistic.
In reply, Government stated (January 2017) that instructions have been issued to concerned ULBs for recovery of outstanding tax and monitoring would be done from State level to ensure the recovery.
4.1.8.2 User charges for water supply from bulk connections
Test check of records of the Office of Executive Engineer, Public Health Engineering Department, Division-I, Mandleshwar and Maintenance Division-II, Musakhedi under Municipal Corporation Indore, revealed the following:
• Out of 76 bulk water connections under Maintenance Division-II, Musakhedi, water meters were not installed on 15 connections. Out of 61 bulk water connections where bulk meters were installed, 16 bulk meters were not working and water user charges were levied on average basis. Audit noticed that ` 16.17 crore was outstanding for recovery from 40 out of 76 bulk connections as on March 2016. Major defaulters of bulk connections were Gram Panchayat, Gabli Palasiya (` 5.54 crore) and Gram Panchayat Kodariya under Janpad Panchayat Mahu, Indore (` 9.27 crore).
• In Maintenance Division-I, Mandleshwar, an amount of ` 14.45 crore was outstanding for recovery from six bulk water connections as on 31 March 2016. Out of which, ` 13.53 crore was outstanding for recovery from Nagar Parishad Mandleshwar.
In reply, Government stated (January 2017) that instructions had been issued for recovery of outstanding tax and monitoring would be done at State level to ensure the recovery.
4.1.9 Building Permission Fee
As per Gazette Notification of Government of Madhya Pradesh (June 2012), application fee for building permission should be collected at the rate of ` one per square metre of proposed built up area. Building permission fee for granting permission should be collected at different rates from residential, commercial or industrial properties. Along with the building permission fee, different kinds of fees such as water conservation charges, drainage fee, water harvesting charges etc. as decided by MIC/PIC should also be collected from the applicants. During test check of records, we noticed that:
• In Municipal Corporation Indore, application fees for building permission was being collected at the rate of ` 30 to ` 100 for ground floor and thereafter ` 20 per floor as per resolution of Parishad dated 30 March 2002. Audit scrutiny revealed that the revised rate prescribed by the Government, vide Gazette Notification dated 01.06.12, was not complied with by the MC. As a result, there was short realisation of ` 11.77 lakh on account of application fee for building permission in respect of permissions granted in 111 test checked cases of high rise buildings during 2013-14 to 2015-16. On
User charges
amounting to
`̀̀̀ 30.62 crore
remained
outstanding in
respect of 46
bulk water
supply
connections

Audit Report on Local Bodies for the year ended 31 March 2016
48
being pointed out, MC Indore updated (4 April 2016) online building permission system incorporating the revised rate.
• Municipal Council Porsa, district Morena did not maintain data related to grant of building permission. Therefore, the collection of building permission fee could not be ascertained in audit.
In reply, Government stated (January 2017) that uniform software was being developed for building permission at State level after which the leakages would be stopped. However, instructions for collection of fee as per rules would be issued to ULBs.
The reply was not acceptable, as test checked MCs failed to collect the fee at prescribed rates notified in the Gazette and therefore, responsibility for loss of revenue were required to be fixed.
4.1.10 Rent from shops
4.1.10.1 Failure to auction shops from last 25 years
As per Rule 3 of MP Transfer of Immovable Properties Rules, 1994, the Commissioner may with the sanction of the Corporation, sell, let out on hire or otherwise any immovable property which may be a source of income of the Corporation to the highest tenderer by inviting open tender.
Audit scrutiny revealed that MC Indore was not aware of actual number of vacant shops. Market Department of the MC intimated (December 2015) the Additional Commissioner (Revenue) of the MC that there were 107 vacant shops within municipal area. However, Local Fund Audit observed (December 2015) that total 268 shops of Corporation were vacant for auction from last 18 to 25 years within the Municipal area. In response, a physical verification was carried out and Market Department ascertained 80 vacant shops for auction and also identified encroachment in another 28 shops.
Further scrutiny revealed that MC Indore decided minimum offset value3 of ` 1.62 crore for 48 shops in February 2012. The tender for auction of these shops was invited in November 2012. However, bid of ` 0.95 crore was received for 16 shops only, which was cancelled by MIC (Resolution no. 620 dated 20.12.14). Thereafter, no tender has been called for auction of vacant shops (February 2016). In reply, the Commissioner stated (April 2016) that auction of 82 vacant shops and survey for determining status of encroachment of shops was under process.
The fact remains that MC Indore could not auction vacant shops from last 18 to 25 years resulting in loss of revenue, beside encroachment of shops.
In reply, Government stated (January 2017) that enquiry would be done from State level and corrective action would be taken.
4.1.10.2 Rent/Premium of shops remained outstanding for recovery
As per Rule 57, 59 and 60 of MP Municipal Accounts Rules, 1971, lease rent/premium on the immovable property was to be imposed and recovered by the MCs. Scrutiny of records revealed that an amount of ` 7.06 crore was
3 Minimum rate (per square feet) decided by MC for auction of shops
MC Indore failed
to auction shops
from last 18 to 25
years resulting in
loss of revenue
and
encroachment of
shops
Chapter IV: Performance Audit
49
outstanding for recovery on account of rent/premium of shops in three Municipal Corporations4 and eight Municipal Councils5 as on 31 March 2016.
In reply, Government stated (January 2017) that instruction would be issued to concerned ULBs from State level for recovery.
4.1.11 Advertisement Fee
4.1.11.1 Advertisement on unipoles
As per resolution passed by Mayor-in-Council of MC Indore (September 2007), tender for advertisement on both sides of unipoles at six places within Municipal area for three years was accepted at ` 38.88 lakh. The agreement ended in October 2010. Audit scrutiny revealed that MC Indore did not advertise for tender for advertisement of unipoles and tenders were invited in July 2011, i.e., after a gap of eight months. However, the agreement could not be executed as the firm which quoted the highest bid of ` 81.00 lakh did not accept the letter of acceptance (LoA). Thereafter, the tender was reinvited in October 2012 after a lapse of about one year. The agreement for advertisement on unipoles was entered into (June 2013) for a period of three years with a firm, which quoted the highest bid of ` 46.21 lakh.
As per condition of the tender documents, full amount of the tender value was to be recovered from successful bidder. Even in case of vacating the sites of advertisement before the completion of agreement period, full amount was to be recovered under ‘Right of Occupation’. Further, the contract provided for depositing 40 per cent of the sanctioned cost within seven days, 30 per cent in first week of second year and remaining 30 per cent in first week of third year.
Audit noticed that the firm deposited the first instalment of ` 18.48 lakh, but the second and third instalments were not deposited. The firm intimated (July 2014) the MC that the firm was not able to use these unipoles from last one year due to encroachment of religious and political institutions and asked the MC to refund the remaining amount after adjustment of premium deposited. Further scrutiny revealed that MC did not take any action on the firm for recovery of balance ` 27.73 lakh under the contract condition regarding the liability of contractor to pay full amount even in case of vacating the sites of advertisement before the completion of agreement period. Moreover, MC did also not re-invite tender for advertisement on unipoles. Thus, MC extended undue benefit of ` 27.73 lakh to the contractor.
In reply, Government stated (January 2017) that draft advertisement policy at State level was in the process of finalisation. However, this case would be enquired by the Department.
4.1.11.2 Loss of revenue on hoarding rent
As per Rule 3 of MP Transfer of Immovable Properties Rules, 1994, the Commissioner may with the sanction of the Corporation, sell, let out on hire or otherwise any immovable property which may be a source of income of the Corporation to the highest tenderer by inviting open tender. 4 Dewas (` 24.41 lakh), Indore (` 300.00 lakh), Ratlam (` 53.97 lakh) 5 Amla (` 2.10 lakh), Anuppur (` 1.56 lakh), Begumganj (` 9.92 lakh), Garhakota
(` 6.59 lakh), Harda (` 23.45 lakh), Junnordeo (` 57.52 lakh), Nainpur (`13.65 lakh) and Pandhurna (` 212.76 lakh)
`̀̀̀ 7.06 crore was
outstanding for
recovery on
account of rent/
premium of shops
MC Indore did
not recover
`̀̀̀ 27.73 lakh from
a firm for
advertisement on
unipoles

Audit Report on Local Bodies for the year ended 31 March 2016
50
Scrutiny of records of MC Indore revealed that the permission of hoardings for advertisement on 733 places was given by the MC to 107 agencies during the year 1991 to 2009. However, instead of calling annual tenders, the advertising agencies were granted extension every year up to 2014-15. Audit noticed that the rate of hoarding was revised from ` 75 to ` 85 per square feet (March 2009) and from ` 85 to ` 100 per square feet (August 2012). Thereafter, the rates were not revised till March 2015, which resulted in undue financial benefits to advertising agencies.
Further scrutiny revealed that the average hoarding rent during the period 2010-11 to 2014-15 was ` 3.68 crore. However, no hoarding rent was collected during the year 2015-16 due to cancellation of permission by MIC. Thus, cancellation of permissions without selecting the advertising agencies for hoarding resulted in loss of revenue to MC, which ranged6 between ` 3.14 crore and ` 4.94 crore during 2010-11 to 2014-15.
In reply, Government stated (January 2017) that draft advertisement policy at State level was in the process of finalisation. As soon as it is finalised, uniform policy would be there. However, these cases would be enquired by the Department.
4.1.12 Budgeting, Accounting and Appropriation of Revenues
4.1.12.1 Improper maintenance of budget and accounts
GoMP published (April 2007) Madhya Pradesh Municipal Accounting Manual (MPMAM) for adoption of accrual basis accounting system by MCs from 1 April 2008. As per Section 126 of MP Municipal Corporation Act, 1956 and 121 of Municipalities Act, 1961, as soon as the annual accounts has been passed, it would be transmitted to the Government in prescribed format.
Audit noticed that budget estimates and accounts of the period 2011-12 to 2015-16 of MCs Indore, Ratlam and Rewa were prepared as per provisions of MPMAM. However, Municipal Corporation Dewas and all test checked Municipal Councils did not prepare its budget and accounts in prescribed format. Further, the annual accounts of Municipal Corporations Dewas, Indore, Ratlam and Rewa were not passed by the Corporation.
In reply, Government stated (January 2017) that commercial audit of ULBs had been started from this year. Conversion to double entry system was under process and monitoring was being done from State level.
4.1.12.2 Preparation of unrealistic budget estimates
As per Rule 3 of MP Municipalities (Budget Estimates) Rules, 1962, the budget estimates should be prepared on the basis of comparative statements of actual income and expenditure of previous three years of the ULB.
Audit scrutiny revealed that there was large variation between budget estimates and actual income and expenditure which indicated improper budget formulation, as detailed in Appendices-4.4 (A) and (B). The actual income varied from the budget estimates up to 81 per cent during 2011-12 to 2015-16. During this period, the variation in actual vis-à-vis estimated expenditure was
6 ` 3.28 crore (2010-11), ` 4.94 crore (2011-12), ` 3.57 crore (2012-13), ` 3.46 crore
(2013-14), ` 3.14 crore (2014-15)
Budget
estimates were
not prepared
on realistic
basis

Chapter IV: Performance Audit
51
up to 80 per cent. Thus, budget estimates was not prepared on realistic basis as envisaged under the MP Municipalities (Budget Estimates) Rules, 1962.
In reply, Government stated (January 2017) that instructions would be issued to all ULBs for preparation of budget on realistic basis.
4.1.12.3 Bank reconciliation statement not prepared
According to Rules 97 and 98 of Madhya Pradesh Municipal (Accounts) Rules, 1971, reconciliation of differences, if any, between the balances of cash book and bank accounts should be conducted every month.
Audit scrutiny revealed that bank reconciliation was not carried out by any of the test checked MCs during the period 2010-11 to 2015-16. The difference between closing balances of cash book and bank pass book as on 31.03.16 in these MCs is shown in Appendix-4.5. The difference in closing balances of cash book and bank pass book could not be ascertained in case of MCs Indore and Ratlam, as these MCs were not maintaining cash book in prescribed format.
Further scrutiny revealed that the balance in bank accounts of Municipal Corporations Dewas, Rewa and Municipal Councils Anuppur, Badwah, Begumganj and Garhakota was less in comparison to balances mentioned in Cash Book, which was fraught with the risk of misutilisation of fund in the absence of bank reconciliation.
In reply, Government stated (January 2017) that instructions would be issued to concerned ULBs to prepare bank reconciliation. Under accounting reform, the handholding of the ULBs would be done by consultants and thereby whole accounting process including bank reconciliation would be strengthened.
4.1.12.4 Reserve Fund
• Short credit of ` 162.53 crore in Reserve Fund
As per GoMP orders (March 1998), five per cent of daily income of the ULBs, including grants-in-aid for compensation in lieu of octroi and passenger tax, should be credited in Reserve Fund of the ULB. The Accounts of Reserve Fund was to be maintained separately from the accounts of ULB. The Reserve Fund was to be utilised for emergency works or other works of public utility for which there was no budget provision.
Audit scrutiny revealed that test checked MCs were required to credit ` 169.33 crore to Reserve Fund during the period 2011-12 to 2015-16 (Appendix-4.6). However, only ` 6.81 crore was credited, thereby resulting in short credit of ` 162.53 crore in the Reserve Fund of test checked MCs. Further, MC Dewas and Indore did not constitute the Reserve Fund.
In reply, Government stated (January 2017) that cases of Indore and Dewas would be enquired from State level and instructions would be issued to other ULBs to deposit short credit.
• Funds drawn from Reserve Fund were not recouped
As per GoMP order (March 1998), the funds drawn from Reserve Fund were required to be recouped in maximum 24 instalments. The first instalment of recoupment becomes due after a month from the date of drawal from Reserve
Bank
reconciliation
was not carried
out by test
checked MCs
Test checked
MCs short
credited
`̀̀̀ 162.53 crore
in the Reserve
Fund

Audit Report on Local Bodies for the year ended 31 March 2016
52
Fund. Scrutiny of records of MC Amla revealed that ` 2.50 lakh was drawn from reserve fund in 2003-04 for construction of shops. However, the funds had not been recouped even after a lapse of 13 years, which was in violation of the orders of State Government.
In reply, Government stated (January 2017) that the cases would be examined and necessary action would be taken.
• Irregular expenditure of ` 4.84 lakh from Reserve Fund
As per GoMP order (March 1998), no fund can be drawn from Reserve Fund without prior sanction of the Director, UADD. Funds drawn from Reserve Fund could be expended only for non-recurring expenditure for which there was no budget provision. Audit scrutiny of records in MC Badwah revealed that fund amounting to ` 4.84 lakh was drawn from Reserve Fund (January 2016) for payment of salaries of employees of MC. The approval of Director, UADD was not obtained for drawal of fund, though it was required as per State Government’s instructions (March 1998). Further, the expenditure from Reserve Fund on payment of salaries, was contrary to orders of the Government.
In reply, Government stated (January 2017) that the cases would be examined and necessary action would be taken.
4.1.12.5 Delay in discharge of liability
As per Section 88 of MP Municipal Corporation Act, 1956, the moneys from time to time credited to municipal fund shall be applied in following order of preferences - Firstly, in making due provisions for repayment of all loans payable by the Corporation, Secondly in discharge of all liabilities imposed on the Corporation and Thirdly, in payment of all sums, charges and cost necessary for purposes provided for carrying out the Act into effect.
Audit scrutiny revealed that MCs Dewas and Indore did not discharge the liability of Corporation towards electricity bill. In MC, Dewas, the outstanding bill for electricity of street light, water supply etc. was ` 1.75 crore as on 31 March 2016, which was due since the year 2002. In MC, Indore, the outstanding bill for electricity of water supply was ` 499.08 crore as on 31 March 2016, which pertained to period prior to year 2012. However, no budget provision was made for payment of outstanding electricity bills.
MC, Indore stated (April 2016) that the liability would be reflected in the budget and annual accounts of next year. In reply, Government stated (January 2017) that instructions for ensuring timely payment of electricity bill would be issued.
4.1.12.6 Deposit of taxes deducted at source
Scrutiny of records of MCs Anuppur, Dewas and Rewa revealed that these MCs did not remit ` 7.66 crore of Value Added Tax, Royalty, Labour Welfare Cess and Income Tax deducted to the account of State Government, Madhya Pradesh Building and Other Construction Workers' Welfare Board and Government of India respectively as detailed in Appendix-4.7. Further scrutiny revealed that MCs unauthorisedly utilised these taxes deducted at source for their regular expenses.
MCs Dewas and
Indore did not
pay `̀̀̀ 500.83
crore of
electricity bill
Taxes deducted
at source
amounting to
`̀̀̀ 7.66 crore was
not deposited in
the account of
the Government

Chapter IV: Performance Audit
53
In reply, Government stated (January 2017) that instructions would be issued to deposit the taxes immediately.
4.1.12.7 Diversion of scheme funds for expenses of Municipal Council
Scrutiny of records of MC Badwah revealed that the MC received ` 6.69 crore under Urban Infrastructure Development Scheme for Small and Medium Town (UIDSSMT) for water supply project. However, the MC utilised ` 69.54 lakh of UIDSSMT fund for regular expenses of the MC such as payment of electricity bills and running bills of contractors during September 2014 to March 2015.
CMO, MC Badwah (June 2016) informed that the fund of UIDSSMT scheme was spent for due payments of MC as per sanction of President and CMO, which would be refunded in scheme fund in future. The reply was not acceptable as CMO and President were not competent to sanction utilisation of UIDSSMT fund for purpose other than those for which it was received.
In reply, Government stated (January 2017) that the case would be examined and necessary action would be taken.
4.1.12.8 Diversion of Education Cess for transportation of mid day meal
to schools
As per orders of UADD, GoMP (October 1999), ULBs were permitted to levy Education Cess at a rate not more than five per cent of the annual letting value of those land/buildings on which Property Tax was imposed. Further, GoMP issued orders (October 2012) regarding utilisation of Education Cess on maintenance, sanitation and providing potable water facilities to Government Schools within the municipal area.
Audit scrutiny revealed that MC Indore irregularly utilised ` 9.75 crore of Education Cess during 2011-12 to 2015-16 on transportation of cooked food under Mid Day Meal (MDM) Scheme. On this being pointed out, the Commissioner replied (June 2016) that Education Cess was spent for transportation of food under MDM as per resolution passed by MIC. However, copy of resolution of MIC was not furnished to audit.
In reply, Government stated (January 2017) that revised instruction for utilisation of Education Cess had been issued (July 2016).
Fact remains that the instructions of October 2012 for utilisation of Education Cess was in force during 2011-12 to 2015-16, which was required to be followed by MC, Indore and accountability for overruling the orders of State Government without authority was required to be fixed.
4.1.12.9 State Share of Urban Development Cess was not remitted
As per provision of MP Upkar Adhiniyam 1981, MCs were required to levy and realise Urban Development Cess on land and buildings within Municipal area. As per Gazette Notification of Finance Department, GoMP (February 2008), ULBs were required to deposit 40 per cent of the Urban Development Cess realised by them in the accounts of the State Government.
During the period 2010-11 to 2015-16, test checked MCs collected ` 46.85 crore as Urban Development Cess (Appendix-4.8). Thus, an amount of ` 18.74 crore (40 per cent) was to be deposited in the accounts of the
MCs did not
remit State
Share of Urban
Development
Cess of `̀̀̀ 18.60
crore

Audit Report on Local Bodies for the year ended 31 March 2016
54
Government. However, only ` 0.14 crore was deposited by MCs Garhakota, Harda and Nainpur. Other test checked MCs did not deposit any amount in accounts of the Government. Thus, State Government was deprived of revenue of ` 18.60 crore due to failure of MCs to credit Urban Development Cess in the Government Account.
In reply, Government stated (January 2017) that instructions would be issued to concerned ULBs to deposit the requisite amount in account of the Government.
4.1.13 Monitoring
4.1.13.1 Lack of staff in Revenue Department for recovery of taxes
Collection of revenue is the main source of earnings of ULBs, so sufficient staff should be posted in Revenue Department for revenue realisation. Scrutiny of records of six test check MCs7 revealed that there was acute shortage of staff in Revenue Department of these MCs, as detailed in Appendix-4.9. The vacancy against sanctioned posts of Revenue Department was 94 per cent of posts in Dewas, 70 per cent of the posts in Indore, 77 per cent of posts in Ratlam, 46 per cent of posts in Badwah, 40 per cent of posts in Porsa and 36 per cent of posts in Rewa. The shortage of staff adversely affected the revenue recovery process, as discussed in paragraphs 4.1.7.2 and 4.1.7.3.
In reply, Government stated (January 2017) that efforts were being made to rationalise the staff at ULB level.
4.1.13.2 Demand of taxes not monitored on the basis of GIS survey
Under the Madhya Pradesh Urban Infrastructure Investment Programme (MPUIIP), State Government selected (July 2013) MC Dewas for the pilot project of preparation of assessment and demand register of Property Tax. After conducting the survey, the outstanding Property Tax arrears of ` 41.21 crore and outstanding user charge for water supply of ` 6.08 crore were ascertained as on March 2013 in MC Dewas.
Audit scrutiny, however, revealed that MC did not monitor recovery of these outstanding arrears and the demand of outstanding tax arrears were reflected in the Recovery Statement as ` 8.25 crore in respect of Property Tax and ` 2.95 crore in respect of user charge for water supply. Thus, the failure of MC Dewas to follow up the ascertained demand worked out on the basis of survey resulted in short raising of demand of ` 36.09 crore of Property Tax and user charge for water supply.
In reply, Government stated (January 2017) that Property Tax had been covered under urban reforms and GIS based Property Tax collection was being implemented across the State under supervision of Directorate, UADD. However, report from the ULB would be called for.
4.1.13.3 GIS survey of properties not completed in MC Indore
Scrutiny of records (April 2016) of Commissioner, MC, Indore revealed that MC entered into an agreement (March 2007) with an agency for GIS survey of
7 Badwah, Dewas, Indore, Porsa, Ratlam and Rewa

Chapter IV: Performance Audit
55
properties of municipal area at a cost of ` 1.50 crore and the work order was issued in January 2008. As per the work order, the survey work was to be carried out up to May 2008 and thereafter, GIS based computer application system was to be developed in the next month.
Further scrutiny revealed that MC made payment of ` 37.50 lakh (February 2009) and ` 13.24 lakh (March 2010) on the basis of progress of work. However, the agency did not complete the GIS survey and data base of properties. After issuing several notices to the agency, the MC terminated (June 2012) the contract. Thus, the desired objective could not be achieved due to incomplete work of GIS database which resulted in unfruitful expenditure of ` 50.74 lakh.
In reply, Government stated (January 2017) that GIS survey of all the ULBs was under process at State level. Case of MC Indore would be enquired and report would be asked from the Corporation.
4.1.14 Summary of conclusion and recommendations
• The revenue raised by ULBs was insufficient to meet out their expenditure. The share of own revenue remained between 37 per cent and 69 per cent of total expenditure in test checked Municipal Corporations, whereas in test checked Municipal Councils, it remained between 24 per cent and 64 per cent. Further, the major increase in own revenue during 2011-16 was attributed to increased grants-in-aid from State Government for compensation in lieu of Octroi and Passenger Tax and there was no proportionate increase in own tax collection of MCs.
Recommendation: State Government and MCs should take effective steps for exploiting the potential of demand and collection of own revenue in their jurisdiction by capturing database of assessee through GIS survey.
• Property Tax Board, which was constituted to assist MCs in determination and collection of Property Tax, did not perform its mandated duties due to lack of manpower in the Board.
Recommendation: State Government should strengthen Property Tax Board so that it may assist and guide the MCs regarding levy and realisation of taxes to enhance their revenue raising capabilities.
• Budget and Accounts were not prepared as per provisions of MP Municipal Accounts Manual. Bank Reconciliation was not carried out in test checked MCs, which was fraught with the risk of misutilisation of fund.
Recommendation: State Government should ensure preparation of Budget and Accounts by MCs according to MP Municipal Accounts Manual.
• There was short credit of ` 162.53 crore in Reserve Fund by test checked MCs. State Government was deprived of revenue of ` 18.60 crore due to failure of MCs to remit the State’s share of Urban Development Cess in Government Account. Further, MCs did not
Incomplete work
of GIS data base
resulted in
unfruitful
expenditure
`̀̀̀ 50.74 lakh

Audit Report on Local Bodies for the year ended 31 March 2016
56
deposit ` 7.66 crore of taxes deducted at source (TDS) in respect of Value Added Tax, Royalty, Labour Welfare Cess and Income Tax, which was utilised by MCs for their regular expenses.
Recommendation: MCs should ensure that statutory dues, such as TDS in respect of Value Added Tax, Royalty, Labour Welfare Cess and Income Tax are deposited with respective authorities within prescribed time.
• The collection of Property Tax, Composite Tax and user charges for water supply was significantly less than the respective demands during 2011-16. The outstanding collection in test checked MCs was ` 145.38 crore in respect of Property Tax, ` 142.69 crore in respect of Composite Tax and ` 243.65 crore in respect of user charges for water supply as on March 2016. There was acute shortage of staff in Revenue Department of MCs, which adversely affected the revenue recovery process. Further, demand of taxes were not monitored on the basis of GIS Survey.
Recommendation: MCs should strengthen the procedure for recovery of current taxes and arrear of taxes by periodic monitoring and providing adequate staff in the Revenue Department.


Chapter V: Compliance Audit
URBAN DEVELOPMENT AND HOUSING DEPARTMENT
5.1 Setting up and management of Fire Services by Urban Local
Bodies
5.1.1 Introduction
The Fire Services have been included as a Municipal function under Article 243 (W) in the XII Schedule of the Constitution of India. The key role of fire services are to save life and property from fire, conduct rescue operations, educate and create public awareness for fire prevention. It is the primary responsibility of the municipal bodies themselves and the State Governments to allocate sufficient resources for strengthening and equipping Fire Services with modern gadgets and technologies and to take various steps required for safety of life and property of the citizens in the area of their jurisdiction. Under Madhya Pradesh Municipal Corporations Act 1956 and Madhya Pradesh Municipalities Act 1961, Urban Local Bodies (ULBs) are responsible for establishment and maintenance of fire brigade and arrangement for the prevention and extinction of fire.
The setting up and management of fire services by ULBs in the State covering period from 2011-12 to 2015-16 was examined in audit to assess whether adequate infrastructure for fire services was available and supported by proper planning, adequate funding and monitoring. For the test check of records in audit, Bhopal Municipal Corporation (BMC), Jabalpur Municipal Corporation (JMC), four Municipal Councils1 (MCs) and four Nagar Parishads2 (NPs) were selected by using Simple Random Sampling without Replacement
method. Records of Urban Administrative and Development Directorate (UADD) were also examined.
An entry conference was held with Additional Commissioner, UADD on 17 March 2016 to discuss audit objectives, audit criteria, scope and methodology. Exit conference was held on 6 January 2017 with the Additional Commissioner, UADD to discuss the audit findings. The replies of State Government have been suitably incorporated in the report.
Audit Findings
5.1.2 Planning
5.1.2.1 Comprehensive Plan for management of fire services not prepared
With a view to upgrade the shortcoming in the fire services, the Government of India (GoI) constituted (1955) a Standing Fire Advisory Committee (SFAC) to advise to GoI for speedy development of fire services all over the country including standardisation of fire fighting equipment. In order to standardise and revamp fire services in the country, the National Disaster Management
1 Chanderi (Distt. Ashoknagar), Malanjkhand (Balaghat), Mandideep (Raisen) and
Sanavad (Khargone) 2 Banmore (Morena), Chandla (Chhatarpur), Khirkiya (Harda) and Shahpur
(Burhanpur)

Audit Report on Local Bodies for the year ended 31 March 2016
58
Authority (NDMA) issued (April 2012) guidelines on scaling, type of equipment and training of fire services (NDMA guidelines, 2012), which was to be followed by all State Governments and local bodies in a planned and focused manner.
As per Para 3.3 of NDMA guidelines, 2012, the State was to prepare a complete plan and work out the total requirements of manpower and equipment for the entire State on the basis of recommendation of SFAC. The number of fire stations and the number and type of vehicles were to be calculated. After finalising the requirements, it was to be examined as to how much can be procured out of Thirteenth Finance Commission (ThFC) grant to the ULBs and for remaining requirements, proposals were to be prepared and submitted to the Planning Commission for approval in the State Plan for next five years (2012-17).
Audit noticed that State Government did not prepare any comprehensive plan for strengthening and management of fire services as required under NDMA guidelines, 2012. Commissioner, UADD informed (February 2016) that the ThFC grant was released to ULBs with the instruction to procure the water tender on first priority, in cases where water tender was not available. Thus, even the requirement of water tenders at State level were not assessed by UADD before release of ThFC grant to ULBs.
In reply (January 2017), State Government stated that in view of audit observation, orders were issued in December 2016 for procurement of 14 water tenders in 11 ULBs and the remaining requirement would be met according to availability of budget. “Ideal Personnel Structure” had been published for ULBs and instructions would be issued to ULBs for making recruitment as per “Ideal Personnel Structure”.
The reply is not acceptable, as State Government could not provide any evidence for preparation of comprehensive plan and projected requirement for funds communicated to the Planning Commission to bridge the resource gap in the State Plan during 2012-17.
5.1.2.2 Regulations for fire service management not made by ULBs
Section 353 of Municipal Corporation Act 1956 envisages that the Commissioner shall make regulations for: (a) training, discipline and good conduct of the men belonging to the fire brigade, (b) their speedy attendance with engines, fire-escapes and all necessary implements on the occasion of any alarm of fire, (c) maintenance of the said brigade generally in the state of efficiency, and (d) the submission of reports of fires. Further, Section 358 (3) (k) of Municipalities Act 1961 envisages that the Municipal Councils may make bye-laws for the provision of means of egress in case of fire, fire-escapes and water-lifting devices.
Audit scrutiny revealed that test checked ULBs did not frame regulations/bye-laws to regulate fire services as envisaged under respective Acts. In reply (January 2017), Government stated that instructions would be issued to ULBs.
The failure of ULBs to frame regulations/bye-laws for fire services, though mandated under the respective Acts, led to deficient management of fire services, as discussed in succeeding paragraphs.
State Government
did not prepare
comprehensive
plan for
management of
fire services
None of the test
checked ULBs
made any
regulations/
bylaws to regulate
fire service

Chapter V: Compliance Audit
59
5.1.2.3 Enactment of a Fire Act not done
SFAC finalised a model Fire Force Bill, which was circulated (October 1958) by GoI to all State Governments for enactment by their respective Legislature. Considering the increasing vulnerability to fire all over the country, NDMA guidelines, 2012 envisaged that States, which had not enacted their own Fire Act, should immediately enact a suitable Fire Act within a year.
Audit scrutiny revealed that the State Government did not enact its own Fire Act. The fire services were organised under Municipal Corporations Act 1956 and Municipalities Act 1961. However, the respective municipal acts did not provide for various necessary provisions included in Model Fire Bill, such as,
- penalties and punishments for violation of duty of fire service personnel, failure of person in communicating information on outbreak of fire, false report of the outbreak of a fire; and,
- liability of property owner, whose property catches fire due to deliberate or negligent action, to pay compensation to any other person suffering damage to his property.
In reply (January 2017), State Government stated that the suggestions of States on model draft bill were invited by GoI. The necessary amendments in Acts/Rules would be made after finalisation of Model Fire Safety Act.
Fact remains that State Government did not enact the Fire Act, despite the NDMA guidelines, 2012 required it to be enacted within a year.
5.1.2.4 Fire services not transferred to ULBs
According to Constitution (74th Amendment Act), 1992, 18 functions including fire services, were to be devolved to Municipalities under Article 243W read with 12th schedule of the Constitution of India. State Government devolved all functions listed in the 12th schedule to ULBs. Audit scrutiny revealed that fire services in the State was being rendered by Municipalities. However, Police fire services continued to render the fire services in Indore, four buildings of Bhopal (Vallabh Bhawan, Satpura Bhawan, Vindhayachal Bhawan and Vidhan Sabha Bhawan) and Industrial Areas of Pithampur (Dhar district) and Malanpur (Bhind district). As a result, six fire stations, 90 fire vehicles and 253 employees were yet to be transferred from Police to ULBs.
In reply (January 2017), State Government stated that Home Department had been requested for handing over the fire services.
5.1.3 Financial outlay
ThFC recommended that a portion of grants provided to ULBs be spent on revamping of fire services within their respective jurisdictions. The State Government received ThFC grants of ` 1,325.30 crore during the period of 2010-16 for further allocation to ULBs. Audit noticed that State Government released ThFC grant of ` 168.11 crore to test checked ULBs. However, there was no separate allocation of fund for fire services under ThFC grants released to ULBs.
Audit scrutiny revealed that State Government released ` 8.50 crore as a State Grant to test checked ULBs for fire services. The details of receipts of ThFC
The State
Government did
not enact its
own Fire Act

Audit Report on Local Bodies for the year ended 31 March 2016
60
Grant, State grant and expenditure incurred on fire services by test checked ULBs during 2010-16 were as detailed in Table 5.1.
Table – 5.1: Details of receipts under ThFC Grant and State Grant and
expenditure on fire services by test checked ULBs during 2010-16
(`̀̀̀ in crore)
Name of ULBs ThFC grant State fund
Total receipt Expenditure on fire
services (per cent)
Receipt for
fire services
Expenditure on
fire services
BMC 91.08 1.24 (1) 6.05 0.55
JMC 65.47 1.31 (2) 0.55 0.55
MC Chanderi 1.8 0.13 (7) 0.33 0
MC Malanjkhand 1.47 0 0.33 0
MC Mandideep 2.8 0.65 (23) 0.33 0
MC Sanavad 1.76 0.04 (2) 0.33 0
NP Banmore 1.02 0 0.33 0.25 (75)
NP Chandla 0.76 0 0.25 0.12 (48)
NP Khirkiya 1.01 0 0 0
NP Shahpur 0.94 0 0 0
Total 168.11 3.37 8.50 1.47
(Source: Information collected from ULBs)
As evident from Table 5.1, five ULBs did not incur any expenditure on fire services against ThFC grant. The expenditure of remaining five ULBs, except MC Mandideep, was only one to seven per cent. Thus, ULBs did not comply the ThFC recommendation of incurring a portion of grants on revamping of fire services within their respective jurisdictions. Further, 83 per cent of the State grant (` 7.03 crore) released for fire services remained blocked with seven test checked ULBs as of August 2016.
Test checked ULBs also collected ` 30.29 crore during 2011-16 as general fire tax (as a part of composite tax3), which was imposed as per State Gazette
notification (April 1997) for conduct and management of fire services in municipal area under the provisions of Madhya Pradesh Municipal Corporation Act 1956 and Municipality Act 1961. The details of funds augmented in the budget of ULBs and expenditure incurred on fire services by test checked ULBs during 2010-16 were as detailed in Table 5.2.
Table – 5.2: Details of Fire tax, budget estimates and actual expenditure on fire
services during 2011-12 to 2015-16
(` (` (` (` in crore) Name of ULB Provisions for
expenditure on fire
service in BEs
Recovery of
General Fire Tax
Actual expenditure against
BEs (Percentage of
Expenditure)
BMC 15.46 19.82 6.87 (44)
JMC 28.04 9.75 3.30 (11)
MC Chanderi 0 0.17 0.01
MC Malanjkhand 0.38 0.13 0.13 (34)
MC Mandideep 0.40 0.15 0.11 (27)
MC Sanavad 0.69 0.10 0.64 (92)
3 Sanitation Tax, light tax and fire tax
Utilisation of
ThFC grant on fire
service was one to
seven per cent

Chapter V: Compliance Audit
61
Name of ULB Provisions for
expenditure on fire
service in BEs
Recovery of
General Fire Tax
Actual expenditure against
BEs (Percentage of
Expenditure)
NP Banmore 0 0.03 0.24
NP Chandla 0.68 0.01 Not available
NP Khirkiya 0.40 0.08 0.01 (2)
NP Shahpur 0.04 0.05 0.02 (50)
Total 46.09 30.29 11.33
(Source: Information provided by UADD)
Thus, the expenditure on fire services by test checked ULBs (except MC Sanavad) was only 2 to 50 per cent against the budget estimate. These ULBs could not utilise even the realised fire tax, though these ULBs had severely deficient infrastructure for managing fire services, as discussed in succeeding paragraphs.
In reply, BMC stated (August 2016) that the available resources were adequate for fire services as per the requirement of Municipal area, therefore, the ThFC grant was utilised on other basic services. JMC stated (February 2016) that the requisite improvement could not be made in fire services as ThFC grant was utilised on infrastructure work. The CMO Sanavad (June 2016) replied that State Grant received was kept in Municipal fund. CMO NP Banmore replied (May 2016) that available funds would be utilised on fire services with approval of Municipal Council.
The reply of BMC was not acceptable as the available fire stations, equipment and manpower for fire services in BMC were much less than the requirement as stated in fire mitigation plan discussed in para 5.1.4.4.
During exit conference (January 2017), State Government replied that the ULBs were directed to utilise ThFC grant for purchase of water tender (if not available) on priority basis and thereafter remaining grant was to be utilised on water supply, solid waste management, infrastructure in slums, sewerage and drainage and construction of roads and also issued an order (January 2017) to ensure utilisation of fire tax revenue on fire services.
Reply of State Government was not acceptable, as the Government failed to earmark a portion of ThFC grant for utilisation on fire services as recommended by ThFC. The requirements of manpower and equipment for the entire State was also not worked out for requesting fund during next five year in the State Plan. As a result, fire services could not be strengthened in the State and there remained large gaps in basic requirements viz. fire stations, essential equipment and manpower.
5.1.4 Infrastructure and Fire Management
5.1.4.1 Inadequate number of Fire Stations
Operational efficiency of any fire service depends, to a large extent, upon the location of fire station in relation to the entire area which is required to be protected by the fire station. SFAC recommended that fire station should be established in district headquarter towns and all sub divisional headquarter towns. It was also recommended that one fire station should be available for every 10.36 Sq.kms. of area to be covered in the city having population more

Audit Report on Local Bodies for the year ended 31 March 2016
62
than one million. The minimum dimensions for each essential features of a fire station was also recommended by SFAC.
Audit scrutinty revealed that no fire station was established in test checked ULBs, except BMC and JMC. As a result, water tenders were kept in open areas, which were about one to two km away from water hydrants.
BMC had only 10 fire stations against the requirement of 28 fire stations for covering area of 285 Sq.km. Out of 10 fire stations, only four fire stations4 were established in covered buildings. However, the dimensions of Appliance Room, Watch Room, Store Room etc. in the fire stations were less than the minimum dimensions recommended by SAFC (Appendix-5.1). Further, water hydrants were installed only in two fire stations, despite recommendation of SFAC of minimum one hydrant in each fire station. The water hydrants for remaining eight fire stations were installed one to three km away from fire stations.
Fire station, Kolar, Bhopal
(Obstacles in water tender parking area) Main fire station Jabalpur
(water tenders were kept in open area)
Further, in JMC, there were two fire stations (one main fire station and one fire sub-station) against the requirement of 11 fire stations assessed by the Corporation for covering area of 122.5 Sq.km. The main fire station was covering about 87 per cent service area. Further, land at nine various places was earmarked (July 2007) for establishment of fire stations and provision for establishing fire station was also made in the Budget Estimates for the period 2011-12 to 2014-15.
Audit noticed that there was loss of property of ` 2.90 crore in the area in 26 fire outbreaks with distance of five Kms and above from the fire station. However, JMC failed to establish new fire stations as of March 2016.
In reply, test checked ULBs stated (April 2016 to August 2016) that the requisite fire stations could not be established due to lack of funds. During exit conference the State Government replied that instructions were issued (January 2017) to BMC and JMC to ensure the utilisation of fire tax revenue on fire services.
4 Chhola, Govindpura, Pulbogda and Sant Hirdaram Nagar
Fire stations
established by
BMC and JMC
were not as per
SFAC norms

Chapter V: Compliance Audit
63
5.1.4.2 Essential equipment
SFAC recommended the minimum essential equipment viz. two water tender pumps (carrying minimum 2700 litre water), one extra heavy water tender (carrying minimum 9000 litre water) and one ambulance for scaling of each fire station. The Details of essential equipment available in fire stations of BMC and JMC were as given in Table-5.3.
Table – 5.3: Details of availability of essential equipment in test checked ULBs
Name
of ULB
No. of fire
station
Water tender pump Heavy water tender Ambulance
Available Required Available Required Available Required Available
BMC 10 20 20 10 Nil 10 Nil
JMC 02 04 08 02 01 02 Nil
Total 12 24 28 12 01 12 Nil
(Source: Information provided by ULBs)
Thus, there were shortage of 11 heavy water tender pumps and 12 ambulances in available fire stations of BMC and JMC. Further, the requirement of essential equipment in remaining test checked ULBs could not be assessed in Audit due to absence of any fire station in these ULBs.
In reply, the test checked ULBs stated (February to August 2016) that equipment could not be procured due to lack of funds. During exit conference (January 2017), State Government replied that the procurement of water tenders was under process.
Replies are not acceptable, as ULBs failed to utilise even the realised fire tax for strengthening fire services in their respective jurisdictions.
5.1.4.3 Personnel Protective equipment
Fire fighters are exposed to highly variable environments including elevated temperatures and convective and radiant thermal flux. Keeping in view, NDMA prescribed 16 types of personal protective equipment as detailed in Appendix-5.2. However, scrutiny of records revealed that no personal protective equipment was available in MC Sanavad and NPs Chandla, Khirkiya and Shahpur. Further, only two to eight equipment were available in remaining ULBs.
In reply (January 2017), State Government stated that the action would be taken for procurement of personnel protective equipment as per availability of budget.
The reply is not acceptable, as State Government/ULBs had not prepare any plan for procurement of protective equipment.
5.1.4.4 Fire Mitigation Plan not implemented
According to para 10.161, ThFC recommended that all Municipal Corporations with a population of more than one million (2001 census) must put in place a fire hazard response and mitigation plan for their respective jurisdictions and publish it in the State Gazette.
BMC and JMC, which had population of 14.58 lakh and 10.76 lakh (census 2001) respectively, prepared Fire Hazard Response and Mitigation

Audit Report on Local Bodies for the year ended 31 March 2016
64
Plans (Fire Mitigation plan hereinafter) for the period 2010-15 and published (February, 2011) it in two parts (Capital Investment Plan and Human Resource Management) in the State Gazette. Following deficiencies in implementation of fire mitigation plan were observed:
• Implementation of Fire Mitigation Plan in BMC
The Capital Investment Plan (CIP) of ` 323 crore of BMC was based on requirement of infrastructure and equipment as per NDM guidelines. The CIP comprised establishment of one city level headquarter, four divisional headquarters, one training centre and 28 fire stations and 246 fire equipment. Human Resource Management plan comprised requirement of 491 posts for fire services (44 post for general manpower and 447 posts for operation of equipment).
BMC received ThFC grant of ` 91.08 crore during 2010-16, while expenditure incurred on fire services was only ` 1.24 crore (one per cent) against the proposed CIP. Further, against the additional requirement of 22 fire stations, only five fire stations5 were established and 14 equipment6 were procured against the projected requirement of 213 equipment during the period 2011-16. Audit noticed that no initiatives were taken for establishment of city level headquarter, divisional headquarter and training centre.
Audit noticed that the sanctioned strength of fire personnel was 176 against the projected requirement of 4177 in the human resource management plan and only 156 personnel were actually deployed for fire services. However, BMC did not take any initiatives for recruitment of staff during 2011-16.
• Implementation of Fire Mitigation Plan in JMC
The CIP of ` 137.85 crore of JMC was based on requirement of infrastructure and equipment as per NDMA guidelines, 2012, which comprised of establishment of one headquarter, two divisions, 11 fire stations and 39 fire equipment. Human Resource Management comprised requirement of 550 posts for fire services (243 post for general manpower, 89 post for office requirement and 218 posts for operation of equipment).
JMC received ThFC grant of ` 65.47 crore during 2011-16 and the expenditure of JMC on fire services was only ` 1.31 crore (two per cent). However, no fire station was established despite 11 planned fire stations. Further, the sanctioned strength of fire personnel was 187 against the projected requirement of 3738 in the human resource management plan and only 85 personnel were actually deployed for fire services.
Thus, the mitigation plans of BMC and JMC were not implemented despite availability of ThFC grant of ` 91.08 crore in BMC and ` 65.47 crore in JMC.
On this being pointed out, the BMC stated (August 2016) that mitigation plan could not be implemented due to unavailability of land and adequate fund. The
5 Fire station Gandhi Nagar, Govindpura, Ibrahimpura, ISBT and Mata mandir 6 One foam tender, One water tender, One Rescue van and 11 fire bullets
7 Chief Fire Officer (01), Fire Officer (04), Asstt. Fire Officer(10), Leading Fireman
(288) and fireman (114) 8 Chief Fire Officer (04), Fire Officer (02), Asstt. Fire Officer(04), Leading Fireman
(97) and fireman (266)

Chapter V: Compliance Audit
65
JMC stated (February 2016) that the plan could not be implemented due to not receiving additional grant for this purpose.
The replies of both ULBs are not acceptable as they could not utilise even available funds on fire services. During exit conference State Government replied that instructions were issued (January 2017) to ULBs to ensure the utilisation of fire tax revenue and grants provided for augmentation of fire services.
5.1.4.5 Allotment of Staff quarters to fire personnel
SFAC recommended that the allotment of quarters to all the fire personnel should be within the premises of the fire station to ensure their availability at all times.
Audit scrutiny revealed that only four fire stations9 out of 12 fire stations in BMC and JMC had staff quarters. Thus, staff quarters was not available within the premise of eight fire stations, whereas 81 fire personnel were posted in these fire stations. Further, 85 staff quarters were available in the premises of four fire stations, whereas 160 fire personnel were deputed in these fire stations. However, only 24 staff quarters (28 per cent) were allotted to fire personnel and remaining 61 quarters were allotted to staff deployed in other department of MCs. The details of availability of staff quarters within the premises of four fire stations and allotment to fire personnel are given in Table-5.4.
Table – 5.4: Details of availability and allotment of staff quarters
Name
of
ULB
No.
fire
station
No fire
personnel
deployed
No, of staff quarters
in the premises of
fire stations
Staff quarters
allotted to fire
personnel
Staff quarters
allotted to
others
BMC 03 77 32 15 17
JMC 01 83 53 09 44
Total 04 160 85 24 61
(Source: Information collected from ULBs)
In reply, the BMC stated (August 2016) that the staff quarters were allotted to other employees since long and the matter would be considered in future. The JMC replied (February 2016) that the staff quarters were allotted to fire personnel on priority basis subject to their demand. During exit conference, State Government replied that the instructions were issued (January 2017) for allotment of staff quarters to fire personnel on priority basis.
The reply was not acceptable, as BMC and JMC failed to provide staff quarters to all the fire personnel within the premises of the fire station so as to ensure their availability at all times.
5.1.4.6 Fire calls and Response time
As per para 2.5 of NDMA guidelines, 2012 the locations of the fire station should be such that the men and equipment would be able to reach any part of the area covered by the respective fire stations within three to five minutes in urban area and 20 minutes in the rural areas.
9 Bhopal (Fatehgarh, Pulbugda, Sant Hirdaram Nagar), Jabalpur (Nigam compound)
Out of 85 staff
quarters only 24
staff quarters were
allotted to fire
personnel
Audit Report on Local Bodies for the year ended 31 March 2016
66
Audit noticed that BMC and JMC attended 10948 (9220 and 1728 respectively) fire calls and other test checked ULBs attended 919 (MCs 485, NPs 434) fire calls during 2011-12 to 2015-16. However, response time was not recorded by any of the test checked ULBs. Thus, in absence of records showing response time the efficiency of fire services could not be ascertained in audit.
In reply (January 2017), State Government stated that instructions were issued (January 2017) to all ULBs for recording the response time as required by SFAC recommendations.
5.1.4.7 National Building Code requirements in respect of fire prevention
not complied
SFAC recommended that ‘No Objection Certificate’ (NOC) must be obtained from the fire service for each place of public assembly and provisions for fire safety requirement in such occupancies as contained in National Building Code (NBC) of India may be strictly enforced. State Government made a provision in Land Development Act 2012 that fire fighting system as prescribed in NBC should be installed in buildings having height of more than 12.5 meter. The Commissioner, UADD was designated as State Fire Authority (SFA) for ensuring the installation of fire equipment in the buildings as per the norms of NBC.
Audit scrutiny revealed that SFA issued provisional fire NOCs for buildings on the basis of fire plan, lay out plan and building permissions issued by ULBs or Gram Panchayats etc. with the condition that the applicant would invariably inform after installation of fire fighting equipment in the building so that the temporary NOC and licence for occupation after due verification could be issued. During 2011-12 to 2015-16, SFA issued 517 provisional NOCs without mentioning validity period for these NOCs. Of these provisional cases of permission, temporary NOCs were issued later on only in 130 cases (25 per cent). The information of installation of fire fighting system was not available (August 2016) with SFA in remaining 387 cases.
Scrutiny of records in test checked ULBs revealed that BMC issued 153 building permissions and JMC issued 41 building permissions during 2011-16 with the condition that the owner of the building had to obtain fire NOC from SFA. However, out of 194 cases of building permission, the owners of buildings applied for NOC only in 19 cases (10 per cent). The provisional NOC was issued in 17 cases and the status of installation of fire fighting system was not verified by respective ULBs or SFA in remaining 177 cases.
In reply, BMC and JMC stated (June 2016 and February 2016) that while issuing building permissions, the owners were directed to obtain NOC from SFA.
During exit conference, State Government replied that the information regarding building permission issued by ULBs were not made available to SFA. Hence, the fire NOCs were issued only in those cases in which the proposal received from owners of the building. However, the instructions in this regard would be issued.
Response time
to attend fire
calls was not
recorded in any
test checked
ULBs

Chapter V: Compliance Audit
67
Thus, due to lackadaisical approach on the part of Municipal authorities and SFA, compliance of NBC norms in respect of installation of fire equipment in buildings was not ensured.
5.1.4.8 Public awareness programme
The public awareness for prevention of fire is important and therefore, SFAC recommended that the public awareness programme should be organised, which may include propaganda in schools and colleges, exhibition of slides and films in cinema houses, competition of slogan writing and observance of fire week or fire day.
Audit observed that no programme of public awareness for prevention of fire was organised by any test checked ULBs, except JMC which observed fire day (14 April) and organised propaganda in schools and colleges through distribution of ‘Agni Suraksha Fun book’.
In reply (January 2017), State Government stated that the instructions were issued (January 2017) for running a campaign for public awareness for prevention of fire.
5.1.5 Man power management and capacity building
5.1.5.1 Shortage of fire staff
State government issued (February 2014) ideal personnel structure for ULBs and approved sanctioned strength of 443 fire personnel for test checked ULBs. Audit scrutiny revealed that none of the test checked ULBs, except BMC and JMC, had sanctioned post of Chief Fire Officer/Fire Officer/Assistant Fire Officer. Further, there was acute shortage of fire personnel and only 285 fire personnel (64 per cent) were actually deployed, as depicted in Chart 5.1 and Appendix-5.3.
Further, out of 285 fire personnel deployed in the test checked ULBs, only 94 personnel (33 per cent) were on regular basis and remaining 191 personnel were either on daily wages or contract basis. Audit scrutiny revealed that recruitment against the sanctioned posts of fireman was not done during
Audit Report on Local Bodies for the year ended 31 March 2016
68
2011-16, except confirmation of three daily wages employees on the post of fireman in NP Chandla.
As per Municipal Corporation recruitment and service rules 2000, the post of fireman was to be filled only by direct recruitment method and “diploma in fire services” was essential qualification for fire man. Also, SFAC recommended physical standard for physical fitness of fire personnel, such as running a distance of 100 yards with a weight of 10 stones in one minute, lifting the hook ladder to a vertical position by third and sixth round, climbing a rope or a vertical position to a height of eight to ten feet from the ground, etc. However, the physical fitness of fire personnel was never ensured by any test checked ULBs.
In reply (January 2017), State Government stated that the recruitment of staff was to be done by ULBs. However, the instructions were issued (January 2017) to ULBs to ensure necessary qualification and physical fitness of fire personnel.
5.1.5.2 Capacity building of fire staff was not ensured
The aim of training was to ensure that all fire service personnel are given the necessary exposure to develop the knowledge, skills, attitude, physical fitness, vision and mental alertness. Further, a Fire Training Centre should be established in every State for new entrants and for organising service/promotional courses. ThFC also identified the capacity building as a critical area for disaster management and allocated funds of ` 25 crore for this purpose to each state during 2010-15, which was to be utilised on training of fire personnel.
Audit scrutiny revealed that State Government did not establish fire training centre in the State. Further, no training programms/courses for fire personnel was organised by State Government or by the test checked ULBs during 2011-12 to 2015-16.
In reply (January 2017), State Government stated that the instructions were issued (January 2017) to ULBs to organise training programme for fire personnel for necessary qualification and physical fitness of fire personnel.
5.1.6 Monitoring and upkeeping of fire records
Audit scrutiny revealed that there was no monitoring mechanism for periodic inspection of fire stations/ equipment and its reporting at State level as well as at test-checked ULBs level. Fire call register was not maintained in test checked ULBs except in BMC and JMC. However, information required to assess the efficiency of fire service such as response time was not recorded in fire call register of BMC and JMC. The details of loss were recorded in only some cases in fire call register.
During exit conference (January 2017), State Government replied that in view of audit observations, the instructions were issued to all ULBs for keeping records of response time and loss properties.
5.1.7 Summary of conclusions and recommendations
• State Government did not prepare comprehensive plan for strengthening and management of fire services. Fire Act was not
There was no
system in place
for monitoring
and up
keeping of
records
No training
programs were
organised for
capacity
building of fire
personnel

Chapter V: Compliance Audit
69
enacted in the State, despite NDMA guidelines 2012 required it be enacted within a year. The Commissioner/CMOs of the test checked ULBs did not frame regulations/bylaws to regulate fire services as envisaged under the respective Municipal Acts. Compliance of norms of NBC in respect of installation of fire fighting system in the buildings was not ensured by ULBs and SFA.
Recommendation: ULBs should make regulations/bylaws to regulate fire services.
State Government stated that ULBs would be directed accordingly.
• Test checked ULBs did not utilise even the realised fire tax for strengthening of fire services. The requirements of manpower and equipment for the entire State was not worked out for requesting fund in the State Plan. As a result, fire services could not be strengthened in the State and there remained large gaps in basic requirements viz. fire stations, essential equipment and manpower.
Recommendation: ULBs should ensure the utilisation of grant-in aid as well as their own revenue for strengthening of fire services.
State Government stated that in view of audit recommendation, all
ULBs have been directed to ensure utilisation of fire tax revenue on
strengthening of fire services.
• No fire station was established in test checked ULBs, except in BMC and JMC which also lacked sufficient number of fire stations. Due to lack of fund, BMC and JMC did not implement fire mitigation plan published by State Government in compliance of ThFC recommendations. Fire stations of BMC and JMC were not equipped as per SFAC norms. There was inadequacy of essential equipment and personal protective equipment.
Recommendation: For improving efficiency in fire services, Fire stations and essential equipment as recommended by SFAC should be provided.
State Government stated that in view of audit recommendation, BMC
and JMC have been directed to ensure utilisation of fire tax revenue
for upgradation of fire station and fire equipment.
• ULBs lacked firefighting manpower significantly and there are large number of vacancies. No recruitment against the sanctioned posts of fireman was done during 2011-16. Out of 285 personnel engaged in fire service, only 94 personnel (33 per cent) were on regular basis and remaining 191 personnel were either on daily wages or contract basis. No initiatives were taken for capacity building as neither any fire training centre was established by State Government nor any training programs/ courses for fire personnel was organised by ULBs.
Recommendation: ULBs should deploy adequate number of staff for fire services. Also the required qualifications and physical fitness of fire personnel should be ensured. Capacity building of fire personnel should be ensured.

Audit Report on Local Bodies for the year ended 31 March 2016
70
State Government stated that ULBs have been directed to orgnaise
training programmes from time to time for essential qualification and
physical fitness of fire personnel.
• Response time to attend fire calls was not recorded by any test checked ULB. Public awareness program for fire prevention was not organised.
Recommendation: Response time as recommended by SFAC should be observed by ULBs to watch the efficiency of fire service. Public awareness programs should be organised time to time.
State Government accepted the audit recommendations.
• No monitoring mechanism was in place at State level as well as at test-checked ULBs level in respect of periodic inspection of fire stations/equipment and its reporting. Fire call register was not maintained properly due to which efficiency of fire services could not be assessed in audit.
Recommendation: Essential records such fire call register should be maintained properly.
State Government accepted the audit recommendations.
5.2 Compliance Audit Paragraphs
URBAN DEVELOPMENT AND HOUSING DEPARTMENT
5.2.1 Short realisation of supervision fee
Supervision fee amounting to `̀̀̀ 78.82 lakh was short realised from six
colonizers by Municipal Council, Badnawar, district Dhar.
According to Rule 12 of Madhya Pradesh Nagar Palika (Registration of Colonizer, Terms and Conditions) Rules, 1998 (Rules), the colonizer would have to deposit an amount equal to two per cent of the estimated cost to be incurred on the internal development of the colony. Vide amendment (April 2013) in the Rules, the cost of internal development in a colony would be calculated on the basis of prevailing rates under the Integrated Standard Schedule of Rates published by the Department.
Scrutiny of records of Chief Municipal Officer (CMO), Municipal Council (MC), Badnawar, District Dhar (May 2015) revealed that supervision fee amounting to ` 5.65 lakh was collected by the MC from six colonizers between April 2011 and March 2015. The cost of internal development was not calculated by the MC on the basis of Integrated Standard Schedule of Rates or prevailing rates in nearby MCs. The estimated cost submitted by the respective colonizers were accepted for collection of supervision fee. However, in view of the prevailing cost of internal development fixed in the nearby Municipality (MC Indore10), the supervision fee in these six cases worked out to ` 84.47 lakh (Appendix 5.4). Thus, supervision fee amounting to ` 78.82 lakh was short realised from colonizers.
10
MC, Indore fixed the cost of internal development of colony at the rate of ` 200 per square feet vide MC’s resolution dated 06.01.2011.

Chapter V: Compliance Audit
71
In the exit conference (January 2017), the Government stated that necessary instructions would be issued to Municipal Council, Badnawar to recover supervision fees as per rule. In reply MC, Badnawar further informed (February 2017) that notices for recovery of ` 78.82 lakh were issued (September 2016) to colonizers.
Fact remains that MC Badnawar failed to collect the supervision fee as per codal provisions, which resulted in short realisation of supervision fee amounting to ` 78.82 lakh.
5.2.2 Avoidable payment of penalty and interest
MC, Ujjain failed to deposit statutory dues in respect of Employees
Provident Funds and Miscellaneous Provisions Act 1952, which resulted
in avoidable payment of penalty and interest of `̀̀̀ 65.55 lakh.
The Employees Provident Funds and Miscellaneous Provisions Act 1952 (EPF Act), which was enacted by Parliament, provides for the institution of provident fund for employees in factories and other establishments. Under the provisions of the Employee’s Provident Fund Scheme, 1952, which was framed by the Central Government under the EPF Act, the employer shall deduct the employee’s contribution from his wages which together with his own contribution shall be deposited to the fund within fifteen days of the close of every month. In case of default in payment of contribution, the employer may be liable to pay penalty and interest at the rate specified under EPF Act. Central Government notified (January 2011) that Municipal Corporations and Municipal Councils would be covered under EPF Act.
Scrutiny of records (February 2015) of MC, Ujjain revealed that the MC did not deduct employee’s contribution from January 2011 to November 2011 in respect of its contractual employees. Employees Provident Fund Organisation (EPFO) assessed (December 2013) payable EPF contribution of ` 59.81 lakh for the period January 2011 to November 2011 and recovered (January 2014) it directly from the bank account of MC.
Further, for the period from December 2011 to July 2013, though the employee’s contribution was deducted by the MC, but the contribution to EPFO was deposited with delays ranging between one and 35 months. Due to the failure of the MC to deposit of employees and employers contributions during January 2011 to November 2011 and delayed deposits of contributions during December 2011 to July 2013, EPFO levied penalty and interest amounting to ` 65.55 lakh (Penalty ` 44.20 lakh + interest ` 21.35 lakh), which was paid by the MC in June 2014.
In the exit conference (January 2017), the Government stated that necessary instructions would be issued to deposit EPF on time for avoiding penalty and interest.
Thus, the failure of MC Ujjain to comply with the provision of the EPF Act resulted in avoidable payment of penalty and interest of ` 65.55 lakh and accountability for default in payment of statutory dues was, therefore, required to be fixed.

Audit Report on Local Bodies for the year ended 31 March 2016
72
5.2.3 Short realisation of shelter fee
Shelter fees amounting to `̀̀̀ 36.37 lakh was not realised/short realised
from colonizers in Municipal Corporation, Rewa.
According to Rule 10 of Madhya Pradesh Nagar Palika (Registration of Colonizer, Terms and Conditions) Rules, 1998, in every residential plotted colony to be developed in the municipal area, the colonizer shall develop plots/offer constructed dwelling units (DUs) for persons belonging to economically weaker sections and lower income groups in such number that would be equivalent to 15 per cent of the total number of plots/DUs developed for other income groups. However, any colonizer, who seeks exemption from providing plots or dwelling units for the persons belonging to economically weaker sections and lower income groups shall have to pay shelter fees under Rule 10(9) prescribed at the rate of five per cent of the product of total area of residential plots or total built up area in square meter (sqm), as the case may be and the prevailing guideline rate determined by the Collector of Stamps.
In addition to reserving the plot/DUs for economically weaker section and lower income groups and the shelter fee paid under Rule 10(9), every colonizer shall have to deposit shelter fee as the product of the total permissible built up area in sqm and ` 100 in case of group housing colony as per Rule 10(10).
Scrutiny of records (April 2015) of Municipal Corporation (MC), Rewa revealed that in four cases for permission for construction of DUs, shelter fee amounting to ` 28.68 lakh was not realised/short realised under Rule 10(10) of Madhya Pradesh Nagar Palika (Registration of Colonizer, Terms and Conditions) Rules, 1998. Out of these permissions, one colonizer had opted for exemption from providing DUs to the persons belonging to economically weaker sections and lower income groups. However, shelter fee amounting to ` 7.69 lakh in view of prevailing guideline rate of ` 13,000 per sqm was not collected under Rule 10(9). Thus, failure of MC to collect shelter fee as prescribed under codal provisions resulted in short realisation of shelter fee amounting to ` 36.37 lakh, as computed in Table 5.5.
Table – 5.5: Short realisation of shelter fee
(`̀̀̀ in lakh)
Details of
permission to
colonizer
Permissible
built up
area in sqm
Shelter fee
payable
under Rule
10 (10)
Shelter fee
payable
under Rule
10 (9)
Shelter
fee
realised
Short
realised
shelter
fee
No.378/MC/2014, dated 06.02.2014
4175.12 4.18 Nil 2.52 1.66
No.501/MC/2013, dated 07.10.2013
11036 11.04 Nil Nil 11.04
No.718/MC/2013, dated 09.01.2013
14801 14.80 Nil Nil 14.80
No.450/MC/2013, dated 18.09.2013
1182.96 1.18 7.69 Nil 8.87
Total 31.20 7.69 2.52 36.37


Appendix-1.1
(Reference: Paragraph 1.5, page 5)
List of test-checked PRIs during 2015-16
Zila Panchayats
1 Alirajpur 2 Ashoknagar 3 Badwani
4 Balaghat 5 Betul 6 Bhind
7 Bhopal 8 Chhatarpur 9 Dhar
10 Guna 11 Harda 12 Hoshangabad
13 Katni 14 Morena 15 Narsinghpur
16 Panna 17 Raisen 18 Rewa
19 Shahdol 20 Sheopur 21 Shivpuri
22 Sidhi 23 Tikamgarh 24 Umaria
Janpad Panchayats
1 Amarwada 2 Ambah 3 Amla
4 Ater 5 Baidhan 6 Bairasiya
7 Bajna 8 Baraseoni 9 Begumganj
10 Bhander 11 Bhanpura 12 Bhikangaon
13 Bichhia 14 Bichhua 15 Biaora
16 Bizawar 17 Chachoda 18 Chandreshekhar Azad Nagar (Bhabhara)
19 Chhindwada 20 Chorai 21 Dabra
22 Depalpur 23 Ganjbasoda 24 Ghatigaon
25 Ghodadongri 26 Gogawan 27 Gohparu
28 Guna 29 Harrai 30 Indore
31 Isagarh 32 Jaisinghnagar 33 Jatara
34 Jawad 35 Junnardeo 36 Karanzia
37 Kareli 38 Karera 39 Kasrawad
40 Katthiwada 41 Katni 42 Khaknar
43 Kukshi 44 Lalbarra 45 Mahoo
46 Maihar 47 Majholi 48 Malhargarh
49 Manasa 50 Manawar 51 Mandla
52 Mauganj 53 Mehgaon 54 Mohkheda
55 Morar 56 Nainpur 57 Nalkheda
58 Narsinghgarh 59 Narwar 60 Narayanganj
61 Nateran 62 Pati 63 Palera
64 Pandhurana 65 Parasiya 66 Patan
67 Raipur Karchulian 68 Rajpur 69 Ratlam
70 Rehli 71 Rewa 72 Sagar
73 Saikheda 74 Samnapur 75 Sanchi
76 Sanver 77 Sehore 78 Shajapur
79 Sheopur 80 Shujalpur 81 Sondwa
82 Sonsar 83 Tamia 84 Tarana
85 Thandla 86 Tikamgarh 87 Timarni
88 Vidisha
Note- 1020 Gram Panchayats are audited during 2015-16.

Audit Report on Local Bodies for the year ended 31 March 2016
76
Appendix-1.2
(Reference: Paragraph 1.10, page 8)
Difference in Cash Book balance and Pass Book Balances on 31.03.2015
(` ` ` ` in lakh))))
Sl.
No.
Name of Units Balance as per
Bank Pass book
as on 31.03.2015
Balance as
per Cash
book as on
31.03.2015
Difference, where
bank balance is
more (+) than
cash book balance
Difference where
bank balance is
less (-) than cash
book balance
Zila Panchayats
1 Katni 2,660.43 2,628.95 31.48 - 76.64 76.84 - -0.20
2 Bhopal 886.78 636.83 249.95 - 1,029.70 2,080.73 - -1,051.03
3 Sheopur 1,654.32 1,477.80 176.52 -
0.00 2.29 - -2.29
4 Anuppur 1,462.16 1,446.30 15.86 -
5 Shahdol 1,516.06 1,176.11 339.95 -
6 Hoshangabad 38.45 39.38 - -0.93
7 Harda 115.58 120.23 - -4.65
279.25 262.45 16.80 -
8 Rewa 858.54 813.42 45.12 -
51.99 64.33 - -12.34
9 Alirajpur 1,517.43 1,908.60 - -391.17
10 Ashoknagar 2,650.24 2,644.36 5.88 -
3.70 3.71 - -0.01
11 Tikamgarh 86.34 92.64 - -6.30
12 Betul 6,684.52 5,866.36 818.16 -
58.44 78.24 - -19.80
Total 21,630.57 21,419.57 1,699.72 -1,488.72
Janpad Panchayats
1 Katthiwada (Alirajpur) 222.97 195.69 27.28 -
2 Tarana, Ujjain 86.63 62.73 23.90 -
3 Manawar, Dhar 282.97 268.05 14.92 -
4 Sanwer, Indore 317.28 316.91 0.37 -
5 Bairasiya, Bhopal 292.61 243.88 48.73 -
6 Pandhurna (Chhindwara)
502.78 534.26 -
-31.48
7 Depalpur (Indore) 192.24 182.29 9.95 -
8 Maihar (Satna) 102.13 100.80 1.33 -
9 Tikamgarh 453.55 394.12 59.43 -
10 Jatara (Tikamgarh) 313.71 197.17 116.54 -
11 Bijawar (Chhatarpur) 26.62 28.39 - -1.77
132.45 115.43 17.02 -
12 Indore 75.27 79.30 - -4.03
13 Bichhua (Chhindwara) 430.18 392.44 37.74 -

Appendices
77
Sl.
No.
Name of Units Balance as per
Bank Pass book
as on 31.03.2015
Balance as
per Cash
book as on
31.03.2015
Difference, where
bank balance is
more (+) than
cash book balance
Difference where
bank balance is
less (-) than cash
book balance
14 Chorai (Chhindwara) 337.50 334.03 3.47 -
15 Sanchi (Raisen) 253.05 198.56 54.49 -
111.98 121.62 - -9.64
16 Isagarh (Ashoknagar) 289.62 247.83 41.79 -
17 Begumganj (Raisen) 112.02 27.07 84.95 -
87.92 260.13 - -172.21
18 Ghatigaon, Gwalior 95.55 67.78 27.77 -
219.01 221.32 - -2.31
19 Narwar, Shivpuri 411.91 382.12 29.79 -
20 Mehgaon, Bhind 104.99 110.08 - -5.09
21 Chachoda, Guna 314.98 306.85 8.13 -
22 Harrai, Chhindwada 477.92 336.15 141.77 -
23 Murar, Gwalior 161.52 129.74 31.78 -
24 Mohkheda, Chhindwada
400.45 145.93 254.52 -
25 Sonsar, Chhindwada 290.44 401.67 - -111.23
26 Majholi, Sidhi 4.56 3.88 0.68 -
27 Timarni, Harda 81.50 74.71 6.79 -
37.95 49.62 - -11.67
28 Khaknar, Burhanpur 210.31 177.08 33.23 -
73.46 81.47 - -8.01
29 Tamia, Chhindwada 514.79 497.63 17.16 -
30 Junnardev, Chhindwada
863.01 799.28 63.73 -
31 Bajna, Ratlam 98.96 75.72 23.24 -
32 Sondwa, Alirajpur 231.35 220.45 10.90 -
33 Saikheda, Narsinghpur 86.38 141.94 - -55.56
31.24 20.32 10.92 -
34 Rajpur, Badwani 313.51 298.06 15.45 -
35 Thandla, Jhabua 157.09 168.53 - -11.44
36 Jawad, Neemuch 19.00 41.44 - -22.44
207.67 142.49 65.18 -
37 Gohparu, Shahdol 136.33 145.69 - -9.36
44.54 40.33 4.21 -
38 Jaisinghnagar, Shahdol
30.10 30.72 - -0.62
665.31 498.38 166.93 -
39 Bhikangao, Khargone 267.35 250.20 17.15 -
40 Palera, Tikamgarh 158.65 138.52 20.13 -
41 Nalkheda, Agar 66.32 63.48 2.84 -
42 Patan, Jabalpur 271.11 282.68 - -11.57
43 Shajapur 140.46 125.20 15.26 -

Audit Report on Local Bodies for the year ended 31 March 2016
78
Sl.
No.
Name of Units Balance as per
Bank Pass book
as on 31.03.2015
Balance as
per Cash
book as on
31.03.2015
Difference, where
bank balance is
more (+) than
cash book balance
Difference where
bank balance is
less (-) than cash
book balance
44 Ater, Bhind 53.23 53.19 0.04 -
45 Guna 117.91 128.53 - -10.62
46 Manasa, Neemuch 7.26 7.41 - -0.15
253.76 224.28 29.48 -
47 Lalbarra 253.50 229.68 23.82 -
36.52 38.56 - -2.04
48 Ganjbasoda, Vidisha 69.67 86.81 - -17.14
28.32 27.71 0.61 -
49 Sheopur, Sheopur 10.34 11.70 - -1.36
108.60 100.03 8.57 -
50 Amla, Betul 237.31 232.24 5.07 -
51 Kareli, Narsinghpur 31.15 47.23 - -16.08
83.35 59.42 23.93 -
52 Kukshi, Dhar 257.93 216.77 41.16 -
53 Pati, Badwani 311.22 251.37 59.85 -
54 Bichhiya, Mandla 576.12 568.53 7.59 -
55 Shujalpur, Shajapur 157.65 87.01 70.64 -
17.70 66.25 - -48.55
56 Rewa 3.80 4.26 - -0.46
103.89 80.97 22.92 -
57 Amarwada, Chhindwada
338.45 253.46 84.99 -
Total 14,868.88 13,545.57 1,888.14 -564.83
Gram Panchayats
1 Hapsily, Begamganj, Raisen
1.16 15.65 - -14.49
2 Lohgarh, Dabra, Gwalior
8.92 13.82 - -4.90
3 Naingao, Kukshi, Dhar
3.13 4.08 -0.95
4 Aali, Kukshi, Dhar 4.47 4.41 0.06 - 5 Bhatyari, Kukshi,
Dhar 2.60 2.43 0.17 - 6 Kundara, Kukshi,
Dhar 3.38 3.05 0.33 - 7 Badgayaar, Kukshi,
Dhar 5.28 5.55 - -0.27 8 Jauhariya, Kareli,
Narsinghpur 6.33 4.36 1.97 - 9 Kumhdi, Kareli,
Narsinghpur 6.04 6.25 - -0.21 10 Imaliya, Kareli,
Narsinghpur 6.57 6.50 0.07 - 11 Kanjai, Lalbarra,
Balaghat 4.96 4.63 0.33 -

Appendices
79
Sl.
No.
Name of Units Balance as per
Bank Pass book
as on 31.03.2015
Balance as
per Cash
book as on
31.03.2015
Difference, where
bank balance is
more (+) than
cash book balance
Difference where
bank balance is
less (-) than cash
book balance
12 Bhadugao, Timarni, Harda 0.64 1.05 - -0.41
13 Khajure, Rajpur, Badwani 4.40 4.34 0.06 -
14 Morgun, Rajpur, Badwani 0.05 0.04 0.01 -
15 Bobalwadi, Rajpur, Badwani 16.33 6.92 9.41 -
16 Shivni, Pati, Badwani 0.04 0.03 0.01 - 17 Aabli, Pati, Badwani 20.79 6.05 14.74 - 18 Undrakachch,
Timarni, Harda 0.181 0.180 0.001 - 19 Barkala, Timarni,
Harda 0.135 0.141 - -0.006 20 Odpura, Ghatigao,
Gwalior 0.00 0.12 - -0.12 21 Manpur, Lalbarra,
Balaghat 3.26 0.26 3.00 - 22 Majhgao,
Narayanganj, Mandla 5.19 5.18 0.01 -
Total 103.86 95.04 30.17 -21.36
Grand Total 36,603.31 35,060.18 3,618.03 -2,074.91

Audit Report on Local Bodies for the year ended 31 March 2016
80
Appendix-1.3
(Reference: Paragraph 1.11, page 8)
Outstanding temporary advances as on 31.03.2015
(`̀̀̀ in lakh)
Sl.
No.
Name of Unit Balance of
outstanding
advances as
on 31.03.2015
Period to which
advance relates
1 Zila Panchayat Umaria 0.57 2002-03 to 2011-12
2 Zila Panchayat Raisen 0.93 2012-13 to 2013-14
3 Zila Panchayat Anuppur 7.95 2011-12 to 2014-15
4 Zila Panchayat Balaghat 0.67 2013-14 to 2014-15
5 Zila Panchayat Dhar 2.72 2006-07 to 2014-15
6 Zila Panchayat Tikamgarh 0.23 2013-14 to 2014-15
7 Zila Panchayat Panna 0.09 2014-15
Total 13.16
1 Janpad Panchayat Mauganj 1.40 2012-13 to 2014-15
2 Janpad Panchayat Tarana 1.03 2011-12 to 2014-15
3 Janpad Panchayat Pandhurna 7.78 1983-84 to 2011-12
4 Janpad Panchayat Maihar 0.20 2011-12
5 Janpad Panchayat Tikamgarh 0.39 2012-13 to 2014-15
6 Janpad Panchayat Bijawar 1.60 2008-09 to 2014-15
7 Janpad Panchayat Indore 1.04 2014-15
8 Janpad Panchayat Baidhen 1.52 1994-95 to 2014-15
9 Janpad Panchayat Karanjiya 1.27 2013-14 to 2014-15
10 Janpad Panchayat Katni 0.14 2010-11 to 2011-12
11 Janpad Panchayat Bichhua 5.61 2010-11 to 2014-15
12 Janpad Panchayat Malhargarh 0.58 2000-01 to 2003-04
13 Janpad Panchayat Bhanpura 1.59 1998-99 to 2011-12
14 Janpad Panchayat Amarwada 2.20 2010-11 to 2013-14
15 Janpad Panchayat Chorai 0.05 1985-86
16 Janpad Panchayat Sanchi 0.45 2013-14
17 Janpad Panchayat Harrai 1.29 1996-97 to 2009-10
18 Janpad Panchayat Morar 0.61 2012-13 to2013-14
19 Janpad Panchayat Mohkheda 1.80 2006-07 to 2013-14
20 Janpad Panchayat Majholi 0.12 2012-13 to 2013-14
21 Janpad Panchayat Khaknaar 0.66 2010-11 to 2014-15
22 Janpad Panchayat Tamia 0.26 2012-13
23 Janpad Panchayat Junnardeo 3.90 2010-11 to 2014-15
24 Janpad Panchayat Ambah 1.10 2012-13 to 2014-15
25 Janpad Panchayat Saikheda 1.20 2013-14 to 2014-15
26 Janpad Panchayat Rajpur 20.78 Not made available
27 Janpad Panchayat Thandla 5.98 2007-08 to 2013-14
28 Janpad Panchayat Jawad 4.26 2008-09 to 2014-15
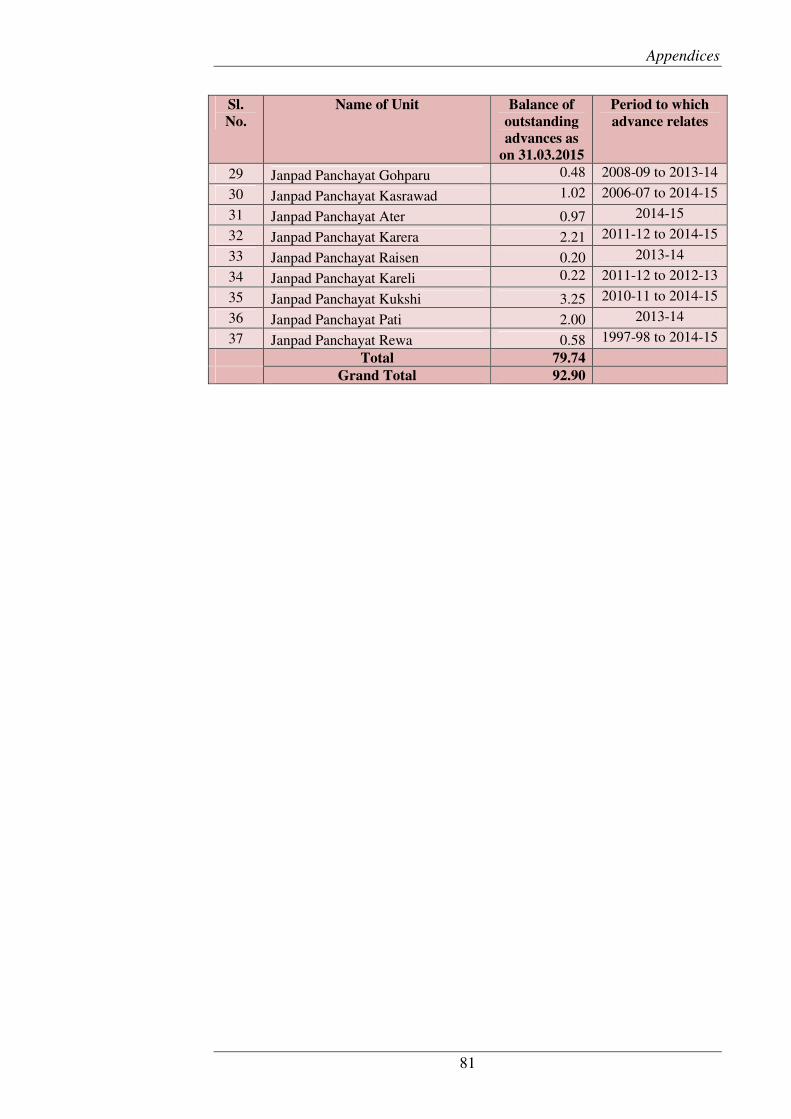
Appendices
81
Sl.
No.
Name of Unit Balance of
outstanding
advances as
on 31.03.2015
Period to which
advance relates
29 Janpad Panchayat Gohparu 0.48 2008-09 to 2013-14
30 Janpad Panchayat Kasrawad 1.02 2006-07 to 2014-15
31 Janpad Panchayat Ater 0.97 2014-15
32 Janpad Panchayat Karera 2.21 2011-12 to 2014-15
33 Janpad Panchayat Raisen 0.20 2013-14
34 Janpad Panchayat Kareli 0.22 2011-12 to 2012-13
35 Janpad Panchayat Kukshi 3.25 2010-11 to 2014-15
36 Janpad Panchayat Pati 2.00 2013-14
37 Janpad Panchayat Rewa 0.58 1997-98 to 2014-15
Total 79.74
Grand Total 92.90

Audit Report on Local Bodies for the year ended 31 March 2016
82
Appendix-2.1
(Reference: Paragraph 2.1.1, page 11)
List of test checked Gram Panchayats
Sl.
No.
District Janpad
Panchayat
Gram Panchayat
1 Anuppur
Anuppur Bamhani, Chapani, Chukan, Dhumma, Harad, Khodri No.2, Nimha, Payari No.2, Saddi, Tanki
Jaithari Barri, Cholana, Dongratola, Harri, Khada, Lakhanpur, Munda, Paraswar, Semarwar, Venkat Nagar
Kotma Baihatola, Beliyachhot, Budhanpur, Godaru, Kathkona, Majhauli, Patharudi, Sajatola, Thangoan, Urtan
Pushprajgarh Barbaspur, Bijauri, Dharamdas, Girarikhurd, Juhili, Khamarodha, Lalpur, Mohadi, Piparaha, Sarai
2 Dewas
Bagali Barkhedasomma, Bisali, Dangarkheda, Gopipur, Kamlapur, Lasundiyahatu, Mirjapur, Patadipala, Potala, Shampura
Dewas Akhabarpur, Barkehdakotapai, Bijepur, Gujarbapcha, Khajuriya, Lohari, Nariyakheda, Raghogad, Singawada, Sutarkhedi
Kannod Balya, Bhamar, Chaplasa, Gadagoan, Jaansur, Kheree, Mahudiya, Palasi, Raipura, Sonkhedi
Khategao Bajwada, Bizalgaon, Dudhiyakhedi, Jiyagaon, Kharda, Leeli, Navalgaon, Piplyanankar, Sawasada, Tiwariya
Sonkachha Bhalai-Khurd, Chobarajagir, Doulatpur, Harnavda, Jamli, Khajuriyakanka, Khumariyarao, Murmiya, Patadiyataj, Rolupiplya.
Tonkkhurd Balon, Budasa, Dhturiya, Harnavda, Jasmiya, Kanehriya, Kradiya, Nagpachlana, Pandi, Rabdiya

Appendices
83
Appendix-2.2
(Reference: Paragraph 2.1.4.4, page 18)
Statement of Assets not being utilised for intended purposes
Sl.
No.
Name of
Structure/Building
Location Specific Purpose Purpose for which being
utilised
Reply of PRI
1 Block Resource centre
JP Khategaon For organising training, and running helpline centre
Industrial Technical Institute pertaining to technical education department
BRC building would be utilised as per instruction of the government in future.
JP Sonkachha Being utilised for running office of MNREGS (Block level)
The reply was silent about the reason due which BRC was allowed for running office of MGNREGS.
JP Kannod Being utilised for running office of MNREGS (Block level)
The reply was silent about the reason due which BRC was allowed for running office of MGNREGS.
JP Anuppur Being utilised for running Home-Guard office
BRC building was situated in Anuppur and JP had been shifted to 35 Km far from Anuppur in its new building at GP Badra therefore utilisation of BRC building was not possible.
2 Samudayik Bhavan GP Harri JP Jaithari. For the use of functions of community or its members.
Running Public Distribution shops
Building given for PDS shop as per oral order of District Collector/ CEO, ZP.
GP Chukan JP Anuppur Being utilised as storage of fodder
The reply was silent about the reason due which Samudayik Bhavan was not utilised for intended purpose.
GP Venkatnagar JP Jaithari Storage of construction material
Storage facility of construction material was not available, therefore building was utilised for storage of costruction material.
GP Cholana JP Jaithari, Storage facility was not available, hence building was utilised for storage purpose.
GP Thangaon JP Kotma, Storage facility was not available, hence building was utilised for storage purpose.
GP Harnavda JP Tonkkhurd Material of electricity company temporarily kept. GP Bamhani JP Anuppur Running Gram Panchayat
Bhavan New Panchayat bhavan was under construction, hence being utilised for Gram Panchayat Bhavan.

Audit Report on Local Bodies for the year ended 31 March 2016
84
Sl.
No.
Name of
Structure/Building
Location Specific Purpose Purpose for which being
utilised
Reply of PRI
3 E Panchayat Rooms Traditional
GP Harri JP Jaithari For installation of Computer peripherals
Buildings are lying empty. Rajiv Gandhi Seva Kendra (RGSK) constructed in the same campus and e-panchayat was running in RGSK, hence building were lying empty.
GP Munda of JP Jaithari Building would be utilised after getting net connectivity.
GP Mahodiya of JP Kannod E- Panchayat activity in the building would be statarted soon.
GP Sonkhedi of JP Kannod Building would be utilised after getting electricity connection.
GP Harnavda JP Tonkkhurd Building not being utilised as it was situated far from Panchayat Bhavan.
4 Sub Health Center GP Harad JP Anuppur, The building lying empty. Electricity facility was not available, hence sub health centre was not operative in the building.
5 GP Bhavan GP Singavda JP Dewas Being utilised for Veterinary hospital
Due to non-availability of building for vaterinary hospital, Panchayat Bhavan building was utilised for Veterinary hospital.

Appendices
85
Appendix-2.3
(Reference: Paragraph 2.1.4.6, page 20)
List of Theft items in Gram Panchayat
Sl.
No.
Name of JPs Name of GP List of theft items Total cost of
Items
(amount in `̀̀̀)
Date of FIR
1 Anuppur Darsagar LCD –TV Computer set,Camera, tata sky, battery
1,04,931 26.05.15
2 Jaithari Gorsi Computer Set Complete 1,04,931 6.7.15 3 Mahuda Computer Set Complete 1,04,931 19.8.15 4 Takhuli LED TV 31,050 1.1.15 5 Umariya Computer Set Complete 1,04,931 9.9.15 6 Bagli Gusat CPU 21,133 11.5.15 7 Mahukheda Computer set 1,16,244 Information
not provided 8 Karondiya Computer set 45,315 15.5.15 9 Pipri Computer set 92,004 12.7.14
10 Dewas Vimandi Bhuseni LCD-TV, Monitor,Printer 42,155 Under Investigation 11 Lasudiya sonda LCD- TV, Battery 54,450
12 Sonda Monitor, battery 27,800
13 Agrod LCD- TV, Monitor 35,450 14 Bijepur LCD-TV 31,050 15 Banger LCD-TV, Monitor 35,450 16 Bairagar Monitor, battery 27,800
17 Chandana LCD, Monitor 35,450 18 Rajoda Monitor 4,400 19 Kailod Monitor 4,400 20 Nariya Kheda Computer Set Complete 1,04,931 21 Sabukhedi Computer Set Complete 1,04,931 22 Ramgar Jangli LCD-TV 31,050 23 Mangrola LCD-TV 31,050 24 Aant Monitor 4,400 25 Havatpura Inverter Battery 23,400 26 Kannod Hatnori LCD-TV, Battery 54,450 27.6.15 27 Bhilai LCD-TV, Battery 54,450 2014-15 28 Mahudiya Computer, LED-TV 52,183 18.9.15 29 Gardi Jhabariya LCD-TV 31,050 23.6.16
30 Bijwad Inverter Battery 23,400 2014-15 31 Khategaon Kakardi LCD-TV 31,050 27.6.14 32 Badada Computer Set Complete 1,04,930 1.2.14 33 Jiyagaon Computer Set Complete 1,04,930 23.1.14 34 Pipaliyanankar Monitor 4,400 11.9.15 35 Sonkacahha Dudlai Computer Set Complete 1,04,930 20.9.14
36 Jamodi Computer Set Complete 1,04,930 5.8.14 37 Sadikheda Computer Set Complete 1,04,930 25.8.15 38 Phawda LED-TV 31,050 22.4.16 39 Tonkkhurd Bhairwa khedi Computer Set Complete 1,04,930 FIR not
furnished
40 Dontajhangir LED-TV 31,050 41 Alari LED-TV 31,050 42 Kanheriya LED-TV 31,050
43 Harnawada LED-TV 31,050
Total 23,59,450

Audit Report on Local Bodies for the year ended 31 March 2016
86
Appendix-2.4
(Reference: Paragraph 2.2.2, page 24)
Statement showing interest not deposited into Government account (` ` ` ` )
Sl.
No.
Name of Janpad
Panchayat
Audit Period Date of Interest
receipt
Amount of
interest
1. Amarwara (Chhindwara)
04/14 to 03/15 30.06.2014 26,183 25.12.2014 33,414
Total 59,597
2. Bairesiya (Bhopal) 04/12 to 03/15 02.08.2013 21,990 01.02.2014 47,971 02.08.2014 41,649 02.02.2015 56,576
Total 1,68,186
3. Bichhua (Chhindwara) 04/11 to 03/15 30.6.2012 12,993 31.12.2012 20,917 30.06.2013 25,930 31.12.2013 18,757 30.06.2014 14,169
Total 92,766
4. Chachora (Guna) 04/12 to 03/15 30.06.2012 16,927 31.12.2012 9,924 30.06.2014 16,043 31.12.2013 14,609 30.06.2014 5,932 31.12.2014 14,031
Total 77,466
5. Essagarh (Ashoknagar)
04/11 to 03/15 30.06.2011 21,029
31.12.2011 12,849 30.06.2012 47,956 31.12.2012 30,008 30.04.2013 42,808 30.12.2013 73,724 30.06.2014 53,842 25.12.2014 40,820
Total 3,23,036
6. Gohparu (Shahdol) 04/11 to 03/15 31.05.2011 12,665 30.11.2011 20,486 31.05.2012 10,957 30.11.2012 15,182 31.05.2013 10,311 30.11.2013 16,085 31.05.2014 13,727 30.11.2014 11,494
Total 1,10,907
7. Khaknr (Burhanpur) 04/12 to 03/15 07.02.2014 1,16,133 08.08.2014 52,725 02.02.2015 62,837
06.08.2012 32,175
02.02.2013 21,593
06.08.2013 15,895
03.02.2014 344
02.08.2014 345
14.01.2015 323
02.02.2015 36
Total 3,41,406

Appendices
87
Sl.
No.
Name of Janpad
Panchayat
Audit Period Date of Interest
receipt
Amount of
interest
8. Mandla (Mandla) 04/12 to 03/15 03.08.2012 58,215
04.02.2013 57,163
03.08.2013 64,833
02.02.2014 72,332
03.08.2014 92,428
Total 3,44,971
9. Maihar (Satna) 04/11 to 03/15 16.11.2012 61,989
05.09.2012 81,758
01.03.2013 74,590
05.09.2013 1,25,840
03.03.2014 1,07,415
31.08.2014 78,055
28.02.2015 83,517
Total 6,13,164
10. Nainpur (Mandla) 04/13 to 03/15 06.12.2013 7,922
04.06.2014 5,446
06.12.2014 4,982
08.06.2014 3,576
30.11.2013 87,839
30.11.2014 77,699
Total 1,87,500
11. Sanchi (Raisen) 04/13 to 03/15 31.05.2013 33801
31.11.2013 41788
31.05.2014 51747
30.11.2014 52759
Total 1,80,095
12. Shajapur (Shajapur) 04/13 to 03/15 30.06.2013 15,208
31.12.2013 29,078
30.06.2014 24,915
25.12.2014 23,394
Total 92,595
13. Sheopur (Sheopur) 04/12 to 03/15 31.05.2011 73,296
30.11.2011 86,875
31.05.2012 1,17,882
30.11.2012 1,02,604
31.05.2013 92,953
30.11.2013 1,04,004
31.05.2014 1,64,140
30.11.2014 1,95,790
Total 9,37,544
Grant Total 35,29,233

Audit Report on Local Bodies for the year ended 31 March 2016
88
Appendix–3.1
(Reference: Paragraph 3.3, page 28)
Statement showing devolution of functions to Urban Local Bodies
Sl. No. Name of functions
1 Urban Planning including Town Planning
2 Regulation of land-use and construction of buildings
3 Planning for economic and social development
4 Roads and bridges
5 Water supply for domestic, industrial and commercial purposes
6 Public health, sanitation conservancy and solid waste management
7 Fire services
8 Urban forestry, protection of the environment and promotion of ecological aspects
9 Safeguarding the interests of weaker sections of society, including the handicapped and mentally retarded
10 Slum improvement and up-gradation
11 Urban poverty alleviation
12 Provision of Urban amenities and facilities such as parks, gardens, playgrounds
13 Promotion of cultural, educational and aesthetic aspects
14 Burials and burial grounds; cremations, cremation grounds and electric crematoriums
15 Cattle pounds, prevention of cruelty to animals
16 Vital Statistics including registration of birth and deaths
17 Public amenities including street lighting, parking lots, bus stops and public conveniences
18 Regulation of slaughter houses and tanneries

Appendices
89
Appendix-3.2
(Reference: Paragraph 3.5, page 30)
List of test checked ULBs during 2015-16
Municipal Corporations
1 Bhopal 2 Burhanpur 3 Dewas
4 Gwalior 5 Rewa 6 Satna
Municipal Councils
1 Ashta 2 Badhwarh 3 Badnagar
4 Bijuri 5 Bina 6 Byavhra
7 Gadrawara 8 Junnardev 9 Kareli
10 Khurai 11 Manawar 12 Panagar
13 Pandhurana 14 Panna 15 Pasan
16 Sidhi 17 Sihora 18 Sironj
Nagar Parishads
1 Amarkantak 2 Amarpatan 3 Badi
4 Badnawar 5 Baihar 6 Batul Bazar
7 Bichia 8 Billaua 9 Budar
10 Budni 11 Chandobutaria 12 Chapiheda
13 Depalpur 14 Gairatganj 15 Ichawar
16 Jaura 17 Jhandupura 18 Kari
19 Katangi 20 Khilchipur 21 Khujner
22 Kotar 23 Lavkushnagar 24 Maheshwar
25 Majholi 26 Mihona 27 Newton Chikhli
28 Pichor 29 Rajnagar 30 Rampur
31 Ratangarh 32 Sahpura 33 Sanchi
34 Singoli 35 Sirmor 36 Siwani
37 Sultanpur 38 Tendukheda 39 Udaipura

Audit Report on Local Bodies for the year ended 31 March 2016
90
Appendix-3.3
(Reference: Paragraph 3.9, page 33)
Bank reconciliation statement was not prepared (` ` ` ` in lakh)
Sl.
No.
Name of Units Balance as per
Bank Pass
book as on
31.3.15
Balance as
per Cash
book as on
31.3.15
Difference, where
bank balance is
more (+) than cash
book balance
Difference
where bank
balance is less
(-) than cash
book balance
Municipal Corporations
1 Burhanpur 3,105.80 2,994.35 111.45 -
Total 3,105.80 2,994.35 111.45 -
Municipal Councils
2 Khurai, Sagar 363.21 313.31 49.90 -
3 Badnagar 743.56 676.56 67.00
4 Gaadrawara, Narsinghpur
166.20 86.50 79.70
5 Kareli 1,290.52 1,202.04 88.48
6 Pandurna, Chindwada
684.21 664.05 20.16
7 Sironj 94.42 82.63 11.79
8 Panna 311.79 433.21 121.42
281.44 222.44 59.00
9 Sidhi 2,337.35 2,228.50 108.85 -
10 Bina 611.10 539.38 71.72 -
11 Mandideep 2,161.84 1,709.10 452.74 -
12 Manawar 647.64 505.16 142.48 -
Total 9,693.28 8,662.88 1,151.82 121.42
Nagar Parishads
13 Shahpura, Jabalpur 895.81 889.20 6.61
9.242 9.246 0.004
14 Ichawar, Sihore 184.65 154.42 30.23
15 Gairatganj 59.68 49.21 10.47
16 Bilauaa 324.20 305.64 18.56
17 Budhar 438.11 426.98 11.13
18 Aashta 706.62 583.13 123.49
19 Amarpatan, Satna 200.24 212.50 12.26
20 Lavkushnagar 204.64 131.47 73.17
21 Khujner 73.30 71.18 2.12
22 Kaari 19.29 5.21 14.08
23 Betul Bazar 164.61 161.38 3.23
24 Silwani 525.24 423.05 102.19
25 Budhni 270.63 230.18 40.45
26 Sanchi 74.16 38.28 35.88
27 Sultanpur 192.36 185.05 7.31
28 Newton Chikhli 669.04 657.88 11.16
29 Majhauli 131.71 130.65 1.06
30 Baari 8.54 3.76 4.78
31 Mihauna 320.47 328.19 7.72
32 Chandameta-Butaria 197.81 98.45 99.36
33 Ratangarh 144.60 141.96 2.64
Total 5,814.95 5,237.02 597.92 19.98
Grand Total 18,614.03 16,894.25 1,861.19 141.40

Appendices
91
Appendix-3.4
(Reference: Paragraph 3.10, page 33)
Statement showing unrealised Tax Revenue (Property tax, composite tax,
education cess, urban development cess, market fees, show tax)
(` ` ` ` in lakh)
Sl.
No. Name of Units Arrears of
previous
years
Demand
raised
during
2014-15
Total Total tax
collected as of
March 2014-15
Amount of
unrealised
tax (as on
31.03.2015) Municipal Corporations
1 Satna 813.87 729.09 1,542.96 549.39 993.57 2 Gwalior 5,582.91 2,764.78 8,347.69 2,229.43 6,118.26 3 Burhanpur 418.27 139.53 557.80 219.39 338.41
Total 6,815.05 3,633.40 10,448.45 2,998.21 7,450.24 Municipal Councils
4 Manawar 13.07 22.24 35.31 27.30 8.01 5 Sihore 17.64 30.54 48.18 28.97 19.21 6 Pandurna 48.93 55.64 104.57 59.12 45.45
7 Kareli 94.80 43.97 138.77 28.32 110.45
8 Gaadrawara 81.00 16.75 97.75 10.52 87.23 9 Khurai 38.32 39.58 77.90 58.67 19.23
10 Aasta 41.58 51.33 92.91 36.03 56.88
11 Badnagar 26.02 9.47 35.49 10.23 25.26
12 Panna 44.93 55.41 100.34 49.23 51.11
13 Seedhi 111.92 82.76 194.68 76.75 117.93
14 Badwah 26.08 16.10 42.18 16.99 25.19
15 Pasaan, Anuppur 74.53 41.98 116.51 36.55 79.96
16 Panagar 5.07 12.50 17.57 8.90 8.67
17 Bina 69.57 41.43 111.00 45.58 65.42
18 Mandideep 353.99 164.53 518.52 225.53 292.99
19 Byavara, Rajgarh 150.31 26.91 177.22 33.68 143.54
Total 1,197.76 711.14 1,908.90 752.37 1,156.53
Nagar Parishads
20 Ichawar, Sihore 5.45 3.80 9.25 5.87 3.38 21 Budhar, Shehdol 64.05 11.81 75.86 17.73 58.13
22 Bhua, Bichia, Mandala
15.38 21.44 36.82 20.37 16.45
23 Amarpatan 64.71 25.82 90.53 24.19 66.34 24 Maheshwar 32.62 16.50 49.12 17.33 31.79 25 Khilchipur 21.00 11.00 32.00 16.86 15.14 26 Kaari 19.99 2.08 22.07 2.65 19.42 27 Betul Bazar 6.76 6.50 13.26 7.86 5.40 28 Singholi 8.84 3.07 11.91 4.25 7.66 29 Katangi 9.00 5.32 14.32 7.09 7.23
30 Devpalpur, Indore
11.92 16.05 27.97 15.95 12.02
31 Budni 13.17 19.26 32.43 22.34 10.09 32 Jaura, Moorena 74.07 16.80 90.87 27.39 63.48
33 Sanchi, Raisen 12.32 10.15 22.47 9.89 12.58
34 Sultanpur, Raisen 23.23 4.97 28.20 3.99 24.21
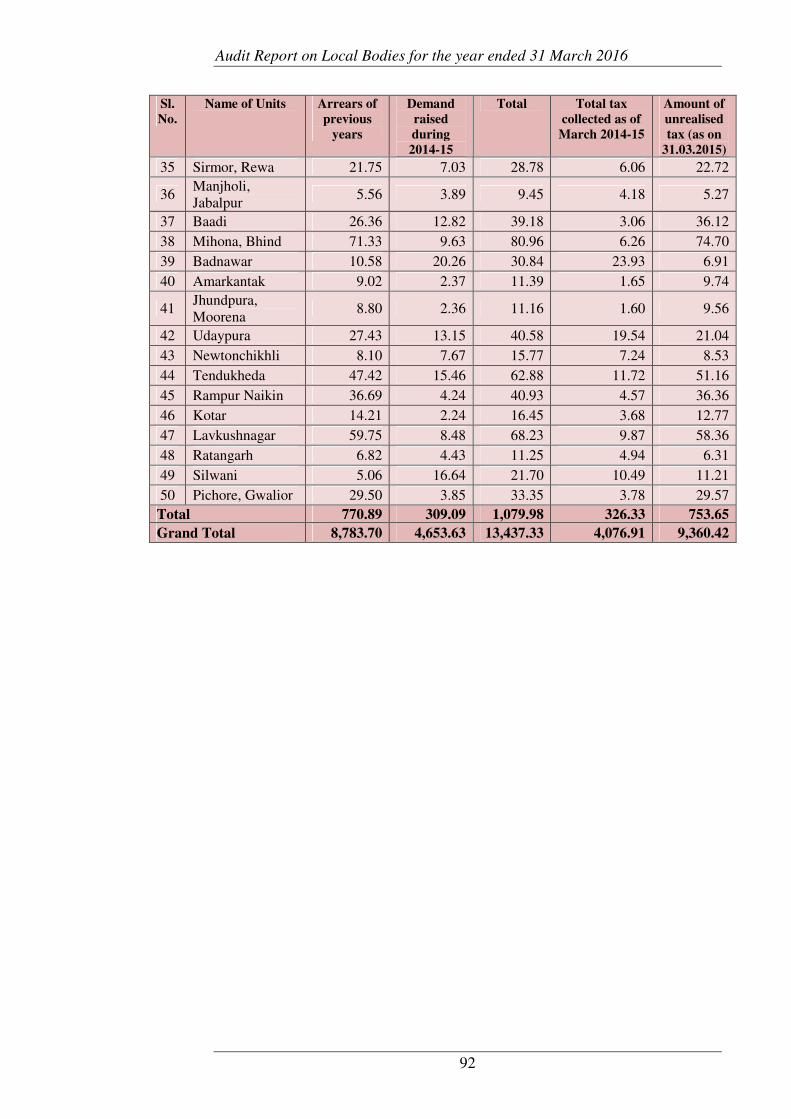
Audit Report on Local Bodies for the year ended 31 March 2016
92
Sl.
No. Name of Units Arrears of
previous
years
Demand
raised
during
2014-15
Total Total tax
collected as of
March 2014-15
Amount of
unrealised
tax (as on
31.03.2015)
35 Sirmor, Rewa 21.75 7.03 28.78 6.06 22.72
36 Manjholi, Jabalpur
5.56 3.89 9.45 4.18 5.27
37 Baadi 26.36 12.82 39.18 3.06 36.12
38 Mihona, Bhind 71.33 9.63 80.96 6.26 74.70
39 Badnawar 10.58 20.26 30.84 23.93 6.91
40 Amarkantak 9.02 2.37 11.39 1.65 9.74
41 Jhundpura, Moorena
8.80 2.36 11.16 1.60 9.56
42 Udaypura 27.43 13.15 40.58 19.54 21.04
43 Newtonchikhli 8.10 7.67 15.77 7.24 8.53
44 Tendukheda 47.42 15.46 62.88 11.72 51.16
45 Rampur Naikin 36.69 4.24 40.93 4.57 36.36
46 Kotar 14.21 2.24 16.45 3.68 12.77
47 Lavkushnagar 59.75 8.48 68.23 9.87 58.36
48 Ratangarh 6.82 4.43 11.25 4.94 6.31
49 Silwani 5.06 16.64 21.70 10.49 11.21
50 Pichore, Gwalior 29.50 3.85 33.35 3.78 29.57
Total 770.89 309.09 1,079.98 326.33 753.65
Grand Total 8,783.70 4,653.63 13,437.33 4,076.91 9,360.42

Appendices
93
Appendix-3.5
(Reference: Paragraph 3.10, page 33)
Statement showing details of unrealised rent and premium
(` ` ` ` in lakh)
Sl. No. Name of Units Outstanding premium
of allotted shops
Outstanding rent
of allotted shops
Total (as on
31.03.2015)
Municipal Corporations
1 Satna 282.41 130.29 412.70
2 Burhanpur - 40.51 40.51
Total 282.41 170.80 453.21
Municipal Councils
3 Aasta 40.48 - 40.48
4 Sihora 2.25 1.41 3.66
5 Seedhi - 22.48 22.48
6 Gaadrawara - 14.91 14.91
7 Khurai - 22.51 22.51
8 Mandideep - 5.78 5.78
9 bayvara, Rahgarh - 33.24 33.24
10 Panna - 5.69 5.69
11 Badwah - 6.99 6.99
12 Pasaan, anuppur - 1.80 1.80
13 Panagar - 0.14 0.14
14 Bina - 1.46 1.46
Total 42.73 116.41 159.14
Nagar Parishads
15 Amarpatan 0.98 20.33 21.31
16 chapiheda - 2.90 2.90
17 Bhua - 3.54 3.54
18 Ratangarh* - 0.96 0.96
19 Maheshwar - 6.29 6.29
20 Khilchipur 30.25 23.17 53.42
21 Ichawar - 0.07 0.07
22 Betul Bazaar - 1.89 1.89
23 Singoli - 0.48 0.48
24 Katangi - 0.50 0.50
25 Devpalpur - 0.20 0.20
26 Budni - 2.28 2.28
27 Jaura - 13.79 13.79
28 Sanchi - 1.16 1.16
29 Sultanpur 66.11 1.66 67.77
30 Manjholi, Jabalpur - 3.03 3.03
31 Baadi - 1.99 1.99
32 Mihona - 3.30 3.30
33 Badnawar - 1.55 1.55 34 Amarkantak - 9.78 9.78
35 Lavkushnagar - 4.92 4.92
36 Rampur Naikin - 11.88 11.88

Audit Report on Local Bodies for the year ended 31 March 2016
94
Sl. No. Name of Units Outstanding premium
of allotted shops
Outstanding rent
of allotted shops
Total (as on
31.03.2015)
37 Sirmor - 2.40 2.40
38 Tendukheda - 3.10 3.10
39 Chandameta Botaria - 0.21 0.21
40 Udaypura - 4.15 4.15
Total 97.34 125.53 222.87
Grand Total 422.48 412.74 835.22

Appendices
95
Appendix-3.6
(Reference: Paragraph 3.10, page 33)
Statement showing details of non-tax revenue (water charges, license fees,
land and building rent etc) not realised
(`̀̀̀ in lakh)
Sl.
No.
Name of Units Arrears of
previous
years
Demand
raised during
2014-15
Total Total tax
collected (as of
March 2015)
Amount of
uncollected tax as
on 31 March 2015
Municipal Corporations
1 Satna 736.71 184.58 921.29 122.67 798.62 2 Gwalior 5503.50 2141.74 7645.26 1529.57 6115.69
Total 6240.21 2326.32 8566.55 1652.24 6914.31
Municipal Councils
3 Manawar 31.25 26.44 57.69 38.31 19.38 4 Kareli 18.22 13.86 32.08 9.22 22.86 5 Pandurna 30.41 27.91 58.32 22.06 36.26 6 Sihora 12.04 25.59 37.63 22.24 15.39 7 Gaadrawara 106.89 36.06 142.95 23.06 119.89 8 Khurai 9.08 17.28 26.36 16.94 9.42
9 Aasta 16.46 40.99 57.45 28.24 29.21
10 Badnagar 14.21 45.33 59.54 42.06 17.48
11 Panna 143.95 51.61 195.56 40.59 154.97
12 Seedhi 21.22 11.77 32.99 14.69 18.30
13 Badwah 34.89 39.28 74.17 36.02 38.15
14 Pasaan, anuppur
0.77 0.76 1.53 0.81 0.72
15 Panagar 3.16 13.45 16.61 7.82 8.79
16 Bina 37.28 32.00 69.28 24.02 45.26
17 Mandideep 71.35 20.27 91.62 15.89 75.73
Total 551.18 402.60 953.78 341.96 611.82
Nagar Parishad
18 Ichhawar 3.27 6.38 9.65 8.46 1.19
19 Budhar 5.50 3.89 9.39 4.76 4.63
20 Bhua 12.99 3.95 16.94 3.79 13.15
21 Amarpatan 7.58 5.83 13.41 5.84 7.57
22 Maheshwar 2.81 31.11 33.92 32.41 1.51
23 Khilchipur 20.00 10.00 30.00 12.25 17.75
24 Kaari 4.54 0.80 5.34 0.61 4.73
25 Betul Bazaar 4.31 4.63 8.94 5.14 3.80
26 Singholi 4.37 5.53 9.90 5.95 3.95
27 Katangi 2.93 2.29 5.22 2.88 2.34
28 Devpalpur 16.79 13.63 30.42 15.32 15.10
29 Budni 7.68 8.18 15.86 7.67 8.19
30 Jaura 14.46 6.11 20.57 5.23 15.34
31 Sanchi 15.06 6.89 21.95 8.79 13.16
32 Sultanpur 4.78 3.60 8.38 2.93 5.45
33 Simrol 4.17 2.69 6.86 2.31 4.55
34 Manjholi, Jabalpur
1.46 2.06 3.52 2.34 1.18

Audit Report on Local Bodies for the year ended 31 March 2016
96
Sl.
No.
Name of Units Arrears of
previous
years
Demand
raised during
2014-15
Total Total tax
collected (as of
March 2015)
Amount of
uncollected tax as
on 31 March 2015
35 Baadi 5.26 1.65 6.91 1.52 5.39
36 Mihona 22.20 3.54 25.74 2.76 22.98
37 Badnawar 4.27 26.50 30.77 23.74 7.03
38 Amarkantak 1.26 1.78 3.04 1.77 1.27
39 Jhundpura 4.56 1.97 6.53 1.21 5.32
40 Udaypura 5.65 6.19 11.84 6.10 5.74
41 Newtonchikhli 3.65 5.05 8.70 4.98 3.72
42 Tendukheda 4.11 6.12 10.23 5.46 4.77
43 Rampur Naikin
1.05 1.67 2.72 0.56 2.16
44 Kotar 0.73 0.99 1.72 0.94 0.78
45 Lavkushnagar 11.36 4.44 15.80 7.33 8.47
46 Ratangarh 1.10 4.00 5.10 4.51 0.59
47 Silwani 5.43 7.80 13.23 4.10 9.13
48 Rajnagar 4.53 4.15 8.68 3.79 4.89
49 Sahpura 12.28 3.32 15.60 2.01 13.59
50 Pichore 13.85 3.06 16.91 2.33 14.58
Total 233.98 199.80 433.79 199.79 233.99
Grand Total 7,025.40 2,928.72 9,954.12 2,194.00 7,760.12

Appendices
97
Appendix-3.7
(Reference: Paragraph 3.11, page 34)
Details of unadjusted temporary advance
(` ` ` ` in lakh)
Sl. No. Name of the units Unadjusted amount
as on 31.03.2015
Period to which
advance relates
Municipal Corporations
1 Burhanpur 0.86 2013-14 to 2014-15 2 Gwalior 77.34 2008-09 to 2014-15
Total 78.20
Municipal Councils
3 Sidhi 1.53 2007-08 to 2014-15 4 Pasaan 3.27 2007-08 to 2013-14 5 Bijuri 8.90 1999-00 to 2014-15 6 Mandideep 1.31 2005-06 to 2012-13
Total 15.01
Nagar Parishads
7 Bhua Bichia, Mandala 2.13 2012-13 to 2013-14 8 Billauaa 0.23 2007-08 to 2013-14 9 Ichhawar, Sehore 0.41 2006-07 to 2014-15
10 Rajnagar,Chhatarpur 0.21 1998-99 to 2014-15 11 Betul Bazaar 0.19 1970-71 to 1994-95 12 Silwani 0.43 2009-10 to 2010-11 13 Lavkushnagar 10.54 2007-08 to 2014-15 14 Katangi 1.25 2008-09 15 Sanchi 0.37 2014-15 16 Sultanpur 0.67 2010-11 to 2011-12 17 Newton Chikhli 2.15 2008-09 to 2014-15 18 Pichhore 2.06 2008-09 to 2013-14 19 Baihar 1.05 2008-09
Total 21.69
Grand Total 114.90

Audit Report on Local Bodies for the year ended 31 March 2016
98
Appendix-4.1
(Reference: Paragraph 4.1.7.2, page 44)
Statement showing demand and collection of Property Tax by test checked MCs (`̀̀̀ in lakh)
Year Outstanding demand
of previous years
Collection against demand of
previous year(Per cent)
Outstanding
recovery
Demand of
current year
Collection against demand of
current year(Per cent)
Outstanding
recovery
Total outstanding
recovery
Municipal Corporation Dewas
2011-12 501.83 278.11 (55) 223.72 288.16 82.23 (29) 205.93 429.65 2012-13 429.64 236.19 (55) 193.45 253.27 160.66 (63) 92.61 286.06 2013-14 286.05 186.09 (65) 99.96 303.59 218.95 (72) 84.64 184.60 2014-15 184.60 112.80 (61) 71.80 344.29 246.20 (72) 98.09 169.89 2015-16 169.89 89.39 (63) 80.50 360.94 310.87 (86) 50.07 130.57
Municipal Corporation Indore
2011-12 11,610.66 1,497.93 (13) 10,112.73 4,394.74 2,700.09 (61) 1,694.65 11,807.38 2012-13 10,907.56 1,605.92 (15) 9,301.64 4,558.46 2,668.49 (59) 1,889.97 11,191.61 2013-14 12,622.54 753.11 (6) 11,869.43 5,390.24 3,066.30 (57) 2,323.94 14,193.37 2014-15 14,040.28 1,060.78 (8) 12,979.50 5,662.04 3,204.06 (57) 2,457.98 15,437.48 2015-16 13,528.90 1,521.55 (11) 12,007.35 6,174.98 4,141.13 (67) 2,033.85 14,041.20
Municipal Corporation Ratlam
2011-12 128.08 23.10 (18) 104.98 172.72 154.45 (89) 18.27 123.25 2012-13 134.25 106.66 (79) 27.59 182.75 106.77 (58) 75.98 103.57 2013-14 133.01 108.15 (81) 24.86 186.75 134.11 (72) 52.64 77.50 2014-15 112.25 75.63 (67) 36.62 211.75 171.60 (81) 40.15 76.77 2015-16 154.82 119.37 (77) 35.45 233.00 201.24 (86) 31.76 67.21
Municipal Corporation Rewa
2011-12 100.00 132.60 (132) -32.60 110.00 51.20 (47) 58.80 26.20 2012-13 80.00 117.40 (147) -37.40 120.00 52.85 (44) 67.15 29.75 2013-14 187.55 115.26 (61) 72.29 135.00 95.26 (71) 39.74 112.03 2014-15 192.00 180.52 (94) 11.48 148.00 110.32 (75) 37.68 49.16 2015-16 330.00 349.77 (106) -19.77 250.00 89.58 (36) 160.42 140.65
Municipal Council Amla 2011-12 1.75 1.36 (78) 0.39 5.17 4.20 (81) 0.97 1.36 2012-13 1.37 0.84 (61) 0.53 6.33 5.33 (84) 1.00 1.53 2013-14 1.53 0.46 (30) 1.07 7.50 6.27 (84) 1.23 2.30
2014-15 10.35 4.17 (40) 6.18 8.10 6.48 (80) 1.62 7.80
2015-16 10.34 5.23 (51) 5.11 18.58 9.61 (52) 8.97 14.08

Appendices
99
Year Outstanding demand
of previous years
Collection against demand of
previous year(Per cent)
Outstanding
recovery
Demand of
current year
Collection against demand of
current year(Per cent)
Outstanding
recovery
Total outstanding
recovery
Municipal Council Anuppur
2011-12 3.20 1.66 (52) 1.54 2.48 1.81 (73) 0.67 2.21
2012-13 2.21 1.22 (55) 0.99 3.12 1.54 (49) 1.58 2.57
2013-14 3.70 2.66 (72) 1.04 3.14 1.83 (58) 1.31 2.35
2014-15 3.14 1.44 (46) 1.70 3.23 1.57 (49) 1.66 3.36
2015-16 4.05 0.52 (13) 3.53 3.37 0.78 (23) 2.59 6.12
Municipal Council Badwah
2011-12 11.54 3.33 (29) 8.21 7.20 5.40 (75) 1.80 10.01
2012-13 9.77 4.48 (46) 5.29 6.40 4.80 (75) 1.60 6.89
2013-14 9.81 3.86 (39) 5.95 8.82 6.37 (72) 2.45 8.40
2014-15 8.41 2.96 (35) 5.45 8.82 6.47 (73) 2.35 7.80
2015-16 7.93 2.81 (35) 5.12 8.78 6.37 (73) 2.41 7.53
Municipal Council Begumganj
2011-12 51.21 3.10 (6) 48.11 12.30 0.44 (4) 11.86 59.97
2012-13 59.98 3.29 (5) 56.69 5.49 0.87 (16) 4.62 61.31
2013-14 61.31 1.97 (3) 59.34 5.49 0.61 (11) 4.88 64.22
2014-15 64.22 10.96 (17) 53.26 7.99 2.86 (36) 5.13 58.39
2015-16 58.39 7.66 (13) 50.73 7.99 1.87 (23) 6.12 56.85
Municpal Council Garhakota
2011-12 9.93 1.35 (14) 8.58 2.99 0.98 (33) 2.01 10.59
2012-13 10.59 1.78 (17) 8.81 2.99 1.16 (39) 1.83 10.64
2013-14 10.64 1.87 (18) 8.77 2.99 1.16 (39) 1.83 10.60
2014-15 10.64 1.18 (11) 9.46 2.99 1.04 (35) 1.95 11.41
2015-16 10.98 4.15 (38) 6.83 17.78 10.60 (60) 7.18 14.01
Municipal Council Harda
2011-12 11.01 4.20 (38) 6.81 36.44 31.17 (86) 5.27 12.08
2012-13 12.11 6.41 (53) 5.70 38.93 32.23 (83) 6.70 12.40
2013-14 12.41 6.64 (53) 5.77 41.17 34.39 (84) 6.78 12.55
2014-15 12.22 5.96 (49) 6.26 43.67 36.29 (83) 7.38 13.64
2015-16 13.64 5.25 (38) 8.39 46.53 37.94 (82) 8.59 16.98

Audit Report on Local Bodies for the year ended 31 March 2016
100
Year Outstanding demand
of previous years
Collection against demand of
previous year(Per cent)
Outstanding
recovery
Demand of
current year
Collection against demand of
current year(Per cent)
Outstanding
recovery
Total outstanding
recovery
Municipal Council Junnordeo
2011-12 12.55 3.14 (25) 9.41 10.67 6.39 (60) 4.28 13.69
2012-13 15.33 1.99 (13) 13.34 10.67 3.74 (35) 6.93 20.27
2013-14 17.28 10.22 (59) 7.06 10.67 8.75 (82) 1.92 8.98
2014-15 8.98 6.58 (73) 2.40 10.67 6.11 (59) 4.56 6.96
2015-16 2.87 2.61(91) 0.26 12.32 9.10 (74) 3.22 3.48
Municipal Council Nainpur
2011-12 8.09 2.18 (27) 5.91 4.40 2.25 (51) 2.15 8.06
2012-13 8.16 4.47 (55) 3.69 4.40 2.53 (57) 1.87 5.56
2013-14 12.22 3.63 (30) 8.59 5.09 3.07 (60) 2.02 10.61
2014-15 10.47 2.33 (19) 8.14 5.55 2.90 (52) 2.65 10.79
2015-16 11.05 3.80 (34) 7.25 5.65 3.43 (61) 2.22 9.47
Municipal Council Pandhurna
2011-12 16.49 5.19 (31) 11.30 24.02 20.69 (86) 3.33 14.63
2012-13 14.87 7.40(50) 7.47 24.19 20.78 (86) 3.41 10.88
2013-14 13.03 6.15 (47) 6.88 25.64 23.26 (91) 2.38 9.26
2014-15 14.98 4.83 (32) 10.15 27.83 25.33 (91) 2.50 12.65
2015-16 16.14 4.72 (29) 11.42 30.86 28.18 (91) 2.68 14.10
Municipal Council Porsa
2011-12 23.78 2.35 (10) 21.43 3.00 0.43 (14) 2.57 24.00
2012-13 24.01 3.82 (16) 20.19 3.82 0.73 (19) 3.09 23.28
2013-14 23.27 2.74 (12) 20.53 4.73 0.58 (12) 4.15 24.68
2014-15 24.68 3.73 (15) 20.95 4.50 0.89 (20) 3.61 24.56
2015-16 23.79 9.95 (42) 13.84 4.50 2.84 (63) 1.66 15.50
Total 8,864.93 30,090.64 18,400.78
Total outstanding recovery as on 31.03.16 14,537.75
(Source: Information collected from test checked MCs)

Appendices
101
Appendix- 4.2
(Reference: Paragraph 4.1.7.3, page 45)
Statement showing demand and collection of Composite Tax by test checked MCs (`̀̀̀ in lakh)
Year Outstanding demand
of previous years
Collection against demand of
previous year (Per cent)
Outstanding
recovery
Demand of
current year
Collection against demand of
current year(Per cent)
Outstanding
recovery
Total outstanding
recovery
Municipal Corporation Dewas
2011-12 211.56 124.66 (59) 86.90 114.50 64.01(56) 50.49 137.39 2012-13 137.39 113.06 (82) 24.33 239.62 116.80(49) 122.82 147.15 2013-14 147.14 31.14 (21) 116.00 243.28 140.41(58) 102.87 218.87 2014-15 218.87 171.75 (78) 47.12 215.18 152.63(71) 62.55 109.67 2015-16 109.67 44.70 (41) 64.97 180.47 135.35(75) 45.12 110.09
Municipal Corporation Indore
2011-12 11,095.95 1,403.31 (13) 9,692.64 3,577.93 2,015.39 (56) 1,562.54 11,255.18 2012-13 10,980.95 1,433.38 (13) 9,547.57 3,707.18 2,012.77 (54) 1,694.41 11,241.98 2013-14 12,230.82 711.81 (6) 11,519.01 4,256.03 2,254.83 (53) 2,001.20 13,520.21 2014-15 13,374.81 949.75 (7) 12,425.06 4,399.38 2,388.87 (54) 2,010.51 14,435.57 2015-16 13,196.23 1,386.55 (10) 11,809.68 4,749.91 2,977.51 (63) 1,772.40 13,582.08
Municipal Corporation Ratlam
2011-12 116.96 64.32(55) 52.64 110.00 45.47(41) 64.53 117.17 2012-13 117.47 61.81(53) 55.66 110.00 30.74(28) 79.26 134.92 2013-14 134.84 54.72(41) 80.12 110.00 29.05(26) 80.95 161.07 2014-15 161.06 60.21(37) 100.85 110.00 33.37(30) 76.63 177.48 2015-16 177.48 72.50(41) 104.98 110.00 47.26(43) 62.74 167.72
Municipal Corporation Rewa
2011-12 110.00 45.25(41) 64.75 63.00 10.05(16) 52.95 117.70 2012-13 110.00 48.65(44) 61.35 65.00 10.15(16) 54.85 116.20 2013-14 80.00 48.00(60) 32.00 67.00 12.20(18) 54.80 86.80 2014-15 107.00 24.21(23) 82.79 69.00 38.50(56) 30.50 113.29 2015-16 90.00 67.84(75) 22.16 112.00 11.66(10) 100.34 122.50
Municipal Council Amla 2011-12 1.95 1.69(86) 0.26 5.03 4.33(86) 0.70 0.96 2012-13 0.95 0.88(93) 0.07 5.70 3.85(68) 1.85 1.92 2013-14 1.93 1.40(73) 0.53 5.76 4.85(84) 0.91 1.44
2014-15 12.96 3.83(30) 9.13 5.76 3.63(63) 2.13 11.26
2015-16 5.76 4.46(77) 1.30 5.07 2.95(58) 2.12 3.42

Audit Report on Local Bodies for the year ended 31 March 2016
102
Year Outstanding demand
of previous years
Collection against demand of
previous year (Per cent)
Outstanding
recovery
Demand of
current year
Collection against demand of
current year(Per cent)
Outstanding
recovery
Total outstanding
recovery
Municipal Council Anuppur
2011-12 20.37 2.59(13) 17.78 2.33 0.49(21) 1.84 19.62
2012-13 15.00 2.54(17) 12.46 2.40 0.52(22) 1.88 14.34
2013-14 14.34 3.51(24) 10.83 2.50 0.62(25) 1.88 12.71
2014-15 22.16 2.42(11) 19.74 2.67 0.65(26) 2.02 21.76
2015-16 21.20 3.00(14) 18.20 2.99 0.59(20) 2.40 20.60
Municipal Council Badwah
2011-12 17.66 3.76(21) 13.90 3.65 1.70(47) 1.95 15.85
2012-13 16.51 2.89(18) 13.62 3.56 1.55(44) 2.01 15.63
2013-14 15.96 2.95(18) 13.01 3.95 1.96(50) 1.99 15.00
2014-15 15.00 2.33 (16) 12.67 3.95 1.97(50) 1.98 14.65
2015-16 15.08 2.77 (18) 12.31 3.96 1.91(48) 2.05 14.36
Municipal Council Begumganj
2011-12 80.81 1.92(2) 78.89 7.13 0.33(5) 6.80 85.69
2012-13 85.70 2.58(3) 83.12 7.44 0.50(7) 6.94 90.06
2013-14 90.06 1.99(2) 88.07 7.44 0.31(4) 7.13 95.20
2014-15 95.20 8.37(9) 86.83 10.70 1.13(11) 9.57 96.40
2015-16 96.39 5.93(6) 90.46 10.70 0.81(8) 9.89 100.35
Municpal Council Garhakota
2011-12 19.57 1.22(6) 18.35 9.88 1.00(10) 8.88 27.23
2012-13 27.24 3.25(12) 23.99 9.88 2.09(21) 7.79 31.78
2013-14 31.78 2.83(9) 28.95 9.88 1.72(17) 8.16 37.11
2014-15 31.78 3.52(11) 28.26 9.88 2.13(22) 7.75 36.01
2015-16 31.78 9.44(30) 22.34 19.98 10.63(53) 9.35 31.69
Municipal Council Harda
2011-12 13.45 4.03(30) 9.42 14.91 11.09(74) 3.82 13.24
2012-13 12.89 3.44(27) 9.45 15.25 10.86(71) 4.39 13.84
2013-14 13.83 3.85(28) 9.98 15.45 11.36(74) 4.09 14.07
2014-15 14.01 3.75(27) 10.26 15.69 11.57(74) 4.12 14.38
2015-16 14.40 2.95(20) 11.45 16.17 11.51(71) 4.66 16.11

Appendices
103
Year Outstanding demand
of previous years
Collection against demand of
previous year (Per cent)
Outstanding
recovery
Demand of
current year
Collection against demand of
current year(Per cent)
Outstanding
recovery
Total outstanding
recovery
Municipal Council Junnardeo
2011-12 17.92 2.57(14) 15.35 4.73 1.93(41) 2.80 18.15
2012-13 18.72 1.38(7) 17.34 4.73 1.20(25) 3.53 20.87
2013-14 19.85 11.40(57) 8.45 4.73 3.81(81) 0.92 9.37
2014-15 9.38 6.55(70) 2.83 4.73 2.85(60) 1.88 4.71
2015-16 4.36 3.98(91) 0.38 5.00 3.70(74) 1.30 1.68
Municipal Council Nainpur
2011-12 5.78 1.68(29) 4.10 2.65 1.33(50) 1.32 5.42
2012-13 5.42 3.15(58) 2.27 2.65 1.29(49) 1.36 3.63
2013-14 10.96 2.45(22) 8.51 3.35 1.32(39) 2.03 10.54
2014-15 9.50 1.79(19) 7.71 3.48 1.31(38) 2.17 9.88
2015-16 11.89 2.34(20) 9.55 3.77 1.43(38) 2.34 11.89
Municipal Council Pandhurna
2011-12 26.02 8.39(32) 17.63 13.05 7.99(61) 5.06 22.69
2012-13 25.64 5.93(23) 19.71 13.22 8.04(61) 5.18 24.89
2013-14 26.65 10.92(41) 15.73 13.42 8.48(63) 4.94 20.67
2014-15 26.88 5.64(21) 21.24 13.96 8.54(61) 5.42 26.66
2015-16 27.30 8.19(30) 19.11 14.63 9.34(64) 5.29 24.40
Municipal Council Porsa
2011-12 48.52 5.75(12) 42.77 6.00 0.77 (13) 5.23 48.00
2012-13 48.00 2.63 (5) 45.37 9.45 0.64 (7) 8.81 54.18
2013-14 54.18 3.47 (6) 50.71 12.71 0.70 (27) 12.01 62.72
2014-15 62.73 3.92(6) 58.81 9.50 0.66(7) 8.84 67.65
2015-16 70.26 12.88(18) 57.38 9.50 5.26(55) 4.24 61.62
Total 7,122.72 23,004.40 12,706.22 10,298.18
Total outstanding recovery as on 31.03.16 14,268.51
(Source: Information collected from test checked MCs)
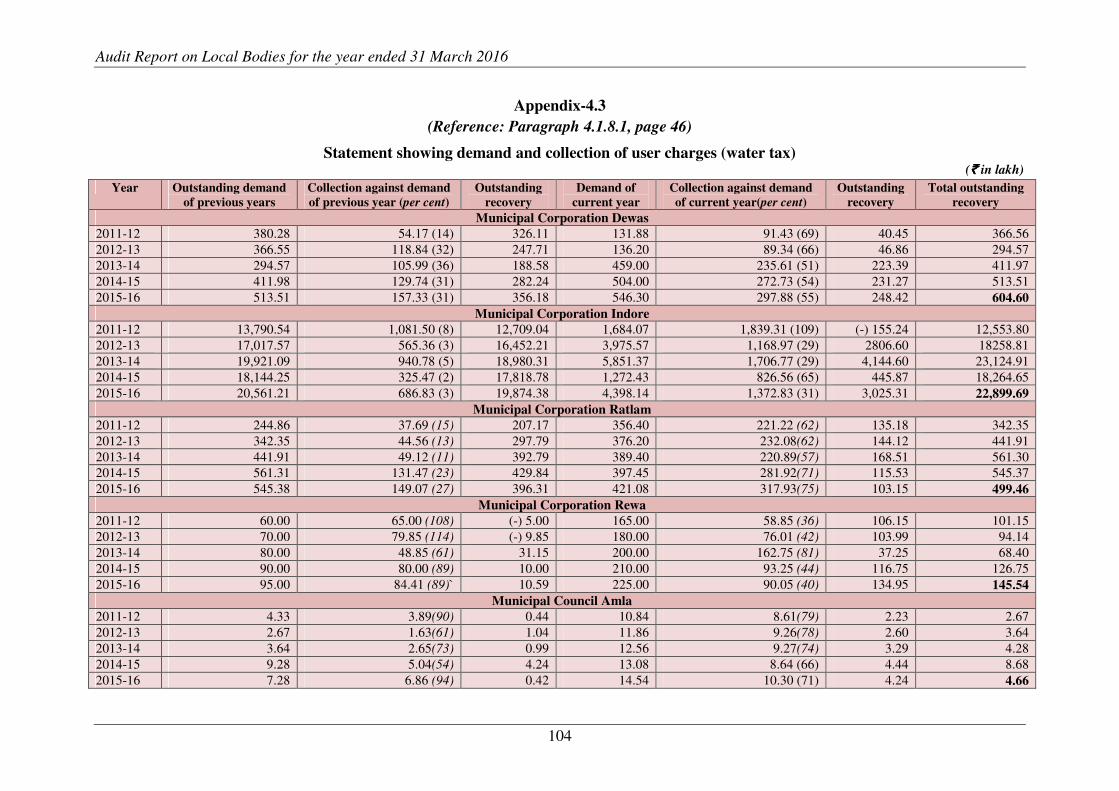
Audit Report on Local Bodies for the year ended 31 March 2016
104
Appendix-4.3
(Reference: Paragraph 4.1.8.1, page 46)
Statement showing demand and collection of user charges (water tax) (`̀̀̀ in lakh)
Year Outstanding demand
of previous years
Collection against demand
of previous year (per cent)
Outstanding
recovery
Demand of
current year
Collection against demand
of current year(per cent)
Outstanding
recovery
Total outstanding
recovery
Municipal Corporation Dewas 2011-12 380.28 54.17 (14) 326.11 131.88 91.43 (69) 40.45 366.56 2012-13 366.55 118.84 (32) 247.71 136.20 89.34 (66) 46.86 294.57 2013-14 294.57 105.99 (36) 188.58 459.00 235.61 (51) 223.39 411.97 2014-15 411.98 129.74 (31) 282.24 504.00 272.73 (54) 231.27 513.51 2015-16 513.51 157.33 (31) 356.18 546.30 297.88 (55) 248.42 604.60
Municipal Corporation Indore 2011-12 13,790.54 1,081.50 (8) 12,709.04 1,684.07 1,839.31 (109) (-) 155.24 12,553.80 2012-13 17,017.57 565.36 (3) 16,452.21 3,975.57 1,168.97 (29) 2806.60 18258.81 2013-14 19,921.09 940.78 (5) 18,980.31 5,851.37 1,706.77 (29) 4,144.60 23,124.91 2014-15 18,144.25 325.47 (2) 17,818.78 1,272.43 826.56 (65) 445.87 18,264.65 2015-16 20,561.21 686.83 (3) 19,874.38 4,398.14 1,372.83 (31) 3,025.31 22,899.69
Municipal Corporation Ratlam
2011-12 244.86 37.69 (15) 207.17 356.40 221.22 (62) 135.18 342.35 2012-13 342.35 44.56 (13) 297.79 376.20 232.08(62) 144.12 441.91 2013-14 441.91 49.12 (11) 392.79 389.40 220.89(57) 168.51 561.30 2014-15 561.31 131.47 (23) 429.84 397.45 281.92(71) 115.53 545.37 2015-16 545.38 149.07 (27) 396.31 421.08 317.93(75) 103.15 499.46
Municipal Corporation Rewa
2011-12 60.00 65.00 (108) (-) 5.00 165.00 58.85 (36) 106.15 101.15 2012-13 70.00 79.85 (114) (-) 9.85 180.00 76.01 (42) 103.99 94.14 2013-14 80.00 48.85 (61) 31.15 200.00 162.75 (81) 37.25 68.40 2014-15 90.00 80.00 (89) 10.00 210.00 93.25 (44) 116.75 126.75 2015-16 95.00 84.41 (89)` 10.59 225.00 90.05 (40) 134.95 145.54
Municipal Council Amla 2011-12 4.33 3.89(90) 0.44 10.84 8.61(79) 2.23 2.67 2012-13 2.67 1.63(61) 1.04 11.86 9.26(78) 2.60 3.64 2013-14 3.64 2.65(73) 0.99 12.56 9.27(74) 3.29 4.28 2014-15 9.28 5.04(54) 4.24 13.08 8.64 (66) 4.44 8.68 2015-16 7.28 6.86 (94) 0.42 14.54 10.30 (71) 4.24 4.66

Appendices
105
Year Outstanding demand
of previous years
Collection against demand
of previous year (per cent)
Outstanding
recovery
Demand of
current year
Collection against demand
of current year(per cent)
Outstanding
recovery
Total outstanding
recovery
Municipal Council Anuppur
2011-12 4.50 3.07 (68) 1.43 6.80 5.13 (75) 1.67 3.10
2012-13 3.11 2.15(69) 0.96 7.78 4.08 (52) 3.70 4.66
2013-14 7.24 4.97(67) 2.27 8.16 6.40 (78) 1.76 4.03
2014-15 4.59 1.85(40) 2.74 7.99 6.17 (77) 1.82 4.56
2015-16 4.53 1.50(33) 3.03 8.05 5.65 (70) 2.40 5.43
Municipal Council Badwah
2011-12 38.47 15.97(42) 22.50 32.42 24.63 (76) 7.79 30.29
2012-13 30.03 8.10(27) 21.93 32.07 24.56 (76) 7.51 29.44
2013-14 29.39 4.51(15) 24.88 39.48 29.47 (75) 10.01 34.89
2014-15 34.81 5.96(17) 28.85 39.63 30.06 (76) 9.57 38.42
2015-16 38.42 9.23(24) 29.19 39.25 30.92 (79) 8.33 37.52
Municipal Council Begumganj
2011-12 10.62 0.36 (3) 10.26 1.81 0.20 (11) 1.61 11.87
2012-13 11.87 0.87 (7) 11.00 2.17 0.47 (22) 1.70 12.70
2013-14 12.70 0.54 (4) 12.16 2.17 0.64 (30) 1.53 13.69
2014-15 13.69 3.69 (27) 10.00 3.82 1.40 (37) 2.42 12.42
2015-16 12.41 1.87 (15) 10.54 3.82 1.18 (31) 2.64 13.18
Municipal Council Garhakota
2011-12 18.88 3.06 (16) 15.82 12.00 3.19 (27) 8.81 24.63
2012-13 24.63 6.31 (26) 18.32 12.00 6.18 (51) 5.82 24.14
2013-14 24.15 4.15 (17) 20.00 12.01 4.86 (41) 7.15 27.15
2014-15 24.15 2.77 (11) 21.38 12.01 4.04 (34) 7.97 29.35
2015-16 24.15 4.39 (18) 19.76 12.01 7.71 (64) 4.30 24.06
Municipal Council Harda
2011-12 25.52 6.30(25) 19.22 42.01 33.84(81) 8.17 27.39
2012-13 27.39 7.28(27) 20.11 44.41 36.43(82) 7.98 28.09
2013-14 27.17 7.80(29) 19.37 44.91 36.83(82) 8.08 27.45
2014-15 27.45 7.68(28) 19.77 45.66 33.72(74) 11.94 31.71
2015-16 31.71 7.68(35) 24.03 46.38 36.93(80) 9.45 33.48

Audit Report on Local Bodies for the year ended 31 March 2016
106
Year Outstanding demand
of previous years
Collection against demand
of previous year (per cent)
Outstanding
recovery
Demand of
current year
Collection against demand
of current year(per cent)
Outstanding
recovery
Total outstanding
recovery
Municipal Council Junnordeo
2011-12 10.54 2.07(20) 8.47 8.15 7.55(93) 0.60 9.07
2012-13 9.59 0.90(9) 8.69 8.15 6.55(80) 1.60 10.29
2013-14 10.78 5.39(50) 5.39 8.15 7.25(89) 0.90 6.29
2014-15 6.29 3.77(60) 2.52 8.15 6.86(84) 1.29 3.81
2015-16 1.94 1.94(100) 0.00 8.15 6.02(74) 2.13 2.13
Municipal Council Nainpur
2011-12 6.26 2.96 (47) 3.30 11.98 8.22 (69) 3.76 7.06
2012-13 6.32 3.32 (52) 3.00 12.34 8.41 (65) 3.93 6.93
2013-14 7.44 2.49 (37) 4.95 12.90 8.20 (64) 4.70 9.65
2014-15 9.70 2.19 (23) 7.51 13.55 8.12 (60) 5.43 12.94
2015-16 13.06 4.31 (33) 8.75 13.64 8.42 (61) 5.22 13.97
Municipal Council Pandhurna
2011-12 31.90 12.23(40) 19.67 24.67 14.91(60) 9.76 29.43
2012-13 32.83 9.83(30) 23.00 25.60 18.27(71) 7.33 30.33
2013-14 32.45 13.81(43) 18.64 27.84 17.69(64) 10.15 28.79
2014-15 30.41 6.19(20) 24.22 27.91 15.87(57) 12.04 36.26
2015-16 39.48 10.57(27) 28.91 27.92 17.75(64) 10.17 39.08
Municipal Council Porsa
2011-12 38.52 10.66 (28) 27.86 14.50 7.34 (51) 7.16 35.02
2012-13 35.02 6.56 (19) 28.46 14.88 7.52 (51) 7.36 35.82
2013-14 35.82 6.69 (19) 29.13 13.96 7.25 (52) 6.71 35.84
2014-15 35.84 6.31 (18) 29.53 15.85 6.78 (43) 9.07 38.60
2015-16 44.15 9.14 (21) 35.01 15.85 8.92 (56) 6.93 41.94
Grand
Total
5199.49 22775.33 10275.05 12500.28 24364.74
Total outstanding recovery as on 31.03.16 24,364.74
(Source: Information collected from test checked MCs)
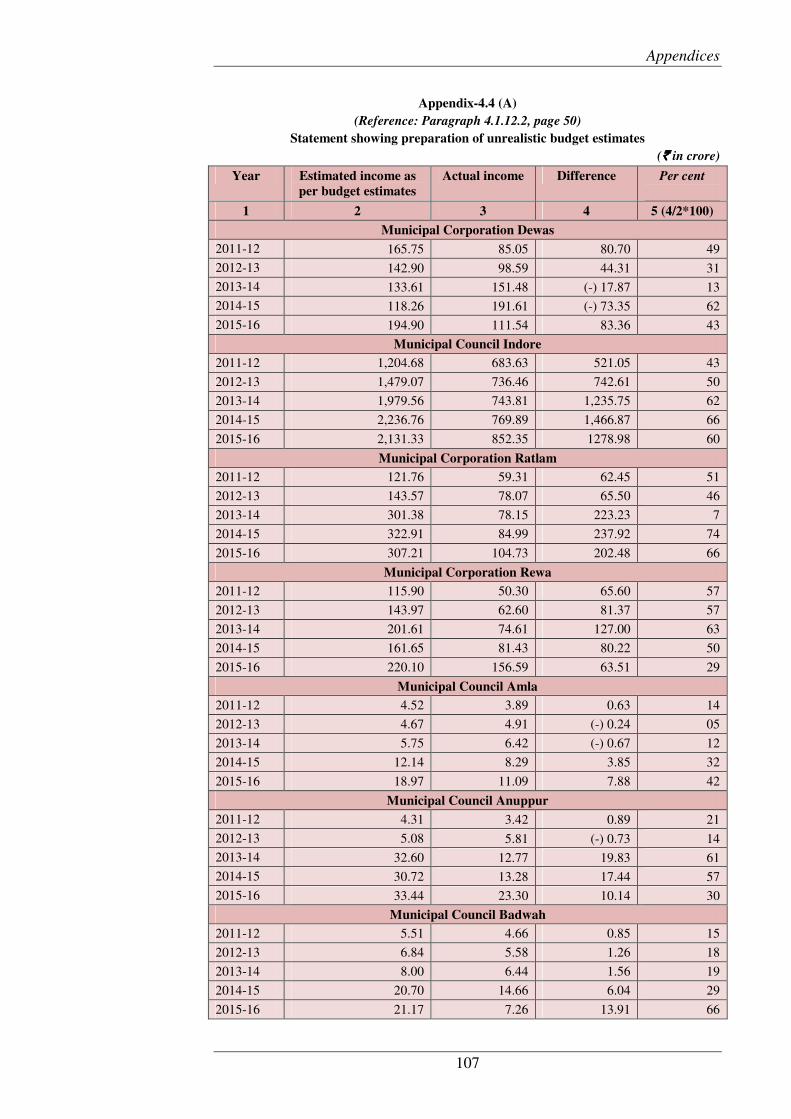
Appendices
107
Appendix-4.4 (A)
(Reference: Paragraph 4.1.12.2, page 50)
Statement showing preparation of unrealistic budget estimates
(`̀̀̀ in crore)
Year Estimated income as
per budget estimates
Actual income Difference Per cent
1 2 3 4 5 (4/2*100)
Municipal Corporation Dewas
2011-12 165.75 85.05 80.70 49
2012-13 142.90 98.59 44.31 31
2013-14 133.61 151.48 (-) 17.87 13
2014-15 118.26 191.61 (-) 73.35 62
2015-16 194.90 111.54 83.36 43
Municipal Council Indore
2011-12 1,204.68 683.63 521.05 43
2012-13 1,479.07 736.46 742.61 50
2013-14 1,979.56 743.81 1,235.75 62
2014-15 2,236.76 769.89 1,466.87 66
2015-16 2,131.33 852.35 1278.98 60
Municipal Corporation Ratlam
2011-12 121.76 59.31 62.45 51
2012-13 143.57 78.07 65.50 46
2013-14 301.38 78.15 223.23 7
2014-15 322.91 84.99 237.92 74
2015-16 307.21 104.73 202.48 66
Municipal Corporation Rewa
2011-12 115.90 50.30 65.60 57
2012-13 143.97 62.60 81.37 57
2013-14 201.61 74.61 127.00 63
2014-15 161.65 81.43 80.22 50
2015-16 220.10 156.59 63.51 29
Municipal Council Amla
2011-12 4.52 3.89 0.63 14
2012-13 4.67 4.91 (-) 0.24 05
2013-14 5.75 6.42 (-) 0.67 12
2014-15 12.14 8.29 3.85 32
2015-16 18.97 11.09 7.88 42
Municipal Council Anuppur
2011-12 4.31 3.42 0.89 21
2012-13 5.08 5.81 (-) 0.73 14
2013-14 32.60 12.77 19.83 61
2014-15 30.72 13.28 17.44 57
2015-16 33.44 23.30 10.14 30
Municipal Council Badwah
2011-12 5.51 4.66 0.85 15
2012-13 6.84 5.58 1.26 18
2013-14 8.00 6.44 1.56 19
2014-15 20.70 14.66 6.04 29
2015-16 21.17 7.26 13.91 66

Audit Report on Local Bodies for the year ended 31 March 2016
108
Municipal Council Begumganj
2011-12 11.21 4.64 6.57 59
2012-13 12.74 7.67 5.07 40
2013-14 18.67 5.51 13.16 70
2014-15 20.41 5.49 14.92 73
2015-16 21.30 17.47 3.83 18
Municipal Council Garhakota
2011-12 4.77 4.93 (-) 0.16 -3
2012-13 6.51 5.55 0.96 15
2013-14 7.17 7.95 (-) 0.78 -11
2014-15 8.84 5.61 3.23 37
2015-16 10.64 8.07 2.57 24
Municipal Council Harda
2011-12 24.07 19.92 4.15 17
2012-13 34.24 33.35 0.89 03
2013-14 56.79 19.26 37.53 66
2014-15 75.35 14.03 61.32 81
2015-16 14.78 24.45 (-) 9.67 65
Municipal Council Junnordeo
2011-12 7.25 2.32 4.93 68
2012-13 7.90 2.32 5.58 71
2013-14 14.69 3.53 11.16 76
2014-15 28.23 14.94 13.29 47
2015-16 32.65 17.00 15.65 48
Municipal Council Nainpur
2011-12 5.91 3.91 2.00 34
2012-13 6.80 5.22 1.58 23
2013-14 15.23 4.12 11.11 73
2014-15 15.03 5.05 9.98 66
2015-16 11.46 7.86 3.60 31
Municipal Council Pandhurna
2011-12 20.41 8.42 11.99 59
2012-13 21.49 10.20 11.29 53
2013-14 87.60 32.89 54.71 62
2014-15 55.80 42.45 13.35 24
2015-16 60.75 44.83 15.92 26
Municipal Council Porsa
2011-12 6.78 5.34 1.4 21
2012-13 7.12 7.16 (-) 0.04 01
2013-14 13.24 8.94 4.30 32
2014-15 14.67 8.96 5.71 39
2015-16 14.97 14.74 0.23 02
(Source: Information collected from test checked MCs)

Appendices
109
Appendix-4.4 (B)
(Reference: Paragraph 4.1.12.2, page 50)
Statement showing preparation of unrealistic budget estimates
(`̀̀̀ in crore)
Year Estimated expenditure
as per budget
Actual
expenditure
Difference Per cent
1 2 3 4 5 (4/2*100)
Municipal Corporation Dewas
2011-12 165.74 75.34 90.40 55
2012-13 142.87 93.58 49.29 34
2013-14 113.58 122.39 (-) 8.81 8
2014-15 118.22 189.93 (-) 71.71 61
2015-16 194.88 62.64 132.24 68
Municipal Corporation Indore
2011-12 1,181.10 690.07 491.03 42
2012-13 1,479.05 772.03 707.02 48
2013-14 1,987.54 874.49 1,113.05 56
2014-15 2,240.61 933.10 1,307.51 58
2015-16 2132.31 526.35 1605.96 75
Municipal Corporation Ratlam
2011-12 121.67 63.54 58.13 48
2012-13 143.18 76.80 66.38 46
2013-14 300.49 77.47 223.02 74
2014-15 322.17 74.52 247.65 77
2015-16 306.24 99.47 206.77 68
Municipal Corporation Rewa
2011-12 115.86 42.13 73.73 64
2012-13 143.41 51.08 92.33 64
2013-14 201.22 65.60 135.62 67
2014-15 165.94 65.40 100.54 61
2015-16 219.39 72.44 146.95 67
Municipal Council Amla
2011-12 4.76 3.74 1.02 21
2012-13 4.53 4.84 (-) 0.31 07
2013-14 5.27 5.89 (-) 0.62 12
2014-15 11.96 8.24 3.72 31
2015-16 18.83 8.57 10.26 54
Municipal Council Annuppur
2011-12 4.55 3.41 1.14 25
2012-13 5.36 2.86 2.50 47
2013-14 35.65 8.36 27.29 77
2014-15 37.52 17.15 20.37 54
2015-16 36.47 7.33 29.14 80
Municipal Council Badwah
2011-12 5.51 4.66 0.85 15
2012-13 6.84 4.64 2.20 32
2013-14 8.00 5.83 2.17 27
2014-15 20.70 6.57 14.13 68
2015-16 21.17 7.26 13.91 66

Audit Report on Local Bodies for the year ended 31 March 2016
110
Municipal Council Begumganj
2011-12 11.21 3.96 7.25 65
2012-13 12.74 4.22 8.52 67
2013-14 18.67 5.76 12.91 69
2014-15 20.40 6.01 14.39 71
2015-16 21.30 13.04 8.26 39
Municipal Council Gadhakota
2011-12 4.77 4.70 0.07 1
2012-13 6.51 5.37 1.14 18
2013-14 7.16 7.45 (-) 0.29 4
2014-15 8.82 6.98 1.84 21
2015-16 10.62 7.56 3.06 29
Municipal Council Harda
2011-12 28.38 23.16 5.22 18
2012-13 29.62 11.37 18.25 62
2013-14 53.26 16.96 36.30 68
2014-15 86.97 12.79 74.18 85
2015-16 15.65 24.85 (-) 9.20 59
Municipal Council Junnordeo
2011-12 7.25 4.20 3.05 42
2012-13 7.90 4.21 3.69 47
2013-14 14.68 8.37 6.31 43
2014-15 28.23 12.86 15.37 54
2015-16 32.65 21.36 11.29 35
Municipal Council Nainpur
2011-12 5.46 3.27 2.19 40
2012-13 6.61 4.36 2.25 34
2013-14 15.12 4.67 10.45 69
2014-15 14.69 5.90 8.79 60
2015-16 11.44 5.62 5.82 51
Municipal Council Pandhurna
2011-12 20.41 7.34 13.07 64
2012-13 21.49 9.94 11.55 54
2013-14 87.60 26.49 61.11 70
2014-15 55.78 33.77 22.01 39
2015-16 60.74 19.95 40.79 67
Municipal Council Porsa
2011-12 6.77 4.90 1.87 28
2012-13 7.12 5.95 1.17 16
2013-14 13.24 5.86 7.38 56
2014-15 14.67 7.10 7.57 52
2015-16 14.93 9.14 5.79 39
(Source: Information collected from test checked MCs)

Appendices
111
Appendix-4.5
(Reference: Paragraph 4.1.12.3, page 51)
Statement showing differences in closing balances as per cash book and bank pass book
as on 31.03.16
(`̀̀̀ in lakh)
Sl.
No.
Name of ULB CB as per bank pass
book
CB as per cash
book
Difference
1 Municipal Corporation Dewas
6,214.09 5,335.85 878.24
104.01 311.14 (-) 207.13
2 Municipal Corporation Rewa 927.07 965.41 (-) 38.34
7,025.25 6,953.66 71.59
3 Municipal Council Amla 412.59 336.62 75.97
4 Municipal Council Anuppur 26.04 18.06 7.98
1,530.85 1,580.79 (-) 49.94
5 Municipal Council Badwah 868.29 890.83 (-)22.54
6 Municipal Council Begumganj
1,493.22 1,357.22 136.00
57.01 58.62 (-) 1.61
7 Municipal Council Garhakota 229.81 183.86 45.95
76.49 78.83 (-) 2.34
8 Municipal Council Harda 1,842.06 1,710.46 131.60
9 Municipal Council Junnordeo 877.25 635.79 241.46
10 Municipal Council Nainpur 600.35 516.71 83.64
11 Municipal Council Pandhurna
3,392.16 3,323.44 68.72
12 Municipal Council Porsa 1,448.07 1,230.72 217.35
(Source: Information collected from test checked MCs)

Audit Report on Local Bodies for the year ended 31 March 2016
112
Appendix-4.6
(Reference: Paragraph 4.1.12.4, page 51)
Statement showing short deposit of money in Reserve Fund
(`̀̀̀ in lakh)
Name of Municipal
Corporation/Council
Year Total own
revenue during
the year
Amount to be
deposited in reserve
fund
Actual
Amount
deposited
Short
Deposit
1 2 3 4 (five per cent of 3) 5 6
Dewas 2011-12 3,269.36 163.46 Nil 163.46
2012-13 3,957.35 197.87 Nil 197.87
2013-14 3,552.96 177.65 Nil 177.65
2014-15 5,056.38 252.82 Nil 252.82
2015-16 4,525.86 226.29 Nil 226.29
Total 20,361.91 1,018.09 Nil 1,018.09
Indore 2011-12 38,802.00 1,940.10 Nil 1,940.10
2012-13 47,459.00 2,372.95 Nil 2,372.95
2013-14 51,639.00 2,581.95 Nil 2,581.95
2014-15 57,755.00 2,887.75 Nil 2,887.75
2015-16 64,441.00 3,222.05 Nil 3,222.05
Total 2,60,096.00 13,004.80 Nil 13,004.80
Ratlam 2011-12 3,443.24 172.16 Nil 172.16
2012-13 3,538.22 176.91 Nil 176.91
2013-14 4,342.82 217.14 Nil 217.14
2014-15 4,390.14 219.51 Nil 219.51
2015-16 4,438.66 221.93 219.28 2.65
Total 20,153.08 1,007.65 219.28 788.37
Rewa 2011-12 3,441.34 172.07 20.88 151.19
2012-13 2,317.89 115.89 30.62 85.27
2013-14 3,204.19 160.21 1.31 158.90
2014-15 4,737.30 236.87 10.83 226.04
2015-16 3,735.89 186.79 2.82 183.97
Total 17436.61 871.83 66.46 805.37
Amla 2011-12 218.40 10.92 Nil 10.92
2012-13 243.47 12.17 Nil 12.17
2013-14 313.43 15.67 Nil 15.67
2014-15 357.24 17.86 Nil 17.86
2015-16 391.79 19.59 30.05 (-) 10.46
Total 1,524.33 76.21 30.05 46.16
Anuppur 2011-12 176.98 8.85 0.15 8.70
2012-13 214.32 10.72 0.00 10.72
2013-14 174.45 8.72 0.00 8.72
2014-15 173.42 8.67 22.03 (-) 13.36
2015-16 209.44 10.47 0.02 10.45
Total 948.61 47.43 22.20 25.23
Badwah 2011-12 302.02 15.10 Nil 15.10
2012-13 339.41 16.97 Nil 16.97
2013-14 397.91 19.90 Nil 19.90
2014-15 380.99 19.04 Nil 19.04
2015-16 412.83 20.64 31.39 (-) 10.75
Total 1,833.16 91.65 31.39 60.26

Appendices
113
(Source: Information collected from test checked MCs)
Begumgunj 2011-12 205.12 10.26 1.01 9.25
2012-13 212.19 10.61 1.38 9.23
2013-14 283.52 14.18 0.76 13.42
2014-15 401.73 20.09 2.21 17.88
2015-16 426.13 21.31 1.65 19.66
Total 1,528.69 76.45 7.01 69.44
Gadhakota 2011-12 190.26 9.51 1.21 8.30
2012-13 193.45 9.67 2.17 7.50
2013-14 251.81 12.59 1.29 11.30
2014-15 198.08 9.90 2.10 7.80
2015-16 296.79 14.84 4.78 10.06
Total 1,130.39 56.51 11.55 44.96
Harda 2011-12 1,121.83 56.09 23.03 33.06
2012-13 1,109.53 55.48 18.00 37.48
2013-14 1,269.97 63.50 18.07 45.43
2014-15 992.91 49.65 15.78 33.88
2015-16 1,231.47 61.57 20.08 41.49
Total 5,725.71 286.29 94.97 191.33
Junnordeo 2011-12 192.45 9.62 2.75 6.87
2012-13 198.53 9.93 3.61 6.32
2013-14 260.72 13.03 2.96 10.07
2014-15 281.99 14.09 8.80 5.29
2015-16 311.44 15.57 8.89 6.68
Total 1,245.13 62.24 27.01 35.23
Nainpur 2011-12 220.18 11.01 4.06 6.95
2012-13 253.80 12.69 5.18 7.51
2013-14 223.32 11.17 3.97 7.20
2014-15 267.71 13.38 5.56 7.82
2015-16 277.17 13.86 4.54 9.32
Total 1,242.18 62.11 23.31 38.80
Pandhurna 2011-12 523.27 26.16 19.04 7.12
2012-13 589.20 29.46 25.67 3.79
2013-14 728.08 36.40 41.90 (-) 5.50
2014-15 891.44 44.57 20.06 24.51
2015-16 835.44 41.77 18.28 23.49
Total 3,567.43 178.36 124.95 53.41
Porsa 2011-12 262.33 13.12 6.16 6.96
2012-13 419.09 20.95 4.65 16.30
2013-14 312.70 15.64 6.72 8.92
2014-15 419.71 20.99 5.08 15.91
2015-16 460.86 23.04 Nil 23.04
Total 1,874.69 93.74 22.61 71.13
Grand Total 3,38,667.92 16,933.40 680.79 16,252.58

Audit Report on Local Bodies for the year ended 31 March 2016
114
Appendix-4.7
(Reference: Paragraph 4.1.12.6, page 52)
Statement showing delays in remitting taxes deducted at source to respective authorities
(`̀̀̀ in lakh)
Municipal Corporation Dewas
Year Labour Welfare Cess Royalty VAT/CST Income Tax Total
Up to 2010-11 4.34 7.72 Nil Nil 12.06 2011-12 3.03 9.60 Nil Nil 12.63 2012-13 18.00 41.42 61.03 Nil 120.45 2013-14 36.25 37.51 64.68 Nil 138.44 2014-15 18.89 29.60 Nil Nil 48.49 2015-16 41.86 52.97 Nil Nil 94.83
Total 122.37 178.82 125.71 Nil 426.90
Municipal Corporation Rewa
As on 31.03.2016 Nil 122.12 145.97 Nil 268.09
Municipal Council Anuppur
2012-13 0.66 0.76 4.59 1.91 7.92 2013-14 2.57 0.72 11.36 3.66 18.31 2014-15 11.50 Nil 17.21 12.88 41.59 2015-16 0.99 0.25 0.51 1.35 3.10
Total 15.72 1.73 33.67 19.80 70.92
Grand Total 138.09 302.67 305.35 19.80 765.91
(Source: Information collected from test checked MCs)

Appendices
115
Appendix – 4.8
(Reference: Paragraph 4.1.12.9, page 53)
Statement showing short remittance of State's share of Urban Development Cess in
Government Account
(`̀̀̀ in lakh)
Year Urban Development
Cess collected during
the year
Amount to be
credited in
Government Account
Actual amount
deposited in
Government account
Short
deposit
1 2 3 (40 per cent of 2) 4 5
Municipal Corporation Dewas
2011-12 37.89 15.16 Nil 15.16 2012-13 65.14 26.05 Nil 26.05 2013-14 165.92 66.37 Nil 66.37 2014-15 153.50 61.40 Nil 61.40 2015-16 213.78 85.51 Nil 85.51 Total 636.23 254.49 Nil 254.49
Municipal Corporation Indore
2011-12 458.01 183.20 Nil 183.20 2012-13 601.90 240.76 Nil 240.76 2013-14 598.87 239.55 Nil 239.55 2014-15 808.14 323.26 Nil 323.26 2015-16 1,010.04 404.02 Nil 404.02 Total 3,476.96 1,390.79 Nil 1,390.79
Municipal Corporation Ratlam
2011-12 46.41 18.56 Nil 18.56
2012-13 41.68 16.67 Nil 16.67
2013-14 41.92 16.77 Nil 16.77
2014-15 43.44 17.38 Nil 17.38
2015-16 56.09 22.44 Nil 22.44
Total 229.54 91.82 Nil 91.82
Municipal Corporation Rewa
2011-12 23.40 9.36 Nil 9.36
2012-13 32.10 12.84 Nil 12.84
2013-14 26.61 10.64 Nil 10.64
2014-15 74.03 29.61 Nil 29.61
2015-16 67.80 27.12 Nil 27.12
Total 223.94 89.57 Nil 89.57
Municipal Council Amla
2011-12 0.05 0.02 Nil 0.02
2012-13 0.06 0.02 Nil 0.02
2013-14 0.13 0.05 Nil 0.05
2014-15 0.19 0.08 Nil 0.08
2015-16 2.82 1.13 Nil 1.13
Total 3.25 1.30 Nil 1.30
Municipal Council Anuppur
2011-12 0.72 0.29 Nil 0.29
2012-13 0.46 0.18 Nil 0.18
2013-14 0.75 0.30 Nil 0.30
2014-15 0.73 0.29 Nil 0.29
2015-16 0.26 0.10 Nil 0.10
Total 2.92 1.16 Nil 1.16

Audit Report on Local Bodies for the year ended 31 March 2016
116
Municipal Council Budwah
2011-12 1.22 0.49 Nil 0.49
2012-13 1.20 0.48 Nil 0.48
2013-14 1.45 0.58 Nil 0.58
2014-15 1.46 0.58 Nil 0.58
2015-16 1.42 0.57 Nil 0.57
Total 6.75 2.70 Nil 2.70
Municipal Council Begumganj
2011-12 0.44 0.18 Nil 0.18
2012-13 0.78 0.31 Nil 0.31
2013-14 0.40 0.16 Nil 0.16
2014-15 2.16 0.86 Nil 0.86
2015-16 1.40 0.56 Nil 0.56
Total 5.18 2.07 Nil 2.07
Municipal Council Gadhakota
2011-12 0.44 0.18 0.18 0
2012-13 0.36 0.14 0.14 0
2013-14 0.33 0.13 0.13 0
2014-15 0.28 0.11 0.11 0
2015-16 2.54 1.02 0.12 0.90
Total 3.95 1.58 0.68 0.90
Municipal Council Harda
2011-12 5.53 2.21 1.57 0.64
2012-13 5.88 2.35 1.90 0.45
2013-14 6.50 2.60 2.21 0.39
2014-15 6.86 2.74 2.41 0.33
2015-16 6.99 2.80 3.62 Nil
Total 31.76 12.70 11.71 0.99
Municipal Council Junnordeo
2011-12 2.20 0.88 Nil 0.88
2012-13 1.19 0.48 Nil 0.48
2013-14 2.92 1.17 Nil 1.17
2014-15 4.24 1.70 Nil 1.70
2015-16 4.15 1.66 Nil 1.66
Total 14.70 5.89 Nil 5.89
Municipal Council Nainpur
2011-12 1.67 0.67 0.67 0.00
2012-13 2.21 0.88 0.89 0.00
2013-14 1.75 0.70 0.00 0.70
2014-15 1.87 0.75 0.00 0.75
2015-16 2.19 0.88 0.00 0.88
Total 9.69 3.88 1.56 2.32
Municipal Council Pandhurna
2011-12 7.09 2.84 Nil 2.84
2012-13 6.89 2.76 Nil 2.76
2013-14 8.50 3.40 Nil 3.40
2014-15 8.61 3.44 Nil 3.44
2015-16 9.48 3.79 Nil 3.79
Total 40.57 16.23 Nil 16.23
Grand Total 4,685.44 1,874.18 13.95 1,860.23
(Source: Information collected from test checked MCs)
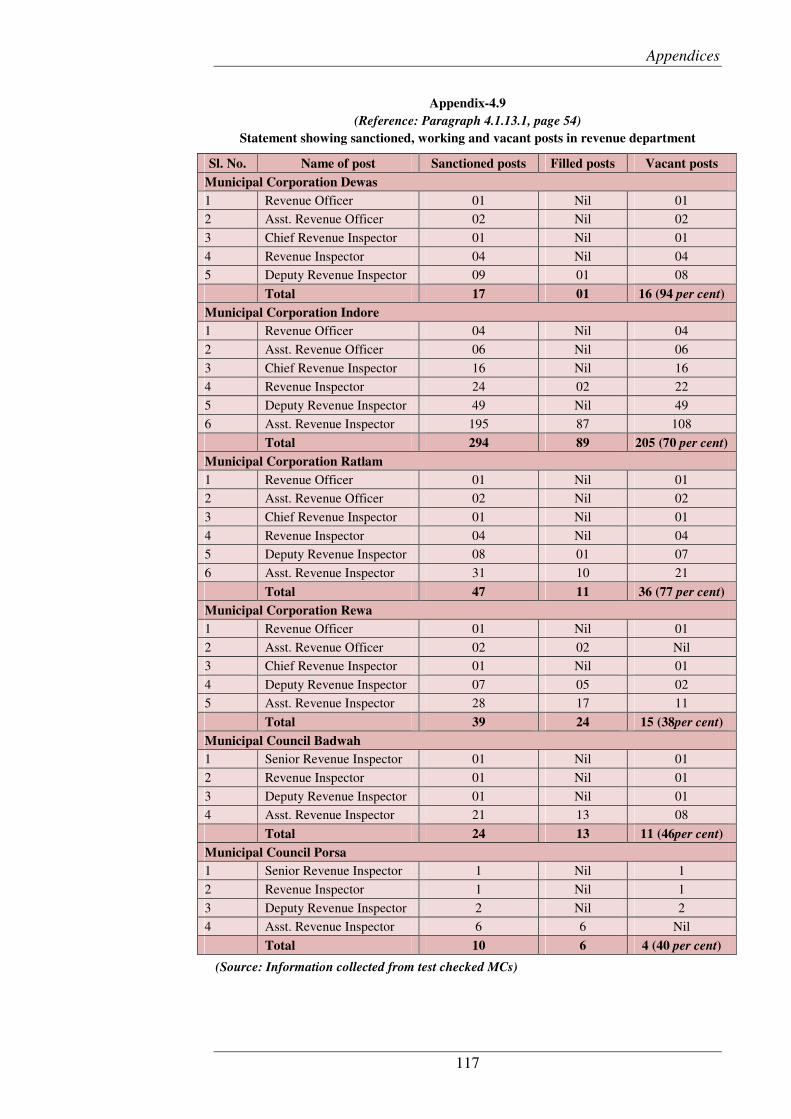
Appendices
117
Appendix-4.9 (Reference: Paragraph 4.1.13.1, page 54)
Statement showing sanctioned, working and vacant posts in revenue department
Sl. No. Name of post Sanctioned posts Filled posts Vacant posts
Municipal Corporation Dewas
1 Revenue Officer 01 Nil 01
2 Asst. Revenue Officer 02 Nil 02
3 Chief Revenue Inspector 01 Nil 01
4 Revenue Inspector 04 Nil 04
5 Deputy Revenue Inspector 09 01 08
Total 17 01 16 (94 per cent)
Municipal Corporation Indore
1 Revenue Officer 04 Nil 04
2 Asst. Revenue Officer 06 Nil 06
3 Chief Revenue Inspector 16 Nil 16
4 Revenue Inspector 24 02 22
5 Deputy Revenue Inspector 49 Nil 49
6 Asst. Revenue Inspector 195 87 108
Total 294 89 205 (70 per cent)
Municipal Corporation Ratlam
1 Revenue Officer 01 Nil 01
2 Asst. Revenue Officer 02 Nil 02
3 Chief Revenue Inspector 01 Nil 01
4 Revenue Inspector 04 Nil 04
5 Deputy Revenue Inspector 08 01 07
6 Asst. Revenue Inspector 31 10 21
Total 47 11 36 (77 per cent)
Municipal Corporation Rewa
1 Revenue Officer 01 Nil 01
2 Asst. Revenue Officer 02 02 Nil
3 Chief Revenue Inspector 01 Nil 01
4 Deputy Revenue Inspector 07 05 02
5 Asst. Revenue Inspector 28 17 11
Total 39 24 15 (38per cent)
Municipal Council Badwah
1 Senior Revenue Inspector 01 Nil 01
2 Revenue Inspector 01 Nil 01
3 Deputy Revenue Inspector 01 Nil 01
4 Asst. Revenue Inspector 21 13 08
Total 24 13 11 (46per cent)
Municipal Council Porsa
1 Senior Revenue Inspector 1 Nil 1
2 Revenue Inspector 1 Nil 1
3 Deputy Revenue Inspector 2 Nil 2
4 Asst. Revenue Inspector 6 6 Nil
Total 10 6 4 (40 per cent)
(Source: Information collected from test checked MCs)
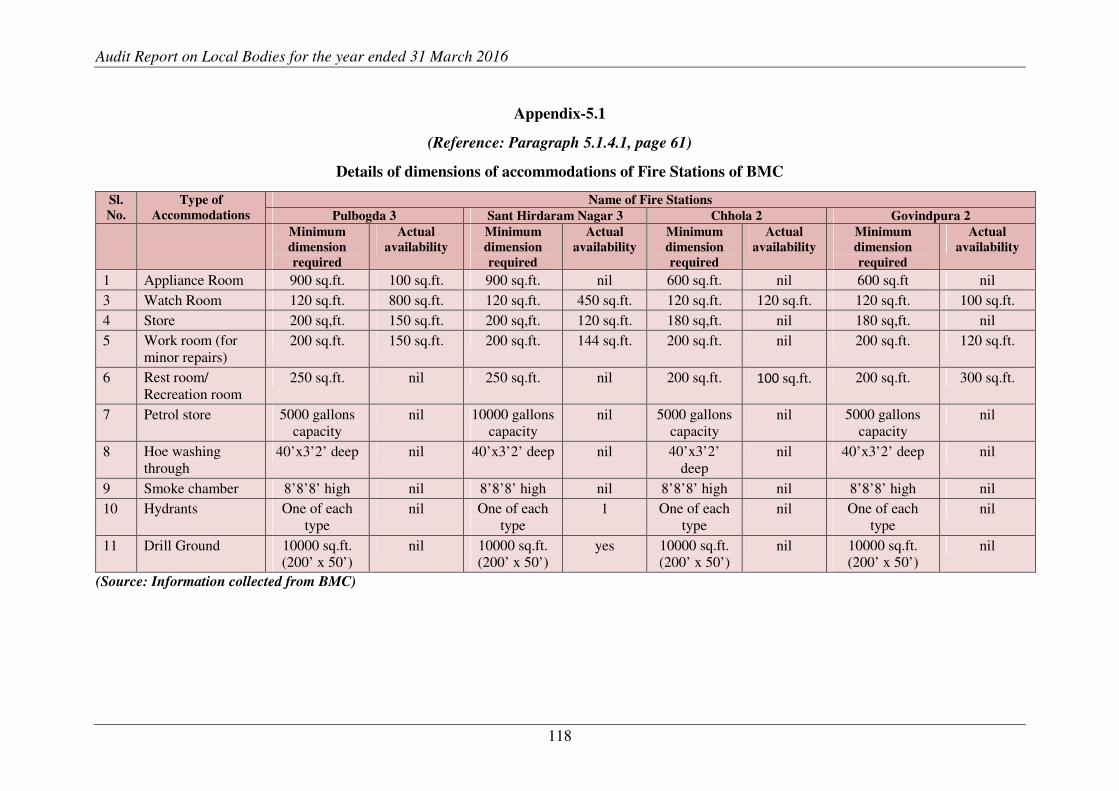
Audit Report on Local Bodies for the year ended 31 March 2016
118
Appendix-5.1
(Reference: Paragraph 5.1.4.1, page 61)
Details of dimensions of accommodations of Fire Stations of BMC
Sl.
No.
Type of
Accommodations
Name of Fire Stations
Pulbogda 3 Sant Hirdaram Nagar 3 Chhola 2 Govindpura 2
Minimum
dimension
required
Actual
availability
Minimum
dimension
required
Actual
availability
Minimum
dimension
required
Actual
availability
Minimum
dimension
required
Actual
availability
1 Appliance Room 900 sq.ft. 100 sq.ft. 900 sq.ft. nil 600 sq.ft. nil 600 sq.ft nil
3 Watch Room 120 sq.ft. 800 sq.ft. 120 sq.ft. 450 sq.ft. 120 sq.ft. 120 sq.ft. 120 sq.ft. 100 sq.ft.
4 Store 200 sq,ft. 150 sq.ft. 200 sq,ft. 120 sq.ft. 180 sq,ft. nil 180 sq,ft. nil
5 Work room (for minor repairs)
200 sq.ft. 150 sq.ft. 200 sq.ft. 144 sq.ft. 200 sq.ft. nil 200 sq.ft. 120 sq.ft.
6 Rest room/ Recreation room
250 sq.ft. nil 250 sq.ft. nil 200 sq.ft. 100 sq.ft. 200 sq.ft. 300 sq.ft.
7 Petrol store 5000 gallons capacity
nil 10000 gallons capacity
nil 5000 gallons capacity
nil 5000 gallons capacity
nil
8 Hoe washing through
40’x3’2’ deep nil 40’x3’2’ deep nil 40’x3’2’ deep
nil 40’x3’2’ deep nil
9 Smoke chamber 8’8’8’ high nil 8’8’8’ high nil 8’8’8’ high nil 8’8’8’ high nil
10 Hydrants One of each type
nil One of each type
1 One of each type
nil One of each type
nil
11 Drill Ground 10000 sq.ft. (200’ x 50’)
nil 10000 sq.ft. (200’ x 50’)
yes 10000 sq.ft. (200’ x 50’)
nil 10000 sq.ft. (200’ x 50’)
nil
(Source: Information collected from BMC)

Appendices
119
Appendix-5.2
(Reference: Paragraph 5.1.4.3, page 63)
Details of availability of personal protective equipment in test checked ULBs
Sl. No. Personal protective equipment recommended by SFAC BMC JMC MC
Chanderi
MC
Malanjkhand
MC Mandideep MC
Banmore
1 Helmet √ √ √ √ √ √
2 Water bottle with sling x x x x x x
3 Eye protection √ x x x x x
4 Ear protection x x x x x x
5 Safety steel-toe boots x x x x x x
6 Safety whistle x √ x x x x
7 Knee pads x x x x x x
8 Work gloves √ x √ √ x √
9 Overalls fire resistant suit x x x x x x
10 Personal safety line x x x x x x
11 Gum boot/ safety boot/ firefighting boot √ √ √ √ √ √
12 Fire entry suit √ x x x x x
13 Fire proximity suit √ x x x x x
14 Fire approach suit fire entry suit x x x x x x
15 Fire men axe √ √ x √ √ x
16 Breathing apparatus √ √ x x x x
(Source: Information provided by ULBs)

Audit Report on Local Bodies for the year ended 31 March 2016
120
Appendix.5.3
(Reference: Paragraph 5.1.5.1, page 67)
Details of Sanctioned strength of fire staff and men in position
Name of
ULB
Chief Fire Officer Fire Officer Asstt. Fire Officer Leading Fireman Fireman Total
Sanctioned Working Sanctioned Working Sanctioned Working Sanctioned Working Sanctioned Working Sanctioned Working
BMC 2 - 4 1 8 54 - 108 155 176 156
JMC 1 - 2 - 4 2 60 03 120 80 187 85
MC
Chanderi
Posts of Chief Fire Officer, Fire Officer and Asstt. Fire Officer were not
sanctioned in these ULBs
1 - 6 6 7 6
MC
Malanjkhand
1 - 6 5 7 5
MC
Mandideep
1 - 18 13 19 13
MC Sanavad 1 - 12 11 13 11
NP Banmore 1 - 13 2 14 2
NP Chandla 1 - 6 4 7 4
NP Khirkiya 1 - 6 2 7 2
NP Shahpur 1 - 6 1 7 1
Total 3 - 6 1 12 2 122 3 301 279 443 285
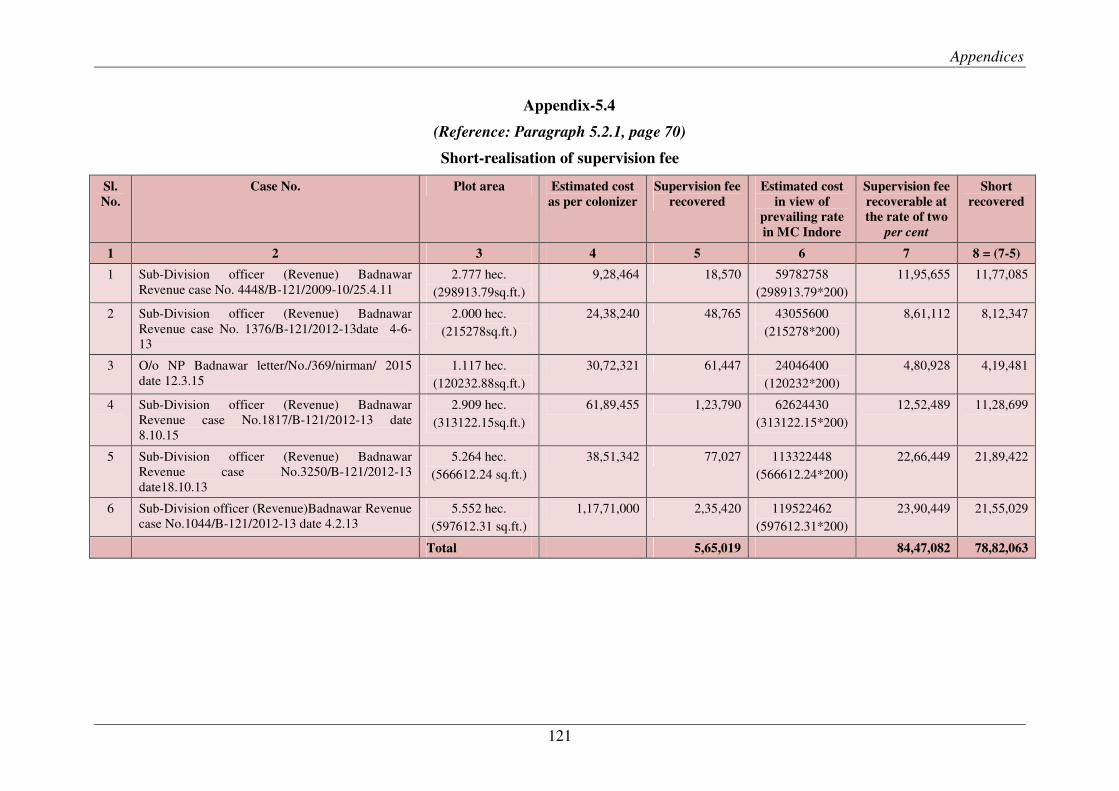
Appendices
121
Appendix-5.4
(Reference: Paragraph 5.2.1, page 70)
Short-realisation of supervision fee
Sl.
No.
Case No. Plot area Estimated cost
as per colonizer
Supervision fee
recovered
Estimated cost
in view of
prevailing rate
in MC Indore
Supervision fee
recoverable at
the rate of two
per cent
Short
recovered
1 2 3 4 5 6 7 8 = (7-5)
1 Sub-Division officer (Revenue) Badnawar Revenue case No. 4448/B-121/2009-10/25.4.11
2.777 hec.
(298913.79sq.ft.)
9,28,464 18,570 59782758
(298913.79*200)
11,95,655 11,77,085
2 Sub-Division officer (Revenue) Badnawar Revenue case No. 1376/B-121/2012-13date 4-6-13
2.000 hec.
(215278sq.ft.)
24,38,240 48,765 43055600
(215278*200)
8,61,112 8,12,347
3 O/o NP Badnawar letter/No./369/nirman/ 2015 date 12.3.15
1.117 hec.
(120232.88sq.ft.)
30,72,321 61,447 24046400
(120232*200)
4,80,928 4,19,481
4 Sub-Division officer (Revenue) Badnawar Revenue case No.1817/B-121/2012-13 date 8.10.15
2.909 hec.
(313122.15sq.ft.)
61,89,455 1,23,790 62624430
(313122.15*200)
12,52,489 11,28,699
5 Sub-Division officer (Revenue) Badnawar Revenue case No.3250/B-121/2012-13 date18.10.13
5.264 hec.
(566612.24 sq.ft.)
38,51,342 77,027 113322448
(566612.24*200)
22,66,449 21,89,422
6 Sub-Division officer (Revenue)Badnawar Revenue case No.1044/B-121/2012-13 date 4.2.13
5.552 hec.
(597612.31 sq.ft.)
1,17,71,000 2,35,420 119522462
(597612.31*200)
23,90,449 21,55,029
Total 5,65,019 84,47,082 78,82,063