REPORT OF THE KERALA PUBLIC
42
Transcript of REPORT OF THE KERALA PUBLIC

REPORT OF THE KERALA PUBLIC
EXPENDITURE REVIEW COMMITTEE
FOURTH COMMITTEE
[Constituted as per Gazette Notification No. G.O.(P) 37/2017/Fin dated 17.03.2017
(S.R.O.No.132/17) as prescribed under section 6 of the Kerala Fiscal Responsibility Act 2003
(29 of 2003)]
THIRD REPORT
2016-17
JANUARY 2019


Acknowledgments
This is the 3rd report of the 4th Kerala Public Expenditure Review Committee
(KPERC). This report has examined various aspects of the State’s public finance for the
financial year 2016-17. The recommendations based on the analysis have been made in
compliance with the mandate of the KPERC, under Fiscal Responsibility Act (FRA) Act
2003. The committee acknowledges the support and cooperation rendered by Shri.
Manoj Joshi IAS, Principal Secretary and other officials of the Finance Department,
Government of Kerala, which made possible the timely completion of this report. The
committee would like to thank the Director, Gulati Institute of Finance and Taxation
(GIFT) for hosting the meetings of the Committee and providing necessary
infrastructure support.
The committee specially acknowledges the efforts and contribution of Shri.
M.Chandra Dhas, Secretary of the KPERC, for collecting and collating data, analyzing
the same and giving unstinted support in drafting this report. The Committee is
grateful to Dr. N. Ramalingam, Associate Professor, GIFT for the support given. The
Committee also places its gratitude to Shri. Ajith. S. Under Secretary, Finance
Department, for the valuable support, especially in data analysis. Shri Abhilash. S,
Assistant Private Secretary to the of Finance, Government of Kerala deserves mention
for the cooperation given for the functioning of the Committee. The secretarial
assistance provided by Shri.P.Karthikaraj and Shri. Jayesh V Nair to the Committee
helped a lot in finalizing this report.
Pinaki Chakraborty
Chairman
Padmini Swaminathan
Member

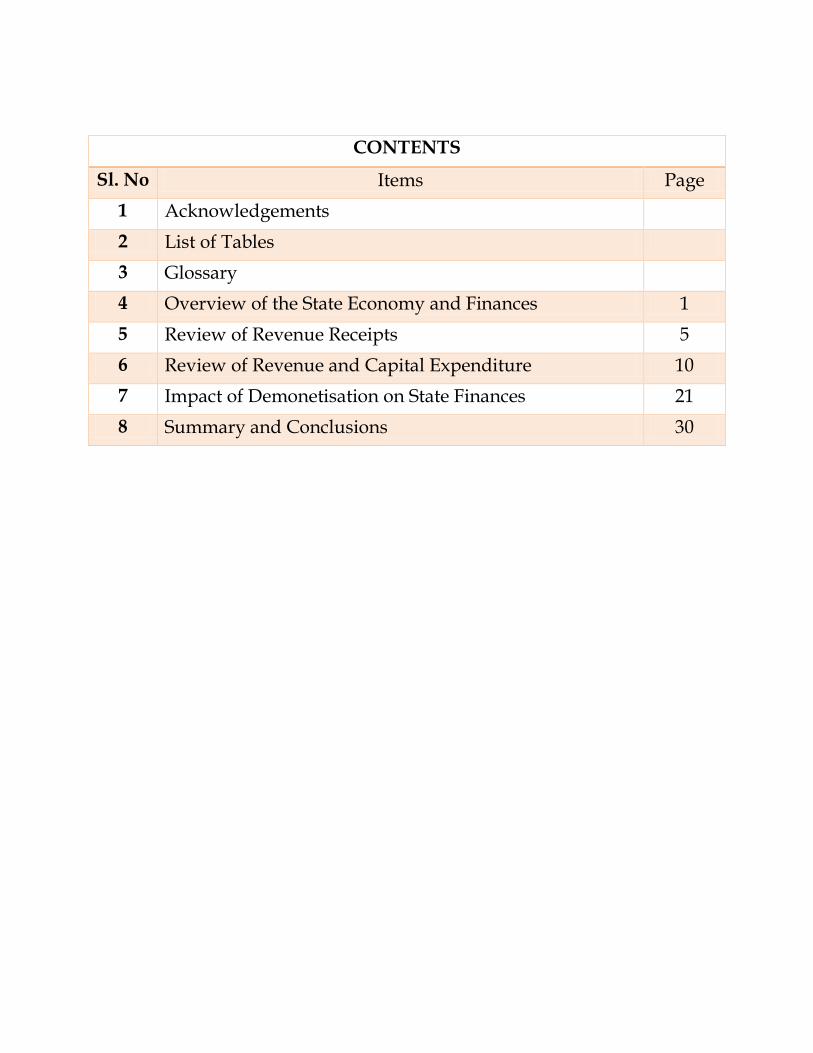
CONTENTS
Sl. No Items Page
1 Acknowledgements
2 List of Tables
3 Glossary
4 Overview of the State Economy and Finances 1
5 Review of Revenue Receipts 5
6 Review of Revenue and Capital Expenditure 10
7 Impact of Demonetisation on State Finances 21
8 Summary and Conclusions 30

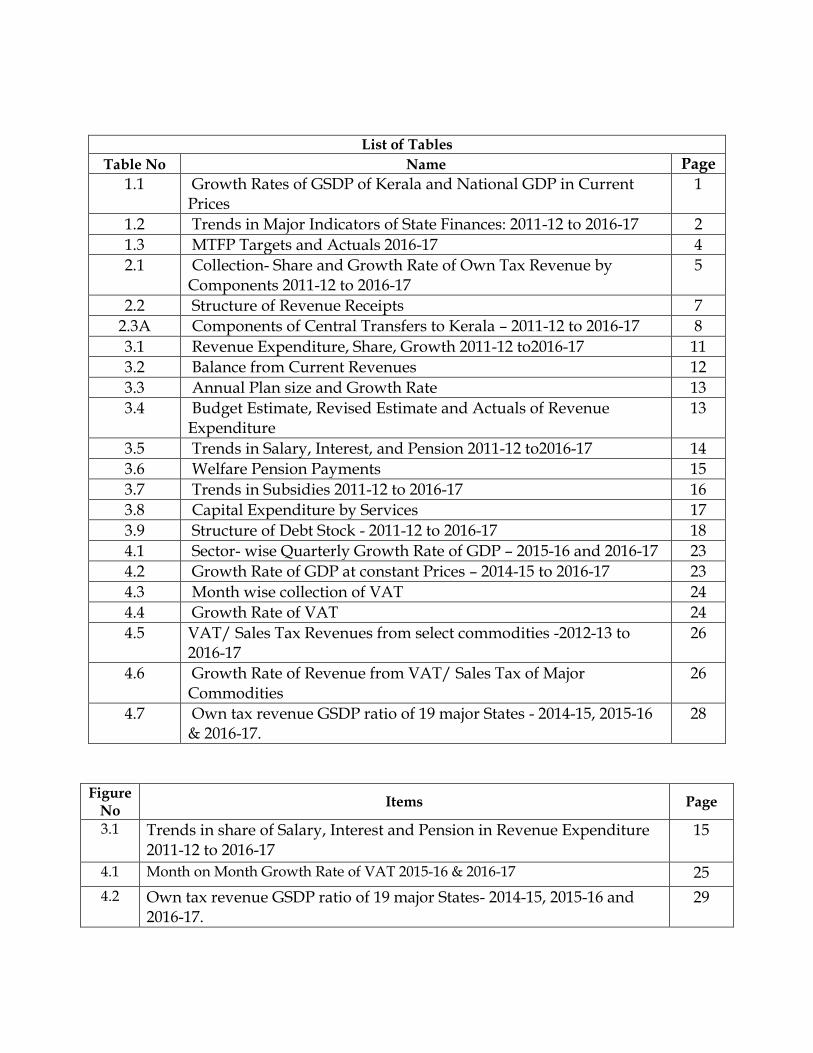
List of Tables
Table No Name Page
1.1 Growth Rates of GSDP of Kerala and National GDP in Current Prices
1
1.2 Trends in Major Indicators of State Finances: 2011-12 to 2016-17 2
1.3 MTFP Targets and Actuals 2016-17 4
2.1 Collection- Share and Growth Rate of Own Tax Revenue by Components 2011-12 to 2016-17
5
2.2 Structure of Revenue Receipts 7
2.3A Components of Central Transfers to Kerala – 2011-12 to 2016-17 8
3.1 Revenue Expenditure, Share, Growth 2011-12 to2016-17 11
3.2 Balance from Current Revenues 12
3.3 Annual Plan size and Growth Rate 13
3.4 Budget Estimate, Revised Estimate and Actuals of Revenue Expenditure
13
3.5 Trends in Salary, Interest, and Pension 2011-12 to2016-17 14
3.6 Welfare Pension Payments 15
3.7 Trends in Subsidies 2011-12 to 2016-17 16
3.8 Capital Expenditure by Services 17
3.9 Structure of Debt Stock - 2011-12 to 2016-17 18
4.1 Sector- wise Quarterly Growth Rate of GDP – 2015-16 and 2016-17 23
4.2 Growth Rate of GDP at constant Prices – 2014-15 to 2016-17 23
4.3 Month wise collection of VAT 24
4.4 Growth Rate of VAT 24
4.5 VAT/ Sales Tax Revenues from select commodities -2012-13 to 2016-17
26
4.6 Growth Rate of Revenue from VAT/ Sales Tax of Major Commodities
26
4.7 Own tax revenue GSDP ratio of 19 major States - 2014-15, 2015-16 & 2016-17.
28
Figure No
Items Page
3.1 Trends in share of Salary, Interest and Pension in Revenue Expenditure 2011-12 to 2016-17
15
4.1 Month on Month Growth Rate of VAT 2015-16 & 2016-17 25
4.2 Own tax revenue GSDP ratio of 19 major States- 2014-15, 2015-16 and 2016-17.
29

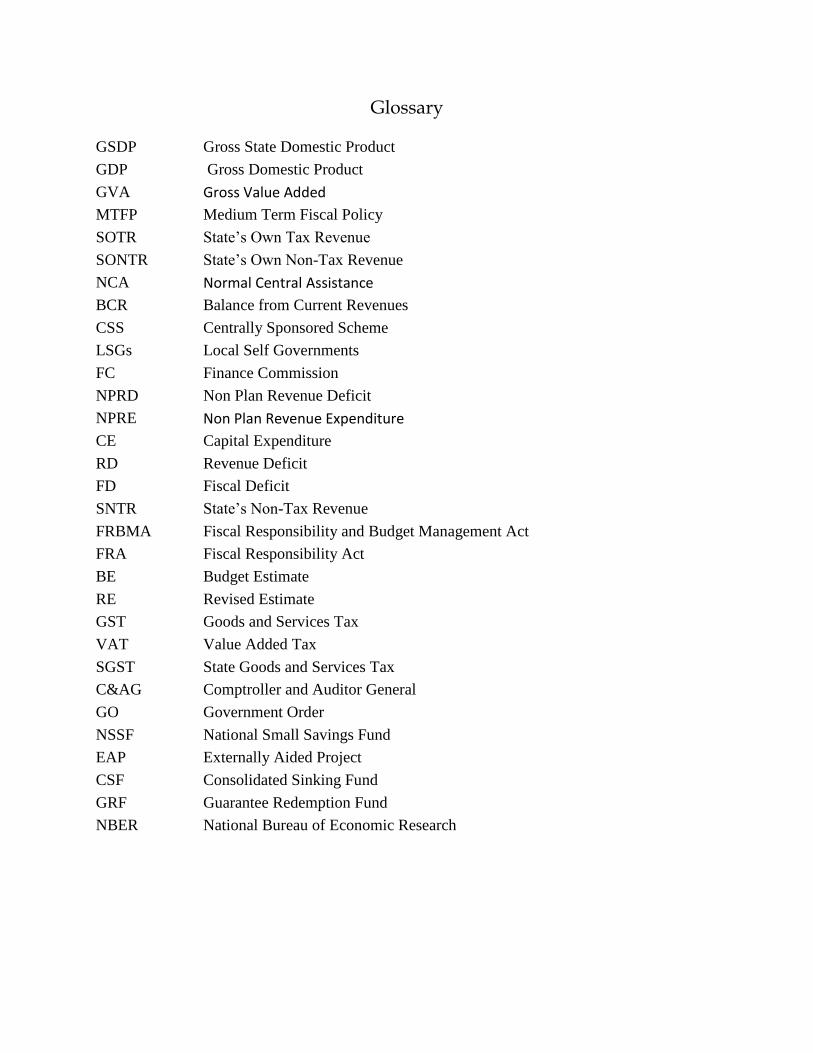
Glossary
GSDP Gross State Domestic Product
GDP Gross Domestic Product
GVA Gross Value Added
MTFP Medium Term Fiscal Policy
SOTR State’s Own Tax Revenue
SONTR State’s Own Non-Tax Revenue
NCA Normal Central Assistance
BCR Balance from Current Revenues
CSS Centrally Sponsored Scheme
LSGs Local Self Governments
FC Finance Commission
NPRD Non Plan Revenue Deficit
NPRE Non Plan Revenue Expenditure
CE Capital Expenditure
RD Revenue Deficit
FD Fiscal Deficit
SNTR State’s Non-Tax Revenue
FRBMA Fiscal Responsibility and Budget Management Act
FRA Fiscal Responsibility Act
BE Budget Estimate
RE Revised Estimate
GST Goods and Services Tax
VAT Value Added Tax
SGST State Goods and Services Tax
C&AG Comptroller and Auditor General
GO Government Order
NSSF National Small Savings Fund
EAP Externally Aided Project
CSF Consolidated Sinking Fund
GRF Guarantee Redemption Fund
NBER National Bureau of Economic Research


REPORT OF THE KERALA PUBLIC EXPENDITURE REVIEW COMMITTEE
1
Chapter 1
Overview of the State Economy and Finances
1.1 Indian economy is facing multiple challenges. Deceleration in Gross Domestic
Product (GDP) growth, lower investment GDP ratio, declining rate of savings and
mounting non-performing assets in the banking sector are some of the major challenges.
Demonetisation (withdrawal of Rs.500 and Rs.1000 from circulation on November
8,2016) has acted as a catalyst in this process. Introduction of Goods and Services Tax
(GST), which was expected to increase GDP and raise revenue buoyancy did not yield
the expected results. Besides, GST procedures have complicated the tax system in a way
that has hurt the operation of small and informal sector disproportionately. Kerala
economy naturally is not insulated from all these challenges. If we examine the recent
economic growth performance, Kerala’s growth rate has steadily declined on a year on
year basis. The growth rate of Gross State Domestic Product (GSDP) of Kerala at
current prices has been below the growth rate of national GDP from 2012-13. The gap
between the growth rates of GSDP and GDP have widened during 2015-16 and 2016-17
(Table 1.l).
Table 1.1 Growth Rates of GSDP of Kerala and National GDP in Current Prices (%)
Year Primary Secondary Tertiary GSVA(GVA) GSDP (GDP)
2012-13 3.8 10.22 17.42 13.38 13.26
(11.23) (11.1) (15.98) (13.5 (13.82)
2013-14 11.29 9.27 14.3 12.54 12.79
(13.32) (9.8) (13.94) (12.6) (12.92)
2014-15 14.17 6.53 10.46 9.95 10.22
(7.24) (8.8) (13.38) (10.8) (10.79)
2015-16 -5.52 5.1 10.09 6.61 8.59
(3.72) (7.7) (10.87) (8.5) (9.94)
2016-17 10.04 5.89 10.74 9.65 9.67
(7.4) (6.1) (7.5) (10.1) (10.8)
Source: Economic Survey, 2018, finmin.nic.in
Note: Figures in parentheses are all - India GDP growth rates
1.2 Overview of State Finances
An overview of State finances is presented in Table 1.2. The revenue to GSDP ratio
hovered around 12.3 per cent during 2015-16 and 2016-17. While the State’s Own Tax
Revenue (SOTR) to GSDP ratio dropped to 6.84 per cent. State’s Non- Tax Revenue

REPORT OF THE KERALA PUBLIC EXPENDITURE REVIEW COMMITTEE
2
(SNTR) remained stagnant during 2016-17. The central transfers were at around 4 per
cent of GSDP during this period.
State’s Revenue Deficit (RD) as a percentage of GSDP remained as high as 2.51 per cent
in 2016-17. The Fiscal Deficit (FD) and Primary Deficit (PD) were 4.29 per cent and 2.32
per cent of GSDP respectively in 2016-17. The outstanding debt to GSDP ratio for the
same year was 30.25 per cent. Increase in fiscal imbalance and deviations from the
targets set in Medium Term Fiscal Policy (MTFP) statements were significant (Table
1.3). The years 2017-18 (RE) and 2018-19 (BE) are expected to see a reduction in the FD
and RD to GSDP ratios although they will continue to remain above the Fiscal
Responsibility and Budget Management (FRBM) Act targets. Outstanding debt to
GSDP ratio is expected to increase to more than 31 per cent of GSDP in 2017-18 (RE) and
2018-19 (BE).
Table 1.2: Trends in Major Indicators of State Finances: 2011-12 to 2016-17
(Rs. crore)
Items 2011-12 2012-13 2013-14 2014-15 2015-16 2016-17
Revenue Receipts 38010 44137 49177 57950 69033 75612
% of GSDP 10.44 10.70 10.57 11.31 12.28 12.27
State Tax Revenue 25719 30077 31995 35233 38995 42176
% of GSDP 7.06 7.29 6.88 6.87 6.94 6.84 State Non-Tax Revenue (SNTR*) 2592 4199 5575 7284 8425 9700
SNTR as % of GSDP 0.71 1.02 1.20 1.42 1.50 1.57 Net receipts of Lotteries in SNTR 381 591 593 960 1149 1291
Central Govt. Transfers 9700 9862 11607 15434 21612 23735
% of GSDP 2.66 2.39 2.50 3.01 3.85 3.85
Capital Receipts 12284 15685 17050 18719 17965 26763
% of GSDP 3.37 3.80 3.67 3.65 3.20 4.34
Total Receipts 50295 59823 66227 76670 86998 102374
% of GSDP 13.82 14.51 14.24 14.96 15.48 16.61
Total Expenditure 50896 59228 66244 76744 87032 102383
% of GSDP 13.98 14.36 14.24 14.97 15.49 16.61
Revenue Expenditure 46045 53489 60486 71746 78689 91096
RE as % of GSDP 12.65 12.97 13.01 14.00 14.00 14.78 Expenditure on Lotteries in RE 902 2083 3203 4485 5123 5992

REPORT OF THE KERALA PUBLIC EXPENDITURE REVIEW COMMITTEE
3
Items 2011-12 2012-13 2013-14 2014-15 2015-16 2016-17
Capital Outlay 3853 4603 4294 4255 7500 10126
% of GSDP 1.06 1.12 0.92 0.83 1.33 1.64
Loan Disbursements 999 1136 1464 743 842 1160
% of GSDP 0.27 0.28 0.31 0.14 0.15 0.19
Revenue Deficit 8034 9351 11309 13796 9657 15485
% of GSDP 2.21 2.27 2.43 2.69 1.72 2.51
Fiscal Deficit 12815 15002 16944 18642 17818 26448
% of GSDP 3.52 3.64 3.64 3.64 3.17 4.29
Primary Deficit 6521 7798 8679 8872 6708 14332
% of GSDP 1.79 1.89 1.87 1.73 1.19 2.33
Outstanding Debt 89418 103561 119009 135440 157370 186453
% of GSDP 24.56 25.12 25.59 26.42 28.00 30.25
GSDP (Current Prices) 364048 412313 465041 512564 561993 616357 Source: Budget in Brief, GOK, Various issues, Finance Accounts, C&AG, various issues&mospi.nic.in
There has also been a decline in growth of central transfers in 2016-17 when compared
with 2014-15 and 2015-16. The apparent increase in transfers in 2014-15 was due to the
routing of plan assistance through the Consolidated Fund of the State instead of the
earlier practice under which central assistance for major Centrally Sponsored Schemes
(CSS) were directly given to the implementing agencies bypassing the State Budgets.
The increase in 2015-16 was due to the higher devolution of taxes to the States in the
award of the 14th Finance Commission (FC). The increase in central transfer in the year
2016-17 in absolute terms was Rs 2123 crore.
As regards revenue expenditure, the growth was 15.8 per cent in 2016-17 over that of
2015-16. This was mainly due to the impact of pay/pension revision and higher
devolution to Local Governments (LGs). Unlike the previous pay revision, when almost
all the arrears were either paid in cash or credited to the General Provident Fund (GPF)
in 2011-12 itself, the impact of the pay/pension revision consequent to the
recommendations of the 10 th Pay Commission would be felt up to 2018-19 as the
payment of arrears has been staggered. Another important item of Non-Plan Revenue
Expenditure (NPRE) is the devolution to LGs. After registering a sharp fall in 2015-16
with a negative growth rate of 39 per cent there has been a marked increase to 40 per
cent in 2016-17.
Regarding devolution to LGs, it needs to be noted that there has not been separate
classification for booking current (revenue) expenditure and capital expenditure. All the
devolved funds are classified as NPRE in the State budget. But in actual practice, LGs
are incurring expenditure not only for current expenditure but also for creating capital
REPORT OF THE KERALA PUBLIC EXPENDITURE REVIEW COMMITTEE
4
assets from the transferred funds. The devolution to LGs reflects in the RD and FD of
the State. While the impact on FD cannot be changed by calculating the expenditure
incurred for capital projects, the effective RD of the State can be arrived at as an
indicator, if capital expenditure incurred out of the grants to LGs is available. A suitable
methodology needs to be devised for having timely information on the capital
expenditure out of the grants to LGs. This would enable the government to have an
accurate figure of capital spending and Gross Fixed Capital formation in various sectors
across LGs in the State.
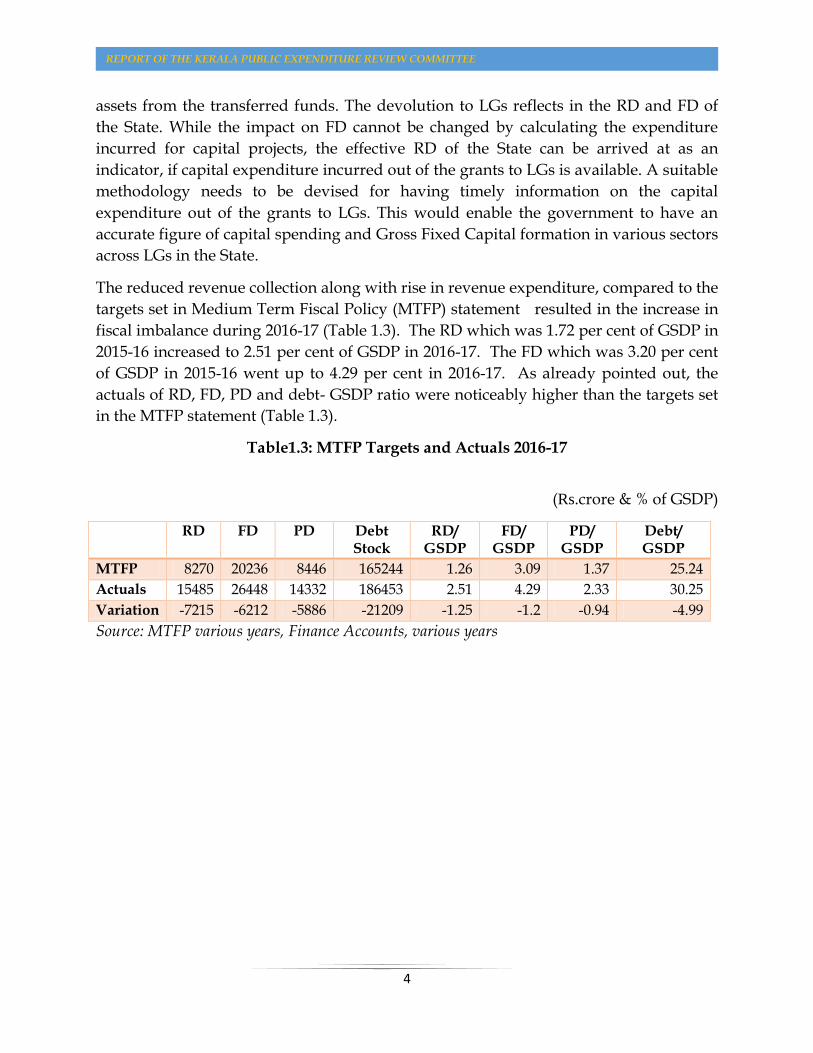
The reduced revenue collection along with rise in revenue expenditure, compared to the
targets set in Medium Term Fiscal Policy (MTFP) statement resulted in the increase in
fiscal imbalance during 2016-17 (Table 1.3). The RD which was 1.72 per cent of GSDP in
2015-16 increased to 2.51 per cent of GSDP in 2016-17. The FD which was 3.20 per cent
of GSDP in 2015-16 went up to 4.29 per cent in 2016-17. As already pointed out, the
actuals of RD, FD, PD and debt- GSDP ratio were noticeably higher than the targets set
in the MTFP statement (Table 1.3).
Table1.3: MTFP Targets and Actuals 2016-17
(Rs.crore & % of GSDP)
RD FD PD Debt Stock
RD/ GSDP
FD/ GSDP
PD/ GSDP
Debt/ GSDP
MTFP 8270 20236 8446 165244 1.26 3.09 1.37 25.24
Actuals 15485 26448 14332 186453 2.51 4.29 2.33 30.25
Variation -7215 -6212 -5886 -21209 -1.25 -1.2 -0.94 -4.99
Source: MTFP various years, Finance Accounts, various years
REPORT OF THE KERALA PUBLIC EXPENDITURE REVIEW COMMITTEE
5
Chapter 2
Review of Revenue Receipts
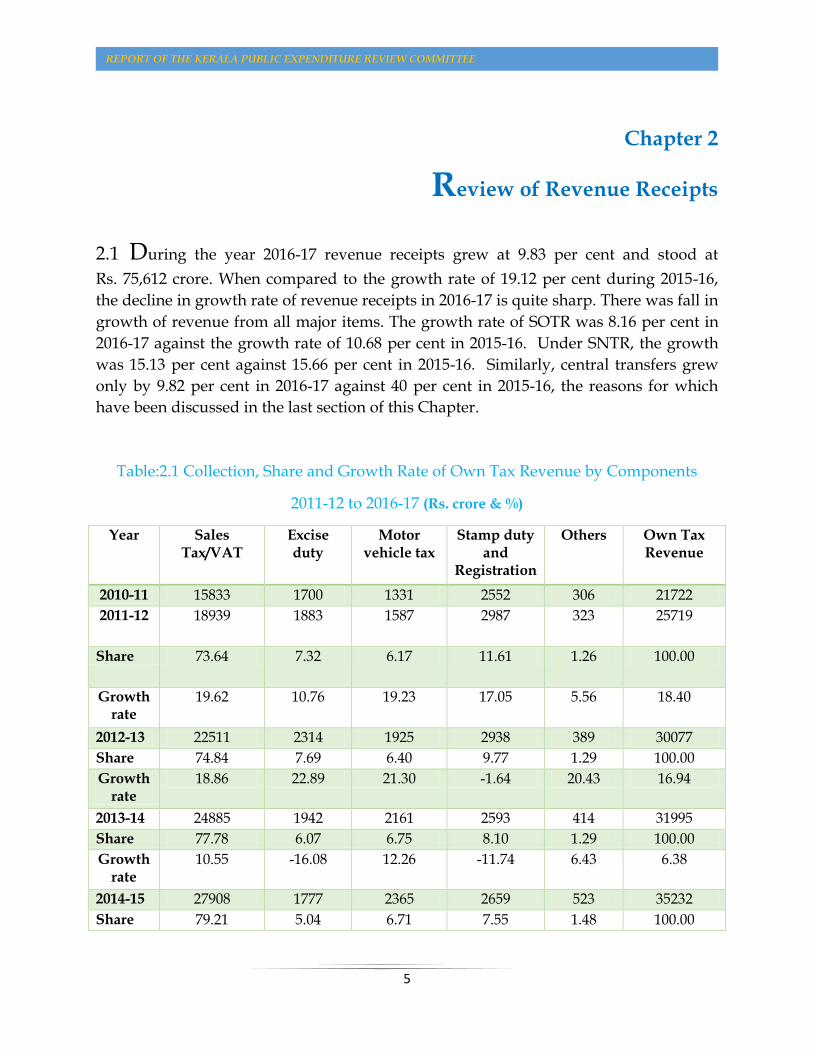
2.1 During the year 2016-17 revenue receipts grew at 9.83 per cent and stood at
Rs. 75,612 crore. When compared to the growth rate of 19.12 per cent during 2015-16,
the decline in growth rate of revenue receipts in 2016-17 is quite sharp. There was fall in
growth of revenue from all major items. The growth rate of SOTR was 8.16 per cent in
2016-17 against the growth rate of 10.68 per cent in 2015-16. Under SNTR, the growth
was 15.13 per cent against 15.66 per cent in 2015-16. Similarly, central transfers grew
only by 9.82 per cent in 2016-17 against 40 per cent in 2015-16, the reasons for which
have been discussed in the last section of this Chapter.
Table:2.1 Collection, Share and Growth Rate of Own Tax Revenue by Components
2011-12 to 2016-17 (Rs. crore & %)
Year Sales Tax/VAT
Excise duty
Motor vehicle tax
Stamp duty and
Registration
Others Own Tax Revenue
2010-11 15833 1700 1331 2552 306 21722
2011-12 18939 1883 1587 2987 323 25719
Share 73.64 7.32 6.17 11.61 1.26 100.00
Growth rate
19.62 10.76 19.23 17.05 5.56 18.40
2012-13 22511 2314 1925 2938 389 30077
Share 74.84 7.69 6.40 9.77 1.29 100.00
Growth rate
18.86 22.89 21.30 -1.64 20.43 16.94
2013-14 24885 1942 2161 2593 414 31995
Share 77.78 6.07 6.75 8.10 1.29 100.00
Growth rate
10.55 -16.08 12.26 -11.74 6.43 6.38
2014-15 27908 1777 2365 2659 523 35232
Share 79.21 5.04 6.71 7.55 1.48 100.00

REPORT OF THE KERALA PUBLIC EXPENDITURE REVIEW COMMITTEE
6
Year Sales Tax/VAT
Excise duty
Motor vehicle tax
Stamp duty and
Registration
Others Own Tax Revenue
Growth rate
12.15 -8.50 9.44 2.55 26.33 10.12
2015-16 30737 1964 2814 2878 602 38995
Share 78.82 5.04 7.22 7.38 1.54 100.00
Growth rate
10.14 10.52 18.99 8.24 15.11 10.68
2016-17 33453 2019 3107 3007 590 42176
Growth Rate
8.84 2.82 10.42 4.47 -2.03 8.16
Source: Finance Accounts, C& AG
2.2 Components of SOTR
As already explained in the previous two reports of this Committee, the VAT growth
rate declined from 2013-14 and remained subdued in subsequent years. The State
during the period 2011-12 to 2016-17 went for two upward revisions of VAT rates1. An
Additional Resource Mobilisation (ARM) of Rs.1000 crore was expected through this
revision in 2012-13. The growth in VAT collection went up sharply to 24.16 per cent in
2012-13. But what needs to be noted here is that targets set in Budget Estimate (BE)
could not be achieved and Additional Resource Mobilisation (ARM) anticipated also
did not materialise. Again in 2013-14, the highest slab of VAT rate was revised from 13.5
per cent to 14.5 per cent targeting an ARM of Rs. 650 crore. The shortfall in realisation
was to the order of 12.56 per cent when compared with the budget estimate. The growth
rate of the VAT revenue was 11.03 per cent. In 2014-15, the VAT growth rate declined
further to 8.08 per cent. In 2015-16 also the VAT growth rate remained lower at 10.45
per cent. It has to be taken note that the buoyancy in VAT was the lowest during
2012-13 to 2016-17, the period in which VAT rates were revised upward twice.
1 This was partly meant to compensate for the reduction of Central Sales Tax (CST) from 4 per cent to 2 per cent
during this period.

REPORT OF THE KERALA PUBLIC EXPENDITURE REVIEW COMMITTEE
7
In 2016-17, much of the decline in the growth rate of major components of SOTR could
be attributed to the impact of demonetisation that was implemented on November 8,
2016. The VAT collection in Kerala was recovering in the month of September 2016. But
from December 2016, the VAT collection took a hit, the reasons of which have been
elaborately discussed in the Chapter 4. The growth in tax collection suffered a setback
due to demonetisation and the own tax-GSDP ratio declined to 6.84 per cent in 2016-17.
The BE of SOTR was Rs.47614 crore. This was lowered to Rs.44548 crore in the Revised
Estimate (RE) and as per actuals this came down further to Rs.42176 crore. The actuals
as against BE was 88.58 per cent and against RE was 94. 68 per cent.
Table: 2.2 Structure of Revenue Receipts (Rs. crore &%)
Item 2011-12 2012-13 2013-14 2014-15 2015-16 2016-17
Revenue Receipts 38010 44137 49177 57950 69033 75612
SOTR 25719 30077 31995 35233 38995 42176
SNTR 2592 4199 5575 7284 8425 9700
Central Transfers 9700 9862 11607 15434 21612 23735
B. Share (%per annum)
SOTR 67.66 68.14 65.06 60.80 56.49 55.78
SONTR 6.82 9.51 11.33 12.57 12.21 12.83
Central Transfers 25.52 22.34 23.60 26.63 31.31 31.39
C. Growth Rates (%per annum)
Revenue Receipts 16.12 11.42 17.84 19.12 9.53
SOTR 16.94 6.38 10.12 10.68 8.16
SONTR 61.97 32.79 30.65 15.68 15.13
Central Transfers 1.68 17.69 32.98 40.02 9.82
Source: Finance Accounts, C&AG, Various issues
2.3 Trends in SNTR
The SNTR collection of the state too experienced a slowdown though not as sharp as
that of tax collection. Gross collection from lotteries is the major item of SNTR. The
SNTR-GSDP ratio which was 1.50 per cent in 2015-16 increased to 1.57 per cent during
2016-17.
2.4 Central Transfers
The central transfers as a share of total Revenue Receipts (RR) grew in the recent years.
especially since 2014-15. The reasons for this change in share have been elaborately
REPORT OF THE KERALA PUBLIC EXPENDITURE REVIEW COMMITTEE
8
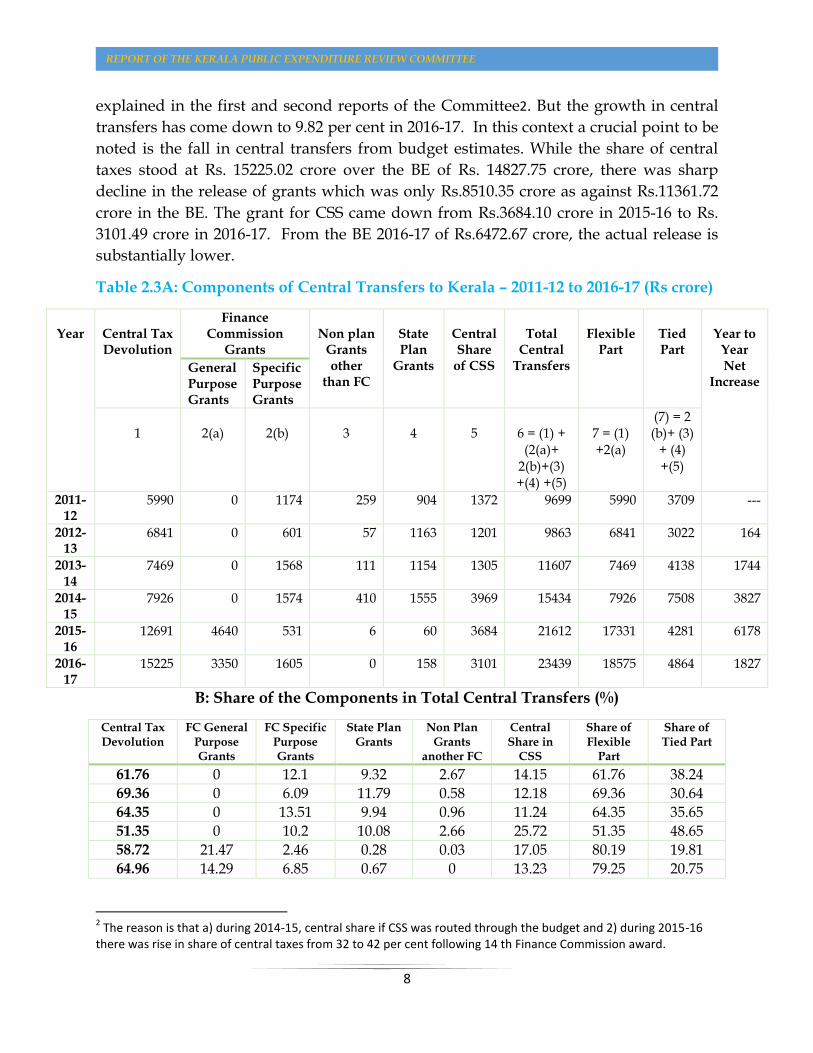
explained in the first and second reports of the Committee2. But the growth in central
transfers has come down to 9.82 per cent in 2016-17. In this context a crucial point to be
noted is the fall in central transfers from budget estimates. While the share of central
taxes stood at Rs. 15225.02 crore over the BE of Rs. 14827.75 crore, there was sharp
decline in the release of grants which was only Rs.8510.35 crore as against Rs.11361.72
crore in the BE. The grant for CSS came down from Rs.3684.10 crore in 2015-16 to Rs.
3101.49 crore in 2016-17. From the BE 2016-17 of Rs.6472.67 crore, the actual release is
substantially lower.
Table 2.3A: Components of Central Transfers to Kerala – 2011-12 to 2016-17 (Rs crore)
Year
Central Tax Devolution
Finance Commission
Grants
Non plan
Grants other
than FC
State Plan
Grants
Central Share
of CSS
Total
Central Transfers
Flexible
Part
Tied Part
Year to
Year Net
Increase General Purpose Grants
Specific Purpose Grants
1
2(a)
2(b)
3
4
5
6 = (1) +
(2(a)+ 2(b)+(3) +(4) +(5)
7 = (1) +2(a)
(7) = 2 (b)+ (3)
+ (4) +(5)
2011-12
5990 0 1174 259 904 1372 9699 5990 3709 ---
2012-13
6841 0 601 57 1163 1201 9863 6841 3022 164
2013-14
7469 0 1568 111 1154 1305 11607 7469 4138 1744
2014-15
7926 0 1574 410 1555 3969 15434 7926 7508 3827
2015-16
12691 4640 531 6 60 3684 21612 17331 4281 6178
2016-17
15225 3350 1605 0 158 3101 23439 18575 4864 1827
B: Share of the Components in Total Central Transfers (%)
Central Tax Devolution
FC General Purpose Grants
FC Specific Purpose Grants
State Plan Grants
Non Plan Grants
another FC
Central Share in
CSS
Share of Flexible
Part
Share of Tied Part
61.76 0 12.1 9.32 2.67 14.15 61.76 38.24
69.36 0 6.09 11.79 0.58 12.18 69.36 30.64
64.35 0 13.51 9.94 0.96 11.24 64.35 35.65
51.35 0 10.2 10.08 2.66 25.72 51.35 48.65
58.72 21.47 2.46 0.28 0.03 17.05 80.19 19.81
64.96 14.29 6.85 0.67 0 13.23 79.25 20.75
2 The reason is that a) during 2014-15, central share if CSS was routed through the budget and 2) during 2015-16
there was rise in share of central taxes from 32 to 42 per cent following 14 th Finance Commission award.
REPORT OF THE KERALA PUBLIC EXPENDITURE REVIEW COMMITTEE
9
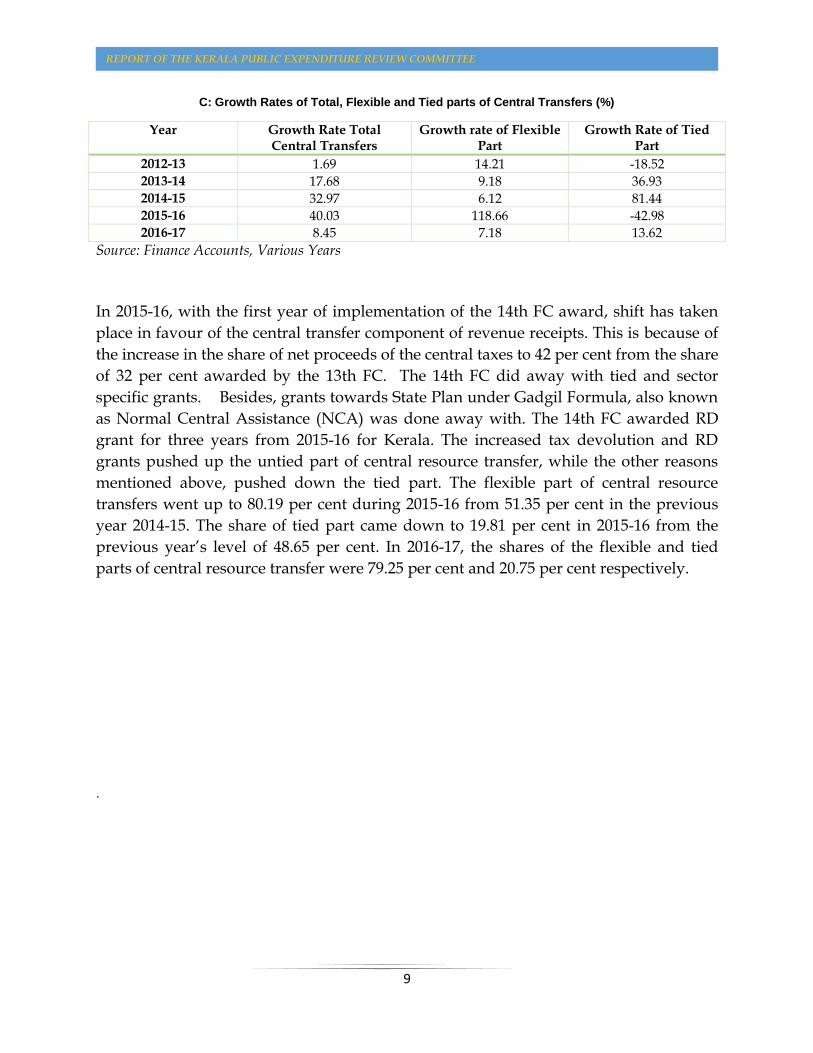
C: Growth Rates of Total, Flexible and Tied parts of Central Transfers (%)
Year Growth Rate Total Central Transfers
Growth rate of Flexible Part
Growth Rate of Tied Part
2012-13 1.69 14.21 -18.52
2013-14 17.68 9.18 36.93
2014-15 32.97 6.12 81.44
2015-16 40.03 118.66 -42.98
2016-17 8.45 7.18 13.62
Source: Finance Accounts, Various Years
In 2015-16, with the first year of implementation of the 14th FC award, shift has taken
place in favour of the central transfer component of revenue receipts. This is because of
the increase in the share of net proceeds of the central taxes to 42 per cent from the share
of 32 per cent awarded by the 13th FC. The 14th FC did away with tied and sector
specific grants. Besides, grants towards State Plan under Gadgil Formula, also known
as Normal Central Assistance (NCA) was done away with. The 14th FC awarded RD
grant for three years from 2015-16 for Kerala. The increased tax devolution and RD
grants pushed up the untied part of central resource transfer, while the other reasons
mentioned above, pushed down the tied part. The flexible part of central resource
transfers went up to 80.19 per cent during 2015-16 from 51.35 per cent in the previous
year 2014-15. The share of tied part came down to 19.81 per cent in 2015-16 from the
previous year’s level of 48.65 per cent. In 2016-17, the shares of the flexible and tied
parts of central resource transfer were 79.25 per cent and 20.75 per cent respectively.
.
REPORT OF THE KERALA PUBLIC EXPENDITURE REVIEW COMMITTEE
10
Chapter 3
Review of Revenue and Capital Expenditure
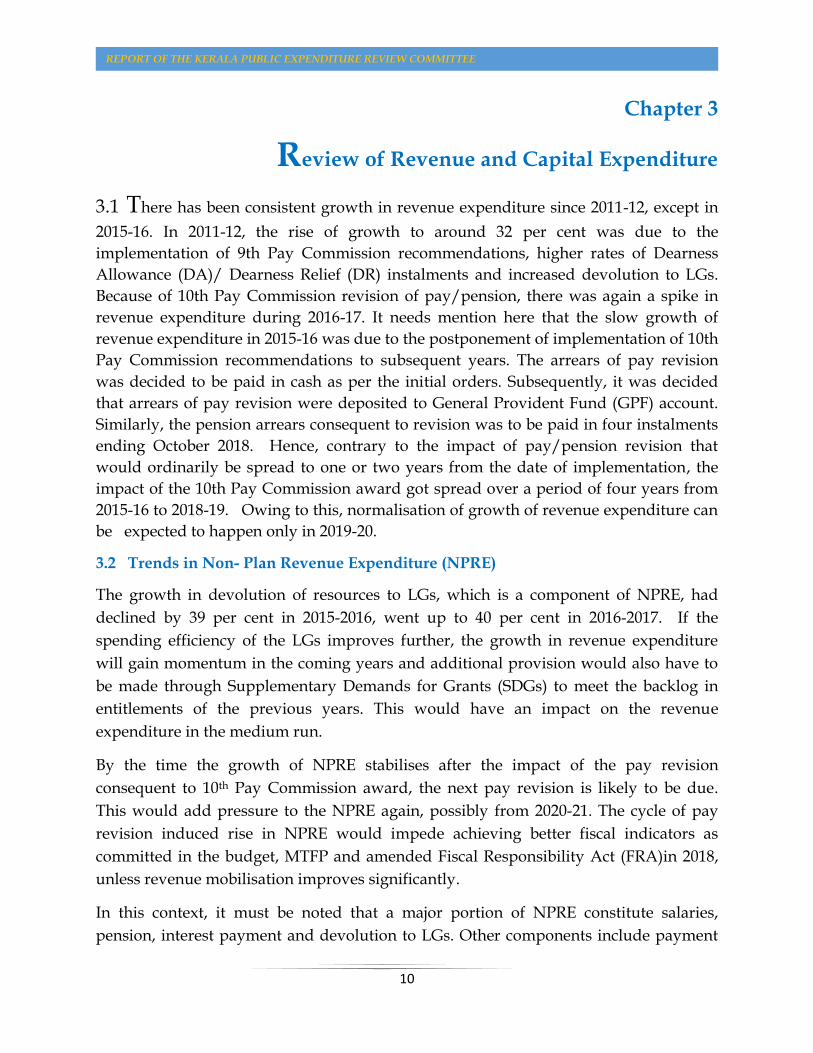
3.1 There has been consistent growth in revenue expenditure since 2011-12, except in
2015-16. In 2011-12, the rise of growth to around 32 per cent was due to the
implementation of 9th Pay Commission recommendations, higher rates of Dearness
Allowance (DA)/ Dearness Relief (DR) instalments and increased devolution to LGs.
Because of 10th Pay Commission revision of pay/pension, there was again a spike in
revenue expenditure during 2016-17. It needs mention here that the slow growth of
revenue expenditure in 2015-16 was due to the postponement of implementation of 10th
Pay Commission recommendations to subsequent years. The arrears of pay revision
was decided to be paid in cash as per the initial orders. Subsequently, it was decided
that arrears of pay revision were deposited to General Provident Fund (GPF) account.
Similarly, the pension arrears consequent to revision was to be paid in four instalments
ending October 2018. Hence, contrary to the impact of pay/pension revision that
would ordinarily be spread to one or two years from the date of implementation, the
impact of the 10th Pay Commission award got spread over a period of four years from
2015-16 to 2018-19. Owing to this, normalisation of growth of revenue expenditure can
be expected to happen only in 2019-20.
3.2 Trends in Non- Plan Revenue Expenditure (NPRE)
The growth in devolution of resources to LGs, which is a component of NPRE, had
declined by 39 per cent in 2015-2016, went up to 40 per cent in 2016-2017. If the
spending efficiency of the LGs improves further, the growth in revenue expenditure
will gain momentum in the coming years and additional provision would also have to
be made through Supplementary Demands for Grants (SDGs) to meet the backlog in
entitlements of the previous years. This would have an impact on the revenue
expenditure in the medium run.
By the time the growth of NPRE stabilises after the impact of the pay revision
consequent to 10th Pay Commission award, the next pay revision is likely to be due.
This would add pressure to the NPRE again, possibly from 2020-21. The cycle of pay
revision induced rise in NPRE would impede achieving better fiscal indicators as
committed in the budget, MTFP and amended Fiscal Responsibility Act (FRA)in 2018,
unless revenue mobilisation improves significantly.
In this context, it must be noted that a major portion of NPRE constitute salaries,
pension, interest payment and devolution to LGs. Other components include payment

REPORT OF THE KERALA PUBLIC EXPENDITURE REVIEW COMMITTEE
11
of welfare pensions and subsidies. This implies that a substantial part of the NPRE is
committed in nature and is difficult to control. The fact that the share of salaries,
pension and interest could be maintained at a stable level of below 60 per cent of
revenue expenditure is a positive development though, care should be taken to see that
this share is systematically reduced to 52.87 per cent by 2020-21 as projected in MTFP
Statement, 2018. Feasible measures need to be taken to control the other items of NPRE
as well. For this, a department-wise analysis needs to be done and there is need to shift
to zero based budgeting instead of incremental allocations every financial year at least
for select sectors.
When trends in components of revenue expenditure are analysed, the share of General
services has stagnated and that of Social services has increased. The share of Economic
services has however declined. (Table 3.1). As regards, the growth rate, the grants-in-
aid to LGs has increased sharply from a negative growth during 2015-16 followed by
social sector. There is a decline in growth rate of expenditure in Economic Services
(Table 3.1).
Table 3.1: Revenue Expenditure, Share, Growth 2011-12 to2016-17( Rs crore)
Year General Social Economic Grants in aid Total
2011-12 20300.02 16223.86 6131.66 3389.08 46044.62
2012-13 22786.61 18877.49 7808.00 4016.22 53488.32
2013-14 26605.09 20979.88 7929.05 4971.47 60485.49
2014-15 31432.74 23718.12 10197.56 6398.00 71746.42
2015-16 36084.68 27603.29 11098.41 3903.08 78689.46
2016-17 41195.33 33764.72 10655.35 5481.00 91096.40
A. Share (%)
2011-12 44.09 35.24 13.32 7.36 100
2012-13 42.60 35.29 14.60 7.51 100
2013-14 43.99 34.69 13.11 8.22 100
2014-15 43.81 33.06 14.21 8.92 100
2015-16 45.86 35.08 14.10 4.96 100
2016-17 45.22 37.06 11.70 6.02 100
B. Growth (%)
2011-12 31.66 33.96 40.81 21.99 32.83
2012-13 12.25 16.36 27.34 18.50 16.17
2013-14 16.76 11.14 1.55 23.78 13.08
2014-15 18.15 13.05 28.61 28.69 18.62
2015-16 14.80 16.38 8.83 -39.00 9.68
2016-17 14.16 22.32 -3.99 40.43 15.77 Source: Finance Accounts C&AG, various years.

REPORT OF THE KERALA PUBLIC EXPENDITURE REVIEW COMMITTEE
12
3.3 Plan Revenue Expenditure
The plan revenue expenditure requires deeper examination in this context. The State is
continuing with the Five -Year Plan and the accounts are still classified as plan and non-
plan. Plan and non-plan distinction has been done away in the Union budget. The plan
resources are apportioned between revenue expenditure and capital expenditure and
allocated to departments. More than 70 per cent of the apportioned plan expenditure is
revenue in nature. This along with committed NPRE adds to pressure on the RD,
especially when revenue growth is constrained.
The Committee in this context examined whether the plan resources are being properly
estimated and whether there are fiscal challenges that are adversely affecting the State
finances due to the way the Plan is financed. As is known, BCR (Balance from Current
Revenues) determines whether current revenue resources are available for plan
financing. BCR is the difference between Revenue receipts excluding plan grants minus
NPRE. If the NPR account (BCR) is negative it would mean that this gap would be
filled in by other resources like borrowings even for meeting non-plan revenue
expenditure. This would result in borrowed funds being used for filling gap in the Non
Plan Revenue (NPR) account as well as for financing substantial revenue component of
the plan expenditure. If the NPR account is balanced, all the borrowing and liabilities
and other plan resources can be used entirely for plan expenditure. If the BCR is
positive, it would mean that the NPR account contributes to plan resources positively.
In the Kerala context. BCR has been consistently negative, implying that the borrowed
amounts are utilised for meeting revenue expenditure both plan and non-plan. The
BCR for the period from 2012-13 to 2016-17 is given in Table 3.2. Notwithstanding a
growing negative BCR, plan size has been growing in the State (Table 3.3).
Table 3.2: Balance from Current Revenues
(Rs crore)
2012-13 2013-14 2014-15 2015-16 2016-17
BCR -4701.5 -6915.8 -9037.19 -935.49 -5252.11 Source Finance Accounts C&AG, various Years
REPORT OF THE KERALA PUBLIC EXPENDITURE REVIEW COMMITTEE
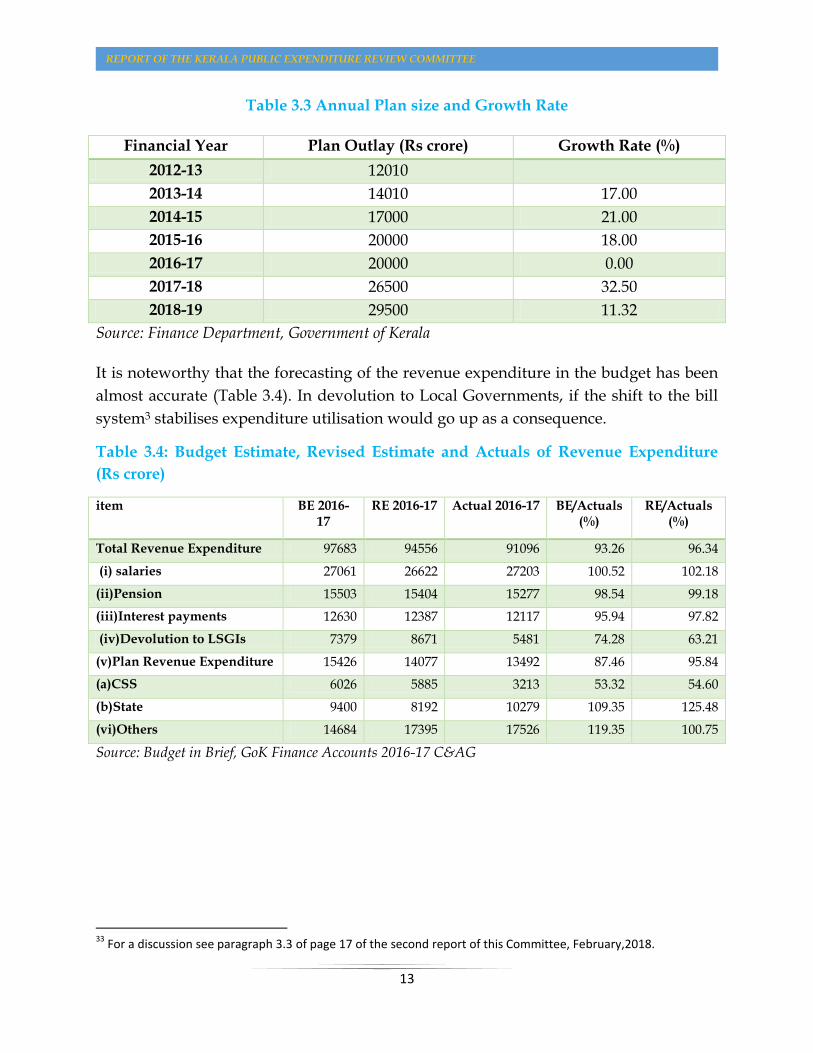
13
Table 3.3 Annual Plan size and Growth Rate
Financial Year Plan Outlay (Rs crore) Growth Rate (%)
2012-13 12010
2013-14 14010 17.00
2014-15 17000 21.00
2015-16 20000 18.00
2016-17 20000 0.00
2017-18 26500 32.50
2018-19 29500 11.32
Source: Finance Department, Government of Kerala
It is noteworthy that the forecasting of the revenue expenditure in the budget has been
almost accurate (Table 3.4). In devolution to Local Governments, if the shift to the bill
system3 stabilises expenditure utilisation would go up as a consequence.
Table 3.4: Budget Estimate, Revised Estimate and Actuals of Revenue Expenditure
(Rs crore)
item BE 2016- 17
RE 2016-17 Actual 2016-17 BE/Actuals (%)
RE/Actuals (%)
Total Revenue Expenditure 97683 94556 91096 93.26 96.34
(i) salaries 27061 26622 27203 100.52 102.18
(ii)Pension 15503 15404 15277 98.54 99.18
(iii)Interest payments 12630 12387 12117 95.94 97.82
(iv)Devolution to LSGIs 7379 8671 5481 74.28 63.21
(v)Plan Revenue Expenditure 15426 14077 13492 87.46 95.84
(a)CSS 6026 5885 3213 53.32 54.60
(b)State 9400 8192 10279 109.35 125.48
(vi)Others 14684 17395 17526 119.35 100.75
Source: Budget in Brief, GoK Finance Accounts 2016-17 C&AG
33
For a discussion see paragraph 3.3 of page 17 of the second report of this Committee, February,2018.

REPORT OF THE KERALA PUBLIC EXPENDITURE REVIEW COMMITTEE
14
3.4 Trends in Committed Revenue Expenditure
The three major components of committed revenue expenditure of the State are salary,
interest and pension. Together, they comprised 59.93 per cent of revenue expenditure
during 2016-17, which is a decline of 0.59 percentage points from that of 2015-16 (Table.
3.5). The total share of salary, interest and pension during 2016-17 has remained below
the six-year average of 61.87 per cent. Salary component has increased marginally at
0.06 per cent from that of 2015-16, while the share of interest came down by 0.42 per
cent and that of pension went up by 0.07 per cent during 2016-17 when compared to
2015-16. On the whole, the trend in committed expenditure is of decline, when
measured as a percentage of revenue expenditure since 2011-12 (Table 3.5, Figure 3.1).
Table 3.5: Trends in Salary, Interest, and Pension 2011-12 to2016-17(Rs crore)
Year Salary Interest Pension Revenue Expenditure
2011-12 16029 6294 8700 46045
2012-13 17257 7205 8867 53489
2013-14 19280 8265 9971 60486
2014-15 21334 9770 11253 71746
2015-16 23450 11111 13063 78690
2016-17 27203 12117 15277 91096
Shares of Salary, Interest and Pensions to Revenue Expenditure
2011-12 34.81 13.67 18.89 67.38
2012-13 32.26 13.47 16.58 62.31
2013-14 31.88 13.66 16.48 62.02
2014-15 29.74 13.62 15.68 59.04
2015-16 29.80 14.12 16.60 60.52
2016-17 29.86 13.30 16.77 59.93
Average 31.39 13.64 16.84 61.87
Source: Finance Accounts, C&AG, Various issues

REPORT OF THE KERALA PUBLIC EXPENDITURE REVIEW COMMITTEE
15
Figure 3.1 Trends in share of Salary, Interest and Pension in Revenue Expenditure
2011-12 to 2016-17 (%)
3.5 Welfare Pensions
The State has been a forerunner in the payment of welfare pensions to the marginalised
sections of the society, who need social protection. The category wise details of welfare
pension payments are shown in the Table 3.6.
Table 3.6 Welfare Pension Payments
Items 2015-16 2016-17
Monthly rate (Rs)
Number of Beneficiaries
Amount (Rs crore)
Monthly rate (Rs)
Number of Beneficiaries
Amount (Rs crore)
Agriculture Labour Pension
600 4,90,829 484.98 1000 4,96,753 485.58
Old Age Pension
600/1500 1404043 1123.90 1000/1500 1538150 2147.09
Widow Pension
800 1111304 1214.69 1000 1144573 1366.40
Unmarried women above 50 years
800 70424 77.20 1000 72320 84.90
Disability Pension
800/1100 323931 364.08 1000/1100 332090 361.94
Total 3400531 3264.84 3583886 4445.91
Source: Finance Department, Government of Kerala
0.00
5.00
10.00
15.00
20.00
25.00
30.00
35.00
40.00
2011-12 2012-13 2013-14 2014-15 2015-16 2016-17
Salary Interest Pension
REPORT OF THE KERALA PUBLIC EXPENDITURE REVIEW COMMITTEE
16
From April 2016, the rate of welfare pensions was raised to Rs.1000 from Rs.600
representing an increase of 66.66 per cent. In addition to other major items of payments
like Salaries, Pension, Interest payment and devolution to LGs, commitment towards
welfare pension payments also has emerged as a major item of committed revenue
expenditure. This has added stress on the finances of the State. There is all likelihood
that welfare pension payments will assume larger proportions within a few years given
the fact that elderly population in the State is increasing and pension amounts would
also be enhanced. In addition, Government is also providing grants-in-aid to different
Welfare Fund Boards. This commitment is also increasing year after year. While social
welfare cannot be compromised, a holistic view of expenditure rationalisation is to be
taken, so that the State finances are not unduly strained.
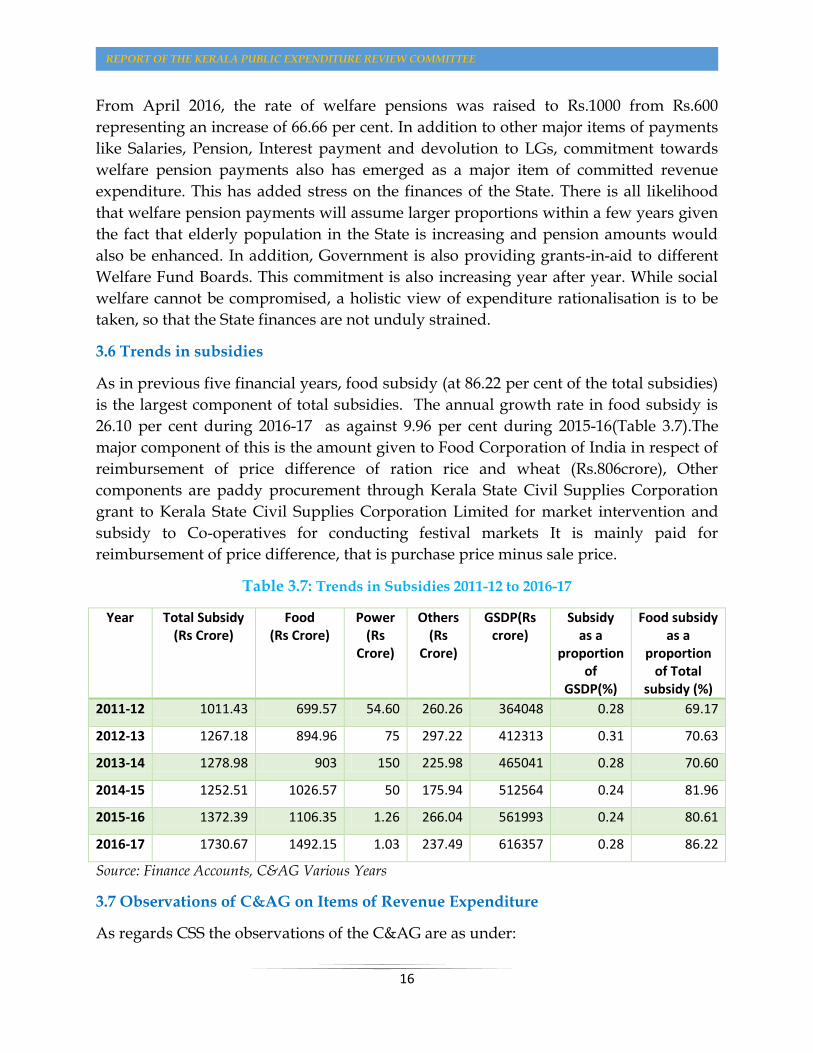
3.6 Trends in subsidies
As in previous five financial years, food subsidy (at 86.22 per cent of the total subsidies)
is the largest component of total subsidies. The annual growth rate in food subsidy is
26.10 per cent during 2016-17 as against 9.96 per cent during 2015-16(Table 3.7).The
major component of this is the amount given to Food Corporation of India in respect of
reimbursement of price difference of ration rice and wheat (Rs.806crore), Other
components are paddy procurement through Kerala State Civil Supplies Corporation
grant to Kerala State Civil Supplies Corporation Limited for market intervention and
subsidy to Co-operatives for conducting festival markets It is mainly paid for
reimbursement of price difference, that is purchase price minus sale price.
Table 3.7: Trends in Subsidies 2011-12 to 2016-17
Year Total Subsidy (Rs Crore)
Food (Rs Crore)
Power (Rs
Crore)
Others (Rs
Crore)
GSDP(Rs crore)
Subsidy as a
proportion of
GSDP(%)
Food subsidy as a
proportion of Total
subsidy (%)
2011-12 1011.43 699.57 54.60 260.26 364048 0.28 69.17
2012-13 1267.18 894.96 75 297.22 412313 0.31 70.63
2013-14 1278.98 903 150 225.98 465041 0.28 70.60
2014-15 1252.51 1026.57 50 175.94 512564 0.24 81.96
2015-16 1372.39 1106.35 1.26 266.04 561993 0.24 80.61
2016-17 1730.67 1492.15 1.03 237.49 616357 0.28 86.22
Source: Finance Accounts, C&AG Various Years
3.7 Observations of C&AG on Items of Revenue Expenditure
As regards CSS the observations of the C&AG are as under:

REPORT OF THE KERALA PUBLIC EXPENDITURE REVIEW COMMITTEE
17
“The Central share and State share in respect of a number of Central Plan and Centrally
Sponsored Plan Schemes, for which Government of India assistance has been received
during the year, have not been fully released to the implementing agencies by the State
Government during the year. The position in respect of a few major schemes is given in
the Annexure to Statement 15.” (Page no.66, Finance Accounts,2016-17, Volume I)
(xi). Direct transfer of Central Scheme Funds to Implementing Agencies in the State
(Funds routed outside State Budget)
“In spite of the Government of India’s decision to release all assistance to CSSs/ACA to
the State Government and not directly to implementing agencies, funds were
transferred directly to implementing agencies. As per the PFMS portal of the CGA, GOI
released Rs.3722.96 crore to the implementing agencies during 2016-17 as against
Rs.2511.70 crore in 2015-16 which is an increase of 48.22 per cent. Details are at
Appendix-VI.” (ibid.)
3.8 Capital Expenditure
The Capital Expenditure as in 2016-17 grew at 35.28 per cent. The Capital outlay and
Loan Disbursement together constituted 1.83 per cent of GSDP as against 1.48 per cent
in 2015-16. During 2016-17, the highest growth was recorded under Economic services
at 37.41 per cent, while the Social services grew at 20.03 per cent. There was a decline in
growth rate of General services by 17.83 per cent (Table 3.8). The highest share in capital
expenditure is that of Economic Services followed by Social and General services (Table
3.9).
Table 3.8: Capital Expenditure by Services (Rs. Crore)
Items 2012-13 2013-14 2014-15 2015-16 2016-17
General Service 147 148 135 257 211
Social Service 1105 1124 963 1123 1348
Economic Service 4334 4278 3691 6758 9286
Miscellaneous 154 208 209 206 442
Capital Expenditure 5739 5759 4998 8343 11286
Share (%)
General Service 3.03 3.05 2.78 5.29 4.35
Social Service 19.26 19.52 19.27 13.46 11.94
Economic Service 75.51 74.30 73.85 81.00 82.27
Miscellaneous 2.68 3.62 4.19 2.46 3.92
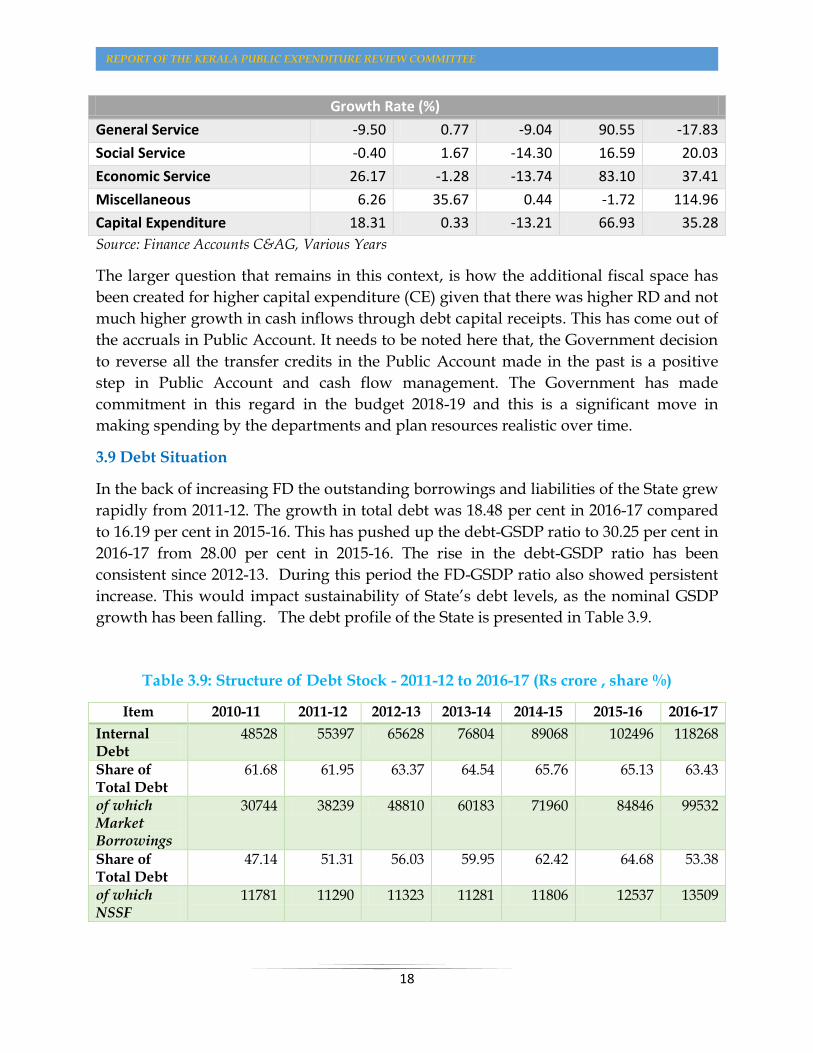
REPORT OF THE KERALA PUBLIC EXPENDITURE REVIEW COMMITTEE
18
Growth Rate (%)
General Service -9.50 0.77 -9.04 90.55 -17.83
Social Service -0.40 1.67 -14.30 16.59 20.03
Economic Service 26.17 -1.28 -13.74 83.10 37.41
Miscellaneous 6.26 35.67 0.44 -1.72 114.96
Capital Expenditure 18.31 0.33 -13.21 66.93 35.28
Source: Finance Accounts C&AG, Various Years
The larger question that remains in this context, is how the additional fiscal space has
been created for higher capital expenditure (CE) given that there was higher RD and not
much higher growth in cash inflows through debt capital receipts. This has come out of
the accruals in Public Account. It needs to be noted here that, the Government decision
to reverse all the transfer credits in the Public Account made in the past is a positive
step in Public Account and cash flow management. The Government has made
commitment in this regard in the budget 2018-19 and this is a significant move in
making spending by the departments and plan resources realistic over time.
3.9 Debt Situation
In the back of increasing FD the outstanding borrowings and liabilities of the State grew
rapidly from 2011-12. The growth in total debt was 18.48 per cent in 2016-17 compared
to 16.19 per cent in 2015-16. This has pushed up the debt-GSDP ratio to 30.25 per cent in
2016-17 from 28.00 per cent in 2015-16. The rise in the debt-GSDP ratio has been
consistent since 2012-13. During this period the FD-GSDP ratio also showed persistent
increase. This would impact sustainability of State’s debt levels, as the nominal GSDP
growth has been falling. The debt profile of the State is presented in Table 3.9.
Table 3.9: Structure of Debt Stock - 2011-12 to 2016-17 (Rs crore , share %)
Item 2010-11 2011-12 2012-13 2013-14 2014-15 2015-16 2016-17
Internal Debt
48528 55397 65628 76804 89068 102496 118268
Share of Total Debt
61.68 61.95 63.37 64.54 65.76 65.13 63.43
of which Market Borrowings
30744 38239 48810 60183 71960 84846 99532
Share of Total Debt
47.14 51.31 56.03 59.95 62.42 64.68 53.38
of which NSSF
11781 11290 11323 11281 11806 12537 13509

REPORT OF THE KERALA PUBLIC EXPENDITURE REVIEW COMMITTEE
19
Share of Total Debt
14.97 12.63 10.93 9.48 8.72 7.97 7.25
Loans from the Centre
6359 6396 6622 6662 7065 7235 7614
Share of Total Debt
8.08 7.15 6.39 5.60 5.22 4.60 4.08
PF Small savings
23786 27625 31311 35543 39307 47639 60571
Share of Total Debt
30.23 30.89 30.23 29.87 29.02 30.27 32.49
of which Treasury Deposits
10410 11632 12870 14701 15900 21515 30876
Share of Total Debt
13.23 13.01 12.43 12.35 11.74 13.67 16.56
Total Debt 78673 89418 103561 119009 135440 157370 186453
Source: Finance Accounts, C&AG, Various Years
From 2011-12 the FD-GSDP ratio has been above 3 per cent, which is the mandatory
limit set as per the FRA 2003. It requires special mention in this connection that the
share of internal debt, the largest component of debt came down to 63.43 per cent from
65.13 per cent in 2015-16. Market borrowings and NSSF are the two major items under
internal debt. Share of both market borrowings and NSSF came down to 53.38 per cent
and 7.25 per cent from 64.68 per cent and 7.97 per cent respectively. Loans from the
Centre is the next category of Public Debt. The share of this item is below 5 per cent for
the past 2 financial years. Loans for Externally Aided Projects ( EAPs) is the main item
under this head. There is not any sizeable variation from the previous year given the
low share. PF and small savings are other major items that are booked under Public
Account. In 2016-17 share of this went up to, to 32.49 per cent from 30.49 per cent in
2015-16. The increase in share of PF was because of the deposit of arrears of revision of
pay in GPF.
With regard to the allocations not made in the budget and targeted reduction in deficit
indicators the C&AG made the following observations.
(xiv). Disclosures under Kerala Fiscal Responsibility and Budget Management
(FRBM) Act, 2003
“The Kerala Fiscal Responsibility and Budget Management Act, 2003, read with the
Kerala Fiscal Responsibility and Budget Management (Amendment) Act 2011 based on
the ceilings fixed by the Thirteenth Finance Commission had mandated the State to
reduce the revenue deficit to zero, fiscal deficit to 3 per cent and State’s total debt
liabilities to 29.80 per cent of estimated GSDP within a period of four years from 1 April
2011. The 14th Finance Commission, while keeping status quo in revenue deficit and

REPORT OF THE KERALA PUBLIC EXPENDITURE REVIEW COMMITTEE
20
fiscal deficit targets, has recommended to bring down State’s total debt liabilities to
30.84 per cent of estimated GSDP by 2016-17.
Though the recommendations of the 14th Finance Commission had already been
approved by the Central Government, the State is yet to make subsequent amendments
in the FRBM Act 2003
C &AG further adds as under:
“Fiscal targets given in the Medium Team Fiscal Plan for Kerala 2016-17 to 2018-19 and
the achievements as per the accounts of 2016-17 are given below.
Sl.No. Target Achievement
1 Reduce Revenue Deficit to 1.98 per cent of GSDP
Revenue Deficit as per the accounts was Rs.15484.59 crore i.e.2.36 per cent of GSDP*
2 Reduce Fiscal Deficit to a level not exceeding 3.51 per cent of the GSDP.
Fiscal Deficit as per the accounts was Rs.26448.35 crore i.e.4.04 per cent of GSDP
3 Reduce the State’s Total Debt to 26.82 per cent of GSDP.
Total Debt as per the accounts was Rs.189768.55 crore i.e.28.96 per cent of GSDP
Table extracted from Finance Accounts, 2016-17, Volume I, Page 68.
Note*The GSDP was estimated at Rs.655205 crore as per the details from Economics and Statistics
Department.
(xv) Impact of incorrect/inappropriate accounting on Revenue/Fiscal deficit
Impact on Revenue / Fiscal Deficit of the State Government consequent to the budgeting and
booking under incorrect expenditure and revenue heads (details given in preceding paragraphs)
is given below:” ”.(,Finance Accounts, 2016-17, Volume No I, Page Nos. 67-68).
(Rs. in crore)
Paragraph No.
Item Impact on Revenue Deficit
Impact on Fiscal Deficit
Understatement Understatement 3 (vi) Non provision of interest on
interest bearing Reserve Funds and Deposits
6.39 6.39
3(vi) (a) Non contribution to Consolidated Sinking Fund
802.69 802.69
3(vi) (b) Non Contribution to Guarantee Redemption Fund
101.30 101.30
Total Understatement/Overstatement 910.38 910.38
Table extracted from Finance Accounts, 2016-17, Volume I, Page 68.

REPORT OF THE KERALA PUBLIC EXPENDITURE REVIEW COMMITTEE
21
Chapter 4
Impact of Demonetisation on State Finances
4.1 When additional Terms of Reference (ToR) was given to the 11th Finance
Commission, there was an observation in the report of the Commission, that the States’
revenues, expenditure and deficits/can be impacted by policies which are beyond their
control. The withdrawal of high denomination currency notes (Rs.500 and Rs.1000) on
November 8, 2016, (through Specified Bank Notes (Cessation of Liabilities) Ordinance
2016 replaced by Specified Bank Notes (Cessation of Liabilities) Act, 2017) was one such
measure, which falls in this category. States had no control over it, yet the measure was
likely to have a substantial impact on their finances. The focus of this chapter is on the
impact of withdrawal of high denomination bank notes from circulation, (commonly
called demonetisation) on Kerala State finances, especially on the revenue side. Already,
the State Planning Board has produced a comprehensive report on impact of
demonetisation on Kerala economy and the aspects covered therein are not repeated
here.
Demonetisation was propounded as a measure in which short run pain had to be
endured for long run gain. The short run pain included cash crunch leading to hardship
for businesses and livelihood activities, mainly in the non-digitised small and medium
sectors in the informal sector, that are heavily dependent on the cash economy. The
long run gains expected were substantial reduction if not elimination of tax evaded
economy (commonly called black economy), detecting counterfeit currency notes and
discouraging use of cash so that transactions become traceable. It would be worthwhile
to state these briefly before discussing the impact of demonetisation on Kerala’s State
finances.
There are no recent official estimates of tax evaded income in India. The Government of
India came out with a white paper on black economy in 2012, but there is no estimation
of tax evaded incomes in this. The National Institute of Public Finance and Policy
(NIPFP) in a study in 1985, made a sector wise analysis and estimated the size of tax
evaded incomes at 21 per cent of the Gross Domestic Product (GDP). A later cross-
country study by Schneider et al (2010) has estimated the size of shadow economy in
India at 22.4 per cent. Estimate in Centre for Development Studies (CDS) working paper
475 (2017) estimates the size of tax evaded incomes in India at 26.97 per cent of Gross
Value Added (GVA) at current basic prices. Barring an estimate by Kumar (2016) at 80
per cent and NIFM (2014) at 35 per cent of GDP respectively, other studies estimate the

REPORT OF THE KERALA PUBLIC EXPENDITURE REVIEW COMMITTEE
22
size of tax evaded incomes between one-fifth to one-fourth of the GDP. It is to be noted
that this proportion has remained unchanged for more than three decades implying
that its size has grown phenomenally as GDP has grown in absolute terms over this
period. Translated into rupee terms, the size of the tax evaded incomes in India is likely
to be about ₹ 25 lakh crore. The upper limit of tax evaded incomes that was expected to
be detected because of demonetisation was Rs. 3 lakh crore, which would be only 12 per
cent of the estimated tax evaded incomes in India. Even the detection of Rs. 3 lakh crore
is open to question going by the fact revealed in RBI Annual Report (2018) that about 99
per cent of the demonetised currency has come back to the banking system. If it is
argued that part of this is tax evaded income, its detection and finalisation would take a
long time. As regards counterfeit currency, no statistics other than what has been
detected is available. This is around Rs.500 crore. The currency- GDP ratio (at around 12
per cent) in India has not come down after demonetisation. In short, the gains are yet to
be visible, but the pain has already been endured.
4.2 Impact of Demonetisation on Macro Economy
The basic monetarist equation MV= PY implies that money supply multiples by its
velocity (the number of times currency changes hands) would be the nominal GDP. The
withdrawal of 86 per cent of the currency in circulation on November 8, 2016, resulted
in contraction of money supply. As there were restrictions on bank and ATM
withdrawals, the velocity of circulation was kept low. Natural consequence would be
reduction in nominal output.4 This has happened in the aftermath of demonetisation as
is evident from decline in the growth rate of almost all sectors in the fourth quarter of
2016-17 at all India level (Table 4.1). Due to this impact, the overall growth rate of GDP
for 2016-17 has been lower than that of the previous years, 2014-15 and 2015-16 (Table
4.2). But for the higher growth rate in agriculture and public administration and defence
in fourth quarter of agriculture in fourth quarter of 2016-17 when compared with that
of the fourth quarter of 2015-16 by 3.7 per cent and 10.3 per cent respectively (the
latter due to impact of seventh Pay Commission recommendations), the GDP growth
rate would have fallen much more than the 3.1 percentage points in the fourth quarter
of 2016-17.
4 If there are price increases due to disruption in supply chains, it can to an extent camouflage the fall in real
output. This did not happen in the Indian case.

REPORT OF THE KERALA PUBLIC EXPENDITURE REVIEW COMMITTEE
23
Table 4.1: Sector- wise Quarterly Growth Rate of GDP – 2015-16 and 2016-17
2015-16 Q1 Q2 Q3 Q4 2016-17
Q1 Q2 Q3 Q4
Agriculture, Forestry and Fishing
2.4 2.3 -2.1 1.5 2.5 4.1 6.9 5.2
Manufacturing 8.2 9.3 13.2 12.7 10.7 7.7 8.2 5.3
Construction 6.2 1.6 6.0 6.0 3.1 4.3 3.4 -3.7
Trade, hotels, transport An communication
10.3 8.3 10.1 12.8 8.9 7.7 8.3 6.5
Financial, Real Estate and Professional Services
10.1 13.0 10.5 9.0 9.4 7.0 3.3 2.2
Public Administration, Defence and other services
6.2 7.2 7.5 6.7 8.6 9.7 10.3 17.0
Gross Value Added (GVA at basic prices)
7.6 8.2 7.3 8.7 7.6 6.8 6.7 5.6
Source: Reserve Bank of India, Annual Report, 2016-17
Table 4.2: Growth Rate of GDP at constant Prices – 2014-15 to 2016-17
Sector 2014-15 2015-16 2016-17
Agriculture, Forestry and Fishing
-0.2 0.7 4.9
Manufacturing 8.3 10.8 7.9
Construction 4.7 5.0 1.7
Trade, Hotels, Transport and Communications
9.0 10.5 7.8
Financial, Real Estate and Professional Services
11.1 10.8 5.7
Public Administration, Defence and other services
8.1 6.9 11.3
Gross Value Added (GVA at basic prices)
7.2 7.9 6.6
Source: Reserve Bank of India, Annual Report, 2016-17

REPORT OF THE KERALA PUBLIC EXPENDITURE REVIEW COMMITTEE
24
4.3 Impact on State’s Own Tax Revenues
Substantial part of the State’s own tax revenue is from commodity taxes, that is, VAT
(GST since 1st July 2017) and sales tax on petroleum products and alcoholic liquor for
human consumption. Commodity taxes comprise around 78 per cent of own tax
revenues in Kerala. Demonetisation can impact trade by restrictions on purchasing
power or the customer due to cash shortage and cash shortage adversely affecting
supplies to traders. Both would result in slowdown of revenue from commodity taxes.
In Kerala’s case, demonetisation came during the period when there was slowdown in
growth rate of own tax revenues and its main component, revenue from commodity
taxes. From an annual growth rate of 18-20 per cent during 2006-07 to 2012-13, it fell to
around 10 per cent since 2013-14. To analyse the impact of demonetisation, let us
compare the month-to-month and quarter-to-quarter growth rate of VAT declining
during 2015-16 and 2016-17 with respect to immediately preceding years.
Table 4.3: Month wise collection of VAT (Rs. crore)
Month 2014-15 2015-16 2016-17
April 1367.57 1399.25 1564.81
May 1185.26 1255.61 1442.35
June 1228.59 1322.85 1429.23
July 1243.10 1335.93 1397.03
Aug 1165.94 1303.67 1437.32
Sept 1344.58 1503.92 1673.83
Octo 1269.66 1398.62 1640.74
Nov 1155.69 1209.64 1378.60
Dec 1181.48 1191.84 1296.21
Jan 1415.21 1470.21 1536.39
Feb 1214.08 1338.13 1414.28
Mar 1304.34 1499.48 1643.58
Total 15075.50 16229.15 17854.37
Source: State GST Department
Table 4.4: Growth Rate of VAT (%)
Month 2015-16 2016-17
April 2.32 11.83 May 5.94 14.87
June 7.67 8.04 July 7.47 4.57
Aug 11.81 10.25 Sept 11.85 11.30

REPORT OF THE KERALA PUBLIC EXPENDITURE REVIEW COMMITTEE
25
Month 2015-16 2016-17
Octo 10.16 17.31 Nov 4.67 13.97
Dec 0.88 8.76 Jan 3.89 4.50
Feb 10.22 5.69 March 15.00 9.61
Source: Table 4.3
Figure 4.1: Figure: Month-on- Month Growth Rate of VAT -2015-16 and 2016-17
Source: Table: 4.4
When we compare the growth rate of VAT for 2015-16 and 2016-17, the slowdown in
the fourth quarter (January to March) during 2016-17, is marked in comparison to that
during 2015-16 Table 4.4 and Figure 4.1). Though there is a slowdown even during
2015-16, there is a pickup in growth rate during February and March, which is absent
during 2016-17. In fact, during 2016-17, until October, the growth rate in VAT revenue
was substantially higher than that during 2015-16. Post-November, the slowdown is
discernible, and this is clearly a consequence of demonetisation, which put brakes on
the economy and especially in the trading sector. To analyse the impact of
demonetisation further let us also look at the trends in revenues of major commodities
and their growth rates (Tables 4.5 and 4.6)
0
5
10
15
20
April May June July Aug Sept Octo Nov Dec Jan Feb Mar
VAT gr 2015-16 VAT gr 2016-17
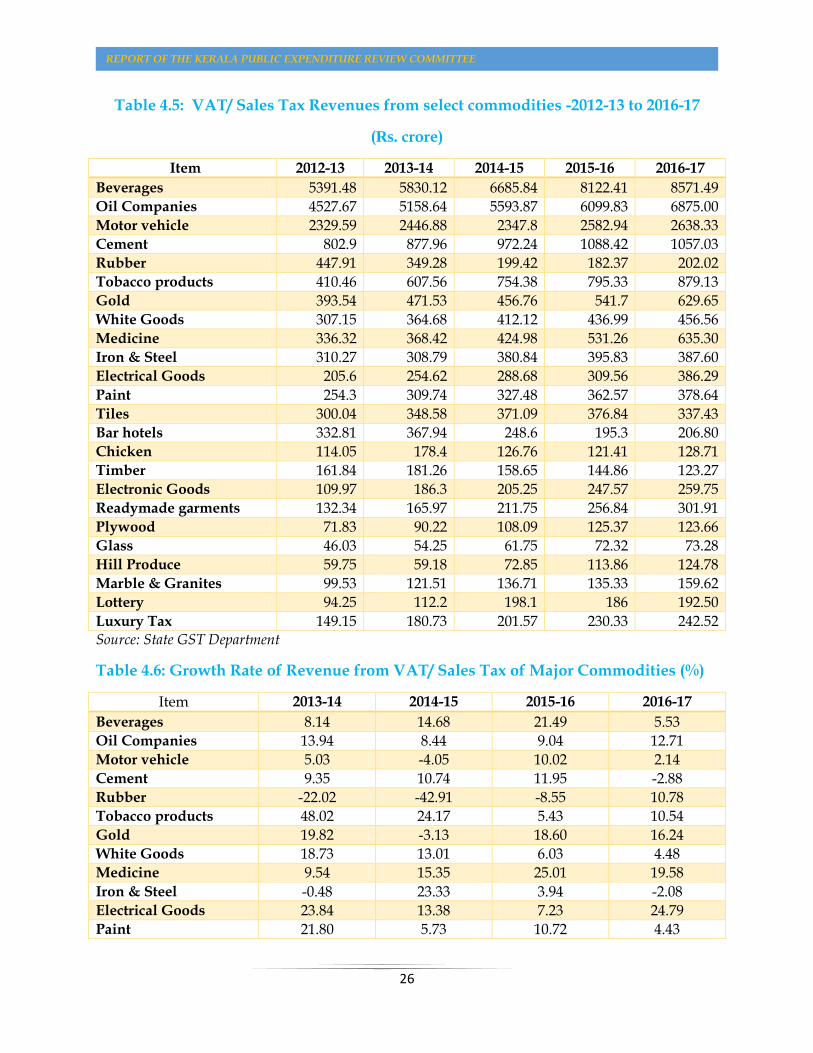
REPORT OF THE KERALA PUBLIC EXPENDITURE REVIEW COMMITTEE
26
Table 4.5: VAT/ Sales Tax Revenues from select commodities -2012-13 to 2016-17
(Rs. crore)
Item 2012-13 2013-14 2014-15 2015-16 2016-17
Beverages 5391.48 5830.12 6685.84 8122.41 8571.49
Oil Companies 4527.67 5158.64 5593.87 6099.83 6875.00
Motor vehicle 2329.59 2446.88 2347.8 2582.94 2638.33
Cement 802.9 877.96 972.24 1088.42 1057.03
Rubber 447.91 349.28 199.42 182.37 202.02
Tobacco products 410.46 607.56 754.38 795.33 879.13
Gold 393.54 471.53 456.76 541.7 629.65
White Goods 307.15 364.68 412.12 436.99 456.56
Medicine 336.32 368.42 424.98 531.26 635.30
Iron & Steel 310.27 308.79 380.84 395.83 387.60
Electrical Goods 205.6 254.62 288.68 309.56 386.29
Paint 254.3 309.74 327.48 362.57 378.64
Tiles 300.04 348.58 371.09 376.84 337.43
Bar hotels 332.81 367.94 248.6 195.3 206.80
Chicken 114.05 178.4 126.76 121.41 128.71
Timber 161.84 181.26 158.65 144.86 123.27
Electronic Goods 109.97 186.3 205.25 247.57 259.75
Readymade garments 132.34 165.97 211.75 256.84 301.91
Plywood 71.83 90.22 108.09 125.37 123.66
Glass 46.03 54.25 61.75 72.32 73.28
Hill Produce 59.75 59.18 72.85 113.86 124.78
Marble & Granites 99.53 121.51 136.71 135.33 159.62
Lottery 94.25 112.2 198.1 186 192.50
Luxury Tax 149.15 180.73 201.57 230.33 242.52 Source: State GST Department
Table 4.6: Growth Rate of Revenue from VAT/ Sales Tax of Major Commodities (%)
Item 2013-14 2014-15 2015-16 2016-17
Beverages 8.14 14.68 21.49 5.53
Oil Companies 13.94 8.44 9.04 12.71
Motor vehicle 5.03 -4.05 10.02 2.14
Cement 9.35 10.74 11.95 -2.88
Rubber -22.02 -42.91 -8.55 10.78
Tobacco products 48.02 24.17 5.43 10.54
Gold 19.82 -3.13 18.60 16.24
White Goods 18.73 13.01 6.03 4.48
Medicine 9.54 15.35 25.01 19.58
Iron & Steel -0.48 23.33 3.94 -2.08
Electrical Goods 23.84 13.38 7.23 24.79
Paint 21.80 5.73 10.72 4.43
REPORT OF THE KERALA PUBLIC EXPENDITURE REVIEW COMMITTEE
27
Tiles 16.18 6.46 1.55 -10.46
Bar hotels 10.56 -32.43 -21.44 5.89
Chicken 56.42 -28.95 -4.22 6.01
Timber 12.00 -12.47 -8.69 -14.91
Electronic Goods 69.41 10.17 20.62 4.92
Readymade garments 25.41 27.58 21.29 17.55
Plywood 25.60 19.81 15.99 -1.37
Glass 17.86 13.82 17.12 1.32
Hill Produce -0.95 23.10 56.29 9.59
Marble & Granites 22.08 12.51 -1.01 17.95
Lottery 19.05 76.56 -6.11 3.49
Luxury Tax 21.17 11.53 14.27 5.29 Source: Table 4.5
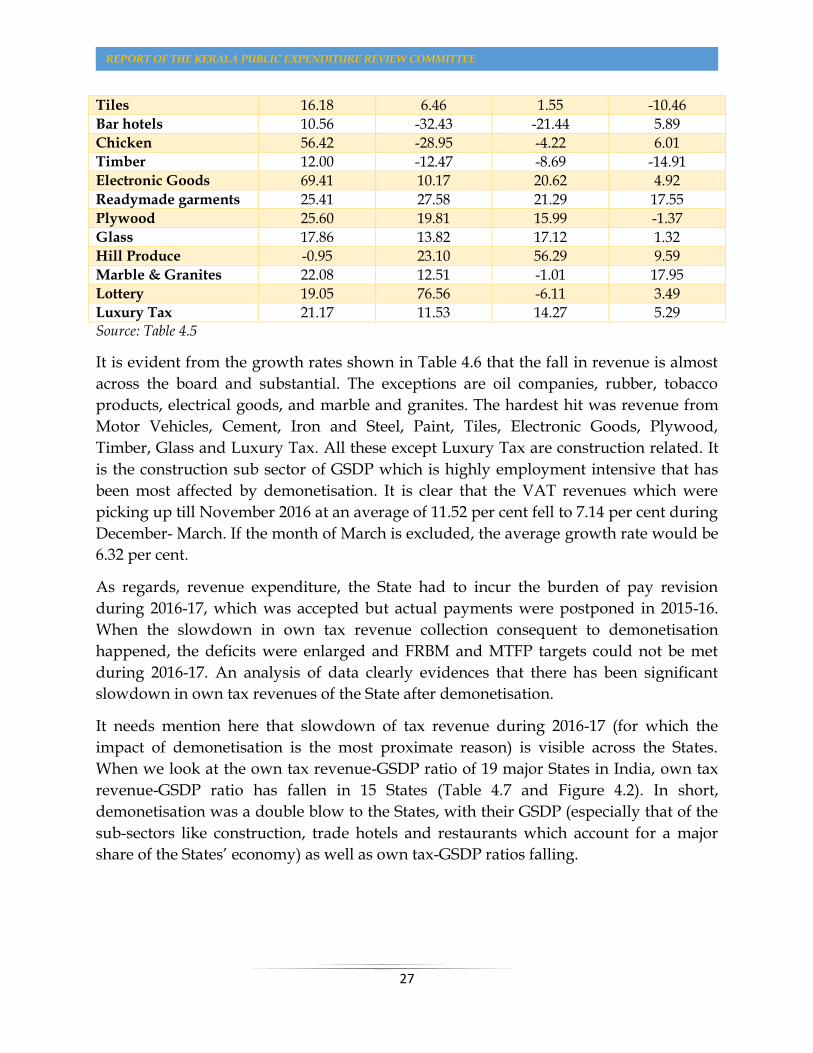
It is evident from the growth rates shown in Table 4.6 that the fall in revenue is almost
across the board and substantial. The exceptions are oil companies, rubber, tobacco
products, electrical goods, and marble and granites. The hardest hit was revenue from
Motor Vehicles, Cement, Iron and Steel, Paint, Tiles, Electronic Goods, Plywood,
Timber, Glass and Luxury Tax. All these except Luxury Tax are construction related. It
is the construction sub sector of GSDP which is highly employment intensive that has
been most affected by demonetisation. It is clear that the VAT revenues which were
picking up till November 2016 at an average of 11.52 per cent fell to 7.14 per cent during
December- March. If the month of March is excluded, the average growth rate would be
6.32 per cent.
As regards, revenue expenditure, the State had to incur the burden of pay revision
during 2016-17, which was accepted but actual payments were postponed in 2015-16.
When the slowdown in own tax revenue collection consequent to demonetisation
happened, the deficits were enlarged and FRBM and MTFP targets could not be met
during 2016-17. An analysis of data clearly evidences that there has been significant
slowdown in own tax revenues of the State after demonetisation.
It needs mention here that slowdown of tax revenue during 2016-17 (for which the
impact of demonetisation is the most proximate reason) is visible across the States.
When we look at the own tax revenue-GSDP ratio of 19 major States in India, own tax
revenue-GSDP ratio has fallen in 15 States (Table 4.7 and Figure 4.2). In short,
demonetisation was a double blow to the States, with their GSDP (especially that of the
sub-sectors like construction, trade hotels and restaurants which account for a major
share of the States’ economy) as well as own tax-GSDP ratios falling.

REPORT OF THE KERALA PUBLIC EXPENDITURE REVIEW COMMITTEE
28
Table 4.7: Own tax revenue GSDP ratio of 19 major States - 2014-15, 2015-16 &
2016-17.
States 2014-15 2015-16 2016-17
Andhra Pradesh 8.10 6.54 6.36
Bihar 6.05 6.67 5.57
Chhattisgarh 6.69 6.55 7.22
Goa 8.16 7.32 6.80
Gujarat 6.65 6.11 0.55
Haryana 6.32 6.37 6.22
Jharkhand 4.74 4.96 5.65
Karnataka 7.69 7.46 7.18
Kerala 6.87 6.99 6.78
Madhya Pradesh 7.62 7.58 6.83
Maharashtra 6.49 6.33 6.05
Odisha 6.31 6.81 6.06
Punjab 7.20 6.82 6.48
Rajasthan 6.28 6.25 5.84
Tamil Nadu 7.33 6.93 6.76
Telangana 5.79 7.04 7.34
Uttar Pradesh 7.33 7.24 6.88
Uttarakhand 5.17 5.34 5.68
West Bengal 5.49 5.33 5.17
Average 6.75 6.61 5.92
Source: Handbook of Statistics on Indian States RBI, 2017.

REPORT OF THE KERALA PUBLIC EXPENDITURE REVIEW COMMITTEE
29
Figure 4.2: Own tax revenue GSDP ratio of 19 major States- 2014-1, 2015-16 and
2016-17.
Source: Table 4.7
The own tax revenue collection of the State since 2013-14 remained moderate (Table
1.2). The commodity taxes which comprise 78 per cent of own tax revenue was
Rs.34038 crore during 2016-17 as against Rs.31152 crore during 2015-16. This implies a
growth rate of 9.27 per cent over 2015-16. The growth rates of VAT revenue and non-
VAT revenues were 10.01 per cent and 8.45 per cent respectively for 2016-17. For 2015-
16, the growth rates were 10.44 per cent and 11.61 per cent for VAT and non-VAT
revenues respectively.
A quarter-wise analysis of VAT revenue growth reveals that it slowed down from 13.36
per cent during third quarter (October -December) to 6.6 per cent during the fourth
quarter (January-March) of 2016-17 The decline in growth rate of VAT revenue in the
quarter immediately following demonetisation is 49 per cent (Table 4.4).
The VAT revenue which grew on an average at 11.22 per cent during the first three
quarters of 2016-17, slowed down to 6.6 per cent during the last quarter following
demonetisation. In other words, a gradual pick-up in growth rate of VAT revenue
rate during 2016-17 received a setback as a consequence of demonetisation.
0123456789
2014-15 2015-16 2016-17
REPORT OF THE KERALA PUBLIC EXPENDITURE REVIEW COMMITTEE
30
Chapter 5
Summary and Conclusions
5.1 The financial year 2016-17 has been one of shocks on revenue and increase in
expenditure. On the revenue side, the State had to endure the setback due to
demonetisation and its impact on the economy, especially in the retail trade and
informal sector. The expectations of a robust OTR growth rate at 20 per cent as assumed
in Medium Term Fiscal Policy (MTFP) Statement were belied and it continued to be
below 10 per cent. On the expenditure side, the growth rate of revenue expenditure rose
to 15.77 per cent from 9.68 per cent in 2015-16. This was due to the impact of the
implementation of the 10th State Pay Commission award, which was announced but not
implemented in 2015-16. Together, these led to widening of RD and FD to 2.51 per cent
and 4.29 per cent of GSDP during 2016-17. In other words, substantial part, that is, 58.5
per cent of the FD comprised RD, leaving only 42.5 per cent of FD for capital
expenditure.
5.2 As regards the economy of the State, the GSDP at current prices grew at 9.67 per
cent in 2016-17, which was lower than the growth rate of all-India GDP, which was 10.8
per cent. In 2016-17, much of the decline in the growth rate of major components of
SOTR could be attributed to the impact of demonetisation on the economic activities.
The VAT collection which was recovering after initial sluggishness in the beginning of
2016-17 could somewhat recover from the month of September 2016 and the tempo was
sustained up to November 2016. But from December the VAT collection took a hit, the
reasons of which have been elaborately discussed in the Chapter 4. The growth in tax
collection suffered a setback due to demonetisation and the own tax/GSDP ratio
declined to 6.84 per cent in 2016-17.
5.3 As regards trends in components of revenue expenditure, the share of General
Services has stagnated and that of social services increased. The share of economic
services has however declined. As regards, the growth rate, the grants-in-aid to LGs
has increased sharply by 40 per cent from a negative growth 39 per cent during 2015-16.
5.4 With more than half of the non-plan revenue being committed, the plan expenditure
faces the cut whenever there is a liquidity problem. The report emphasises on having
realistic expenditure levels including plan size. Identifying the appropriate quantum of
plan resources is imperative for deciding the right plan size in a year. Cautious and a
realistic approach is needed to arrive at the appropriate size of plan resources. Our
financial management however leaves much scope for overestimation of plan resources.

REPORT OF THE KERALA PUBLIC EXPENDITURE REVIEW COMMITTEE
31
This overestimated plan size leads to fund crunch, poor debt and liquidity management
and eventually impedes the effective implementation of plan projects.
5.5 The Balance in Current Revenue (BCR) was Rs.(-) 5252 crore during 2016-17. A
growing negative BCR and an increasing plan size are not compatible with the fiscal
consolidation efforts. It is suggested that the non-committed items in the non-plan
expenditure should be allotted through zero based budgeting instead of incremental
allocations at least to start within a few sectors. The methodology of estimating plan
resources needs to consider the overall resource envelope.
5.6 The Capital Expenditure (Capital Outlay+ Loan Disbursements) grew at 35.28 per
cent in 2016-17, which was 1.83 per cent of GSDP as against 1.48 per cent in 2015-16 The
growth rate under capital outlay was 35 per cent over that of 2015-16 and under loan
disbursement it was 37.76 per cent. It is important to note that the capital expenditure in
the budget is underestimated because it does not include that undertaken by the local
governments out of the grants given by the State Government. The capital expenditure
incurred through Special Purpose Vehicles like Kerala Infrastructure Investment Fund
Board (KIIFB) is also not reflected in the capital expenditure shown in the budget.
5.7 Though the components of the debt stock show a movement towards market
borrowings, which has a lower interest burden, the debt-GSDP ratio of the State is
around 31 per cent of GSDP, which is higher than the targets mentioned in MTFP. This
debt ratio is significantly higher than the all State average debt to GSDP ratio of 23.8 per
cent for the year 2016-17.
5.8 The impact of demonetisation has been discussed in detail in Chapter 4. The VAT
revenues which were picking up till November 2016 at an average growth rate of 11.52
per cent fell to 7.14 per cent during December 2016- March 2017 (the quarter following
demonetisation). If the month of March,2017, is excluded, the average growth rate
would be 6.32 per cent. As discussed in the Chapter 2, the OTR-GSDP ratio of 15 out of
19 major States of India had fallen during 2016-17, the year in which demonetisation
was implemented
5.9 To summarise, 2016-17, was a year in which there were unusual problems both on
revenue and expenditure side. Consequently, there were slippages in deficit targets as
well. The State budget, 2018-19 has made a firm commitment to fiscal consolidation, but
the adverse impact of heavy floods of 2018 on the State economy would have
substantial impact on State finances, which needs to be factored in while drawing a
fiscal consolidation map for the State.
*****
![AEZ Kerala [Final Report]](https://static.fdocuments.in/doc/165x107/585a36381a28ab6e32914127/aez-kerala-final-report.jpg)