REPORT OF THE ICES/NAFO WORKSHOP ON GREENLAND HALIBUT AGE ... fileDemersal Fish Committee REPORT OF...
60
Demersal Fish Committee REPORT OF THE ICES/NAFO WORKSHOP ON GREENLAND HALIBUT AGE DETERMINATION Reykjavik, Iceland 26 - 29 November 1996 This report is not to be quoted without prior consultation with the General Secretary. The document is a report of an expert group under the auspices of the International Council for the Exploration of the Sea and does not necessarily re present the views of the Council. International Council for the Exploration of the Sea Conseil International pour l'Exploration de la Mer Palægade 2-4 DK-1261 Copenhagen K Denmark
Transcript of REPORT OF THE ICES/NAFO WORKSHOP ON GREENLAND HALIBUT AGE ... fileDemersal Fish Committee REPORT OF...

Demersal Fish Committee
REPORT OF THE
ICES/NAFO WORKSHOP ON GREENLAND HALIBUT AGE DETERMINATION
Reykjavik, Iceland
26 - 29 November 1996
This report is not to be quoted without prior consultation with the General Secretary. The document is a report of an ex pert gro up under the auspices of the International Council for the Exploration of the Sea and does not necessarily re present the views of the Council.
International Council for the Exploration of the Sea
Conseil International pour l'Exploration de la Mer
Palægade 2-4 DK-1261 Copenhagen K Denmark


TABLE OF CONTENTS
Section P age
l INTRODUCTION ............................................................................................................................................. l 1.1 Participants ............................................................................................................................................... l 1.2 Terms of reference .................................................................................................................................... l 1.3 Importance of Age Determination ............................................................................................................ l 1.4 General Biology ........................................................................................................................................ 2
1.4.1 Distribution .................................................................................................................................... 2 1.4.2 Spawning ....................................................................................................................................... 2 1.4.3 Maturity ........................................................................................................................................ 2 1.4.4 Age and Growth ............................................................................................................................. 3 1.4.5 Mortality ........................................................................................................................................ 3
2 AGE VALIDATION ......................................................................................................................................... 3
3 REVIEW OF THE EXCHANGE PROGRAM PRIOR TO THE WORKSHOP ............................................... 4
4 AGE READING COMPARISONS DURING THE WORKSHOP ................................................................... 5 4.1 Experienced readers comparison .............................................................................................................. 5 4.2 Other comparisons .................................................................................................................................... 7
5 PROTOCOL FOR AGE DETERMINATION OF GREENLAND HALIBUT OTOLITHS ............................. 8 5.1 Standardized terminology ......................................................................................................................... 8 5.2 Sampling and Storing ................................................................................................................................ 9 5.3 Preparation Techniques ............................................................................................................................ 9 5 .4 Reading Procedure .................................................................................................................................. l O
5.4.1 Reflected versus transmitted light. ............................................................................................... 10 5.4.2 Counting axes and magnification ................................................................................................. lO 5.4.3 Determination of the first annulus ............................................................................................... lO 5.4.4 Edge (marginal) growth ............................................................................................................... lO
6 FUTURE EXCHANGES ................................................................................................................................. l O
7 RECOMMENDATIONS ................................................................................................................................. 11
8 REFERENCES ................................................................................................................................................ 12
Tables 2.1- 5.3 ...................................................................................................................................................... 14
Figures 2.1 - 5.1 ..................................................................................................................................................... 22
APPENDIX l - Bibliography ................................................................................................................................ 37
APPENDIX 2 - Parti ei pants Addresses ................................................................................................................. 42
APPENDIX 3- Pairwise comparison plots ........................................................................................................... 44
APPENDIX 4 - Raw data from the comparative age reading experiment ............................................................. 51
E:\ACFM\WKGHAD\REPORT.DOC 07/02197

1 INTRODUCTION
1.1 Participants
Alpoim, Ricardo M.R. Andresson, Hordur Babaluk, John Bowering, W. Ray Bragadottir, Solrun Drevetnyak, Konstantin Godinho, M. Lourdes M. Greene, Brian Gretarsdottir, Ester Hjørleifsson, Einar Junquera, Susana Keast, Margaret Larsen, Per O. Morin, Bernard Møgster, Mons Nedreaas, Kjell H. Simonsen, Claus S. Sæverud, Anne
1.2 Terms of reference
Portugal Iceland Canada Canada (NAFO Chairman) lee land Rus sia Portugal Canada Iceland Iceland Spain Canada Greenland Canada Norway Norway (ICES Chairman) Green land Norway
In the 83rd Statutory Meeting of ICES in 1995 it was decided that:
2:37 A Joint ICES/NAFO Workshop on Greenland halibut age reading (Chairmen: K. Nedreaas, Norway, and W.R. Bowering, Canada) will meet in Reykjavik, Iceland from 26-29 November 1996 to:
a) intercalibrate the age reading and age determination methodology of Greenland halibut and describe a protocol for handling Greenland halibut otoliths;
b) evaluate research from comparative age determinations and evaluate results using the methods described by the Working Group on Sampling Strategies for Age and Maturity;
c) establish a protocol for the age determination of otoliths using diagrams and photographs to illustrate age reading criteria;
d) establish a Greenland halibut otolith exchange programme on a regular basis between laboratories in vol ved;
e) in the light of the Workshop results, identify new research and action needed to improve the consistency of age reading.»
1.3 lmportance of Age Determination
Most mathematical models used in modem fish stock assessment for the purpose of providing scientific ad vice to fisheries managers are age based models. Therefore, any errors in age determinations of fish samples introduced to these models will also create errors in the assessment results of the respective fish stocks for which management advice is being developed. The implications can be serious with respect to the fishing industry regarding possible assignment of incorrect catch quotas and other management measures advised from the results of the assessment. In addition, the well being of the fish resources can also be detrimentally affected especially if assigned quotas are inadvertently set too high as a result of these errors.
Besides the importance to fish stock assessment models per se, it must be recognized that the study of biological parameters such as growth rates and maturity rates are very much related to precise knowledge of age structure in order to properly understand the dynamics of commercial fish populations. Results of these studies also play an instrumental role in the forma ti on of appropriate scientific ad vice used for fisheries management.
E:\ACFM\WKGHAD\REPORT.DOC 05/02/97 l
1.4 General Biology
1.4.1 Distribution
Greenland halibut (Reinhardtius hippoglossoides) are distributed throughout the North Atlantic (Nizovtsev 1970; Sigurdsson 1977, 1980, 1981; Godø and Haug 1987; Bowering and Brodie 199~) in depths up to at least 2200 m (Boje and Hareide 1993; de Cardenas et al. 1996) and are known to exhibit extensive migrations (Sigurdsson 1981; Bowering 1984; Godø and Haug 1987). Because the continental slope is rather continuous at such depths from western to eastern Atlantic, Greenland halibut distribution is more or less continuous along the continental slope. Recent mtDNA studies have also concluded that Greenland halibut throughout the entire North Atlantic are genetically homogeneous which is consistent with known depth distribution and migratory patterns. Any variation in phenotypic characteristics within the species is therefore considered to be a result of the environmental influence of the area in which individual fish live (Vis et al. 1997). The species comprises a significant commercial groundfish resource in the North Atlantic. In order to regulate fishing, the Greenland halibut population is managed according to six separate management units as follows: l - Gulf of St. Lawrence (NAFO Divisions 4RST, 2 -Labrador to Flemish Cap (NAFO Sub-area 2 and Divisions 3KLMNO), 3 - Davis Strait (NAFO Sub-area O and Divisions 1B-1F), 4 -Northwest Greenland inshore (NAFO Division lA), 5 - East Greenland-Iceland-Faroe Islands (ICES Sub-areas V and XIV) and 6- Northeast Arctic (ICES Regions I and Il).
1.4.2 Spawning
In the northwest Atlantic the main spawning area is located in the deep waters (at least 600-1000 m) of Davis Strait (Bowering and Chumakov 1989) although recent investigations have indicated that same spawning occurs all along the continental slope of eastern Canada to as far south as the Flemish Cap (Junquera and Zamarro 1994; Morgan and Bowering 1997). Same localized spawning also takes place in the Gulf of St. Lawrence (Bowering 1982) and possibly in same West Greenland fjords although the extent to which it occurs there is not entirely clear (Riget and Boje 1989). Time of spawning is highly variable and has been observed from December to August (Jensen 1935; Smidt 1969; Junquera and Zamarro 1994; Morgan and Bowering 1997). However, most spawning likely takes place during winter and may- not occur on an annual basis for all Greenland halibut that have reached maturity (Fedorov 1971).
In the Iceland area spawning usually occurs in winter northwest Iceland most likely along the continental slope of east Greenland at depths to 1000 m (Sigurdsson 1977). From 0-Group surveys conducted during 1970-79, young of the year Greenland halibut were caught throughout the Irminger Sea from western Iceland to the southern tip of Greenland with the higher catches taken on the east Greenland continental shelf (Sigurdsson 1980). During spring it is reported that most post-spawning fish be gin a feeding migration to the north and northeast of Iceland where they encounter a rich food source of shrimp (Nizovtsev 1970). Same fish migrate as far as to the southeast of Iceland. It is further reported that by September the main feeding migration is over and from September to December the return migration to western Iceland takes place for spawning.
According to Godø and Haug (1987) the Greenland halibut in the northeast Atlantic area of the Barents and Norwegian seas spawn mainly during winter along the continental slope from as far south as Traena Bank (66°- 67° N) northward to 76° N off southwestern Spitsbergen. They found that there was a relatively high proportion of small fish north of 76° N and this may indicate a nursery area although they also attributed the heterogeneity in size composition in part to a southern migration of larger fish.
1.4.3 Maturity
Proportions of Greenland halibut mature-at-length from the northwest Atlantic are subject to large spatial and tempora! variation. Proportions mature-at-age also exhibited inconsistency with the age at 50% maturity ranging from 9.5 to 15.0 years for females and 8.2 to 11.6 years for males (Morgan and Bowering 1997). These authors observed that there were no apparent trends in this variation and considered it to be likely a result of irregularities in the maturation process and spawning of Greenland halibut leading to variability in the distribution of adult fish.
Very little data are readily available on size and age at maturity for the Iceland-East Greenland and northeast Arctic areas. However, data used in the assessment of the Greenland halibut stock in Iceland-East Greenland indicate they reached 50% maturity most aften between 9 and 10 years old (sexes combined) since the early 1980's. On the other hand, the estimated age at 50% maturity in 1995 was considerably younger at 7-8 years old (Anon. 1996a). Data from the assessment of the Northeast Arctic Greenland halibut stock (Anon. 1995a) show that males mature at a
E:\ACFM\WKGHAD\REPORT.DOC 05/02/97 2
much younger age than females. Data collected during the 1970's and early 1980's suggest that 50% of males are mature at about 5 years old whereas fe males reach 50% maturity between 9 and l O years old. The most recent information from Russian surveys in the Barents Sea (1993-95) show that 50% maturity was reached at about 6 years old for sexes combined.
1.4.4 Age and Growth
Based on age and growth studies of Greenland halibut in the northwest Atlantic as an example, it is believed that they can live to at least 18 years old and are common up to a length of 110 cm (Smidt 1969; Bowering 1978, 1983; Boje and Jørgensen 1991). However, males have a considerably shorter life span than females with very few males encountered beyond age 12 or a length of about 65 cm. These studies also suggest that while there appears to be some divergence of the growth rate between males and females at about the age range of 8-1 O years old, it is not significant, like ly a result of there being few males available beyond this age. The only comparison in the literature of growth rates of Greenland halibut in the North Atlantic is in Krzykawski (1976). His results show that Greenland halibut have a faster growth rate overall in the Newfoundland area compared to the Barents Sea and those of the Iceland area are the slowest growing of the three areas examined. It must be noted, however, that this study was based on very limited data and a more detailed investigation is warranted befare any firm conclusions can be reached.
1.4.5 Mortality
Due to the considerable difference in the age span between males and females it follows that there is likely to be a concomitant difference in natural mortality. Because there is also a depth distribution trend associated with increasing size (see Bowering and Chumakov 1989) the exploitation pattern of commercial fisheries can have a significant effect on a population with respect to differential fishing mortality between the sexes. If fishing effort is mainly directed in deep water, for example, then the catch can often be entirely of large females likely resulting in high fishing mortality that can cause undesirable repercussions for the spawning stock biomass. On the other hand, very low fishing mortality on mature males can result in losses in yield. Trying to reach an appropriate balance between the two presents both a difficult stock assessment problem and serious implications for fisheries management. For a preliminary evaluation of the problem as it exists in the Flemish Cap fishery in the northwest Atlantic seede Cardenas (1996).
2 AGE V ALIDATION
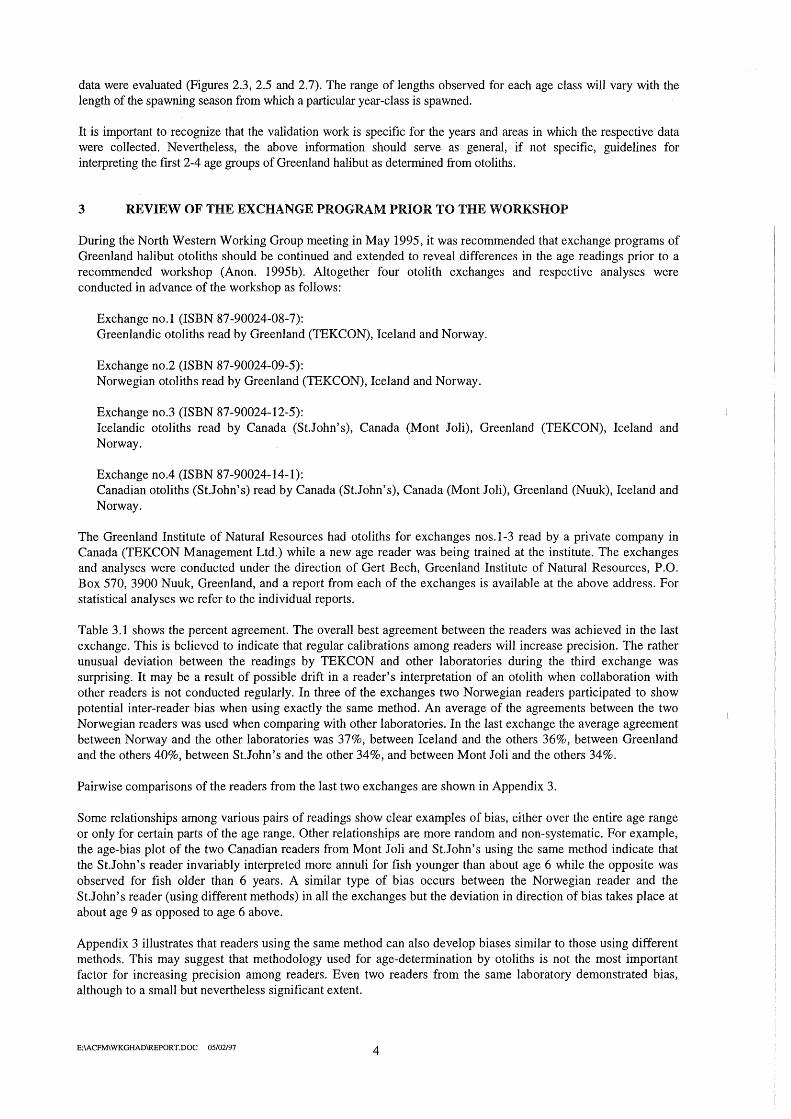
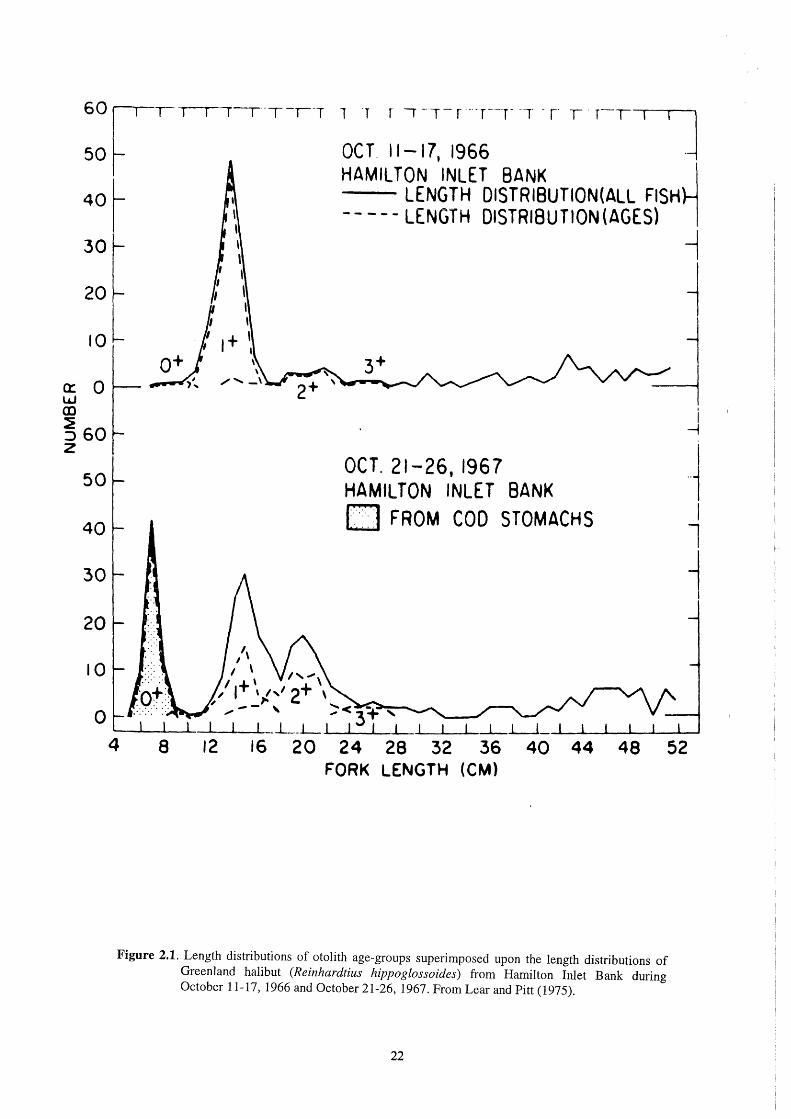
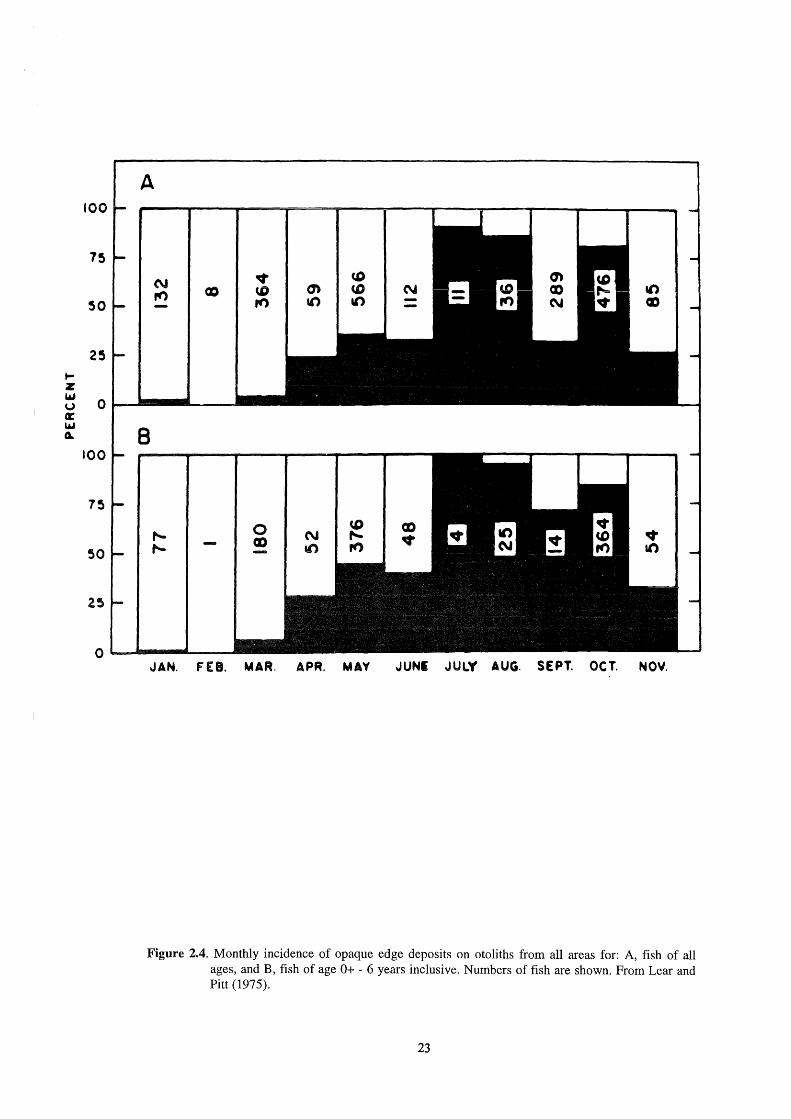
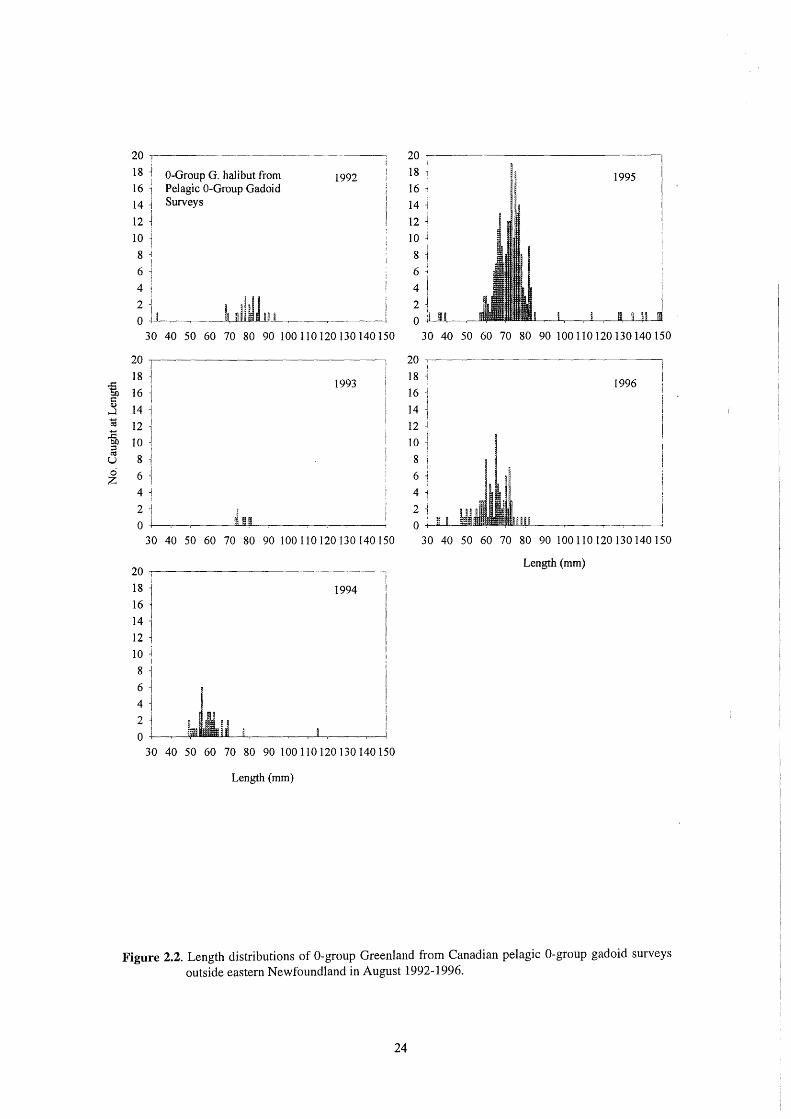
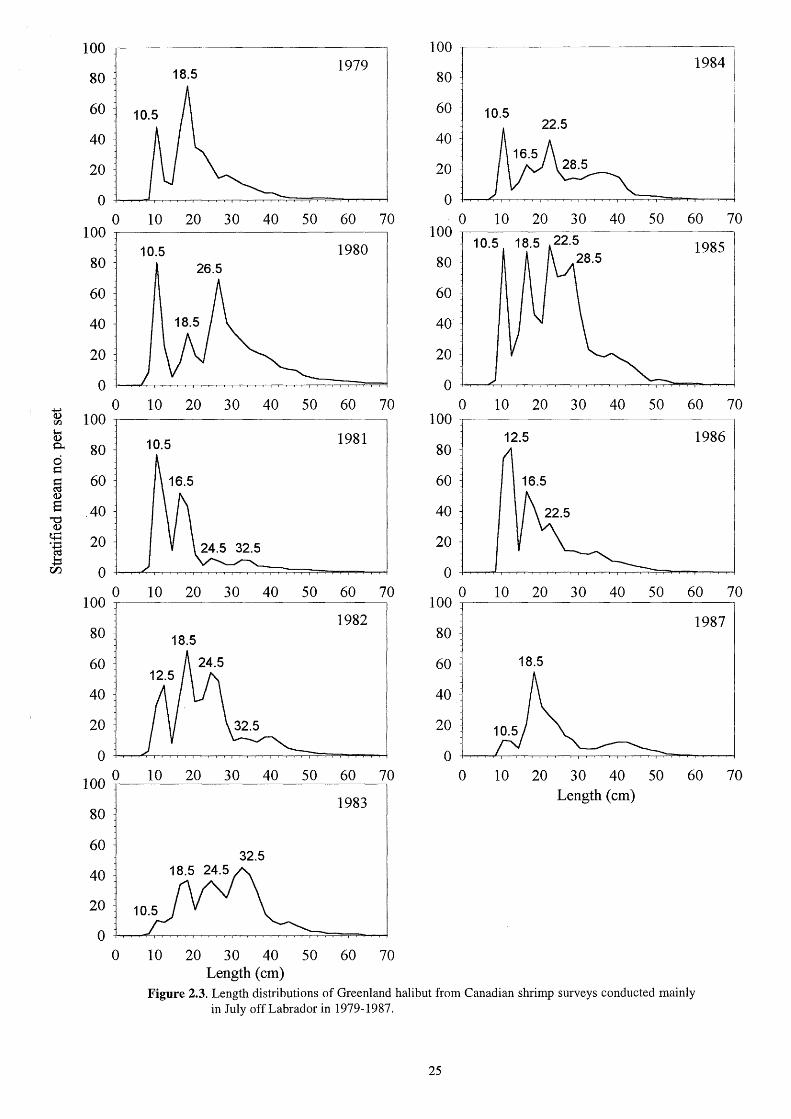
The only otolith age validation studies on Greenland halibut that have been published are in Lear and Pitt (1975) for the Canada Newfoundland area and in Smidt ( 1969) for the West Greenland area. In both instances, the validation work was largely based on evaluating highly distinctive modes in the length frequency distributions (Petersen technique) of young Greenland halibut in conjunction with age distributions determined from otolith interpretations (Figure 2.1). Interpretation of the first year was of paramount importance in order that the subsequent two to three distinctive modes in the length frequency distributions could be determined as age classes. Establishing the first year was greatly enhanced by knowledge of the early life history stages as studied primarily by Jensen (1935). Information from recent pelagic 0-Group surveys in eastern Newfoundland (Figure 2.2) accompanied by length frequencies of Greenland halibut from shrimp surveys conducted mainly during July from 1979-1987 off Labrador (Figure 2.3) confirmed the validation results of earlier studies. In addition, observations on the formation of the growth zones at the otolith edge suggested that very little growth occurs during the months of February and March then increases significantly in spring (Lear and Pitt 1975) (Figure 2.4). Maximum growth occurred during July and August followed by September and October. Growth in November was about the same as in the spring months.
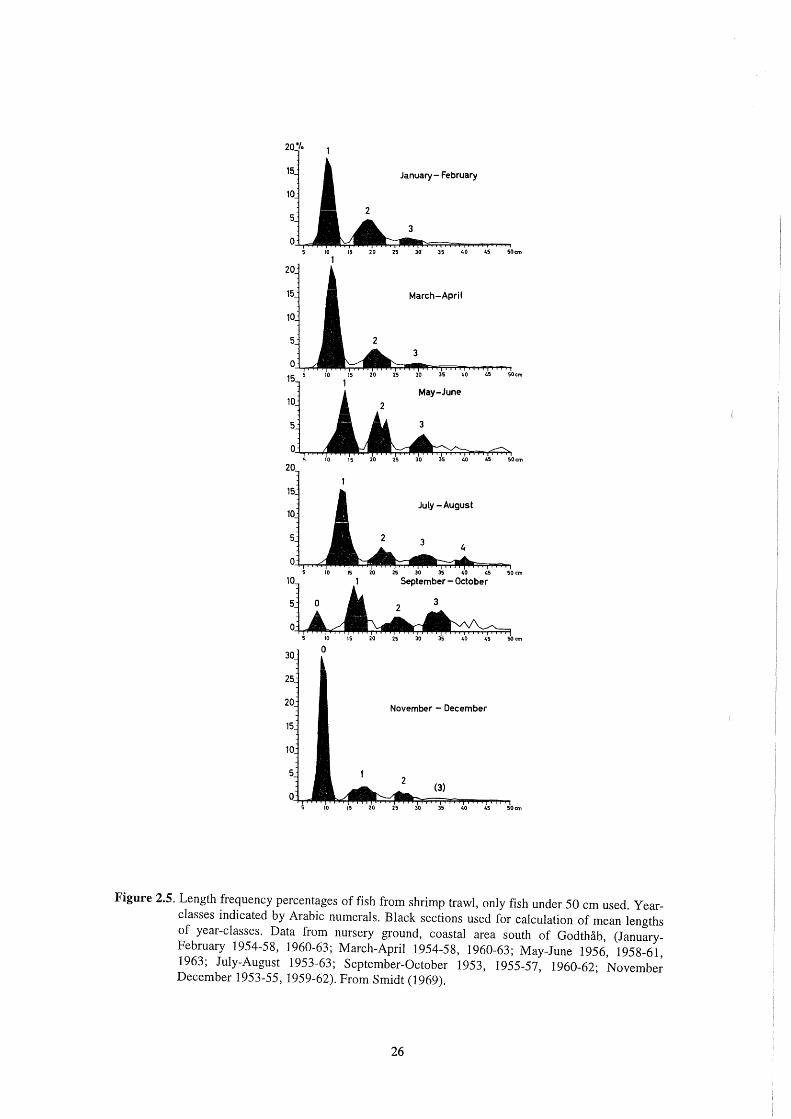
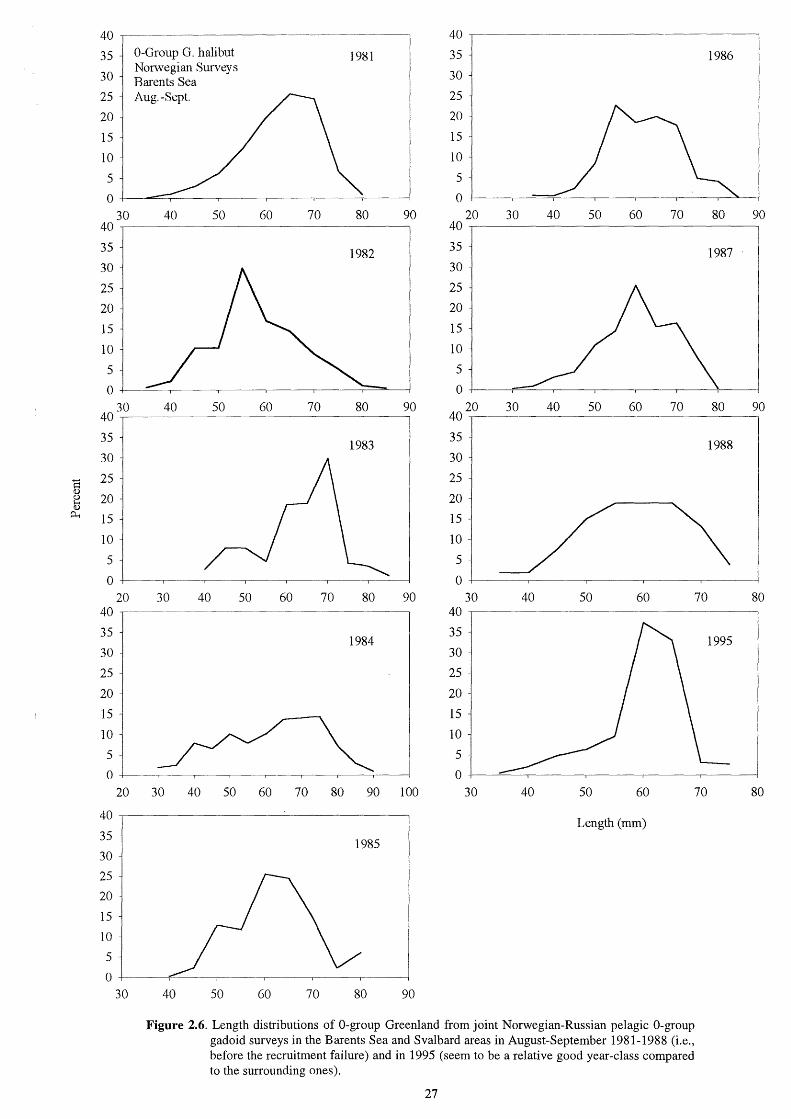
Larval studies by Jensen (1935) and observations from pelagic surveys indicate that Greenland halibut in the western Atlantic spawn mainly in winter to early spring. They have a lengthy pelagic period and in most instances appear to become demersal in late summer to early fall at a length range of 6-8 cm (Figure 2.5). Similar observations were made from 0-Group survey data in both Icelandic (Table 2.1) and Barents Sea waters (Figure 2.6). According to the data in Smidt (1969), 0-Group Greenland halibut first appeared in commercial shrimp trawler catches in SeptemberOctober at a mode of about 8 cm. By November-December the by-catch of 0-Group Greenland halibut had greatly increased at a size mode of about 9-1 O cm (Figure 2.5). It can be inferred from these data that Greenland halibut caught at lengths of 8-1 O cm very late in the year are O-Gro up and it follows that those of similar size caught earl y in the year are definitely l year olds. Further examination of the length frequency modes also suggest that Greenland halibut can be expected to grow about 6-8 cm per year on average at least for the first 2-4 years for most areas where
E:\ACFM\WKGHAD\REPORT.DOC 05/02/97 3
data were evaluated (Figures 2.3, 2.5 and 2.7). The range of lengths observed for each age dass will vary with the length of the spawning season from which a particular year-dass is spawned.
It is important to recognize that the validation work is specific for the years and areas in which the respective data were collected. Nevertheless, the above information should serve as general, if not specific, guidelines for interpreting the first 2-4 age groups of Greenland halibut as determined from otoliths.
3 REVIEW OF THE EXCHANGE PROGRAM PRIOR TO THE WORKSHOP
During the North Western Working Group meeting in May 1995, it was recommended that exchange programs of Greenland halibut otoliths should be continued and extended to reveal differences in the age readings prior to a recommended workshop (Anon. 1995b). Altogether four otolith exchanges and respective analyses were conducted in advance of the workshop as follows:
Exchange no.1 (ISBN 87-90024-08-7): Greenlandic otoliths read by Greenland (TEKCON), Iceland and Norway.
Exchange no.2 (ISBN 87-90024-09-5): Norwegian otoliths read by Greenland (TEKCON), Iceland and Norway.
Exchange no.3 (ISBN 87-90024-12-5): Icelandic otoliths read by Canada (St.John's), Canada (Mont Joli), Greenland (TEKCON), Iceland and Norway.
Exchange no.4 (ISBN 87-90024-14-1): Canadian otoliths (St.John's) read by Canada (St.John's), Canada (Mont Joli), Greenland (Nuuk), Iceland and Norway.
The Greenland Institute of Natura! Resources had otoliths for exchanges nos.1-3 read by a private company in Canada (TEKCON Management Ltd.) while a new age reader was being trained at the institute. The exchanges and analyses were conducted under the direction of Gert Bech, Greenland Institute of Natura} Resources, P.O. Box 570, 3900 Nuuk, Greenland, and a report from each of the exchanges is available at the above address. For statistical analyses we refer to the individual reports.
Table 3.1 shows the percent agreement. The overall best agreement between the readers was achieved in the last exchange. This is believed to indicate that regular calibrations among readers will increase precision. The rather unusual deviation between the readings by TEKCON and other laboratories during the third exchange was surprising. It may be a result of possible drift in a reader' s interpretation of an otolith when collaboration with other readers is not conducted regularly. In three of the exchanges two Norwegian readers participated to show potential inter-reader bias when using exactly the same method. An average of the agreements between the two Norwegian readers was used when comparing with other laboratories. In the last exchange the average agreement between Norway and the other laboratories was 37%, between Iceland and the others 36%, between Greenland and the others 40%, between St.John's and the other 34%, and between Mont Joli and the others 34%.
Pairwise comparisons of the readers from the last two exchanges are shown in Appendix 3.
Some relationships among various pairs of readings show dear examples of bias, either over the entire age range or only for certain parts of the age range. Other relationships are more random and non-systematic. For example, the age-bias plot of the two Canadian readers from Mont Joli and St.John's using the same method indicate that the St.John's reader invariably interpreted more annuli for fish younger than about age 6 while the opposite was observed for fish older than 6 years. A similar type of bias occurs between the Norwegian reader and the St.J ohn' s reader (us ing different methods) in all the exchanges but the deviation in direction of bi as takes place at about age 9 as opposed to age 6 above.
Appendix 3 illustrates that readers using the same method can also develop biases similar to those using different methods. This may suggest that methodology used for age-determination by otoliths is not the most important factor for increasing precision among readers. Even two readers from the same laboratory demonstrated bias, although to a small but nevertheless significant extent.
E:\ACFM\WKGHAD\REPORT.DOC 05/02/97 4
There is considerable subjectivity in determining ages from otoliths, which largely explains why reproduction of the age determinations in multiple readings is such a difficult task both within and between readers. An important consideration in achieving agreement between readers could therefore be developing a clear definition of the first annulus. This does not appear to be so difficult in 1-3 year olds, but may cause a systematic bias when reading otoliths from older fish. However, it is more difficult to establish a convention for interpreting older ages, i.e., to tell annuli from checks. Information about date of capture may, however, minimize the differences in interpretation of the otolith edge.
4 AGE READING COMPARISONS DURING THE WORKSHOP
4.1 Experienced readers comparison
Age readers from the three laboratories most experienced in Greenland halibut otolith age determination (St. John's, Canada; Bergen, Norway and Reykjavik, Iceland) met for the three days prior to the workshop to conduct comparative age reading exercises using their respective methodologies. Analyses of the data were carried out during the workshop. Altogether 50 otoliths from 16-72 cm fish were read by the three readers using three different methods. The otoliths were read untreated in transmitted light (the method most familiar to the Norwegian reader), untreated in reflected light (method most familiar to the Canadian reader) and finally baked using reflected light (method most familiar to the Icelandic reader). Since the main purpose of the exercise was to compare methods, the otoliths were read without information on fish length and only otoliths from fish caught in spring were used.
Percent agreement
Pairwise comparisons of the age readings using the same method were conducted. Pairwise comparisons using the TLNT-method (transmitted light, no treatment) indicated percent agreements of 33, 34 and 19% for Norway/Iceland, Norway/Canada and Iceland/Canada, respectively (Table 4.1). The respective percent agreements were 20, 32 and 22% using the RLNT-method (reflected light, no treatment), and 36, 33 and 35% for the RLBA-method (reflected light, baked otoliths).
Percent agreements +1- l year were in the range of 60-83% when using the TLNT-method, 56-64% when using the RLNT -method and 75-81% when using the RLBA-method.
Percent agreements were generally higher for ages below 6 years. For the TLNT -method the percent agreement between two readers for ages below 6 years varied from 20-57% and 14-36% for fish of age 6 years and older. Percentage agreement using the RLNT-method were in the range of 24-50% and 18-22% and for the RLBA-method were in the range of 50-65% and 13-27% agreement for ages less than 6 years and 6 years and older, respectively.
It can be concluded from these results that a certain improvement in precision was achieved when baking the otoliths before reading them in reflected light.
Inter-reader bias tests
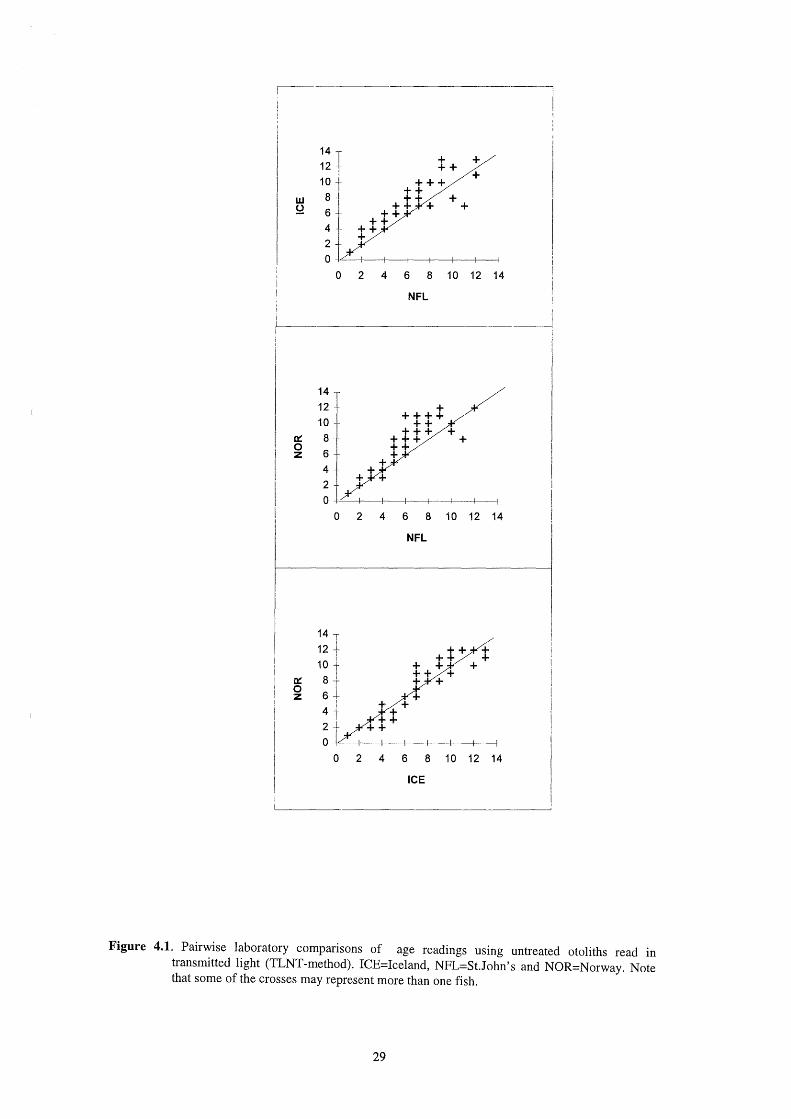
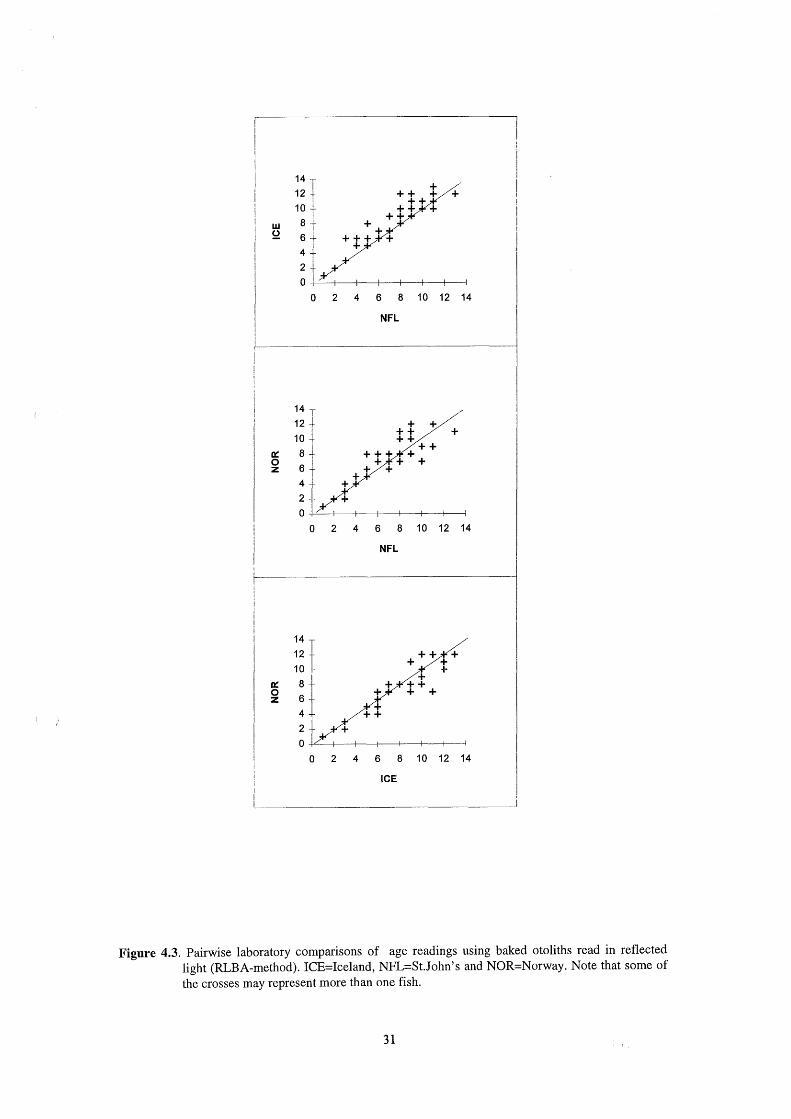
Inter-reader bias plots together with Bowker's symmetry test were made according to Anon. 1994. The plots are shown for each pairwise comparison of the three readers for each method in Figures 4.1- 4.3.
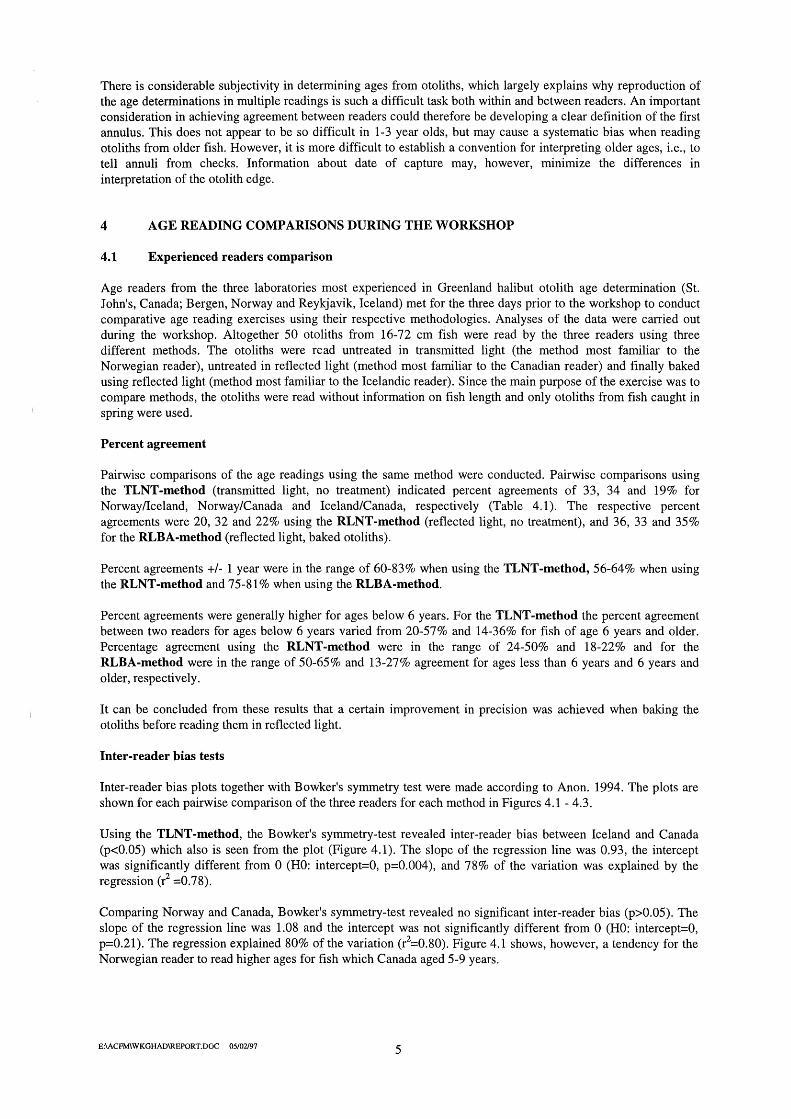
Using the TLNT -method, the Bowker's symmetry-test revealed inter-reader bias between lee land and Canada (p<0.05) which also is seen from the plot (Figure 4.1). The slope of the regression line was 0.93, the intercept was significantly different from O (HO: intercept=O, p=0.004), and 78% of the variation was explained by the regression (r2 =0.78).
Comparing Norway and Canada, Bowker's symmetry-test revealed no significant inter-reader bias (p>0.05). The slope of the regression line was 1.08 and the intercept was not significantly different from O (HO: intercept=O, p=0.21). The regression explained 80% of the variation (r2=0.80). Figure 4.1 shows, however, a tendency for the Norwegian reader to read higher ages for fish which Canada aged 5-9 years.
E:\ACFM\WKGHAD\REPORT.DOC 05/02/97 5

Comparing Norway and Iceland, Bowker's symmetry-test revealed no significant inter-reader bias (p>0.05). The slope of the regression line was 1.04, the intercept was not significantly different from O (p=0.54 ), and 87% of the variation was explained by the regression (r2=0.87). Figure 4.1 shows, however, that the Icelandic reader read higher ages on the younger fish and lower ages on the older fish compared with the Norwegian reader.
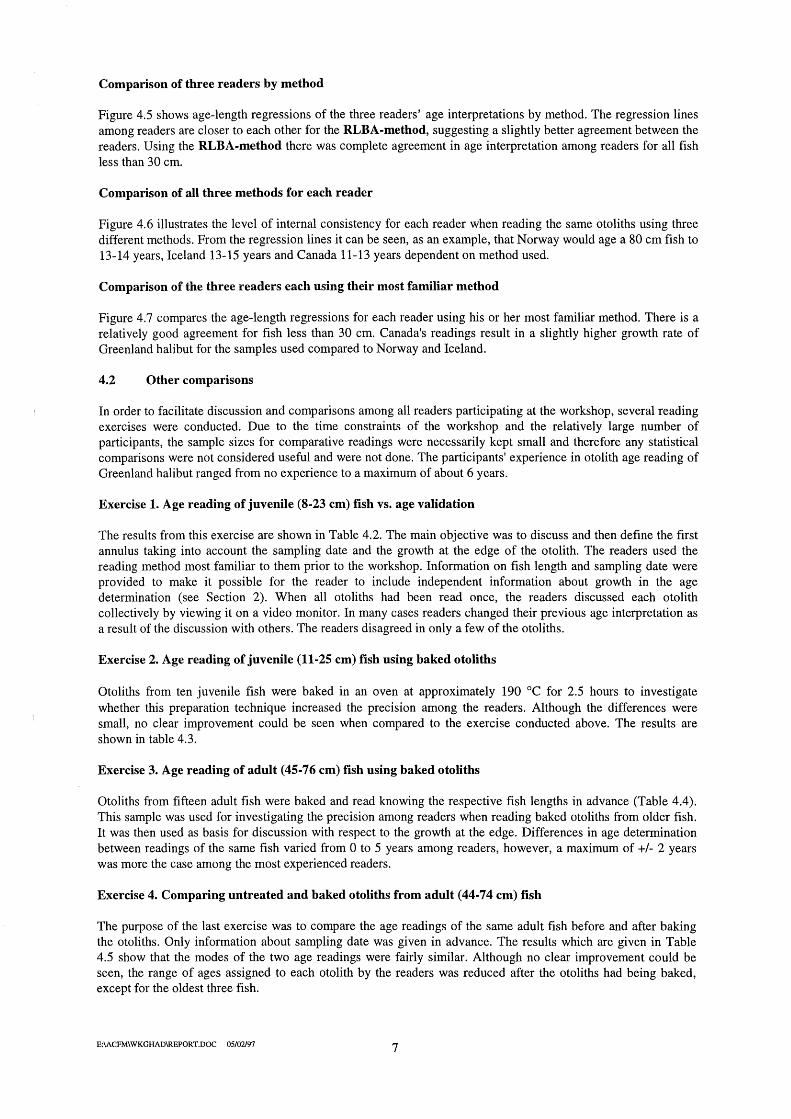
Using the RLNT-method, the Bowker's symmetry-test revealed also inter-reader bias between Iceland and Canada (p<0.05) which is seen clearly from the p lot (Figure 4.2). The slope of the regression line was 1.01, and the intercept was not significantly different from O (HO: intercept=O, p=0.06). However, only 66% of the variation could be explained by the regression (r2 =0.66).
Comparing Norway and Canada, Bowker's symmetry-test revealed no significant inter-reader bias (p>0.05). The slope of the regression line was 0.94, and the intercept was not significantly different from O (HO: intercept=O, p=0.17). The regression explained 71% of the variation in the data (r2=0.71).
Comparing Norway and Iceland, Bowker's symmetry-test revealed no significant inter-reader bias (p>0.05). The slope of the regression line was only 0.71, but the intercept was not significantly different from O (p=0.14). Only 57% of the variation in the data was explained by the regression (r2=0.57). Figure 4.2 shows especially one stri king outlier which was aged 6 and 17 years by Norway and lee land, respectively.
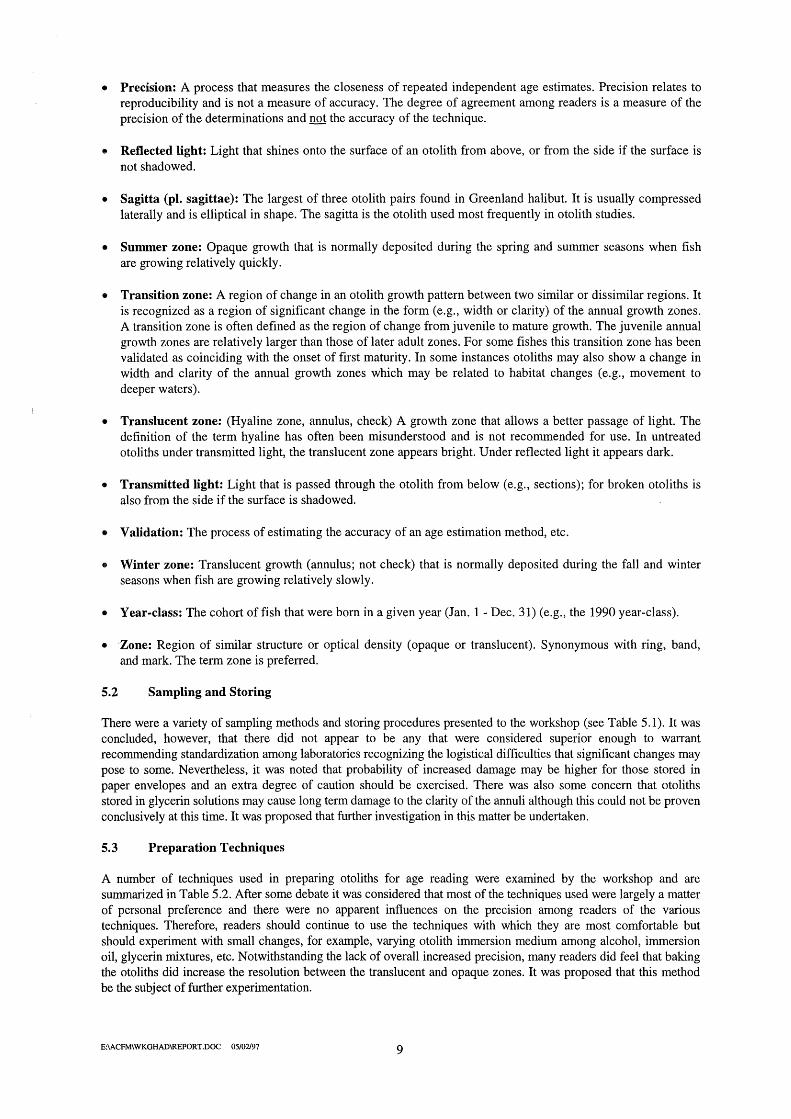
Using the RLBA-method, the Bowker's symmetry-test revealed no inter-reader bias between Iceland and Canada (p>0.05) although Iceland in many cases interpreted the otoliths to be much older (Figure 4.3). The slope of the regression line was 0.96 and the intercept was significantly different from O (HO: intercept=O, p=0.03) although the readers agreed on the interpretation of l and 2 year olds. The regression explained 85% of the variation in the data (r2 =0.85).
Comparing Norway and Canada, Bowker's symmetry-test revealed no significant inter-reader bias (p>0.05). The slope of the regression line was 0.94, and the intercept was not significantly different from O (HO: intercept=O, p=0.17). The regression explained 85% of the variation in the data (r2 =0.85).
Comparing Norway and Iceland, Bowker's symmetry-test revealed no significant inter-reader bias (p>0.05). The slope of the regression line was 0.95, and the intercept was not significantly different from O (p=0.92). The regression explained 87% of the variation in the data (r2 =0.87).
The RLBA-method was the only one of the three methods investigated where none of the reader comparisons showed any significant deviance from symmetry. The coefficients of determination (r2
) were also generally higher for this method, although the intercept for the regression between the Icelandic and Canadian readers was different from O.
Residual plots with regression lines
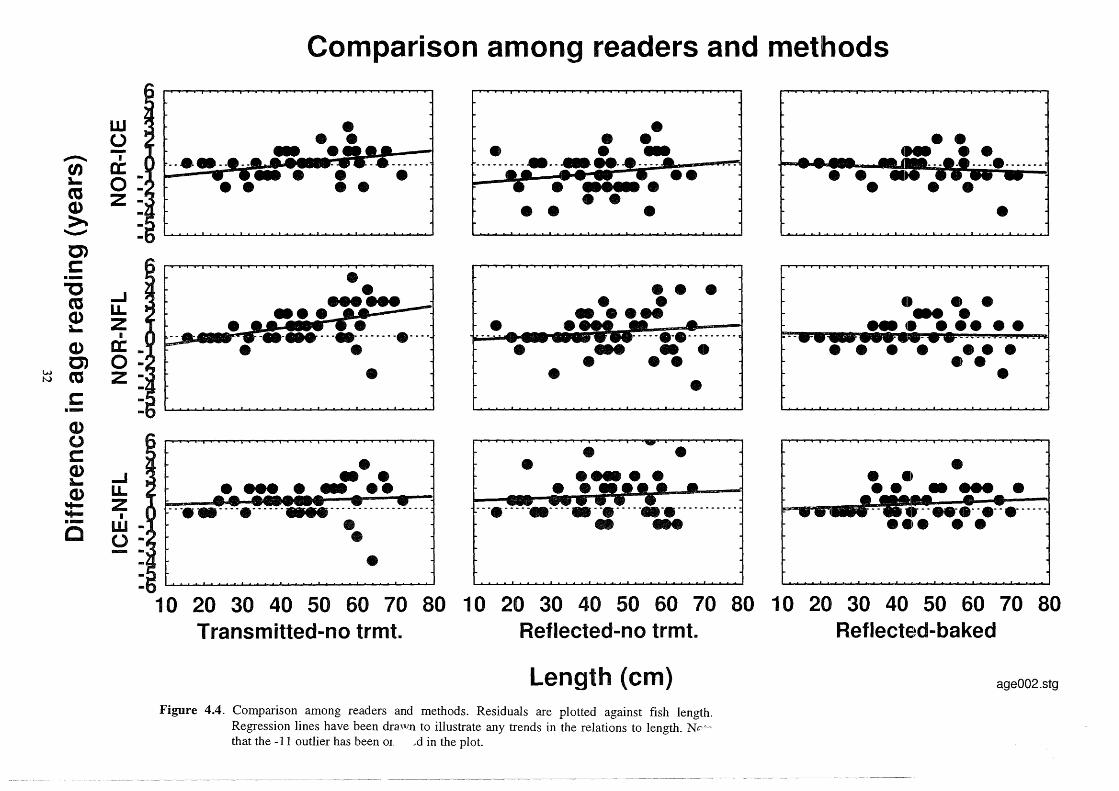
Differences in age readings were plotted against length of the fish (Figure 4.4 ). However, Figure 4.4 shows variation in the residuals by length. The size of the residuals may differ with regard to the length of the fish and the regression lines also reveal trends in the residuals over the length range.
The transmitted light-no treatment method (TLNT) shows higher residuals with increasing length, and the regression lines show a trend in the mean size of the residuals by fish length.
The reflected light-no treatment method (RLNT) shows overall higher residuals among readers although the magnitude of the residuals appear to be independent of fish length compared with the TLNT -method. Nevertheless, there is a trend in the residuals over the length range of the fish. An outlier of -Il between the Norwegian and the Icelandic reader for a 68 cm fish is not shown in the figure nor in the regression due to the figure scaling.
The reflected light-baked method (RLBA) shows overalllower residuals, although there is a slight increase in the residuals with increasing fish length. The regression lines are, however, more flat and close to the zero-line compared to the other two methods.
E:\ACFM\WKGHAD\REPORT.DOC 05/02/97 6
Comparison of three readers by method
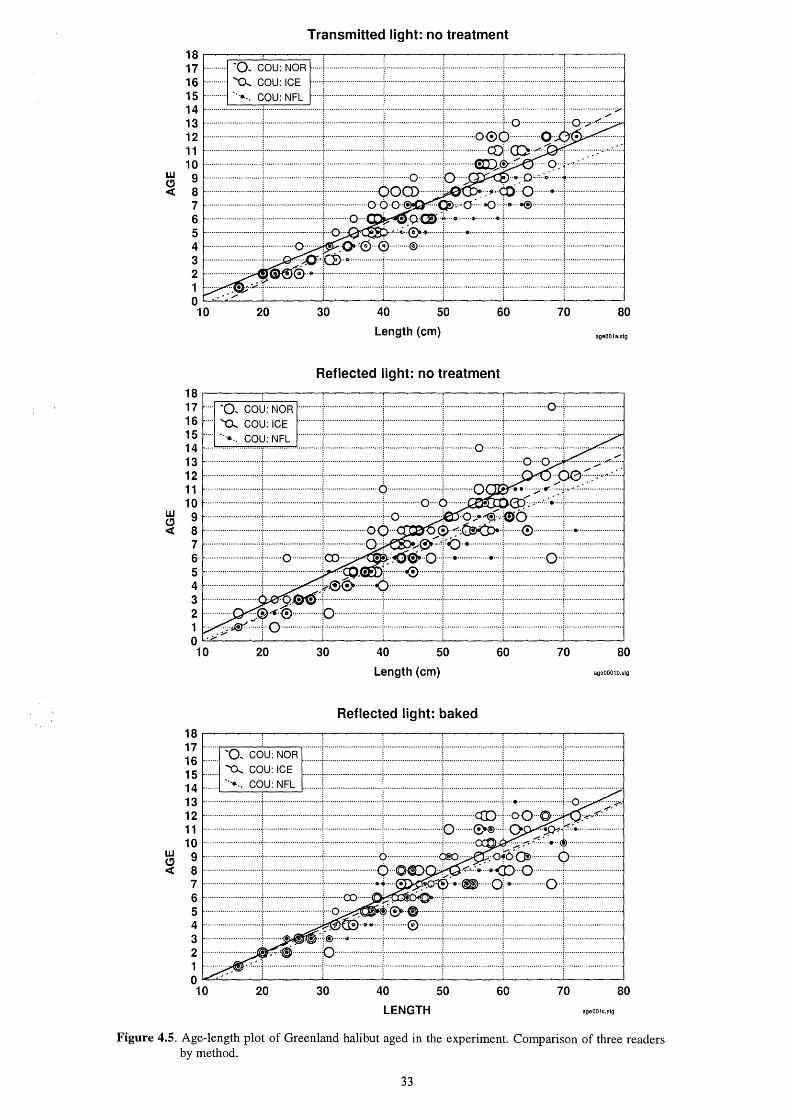
Figure 4.5 shows age-length regressions of the three readers' age interpretations by method. The regression lines among readers are doser to each other for the RLBA-method, suggesting a slightly hetter agreement between the readers. Using the RLBA-method there was complete agreement in age interpretation among readers for all fish less than 30 cm.
Comparison of all three methods for each reader
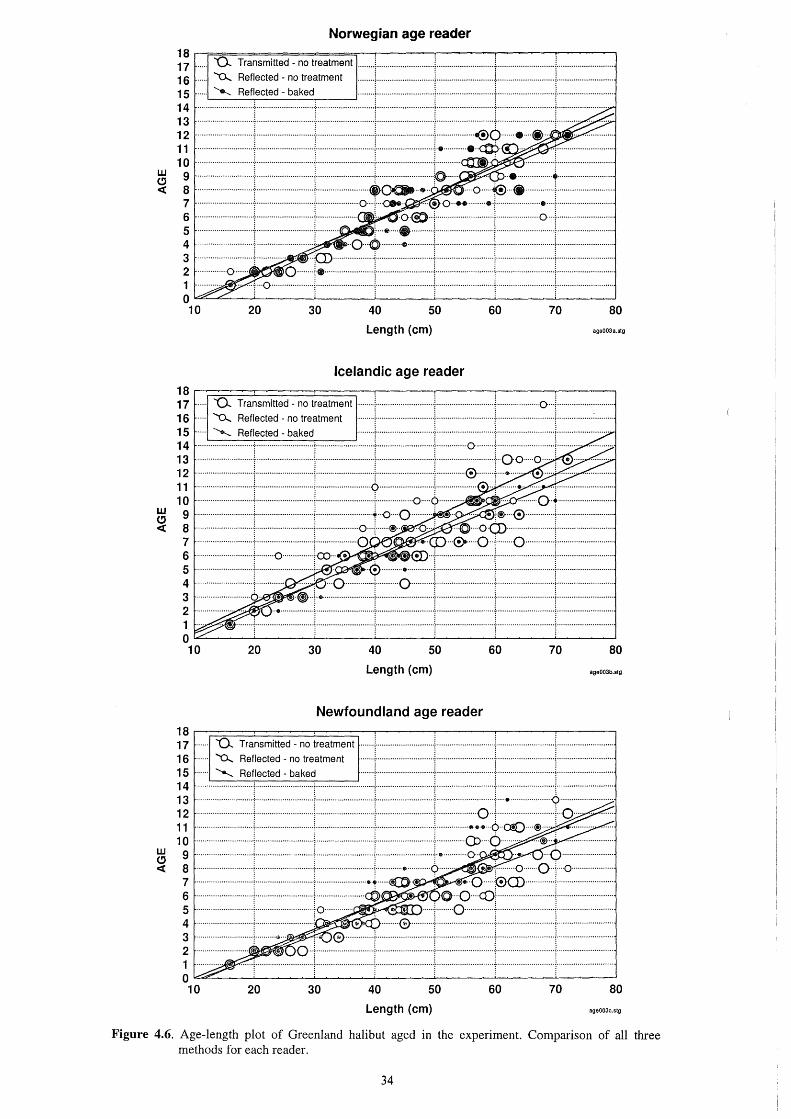
Figure 4.6 illustrates the level of internal consistency for each reader when reading the same otoliths using three different methods. From the regression lines it can be seen, as an example, that Norway would age a 80 cm fish to 13-14 years, Iceland 13-15 years and Canada 11-13 years dependent on method used.
Comparison of the three readers each using their most familiar method
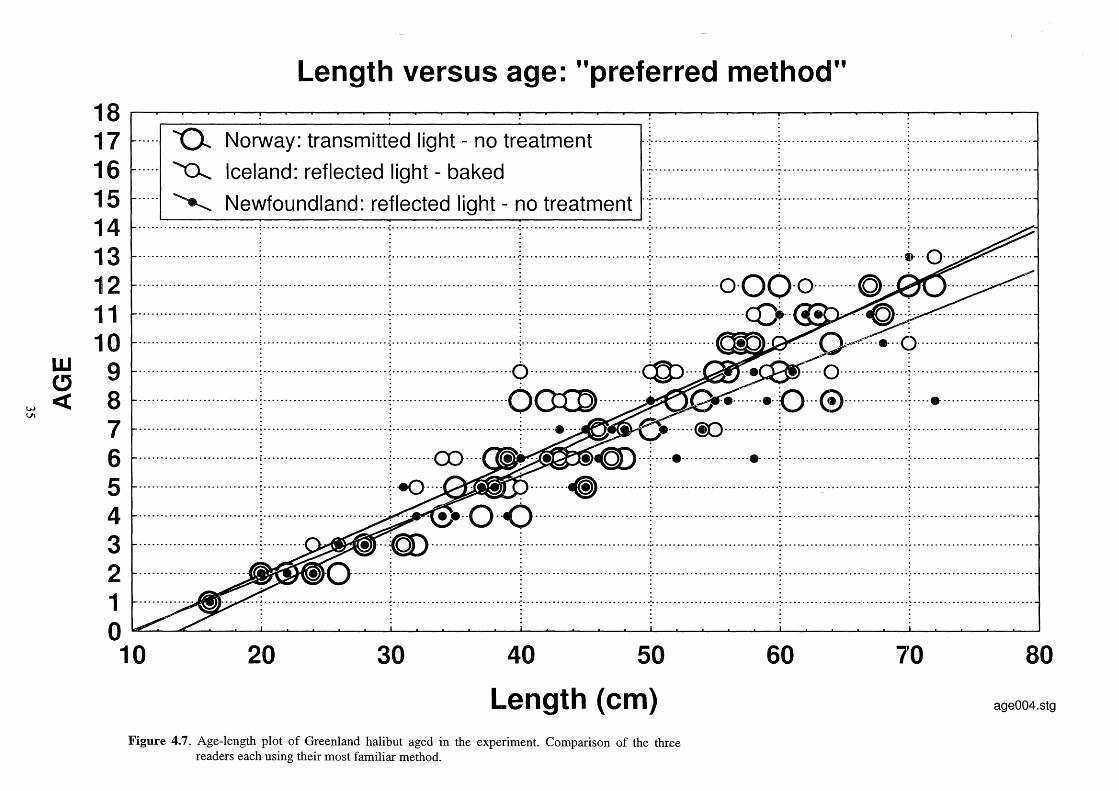
Figure 4.7 compares the age-length regressions for each reader using his or her most familiar method. There is a relatively good agreement for fish less than 30 cm. Canada's readings result in a slightly higher growth rate of Greenland halibut for the samples used compared to Norway and Iceland.
4.2 Other comparisons
In order to facilitate discussion and comparisons among all readers participating at the workshop, several reading exercises were conducted. Due to the time constraints of the workshop and the relatively large number of participants, the sample sizes for comparative readings were necessarily kept small and therefore any statistical comparisons were not considered useful and were not done. The participants' experience in otolith age reading of Greenland halibut ranged from no experience to a maximum of about 6 years.
Exercise l. Age reading of juvenile (8-23 cm) fish vs. age validation
The results from this exercise are shown in Table 4.2. The main objective was to discuss and then define the first annulus taking into account the sampling date and the growth at the edge of the otolith. The readers used the reading method most familiar to them prior to the workshop. Information on fish length and sampling date were provided to make it possible for the reader to include independent information about growth in the age determination (see Section 2). When all otoliths had been read once, the readers discussed each otolith collectively by viewing it on a video monitor. In many cases readers changed their previous age interpretation as a result of the discussion with others. The readers disagreed in only a few of the otoliths.
Exercise 2. Age reading of juvenile (11-25 cm) fish using baked otoliths
Otoliths from ten juvenile fish were baked in an oven at approximately 190 oc for 2.5 hours to investigate whether this preparation technique increased the precision among the readers. Although the differences were small, no clear improvement could be seen when compared to the exercise conducted above. The results are shown in table 4.3.
Exercise 3. Age reading of adult (45-76 cm) fish using baked otoliths
Otoliths from fifteen adult fish were baked and read knowing the respective fish lengths in advance (Table 4.4). This sample was used for investigating the precision among readers when reading baked otoliths from older fish. It was then used as basis for discussion with respect to the growth at the edge. Differences in age determination between readings of the same fish varied from O to 5 years among readers, however, a maximum of +1- 2 years was more the case among the most experienced readers.
Exercise 4. Comparing untreated and baked otoliths from adult (44-74 cm) fish
The purpose of the last exercise was to compare the age readings of the same adult fish before and after baking the otoliths. Only information about sampling date was given in advance. The results which are given in Table 4.5 show that the modes of the two age readings were fairly similar. Although no clear improvement could be seen, the range of ages assigned to each otolith by the readers was reduced after the otoliths had being baked, except for the oldest three fish.
E:\ACFM\WKGHAD\REPORT.DOC 05/02/97 7

It was concluded by the workshop that different interpretations of the otolith edge may cause systematic bias due to different practices in utilizing information with respect to date of capture.
5 PROTOCOL FOR AGE DETERMINATION OF GREENLAND HALIBUT OTOLITHS
The various techniques used currently by the different laboratories represented at the workshop were reviewed and are summarized for presentation in Tables 5.1-5.3. Examples of Greenland halibut otoliths are shown as illustrations in Figure 5.1.
5.1 Standardized terminology
The workshop agreed that the following terminology be used for consistency among Greenland halibut otolith age readers:
Based on recent international work (Secor et al. 1995, Anon. 1996b) that has taken place in order to standardize, as much as possible, the terminology used during otolith interpretation, it is recommended that the following definitions be used when making reference to Greenland halibut otoliths and interpretation of their ages:
• Accuracy: The closeness of a measured or computed value (e.g. age) to its true value. Accuracy can be proven or estimated: estimates of accuracy are less valuable, but in some cases only an estimate is possible.
• Age estimation, age determination: These terms are preferred when discussing the process of assigning ages to fish. The term aging should not be used as it refers to time-related processes and the alteration of an organism's composition, structure, and function over time.
• Age-group: The group of fish that has a given age (e.g., the 5-year-old age-group). The term is not synonymous with year-class.
• Annulus (pl. annuli): (Winter zone) A translucent growth zone that forms once a year representing a time of slower growth. For Greenland halibut populations the annulus is generally formed during the fall and winter months.
• Annual growth zone: A growth zone that consists of one opaque zone (summer zone) and one annulus (winter zone).
• Bias: A lack of precision that is not normally distributed around the mean; it is skewed to one side or the other. For age reading it may apply to one reader's interpretations which are predominantly more or less than those of another for all ages; or it may only apply to a portion of the age range.
• Birth date: Based on the internationally accepted standard all Greenland halibut are assumed to have a birth date of J anuary l.
• Check: Translucent zone that forms within the opaque (summer) zone representing a slowing of growth. Such a zone is not usually as prominent as annuli and should not be included in the age estimate.
• Cohort: A group offish that were horn during the same year (Jan. l- Dec. 31).
• Edge (marginal) growth: The am o unt and type of growth ( opaque or translucent) on an otolith 's margin or edge. The amount and type of growth on the edge must be related to the time of year the fish was caught and the internationally accepted and standard January 1st birthday. New opaque growth forming on the margin of the otolith is often referred to as plus growth or incremental growth.
• Nucleus: The central area of the otolith formed during the larval stage.
• Opaque zone: (Summer zone) A growth zone that restricts the passage of light. In untreated otoliths under transmitted light, the opaque zone appears dark. Under reflected light it appears bright.
E:\ACFM\WKGHAD\REPORT.DOC 05/02197 8
• Precision: A process that measures the closeness of repeated independent age estimates. Precision relates to reproducibility and is not a measure of accuracy. The degree of agreement among readers is a measure of the precision of the determinations and not the accuracy of the technique.
• Reflected light: Light that shines onto the surface of an otolith from above, or from the side if the surface is not shadowed.
• Sagitta (pl. sagittae): The largest of three otolith pairs found in Greenland halibut. It is usually compressed laterally and is elliptical in shape. The sagitta is the otolith used most frequently in otolith studies.
• Summer zone: Opaque growth that is normally deposited during the spring and summer seasons when fish are growing relatively quickly.
• Transition zone: A region of change in an otolith growth pattern between two similar or dissimilar regions. It is recognized as a region of significant change in the form (e.g., width or clarity) of the annual growth zones. A transition zone is often defined as the region of change from juvenile to mature growth. The juvenile annual growth zones are relatively larger than those of later adult zones. For some fishes this transition zone has been validated as coinciding with the onset of first maturity. In some instances otoliths may also show a change in width and clarity of the annual growth zones which may be related to habitat changes (e.g., movement to deeper waters).
• Translucent zone: (Hyaline zone, annulus, check) A growth zone that allows a hetter passage of light. The definition of the term hyaline has often been misunderstood and is not recommended for use. In untreated otoliths under transmitted light, the translucent zone appears bright. Under reflected light it appears dark.
• Transmitted light: Light that is passed through the otolith from below (e.g., sections); for broken otoliths is also from the side if the surface is shadowed.
• Validation: The process of estimating the accuracy of an age estimation method, etc.
• Winter zone: Translucent growth (annulus; not check) that is normally deposited during the fall and winter seasons when fish are growing relatively slowly.
• Year-dass: The cohort of fish that were born in a given year (Jan. l - Dec. 31) (e.g., the 1990 year-class).
• Zone: Region of similar structure or optical density ( opaque or translucent). Synonymous with ring, band, and mark. The term zone is preferred.
5.2 Sampling and Storing
There were a variety of sampling methods and storing procedures presented to the workshop (see Table 5.1). It was concluded, however, that there did not appear to be any that were considered superior enough to warrant recommending standardization among laboratories recognizing the logistical difficulties that significant changes may pose to some. Nevertheless, it was noted that probability of increased damage may be higher for those stored in paper envelopes and an extra degree of caution should be exercised. There was also some concern that otoliths stored in glycerin solutions may cause long term damage to the clarity of the annuli although this could not be proven conclusively at this time. It was proposed that further investigation in this matter be undertaken.
5.3 Preparation Techniques
A number of techniques used in preparing otoliths for age reading were examined by the workshop and are summarized in Tab le 5 .2. After some de bate it was considered that most of the techniques used were large ly a matter of personal preference and there were no apparent influences on the precision among readers of the various techniques. Therefore, readers should continue to use the techniques with which they are most comfortable but should experiment with small changes, for example, varying otolith immersion medium among alcohol, immersion oil, glycerin mixtures, etc. Notwithstanding the lack of overall increased precision, many readers did feel that baking the otoliths did increase the resolution between the translucent and opaque zones. It was proposed that this method be the subject of further experimentation.
E:\ACFM\WKGHAD\REPORT.DOC 05/02197 9
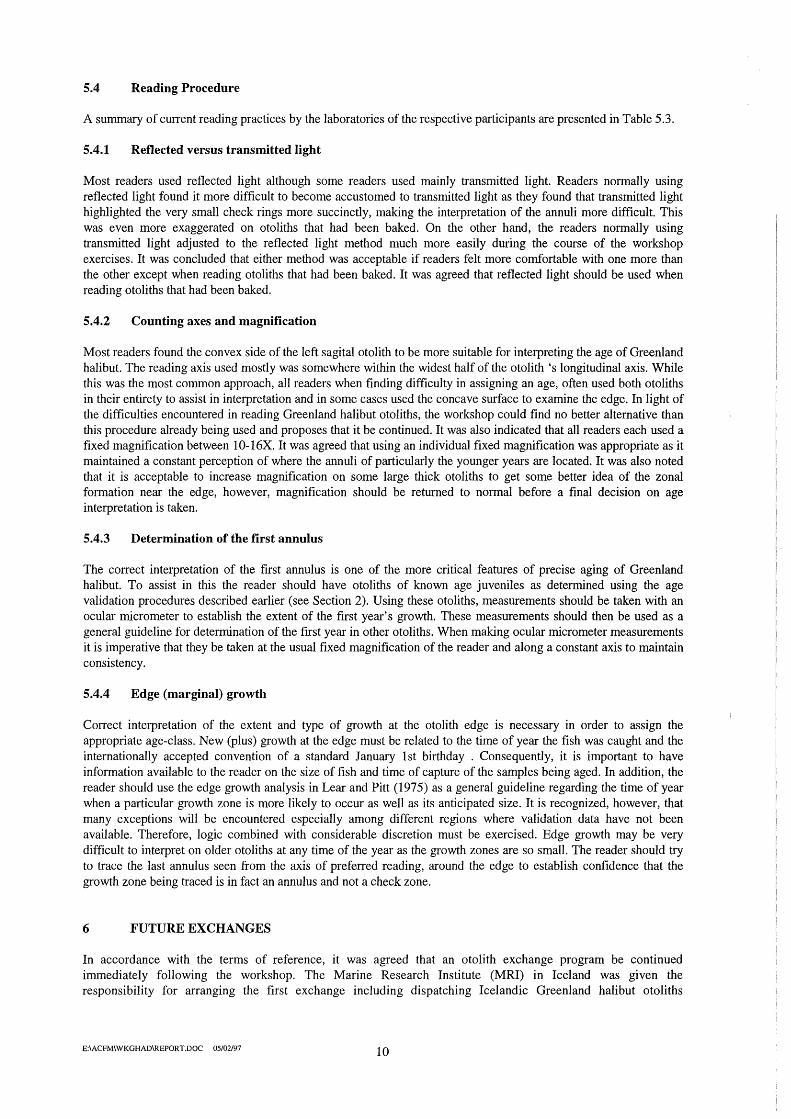
5.4 Reading Procedure
A summary of current reading practices by the laboratories of the respective participants are presented in Tab le 5.3.
5.4.1 Reflected versus transmitted light
Most readers used reflected light although some readers used mainly transmitted light. Readers normally using reflected light found it more difficult to become accustomed to transmitted light as they found that transmitted light highlighted the very small check rings more succinctly, making the interpretation of the annuli more difficult. This was even more exaggerated on otoliths that had been baked. On the other hand, the readers normally using transmitted light adjusted to the reflected light method much more easily during the course of the workshop exercises. It was concluded that either method was acceptable if readers felt more comfortable with one more than the other except when reading otoliths that had been baked. It was agreed that reflected light should be used when reading otoliths that had been baked.
5.4.2 Counting axes and magnification
Most readers found the convex side of the left sagital otolith to be more suitable for interpreting the age of Greenland halibut. The reading axis used mostly was somewhere within the widest half of the otolith 's longitudinal axis. While this was the most common approach, all readers when finding difficulty in assigning an age, aften used both otoliths in their entirety to assist in interpretation and in some cases used the concave surface to examine the edge. In light of the difficulties encountered in reading Greenland halibut otoliths, the workshop could tind no hetter alternative than this procedure already being used and proposes that it be continued. It was also indicated that all readers each used a fixed magnification between 10-16X. It was agreed that using an individual fixed magnification was appropriate as it maintained a constant perception of where the annuli of particularly the younger years are located. It was also noted that it is acceptable to increase magnification on some large thick otoliths to get some hetter idea of the zonal formation near the edge, however, magnification should be returned to normal before a final decision on age interpretation is taken.
5.4.3 Determination of the first annulus
The correct interpretation of the first annulus is one of the more critical features of precise aging of Greenland halibut. To assist in this the reader should have otoliths of known age juveniles as deterrnined using the age validation procedures described earlier (see Section 2). Using these otoliths, measurements should be taken with an ocular micrometer to establish the extent of the first year' s growth. These measurements should then be used as a general guideline for deterrnination of the first year in other otoliths. When making ocular micrometer measurements it is imperative that they be taken at the usual fixed magnification of the reader and along a constant axis to maintain consistency.
5.4.4 Edge (marginal) growth
Correct interpretation of the extent and type of growth at the otolith edge is necessary in order to assign the appropriate age-class. New (plus) growth at the edge must be related to the time of year the fish was caught and the internationally accepted convention of a standard January 1st birthday . Consequently, it is important to have information available to the reader on the size of fish and time of capture of the samples being aged. In addition, the reader should use the edge growth analysis in Lear and Pitt (1975) as a general guideline regarding the time of year when a particular growth zone is more likely to occur as well as its anticipated size. It is recognized, however, that many exceptions will be encountered especially among different regions where validation data have not been available. Therefore, logic combined with considerable discretion must be exercised. Edge growth may be very difficult to interpret on older otoliths at an y time of the year as the growth zones are so small. The reader should try to trace the last annulus seen from the axis of preferred reading, around the edge to establish confidence that the growth zone being traced is in fact an annulus and not a check zone.
6 FUTUREEXCHANGES
In accordance with the terms of reference, it was agreed that an otolith exchange program be continued immediately following the workshop. The Marine Research Institute (MRI) in Iceland was given the responsibility for arranging the first exchange including dispatching Icelandic Greenland halibut otoliths
E:\ACFM\WKGHAD\REPORT.DOC 05/02/97 10
(supplemented with East-Greenland otoliths of juvenile fish if necessary) to Nuuk, Greenland. In addition, the MRI will collect and analyse the data from the various participants and report the results to both ICES and NAFO for scientific review. Responsibility for arranging further exchanges, analyzing the data and reporting the results will alternate among the participating laboratories.
The first exchange should consist of 5 baked otolith samples for each 5 cm length group. The otoliths should be baked following the established Icelandic procedure. The samples should be dispatched in secure, dry condition to Greenland no later than the end of December, 1996 including information on fish length and date of capture. Data on round weight, sex and maturity is also desirable where available. The participating laboratories should not treat the otoliths in any manner that may alter their original condition in order to ensure consistency in the appearance of the samples for all readers.
The otoliths should be dispatched to the countries/laboratories and responsible age readers in the following order:
o l 2 3 4 5 6 7
Country
Reykjavik, Iceland Nuuk, Greenland Iqaluit/Winnipeg, Canada Mont Jo li, Canada St.John's, Canada Lisbon, Portugal Vigo, Spain Bergen, Norway
Responsible Reader
Hordur Andresson Per Otto Larsen Margaret Keast/John Babaluk Bernard Morin Brian Greene Lourdes Godinho Susana Junquera Anne Sæverud
Bach laboratory should send the results (one set of age readings per laboratory) by postal mail to the responsible laboratory, in this case Iceland, irnrnediately after reading. The otolith sample then should be securely repackaged and sent to the next laboratory on the list above.
7 RECOMMENDATIONS
The Workshop recornrnends the following research activities in order to facilitate more precision and ensure accuracy of age interpretations of Greenland halibut otoliths among regions of the North Atlantic:
• Age validation
In order to assist in the proper assignment of the final age of an otolith, the development of growth increments throughout the year at the edge of the otolith should be described for each fishing area in a fashion similar to that reporte~ in Lear and Pitt (1975).
Validation of the first 1-3 years of growth should be conducted for each fishing area by analyzing modes in length frequency data (Petersen technique) in conjunction with back-calculation of annual growth increments from the otolith. Following known strong year-classes can be especially helpful in this regard.
V alidation is needed for ages older than approximately 3 years and fish larger than about 30 cm in length. Traditional tagging data that contain otoliths, fish size at tagging and recapture and time in sea between tagging and recapture should be analysed. Although traditional tagging data does not give us an exact age when the fish were first tagged, such analyses can be particularly informative if there is a lengthy period between time of tagging and recapture especially if fish were small when tagged (then Petersen technique may be used to gi ve an approximate age). The Workshop was informed that MRI, Iceland has valuable tagging data that may be useful in this respect and recornrnends that these data be thoroughly examined as early as possible.
Oxytetracycline marking in conjunction with regular, traditional tagging programs should be encouraged.
• Radionucleotide dating should be further investigated.
E:\ACFM\WKGHAD\REPORT.DOC 05/02/97 11
• Investigation into determining an optimal storage medium for Greenland halibut otoliths that could enhance the acuity between annuli without long term detrimental effects to the otolith structure.
• Investigation into determining an optimal temperature and treatment time when baking otoliths for age determination purposes.
• As opportunities arise, any intermediate results from the otolith exchanges should be presented both to ICES and NAFO for review and further recommendations for improvements.
8 REFERENCES
Anon. 1995a. Report of the Arctic Fisheries Working Group. ICES Headquarters, Copenhagen, 23-31 August 1995. ICES CM 1996/Assess:4.
Anon. 1995b. Report of the North Western Working Group. ICES Headquarters, Copenhagen, 3-10 May 1995. ICES CM 1995/Assess:19.
Anon. 1996a. Report of the North Western Working Group. ICES Headquarters, Copenhagen, 1-8 May 1996. ICES CM 1996/Assess:15.
Anon. 1996b. Report of the workshop on age reading of Sebastes spp. Bremerhaven, Germany, 4-8 December 1995. ICES CM 1996/G:l.
Boje, J. and Jørgensen, O. 1991. Growth ofGreenland halibut in the North Atlantic. ICES C.M. 1991/G:40, 12p.
Boje, J. and Hareide, N.R. 1993. Trial deepwater longline fishery in the Davis Strait, May-June, 1992. NAFO SCR Doc. 93/53, Serial No. N2236, 6p.
Bowering, W.R. 1978. Age and growth of the Greenland halibut, Reinhardtius hippoglossoides (Walbaum), in ICNAF Sub-areas 2-4. ICNAF Res. Bull. No. 4: 5-10.
Bowering, W. R. 1982. Population dynamics of Greenland halibut in the Gulf of St. Lawrence. J. Northw. Atl. Fish. Sei. 3: 141-147.
Bowering, W.R. 1983. Age, growth, and sexual maturity of Greenland halibut, Reinhardtius hippoglossoides (Walbaum), in the Canadian Northwest Atlantic. Fishery Bulletin: Vol. 81, No. 3: 599-611.
Bowering, W. R. 1984. Migrations of Greenland halibut, Reinhardtius hippoglossoides, in the Northwest Atlantic from tagging in the Labrador-Newfoundland region. J. Northw. Atl. Fish. Sei. 5: 85-91.
Bowering, W. R. and Chumakov, A. K. 1989. Distribution and relative abundance of Greenland halibut (Reinhardtius hippoglossoides (Walbaum)) in the Canadian Northwest Atlantic from Davis Strait to the northern Grand Bank. Fish. Res. 7: 301-328.
Bowering, W.R. and Brodie, W.B. 1995. Greenland halibut (Reinhardtius hippoglossoides). A review of the dynamics of its distribution and fisheries off eastern Canada and Greenland. In NATA ASI Series Volume XX: Deep water fisheries of the North Atlantic oceanic slope, pp. 113-160. Ed. by A.G. Hopper. Kluwer Academic Publishers, Netherlands.
de Cardenas, E. 1996. The females ratio by length as an indicator of sexual differences in mortality of Greenland halibut, Reinhardtius hippoglossoides, at ages 8+. NAFO SCR Doc. 96/35, Ser. No. N2710, 10p.
de Cardenas, E., Casas, J.M., Alpoim, R. and Murua, H. 1996. Preliminary results of the European longline survey in the NAFO Regulatory Area. NAFO SCR Doc. 96/34, Ser. No. N2709, 6p + corrigendum.
Fedorov, K. Ye. 1971. The state of the gonads of the Barents Sea Greenland halibut (Reinhardtius hippoglossoides (Walbaum)) in connection with failure to spawn. J. Icthyol. 11:673-682.
E:\ACFM\WKGHAD\REPORT.DOC 05/02/97 12
Godø, O.R. and Haug, T. 1987. Migration and recruitment to the commercial stock of Greenland halibut (Reinhardtius hippoglossoides (Walbaum)), in the Svalbard area. FiskDir. Skr. Ser. HavUnders., 18: 311-328.
Jensen, A. S. 1935. The Greenland halibut (Reinhardtius hippoglossoides) its development and migrations. K. Dan. Vidensk. Selsk. Skr. 9Rk. 6: 1-32.
Junquera, S. and Zamarro, J. 1994. Sexual maturity and spawning of the Greenland halibut (Reinhardtius hippoglossoides) from Flemish Pass area. NAFO Scientific Council Studies No. 20: 47-52.
Krzykawski, S. 1976. A characteristic of growth of Greenland halibut, Reinhardtius hippoglossoides (Walbaum), from the North Atlantic. Acta Icthyologica et Piscatoria: Vol. VI, Fase. 2: 79-101.
Lear W.H. and Pitt, T.K. 1975. Otolith age validation of Greenland halibut (Reinhardtius hippoglossoides). J.Fish.Res.Board Can. 32: 289-292.
Morgan, M.J., and Bowering, W.R. 1997. Variation in maturity of Greenland halibut (Reinhardtius hippoglossoides (Walbaum)) throughout the Northwest Atlantic with implications for fisheries management. ICES J. Mar. Sei. (In press).
Nizovtsev, G.P. 1970. Migrations of Greenland halibut (Reinhardtius hippoglossoides (Walbaum)) in Icelandic waters. ICES C.M Doc. 1970/F:24, 6p.
Riget, F. and Boje, J. 1989. Fishery and some biological aspects of Greenland halibut (Reinhardtius hippoglossoides) in West Greenland waters. NAFO Sei. Coun. Studies 13: 41-52.
Secor, D.H., Dean, J.M., and Campana, S.E. 1995. Recent developments in fish otolith research. University of South Carolina Press, Columbia, USA. 735 pp. ISBN 1-57003-011-1.
Sigurdsson, A. 1977. On the spawning grounds of Greenland halibut in Icelandic waters. ICES C.M. Doc. 1977/F:28, llp.
Sigurdsson, A. 1980. On the nursery grounds of the Greenland halibut spawning in Icelandic waters. ICES C.M. Doc. 1980/0:45, 8p.
Sigurdsson, A. 1981. Migrations of Greenland halibut (Reinhardtius hippoglossoides (Walb.)) from Iceland to Norway. RitFiskideildar 6, 1981,3-6.
Smidt, E. 1969. The Greenland halibut (Reinhardtius hippoglossoides), biology and exploitation in Greenland waters. Medd. Dan. Fisk. Havunders. 6: 79-148.
Vis, M.L., Steven, M. C., Bowering, W.R. and Davidson, W.S. 1997. Greenland halibut (Reinhardtius hippoglossoides) in the North Atlantic are genetically homogeneous. Can. J. Fish. Aquat. Sei. (In press).
E:\ACFM\WKGHAD\REPORT.DOC 05/02/97 13
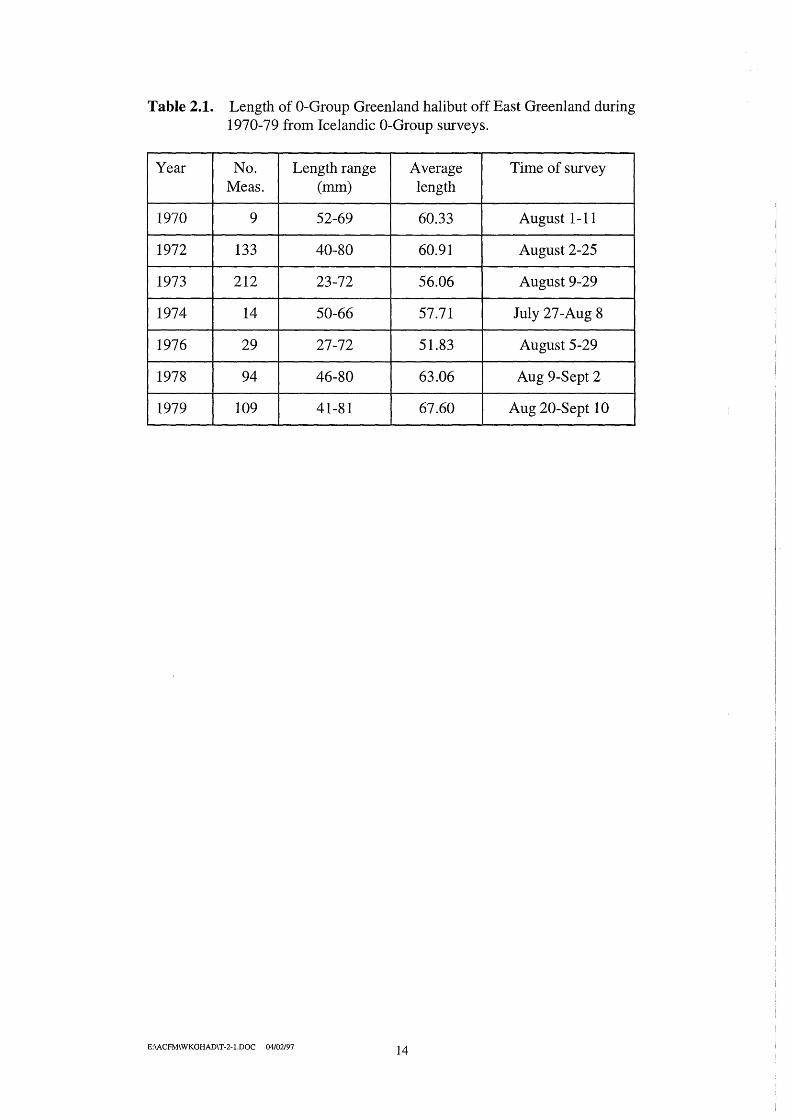
Tab le 2.1. Length of 0-Group Greenland halibut off East Greenland during 1970-79 from Icelandic 0-Group surveys.
Year No. Length range Average Time of survey Meas. (mm) length
1970 9 52-69 60.33 August 1-11
1972 133 40-80 60.91 August 2-25
1973 212 23-72 56.06 August 9-29
1974 14 50-66 57.71 July 27-Aug 8
1976 29 27-72 51.83 August 5-29
1978 94 46-80 63.06 Aug 9-Sept 2
1979 109 41-81 67.60 Aug 20-Sept l O
E:\ACFM\WKGHAD\T-2-l.DOC 04/02/97 14
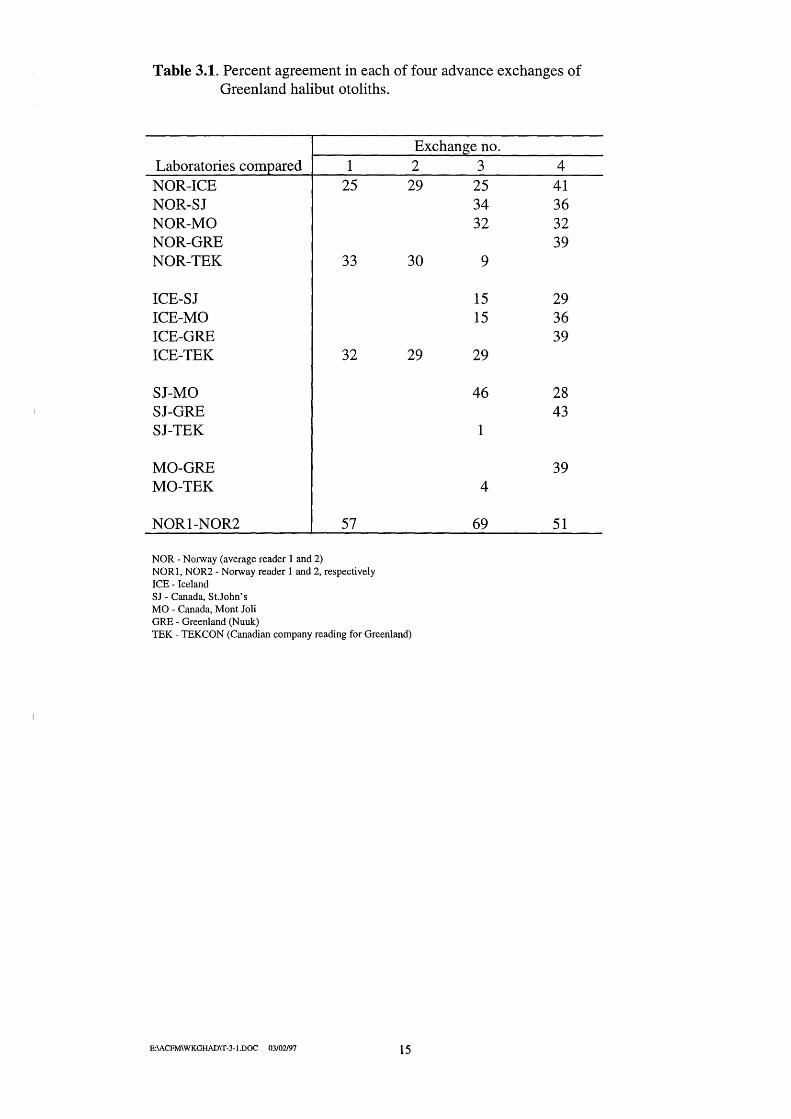
Table 3.1. Percent agreement in each of four advance exchanges of Greenland halibut otoliths.
Exchange no. Laboratories compared l 2 3 4 NOR-ICE 25 29 25 41 NOR-SJ 34 36 NOR-MO 32 32 NOR-GRE 39 NOR-TEK 33 30 9
ICE-SJ 15 29 ICE-M O 15 36 ICE-GRE 39 ICE-TEK 32 29 29
SJ-MO 46 28 SJ-GRE 43 SJ-TEK l
MO-GRE 39 MO-TEK 4
NOR1-NOR2 57 69 51
NOR -Norway (average reader l and 2) NOR l, NOR2- Norway reader l and 2, respectively ICE - Iceland SJ- Canada, St.John's MO- Canada, Mont Joli GRE- Greenland (Nuuk) TEK- TEKCON (Canadian company reading for Greenland)
E:\ACFM\WKGHAD\T-3-l.DOC 03/02197 15
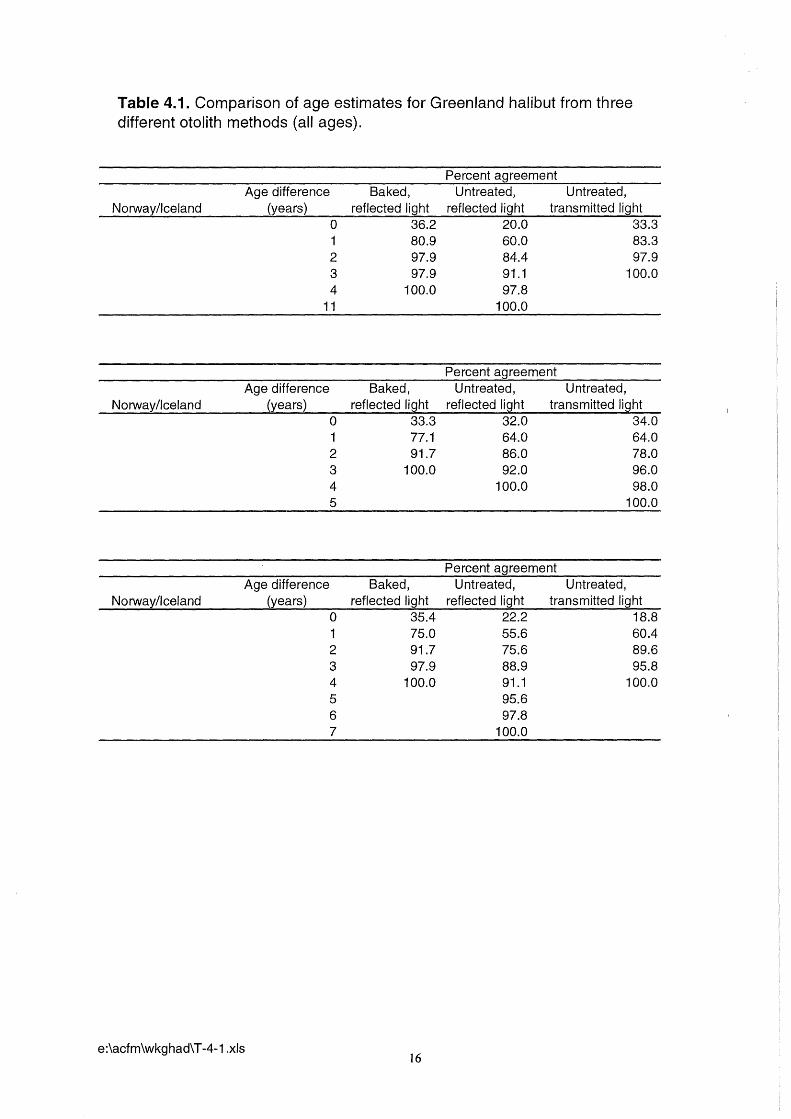
Table 4.1. Comparison of age estimates for Greenland halibut from three different otolith methods (all ages).
Age difference Baked, Norway/lceland (years) reflected light
o 36.2 1 80.9 2 97.9 3 97.9 4 100.0
11
Norway/lceland
Norway/lceland
Age difference (years)
Age difference (years)
e:\acfm\wkghad\ T -4-1 .xls
o 1 2 3 4 5
o 1 2
Baked, reflected light
33.3 77.1 91.7
100.0
Baked, reflected light
35.4 75.0 91.7
3 97.9 4 100.0 5 6 7
16
Percent agreement Untreated, Untreated,
reflected light transmitted light 20.0 33.3 60.0 83.3 84.4 97.9 91.1 100.0 97.8
100.0
Percent agreement Untreated,
reflected light 32.0 64.0 86.0 92.0
100.0
Untreated, transmitted light
34.0 64.0 78.0 96.0 98.0
100.0
Percent agreement Untreated,
reflected light 22.2 55.6 75.6 88.9 91.1 95.6 97.8
100.0
Untreated, transmitted light
18.8 60.4 89.6 95.8
100.0
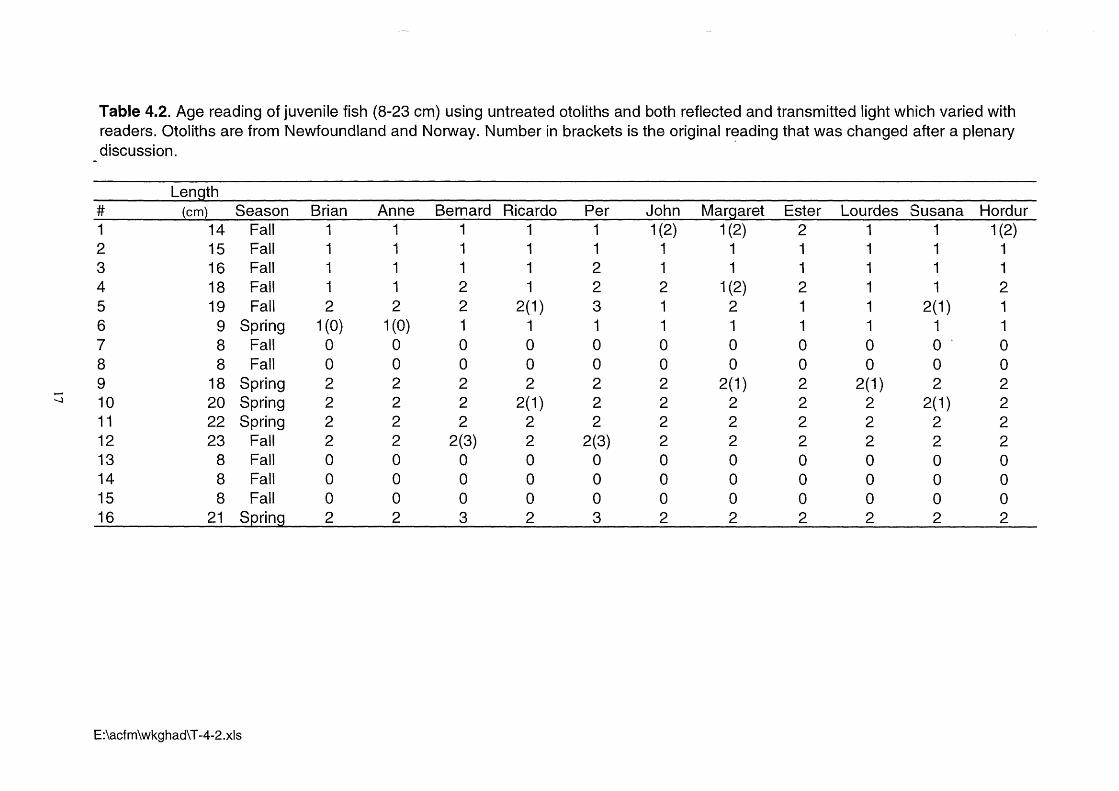
Table 4.2. Age reading of juvenile fish (8-23 cm) using untreated otoliths and both reflected and transmitted light which varied with readers. Otoliths are from Newfoundland and Norway. Number in brackets is the original r~ading that was changed after a plenary discussion.
Len th # {cm} Season Brian Anne Bernard Ricardo Per John Margaret Ester Lourdes Susana Hordur 1 14 Fall 1 1 1 1 1 1(2) 1(2) 2 1 1 1(2) 2 15 Fall 1 1 1 1 1 1 1 1 1 1 1 3 16 Fall 1 1 1 1 2 1 1 1 1 1 1 4 18 Fall 1 1 2 1 2 2 1 (2) 2 1 1 2 5 19 Fall 2 2 2 2(1) 3 1 2 1 1 2(1) 1 6 9 Spring 1(0) 1(0) 1 1 1 1 1 1 1 1 1 7 8 Fall o o o o o o o o o o· o 8 8 Fall o o o o o o o o o o o 9 18 Spring 2 2 2 2 2 2 2(1) 2 2(1) 2 2 --l 10 20 Spring 2 2 2 2(1) 2 2 2 2 2 2(1) 2 11 22 Spring 2 2 2 2 2 2 2 2 2 2 2 12 23 Fall 2 2 2(3) 2 2(3) 2 2 2 2 2 2 13 8 Fall o o o o o o o o o o o 14 8 Fall o o o o o o o o o o o 15 8 Fall o o o o o o o o o o o 16 21 Spring 2 2 3 2 3 2 2 2 2 2 2
E:\acfm\wkghad\T -4-2.xls
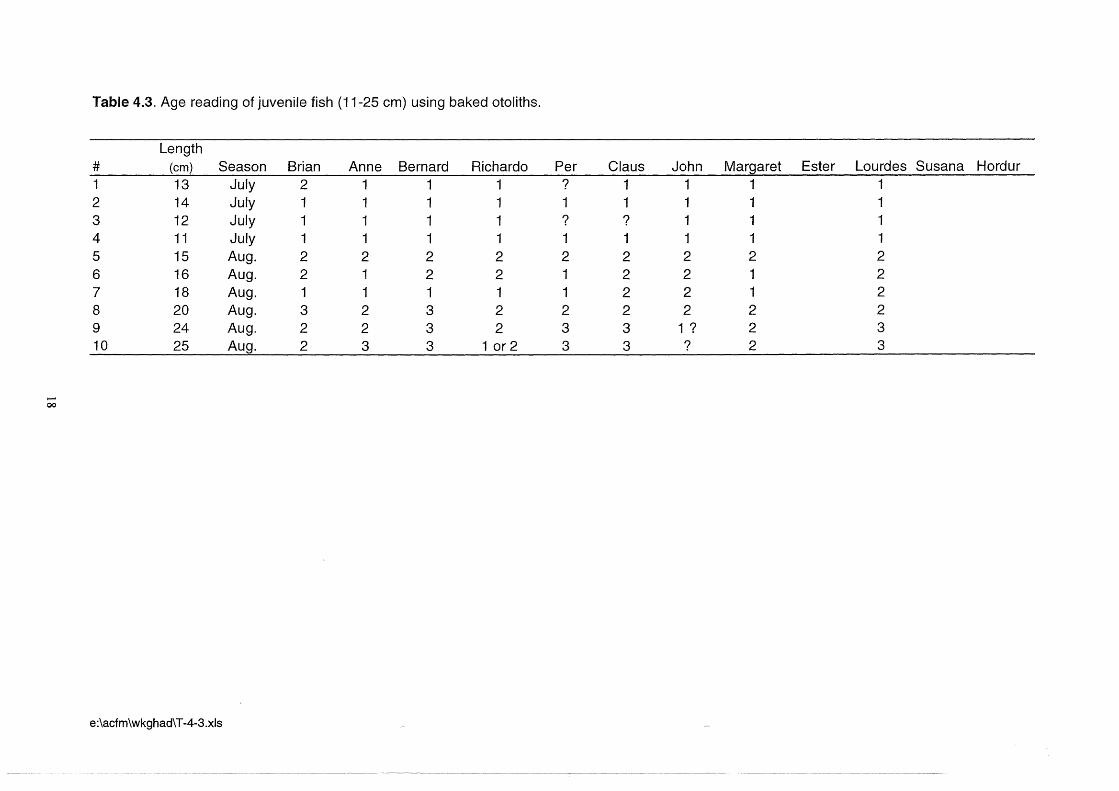
Table 4.3. Age reading of juvenile fish (11-25 cm) using baked otoliths.
Length # (cm) Season Brian Anne Bernard Richard o Per Claus John Margaret Ester Lourdes Susana Hordur 1 13 Jul y 2 1 1 1 ? 1 1 1 1 2 14 July 1 1 1 1 1 1 1 1 1 3 12 Jul y 1 1 1 1 ? ? 1 1 1 4 11 Jul y 1 1 1 1 1 1 1 1 1 5 15 Aug. 2 2 2 2 2 2 2 2 2 6 16 Aug. 2 1 2 2 1 2 2 1 2 7 18 Aug. 1 1 1 1 1 2 2 1 2 8 20 Aug. 3 2 3 2 2 2 2 2 2 9 24 Aug. 2 2 3 2 3 3 1 ? 2 3 10 25 Aug. 2 3 3 1 or 2 3 3 ? 2 3
....... 00
e:\acfm\wkghad\T-4-3.xls
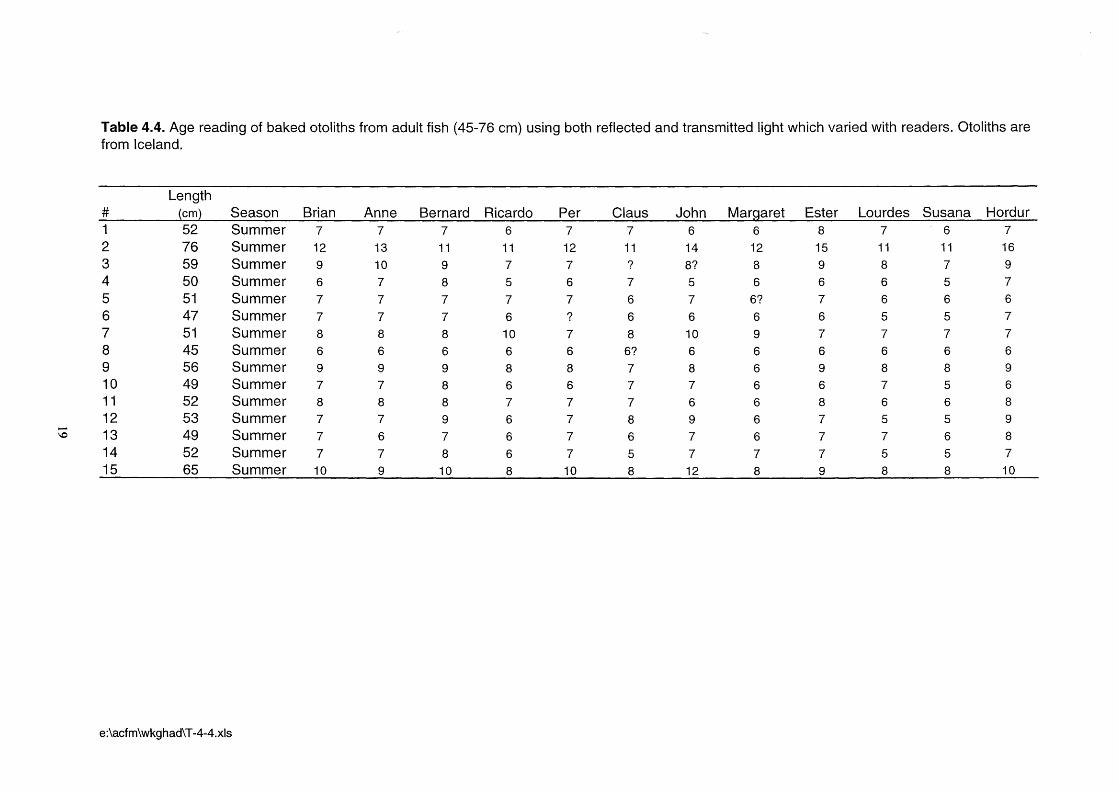
Table 4.4. Age reading of baked otoliths from adult fish (45-76 cm) using both reflected and transmitted light which varied with readers. Otoliths are from lceland.
Length # ~cm} Season Brian Anne Bernard Ricardo Per Claus John Margaret Ester Lourdes Susana Hordur 1 52 Summer 7 7 7 6 7 7 6 6 8 7 6 7
2 76 Summer 12 13 11 11 12 11 14 12 15 11 11 16
3 59 Summer 9 10 9 7 7 ? 8? 8 9 8 7 9
4 50 Summer 6 7 8 5 6 7 5 6 6 6 5 7
5 51 Summer 7 7 7 7 7 6 7 6? 7 6 6 6
6 47 Summer 7 7 7 6 ? 6 6 6 6 5 5 7
7 51 Summer 8 8 8 10 7 8 10 9 7 7 7 7
8 45 Summer 6 6 6 6 6 6? 6 6 6 6 6 6
9 56 Summer 9 9 9 8 8 7 8 6 9 8 8 9
10 49 Summer 7 7 8 6 6 7 7 6 6 7 5 6
11 52 Summer 8 8 8 7 7 7 6 6 8 6 6 8
12 53 Summer 7 7 9 6 7 8 9 6 7 5 5 9 \0 13 49 Summer 7 6 7 6 7 6 7 6 7 7 6 8
14 52 Summer 7 7 8 6 7 5 7 7 7 5 5 7 15 65 Summer 10 9 10 8 10 8 12 8 9 8 8 10
e:\acfm\wkghad\ T -4-4.xls
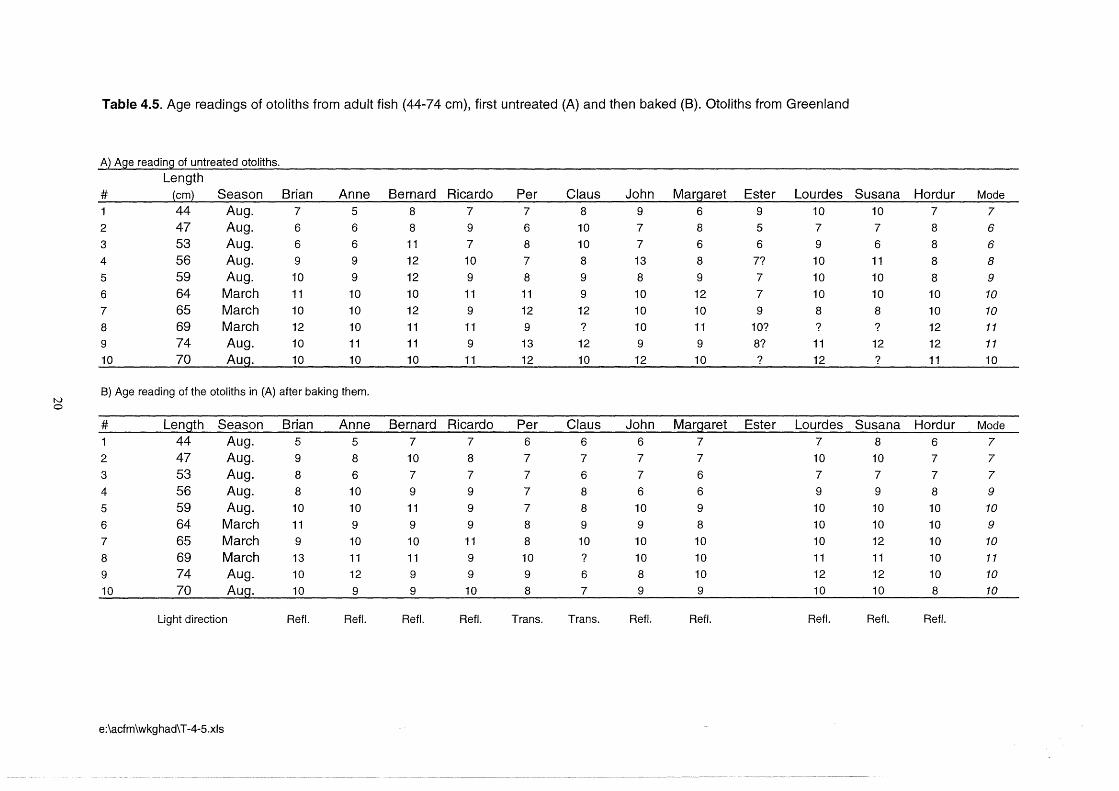
Table 4.5. Age readings of otoliths from adult fish (44-74 cm), first untreated (A) and then baked (B). Otoliths from Greenland
A) Age reading of untreated otoliths.
Length # {cm} Season Brian Anne Bernard Ricardo Per Claus John Margaret Ester Lourdes Susana Hordur Mode
44 Aug. 7 5 8 7 7 8 9 6 9 10 10 7 7
2 47 Aug. 6 6 8 9 6 10 7 8 5 7 7 8 6
3 53 Aug. 6 6 11 7 8 10 7 6 6 9 6 8 6
4 56 Aug. 9 9 12 10 7 8 13 8 7? 10 11 8 8
5 59 Aug. 10 9 12 9 8 9 8 9 7 10 10 8 9
6 64 March 11 10 10 11 11 9 10 12 7 10 10 10 10 7 65 March 10 10 12 9 12 12 10 10 9 8 8 10 10 8 69 March 12 10 11 11 9 ? 10 11 10? ? ? 12 11 9 74 Aug. 10 11 11 9 13 12 9 9 8? 11 12 12 11 10 70 Aug. 10 10 10 11 12 10 12 10 ? 12 ? 11 10
N 8) Age reading of the otoliths in (A) after baking them.
o
# Length Season Brian Anne Bernard Ricardo Per Claus John Margaret Ester Lourdes Susana Hordur Mode
1 44 Aug. 5 5 7 7 6 6 6 7 7 8 6 7
2 47 Aug. 9 8 10 8 7 7 7 7 10 10 7 7
3 53 Aug. 8 6 7 7 7 6 7 6 7 7 7 7
4 56 Aug. 8 10 9 9 7 8 6 6 9 9 8 9
5 59 Aug. 10 10 11 9 7 8 10 9 10 10 10 10 6 64 March 11 9 9 9 8 9 9 8 10 10 10 9
7 65 March 9 10 10 11 8 10 10 10 10 12 10 10 8 69 March 13 11 11 9 10 ? 10 10 11 11 10 11 9 74 Aug. 10 12 9 9 9 6 8 10 12 12 10 10 10 70 Aug. 10 9 9 10 8 7 9 9 10 10 8 10
Light direction Re fl. Re fl. Re fl. Re fl. Trans. Trans. Re fl. Re fl. Re fl. Re fl. Re fl.
e:\acfm\wkghad\ T -4-5.xls

Table 5.1. Various techniques currently used by the different laboratories for sampling and storing Greenland halibut otoliths.
Lab ora tory Both otoliths are Se ales washed in 1-2% Stored dry Stored in 50:50 removed ammonium solution glycerin:thymol solution
Greenland X X lee land X X X Norway X X Portugal X X Rus sia X X Spain X X Canada
Iqaluit X X MontJoli X X St.John's X X
USA Seattle X X
Table 5.2. Various preparation techniques currently used by the different laboratories.
Laboratory Soaked in Soakedin Baking 280°C, 30 Grinding if No Scales placed glycerin: glycerin: 190°C, min. necessary preparation between two thymol alcohol (25:75) 2-3 hours microscope
(50:50) for at for approx. 12 slides least 48 hours hours
Greenland X lee land X X Norway X Portugal X Russia X Spain X Canada
Iqaluit X MontJoli St.John's X
USA Seattle X
Table 5.3 Reading procedures currently used by the different laboratories.
Lab ora tory Left/ right Hyaline vs. Light direction Reading Magnification Other otolith opaque zones medium
Greenland Both Opaque Transmitted Water 16x lee land Left Hyaline Reflected Water 10-16x Norway Both Opaque Transmitted Water 16x Portugal Both Hyaline Reflected Oil 8-10x
Microphot Russia projector Spain Both Hyaline Reflected Glyc:alcohol 10-16x Canada
Iqaluit Left Hyaline Reflected Water lOx Mont Joli Left Hyaline Reflected Alcohol 10-16x St.John's Both Hyaline Reflected Alcohol lOx
USA Seattle Both Hyaline Reflected Water 9x Image analysis
E:\ACFM\WKGHAD\T-511-3.DOC 03/02/97 21
60jr1
50 r--
40~ 30
20
lO
0:: o w CD
~ 60 z
50
40
30
20
lO
4 8
~(~ ~~=;;-~~~:--TT TIT-l~ HAMILTON INLET BANK ~ -- LENGTH OISTRIBUTION(ALL FISH ----- LENGTH OISTRIBUTION (AGES)
OCT. 21-26, 1967 HAMILTON INLET BANK [J FROM COD STOMACHS
44 48
~
i -1
i l
l
l
Figure 2.1. Length distributions of otolith age-groups superimposed upon the length distributions of Greenland halibut (Reinhardtius hippoglossoides) from Hamilton Inlet Bank during October 11-17, 1966 and October 21-26, 1967. From Lear and Pitt (1975).
22
100
75
50
25 .... z YJ o u c:r YJ 0..
100
75
50
25
o
A
N ~ cD <D 0\ U) N ", ", l() l()
B
o CD CD ,.... CD N ,.... • ,._ &() ",
JAN. FEB. MAR. APR. MAY JUNI JULY AUG. SEPT. OCT. NOV.
Figure 2.4. Monthly incidence of opaque edge deposits on otoliths from all areas for: A, fish of all ages, and B, fish of age 0+ - 6 years inclusive. Numbers of fish are shown. From Lear and Pitt (1975).
23
20 ~----------------------------
18 ~ 0-Group G. halibut from 16 1 Pelagic 0-Group Gadoid 14 4 Surveys
12 ~ 10 i 8 ~
l 6 ~
\
4 ~
1992
~~~~~~~~~~ml~lu~J~~~~~~~~~~
20 ~--------------------------~ 18
16
14
12
10
8
6
4
2 o -+L--l'LB.---~~
1995
30 40 50 60 70 80 90100110120130140150 30 40 50 60 70 80 90100110120130140150
20 20 ~--------------------------~
18 l
t 16 J 53 l
...:l 14 i ~ 12 l
~ 10 ~ :::s l
l3 8~ o z 6 ~
4 -j !
1993
30 40 50 60 70 80 90100110120130140150
:: j 14 ~ 12i 10 ~
l
: 1 2 ~
1994
o ~~~~~~~------~~--~~ 30 40 50 60 70 80 90 100 110 120 130140150
Length (mm)
l
18 ~
16
14
12
10
8
6
4 l
2 l
1996
30 40 50 60 70 80 90 100110120130140150
Length (mm)
Figure 2.2. Length distributions of 0-group Greenland from Canadian pelagic 0-group gadoid surveys outside eastern Newfoundland in August 1992-1996.
24
100 100 1979 1984
80 18.5 80
60 60 10.5
40 40
20 20
o o o 10 20 30 40 50 60 70 o 10 20 30 40 50 60 70
100 100 10.5 1980 1985
80 26.5 80
60 60
40 40
20 20
o o +-' o 10 20 30 40 50 60 70 o 10 20 30 40 50 60 70 Q) 100 100 00
~ 1981 12.5 1986 Q) 10.5 o.. 80 80
o ~
~ 60 60 Q)
E .40 40 '"O
Q)
t+=: 20 20 ·~ .l:1 00 o o
100 o 10 20 30 40 50 60 70 100 o 10 20 30 40 50 60 70
1982 1987 80 18.5 80
60 60 18.5
40 40
20 20
o o 100 o 10 20 30 40 50 60 70 o 10 20 30 40 50 60 70
1983 Length (cm) 80
60 32.5
40
20
o o 10 20 30 40 50 60 70
Length (cm) Figure 2.3. Length distributions of Greenland halibut from Canadian shrimp surveys conducted mainly
in July off Labrador in 1979-1987.
25
January- February
lS 40 45 SOtm
March-April
50 em
50 em
July -August
o
November - December
Figure 2.5. Length frequency percentages of fish from shrimp trawl, only fish under 50 cm used. Yearclasses indicated by Arabic numerals. Black sections used for calculation of mean lengths of year-classes. Data from nursery ground, coastal area south of Godthåb, (J anuaryFebruary 1954-58, 1960-63; March-April 1954-58, 1960-63; May-June 1956, 1958-61, 1963; July-August 1953-63; September-October 1953, 1955-57, 1960-62; November December 1953-55, 1959-62). From Smidt (1969).
26
40 40
35 0-Group G. halibut 1981 35 1986
30 Nonvegian Surveys
30 Barents Sea 25 Aug.-Sept. 25
20 20
15 15
10 10
5 5
o o 30 40 50 60 70 80 90 20 30 40 50 60 70 80 90
40 40
35 1982 35 1987
30 30
25 25
20 20
15 15
10 10
5 5
o o 30 40 50 60 70 80 90 4020 30 40 50 60 70 80 90
40
35 1983
35 1988
30 30
-s 25 25 ([)
20 o 20 l-o ([)
p... 15 15
10 10
5 5
o o 20 30 40 50 60 70 80 90 30 40 50 60 70 80
40 40
35 1984
35
30 30
25 25
20 20
15 15
10 10
5 5
o o 20 30 40 50 60 70 80 90 100 30 40 50 60 70 80
40 Length (mm)
35 1985
30
25
20
15
10
5
o 30 40 50 60 70 80 90
Figure 2.6. Length distributions of 0-group Greenland from joint Norwegian-Russian pelagic 0-group gadoid surveys in the Barents Sea and Svalbard areas in August-September 1981-1988 (i.e., befare the recruitment failure) and in 1995 (seem to be a relative good year-class compared to the surrounding ones).
27
4000
3500
3000
--- 2500 00 o o o "-"' 2000 (!) o ~ ~ 1500 ~ = < 1000
500
o
10
8
6
4
2
o
Norwegian Shriinp Survey 1988 August
15
o 5 10 15 20 25 30 35 40 45 50 55
Length ( ctn)
1996 June
21
o 5 10 15 20 25 30 35 40 45 50 55
Length (cm)
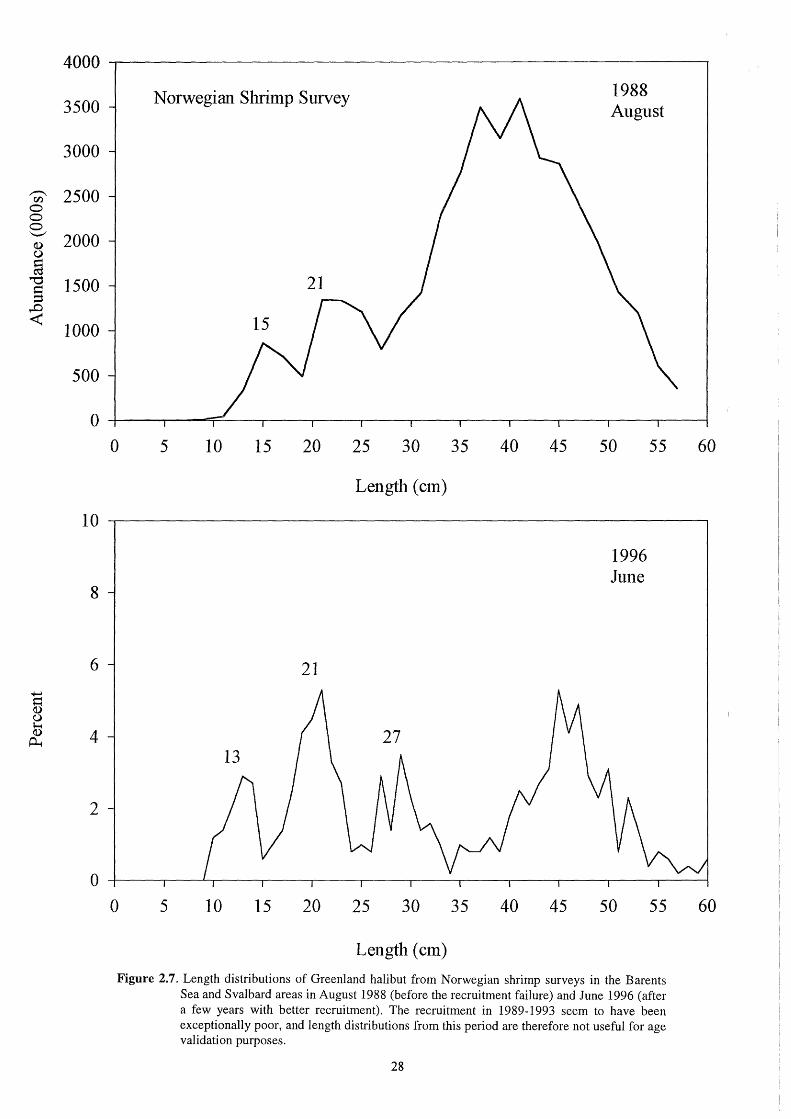
Figure 2.7. Length distributions of Greenland halibut from Norwegian shrimp surveys in the Barents Sea and Svalbard areas in August 1988 (before the recruitment failure) and June 1996 (after a few years with better recruitment). The recruitment in 1989-1993 seem to have been exceptionally poor, and length distributions from this period are therefore not useful for age validation purposes.
28
60
60
14 -r
+ 12 + t+
+ 10 t +++
++ w
li ++ +
~ ++ + + ++ ++ ++ +
o 2 4 6 8 10 12 14
NFL
14 12 ++K 10 ++
+++ + 0:: 8 /+ o z 6
4 +
2 o
o 2 4 6 8 10 12 14
NFL
14 + 12 ++ +
1~ t ++ + + + + ++ +
0:: + + o 61 + z l + +
4f + ++ 2 ++ o
o 2 4 6 8 10 12 14
ICE l
i ! L_
Figure 4.1. Pairwise laboratory comparisons of age readings using untreated otoliths read in transmitted light (TLNT-method). ICE=Iceland, NFL=St.John's and NOR=Norway. Note that some of the crosses rna y represent more than one fish.
29

r---------------------
l l
l l l l
l !
l l
l j
l l l
l l l
l
w ~
0::: o z
0::: o z
~~! + ~i + + ~ 1~, 6 + t +
~ + + o y
o 2 4 6 8 10 12 14 16 18
NFL
~~I 14 12 + 1~ ± + ~L +
o l. o 2 4 6 8 10 12 14 16 18
NFL
18 16 + / 14 + /
~~1L+//++ 8 + ++ $+ 6-+-4 l
2 !+ + o t l l l l l
+
o 2 4 6 8 10 12 14 16 18
JCE
Figure 4.2. Pairwise laboratory comparisons of age readings using untreated otoliths read in reflected light (RLNT-method). ICE=Iceland, NFL=St.John's and NOR=Norway. Note that some of the crosses may represent more than one fish.
30
14 + 12 ++ +/.;:· 10 + ++ ++ + a+ ++
w + 2 6f + +++ +
H +
l l l l
o 2 4 6 8 10 12 14
NFL
14 T 12 + + 10
++ + ++
0:: 8 ++
+++ + o
6 + + +
z + 4
2
2 4 6 8 10 12 14
NFL
~------------------------------------~
14 J 12 ++ + 10
+ + +
:1 +
0:: + ++ o + + + z
+ ++
2- + o ---i
o 2 4 6 8 10 12 14
ICE
Figure 4.3. Pairwise laboratory comparisons of age readings using baked otoliths read in reflected light (RLBA-method). ICE=Iceland, NFL=St.John's and NOR=Norway. Note that some of the crosses may represent more than one fish.
31
.....-... U) -m Q) ~
..............
C) c: ·--c m Q) -Q) C)
w m N
c: ·-Q) o c: Q) -Q) ...... ...... ·-c
w u -l
a: o z-
..J u. z
l
a: .. 0-z-
-1 u. z
l
wu--
Comparison among readers and methods
• • ......... •
• -. .... . .. .. -- --------.-----.------.. -.. . ... -------------------'-
• • •
• •
• • .. •
••• • • -.... t. •• - • ~ ---- e Ill a A- -- --e-e- --------e .. • • • • • • •
• • • ..... • • ---.-------------.---- ---·------------ ..
• .. • •
•
• • • • • •• • •
• • •
•
.. -.... rr:~ .. -:-.~.------••• ..
10 20 30 40 50 60 70 80 10 20 30 40 50 60 70 80 10 20 30 40 50 60 70 80 Transmitted-no trmt. Reflected-no trmt. Reflected-baked
Length (cm) age002.stg
Figure 4.4. Comparison among readers and methods. Residuals are plotted against fish length. Regression lines have been drawn to illustrate any trends in the relations to length. Nr-'-' that the -11 outlier has been 01. ,d in the plot.
Transmitted light: no treatment
18~~~~==~~--~~----~~~~~~~--~~ 17 16 15 14 13 12 11 10
w 9 ~ 8
7 6 5 4 3 2 1 o~~~-L--~--~------~----~~--~~~----~----~ 10 20 30 40 50 60 70 80
Length (cm) age001 a.stg
Reflected light: no treatment
20 30
Length (cm) age0001b.stg
Reflected light: baked 18~~~~~~--~~----~----~--~~~~~~~--~~
~~ ••••••• ~ ~~~: ~r li J• l !•••·••··••••••••••••••••••••• 13 12 11 10
w 9 (!) < 8
7 6 5 4 3 2 1 o~~---L--~--~--~--~----~------~~----~----~ 10 20 30 40 50 60 70 80
LENGTH age001c.stg
Figure 4.5. Age-length plot of Greenland halibut aged in the experiment. Comparison of three readers by method.
33
Norwegian age reader 18rr~==============~-:-----:~----,------::---~l 17 ..... '0.. Transmitted- no treatment ....... ) ............................... ~ .............................. ~ ............................ ) ............................ .
16 ..... '0... Reflected - no treatment ......... ~ ............................... j .............................. f······························l······························ 15 ..... -...._..._ Reflected - baked ·········!·······························[·······························~·······························!······························
l L lJJ!; ~i = ; 1
10 ······························f······························i······························+·····························+············~·.
L J l ~f.~~~~~:t:~ ~l ! ::::::::::::::::::::::::::::::t::::::::::::::::::::::::::::::j::·········· ··0··-~::::::!::::::::::::j::::::::::::::::::::::::::::::f::::::::::::::::::::::::::::::j::::::::::::::::::::::::::::::
r r:? ~ 11 r r o~-'~~~~~~--~~~----~~----~~~~~~--~~~
10 20 30 40 50 60 70 80
Length {cm) age003a.stg
lcelandic age reader
18~~==~=====c==~~~~--r--~--r---~~--~~ 17 ····· '0.. Transmitted - no treatment ......... j ............................... l······························f······················O···J······························ 16 ····· '0... Reflected - no treatment ·········~·······························l······························t······························i······························
1~ ?::r~=~:~=~=~~·····················•••••••••l••••·•••••••• t ~ J••;:~ !:•••·····•••••••••·· ~ ~ ::::::::::::::::::::::::::::::t::::::::::::::::::::::::::::::l:::::::::::::::::::::::::::::t:::::::::::::::::::::::::::::[:::::::::::::::~···~··::t··::~:::~: : .. ~. ····::1 .. ::::::::: .... ::::::::::::::: 1 o ······························f······························!······························+··················o·····Q-············· • . ···· ··········O·~·····························
~ 9 ······························f······························i······························~···O····O···········: • ·· ···· • :·®····@··············+····························· -« 8 ······························f······························l·······················O····I·······®·· ··O···! ···O····O·CD·························i······························
7 ······························f······························i······················O . ··•··(()···<!>-····O··f········O···············i······························
o~~--~~~----~~--~~~~~~~~--~~~--~~~--~
10 20 30 40 50 60 70 80
Length {cm) age003b.stg
Newfoundland age reader
18~~==~====~==~~~~~~--~----~--~~
~ ~ ~ ~~~~:c~~~~dn~ ~~e:;~~:;nt :::::::l:::::::::::::::::::::::::::::::l::::::::::::::::::::::::::::::i::::::::::::::::::::::::::::::l:::::::::::::::::::::::::::::: 15 'a...... Reflected - baked ·······i·······························l·······························t······························l······························
1 ·······~······························r·····························r······························r·····························t······························r-···························· o~~--~--~~~----~~----~~~~~~----~~--~~~
10 20 30 40 50 60 70 80
Length {cm) age003c.stg
Figure 4.6. Age-length plot of Greenland halibut aged in the experiment. Comparison of all three methods for each reader.
34
w
" w <( Vl
Length versus age: ''preferred method'' 18~~~~~~~~~~~~--~~~~~~~~~--~~
17 ····· "Q._ Norway: transmitted light - no treatment · ·····························~······························ ···························· 16 ····· 'R lceland: reflected light- baked · ·····························~····························· ····························
15 ····· " Newfoundland: reflected light- no treatment · ·····························~······························ ···························· 14 ......................................................... ······························~····························· ·····························~······························ ·························· 13 ......................................................... ······························~···························
12
~~ [:::::::::::::::::::::::::::: ::::::::::::::::::::::::::::: ::::::::::::::::::::::::::···]·························· 9 8 ~ , ......................................................... ··········=·····~-~~~ -~ 5 -························ 4 3 2 ...................................................................................................
~ ~ ............................................................................................................................................................................ 1
10 20 30 40 50
Length (cm) Figure 4.7. Age-length plot of Greenland halibut aged in the experiment. Comparison of the three
readers each using their most familiar method.
60 70 80
age004.stg
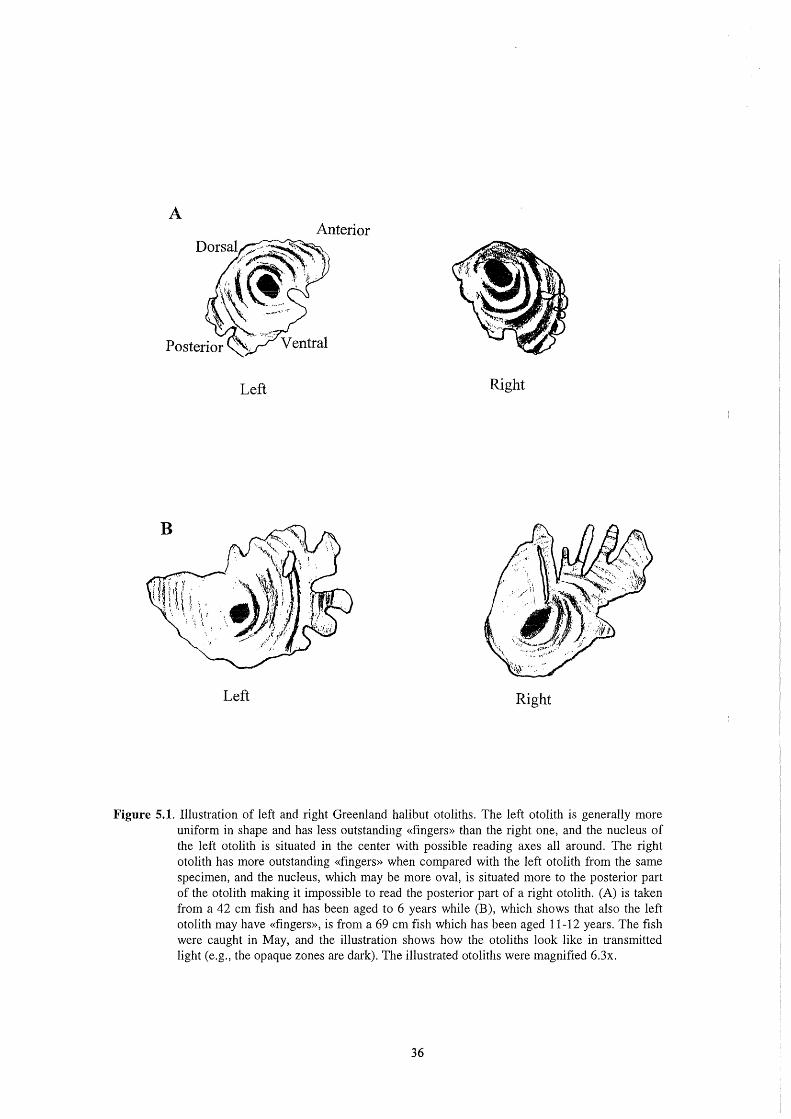
A
Left Right
Left Right
Figure 5.1. Illustration of left and right Greenland halibut otoliths. The left otolith is generally more uniform in shape and has less outstanding «fingers» than the right one, and the nucleus of the left otolith is situated in the center with possible reading axes all around. The right otolith has more outstanding «fingers» when compared with the left otolith from the same specimen, and the nucleus, which may be more oval, is situated more to the posterior part of the otolith making it impossible to read the posterior part of a right otolith. (A) is taken from a 42 cm fish and has been aged to 6 years while (B), which shows that also the left otolith may have «fingers», is from a 69 cm fish which has been aged 11-12 years. The fish were caught in May, and the illustration shows how the otoliths look like in transmitted light (e.g., the opaque zones are dark). The illustrated otoliths were magnified 6.3x.
36
APPENDIX l
BIBLIOGRAPHY
Alton, M.S., Bakkala, R.G., Walters, G.E. and Munro, P.T. 1988. Greenland turbot, Reinhardtius hippoglossoides, of the eastern Bering Sea and Aleutian Islands region. NOAA Technical Report NMFS 71, 31 pp.
Anon. 1994. Report of the workshop on sampling strategies for age and maturity. ICES CM 1994/ D:1, 67 pp.
Armstrong, D.W. and Ilardia, S. 1986. On bias in estimates of population parameters obtained by means of length-stratified sampling for age/length keys. ICES, Doc. C.M. 1986/G: 10.
Atkinson, D. B., Bowering, W. R., Parsons D. G., Horsted Sv. Aa., and Minet J. P. 1982. A review of the biology and fisheries for roundnose grenadier, Greenland halibut and northern shrimp in Davis Strait. NAFO Sei. Coun. Studies. 3: 7-27.
Beamish, R.J. and McFarlane,G.A. 1983. The forgotten requirement for age validation in fisheries biology. Trans.Amer.Fish.Soc. 112(6): 735-743.
Beamish, R.J. and Fournier, D.A. 1981. A method for comparing the precision of aset of age determinations. Can. J. Fish. Aquat. Sei. 38: 982 - 983.
Bernard, D.R. 1981. Multivariate analysis as a means of comparing growth in fish. Can. J. Fish. Aquat. Sei., 1981. 38(2): 233-236.
Blacker, R.W. 1974. Recent advances in otolith studies. In Barden Jones, F.R. [ed]. Sea fisheries research. Eik Science, London: 67-90. Doc.66/69. Ser. No. 1686.
Boehlert, G.W. 1985. Using objective criteria and multiple regression models for age determination in fishes. Fish. Bull. 83(2): 103-117.
Boje, J. 1991. An assessment of the Greenland halibut stock component in NAFO Sub-areas 0+1. NAFO SCR Doc. 91/38. 12 p.
Boje, J. and Riget, F. 1989. Results of the 1986, 1987 and 1989 Greenland-Canada Greenland halibut otolith exchange. NAFO SCR Doc. 89/42. 3p.
Boje, J. and Jørgensen, O.A. 1991. Growth of Greenland halibut in the Northwest Atlantic. ICES Demersal Fish Committee CM 1991/G:40. 12 p.
Bowering, W.R. 1978. Age and growth of the Greenland halibut, Reinhardtius hippoglossoides (Walbaum), in ICNAF Sub-areas 2-4. ICNAF Res Bull No. 13: 5-10.
Bowering, W.R. 1981. Greenland halibut in the Gulf of St. Lawrence- from immigrants to emigrants. CAFSAC Res. Doc. 81/55. 18 p.
Bowering, W. R. 1982. Population dynamics of Greenland halibut in the Gulf of St. Lawrence. J. Northw. Atl. Fish. Sei. 3: 141- 147.
Bowering, W. R. 1983. Age, growth, and sexual maturity of Greenland halibut, Reinhardtius hippoglossoides (Walbaum), in the Canadian Northwest Atlantic. Fish. Bull. 81: 599-611.
Bowering, W.R. and Stansbury, D.E. 1984. Regressions of weight on length for Greenland halibut, Reinhardtius hippoglossoides, from Canadian waters of the northwest Atlantic. J.Northw.Atl.Fish.Sci., vol. 5: 107-108.
E:\ACFM\WKGHAD\REPORT.DOC 05/02/97 37
Bowering, W.R. and Brodie, W.B. 1988. A review of the status of the Greenland halibut resources in NAFO Subarea 2 and Divisions 3K and 3L. NAFO SCR Doc. 88/69. 23 p.
Bowering, W.R. and Brodie, W.B. 1991. Distribution of cornmercial flatfishes in the Newfoundland- Labrador region of the Canadian Northwest Atlantic and changes in certain biological parameters since exploitation. Neth. J. Sea. Res. 27(3/4): 407-422.
Bradford, M.J. 1991. Effects of ageing errors on recruitment time series estimated from sequential population analysis. Can. J. Fish. Aquat. Sei. 48: 555- 558.
Brothers, E.B., Mathews, C.P. and Lasker, R. 1976. Daily growth increments in otoliths from larval and adult fishes. U.S.Fish.Bull. 74: 1-8.
de Cardenas, E. 1996. The females ration by length as an indicator of sexual differences in mortality of Greenland halibut (Reinhardtius hippoglossoides) at ages 8+. NAFO SCR Doc. 96/35. lO p.
Chang, W.Y.B. 1982. A statistical method for evaluating the reproducibility of age determination. Can. J. Fish. Aquat. Sei. 39: 1208- 1210.
Chaine, J. and Duvergier, J. 1934. Research on the otoliths of fishes, a descriptive and comparative study of the sagitta of teleosts. Actes Soc. Linn. Bordeaux 86: 5-24.
Chilton, D.E. and Beamish, R.J. 1982. Age determination methods for fishes studied by the groundfish program at the Pacific Biological Station. Can. Spee. Publ.Fish. Aquat.Sci. 60: l 02 p.
Christensen, J.M. 1964. Burning of otoliths, a technique for age determination of soles and other fish. J. Cons. Int. Explor. Mer. 29: 73-81.
Crawford, R. E. (1992). Life history of the Davis Strait Greenland halibut, with reference to the Cumberland Sound fishery. Can. Man. Rep. Fish. Aquat. Sei. No. 2130, 19 p.
Ernst, P. and Borrman, H. 1987. Investigations on growth of the Greenland halibut stock (Reinhardtius hippoglossoides Walb.) off Canada and West Greenland. NAFO SCR Doc. 87/75. 15 p.
Flatman, S. 1990. The evaluation of biological sampling targets and the precision of estimated age composition with reference to demersal fish sampling in ICES Divisions VHa, VIIe, and VIIf,g. MAFF Internal Report No. 21.
Fryd, C. 1901. Fish otoliths in relation to importance for systematics and aging. Inaugural-dissertation, Univ.Kiel, Germany.
Godø, O.R. and Haug, T. 1989. A review of the natura! history, fisheries, and management of Greenland halibut (Reinhardtius hippoglossoides) in the eastern Norwegian and Barents Seas. J. Cons. Ciem. 46(1): 62-75.
Gudmunsdottir, A. Steinarsson, B.A. and Stefansson, G. 1988. A simulation procedure to evaluate the efficiency of some otolith and length sampling schemes. ICES, Doc. C.M. 1988/D:14.
Gulland, J.A. 1955. Estimation of growth and mortality in cornmercial fish populations. Fish., Invest., Lond. (2),18(9). 49 p.
Haug, T. and Gulliksen, J. 1982. Size, age, occurrence, growth, and food of Greenland halibut, Reinhardtius hippoglossoides (Walbaum) in coastal waters of western Spitzbergen. Sarsia 67 (4): 293-297.
Haug, T., Bjørke, H. and Falk-Petersen, I-B. 1989. The distribution, size composition, and feeding of larval Greenland halibut (Reinhardtius hippoglossoides Walbaum) in the eastern Norwegian and Barents Seas. Rapp. P.-v. Reun.Cons.int.Explor.Mer, 191:226-232.
Jensen, A.S. 1935. The Greenland halibut (Reinhardtius hippoglossoides) its development and migrations. K. Dan. Vidensk. Selsk. Skr. 9Rk. 6: 1-32.
E:\ACFM\WKGHAD\REPORT.DOC 05/02/97 38

Keir, R.S. 1960. Answers to the questionnaire on age reading. ICNAF MD. 4. Ser.No. 714
Kimura, D.K. 1977. Statistical assessment of the age-length key. J. Fish. Res. Board Can. 34: 317-324.
Kimura, D.K. and J.J. Lyous 1991. Between reader bias and variability in the age-determination process. Fish. Bull.89: 53-60.
Kochkin, P.N. 1980. How to prepare fish vertebrae for age determination. J. Ichthyol. 20(6): 153-157.
Koslow, J.A. 1984. Recruitment patterns in northwest Atlantic fish stocks. Can. J. Fish. Aquat. Sei. 41(12): 1722-1729.
Kovtsova, M.V. and Nizovtsev, G.P. 1985. Peculiarities of growth and maturation of Green-land halibut of the Norwegian-Barents Sea stock in 1971-1984. ICES C.M. 1985/G:7. 17 p.
Krzykawski, S. 1975. Age and growth rate of the Greenland halibut Reinhardtius hippoglossoides (Walbaum) from the Northern Atlantic. ICES C.M. 1975/F: 24. 8 p.
Krzykawski, S. 1976. A characteristic of growth of Greenland halibut, Reinhardtius hippoglossoides (Walbaum), from the North Atlantic. Acta Icthyol Piscatoria. 6(2): 79-102.
Krzykawski, S. 1991. Morphometry and growth of Greenland halibut Reinhardtius hippo-glossoides (Walbaum, 1792) from the Barents Sea. Acta Ichthyol Piscatoria 21(2) 1991: 87-106.
Krzykawski, S. 1992. Biometric characters and growth of Greenland halibut Reinhardtius hippoglossoides (Walbaum, 1792) off Labrador. Acta Ichthyol Piscatoria. 22( l) 1992: 97-111.
Lahn Johannessen, J.H. 1965. Blåkveiten og blåkveitefisket på egga. University of Bergen. Thesis in zoology. 52 pp., 33 tables, 24 figures. (In Norwegian).
Lai, H.L. 1987. Optimum allocation for estimating age composition using age-length key. Fishery Bulletin, 85(2): 179-185.
Leaman, B.M. and Beamish, R.J. 1984: Ecological and management implications of longevity in some Northeast Pacific groundfishes. Bull.42. Int. North. Pac. Fish. Comm. 1984.
Lear, W.H. 1970a. Catch statistics, length and age composition of Greenland halibut in the Newfoundland area. Fish. Res. Board Can. Tech. Rep. No. 179. 27 p.
Lear, W. H. 1970b. The biology and fishery of the Greenland halibut (Reinhardtius hippoglossoides Walbaum) in the Newfoundland area. M.Sc. thesis, Memorial Univ. Newfoundland, St. John's, Nfld. 132 p.
Lear, W.H. and T.K. Pitt. 1975. Otolith age validation of Greenland halibut (Reinhardtius hippoglossoides). J. Fish. Res. Bd. Can. 32(2): 289-292.
Mathias, J. and Keast, M. 1996. Status of the Greenland halibut (Reinhardtius hippoglossoides) fishery in Cumberland Sound, Baffin Island 1987-95. NAFO SCR Doc. 96171. 20 p.
Mikawa, M. 1969. Ecology of the lesser halibut, Reinhardtius hippoglossoides matsuurae Jordan and Snyder. Translation series (Fish. Res. Board Can.) No. 1260. 106 p.
Milinskii, G.l. 1968. The biology and fisheries of Greenland halibut of the Barents Sea. Translation series (Fish. Res. Board Can.) No. 1159. 22 p.
Morgan, M.J. and Bowering, W.R. 1995. Maturity at size and age of Greenland halibut in NAFO Sub-area 2 and Divisions 3KLM. NAFO SCR Doc. 95/54. 19 p.
E:\ACFM\WKGHAD\REPORT.DOC 05/02/97 39
Morgan, M.J. and Bowering, W.R. 1997. Temporal and geographical variation in maturity at length and age of Greenland halibut (Reinhardtius hippoglossoides) from the Canadian Northwest Atlantic with implications for fisheries management. ICES J. Mar. Sei. (In Press).
Mulligan, T.J. and Leaman, B.M. 1992. Length-at-age analysis: Can you get what you see? Can. J. Fish. Aquat. Sei. 49(4): 632-643.
Nicholson, M.D. and Armstrong, D.W. 1974. A note on a possible source of bias in the estimation of mean length at age. ICES, C.M. 1974/F:35.
Nizovtsev, G.P. 1987. Growth pattern of Greenland halibut (Reinhardtius hippoglossoides W.) from the north east Atlantic. NAFO SCR Doc. 87/89. 20 p.
Nizovtsev, G.P. 1991. Growth patterns of Greenland halibut (Reinhardtius hippoglossoides) in the Northwest Atlantic. NAFO. Sei. Coun. Studies, 15: 35-41.
Pope, J.G., and Knights, B. 1975. Sources of variation in catch at age data and the optimal use of age reading effort. ICES, Doc. 1975/F: 20.
Pope, J.G., and Grey, D. 1983. An investigation of the relationship between the precision of assessment data and the precision of total allowable catches, p. 151-157. In W.G. Doubleday and Rivard, W. [ed.]. Sampling commercial catches of marine fish and invertebrates. Can. Spee. Publ. Fish. Aquat. Sei. 66.
Richards, L.J., Schnute, J.T., Kronlund, A.R. and Beamish, R.J. 1992. Statistical models for the analysis of ageing error. Can. J. Fish. Aquat. Sei. 48: 1801- 1815.
Riget, F. and Boje, J. 1987. Biology and fishery of Greenland halibut at West Greenland. NAFO SCR Doc. 87/81. 29 p.
Riget, F. and Boje, J. 1988. Mean length at age of Atlantic halibut (Hippoglossus hippoglossus) in West Greenland. NAFO SCR Doc. 88/10.4 p.
Riget, F. and Boje, J. 1989. Fishery and some biological aspects of Greenland halibut (Reinhardtius hippoglossoides) in West Greenland waters. NAFO Sei. Coun. Studies, 13: 41-52.
Rivard, D. 1989. Overview of the systematic, structural, and sampling errors in cohort analysis. Am. Fish. Soc. Symp. 6: 49- 65.
Rivard, D. and Foy, M.G. 1987. An analysis of errors in catch projections for Canadian Atlantic fish stocks. Can. J. Fish. Aquat. Sei. 44(5): 967-981.
Schouten, H.J.A. 1982. Measuring pairwise interobserver agreement when all subjects are judged by the same observers. Statistica Neerlandica 36: 45- 61.
Schweigert, J.F. and Siber, J.R. 1983. Optimizing survey design for determining age structure of fish stocks: an example from British Columbia Pacific herring (Clupea harengus pallasi). Can. J. Fish. Aquat. Sei. 40: 588-597.
Scott, T. 1906. Observations on the otoliths of some teleostean fishes. 24th Ann. Rep. Fish. Bd. Scot. Part 3 (Sci.Invest.): 48-82.
Shepherd, C.E. 1910. Comparisons of otoliths found in fishes. The Zoolog., London, SerA, 14: 292-298.
Shepherd, J.G. and Nicholson, M.D. 1986. Use and abuse of multiplicative models in the analysis of fish catchat-age data. The Statistician 35(2): 221- 227.
Sigurdsson, A. 1979. The Greenland halibut, Reinhardtius hippoglossoides (Walb.), at Iceland. In Hafrannsoknir 16. 31 pp., 18 figures, 21 tables. (Summary, figure and table legends in English).
E:\ACFM\WKGHAD\REPORT.DOC 05/02/97 40
Skalkin, V.A. 1963. Otoliths of Some Fishes in Far Eastern Seas. IZV.TINRO 49: 159-199.
Smidt, E. 1969a. The Greenland halibut (Reinhardtius hippoglossoides), biology and exploitation in Greenland waters. Medd. Dan. Fisk. Havunders. 6: 79-148.
Smidt, E. 1969b. The Greenland halibut. Translated from Tidsskrifted Grønland, p 259-366, by the Translation Bureau, Multilingual Serv. Div., Dept. of Sec. of State of Canada, Trans. Ser. No. 3094.
Sorokin, V.P. 1980. Some features of the biology of the Greenland halibut, Reinhardtius hippoglossoides (Walbaum), in the Barents Sea. Can. Trans. Fish. and Aquat. Sei. No. 4672. 35 p.
Tanaka, S. 1953. Precision of age-composition of fish estimated by double sampling method using the length for stratification. Bull. Jap. Soc. Sei. Fish. 19: 657- 670.
Trippel, E.A. and Harvey, H.H., 1991. Comparison of methods used to estimate age and length of fishes at sexual maturity using populations of white sucker (Catostomus commersoni). Can. J. Fish. Aquat. Sei. 48: 1446-1459.
Vernidub, M.F. and Panin, K.I. 1983. Some data on the systematic position and biology of a Pacific member of the genus Reinhardtius Gill. Can.Trans.Fish and Aquat. Sei. No. 5018. 35 p.
Westrheim, S.J. and Ricker, W.E. 1978. Bias in using an age-length key to estimate age-frequency distributions. J.Fish.Res.Bd.Can. 35(2): 184-189.
Wiedemann Smith, S. 1968. Otolith age reading by means of surface structure examination. J.Cons.Int.Explor.Mer. 32: 270-277.
Yatsu, A. and Jørgensen, O. 1989. Distribution, abundance, size, age, gonad index and stomach contents of Greenland halibut (Reinhardtius hippoglossoides) off West Greenland in September/October 1988. NAFO SCR Doc. 89/31. 12 p.
E:\ACFM\WKGHAD\REPORT.DOC 05/02/97 41
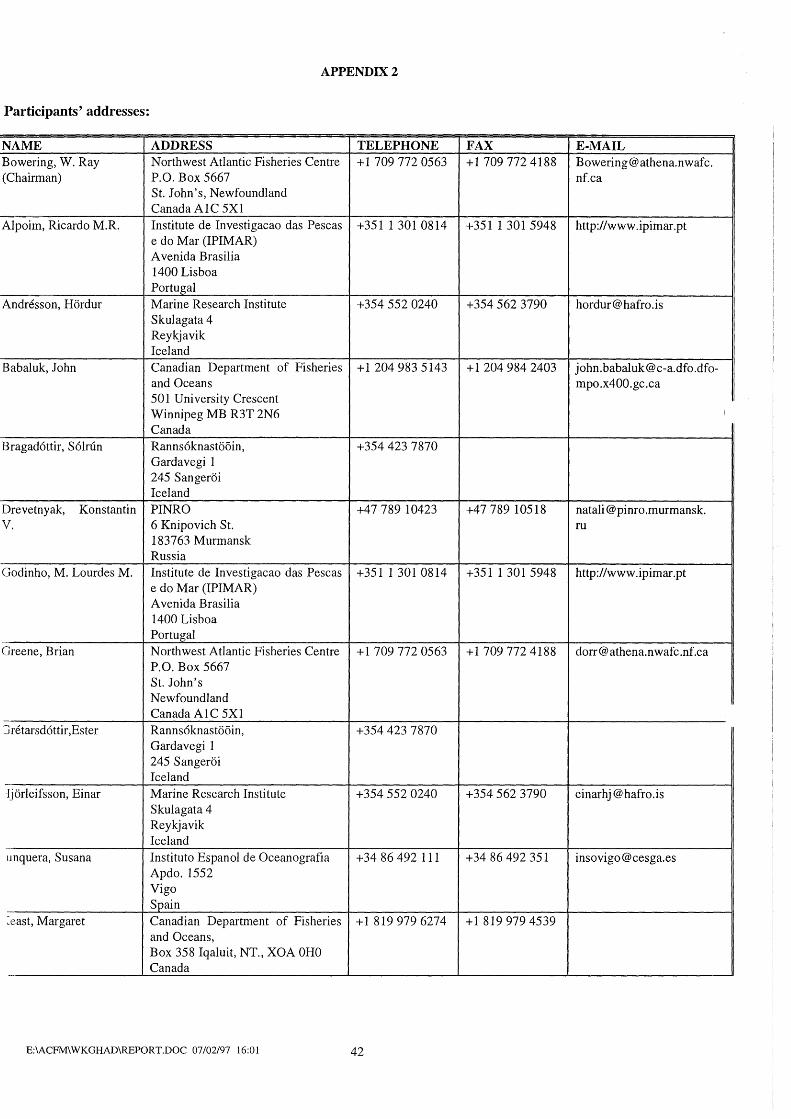
APPENDIX2
Parti ei pants' ad dresses:
NAME AD DRESS TELEPHONE FAX E-MAIL Bowering, W. Ray Northwest Atlantic Fisheries Centre +l 709 772 0563 +17097724188 [email protected]. (Chairman) P.O. Box 5667 nf.ca
St. John's, Newfoundland Canada Al C 5Xl
l Alpoim, Ricardo M.R. Institute de Investigacao das Pescas +3511 301 0814 +351 l 301 5948 http://www.ipimar.pt l e do Mar (IPIMAR)
A venida Brasilia 1400 Lisboa Portugal
Andresson, Hordur Marine Research Institute +354 552 0240 +354 562 3790 [email protected] Skulagata 4 Reykjavik lee land
Babaluk, John Canadian Department of Fisheries +12049835143 +l 204 984 2403 [email protected] Oceans mpo.x400.gc.ca 501 University Crescent Winnipeg MB R3T 2N6 Canada
Bragad6ttir, S6ln1n Ranns6knasto6in, +354 423 7870 Gardavegi l 245 Sangeroi Iceland
Drevetnyak, Konstantin PINRO +47 789 10423 +47 789 10518 natali@ pinro.murmansk. V. 6 Knipovich St. ru
183763 Murmansk Rus sia
Godinho, M. Lourdes M. Institute de Investigacao das Pescas +351 l 301 0814 +351 l 301 5948 http://www.ipimar.pt e do Mar (IPIMAR) A venida Brasilia 1400 Lisboa Portugal
Greene, Brian North west Atlantic Fisheries Centre +l 709 772 0563 +17097724188 dorr@ athena.nwafc.nf.ca P. O. Box 5667 St. John's Newfoundland Canada Al C 5Xl l
:Jretarsd6ttir ,Ester Ranns6knast06in, +354 423 7870 Gardavegi l 245 Sangeroi Iceland
-Ijorleifsson, Einar Marine Research Institute +354 552 0240 +354 562 3790 einarhj@ hafro.is Skulagata 4 Reykjavik Iceland
unquera, Susana Instituto Espanol de Oceanografia +34 86 492 111 +34 86 492 351 [email protected] Apdo. 1552 Vigo Spain
:east, Margaret Canadian Department of Fisheries +l 819 979 6274 +l 819 979 4539 and Oceans, Box 358 Iqaluit, NT., XOA OHO Canada
E:\ACFM\WKGHAD\REPORT.DOC 07/02/97 16:01 42
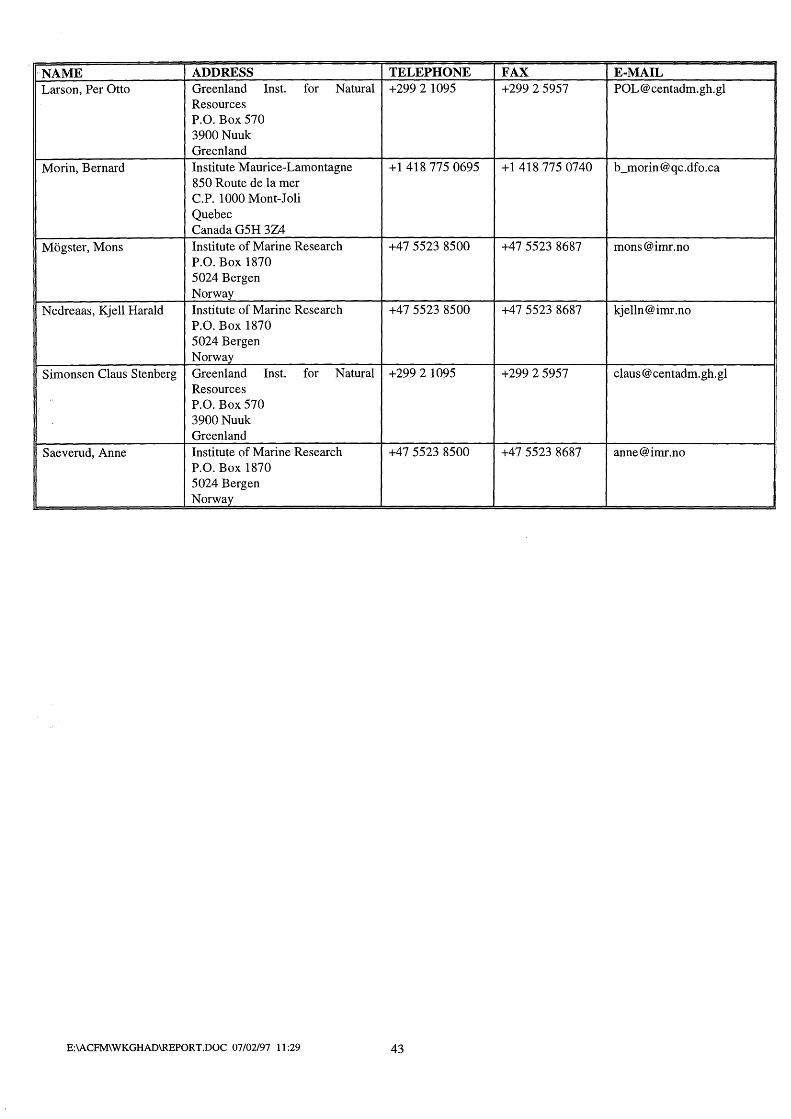
NAME AD DRESS TELEPHONE FAX E-MAIL Larson, Per Otto Greenland Inst. for Natural +299 2 1095 +299 2 5957 [email protected]
Resources P.O. Box 570 3900Nuuk Greenland
Morin, Bernard Institute Maurice-Lamontagne +l 418 775 0695 +l 418 775 0740 [email protected] 850 Route de la mer C.P. 1000 Mont-Joli Quebec Canada G5H 3Z4
Mogster, Mons Institute of Marine Research +47 5523 8500 +47 5523 8687 mons @imr.no P.O. Box 1870 5024 Bergen Norway
Nedreaas, Kjell Harald Institute of Marine Research +47 5523 8500 +47 5523 8687 kjelln@ imr .no P.O. Box 1870 5024 Bergen Norway
Simonsen Claus Stenberg Greenland Inst. for Natural +299 2 1095 +299 2 5957 claus@ centadm.gh.gl Resources
i P.O. Box 570 3900Nuuk Greenland
Saeverud, Anne Institute of Marine Research +47 5523 8500 +47 5523 8687 [email protected] P.O. Box 1870 5024 Bergen Norway
E:\ACFM\WKGHAD\REPORT.DOC 07/02/97 11:29 43
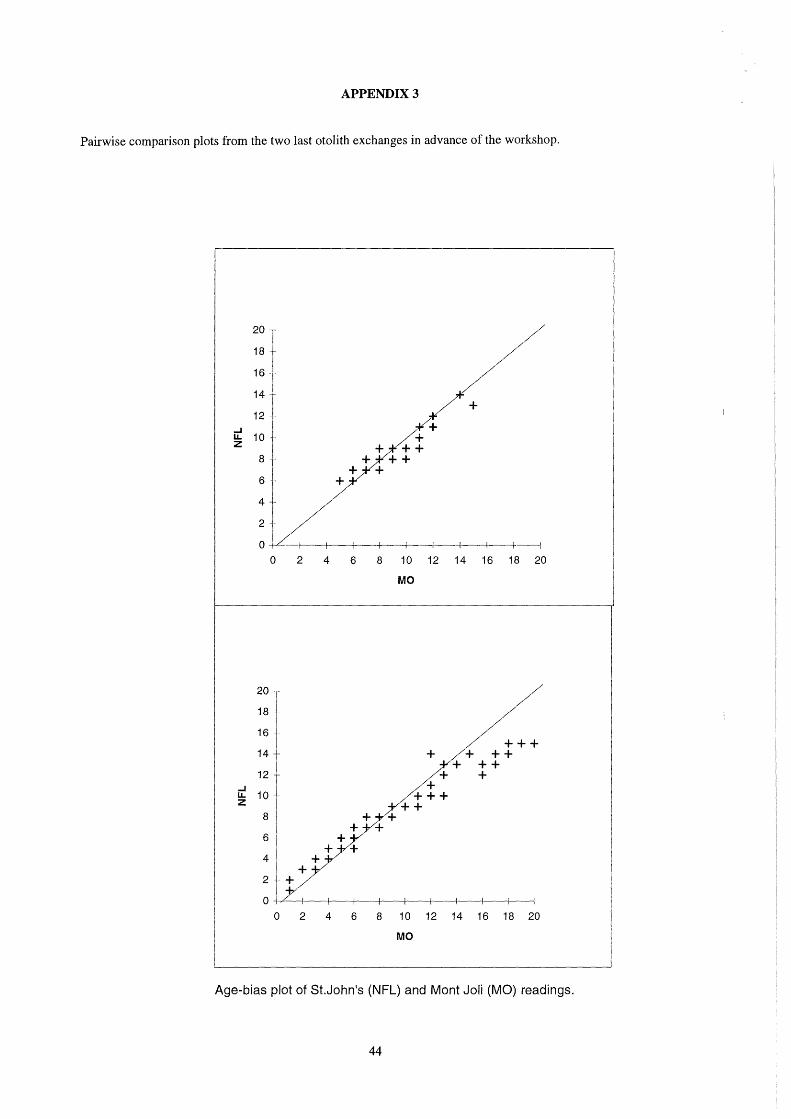
APPENDIX3
Pairwise comparison plots from the two last otolith exchanges in advance of the workshop.
M~ /
18 ~ /
;:;,1 / ..J /~+ ~ 10·r +/+t
:1 ;;/+++ 4-l- /
2+ / o -tL--+--t-----1--t-----t-----+---+--t---+----1
o
20.
18 ..
16
14
12
ii 10 z
2 4 6 8 1 o 12 14 16 18 20
MO
o 2 4 6 8 1 o 12 14 16 18 20
MO
Age-bias plot of St.John's (NFL) and Mont Joli (MO) readings.
44
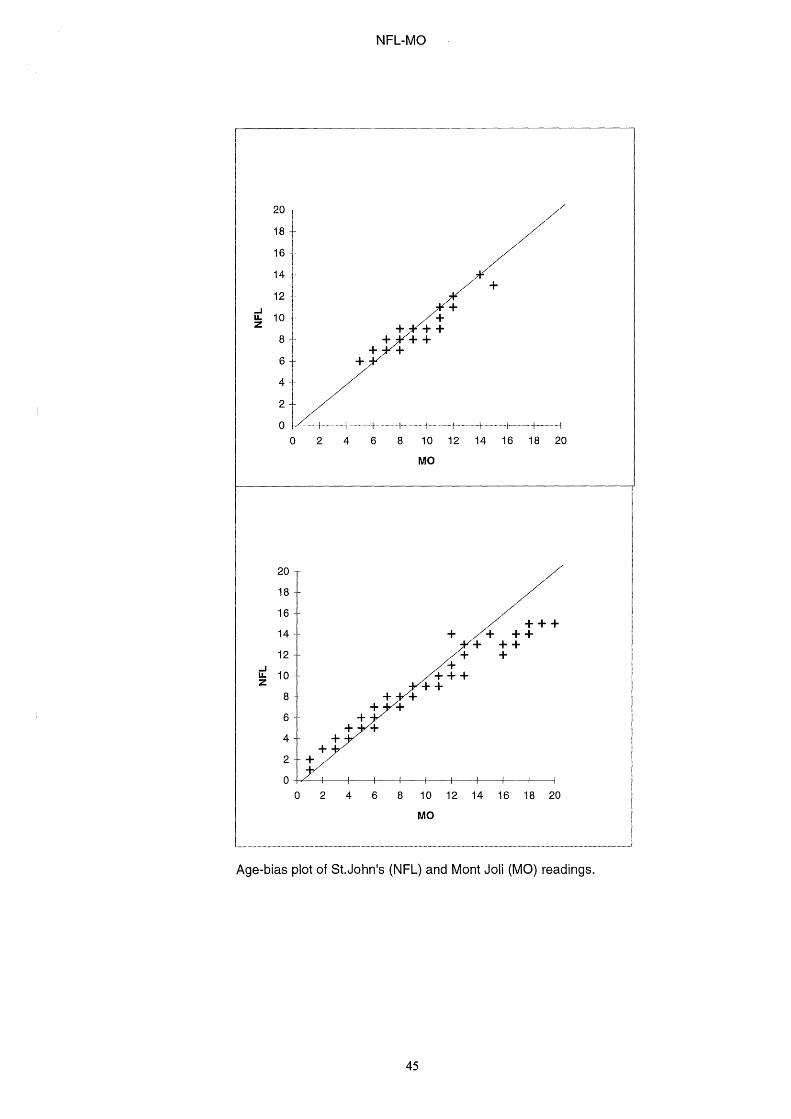
20
18
16
14
12 ..J
10 u. z
8
6
4
2
o o
20 ..
18
16
14
12 ..J
10. u. z 8·
6·
4
2
o o
NFL-MO
//
/ * /+
/+ +
+ ++ + ++
+ + +
2 4 6 8 10 12 14 16 18 20
MO
2 4 6 8 1 o 12 14 16 18 20
MO
Age-bias plot of St.John's (NFL) and Mont Joli (MO) readings.
45
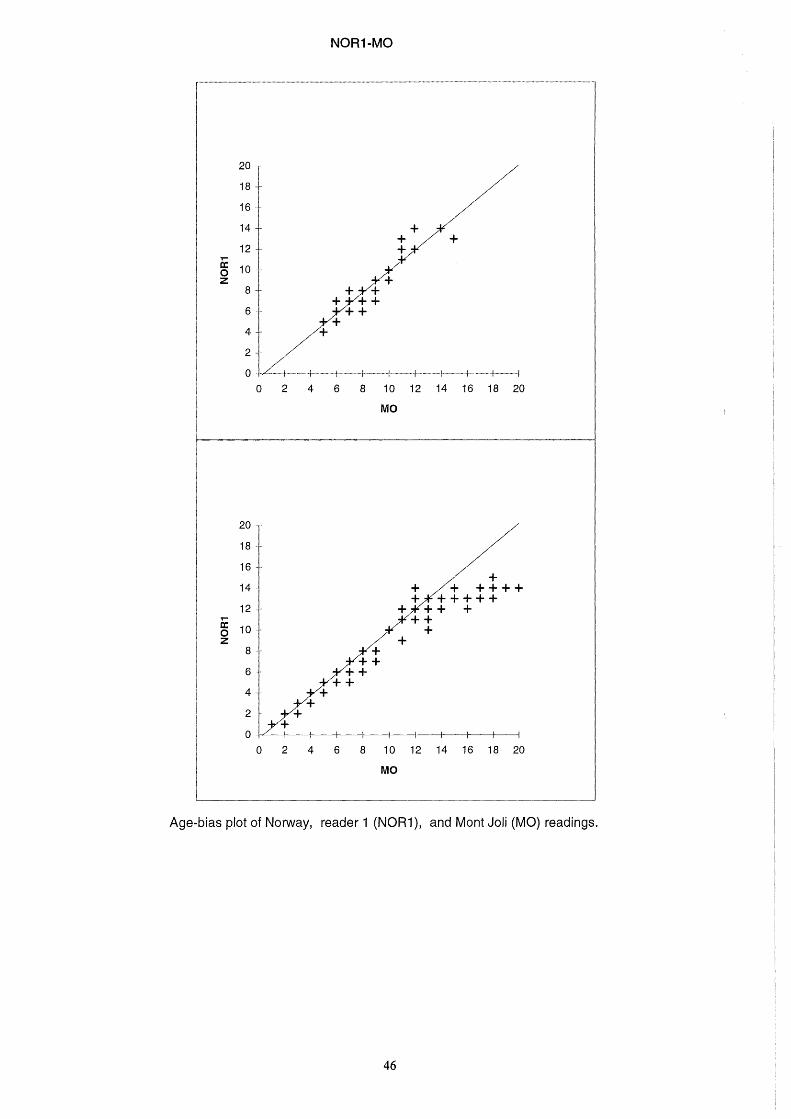
,...
20 r 18 t 16 ...
14
12
~ 10 z
20 ....
18 ..
16 ..
14 .
12 ...
a: o 10 .. z
8.
6
NOR1-MO
MO
o 2 4 6 8 1 o 12 14 16 18 20
MO
Age-bias plot of Norway, reader 1 (NOR1), and Mont Joli (MO) readings.
46
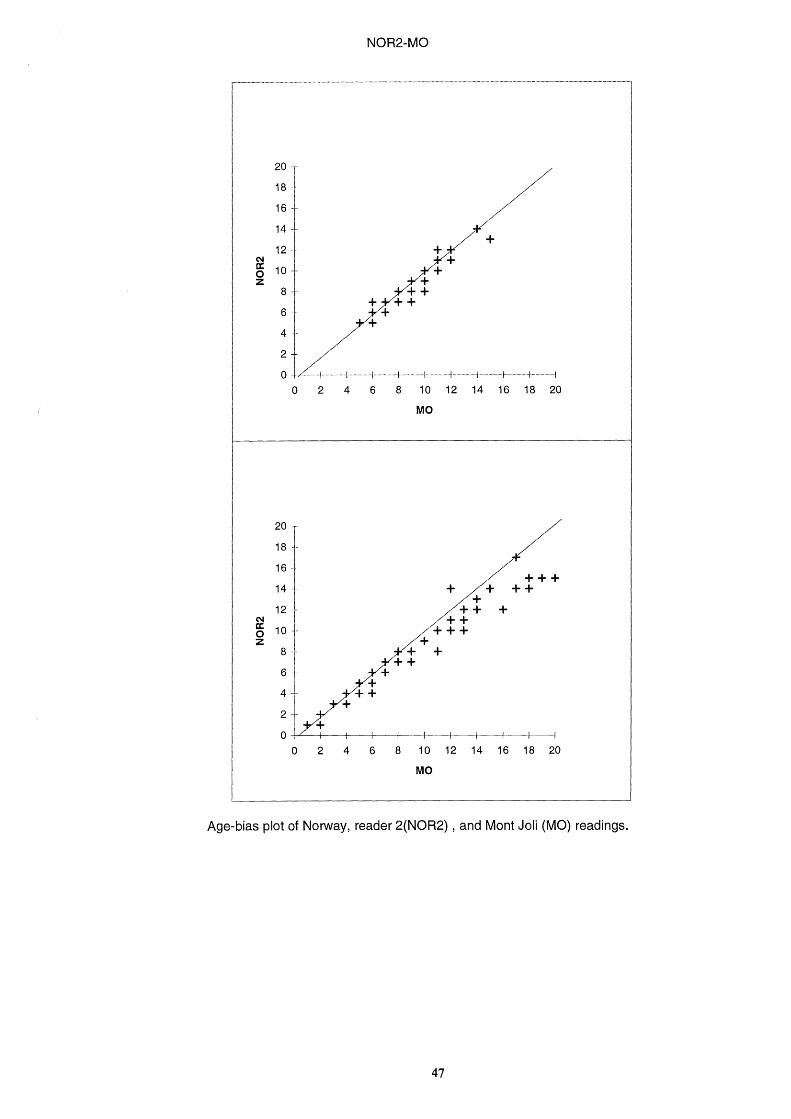
N
20
18
16
14
12 ...
NOR2-MO
~ 10 z +
+ +
+
N 0: o z
8 ++ + ++
6 ... +
4 /+ 21/ o .. /-·······1···········1·······+ . l··· .. +·· . ···+·· ···+·· ... +·· ····1 .... ··l
o 2 4 6 8 1 o 12 14 16 18 20
20 ..
18 ..
16 ....
14 .
12 ...
10 ...
8·
6
4
2 + o
o 2
MO
/ / +++
+ /.+ ++ /+ /++ +
/++ /+++
A~ + + +
/~+ ++
+
4 6 8 1 o 12 14 16 18 20
MO
Age-bias p lot of Norway, reader 2(NOR2) , and Mont Joli (MO) readings.
47
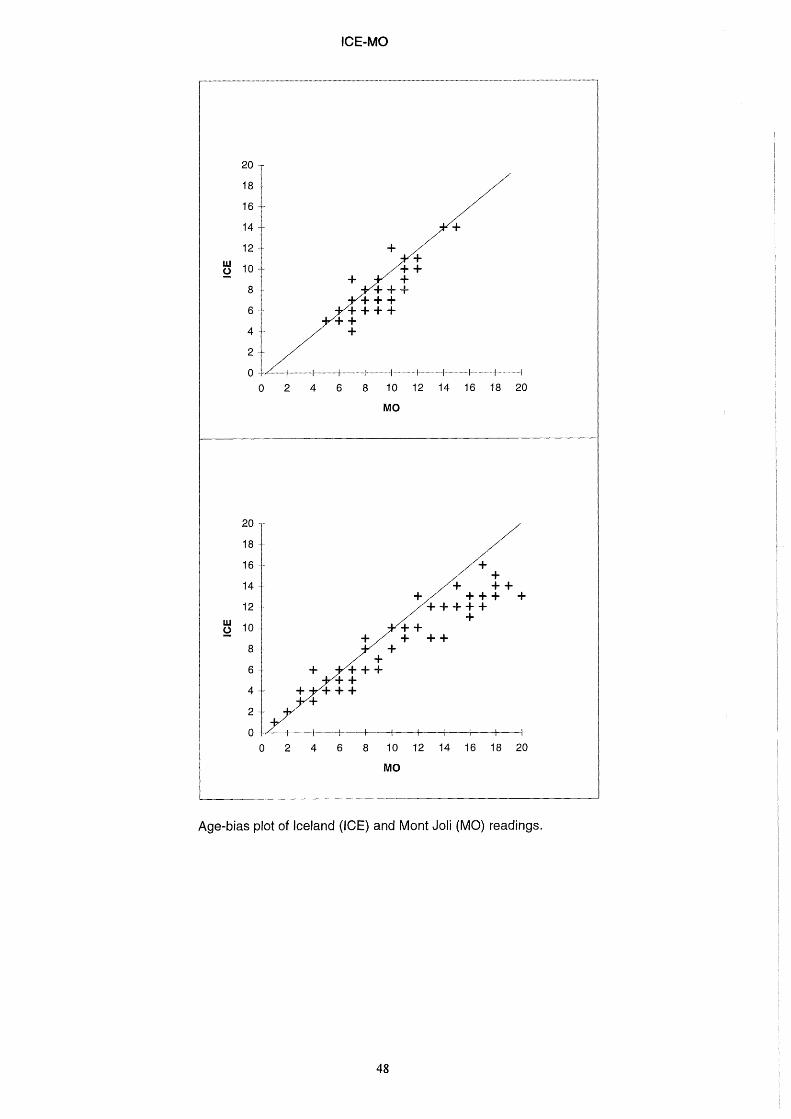
8
6 ...
ICE-MO
+/ +/+++ +++ +++
+ 4 . / +
/
2/ o .L········I·······f········i·······l·····l····l·····+··+ ·l
o 2 4 6 8 1 o 12 14 16 18 20
MO
o 2 4 6 8 1 o 12 14 16 18 20
MO
Age-bias plot of lceland (ICE) and Mont Joli (MO) readings.
48
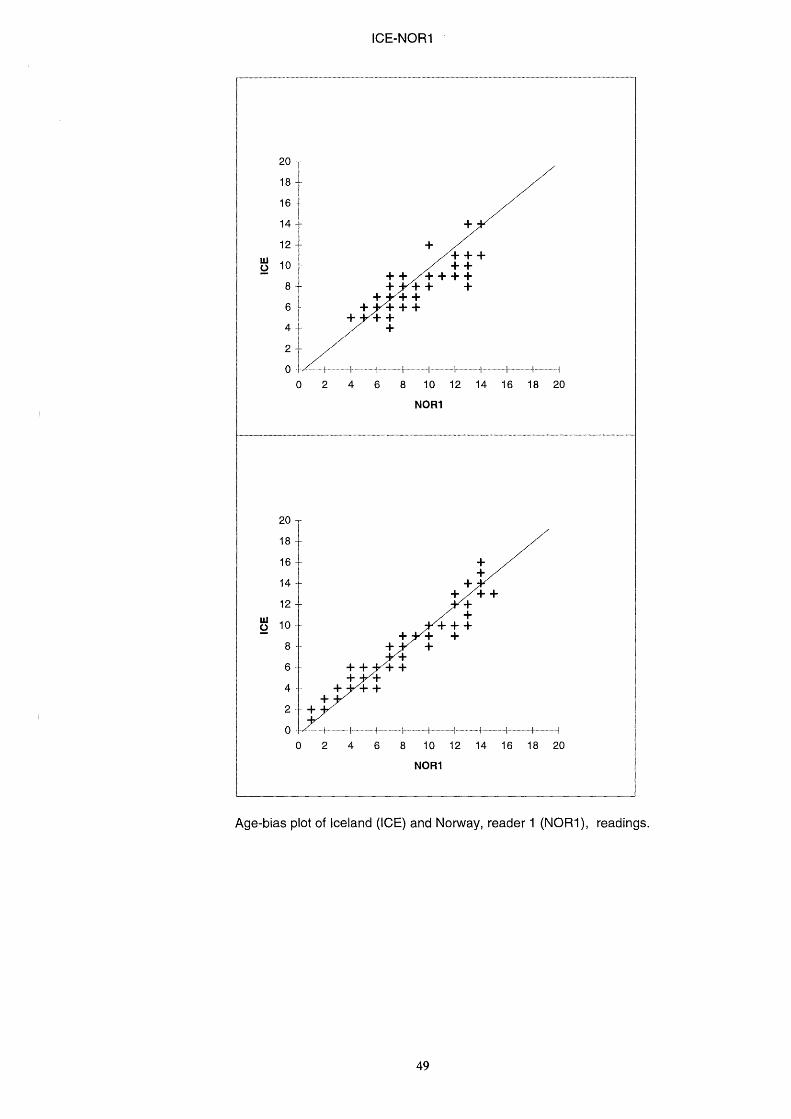
w 2
ICE-NOR1
20 + 18
16 t 14
12
10 .. + 8 .. +
6 ;Jntt + 4 +
+ 2· +y o zl l l l
o 2 4 6 8
+ +
+ + ++
+ +
+++ + + +
·····+ ·······+ ··········+ ········+· 10 12 14 16
NOR1
·····+···· ··1
18 20
Age-bias plot of lee land (ICE) and Norway, reader 1 (NOR1 ), readings.
49
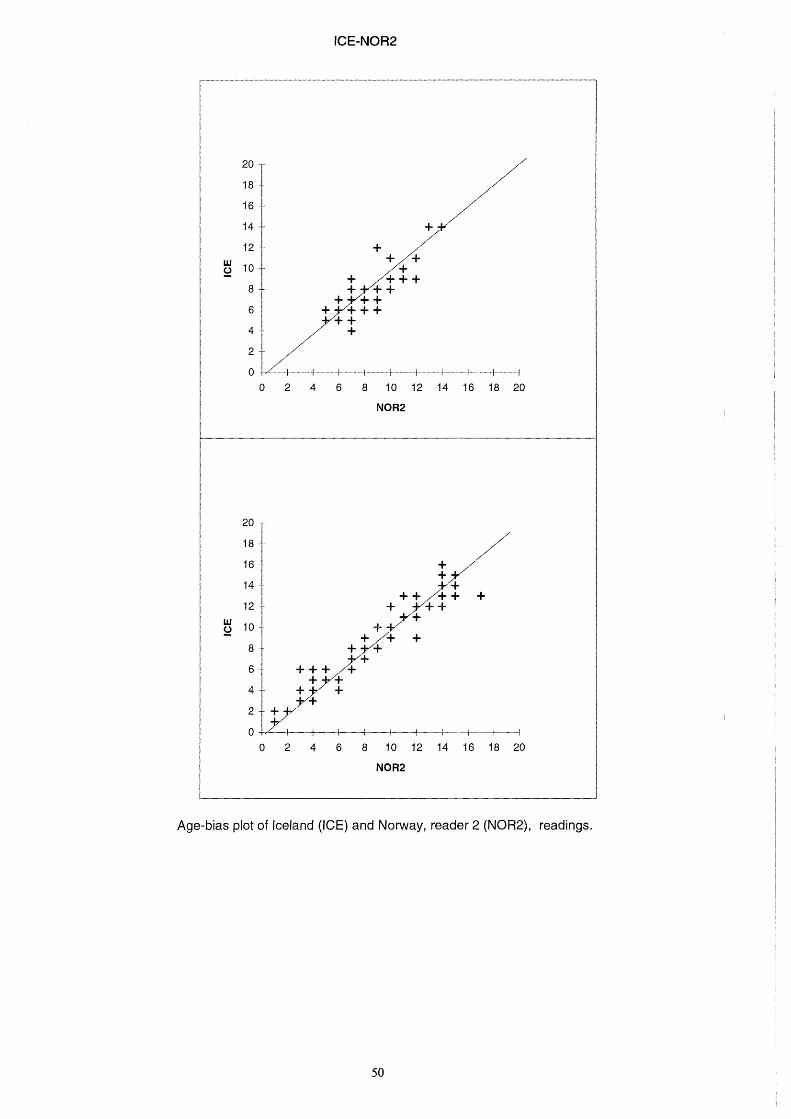
ICE-NOR2
// +0
+ /'+++ 8 + +"+ + 6 +}ftt /++
~t l l l+ l . l ···l ·J··· ·l ·+ l
20 T
181
16 i 14
w 2 10
12 ..
o 2 4 6 8 1 o 12 14 16 18 20
NOR2
20
18
16 .
14 .
12 w 2 10.
NOR2
Age-bias plot of lceland (ICE) and Norway, reader 2 (NOR2), readings.
50
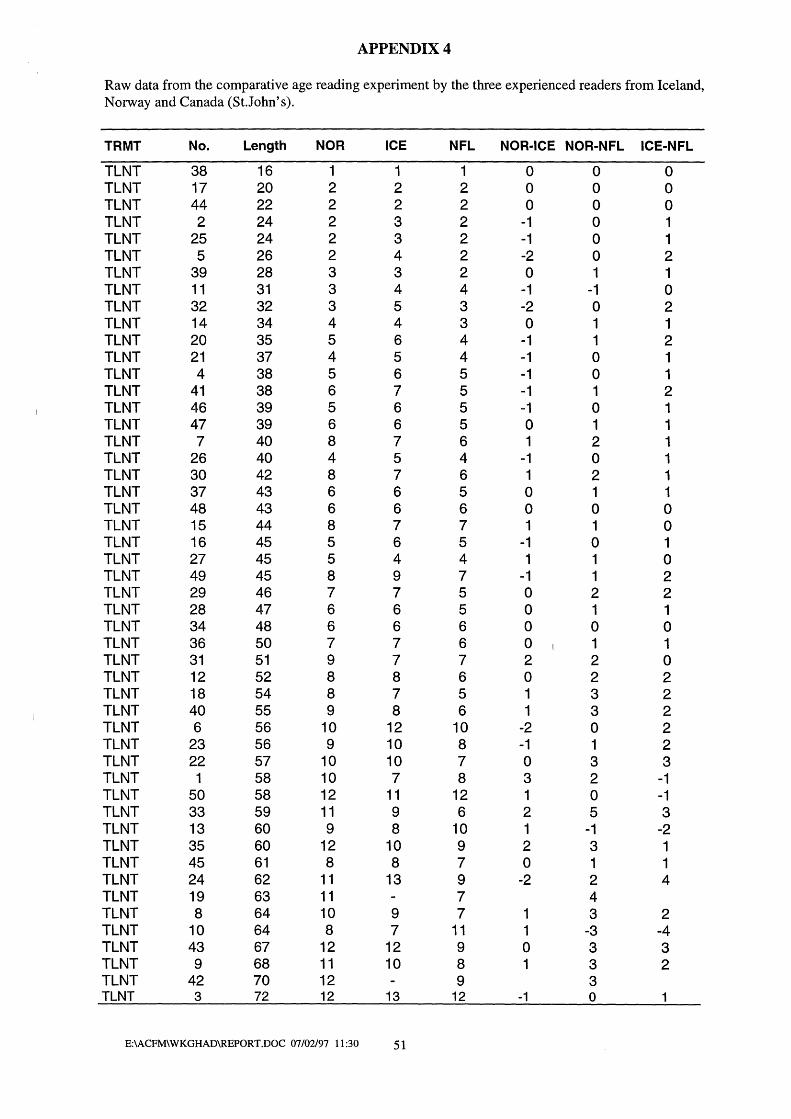
APPENDIX4
Raw data from the comparative age reading experiment by the three experienced readers from Iceland, Norway and Canada (St.John's).
TRMT No. Length NOR ICE NFL NOR-ICE NOR-NFL ICE-NFL
TLNT 38 16 1 1 1 o o o TLNT 17 20 2 2 2 o o o TLNT 44 22 2 2 2 o o o TLNT 2 24 2 3 2 -1 o 1 TLNT 25 24 2 3 2 -1 o 1 TLNT 5 26 2 4 2 -2 o 2 TLNT 39 28 3 3 2 o 1 1 TLNT 11 31 3 4 4 -1 -1 o TLNT 32 32 3 5 3 -2 o 2 TLNT 14 34 4 4 3 o 1 1 TLNT 20 35 5 6 4 -1 1 2 TLNT 21 37 4 5 4 -1 o 1 TLNT 4 38 5 6 5 -1 o 1 TLNT 41 38 6 7 5 -1 1 2 TLNT 46 39 5 6 5 -1 o 1 TLNT 47 39 6 6 5 o 1 1 TLNT 7 40 8 7 6 1 2 1 TLNT 26 40 4 5 4 -1 o 1 TLNT 30 42 8 7 6 1 2 1 TLNT 37 43 6 6 5 o 1 1 TLNT 48 43 6 6 6 o o o TLNT 15 44 8 7 7 1 1 o TLNT 16 45 5 6 5 -1 o 1 TLNT 27 45 5 4 4 1 1 o TLNT 49 45 8 9 7 -1 1 2 TLNT 29 46 7 7 5 o 2 2 TLNT 28 47 6 6 5 o 1 1 TLNT 34 48 6 6 6 o o o TLNT 36 50 7 7 6 o 1 1 TLNT 31 51 9 7 7 2 2 o TLNT 12 52 8 8 6 o 2 2 TLNT 18 54 8 7 5 1 3 2 TLNT 40 55 9 8 6 1 3 2 TLNT 6 56 10 12 10 -2 o 2 TLNT 23 56 9 10 8 -1 1 2 TLNT 22 57 10 10 7 o 3 3 TLNT 1 58 10 7 8 3 2 -1 TLNT 50 58 12 11 12 1 o -1 TLNT 33 59 11 9 6 2 5 3 TLNT 13 60 9 8 10 1 -1 -2 TLNT 35 60 12 10 9 2 3 1 TLNT 45 61 8 8 7 o 1 1 TLNT 24 62 11 13 9 -2 2 4 TLNT 19 63 11 7 4 TLNT 8 64 10 9 7 1 3 2 TLNT 10 64 8 7 11 1 -3 -4 TLNT 43 67 12 12 9 o 3 3 TLNT 9 68 11 10 8 1 3 2 TLNT 42 70 12 9 3 TLNT 3 72 12 13 12 -1 o 1
E:\ACFM\WKGHAD\REPORT.DOC 07/02/97 11:30 51
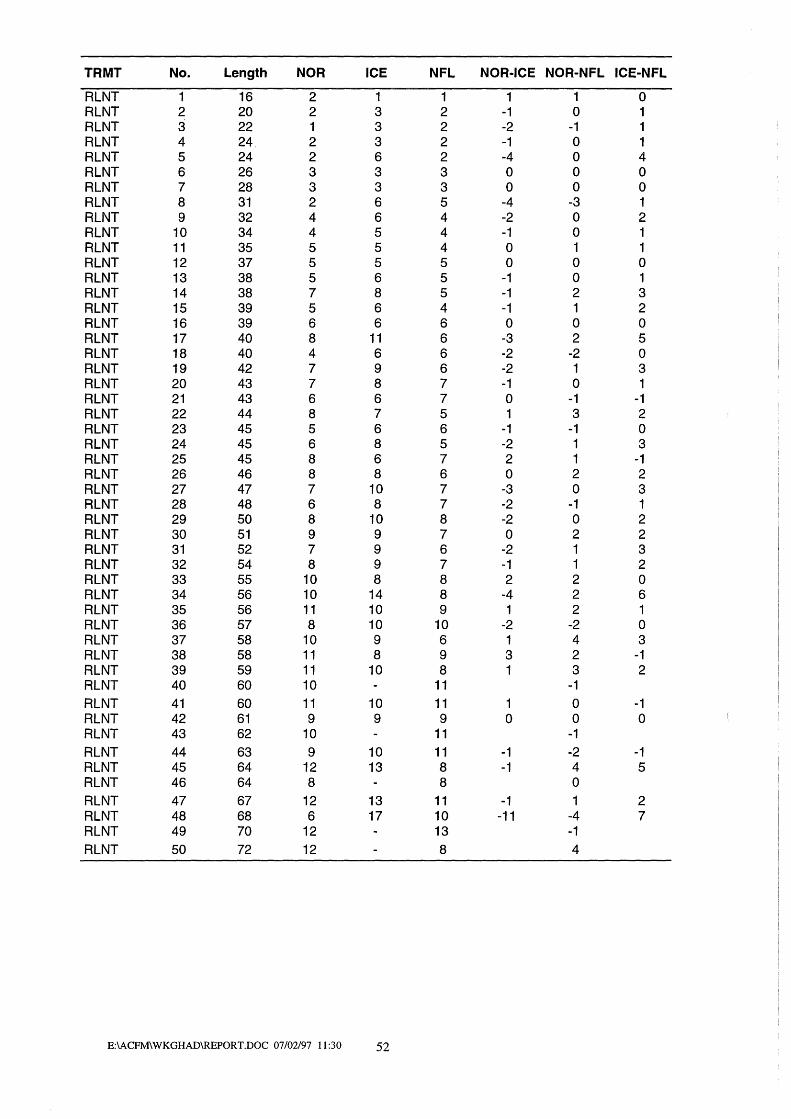
TRMT No. Length NOR ICE NFL NOR-ICE NOR-NFL ICE-NFL
RLNT 1 16 2 1 1 1 1 o RLNT 2 20 2 3 2 -1 o 1 RLNT 3 22 1 3 2 -2 -1 1 RLNT 4 24 2 3 2 -1 o 1 RLNT 5 24 2 6 2 -4 o 4 RLNT 6 26 3 3 3 o o o RLNT 7 28 3 3 3 o o o RLNT 8 31 2 6 5 -4 -3 1 RLNT 9 32 4 6 4 -2 o 2 RLNT 10 34 4 5 4 -1 o 1 RLNT 11 35 5 5 4 o 1 1 RLNT 12 37 5 5 5 o o o RLNT 13 38 5 6 5 -1 o 1 RLNT 14 38 7 8 5 -1 2 3 RLNT 15 39 5 6 4 -1 1 2 RLNT 16 39 6 6 6 o o o RLNT 17 40 8 11 6 -3 2 5 RLNT 18 40 4 6 6 -2 -2 o RLNT 19 42 7 9 6 -2 1 3 RLNT 20 43 7 8 7 -1 o 1 RLNT 21 43 6 6 7 o -1 -1 RLNT 22 44 8 7 5 1 3 2 RLNT 23 45 5 6 6 -1 -1 o RLNT 24 45 6 8 5 -2 1 3 RLNT 25 45 8 6 7 2 1 -1 RLNT 26 46 8 8 6 o 2 2 RLNT 27 47 7 10 7 -3 o 3 RLNT 28 48 6 8 7 -2 -1 1 RLNT 29 50 8 10 8 -2 o 2 RLNT 30 51 9 9 7 o 2 2 RLNT 31 52 7 9 6 -2 1 3 RLNT 32 54 8 9 7 -1 1 2 RLNT 33 55 10 8 8 2 2 o RLNT 34 56 10 14 8 -4 2 6 RLNT 35 56 11 10 9 1 2 1 RLNT 36 57 8 10 10 -2 -2 o RLNT 37 58 10 9 6 1 4 3 RLNT 38 58 11 8 9 3 2 -1 RLNT 39 59 11 10 8 1 3 2 RLNT 40 60 10 11 -1 RLNT 41 60 11 10 11 1 o -1 RLNT 42 61 9 9 9 o o o RLNT 43 62 10 11 -1 RLNT 44 63 9 10 11 -1 -2 -1 RLNT 45 64 12 13 8 -1 4 5 RLNT 46 64 8 8 o RLNT 47 67 12 13 11 -1 1 2 RLNT 48 68 6 17 10 -11 -4 7 RLNT 49 70 12 13 -1 RLNT 50 72 12 8 4
E:\ACFM\WKGHAD\REPORT.DOC 07/02/97 11:30 52

TRMT No. Length NOR ICE NFL NOR-ICE NOR-NFL ICE-NFL
ALBA 38 16 1 1 1 o o o ALBA 17 20 2 2 2 o o o ALBA 2 24 2 3 3 -1 -1 o ALBA 25 24 2 2 2 o o o ALBA 5 26 3 3 3 o o o ALBA 39 28 3 3 3 o o o ALBA 11 31 2 3 3 -1 -1 o RLBA 32 32 4 5 4 -1 o 1 ALBA 14 34 4 6 3 -2 1 3 ALBA 20 35 4 6 4 -2 o 2 ALBA 21 37 5 5 4 o 1 1 ALBA 4 38 5 5 5 o o o ALBA 41 38 5 5 4 o 1 1 ALBA 46 39 6 6 5 o 1 i ALBA 47 39 6 6 7 o -1 -1 ALBA 7 40 8 9 7 -1 1 2 ALBA 26 40 5 5 o ALBA 30 42 5 6 5 -1 o 1 ALBA 37 43 8 8 5 o 3 3 ALBA 48 43 7 6 7 1 o -1 ALBA 15 44 7 6 6 1 1 o ALBA 16 45 5 6 5 -1 o 1 ALBA 27 45 4 5 4 -1 o 1 ALBA 49 45 8 8 8 o o o ALBA 29 46 8 7 6 1 2 1 ALBA 28 47 6 6 7 o -1 -1 ALBA 34 48 8 7 6 1 2 1 ALBA 36 50 7 9 7 -2 o 2 ALBA 31 51 11 9 9 2 2 o ALBA 12 52 8 9 7 -1 1 2 ALBA 18 54 7 7 7 o o o ALBA 40 55 7 7 7 o o o ALBA 6 56 11 12 8 -1 3 4 ALBA 23 56 9 10 11 -1 -2 -1 ALBA 22 57 12 10 11 2 1 -1 ALBA 1 58 10 10 8 o 2 2 ALBA 50 58 12 11 11 1 1 o ALBA 33 59 7 9 8 -2 -1 1 ALBA 13 60 8 10 9 -2 -1 1 ALBA 35 60 ALBA 45 61 8 9 7 -1 1 2 ALBA 24 62 11 12 13 -1 -2 -1 ALBA 19 63 9 11 -2 ALBA 8 64 12 11 9 1 3 2 ALBA 10 64 8 9 9 -1 -1 o ALBA 43 67 12 12 11 o 1 1 ALBA 9 68 7 11 10 -4 -3 1 ALBA 42 70 9 10 10 -1 -1 o ALBA 3 72 12 13 11 -1 1 2 ALBA ? 10 12 9 -2 1 3
E:\ACFM\WKGHAD\REPORT.DOC 07/02/97 11:30 53

Demersal Fish Committee ICES CM1997fJ~·~z~ --roffiATUM
3
REPORT OF THE
ICES/NAFO WORKSHOP ON GREENLAND HALIBUT AGE DETERMINATION
Reykjavik, Iceland
26 - 29 November 1996
The attached page should replace Table 4.1 in the report mailed to you on 3 March 1997
This report is not to be quoted without prior consultation with the General Secretary. The document is a report of an expert group under the auspices of the International Council for the Exploration of the Sea and does not necessarily represent the views of the Council.
International Council for the Exploration of the Sea
Conseil International pour l'Exploration de la Mer
Palægade 2-4 DK-1261 Copenhagen K Denmark
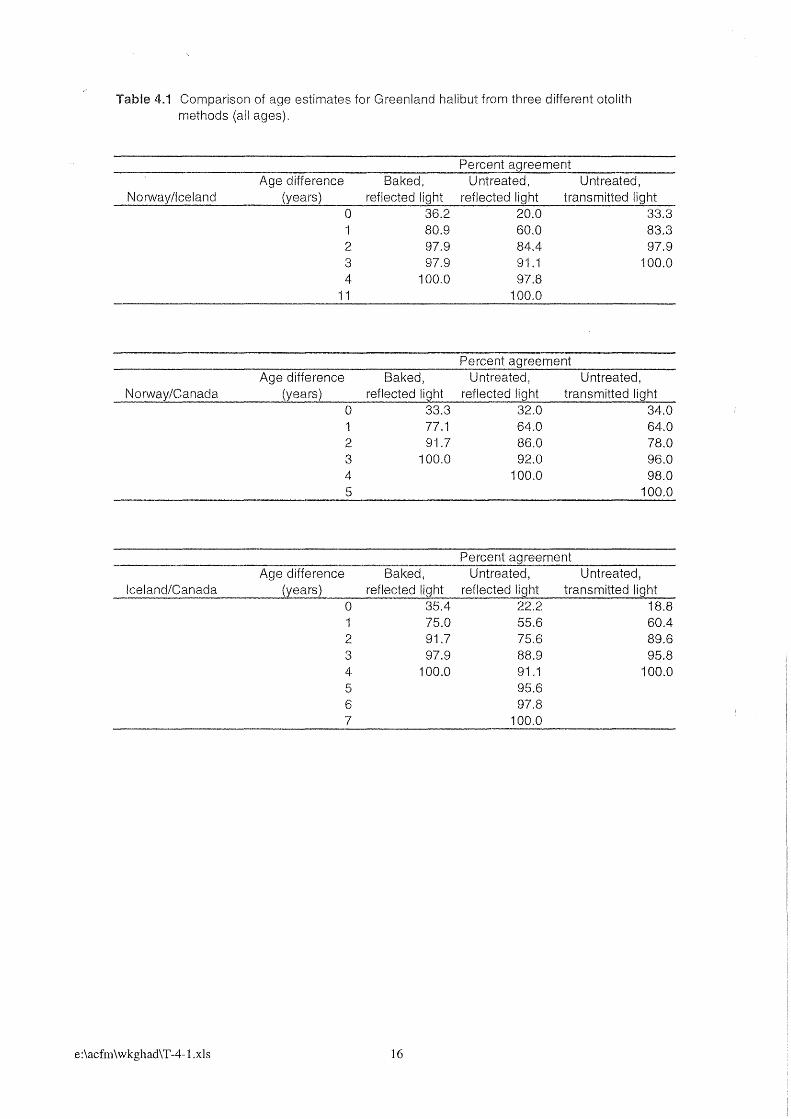
Table 4.1 Comparison of age estlmates for Greenland halibut from three different otollth methods (all ages).
Norway/lceland
Norway/Canada
lee Iand/Canada
Age dlfference (years)
o l 2 3 4
Baked, reflected light
36.2 80.9 97.9 97.9
100.0 11
Age difference (years)
o
Bak ed, reflected light
33.3 77.1
2 91.7 3 100.0 4 5
Percent agreement Untreated, Untreated,
reflected light transmitted light 20.0 33.3 60.0 84.4 91.1 97.8
100.0
Percent agreement Untreated, Untreated,
83.3 97.9
100.0
reflected light transmitted light 32.0 34.0 64.0 64.0 86.0 78.0 92.0 96.0
100.0 98.0 100.0
Percent agreement Age difference Baked, Untreated. Untreated,
(years) reflected light reflected light transmitted light ------------·------- ------------=----------=-----------~~--
e:\acfm\wkghad\T-4-l.xls
o 35.4 22.2 18.8 75.0
2 91.7 3 97.9 4 100.0 5 6 7
16
55.6 60.4 75.6 89.6 88.9 95.8 91.1 100.0 95.6 97.8
100.0