Report of the High-level Committee on Socio-Economic, Health and Educational Status of the Tribals...
431
1 REPORT OF THE HIGH LEVEL COMMITTEE ON SOCIO- ECONOMIC, HEALTH AND EDUCATIONAL STATUS OF TRIBAL COMMUNITIES OF INDIA Ministry of Tribal Affairs Government of India May, 2014
-
Upload
ruralindia -
Category
News & Politics
-
view
3.990 -
download
12
Transcript of Report of the High-level Committee on Socio-Economic, Health and Educational Status of the Tribals...

1
REPORT OF THE
HIGH LEVEL COMMITTEE ON SOCIO-
ECONOMIC, HEALTH AND EDUCATIONAL
STATUS OF TRIBAL COMMUNITIES OF INDIA
Ministry of Tribal Affairs
Government of India
May, 2014

2
REPORT OF THE
HIGH LEVEL COMMITTEE ON SOCIO-
ECONOMIC, HEALTH AND EDUCATIONAL
STATUS OF TRIBAL COMMUNITIES OF INDIA
Ministry of Tribal Affairs
Government of India
May, 2014
3
CONSTITUTION OF THE HIGH LEVEL
COMMITTEE
1. Prof. Virginius Xaxa Chairman
2. Dr. Usha Ramanathan Member
3. Dr. Joseph Bara Member
4. Dr. Kamal K. Misra Member
5. Dr. Abhay Bang Member
6. Ms. Sunila Basant Member
7. Dr. Hrusikesh Panda Member Secretary

4
Contents
1. Preface 21-23
2. Introduction 24-33
3. Geographical and Demographic Profile 34-50
3.1 Introduction
3.2 Population of Scheduled Tribes across States
3.3 Number of Scheduled Tribes
3.4 District-level data on Scheduled Tribe population
3.5 Populous and ‘Vulnerable’ Tribes
3.6 Forests, Dams and Mines
3.7 Conflicts affecting tribal populations
4. Tribes: Legal and Administrative Framework 51-94
4.1 Definitions of ‘tribe’
4.2 De-notified, Nomadic and Semi-Nomadic Tribes
4.3 Particularly Vulnerable Tribal Groups (PVTGs)
4.4 Scheduled Areas
4.5 The Fifth Schedule
4.5.1 Governor’s Report
4.5.2 Tribes Advisory Councils
4.6 Legal and Administrative Structures in Northeast India
4.6.1 The Sixth Schedule
4.6.2 Statutory Autonomous Councils
4.6.3 Scheduled Tribe Development Councils
4.7 Ladakh Autonomous Hill Development Council (Leh and Kargil)
4.8 Overall Assessment of the Autonomous District Councils under Sixth
Schedule
4.9 Recommendations
5. Livelihoods and Employment Status 95-153
5.1 Introduction
5.2 Traditional Economy and Livelihoods
5.3 Land Ownership
5.3.1 Distribution of Ownership Holdings
5.3.2 Operational Holdings
5.4 Household Assets and Amenities
5.4.1 Value of Assets and Average Asset Value

5
5.5 Employment (Formal, Organized and Unorganized Sectors)
5.5.1 Work Force Participation
5.5.2 Unemployment Rates
5.5.3 Employment in Organized Sectors.
5.5.4 Representation in Unorganized Sector
5.5.5 Employment under Mahatma Gandhi National Rural
Employment Guarantee Act (MGNREGA)
5.6 Occupational Distribution
5.7 Income and Expenditure
5.8 Poverty Profile
5.9 Average Debt and Incidence of Indebtedness
5.10 Recommendations
6. Education 154-190
6.1 Introduction
6.2 Evolution of Educational Policy
6.2.1 Policy Review by Dhebar Commission,1960
6.2.2 Sluggish Trend of Growth
6.3 Early Educational Planning
6.4 National Policy on Education, 1986
6.5 Flagship Programs at Three Levels
6.5.1 Outcome of the Missions
6.6 A Long Way To Go
6.7 Education as a Site of Discrimination
6.8 Facts behind Free Education
6.9 The Right of Children to Free and Compulsory Education Act, 2009
6.10 Teachers and Way of Teaching Tribal Children
6.11 Residential Schools and the Tribals
6.12 Educational Domain and Knowledge on Tribes
6.13 Contemporary Concerns in Tribal Education
6.13.1 Incidence of High Dropout Rates
6.13.2 No-detention Policy
6.13.3 Shortage of ‘Quality’ Teachers
6.13.4 Language Barriers for the Tribal Students
6.13.5 Involvement of Panchayats and Community in Education
6.13.6 Education for Displaced Tribals and Dispersed Tribals
6.13.7 Education for Nomadic Tribes
6.13.8 Single Window Scholarship Portal
6.14 Recommendations

6
7. Health 191-250
7.1 Introduction
7.2 Methods
7.3 Sources of data
7.4 Population characteristics
7.4.1 Population Growth
7.4.2 Sex Ratio
7.4.3 Occupational structure
7.5 Mortality
7.6 Fertility
7.7 Disease Patterns
7.8 Nutrition
7.8.1 Findings
7.9 Hypertension
7.10 Consumption of Tobacco and Alcohol
7.10.1 Consumption of Tobacco
7.10.2 Consumption of Alcohol
7.11 Determinants of Health: Drinking water, sanitation and fuel
7.12 Public Health Infrastructure and Human Resources for Health in Tribal
Areas
7.13 Treatment Seeking Behaviour
7.14 Maternal and Child Health Care Program Coverage
7.14.1 Maternal Care
7.14.2 Child Health Care
7.15 Conclusions
7.16 Recommendations
8. Land Alienation, Displacement and Enforced Migration 251-307
8.1 Introduction
8.1.1 Background
8.1.2 Constitutional Provisions
8.2 Right to Land
8.2.1 Conceptual framework of Land Acquisition Act, 1894: ‘Eminent
domain’ and ‘Public purpose’
8.2.2 Forest Laws
8.2.3 Ways in which tribal land alienation takes place
8.2.4 Process of involuntary displacement
8.2.5 Forced migration for economic survival
8.2.6 Two Views
8.2.7 Protests and agitations

7
8.3 Extent of Displacement
8.3.1 Data regarding Displaced Persons and Project Affected Persons
8.3.2 Views of National Human Rights Commission
8.4 Resettlement of the Displaced
8.4.1 Extent of Private, Common and Forest Land Taken For Projects
8.5 Analysis of DPs/PAPs in various states
8.6 Land Alienation of Tribal Land by Non-tribals
8.7 Impact of Migration on Tribal Communities
8.8 Involuntary Displacement and Tribal Situation: Before and After
8.9 Conclusion
8.10 Recommendations
9. Legal and Constitutional Issues 308-372
9.1 Introduction
9.2 Forest Rights Act
9.2.1 Implementation of the FRA
9.2.2 Community Forest Rights
9.2.3 Joint Forest Management
9.2.4 Particularly Vulnerable Tribal Groups: Food Security and Habitat
Rights
9.2.5 Women
9.3 Forest Rights Act in Protected Areas
9.3.1 Critical Wildlife Habitats (CWH)
9.3.2 Non-recognition and rejection of Community Forest Rights
claims
9.3.3 Consultation with and consent of the Gram Sabha
9.3.4 Relocation without following process under WLPA and FRA
9.3.5 Tiger Reserves
9.3.6 Elephant Corridor
9.3.7 Evictions: Letter dated May 3, 2002
9.4 Panchayats (Extension to the Scheduled Areas) Act, 1996, (PESA)
9.4.1 The Rules framed by state governments are not compliant with
PESA
9.4.2 Amendment to the PESA
9.4.3 Linear Projects
9.5 Land Acquisition Law of 2013, Forest Rights Act, 2006 and PESA, 1996
9.6 Land alienation: Kerala
9.7 Memoranda of Understanding (MoUs)
9.8 Cabinet Committee on Investment (CCI)
9.9 Niyamgiri
9.10 Salwa Judum

8
9.11 Criminal Law
9.11.1 Soni Sori Case
9.11.2 Narayanpatna
9.11.3 De-notified Tribes (DNT)
9.12 Andaman and Nicobar Islands
9.13 Bonded Labour
9.14 Recommendations
10. Delivery of Public Goods and Services 373-389
10.1 Introduction
10.2 Twelfth Five Year Plan and Beyond
10.3 Strengthening of Institutions: ITDAs/ITDPs
10.4 Strengthening of Institutions for PVTGs
10.5 Creations of Institutions in Urban Areas
10.6 Knowledge and Capacity Building Institutions – Tribal Research
Institutions
10.7 Anthropological Survey of India
10.8 Prioritizing Grants under Special Area Programmes
10.9 Union Finance Commission
10.10 Isolation of Tribes – Socio-economic issues
10.11 Recommendations
11. Recommendations - at a glance 390-417

9
List of Abbreviations
ADC Autonomous Development Council
AHS Annual Health Survey
ANC Antenatal Care
ANM Auxiliary Nurse Midwife
AnSI Anthropological Survey of India
ASHA Accredited Social Health Activist
ATR Andaman Trunk Road
AYUSH Ayurveda, Yoga, Unani, Siddha, and Homeopathy
BMI Body Mass Index
BPL Below Poverty Line
CABE Central Advisory Board of Education
CCI Cabinet Committee on Investment
CED Chronic Energy Deficiency
CFR Community Forest Rights
CHC Community Health Centre
CPR Common Property Resources
CPR Contraceptive Prevalence Rate
CSS Centrally Sponsored Schemes
CTA Criminal Tribes Act
CWH Critical Wildlife Habitats
DLHS District Level Household Survey
DNT De-notified Tribes
DRDA District Rural Development Agency
DPs Displaced Persons
EIA Environment Impact Assessment
EMRS Eklavya Model Residential Schools
FRA The Scheduled Tribes and Other Traditional Forest Dwellers (Recognition of
Forest Rights) Act, 2006
FRC Forest Rights Committee
GER Gross Enrollment Ratio
GS Gram Sabha

10
HLC High Level Committee
HOH Household Ownership Holdings
ICMR Indian Council of Medical Research
IDBI Industrial Development Bank of India
IEC Information Education and Communication
IFR Individual Forest Rights
IMR Infant Mortality Rate
IOI Incidence of Indebtedness
ITDP Integrated Tribal Development Program
JFM Joint Forest Management
JSSK Janani Shishu Suraksha Karyakram
JSY Janani Suraksha Yojana
LFPR Labour Force Participation Rate
LWE Left-Wing Extremism
MADA Modified Area Development Approach
META Medical Education for Tribal Areas
MFP Minor Forest Produce
MGNREGA Mahatma Gandhi National Rural Employment Guarantee Act, 2005
MLA Member of Legislative Assembly
MMR Maternal Mortality Rate
MoEF Ministry of Environment and Forests
MoSPI Ministry of Statistics, Planning and Implementation
MoTA Ministry of Tribal Affairs
MOU Memorandum of Understanding
MPCE Monthly Per Capita Expenditure
MPP Mandal Praja Parishad
MTDP Multipurpose Tribal Development Projects
NABARD National Bank for Agriculture and Rural Development
NAC National Advisory Council
NCERT National Council of Educational Research and Training
NCST National Commission for Scheduled Tribes
NDE Non-Directory Establishments
NDTE Non-Directory Trading Establishments

11
NFHS National Family Health Survey
NGT National Green Tribunal
NHB National Housing Bank
NHRC National Human Rights Commission
NMR Neonatal Mortality Rate
NNMB National Nutrition Monitoring Bureau
NPNL Non-Pregnant Non-Lactating
NRHM National Rural Health Mission
NSSO National Sample Survey Organisation
NTCA National Tiger Conservation Authority
NTFP Non-Timber Forest Produce
OA Operational Areas
OAE Own Account Enterprises
OATE Own Account Trading Enterprises
OBC Other Backward Classes
OH Operational Holdings
OTFD Other Traditional Forest Dwellers
PA Protected Areas
PAPs Project affected Persons
PESA Provisions of Panchayats (Extension to Scheduled Areas) Act, 1996
PHC Primary Health Centre
PIL Public Interest Litigation
PMO Prime Minister’s Office
PSU Public Sector Undertakings
PVTG Particularly Vulnerable Tribal Groups
R&R Resettlement and Rehabilitation
RDA Recommended Daily Allowance
RDI Recommended Daily Intake
RGI Registrar General of India
RTE Right of Children to Free and Compulsory Education Act, 2009
SEZ Special Economic Zones
SLP Special Leave Petition
SPO Special Police Officers

12
SRS Sample Registration System
SSA Sarva Shiksha Abhiyan
ST Scheduled Tribes
TAC Tribes Advisory Council
TDI Tribal Development Index
TDB Tribal Development Blocks
TFR Total Fertility Rate
THI Tribal Health Index
TRI Tribal Research Institute
TSP Tribal Sub Plan
U5MR Under-five Mortality Rate
UPS Usual Principal Status
UR Unemployment Rate
UT Union Territory
VSS Van Samrakhyan Samiti
WLPA Wildlife Protection Act, 1972
WPR Worker Population Ratio
13
List of Tables
Table 3.1: Total population of STs and proportion of STs in each state to the total state
and national population
Table 3.2: States with highest and lowest proportion of Scheduled Tribes
Table 3.3: Distribution of ST population by State
Table 3.4: State-wise ST population and decadal growth rate
Table 3.5: State-wise percentage of Scheduled Tribes to total population (rural and
urban) and decadal growth-rate (2001-2011)
Table 3.6: State-wise Number of Scheduled Tribes
Table 3.7: State-wise no. of districts with ST Population more than 50% and between 25
and 50%
Table 3.8: State-wise total no. of districts with ST Population above 25%
Table 3.9: Concentration of ST population across districts
Table 3.10: Modifications made in the list of Scheduled Tribes since the 2001 census
Table 3.11: Fifteen most populous tribes in India
Table 3.12: PVTGs with a population of less than 1000 persons
Table 5.1: Distribution of Land Ownership among Scheduled Tribes and All, 2003
Table 5.2: Distribution of Land Ownership Holdings among households of Scheduled
Tribes and All; and Average Size by Major Classes (percent) - All-India
Table 5.3: Operational Holdings (Quinquennial): All-India Level
Table 5.4: Percentage Changes in Access to Cultivated Land by Scheduled Tribes,
2004-2010
Table 5.5: Assets possessed by the Households among Scheduled Tribes and all Social
Groups
Table 5.6: Condition of Houses Occupied by Scheduled Tribes and Other Households,
2011 Census
Table 5.7: Main Source of Lighting among Households of Scheduled Tribes and All,
2011 Census
Table 5.8: Fuel used for Cooking by Households of Scheduled Tribes and All, 2011
Census
Table 5.9: Location and Source of Drinking Water for Scheduled Tribes and All
Households, 2011 Census
Table 5.10: Percentage of Household having Latrine and Bathing Facility within
Premises, 2011

14
Table 5.11: Value of Land, Buildings and Total Assets by Rural and Urban at All-India,
by Scheduled Tribes and Others
Table 5.12: Percentage of Households belonging to Selected Asset Holding Category
Table 5.13: No. Employed per 1000 Persons (WPR) during 1983 to 2009-10
Table 5.14: Worker Population Ratio for different social groups based on UPS approach
Table 5.15: Labour Force Participation Rate for different social groups based on UPS
approach for persons aged 15 years & above
Table 5.16: Unemployment Rate (UR) and Proportion of Unemployed Persons (PU)
during 1983 to 2009-10
Table 5.17: Unemployment Rates for Scheduled Tribes and All Groups based on UPS
approach
Table 5.18: Percentage of Combined Government Employment including Insurance
Table 5.19: Scheduled Tribe Representation in Central Government Services in 1994,
1999, and 2004
Table 5.20: Percentage Share of Scheduled Tribe in Central Government Jobs (By
Categories)
Table 5.21: Group-wise Number of Employees and Representation of Scheduled Tribes
in Public Sector Enterprises in India (01.01.1971 to 1.1.2010)
Table 5.22: Percentage of Scheduled Tribe Employees in PSEs, 1971-2004 (By
Categories)
Table 5.23: Percentage Distribution of Scheduled Tribe Employees in Public Sector
Banks (By Categories)
Table 5.24: Percentage Distribution of Scheduled Tribe Employees in Insurance Jobs (By
Categories)
Table 5.25: Backlog Vacancies for Scheduled Tribes and All in the Central Government
as of 8th May 2013
Table 5.26: Distribution of Enterprises (only for proprietary and partnership enterprises)
of Unorganized Service Sector by Social Group of Owner/Partner by Type of
Enterprise per 1000 population: All-India (2001-02)
Table 5.27: Percentage (percent) Distribution of Enterprises by Status in the Last Three
Years for All Industries and Social Groups - All-India (Rural and Urban),
1997
Table 5.28: Performance of the MGNREGA (National Overview)
Table 5.29: MGNREGA at a Glance
Table 5.30: Occupational Distribution among Scheduled Tribes and Others
Table 5.31: Employment distribution of Rural Households among Scheduled Tribe and
All by Household type

15
Table 5.32: Employment distribution of Urban Households among Scheduled Tribe and
All by Household type
Table 5.33: Household incomes, consumption and poverty among Scheduled Tribes and
All
Table 5.34: Proportion of Household Income by Source
Table 5.35: Agricultural Productivity in Tribal States
Table 5.36: Number per 1000 of households reporting each source of income during the
period of last 365 days belonging to different social groups, by State/UT:
Rural in 1999-2000
Table 5.37: State-wise Monthly per capita expenditure class for Scheduled Tribes and all
social groups per 1000 distribution of persons
Table 5.38: Changes in Average Monthly Per Capita Expenditure (MPCE)
Table 5.39: Gaps of MPCEs of Social Groups from Scheduled Tribes
Table 5.40: Poverty by Social Groups, 1993-94 to 2011-12 in All-India – Rural, Urban
and Combined
Table 5.41: Total Amount of Outstanding Cash Dues (TD), Average Debt (AOD) per
Household, Average Value of Assets (AVA), Debt Asset Ratio (DAR),
Incidence of Indebtedness (IOI) as on 30.6.02 for each social group
Table 6.1: Scheduled Tribe Literacy Rate and Gap, 1961-1981
Table 6.2: Scheduled Tribe Drop-out Rate in Comparison, 1980-81
Table 6.3: State-wise Scheduled Tribe Drop-out Rate from Class I-X, 1981-82
Table 6.4: Discipline and Level-wise Scheduled Tribe Presence in Higher Education,
Table 6.5: Field-wise Distribution of Plan Outlay in the First and Second Plans
Table 6.6: Distance between Household and Nearest Primary School, 1993-94 to 2007-
08 (percent)
Table 6.7: Distance between Households and Upper Primary/Secondary Schools (in per
cent)
Table 6.8: Educational Level-wise Enrolment, 1980-81 to 2010-11 of STs and Others
(in lakhs)
Table 6.9: Educational Level-wise Gross Enrolment Ratio of STs and Others, 1986-87
to 2010-11
Table 6.10: Dropout Rate of Scheduled Tribes and Others, 1990-91 to 2010-11
Table 6.11: Percentage of Out-of-school Children (6-14 years)
Table 6.12: Average Expenditure on Education in the last 365 days
Table 6.13: Item-wise Average Private Expenditure on Education, 2009-10
Table 6.14: Type of Institution attended by Social Groups

16
Table 7.1: Annual exponential growth rate of Scheduled Tribe Population between
Census of India, 2001 and 2011
Table 7.2: Sex Ratio of population in India and States/UTs, 2011
Table 7.3: Occupational structure by types of sector among Scheduled Tribes and Non-
Scheduled Tribes
Table 7.4: Infant mortality, Under-five mortality and Life expectancy at birth for
Scheduled Tribes population
Table 7.5: Neonatal Mortality Rate, Infant Mortality Rate and Under-five Mortality Rate
among Scheduled Tribes and Others by States/UTs
Table 7.6: Trends in Neonatal, Infant and Under-five mortality rates for Scheduled
Tribes and Total Population by State/UTs
Table 7.7: Total fertility rates for Scheduled Tribes and Others by State/UTs
Table 7.8: Percentage of currently married women aged 15-49 years, currently using any
modern contraceptive method according to States/India
Table 7.9: Prevalence of Tobacco consumption (Smoke/Chewing) among Men aged 15-
54 (NFHS (2005-06))
Table 7.10: Prevalence of Alcohol consumption among Men aged 15-54 Years
Table 7.11: Availability of tap water within the households in India and States/UTs
Table 7.12: Households with sanitary facility in India and States/UTs
Table 7.13: Households with drainage facility in India and States/UTs
Table 7.14: Households using cooking fuel in India and States, 2011
Table 7.15: Physicians, Pediatricians, and Specialists at community health centers
(CHCs) in Tribal areas, 2012
Table 7.16: Doctors at PHCs in tribal areas, 2012
Table 7.17: Human resources, services, equipment, emergency and essentials drugs
availability at CHCs
Table 7.18 Human resources, services, equipment, emergency and essentials drugs
availability at sampled PHCs
Table 7.19: Sources of treatment seeking among Scheduled Tribes and Non-Scheduled
Tribes
Table 7.20: Households seeking health care from traditional healers in India
Table 7.21: Full Antenatal check-up in ever-married women aged 15-49, by state
Table 7.22: Institutional delivery in ever-married women aged 15-49, by state
Table 7.23: Newborns who received check-up within 24 hours of birth (percent)
Table 7.24: Percentage of children aged 0-5 months who received exclusive breast
feeding

17
Table 7.25: Percentage of children aged 12-23 months who received full immunization by
states
Table 8.1: Social groups of DP/PAPs from 13 States
Table 8.2: A conservative estimation of displaced by development projects in India,
percentage of STs (1951-1990) and number resettled (in lakhs)
Table 8.3: Information from PSU Coal India of Displaced Persons, Resettlement and
Rehabilitation
Table 8.4: Extent and Proportion of Common Land/Forest Diverted and Private Land
Acquired
Table 8.5: Project wise number of DPs/PAPs in Andhra Pradesh (1951-95)
Table 8.6: Distribution of DPs and PAPs by social group in Andhra Pradesh
Table 8.7: Total and type of land acquired and extent of DPs/PAPs and caste-tribe
division in Jharkhand, 1951-1995
Table 8.8: Total and type of land acquisition, DPs/PAPs and resettlement in Odisha
Table 8.9: Land acquisition, utilisation and DPs/PAPs by project categories
Table 8.10: Social background of DPs/PAPs in Gujarat
Table 8.11: District-wise land acquisition according to project category in Chhattisgarh
(1982-90, 1991-07)
Table 8.12: Land acquisition by project category in Chhattisgarh (1982-90, 1991-2007)
Table 8.13: Land Acquisition, Displacement and R&R data, Madhya Pradesh
Table 8.14: Total number of DPs and PAPs in West Bengal, 1947-2000
Table 8.15: State-wise information on alienation and restoration of tribal lands
Table 9.1: FRA claims status as of 31st January 2014
Table 9.2: Protected Areas of India
Table 9.3: Figures on Encroachments, Regularisation and Evictions (31.3.2004)
Table 9.4: State Position on Minor Forest Produce (as on 2010)
Table 9.5: Number of Settlements and People affected by Polavaram project
Table 10.1: Central Government Annual Outlay for Tribal Sub-Plan
Table 10.2: Ministry-wise Tribal Sub-Plan Outlay
Table 10.3: Tribal Sub-Plan outlay for selected States
Table 10.4: Tribal Sub-Plan Allocation
Table 10.5: Selected Socio-economic Indicators

18
List of Figures
Figure 3.1: State-wise distribution of STs (as per the 2011 census)
Figure 3.2: Decadal change in ST population (total, rural and urban)
Figure 5.1: Change in Occupations among Scheduled Tribes
Figure 5.2: Distribution of Land Ownership (Average Area (ha) owned per Household
among Scheduled Tribes and All)
Figure 5.3 Distribution of Ownership Holdings among households (percent) in Rural
Areas
Figure 5.4 Distribution of Ownership Holdings among households (percent) in Urban
Areas
Figure 5.5 Distribution of Ownership Holdings among households (percent) in Rural
and Urban Areas
Figure 5.6 Distribution of Large Land Holdings among households (percent) of
Scheduled Tribes and Total Population
Figure 5.7 Percent Share of Operational Holdings and Operational Areas
Figure 5.8: Percent Share of Operational Holdings and Operational Areas among
Scheduled Tribes
Figure 5.9: Operational Holdings (Average area operated (hectares) among Scheduled
Tribes and All from 1980-81 to 2010-11)
Figure 5.10: Assets Possessed by ST and all Households in 2011
Figure 5.11: Condition of Houses Occupied by Scheduled Tribe and Other Households,
2011 Census
Figure 5.12: Main Source of Lighting among Households of Scheduled Tribes and All,
2011 Census
Figure 5.13: Fuel used for Cooking by Households of Scheduled Tribe and All, 2011
Census
Figure 5.14: Percentage of households by Location of drinking water for Scheduled Tribes
and All groups, 2011 Census
Figure 5.15: Percentage of households by Source of drinking water for Scheduled Tribes
and All groups, 2011 Census
Figure 5.16: Percentage of Households having Latrine and Bathing Facility within
Premises, 2011
Figure 5.17: Average Value of Assets (Rs.)/HH
Figure 5.18: Percent of Household Asset Holding

19
Figure 5.19: Worker Population Ratio (WPR) from 1983 to 2009-10 (Rural Male)
Figure 5.20: Worker Population Ratio (WPR) from 1983 to 2009-10 (Rural Female)
Figure 5.21: Worker Population Ratio (WPR) from 1983 to 2009-10 (Urban Male)
Figure 5.22: Worker Population Ratio (WPR) from 1983 to 2009-10 (Urban Female)
Figure 5.23: Worker Population Ratio based on UPS approach
Figure 5.24: Labour Force Participation Rate
Figure 5.25: Unemployment Rate (Rural Male)
Figure 5.26: Unemployment Rate (Rural Female)
Figure 5.27: Unemployment Rate (Urban Male)
Figure 5.28: Unemployment Rate (Urban Female)
Figure 5.29: Unemployment Rates based on UPS Approach
Figure 5.30: Occupational Distribution among Scheduled Tribes and Others
Figure 5.31: Occupational Distribution among Scheduled Tribes
Figure 5.32: Household Income and Consumption
Figure 5.33: Percent of Poor among Scheduled Tribes and General Population
Figure 5.34: Percent of BPL Population (Rural)
Figure 5.35: Percent of BPL Population (Urban)
Figure 5.36: Percent of BPL Population (Rural and Urban)
Figure 5.37: Incidence of Indebtedness among Scheduled Tribes and Other Groups
(Percent)
Figure 6.1: Proportional Change in GER and Dropout Rate of STs (Class I-VIII)
Figure 6.2: Proportional Change in GER and Dropout Rate of STs (Class I-X)
Figure 7.1: Contraceptive Use (2007-08)
Figure 7.2: Average Household Intake of Foodstuffs as % RDA
Figure 7.3 Median household Intake of Nutrients as % RDA
Figure 7.4: Average Household Intake of Foodstuffs as % RDA (1-3 Years Children)
Figure 7.5: Median Intake of Nutrients as % RDA among 1-3 Years Children
Figure 7.6: Average Intake of Foodstuffs as % RDA among Sedentary Females – NPNL
(>= 18 Years)
Figure 7.7: Median Intake of Nutrients as % RDA among Sedentary Females – NPNL
(>= 18 Years)

20
Figure 7.8: Prevalence (%) of Under-nutrition among Pre-School Children according to
SD Classification (WHO) by Gender
Figure 7.9: Distribution (%) of Adults by BMI Grades
Figure 7.10: Percent Prevalence of Nutritional Deficiency Signs of Pre-school Children –
Time Trends
Figure 7.11: Mean Intake of Nutrients among 1-3 years Children – Time Trends
Figure 7.12: Distribution (%) of Children (1-5 years) according to GOMEZ Classification
– Time Trends
Figure 7.13: Distribution (%) of Adults by BMI Grades and Years
Figure 7.14: Prevalence (%) of Hypertension by States – Males
Figure 7.15: Prevalence (%) of Hypertension by States – Females
Figure 7.16: Shortfall of Specialists in Tribal Areas
Figure 7.17: Percent of Sample PHCs Possessed Selected Equipment in Different State
Figure 7.18: Institutional Delivery by ST and Non-ST, 2007-08
Figure 9.1: Awareness Levels regarding Individual Forest Rights among Women
Figure 10.1: Grants under Article 275(1)

21
1. Preface
The Indian State must aim to ensure that all sections of society share in the economic
and social prosperity of the country. It is widely acknowledged that a large section of
the Indian population, especially the tribal communities, have not received the full
benefits of development processes undertaken over the past six decades. Indeed, it is
recognised that the tribal population has been adversely affected by the developmental
projects undertaken during this period. It is imperative that the causes, circumstances
and consequences of this situation are studied and analysed in detail in order to design
appropriate interventional measures to remedy the current state of affairs and uphold
the progressive principles enshrined in the Constitution of India.
Accordingly, the Prime Minister’s Office constituted a High-Level Committee (HLC)
in August 2014, consisting of the following members: Prof. Virginius Xaxa as
Chairperson, Dr. Usha Ramanathan, Dr. Joseph Bara, Dr. K.K. Misra, Dr. Abhay
Bang, Smt. Sunila Basant, and Dr. Hrusikesh Panda, Secretary, Ministry of Tribal
Affairs, as Member-Secretary. The Committee was mandated to examine the socio-
economic, educational and health status of tribal communities and recommend
appropriate interventional measures to improve the same. The Committee formulated
thematic sections based on various socio-economic parameters mentioned in the
Terms of Reference and each theme was taken up by individual members based on
their areas of expertise.
The decision of the Prime Minister’s Office to constitute this Committee is an
indication of the Centre’s commitment to tribal welfare and willingness to make
appropriate amendments in programmes and policies to alter the dismal situation of
the tribal population in contemporary India. The HLC is honoured to have had the
opportunity to prepare this report on a matter of immense importance for the country.
The Committee’s visits to various tribal areas and interactions with people have only
strengthened our belief in the urgent need for rethinking the prevailing model of
development and a shift in the State’s approach to the tribal question. The HLC
sincerely hopes that the recommendations be incorporated into State laws, policies
and practices. Doing so is essential in order to strengthen existing and future
programmes and laws for the Scheduled Tribes.
The task assigned to the Committee was formidable and challenging. The primary
limitation faced by the HLC was that of inadequate time. Nonetheless, the Committee
persevered to compile the report within the stipulated time period. While the report
was to be submitted by May 13, 2014, the Committee has taken an additional two
weeks for completion. The Chairperson wishes to express his sincere gratitude to all
the members of the Committee for their time, effort and commitment in preparing this
report, despite several other personal and professional obligations.

22
Such a mammoth exercise would have been impossible without the generous help of
numerous individuals and organisations. The former Minister of Tribal Affairs, Dr.
Kishore Chandra Deo shared his insights into the conditions of tribals with the
Committee at the very outset. The HLC is extremely grateful to him.
We are thankful to the former Member-Secretary, Smt. Vibha Puri Das for setting in
motion the work of the HLC and providing the impetus to take this report forward,
furnishing logistical, moral and intellectual support until her retirement in December
2013.
At the Ministry of Tribal Affairs, the Committee thanks the Deputy Director-General
(Statistics), Dr. Siladitya Chaudhuri, for his dedicated efforts in the formation of task
groups and initial collection of data. The HLC is also grateful to Joint Secretaries,
Shri Ashok Pai and Shri Manoj Pingua (former Secretary, Tribal Welfare,
Government of Chhattisgarh), and Economic Advisor, Smt. Sangeeta Verma for their
help.
Special thanks must go to Dr. Namita Priyadarshee, Director (High Level Committee)
for her enormous efforts in ensuring the completion of the report. The staff and
consultants at the HLC secretariat – Shri Harvinder Singh, Shri M.P. Saini, Ms.
Poonam Madhwal and Shri Sandeep Kumar – provided the Committee with
invaluable administrative support, without which our task could not have been
accomplished successfully.
The HLC wishes to thank the office of the Registrar General of India, the National
Sample Survey Organisation (NSSO), Chief Statistician of India and Secretary,
Ministry of Statistics, Planning and Implementation (MoSPI) for providing the
Committee with valuable statistical data. For sharing information on various
developmental indices, we are extremely grateful to the Ministry of Rural
Development; Ministry of Micro, Small and Medium Enterprises; Ministry of Labour
and Employment; Ministry of Agriculture (Department of Agriculture and
Cooperation and Department of Animal Husbandry, Dairying and Fisheries); Ministry
of Human Resource Development (Department of Higher Education and Department
of School Education and Literacy); Ministry of Health and Family Welfare
(Department of Health and Family Welfare and Department of AYUSH) and Ministry
of Social Justice and Empowerment. The Committee benefitted immensely from the
efforts of the various State Government departments which submitted data on tribal
development, hosted the Committee by arranging field visits and arranged meetings
with local leaders and Government officials.
The HLC would like to acknowledge the National Law University, Dwarka, New
Delhi, for providing logistical support at the initial stage. The HLC is obliged to the
experts – Dr. K.B. Saxena, Shri C.R. Bijoy, Shri Suhas Chakma, and Shri Tushar
Dash – who participated in the workshop organised in April, for contributing to the

23
report with their knowledge and expertise on tribal issues. We would also like to
thank Prof. Tiplut Nongbri for her suggestions.
Several Non-Governmental Organisations (NGOs), community organisations,
academics and members of the public took time out to submit suggestions to the HLC,
which the HLC has taken note of and incorporated in the report. The Committee is
indebted to the NGOs and researchers who provided us with valuable reports and
data, and who organised meetings, workshops and public hearings to collect
information for the purpose of this report.
The HLC received research assistance from individual consultants and agencies
namely, Prof. M. Gopinath Reddy, Centre for Economic and Social Studies (CESS)
Hyderabad; Dr. K. Koteswara Rao; Prof. Chander Shekhar and Prof. Faujdar Ram,
International Institute of Population Sciences (IIPS), Mumbai; Dr. Joseph Marianus
Kujur, Indian Social Institute, New Delhi; Bhaskar Kumar Kakati, Amba Kak,
Lubhyathi Rangarajan, Tanya Matthan, Ganesh Manjhi and Bipasha Rosy Lakra. The
tireless efforts of the consultants are highly appreciated by the Committee. The HLC
is thankful for the efforts of Dr. Madhavi Panda, who worked diligently to edit the
report at extremely short notice and Shri Dilip Kumar for his patient technical
assistance.
All Committee Members

24
2. Introduction
The tribal population in India, though a numerically small minority, represents an
enormous diversity of groups. They vary among themselves in respect of language
and linguistic traits, ecological settings in which they live, physical features, size of
the population, the extent of acculturation, dominant modes of making a livelihood,
level of development and social stratification. They are also spread over the length
and breadth of the country though their geographical distribution is far from uniform.
A majority of the Scheduled Tribe population is concentrated in the eastern, central
and western belt covering the nine States of Odisha, Madhya Pradesh, Chhattisgarh,
Jharkhand, Maharashtra, Gujarat, Rajasthan, Andhra Pradesh and West Bengal. About
12 per cent inhabit the Northeastern region, about five per cent in the Southern region
and about three per cent in the Northern States.
Groups and communities identified and enumerated as tribes during British rule came
to be re-classified as Scheduled Tribes after the Constitution was adopted in 1950.
The Constitution, as per Article 342, provided for the listing of these groups in the
Schedule so that certain administrative and political concessions could be extended to
them. Thus, a distinction was drawn in the form of tribe as a social and cultural entity
and tribe as a politico-administrative category. However, there were groups and
communities who belonged linguistically, socially and culturally to the same
community but found themselves listed in some States of the Indian Union but not in
other, often neighbouring, States. Similarly within the State, the same community
may have found itself listed in some regions but not in others.
There has also been the exclusion of certain groups from the Schedule due to
differential spellings in the names of the communities. Such anomalies were wide
spread at the time of adoption of the Constitution, although some corrective measures
have been taken from time to time. This partially explains why there has been a
phenomenal increase in the number of communities in the Scheduled Tribe category
as well as some increase in the total size of the tribal population. Even today, there are
demands being made by groups in different parts of the country for inclusion in the
category on various grounds. Thus, ‘tribe’ continues to be an important marker of
identity and mode of political articulation among several communities in India.
The High Level Committee (HLC) was constituted by the Prime Minister’s Office in
August, 2014 to look into the socio-economic, educational and health status of the
tribals of India. The Terms of Reference (TOR) of the HLC refers to ‘tribal
communities’ which expands the scope of this report beyond the political-
administrative category of Scheduled Tribes. As mentioned earlier, the category of
‘tribe’ entails a social and cultural dimension but the Scheduled Tribe category has
politico-administrative implications. The demand for Scheduled Tribe status
continues to this day and there is no guarantee that such demands will not emerge in
the future.

25
The Constitution did not define the criteria for recognition of Scheduled Tribes and
hence the Lokur Committee was set up to look into this issue. The Committee
recommended five criteria for identification, namely, (1) primitive traits (2) distinct
culture, (3) geographical isolation, (4) shyness of contact with the community at large
and (5) backwardness. However, some of these criteria carry forward certain
paternalistic and pejorative connotations from the colonial era. Features associated
with the idea of ‘indigenous peoples’ may serve as a useful pointer in this regard,
although the term ‘indigenous’ is more accurate in the context of North and South
America and Australia. In South Asia, this term has been questioned since it assumes
a theory of Aryan invasion. However, many tribal communities employ the term
‘adivasi’ (original inhabitant) as a political term of self-reference – although this term
is not recognised by the Government of India. While tribes have a distinct culture and
history, they also share commonalities with other marginalised sections of Indian
society, such as the lack of adequate political representation, economic deprivation
and cultural discrimination. Beyond their marginality, however, the many positive
features of tribal society must be appreciated and it must be recognised that non-tribal
people have much to learn from the richness of tribal cultures and systems of
knowledge.
The tribal population, scattered across the country, is differently placed with respect
to the politico-administrative structures existing in the country. Where they are a
numerical minority, they are a part of the general administrative structure of the
country, although certain rights have accrued to Scheduled Tribes across the country
through reservations in educational institutions and government employment.
However, where they are numerically dominant, two distinct administrative
arrangements have been provided for them in the Constitution in the form of the Fifth
and Sixth Schedules. The Sixth Schedule areas are some of the areas which were
‘excluded’ until the Government of India Act, 1935 in the erstwhile Assam and other
tribal-dominant areas which became separate States. These areas have been given
special provisions under Part XXI of the Constitution. The extension of such
provisions to newer areas has been the result of political mobilization and social
movements. Similarly, there are States where the provisions of the Fifth Schedule are
in force. The Fifth Schedule is aimed at providing protections to the tribal population
through separate laws for Scheduled Areas, including a special role for the Governor
and the institution of Tribes Advisory Council. The provisions of the Fifth Schedule
have seen further legal and administrative reinforcement in the form of Provisions of
Panchayats (Extension to Scheduled Areas) Act, 1996.
Despite these special provisions, tribes are among the poorest and most marginalized
sections of Indian society. Although numerically only about 8.6 per cent, they
disproportionately represent the people living below the poverty line, are illiterate and
suffer from extremely poor physical health. To illustrate, 45.7 per cent of the
population as a whole was below the poverty line in 1993-94. In the same year, 63.7
26
per cent of tribal people were living below the poverty line, almost 20 per cent than
the rest of the country. The poverty figures were 37.7 and 60.0 per cent respectively in
the year 2004-05. The scenario has been similar in the sphere of education and health.
The literacy rate of tribes in 2001 was 47 per cent as compared to 69 per cent for the
general population. Moreover, as per the National Family Health Survey, 2005-06,
the Infant Mortality rate was 62.1 per 1000 live births among tribes, and Under-five
Mortality was as high as 95.7 per 1000 live births.
In acknowledgement of the marginality of tribal communities, a number of
Committees and Commissions have been constituted over the years by the
government to look into the issues facing tribal communities, apart from numerous
other bodies which have examined the status of tribes as part of broader thematic
investigations. One of the first committees set up in this regard post-1947 was the
Elwin Committee which was to examine the functioning of Multi-Purpose
Development Blocks, the basic administrative unit for all tribal development
programmes. This was followed by the U.N. Dhebar Commission, constituted in 1960
to address the overall situation of tribal groups, including the issue of land alienation
in tribal areas. The Lokur committee, set up in 1965, looked at matters relating to the
scheduling of groups as Scheduled Tribes. It was this committee which delineated the
criteria for scheduling, which continues to operate to this day. The Shilu Ao
committee, 1966, like the Elwin committee, addressed the issue of tribal development
and welfare.
The 1970s, too, saw the constitution of several committees to address tribal problems
and it was on the basis of the recommendations of some of these committees that the
Tribal Sub-Plan approach of the government emerged. The committees constituted in
the more recent years have been the Bhuria Committee (1991) and the Bhuria
Commission (2002-2004). The Bhuria Committee recommendations paved the way
for the enactment of the PESA Act, 1996, while the Bhuria Commission focused on a
wide range of issues from the Fifth Schedule to tribal land and forests, health and
education, the working of Panchayats and the status of tribal women. The most recent
committees have been the Bandopadhyay Committee, which looked at development
and governance in Left-Wing Extremist areas, and the Mungekar Committee, which
examined issues of administration and governance.
The issues that the above mentioned Committees have dealt with fall broadly into two
categories: development and protection. And yet, on both these issues, the outcome
for tribal communities has been mixed. Through the last six decades, the State has
emphasized development while doing little to enhance the protections provided in the
Constitution through the everyday practice of statecraft. Rather, the protective
measures have been violated by the very State which is supposed to ensure the
enforcement of these protections. It is this which largely explains the marginal status
of tribal communities.

27
The constitution of this High Level Committee by the Prime Minister’s Office marks
the recognition of the fact that Scheduled Tribes have lagged behind other segments
of the population in respect of overall economic standing, education and health status,
despite the country having witnessed a relatively high growth rate in last two decades.
However, this growth seems to have bypassed the tribes as tribes seem to have not
done well with respect to all indicators of development at the national level. The
Terms of Reference centres on the socio-economic, education and health status of
tribal communities (Annexure 1). However, issues of law and administration have
been included in our report, particularly since socio-economic status is intimately
connected to legal frameworks and political arrangements.
In the course of preparing our report, the Committee went through several constraints
which must be mentioned at the outset. The most important limitation was that of
time, particularly since our visits to the States and interactions with the State
Government officials were halted with the announcement of the Parliamentary
elections and the enforcement of the model code of conduct. Further, while the
Committee had requested the State Governments for data on various parameters
related to Scheduled Tribes in their States, a large number failed to submit this data.
Further, the National Sample Survey Organisation (NSSO), Census of India, and the
National Family Health Survey did not have data on some issues to be examined by
the Committee as per the Terms of Reference, and where data existed, in some cases,
disaggregated data was not available.
The Committee is mandated to prepare a position paper on the present socio-
economic, health and educational status of STs, and is expected to suggest policy
initiatives as well as effective outcome-oriented measures to improve development
indices and strengthen public service delivery to the Scheduled Tribes. The TOR
emphasizes an examination of the position of tribes vis–a-vis other social groups as
well as at different levels such as the national, regional and district levels. The key
issues and questions to be addressed are:
geographical pattern of economic activity and the changes in avenues of
employment and livelihood due to rapid urbanization and shrinking of
their habitat; asset base and income levels and changes in the pattern of
ownership and productivity of immovable assets coupled with the role of
public policy and legal frameworks in facilitating/inhibiting such changes
access to educational services, level of social infrastructure, level of
literacy and dropout rates
access to health services, level of social infrastructure, Maternal
Mortality Rate and Infant Mortality Rate
relative share of public and private employment, reasons for under-
representation and capacity building steps to enhance employability

28
adequate systems and structures for implementation of protective
legislations
consolidate, collate and analyse this information to identify areas of
intervention in order to address the socio-economic, health and education
status of tribes.
Whereas data are the foundation of this study, careful analysis and interpretation of
data have been the most important and critical task of the Committee. It is on this
basis that the Committee has tried to discern the effectiveness and limitations of
relevant laws, policies, institutions and programmes and has made recommendations
for addressing the tribal problem in India.
The Committee has prepared the report based on information obtained from various
Ministries, Departments and Agencies of the Central and State Governments. Two
major sources of information have been the office of the Registrar General of India
and the National Sample Survey Organisation (NSSO). The Committee has surveyed
the published books, research articles and reports on social, economic, health and
educational status of Scheduled Tribes in India at different levels and on the working
of Constitutional and legal provisions. The HLC as a team visited some Fifth, Sixth
Schedule and non-Scheduled states and interacted with officials, Non-Governmental
Organisations (NGOs) and community leaders to understand the problems existing in
the States. Alongside, individual members undertook field visits and attended public
hearings in several States to assess the ground-level reality. A large number of
representations from individuals, NGOs and community organisations were submitted
to the HLC, which have been examined and used in the report.
The report has been organized around five critical thematic issues: livelihood and
employment, education, health, involuntary displacement and migration, and legal
and constitutional matters. Of the five themes, three themes are concerned with issues
that have been at the root of the post-colonial State’s development agenda for tribes:
livelihood and employment, education and health. Substantial resources have been
allocated specifically for tribes in all these spheres, and special programmes and
schemes have also been formulated to address problems on these fronts, beginning
from the first phase of India’s planned development. The concern with these issues
still continues. The steady increase in resource allocation for these purposes and
revamping of programmes and schemes has proceeded side by side. And yet the status
of tribes in these spheres continues to be one of the critical gaps in India’s road to
development. The report examines the position of tribes in these spheres in three
separate chapters. This also raises the question of institutions and systems for delivery

29
of public goods and services, which is the subject of the last chapter.1Although, tribes
constitute a distinct social category and have special Constitutional and legal
provisions, they have not been outside of India’s larger economic and political
framework. And the working of these larger institutional frameworks especially, the
economic, legal and administrative, has adversely affected the tribal communities in
India. As a part of the nation-building process, tribal areas have witnessed the large-
scale development of industry, mining, infrastructure projects such as roads and
railways, hydraulic projects such as dams and irrigation. These have been followed by
processes of urbanization as well. The overall impact of these on tribes has been
often loss of livelihood, massive displacement and involuntary migration. Issues
pertaining to these mentioned problems have been critically examined in the report.
Another important issue analysed by the Committee is the working of legislations that
have a bearing on tribal communities. It is not possible to make a detailed study of all
of these laws and hence, only those that the HLC views as central to their socio-
economic status have been addressed in the report. The Provisions of Panchayats
(Extension to Scheduled Areas) Act (PESA), 1996 and The Scheduled Tribes and
Other Traditional Forest Dwellers (Recognition of Forest Rights) Act (FRA), 2006,
enacted to redress the historical injustice to tribal and forest communities, have been
significant initiatives that have changed their legal status. However, policies and
practices have been slow to absorb the changed circumstances recognised in the law.
These legislations and their violations have been examined for future amendment.
Subjects such as land acquisition, food security, detention and imprisonment, the
status of Particularly Vulnerable Tribal Groups (PVTGs) and De-notified Tribes, have
also been highlighted.
The above key substantive chapters in the report have been prefaced by two separate
chapters –outlining the geographical and demographic profile of tribal communities in
India and focusing on the workings of the legal and administrative framework
provided for Scheduled Tribes in the Constitution.
As mentioned previously, the substantive issue of the socio-economic, educational
and health status of tribal communities are an integral part of the development agenda
that the State has been pursuing for its citizens. With respect to tribal development,
there were two prominent colonial discourses which have continued into the post-
colonial period.
In one of the discourses, the overall condition of tribal people, including their poverty,
is attributed to their social and geographical isolation. Correspondingly, the whole
thrust of the approach to tribal development in independent India was to be centred on
1 Since the Committee had the advantage of the presence of the Secretary, MoTA, and it was evident that the Ministry needed to
be strengthened so as to be able to carry out its task of protecting the tribal interest, the Secretary has contributed this chapter to
the report. Such an exercise needs to be done with other agencies involved in protecting and promoting the tribal interest
including the National Commission for Scheduled Tribes.

30
the integration of tribes into the larger Indian society. In fact, their integration was
seen as the solution to tribal ‘backwardness’. There was, however, also a dramatically
contrasting explanation for their poverty. The main architect of this view was Verrier
Elwin who attributed their deplorable and impoverished condition to their contact
with the outside world, which had led to indebtedness and loss of control over their
land and forests. The nationalist leadership recognized both of these dimensions and
addressed them. The provisions enshrined for Scheduled Tribes in the Indian
Constitution are a testimony to this dual approach. It provides for development as well
as for safeguarding and protection of their interests.
However, it was development (of a particular kind) that became the primary thrust of
the State’s agenda, with minimal regard for protections and safeguards. What the
State is actually pursuing in tribal areas – apart from Northeast India – is assimilation
rather than integration, contrary to what is claimed. A policy of integration would
provide space for protections and safeguards for their distinct identity, as enshrined in
the Constitution. However, these provisions are precisely what are under threat of
erosion through the process of cultural domination and more importantly, the
prevailing development paradigm.
Moreover, the view that lack of development of the tribal population was caused by
their isolation took precedence. This is often followed with the argument of
inadequate resource allocation for tribal development. However, even with an
increase in resource allocations since the Fifth Five Year Plan beginning in 1974, the
condition of tribals has failed to improve proportionally. There is no doubt that
isolation is an important constraint to development. However, to put the blame
squarely on isolation is a gross distortion of the development problem of the tribal
population.
Poor implementation of programmes is offered as another explanation for the issue of
lack of social development among tribals. In this view, the solution lies in effective
implementation of State-sponsored development programmes and schemes, whether
these pertain to livelihood and income-generation activities, education, health, or
communication facilities. However, the problem of ineffective implementation in
tribal areas remains inadequately addressed.
The third set of arguments regarding poor development of the tribal populations is
built around the issue of the traditional socio-cultural aspects of tribal life. If tribals
suffer from low income, poor educational and health status and various kinds of
diseases, this is because of their traditions and lifestyle. However, this may not be due
as much to their social structure but to overall cultural and value framework of State-
led development. The framework of development is alien to the tribes. For example,
education in the regional language is usually familiar to the general population,
including the Scheduled Castes, but this is not the case in the tribal context (although
Scheduled Castes suffer from several other forms of discrimination). Hence, social

31
development processes may not operate as smoothly as in ‘mainstream’ society. Thus,
there is a need to re-orient development in tune with the tribal culture and to adopt a
more humane approach to tribal development.
However, one can probe the issue of tribal development beyond concerns of
inadequate resource allocation, ineffective implementation or tribal traditions to
engage with the larger question of national and regional development. The
appropriation of tribal land and forests began during colonial rule and has continued
to the present. Since tribal-inhabited regions are rich in mineral, forest and water
resources, large-scale development projects invariably came to be located in tribal
areas.
No region in India illustrates this better than the States of Jharkhand and Odisha,
which have considerable natural resources, but also the highest percentages of tribal
people living below the poverty line. In 2004–05, the proportion of tribal people
living below poverty line stood at 54.2 per cent in Jharkhand while the percentage
was as high as 75.6 per cent in Odisha in the same year. Overcoming tribal ‘isolation’
through large-scale mining, industrial and infrastructure projects, as these States have
witnessed, has clearly not resolved the problem of poor development indicators.
Rather, these have led to further impoverishment and vulnerability.
Over the last two decades, there has been a massive push to this development agenda,
which has coincided with economic liberalisation and the entry of private
corporations into tribal areas. This has been met with considerable resistance by tribal
communities. This is often interpreted as evidence that tribes are ‘anti-development’,
which is far from the truth. What tribes have been questioning is the model of
development that is being imposed on them. Laws and rules that provide protection
to tribes are being routinely manipulated and subverted to accommodate corporate
interests. Tribal protests are being met with violence by the State’s paramilitary forces
and the private security staff of corporations involved.
These dismal situations have paved the way for Left-Wing Extremism (LWE) in tribal
areas. Of the nine States considered to be seriously affected by LWE, six are States
with Scheduled districts. Among the 83 LWE-affected districts, 42 districts have
Scheduled Areas. These regions are marked by the following features:(1) serious
neglect and deprivation, widespread poverty and poor health and educational
status;(2) exploitation and oppression by traders and money lenders, on the one hand,
and absence of an effective and sensitive civil administration, on the other; (3) large-
scale displacement of tribal people for development projects;(4) occurrence of all of
the above despite the special Constitutional and legal provisions for the tribal people
(in the form of the Fifth Schedule, laws to prevent alienation of tribal land and
restoration of alienated lands, and in recent years, progressive legislations, such as
PESA, 1996 and FRA, 2006).

32
Broadly, there are three perspectives through which LWE in the region is viewed. The
first view sees it primarily as a national security problem to be addressed militarily.
This approach will result in the further alienation of tribal communities, widen the
trust deficit between the State and the people, and strengthen the Maoists. The country
cannot afford to adopt this line of thinking. The second perspective notes the overlap
between Maoist strongholds and tribal areas with dismal development indices and
views more development as the only solution. The third, a combination of the above
two, combines a military approach to secure the area with a focus on establishment of
better public infrastructure.
However, there should be a fourth perspective based on the explicit recognition that
there has been subversion of the law by both government and corporations in order to
appropriate tribal resources, and that this situation needs to be rectified. It
acknowledges that State failures and the trust deficit have facilitated the entry of the
Maoists into these areas and helped them gain some support among the people,
particularly Dalits and adivasis. A large section of people in tribal heartlands have lost
faith in the ability of the law and the willingness of the administration to protect their
interests. Any solution, therefore, should begin with confidence-building measures
through the redress of past wrongs and the guarantee of justice. This is necessary in
order to restore the trust of the tribals in the government.
To summarize, tribal communities face disregard for their values and culture, breach
of protective legislations, serious material and social deprivation, and aggressive
resource alienation. Hence, the solution to these issues should enable the tribals to
protect their own interests. Below, we outline the perspective that forms the
foundation of all the recommendations based in this report. We hope that the
government will seriously consider the suggestions of the HLC and incorporate them
in law, policy and practice. The report of the HLC is based on the perspective outlined
below and we hope that the State’s approach will be based on the same premises,
namely that:
An empowered citizenry and a functioning, participatory (including
participation of women) self-governance is the best guarantee for a democratic
nation;
Due share in socio-economic progress for tribal people and their habitations,
including facilities like health, education, livelihood, drinking water,
sanitation, roads, electricity and sustainable income, in situ;
Protecting the land and forest rights of tribal communities is equivalent to
protecting their livelihoods, life and liberty. This remains one of the critical
necessities of a welfare State. Therefore, laws protecting tribal land from
alienation must be upheld at all costs;

33
The right to natural resources in tribal lands has to be protected. They should
only be accessed with the consent of the Gram Sabhas of the villages (both
directly affected and in the zone of influence);
While tribal lands hold much of the natural and mineral wealth of the nation,
these resources cannot be alienated against their will. Moreover, communities
who part with their lands have the right to share in the wealth and income so
generated from its resources.
Hence, a reasonable share of the wealth generated by the resources in their
homelands must accrue to them by law, and
The right to preservation of their language, culture and traditions, and to
protect themselves against the loss of identity, must be recognized, protected,
documented and allowed to thrive as a dynamic living culture.

34
3. Geographical and Demographic Profile
3.1 Introduction
Although the Census of 2011 enumerates the total population of Scheduled Tribes at
10,42,81,034 persons, constituting 8.6 per cent of the population of the country, the
tribal communities in India are enormously diverse and heterogeneous. There are
wide ranging diversities among them in respect of languages spoken, size of
population and mode of livelihood. The number of communities that find their place
in the list of the Schedule of the Indian constitution is reflective of this diversity. The
Government of India, in its Draft National Tribal Policy, 2006 records 698 Scheduled
Tribes in India. As per the Census of India 2011, the number of individual groups
notified as Scheduled Tribes is 705. While it is not possible to provide detailed
descriptions of the demographic features and socio-economic status of each of these
tribal groups, this section attempts to map out the broad contours of the Scheduled
Tribes of the country in terms of their demography and geography.
There are various ways in which the demography of Scheduled Tribes may be
understood. Here, we have primarily presented data on tribal population and its
geographical distribution across states and the different individual tribes, areas of
concentration and populations. Further, we include available quantitative and
qualitative data on the tribal population in relation to languages and livelihoods,
density of forest cover and existence of mineral resources, and on-going conflicts.
The territories inhabited by tribes cross States and Union Territories in the country
and several tribes are found residing across five to six states. There are also tribal
groups whose populations are distributed across international boundaries such as
tribes in Himachal Pradesh, Uttar Pradesh, West Bengal, Arunachal Pradesh, Sikkim,
Nagaland, Manipur, Meghalaya and Mizoram which have fellow tribes people in
China (including Tibet), Bhutan, Myanmar and Bangladesh. The Nagas, for instance,
are divided among the states of Nagaland, Manipur, Assam, and Arunachal Pradesh as
well as in the neighbouring country of Myanmar.
The tribes can be distinguished into five broad regional groupings based on
ecological, social, economic, administrative, and ethnic factors (although there are
many overlaps):
1. Himalayan Region: It has three sub-regions: (a) Northeastern Himalayan region,
(b) Central Himalayan region, and (c) North-Western Himalayan region.

35
2. Middle Region: It is constituted by the States of Bihar, Jharkhand, West Bengal,
Odisha and Madhya Pradesh (including Chhattisgarh), where more than 55 per cent
tribal people of India live.
3. Western Region: It includes the States of Rajasthan, Gujarat, Maharashtra, Goa,
Dadra and Nagar Haveli.
4. Southern region: It is comprised of the states of Andhra Pradesh, Tamil Nadu,
Karnataka and Kerala.
5. Island Region: The Islands of Andaman and Nicobar in the Bay of Bengal and
Lakshadweep in the Arabian Sea.
There are many differences between these regions as well as differences from tribe to
tribe. For example, while the Northeast is often viewed as a singular and
homogeneous entity, the region is highly diverse with over 200 tribes and sub-tribes,
each of which have their own language, culture and political structures. Further, the
tribes of the Northeast differ from tribes in other parts of India, particularly in terms
of their historical relationship with the colonial and Indian State. The tribes of the
Andaman and Nicobar Islands, comprising 556 islands of which only a few are
populated, are also distinct. The Islands are administered as a Union Territory under
the Central Government and are home to some of the smallest tribes such as the Great
Andamanese, Onge, Jarawa and the Sentinelese.
The tribes can also be differentiated on the basis of population size since communities
like Gonds, Bhils, Santhals, Oraons, Minas, Mundas and so on have a population that
ranges from one million to a little over seven million people. As against this, there are
communities like the Andamanese Islanders and tribal groups such as the Birjia and
Asur in Bihar and the Birhor of Madhya Pradesh who have a population of less than
200 persons.
The languages of India fall into four different linguistic families. These are Indo-
European, Dravidian, Austro-Asiatic and the Tibeto-Burman sub-family of the Sino-
Tibetan languages. Approximately three-fourths of the country speaks languages
belonging to Indo-European family. However, only a little over one per cent of tribal
population speak languages of this family, the Bhil and Halbi tribes being the two
main groups among them. Languages belonging to Dravidian family are spoken by
tribes such as the Gond, Khond, Koya, Oraon, and Toda. Tibeto-Burman languages
are spoken by the tribes of the Himalayas and Northeast India. The Austro-Asiatic
family of languages is spoken only by tribals in the country like the Santhal, Munda,
and Ho.

36
Scheduled Tribes communities live in about 15% of the country’s area, in various
ecological and geo-climatic conditions ranging from plains and forests to hills. A
large proportion of Scheduled Tribes are collectors of forest produce, hunter-
gatherers, shifting cultivators, pastoralists and nomadic herders, and artisans.
Traditional occupations of tribal groups may range from honey-collection to hunting
small animals to engaging in metal-work and rope-making.
A majority of tribal groups work in the primary sector, and are heavily dependent on
agriculture either as cultivators or as agricultural labourers. At the same time, a
number of Scheduled Tribes no longer follow their traditional occupations and work
as labourers on plantations or in mines and factories (in many cases, since the
nineteenth-century). Displacement and enforced migration has also led to an
increasing number of Scheduled Tribes working as contract labourers in the
construction industry and as domestic workers in major cities. Over 80% of
Scheduled Tribes work in the primary sector against 53% of the general population,
primarily as cultivators. However, the number of STs who were cultivators, declined
from over 68% to 45% in 2001 whereas the number of tribal agricultural labourers
increased from about 20% to 37%, demonstrating increasing landlessness among
tribals. This trend has intensified, as can be seen in data from the 2011 Census. It is
further estimated that, in the last decade, about 3.5 million tribal people are leaving
agriculture and agriculture-related activities to enter the informal labour market.
Scheduled Tribes comprise 11.3 per cent of the Indian rural population and 2.8 per
cent of the Indian urban population. In 2001, the proportion of STs to the total
population was 8.2 per cent, while the proportion was 10.4 per cent in rural areas and
2.4 per cent in urban areas. The total male ST population according to the 2011
census is 5,24,09,823 of which 4,71,26,341 are residing in rural areas and 52,83,482
are in urban areas. The total female ST population is 5,18,71,211 with 4,66,92,821 in
rural areas and 51,78,390 in urban areas. The sex ratio among the Scheduled Tribes is
991 females to every 1000 males in rural areas and 980 females to every 1000 males
in urban areas, the average being 990.
3.2 Population of Scheduled Tribes across States
The following table segregates data on proportion of STs in the population of each
State thus depicting the States with the largest proportion of Scheduled Tribes (though
not the largest in terms of actual population) as well as the States with the lowest
proportion of STs (not including states/Union Territories with no recognised ST
population).
The Himalayan Region comprises 2.03 per cent of STs in the States of Jammu and
Kashmir, Himachal Pradesh, Uttarakhand and Uttar Pradesh; the Northeastern region
has 12.41 per cent of STs in Sikkim, Arunachal Pradesh, Nagaland, Manipur,

37
Mizoram, Tripura, Meghalaya and Assam; the Central-east Indian region has the
largest proportion of STs, about 52.51 per cent in Andhra Pradesh, Bihar, Jharkhand,
Madhya Pradesh, Chhattisgarh, Odisha and West Bengal; the Western region of
Rajasthan, Gujarat, Daman and Diu, Dadra and Nagar Haveli, Maharashtra and Goa
has 27.64 per cent of STs; the Southern region has 5.31 per cent of STs in the states of
Karnataka, Kerala and Tamil Nadu; and finally, 0.11 per cent of STs live in the island
region of Andaman and Nicobar Islands and Lakshadweep.
Table 3.1: Total population of STs and proportion of STs in each state to the
total state and national population S.
No.
Name of the
State/UT
Total
Population
ST
Population
% of STs in the
State to total
State
population
% of STs in the State to
total ST population in
India
00 India 1210569573 104281034 8.61 --
1 Andaman &
Nicobar Islands
380581 28530 7.49 0.02
2 Andhra Pradesh 84580777 5918073 6.99 5.67
3 Arunachal Pradesh 1383727 951821 68.78 0.91
4 Assam 31205576 3884371 12.44 3.72
5 Bihar 104099452 1336573 1.28 1.28
6 Chandigarh 1055450 0 -- --
7 Chhattisgarh 25545198 7822902 30.62 7.50
8 D & N Haveli 343709 178564 51.95 0.17
9 Daman & Diu 243247 15363 6.31 0.01
10 Goa 1458545 149275 10.23 0.14
11 Gujarat 60439692 8917174 14.75 8.55
12 Haryana 25351462 0 -- --
13 Himachal Pradesh 6864602 392126 5.71 0.37
14 Jammu & Kashmir 12541302 1493299 11.90 1.43
15 Jharkhand 32988134 8645042 26.20 8.29
16 Karnataka 61095297 4248987 6.95 4.07
17 Kerala 33406061 484839 1.45 0.46
18 Lakshadweep 64473 61120 94.79 0.05
19 Madhya Pradesh 72626809 15316784 21.08 14.68
20 Maharashtra 112374333 10510213 9.35 10.07
21 Manipur 2570390 902740 35.12 0.86
22 Meghalaya 2966889 2555861 86.14 2.45
23 Mizoram 1097206 1036115 94.43 0.99
24 Nagaland 1978502 1710973 86.47 1.64
25 NCT of Delhi 16787941 0 -- --
26 Odisha 41974218 9590756 22.84 9.19
27 Puducherry 1247953 0 -- --
28 Punjab 27743338 0 -- --
29 Rajasthan 68548437 9238534 13.47 8.85
30 Sikkim 610577 206360 33.79 0.19
31 Tamil Nadu 72147030 794697 1.10 0.76
32 Tripura 3673917 1166813 31.75 1.11
33 Uttar Pradesh 199812341 1134273 0.56 1.08
34 Uttarakhand 10086292 291903 2.89 0.27
35 West Bengal 91276115 5296953 5.80 5.07 Source: Census of India, 2011. (Note: Excluding 3 Sub-divisions of Senapati District of Manipur)

38
Among the States and Union Territories, Lakshadweep ranks top with the highest
proportion of ST population (within the state) of 94.8%, followed by Mizoram
(94.4%), Nagaland (86.5%), Meghalaya (86.1%), and Arunachal Pradesh (68.8%).
Uttar Pradesh stands last with the lowest proportion of ST population of 0.56%,
followed by Tamil Nadu (1.1%), Bihar (1.28%), Kerala (1.45%), and Uttarakhand
(2.89%).
Table 3.2: States with highest and lowest proportion of Scheduled Tribes Top 5 States/Union Territories Bottom 5 States/Union Territories
Lakshadweep 94.8% Uttar Pradesh 0.56%
Mizoram 94.4% Tamil Nadu 1.1%
Nagaland 86.5% Bihar 1.28%
Meghalaya 86.1% Kerala 1.45%
Arunachal Pradesh 68.8% Uttarakhand 2.89% Source: Census of India, 2011.
The map below pictorially depicts these figures to indicate the States more than 40 per
cent tribal population, with between twenty and forty per cent, between ten and
twenty per cent, five and ten per cent, and below five per cent. The States of the
Northeast are clearly the states with a very large tribal population relative to the total
population while significant tribal populations are also residing in the Central states of
Madhya Pradesh, Chhattisgarh, Jharkhand and Odisha. The lowest proportion of
tribals in the State population is found in the Southern states of Kerala and Tamil
Nadu and the Northern states of Uttarakhand, Uttar Pradesh, New Delhi and Bihar.

39
Percentage of ST population to total state population
Regarding the distribution of ST population by States, Madhya Pradesh stands first
with 14.7%, followed by Maharashtra (10.1%), Odisha (9.2%), Rajasthan (8.9%),
Gujarat (8.6%), Jharkhand (8.3%), Chhattisgarh (7.5%), Andhra Pradesh (5.7%),
West Bengal (5.1%), Karnataka (4.1%), Assam (3.7%), Meghalaya (2.5%), and the
remaining States represent 11.6% of the tribal population. Proportion of ST
population in the rural areas is 11.3% and in urban areas is 2.8%. More than half the
Scheduled Tribe population is concentrated in the States of Madhya Pradesh,
Chhattisgarh, Maharashtra, Odisha, Jharkhand and Gujarat.
The table below shows us the distribution of the ST population in the various States of
India, with Madhya Pradesh having the largest percentage share of the ST population.
Other States with a significant proportion of the all-Indian ST population are
Maharashtra, Odisha, Rajasthan, Gujarat and Jharkhand – all having between 8 and 10
per cent share. Interestingly, Karnataka and West Bengal, neither of which have any
Scheduled Areas within its State boundaries have 4.1 per cent and 5.1 per cent of the
country’s ST population. The ‘others’ of the ST population – 11.6 per cent – are
located across the county, notably in the other states of the Northeast, in the South

40
Indian States of Kerala and Tamil Nadu which have small ST populations as well as
the Northern States of Jammu and Kashmir, Himachal Pradesh and Uttarakhand.
Table 3.3: Distribution of ST population by State S.No. State % of
national
ST
population
S.No. State % of
national
ST
population
1 Madhya Pradesh 14.7 8 Andhra Pradesh 5.7
2 Maharashtra 10.1 9 West Bengal 5.1
3 Odisha 9.2 10 Karnataka 4.1
4 Rajasthan 8.9 11 Assam 3.7
5 Gujarat 8.6 12 Meghalaya 2.5
6 Jharkhand 8.3 13 Others 11.6
7 Chhattisgarh 7.5
Figure 3.1: State-wise distribution of STs (as per the 2011 census)
While the tables above indicate the distribution of the ST population according to the
most recent census, it is valuable to examine the decadal growth (or decline) rate of
the ST populations in each of these States as well as the changing proportion of STs
within the total population of the State. While these figures do not transparently yield
any definitive trends, they do point toward issues of migration of ST population
outside the State, increasing influx of non-tribals into the State, recognition of more
tribal groups by the State and so on.
The decadal growth of Scheduled Tribes is better than the growth rate of the general
population between 1991 and 2001, and 2001 and 2011. Between 1991 and 2001,
while the decadal growth rate of the general population was recorded at 22.66, the
Scheduled Tribe growth rate was 24.45. Similarly, between 2001 and 2011, when the
general population growth rate was 17.64, the growth rate of Scheduled Tribe
population in the corresponding period was 23.66. On the whole, the ST population
within the total population of India has increased from 8.2 per cent in 2001 to 8.6 per

41
cent in 2011. In many States, the STs as a proportion of the population have remained
fairly constant between the 2001 and 2011 censuses. However, States/Union
Territories such as Andaman and Nicobar Islands, Chhattisgarh, Daman and Diu and
Nagaland have recorded small decreases in the relative proportion of STs in the
population between 2001 and 2011 (up to about three per cent decrease in Nagaland).
The most significant decrease in proportion is in Dadra and Nagar Haveli, which has
recorded a decrease of about ten per cent over the decade. Other states have recorded
small increases which may be due to population growth as well as State recognition of
greater number of tribes. Significant increases in proportion can be noted in Sikkim
(about 13 per cent) and Arunachal Pradesh (about four per cent).
Table 3.4: State-wise ST population and decadal growth rate
State/UT
ST Population
Decadal
Growth Rate
among STs
Decadal
Growth Rate
among Total
Population
% of STs in
the State to
total State
population
1991 2001 2011 1991-
2001
2001-
2011
1991-
2001
2001-
2011 2001 2011
India 67,758,380 84,326,240 104281034 24.45 23.66 22.66 17.64 8.20 8.61
Andaman &
Nicobar
Islands
26,770 29,469 28,530 10.08 -3.2 26.90 6.86 8.27 7.5
Andhra
Pradesh 4,199,481 5,024,104 5,918,073 19.64 17.8 14.59 10.98 6.59 7.0
Arunachal
Pradesh 550,351 705,158 951,821 28.13 35 27.00 26.03 64.22 68.8
Assam 2,874,441 3,308,570 3,884,371 15.10 17.4 18.92 17.07 12.41 12.4
Bihar 6,616,914 758,351 1,336,573 - 76.2 - 25.42 0.91 1.28
Chandigarh NST NST NST NST NST 40.28 17.19 NST --
Chhattisgarh -- 6,616,596 7,822,902 - 18.2 - 22.61 31.76 30.6
Dadra &
Nagar Haveli 109,380 137,225 178,564 25.46 30.1 59.22 55.88 62.24 52.0
Daman & Diu 11,724 13,997 15,363 19.39 9.8 55.73 53.76 8.85 6.31
Goa 376 566 149,275 50.53 - 15.21 8.23 0.04 10.23
Gujarat 6,161,775 7,481,160 8,917,174 21.41 19.2 22.66 19.28 14.76 14.8
Himachal
Pradesh 218,349 244,587 392,126 12.02 60.3 17.54 12.94 4.02 5.71
Jammu &
Kashmir -- 1,105,979 1,493,299 - 35 - 23.64 10.90 11.90
Jharkhand -- 7,087,068 8,645,042 - 22 - 22.42 26.30 26.2
Karnataka 1,915,691 3,463,986 4,248,987 80.82 22.7 17.51 15.60 6.55 6.95
Kerala 320,967 364,189 484,839 13.47 33.1 9.43 4.91 1.14 1.45
Lakshadweep 48,163 57,321 61,120 19.01 6.6 17.30 6.30 94.51 94.8
Madhya
Pradesh 15,399,034 12,233,474 15,316,784 - 25.2 - 20.35 20.27 21.1
Maharashtra 7,318,281 8,577,276 10,510,213 17.20 22.5 22.73 15.99 8.85 9.4
Manipur 632,173 741,141 902,740 17.24 21.8 17.94 12.05 34.20 35.1

42
Meghalaya 1,517,927 1,992,862 2,555,861 31.29 28.3 30.65 27.95 85.94 86.1
Mizoram 653,565 839,310 1,036,115 28.42 23.4 28.82 23.48 94.46 94.4
Nagaland 1,060,822 1,774,026 1,710,973 67.23 -3.6 64.53 -0.58 89.15 86.5
Odisha 7,032,214 8,145,081 9,590,756 15.83 17.7 16.25 14.05 22.13 22.8
Rajasthan 5,474,881 7,097,706 9,238,534 29.64 30.2 28.41 21.31 12.56 13.5
Sikkim 90,901 111,405 206,360 22.56 85.2 33.06 12.89 20.60 33.8
Tamil Nadu 574,194 651,321 794,697 13.43 22 11.72 15.61 1.04 1.1
Tripura 853,345 993,426 1,166,813 16.42 17.5 16.03 14.84 31.05 31.8
Uttar Pradesh 2,87,901 107,963 1,134,273 - 950.6 19.47 20.23 0.06 0.56
Uttarakhand -- 256,129 291,903 - 14 - 18.81 3.02 2.89
West Bengal 3,808,760 4,406,794 5,296,953 15.70 20.2 17.77 13.84 5.50 5.8
Source: Census of India, 2001 and 2011.
From the following figure, it is evident that the population of Scheduled Tribes is
increasing from 30 million in the year 1961 to over a 100 million in the year 2011.
This is reflected in increasing ST population in both rural and urban areas.
Figure 3.2: Decadal change in ST population (total, rural and urban)
The following table disaggregates the data by presenting the proportion of STs in the
rural and the urban population of each State. Further, the table shows the changing
proportions in the rural and urban populations between 2001 and 2011, pointing to
processes of migration of tribals to urban areas as well as increasing urbanisation of
hitherto rural tribal areas. Several States display an increase in the proportion of STs
in rural areas (which could be due to population growth among STs, migration of non-
tribals from rural to urban areas and so on). Almost across the board, however, there
appears to be an increase of STs in urban areas which is indicative of population

43
growth and increased migration of STs to urban areas (in search of employment
opportunities, possibly as a result of loss of livelihood in rural areas).
Table 3.5: State-wise percentage of Scheduled Tribes to total population (rural
and urban) and decadal growth-rate (2001-2011) State Total
(2001)
Rural Urban Total (2011) Rural Urban
Jammu &
Kashmir
10.9 13.8 2 11.9 15.4 2.5
Himachal Pradesh 4 4.3 1.3 5.7 6.1 2.6
Punjab No STs - - No STs - -
Chandigarh No STs - - No STs - -
Uttarakhand 3 3.8 0.7 2.9 3.8 0.9
Rajasthan 12.6 15.5 2.9 13.5 16.9 3.2
Uttar Pradesh 0.1 0.1 0 0.6 0.7 0.2
Bihar 0.9 1 0.5 1.3 1.4 0.6
Sikkim 20.6 21.2 15.9 33.8 36.6 25.5
Arunachal
Pradesh
64.2 69.7 43.4 68.8 74.1 51
Nagaland 89.1 93.7 67.1 86.5 92.8 70.8
Manipur 34.2 44.4 6.1 35.1 45.6 16.4
Mizoram 94.5 96.3 92.6 94.4 96.6 92.5
Tripura 31.1 36.5 4.7 31.8 41.2 5.1
Meghalaya 85.9 90.2 68.3 86.1 90.1 70.4
Assam 12.4 13.6 4.5 12.4 13.7 5
West Bengal 5.5 7.2 1.2 5.8 7.8 1.5
Jharkhand 26.3 31 9.8 26.2 31.4 9.8
Odisha 22.1 24.6 8.1 22.8 25.7 8.5
Chhattisgarh 31.8 37.6 8.4 30.6 36.9 10
Madhya Pradesh 20.3 25.8 4.9 21.1 27.2 5.2
Gujarat 14.8 21.6 3.2 14.8 23.1 3.5
Daman & Diu 11.1 4.9 6.3 12.6 4.2
Dadra & Nagar
Haveli
62.2 74.9 19.4 52 82.4 17.2
Maharashtra 8.9 13.4 2.7 9.4 14.6 3
Andhra Pradesh 6.6 8.4 1.8 7 9.3 2.4
Karnataka 6.6 8.4 2.9 7 9.2 3.5
Goa 0 0 0.1 10.2 15.9 6.8
Lakshadweep 94.5 95.6 93.1 94.8 95.2 94.7
Kerala 1.1 1.5 0.2 1.5 2.5 0.3
Tamil Nadu 1 1.6 0.4 1.1 1.8 0.4
Andaman &
Nicobar Islands
8.3 11.9 0.9 7.5 11.3 1.3
Source: Census of India, 2001 and 2011.
3.3 Number of Scheduled Tribes
Having gained a picture of the total tribal populations in each State of the country, the
table below indicates the total number of tribal communities in the different States. As
can be seen from the table, among the States, Odisha has the largest number of
notified STs (62) followed by Karnataka (50), Maharashtra (45), Madhya Pradesh
(43) and Chhattisgarh (42). Sikkim has the least with four tribes followed by

44
Nagaland, Daman and Diu and Uttarakhand with five each. Among the South Indian
States (without any Scheduled Areas), Karnataka has the largest number of Scheduled
Tribes (50) followed by Tamil Nadu (36) and Kerala (36).
Table 3.6: State-wise Number of Scheduled Tribes
S.No. State/UT No. of
Tribes
S.No. State/UT No. of
Tribes
1 Andhra Pradesh 25 16 Meghalaya 17
2 Arunanchal Pradesh 16 17 Mizoram 15
3 Assam 29 18 Nagaland 05
4 Bihar 33 19 Odisha 62
5 Chhattisgarh 42 20 Rajasthan 12
6 Goa 08 21 Sikkim 04
7 Gujarat 29 22 Tamil Nadu 36
8 Himachal Pradesh 10 23 Tripura 19
9 Jammu & Kashmir 12 24 Uttarakhand 05
10 Jharkhand 32 25 Uttar Pradesh 15
11 Karnataka 50 26 West Bengal 40
12 Kerala 36 27 Andaman & Nicobar Islands 06
13 Madhya Pradesh 43 28 Dadra and Nagar Haveli 07
14 Maharashtra 45 29 Daman and Diu 05
15 Manipur 34 30 Lakshadweep 01
Total 693 Source: http://tribal.nic.in/Content/scheduledtribes.aspx
http://censusindia.gov.in/Tables_Published/SCST/dh_st_Lakshadweep.pdf
3.4 District-level data on Scheduled Tribe population
There are 90 districts in India, where the tribal population is more than 50% of the
total population (See Annexure 2 for names of all 90 districts). Similarly, in 62
districts, the tribal population is more than 25%, but less than 50% of the total
population (See Annexure 2 for names of all 62 districts). The following tables
demonstrate the State-wise number of districts with more than 50 per cent ST
population and with between 25 and 50 per cent ST population, and state-wise total
number of districts with more than 25 per cent ST population. While this gives a
broad picture of the areas of tribal concentrations within the various States, it should
be noted that these figures do not cover the entire ST population since there may be
less than 25 per cent or less than 50 per cent ST population at the district level but
more than this proportion at the block or village-level (which may be listed as
Scheduled Areas as well).

45
Table 3.7: State-wise no. of districts with ST Population more than 50% and
between 25 and 50%
S.
No. State
Districts with
above 50%
S.
No. State
Districts
with 25-
50%
1 Arunachal Pradesh 13 1 Madhya Pradesh 13
2 Nagaland 11 2 Chhattisgarh 8
3 Mizoram 8 3 Jharkhand 6
4 Odisha 8 4 Odisha 6
5 Chhattisgarh 7 5 Assam 5
6 Meghalaya 7 6 Gujarat 4
7 Madhya Pradesh 6 7 Arunachal Pradesh 3
8 Gujarat 5 8 Jammu & Kashmir 3
9 Jharkhand 5 9 Maharashtra 3
10 Manipur 5 10 Rajasthan 3
11 Rajasthan 3 11 Sikkim 3
12 Assam 2 12 Tripura 3
13 Himachal Pradesh 2 13 Andhra Pradesh 1
14 Jammu & Kashmir 2 14 Himachal Pradesh 1
15 Andaman & Nicobar
Islands
1 Total 62
16 Dadra & Nagar Haveli 1
17 Lakshadweep 1
18 Maharashtra 1
19 Sikkim 1
20 Tripura 1
Total 90
Source: Census of India, 2011.
Table 3.8: State-wise total no. of districts with ST Population above 25% S. No. State Total districts with above 25% of ST population
1 Madhya Pradesh 19
2 Arunachal Pradesh 16
3 Chhattisgarh 15
4 Odisha 14
5 Nagaland 11
6 Jharkhand 11
7 Gujarat 9
8 Mizoram 8
9 Meghalaya 7
10 Assam 7
11 Rajasthan 6
12 Manipur 5
13 Jammu & Kashmir 5
14 Maharashtra 4
15 Sikkim 4
16 Tripura 4
17 Himachal Pradesh 3
18 Andaman & Nicobar
Islands 1
19 Dadra & Nagar Haveli 1
20 Lakshadweep 1
21 Andhra Pradesh 1
Total 152 Source: Census of India, 2011.

46
The table below goes beyond data on tribal-majority districts in the country to
demonstrate the total spread of Scheduled Tribes across India. While the preceding
tables focused on districts with substantial tribal populations (at least more than 25
per cent), the following table shows the total number of districts in which Scheduled
Tribes reside, even those districts in which they may constitute a minority (less than
one per cent). Thus, Scheduled Tribes reside in as many as 543 districts in India. It is
also pertinent to note that these figures indicate proportion of Scheduled Tribes in the
total district population which does not reveal much about the actual size of the
Scheduled Tribe population in the district. In large and populous districts, even one
per cent tribal population could indicate a large number of people.
Table 3.9: Concentration of ST population across districts Percentage of ST population Number of districts
1. Less than 1 per cent 173
2. Between 1 and 5 per cent 106
3. Between 5 and 20 per cent 124
4. Between 20 and 35 per cent 42
5. Between 35 and 50 per cent 23
6. Above 50 per cent 75
Total 543 Source: Report of Task Force on Tribals, Planning Commission, 2004-05.
3.5. Populous and ‘Vulnerable’ Tribes
Many of the large tribal groups have several sub-tribes and are called by various
(though usually similar) nomenclatures in different parts of the country since they are
often several over a large area often crossing the administrative boundaries of States.
This situation has caused considerable confusion and anomalies in classification of
tribes due to misspelling of names or non-recognition of synonyms used to refer to
various tribes and sub-tribes. A significant number of the modifications in the list of
Scheduled Tribes seek to address these anomalies, although there are also some cases
of addition of a new tribe or sub-tribe to the list. The table below indicates the number
of modifications made in the list of Scheduled Tribes since the 2001 Census. The
figures are organised according to the States with reference to which the change was
made (since the ST list is made State-wise and is not a pan-Indian catalogue). As can
be seen from the table below, the largest number of modifications is in relation to
addition of a synonym or sub-group within an existing entry (of a tribe).
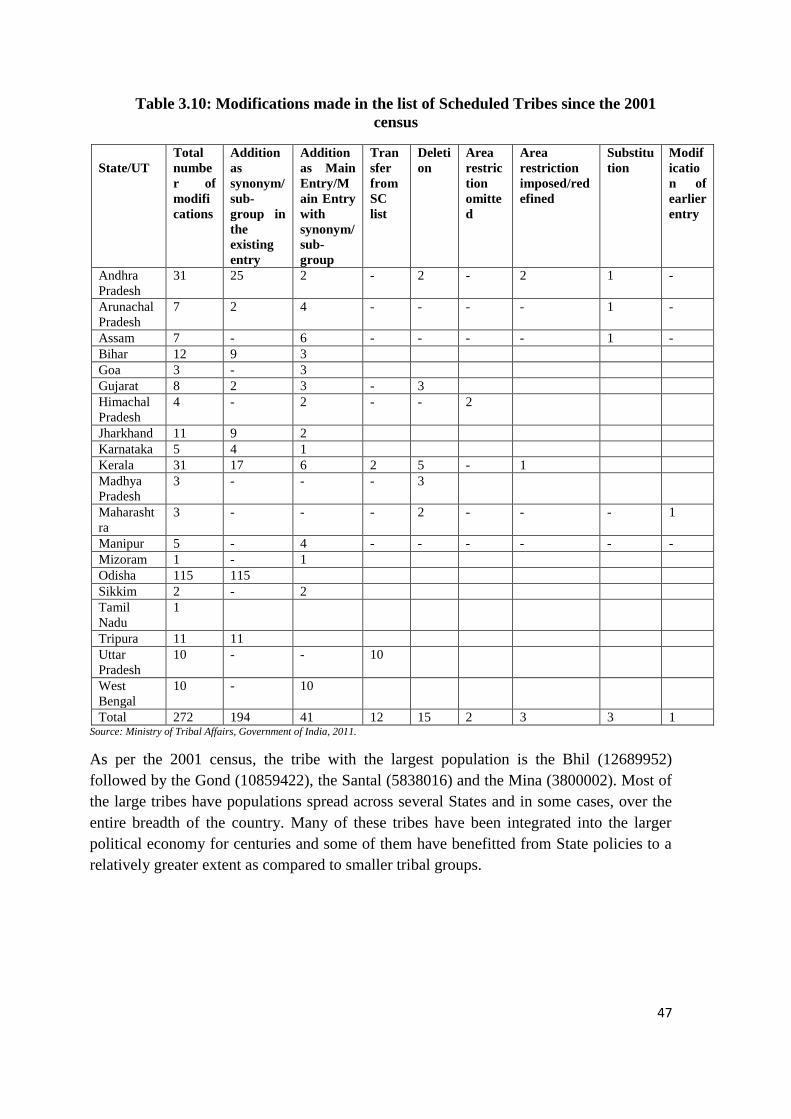
47
Table 3.10: Modifications made in the list of Scheduled Tribes since the 2001
census
State/UT
Total
numbe
r of
modifi
cations
Addition
as
synonym/
sub-
group in
the
existing
entry
Addition
as Main
Entry/M
ain Entry
with
synonym/
sub-
group
Tran
sfer
from
SC
list
Deleti
on
Area
restric
tion
omitte
d
Area
restriction
imposed/red
efined
Substitu
tion
Modif
icatio
n of
earlier
entry
Andhra
Pradesh
31 25 2 - 2 - 2 1 -
Arunachal
Pradesh
7 2 4 - - - - 1 -
Assam 7 - 6 - - - - 1 -
Bihar 12 9 3
Goa 3 - 3
Gujarat 8 2 3 - 3
Himachal
Pradesh
4 - 2 - - 2
Jharkhand 11 9 2
Karnataka 5 4 1
Kerala 31 17 6 2 5 - 1
Madhya
Pradesh
3 - - - 3
Maharasht
ra
3 - - - 2 - - - 1
Manipur 5 - 4 - - - - - -
Mizoram 1 - 1
Odisha 115 115
Sikkim 2 - 2
Tamil
Nadu
1
Tripura 11 11
Uttar
Pradesh
10 - - 10
West
Bengal
10 - 10
Total 272 194 41 12 15 2 3 3 1 Source: Ministry of Tribal Affairs, Government of India, 2011.
As per the 2001 census, the tribe with the largest population is the Bhil (12689952)
followed by the Gond (10859422), the Santal (5838016) and the Mina (3800002). Most of
the large tribes have populations spread across several States and in some cases, over the
entire breadth of the country. Many of these tribes have been integrated into the larger
political economy for centuries and some of them have benefitted from State policies to a
relatively greater extent as compared to smaller tribal groups.

48
Table 3.11: Fifteen most populous tribes in India
Name of Tribe
Population
States in which members are residing
Bhil 12689952 Tripura, Andhra Pradesh, Rajasthan, Chhattisgarh, Andhra
Pradesh,Gujarat, Maharashtra, Karnataka
Gond 10859422 Bihar, West Bengal, Jharkhand , Odisha, Chhattisgarh, Madhya
Pradesh, Gujarat, Andhra Pradesh, Karnataka
Santhal 5838016 Bihar, Tripura , West Bengal, Odisha, Jharkhand
Mina 3800002 Rajasthan, Madhya Pradesh
Naikda 3344954 Karnataka, Rajasthan, Gujarat, Daman & Diu , Dadra & Nagar
Haveli, Maharashtra , Goa
Oraon 3142145 Bihar, West Bengal, Jharkhand , Odisha , Chhattisgarh, Madhya
Pradesh, Maharashtra
Sugalis 2077947 Andhra Pradesh
Munda 1918218 Bihar, West Bengal, Jharkhand, Chhattisgarh, Madhya Pradesh,
Tripura, Odisha
Nagas 1820965 Nagaland
Khond 1397384 Bihar, West Bengal, Jharkhand, Odisha
Boro 1352771 Assam
Koli Mahadev 1227562 Maharashtra
Khasi 1138356 Mizoram, Meghalaya, Assam
Kol 991400 Odisha, Chhattisgarh, Madhya Pradesh, Maharashtra
Varli 974916 Gujarat, Daman & Diu, Dadra & Nagar Haveli, Maharashtra,
Karnataka, Goa Source: Census of India, 2001.
The table below provides a register of the Particularly Vulnerable Tribal Groups
(PVTGs) with population of less than a 1000 persons. One of the criteria for their
vulnerability is their small population– the population size of the smallest group
reaches a low of only 17 persons in the case of the Birjia in the state of Bihar.
Table 3.12: PVTGs with a population of less than 1000 persons
PVTG Population
Birjia (Bihar) 17
Sentinelese 39
Great Andamanese 43
Onge 96
Birhor (Madhya Pradesh) 143
Asur (Bihar) 181
Mankidias (Odisha) 205
Jarawa 240
Cholanaicken (Kerala) 326
Shompen 398
Birhor (Bihar) 406
Savar (Bihar) 420
Raji (Uttarakhand) 517
Sauria Paharia (Bihar) 585
Birhor (Odisha) 702
Korwa (Bihar) 703
Todas (Tamil Nadu) 875
Kota (Tamil Nadu) 925
Raji (Uttar Pradesh) 998 Source: Census of India, 2001.

49
3.6 Forests, Dams and Mines
According to the Forest Survey of India,2 2011, the total forest cover in the country is
692, 027 sq. km. which comprises 21.05 per cent of the total geographical area of the
country. The total forest cover in the 188 tribal districts in 26 states and Union
Territories in the country identified as falling under the Integrated Tribal
Development Programme (ITDP) is about 411, 881 sq. km, which constitutes 37.25
per cent of the geographical area in these districts. Therefore, almost 60 per cent of
the forest cover of the country is found in tribal areas. The States with the largest
forest cover in terms of absolute area are also States with substantial tribal
populations – Madhya Pradesh (77, 700 sq. km), Arunachal Pradesh (67, 410 sq. km.),
Chhattisgarh (55, 674 sq. km), Maharashtra (50, 646 sq. km) and Odisha (48, 903 sq.
km.). In terms of proportion of forest cover in relation to the geographical area of the
State, the Island regions and the Northeastern states are highest – led by Mizoram
(90.6 per cent), followed by Lakshadweep (84.56 per cent), Andaman and Nicobar
Islands (81.51 per cent, Arunachal Pradesh (80.50 per cent), Nagaland with (80.33 per
cent), Meghalaya (77.02 per cent) and Tripura (76.07 per cent).
Of the 58 districts, wherein the forest cover is greater than 67 per cent, 51 districts are
tribal districts.3 Therefore, a large section of the tribal population have been
dependent on the forest for their livelihood. However, much of this forest was
classified as Reserved Forests and Protected Forests as well as Wildlife Santuaries
and National Parks, resulting in the marginalisation of tribal communities who were
treated as encroachers on this land prior to the passing of the Forest Rights Act, 2006.
With regard to mineral resources, three States with substantial tribal populations –
Odisha, Chhattisgarh and Jharkhand - have considerable mineral reserves. These three
States alone account for 70 per cent of India’s coal reserves, 80 per cent of its high-
grade iron ore, 60 per cent of its bauxite and almost 100 per cent of its chromite
reserves.4 Indeed, according to the Centre for Science and Environment, about half of
the top mineral-producing districts are tribal districts – and these are also districts
with forest cover of 28 per cent which is larger than the national average of 20.9 per
cent. Unfortunately, much of this forest land has been diverted for mining purposes
resulting in environmental degradation, loss of livelihood, and displacement of tribal
communities. Many of these mineral-bearing areas are also affected by the on-going
conflict between the Maoists and the State .
Dams have been another source of displacement for tribes since Independence, with
India being one of the largest dam-building nations in the world. It is estimated that
dams are the biggest causes of displacement in the country, although actual figures
regarding the number of people displaced range from 20 to 50 million. However, it is
generally agreed that about 40 per cent of those displaced belong to the Scheduled
2 India State of Forest Report, Forest Survey of India, 2011. 3 Draft National Tribal Policy, Ministry of Tribal Affairs, Government of India, 2006. 4 Centre for Science and Environment, Rich Lands, Poor People: Is ‘Sustainable Mining’ Possible? 2008.

50
Tribes. Given that the Scheduled Tribes constitute about eight per cent of the
country’s population, they are clearly disproportionately represented in the number of
displaced persons.
3.7 Conflicts affecting tribal populations
Numerous armed conflicts affect large parts of tribal areas in contemporary India
spanning the central region to the Northeast. In central India, the most well-known
conflict at present is the armed conflict between the Communist Party of India
(Maoist) and the Indian state, which is ongoing in parts of the states of Maharashtra,
Andhra Pradesh, Madhya Pradesh, Chhattisgarh, Jharkhand, Bihar, Odisha and West
Bengal, among others. A large portion of these areas are tribal-dominated and it is
tribal civilians, who have been worst affected by the conflict. The conflict has only
escalated in recent years, particularly in central India, following the initiation by the
state of a counter-insurgency operation known as the Salwa Judum in Chhattisgarh
which has been responsible for rapes, murders, arson, looting and intimidation in the
name of defeating the Maoists.
Violent conflicts plague large parts of the Northeast and this has been so since 1947.
Across the region, there are conflicts between the State and tribal groups, between
different tribes, and between tribes and non-tribal groups – although the State is
involved in all of these conflicts in some way or another. As a result, there is an
alarming concentration of troops, border security forces and police personnel in this
region. Further, the Armed Forces (Special Powers) Act, 1958 is in operation in the
states of Manipur, Assam and Nagaland as well as parts of Tripura and Arunachal
Pradesh. This Act gives considerable powers to the armed forces to arrest and search
without warrant as well as shoot to kill on mere suspicion, once an area has been
declared as ‘disturbed’. The Act also provides that no legal proceedings can be
initiated against military personnel without permission from the Central Government.
Many cases of extra-judicial killings, rapes and harassment by armed forces have
been reported in these States amidst a culture of impunity. Apart from protracted
armed struggles with the State as well as inter-ethnic conflicts, there are also more
localised peaceful instances of struggles of tribals against the State and corporations
over land and natural resources, occuring across the country.
To conclude, the above sections have provided a brief profile of the Scheduled Tribes
of the country in an attempt to provide an outline of the communities at the centre of
this report. Such a broad sketch certainly fails to adequately capture the full richness,
diversity and complexity of tribal life and the struggles of the tribal people. However,
it serves as a short introduction to the chapters that follow and which constitute a
detailed exposition of each of these issues – from the scheduling of tribes to the plight
of the Particularly Vulnerable Tribal Groups (PVTGs), the changing livelihoods of the
tribals to their rights over forest resources and their displacement for the construction
of mines and dams.

51
4. Tribes: Legal and Administrative Framework
Section I: Definition and concept of tribe
4.1 Definitions of ‘tribe’
The Indian Constitution, and laws made under it, recognise the special status of tribal
communities. While sociologists and social anthropologists have debated the defining
characteristics of a tribe, the Constitution recognises that tribal communities need and
deserve special protections and that the politico-administrative establishment must act
to ensure that such protections are extended to tribal communities. Accordingly, the
device of scheduling has been adopted to enable identification of tribal communities
and tribal areas that are to come within this dispensation.
It is necessary to examine the early origins of the concept of ‘tribe’ and its
transformation in various historical and political contexts, specifically during the
colonial period in the Indian sub-continent. In the Roman context, the term ‘tribe’ was
used to refer to a state of barbarism, but also to indicate a tributary relationship
between a group and the imperial State, with whom gifts and tributes were exchanged.
Tribe, therefore, referred to a particular relationship between centre and periphery,
which was equally applicable to the tribal relationship with the Mughal Empire in
India. One of the other early meanings of tribe was also that of a group claiming
common ancestry. Later, the idea of the tribe as people living in ‘primitive’ conditions
became dominant. The reference to a particular relationship with the State was pushed
to the background by an emphasis on the tribe as an autochthonous, homogeneous
whole – an independent, self-contained unit.
In India, the local equivalent of the term ‘tribe’ is often assumed to be ‘jana’ or
‘communities of people’ based on the usage of the term in ancient Buddhist and
puranic texts. In this conception, the term jana was used in opposition to the term jati
to indicate that these communities were outside the jati or hierarchical caste system of
social organisation. This view, however, was not universally accepted, since other
scholars point out that the categories of jana and jati do not neatly overlap with that of
tribe and caste respectively in the present context.
It was largely following the various tribal rebellions during the colonial period that
tribes came to be seen as the region’s ‘original inhabitants’ who existed outside of the
caste system and had been marginalised by the more advanced caste-Hindu society.
The nineteenth-century ethnographic view of tribes argued that the term referred to
both a particular type of society based on kinship ties and a stage of evolution.5 In the
former view, standard definitions describe the tribe as a social group with a definite
area, dialect, cultural homogeneity and unifying social organisation. An amalgam of
the various traits ascribed to tribal groups include: relative egalitarianism within the
5 Virginius Xaxa, State, Society and Tribes: Issues in Post-colonial India, New Delhi: Pearson, 2008.

52
group, the absence of complex political structures, strong and functional kinship
bonds, cooperation, territorial integrity, cultural and linguistic distinctiveness, and
lower levels of technology. In the case of the latter view, tribes are seen as ‘primitive’
societies in the sense of lacking all the traits of modern, Western society in that they
are non-literate, ‘uncivilised’, non-industrial, rural, and so on.
The two views are connected in that tribes were seen as having primitive social
organisation, implying that tribal people were at a lower stage in the evolutionary
social hierarchy in terms of their socio-cultural characteristics, economy and political
structures, often being described as simple as well as insulated from changes in the
larger regional polity. Tribes in the Indian context have also been defined as groups
remaining outside of the structures of State and civilisation.
Each definition of tribes stresses on a particular aspect of tribal life – their relationship
with the state, civilization and processes of development as well as specific features of
their culture, livelihood, and economy. However, the dominant conception of tribe
that developed during this period revolved around notions of ‘backwardness’,
indigeneity, and separation from the larger Hindu civilization. Tribes were identified
largely in terms of what they were not: they did not practice Vedic Hinduism, they
were not Muslim, their societies were marked by the relative absence of economic and
ritual stratification, and they were not integrated into the “modern” economy or
civilization.6
The Census of India has also played a critical role in shaping the modern
understanding of tribe through its efforts at enumeration and classification. The proper
delineation of tribes began with the colonial census in the late nineteenth century to
provide detailed information about the population of the sub-continent. Through this
exercise, certain communities were labelled as tribes although the criteria transformed
over time. In the 1881 census, the term used was ‘forest tribes’, a sub-category within
the broader group of ‘agricultural and pastoral castes’. In the 1901 census, tribes were
identified as those who ‘practiced animism’ thus placing religious practices at the
centre. Therefore, those practising Hinduism were viewed as castes, while those
practising animism were labelled tribes, although this criterion would change in the
following decades such that, at present, Scheduled Tribes can practise any religion,
including Hinduism and Christianity. In later censuses, additional references to
territory were included, producing the label of ‘hill and forest tribes’ in 1921 and
‘primitive tribes’ a decade later. The new descriptions laid emphasis on the isolation
of tribes within hill and forest areas as well as their ‘primitive’ way of life. One of the
earliest attempts to create a list of tribes in the sub-continent was during the 1931
census which identified ‘primitive tribes’. This was followed by a list of “backward
tribes” for the provinces made under the Government of India Act, 1935. In the 1941
6 David Stuligross, Autonomous Councils in Northeast India: Theory and Practice, Alternatives: Global, Local, Political, Vol.
24, No. 4 (Oct.-Dec. 1999), pp. 497-525.

53
census, tribes were identified not in terms of their religion but according to their
‘origin’, that is, tribes were those who have a ‘tribal origin’.
Subsequent ethnographers have contested these conceptualisations, arguing that tribes
have constantly been in interaction with other social groups, and that, terms such as
‘primitive’ and ‘backward’ are based on the problematic assumption of social
evolutionism. Other scholars have argued that the conception of tribe as isolated was
based on their emergent marginalisation through unjust forest policies, forced
sedentarization and pacification during British colonial rule. Large segments of the
tribal population were integrated into the market economy during this period through
the appropriation of their lands as well as their labour in commercial forestry, mines
and plantations.
In the post-colonial period, therefore, certain anthropologists have tended to view the
‘tribe’ as a colonial construction, rendering fixed and rigid those identities which were
earlier relatively fluid and contextual. Anthropological accounts of tribal communities
have largely provided working definitions of tribe which have often been specific to
their site of study given that tribes differ considerably in terms of their population
size, mode of livelihood and level of integration within the capitalist economy. There
is huge differentiation, for example, in the range of occupations practiced among
tribes – they may be: hunters and gatherers, shifting cultivators, settled
agriculturalists, pastoralists, artisans, farm labourers, and plantation and industrial
workers.
The 1950 Constitutional Amendment order with the full list of Scheduled Tribes
recognised at the time was largely based on the list of “backward tribes” prepared by
the colonial administration in 1936. At the time of the first census of independent
India in 1951, there were 212 recognised Scheduled Tribes in the country. The term
Scheduled Tribe itself is a politico-administrative category that does not capture the
enormous social complexity of the various tribes encompassed within its fold. The
Constitution of India categorised certain sections of the population as Scheduled
Tribes to make available special welfare provisions to them – even though this
category was never properly defined. In a circular fashion, tribes are defined as those
groups enumerated as tribes under the Indian Constitution. Thus, Article 366(25) of
the Constitution defines Scheduled Tribes as follows:
“Scheduled Tribes means such tribes or tribal communities or parts of or groups within such
tribes or tribal communities as are deemed under article 342 to be Scheduled Tribes for the
purposes of this Constitution.”
The list of tribes drawn up by the colonial and post-colonial government was based on
political and administrative considerations, given that State recognition could be
translated into important protective and developmental benefits. However, the
identification of such groups has been based on recommendations made by the
officials of the 1931 Census, the First Backward Classes Commission 1955, and the

54
Report of the Advisory Committee on the Revision of the Lists of Scheduled Castes
and Tribes, 1965. The currently followed criteria for identification are: primitive
traits, distinctive culture, geographical isolation, shyness of contact with the
community at large, and general backwardness. As can be seen from several of these
identifying features, the idea of the tribe as the ‘primitive’ has clearly continued into
the post-colonial period. The first Backward Classes Commission (Kaka Kalelkar
Commission) appointed by the President of India under Article 340 argued that the
tribes:
“lead a separate exclusive existence and are not fully assimilated in the main body of the
people. Scheduled Tribes may belong to any religion. They are listed as Scheduled Tribes,
because of the kind of life led by them.”7
In 1951, the Tribal Welfare Committee comprising of anthropologists, social workers
and administrators met under the Indian Conference of Social Work in Calcutta and
recommended these criteria for differentiation of tribes: tribes are those who are still
confined to their original forest habitats and follow the old pattern of life; semi-tribal
communities are those who have settled down in rural areas and practice agriculture
and similar occupations; acculturated tribal communities are those who have migrated
to urban and semi-urban areas and are working in industries and have modern cultural
traits, and other tribal communities who have been totally assimilated into the Indian
population. However, there are many forest-dwellers who are not tribals; settled
agriculture is practiced by many tribes (who are not semi-tribal in other respects) and
migration to urban areas does not necessarily lead to the shedding of all tribal cultural
traits.
In 1959, the Government of India appointed a Commission headed by Shri. U.N.
Dhebar to look into the welfare of the Scheduled Tribes and even this commission
failed to arrive at a satisfactory definition. The Commission concluded that Scheduled
Tribes can be identified by the fact that they live apart in the hills, and even where
they live on the plains, they lead a separate, excluded existence and are not fully
assimilated with the rest of society. As per its recommendations, it reiterates the
position that the technical definition of a tribe is any group listed as a Scheduled Tribe
under Article 342.
The granting of ST status to certain social groups is an on-going process, indicating
that there are groups which might identify themselves as tribes but which remain
outside of the official ST category. The First Backward Classes Commission set up
by the President of India in 1953, recommended the declaration of additional
communities as Scheduled. Thus, through another order in 1956, the President
notified a modification of the list of Scheduled Tribes. In the 1961 census, the number
of Scheduled Tribe communities increased to 427, which was twice the number from
the previous census. This increased to 432 by the time of the 1971 census.
7 Cited in the Report of the Advisory Committee on the Revision of the Lists of Scheduled Castes and Scheduled Tribes,
Department of Social Security, Government of India, pp. 6-7.

55
As the issue of anomalies within the ST list constantly arose, the government set up
the Advisory Committee on the Revision of the Lists of Scheduled Castes and
Scheduled Tribes (Lokur Committee Report) which was to advice on the proposals
received by the government on revision of these lists in a “rational and scientific
manner”. The committee was specifically asked for its recommendations on whether
communities listed as Scheduled Tribes in one area of a particular State or Union
Territory (UT) should be recognised in other parts of the same State or UT as well as
in other States.
A glance at the lists of tribes recommended for both inclusion and exclusion by the
Lokur Committee throws further light on their considerations while determining the
legal status of groups claiming tribal identity. Some of the reasons cited for inclusion
of new tribes within the list include ‘very isolated’, ‘still living in caves’, ‘living in
forest areas’, or more vaguely, ‘are primitive jungle tribes’, ‘having tribal
characteristics’, ‘very backward tribe’, and ‘distinctive dress and customs’. Clearly, a
mixture of geographical and locational features as well as primitiveness and
backwardness account for the suggested Constitutional recognition of a range of
tribes. On the other hand, the explanations for suggested exclusion from the list were
‘not a tribe’, ‘do not possess tribal characteristics’, ‘population insignificant’ and
‘assimilated with the general population’.
On the question of enumeration, the Lokur Committee noted that in light of several
Supreme Court rulings on the matter, it would be necessary for the government to list
not simply the name of each tribe under the Schedule but to create a compendium of
all local synonyms, phonetic variations and sub-tribes within each tribe in order to
ensure that confusions over inclusion are avoided. The committee held that, in light of
this onerous task, it should henceforth be assumed that any caste or tribe specified in
the list would automatically include all synonyms, variations and sub-groups.
The Scheduled Tribes and Scheduled Areas Commission (Bhuria Commission)
Report (2002-2004) has pointed out that winds of change have been sweeping through
tribal society and this has resulted in the growth of individualism, particularly among
the youth. However, despite transformations in the internal communitarian dynamics
of tribal society which threaten to alter its very ‘tribal-ness’ the Commission noted
that tribal identity is likely to reassert itself in the form of traditional norms and
mores.
The Bhuria Commission Report further stated that:
“as an individual, individualism may be practised by a tribal when he is at large and may be
abroad, but even in facing the larger world his psyche looks backwards to lean on the support
of his own tribal community, thereby revealing the profundity of bonds with his tribe”.8
8 Report of the Scheduled Areas and Scheduled Tribes Commission, Government of India, 2002-2004, pp.7.

56
Beyond definitions of ‘tribes’, the Indian context has produced a situation in which
classification of communities as Scheduled Tribes is not uniform throughout the
country but varies based on often arbitrary administrative boundaries. Several
committees have taken note of this anomalous situation, introduced through the
Government of India Act, 1935, whereby members of the same tribe from an
ethnological or social point of view are recognised as Scheduled Tribes in one State or
one part of a State and not in others. That is, the category of Scheduled Tribes,
although distinct, was connected to an understanding of ‘tribal areas’ in that, until
1976, area restrictions were in operation with regard to recognition as a Scheduled
Tribe. This meant that it was possible for X tribe to be recognised in district Y of a
particular State but not in neighbouring district Z of the same State. Thus, ST status
was linked to place, although the place itself need not be a Scheduled Area.
According to the Lokur Committee, these territorial restrictions acted as a barrier to
spatial and social mobility, since moving out of the area in which their tribe is
recognised would imply the loss of all benefits and privileges. Such restrictions were
therefore, seen to be contrary to the goal of tribal integration which advocates the end
to tribal ‘isolation’ and the inter-mingling of populations. Despite recognition of the
often bizarre consequences of area restrictions, the Lokur Committee refrained from
recommending changes in the same since inter-state movement of tribes was deemed
to be negligible at the time. Their report also dismissed the idea of an all-India
Scheduled Tribes list, since the Constitution provides for lists to be made only at the
State or UT level. The Lokur Committee recommended that the various tribes in the
list should be administratively differentiated, so as to ensure that priority in
development planning should be given to the more deprived, among the groups.
In 1976, the Removal of Area Restrictions (Amendment) Act was passed, which
removed area restrictions on the recognition of Scheduled Tribes, making lists
applicable to entire States rather than blocks and districts within States as was the case
earlier. This led to a substantial increase in the tribal population as recorded in the
census. Now, a tribe is included within the Scheduled Tribe list on a state-wide basis
– although it is possible that the same tribe is not Scheduled Tribe in other states.
However, it has been noted that the sharp increase in recorded tribal population
between the 1971 and 1981 censuses was not only due to the removal of area
restrictions but due to misreporting to census officials by groups with nomenclatures
sounding similar to that of certain Scheduled Tribes. Between 1971 and 1981, the
population of Scheduled Tribes, as recorded in the Census, rose by 95 per cent in
Maharashtra and 690 per cent in Karnataka. This occurred despite the fact that
reporting oneself as a Scheduled Tribe in the census does not in any way support
claims for Scheduled Tribe status under the Constitution.
Despite efforts made by various governments, there continue to be several anomalies
in the scheduling of tribes. The National Commission for Scheduled Tribes (NCST)
has noted that cases involving inclusion of communities which are scheduled in one

57
state and non-scheduled in a neighbouring state need to be given priority in order that
members are not denied benefits any further. The Banjaras, for example, are a
recognised Scheduled Tribe settling in various parts of the country, including now in
Delhi. However, the strong association between the idea of a tribe and that of rurality
has led to the refusal of the Government of Delhi to list them as a Scheduled Tribe in
the capital city – rather, they are included within the list of Scheduled Castes. Another
curious distinction in the state of Assam is that between plains tribals and hill tribals,
so the Garos, Karbis, Hajongs, Dimasas, Mon-Tai speaking peoples, Singphos,
Hmars, Nagas, hill tribals, lose their scheduled status once they come down to the
plains and the Bodos, Lalungs, Mech-Kacharis, all plains tribals, lose their scheduled
status if they go to the hills.
There are also other anomalies in the process of scheduling such as instances of
increasing the communities within the Scheduled Tribes list in the state without
simultaneously reserving electoral constituencies for STs. There is also the concern
that some tribes classified under the Particularly Vulnerable Tribal Groups (PVTGs)
have not yet been notified as Scheduled Tribes, a situation that the NCST has taken
up. In recent years, commentators have questioned the established criteria for
inclusion as both outdated (since ‘isolated existence’ does not hold true for most
communities today, even those living in remote forest areas) and derogatory to tribal
groups (the idea of ‘primitivism’ is insulting to tribal culture and identity). Issues
pertaining to scheduling criteria and anomalies have been examined in a report
submitted by the Task Force set up on February 3, 2014 under the Chairmanship of
Dr. Hrusikesh Panda, Secretary, Ministry of Tribal Affairs – and so no more need be
said here.
4.2 De-notified, Nomadic and Semi-Nomadic Tribes
Scheduled Tribes in India are enormously diverse in terms of their populations,
occupations, and the kinds of discriminations they face. There are also some
communities which are known as ‘tribes’ but who are not necessarily included within
the Scheduled Tribe list. Two other important governmental classifications of tribes
which refer to specific histories and vulnerabilities of these communities are:
De-notified, Nomadic and Semi-Nomadic Tribes and Particularly Vulnerable Tribal
Groups (PVTGs).
The recent history of De-notified Tribes (DNTs) can be traced back to the Criminal
Tribes Acts (CTA) of 1871 and later 1911 under which between 150 and 200
communities were deemed to be ‘hereditary criminals’ and subject to surveillance,
confinement and gross discrimination. The Acts represented the formalisation of a
view held by the British for several decades before and are connected to previously
existing prejudices against wandering and/or rebellious communities. The apparent
purpose of the CTA was to contain and curb entire communities who were viewed as

58
‘hereditarily criminal’, in light of the then prevailing notion that crime was a genetic
trait passed down from one generation to the next. All that was needed for declaration
of a community as a CT was “reason to believe” (rather than any factual evidence)
that the community was ‘addicted’ to crime.9
A large proportion of the communities who came to be labelled as ‘criminal’ were
nomadic groups whose diverse occupations led them to be itinerant communities,
travelling from village to village practising their trade. These ‘wandering tribes’ were
viewed as being more criminal than others since their restlessness and mobility itself
was viewed as a sign of their criminality in a society wherein sedentary living was
associated with respectability. Some other such groups were said to have been
employed as guards to landlords as well as henchmen to the king, often performing
the dirty work of their employers and hence, earning some notoriety.
The CTA gave enormous powers to the local police force which could confine these
communities to specific areas in order to control their criminal activities. In later
years, another draconian provision was added to the Act which allowed for the
creation of ‘settlements’ for criminal tribes, thereby forcibly sedentarising them and
simultaneously forcing them into both agricultural and industrial work to ‘reform’ and
‘cure’ their criminal propensities. Another provision of the Act allowed for the
creation of separate reformatory settlements for the children of these tribes.
The CTA was removed from the statute books in 1952 on the recommendation of the
All India Criminal Tribes Inquiry Committee (1949) and henceforth, ‘Criminal
Tribes’ came to be known as ‘De-notified Tribes’ instead. Even though the law has
been repealed, the identification of these communities as ethnic groups having
criminal antecedents continues to this day, leading to everyday discrimination in
terms of access to education and jobs as well as brutal violence by neighbouring
communities and police personnel.
Traditionally, de-notified, nomadic and semi-nomadic communities practice a range
of occupations and are remarkably internally diverse. Scholars have classified them
according to four broad categories: 1) pastoralists and hunter-gatherers, mainly
shepherds, cowherds and hunters of small game, 2) goods and service nomads, such
as blacksmiths, stone workers, weapon makers, salt traders, basket makers and so on,
3) entertainers including dancers, acrobats, snake charmers, monkey trainers and
wrestlers, and 4) religious performers, ascetics, devotional singers, minstrels and
astrologers.10
However, a vast number of historical changes have jeopardised their livelihoods,
beginning from the colonial period. Hunter-gatherers and pastoralists have been
affected by the growing restrictions on access to grazing grounds and forests, the
9Meena Radhakrishna, Dishonoured by History: ‘Criminal Tribes’ and British Colonial Policy, New Delhi: Orient Longman,
2008. 10 Milind Bokil, De-notified and Nomadic Tribes: A Perspective, Economic and Political Weekly, January 12, 2002, pp. 151.

59
degradation of natural resources as well as increasing privatization of common
property resources. Travelling goods and service communities have suffered as a
result of mechanised production systems, the displacement of traditional building
materials and the development of new infrastructure such as roads and railways.
Further, entertainer communities have been destroyed as a result of wildlife
conservation laws.
One major issue that has been raised with regard to de-notified and nomadic
communities is the lack of proper enumeration and classification which made the
planning and implementation of welfare schemes difficult. Some of these
communities have been listed as Scheduled Tribes, others as Scheduled Castes, and
some as Other Backward Classes (OBCs). Further, as is the case with the ST list
itself, there are disparities in listings of the same group across States and even within
the same State. For example, the Kaikadis are listed as Scheduled Castes in the
Vidharba region of Maharashtra, as Vimukta Jatis and Nomadic Tribes (VJNTs) in
the rest of this State and as Scheduled Tribes in the neighbouring State of Andhra
Pradesh. Similarly, the Banjaras are a Scheduled Tribe in Andhra Pradesh, Odisha and
Bihar, a Scheduled Caste in States like Karnataka, Delhi and Rajasthan, OBC in Uttar
Pradesh and a De-notified Tribe in Maharashtra and Tamil Nadu.
While these anomalies have not been addressed, the situation of DNTs is exacerbated
by the fact that many groups are not included under any list and are denied access to
affirmative action policies and development programmes despite the historical (and
continuing) injustice faced by these peoples. Moreover, in the absence of reliable data
about the population, geographical spread and development indices among these
groups, it is hard for policy-makers to plan an effective intervention strategy for
DNTs. According to some estimates, there are about 1500 nomadic and semi-nomadic
communities and 198 De-notified Tribes in the country.
4.3 Particularly Vulnerable Tribal Groups (PVTGs)
Certain tribes have been characterised as Particularly Vulnerable Tribal Groups
(PVTGs) (earlier known as Primitive Tribal Groups) on the basis of their greater
’vulnerability’ even among the tribal groups (although the precise contours of their
vulnerability has not been clearly defined). PVTGs, currently including 75 tribal
groups, have been identified as such on the basis of the following criteria: 1) forest-
dependent livelihoods, 2) pre-agricultural level of existence, 3) stagnant or declining
population, 4) low literacy rates and 5) a subsistence-based economy. As per the 2001
census, these 75 PVTGs had a total population of 27,68,322. The majority of the
PVTG population lives in the six States of Maharashtra, Madhya Pradesh,
Chhattisgarh, Jharkhand, Odisha, Andhra Pradesh and Tamil Nadu. Odisha has 13
PVTGs, the largest number for any State. Even within the groups labelled PVTGs by
the State, there is considerable differentiation, most obviously with respect to size –

60
there are 19 groups with a population of less than 1000 persons and 8 groups with a
population of more than one lakh.
The vulnerability of the PVTGs primarily stems from the loss of their traditional
livelihoods, habitats and customary resource rights through the gradual exploitative
intrusion of the market and State into their areas in the form of industrial projects,
conservation efforts, tourism, and the forest bureaucracy and so on. These conditions
have led to the loss of their land and resources resulting in chronic malnutrition,
starvation and ill health among these groups. The groups most under threat have been
identified as the Shompens, Sentinelese and Jarawas of the Andaman Islands; the
Bondos of Odisha; Cholanaickans of Kerala; Abujh Marias of Chhattisgarh and
Birhors of Jharkhand. Some PVTGs such as the Paudi Bhuiyan in Odisha are still not
included within the list of Scheduled Tribes.
One of the most critical issues to be addressed with regard to PVTGs is their
perceived ‘primitivism’ and ‘backwardness’ evident in official discourse. Although,
the term ‘Primitive Tribal Groups’ was replaced by ‘Particularly Vulnerable Tribal
Groups’ in 2006, the highly derogatory term ‘primitive’ continues to be used by the
government, media and NGOs. For instance, a look at the website of the Andaman
and Nicobar administration on vulnerable tribal groups of the islands reveals the
continued use of colonial depictions of tribes as ‘primitive’ and ‘hostile’. On the
Shompens, it is noted that “Shompens have been visiting the settlers and they are
gradually shaking off their shyness and indifferent attitude towards the civilized
people”.11 It is essential for government bodies to shed assumptions of tribal
backwardness and savagery. Moreover, even though it is imagined that PVTGs have
lacked contact with other social groups and have to be protected from outside
intrusion, it must be noted that these groups have had long histories of contact and
change and it is precisely these exploitative encounters, which have contributed to
their contemporary condition. Stereotyping of PVTGs as ‘backward’ presumes a
linear trajectory of development and progress and devalues the culture and traditions
of these communities with devastating effects.
It must be noted that all tribes in the list of PVTGs have not been granted Scheduled
Tribe (ST) status. For example, the Abujh Maria has only recently been granted ST
status in the State of Chhattisgarh even though they have been in the PVTG list
earlier. The rationale behind inclusion and exclusion must be made clear and all
discrepancies must be immediately addressed. Further, of the States with PVTGs,
Kerala, Karnataka, Tamil Nadu, Uttar Pradesh and West Bengal do not have
Scheduled Areas, thereby increasing the vulnerability of these tribes, who lack the
protections and rights offered by the Fifth Schedule and the Provisions of Panchayat
(Extension to Scheduled Areas) Act, 1996.
11 Andaman and Nicobar Administration, A Brief Note on Vulnerable Tribal Groups, Available at
http://www.and.nic.in/andaman/tribes.php
61
Their socio-economic vulnerability and low population levels has led them to be
treated as ‘endangered’ and ‘on the verge of extinction’ - terminology which denies
them their full humanity. Rather than granting them their autonomy and rights to
address historical injustices, this perception has led to disastrous State Government
interventions in the name of their ‘preservation’. One such scheme has been the State
policy disallowing members of PVTGs from availing of sterilisation schemes in
government hospitals. Tribes such as the Paharias, Baigas, Kamars and Pahari Korvas
of central India have been denied permanent methods of contraception in an attempt
by the State to encourage population growth in the face of their apparently dwindling
numbers.12 This policy originated in an order passed by the Madhya Pradesh
government in 1979 to exclude vulnerable tribal communities from the wave of
sterilisation drives taking place across north India. However, even decades later, this
order continues to be followed.
Such a policy denies members of PVTGs the autonomy to make free and informed
reproductive choices, and particularly denies any agency and bodily autonomy to
women of these communities, who have to bear the burden of the denial of access to
sterilisation facilities. Moreover, it sidesteps the real factors contributing to high
mortality rates such as chronic malnutrition, starvation and lack of access to adequate
health facilities. On the other hand, in the Wayanad district of Kerala, Kattunayakan
tribals are sometimes coerced or intimidated into undergoing sterilisation in order for
health workers to meet necessary sterilisation targets. Both practices need to be
condemned and it is necessary that the reproductive rights and autonomy of PVTGs
be respected by the State. The real issue for PVTGs is the non-provision of health
facilities as well as denial of their right to sufficient, nutritious food.
Tribal groups such as the Sahariya in Baran, Rajasthan continue to work as bonded
labour for rich landlords for generations. Many of them are agricultural labourers
working under the hali system which is one of the forms of bonded labour banned
under the Bonded Labour (Abolition) Act 1976.13 Many Sahariyas were tricked into
accepting loans with exorbitant interest rates and subsequently have had to work for
big landowners without wages. Tribal indebtedness is a huge problem, often leading
to situations of bonded labour. Even among the Juang PVTGs in Odisha, many
families are forced to labour in repayment of their debt in a system locally called goti
– despite the prevalence of the central law as well as the Orissa Debt Bondage
(Abolition and Regulation) Act, 1948. Action must be taken to ensure that all PVTGs
are removed from bondage and freed of their debts.
Literacy rates among PVTGs are extremely low, most often much lower than even the
State average for the Scheduled Tribe population. This is largely due to the abysmal
12Aarti Dhar, Misconstruing order, Chhattisgarh tribals denied sterilisation for three decades, The Hindu, October 31, 2012,
Available at http://www.thehindu.com/news/national/misconstruing-order-Chhattisgarh-tribals-denied-sterilisation-for-three-
decades/article4048484.ece 13Anumeha Yadav, The story of slavery that Jaipur can no longer deny, Tehelka, Vol. 7, Issue 51, December 25, 2010, Available
at http://archive.tehelka.com/story_main48.asp?filename=Ne251210The_story_of.asp

62
education infrastructure in tribal areas, poorly trained or absentee teachers, lack of
teaching in tribal languages and irrelevant and alienating curriculum. Yet PVTG
children are highly educated in many ways and possess considerable knowledge about
agriculture, forests and so on which must be duly recognised. Any educational policy
or programme for PVTGs would need to take account of their distinct culture in order
to develop a curriculum and pedagogic style which centralises their traditional skills,
culture and language while introducing young people to diverse knowledge and
cultures from across the world.
Many PVTGs are forest dwellers and depend heavily on land and forest resources for
their subsistence. Over time, their habitat has been declared as Reserved Forest,
Protected Forest, leaving them vulnerable to displacement and eviction without
compensation. For instance, in 2009, 245 Baiga families were moved out of the
Achanakmar Tiger Reserve, when it was notified under Project Tiger.14 The housing
colonies built for their rehabilitation soon began to collapse, they did not receive
pattas for their new farmland and they did not get the full compensation owed to them
under the Project Tiger relocation scheme. The Baiga families were relocated to an
area where their traditional forest livelihood of collecting Sal and Tendu leaves as
well as bamboo was no longer feasible. In Tamil Nadu, the Kattunayakans, a tribe of
honey-collectors, who live on the fringes of the Mudumalai Wildlife Sanctuary, a
321-square-kilometre park, are being prevented from collecting honey as well as other
produce from the forest area due to immense harassment from forest guards.15 The
adivasis here are denied their rights to access the forest in complete violation of the
Forest Rights Act, 2006 which has yet to be implemented in the State of Tamil Nadu.
It is essential that the habitat rights of PVTGs as guaranteed by the FRA be
recognised by the Forest Department and the claims filed by forest-dwelling
communities be granted at the earliest. It is crucial that their lands and habitats be
protected from any intrusions and that displacement be prevented.
Habitat rights for PVTGs as guaranteed by the Forest Rights Act must be granted to
them and definitional as well as procedural ambiguities must be cleared up. Section
3(1)(e) of the FRA recognises the “rights including community tenures of habitat and
habitation for primitive tribal groups and pre-agricultural communities” and Section
2(h) defines ‘habitat’ as the “area comprising the customary habitat and such other
habitats in Reserved Forests and protected forests of Primitive Tribal Groups and pre-
agricultural communities and other forest dwelling Scheduled Tribes”. The FRA
Amendment Rules now provide that, “In view of the differential vulnerability of
PVTGs, the District Level Committee shall ensure that all PVTGs are conferred
habitat rights, in consultation with their concerned traditional institutions and that
their claims for habitat rights are filed before the concerned Gram Sabhas”. State
14 Sayantan Bera, Baigas in exile, Down to Earth, July 31, 2012, Available at http://www.downtoearth.org.in/content/baigas-
exile. 15Mari Marcel Thakaekara, Honey is life, New Internationalist, Issue 425, 2009, Available at
http://newint.org/features/2009/09/01/tribal-peoples/

63
Governments need to be urged to recognise habitat rights over revenue land in
addition to habitat rights over forest land (granted by the FRA). Except for the Madia
in Maharashtra and the Chuktia Bhunjia, Mankadia, Dongria-Khond, Juang, and
Khadias in Odisha, there have been few efforts to claim habitat rights. In order for this
to occur, it would be necessary for the government to clear up the confusions
regarding definition of habitat; clashes between traditional and State/district
boundaries; claims to habitat rights in protected areas such as tiger reserves; and
habitat rights for displaced PVTGs.
What has often occurred in the past is that development programmes have been
imposed on PVTGs without considering their own priorities and development needs.
In the current moment, a move away from the one-size-fits-all approach to
development is absolutely essential.16 An enabling environment must be created in
which communities are empowered to make their own choices about the path of
development they would like to follow and the livelihoods they wish to adopt. No
development project can be imposed on PVTGs – instead all welfare
projects/plans/schemes must move forward only with their informed consent as well
as their participation in the process of planning and decision-making. As the National
Advisory Council recommendations have noted, there is a significant risk that
vulnerabilities may be exacerbated rather than reduced through government
intervention and therefore due caution must be exercised in all cases. Programmes
should not have the effect of undermining their self-sufficiency and their own
development priorities must be the driving force of government action. Vulnerabilities
must be addressed through taking account of their food production and distribution
systems and their rich repertoire of traditional skills and knowledge.
4.4 Scheduled Areas
In the wake of tribal rebellions in the nineteenth century, the British became
convinced of the vulnerability of tribal populations in the form of various ‘outsiders’
and assumed the role of paternalist protectors of tribals against the non-tribal
exploiters. This brand of protectionism, however, worked to justify British presence in
tribal areas as the guardian of their interests. Indeed, British policy toward tribals
followed a contradictory path: on the one hand, it advocated protection of these areas
through exclusion from the operation of general laws and on the other hand, it
facilitated assimilation with the larger social structures through the market.
Even prior to the development of a delineation of the characteristic features of a tribe,
there existed a separate system of governance for predominantly tribal areas marked
16 See Development Challenges Specific to Particularly Vulnerable Tribal Groups, Recommendations of the National Advisory
Council, 2013.

64
by special legal provisions and the non-applicability of general laws in these areas.
Thus, the creation of distinctive tribal spaces in legal-administrative terms preceded
the classification of specific groups as tribes based on established criteria. These areas
are referred as Scheduled Areas in the post-Independence period.
In the Singhbhum area, for example, the British introduced a system of
administration, similar to that already in place in Ramgarh and Jungle Mahals through
Regulation XIII of 1833. Wilkinson’s Rules meant the withdrawal of regulations in
force in other parts of British India and the assignment of all governance in the district
to the Political Agent to the Governor-General. These areas came to be known as
Non-Regulation Provinces and were to be governed by special rules for civil and
criminal justice, collection of land revenue, and so on. In 1874, another law was
passed which renamed the non-regulation tracts as Scheduled Districts and defined
their geographical boundaries. In the Northeast region, in addition, the British put in
force the Inner Line Regulation in 1873, as the point beyond which general laws for
the colony would not be applicable and entry of subjects living outside the area was
strictly prohibited.
The separation of these areas continued with the Government of India Act, 1919
which renamed the Scheduled Tracts as ‘Backward Tracts’ and also distinguished
between ‘really backward tracts’ wherein the Governor General was exclusively
responsible for law and administration and the ‘backward tracts’ wherein the
Governor General could act through local officials. This nomenclature was altered to
‘wholly excluded areas’ and ‘partially excluded areas’ respectively by the Simon
Commission according to the level of backwardness. The Government of India Act,
1935 followed from this, stating that the Governor could determine policy directly or
through his agents in the tribal areas and prohibited legislative Council members from
asking any questions about the administration of the excluded areas. Functionaries of
the colonial government were, therefore, singularly responsible for about 15 million
people in the sub-continent.
The role of the Agent of the Governor-General in these areas was two-fold: to protect
the tribal from the non-tribal populations and to exert a civilizing influence on them
through programmes of reform. The policy of exclusion came from the belief of the
colonial government that their government would be best for the tribals and that the
Indian government would only impose dominant cultural values on them. Thus, a
special class of areas with tribal-majority populations was created, within which a
distinctive legal framework would operate with the following characteristics: rule by
district officers under the governor, simple procedures in dispute settlement,
restriction of entry of non-tribals, the exclusion of these areas from the operation of
ordinary laws.
One of the primary features of the Partially Excluded areas was that no general laws
would apply to these areas, unless the Governor saw it fit to apply these legislations.

65
In the post-1947 period, however, this feature was altered vis-à-vis the Fifth Schedule
areas since now all Central and State laws would automatically apply to tribal areas
unless the Governor took the decision to prevent application or modify/amend the
legislation in keeping with the circumstances of the Scheduled Areas. Rarely do
Governors invoke this power leading to a situation where in all legislations,
irrespective of their suitability in Scheduled Areas, are operational without any
amendment or alteration.
At the same time, one of the assumptions behind the creation of these spaces was the
idea that the tribes could not cope with the complexity of representative institutions.
The Montagu-Chelmsford Report which was to later form the basis of the
Government of India Act, 1919 even noted that “there was no political material on
which to found political institutions” in these areas.
The demand for political autonomy by tribals was overlooked, despite several on-
going agitations for political rights. Further, this view neatly separated the related
issues of social and economic well-being and political power. The resultant policies
were based on the economic integration of tribals through development programmes
while attempting to ensure that the cultural aspects of their society such as language
and customs were left untouched. This understanding of the tribal question continued
into the post-colonial period. The Constitution of India continued with this system of
governance through the separate, but inter-linked categories of Scheduled Tribes and
Scheduled Areas.
Similar to Scheduled Tribes, the definition for Scheduled Areas (under the Fifth
Schedule of the Constitution) is “such areas as the President may by order declare to
be Scheduled Areas”. The criterion for the declaration of an area as a Scheduled Area
was identified by the first Scheduled Areas and Scheduled Tribes Commission
(Dhebar Commission). The features of such an area were: the preponderance of tribal
population, compactness and reasonable size of the area, under-developed nature of
the area, and marked disparity in the economic standard of the people. Several orders
relating to Scheduled Areas have been passed by the President over the years. The
present Scheduled Areas follows the pattern of the erstwhile Partially Excluded Areas,
although more orders regarding Scheduled Areas have been passed by the President in
the post-Independence period. Since 1976, there have been efforts to ensure that the
Scheduled Areas coincide with the Tribal Sub-Plan areas through several orders,
although this task is still not complete.
It is important to reiterate that there are several tribal-populated and tribal-dominant
areas across the country which are not Scheduled Areas and therefore, are not covered
by the protections offered under the Fifth Schedule. These include tribals living in the
nine States of India which have Scheduled Areas as well as those living outside of
these States – for example, in West Bengal, Bihar, Uttar Pradesh, Uttarakhand, Goa,

66
Tamil Nadu, Kerala, and Karnataka and the Union Territories of Daman and Diu,
Dadra and Nagar Haveli, Lakshadweep, and the Andaman and Nicobar Islands.
For example, the southern region comprising Karnataka, Kerala and Tamil Nadu
comprise over five per cent of the total Scheduled Tribe population. Karnataka alone
has 50 recognised tribal groups within its State boundaries while Tamil Nadu has 37
Scheduled Tribes and Kerala has 36 Scheduled Tribes. A large proportion of the tribal
population of South India belongs to the Nilgiri hills region, covering all these three
States. Although, a survey by the British in 1847 apparently revealed that about 78 per
cent of the people in the Nilgiri plateau region were tribal hunter-gatherers,
pastoralists and shifting cultivators, these areas were never scheduled, possibly due to
British economic interests in the emerging plantation economy.17 Tribals in this
region face serious problems of landlessness, land alienation, malnutrition, bonded
labour, eviction from National Parks and Sanctuaries, as well as displacement due to
mines and hydroelectric projects. However, by and large, discussions around tribal
rights tend to focus on Fifth and Sixth Schedule Areas to the neglect of other non-
Scheduled regions with substantial tribal populations.
On the question of Scheduled Areas, the Bhuria Commission (2002-2004) requested
the governments in the various States with sizeable tribal populations to comment on
the existing criteria for scheduling of areas through an assessment of their validity
within the contemporary context and through recommendations that could make the
given criteria more specific and precise. For example, it remains unclear what exactly
‘preponderance’ of tribals means in terms of percentages of the population. There is
also the question of the size of the administrative unit within which ‘preponderance’
is necessary – at the level of the district or the block or the village. This is an
especially important question given that there has been considerable in-migration of
non-tribals to Scheduled Areas as well as non-Scheduled areas with large tribal
populations. This influx has changed the relative population of tribal and non-tribal
communities in the area, often worsening the disparity between the two groups.
The State Governments, in response to the Bhuria Commission, provided several
suggestions on this issue, with some calling for changes in the criteria while others
declaring their satisfaction with the status quo as regards their States.18 The State
Government of Chhattisgarh noted that while it has about 81,669 sq. km as Scheduled
Areas, there are 88,000 sq. km in the state under the Tribal Sub-Plan (TSP), thus
creating a disparity which must be addressed by making Scheduled Areas
coterminous with TSP areas. They further suggested the condition of 50% Scheduled
Tribe population for declaration of Scheduled Area as well as the treatment of the
Gram Sabha as a viable unit. Madhya Pradesh, on the other hand, has suggested a
norm of 40% tribal population in a block and Gram Panchayat for eligibility. The
17 Ratnaker Bhengra, C.R. Bijoy and Shimreichon Luithui. 1998. The Adivasis of India, Minority Rights Group International, p.21. 18 Report of the Scheduled Areas and Scheduled Tribes Commission, Government of India, Volume I, 2002-2004.

67
government also argued that human development indices may not be a viable standard
for exclusion from Scheduled Areas, since there is considerable economic and social
differentiation between and within tribal groups. The Rajasthan government
recommended that the backwardness of an area be assessed, according to the
following parameters: ST female literacy and availability of safe drinking water,
healthcare, and electricity. Based on these suggestions, the Bhuria Commission
recommended:
a) that the notification of Scheduled Areas should include villages as well as towns and cities
in the blocks, tehsils and districts, including all forest and revenue lands
b) that all the Integrated Tribal Development Projects (ITDPs), Modified Development
Approach (MADA) pockets included in the Tribal Sub-Plan should be considered for
notification as Scheduled Areas subject to conformity with the established standards.
The parameters for further inclusion of non-Scheduled Areas within the ambit of the
Fifth Schedule must be debated by the central and State Governments and action must
be taken in this regard immediately. The situation wherein a substantial number of
Scheduled Tribes reside outside of the Scheduled Areas needs to be addressed to
ensure that tribes are not denied the protections offered by the Constitution and other
legislations pertaining to Scheduled Areas. Given the onslaught of global market
forces on tribal lands, the extension of such provisions is of the utmost importance
and urgency.
Section II: Legal and Administrative Framework in Scheduled Areas
In the post-colonial period, the classification of an area (which may range in size from
a single village to a block to an entire district within a State) as a Scheduled Area
carries significant legal and political implications since it is on this basis that the
provisions of either the Fifth or the Sixth Schedule apply.19 These constitutional
arrangements for the Scheduled Tribes follow different patterns and provide for both
protections from non-tribals (particularly on land alienation, money-lending and
political representation) and provisions for autonomous decision-making on various
matters. These frameworks constitute the recognition of the adverse inclusion of tribal
communities within the global political economy as well as the distinctiveness of
tribal culture and identity threatened by the cultural imperialism of the non-tribal
majority. At the same time, it must be noted that several of these provisions are
paternalistic in nature and are not entirely adequate to the onerous task of ensuring the
protection of tribal land and resources given the current context of liberalisation.
Moreover, the experience of the functioning of the institutions created under these
constitutional provisions demonstrates that stricter implementation and further
strengthening of laws is an urgent necessity. This section examines the various
arrangements instituted for the Scheduled Tribes and briefly analyses the strengths
19 However, there are provisions beyond the Fifth and Sixth Schedule that apply to tribal areas and provide for various degrees
of autonomy and self-government. These will also be explored in the following sections.

68
and weaknesses of each. Such an analysis is essential in order to objectively assess
whether these provisions have fulfilled their stated goals over the last sixty years and
to begin a discussion on potential mechanisms to strengthen their functioning in the
future.
4.5 The Fifth Schedule
The basis of the Fifth Schedule of the Constitution can be traced back to the laws of
the British colonial government designating certain parts of the sub-continent
‘backward tracts’ and ‘partially excluded areas’. The latter term was incorporated into
the Constitution and it is within these tracts labelled Scheduled Areas (wherein a large
number of Scheduled Tribes reside, alongside other relevant criteria) that the Fifth
Schedule is applicable. The debate around the Fifth Schedule, its relevance and its
efficacy vis-à-vis the intentions of the Constitution makers are as contentious today as
they were during the debates of the Constituent Assembly.
During the debates regarding the provisions of the Constitution of the modern Indian
nation, the issue of the administration of the Scheduled Tribes generated heated
debates on the post-colonial State’s policy toward and legislation on adivasi
communities. Largely, nationalist leaders and social reformers favoured the
assimilation of tribals into ‘mainstream’ Indian society, and their views were pitted
against those of the British administrators and anthropologists who advocated
isolationism or protection. These contrasting positions were reflected in the famous
debate between G.S. Ghurye and Verrier Elwin in which the latter argued for a policy
of protection of the ‘tribal way of life’ and the former stated that those in favour of
isolation sought a revival of the past, and that Elwin’s position ignored the histories of
tribal migration and intermingling with non-tribal populations. While both views were
heard out, the policy ultimately adopted was a middle ground of ‘controlled
integration’, the middle ground advocated by then Prime Minister Shri. Jawaharlal
Nehru. There was, therefore, recognition of difference, even if this was done in the
pursuit of its eventual erasure. An approach of simultaneous ‘protection’ and ‘uplift’
was stressed.
The belief that tribal areas required special laws led to the setting up of the Advisory
Committee on Fundamental Rights and Minorities by the Constituent Assembly,
1947. This body appointed three sub-committees in 1947 to look into specific tribal
areas and make suggestions for their administration and functioning. The first was
authorized to look into the excluded and partially excluded areas ‘other than Assam’
and was headed by Shri. A.V. Thakkar, the second to examine tribal areas within
undivided Assam chaired by Shri. Gopinath Bardoloi, and the third was to analyse the
situation of tribes in the North Western Frontier Province. The proposals of the first
two committees were later incorporated as the Fifth and Sixth Schedules of the Indian
Constitution.

69
The report of the Joint Sub-Committee described tribal society as “lacking in such
civilizing facilities as roads, schools, dispensaries and water supply”.20 Tribal people
are described as “extremely simple people who can be and are exploited with ease by
plainsfolk”. Hence, a policy of protectionism would be necessary since “sudden
disruption of the tribal customs and ways by exposure to the impact of a more
complicated and sophisticated manner of life is capable of doing great harm”21 At the
same time, it was argued that isolationism was not the solution since only a
continuous process of assimilation into mainstream Indian (and Hindu) society would
lead to their ‘development’. The debate on the tribal question took place on 5th and 6th
September, 1949 and the main focus remained on this issue - “reconciling the
diversity of custom with the ‘national life of the country”.22
The Fifth Schedule (Article 244(1)) of the Constitution finally adopted by the
Constituent Assembly did not include several of the recommendations of the sub-
committees and Assembly members. The Fifth Schedule contains provisions relating
to the administration of Scheduled Areas other than in Northeast India. First, areas
can be designated Scheduled Areas on the order of the President, who can similarly
declare that certain parts of/entire Scheduled Areas cease to be such. Second, the
Governor of each State having Scheduled Areas shall annually, or whenever required
by the President of India, submit a report to the President regarding the administration
of Scheduled Areas. Currently, certain parts of nine States of the country are covered
by the Fifth Schedule. The broad list of Scheduled Areas is as follows:23
State Areas
Andhra
Pradesh
Visakhapatnam, East Godavari, West Godavari, Adilabad, Srikakulam, Vizianagaram,
Mahboobnagar, Prakasam (only some mandals/villages are scheduled mandals)
Jharkhand Dumka, Godda, Devgarh, Sahabgunj, Pakur, Ranchi, Singhbhum (East&West), Gumla,
Simdega, Lohardaga, Palamu, Garwa, (some districts are only partly tribal blocks)
Chhattisgarh Sarbhuja, Bastar, Raigad, Raipur, Rajnandgaon, Durg, Bilaspur, Sehdol, Chindwada,
Kanker
Himachal
Pradesh
Lahaul and Spiti districts, Kinnaur, Pangi tehsil and Bharmour sub-tehsil in Chamba
district
Madhya
Pradesh
Jhabua, Mandla, Dhar, Khargone, East Nimar (khandwa), Sailana tehsil in Ratlam
district, Betul, Seoni, Balaghat, Morena
Gujarat Surat, Bharauch, Dangs, Valsad, Panchmahl, Sadodara, Sabarkanta (parts of these
districts only)
Maharashtra Thane, Nasik, Dhule, Ahmednagar, Pune, Nanded, Amravati, Yavatmal, Gadchiroli,
Chandrapur (parts of these districts only)
20 Cited in Amit Prakash, Contested Discourses: Politics of Ethnic Identity and Autonomy in the Jharkhand Region of India, Alternatives: Global, Local, Political, Vol. 24, No. 4 (Oct.-Dec. 1999), pp. 475 from Joint Report of the Excluded and the
Partially Excluded Areas (other than Assam) and the Northeast Frontier (Assam)Tribal and Excluded Areas Sub-Committees,
August 25, 1947. 21 Ibid. 22 Nandini Sundar, Subalterns and Sovereigns: An Anthropological History of Bastar, New Delhi: Oxford University Press, pp. 185. 23 The list below only serves as a broad outline of the Scheduled Areas and does not constitute an exhaustive and detailed
catalogue of areas under the Fifth Schedule.

70
Odisha Mayurbhanj, Sundargarh, Koraput, Malkangiri, Rayagada, Narayanpur (full), Raigada,
Keonjhar, Sambalpur,Kondmals, Ganjam, Kalahandi, Bolangir, Balasor (some blocks)
Rajasthan Banswara, Dungarpur (fully tribal districts), Udaipur, Chittaurgarh, Siroi (some areas)
Part B of the Fifth Schedule provides for the creation of a Tribes Advisory Council
(TAC) in each State having Scheduled Areas (and if the President directs, also in
States having Scheduled Tribes but not Scheduled Areas), consisting of twenty
members of which three-fourths must be representatives of Scheduled Tribes in the
Legislative Assembly of that State. The duty of the TAC is to advise on matters
pertaining to the “welfare and advancement” of the Scheduled Tribes “as may be
referred to them by the Governor”. Further, the Fifth Schedule grants extensive
powers to the Governor who, by public notification, may direct that a law enacted by
the Parliament or the State Legislative Assembly shall not apply to a Scheduled Area,
or may apply subject to certain amendments or restrictions as he/she specifies. The
Governor may only make such regulations on consultation with the concerned Tribes
Advisory Council and subject to the final assent of the President. The section states:
The Governor may make regulations for the peace and good government of any area in a
State which is for the time being a Scheduled Area. In particular and without prejudice to the
generality of the foregoing power, such regulations may- (a) prohibit or restrict the transfer
of land by or among members of the Scheduled Tribes in such area; (b) regulate the allotment
of land to members of the Scheduled Tribes in such area; (c) regulate the carrying on of
business as money-lender by persons who lend money to members of the Scheduled Tribes in
such area.
These provisions were viewed as essential in view of the historical fact that adivasi
livelihoods depend on the land and that alienation of resources had led to considerable
impoverishment of adivasis during the colonial period. Nonetheless, the initial
recommendations of the committees and the earlier draft of the Fifth Schedule
accorded far greater autonomy to tribal areas than the final version, which watered
down the role of the Tribes Advisory Council to a mere consultant rather than an
autonomous decision-making body. A Member of the Constituent Assembly, Shri.
Jaipal Singh, had argued against this version of the Schedule and demanded instead: a
statutory obligation that a report on the Scheduled Areas and Tribes be submitted by
the Governor annually, that TACs be compulsorily set up in all States having
Scheduled Tribes and not just in those States having Scheduled Areas, that the
Governor should be bound to carry out the decisions of the TAC regarding the
modification and amendment of laws made by Parliament or the State Legislature.
Singh noted that the new draft (the one finally incorporated into the Constitution)
made the Fifth Schedule considerably less powerful than he had hoped and
“emasculated the Tribes Advisory Council”. Lamenting the lack of powers to the
tribal people themselves and their representatives in the TAC, Singh stated:

71
“The whole pattern of the original draft was to bring the Tribes Advisory Council into action.
It could initiate, originate things, but, somehow or other, the tables have now been turned.
The initiative is placed in the hands of the Governor or Ruler of the State.” 24
Another Constituent Assembly member, Shri. Yudhishtir Misra, held that the TAC
should not only be allowed to advise on the “welfare and advancement” of tribes, but
also more broadly on the administration of the Scheduled Areas. Moreover, Misra
warned that the advisory powers of the TAC should not be circumscribed by the
whims and fancies of the executive as seemed likely given the current form of the
Fifth Schedule – which states that the TAC can only advise on matter referred to it by
the Governor. However, their suggestions were refused by their colleagues in the
Assembly who believed that the work of the TAC must not be of a political nature on
the grounds that it might lead to separatism and that tribals would not themselves be
able to comprehend the complexities of law-making. Rather than grant genuine
autonomy to tribal India, the Fifth Schedule paternalistically placed their welfare in
the hands of a representative of the Centre.
Unlike the Sixth Schedule wherein Autonomous District Councils have been given
significant legislative, judicial and executive powers on several important matters, the
Fifth Schedule places the governance of tribal areas in ‘mainland’ India largely in the
hands of the Governor. This occurred for two reasons: one, mainland areas had large
non-tribal populations and two, the tribes of the Northeast were seen as more
advanced and capable of self-governance unlike the tribes in other parts of the sub-
continent. As a result, tribes were given ‘protection’ from outside intrusions and land
alienation but were not granted much autonomy on political and economic matters.
4.5.1 Governor’s Report
Over the years, States with Scheduled Areas have developed a framework around
which the Governor’s reports are to be presented. According to the Scheduled Areas
and Scheduled Tribes Commission Report (2002-2004), the Governor’s report is
expected to contain an objective and independent assessment of the quality of the
administration of Scheduled Areas, the implementation of protective safeguards for
tribals, and the regulations made by the Governor in keeping with his powers under
the Fifth Schedule.25 It should further cover issues of displacement and rehabilitation,
law and order problem, tribal protests, atrocities against tribes, and so on. This report
is required to be placed before the TAC for their advice and recommendations. On the
basis of this Report, the Union Government may issue directives to the State
Governments for better administration of these areas.
According to the Bhuria Commission Report (2002-2004), at the time of their writing,
the States of Andhra Pradesh and Madhya Pradesh did not send their reports since
24 Debates of the Constituent Assembly of India, September 5, 1949, Available at http://164.100.47.132/LssNew/constituent/vol9p26.html 25 Report of the Scheduled Areas and Scheduled Tribes Commission, Government of India, 2002-2004, pp. 36-37.

72
1999-2000, while Maharashtra and Orissa had not sent theirs from 2000-2001
onward. Only Himachal Pradesh has submitted its report regularly. In more recent
years, the Ministry of Tribal Affairs reports that, as of 25.5.2013, it had received
Governor’s Reports for the year 2011-12 only from Gujarat and was still awaiting
reports from the other eight States. Maharashtra had not submitted its report for the
previous year 2010-11 either.
Even when the reports are sent regularly, there have been several questions raised
regarding the quality and value of the reports. Critics have pointed out that the reports
are repetitive, casually and haphazardly constructed and tend to borrow heavily from
reports of the tribal welfare department, merely listing out the schemes and
programmes for tribal development without even examining their implementation and
efficacy on the ground. Pressing issues such as the impacts of insurgency and counter-
insurgency on tribal populations and displacement by big industry rarely find
mention. The Governor’s Reports offer quantitative rather than qualitative or
analytical data about the status of tribal administration in the concerned States – even
the statistical information presented relates to the flow of development funds to tribal
villages and the number of beneficiaries of government welfare schemes. The reports
do not offer an independent assessment of the policies of the State Governments vis-
à-vis Scheduled Areas and instead seem to uncritically accept government claims of
tremendous achievements with regard to tribal development.
A confidential report sent to the President by the National Commission for Scheduled
Tribes (accessed by Down to Earth magazine in 2013) has also complained of the
failure of Governors in performing their administrative duties to ensure self-
governance in tribal areas. The National Commission advocated that Governors be
made more accountable with regard to their roles vis-à-vis Scheduled Areas, namely
ensuring the implementation of constitutional provision protecting tribal rights.26
Most importantly, the Governor should ensure that all laws which contradict the
constitutional protections for tribals should be repealed or modified in Scheduled
Areas. The NCST further recommended that the Ministry of Tribal Affairs prepare a
detailed format for submission of the Governor’s reports which could include a
review of all Central and State laws and their compatibility with Constitutional
provisions for Scheduled Tribes and consultation with the TACs. Other experts have
also advocated the inclusion of an Action Taken Report (ATR) for the previous year
in the report of the subsequent year. Where such regulations have been made, they
primarily pertain to control of land alienation and money lending in tribal areas and
do not venture to cover the spectrum of issues that may be covered under the “peace
and good government” of the area. There are several instances in which the Governor
has exercised his powers to make regulations. In Odisha, these regulations have
included the Odisha Scheduled Areas Transfer of Immovable Property (By Scheduled
26 Jitendra, Governors in the Dock, Down to Earth, April 15, 2013, Available at
http://www.downtoearth.org.in/content/governors-dock

73
Tribes) Regulation 1956, Odisha Scheduled Area Money-Lenders Regulation 1967,
and the Odisha Schedule Area Debt Relief Regulation. However, reviews of the
implementation of these regulations (as well as similar laws seeking to stem land
alienation and money-lending in tribal areas) points to their failure owing to excessive
dependence on the powerful mainstream bureaucracy unwilling to acknowledge tribal
rights over land and forest. More recently, the Bhuria Commission Report has further
recommended the inclusion of another subject under which the Governor could
exercise his powers – for the regulation of trade and commerce in the Scheduled
Areas of the State.27
In April 2012, Union Minister for Tribal Affairs, Dr. V. Kishore Chandra Deo
requested the Governor of Andhra Pradesh, Shri. E.S.L Narsimhan, to use his powers
under the Fifth Schedule to cancel a Memorandum of Understanding (MoU) signed
by the Government for bauxite mining in Fifth Schedule areas of Visakhapatnam
district. It has also been noted that when Governors do exercise their Fifth Schedule
powers, it is only on the advice of the Council of Ministers. Activists have
complained that Governors never respond to petitions calling for their intervention in
cases of land conflicts, acquisition for mineral extraction and police atrocities against
tribal communities.
In order to assist the Governor in the fulfilment of the Constitutional duties of his/her
office, the creation of a special Governor’s Cell to work specifically on issues
pertaining to the Scheduled Tribes has begun in several States. The governments of
Chhattisgarh, Jharkhand, Maharashtra and Rajasthan have informed the Ministry of
Tribal Affairs that they have constituted the Governor’s Cell in their States, although
the details of their functioning are not yet known. The Governor’s Office in Andhra
Pradesh has noted that there is no need for such a cell in the State since the Tribal
Welfare department is capable of performing the same duties. The State of Madhya
Pradesh has informed the Ministry that there was no consensus on the creation of such
a cell. According to the Government of Himachal Pradesh, such a cell has already
been formed in their State.
The proposed composition as per the directives of the Ministry of Tribal Affairs in a
letter to states with Scheduled Areas (dated December 8, 2010) is as follows:
1. Secretary (Head)
2. Deputy Secretary’s Level Officer (one Anthropology subject expert)
3. One Law and Constitution expert of Deputy Secretary rank
4. Deputy Director (anthropology subject expert)
5. Research Officer/Section Officer (one) (Research Officer should be subject
expert in Anthropology/Sociology)
6. Two Assistants/Technical Assistants/Legal Assistants
7. Other supporting staff – data entry operator.
27Report of the Scheduled Areas and Scheduled Tribes Commission, Government of India, 2002-2004, pp. 59.

74
The formation of the Governor’s Cell is a longstanding necessity in order for the
Governor to properly carry out the duties of the post vis-à-vis protection of the tribes.
It is imperative that the Cell be set up in all the Fifth Schedule States and that these
Cells function independently and conscientiously. Most importantly, the Cell should
be prevented from becoming simply another bureaucratic institution among many
performing its tasks mechanically with little autonomy or interest in tribal affairs.
4.5.2 Tribes Advisory Councils
These Councils have been set up in all the nine States having Scheduled Areas as well
as two other States, West Bengal and Tamil Nadu, both having sizeable tribal
populations. As discussed above, there are several shortcomings inherent in the
structure and mandate of the TACs as laid down in the Constitution. Firstly, the TACs
can only discuss and make recommendations on those issues which are referred to it
by the Governor. Secondly, it functions only in an advisory capacity and has no power
of implementation. Thirdly, the Councils are not accountable to the tribal population
given that they are appointed by the Governor or the State Government.
State Dates on which TAC meetings were held (as on 25.5.2013)
2011-2012
2012-2013
Andhra Pradesh 18.2.2012 Not Reported
Chhattisgarh 26.9.2011 13.7.2012 and 25.11.2012
Gujarat 24.1.2012 Not Reported
Himachal Pradesh 5.3.2012 Not Reported
Jharkhand 19.4.2011, 16.6.2011 and
30.1.2012
9.11.2012
Madhya Pradesh 20.7.2011 and 26.3.2012 Not Reported
Maharashtra 4.1.2012 Not Reported
Odisha 13.5.2011 28.9.2012
Rajasthan 21.7.2011 and 9.2.2012 7.9.2012
West Bengal Not Reported Not Reported
Tamil Nadu Not Reported Not Reported Source: Ministry of Tribal Affairs.
A detailed study of the minutes of the meetings of the Tribes Advisory Councils by
the Asian Indigenous and Tribal Peoples’ Network (2012) reveals that the meetings of
the Councils are almost tokenistic and critical issues (such as land alienation) are
rarely discussed.28 Further, the resolutions of the Councils are not followed up in
subsequent meetings and the implementation of their recommendations is not
independently verified. The issue of the representativeness of the TACs is also a
central issue – while three-fourths of the members are to be tribal MLAs from the
concerned State, the non-official, nominated members include the Chief Minister of
the State (often the Chairperson of the TAC) and bureaucrats.
28 Asian Indigenous and Tribal Peoples Network, The Tribes Advisory Councils: Time to be replaced by the Autonomous District
Councils, December 2012.

75
The States’ rules for the appointment of members hold that they shall be appointed,
either by the State Government (Rajasthan Tribes Advisory Council Rules) or the
Governor (Andhra Pradesh TAC Rules and Jharkhand TAC Rules) with no specifying
criteria. It is the State Governments rather than the Governor which have framed the
rules regarding TAC functioning which has led to the near complete usurpation of
these bodies by the political parties in power both in terms of representation within
the Councils as well as the issues that are taken up for discussion.
The Gujarat Tribes Advisory Council Rules, 1960 provides that “No business shall be
transacted and no proposition shall be moved or discussed at any meeting, unless it
has been specified in the notice for convening the meeting.” The Jharkhand Tribes
Advisory Council Rules states that only those matters shall be discussed in the
Council which has been referred to the Council by the Governor for advice.29
The Andhra Pradesh TAC (as of 2009) consists of the Minister of Tribal Welfare,
Andhra Pradesh (Chairperson); the Principal Secretary to Government of Andhra
Pradesh (TW), Social Welfare Department (Member); the Director for Scheduled
Castes and Scheduled Tribes, Government of India (Member); the Director of Tribal
Cultural Research and Training Institute, Hyderabad (Member); the Commissioner of
Tribal Welfare, Government of Andhra Pradesh (Member Secretary); and 15 tribal
MLAs. The Chhattisgarh TAC (as of 2009)comprises the Chief Minister
(Chairperson), the Minister of Scheduled Tribes and Schedule Caste Development
Department (Vice Chairperson); 15 Scheduled Tribe MLAs (Members); three
Members of Parliament (nominated as Members); and Secretary, Scheduled Tribes
and Schedule Caste Development Department, Chhattisgarh government (Secretary).
Clearly then, a large portion of the members are State functionaries and there are few
independent persons with experience and expertise on tribal issues who are nominated
to the Council.
Further, the members of the TAC have few powers even in terms of what can be
discussed at the Council meetings. For instance, the Chhattisgarh TAC rules states
that, apart from matters referred to it by the Governor, “No issue shall be taken up for
discussion and included in the proceedings and no proposals shall be passed in a
meeting unless the issue has been mentioned in the notice for the meeting, however,
the Chairperson can, using his discretion, permit such issues to be taken up for
proceedings, that he thinks necessary and are in the direction of the motto of the
Council at large but was excluded in the notice.” The Bhuria Commission Report
(2002-04) places on record the dismay of some members of various State Councils
who complain that the State Government do not put any important matters to the
Council for advice. In all these years of its functioning, the TACs have rarely made
any significant policy proposals or recommendations on tribal and developmental
issues.
29 Asian Centre for Human Rights, Submission to High Level Committee, December 31, 2013.

76
Even when issues are taken up by the TAC, it has been noted that there is rarely any
sustained and consistent engagement with the matter in the form of follow-ups and
field visits. As per the minutes of their meetings, none of the TACs discussed the
issue of land alienation among tribals between the years 2005 and 2011. In the case of
the Himachal Pradesh TAC, an excess of items were placed before the Council for
discussion but many seem to have been subject to only a cursory examination and no
decisive conclusions were reached. For example, the Asian Indigenous and Tribal
Peoples’ Network (AITPN) report notes that at the 36th meeting held on 12 May 2006,
102 items were discussed; 104 items were discussed at the 38th meeting on 2 August
2007, and 88 items (including 21 follow up items and 67 new items) were discussed
in the 40th meeting held on 15 May 2010. As a result, no single issue or group of
issues could be seriously analysed and few concrete decisions could be made or
implemented.
In 2012, the extremely limited powers of agenda-setting within the TAC came to the
fore when two members of the Jharkhand TAC walked out of a Council meeting on
the grounds that the Chairman of the TAC was uninterested in taking up serious
problems of the tribal population. The specific matter which the members protested
was land acquisition at Nagri for construction of India Institute of Management (IIM)
and National University for Study and Research in Law. The Chairperson, however,
did not allow discussion on the subject, stating that it be brought before the Council in
writing first. The Chairperson’s statement was countered by the members on the
grounds that several memorandums had been submitted to the Council already and
hence, must be placed for discussion.
There continue to be complaints regarding the legal and actual powers of the
Governor with regard to the TAC as well on the point of issues to be discussed within
the Council. While the Constitution holds that the TAC can hold deliberations on
matters referred to it by the Governor, experts have argued over whether the Governor
as the Constitutional head of the State can make this referral on his own discretion or
only on the advice of the Council of Ministers. The question is central since the
answer could shape future interpretations of the Fifth Schedule as well as the extent of
control of various State Governments over the functioning of TACs. In recent years,
the Central Government itself has given two contradictory interpretations on this issue
since, in 2010, the Attorney-General Shri. G.E. Vahanvati opined that the Governor
did have discretionary powers, but in 2013, the Assistant Solicitor-General, Smt.
Fouzia Mirza stated that the Governor can employ his powers on the aid and advice of
the Council of Ministers and not at his own discretion. This statement was made to a
Public Interest Litigation (PIL) filed by activist Shri. B.K. Manish in the Chhattisgarh
High Court (later dismissed) questioning the un-Constitutional functioning of the
TACs, which was later argued through a Special Leave Petition (SLP) in the Supreme
Court. In light of this case, the Ministry of Law and Justice issued a circular to all law
officers in July, 2013 clarifying that Attorney General Shri. Vahanvati’s opinion
77
affirming the discretionary powers of the Governor was the official stand of the
Government of India.30
Even when serious debate does occur at the TAC, the Council does not follow up on
latest development and implementation on their recommendations. The Andhra
Pradesh TAC took up the matter of the Polavaram project at its meeting in February
2007 and made the following resolutions: that all landless families to be displaced by
the project should be given land in the resettlement areas, resettlement land should be
identified in consultation with tribals, a publicity campaign on the R&R package
should be held in all affected villages, and the TAC members should visit these
villages. Between that meeting and their meeting in March 2011, however, no further
inquiry or discussion of the issue was initiated and the matter seems to have been
forgotten entirely.
Since the formation of the first TAC in Andhra Pradesh in 1958 until January 2012,
105 meetings of the Council have been held. But since 2006, the APTAC has stopped
examining the action taken on decisions made in previous meetings, as was the
practice earlier. The concerned departments do not always submit Action Taken
Reports to the TAC and therefore, the earlier decisions and recommendations of the
TACs, even when implemented, are not revisited in subsequent meetings (as reflected
in the minutes). This is true of the Councils in almost all of the States.
4.6 Legal and Administrative Structures in Northeast India
Northeast India, home to numerous diverse ethnic groups and located strategically
with borders with Bhutan, China, Myanmar and Bangladesh. Historically, tribes of
this region have seen “isolationist” policies of the colonial British who labelled many
hilly tribal tracts of the Northeast as “wholly excluded” areas. While the tribal-
dominated areas in what is commonly referred to as ‘mainland’ India are largely
governed by the provisions of the Fifth Schedule, the States of the Northeast are
covered by the Sixth Schedule of the Constitution as well as a host of other legal and
administrative arrangements for the protection of tribal autonomy.
As early as 1929, the Nagas submitted a petition to the Simon Commission, asking for
autonomy from the future Indian nation-state. Other tribes such as the Khasis and the
Mizos called for self-governance on issues such as customary laws, control over
resources and so on, while also demanding separation from the larger State of Assam.
Several tribes including the Nagas, Mizos, Garos, Khasis and Karbis were (and, in
some cases, still are) demanding a united homeland for all their fellow tribes people
who are spread across several Indian States and even across international borders.
30Jitendra, SC notice to Chhattisgarh on the way tribal advisory Councils function, Down to Earth, July 23, 2013. Available at
http://www.downtoearth.org.in/content/sc-notice-chhattisgarh-way-tribal-advisory-Councils-function

78
Some of the other demands made by tribes in this region are: protection against land
alienation by settlers, continued authority of traditional Councils, and safeguards
against the erosion of their cultures.
The British philosophy of maintaining status quo and isolation was replaced by
policies of development and integration of the Northeast through the Sixth Schedule
of the Constitution. The Schedule was drafted by a Sub-Committee of the Constituent
Assembly called the Northeast Frontier (Assam) Tribal and Excluded Areas Sub-
Committee headed by Assamese political leader, Shri. Gopinath Bardoloi. The sub-
committee aimed to “…reconcile the aspirations of the hill people for political
autonomy with the Assam government’s drive to integrate them with the plains”. The
Sixth Schedule is entirely focused on protection of tribal areas and interests, by
recognising self-governance through constitutional institutions at the district or
regional level.
The Sixth Schedule provides for the creation of Autonomous District and Regional
Councils and accords a host of legislative, executive and judicial powers to these
autonomous bodies. It applies to certain tribal areas of the States of Assam,
Meghalaya, Tripura and Mizoram, Apart from the Sixth Schedule, there are other
constitutional provisions in the Northeast such as Article 371-A in Nagaland which
provides autonomy on issues of religious and social practices, customary law, civil
and criminal justice and ownership of land and resources. Similar provisions are
operational in the State of Mizoram under Article 371- G, although parts of Mizoram
are also covered under the Sixth Schedule. Manipur is governed by Article 371-C as
well as the Manipur (Hill Areas) District Council Act, although this does not compare
with the considerable autonomy conferred on tribal areas by the Sixth Schedule.
Additionally, traditional political institutions are present alongside constitutional
bodies. These include the institution of Syiems among the Khasi, the Daloi among the
Jaintias and Nokma among the Garos of Meghalaya, Khulakpa among the Nagas, and
Haosa, Semang and Pachong amongst the Kukis of Manipur.31
The following table outlines briefly the various legal and administrative structures in
place in the States of the Northeast region:32
State Legal and administrative structures
Arunachal Pradesh Article 371H, No Autonomous Councils,
Panchayati Raj Institutions
Assam Sixth Schedule, Article 371B, Three Autonomous
Councils
Manipur Article 371C, Manipur Hill Village Authority Act
and Manipur Hill Areas District Council
Mizoram Sixth Schedule, Article 371G, Three Autonomous
31 C.R. Bijoy and Tiplut Nongbri. Country Technical Note on Indigenous Peoples’ Issues: Republic of India. IFAD, January 2013. 32 C.R. Bijoy, Shomona Khanna and Shankar Gopalakrishnan, India and the Rights of Indigenous Peoples: Constitutional, Legislative and Administrative Provisions Concerning Indigenous and Tribal peoples in India and their Relation to International
Law on Indigenous Peoples, Asia Indigenous Peoples Pact (AIPP), 2010.

79
Councils
Meghalaya Sixth Schedule, Three Autonomous Councils
Mizoram Sixth Schedule, Article 371G, Three Autonomous
Councils
Nagaland Article 371A and Article 371AA, No
Autonomous Councils but Village Councils in
each major village
Tripura Sixth Schedule, One Autonomous Council for all
tribes (Tripura Tribal Areas Autonomous District
Council)
Broadly, there are three types of legal typologies of administration of local self-
government in North East States. These are Sixth Schedule Frame, State Legislation
Frame, and National Frame. Sixth Schedule covers the entire Meghalaya except
Shillong, parts of Mizoram, Tripura and Assam. Local Self Government of Nagaland
and the non-Council areas in Mizoram fall under the State Legislation frame. Local
self-government of Arunachal Pradesh, Sikkim, Manipur (excluding the hill area
covered under Hill Area Autonomous Council) and non-Council areas of Assam and
Tripura are covered under the National Frame.
Two types of Autonomous District Councils are found in the Northeast States. These
are the Autonomous District Council set up under the Sixth Schedule and
Autonomous District Council established by various Acts of the State Legislative
Assembly which are not under Sixth Schedule.
Assam has three Autonomous Councils under the Sixth Schedule: Dima Hasao
District Autonomous Council (DHDAC), the Karbi Anglong Autonomous
Council (KAAC), and the Bodoland Territorial Council (BTC).
The entire State of Meghalaya except Shillong area is covered under the
provisions of the Sixth Schedule of the Constitution. Meghalaya has three
Autonomous District Councils under the Sixth Schedule of the Constitution.
These are - Khasi Hills Autonomous District Council (KHADC), Garo Hills
Autonomous District Council (GHADC), and the Jaintia Hills Autonomous
District Council (JHADC).
There are three Autonomous District Councils in Mizoram under Sixth
Schedule. They all cover two administrative districts namely Lawngthlai and
Saiha districts. These three Autonomous District Councils are the Chakma
Autonomous District Council (CADC), the Mara Autonomous District
Council (MADC), and the Lai Autonomous District Council (LADC).
The Tripura Tribal Areas Autonomous District Council (TTAADC) is an
independent Council administering the tribal areas of the State of Tripura
under the Sixth Schedule.
There are other Autonomous Councils in Assam and Manipur. These are
established by Acts passed in the State Legislative Assembly. Assam has 6

80
other Autonomous District Councils and Manipur has same number of Hill
District Councils.
There are also special provisions envisaged in the Constitution of India which
can be classified as “Temporary, Transitional and Special Provisions”.
List of Autonomous Districts and Autonomous Hill Districts in India:33
Autonomous District District
Headquarters
Ethnic Composition Year of
formation/alteration
Bodoland Kokrajhar Bodos, Bengalis,
KochRajbongshis, smaller
tribes
2003
Karbi Anglong Diphu Karbis, Dimasa, Rengma,
Kuki, Garos, Tiwas, Khasis,
Hmars, Mizos, Chakmas,
Assamese, Biharis
1951; 1976
North Cachar Haflong Dimasa, Kuki, Hmar,
Zemei, Hrangkhawls
1951; 1970
Garo Hills Tura Garos, smaller tribal groups 1972 (bifurcation in
1979)
Jaintia Hills Jowai Pnar and Jaintia,
Khasi
1972
Khasi Hills Shillong Khasi, smaller
Groups
1972
Tripura Tribal Area Khumwng Bhil, Bhutia, Chainel,
Chakma, Garo, Holan,
Kuki, Lepcha, Lushai, Mog,
Munda, Moatia,
Orang, Riang, Santal,
Tripura, Uchai.
1982
Chakma Autonomous
District
Chawngte Chakma 1987
Lai Lawngtlai Lai 1987
Mara Siaha Mara 1987
Darjeeling Gorkha Hill
Council
Darjeeling Gorkhas, Limbu, Rai,
Gurung, Tamang, Lepchas,
Bhutia, Sherpas, Newars,
Marwaris, Biharis, Chinese,
Anglo-Indians
1988
Autonomous Hill
Development Council,
Leh
Leh Ladakhi (Bot tribe) 1995
Autonomous Hill
Development Council,
Kargil
Kargil Purigba, Balti,
Brokpa, Gujjar
2003
33 Thomas Benedikter, India’s “Autonomous Councils”, in Thomas Benedikter (Ed.) Solving Ethnic Conflict through Self-
Government: A Short Guide to Autonomy in Europe and Asia, EURAC, 2009.

81
4.6.1 The Sixth Schedule
The original Sixth Schedule areas created in 1952 underwent a drastic reorganization
in 1971; some areas were put under newly created States such as Mizoram and
Meghalaya which were carved out of the erstwhile Assam State. The Sixth Schedule
(Article 244 (2) and 275 (1)) provides for administration of Tribal Areas in the States
of Assam, Meghalaya, Tripura and Mizoram through Autonomous District and
Regional Councils endowed with legislative, judicial, and executive powers.
The Sixth Schedule under Article 244 (2) provides for the creation of Autonomous
District Councils (ADC) in an Autonomous District and Regional Councils for
autonomous regions. These Councils have legislative powers on matters relating to:
allotment, occupation, or the setting apart of land, other than reserved forests,
for the purpose of agricultural or grazing or for residential or other non-
agricultural purposes or for any other purpose likely to promote the interests of
the inhabitants of any village or town (Provided that nothing in such laws shall
prevent the compulsory acquisition of any land, whether occupied or
unoccupied for public purpose)
management of any forest not being a Reserved Forest
use of any canal or water course for purpose of agriculture
regulation of the practice of jhum or any other form of shifting cultivation
establishment of village or town committees or Councils and their powers
any other matter relating to village or town administration, including village
and town police, public health and sanitation
appointment of succession of chiefs or headmen
inheritance of property
marriage and divorce
social custom
The Council has legislative powers over matters such as primary education,
dispensaries, markets, cattle pounds, ferries, fisheries, roads, road transport and
waterways. The District Council can regulate money lending and trading by non-
residents or non-tribal people living in the area. It has the power to collect taxes and
tolls on land, buildings and persons, professions, trades, animals, vehicles, boats,
entry of goods into the local markets, goods carried on ferries, the maintenance of
schools, dispensaries androids. The ADCs can issue licenses and leases for the
prospecting and extraction of minerals and are entitled to get a share of royalties
accruing to the State from mineral extraction.
The Sixth Schedule further provides that no Act of the State legislature shall apply to
any autonomous district unless approved by the Council. The Governor of the states
under the Sixth Schedule has the power to decide to either apply or not apply any Act
of Parliament or the Legislature in the autonomous area of Assam, Tripura and

82
Mizoram. Along with this provision, except in Assam, in all other Scheduled Area of
the Northeast region, the President of India has the right to apply or not apply any Act
of Parliament or the Legislature on any matter.
The Councils have judicial powers for trial of offences committed by members of the
Scheduled Tribes in their respective areas of jurisdiction. The District and Regional
Councils have been conferred powers under the Code of Civil Procedure, 1908, and
the Code of Criminal Procedure, 1898 for the trial of certain suits, cases and offences.
There is a two-tier system for judicial administration at the district and village levels.
The village Council can hear cases wherein both parties belong to Scheduled Tribes
while the district courts act as a court of appeal. A District Fund for each Autonomous
District and a Regional Fund for each Region has been set up to channelize all the
funds designated for these areas.
The Governor has the power to annul or suspend any act or resolution of a District or
Regional Council which he finds likely to endanger the safety of India or to be
prejudicial to public order. The Governor can suspend the Council and exercise all the
powers vested in the Council. However the Governor has to lay such an order before
the State legislature as soon as possible and the order shall, unless revoked by the
legislature, continue for a period of twelve months from the date on which it was
made. The Governor has the power to appoint a Commission at any point of time to
examine and report on any matter relating to the administration of the autonomous
districts and regions in the State or may appoint a Commission to inquire into and
report on the administration of autonomous districts and autonomous regions. Further,
the Governor has the power to dissolve a District or a Regional Council with the
recommendation of such a Commission.
4.6.2 Statutory Autonomous Councils
There are also Statutory Autonomous Councils in the States of Assam and Manipur.
These have been established by Acts passed in State Legislative Assembly. These can
be categorised under the following heads:
1. Autonomous District Councils in Assam
2. Hill District Councils in Manipur
1. Statutory Autonomous Councils in Assam
Besides the three (i.e. The North Cachar Hills District, The Karbi Anglong District,
The Bodoland Territorial Area District) Councils of the Sixth Schedule, Assam has
many Autonomous Councils created by the State Government, some of which are:
1. Rabha Hasong Autonomous Council (RHAC),
2. Lalung (TIWA) Autonomous Council (LAC),
3. Mising Autonomous Council (MAC),

83
4. Thengal Kachori Hill Autonomous Council, (TKAC)
5. Sonowal Kahari Autonomous Council (SKAC)
6. Deori Autonomous Council (DAC)
The administrative structure of these Councils is patterned on the Autonomous
District and Regional Councils created by the Sixth Schedule. This, however, has
added significant confusion in the administration. There are three authorities
operating in parallel in these areas, namely, the Council, the State departments and the
Panchayati Raj. These Councils cover non-contiguous villages. There are many other
communities – both tribals and non-tribals – who have been living before some of
these tribes came. The creation of autonomous tribe-specific councils will: i) violate
Part IX A of the Constitution, ii) not be inclusive as the dominant tribe will control
the AC, and other communities will face real or perceived discrimination, and iii) lead
to violent inter-ethnic conflicts.
2. Hill District Councils in Manipur
The Autonomous Council of Manipur has been established by the Manipur (Hill
Areas) District Council Act, 1971. According to the Act, all the hill areas of Manipur
were to be divided into six Autonomous Districts, each with a district Council. These
Councils are:
1. Chandel Autonomous District Council,
2. Churachandpur Autonomous District Council,
3. Sadar Hills Autonomous District Council, Kangpokpi
4. Manipur North Autonomous District Council, Senapati
5. Tamenglong Autonomous District Council,
6. Ukhrul Autonomous District Council.
Each district Council has 24 members. Each District Council has an Executive
Committee which is constituted by a Chairman, Vice- Chairman and five other
members. The Chairman and the Vice-chairman of the District Council is the Ex-
officio Chairman and Vice-Chairman respectively of the Executive Committee and
five other Executive Members shall be nominated by the Chairman from amongst the
Members of the District Council.
These Councils enjoy executive powers under which they are looking after 26
different subjects like construction, repair and maintenance of roads, bridges,
channels and buildings; establishment, maintenance and management of schools up to
Class VIII; establishment, maintenance and management of dispensaries and Primary
Health Sub-Centers, water supply and sanitation schemes; construction, repair and

84
maintenance of embankments, and the supply, storage and control of water for
agricultural purposes including irrigation schemes, preservation, reclamation and
conservation of soil, animal husbandry and veterinary dispensaries, etc. However, the
Manipur District Council Act, 1971 did not confer any legislative powers on the
District Council although the Council can recommend legislations on matters
concerning Scheduled Tribes such as the appointment or succession of chiefs,
inheritance of property, marriage and divorce and social customs. The Manipur
District Council Act, 1971, also granted financial power to these District Councils.
Under these provisions, the Council can levy taxes on professions, trades and
employment, on animals, vehicles and boats, on the entry of goods into the market for
sale and goods carried in ferries, on the maintenance of schools, dispensaries or roads
and any other tax falling under list II of the Seventh Schedule of the Constitution
which the Manipur legislature may, by law, empower the District Council to levy.
However, the Council exercises only nominal judicial power, which lies primarily in
the hands of the State Government.
4.6.3 Scheduled Tribe Development Councils
There are also Tribe Development Councils in parts of the Northeast. These are:
1. Barak Valley Hills Tribe Development Council
2. Amri Karbi Development Council
3. Mech Kachari Development Council
4. Sarania Kachari Development Council
4.7 Ladakh Autonomous Hill Development Council (Leh and Kargil)
Ladakh, a region located in the Northeastern part of the State of Jammu and Kashmir,
is a space known more for its magnificent beauty and inhospitable terrain and less for
its strong movements for autonomy and self-rule. This long-standing demand was
partially fulfilled in 1995 with the passing of the Ladakh Autonomous Hill
Development Council Act which allowed for a measure of autonomy within the
Indian State with the Darjeeling Gorkhaland Hill Council set up in 1988 as a model.
The initial demand of some Ladakhi activists was, however, for Union Territory (UT)
status which was denied – although the call for UT status remains a key electoral
issue. The passing of the Act marked the culmination of Ladakhi assertions of
autonomy that date back to the 1940s when debates about acceding to the Indian
nation-state were rife but these protests escalated in 1989, under the Ladakhi Buddhist
Association.
The region of Ladakh is divided into two districts: Leh and Kargil. In the course of
Ladakhi protests for autonomy and development, the Indian government granted
almost the entire population of Ladakh Scheduled Tribe status in 1989. A total of

85
eight communities were included within the list of Scheduled Tribes. According to the
2001 census, among the two districts of Ladakh, Kargil (88.3 per cent) has the highest
proportion of Scheduled Tribes to the total population followed by Leh (82 per cent).
The Bot tribe is the largest tribe in the Leh district while the Balti and Purigpa tribes
are concentrated in Kargil district. Islam is the predominant religion of the STs (86.3
per cent) in the larger State of Jammu and Kashmir followed by Buddhist (9.3 per
cent) and Hindu tribes (4.3 per cent). A majority of the Gujjar, Bakarwal and Brokpa
tribes are Muslim while the Bot are primarily Buddhist and the Gaddi mainly
followers of the Hindu religion. Within the Ladakh region, the Leh district is largely
Buddhist with a substantial Muslim minority and Kargil district is dominated by Shia
Muslims with a Buddhist minority. As part of the 1995 Act, separate Autonomous
Councils were to be formed for the districts of Leh and Kargil.
The ‘Reasons for Enactment’ section of the law reads as follows:
“Ladakh region is geographically isolated with a sparse population, a vast area and
inhospitable terrain which remains landlocked for nearly six months in a year. Consequently,
the people of the area have had a distinct regional identity and special problems distinct from
those of the other areas of the State of Jammu and Kashmir. The people of Ladakh have, for a
long time, been demanding effective local institutional arrangements which can help to
promote and accelerate the pace of development and equitable all-round growth and
development having regard to its peculiar geoclimatic and locational conditions, and
stimulate fullest participation of the local community in the decision making process. It is felt
that decentralisation of power by formation of Hill Councils for the Ladakh Region would
give a boost to the developmental activities in Ladakh and meet the aspirations of the people
of the said Region. The present measure is enacted to achieve the above object.”
(LAHDC Act 1995. Gazette of India, May 9, 1995, p.19)
As a result, powers relating to the planning and implementation of development were
transferred from government control at the Central and State level to the local district
level Council.
Initially, only Leh district opted to form the Council and the Kargil district declined
the offer. The first Council for Leh district was sworn in on September 3, 1995. In
2003, Kargil district held elections for appointment to its own Hill Development
Council. The Act provides for 30 seats in total for the Council, of which twenty-six
seats are filled through elections held on the basis of adult franchise from demarcated
constituencies and the remaining four seats are to be filled by persons nominated by
the Governor from among the main minority groups (Muslims in the case of Leh) and
women. Members of the Council are to meet at least once every year. The Council
must elect from among its members a Chief Executive Councillor who chooses four
Executive Councillors, and together this group of five constitutes the executive body
of the Council. Again, one of the four Councillors must be drawn from among the
principal minorities.
The powers and functions of the Council include:

86
Allotment, use and occupation of land vested in the Council (i.e. all
‘wasteland’, excludes land classified as forests)
Formulation and review of progress of development programmes for the
district
Formulation of the budget for the district
Formulation of guidelines for implementation of schemes at the grassroots
level;
Promotion of languages and culture of the area
Management of un-demarcated forests and canals or water courses for
agriculture;
Tourism planning, promotion, and development
Vocational training
Preservation of the environment and ecology of the area
Rights to levy and collect local taxes and fees, including on grazing, business,
transport, entertainment, etc. (note, however, that there is no specific mention
of tourism, one of the central planks of the economy).
Power to hire and fire public servants except for the very highest ranks; all
government employees (except in the judiciary and police) are “transferred” to
the Council, although the government retains its discretion to recall them.
Clearly, considerable powers have been devolved to the local District Councils which
give voice to the peoples’ longstanding aspirations for powers of autonomous
decision-making on questions of cultural preservation, environmental protection, and
development planning. At the same time, there are several shortcomings in the law
itself as well as gaps in its implementation which have resulted in considerable
disenchantment with the working of the Councils over the past twenty years.
Some of the central drawbacks highlighted are:
1. Even though the Council has the power to draw up budgets and development
plans, these still require the approval of the State Government prior to
implementation. Further, these plans can only be formulated within the
principles of the National and State-level Five Year Plans. Together, these
impediments imply that centralized structures continue to prevail as the State
and National Governments have the power to reject or amend the Council’s
programmes. In the 1997-98 budget, the Leh Council requested the
government for 36 crore rupees in its budget but was only given 27 crores
initially and later an additional five crore which still did not meet its
requirements for the year.34
34 Martijn van Beek., ‘Hill Councils, Development, and Democracy: Assumptions and Experiences from Ladakh’, Alternatives:
Global, Local, Political, Vol. 24, No. 4 (Oct.-Dec. 1999), pp. 444.
87
2. A large part of the funds for the functioning of the Council flow through the
State Government which has often delayed the release of funds, thus
effectively putting a halt to most of the Council’s activities.
3. Members of the Council are representatives of various mainstream political
parties. Therefore, when members of a particular party form the majority in
the Council but are the oppositional party at the level of the State Government,
the Council is side-lined and various obstacles to its functioning are created by
the State administration and the government in power. Thus, the effectiveness
of the Council is shaped by the National and State political interests of the
day. The Ladakh region, having a sparse population and only one Lok Sabha
seat, is often viewed as marginal within the framework of electoral politics
and hence, ignored by successive governments at the State and Centre.
4. The Leh Council has also borne witness to struggles between the Council
members and the administrative structure regarding issues of rank, privileges
and powers.
5. At the local level, much resentment has arisen from the perceived domination
of the Council by members of the former nobility, elites working with various
non-governmental organizations, and people from Leh town. The latter has
occurred even despite attempts to ensure only locals represent the various
constituencies.35 Some of the decisions implemented by the Leh Council have
not resonated with the local people such as making it compulsory for school
children to wear the traditional dress or enforce building codes in the area.36
6. It has been argued that the structure of the Council further entrenches
communal identities through the creation of separate Councils for the Leh and
Kargil districts (on the assumption that territory is equivalent to community),
while ignoring the important linkages between communities as well as
divisions of gender, class, and so on within communities.
The devolution of power does not, therefore, lead to the empowerment of local
communities in any automatic or linear way. The Autonomous Council model in
general, does not offer genuine financial autonomy on which political autonomy can
be founded. There is a huge discrepancy between the formal rules guaranteeing
autonomy and the informal workings of autonomy on the ground. The Councils
continue to be heavily dependent on a centralised executive and bureaucratic structure
which hamper smooth and independent working of the Councils. Moreover, the
powers given to the Councils are limited in several respects such that they are
transformed into implementation agencies for development programmes rather than
autonomous decision-making bodies. More specifically, the political economy of
Ladakh is such that the local people have become heavily dependent on external
forces on account of the government policies of encouraging tourism and cash
35 Martijn van Beek. “Beyond Identity Fetishism: “Communal Conflict” in Ladakh and the Limits of Autonomy” Cultural
Anthropology, Vol. 15, No. 4 (Nov. 2000), pp.545. 36 Martijn van Beek. “Hill Councils, Development, and Democracy: Assumptions and Experiences from Ladakh”, Alternatives:
Global, Local, Political, Vol. 24, No. 4 (Oct.-Dec. 1999), pp. 449.

88
cropping, providing huge agricultural subsidies and rations (Ladakh is also a strategic
border area, sharing boundaries with both Pakistan and China).
Further, while territorial autonomy is essential, there are dangers that this model may
contribute to discrimination against minority communities through the creation of
exclusive spaces for the numerically dominant community within a region. Even
within a single community, as can be seen in the Ladakh case, the Councils have been
captured by elite groups who have often implemented their own agenda for the region.
4.8 Overall Assessment of the Autonomous District Councils under Sixth
Schedule
After the creation of full States comprising Sixth Schedule areas – such as in Mizoram
and Meghalaya – some commentators have questioned the need for these provisions.
In Meghalaya, the State Government has held the view that that these Councils ought
to stick to their traditional role, which is to protect tribal culture, land and identity and
refrain from engaging in developmental activities. In many cases, State Governments
have deliberately impeded the functioning of the Councils, particularly through
blocking the flow of funds to them. One of the serious limitations of the Sixth
Schedule has been the fact that the powers given to the Councils to make legislation
and implement development programmes have not been matched with the financial
autonomy to follow this through. As a result, ADCs often have to depend on funds
from the Central and State Governments (routed through the State Government)
which are often antagonistic toward the work of the ADC. Apart from government
sources, the Autonomous District Councils receive a small amount from the collection
of taxes and land revenue. In many States, the issue of financial resource allocation
has become a major bone of contention between the State Government and the ADCs.
In Meghalaya, even the salaries of primary school teachers could not be paid regularly
because of non-receipt of funds. In this case, the government claimed to have
withheld the funds since the ADC in question, the Khasi Hills Autonomous District
Council, was engaged in corrupt practices.37 Further, there is a large gap between the
approved budget and the flow of funds from the State Government to the Council,
which adversely affects both the planning and the execution processes. This is in
sharp contrast to arrangements made for Panchayats, which have been provided with
their own Finance Commission which is empowered to periodically review the
financial position and lay down appropriate principles of allocation of resources
between the Panchayats and the State.
In Mizoram, the situation is somewhat different since the three ADCs in the State
cover only 15 per cent of State’s population (the dominant majority are Mizos). Thus,
these Councils do not receive sufficient attention from the State Government. The
37 Tiplut Nongbri, Democracy, Gender and Tribes: A Critical Appraisal of India's Constitutional Policies, Indian Anthropologist,
Vol. 31, No. 2, 2001, pp. 4.

89
tribal communities have constant frictions, which adversely affect administration and
developmental activities. In fact, between the years 1986 and 2000, there have been
21 resolutions submitted in the Mizoram Legislative Assembly demanding the
abolition of the Chakma Autonomous District Council.38 The Karbi Anglong ADC
was dissolved four times between 1988 and 1998.
Furthermore, the structure of the Sixth Schedule is such that the autonomy of the
ADCs is seriously restricted in several respects. For example, in Meghalaya, the
autonomy of the ADC has been curtailed through the insertion of paragraph 12 A into
the Constitution which states that all legislations passed by the State Government take
precedence over those passed by the Councils. The powerlessness of the ADC is clear
if one examines the issue of regulation of forests – one of the most important subjects
entrusted to the ADC. Following a Supreme Court order in 1995-96 in the
Godavarman case, felling of timber in private forests was banned irrespective of
ownership status in Meghalaya. All forest-related activities could only be carried out
as per the Working Plan duly approved by the Forest Department, thus completely
bypassing the jurisdiction of the ADCs. Many of the functions of the ADCs are being
taken over by the State Governments – in Mizoram as well as the Garo Hills,
executive and judicial functions have been taken over by the Deputy Commissioner
and District Magistrate, thus rendering the ADC redundant. The Commissioners
coordinate development programmes and process legislation, making them extremely
powerful at the district level. All the activities and departments under the control of
the Councils as per the provisions of the Sixth Schedule have not yet been transferred
to them and neither have parallel institutions such as the District Rural Development
Agencies (DRDA).
The matters over which the ADCs have powers do not cover the entire gamut of
issues pertinent to the creation of genuine autonomy. Thus, control over primary
schools, markets, agriculture, forests and so on is necessary but not sufficient for
tribal groups to preserve their identities and ensure the development of their districts
and regions.
Considerable powers have been handed over to the Governor even in the Sixth
Schedule areas which can impede the autonomous functioning of the ADCs. The
Governor has the power to decide whether laws made by the State Legislature, on
matters other than those over which the ADC has legislative powers, will apply to the
Autonomous Districts. The decision regarding applicability of laws made by
Parliament in Sixth Schedule areas is made by the Governor in the case of Assam and
the President of India in the case of other Northeastern states. Moreover, all
legislation passed by the ADCs requires the assent of the Governor to become law.
The Governor also has the power to dissolve the ADC.
38 Subir Bhaumik and Jayanta Bhattacharya, Autonomy in the Northeast: The Hills of Tripura and Mizoram, in Ranabir
Samaddar (ed.) The Politics of Autonomy: Indian Experiences, New Delhi: Sage Publications, 2005.

90
There is a significant degree of variation in the functions devolved to various
Autonomous Councils. For instance, the Bodoland Territorial Council has more
power and departments compared to other Autonomous Councils of the Northeast,
though the latter have been in existence for several decades more. This situation has
resulted in other areas demanding greater powers and autonomy.
There is also no mandatory time limit for the reconstitution of the ADC once it is
dissolved, and hence election is indefinitely postponed. Constitutionally, the
Autonomous District Council should have its own Autonomous Agency, similar to
the Election Commission of India or the State Election Commission to conduct the
elections to the Autonomous Councils. But the Rules of 1951 empowered the State
Government to conduct the Council elections through the Hills Area Department of
the Assam State Government, a rule which works against the proper functioning of
the Sixth Schedule.
While the Seventy-Third Amendment to the Constitution provides for the reservation
of one-third of all Panchayats seats at all levels for women, the Councils, unlike
Panchayats, do not have any provision for such reservation. In fact, both the Fifth and
Sixth Schedules have been silent on the issue of women’s representation and gender
justice. As a result, women are almost completely absent from the bodies and
institutions created under these provisions. It has been found that only the Bodoland
Territorial Council and Autonomous District Councils of Mizoram have a system of
reservation of seats for women, although the proportion of reserved seats is very
small. The Autonomous District Councils of Mizoram have amended their laws
relating to Village Council and District Council and decided to reserve at least one
seat in every Village Council for women and two nominated seats of the District
Council for women. Reservation of a certain number of seats for women
representatives in the ADCs must be made mandatory in order to end the exclusion of
women from these political institutions. Further, while the Sixth Schedule aims to
ensure the protection of customs as well as social and religious practices of tribes, it is
necessary to keep in mind the implications of this protection for gender justice. Even
though protecting tribal culture is a vital task and central to the objectives of the Sixth
Schedule, this is not incompatible with equality and fairness.
Another important issue to be addressed is the question of representation of minority
groups within the Councils. Even those groups which are indigenous to the region –
such as smaller tribal groups – do not have any role in the ADCs, a situation which
must be rectified. The population composition has changed everywhere over the
decades. This demographic change is no longer reflected in the representative
structure of the ADCs. Unless reviewed comprehensively, the Sixth Schedule could
become one of the chief sources of future conflicts in the region.
Whereas the Sixth Schedule provisions have many positive features and tribes coming
under the purview have done well, there are certain other structural constraints which

91
have not allowed the Council to function as effectively as it should have been. Some
key constraints as pointed above are non-transfer of departments to Autonomous
Councils, lack of funds available with the Council, absence of provision for women
and smaller tribal groups’ participation in Councils which need to be suitably
addressed to ensure its more vibrant functioning.
On comparing the Fifth and Sixth Schedules, it is apparent that the provisions of the
Sixth Schedule have given greater powers of political autonomy to the tribes of the
Northeast, as was the intention of the Constituent Assembly. On examination of the
working of the provisions of the Fifth Schedule, it has become clear that the
institutional mechanisms for the protection of tribes living in Scheduled Areas have
failed to meet its stated goals and is in need of serious review. The Governor as well
as the Tribes Advisory Councils have not been performing their constitutionally
assigned roles in spirit and have failed to adequately represent the interests of tribal
communities. However, several clauses of the Provisions of Panchayats (Extension to
Scheduled Areas) Act, 1996 and the Forest Rights Act provide for the enlargement of
territorial rights and autonomy for Scheduled Tribes which must be fully
implemented. On the other hand, while the provisions of the Sixth Schedule are
extremely commendable, the workings of the Autonomous Councils, as has been
demonstrated above, has been far from perfect and several aspects of their functioning
– most notably, issues of financial and administrative autonomy, freedom from
arbitrary government intervention, checks against ethnic sectarianism, greater
representation for smaller tribes and women, and so on.
A restructuring of these institutional frameworks will go a long way in addressing the
inequality, dispossession and injustice faced by tribal groups since self-governance,
protective mechanisms, political representation and autonomous decision-making are
critical components within the project to improve the socio-economic status of tribes.
4.9 Recommendations
1. During the colonial period, tribal communities inhabited areas were divided into
‘excluded’ and ‘partially excluded’ areas for purpose of administration. Such
administrative arrangements have found continuation in post-independence India in
the form of Sixth and Fifth Schedules of the Constitution. Laws enacted by the
Governor-General in Council or Governor in Council were not automatically
applicable in these areas in colonial India unless Governor General or Governor
thought otherwise. In post-Independence India, this legal provision has been
continued in Sixth Schedule Areas, but not in Fifth Schedule Areas. Thus, laws passed
by the Parliament or State Legislature are not directly applicable in Sixth Schedule
Areas unless the Governor thinks it desirable. In the Fifth Schedule Areas, laws
passed by these bodies are automatically applicable, unless the Governor thinks it to
be not in the interest and welfare of the tribal communities of the State. There have
92
been laws and policies passed by the Parliament and State Legislatures such as the
Forest Conservation Act, 1980, the Wildlife Protection Act, 1972, the Panchayat Acts
(prior to the passing of the 73rd Amendment in 1992), and so on which have had an
adverse and detrimental impact on tribal communities. Yet the Governors have not
exercised their constitutional power towards the protection and welfare of the tribal
communities. This opens up two possibilities:
(i) Laws and policies enacted by the Parliament and State Legislatures should
not be automatically applied in the Fifth Schedule areas (as was the case under
colonial rule or as is presently the case in the Sixth Schedule areas). Its
applicability should be made contingent on the discretion of the Governor who
would determine its applicability or non-applicability or applicability with
modifications/amendments on the advice of Tribes Advisory Council and
issue a Statement of Objectives and Reasons for decisions on both
applicability and inapplicability of laws and policies.
(ii) In case the above is untenable, the Governor should be mandated to take
the advice of the Tribes Advisory Council and examine legislations and
policies (particularly, though not exclusively, those pertaining to issues such
as forests, land acquisition, conservation, mines and minerals, health and
education) passed by the Parliament or State Legislatures and the implications
of the same on tribal welfare. A mechanism for such examination and action
should be clearly stated and established.
2. Actions taken by the Governor for safeguarding the interests of tribal communities
should be clearly mentioned in the annual Governor’s Reports submitted to the
President. The Governors must be mandated to ensure the timely submission of these
reports. To this end, the Governor’s office must be adequately assisted by specially
set up competent and dedicated team in the form of Governor’s Cell for Scheduled
Tribes (as has already been initiated in some States).
3. The Tribes Advisory Council is an integral part of the administrative structure of
the Fifth Schedule. Currently, the TAC consists of 20 members, of which two-thirds is
comprised of elected members in the State Legislature belonging to the Scheduled
Tribes. The rest are nominated members who generally tend to be government
officials working in Ministries and Departments associated with tribal development.
In this regard, we recommend that:
(i) There needs to be a radical restructuring of the composition of the TAC.
Instead of two-thirds elected members from the State Legislature, this should
be restricted to half the members of the TAC. Moreover, these elected
representatives must come from different political parties, rather than only
from the ruling party. The remaining one-half should be comprised of
Chairpersons of the district Panchayat bodies (or chairpersons of the

93
Autonomous Council, wherever established) of the Scheduled Areas on a
rotational basis.
(ii) Tribes Advisory Council should be empowered, made active and
responsible for the tribal affairs in the State through the following measures:
The scope and responsibilities of TAC should be widened to transform
it into the Tribes Advisory, Protective and Developmental Council.
Constitutional provisions, laws, policies, and administrative matters
pertaining to the Scheduled Tribes must come under its ambit.
The tribal development plan of a State and its outlay should be
approved by the TAC before it is placed before the Legislative
Assembly.
In view of the serious responsibility placed on the TAC, it should be
made compulsory for the Council to meet at least four times a year.
The Tribal Welfare Department should be made accountable to the
TAC. It should present its annual plan, budget and performance report
to the TAC and receive its approval for the next year.
The agenda for the TAC meetings should be prepared through due
consultation with the members.
The Governor should be made responsible for the overall functioning
of the TAC.
4. The provisions of the Sixth Schedule provide considerable space for autonomy and
self-governance. Through the Autonomous Councils, tribals have the opportunity to
enact legislations, execute programmes and adjudicate at a scale larger than their
individual villages. Such a provision has helped tribes of the Northeast to protect their
habitat, land, forests, natural resources, culture and identity. They have not
experienced displacement and land alienation on the scale that tribes in ‘mainland’
India have. In view of these powers of political autonomy, the tribal communities in
the Northeast region have fared much better in respect of socio-economic, educational
and health status.39 In contrast, the tribes in mainland have fared miserably in all these
spheres. Hence, there is an urgent need for extending the pattern of the Sixth Schedule
in the form of Autonomous Councils in the Fifth Schedule areas as has been provided
for in the Provisions of Panchayat (Extension to Scheduled Areas) Act, 1996. The
specific provision notes that, “the State Legislature shall endeavour to follow the
pattern of the Sixth Schedule to the Constitution while designing the administrative
arrangements in the Panchayats at district levels in the Scheduled Areas”.
This pattern would provide tribal areas with an institutional structure that mediates
between the State Government and hamlet-level Gram Sabha. There are various forms
39 There are several other reasons for this situation, most importantly, the relative homogeneity of the population in Northeastern
states, a tribal majority in many states and a history of missionary activity. However, the provisions of the Sixth Schedule have
also made a significant contribution.

94
of Autonomous Councils in the Sixth Schedule areas. These are represented by
Meghalaya, Mizoram, Tripura and Assam. On the question of which pattern would
best suit the ‘mainland’ tribal regions should be seriously deliberated and worked
upon by the States with Fifth Schedule areas.
5. There are a large number of States wherein tribes form a sizeable population in
blocks or villages, for example, in States like West Bengal, Kerala, Tamil Nadu,
Karnataka, Goa, etc. Tribal areas in these States must be brought under the ambit of
Scheduled Areas.
6. There are various impediments to the smooth and inclusive working of the
Autonomous Councils in Sixth Schedule areas which must be addressed. In order to
do so, we propose the following:
Autonomous Councils must be covered under State Finance Commission that
is empowered to review periodically the financial position and lay down
appropriate principles of resource distribution between State and the
Autonomous Council. Funding should not be left to arbitrary discretion of the
State Governments.
The ADC should be reconstituted within six months of its dissolution.
There should be provision for reservation for tribal women (one-third) as well
as smaller tribal groups in the ADCs and other political institutions.
Traditional political institutions at the village/hamlet level should be formally
recognized by the State.

95
5. Livelihoods and Employment Status
5.1 Introduction
Traditionally, the tribes in India pursued an economy, which was closer to nature, and
used indigenous technology. This is reflected in their dependence on forests and other
natural resources available in their habitat. This does not mean that the traditional
tribal economy, was in any way, monotonous. While some tribal communities have
adopted a way of life, similar to the neighboring non-tribal communities, there are
other tribal groups, whose livelihoods are characterized by (a) forest-based
livelihoods, (b) pre-agriculture level of technology, (c) a stagnant or declining
population (d) extremely low literacy and (e) a subsistence level of economy. A
variety of economic activities were pursued by the tribes of India, depending on the
availability of resources in their respective habitats.
5.2 Traditional Economy and Livelihoods
In a study on traditional economic activities pursued by the tribes of India, Vidyarthi
and Rai,40 have delineated the following categories:
i) Hunting,
ii) Hill-cultivation,
iii) Plain agriculture,
iv) Simple artisan,
v) Pastoral and cattle-herding,
vi) Folk-artists, and
vii) Agricultural and non-agricultural labour.
Traditional tribal economy was largely a combination of several types of activities.
For example, hill cultivators and plain agriculturists, were also occasionally hunting
and gathering to supplement their income. Similarly, pastoralists were engaged in
agriculture to meet their basic food requirements. Therefore, the above typology of
economy is only indicative of the main activities.
However, hunting and foraging have been the main sources of traditional livelihoods
for several tribes, including the Birhor, the Hill Kharia, the Pahariya, the Birijia, the
Korwa, the Chenchu, the Kurumba, the Paliyan, the Kadar, the Jarawa, the Onge
andthe Sentinelese. With reduced forest cover and implementation of Wildlife
Protection Act, hunting and foraging are on the decline among these tribes.
40 Vidyarthi, L.P. and B.K. Rai. 1985. The Tribal Culture of India. New Delhi: Concept Publishing Company.

96
Hill cultivation, variously known as shifting cultivation, slash-and-burn cultivation, is
popularly known as podu or jhum among the Indian tribes. Tribal people inhabiting
the hills of Assam, Meghalaya, Manipur, Tripura, Odisha, Andhra Pradesh, Madhya
Pradesh and Chhattisgarh engage in hill cultivation. The Garo, the Tripuri, the
Chakma, the Mog, the Naga, the Maler, the Hill Kharia, the Juang, the Paudi Bhuyian,
the Koya, the Konda Reddi, the Baiga, the Maria Gond and many other tribal
communities continue to practice hill cultivation. However, this is also in decline, due
to land shortage and increase in population. In addition, the Government policy,
dissuades the tribes from practicing shifting cultivation.
Plain land agriculture is the means of livelihood for most of the tribes, even though it
is not highly productive. The Khasi and Jaintia, the Khasa and Tharu, the Kinnaur,
the Bhumij, the Kora, the Bhuyian, the Santal, the Munda, the Ho, the Oraon, the
Baiga, the Gond, the Mina, the Garasia, the Bhil, the Warli and the Thakur are plain
land agriculturists.
A number of tribes subsist on crafts and cottage industries like basket and rope
making, tool making (iron and wooden), spinning and weaving, metal work, iron
work, etc. The Gujjar and Kinnaur (wood work), the Irula, Thoti, Kanjar and Kolam
(basket and rope making), the Lohar and Karmali (iron agricultural implements), the
Chik-Barik (hand woven cloth), the Mahali (basket and bamboo products), the
Godulia Lohar, Mahali, Asur and Agaria (iron smith) and many other artisan groups
largely manage their livelihoods as crafts persons.
The Toda, the Gujjar, Bakarwal and Gaddi, the Golla, Kuruba and Lambada, the
Kisan and Nagesia, the Rabari and Sansi, etc. are pastoralists and animal husbandry is
their main occupation. Decrease in pastures and sedentarisation have resulted in loss
of pastoralism and animal-breeding among these tribes.
There are certain tribes in India, which depend upon folk arts such as singing, barding
and dancing, other activities such as tattoo-making, acrobatics and magic/trickery.
Tribes namely Nat and Sapera, Kela, Pradhan and Ojha, Madaria, Pamula and Garadi
are specialists in various folk arts.
Several landless and marginal tribal households are engaged as agricultural labour.
With the opening of mines and industries in tribal inhabited regions, tribes in the
surrounding areas have taken up non-agricultural labour as the primary source of
livelihood. Some tribes from Jharkhand and Chhattisgarh have migrated to the tea
estates in Northeast India and to Andaman and Nicobar Islands, in search of unskilled
employment.
97
In the pre-independence period, tribes from Jharkhand, Odisha and Chhattisgarh, such
as the Munda, the Oraon, the Santhal and others had migrated to the sprawling tea
gardens of Assam as indentured labour. In post- independence era, they are not
included in the list of Scheduled Tribes in Assam. They are among what are popularly
called the “Tea Tribes”, numbering about 60 lakhs. They have been marginalised due
to centuries of exploitation and denial of their basic rights.
Over the decades, the tribal economy and the livelihood strategies have undergone
substantial changes. Since the tribes were traditionally dependent on natural
resources, the change was all the more visible due to the depletion of resources. In
post-independence period, the rapid phase of urbanization and industrialization
alienated the tribes from their traditional natural resource base and forced them to
search for newer livelihood options. Increase in population among some tribes, lower
availability of food and alienation from natural habitats, made the tribes dependent on
urban markets. Many of them left their homes and migrated to urban areas, in search
of income and employment. As a result, the already vulnerable tribes were exposed to
all kinds of exploitation and marginalization in the new, unfamiliar urban space.
Those who continued to live in their original habitats diversified their occupations to
ensure their sustenance.
The shift in tribal economy and diversification of occupations has been corroborated
in the People of India report by the Anthropological Survey of India. The report
maintains that “… the number of communities practicing hunting and gathering has
declined by 24.08 percent, as forests have disappeared and wildlife has diminished.
Ecological degradation has severely curtailed the related traditional occupations. For
instance, trapping of birds and animals has declined by 36.84 percent, pastoral
activities by 12.5 percent, and shifting cultivation by 18.14 percent. However, there is
a rise in horticulture (34.4 percent), terrace cultivation (36.84 percent), settled
cultivation (29.58 percent), animal husbandry (22.5 percent), sericulture (82.6
percent), and bee-keeping (60 percent). Many of the traditional crafts have
disappeared and spinning, in particular, has suffered (25.58 percent). Related
activities such as weaving (3.32 percent), dyeing (33.34 percent) and printing (100
percent) have similarly suffered. Skin and hide work as also stone carving has
declined.”41
The report further states that, in tribal areas “...business has gone up by 77.46 percent,
trade by 42.14 percent and industry by 100 percent. There is a sharp rise in the
number of Scheduled Tribes employed in Government and private services, self-
employment, etc. The number of Scheduled Tribes employed in mining and masonry
(60 percent) has gone up steeply which suggests a new mobility.”42
41 Singh, K.S. 1997. The Scheduled Tribes. New Delhi: Anthropological Survey of India. 42 Ibid

98
Figure 5.1: Change in Occupations among Scheduled Tribes
Source: Census of India, 1981
The national agencies entrusted with the responsibility of collecting and analyzing
data on Scheduled Tribes of India, like the Census of India and the NSSO focused on
categorizing occupations as cultivators, agricultural labourers and other non-farm
workers (which includes workers of all kinds). Enumeration of Scheduled Tribe-
specific occupations is not carried out and hence observing changes and shifts in the
occupation patterns over time among tribes is difficult.
5.3 Land Ownership
The data on Household Ownership Holdings (HOH) with respect to different social
groups, obtained through the 59th round of survey by the NSSO (Table 5.1), reveals
that the percentage share of HOH among Scheduled Tribes compared to an all-India
average is slightly better. When the average area owned per household in India is
0.563 hectare, it is 0.708 for Scheduled Tribes. In rural areas also, while the all-India
average of land owned per household is 0.725 hectares, the Scheduled Tribes owned
0.767 hectares per HH. In urban areas also the trend is similar, as Scheduled Tribe
households own an average of 0.145 hectares of land, which is higher than the all-
India average of 0.130 hectares.
Table 5.1 also indicates that even the relation between percentage of Scheduled Tribe
households and proportion of land owned by them is in favor of Scheduled Tribes. It
is observed that about 8.46 percent of Scheduled Tribe households own 10.65 percent
of land, both rural and urban combined. In rural areas, 10.55 percent of Scheduled
Tribe households own 11.15 percent of land, while in urban areas, 2.91 percent of
Scheduled Tribe households own 3.25 percent of land. This clearly indicates that
Scheduled Tribe households own comparatively more land than others at all levels
including rural, urban and rural-urban combined (Figure 5.2).

99
Thus, in respect of Scheduled Tribes in 2003, the land ownership and the intra-class
concentration ratio was not adverse (the share of area being higher than the share of
holdings) in comparison to all social groups, and their average size of area owned was
higher than that of all groups. This may be due to the restrictive land transfer
regulation legislations, applicable to the Scheduled Areas in different states.43
However, it must be noted that alienation of tribal lands may not be fully reflected in
the records. Hence, there may be a discrepancy between land ownership on record and
actual land ownership of tribal people.
Historically Scheduled Tribes had a customary ownership over forest as well as land
closer to their settlements. Since reclamation of forest did not warrant permission
from authorities, Scheduled Tribe households reclaimed forest land as per their
requirements. Therefore, it is not unusual for the Scheduled Tribe households to own
more land as compared to other social groups.
Figure 5.2: Distribution of Land Ownership
(Average Area (hectares) owned per Household among Scheduled Tribes and
All)
43 For example, in Andhra Pradesh, the AP Scheduled Areas Land Transfer Regulation (APSALTR) Act of 1959 and the amended
enactment (LTR, I of 1970), provided that the non-STs could transfer their lands only to STs or to the government, but could not
sell them to other non-STs.

100
Table 5.1: Distribution of Land Ownership among Scheduled Tribes and All,
2003
S.No. Item
Scheduled
Tribe All Others
Rural Households
1 Estimated No. of households (in 000) 15592 147838
2 Percentage of households 10.55 100.00
3 Total Area of Land (in 000 ha) 11952 107228
4 Percentage Area of Land Owned 11.15 100.00
5 Average Area (hectares) Owned per Household 0.767 0.725
Urban Households
1 Estimated No. of households (in 000) 1616 55508
2 Percentage of households 2.91 100.00
3 Total Area of Land (in 000 hectares) 235 7212
4 Percentage Area of Land Owned 3.25 100
5 Average Area (hectares) Owned per Household 0.145 0.130
All Households (Rural + Urban)
1 Estimated No. of households (in 000) 17208 203346
2 Percentage of households 8.46 100.00
3 Total Area of Land (in 000 hectares) 12187 114440
4 Percentage Area of Land Owned 10.65 100.00
5 Average Area (hectares) Owned per Household 0.708 0.563 Source: NSSO,, Household Ownership Holdings in India, 2003, Report No. 491(59/18.1/4), November 2006, p.23

101
5.3.1 Distribution of Ownership Holdings
This section presents the distribution of ownership holdings44 among the households
of Scheduled Tribes and all households at the National level. Table 5.2 gives details
of distribution of Households Ownership Holdings at all-India level among rural,
urban, and combined areas for Scheduled Tribes and all other groups for 2002-03.
In rural areas, a substantial proportion of Scheduled Tribes own very little land.
Among them, 12.81 percent of the households own only up to 0.002 hectares of land,
while the aggregate of all groups under this category is 10.0 percent. In the marginal
category, among Scheduled Tribes 63.16 percent of households own 26.96 percent of
land in rural areas. It shows that the marginal category among Scheduled Tribes is
less equitable45 than the all social groups. Significantly, the zero and marginal
categories together account for 75.97 percent among Scheduled Tribes, while it is
79.60 percent for all households. In small and above categories, the relative share of
area is greater than their respective shares of households for Scheduled Tribes in rural
areas.46
44 Zero category means the household that owns only up to 0.002 hectares of land. Marginal category is the one which holds land up to 1 hectares. This implies that the Marginal category is inclusive of the Zero category. The household under the Small
category owns land between 1 and 2 hectares. In Semi-medium category the household owns land between 2 to 4 hectares.
Medium category household owns from 4-10 hectares of land. The Large category owns land above 10 hectares. 45 The inter-category concentration ratio ({percentage area/percentage holdings}*100) measures the equitable distribution in
each category. If it is nearer to zero, it is more inequitable. Among Scheduled Tribes, it is 42.7 percent. 46 That is inter-class concentration ratios are higher than 100, showing skewed distribution, which is seen among small and
above classes.

102
Table 5.2: Distribution of Land Ownership Holdings among households of
Scheduled Tribes and All; Average Size by Major Classes - All-India
S.No. Size Class
Percent
Households
Percent
Owned area
Average area per HH
(Hectares)
ST All ST All ST All
Rural
0 Zero Class 12.81 10.00 0.00 0.01 0.00 0.00
1 Marginal 63.16 69.60 26.96 22.60 0.33 0.24
2 Small 14.21 10.80 25.18 19.95 1.36 1.37
3 Semi-Medium 7.31 6.00 24.57 21.41 2.58 2.64
4 Medium 2.20 3.00 15.37 22.72 5.35 5.60
5 Large 0.30 0.60 7.93 13.32 20.25 16.41
Total (Rural) 100.0 100.0 100.0 100.0 0.77 0.74
Urban
0 Zero-Class 54.50 48.60 0.06 0.09 0.00 0.00
1 Marginal 41.50 48.20 30.67 22.66 0.11 0.06
2 Small 1.90 1.50 18.40 17.29 1.44 1.37
3 Semi-medium 1.50 1.10 29.51 24.81 2.92 2.68
4 Medium 0.60 0.50 21.36 24.55 5.28 5.83
5 Large 0.00 0.10 0.00 10.60
12.59
Total (Urban) 100.0 100.0 100.0 100.0 0.15 0.12
Rural and Urban
combined
0 Zero-Class 16.73 20.52 0.01 0.01 0.00 0.00
1 Marginal 61.13 63.77 27.03 22.60 0.31 0.20
2 Small 13.06 8.27 25.05 19.80 1.36 1.37
3 Semi-medium 6.76 4.66 24.66 21.61 2.59 2.64
4 Medium 2.05 2.32 15.48 22.82 5.35 5.61
5 Large 0.27 0.46 7.77 13.16 20.25 16.19
Total (R+U) 100.0 100.0 100.0 100.0 0.71 0.57
Source: NSSO (2006), November, pp.A-15 and A-27
In the marginal category, the average area owned by Scheduled Tribes is 0.33
hectares, but it is only 0.24 hectares among all social groups. Among Scheduled
Tribes, the average area owned by small, semi-medium and medium holders, is
almost equal to that of the all social groups. Only among large holders, the average
size of land owned by Scheduled Tribes is higher than that of the all social groups.

103
Figure 5.3: Distribution of Ownership Holdings among households (percent)
in Rural Areas
In urban areas, 54.5 percent of Scheduled Tribes are in zero category, and 41.5
percent of them are in marginal category, whereas among all social groups 48.6
percent are in zero category and 48.2 percent are in marginal category. If we consider
zero and marginal categories together, 96 percent of Scheduled Tribes and 96.8
percent of all social groups falls under this group. Therefore, as far as the distribution
of ownership holdings are concerned, there is parity between Scheduled Tribes and all
social groups taken together.
Figure 5.4: Distribution of Ownership Holdings among households
(percent) in Urban Areas
In rural and urban areas combined, 16.73 percent of Scheduled Tribe households own
0.002 hectares of land, and 61.13 percent of them own up to two hectares, whereas
among all social groups, 20.52 percent of households are in zero category and 63.77
percent are in marginal category. Similarly when we consider zero and marginal
categories together, 77.86 percent of Scheduled Tribe HH’s and 84.29 percent of
households from all social groups fall in this category. Regarding average area per
household, among Scheduled Tribes it is nearly equal to that of all social groups,

104
except in case of large category of ownership holding. The trend appears to be similar
to other land ownership of other households in the rural areas.
Figure 5.5: Distribution of Ownership Holdings among households
(percent) in Rural and Urban Areas
5.3.2 Operational Holdings
For the calculation of Operational Holdings (OH), data from Agricultural Censuses is
used, as information on Scheduled Tribes is available for comparison with all-India
level data from the quinquennial survey of 1980-81 to 2010-11. The data are not on
the basis of households but on the basis of technical unit of operation, and if the joint
operational holdings are negligible, the Operational Holdings turns out to be on the
basis of Household Operational Holdings (HOH) (Table 5.3).

105
Table 5.3: Operational Holdings (Quinquennial) All-India Level
S.No Item 1980-81 85-86 90-91 95-96 2000-01 2005-06 2010-11
(i) No. and Area of Operational Holdings
Scheduled Tribes
1 Holdings ( '000) 6854 7648 8670 9523 9404 10343 11993
2
Operates Area ('000
hectares) 16704 17234 17909 17524 16525 16929 18294
3
Average area
operated (hectares) 2.44 2.25 2.07 1.84 1.76 1.64 1.53
All Social Groups
1 Holdings ( '000) 88883 97155 106637 115580 119931 129222 137757
2
Operates Area ('000
hectares) 163797 164562 165507 163355 159436 158323 159180
3
Average area
operated (hectares) 1.84 1.69 1.55 1.41 1.33 1.23 1.16
(ii) Percent Shares of No. and Area of Operational Holdings
Scheduled Tribes
1 Holdings (percent) 7.71 7.87 8.13 8.24 7.84 8.00 8.71
2
Operates Area
(percent) 10.20 10.47 10.82 10.73 10.36 10.69 11.49
All Social Groups
1 Holdings (percent) 100.00 100.00 100.00 100.00 100.00 100.00 100.00
2
Operates Area
(percent) 100.00 100.00 100.00 100.00 100.00 100.00 100.00 Source: Quinquennial Surveys of Agricultural Censuses in India, 1980-81 to 2010-11
Figure 5.6: Distribution of Large Land Holdings among households (percent) of
Scheduled Tribes and Total Population
Analysis of Table 5.3 reveals that from 1980-81 to 2010-11, the percentage share of
Operated Area (OA) for Scheduled Tribes is higher than the Operational Holdings
(OH). In 1980-81, the percentage share of OA was 10.2, which was higher than that
of OH by 2.49 percentage points. Similarly, the difference between the percentage
shares of OAs and OHs for 1985-86, 1990-91, 1995-96, and 2000-2001 were 2.6,
2.69, 2.49, and 2.52 percentage points respectively. However, the difference of

106
percentage shares between OAs and OHs for 2005-6 and 2010-11 have further
widened to 2.69 and 2.78 respectively. With regard to the percentage share of OHs as
well as OAs for Scheduled Tribes between 1980-81 and 1995-96, they have increased
consistently with a marginal decrease in 2000-2001 and 2005-06, but again rising
sharply in 2010-11, as evidenced from the Figures 5.7, 5.8 and 5.9.
Figure 5.7: Percent Share of Operational Holdings and Operational Areas
Figure 5.8: Percent Share of Operational Holdings and Operational Areas
among Scheduled Tribes

107
Figure 5.9: Operational Holdings
(Average area operated (hectares) among Scheduled Tribes and All
from 1980-81 to 2010-11)
The data from Agriculture Census indicates that the OHs and OAs decreased
marginally in 2000-01 and 2005-06, and increased in 2010-11, both for the Scheduled
Tribes as well as at the all-India level. This was due to the fact that, since the
formation of the State of Jharkhand in the year 2000, it was not included in the
agriculture censuses for 2000-01 and 2005-06. It was included in the agriculture
census of 2010-11 for the first time, for which there was rise in both OHs and OAs,
both for Scheduled Tribes and at all-India level. Jharkhand has a Scheduled Tribe
population of 86,45,042. In other words, it comprises of 26.20 percent of the total
population of the State or 8.29 percent of the total Scheduled Tribe population of the
country. Further, according to Dr. Vidya Dhar, DDG and Agriculture Census
Commissioner, in the State of Rajasthan, the OA increased as the Government of
Rajasthan distributed waste land (cultivable) among the landless households during
2010-11. The other reason attributed to the fluctuation in OAs, is due to the collection
of data in North East India on a sample basis and because of jhum cultivation in these
States.
As far as the average OAs is concerned, the Scheduled Tribes have larger OAs
compared to all social groups. For example, in 1980-81, while the Scheduled Tribes
had the average OA of 2.44 hectares, the average OA for all social groups was 1.84
hectares. Similarly, in 2010-11, the OAs for Scheduled Tribes and all social groups
were 1.53 hectares and 1.16 hectares, respectively.
Although Scheduled Tribes are better placed compared to all social groups with
regard to their possession of OHs and OAs, their access to cultivated land is on
decline over the years. This has been evidenced from the NSSO reports of 2004-05
and 2010-11. Table 5.4 reveals that while there is a percentage increase of Scheduled

108
Tribes who are landless and 0.40 hectares of ownership in zero and small categories,
there is percentage decrease in all other categories of landholdings from 0.41 hectares
to above 4 hectares during 2004 and 2010.
Table 5.4: Percentage Changes in Access to Cultivated Land by
Scheduled Tribes, 2004-2010
Source: Calculated from NSSO Report 516, 2004-05, p.70 and NSSO Report 543, 2010-2011, p.74.
5.4 Household Assets and Amenities
The assets possessed by households are used as indicators of their socio-economic
status. The data on household assets among Scheduled Tribes and all social groups is
obtained from the Census of India in 2001 and 2011 (Table 5.5 and Figure 5.10).
Among all social groups, the possession of radio/transistor and landline phone
decreased from 2001 to 2011.
The possession of TV’s, bicycles, scooter/motor-cycle/moped, and car/jeep/van
increased during the same period. In particular, among Scheduled Tribes, 21.77
percent possessed radio/transistor in 2001 and their share decreased to 13.96 percent
in 2011. But possession of TVs rose from 12.06 percent in 2001 to 21.51 percent in
2011. This trend of decrease in the share of radio/transistors and increase in the share
of TV’s indicate that the radio/transistors have been replaced by TVs.
With regard to possession of landline telephone among Scheduled Tribes, it decreased
from 2.51 percent in 2001 to 1.95 percent in 2011, but the possession of mobiles
among Scheduled Tribes was 30.81 percent in 2011. The possession of telephone
came down drastically among all social groups from 9.14 percent in 2001 to 3.93
percent in 2011, whereas the possession of mobiles was 52.45 percent in 2011.
State Class and Size of holdings (Hectare)
0.00 0.01-0.40 0.41-1 1-2 2-4 Above 4
Chhattisgarh -0.8 16.5 6.7 -3.2 15.8 -1.5
Jharkhand 8.2 -4.9 3.2 -7.7 0.9 0.3
Madhya
Pradesh
1.4 6.3 -2.8 -4.1 -0.1 -0.6
Odisha 1.5 8.8 6.5 1.4 -0.6 -0.7
All India 3.6 2.1 -1.7 -2.7 -0.6 -0.1
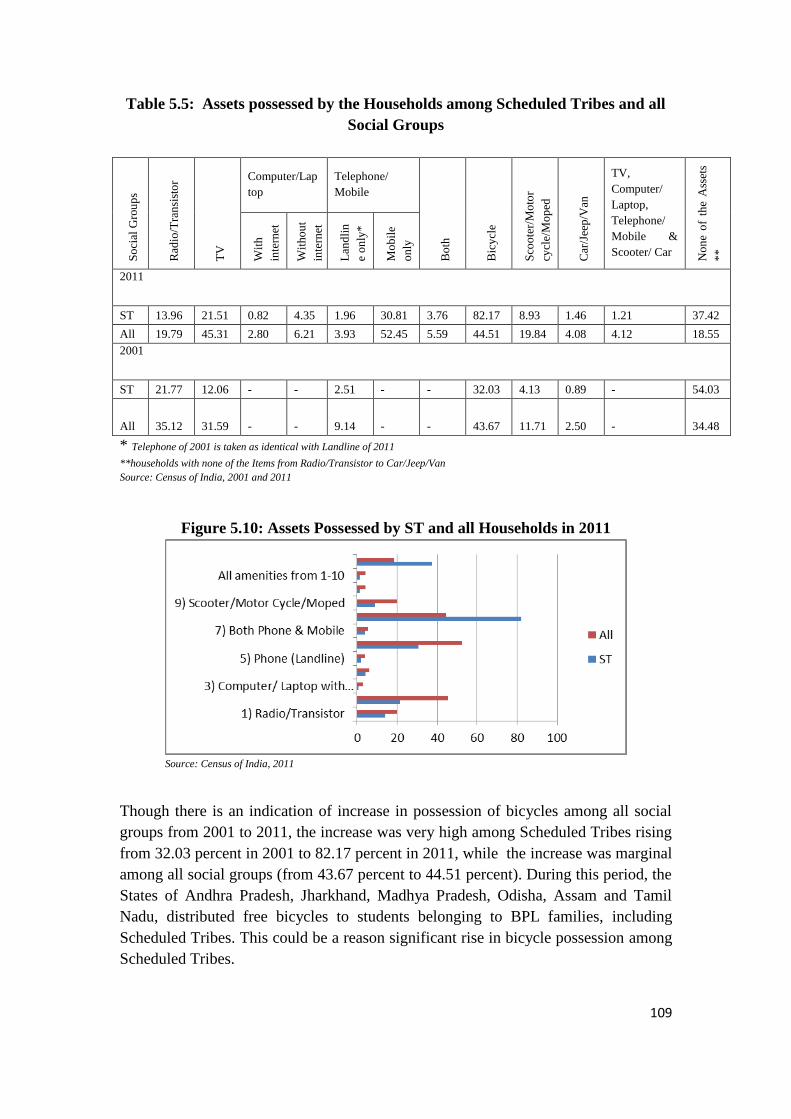
109
Table 5.5: Assets possessed by the Households among Scheduled Tribes and all
Social Groups
S
oci
al G
rou
ps
Rad
io/T
ran
sist
or
TV
Computer/Lap
top
Telephone/
Mobile
Bo
th
Bic
ycl
e
Sco
ote
r/M
oto
r
cycl
e/M
op
ed
Car
/Jee
p/V
an
TV,
Computer/
Laptop,
Telephone/
Mobile &
Scooter/ Car No
ne
of
the
Ass
ets
**
Wit
h
inte
rnet
Wit
ho
ut
inte
rnet
Lan
dli
n
e o
nly
*
Mo
bil
e
on
ly
2011
ST 13.96 21.51 0.82 4.35 1.96 30.81 3.76 82.17 8.93 1.46 1.21 37.42
All 19.79 45.31 2.80 6.21 3.93 52.45 5.59 44.51 19.84 4.08 4.12 18.55
2001
ST 21.77 12.06 - - 2.51 - - 32.03 4.13 0.89 - 54.03
All 35.12 31.59 - - 9.14 - - 43.67 11.71 2.50 - 34.48
* Telephone of 2001 is taken as identical with Landline of 2011
**households with none of the Items from Radio/Transistor to Car/Jeep/Van
Source: Census of India, 2001 and 2011
Figure 5.10: Assets Possessed by ST and all Households in 2011
Source: Census of India, 2011
Though there is an indication of increase in possession of bicycles among all social
groups from 2001 to 2011, the increase was very high among Scheduled Tribes rising
from 32.03 percent in 2001 to 82.17 percent in 2011, while the increase was marginal
among all social groups (from 43.67 percent to 44.51 percent). During this period, the
States of Andhra Pradesh, Jharkhand, Madhya Pradesh, Odisha, Assam and Tamil
Nadu, distributed free bicycles to students belonging to BPL families, including
Scheduled Tribes. This could be a reason significant rise in bicycle possession among
Scheduled Tribes.

110
Table 5.6 reveals that Scheduled Tribes possessed fewer amenities, and the
households with no amenities are highest among Scheduled Tribes. The percentage of
households with ‘no amenities’ decreased from 2001 to 2011 among all social groups.
This decrease was from 54.03 percent to 37.42 percent and 34.48 percent to 18.55
percent among Scheduled Tribes and all social groups, respectively. This indicates
that the possession of the assets among Scheduled Tribes improved over the decade
(16.61 percentage points) slightly more than all groups (15.93 percentage points)
between 2001 and 2011. Over the years, many young Scheduled Tribe persons
seasonally migrate to urban centers to work in construction and service sectors. It is
likely, when they return home, they carry with them the modern gadgets that
contribute their higher share of possession of assets. In any case, the households
without any of the assets among Scheduled Tribes (37.42 percent) is twice that of all
social groups (18.55 percent) in 2011, clearly indicating the lack of affordability.
Examining the data on condition of houses among Scheduled Tribe households, 40.62
percent occupied good houses, 53.13 percent of them are in livable condition and 6.25
percent are under dilapidated condition. In the case of all social groups, 53.11 percent
lived in good houses, 41.54 percent of them in livable condition, and 5.35 percent are
in dilapidated condition. The comparison of the condition of houses between
Scheduled Tribe and all social group households reveals that the houses of Scheduled
Tribes are in bad condition. Most of the tribes in urban areas live in slums, in
makeshift homes, houses which are more dilapidated compared to the average of all
social groups (Table 5.6).
Table 5.6: Condition of Houses Occupied by Scheduled Tribes and
Other Households, 2011 Census
Condition Good Livable Dilapidated
Category ST All ST All ST All
Rural 37.61 45.91 55.85 47.58 6.55 6.51
Urban 59.69 68.44 35.93 28.67 4.39 2.88
Total 40.62 53.11 53.13 41.54 6.25 5.35
Source: Houses and Household Amenities for Scheduled Tribes, http://tribal.nic.in/Content/StatisticsDivision.aspx

111
Figure 5.11: Condition of Houses Occupied by Scheduled Tribes and Other
Households, 2011 Census
In rural areas, 46.20 percent of Scheduled Tribe households and 55.30 percent of all
social groups use electricity for lighting. The use of electricity among Scheduled
Tribes is about 9 percentage points less than that of all social groups (Table 5.7).
However, kerosene is the main source of lighting for 50.93 percent of Scheduled
Tribe households, which is 7.77 percent points higher than that of 43.16 percent of all
social groups, and 4.73 percent points higher than the use of electricity among
Scheduled Tribes. Interestingly, the use of solar energy among Scheduled Tribe
households is 0.66 percent points, higher than that of all groups. Importantly, 1.03
percent of Scheduled Tribe households live with no lighting which is 0.5 percent
points higher than the 0.53 percent of all social groups. In urban areas, though a
majority of 86.47 percent of Scheduled Tribe households uses electricity for lighting,
it is 6.21 percentage points less than the usage of 92.68 percent of all social groups.
11.89 percent of Scheduled Tribe households use kerosene, which is 5.41 percentage
points higher than that of all groups.
Table 5.7: Main Source of Lighting among Households of Scheduled
Tribes and All, 2011 Census
Source Electricity Kerosene Solar
energy
Other oil Any other No lighting
Category ST All ST All ST All ST All ST All ST All
Rural 46.20 55.30 50.93 43.16 1.21 0.55 0.31 0.24 0.32 0.22 1.03 0.53
Urban 86.47 92.68 11.89 6.48 0.29 0.22 0.25 0.12 0.25 0.17 0.85 0.34
Source: Houses and Household Amenities for Scheduled Tribes, http://tribal.nic.in/Content/STATISTICSDivision.aspx
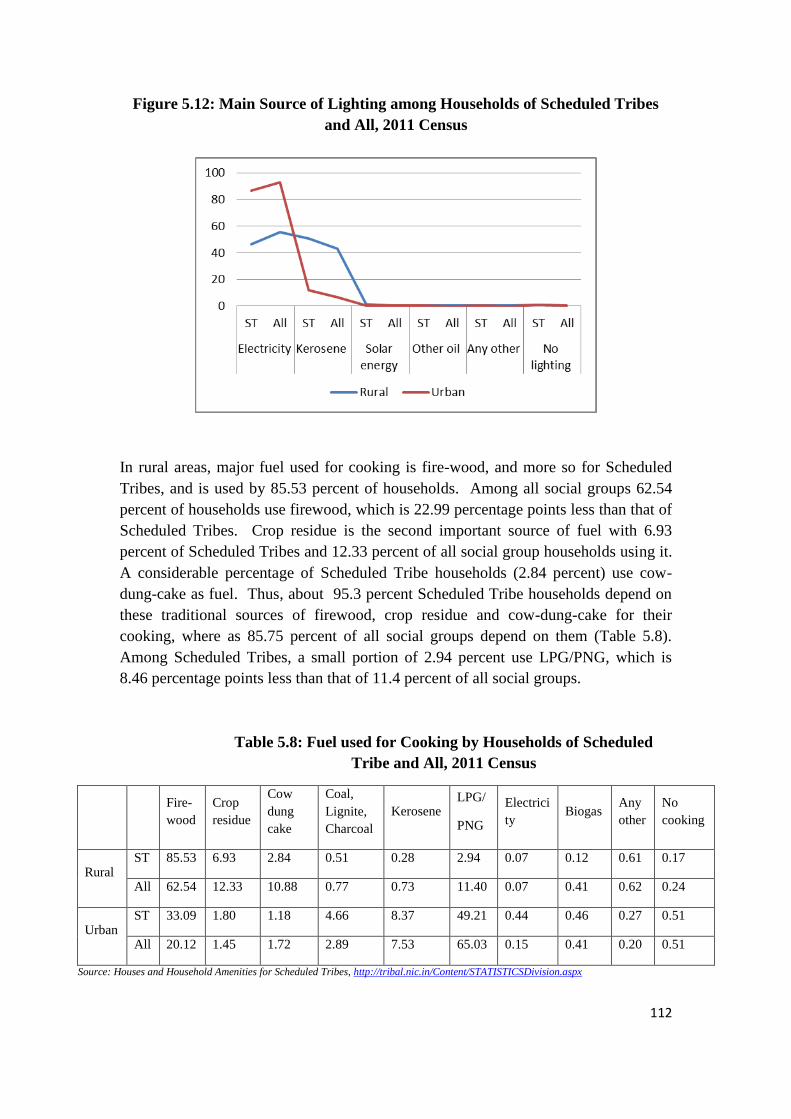
112
Figure 5.12: Main Source of Lighting among Households of Scheduled Tribes
and All, 2011 Census
In rural areas, major fuel used for cooking is fire-wood, and more so for Scheduled
Tribes, and is used by 85.53 percent of households. Among all social groups 62.54
percent of households use firewood, which is 22.99 percentage points less than that of
Scheduled Tribes. Crop residue is the second important source of fuel with 6.93
percent of Scheduled Tribes and 12.33 percent of all social group households using it.
A considerable percentage of Scheduled Tribe households (2.84 percent) use cow-
dung-cake as fuel. Thus, about 95.3 percent Scheduled Tribe households depend on
these traditional sources of firewood, crop residue and cow-dung-cake for their
cooking, where as 85.75 percent of all social groups depend on them (Table 5.8).
Among Scheduled Tribes, a small portion of 2.94 percent use LPG/PNG, which is
8.46 percentage points less than that of 11.4 percent of all social groups.
Table 5.8: Fuel used for Cooking by Households of Scheduled
Tribe and All, 2011 Census
Fire-
wood
Crop
residue
Cow
dung
cake
Coal,
Lignite,
Charcoal
Kerosene LPG/
PNG
Electrici
ty Biogas
Any
other
No
cooking
Rural ST 85.53 6.93 2.84 0.51 0.28 2.94 0.07 0.12 0.61 0.17
All 62.54 12.33 10.88 0.77 0.73 11.40 0.07 0.41 0.62 0.24
Urban ST 33.09 1.80 1.18 4.66 8.37 49.21 0.44 0.46 0.27 0.51
All 20.12 1.45 1.72 2.89 7.53 65.03 0.15 0.41 0.20 0.51
Source: Houses and Household Amenities for Scheduled Tribes, http://tribal.nic.in/Content/STATISTICSDivision.aspx

113
Figure 5.13: Fuel used for Cooking by Households of Scheduled Tribes
and All, 2011 Census
In urban areas, the trend is different, as 49.21 percent of Scheduled Tribes use
LPG/PNG and 33.09 percent of them, depend on firewood. Among all social groups,
65.03 percent use LPG/PNG, which is 15.82 percentage points higher than that of
Scheduled Tribes. About 20.12 percent of all groups depend on firewood, which is
12.97 percentage points lower than that of Scheduled Tribes. Although LPG/PNG is
used by Scheduled Tribes in urban areas, (possibly smaller 5 kg cylinders handy for
migrant and small families), the traditional use of firewood (33.09 percent) and
kerosene (8.37 percent) are still popular among the Scheduled Tribes.
Only 19.7 percent households get water from within the premises, which is 26.9
percentage points less than that of all groups of 46.6 percent. About 46.7 percent and
33.6 percent of Scheduled Tribe households fetch water from near the premises
(within 100 meters) and away (beyond 100 meters) from the households, respectively.
The problem of accessing drinking water is endemic in many tribal areas, which is
evidenced from Table 5.9.
Among the main sources of drinking water, about 39 percent of Scheduled Tribe
households depend on hand-pump, which is 5.7 percentage points higher than that of
all groups of 33.5 percent. It is also observed that 19.1 percent of Scheduled Tribe
households depend on uncovered wells, while it is just 9.4 percent among all social
groups. About 14.6 percent of Scheduled Tribe households depend upon tap-water
from treated source, whereas it is 32 percent for all social groups. About 9.8 percent
of Scheduled Tribes have access to tap-water from untreated sources and 7.8 percent
of them get water from tube-well/borehole.

114
Table 5.9: Location and Source of Drinking Water for Scheduled Tribes and All
Households, 2011 Census
Location and source of
drinking water
Scheduled Tribes All
Percent
of HH by
source
Within
premises
Near the
premises
Away Percent
of HH by
source
Within
premises
Near the
premises
Away
Percent of households by
location of drinking water
100 19.7 46.7 33.6 100 46.6 35.8 17.6
Mai
n s
ou
rce
of
dri
nk
ing
wat
er
Tap-water from
treated source
14.6 53.7 35.1 11.3 32 68.4 25.1 6.5
Tap-water from un-
treated source
9.8 28.7 54.7 16.6 11.6 42.9 45.6 11.5
Covered well 1.9 23.5 40.1 36.4 1.6 54.5 26.3 19.2
Uncovered well 19.1 14.3 39.8 45.9 9.4 33 35.5 31.5
Hand-pump 39.2 10.5 55.9 33.6 33.5 35.4 43.2 21.4
Tube-well/Borehole 7.8 22.2 44.6 33.2 8.5 46.5 32.6 21
Spring 3.1 0 29.9 70.1 0.5 0 35.2 64.8
River/ Canal 2 0 29.8 70.2 0.6 0 39.4 60.6
Tank/pond/lake 1.1 0 43.6 56.4 0.8 0 58.7 41.3
Other sources 1.3 0 31.6 68.4 1.5 0 40.1 59.9 Source: Houses and Household Amenities for Scheduled Tribes, http://tribal.nic.in/Content/STATISTICSDivision.aspx

115
Figure 5.14: Percentage of households by location of drinking water for
Scheduled Tribes and All groups, 2011 Census
For 55.9 percent of Scheduled Tribe households, hand-pumps are located near the
premises, while for 33.6 percent, hand-pumps are away from the households. Only
10.5 percent of Scheduled Tribe households have hand-pumps in their premises.
About 43 percent of households of all social groups have hand-pumps near the
premises, while 35.4 percent of households have the facility within the premises and
21.4 percent have away from the premises.
Regarding the location of the second major source of drinking water, that is,
uncovered well, for 45.9 percent of Scheduled Tribes, it is located away from
households, near the premises for 39.8 percent and within the premises for 14.3
percent of households.
About 6.2 percent of Scheduled Tribe households access drinking water from open
sources, such as springs, rivers, canals, tanks, ponds, lakes, whereas it is 1.9 percent
of all social groups. These open sources are most often contaminated, for which the
Scheduled Tribe population is comparatively more vulnerable to water borne diseases.

116
Figure 5.15: Percentage of households by source of drinking water for
Scheduled Tribes and All groups, 2011 Census
As regards sanitation, Table 5.10 clearly indicates that Scheduled Tribes lag behind
all social groups. 77.4 percent of Scheduled Tribe households do not have latrine
facility within the premises, and 74.7 percent of them go for open defecation. Only
22.6 percent of Scheduled Tribe households have latrine facility within the premises,
which is 24.3 percentage points lower than that of all social groups. Among all social
groups, 53.1 percent of households lack latrine facility within the premises, which is
24.3 percentage points less than that of Scheduled Tribes and 49.8 percent of all
households go for open defecation, which is 24.9 percentage points less than that of
Scheduled Tribes.
Table 5.10: Percentage of Household having Latrine and Bathing Facility
within Premises, 2011
Total
number of
households
Percent of
HH having
latrine
facility
within the
premises
Night
soil
removed
by
human
Percent of
households
not having
latrine
facility
within the
premises
Open
defec
ation
Percent of
households
having bathing
facility within the
premises
Waste water
outlet
connected to
(Closed
drainage)
ST 23,329,105 22.6 0.1 77.4 74.7 17.3 6.1
All 246,692,667 46.9 0.3 53.1 49.8 42.0 18.1
Source: Houses and Household Amenities for Scheduled Tribes,
http://tribal.nic.in/Content/STATISTICS Division.aspx

117
Among Scheduled Tribes, 17.3 percent of households have bathing facility within the
premises, whereas 42 percent of all households, have the same facility. 6.1 percent of
ST households have waste water outlet connected to closed drainage, whereas 18.1
percent of all households have the same facility.
Figure 5.16: Percentage of Households having Latrine and Bathing
Facility within Premises, 2011
5.4.1 Value of Assets and Average Asset Value
Among Scheduled Tribes, 44.98 percent of households have bank accounts thus
availing banking services, whereas 58.7 percent of all households have the same
facility. Value of total assets and its two major components (land and buildings),
along with their respective shares, among social groups in rural and urban areas is
shown in Table 5.12. In rural areas, average value of total assets among Scheduled
Tribes is Rs.1, 36,640 compared to Rs. 2, 65,606 for all social groups, which is 94
percent higher than the average value of assets of Scheduled Tribes (Figure 5.18).
The share of Scheduled Tribes in the total assets value is only 5.2 percent, which is
nearly half of their share of households (10.2 percent). This indicates lower share of
value of assets for Scheduled Tribes against their households. The average value of
land and buildings per households for Scheduled Tribes has relatively lower value
(Rs. 1, 16,281) than that of all social groups (Rs. 2, 30,280) in rural areas. Among
Scheduled Tribes and all social groups, the percentage share of value of land and
buildings occupies more than 85 percent with not much variation between these
groups. When we observe the percentage share of values of land and buildings
separately, Scheduled Tribes have lower share of values of land (61.3 percent) than all
social groups (63.2 percent) and marginally higher share of values of buildings (23.8
percent) than all social groups (23.5 percent) in rural areas.

118
Table 5.11: Value of Land, Buildings and Total Assets by Rural and Urban at All-India,
by Scheduled Tribes and Others
S.No. Social
Group
No. of
households
('00)
Percent
Distri-
bution
of
House-
holds
AVA
per HH
(Rs.)
Percent
Distri-
bution
of Total
Assets
Av.
Value of
Land
and
Building
per HH
(Rs.)
Percent
Distri-
bution
of Value
of land
and
Building
Percent
Share of
Value of
Land and
Building
in each
Group
Percent
Share of
Value of
Land in
each
Group
Percent
Share of
Value of
Building
in each
Group
Rural
1 ST 150825 10.2 136640 5.2 116281 5.2 85.1 61.3 23.8
2 Others 394457 26.7 429513 43.1 374965 43.4 87.3 66.6 20.7
3 All Groups 1478529 100.0 265606 100.0 230280 100.0 86.7 63.2 23.5
Urban
1 ST 16547 3.0 240295 1.7 167486 1.6 69.7 35.9 33.8
2 Others 264851 47.7 560362 64.1 429237 64.4 76.6 37.5 39.1
3 All Groups 554976 100.0 417158 100.0 318292 100.0 76.3 38.5 37.8
Source: NSSO (2006), Report 503(59/18.2/4), p.21, 23.
In urban areas, Scheduled Tribes show lower average value of assets (Rs.2,40,295) by
42.4 percent than that of all social groups (Rs.4,17,158), as shown in Figure 5.17.
Further, Scheduled Tribes have lower share of assets than that of their counterparts in
urban areas. Again, for land and buildings, Scheduled Tribes have lower share (69.7
percent) than all social groups taken together (76.3 percent). For land and buildings
separately also, Scheduled Tribes have lower share than all social groups in urban
areas.
Figure 5. 17: Average Value of Assets (Rs.)/HH
To understand the inequitable distribution of assets, it is interesting to see the share of
households having asset values of (i) < Rs.30,000 and (ii) >Rs.3,00,000 for rural and
urban areas among Scheduled Tribes and all social groups as shown in Table 5.12. In
rural areas, for all social groups the share of households with <Rs. 30000 is 15.9
percent, and for Scheduled Tribes it is 23.5 percent. As against this, if we look at the
share of households with >Rs. 300000, for all social groups it is nearly 1/4th whereas
among Scheduled Tribes it is less than 1/10th. In urban areas, in the <Rs. 30000
category, the share of all social groups is 23.0 percent, while for Scheduled Tribes it is

119
32.5 percent. In the >Rs.3,00,000 category, Scheduled Tribes with 20.1 percent lag
behind all social groups’ share of 33.7 percent. This indicates inequitable distribution
of assets among Scheduled Tribes in rural and urban areas (Figure 5.18).
Table 5.12: Percentage of Households belonging to Selected Asset Holding
Category
Region Social Group
Percent of Household Asset
Holding
< 30000 >300000
Rural
1 ST 23.50 9.10
2 All 15.90 24.80
Urban
1 ST 32.50 20.10
2 All 23.00 33.70
Source: NSSO (2006), April, p.22
Figure 5.18: Percent of HH Asset Holding
5.5 Employment (Formal, Organized and Unorganized Sectors)
5.5.1 Work Force Participation
Worker Population Ratios (WPRs)47 of Scheduled Tribes and All Social Groups over
the NSS Rounds is presented below. At the all-India level, the WPRs according to
usual status (ps+ss) for different social groups over the periods from 1983 to 2009-10
have been presented in Table 5.13.48
47 Worker population ratio is defined as the number of persons employed per thousand persons. 48 The survey periods for which the WPRs have been presented in this Table refer to those of NSS 38th (1983), 43rd (1987-88), 50th
(1993-94), 55th (1999-2000), 61st (2004-05) and 66th (2009-10) rounds.

120
Table 5.13: No. of Employed per 1000 Persons (WPR) during 1983 to 2009-10
Year of Reference
Worker Population Ratio
(WPR)
ST All
Rural Male
2009-10 559 547
2004-05 562 546
1999-00 558 531
1993-94 591 553
1987-88 567 539
1983 588 547
Rural Female
2009-10 359 261
2004-05 464 327
1999-00 438 299
1993-94 482 328
1987-88 454 323
1983 478 340
Urban Male
2009-10 510 543
2004-05 523 549
1999-00 480 518
1993-94 520 521
1987-88 504 506
1983 531 512
Urban Female
2009-10 203 138
2004-05 245 166
1999-00 204 139
1993-94 234 155
1987-88 225 152
1983 255 151
Source: NSSO (2012), September, p.35
WPR= (No. of Employed Persons/Total Population)*1000
In rural areas, for Scheduled Tribe males, between 1983 and 1993-94, WPR was
between 56.7 percent and 59.1 percent, whereas between 1999-00 and 2009-10, its
levels decreased to between 55.8 percent and 56.2 percent. What is significant here is
that the rural Scheduled Tribe males exhibit higher levels of WPR, in each of the
rounds than those of all social groups. In 2004-05 and 2009-10, the rural male
Scheduled Tribes have WPR of 56.2 percent and 55.9 percent as against 54.6 percent
and 54.7 percent respectively for all groups. For rural female Scheduled Tribe
category, between 1983 and 2004-05, the WPR was between 43.8 percent (1999-00)
and 48.2 percent (1993-94). In 2009-10, the same was 35.9 percent. However, these
WPRs are substantially higher than the females of all groups. Thus, WPRs of both
rural males and females among Scheduled Tribes are higher than those of their
counterparts among all social groups (Figures 5.19 and 5.20).

121
Figure 5.19: Worker Population Ratio (WPR) from 1983 to 2009-10
(Rural Male)
.
Figure 5.20: Worker Population Ratio (WPR) from 1983 to 2009-10
(Rural Female)
In urban areas, the WPRs with respect to Scheduled Tribe males, are less than the
average of all groups for almost all the years. In 1983, the male Scheduled Tribe
category exhibited 53.1 percent of WPR, which was marginally higher than that of all
groups (51.2 percent). Between 1987-88 and 2009-10, the WPR of male Scheduled
Tribes varied between 48.0 percent (1999-00) and 52.3 percent (2004-05), whereas
the same for all groups lay between 50.6 percent (1987-88) and 54.9 percent (2004-
05). But, for Scheduled Tribe female category, the WPR is higher than those of their
counterparts among all groups, without any exception (Figures 5.21 and 5.22)

122
Figure 5.21: Worker Population Ratio (WPR) from 1983 to 2009-10
(Urban Male)
Figure 5.22: Worker Population Ratio (WPR) from 1983 to 2009-10
(Urban Female)
Another recent survey conducted by Ministry of Labour and Employment also reveals
a similar trend of WPR among different social groups, as given in Table 5.14 as well
as in Figure 5.23. The survey confirms the highest WPR among Scheduled Tribe
category, which is estimated at 54.7 percent. Under the General category the WPR is
lowest, which is estimated at 44.9 percent with the usual principal status approach.49
49 The major time spent by a person (183 days or more) in a year is used to determine whether the person is in the labour force or out of labour force. This approach is called the Usual Principal Status (UPS) Approach (Government of India.
2013).

123
Table 5.14: Worker Population Ratio for different social groups based on
UPS approach
Social
Group
Rural Urban Rural + Urban
M F P M F P M F P
ST 767 351 567 688 181 443 755 324 547
Overall 749 234 505 699 147 435 735 209 485
Source: Government. of India. 2013, Report on Third Annual Employment & Unemployment Survey (2012-13), Vol. I.
Chandigarh: Labour Bureau, Ministry of Labour& Employment.
Figure 5.23: Worker Population Ratio based on UPS approach
Labour Force Participation Rate (LFPR)50
Table 5.15 reveals that the Labour Force Participation Rate (LFPR) based on Usual
Principal Status (UPS) approach at all India level is highest among Scheduled Tribes
with 56.7 percent, and it is lowest among overall category with 50.9 percent (Figure
5.24). The female LFPR is highest in case of Scheduled Tribes with 33.6 percent
compared to the all India average of 22.6 percent.
Table 5.15: Labour Force Participation Rate for different social groups
based on UPS approach for persons aged 15 years & above
Social
Groups
Rural Urban Rural + Urban
M F P M F P M F P
ST 794
36
2 586 718 201 468 782 336 567
Overall 780
24
8 528 730 169 461 766 226 509 Source: Govt. of India. 2013. Report on Third Annual Employment & Unemployment Survey (2012-13), Vol. I.
Chandigarh: Labour Bureau, Ministry of Labour& Employment.
50 Labour Force Participation Rate (LFPR) is defined as the number of persons in the labour force per 1000 persons. Any
person who is working or is available for/seeking work will be considered part of the ‘labour force’.

124
Figure 5.24: Labour Force Participation Rate
5.5.2 Unemployment Rates
The estimates of unemployment rates (number of unemployed per 1000 in the
labour force) and proportion of unemployed in total population, according to
the usual status (ps+ss) for the 38th (1983), 43rd (1987-88), 50th (1993-94), 55th
(1999-2000), 61st (2004-05) and 66th (2009-10) rounds are presented in Table
5.16 for different social groups at the all-India level.
Table 5.16: Unemployment Rate (UR) and Proportion of Unemployed Persons
(PU) from 1983 to 2009-10
Year of Reference
No. of the
Unemployed per
1000 Labour
Force
No. of the
Unemployed per
1000 Persons
ST All ST All
Rural Male
2009-10 17 16 10 9
2004-05 11 16 6 9
1999-00 11 18 6 10
1993-94 8 14 5 8
1987-88 7 18 4 10
1983 5 14 3 8
Rural Female
2009-10 9 16 3 4
2004-05 4 18 2 6
1999-00 5 10 2 3
1993-94 3 8 2 3
1987-88 14 24 6 8
1983 1 7 1 2
Urban Male
2009-10 44 28 24 16
2004-05 29 38 16 22
1999-00 44 46 22 25
1993-94 47 40 26 22

125
1987-88 43 52 22 28
1983 43 51 24 28
Urban Female
2009-10 43 57 9 8
2004-05 34 69 9 12
1999-00 28 54 6 8
1993-94 17 62 4 10
1987-88 20 62 5 10
1983 15 49 4 8
Source: NSSO (2012), September, p.41
Notes: Unemployment Rate (UR) = {(no of unemployed persons) / (no of employed persons + no of
unemployed persons)}*1000.
1. Proportion Unemployed (PU) = [no of unemployed persons / total population] *1000
As the WPRs of Scheduled Tribes are higher among rural males, rural and urban
females, the unemployment levels appear less among Scheduled Tribes. The measures
used here are unemployment rate and proportion of unemployed persons. Though the
denominator, ‘unemployed persons’ is the same in the two standards, the numerator in
the former case is labour force (employed and unemployed persons) and in the latter
case the numerator is the total persons (labour force and non-workers).
Figure 5.25: Unemployment Rate (Rural Male)
Figure 5.26: Unemployment Rate (Rural Female)
In the analysis below, only unemployment rate is being considered. In rural areas,
(except in 2009-10), in all other five rounds, the unemployment rate with respect to

126
Scheduled Tribe males is less than those of all groups. For the male Scheduled Tribes,
unemployment rates lay between 0.5 percent to 0.8 percent in the periods from 1983
to 1993-94, while they varied between 1.1 percent to 1.7 percent in the periods 1999-
00 to 2009-10. For Scheduled Tribe females, the unemployment rates are substantially
less than those of all groups. This is in conformity with higher WPRs observed earlier
in the previous part. In urban areas, the unemployment rates for both males and
females, are relatively higher among all social groups and in all the years of reference,
compared to those in the rural sector.
Figure 5.27: Unemployment Rate (Urban Male)
Figure 5.28: Unemployment Rate (Urban Female)
The unemployment rates of urban Scheduled Tribe males in 1983, 1987-88, 1999-00
and 2004-05 are lower than those of all groups. In other two time periods (1993-94
and 2009-10), this category of males show higher rates in comparison with males of
all social groups. The unemployment rates for urban Scheduled Tribe males vary
between 4.3 percent and 4.7 percent in all the years, except in 2004-05 for which
unemployment rate is 2.9 percent. For all groups, higher rates were seen for 1983 and
1987-88 (Figure 5.27).
As regards urban female Scheduled Tribes, unemployment rates are lower than those
of their counterparts among all social groups. From the data across the survey

127
periods, among females, the unemployment rates range between 1.5 percent and 4.3
percent for Scheduled Tribes, whereas the same lie between 4.9 percent and 6.9
percent for all groups. This is also in conformity with WPRs of urban Scheduled
Tribe females (Figure 5.28).
Table 5.17, confirms the NSSO findings.51 The Report52 reveals that the
unemployment rate at 3.6 percent at All- India level is lowest in the Scheduled Tribe
category, and it is 4.7 percent for overall category.
Table 5.17: Unemployment Rates for Scheduled Tribes and All Groups
based on UPS approach
Social
Groups
Rural Urban Rural and Urban
M F P M F P M F P
Scheduled Tribe 33 32 33 42 96 54 35 38 36
Overall 40 58 44 42 128 57 40 72 47 Source: Govt. of India. 2013. Report on Third Annual Employment & Unemployment Survey (2012-13), Vol. I.
Chandigarh: Labour Bureau, Ministry of Labour& Employment.
Figure 5.29: Unemployment Rates based on UPS Approach
5.5.3 Employment in Organized Sectors
Employment in Government Sector
If the trend of government employment status among Scheduled Tribes from 1978 to
2000 is analyzed, it is very significant to note that the percentage of government
employments, including insurance is much below the proportion of Scheduled Tribe
population to total population of the country as shown in Table 5.18. It could be either
due to non-implementation of the provision of reservation provided for Scheduled
Tribes or non-availability of suitable candidates for employment or both.
51 It is based on the calculation of unemployment rate at all India level, under the usual principal status approach for the persons
aged 15 years and above. 52 Government of India. 2013. Report on Third Annual Employment & Unemployment Survey (2012-13), Vol. I. Chandigarh:
Labour Bureau, Ministry of Labour & Employment.

128
Table 5.18: Percentage of Combined Government Employment including
Insurance
Years ST Others
1978 4.7 80.4
1980 5.0 79.2
1989 6.5 76.4
1990 6.7 75.8
1999 6.5 76.8
2000 6.6 76.8
2001 6.7 76.5
2004 6.9 76.0
1994* 6.2 76.9
2000* 6.6 76.8
Source: Thorat and Senapati, 200753
* Percentage of government employees including Insurance.
The data on group-wise distribution of Scheduled Tribe representation in Central
Government Services reveals that the percentage of Groups A and B services is much
lower than their total representation and their representation in Groups C and D
services as indicated in Table 5.19. In 1994, there were 195802 Scheduled Tribe
employees out of 3567112 of all employees in central government services. The share
of Scheduled Tribes was 5.49 percent at the aggregate level, and it was 2.8 percent
and 2.9 percent in Groups A and B services respectively. The share of Scheduled
Tribes in Groups C and D is twice as high as in Groups A and B. In 1999, the total
strength of central government employees remaining almost the same (3544262), at
the aggregate level, the share of Scheduled Tribes in the total has improved from 5.49
percent to 6.17 percent as the absolute number increased from 1,95,802 to 2,18,653.
The share in Group A increased to 3.39 percent from 2.92 percent in 1994. Similarly,
the shares of Groups C and D increased marginally by 0.7 and 0.8 percentage points
respectively. In 2004, total central government employees decreased to 3058506
(from 3544262 in 1999). Similarly, the number of employees among Scheduled
Tribes also decreased. It may be due to the effect of LPG (Liberalization,
Privatization and Globalization) policies of the Government of India in downsizing
the role of government. Further, it is noticed that among Scheduled Tribes the
absolute number increased only among Group B services to 6,274 (from 3,512 in
1999). Thus, their share went from 2.35 percent to 4.6 percent. In the Groups A and
C, their shares showed slight increase but decreased in Group D.
53 Thorat, Sukhadeo and Chittaranjan Senapati. 2007. Reservation in Employment, Education and Legislature: Status and
Emerging issues. Working Paper Series, Vol. II, No.5. New Delhi: Indian Institute of Dalit Studies. www.dalitstudies.org.in

129
Table 5.19: Scheduled Tribe Representation in Central
Government Services in 1994, 1999, and 2004
Year
(Point of Time) Group Total ST Percent
01.01.1994
A 59016 1727 2.92
B 103198 2902 2.81
C 2381613 128228 5.38
D 1023285 62945 6.15
Total 3567112 195802 5.49
01.01.1999
A 93520 3172 3.39
B 104963 3512 2.35
C 2396426 145482 6.07
D 949353 66487 7
Total 3544262 218653 6.17
01.01.2004
A 80011 3311 4.1
B 135409 6274 4.6
C 2040970 136630 6.7
D 802116 53776 6.7
Total 3058506 199991 6.5
Source: Planning Commission (Government of India). 2008. Eleventh Five Year Plan 2007-12, Vol. I
(Chapter 6: Social Justice), p.114,. New Delhi.
With regard to percentage share of Scheduled Tribes in Central Government jobs
category-wise, as seen in Table 5.20, it is clear that the percentage of Scheduled
Tribes in Group A and Group B services is very meager. While 0.07 percent of
Scheduled Tribes were employed in Group A services in 1960, it was 1.70 percent in
2003. In Group B services, 0.42 percent of Scheduled Tribes were employed in 1960,
and it was raised to 3.72 percent in 2003. Interestingly, more than three-fourth (77.53
percent) of the ST employees were under the Group D category in 1960. But, their
representation slowly came down to 28.96 percent by 2003, as they perhaps gradually
availed opportunities under Group C services over a period of time from 1960 to
2003. Therefore, 21.98 percent of Scheduled Tribe employees were under Group C in
1960, which was raised to 65.62 percent in 2003.

130
Table 5.20: Percentage Share of Scheduled Tribe in Central Government Jobs
(By Categories)
(Source: Thorat and Senapati 2007)
Table 5.21 provides information on the representation of Scheduled Tribes in Public
Sector Enterprises (PSEs) in India, group-wise, for specified years between 1971 and
2010. At each point of time, the number of PSEs included for the purpose has been
different. There were 85 in 1971, 177 in 1980, 238 in 1999 and 2001, 189 in 2004
and 206 in 2010. At the aggregate level, the share of Scheduled Tribes was only 2.24
percent in 1971, but it rose to 7.53 percent in 1980 and thereafter it went up only
marginally, reaching its peak in 2004 with 8.76 percent, and by 2010 it came down to
7.36 percent. It is interesting to observe that Group D (excluding Safai Karmacharis)
alone has the highest share throughout time. In 1980 it was 10.8 percent, and by 1999
and 2001 it reached 11.4 percent and 11.7 percent respectively. In 2004 and 2010,
this share rose to around 12.4 percent. The share of Group D (Safai Karmacharis) has
always been lying between 1.39 percent and 4.27 percent.
The percentage share of Scheduled Tribe employment in PSEs category-wise between
1971 and 2004, about 0.43 percent of Scheduled Tribes were employed in Group A in
1971, and their employment was raised to 5.27 percent by 2004 (Table 5.22).
Similarly, 0.46 percent of Scheduled Tribes were employed in Group B in 1971,
which was increased to 7.84 percent by 2004. This reveals low representation of
Scheduled Tribes in Group A and Group B services in PSEs when compared to their
proportion of population. In 1971, 36.71 percent of Scheduled Tribes were employed
in Group C and 62.39 percent in Group D (excluding sweepers). This trend was
reversed in 2004 as the employment status under Group C was raised to 58.87
percent, from 36.71 percent in 1971. Concurrently, Group D employment decreased
to 28.02 percent in 2004 against 62.39 percent in 1971.
Years Service Groups
On Jan.1 A B C D
1960 0.07 0.42 21.98 77.53
1969 0.14 0.22 38.13 61.50
1970 0.17 0.31 37.48 62.05
1979 0.36 0.48 44.38 54.77
1980 0.40 0.61 44.27 54.72
1989 0.79 0.99 57.68 40.54
1990 0.86 1.20 57.82 40.12
1999 1.45 1.61 66.54 30.41
2000 1.40 1.90 66.40 30.30
2003 1.70 3.72 65.62 28.96

131
Table 5.21: Group-wise Number of Employees and Representation of Scheduled
Tribes in Public Sector Enterprises in India (01.01.1971 to 1.1.2010)
Year (Point of
Time) Groups
Total No.
of Employees
Representation of Scheduled Tribes
Scheduled Tribes
No.
Percent
age
01.01.1971 (85 Public
enterprises)
Group 'A' 31311 53 0.17
Group 'B' 35751 57 0.16
Group 'C' 351347 4519 1.29
Group 'D' (Excluding Safai
Karamcharis) 129220 7680 5.94
Total 547629 12309 2.25
Group 'D' (Safai Karamcharis) 5551 77 1.39
Grand Total 553180 12386 2.24
01.01.1980 (177 Public
enterprises)
Group 'A' 93984 623 0.66
Group 'B' 97756 1329 1.36
Group 'C' 1274581 98329 7.71
Group 'D' (Excluding Safai
Karamcharis) 353981 38083 10.76
Total 1820302 138364 7.6
Group 'D' (Safai Karamcharis) 36030 1492 4.14
Grand Total 1856332 139856 7.53
01.01.1999 (238 Public
enterprises)
Group 'A' 207424 5838 2.18
Group 'B' 175326 7180 4.09
Group 'C' 1115312 90551 8.12
Group 'D'
(Excluding Safai Karamcharis) 428341 48717 11.37
Total 1926403 152286 7.91
Group 'D' (Safai Karamcharis) 25961 778 2.99
Grand Total 1952364 153064 7.84
01.01.2001
(238 Public
enterprises)
Group 'A' 203329 6167 3.04
Group 'B' 191715 8831 4.61
Group 'C' 942496 83051 8.82
Group 'D' (Excluding Safai
Karamcharis) 366882 43046 11.73
Total 1704422 141095 8.28
Group 'D' (Safai Karamcharis) 21234 726 3.42
Grand Total 1725656 141821 8.22
01.01.2004 (189 Public
enterprises)
Group 'A' 165320 6032 3.65
Group 'B' 156822 8980 5.73
Group 'C' 714125 67396 9.44
Group 'D' (Excluding Safai
Karamcharis) 258663 32073 12.4
Total 1294930 114481 8.84
Group 'D' (Safai Karamcharis) 17778 568 3.19
Grand Total 1312708 115049 8.76
01.01.2010
(206 Public
enterprises)
Group 'A' 261072 13993 5.35
Group 'B' 208501 13117 6.29
Group 'C' 742516 51884 6.98
Group 'D' (Excluding Safai
Karamcharis) 221159 27546 12.45
Total 1433248 106540 7.43
Group 'D' (Safai Karamcharis) 34162 1462 4.27
Grand Total 1467410 108002 7.36
Source: Public Enterprises Survey of various Years, Department of Public Enterprises, Ministry of Heavy Industries &
Public Enterprises, Govt. of India. Note: Group ‘A’: Executive level; Group ‘B’: Supervisory; Group ‘C’: Workmen/Clerical
level; Group ‘D’: Semi-skilled/unskilled labour
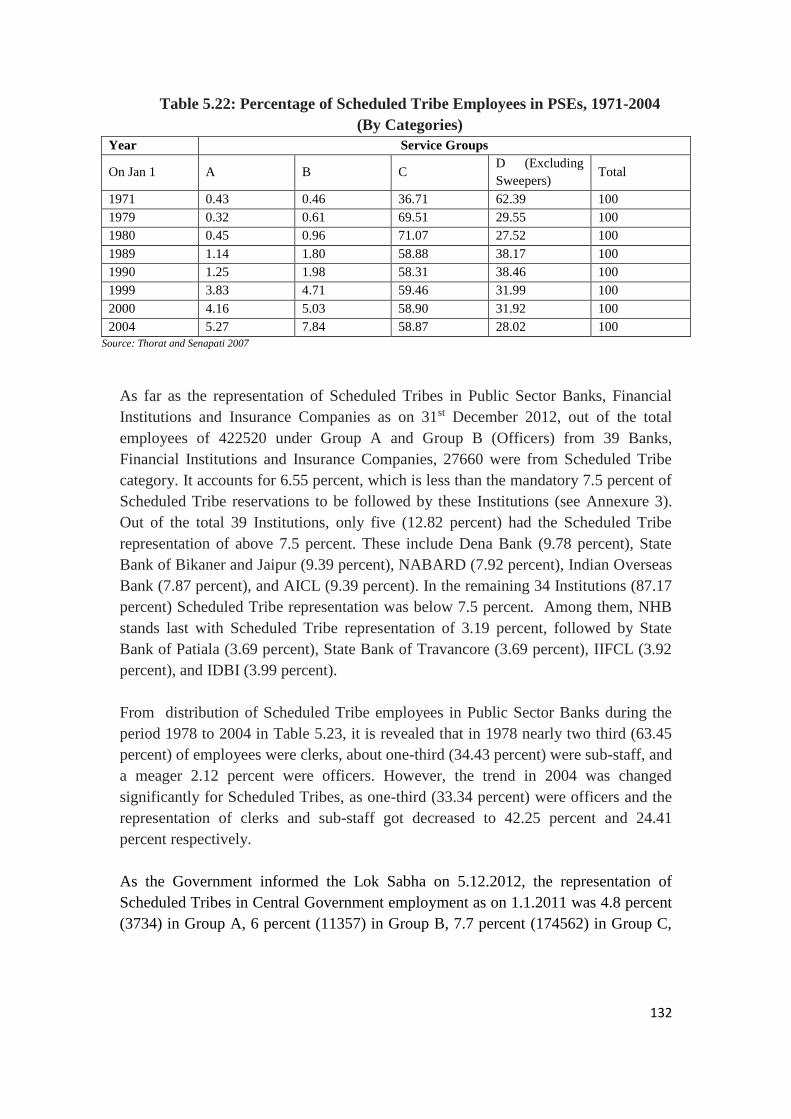
132
Table 5.22: Percentage of Scheduled Tribe Employees in PSEs, 1971-2004
(By Categories)
Year Service Groups
On Jan 1 A B C D (Excluding
Sweepers) Total
1971 0.43 0.46 36.71 62.39 100
1979 0.32 0.61 69.51 29.55 100
1980 0.45 0.96 71.07 27.52 100
1989 1.14 1.80 58.88 38.17 100
1990 1.25 1.98 58.31 38.46 100
1999 3.83 4.71 59.46 31.99 100
2000 4.16 5.03 58.90 31.92 100
2004 5.27 7.84 58.87 28.02 100
Source: Thorat and Senapati 2007
As far as the representation of Scheduled Tribes in Public Sector Banks, Financial
Institutions and Insurance Companies as on 31st December 2012, out of the total
employees of 422520 under Group A and Group B (Officers) from 39 Banks,
Financial Institutions and Insurance Companies, 27660 were from Scheduled Tribe
category. It accounts for 6.55 percent, which is less than the mandatory 7.5 percent of
Scheduled Tribe reservations to be followed by these Institutions (see Annexure 3).
Out of the total 39 Institutions, only five (12.82 percent) had the Scheduled Tribe
representation of above 7.5 percent. These include Dena Bank (9.78 percent), State
Bank of Bikaner and Jaipur (9.39 percent), NABARD (7.92 percent), Indian Overseas
Bank (7.87 percent), and AICL (9.39 percent). In the remaining 34 Institutions (87.17
percent) Scheduled Tribe representation was below 7.5 percent. Among them, NHB
stands last with Scheduled Tribe representation of 3.19 percent, followed by State
Bank of Patiala (3.69 percent), State Bank of Travancore (3.69 percent), IIFCL (3.92
percent), and IDBI (3.99 percent).
From distribution of Scheduled Tribe employees in Public Sector Banks during the
period 1978 to 2004 in Table 5.23, it is revealed that in 1978 nearly two third (63.45
percent) of employees were clerks, about one-third (34.43 percent) were sub-staff, and
a meager 2.12 percent were officers. However, the trend in 2004 was changed
significantly for Scheduled Tribes, as one-third (33.34 percent) were officers and the
representation of clerks and sub-staff got decreased to 42.25 percent and 24.41
percent respectively.
As the Government informed the Lok Sabha on 5.12.2012, the representation of
Scheduled Tribes in Central Government employment as on 1.1.2011 was 4.8 percent
(3734) in Group A, 6 percent (11357) in Group B, 7.7 percent (174562) in Group C,

133
and 6.8 percent (32791) in Group D (including Safai Karmacharis), as per Asian
Centre for Human Rights (ACHR) report, 2013.54
Table 5.23: Percentage Distribution of Scheduled Tribe Employees in
Public Sector Banks (By Categories)
Years Officers Clerks Sub Staff Total
1978 2.12 63.45 34.43 100
1980 7.60 59.02 33.38 100
1988 16.19 58.02 25.79 100
1990 17.22 55.90 26.88 100
1999 23.73 50.88 25.39 100
2000 24.62 49.83 25.55 100
2004 33.34 42.25 24.41 100
Source: Thorat and Senapati 2007
Table 5.24: Percentage Distribution of Scheduled Tribe Employees in
Insurance Jobs (By Categories)
Year Service Groups
Year A B C D Total
1993 4.37 10.42 70.04 15.18 100
2000 9.18 10.62 69.89 10.30 100
Source: Thorat and Senapati 2007
As of 8 May 2013, a total of 29037 backlog vacancies for Scheduled Tribes in the
Central Government were identified (Table 5.25). Out of them, a total of 16842 were
filled up. The remaining 12195 vacancies are pending unfilled. These account for
44.36 percent of the total backlog vacancies of 27488 for all social categories.
Table 5.25: Backlog Vacancies for Scheduled Tribes and All in the Central
Government as of 8th May 2013
Direct Recruitment Promotion Total Total pending
vacancies Backlog Filled up Backlog Filled up Backlog Filled up
ST 11400 7051 17637 9791 29037 16842 12195
Total 44427 28588 31095 19446 75522 48034 27488
Source: ACHR 2013.
ACHR report, 2013 further states that the representation of Scheduled Tribes in
Central Universities is very low as per the data provided by the UGC. The report says,
“The data of the UGC clearly shows that the representation of the Scheduled Tribes
have come down from 3.88 percent in 2006-07 to 0.24 percent in 2010-11 in the post
54 Asian Centre for Human Rights. 2013. The State of Tribal Employment in Public and Private Sector in India (A report
submitted to the High Level Committee) by Asian Centre for Human Rights, New Delhi.

134
of Professors; from 1.03 percent in 2006-2007 to 0.32 percent in the post of Readers
and from 4.43 percent during 2006-07 to 3.63 percent in the post of Lecturers.”
The evidence reveals under-representation of Scheduled Tribes and pending vacancies
in Central Government services. The main reason for this is lack of seriousness in the
implementation of the provisions of reservation for Scheduled Tribes. The ACHR
states that “…‘non-availability of eligible candidates’, ‘no suitable candidates found’
have become the modus operandi to de-reserve the reserved seats and fill up the same
with general category candidates, thereby perpetuating denial and deprivation through
sophisticated means.” Thus, there is an “extraordinary form of discrimination”
towards Scheduled Tribes in the country even today (ACHR 2013).
5.5.4 Representation in Unorganized Sector
Own Account Enterprises (OAEs) are run by households with their own labour.
Establishments are those enterprises that engage at least one hired labourer on a fairly
regular basis. An establishment employing fewer than six workers (household and
hired workers taken together) is termed as a Non-directory Establishment (NDE). An
establishment employing at least six workers (household and hired workers taken
together) is termed as a Directory Establishment (DE). In the present analysis, the
latter two are clubbed under Establishments. Table 5.26 presents the relevant
information on OAEs and establishments for 2001-02 for all-India.
In OAEs in rural India, Scheduled Tribes have the least share of 3.5 percent compared
to 28.8 percent share recorded for others. In urban areas, Scheduled Tribes share is
even less at 1.4 percent against 47 percent recorded for others. In the combined (R
and U) areas, the scenario is same as in the rural areas, as the number of OAEs in
rural areas is about 2/3rd of the total OAEs, rural and urban combined.
In Establishments in rural, urban and combined areas, Scheduled Tribes are nowhere
near others. In rural areas, Scheduled Tribes have only 2.4 percent compared to 47.6
percent recorded in ‘others’, while in urban areas Scheduled Tribes have only 1
percent enterprises as against 67.6 percent for others. Hence, the inequality of
distribution of enterprises between Scheduled Tribes and others is more visible and
dominant in urban areas, even though rural areas also show substantial gap between
Scheduled Tribes and others. The share of Scheduled Tribes for combined rural and
urban is 1.6 percent as against 58.9 percent for others.

135
Table 5.26: Distribution of Enterprises (only for proprietary and partnership
enterprises) of Unorganized Service Sector by Social Group of Owner / Partner by Type
of Enterprise per 1000 population: All-India (2001-02)
Distribution of Enterprises by Social Group of Owner /Partner
Sector
ST Others Not recorded No. Estimated
OAE
Rural 35 288 0 7521304
Urban 14 470 0 4541499
Rural and Urban 27 356 0 12062803
Establishments
Rural 24 476 0 966613
Urban 10 676 0 1249093
Rural and Urban 16 589 0 2215706
All Enterprises (OAE + Estt.)
Rural 34 309 0 8487917
Urban 13 514 0 5790592
Rural + Urban 26 392 0 14278508 Source: NSSO (2003), Report No.483, pp.A.74-82
Types of Enterprises included:- H1 = hotels; H2 = restaurants; I1 = Storage and warehouse; I2 = mechanized road transport;
I3 = other transport and related activities; I4 = communication; K = real estate; H=, renting and business activities; M =
education; N = health and social work; O = other community social and personal service activities; H = H1 + H2; and I = I1 +I2
+ I3+I4.
Among all enterprises (OAEs + Estt.), the order of priorities of social groups seems to
be the same as in OAEs. In rural areas, the share of Scheduled Tribes is just 3.4
percent compared to 30.9 percent recorded for others, while in urban areas, Scheduled
Tribes have only 1.3 percent as against 51.4 percent recorded by other categories. In
combined areas, the order of social groups as seen in rural areas is repeated because
nearly 60 percent of all the enterprises are located in rural areas.
Status of OATEs and NDTEs of Scheduled Tribes versus Other Social Groups
OATEs (Own Account Trading Enterprises) and NDTEs (Non-directory
Trading Establishments) are similar to OAEs and NDEs defined in the last
section. The status of expanding (E), stagnating (S) and contracting (C)
industries has been presented for rural and urban areas among OATEs/NDTEs
in Table 5.27.
In rural areas, at the aggregate level, the majority of the OATEs is stagnating
(61percent); only 25 percent are expanding while 15 percent are contracting.
Among Scheduled Tribes, the situation is the worst as the expanding ones are
only 11 percent, while the stagnating ones are just as at the overall level and
the contracting ones are at 27 percent. Thus, the share of stagnating units is
high among Scheduled Tribes. Though Scheduled Tribes have 2 percent of

136
total NDTEs, they show the best performance (expanding) by 46 percent on
par with the Others (45 percent), while the contracting ones are less (only 2
percent) as against others (9 percent). However Scheduled Tribes have 52
percent stagnating NDTEs. All enterprises reflect the situation of OATEs by
the sheer fact that their share in the total enterprises is the largest. In urban
areas, Scheduled Tribes have a share of only 2 percent in the total OATEs, as
against 71.1 percent for others. Even with regard to NDTEs in urban areas the
share of Scheduled Tribes is negligible at 1.1percent compared to others who
enjoyed a dominant share of 84.5 percent. Even the 1.1 percent share of
enterprises among Scheduled Tribes in urban areas is either stagnant (59
percent) or contracting (47 percent).
Table 5.27: Percentage Distribution of Enterprises by Status in the Last Three
Years for All Industries and Social Groups, All India (Rural and
Urban), 1997
Social
Group
OATE NDTE OATE+NDTE
No. of Report.
Percent of
enterprises No. of Report.
Percent of
enterprises
Percent of
enterprises
Enterprises Status Enterprises Status Status
No. Percent E S C No. Percent E S C E S C
Rural
ST 3907 6.1 11 62 27 153 2 46 52 2 11 62 27
Others 37224 57.9 28 59 12 5811 76.1 45 46 9 29 59 12
All 64313 100 25 61 15 7641 100 44 47 9 25 60 14
Urban
ST 1346 2 25 66 10 182 1.1 34 59 7 25 65 9
Others 46886 71.1 29 58 13 13942 84.5 43 46 10 32 56 13
All 65980 100 28 59 13 16493 100 43 47 11 30 57 12
All Trading Industry Divisions (included): 60 = Wholesale trade in agricultural raw materials live animals, food, beverages, intoxicants and textiles; 61
= Wholesale trade in wood, firewood, paper, skin, leather and fur, fuel, petroleum, chemicals, perfumery, ceramics, glass and ores, and metals; 62 =
Wholesale trade in all types of machinery equipment including transport equipment; 63 = Wholesale trade not elsewhere classified; 64 = Commission
agents; 65 = Retail trade in food and food articles, beverages, tobacco and intoxicants; 66 = Retail trade in textiles; 67 = Retail trade in wood, fuels
and other household utilities and durables; 68 = Retail trade - not elsewhere classified; 890 = Auctioneering services
Note: E = Expanding, S = Stagnating, C = Contracting.
Source: NSSO (1998), Report No.443, pp.A.275-278
5.5.5 Employment under Mahatma Gandhi National Rural Employment
Guarantee Act (MGNREGA).
The employment under the Mahatma Gandhi National Rural Employment Guarantee
Act (MGNREGA) 2005, which came into effect from 2 February 2006, is meant for
providing employment for Scheduled Tribes, Scheduled Castes and other categories
of rural poor. However, the participation of Scheduled Tribes in this scheme has been
decreasing from its inception in 2006. The person-days of employment generated for

137
Scheduled Tribes for the year 2006-2007 was 36 percent, and it came down to 17.19
percent in the year 2013-14 (16 percent till 13 December). This decrease is despite the
fact of increasing total person-days, besides more job cards issued and more
employment provided to households over the years. It reveals that though there is
some increase in person-days for Scheduled Tribes against the total person-days for
some years (between 2007-08 and 2009-10), their share is less than that of the total
person-days (Table 5.28 and Table 5.29).
Table 5.28: Performance of the MGNREGA (National Overview)
FY 06-07 FY 07-08 FY 08-09 FY 09-10 FY 10-11 FY 11-12 FY 12-13
FY 13-14
(till 13
Dec.)
Total Job
Cards issued
[in Crore]
3.78 6.48 10.01 11.25 11.98 12.50 12.79 12.72
Employment
provided to
households
(in Crore)
2.10 3.39 4.51 5.26 5.49 5.06 4.98 3.81
Person-days [in crores]
Total 90.5 143.59 216.32 283.59 257.15 218.76 229.86 134.80
STs 32.98 42.07 55.02 58.74 53.62 40.92 40.75 21.09
STs
percentage 36percent 29percent 25percent 21percent 21percent 19percent 18percent 16percent
Source: Govt. of India. 2014. MGNREGA Report to the People.
http://nrega.nic.in/netnrega/writereaddata/Circulars/Report_People_Eng_jan_2014.pdf
Table 5.29: MGNREGA at a Glance Financial Year
2014-15 2013-14 2012-13 2011-12
Wage Employment
Provided (in
lakhs)
Households 57.2 476.8 498.9 506.4
Individuals 75.4 734 797.3 820
Scheduled
Tribes 10.8 129 142.9 147.4
Person days (In
Cr)
Total as per LB 227.0 259.2 278.7 199.6
Person days Generated so far
5.2 218.7 230.5 218.8
Percent of Total LB
2.3 84.4 82.7 109.6
Percent as per Proportionate
LB
38.5 869.1 844.9 109.6
ST person days 0.8 37.6 41 40.9
http://nrega.nic.in/netnrega/home.aspx; accessed on 30 April 2014.
Note: LB means Labour Budget

138
5.6 Occupational Distribution
Table 5.30 presents occupational distribution at all India level from 1971-2001, with
respect to Scheduled Tribes and General Population. This indicates that the
percentage of Scheduled Tribe cultivators to the total Scheduled Tribe main workers
is the highest, when compared to General Population in all the NSSO surveys. The
percentage of agricultural labourers and non-farming workers to the total main
workers among Scheduled Tribes are consistently higher than the General population.
While among Scheduled Tribes, the percentage of cultivators has decreased from 55.6
percent to 54.32 percent between 1971 and 2001, the percentage of non-farming
workers has increased from 9.4 to 15.8 percent in the corresponding period.
In the NSS terminology, rural households were classified into five economic
categories or household types and urban households into four types on the basis of the
occupations pursued by the household members. The five types of rural households
are (i) self-employed in agriculture, (ii) self-employed in non-agriculture, (iii)
agricultural labour, (iv) other labour,55 and (v) other households.56 The four types of
urban household occupations are: (1) self-employed, (2) regular wage / salary earner,
(3) casual labour, and (4) other households.57
Table 5.30: Occupational Distribution among Scheduled Tribes and Others
Category Years Cultivators Agricultural
labourers
Non-farming
workers
Percentage of
total main
workers of Scheduled Tribes
1971 55.6 33 9.4
1981 54.43 32.67 12.9
1991 54.32 32.69 12.81
2001 54.32 29.88 15.8
Percentage of
total main workers of General
populations
1971 42.9 26.9 30.2
1981 41.5 24.94 33.48
1991 38.75 26.15 35.1
2001 31.7 26.5 41.5
Source: .Government of India, VII Five year plan. (1987-1992), Vol.II, P.330.
Census of India, 1991, Series1, Paper-1 Union Primary Census Abstract for SC/STs; Census of India 2001
55 If a household was not one of these three types but its income from total rural labour was greater than that from all self-employment and from other gainful sources, it was classified as “other labour”. 56 The remaining households were classified as “other households”. 57 Household not having any income from gainful employment were classified under “other households”.

139
Figure 5.30: Occupational Distribution among
Scheduled Tribes and Others
Figure 5.31: Occupational Distribution among Scheduled Tribes
According to recent NSSO survey58, self-employment in agriculture is the dominant
source of income among 31.9 percent of all groups of households. Among Scheduled
Tribes also agriculture is the predominant occupation among 37 percent of the
households. Non-agricultural self-employment is the lowest among Scheduled Tribes
(7 percent) than that of all groups (15.5 percent). Similarly, the ‘other labour’ is the
lowest among Scheduled Tribes (13.1 percent) than that of all groups (14.8 percent).
At the aggregate level, 44 percent of Scheduled Tribes were self-employed, compared
to 47.4 percent at all India average. While 46.5 percent of Scheduled Tribes are
engaged in rural labour, the all India average under this category stands at 40.4
percent. This indicates that a considerable proportion of Scheduled Tribes is engaged
58 NSSO survey, (2012) Report No. 543 (66th round, 2009-10)

140
in rural labour, although almost an equal proportion of them are self-employed (Table
5.31).
Table 5.31 Employment distribution of Rural Households among Scheduled
Tribe and All by Household type
Social
group
Self-employed (SE) Rural labour (RL)
Others
All
(incl.
n.r.)
Agriculture Non-
agriculture
Subtotal Agricultural
labour
Other
labour
Sub-
total
ST 370 70 440 334 131 465 95 1000
All 319 155 474 256 148 404 122 1000
Source: NSSO (2012), Report No. 543, p.A-1
Table 5.32 portrays the details of urban households for 2009-10. Here Scheduled
Tribes have the lowest share in the self-employment (23.3 percent) and regular
salaried/wage employment (38.4 percent) than that of all groups. However, Scheduled
Tribes in casual labour (21.1 percent) and ‘others’ category (16.9 percent) has the
highest share than that of all groups.
Table 5.32 Employment distribution of Urban Households among Scheduled
Tribe and All by Household type
Social
Group
Household Type
Self-
employed
Regular Salaried/
Wage Employee
Casual
Labour
Others All (incl. n.r.)
ST 233 384 211 169 1000
All 347 397 134 121 1000
Source: NSSO (2012), Report No. 543, p.A-2
5.7 Income and Expenditure
Despite changes in access to education and affirmative action, social groups that were
traditionally at the lowest rung of the social hierarchy are still economically worse off.
It can be seen from Table 5.33 that ST households have the lowest annual income of
Rs. 32,345 compared to general population. Also the proportion of poor among the
Scheduled Tribe is comparatively larger than general population, as half of the tribal
population is poor, compared to just 12.0 percent of general population. Even states
which have a large tribal population have comparatively lower household incomes
than other states. According to a survey carried out by IHD, states in central India
(Bihar, UP, Madhya Pradesh) have the lowest regional household incomes, while the
lowest incomes are in Odisha. Households in these Central Indian States and Odisha
have only half of the incomes of those in northern plains. It can be seen that except
UP, rest of the states have a higher proportion of tribal population than others.

141
Table 5.33: Household incomes, consumption and poverty among Scheduled
Tribes and All
Household incomes, consumption and poverty across social groups
Social group Average income (Rs) Average consumption ( Rs)
Percent of
poor
Scheduled
Tribes 32345 29523 49.6
General 72717 65722 12.0 Source: IHDS, 2004-05
Figure 5.32: Household Income and Consumption
The proportion of households deriving income from salary is lowest among
Scheduled Tribes (15 percent), while their dependence on agricultural wages (30
percent) and non-farm wages (22 percent) is higher than that of general population, as
seen in Table 5.34. In fact, close to half of Scheduled Tribe households derive their
income from either agricultural wage or cultivation. Even though, the dependence of a
significant percentage of Scheduled Tribe households on cultivation can be inferred,
and their access to land ownership is higher than other social groups, it has to be
mentioned that incomes derived from cultivation is less than all social groups as can
be seen from the productivity levels of these farms.

142
Table 5.34: Proportion of Household Income by Source
Proportion of household income by source (in percent)
Social group Salary Agriculture
wages Non-farm wages
Family
business Cultivation Others
Scheduled
Tribes 15 30 22 7 23 4
General 32 8 9 18 24 10
Source: IHDS 2004-05.
Figure 5.33: Percent of Poor among Scheduled Tribes and General Population
Table 5.35 shows that the average productivity of food grains in tribal populated
states is far less than the all India average. Moreover, farm income in India is more
volatile and uncertain than other sources of income. Table 5.36 depicts the
productivity levels with reference to agriculture and crop yields across the tribal
dominated states over a ten year period (2003-04 to 2012-13). It is observed that the
average food grain yield in the tribal dominant states is relatively less compared to the
all India average, the only exception being Andhra Pradesh. While the all India
average productivity over the ten years stood at 1855 kg/hectare, Maharashtra (1017),
Chhattisgarh (1207), Madhya Pradesh (1252) and Odisha (1398) exhibited
productivity levels well below the national average. It can be concluded that higher
the proportion of tribal population of the state, lower the productivity compared to the
national average.
Table 5.35: Agricultural Productivity in Tribal States
Productivity in tribal states (Average food grains yields kg/hectare)
States/India
2003-
04
2004-
05
2005-
06
2006-
07
2007-
08
2008-
09
2009-
10
2010-
11
2011-
12
2012-
13*
10
year
average
Andhra
Pradesh 2012 2138 2365 2231 2613 2744 2294 2530 2519 2616 2406.2
Chhattisgarh 1231 979 1111 1148 1238 1041 1008 1424 1384 1514 1207.8
Gujarat 1629 1412 1551 1423 1831 1595 1560 1843 1874 1990 1670.8
Jharkhand 1490 1234 1073 1550 1709 1720 1330 1257 1798 1861 1502.2
Madhya
Pradesh 1248 1131 1130 1167 1069 1168 1285 1162 1510 1657 1252.7
Maharashtra 860 836 948 940 1150 1001 1039 1184 1155 1057 1017
Odisha 1328 1300 1349 1369 1484 1363 1397 1432 1303 1658 1398.3
All India 1727 1652 1715 1756 1860 1909 1798 1930 2079 2125 1855.1 Source: Directorate of Economics and Statistics, Department of Agriculture and Cooperation, various years.

143
According to NSSO report, 1999-2000, income sources of Scheduled Tribes in rural
areas from agriculture/fishing and other agriculture enterprises is comparatively
higher than other social groups at the all-India level. Even while other social groups,
derived higher proportion of their income from more consistent sources like rent,
pension, non-agriculture enterprises and interests and dividends, the access to these
sources of income for Scheduled Tribes is comparatively less. The situation is more
striking among the states that have a higher concentration of Scheduled Tribe
population, as the dependency on traditional sources for income is comparatively
higher among these states than at the all India level (Table 5.36).
Table 5.36: Number per 1000 households reporting each source of income during
the period of last 365 days belonging to different social groups, by State/UT:
Rural in 1999- 2000
Number per 1000 households reporting each source of income during the period of last 365 days
belonging to different social groups, by State/UT: Rural in 1999- 2000
State/
Social
Group
No. Per 1000 Households Reporting Income From
Avg.
No. Of Hhs
MP
CE
Culti
vatio
n
Fishing/
Other
Agr.Ent
erprises
Wages/
Salarie
d
Employ
ment
Non-
Agr.
Enter
prises
Pen
sion Rent
Rem
ittan
ces
Inter
est
And
Divi
dend
s
Ot
her
s All (Rs)
Esti
mate
d
Sa
mp
le
Andhra Pradesh
ST 89 114 67 36 34 0 30 13 79 66 383
840
2
44
1
Others 287 265 184 322
31
9 458 382 374
23
8
26
2 564
333
42
14
90
all
groups 1000 1000 1000 1000
10
00 1000
100
0
100
0
10
00
10
00 453
127
065
51
75
Bihar
ST 108 156 78 50 95 43 30 126 78 81 337
120
60
67
3
Others 232 105 125 200
40
5 293 295 196
23
1
19
4 458
289
94
15
26
all
groups 1000 1000 1000 1000
10
00 1000
100
0
100
0
10
00
10
00 384
149
510
72
83
Gujarat
ST 226 189 259 149
20
8 112 199 34
25
9
20
3 438
120
06
49
9
Others 415 385 286 411
63
9 545 371 589
26
4
37
2 655
220
43
93
2
all
groups 1000 1000 1000 1000
10
00 1000
100
0
100
0
10
00
10
00 551
592
43
24
79
Madhya Pradesh
ST 300 585 360 131 17 104 202 184 41 29 325 334 14

144
0 6 9 13 00
Others 151 41 91 194
21
6 360 238 246
16
0
14
8 516
165
80
83
6
all
groups 1000 1000 1000 1000
10
00 1000
100
0
100
0
10
00
10
00 401
111
932
51
42
Maharashtra
ST 141 95 188 65 38 50 174 11
12
7
16
9 384
196
72
67
6
Others 450 548 348 462
54
9
37
0 468 748
54
9
39
7 570
461
45
17
47
All
groups 1000 1000 1000 1000
10
00
10
00 1000
100
0
10
00
10
00 496
116
151
41
18
Odisha
ST 322 214 332 257
16
1 76 125 207
31
1
28
7 285
181
89
86
1
Others 180 145 146 178
27
3
36
3 393 344
22
2
19
0 480
120
66
79
5
All
groups 1000 1000 1000 1000
10
00
10
00 1000
100
0
10
00
10
00 373
633
83
34
72
All-India
ST 127 122 129 52 41 32 54 38
13
2 109
3
8
8
149
444
10
12
4
Others 332 345 241 344
49
3
41
2 391 566
30
1 307
5
7
7
421
353
23
66
8
All
groups 1000 1000 1000 1000
10
00
10
00 1000
100
0
10
00 1000
4
8
6
137
168
8
71
26
8
Source NSS Report 463: Sources of Household Income in India, 1999- 2000, Appendix Tables.
The monthly per capita expenditure (MPCE) among different social groups at the all
India level, Scheduled Tribes reported close to 15 percent less expenditure than other
social groups and 32 percent less than households in the other category. The state
level scenario depicts MPCE among Scheduled Tribes is comparatively less than the
all India average (Table 5.37). In fact the difference of MPCE between the higher
strata (Other Castes) and Scheduled Tribes is more glaring among the tribal
dominated states, as it ranged between 30 percent and 50 percent (for instance in
Odisha).

145
Table 5.37: State-wise Monthly per capita expenditure class for Scheduled
Tribes and all social groups per 1000 distribution of persons
State/
social
group
Monthly Per capita expenditure class (Rs)
<1
20
120-
140
140-
165
165-
190
190-
210
210-
235
235-
265
265-
300
300-
355
355-
455
455-
560
560 &
above
Andhra Pradesh
ST 67 64 136 138 79 109 98 50 70 81 79 29
All 37 42 86 119 93 108 111 104 105 88 54 53
Bihar
ST
11
4 129 188 172 90 76 78 51 52 29 7 14
All 73 91 147 159 104 106 98 77 76 43 15 11
Gujarat
ST 23 54 73 109 86 118 108 124 154 117 14 20
All 15 27 52 84 73 97 121 129 151 152 50 49
Madhya Pradesh
ST
14
9 106 143 155 103 99 80 57 57 35 11 5
All 74 75 109 135 94 103 97 85 82 77 38 31
Maharashtra
ST 81 101 151 146 116 83 91 65 74 49 20 23
All 77 57 110 117 77 95 101 89 100 83 42 52
Orissa
ST
21
5 143 188 150 95 63 52 34 30 22 4 4
All 92 93 152 139 120 106 81 65 70 45 18 19
All-India
ST 93 83 125 140 102 104 93 76 79 61 24 20
All 47 52 91 112 87 102 107 100 107 98 47 50 NSS Report 463: Sources of Household Income in India, 1999- 2000, Appendix Tables.
From table above, we can observe that at the all India level, the expenditure of
Scheduled Tribes is predominantly in the range of Rs. 120 to 235, whereas the per
capita expenditure for all social groups is mostly above Rs. 210. As income is directly
linked to expenditure we may conclude that the income sources of Scheduled Tribes
are comparatively less than others. The states that have predominantly higher
concentration of ST population (Andhra Pradesh, Bihar, Gujarat, Madhya Pradesh,
Maharashtra and Odisha), we can clearly see the all India picture being replicated in
these states. However, the degree of variation is much higher among these states
compared to the all India trend. In these states the proportion of persons in the higher
MPE class is much lower compared to the all India scenario.

146
Table 5.38: Changes in Average Monthly per Capita Expenditure (MPCE)
Changes in Average Monthly Per Capita Expenditure (MPCE) Over the Period, 1999-00, 2004-
05 and 2009-10
S.No. Social
Group
55th Round (1999-00) 61st Round (2004-05) 66th Round (2009-10)
Rural Urban All Rural Urban All Rural Urban All
MPCE (Rs.)
1 ST 386.69 608.79 417.42 426.19 857.46 463.15 873 1797 966
2 Others 577.22 1004.75 729.45 685.31 1306.1 919.09 1281 2467 1541
All 485.88 854.7 578.62 558.78 1052.36 683.75 1054 1984 1535
Source: NSSO (2007), p.31; NSSO (2012), Oct., latter Report gave data on Rural and Urban and so recalculated from No. of
Persons at Pp. 18, A.54 & 72
Temporarily, comparison of Monthly Per Capita Expenditures (MPCEs) becomes a
problem, because it is only in nominal terms and the change in real situation (at
constant prices), as inflation is not considered.
Table 5.38 presents the information on MPCEs among social groups by rural, urban
and rural and urban sectors. In rural areas, in 1999-00 the MPCE of Scheduled Tribes
was Rs.386.69, compared to Rs. 577.22 recorded for other groups. During 2004-05
and 2009-10, the MPCE increased to Rs. 426.19 and Rs. 873 for Scheduled Tribes
and other groups respectively. However, the gap between Scheduled Tribes and other
social groups has not narrowed down over the years. On the contrary, the gap
expanded rapidly during 1999-00 to 2004-05. In urban areas also, the MPCE of
Scheduled Tribes exhibited growth over the years from Rs. 609 (1999-00) to Rs. 858
(2004-05) and from Rs. 1797 (2009-10) for other groups. Though the MPCEs of
Scheduled Tribes in urban areas is significantly higher than Scheduled Tribes in rural
areas, the gap between Scheduled Tribes and other communities is even higher in
urban areas. Thus, the gaps between the MPCE of Scheduled Tribes and those of
other groups are significant across all the segments and study periods.
Table 5.39: Gaps of MPCEs of Social Groups from Scheduled Tribes
Gaps of MPCEs of Social Groups from Scheduled Tribes in Percentages
S.No.
MPCE Gap
between
55th Round (1999-00) 61st Round (2004-05) 66th Round (2009-10)
Rural Urban All Rural Urban All Rural Urban All
1
Others and
ST 49.27 65.04 74.75 60.8 52.32 98.44 46.74 37.28 59.48
2
All Groups
and ST 25.65 40.39 38.62 31.11 22.73 47.63 20.73 10.41 58.88
Source: Results of Table 25 No. of Persons at Pp. 18, A.54 & 72.
Note: In each year ST MPCE subtracted from that of other group and then percentage calculated with Scheduled Tribe MPCE as
base.
The gap between Scheduled Tribes and Others, and Scheduled Tribes and all groups
is depicted from the Table 5.39. In rural areas, the gap between others and Scheduled

147
Tribes has remained steady over the years. Though gap increased substantially from
49.2 percent during 1999-00 to 60.8 percent in 2004-05, it has however narrowed
down to 46.7 percent during the latest round of estimates. However, it has to be noted
that the gap between the latest round and earliest round is similar, implying that there
is no improvement in the position of Scheduled Tribes. With regard to Scheduled
Tribes in urban areas, the gap in MPCEs has reduced considerably over the years
from 40.4 percent in 1999-00 to 10.4 percent during 2009-10.
Comparing Scheduled Tribes and all other groups in rural areas, we can notice that
the gap followed the trend between Scheduled Tribes and others, as it increased from
25.6 percent to 31.1 percent between 1999-00 and 2004-05 respectively, only to
decline to 20.7 percent in 2009-10. Though the gap between Scheduled Tribes and all
groups is lower than Scheduled Tribes and others, however as in the case of
Scheduled Tribes and others the gap is substantially higher. In urban areas also, the
same trend exists between all groups and Scheduled Tribes, and similar case is
observed in case of rural areas also.
In rural and urban areas combined, the gap between the MPCEs of Scheduled Tribes
and others is similar to that of the general trend exhibited, as it increased in 2004-05
to again stabilize at initial levels in the latest round (2009-10). However, comparing
all groups and Scheduled Tribes in this rural and urban segment, we need to notice
that the gap has increased over the years from 38.6 percent (1999-00) to 47.6 percent
and 58.8 percent during 2004-05 and 2009-10 respectively.
5.8 Poverty Profile
Panagariya and More computed the estimates of the poverty rates as the percentages
of population below the Tendulkar poverty line in rural and urban regions and in the
combined areas (Rural + Urban), for Scheduled Tribes and all social groups for years
1993-94, 2004-05, 2009-10 and 2011-12, based on NSS reports for the respective
years.59 The information is presented in Table 5.40.
59 Panagariya, Arvind and Vishal More. 2013. Poverty by Social, Religious and Economic Groups in India and Its Largest
States, 1993-94 to 2011-12, Working Paper No. 2013-02. School of International and Public Affairs, Institute for Social and
Economic Research and Policy, Columbia University.

148
Figure 5.34: Percentage of BPL Population (Rural)
Table 5.40: Poverty by Social Groups, 1993-94 to 2011-12 in All-India –
Rural, Urban and Combined
Social Groups Percent of
Share in
Population
Regions Percent of Population Below the
Tendulkar Line
Percent Point
Poverty
Reduction
1993-
94
2004-
05
2009-
10
2011-
12
1993-
94
to
2004-
05
2004-05
to
2011-12
Rural
ST 11.1 65.9 62.3 47.4 45.3 3.7 16.9
FC 23.0 44.0 27.1 21.0 15.5 9.0* 11.6
All 100.0 50.3 41.8 33.3 25.4 8.5 16.4
Urban
ST 3.5 41.1 35.5 30.4 24.1 5.6 11.4
FC 40.3 28.2 16.1 12.4 8.1 5.8* 8.0
All 100.0 31.9 25.7 20.9 13.7 6.2 12.0
Combined (R+U)
ST 8.9 63.7 60.0 45.6 43.0 3.7 17.0
FC 28.0 39.5 23.0 17.6 12.5 8.1* 10.5
All 100.0 45.7 37.7 29.9 22.0 8.0 15.7
* Estimated using comparable estimates of poverty among the OBC and FC combined in
2004-05, which came down to 35percent (Rural), 22.5percent (Urban) and 31.4percent (Rural + Urban) in 2004-05.
Source: Arvind Panagariya and Vishal More (2013).

149
Figure 5.35: Percentage of BPL Population (Urban)
Figure 5.36: Percent of BPL Population (Rural and Urban)
In rural India, in 1993-94 poverty rate was very high, at 50.3 percent at the overall
level. Among Scheduled Tribes, it was quite high with 65.9 percent. If we consider
the reduction in the poverty levels between 1993-94 and 2004-05, only Scheduled
Tribes lagged behind all social groups. It is observed that Scheduled Tribes have
poverty rate reduction by only 3.7 percent points, whereas for all groups it was around
8.5 percent. By 2009-10, the reduction rates were substantial across all the groups
between 2004-05 and 2009-10; and Scheduled Tribes also recorded a remarkable
reduction. But poverty rate among Scheduled Tribes was high with 47.4 percent.
Further, between 2009-10 and 2011-12, only Scheduled Tribes had less progress with
a reduction of only 2.1 percent points, while all other groups exhibited substantial
reductions in poverty rates. Thus it is reasonable to compare 2004-05 with 2011-12

150
and see the performance. In the period between 2004-05 and 2011-12, among
Scheduled Tribes the poverty rate was reduced by 16.9 percent points.
In urban areas also, decline in poverty rates is similar to that of rural areas. Among all
social groups, the poverty rates of urban areas are less than their counterparts across
surveys. As a concomitant effect, the poverty rates of combined areas (rural + urban),
lie between the rates of rural and urban areas at each point of time for all social
groups. But, the poverty rates are higher among Scheduled Tribes.
Panagariya and More (2013) sharply point that the second period (i.e., 2004-05 to
2011-12) has been more favorable in reducing the rates of poverty than the first period
(i.e., 1993-94 to 2004-05). They account for this on the ground that the second period
due to its better economic growth could bring in broad-based benefit to all sections of
the society. In this connection, the Planning Commission too has held a view which is
not dissimilar to theirs. The formula adopted by them has, however, been the subject
of much dispute and contestation. As reported in The Hindu newspaper in March
2012,
“The Planning Commission on Monday released the latest poverty estimates for the country
showing a decline in the incidence of poverty by 7.3 per cent over the past five years and
stating that anyone with a daily consumption expenditure of Rs. 28.35 and Rs. 22.42 in urban
and rural areas respectively is above the poverty line.
The new poverty estimates for 2011-12 will only add to the furore triggered by the
Commission’s affidavit in the Supreme Court in October (2011) in which the BPL cap was
pegged at an expenditure of Rs. 32 and Rs. 26 by an individual in the urban and rural areas
respectively at the going rate of inflation in 2010-11.”60
5.9 Average Debt and Incidence of Indebtedness
Table 5.41 presents information on total debt, average debt, debt asset ratio and
incidence of indebtedness for rural and urban households among Scheduled Tribes
and all social groups. In rural areas, if we see the distribution of total debt in relation
to the distribution of households, the share of total debt in relation to their share of
households is relatively small among Scheduled Tribes. Further, interclass
concentration ratio is quite less for Scheduled Tribes (39.21 percent). Table 5.41 also
reflects average debt of Scheduled Tribes (Rs. 3205), which is lower than that of all
social groups (Rs. 7539). Debt asset ratio among Scheduled Tribes (2.3) is lower than
the aggregate (2.8) in rural areas. As regards the incidence of indebtedness,
Scheduled Tribes have the least share (17.9 percent), whereas all social groups have
higher share of IOI to the tune of 26.5 percent.
60 K. Balchand, Now, Planning Commission lowers the poverty line, The Hindu, March 20, 2012.

151
Table 5.41: Total Amount of Outstanding Cash Dues (TD), Average Debt (AOD)
per Household, Average Value of Assets (AVA), Debt Asset Ratio (DAR),
Incidence of Indebtedness (IOI) as on 30.6.02 for each social group
S.No
.
Social
Groups
No. of est.
household
s
('00)
Percen
t
Distri-
bution
of
House-
holds
Total
Debt
(Rs.
crores)
Percen
t Share
of Debt
Average
of
Debt
per HH
( Rs.)
Averag
e
Value
of
Assets
(Rs.)
Debt
Asset
Ratio
(%)
IOI
( %)
Rural
1 ST 150825 10.2 4834 4 3205 136640 2.3 17.9
2 Others 394457 26.7 41171 37 10437 429513 2.4 25.7
3 All 1478529 100.0 111468 100 7539 265606 2.8 26.5
Urban
1 ST 16547 3.0 1528 2 9233 240295 3.8 12.2
2 Others 264851 47.7 35959 55 13577 560362 2.4 15.3
3 All 554976 100.0 65327 100 11771 417158 2.8 17.8
Source: NSSO (2006), April, p.23; Note: 1. DAR is derived as follows: DAR = (AOD/AVA) * 100; 2. ‘All social groups’ includes
households with n.r. cases of social group Incidence of Indebtedness.
Figure 5.37: Incidence of indebtedness among Scheduled Tribes and other
groups (percent)
In urban areas, while the percentage distribution of households among Scheduled
Tribes is 3.0 the percentage share of debt is 2. However, average debt for
Scheduled Tribes (Rs.9233) is higher than that of all social groups (Rs. 11771).
The debt asset ratio among Scheduled Tribes is 3.8percent, which is higher than at
the aggregate level (2.8 percent). Just as in rural areas, the IOI is the least among
Scheduled Tribes (12.2 percent).

152
5.10 Recommendations
1. There is a dire need to establish agro-based training institutions and related
labour-intensive processing industries in tribal regions. Terms and quantum of
micro-credit should be made reasonable for individuals, SHGs, cooperative
institutions and Gram Sabhas in Scheduled Areas for the tribes to pursue these
occupations.
2. In order to make use of land available with the tribal farmers, they should be
motivated to undertake organic farming and eco-forestry. This requires
concerted efforts by the Departments of Agriculture and Forest to motivate the
tribal farmers to undertake such activities.
3. Although majority of STs have land and cultivation is their main occupation,
water for agriculture is the greatest impediment in production. Micro
watershed development program with people-centered participatory approach
is a good method for poverty reduction through natural resource management
in tribal regions. Therefore, micro watershed should be given top-most priority
in tribal areas to enhance agricultural productivity.
4. It is imperative to strategize water management in degraded and undulating
land, dependent on erratic monsoon. Water conservation through large dams
has been proved contrary to the interests of the tribes. Therefore, the best
strategy would be to construct water harvesting structures on various small
and large water sources. Even on big rivers, small water harvesting structures
could be constructed, which would be environment friendly.
5. The deprivation of STs of cultivated land adds to their marginalization and
penury. This warrants the prevention of all kinds of tribal land alienation
through strict enforcement of laws and restoration of alienated land to the
tribal owners as per the provisions of the PESA and the confirmatory Acts by
various States. There should be monitoring agencies at the National and State
levels to prevent alienation of tribal land and its restoration.
6. Since tribal inhabited regions have good forest cover (with or without trees
now), they should be allowed to participate in the protection and management
of forests. The newly acquired land under FRA, 2006 could be utilized in eco-
forestry rather than for food grain cultivation, which could give more return to
the ST farmers, in case they want to opt for it.
7. Credit and marketing facilities need to be extended to the STs. Delivery of
social justice must be monitored by the National Commission for Scheduled
Tribes, both at the national and state levels.

153
8. There is severe under-representation of STs and pending vacancies in Central
Government services. As far as the representation of STs in Public Sector
Banks, Financial Institutions and Insurance Companies, STs accounts for 6.55
per cent, which is less than the mandatory 7.5 per cent of ST reservations to be
followed by these institutions. Therefore, the Government should follow a
transparent policy with regard to jobs for STs in public sector. No ST
candidates who fulfill the basic eligibility criteria for a specific post should be
rejected on the ground of no suitable candidates found.
9. The discriminatory credit policy of the financial institutions is a major
deterrent in the participation of STs in business. Entrepreneurs among STs
must be given credit facility on par with other social groups. Further, all steps
must be taken by the Government for skill development among the tribal
youth to make them employable or self-employed, according to their
aspirations.
10. The participation of STs in MGNREGA has been decreasing from its
inception in 2006. This trend is very disturbing, which should be investigated
and monitored by a special agency under the administrative control of MoTA.
11. Tribals should be encouraged to use their traditional knowledge to meet their
needs by recreating their forest ecosystem and forest-based livelihood.
12. The Particularly Vulnerable Tribal Groups (PVTGs) among the tribes need
special attention due to their vulnerability in the present situation. Their
customary right to land, forest and sources of livelihood must be respected and
protected. The issue of nomenclature must be addressed by commissioning a
special study. MoTA should ensure that all states having PVTGs should take
steps to have micro-projects for individual PVTGs to utilize the grants
received under SCA. The Project Offices for PVTGs should be made to report
to the MoTA about the development activities undertaken for the PVTGs
under their jurisdiction, rather than submitting allocation and expenditure
statements.
13. Data on development parameters with respect to STs are not available for the
purpose of policy planning and implementation. Therefore, a National Institute
of Tribal Development, an autonomous research organization, has to be set up
exclusively for undertaking research on STs.

154
6. Education
6.1 Introduction
This chapter presents an interface of the Government policy of educating the tribals of
India and their actual educational status. It traces the evolution of the Government
policy, detailing perceptions about education for tribals and measures taken by the
Government to address the situation. The chapter further examines the impact of these
policies, with the help of available data. While there is a brief reference to the period
prior to the National Policy on Education, 1986, emphasis is placed on developments
in the last two decades. In 1992, the Government re-issued the National Policy by
adding certain focus as well as a Program of Action, wherein several new schemes
were introduced in the interest of the weaker sections of society. The Government
considers this phase as a ‘watershed’ one since the new measures yielded distinct
results in terms of literacy within a decade.61
The chapter presents the post-1992 educational developments at the three basic levels
of education, namely, primary, secondary and tertiary. But given the complex nature
of the problem at the primary level in large parts of tribal India – which has a bearing
upon low tribal participation at the secondary and tertiary levels – special attention is
paid to primary education.
6.2 Evolution of Educational Policy
The overarching principle of universal free compulsory education is enshrined in
Article 45 and Article 46 of the Constitution of India enjoins upon the Indian State the
responsibility of taking ‘special care’ of educational interests of the Scheduled Castes
and Scheduled Tribes. At the time of Independence, these governing provisions
ensured that the educational needs of the tribals were met with. Living in remote
terrains and on the periphery of other social groups, the tribals were culturally
exclusive. As compared with non-tribal population, tribals were considered most
backward sections of the society. Except for a few pockets in the Northeast and
central India, tribal societies were hardly influenced by the modern education system.
Available statistics of the time show that the tribal participation in formal schooling
was marginal. In fact, the literacy rate of the tribals was only 3.46 per cent in 1951.
The insignificant presence of tribal people owed to the British colonial educational
policy, which did not care for the education of the tribal population. Under the well-
known colonial ‘filtration’ theory, education had to trickle down to the masses
through the upper classes, who would be the first to be educated at centrally located
61 Planning Commission, Government of India, Twelfth Five Year Plan, Volume II, p. 19. While taking literacy as a rough
indicator of education, it must be made clear that education is far broader than literacy, which is only one of the skills acquired
from learning.

155
model institutions. In certain cases, the Government bypassed the filtration route and
opened schools in the interior tribal areas, in order to pacify the tribal population, who
were protesting against oppression, by teaching them the colonial idea of rule by law.
The opening of schools in the difficult areas of tribal habitation involved extra
investment. It also demanded special effort by committed staff, since the tribal people
were not used to any organized system of education and did not appreciate the value
of colonial Western education. The colonial government depended upon the Christian
missionaries to induce and educate the tribals since 1854.62 A few government
schools and schools run by missionaries, confined to small areas, were all that existed
for educating the tribals. Lack of sufficient educational avenues left the tribal people
lagging behind other social groups.
Against the background of neglect under British colonialism, the nation’s move to
reach out to the tribal people educationally through an aggressive program of mass
education was a bold move. The epoch was momentous and the spirit came from the
urge of democracy and socialism, seeking to empower and shape the backward
masses as equal citizens of the country. The mandate of the Constitution captured the
nation’s resolve. This was clearly visible in the deliberations of the apex national
body, the Central Advisory Board of Education (CABE), which devised the National
Education Policy. The opening sentence of the Board’s blueprint for national
education titled Post-War Educational Reconstruction in India – ‘upon the education
of the people of this country the fate of this country depends’ – reflected the
importance assigned to education in nation-building.63 The national government
aimed to achieve universal compulsory education in ten years, by 1960, while CABE
drew up a 40-year timeline. The provision under Article 45 of the Constitution
binding the state to fulfil the goal of universal compulsory education was not
accomplished.
Two Commissions of the Government, namely the Scheduled Areas and Scheduled
Tribes Commission (1960-61), chaired by Shri. U.N. Dhebar, and the Indian
Education Commission (1964-66) closely examined the low educational level of the
tribals, with a view to address the disparity. The Dhebar Commission studied the
difficulties of and barriers to tribal education in detail. It found that the problem of
absenteeism, stagnation and drop-outs among the tribals were far greater than among
other social groups.
6.2.1 Policy Review by Dhebar Commission, 1960
The early years of independence were the age of a predominant nationalist view that
the Indian tribes were ‘backward Hindus’, as propounded by sociologist, G.S. Ghurye.
62 ‘Despatch from the Court of the Directors of the East India Company to the Governor General of India in Council no. 49 dated 19 July 1854, para 41, in Richey, J.A. ed. Selections from Educational Records, Part II, New Delhi: National Archives of
India,1965, p. 376. 63 Bureau of Education, Post-War Educational Development in India: Report by the Central Advisory Board of Education, Delhi:
Manager of Publications, 1944.

156
Called ‘vanavasi’ or ‘adimjati’, the tribals were believed to be primitive savages, in
dire need of ‘civilization’ by the agency of the advanced plainsmen. Just before the
institution of the Dhebar Commission, the then Prime Minister, Shri. Jawaharlal
Nehru enunciated a set of tenets on the tribal question and development in a foreword
to the second edition of Verrier Elwin’s book, A Philosophy for NEFA, which
reversed the established view. Nehru pleaded that development of the tribals should
be ‘along the lines of their own genius’ and effort should be made not to impose
anything on them from outside. Further, he suggested encouragement to tribal
traditional arts and culture. Nehru also disapproved of the paternalism of outsiders
and wanted to train and build the tribals’ capacity to carry out the work of
administration and development.
The tone set by Nehru impacted the Dhebar Commission. Thus, in the field of
education, the Commission distinctly departed from the earlier approach and policies.
The Commission recognized pedagogical ingredients in tribal culture and wanted to
make use of tribal language and cultural resources, such as folklore, songs and history
in teaching. The Commission was aware that such far-reaching intervention required
re-orientation of teachers, revision of curriculum and development of instructional
materials. Recognizing the crucial role of teachers in the whole educational process,
the Commission suggested their complete familiarity with tribal life, culture and
language, and appealed to the teachers to be the tribals’ friend, philosopher and guide.
To remove the existing cultural gulf between teachers and students, the Commission
recommended appointment of teachers from the tribal community, opening teacher
training centres in the tribal heartlands and raising a separate cadre of teachers for a
period of twenty years.64
The Dhebar Commission went on to establish the appropriateness of Mahatma
Gandhi’s concept of ‘basic education’ to the tribal societies. Gandhi’s concept centred
on craft as the means of teaching and learning, and using the vernacular language as
the medium of instruction. Conceived to educate the rural population, the idea was an
alternative to formal, literary and colonial Western system of education. But, detailed
pedagogy along the lines of what Gandhi suggested was not formulated, especially in
the context of the tribal societies.
Besides examining the central problem of approach of tribal education and role of
teachers in the system, the Commission attended to other problems such as poverty-
related issues and children engaged in household work. This paved the way for the
making of a broader policy of tribal education. The Commission, thus, stressed the
need for mid-day meals, clothing, free books, reading and writing materials to all
tribal children in educationally backward areas. The Commission further considered
the children’s difficulties on account of topographical factors and recommended
64 Government of India, Report of the Scheduled Areas and Scheduled Tribes Commission, Volume I 1960-61, Delhi:
Government of India Press, 1961.

157
opening schools in a locality where there were at least 30 school-going children,
though the general norm should be a school within one mile. The Commission then
suggested adjustment of timing, vacations and holidays of schools to suit the tribal
social and cultural life. It even proposed creation of an ambience of tribal culture in
the schools.
The Indian Education Commission endorsed the suggestions and recommendations of
the Dhebar Commission, adding a note of urgency that ‘intensive efforts’ need to be
made to provide five years of early education to all tribal children by 1975-76.65 In
order to achieve this, the Commission wanted the support of simultaneous intensive
parental education.
6.2.2 Sluggish Trend of Growth
The Education Commission’s plea remained unfulfilled. Literacy rate increased from
8.54 in 1961 to 11.3 per cent in 1971, rising marginally to 16.35 per cent in 1981.
Within this, tribal female literacy rate was much lower, at 4.85 per cent in 1971 and
8.04 in 1981. Three decades of experience of tribal education (1951-81) indicated
clear trends at the primary level: first, the tribals’ educational status grew at a slow
pace; second, there was a wide gap between the literacy rate of the tribals and the
general population (Table 6.1); and third, there was a high dropout rate, especially at
the primary level; the drop-out was of chronic nature as the country-wide data
portrays (Table 6.2 and 6.3).
Table 6.1: Scheduled Tribe Literacy Rate and Gap, 1961-1981
Year ST SC GEN Gap between
ST and SC
Gap between
ST and GEN
1961 8.54 10.27 27.86 1.73 19.32
1971 11.29 14.67 33.80 3.37 22.5
1981 16.35 21.38 41.30 5.03 24.95 Source: Census of India, authors’ calculation from census of India, various years
Table 6.2: Scheduled Tribe Drop-out Rate in Comparison, 1980-81
Year ST SC GEN
I-V I-VIII I-X I-V I-VIII I-X I-V I-VIII I-X
1980-
81 75.66 86.71 91.18 60.16 76.85 86.91 58.70 72.70 82.46
Source: MHRD, GOI, Educational Development of Scheduled Castes and Scheduled Tribe, Status and Programs, August-2005
65 National Council of Educational Research and Training, Education and National Development: Report of the Education
Commission 1964-66, New Delhi: NCERT, 1970, pp. 245-46.

158
Table 6.3: State-wise Scheduled Tribe Drop-out Rate from Class I-X, 1981-82
Level of Education Primary Stage (Class I-V)
Middle Stage
(Class I-VIII)
Secondary
Stage (I-
X)
State Boys Girls Total Total Total
Andhra Pradesh 64.83 73.81 68.1 85.4 91.01
Assam 73.53 79.83 76.22 88.37 71.34
Bihar 78.89 83.91 80.58 86.06 92.66
Gujarat 69.35 78.27 72.94 77.11 85.79
Haryana - - - - -
Himachal Pradesh 39.97 49.28 43.05 61.99 80.45
Jammu & Kashmir - - - - -
Karnataka 48.14 48.09 48.12 26.98 45.53
Kerala 39.04 34.64 37.16 45.1 69.5
Madhya Pradesh 66.46 80.39 70.65 84.53 97.13
Maharashtra 70.41 80.18 74.22 85.08 90.55
Manipur 85.69 84.89 85.36 90.84 91.82
Meghalaya 76.86 76.62 76.74 84.75 89.81
Nagaland 75.09 76.59 75.75 87.84 91.04
Odisha 75.39 83.36 77.99 91.23 94.04
Punjab - - - - -
Rajasthan 69.35 84.9 71.48 82.8 86.07
Sikkim - - - - -
Tamil Nadu 34.68 41.68 37.59 72.01 85.43
Tripura 67.61 73.8 69.76 87.97 93.93
Uttar Pradesh 0 5.62 0 53.69 82.02
West Bengal 70.84 65.64 69.27 87.04 93.33
Union Territories
A&N Islands 50.1 39.17 45.74 43.64 74.91
Arunachal Pradesh 77.22 78.18 77.53 87.91 92.93
Chandigarh - - - - -
Dadra and Nagar Haveli 73.6 81.65 76.43 93.64 98.17
Delhi - - - - -
Goa, Daman and Diu 63.19 73.33 66.38 87.31 91.8
Lakshadweep 1.03 16.25 8.01 51.2 66.39
Mizoram 61.61 64.13 62.83 67.86 80.63
Pondicherry - - - - -
India 71.57 78.43 74 84.99 91.65 Source: Ministry of Human Resource Development (Department of Education), reproduced in Report of the Commissioner for Scheduled Caste and
Scheduled Tribe 1986-87 (28th Report).
With 91.65 per cent of the tribal students dropping out by Class X, their higher
education also suffered. Table 6.4 below shows that the tribals’ overall participation
in higher education was just 1.62 per cent compared to 91.3 of the general population
and 7.08 per cent of the Scheduled Castes. Discipline-wise presence at different levels
of higher education shows that in science and technical subjects, the Scheduled Tribes
were below one per cent.

159
Table 6.4: Discipline and Level-wise Scheduled Tribe Presence in Higher Education,
1978-79
Course ST SC GEN
1. Under Graduate
Arts 2.48 9.85 87.67
Science 0.83 4.44 94.73
Commerce 1.27 4.76 93.97
2. Post Graduate
Arts 1.93 10.54 87.53
Science 0.79 2.93 96.28
Commerce 1.29 5.42 93.29
3. Education
Undergraduate 1.30 6.24 92.46
Postgraduate 0.68 3.42 95.9
4. Engineering/Technology
Undergraduate 1.20 6.16 92.64
Postgraduate 0.18 1.92 97.9
5. Medicine
Undergraduate 1.82 9.98 88.2
Postgraduate 0.50 3.69 95.81
6. Agriculture
Undergraduate 0.71 8.39 90.9
Postgraduate 0.87 4.48 94.65
7. Veterinary
Undergraduate 1.14 7.02 91.84
Postgraduate - 1.37 98.63
8. Law
Undergraduate 1.32 7.02 91.66
Postgraduate 0.17 1.37 98.46
9. Others
Undergraduate 0.42 5.93 93.65
Postgraduate 0.56 3.56 95.88
Total 1.62 7.08 91.3 Source: Report of the Commissioner for Scheduled Castes and Scheduled Tribes, 1986-87 (28th Report)
6.3 Early Educational Planning
Periodic government surveys and assessments revealed stark facts on poor educational
status of the tribals. The Fourth All India Educational Survey, (1978) for instance,
found that 83 per cent of the tribal people were covered by a school within a radius of
one kilometre. At the same time, more than 25,000 tribal habitats had no school at all.
As far as secondary schooling was concerned, 82.18 per cent of the tribal population
was within eight kilometres reach of secondary school, while only 18.8 per cent of
them had access to higher secondary school.66 In the case of the tribal habitats, often
circled by forests and hills, the distance of one or eight kilometres did not present the
real picture of access to schools.
During the First Five Year Plan period, the government attended to ‘pre-matric’ and
‘post-matric’ educational needs of the tribals. Some 4,000 schools were established in
the tribal areas. This included 1,000 Ashrams and Sevashram Schools and 650
66 NCERT, Fourth All India School Education Survey, New Delhi: NCERT, 1978.

160
Sanskar Kendras, Balwadis and Community Centres in the central tribal belt between
Odisha in the east and Rajasthan and Maharashtra in the west. Besides, assistance was
given to tribal students by way of scholarships, grants, hostel fees, etc. The Second
Five Year Plan carried forward work in similar line.67
The government interest seems to have been more on secondary, higher secondary
level and higher education. Despite the promises of high importance to primary
education, elementary education was neglected, as can be seen in the details of the
first two Five Year Plans (Table 6.5). Immediately after Independence, the
Government had constituted two Commissions, one each on University education and
secondary education, but so far as the outstanding problem of primary education was
concerned, the Government had set up a committee to examine the same.
Table 6.5: Field-wise Distribution of Plan Outlay in the First and Second Plans
Fields of Education First
Plan (Rs.
in crores)
Second Plan
(Rs. in
crores)
Elementary Education 93 89
Secondary Education 22 51
University Education 15 57
Technical and Vocational Education 23 48
Social Education 5 5
Administration and Miscellaneous 11 57
Total 169 307
Source: Planning Commission, 2nd Five Year plan (1956-61), p.1 (www.planningcommission.nic.in/plans)
The Government, in this initial phase, paid special attention to educational grooming
of the tribal children in Ashrams, viz. hostels and residential schools, segregating
them from their homes and habitats. The consideration occasionally was to bring
children to relatively central locality from remote parts where opening school was
immediately not possible. But the guiding principle was that the tribal people were
savage and wild, who needed to be civilized by the means of education outside the
tribal social and cultural life.68 With this in mind, a step further in the direction of
Ashram proposition was opening of the ‘Sanskar Kendras’ to re-orient children in
upper-caste Hindu cultural norms. Such importance assigned to residential school
concept, led, later on, to the tendency of Ashramization of the whole program of tribal
education.
The Sixth Five Year Plan (1980-85) estimated that 56 per cent of the tribal children of
the country (49 per cent boys and 70 per cent girls) were yet to receive elementary
67 Government of India, Report of the Scheduled Areas and Scheduled Tribes Commission, Volume I 1960-61. 68 For the application of this idea in Ashram mode of education see, Bilthare, D.P., ‘Adimjatiyon Ka Sikshan’, in Report of the Second Conference for Tribes & Tribal (Scheduled) Areas, Lohardaga, 11, 12 and 13 November,1953, Delhi: Bharatiya Adimjati
Sevak Sangh, 1954, pp. 166-76.

161
education.69 After deliberating on the previous challenges, a National Policy on
Education was framed in 1986. Recognizing that the situation of stagnancy at primary
school level bore upon overall low participation of disadvantaged sections at upper
levels, the Seventh Five Year Plan (1985-90) set out to give ‘overriding priority’ to
universalization of elementary education for the children of age-group 6-14 years by
1990.70
6.4 National Policy on Education, 1986
To realize the universalization of elementary education, the National Policy, 1986,
continuing presently, reiterates the earlier resolve to ensure that ‘up to a given level,
all students, irrespective of caste, creed, location or sex, have access to education of a
comparable quality’.71 The policy suggests that government initiate appropriately
funded programs. For implementing equal opportunity in letter and spirit, not only
access is emphasized, but the conditions for success are also to be created. The Union
Government shoulders the responsibility of re-enforcing the national and integrative
character of education and maintaining quality and standards.
The education of the tribal masses receives special attention from the government in
the policy. By the 1980s, educational planners were clear about the problem of tribals
at this stage – poor school facilities, unrelated curriculum, poor methods of teaching
and poverty – all of which were discussed at length by the Dhebar Commission.
Based on an understanding of these problems, the 1986 Policy recommended a
number of measures. Given the fact that ten per cent of rural habitations yet to be
covered by primary school within radius of one km were largely tribal habitations in
the interior areas, the government prioritized construction of school buildings under
schemes like the Jawahar Rojgar Yojna, Tribal Welfare Schemes, etc. The
development of curricula based on the socio-cultural milieu of tribals and of
instructional materials in tribal languages, with provision for switching over to
regional languages, is another priority of the policy. Besides, the policy suggests
expansion of residential schools, including Ashram Schools, Anganwadis and Adult
Education Centres. For teaching jobs in tribal areas, it seeks to encourage and train
tribal youth. To promote tribals in higher education, especially in technical,
professional and para-professional courses, the policy gives incentives by way of
scholarships, special remedial courses and other programs to remove psycho-social
impediments. Finally, to create awareness of the tribals’ rich cultural identity and to
promote their enormous creative talent, the policy recommends suitable designing of
curriculum at all stages of education.
69 Planning Commission, Government of India, Sixth Five Year Plan (1980-85)
planningcommission.nic.in/plans/planrel/fiveyr/6th/6planch21.html, p. 2. 70 Planning Commission, Government of India, Sixth Five Year Plan (1980-85)
planningcommission.nic.in/plans/planrel/fiveyr/7th/vol2/7v2ch10.html, pp. 4-5. 71 Ministry of Human Resource Development, Government of India, National Policy on Education (as modified in 1992), New
Delhi, 1998, pp. 3,5.

162
Besides these, the policy includes certain general points that are significant for the
tribals. On elementary schooling, it emphasizes universal access and enrolment,
universal retention of children up to fourteen years of age and a substantial
improvement in the quality of education. The policy resolves to give ‘highest priority’
to solving the problem of drop-outs and promised to adopt ‘an array of meticulously
formulated strategies based on micro-planning.’ Adopting ‘a warm, welcoming and
encouraging approach’, it allows learners, especially first generation learners, to set
their own pace of learning. It, therefore, underscored a no-detention policy at the
primary stage. At the secondary level, the policy stood for widening the educational
access of the weaker sections and promoting vocational education as a distinct stream.
The government launched Operation Blackboard in 1987 and the National Literacy
Mission in 1988. The Literacy Mission aimed to create a positive outlook among the
adult population to encourage the compulsory elementary education of children.
Operation Blackboard was meant for providing basic infrastructure and essentials of
schooling like classrooms, teachers and so on. Further, a scheme of Restructuring and
Reorganization of Teacher Education was taken up in 1987. Complementing the work
of the Ministry of Human Resource Development, the government launched in 1990-
91, under its tribal division, fresh Ashram Schools from the primary to secondary
level in Tribal Sub-Plan areas with an equal fund sharing arrangement between Centre
and the States.
After the policy revision exercise was complete, the government drew out a Program
of Action (1992). Important steps listed in the Program in the interest of the tribals
are:
provision of primary school or other suitable institution in every tribal
habitation before the end of the Eight Five Year Plan (1992-97)
implementation of educational plan in an integrated manner by the
coordination of Balwadis, non-formal education, adult education and
elementary education under an Educational Complex
making teachers responsible for enrolment drives at the beginning of academic
session with the help of voluntary agencies and local communities
covering, under Operation Blackboard, within two years, all schools in tribal
areas, irrespective of the date on which they were set up
preparation of instructional materials in tribal languages with a view to
teaching them through tribal languages in the initial stage with a provision for
transition to regional languages
linking rates of pre-matric and post-matric scholarships with the increase in
the cost of living index, and disbursing scholarships to students of upper
primary school level and above through banks/ post-offices, in advance on the
first day of each month

163
organization of special coaching, training and remedial teaching classes in
order to enhance scholastic achievement, and providing residential facility to
those preparing for competitive examinations
giving additional scholarships to girl students at secondary and senior
secondary stage, and providing them special coaching and remedial classes
proving quality reading material in cheap rate from Indian and foreign
languages by abridging, adapting and translating, and lastly,
raising teachers from the community to meet the shortage of teachers, through
short courses, specifying District Institutes of Educational Training for teacher
training on a large scale with a long-term perspective.
The Government revamped the scheme of grant-in-aid to voluntary organizations,
specially modifying the rules to provide for 100 per cent assistance, rather than 90 per
cent. Towards promotion of girls’ education, in 1993-94, the scheme of ‘Educational
Complex’ in 136 districts with low literacy pockets was introduced. The complex was
meant for 50 girls of the primary school stage with free food and lodging, uniform and
other facilities, with the additional provision of training in crafts and vocation.
Another initiative of the government was the District Primary Education Program
(1994) with partial funding from the World Bank. Soon after, the National Program of
Nutritional Support, providing each primary school student with three kilograms of
food grains per month, was launched in 1995. Further, a Minimum Level of Learning
program was introduced, with the objective of ascertaining competencies, which all
primary school students should be able to master in language, mathematics and
environmental studies. Further, it aimed to develop curricula and textbooks in relation
to the above mentioned objective. Additionally, in order to reduce the burden of
learning in the early stage that would greatly help tribal students, the Government
constituted a committee in 1993, which expeditiously recommended ways and means
to make learning burden-free.72
At the secondary education level, the Government promoted the program of
vocationalization. This was relevant to the tribals in view of their high drop-out rate at
the secondary school level and subsequent unemployment. The program was
introduced in accordance with the National Policy guideline that aimed at ten per cent
higher secondary students in vocational courses by 1995 and 25 per cent by 2000. In
1993-94, a program of pre-vocational training for students of Class IX and X was
initiated. The idea behind this was to impart training in simple marketable skills and
develop student interest in the vocational stream at the senior secondary level. An
attempt was also made to reach out to the weaker sections by expanding the National
Open School System, whose study centres increased from 161 in 1990-91 to 666 in
1996-97. Of these centres, 105 were for vocational studies.
72 A committee chaired by Professor Yash Pal prepared a report titled, Learning Without Burden, 1993.

164
6.5 Flagship Programs at Three Levels
The positive outcome of some of the schemes mentioned above, inspired educational
planners to conceive of similar missions in a more coordinated manner. Thus, a
mission era set in. Since the year 2000, three missions, one each on elementary
education, secondary education and higher education, called ‘Sarva Shiksha
Abhiyan’, ‘Rashtriya Madhyamik Shikhsa Abhiyan’, and ‘Rashtriya Uchchatar
Shiksha Abhiyan’ respectively, have been launched. Each mission takes care of the
tribal interest in various ways. The measures under these missions are comprehensive
and all-encompassing. Most of the measures are beyond the routine government
policy of positive discrimination. The missions, thus, promise to break the long-
standing stalemate of unsatisfactory participation of the tribals at different levels of
education.
The first, Sarva Shiksha Abhiyan, has been introduced for the achievement of
Universalization of Elementary Education in time-bound manner, which is a scheme
of the Centre in partnership with the States, addressing the needs of 192 million
children in 1.1 million habitations.73 The target of the program was to enable all
children complete five years of primary schooling by the year 2007 and eight years of
schooling by 2010. The program is the culmination of all previous endeavours and
experiences of the government in the education domain. The program focuses,
through a variety of interventions, on universal access and retention, bridging of
gender and social category gaps, and improving the quality of learning. With a view
to create conditions of equity in real terms, the program seeks to open new schools in
those habitations which lack schooling facility and strengthen the existing school
infrastructure. It also provides for additional teachers in schools facing shortages,
special teacher training and grants for developing teaching-learning materials. The
project follows community-based approach in planning, where habitation is the unit
for district-level plans.
The Government strengthened the education policy through the Constitution (Eighty-
Sixth Amendment) Act, 2002, making free and compulsory education of the children
of age-group, 6-14 years, a Fundamental Right. The Government worked out clear
norms on various matters ranging from Centre-State cost-sharing to teacher-student
ratio, school space, distribution of free study materials, and so on. To make the project
a success, the Government ensured sustained financing. An important support to the
program also came from the National Program of Nutritional Support to Primary
Education, popularly known as Mid-Day Meal scheme, which was later revised to
make it more effective. The Government claimed that during 2004-05, about 10.88
crore children availed of the Mid-Day Meal scheme. Another important initiative was
the establishment of residential upper-primary schools, called Kasturba Gandhi Balika
73 The details here are from, Ministry of Human Resource Development, Government of India, ‘Educational Development of
Schedules Castes and Scheduled Tribes: Status and Programmes’, August 2005, and Ministry of Hunan Resource Development, Government of India, ‘Background Paper’, First Meeting of National Monitoring Committee for Education of Scheduled Castes,
Scheduled Tribes and Persons with Disabilities, 27 June 2012, New Delhi , mimeo.

165
Vidyalaya, for ‘hard to reach’ girls, which would largely comprise tribals. These
schools were meant for educationally backward blocks. In the first phase, 750 such
residential schools were planned.
Confident of having built a sound base of primary education, the Government mooted
a national mission at the secondary level of schooling, since 2005 under the forums of
the Central Advisory Board of Education and the Planning Commission. Finally, the
mission, ‘Rashtriya Madhyamik Shiksha Abhiyan’, was inaugurated in 2009. The
Government made the case for the mission from the statement of the National Policy,
1986 that the access to secondary education would be widened ‘with emphasis on
enrolment of girls, Scheduled Castes and Scheduled Tribes, particularly in science,
commerce and vocational streams.’ The mission’s objectives are the following: i) to
achieve a gross enrolment ratio of 75 per cent for classes IX-X within five years by
providing a secondary school, within a reasonable distance of every habitation, ii) to
improve quality of education by making all secondary schools conform to prescribed
norms, iii) to remove gender, socio-economic, geographic and disability barriers, iv)
universal access to secondary level education by 2017, that is, by the end of the
Twelfth Five Year Plan, and v) universal retention by 2020.74
Within this framework, detailed strategies in the interest of the tribals and other
weaker sections have been worked out. To widen access, the steps are: expansion of
existing schools; upgrading upper primary schools, particularly Ashram schools and
open new schools in under-served areas. In the interest of the tribals, the norm of a
secondary school in the five kilometre radius is relaxed. For enhancing equitable
participation, the measures include: more residential facilities with improved living
condition; free uniform, books and cash incentive for girls; merit scholarship; and
expansion of distance learning system. For the improvement of quality, the measures
are: better classroom facilities, laboratories, libraries, and computer rooms,
appointment of additional teachers, in-service training of teachers and providing
residential facilities to teachers, including female teachers. Another important strategy
to help the tribal learners is the deployment of resource agencies, for developing
locale-specific supplementary materials to bridge the cultural and linguistic gaps and
training of teachers accordingly. Specific measures at the district level are supposedly
based on extensive consultation with the households, villages and Gram
Sabhas/wards.
The latest mission, the Rashtriya Uchchatar Siksha Abhiyan, was initiated in
September, 2013, alongside introducing the Rajiv Gandhi Fellowship, Centres for
Studies in Discrimination and Exclusion, Indira Gandhi National Tribal University
and a number of Central Universities, more Indian Institutes of Technology and
Indian Institutes of Management in the interest of the weaker sections and the tribals.
74Rashtriya Madhyamik Shiksha Abhiyan', Ministry of Human Resource
Development at http://mhrd.gov.in/rashtriya_madhyamik_shiksha_abhiyan (last visited 30 May 2014).

166
The mission, beyond these, spreads over two Five-Year Plan periods.75 It stands for a
‘strategic intervention for the improvement of access, equity and quality’ in country’s
higher education through a special centrally-sponsored scheme. The idea is inferred
from the earlier University Commission, 1949 and the Indian Education Commission,
1964, which the National Education Policy, 1986 carried forward. The Rashtriya
Uchchatar Siksha Abhiyan focuses on State Universities and institutions under them,
funded by the Government, since they cater to 94 per cent of students. Taking note,
that Gross Enrolment Ratio of Scheduled Castes, Scheduled Tribes and Other
Backward Castes is far below than that of the general population, the mission talks
about greater access with special emphasis on rural and tribal areas.
6.5.1 Outcome of the Missions
All the three missions have been concerned about problems associated with tribal
education, namely, low enrolment, high drop-out rate and low level of learning.
Several measures undertaken through the mission addressed these core issues. An
assessment of the programs shows that, in many respects, there has been an
improvement across the education levels, as the following observations indicate:
The gap between Scheduled Castes and Scheduled Tribes and the other social
groups in terms of access to school education has significantly narrowed
down. Under Sarva Shiksha Abhiyan specially, massive infrastructure
development took place. The number of schools and teachers has increased.
Over 3 lakh new schools were opened and existing schools were equipped
with basic facilities. The average student-classroom ratio came down from 39
in 2005-06 to 32 in 2009-10. The chief beneficiaries of these developments
were the tribal regions.76
Tables 6.6 and 6.7 show that between 1993-94 and 2007-08, the number of
tribal households within 1 kilometer of the vicinity of primary school rose
from 77.12 per cent to 88.46 per cent. The rise was discernible more in the
rural areas, where it rose from 73.86 per cent to 88 per cent. Similar trends can
be seen at the upper primary and secondary level of schooling. Sizeable
percentage of Scheduled Tribe households was within 1 kilometre reach of the
upper primary school (54 per cent) and of secondary school. The increase of
this facility among the rural Scheduled Tribe population in respect to the upper
primary school was striking.
The trend of enrolment of the tribals at different stages of education shows
that there is a steady decadal rise. When compared with the Scheduled Castes
and the general categories, the growth of Scheduled Tribe enrolment is most
steady (Table 6.8). Table 6.9 on Gross Enrolment Ratio corroborates the trend
75 See the Mission’s vision and other details in the Ministry of Human Resource Development, Rashtriya Uchchatar Siksha
Abhiyan: National Higher Education Mission, September 2013. 76 Planning Commission, Government of India, Twelfth Five Year Plan 2012-2017, Social Sectors, Volume III, New Delhi: Sage
Publications, 2013, p.49.

167
of continuous rise of Scheduled Tribe enrolment at all levels of education
shown in the previous table in the two decades considered here. In most cases,
the GER of Scheduled Tribes at the primary and the upper primary level of
schooling is higher than that of the Scheduled Castes and the General
categories.
Available statistics show that the Government efforts in the last two decades
have been able to contain the drop-out rates (Table 6.10). The rate has almost
continuously declined. Given the record of somewhat static situation earlier,
this was a major achievement. The incidence is specially checked in the initial
stage, namely, Class I –VIII.
Related to the above, there is decline in the number out-of-school children, as
can be seen from the statistics of the Ministry of Human Resource
Development in the period between 2005 and 2009.
Table 6.6: Distance between Household and Nearest Primary School, 1993-94 to
2007-08 (per cent)
Groups Percentage of Households
1km 2km 3km 4km 5km
1993-
94
2007-
08
1993-
94
2007-
08
1993-
94
2007-
08
1993-
94
2007-
08
1993-
94
2007-
08
Total
ST 77.12 88.46 13.39 8.25 6.27 2.35 3.21 0.36 - 0.58
SC 84.31 92.29 12.47 6.57 2.87 0.92 0.35 0.19 - 0.03
GEN 85.07 92.15 11.46 6.58 2.97 1.03 0.50 0.19 - 0.05
Total 83.94 91.67 11.87 6.81 3.37 1.19 0.82 0.21 - 0.12
Rural
ST 73.86 88.00 14.85 8.32 7.45 2.52 3.84 0.43 - 0.72
SC 81.09 92.36 14.83 6.38 3.66 0.99 0.42 0.24 - 0.03
GEN 80.43 91.86 14.17 6.67 4.70 1.17 0.70 0.24 - 0.06
Total 79.43 91.31 14.41 6.89 4.98 1.36 1.19 0.27 - 0.17
Urban
ST 92.57 90.26 6.48 7.95 0.72 1.67 0.23 0.08 - 0.03
SC 91.35 92.11 7.30 7.05 1.14 0.75 0.20 0.05 - 0.04
GEN 91.01 92.59 7.99 6.44 0.76 0.82 0.24 0.11 - 0.04
Total 91.15 92.33 7.81 6.64 0.81 0.88 0.23 0.10 - 0.04
Source: NSS 52nd and 64th Round

168
Table 6.7: Distance between Households and Upper Primary/Secondary Schools
(per cent)
Group/
School
1km 2km 3km 4km 5km
Upp.
Prim.
Sec.
Sch.
Upp.
Prim.
Sec.
Sch.
Upp.
Prim.
Sec.
Sch.
Upp.
Prim.
Sec.
Sch.
Upp.
Prim.
Sec.
Sch.
Total
ST 54.6 31.1 15.8 15.3 13.2 15.1 8.8 13.2 7.6 25.3
SC 62.1 40.6 17.6 19.9 12.2 16.9 5.8 11.7 2.2 10.9
OBC 64.5 40.4 16.6 19.2 10.6 15.5 5.5 12.8 2.7 12.2
GEN 62.2 52.4 18.3 20.2 11.7 12.2 5.1 8.0 2.7 7.2
Total 61.8 42.8 17.1 19.1 11.6 14.7 6.0 11.2 3.4 12.3
Rural
ST 54.6 22.9 15.8 12.7 13.2 16.9 8.8 16.1 7.6 31.3
SC 62.1 31.8 17.6 17.4 12.2 20.6 5.8 15.4 2.2 14.8
OBC 64.5 28.9 16.6 16.9 10.6 19.4 5.5 17.4 2.7 17.4
GEN 62.2 34.4 18.3 19.4 11.7 19.0 5.1 13.9 2.7 13.4
Total 61.8 29.7 17.1 16.9 11.6 19.1 6.0 16.0 3.4 18.3
Urban
ST 80.2 63.1 15.2 25.5 3.2 7.9 0.9 1.9 0.5 1.6
SC 79.3 63.2 17.4 26.4 2.5 7.3 0.6 2.1 0.1 0.9
OBC 81.9 65.1 14.5 23.9 2.7 7.0 0.7 2.9 0.2 1.1
GEN 83.8 70.6 13.6 21.1 1.8 5.3 0.6 1.9 0.2 1.0
Total 82.2 67.1 14.6 23.2 2.3 6.4 0.6 2.3 0.2 1.1 Source: NSS 64th Round (2007-08)

169
Table 6.8: Educational Level-wise Enrolment, 1980-81 to 2010-11 of STs and Others (in Lakhs)
Year/Level Scheduled Tribes Scheduled Castes All Categories
Primary
(I-V)
Upper Primary
(VI-VIII)
Primary
(I-V)
Upper Primary
(VI-VIII)
Primary
(I-V)
Upper Primary
(VI-VIII)
Boys Girls Total Boys Girls Total Boys Girls Total Boys Girls Total Boys Girls Total Boys Girls Total
1980-81 31 15 46 5 2 7 72 38 110 16 6 22 453 285 738 139 68 207
1990-91 49 29 78 11 6 17 97 60 157 27 14 41 570 404 974 215 125 340
2000-01 63 47 110 19 12 31 121 91 212 41 26 67 640 498 1138 253 175 428
2005-06 75 67 142 25 20 45 140 113 253 53 38 91 705 616 1321 289 233 522
2006-07 76 68 144 26 20 46 144 118 262 54 39 93 710 627 1337 298 246 544
2007-08 76 70 146 26 21 47 137 125 262 53 46 99 711 644 1355 310 262 572
2008-09(P) 79 73 152 27 23 50 138 127 265 56 49 105 700 645 1345 294 260 554
2009-10(P) 79 73 152 28 23 51 138 127 265 58 51 109 708 648 1356 318 276 594
2010-11(P) 77 72 149 28 26 54 141 129 270 59 53 112 705 648 1353 328 292 620
Year/Level Sec./Sr. Sec
(IX-XIII)
Higher Education Sec./Sr. Sec
(IX-XIII)
Higher Education Sec./Sr. Sec
(IX-XIII)
Higher Education
1980-81 2 1 3 NA NA NA 9 3 12 NA NA NA 76 34 110 35 13 48
1990-91 7 2 9 NA NA NA 17 6 23 NA NA NA 128 63 191 34 15 49
2000-01 10 5 15 NA NA NA 24 14 38 NA NA NA 169 107 276 54 32 86
2005-06 13 9 22 4 2 6 34 22 56 10 6 16 223 161 384 88 55 143
2006-07 15 10 25 4 3 7 35 23 59 12 6 18 229 169 398 96 60 156
2007-08 14 10 24 6 3 9 36 27 63 15 9 24 252 193 445 106 66 172
2008-09(P) 16 11 27 6 3 9 37 29 66 14 8 22 256 199 455 112 73 185
2009-10(P) 17 13 30 7 4 11 46 36 82 15 9 24 267 215 482 124 83 207
2010-11(P) 18 14 32 NA NA NA 48 39 87 NA NA NA 283 229 512 155 111 266
Source: Educational Statistics at a Glance-2012, MHRD. Note: P-Provisional, NA-Not Available. For the Year 2008-09 data on Higher Education is Final

170
Table 6.9: Educational Level-wise Gross Enrolment Ratio of STs and Others, 1986-87 to 2010-11 (in percentage)77
Level/
Year
Scheduled Tribe Scheduled Castes All Categories
Primary
(I-V)
6-10 Yrs
Upper Primary
(VI-VIII)
11-13 Yrs
Primary
(I-V)
6-10 Yrs
Upper Primary
(VI-VIII)
11-13 Yrs
Primary
(I-V)
6-10 Yrs
Upper Primary
(VI-VIII)
11-13 Yrs
Boys Girls Total Boys Girls Total Boys Girls Total Boys Girls Total Boys Girls Total Boys Girls Total
1986-87 111 68 90 46 22 34 104 65 85 53 27 40 - - - - - -
1990-91 125 81 104 54 27 41 126 86 106 69 36 53 95 72 84 80 52 67
1995-96 115 80 97 57 35 47 110 83 97 71 45 59 - - - - - -
2000-01 117 86 101 73 48 60 107 86 97 76 53 65 105 86 96 67 50 59
2005-06 131 121 126 78 65 72 126 110 119 81 65 74 113 106 109 75 66 71
2006-07 134 124 129 80 68 74 132 115 124 83 67 76 115 108 111 78 70 74
2007-08 136 131 134 81 70 76 126 124 125 82 78 80 115 113 114 82 74 78
2008-09P 143 139 141 86 78 82 130 130 130 87 84 85 114 114 114 78 74 76
2009-10P 140 137 139 88 79 83 128 129 128 91 87 89 116 115 116 85 78 82
2010·11P 137 137 137 91 87 89 131 133 132 94 91 92 115 117 116 88 83 86
77 Gross Enrollment Ratio (GER) is the total student enrollment in a given level of education, regardless of age expressed as percentage of the corresponding eligible official age group population in a given school year (as
defined in Educational Statistics at a Glance, Government of India, Ministry of Human Resource Development, Bureau of Planning, Monitoring and Statistics, New Delhi, 2013).

171
Level/Year Sec./Sr. Sec.
(IX-X) 14-17 Yrs
Higher Edu (18-23) Sec./Sr. Sec.
(IX-X) 14-17 Yrs
Higher Edu (18-23) Sec./Sr. Sec.
(IX-X) 14-17 Yrs
Higher Edu (18-23)
1986-87 NA NA NA NA NA NA NA NA NA NA NA NA NA NA NA NA NA NA
1990-91 NA NA NA NA NA NA NA NA NA NA NA NA NA NA NA NA NA NA
1995-96 NA NA NA NA NA NA NA NA NA NA NA NA NA NA NA NA NA NA
2000-01 31 19.8 25.7 5.8 2.6 4.2 - - - - - -
2001-02 - - - - - - 37 27 33 8 4 6 38 28 33 9 7 8
2005-06 34 23 29 9 5 7 42 31 36 10 6 8 45 36 40 14 9 12
2006-07 36 25 31 10 6 8 44 33 39 12 7 9 45 37 41 15 10 12
2007-08 37 27 32 12 7 10 43 38 41 13 9 11 49 42 46 15 11 13
2008-09P 40 30 35 12 7 9 44 40 42 13 8 11 51 43 47 16 11 14
2009-10P 44 34 39 13 8 10 55 49 52 13 9 11 52 46 49 17 13 15
2010-11P 45 37 42 NA NA NA 57 52 55 NA NA NA 56 48 52 21 17 19
Sources: Educational Statistics at a Glance-2012, MHRD. Note: P-Provisional, NA-Not Available ,for the year 2008-09 data on Higher Education is Final

172
Table 6.10: Dropout Rate of Scheduled Tribes and Others, 1990-91 to 2010-11 (in percentage)78
ST Students Scheduled Tribe Scheduled Castes All Categories
Classes (I-VIII) Classes (I-X) Classes (I-VIII) Classes (I-X) Classes (I-VIII) Classes (I-X)
Boys Girls Total Boys Girls Total Boys Girls Total Boys Girls Total Boys Girls Total Boys Girls Total
1990-91 76 82 79 83 88 85 64 73 68 74 83 85 59 65 61 68 77 71-
2000-01 - - - - - - - - - - - - 50 58 54 66 72 69
2001-02 67 73 69 80 83 81 59 64 61 71 75 73 - - - - - -
2002-03 67 71 69 78 83 80 58 62 60 70 75 72 - - - - - -
2003-04 69 71 70 78 81 79 57 62 59 71 76 73 - - - - - -
2004-05 65 67 66 78 81 79 55 60 57 69 74 71 - - - - - -
2005-06 63 63 63 78 79 79 54 57 55 68 74 71 49 49 49 60 64 62
2006-07 63 62 63 77 79 78 52 55 53 67 72 69 46 45 46 59 62 60
2007-08 63 62 63 76 78 77 54 51 53 68 69 68 44 41 43 57 57 57
2008·09(P) 58 59 58 76 77 76 51 44 48 67 67 67 45 39 42 56 56 56
2009-10(P) 55 61 58 75 76 75 51 52 51 59 60 59 41 44 42 53 52 53
2010-11(P) 55 55 55 71 71 71 47 39 43 57 54 56 40 41 41 50 48 49 Source: Educational Statistics at a Glance-2012, MHRD. Note: P-Provisional
78 Dropout Rate is the percentage of students who drop out from a given grade or cycle or level of education in a given school year (as defined in Educational Statistics at a Glance, Government of India, Ministry of Human
Resource Development, Bureau of Planning, Monitoring and Statistics, New Delhi, 2013).

173
Table 6.11: Percentage of Out-of-school Children (6-14 years)
Year Percentage of out-of-school children to total corresponding population
Total Girls SC ST Muslim
2005 6.9 7.9 8.1 9.5 10.0
2009 4.2 4.6 5.9 5.2 7.7 Source: National Monitoring Committee for Education of Scheduled Castes, Scheduled Tribes and Persons with Disabilities (Background
Paper), MHRD, June 2012.
Figure 6.1: Proportional Change in GER and Dropout Rate of STs (Class I-VIII)

174
Figure 6.2: Proportional Change in GER and Dropout Rate of STs (Class I-X)
Source: Educational Statistics at a Glance-2012, MHRD.
6.6 A Long Way to Go
Behind the silver lining of positive development, however, there are several grey areas. There
are still a large number of schools which do not have minimum facilities. While there has
been a decline in the percentage of out-of-school children across gender and social categories,
tribal children still need greater and focused attention in this regard. Even where there is
reasonable infrastructure and student enrolment, regular school attendance is a problem in the
tribal areas. Some of the most educationally backward states in central India, for instance,
Madhya Pradesh and Jharkhand, have the lowest student attendance rate (below 60 per
cent).79 To make matters worse, the old problem of teacher absenteeism, that the tribal areas
are known for, persists.80
There is long way to go with respect to infrastructural facilities. But, the Government in the
name of tribal education, has somewhat been lopsidedly preoccupied with this subject.
Improvement of the quality of education has not been cared for sufficiently. The neglect has
resulted in poor level of student learning. This is commonly known from various studies by
government agencies like the National Council of Educational Research and Training, private
79 Ibid. p.48. 80 Jha. J. and D. Jhingan, Elementary Education for the Poorest and Other Deprived Groups: The Real Challenge of Universalization, New
Delhi: Centre for Policy Research, 2002.

175
surveys such as Annual Status of Education Report (ASER) of the Pratham Education
Foundation and even by 11th EFA (Education For All) Global Monitoring Report of
UNESCO. The most disturbing trend is steadiness of decline of the tribal children’s learning
level. The ASER, covering 550 rural districts, reveals that 93 per cent of students of Class V
were unable to read Class II textbook contents in 2013 whereas, in 2005, it was 97 percent.81
The situation, at the elementary school level, has given rise to the ‘model of minimum levels
of learning’, which is reduced to mere literacy.82
The low level of learning at the early schooling stage accumulates and is covered up by the
no-detention policy up to Class VIII level. It is ultimately expressed at the secondary level,
where students from the tribal groups constitute the highest proportion of failed candidates or
low scorers in the Class X board examinations. The high drop-out rate that one observes at
the Class X level is actually, the high failure rate of the tribal children. This can be deduced
from the Figures 6.1 and 6.2 above.
One of the factors behind this is the poor quality and inadequate number of teachers. There
are a large number of schools that do not comply with RTE norms on parent-teacher ratio.
Available data suggests that in 2009-10 only 46 per cent of primary and 34 per cent upper
primary by National Council of Teacher Education, as is required under Right to Education
schools fulfilled these norms. Moreover, teachers are without the professional qualifications
as prescribed by the Right of Children to Free and Compulsory Education Act, 2009. There
are about 8.1 lakh untrained teachers who are mostly in the tribal regions.83
6.7 Education as a Site of Discrimination
Traditionally, education has been an area of discrimination against dalits and tribals.84 Of
late, in the changing situation, there seems to be a rise in this trend. As noted earlier, against
the prevailing load of heavy curriculum and tyranny of examination, child-friendly approach
enunciated by the National Policy was supposed to provide relief to children from
disadvantaged groups. In case of the tribal children, however, teaching-learning is not always
friendly. The classrooms are not free from the traditional social prejudice against the tribal
children. In a recent report, Human Rights Watch records that the Ghasiya tribal children of
Sonbhadra District in Uttar Pradesh were made to sit in a single grade irrespective of their
ages, that also separately from the other students.85 The Principal of the concerned school
stated that the tribal children were a ‘big problem’ in the school. Such prejudice not only
precludes the potential for tribal children learning in the classroom, it also perpetuates
discrimination and exclusion. The problem has become endemic. Beyond the concern of
81 ASER, 2005 and 2013 quoted in The Hindu, New Delhi, 16 February 2014, Sunday Magazine. 82 National Curriculum Framework, 2005,Position Paper, National Focus Group on Problems of Scheduled Castes and Scheduled Tribes
Children, NCERT, New Delhi, 2007, p.21. 83 Planning Commission, Government of India, Twelfth Five Year Plan, 2012-17, Volume III, p. 48. 84 According to the Indian Statutory Commission, 1930, during British rule, source of water and educational campuses were two leading
sites of discrimination against the depressed classes. 85 Human Rights Watch, ‘They Say We’re Dirty’: Denying an Education to India’s Marginalized, April 2014, p.3.

176
human rights activists, this has become an important sub-field with academic studies of
exclusion and discrimination in India.86
While discussing discrimination at the level of school education, one cannot refrain from
pointing out the phenomenon in the area of higher education. The reaching of an insignificant
number of tribal students in the portals of higher education is grudged by students from upper
castes. To stop the tribals’ entry, various ways are adopted. In this respect, the case of M.Phil
admission at the premier institution, Jawaharlal Nehru University, was in the news recently.87
In the year 2011-2012, several departments meticulously planned to grant very low marks in
viva-voce to tribal students who were among the best scorers in the confidentially corrected
national level written tests. Once the tribal students manage to take admission, they are
humiliated in various ways so that they are demoralized. Thus, in June 2011, certain
‘etiquettes’ for the tribal and other weaker section students appeared at the Indian Institute of
Technology, New Delhi. Derogatory names given to tribal students from the Northeast is
well-known. The Government takes several measures to protect the tribal students. But, in
most of the cases, the measures are poorly implemented. Instead of according full sympathy
to the tribal students who come from a different cultural background, they are taken as quaint
and unwanted. Anti-tribal psyche is stronger in higher technical institutes. This is revealed by
reports of various Government enquiry committees. For instance, the Thorat Committee
Report on the All India Institute of Medical Sciences (AIIMS), New Delhi, (2006) and, a few
years later, the Mungekar Committee on Vardhman Mahavir Medical College, New Delhi
(2012).88
6.8 Facts behind Free Education
As the poorest sections of Indian society, tribals are largely not capable of paying for
education. Yet, in the event of deficient ‘free’ education, they are inclined to pay for
education outside the government system. Tables 6.12 and 6.13 show the composition of
private expenditure on education in 2009-10. The expenditure on tuition and other fees
(school, colleges etc.), private tutors and coaching centres constitute the largest share of
educational expenditure. The tribals have highest expenditure on these elements, even in rural
areas. Calculations based on NSSO data clearly indicates that a large proportion of tribals
opted for private education between 2004-05 and 2007-08 (Table 6.14). The tribals’ opting
for private education is not necessarily a push factor of the rise of income. It reflects actually
their aspiration for better life through the route of education. Exploiting the situation, ‘public’
(private) schools have mushroomed in the rural areas, even in parts of interior tribal areas.
The private ventures are primarily guided by commercial interests. Unsuspecting, tribals do
86 See, for instance, Nambissan, Geetha B. ‘Exclusion and Discrimination in Schools: Experience of Dalit Children’, Children, Social
Exclusion and Development, Working Paper Series, UNICEF and Indian Institute of Dalit Studies, New Delhi, 2009. 87 Ajoy Ashirwad Mahaprashasta, ‘Injustice undone’, Frontline, Volume 28, Issue 19, September 10-23, 2011. Available at
http://www.hindu.com/thehindu/thscrip/print.pl?file=20110923281903700.htm&date=fl2819/&prd=fline& 88 Report of the Committee to Enquire into Allegation of Differential Treatment of SC/ST Students in All India Institute of Medical Sciences,
New Delhi (Chairman: Sukhdeo Thorat, 2006). Available at http://www.nlhmb.in/Reports%20AIIMS.pdf

177
not even know that most of them are unrecognized and of inferior quality. They are, thus, left
cheated and disenchanted.89
The crunch of State funding on people’s education has been longstanding. The special
provision of Tribal Sub-Plan funding for the tribals has been of help. We have noted earlier
that elementary education, which is supposed to initiate the masses into the education system,
has traditionally received a raw deal by the country’s planners. Ironically, since the beginning
of the new initiatives in this area under the National Policy, 1986, the Government has
developed dependency on international and private capital. Thus, many large programmes
like the Centre’s District Primary Education Programme and Rajasthan’s Lok Jumbish and
Madhya Pradesh’s Education Guarantee Scheme are funded by international agencies such as
World Bank, UNICEF and European Union. These programmes, run through non-
governmental agencies, do not always deliver quality education. If not monitored properly,
sometimes they may invite risk to national interest since they influence the direction, contents
and priorities set by the nation.
89 National Curriculum Framework, 2005,Position Paper, National Focus Group on Problems of Scheduled Castes and Scheduled Tribes
Children, NCERT, New Delhi, 2007, p. 16.

178
Table 6.12: Average Expenditure on Education in the last 365 days
NSS
Round Year
ST SC GEN Gap
between
ST & SC
from
Total
Gap
between
ST &
GEN
from
Total Rural Urban Total Rural Urban Total Rural Urban Total
55th
round
1999-
2000 98 224 161 74 156 115 145 297 221 -46 60
66th
round 2009-10 320 760 453 311 727 467 599 1348 1008 14 555 Source: National Sample Survey of 55th Round and 66th Round
Table 6.13: Item-wise Average Private Expenditure on Education, 2009-10
Education Items/
Categories
ST SC GEN
Rural Urban Total Rural Urban Total Rural Urban Total
Books, journals: first hand 184 352 235 156 253 192 213 372 298
Books, journals, etc.: second hand 73 165 99 61 95 75 81 162 121
Newspapers, Periodicals 165 259 210 198 263 236 257 357 327
Library charges 33 74 52 52 65 59 54 110 85
Stationery, photocopying Charges 98 159 114 97 135 110 126 192 160
Tuition and other fees (School, college, etc.) 455 1332 714 420 1206 709 1039 2589 1867
Private tutor/coaching centre 534 1031 696 497 1045 741 566 1502 1096
Educational CD 39 300 148 402 183 260 148 222 206
Other educational Expenses 108 266 151 59 121 80 135 297 218
Total Expenditure
on Education 649 1654 938 619 1536 950 1300 2986 2211 Source: National Sample Survey of 66th Round

179
Table 6.14: Type of Institution Attended by Social Groups
Social
Groups
/Year
Government Local Bodies Private Aided Private Unaided Not Known
2004-
05
2007-
08
2004-
05
2007-
08
2004-
05
2007-
08
2004-
05
2007-
08
2004-
05
2007-
08
Total
ST 74.26 74.46 3.14 3.31 12.90 10.90 9.25 11.00 0.45 0.33
SC 72.44 73.52 5.22 4.97 9.92 8.81 11.98 12.30 0.43 0.40
OBC 60.94 63.06 4.99 4.89 13.19 10.96 20.40 20.53 0.48 0.56
Others 55.16 52.63 4.85 3.88 16.27 15.68 23.14 26.91 0.59 0.90
Total 62.62 63.21 4.73 4.38 13.67 12.03 18.47 19.77 0.51 0.61
Rural
ST 77.40 80.20 3.35 3.61 11.48 8.34 7.30 7.52 0.47 0.33
SC 79.60 79.50 4.60 5.40 7.12 6.11 8.30 8.73 0.38 0.26
OBC 67.39 71.02 5.04 5.46 10.20 8.31 16.95 14.83 0.42 0.38
Others 65.22 67.10 5.52 4.54 11.90 10.77 16.94 17.08 0.42 0.51
Total 70.36 73.21 4.84 4.93 10.40 8.48 13.98 13.00 0.42 0.38
Urban
ST 64.89 55.71 2.50 2.34 17.14 19.25 15.06 22.36 0.41 0.33
SC 56.66 58.84 6.59 3.92 16.09 15.43 20.10 21.05 0.55 0.75
OBC 48.27 46.52 4.90 3.70 19.06 16.45 27.17 32.38 0.60 0.94
Others 42.03 38.40 3.98 3.23 21.96 20.51 31.21 36.57 0.81 1.29
Total 48.48 45.55 4.52 3.41 19.66 18.30 26.68 31.73 0.66 1.01
Source: Authors’ Calculation from NSS 61 and 64 Round.
6.9 The Right of Children to Free and Compulsory Education Act, 2009
Faced with the unending problem of enrolment, retention and quality education to the
masses and prodded by the Supreme Court in the Unnikrishnan case, the Government
brought the Right of Children to Free and Compulsory Education Act, 2009 in order
to strengthen its hands.90 The Act mandates free and compulsory education of all
children of 6-14 years until they complete elementary education in a neighbourhood
school. The Act further provides for admission of every child who is above six years
of age and has not been admitted to any school; it also provides for re-admission of
every child, who discontinued elementary education for some reason, to a school in a
class appropriate to his/her age, with the proviso of special training or additional
instruction so that he/she is brought at par with others.
Though a right act at a right time, its implementation generally and particularly in
respect to the tribals is a daunting task for the Government. The neighbourhood
schooling is bound to be most contentious since public schools are reluctant to admit
students from the weaker sections. As for re-admission of the out-of-school children,
90 J.P. Unnikrishnan v. State of Andhra Pradesh (1993) 1 SCR 594 at p.693.

180
the implementation is no less problematic. A school principal in a backward district
states: ‘If a child comes to us for enrolment in school when he is 10 years old and
hasn’t learned the basics, then we put the child’s age as 6 years and enrol him in Class
I.’91 His plea is that putting him in the class of his appropriate age would need special
attention which would be at the cost of teaching other students.
6.10 Teachers and Way of Teaching Tribal Children
Along with the shortage of teachers, the quality of teachers and their approach and
method of teaching has been a serious issue that engaged the Dhebar Commission half
a century back. Recently, the subject has been the concern of the National Curriculum
Framework, 2005. Both have underscored the need of familiarity for teachers teaching
tribal children with tribal culture and language so that learning is hassle-free. For
intimate orientation and training of teachers, the Dhebar Commission even insisted on
teacher training centres being located in the tribal areas, and wanted the teachers so
trained to serve the tribal area for at least twenty years. The crux of this idea was not
recognized in the succeeding years. The Program of Action, 1992 actually came with
the idea of raising teachers with ‘crash course’ to meet the shortage of teachers in the
tribal areas.
Equally important, is the need of production of teaching materials in tribal languages
in the interest of a large number of early tribal learners. Within the National Policy,
1986, the National Curriculum Framework is clear that the problems of inequality
need to be addressed not only through policies and schemes, but ‘also through design
and selection of learning tasks and pedagogic practices.’92 But indication is that there
is not much effort in developing curricula and devising instructional materials,
keeping in mind socio-cultural milieu of the tribals. The National Sample Survey data
reveals that the tribal languages listed in the Eighth Schedule, viz., Bodo, Dogri and
Santhali, are educationally used merely by 0.11 per cent, 0.02 per cent and 0.01 per
cent of the tribals respectively.93
The viability of developing instructional materials in the tribal languages and their use
is proved by stray experiments in the Northeast and elsewhere. The role of the nodal
institutions like the NCERT and similar State institutions leaves much to be desired.
Since 1969, the Central Institute of Indian Languages has been doing useful work on
tribal languages, but translation of their efforts, in the field of teaching materials, in
coordination with sister organizations of the Central Ministry of Human Resource
Development, is not discernible.
91 Human Rights Watch, ‘They Say We’re Dirty’, p. 6. 92 NCERT, National Curriculum Framework, 2005, New Delhi: 2005, p.5. 93 National Sample Survey, 2007-08 (64th Round).

181
6.11 Residential Schools and the Tribals
As a way of providing quality education to the tribals in an efficient manner, the
Government has been, from the 1950s to the present policy, opening residential
schools and hostels for them at central places. Ashram School, Eklavya Model School
and Kasturba Gandhi Balika Vidyalaya are leading schemes under this approach.
What has come as a standard approach, it is generally found that there is ‘cultural
discontinuity’ between school environment and social life of the children back home.
The problem was first pointed out by the Scheduled Caste and Scheduled Tribe
Commission in 1987 and later, by the framers of the National Curriculum Framework,
2005.94 Citing authoritative studies, the latter document claims that, in the event of
school environment and functioning being in tune with the tribal cultural life,
performance of the student is better.
While such coordination is not forthcoming, the tribal residential schools and hostels
remain commonplace institutions. They are often in the news for corruption, bad
maintenance of facilities and sexual exploitation of resident girls. A review of the
‘ashramshalas’ in Kanker district of Chhattisgarh by the National Commission for
Protection of Child Rights, in the wake of the case of rape and sexual abuse of girls in
the Jhaliyamari village of Narharpur Block, reported:
43 girls, aged 6 to 13, who attended primary school and stayed in the ashram shala in the
village, were repeatedly exposed to sexual abuse. 125 of these girls were reported to have
been raped almost two years by the male teacher and watchman … While the hostel had a
female superintendent who was mandatorily expected to stay at night, she would go home …
Moreover, the ashram shala was found to be in despicable condition, with merely three shed-
like small rooms – none of which had bolts, no provision of water and electricity, and no
toilets.95
In the context of Maoist militancy, the concept has vulgarized. Tribal children from
militancy-affected interior villages are herded like animals. Among horrific tales
narrated to the High Level Committee was the death of children for lack of basic
health facilities.
6.12 Educational Domain and Knowledge on Tribes
Ever since Nehru recognized tribal culture as an autonomous constituent of Indian
culture, there has been effort, under the national democratic ethos, to know about the
tribals and their problems from an outlook different from the old nationalist
viewpoint. A number of Tribal Research Institutes and museums on tribes in various
states came into being. The National Policy, 1986 wanted a more proactive role of the
education system in this direction. It suggested: ‘The curriculum at all stages will be
94 Government of India, Report of the Commissioner of Scheduled Castes and Scheduled Tribes,1986-87 (Twenty-eighth Report), p. 296; National Curriculum Framework, 2005,Position Paper, National Focus Group on Problems of Scheduled Castes and
Scheduled Tribes Children, NCERT, New Delhi, 2007, pp. 24-25. 95 ‘National Commission for Protection of Child Rights: Visit to State of Chhattisgarh, District Kanker to review the status and
functioning of ashram shalas, 20th to 23rd March 2013’, p.5.

182
designed to create an awareness of the rich cultural identity of the tribal people as also
their enormous creative talent.’96 Such effort would be in the spirit of the national
system of education that was capable of accommodating country’s cultural diversity
while ensuring certain common national values.
Despite this policy enunciation, tribes as a subject figure insignificantly in the school
curriculum. There is dearth of textbook materials and of advanced knowledge on the
tribes. This makes tribes the most misunderstood social group of the country.
Wherever the subject finds some space, the tribals are depicted as quaint and exotic
people. Rich cultures, history and dynamics of the tribal society are not touched upon.
There is, thus, the need to establish study centres that focus on tribal studies. The old
State institutes that are reduced to an extension of respective Government Tribal
Welfare Departments need to be rediscovered. Recently, the Government of India
opened the Indira Gandhi National Tribal University. A good move, it needs to be
well directed. There are areas of education, which need attention like tribal folklore,
language and literature, sports and continuation of performing arts and traditions of
tribal culture.
University Grants Commission should provide special scholarships and fellowships
for higher studies and research related to tribal culture, literature, etc. At least, one
Tribal Chair needs to be established by the UGC in universities in every State
comprising Fifth Schedule Areas. The scope of education needs to be expanded for
the purpose of scholarships and should include tribal painting, art, craft, song, music
and dance, etc. While the Ministry of Tribal Affairs is now supporting scholarships
for students belonging to the tribals, the UGC and the MoTA should support
scholarships for tribal studies for non-tribal students also.
6.13 Contemporary Concerns in Tribal Education
Educating the tribal children has been a challenge for the Government for various
socio-cultural, economic, geographical and administrative reasons. For example, the
literacy rate of tribal people has been lower than the entire population. During the
period, 1961 to 2011, the gap in literacy rate between Scheduled Tribes and the whole
population increased from 19.8 percent in 1961 to 27.2 percent in 1981 and has
declined to 14.6 percent in 2011. The gap can be said to be persisting in the trend
analysis (Table 6.1). If the Northeast areas are excluded, the gap in the literacy rate
between tribal and overall population is fairly high.
However, contemporary concerns on tribal education are more complex than mere
literacy. Absenteeism of teachers in schools in remote areas has increased. Left Wing
Extremism and inter-ethnic violence has resulted in further absenteeism and there is a
96 Ministry of Human Resource Development, Government of India, National Policy on Education, 1986, p.10.

183
need to adopt different strategies for addressing these issues. Security of children,
particularly girls, has become a concern in many locations. Aspiration for higher
education has led the government to institute scholarships for tribal students, but the
uptake has been low due to weak education at primary and secondary levels that
create disadvantages for higher education. This is particularly so, in the case of
Science, Medicine, and Engineering streams.
6.13.1 Incidence of High Dropout Rates
Dropout rates among the tribal students, particularly at the secondary and senior
secondary stages, are very high. With dropout rates97 of 73 per cent at Class X, 84 per
cent at Class XI and 86 per cent at Class XII, higher education also suffers. No-
detention policy, before and after the RTE Act, does not allow students from the tribal
community to acquire basic skills in Three Rs (Reading, Writing and Arithmetic).
Lack of such basic skills in language and arithmetic creates huge barriers for their
further studies. This absence of background education is also a cause of dropouts.
Therefore, the policy of non-detention needs a review. The policy of work education
at the primary and vocational education at the secondary and senior secondary level
needs further integration and strengthening.
Vacations in the tribal schools should be realigned with the local festivals. Long
duration summer vacation happens to be critical period for mass dropouts not only in
tribal areas, but also in all rural areas. This period should be gainfully utilized for
conducting remedial classes, special coaching and skill development. Institutions of
ITDAs/ITDPs and micro projects support to the tribal schools should be strengthened
to prevent dropouts.
6.13.2 No-detention Policy
The committee was unanimous that while the no-detention policy was just and fair on
paper, in practice, it has had deleterious effect on education of children. Children who
are unable to acquire basic concepts in language and numerical ability, will be at a
disadvantage at higher levels. We recommend that this policy should be reviewed and
certainly should be taken out of RTE Act, 2009. When the student, teachers, or the
parents of the student request for retention of a child to enable him/her to acquire
skills to move to the next class, he/she should be retained.
6.13.3 Shortage of ‘Quality’ Teachers
In the 1950s and the ‘60s, Ashram Schools at primary level were introduced in tribal
habitations. The number of teachers per school was below the present RTE norms, but
many of the students remained in school, and it is reflected in the increase in literacy
97 Source: Statistics of School Education, 2010-11.

184
rate of the Scheduled Tribes in following decades. Over time, the absenteeism of
teachers increased and small schools became ineffective.
Owing to paucity of trained teachers, learning achievement levels of tribal students
remain low. A realistic projection should be made for the requirement of teachers for
TSP areas for the next ten years. Additional capacity should be created in existing
teacher training institutions. New teacher training institutions should be opened in the
TSP areas to meet the full requirement of qualified and trained teachers. The
curriculum for the training should be drawn up very carefully taking into account the
socio-cultural milieu, tribal ethos, language etc. Further, it should also meet the
present day needs like computer science, Information and Communication
Technology (ICT) in education, etc.
The dearth of teachers fulfilling the eligibility criteria set out under the RTE Act is an
impediment to achieving the right to education in tribal areas. For addressing the
current crisis of absence of teachers in tribal areas, special efforts need to be made to
produce more teachers who have qualified the Teachers Ability Test. This must be
done on an emergency basis. In the interregnum, teachers appointed in educational
institutions must be given a term within which they qualify the Teachers Eligibility
Test, and facilities be provided to assist them in taking this test, including training
courses and access to materials.
6.13.4 Language Barriers for the Tribal Students
Most of the tribal communities in India have their own mother tongue. But in most of
the States, official/regional languages are used for classroom teaching and these are
not understood by the tribal children at primary level of schooling. In the Vision 2020
document, there was an acknowledgement that Multi-Lingual Education (MLE) was
necessary, in view of the low tribal literacy, high rates of dropouts and low learning
achievements of the tribal children. The Model of Primers in the Tribal language
were first developed in Odisha in 1996. Subsequently, several pilot projects involving
material production and training, aimed at promoting multilingualism in the
classrooms were launched in Odisha, Andhra Pradesh and Assam.
The design of the Primer of Odisha has some aspects which should be noted for
replication. One side of the text was in local script but used tribal language. The other
side of the script was in local language and script. The student learnt the script
because he/she understood the content. The teacher understood the tribal language
because he/she could read in a known script. The contents were about local trees and
fruits, local folk tales and festivals. Some of the text was also about functional literacy
such as clean drinking water and common institutions. However, this initiative was
not carried forward with change of personnel at the helm of Education Departments.

185
A desirable outcome of the Primer was that it transformed the tribal languages into the
written form, while preserving the words and syntax. Information on this and similar
isolated efforts elsewhere need to be disseminated in other tribal areas. Establishment
of Regional Resource Centres in tribal concentration States for providing training,
academic and other technical support for development of pedagogic tools and
education materials catering to multilingual situation should be reinforced and
augmented.
6.13.5 Involvement of Panchayats and Community in Education
A study98 has documented the criticality of involvement of parents and community in
the education of tribal girl children. The study has also documented the unique
perception of tribal parents on modern education. For success of the educational
interventions, involvement of community through the Panchayati Raj Institutions
needs to be institutionalized. Information on various schemes, benefits and
beneficiaries should be provided to the Gram Sabhas and Gram Panchayats, which
would create transparency. This will help create demand for scholarships and access
to higher education, because of wide dissemination of information. Involvement of
community members in school activities would reduce the social distance between the
school and the community and would help in checking dropouts. Social audit by
Gram Sabha will, for example, improve attendance of teachers, quality of food served
in schools and delay in supply of text books.
6.13.6 Education for Displaced and Dispersed Tribals
Special arrangements for schooling facilities for the children of displaced tribal
population residing in urban centres needs to be institutionalized through creation of
special tribal agencies in the urban areas. They should be established under the
Department of Tribal Affairs of the State Government, utilizing the TSP/SSA grants.
Similarly, for the dispersed tribal population, special interventions, such as transport
facilities for the children, should be provided to cater to their educational needs. Many
of these people have been forcibly evicted by land acquisition and, therefore, the
project for which they were displaced should have funded for their rehabilitation,
including educational facilities at the resettlement sites.
6.13.7 Education of Nomadic Tribes
Nomadic tribes are constantly mobile depending on the climate, occupations and
livelihood opportunities. For instance, the Bakkarwals and Gujjars of Jammu and
Kashmir, move to higher altitudes in summers and return to lower altitudes in winters.
98 Education of the Tribal Girl Child: Problems and Proposals’ by A B Ota and R.P. Mohanty, Scheduled Castes and Scheduled
Tribes Research and Training Institute, Odisha

186
While residential schools have been set up for children in lower altitudes, the younger
children (Class I to V) travel along with their parents and do not stay in these schools.
Therefore, these children miss out on primary level schooling. Hence, this issue must
be addressed through a special mass contact program for creating awareness about the
need for schooling and long term benefits.
The region also borders the Line of Control and hence they are exposed to violence.
The Department of Tribal Affairs also has to ensure that there are female wardens for
girl students in residential schools and the space is not violated by armed men. Similar
action is required for other Nomadic Tribes. The basic principles are: (a) The
residential schools should be where the weather is least harsh, (b) there should be
special security for the children, including girl children for whom there should be
women wardens, (c) the parents of students should be brought to these institutions so
that they are informed about the education, and quality of life, of their children, (d)
there should be proactive efforts by Tribal Affairs officials of the State to approach
every family to help them make an informed choice to send their children to the
schools, (e) the holidays for these schools should be fixed in such a way that the
children can meet their family, when the family returns to the place where they
celebrate festivals, weddings, etc.
6.13.8 Single Window Scholarship Portal
There are multiple scholarship schemes of MoTA and MoHRD, including UGC
which have a number of beneficiaries. The immediate goal is to create a common
interface for the tribal students to provide information on different scholarship
schemes, available to them. One of the critical elements for success of such a Single
Window Scholarship Portal is to provide information about different scholarship
schemes in a simple and relevant manner. The portal should enable students to request
for scholarships directly.
6.14 Recommendations
There are multiple scholarship schemes of MoTA and MoHRD, including UGC
which have a number of beneficiaries. The immediate goal is to create a common
interface for the tribal students to provide information on different scholarship
schemes, available to them. One of the critical elements for success of such a Single
Window Scholarship Portal is to provide information about different scholarship
schemes in a simple and relevant manner. The portal should enable students to request
for scholarships directly.
1. The purpose of education anywhere, including in tribal areas, should be to
provide chidren with an understanding of the environment and society in
which they live and to endow them with the capability to earn a livelihood in

187
the local society and, for those who have the desire and ability, in the national
job market.
2. There is a marked gender gap with respect to education in tribal society. This
is reflected in the disparity in literacy levels, drop-out rates and enrolment in
higher education. Hence, there is a need for greater gender focus and social
mobilization to encourage education of girls. The State must develop certain
mechanisms to this effect.
3. Since the educational scenario in tribal areas is marked by poor infrastructure,
providing adequate infrastructure, such as classrooms, teachers and teaching
aids as well as basic facilities like electricity, water, boundary walls and toilets
is absolutely essential for the proper functioning of these schools and from the
perspective of security and safety of children.
4. In view of the deteriorating condition of elementary education in tribal areas,
where Sarva Siksha Abhiyan has hardly been of help, recourse should be taken
to the Right of Children to Free and Compulsory Education Act, 2009 which
provides for compulsory enrolment of all children between the age group 6 to
14, re-enrolment of those who have dropped out with the facility of special
coaching for admission in a class appropriate to his or her age, and admission
of a child in a neighbouring school of his or her choice. The Act should be
stringently implemented.
5. Keeping in view the difficulties of adjusting to a new cultural environment,
teachers for schools in the tribal regions should be recruited locally. Along
with the teaching staff, the administrative staff dealing with tribal education
should have regular orientation courses to appreciate tribal culture and way of
life. To facilitate such training, the centers of training should be located in the
tribal areas. There should be a separate cadre of teaching and administrative
staff, who will serve among the tribal schools over the long run.
6. New teacher training institutions should be opened in the TSP areas to meet
the full requirement of qualified and trained teachers. The curriculum for the
training should be drawn up very carefully, taking into account the socio-
cultural milieu, tribal ethos, language etc.
7. The dearth of teachers fulfilling the eligibility criteria set out under the RTE
Act is an impediment to achieving the right to education in tribal areas. For
addressing the current crisis of absence of teachers in tribal areas, special
efforts need to be made to produce more teachers who have qualified the
Teachers Ability Test. This must be done on an emergency basis. In the
interregnum, teachers appointed in educational institutions must be given a
term within which they qualify the Teachers Eligibility Test, and facilities be
provided to assist them in taking this test, including training, courses and
access to materials.

188
8. The State Governments should develop a policy for multilingual education, so
that early learning is conducted in the local language.
9. The experiment with the Model Primer developed in Odisha and other similar
ventures may be worked upon in TSP areas and in tribal languages in other
states as well.
10. Inclusion of local culture, folklore and history in the curriculum can help in
building confidence of tribal children and enhance the relevance of education
in their lives. Music and dance are a central part of tribal life. Therefore,
storytelling, theatre, painting, music and dance performances should be
promoted. Similarly, sports such as football, archery and other popular local
sports are extremely beneficial and therapeutic for children, and should be
promoted.
11. Recognizing that the tribal people have certain cultural ‘genius’, different
aspects of ‘indigenous knowledge’ should be documented, researched and
promoted. For developing better understanding of the tribal cultures and their
promotion, there should be appropriate number of tribal cultural academies in
regional centres. An important step in this direction is teaching tribal history
and culture in schools for both tribal and non-tribal children.
12. To address the problem of low representation of the tribals in higher
education, it is necessary to refurbish primary and secondary school education
through special coaching.
13. Institutions of ITDAs/ITDPs and micro-projects support to the tribal schools
should be strengthened for prevention of dropouts.
14. The policy of no-detention needs a review. When the student, teachers, or
parents of the student request for retention of a child to enable him/her to
acquire skills to move to the next class, he/she should be retained.
15. In light of the harsh terrain of tribal inhabitations, norms concerning distance
and Pupil-Teacher Ratio, at all levels of school education, should be reviewed.
16. The policy of vocational education at the secondary and senior secondary level
needs further integration and strengthening.
17. There is a marked absence of quality secondary and higher secondary schools
in tribal areas. The Government needs to establish well-run residential schools
such as Jawahar Navodaya Vidyalayas closer to the habitations (within a
radius of ten kilometres) up to Class XII. These schools must provide
comprehensive facilities for marginalized children including quality education,
health care and academic support classes.

189
18. Residential schools should be set up specifically for Nomadic Tribes. The
basic principles are: (a) The residential schools should be in places where the
weather is least harsh, (b) there should be special security for the children,
including girl children for whom there should be women wardens, (c) the
parents of students should be brought to these institutions so that they are
informed about the education, and quality of life, of their children, (d) there
should be proactive efforts by Tribal Affairs officials of the State to approach
every family to help them make an informed choice to send their children to
the schools, (e) the holidays for these schools should be fixed in such a way
that the children can meet their family, when the family returns to the place
where they celebrate festivals, weddings, etc.
19. In residential schools, which are often in the news for incidents of sexual
abuse of students, strong mechanisms should be put in place to protect the
students from abuse, neglect, exploitation and violence.
20. There is a need to recognise the adverse impact of violence on children’s
education. No schools or areas in the immediate vicinity of schools should be
occupied by security forces or the police, as has been the case in conflict zones
in tribal areas. Demilitarisation of schools is vital in order to restore schools as
a place of safety, security and scholarship for students.
21. Involvement of community in educational interventions through the
Panchayati Raj Institutions needs to be institutionalized. Information on
various schemes and benefits to beneficiaries should be provided to the Gram
Sabhas and Gram Panchayats, which would create transparency and increase
awareness about their entitlements.
22. There is a need for regular social audits to monitor the functioning of schools.
To this end, a monitoring committee at the block level for primary and middle
schools and district level for high and higher secondary schools should be set
up.
23. Most of the educational ‘missions’ do not reach the tribal areas and where they
do reach, they are too rare to have any significant impact. The State
educational machinery is largely responsible for this situation. There should be
proper accountability of the State educational administration to end the
longstanding stagnation in education in tribal areas.
24. The scope of education needs to be expanded for the purpose of scholarships
and should include tribal painting, art, craft, song, music and dance, etc. While
the Ministry of Tribal Affairs is now supporting scholarships for students
belonging to Scheduled Tribes, the UGC and the MoTA should support
scholarships for tribal studies for non-tribal students also. A single window

190
scholarship portal targeting the Scheduled Tribe students should be established
to provide information on different scholarship schemes.
25. Regional Resource Centres in States with significant tribal populations should
be established to provide training, academic and other technical support for
development of pedagogic tools and education materials catering to
multilingual situation.
26. It is suggested that owing to poor condition of the State Tribal Research
Institutes, there is the need to improve the same in terms of infrastructure,
quality of staff, research output and direction for policy. It is also
recommended that a Central Tribal Research Institute, as has been planned by
the Central Government, be launched.
27. It is recommended that a Tribal Chair be established by the UGC in
Universities in every State comprising Fifth Schedule Areas.

191
7. Health
7.1 Introduction
This chapter presents the status of health, health care and their selected determinants
among the Scheduled Tribes in comparison to the Non-Scheduled Tribe population in
India, using secondary data. It also makes recommendations to improve the situation,
including suggesting a set of specific goals to be achieved.
This chapter covers the following aspects:
1. Population size, growth, sex ratio and few other characteristics
2. Mortality
3. Fertility
4. Disease patterns
5. Nutrition
6. Hypertension
7. Addiction – tobacco and alcohol
8. Determinants of health: sources of drinking water, sanitation facilities and fuel
9. Public health infrastructure, human resources and health care seeking behavior
10. Maternal and Child Health Care Program Coverage
11. Conclusions
12. Recommendations
13. Goals to be achieved
7.2 Methods
In this chapter, we have primarily based our analysis from data obtained from two
studies. Firstly, a study commissioned by the High Level Committee to a team of
researchers who compiled and analyzed secondary data from available sources.99
Secondly, data from the Technical Report of the National Nutrition Monitoring
Bureau, titled ‘Diet and Nutritional Status of Tribal Population and Prevalence of
Hypertension among Adults’, (2009) was examined closely.100 The recommendations
in this chapter are based on these data, inputs received from various stakeholders and
the deliberations in the High Level Committee.
7.3 Sources of data
Different secondary data sources providing information on tribals in India are
analyzed. These datasets include:
99 Prof. F. Ram, Prof. Chander Shekhar and Prof. H. Lhungdim, International Institute for Population Sciences, Mumbai. 100 We gratefully acknowledge these two reports.

192
Census of India, 2001, 2011
District Level Household Survey (DLHS), 2007-08
National Sample Survey, 2007-08
National Sample Survey, 2012-13
National Family Health Survey (NFHS), 1992-93, 1998-99, 2005-06
Rural Health Statistics, MoHFW, 2012
National Nutrition Monitoring Bureau, Technical Report no. 25, 2009
Other Micro-level Sample Surveys and Research Studies
At the outset, it must be expressed that disaggregated data on the health status of and
health care to tribal population are not easily available. They are subsumed in the
general population. The most recent data are often ten years old. This chapter is an
early effort to weave these data together.
7.4 Population characteristics
This section presents the data on population size, growth, sex ratio and occupational
structure of Scheduled Tribes population.
7.4.1 Population Growth
According to Census 2011, the Scheduled Tribes constitute 8.6 percent of the total
population in India. In the last decade, i.e. between 2001 and 2011 Censuses, (Table
7.1) the tribal population has grown annually by 2.1 percent, but some states have
experienced negative growth (eg. Nagaland and Andaman & Nicobar Islands). The
annual growth has been highest in Sikkim (6.2 percent), Bihar (5.7 percent), and
Himachal Pradesh (4.7 percent). Two states (Goa and Uttar Pradesh) have witnessed
an exceptional growth, due to notification of additional caste/tribe groups under
Scheduled Tribes.

193
Table 7.1: Annual exponential growth rate of Scheduled Tribe Population between
Census of India, 2001 and 2011
States/UTs 2001 2011 Annual Growth Rate (%)
Jammu & Kashmir 11,05,979 14,93,299 3.00
Himachal Pradesh 2,44,587 3,92,126 4.72
Uttarakhand 2,56,129 2,91,903 1.31
Rajasthan 70,97,706 92,38,534 2.64
Uttar Pradesh 1,07,963 11,34,273 (23.5)
Bihar 7,58,351 13,36,573 5.67
Sikkim 1,11,405 2,06,360 6.16
Arunachal Pradesh 7,05,158 9,51,821 3.00
Nagaland 17,74,026 17,10,973 -0.36
Manipur 7,41,141 9,02,740 1.97
Mizoram 8,39,310 10,36,115 2.11
Tripura 9,93,426 11,66,813 1.61
Meghalaya 19,92,862 25,55,861 2.49
Assam 33,08,570 38,84,371 1.60
West Bengal 44,06,794 52,96,953 1.84
Jharkhand 70,87,068 86,45,042 1.99
Odisha 81,45,081 95,90,756 1.63
Chhattisgarh 66,16,596 78,22,902 1.67
Madhya Pradesh 1,22,33,474 1,53,16,784 2.25
Gujarat 74,81,160 89,17,174 1.76
Daman & Diu 13,997 15,363 0.93
Dadra & Nagar Haveli 1,37,225 1,78,564 2.63
Maharashtra 85,77,276 1,05,10,213 2.03
Andhra Pradesh 50,24,104 59,18,073 1.64
Karnataka 34,63,986 42,48,987 2.04
Goa 566 1,49,275 (55.8)
Lakshadweep 57,321 61,120 0.64
Kerala 3,64,189 4,84,839 2.86
Tamil Nadu 6,51,321 7,94,697 1.99
Andaman & Nicobar
Islands 29,469 28,530 -0.32
India 8,43,26,240 10,42,81,034 2.12 Note: Average annual growth rate for whole (Scheduled Tribes and Non-Scheduled Tribes) population of India is 1.69 persons
per 100 population. Figures in parentheses () are high due to notifying some additional castes/tribes as Scheduled Tribes.
7.4.2 Sex Ratio
The tribal population has shown favorable sex ratio as compared to other social
groups in the country, with 990 females per 1000 males (Table 7.2). The sex ratio of
tribal population reflects nearly equal share of males and females as seen in Himachal
Pradesh and West Bengal (each with 999/1000 males) or favorable to females as in
Goa (1046 females), followed by Kerala (1035 females), Arunachal Pradesh (1032
females), Odisha (1029 females), Chhattisgarh (1020 females) and Meghalaya (1013
females).

194
Table 7.2: Sex Ratio of population in India and States/UTs, 2011
Note: The definition of Sex Ratio is taken as number of females per thousand males.
Source: Census of India, 2011.
101 The category ‘Non-Scheduled Tribes’ is same as the term ‘Others’ used in the other chapters.
Total Rural Urban
States/UTs Scheduled
Tribes
Non-
Scheduled
Tribes101
Schedule
d Tribes
Non-
Scheduled
Tribes
Schedul
ed
Tribes
Non-
Schedule
d Tribes
Jammu & Kashmir 924 884 927 904 872 839
Himachal Pradesh 999 970 1003 985 923 852
Uttarakhand 963 963 966 1001 938 883
Rajasthan 948 925 951 929 893 914
Uttar Pradesh 952 912 959 917 884 894
Bihar 958 917 960 920 934 895
Sikkim 960 856 942 849 1042 873
Arunachal Pradesh 1032 759 1022 780 1083 724
Nagaland 976 687 964 675 1014 694
Manipur 1002 987 995 961 1051 1022
Mizoram 1007 565 967 612 1047 546
Tripura 983 949 982 937 1017 971
Meghalaya 1013 851 996 896 1104 793
Assam 985 954 984 956 996 943
West Bengal 999 947 1000 949 991 943
Jharkhand 1003 930 1003 942 1007 900
Odisha 1029 964 1031 974 991 926
Chhattisgarh 1020 978 1021 990 999 951
Madhya Pradesh 984 917 986 918 956 916
Gujarat 981 909 984 939 952 878
Daman & Diu 977 599 982 849 972 536
Dadra & Nagar
Haveli 1010 574 1011 383 1002 628
Maharashtra 977 925 984 946 942 902
Andhra Pradesh 993 993 996 996 968 988
Karnataka 990 972 990 978 993 962
Goa 1046 965 1026 999 1076 947
Lakshadweep 1003 286 994 381 1006 264
Kerala 1035 1085 1031 1079 1070 1091
Tamil Nadu 981 997 982 993 980 1000
Andaman & Nicobar
Islands 937 871 931 871 1030 872
India 990 938 991 944 980 928

195
7.4.3 Occupational Structure
Table 7.3 provides occupational structure of Scheduled Tribes and Non-Scheduled
Tribes population presented in three broad categories. Primary sector includes
agriculture and the allied activities, secondary sector includes manufacturing, and the
tertiary sector includes the service sector. Table 7.3 clearly indicates large disparities
in occupational structure between the two groups at the national as well as sub-
national levels. Two-thirds of Scheduled Tribes are still working in primary sector,
whereas this proportion is lower for Non-Scheduled Tribes population (43 percent).
The involvement of Scheduled Tribes is low in tertiary sector (15 percent), as
compared to Non-Scheduled Tribes population (29 percent).

196
Table 7.3: Occupational structure by types of sector among Scheduled Tribes
and Non-Scheduled Tribes102
States/UTs
Primary Secondary Tertiary
ST
Non-
Scheduled
Tribes
ST
Non-
Scheduled
Tribes
ST
Non-
Scheduled
Tribes
Jammu & Kashmir 35.1 28.0 36.2 41.0 28.7 31.0
Himachal Pradesh 31.3 42.2 30.8 30.2 38.0 27.7
Uttarakhand 41.5 34.9 15.9 24.6 42.6 40.5
Rajasthan 42.4 40.4 48.4 35.7 9.3 23.9
Uttar Pradesh 48.3 48.1 30.8 31.7 20.9 20.2
Bihar 65.9 63.1 31.4 18.6 2.7 18.3
Sikkim 60.7 50.3 5.2 13.8 34.1 36.0
Arunachal Pradesh 73.1 46.4 5.2 23.2 21.7 30.4
Nagaland 46.0 6.7 13.6 73.9 40.5 19.4
Manipur 55.9 38.5 17.1 28.7 27.1 32.8
Mizoram 43.6 68.3 16.2 10.2 40.2 21.5
Tripura 41.2 25.4 43.6 39.8 15.3 34.7
Meghalaya 48.6 25.5 8.4 14.1 43.0 60.4
Assam 65.1 53.0 17.7 23.7 17.2 23.3
West Bengal 82.0 41.2 7.7 30.9 10.3 27.9
Jharkhand 65.8 32.0 22.8 36.6 11.4 31.4
Odisha 65.7 46.7 22.1 28.4 12.2 24.8
Chhattisgarh 81.8 61.2 9.1 19.9 9.1 18.9
Madhya Pradesh 73.0 49.4 18.4 24.6 8.6 26.1
Gujarat 77.3 38.0 11.0 30.8 11.8 31.2
Daman & Diu 3.6 20.8 89.9 28.3 6.5 50.9
Dadra & Nagar Haveli 34.5 0.3 42.6 51.8 22.9 47.9
Maharashtra 63.0 37.7 17.9 19.3 19.0 42.9
Andhra Pradesh 75.6 43.8 11.4 25.5 13.0 30.7
Karnataka 68.5 45.6 12.8 16.9 18.7 37.5
Goa 7.9 5.4 24.9 14.5 67.2 80.2
Lakshadweep 19.9 14.5 24.3 43.8 55.8 41.7
Kerala 45.8 22.0 30.4 38.3 23.7 39.7
Tamil Nadu 63.4 33.6 17.1 32.8 19.5 33.6
Andaman & Nicobar
Island 72.6 15.5 5.1 32.7 22.3 51.8
India 65.7 43.0 19.8 27.6 14.5 29.4 Source: NSSO 68th Round, 2012-13
102 Occupational structure is divided into primary, secondary and tertiary sectors. Primary sector refers to agriculture and allied
operations while tertiary sector is the service sector.

197
Comment:
7.5 Mortality
In the absence of a good civil registration system in the country, it is very difficult to
get latest reliable estimates of fertility and mortality. At the state level there is data on
fertility and mortality, but there is no data generated for the Scheduled Tribes, which
is important for targeted approach of planning and program implementation. This
could also be one of the important factors for poor results from interventions in tribal
areas and there is no way to monitor or evaluate the program. Even the Sample
Registration System (SRS) does not provide estimates on Scheduled Tribe population
at national level, which should have been mandatory. At least in the states, where the
Scheduled Tribe population is more than 8-10 percent, the SRS should provide
estimates.
Tables 7.4 to 7.6 provide the estimates of Neonatal Mortality Rate (NMR), Infant
Mortality Rate (IMR), and Under-five Mortality Rate (U5MR). These are all
deaths in the respective age group per 1000 live births. It may be observed that, the
estimated IMR for Scheduled Tribes was 88 per 1000 live births against all-India
estimate of about 68 (including Scheduled Tribes) as per the Census of India, 2001. It
means that compared to total population, the IMR for Scheduled Tribes population
was around 30 percent higher. Further, U5MR was 129 for Scheduled Tribes against
all-India estimates of around 96 (higher by almost 35 percent). There is huge variation
across states as lowest U5MR is around 55 (many states around 60), whereas highest
is more than 100 for several states.
Population Primary
sector
Tertiary
Sector
Ratio
Non-Scheduled Tribe 43% 29% 3 : 2
Scheduled Tribe 66% 15% 9 : 2

198
Table 7.4: Infant mortality, Under-5 mortality and Life expectancy at birth for
Scheduled Tribes population
States/UTs Infant Mortality
Rate
Under-five Mortality
Rate
Life Expectancy
(Years)
Jammu & Kashmir 93 139 59.7
Himachal Pradesh 69 98 65.1
Uttarakhand 74 106 64.0
Rajasthan 104 158 57.2
Uttar Pradesh 89 132 60.5
Bihar 81 117 62.5
Sikkim 69 97 65.3
Arunachal Pradesh 106 163 56.7
Nagaland 79 114 63.0
Manipur 72 103 64.5
Mizoram 61 85 67.1
Tripura 74 106 64.0
Meghalaya 86 126 61.3
Assam 64 90 66.3
West Bengal 78 113 63.0
Jharkhand 80 116 62.6
Odisha 98 149 58.5
Chhattisgarh 100 152 58.0
Madhya Pradesh 113 175 55.2
Gujarat 67 94 65.8
Daman & Diu 55 76 68.6
Dadra & Nagar Haveli 71 101 64.7
Maharashtra 70 99 65.1
Andhra Pradesh 71 100 64.8
Karnataka 69 97 65.2
Goa NA NA NA
Lakshadweep 66 93 65.8
Kerala 64 89 66.4
Tamil Nadu 65 92 66.1
Andaman & Nicobar
Islands
107 164 56.7
India
Range
88
(55-113)
129
(76-175)
60.9
(55-68.6) Note: Estimates derived using Census, 2001 information on average children ever born and average children surviving
Source: Estimated from Census of India, 2001
Using a different dataset (NFHS-3, 2005-06), in Table 7.5, the estimates of Infant
Mortality Rate in the Scheduled Tribes population, was found to be about 62 per
1000 live births and U5MR was 96 per 1000 live births. Compared to rest of the
population, IMR was higher by 27 percent and U5MR rate was higher by 61 percent.

199
Table 7.5: Neonatal Mortality Rate, Infant Mortality Rate and Under-five
Mortality Rate among Scheduled Tribes and Other by States/UTs
Neonatal Mortality
Rate
Infant Mortality Rate Under-five Mortality
Rate
India/States
Schedule
d Tribes Other*
Schedule
d Tribes Other*
Schedule
d Tribes Other*
Jammu and Kashmir 11.2 34.0 34.3 44.7 * 9.0
Himachal Pradesh * 24.0 * 28.2 * 33.1
Uttarakhand * 27.3 * 43.8 * 52.2
Rajasthan 38.4 44.7 73.2 58.1 113.8 69.9
Uttar Pradesh -- 38.1 -- 71.4 -- 87.7
Bihar -- 51.6 -- 82.2 -- 108.9
Sikkim 14.3 37.3 28.9 48.7 35.9 59.9
Arunachal Pradesh 34.9 28.8 67.6 48.7 100.9 78.6
Nagaland 20.9 17.2 45.8 33.8 65.8 53.5
Manipur 34.2 18.2 51.2 25.8 71.4 37.9
Mizoram -- -- -- -- -- --
Tripura 44.8 29.0 * 53.4 * 56.9
Meghalaya 23.9 * 49.3 * 74.0 *
Assam 43.9 48.1 59.0 74.0 83.2 100.9
West Bengal * 42.9 * 56.6 * 70.4
Jharkhand 64.3 60.7 93.0 75.5 138.5 92.7
Odisha 54.0 31.7 78.7 53.1 136.3 64.2
Chhattisgarh 67.0 63.3 90.6 83.1 128.5 109.3
Madhya Pradesh 56.5 39.6 95.6 66.8 140.7 79.9
Gujarat 53.0 35.9 86.0 47.3 115.8 55.7
Maharashtra 32.5 34.3 51.4 40.5 69.8 47.4
Andhra Pradesh 63.4 46.3 94.1 54.0 112.0 63.2
Karnataka 36.0 29.0 45.8 43.5 77.9 60.4
Goa * 15.0 * 22.2 * 29.2
Kerala * 13.9 * 19.9 * 20.7
Tamil Nadu * * * * * *
India 39.9 34.5 62.1 48.9 95.7 59.2 Note: * -Others exclude Scheduled Castes and Other Backward Castes.
Source: International Institute for Population Sciences (IIPS). National Family Health Survey, (NFHS-3), 2005-06: India.
Mumbai.
Comments:
i) Independent population-based studies have shown that in the national surveys
like SRS and NFHS, the NNMR is underestimated, thereby underestimating
the IMR by nearly 30 to 35 percent. (Hidden Child Mortality in
Maharashtra).103
103 Bang Abhay, Reddy Hanimi, Deshmukh Mahesh: Hidden Child Mortality in Maharashtra (2006) Ministry of Health and
Family Welfare, Government of India.

200
ii) The U5MR is better recorded/reported. It represents the magnitude more
accurately.
iii) The 1-4 year mortality is 33.6 in Scheduled Tribes and 10.3 in the non-
Scheduled Tribes. There is a scope for corrective action like immunization,
management of acute respiratory infections, Diarrhea and Malnutrition.
iv) A very high IMR and U5MR in seven states namely Jharkhand, Odisha,
Chhattisgarh, Madhya Pradesh, Gujarat, Rajasthan and Andhra Pradesh need
urgent attention.

201
Table 7.6: Trends in Neonatal, Infant and Under-five mortality rates for
Scheduled Tribes and Total Population by State/UTs
States/UTs/UT
Neonatal Mortality Rate Infant Mortality Rate Child Mortality Rate
Sched
uled
Tribes
Total Schedu
led
Tribes
Total Sched
uled
Tribes
Total Sched
uled
Tribes
Total Sched
uled
Tribes
Total Sched
uled
Tribes
Total
1992-93 1998-99 1992 -93 1998-99 1992 -93 1998-99
Jammu &
Kashmir * 32 * 38 * 45 * 63 * 59 * 79
Himachal Pradesh * 34 * 25 * 56 * 40 * 69 * 48
Rajasthan 42 37 58 54 75 73 95 88 124 103 155 125
Uttar Pradesh 116 60 51 62 90 100 83 95 128 141 125 132
Bihar 59 54 56 49 97 89 82 76 136 128 117 110
Sikkim * * * 26 * * 44 * * 71
Arunachal
Pradesh * 18 * 42 * 40 * 42 * 72 * 98
Nagaland * 10 * 20 * 17 * 42 * 21 * 64
Manipur * 25 * 19 * 42 * 37 * 62 * 56
Mizoram * 8 * 19 * 15 * 37 * 29 * 55
Tripura * 44 * * * 76 * * 105 * *
Meghalaya * 38 * 51 * 64 * 89 * 87 * 122
Assam 48 52 33 37 90 89 59 62 150 142 74 80
West Bengal 88 52 58 34 107 75 85 51 133 99 100 71
Odisha 53 65 56 56 113 112 99 89 149 131 138 116
Madhya Pradesh 60 53 69 60 103 85 101 93 167 130 180 145
Gujarat 62 42 31 42 92 69 60 64 127 104 95 91
Maharashtra 40 36 49 38 66 51 74 53 99 70 92 70
Andhra Pradesh 56 45 58 47 85 70 104 71 134 91 116 91
Karnataka 68 45 63 44 86 65 85 62 120 87 121 83
Goa * 20 * * * 32 * * * 39 * *
Kerala * 16 * 15 * 24 * 21 * 32 * 26
Tamil Nadu * 46 * 36 * 68 * 51 * * * 65
India 55 49 53 43 91 79 84 68 135 109 127 95
Source: International Institute for Population Sciences (IIPS). National Family Health Survey, (NFHS-1 (1992-93) and NFHS 2
(1998-99, India. Mumbai; Note: 'Total' includes SCs. Scheduled Tribes, OBCs and Others;

202
Table 7.6 indicates that during the period 1992-98, there has not been much significant
change in IMR and U5MR among Scheduled Tribes.
Comment: In Scheduled Tribes population, there was only about 10 percent
reduction in the IMR during 1992-98, whereas in the total population about 25 percent
reduction occurred during the same period.
7.6 Fertility
Table 7.7 provides Total Fertility Rate (TFR) from NFHS 3 (2005-06). For India as
a whole, the estimated TFR among the Scheduled Tribe population was around 3.1
against estimate of 2.4 for the rest of the population. In view of socio-economic
condition of the Scheduled Tribes population the TFR of 3.1 was not high.
Table 7.7: Total fertility rates for Scheduled Tribes and Others by State/UTs
States/UTs Scheduled Tribes Others
Andhra Pradesh * 1.6
Arunachal Pradesh 3.1 2.8
Assam 2.5 2.7
Bihar # 3.4
Chhattisgarh 2.8 1.8
Goa * 1.8
Himachal Pradesh & 1.8
Jammu & Kashmir * 2.1
Jharkhand 3.8 2.8
Karnataka 2.5 2.0
Kerala & 2.2
Madhya Pradesh 3.8 2.3
Maharashtra 2.4 2.1
Manipur 3.8 2.6
Meghalaya 4.2 *
Nagaland 3.5 3.2
Odisha 3.1 2.0
Rajasthan 3.7 2.8
Sikkim 1.9 2.2
Tripura * 2.1
Uttar Pradesh 5.3 3.2
Uttarakhand * 2.4
West Bengal * 2.3
India 3.12 2.35 Note: 'Others' does not include Schedules Castes and Other Backward Castes.
Source: International Institute for Population Sciences (IIPS). National Family Health Survey, (NFHS-3), 2005-06: India.
Mumbai.

203
It may be observed from Figure 1 below that contraceptive use (currently married
women aged 15-49 using any contraceptive method) among Scheduled Tribes at the
all-India level has been comparable to Non-Scheduled Tribe population (41 percent
versus 49 percent). In view of the socio-economic context, there are two possible
explanations related to a relatively high contraceptive use in Scheduled Tribes.
Firstly, it may be that tribal populations have access to contraception and they are
regulating the fertility, which in long run may be beneficial in terms of mother child
health. The second view is that Indian family welfare program has been sterilization
dominated driven by incentives and therefore the poor people fighting with hunger opt
to use sterilization to get money. In fact, many demographers feel that this is one of
the strategies of poor to overcome poverty.
There are more than 15 states and India as a whole where Contraceptive Prevalence
Rate (CPR) is more than 40 per cent (Fig.7.1) indicating the fact that large population
is in contact with health system. The states where CPR is low among tribes are those
whose overall performance is poor. Nevertheless the gap between Scheduled Tribes
and Non-Scheduled Tribes is not very alarming, as far as use of contraception is
concerned.
Figure 7.1:
Fig. 1: CONTRACEPTIVE USE (2007-08)

204
Table 7.8: Percentage of currently married women aged 15-49 years, currently
using any modern contraceptive method by states/India
States/UTs
Scheduled Tribes Non-Scheduled Tribes
Percentage Sample Percentage Sample
Jammu & Kashmir 38.9 2508 43.3 12165
Himachal Pradesh 68.1 1077 69.6 8545
Uttarakhand 57.3 268 58.9 11839
Rajasthan 53.5 6190 55.6 32607
Uttar Pradesh 28.1 1177 27.0 81631
Bihar 19.2 927 29.6 43412
Sikkim 63.0 1966 57.0 2210
Arunachal Pradesh 47.3 10794 51.2 3072
Manipur 15.8 4597 23.4 4156
Mizoram 57.3 6598 39.8 247
Tripura 33.3 1560 45.5 2361
Meghalaya 15.8 5604 26.2 566
Assam 34.3 6928 29.8 21662
West Bengal 45.3 1547 54.0 18995
Jharkhand 17.2 8364 38.7 17411
Orissa 27.1 7212 44.1 19154
Chhattisgarh 40.1 6582 54.1 10337
Madhya Pradesh 48.0 10488 56.9 33701
Gujarat 52.4 5875 57.7 17110
Daman & Diu 57.8 279 53.6 1499
Dadra & Nagar Haveli 51.9 573 54.4 304
Maharashtra 60.4 6018 64.8 26569
Andhra Pradesh 57.9 2075 67.5 17756
Karnataka 60.0 2269 62.4 22935
Goa 40.5 118 36.5 1238
Lakshadweep 16.2 1240 32.0 24
Kerala 57.7 234 55.8 11438
Tamil Nadu 43.5 429 59.4 24158
Andaman & Nicobar Islands 62.4 86 67.5 1639
India 41.9 103835 49.3 500969 Note: Percentage is weighed and sample size is un-weighted.
Source: International Institute for Population Sciences (IIPS), District Level Household and facility Survey, (DLHS-3), 2007-08: Mumbai, India
7.7 Disease Patterns
Quality epidemiological data on the national prevalence and incidence of various
diseases among Scheduled Tribes is almost non-existent. The Indian Council of
Medical Research (ICMR), through its various national institutes and centers, collects
data on some diseases in certain states and among some tribes. Qualitative impressions
of the stakeholders and the doctors/NGOs working in Scheduled Areas are some of the
other sources utilized to make conclusions.

205
Based on these, below are some broad generalizations.
The diseases prevalent in tribal areas can be broadly classified into following
categories:
A) Malnutrition – Low birth weight, under-nutrition of children, lower body
size of adults, anemia, iron and vitamin A and B deficiency.
B) Maternal and child health problems – higher IMR, U5MR, neonatal
mortality, acute respiratory infections, and diarrhea.
C) Communicable diseases – malaria, filaria, tuberculosis, leprosy, skin
infections, sexually transmitted diseases, HIV, typhoid, cholera, diarrheal
diseases, hepatitis, and viral fevers.
D) Accidents and injuries – including the burns, falls, animal bites, snake
bites, violence due to conflicts, and more recently, motor cycle accidents.
E) High consumption of alcohol and tobacco in most areas and of drugs in the
Northeast region.
F) Hereditary diseases such as the Hemoglobinopathies (Sickle Cell) and G-6
PD deficiency.
G) Mental health problems – especially in the areas affected by conflicts.
H) Speciality problems – especially the orthopedic and surgical problems,
gynecological problems, oro-dental problems and eye problems.
I) Non-communicable illnesses – hypertension, stroke, diabetes, and cancers.
Generally, we may conclude, that the Scheduled Tribes in India suffer
predominantly from:
A) The diseases of underdevelopment (malnutrition, communicable diseases,
maternal and child health problems),
B) Diseases, particularly common in Scheduled Tribe population (Sickle cell
disease, animal bites, accidents) and
C) Diseases of modernity (hypertension, high consumption of alcohol and
tobacco, stress).
7.8 Nutrition
For this section, data is heavily borrowed from three studies carried out by the
National Nutrition Monitoring Bureau (NNMB), a body of the Indian Council of
Medical Research. We extensively quote from the latest report.104 We have
maintained the figure numbers as in the NNMB report.
104 National Nutrition Monitoring Bureau : Diet and Nutritional Status of Tribal Population and Prevalence of Hypertension among Adults – Report on Second Repeat Survey, NIN, ICMR Hyderabad (2009)
206
‘The National Nutrition Monitoring Bureau carried out a repeat survey in ITDA areas
during 2007-08, covering 75 percent of the villages (90), which were surveyed during
1985-87 and 1998-99 and 25 percent of the new villages (30), to assess the current
diet and nutritional status and time trends, if any, in the nutritional status and food
consumption pattern of tribal population.
In view of recent increase in prevalence of overweight and obesity and its co-
morbidities among urban, rural and tribal communities in epidemic proportions,
assessment of prevalence of overweight and obesity and hypertension among tribal
adult men and women (≥ 20 years) was also carried out, in addition to the diet and
nutrition surveys in nine NNMB States.
A total of 1,15,113 individuals were covered for nutritional anthropometry, clinical
examination and current history of morbidity, from 40,359 households in 1032
villages of the 9 states. Data on food and nutrient intake was collected from 41,057
individuals of different age and sex groups from about 10,077 households.
Measurement of blood pressure, waist and hip circumference and information on
knowledge and practices about hypertension and diabetes was collected among
47,410 adults of ≥ 20 years.’
7.8.1 Findings
Selected findings from the NNMB report on the Scheduled Tribe population are
reproduced here, followed by a discussion and conclusions by the NNMB. All figures
and data relate to the population in Integrated Tribal Development Project areas.
It was observed that, in general, the overall intake of various foods were less
than Recommended Daily Allowance (RDA). Similarly, the average intakes of
all the nutrients, except for thiamine and vitamin C were less than RDA.
Cereals and millets formed the bulk of the diets in all the States. The intake of
protective / income-elastic foods such as green leafy vegetables, milk and milk
products, fats and oils were well below the recommended levels. The
inadequacy was greater among younger age groups.
The extent of dietary energy and proteins inadequacy was more pronounced,
reiterating the fact that, it is essentially a ‘food gap’. The intakes of various
micronutrients, specifically that of iron, vitamin A, riboflavin and folic acid
was found to be grossly inadequate, which is in consonance with inadequate
intake of protective foods.
The average intake of all nutrients, barring thiamine, niacin and vitamin C
declined over the period 1998-99 to 2007-08. The intake of most of the
nutrients declined in Tamil Nadu, Karnataka, Andhra Pradesh and
Maharashtra, Orissa and West Bengal during the same period.

207
The proportion of tribal population of different age groups consuming less than
70 percent of protein and energy was observed to be higher compared to their
rural counterparts. About 29-32 percent of children of different age groups and
63-74 percent among adult men and women were consuming diets that were
adequate in both protein and energy. The proportion of individuals with
protein-calorie adequacy decreased among all the age groups, during the same
period.
The prevalence of clinical forms of protein-energy malnutrition, vitamin
deficiency, signs like Bitot spots and angular stomatitis declined over the
period 1998-99 to 2008-09. The distance charts revealed that there was
marginal improvement in the weight and height of individuals of different age
groups and both the genders over the period, but continued to be lower than the
median NCHS values.
Though, the overall prevalence of underweight, stunting and wasting (WHO
standards) among 1-5 year tribal children was higher (52 percent, 55 percent
and 22 percent versus 43 percent, 49 percent and 19 percent respectively),
compared to their rural counterparts, but was slightly lower than the previous
survey carried out in 1998-99 (57 percent, 58 percent and 23 percent
respectively).
Similarly the overall prevalence of severe underweight (weight for age
<Median-3SD) also declined from 23 percent in 1998-99 to 20 percent in
2007-08, severe stunting decreased from 31 percent to 26 percent, while the
prevalence of severe wasting, has declined marginally from seven percent to
six percent (NNMB 1998-99). Thus, it was concluded that the improvement in
the nutritional status of preschool children was only marginal. The prevalence
of under-nutrition was higher among 1-3 year children as compared to 3-5 year
children as was observed in other studies.
The prevalence of chronic energy deficiency (BMI<18.5) had decreased by
about nine percent in adult men and by about six percent in adult women
during 1998-99 to 2007-08, while the prevalence of overweight/obesity
(BMI≥23) had increased from 3.6 percent to seven percent among men and
four percent to eight percent among women during the same period. It was
observed that the prevalence was 17 percent among men and 20 percent among
women for the rural counterparts.
The marginal improvement in the nutritional status of the individuals, despite a
decline in the food and nutrient intake, could be attributed to non-nutritional
factors, such as improvement in access to safe drinking water, better out-reach
of health care services and improvement in socio-economic conditions.

208
From this we can conclude that, under-nutrition is still an important public health
problem among tribal children and urgent strengthening of nutrition interventions
and other programs focused towards food and nutrient security among the
population are needed.
Figure 7.2:
Figure 7.3:
Figure 7.4:

209
Figure 7.4
Figure 7.5:

210
Figure 7.6:
Figure 7.7:
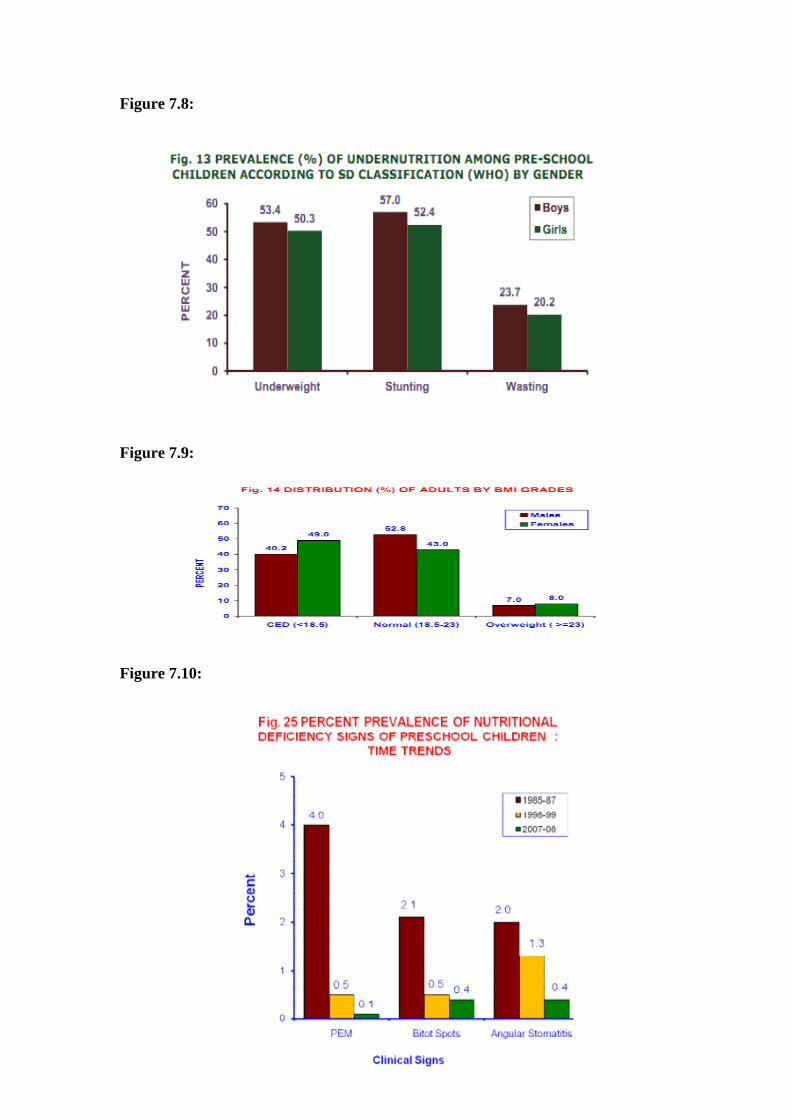
211
Figure 7.8:
Figure 7.9:
Figure 7.10:

212
Figure 7.11:
Figure 7.12:
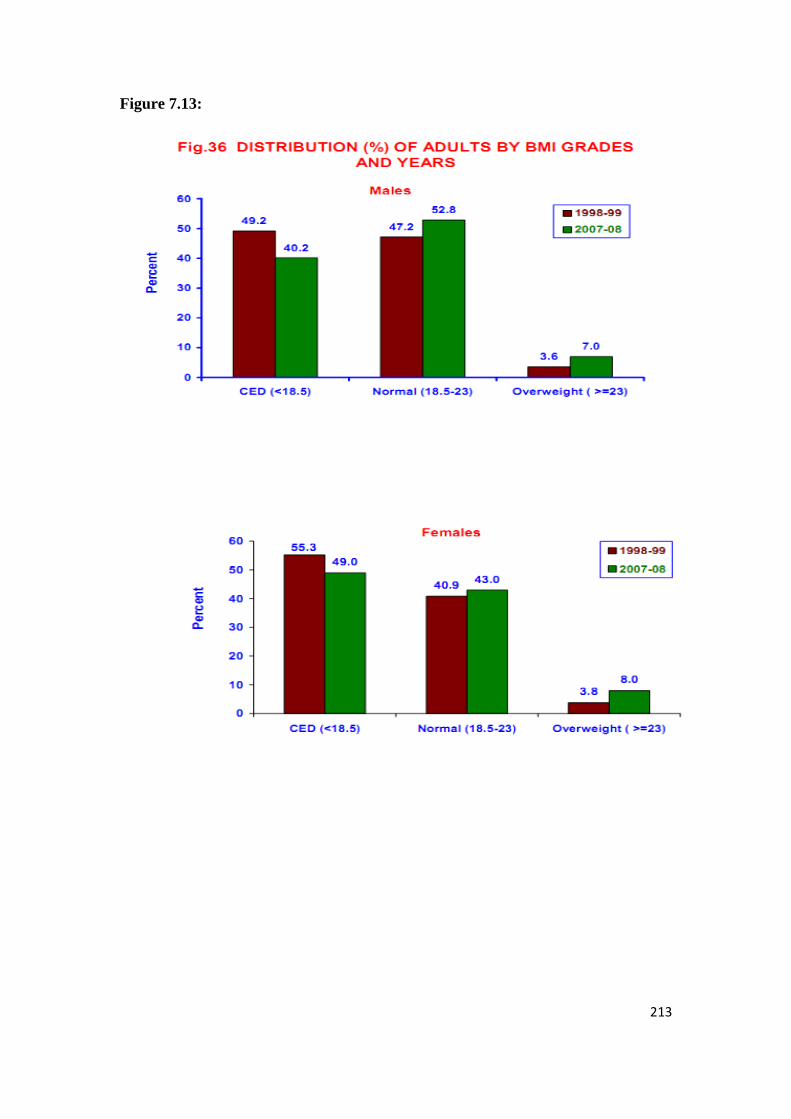
213
Figure 7.13:

214
7.9 Hypertension
The NNMB survey of Scheduled Tribe population, showed that:
The prevalence of hypertension105 among adult tribal population, was 25 percent
among men and 23 percent among women, which was comparable to that reported for
rural adults. A study carried out among tribal population of aboriginal Nicobarees in
2010 reported very high (50 percent) prevalence of hypertension. Prevalence of
hypertension increases with age and was higher among elderly population as observed
in other studies. Awareness of hypertension was however very low (8.4 percent)
among adult tribal population which is similar with other studies. It was also observed
that the prevalence of hypertension was higher in the State of Kerala and Orissa, as
observed by other studies in Kerala.
Also, prevalence of hypertension increased and is found to be significantly higher
among tribal adult population of Odisha and Kerala. It was also noted that the
prevalence of hypertension was relatively higher among older adults, compared to
young adults and in men compared to women. The prevalence was also highest in the
States of Orissa and Kerala and significantly lower in Gujarat. It is also observed that
there is a low level of awareness about the condition. Hence, increased awareness
about the condition through health education, and early diagnosis and prompt
treatment will prevent consequences, due to hypertension such as cardiovascular
diseases, peripheral vascular diseases, kidney diseases etc. Information, Education and
Communication activities addressing the issue of hypertension need to be
strengthened in these areas.
Figure 7.14:
105 As per Criteria of Joint National Committee On Prevention, Detection, Evaluation and Treatment Of High Blood Pressure
VII Report.

215
Figure 7.15:
7.10 Consumption of Tobacco and Alcohol
7.10.1 Consumption of Tobacco
Consumption of tobacco or alcohol in any form has negative implications on health
causing diseases such as cancer and tuberculosis. Table 7.9 provides data on
consumption of tobacco, both through smoking or chewing among men belonging to
Scheduled Tribes and Non-Scheduled Tribes, in the age group, 15-54 years. The
prevalence of tobacco consumption was around 72 and 56 percent among Scheduled
Tribes and Non-Scheduled Tribes respectively. The rural-urban gap exists between the
two groups, where more rural men consumed tobacco than urban men. Around 73
percent rural Scheduled Tribe men consumed tobacco as compared to 60 percent among
urban counterparts. The prevalence of tobacco consumption among Scheduled Tribe
men was quite high in states like West Bengal, Bihar, Mizoram and Odisha (more than
80 percent).

216
Table 7.9: Prevalence of Tobacco consumption (Smoke/Chewing) among Men
aged 15-54, (NFHS (2005-06))
States/UTs Scheduled Tribes Non-Scheduled Tribes
Urban Rural Total Urban Rural Total
Jammu & Kashmir 45.1 46.8 46.6 46.3 57.2 53.7
Himachal Pradesh 9.1 31.5 28.6 32.8 42.8 41.5
Uttarakhand 82.9 79.7 80.9 48.1 56.8 53.7
Rajasthan 72.2 75.5 75.2 55.7 61.5 59.4
Uttar Pradesh 57.8 88.3 83.2 57.7 67.9 64.8
Bihar 74.6 85.7 84.2 59.6 70.2 67.7
Sikkim 68.0 53.7 55.5 65.8 66.7 66.4
Arunachal Pradesh 62.5 53.7 55.5 69.2 75.6 73.1
Nagaland 66.2 67.8 67.5 67.9 67.1 67.2
Manipur 72.7 74.8 74.7 66.5 69.7 68.3
Mizoram 81.6 86.2 83.8 85.7 * 78.3
Tripura 79.3 79.0 79.2 69.7 78.7 77.0
Meghalaya 68.4 70.6 70.2 62.3 75.5 69.6
Assam 78.3 75.5 75.6 65.7 74.6 72.4
West Bengal 60.1 89.7 87.8 70.4 69.9 70.1
Jharkhand 56.6 75.3 74.0 50.0 63.2 58.1
Odisha 77.5 80.8 80.4 60.7 67.2 65.7
Chhattisgarh 73.4 76.5 76.3 62.9 67.1 65.8
Madhya Pradesh 65.6 74.9 74.1 60.3 72.0 67.7
Gujarat 33.3 67.3 64.6 56.3 62.5 59.5
Maharashtra 58.1 64.7 63.4 44.3 51.8 47.5
Andhra Pradesh 40.6 67.5 63.4 39.2 44.5 42.6
Karnataka 49.5 58.2 55.3 36.6 50.5 44.5
Goa 28.2 37.3 34.1 24.0 31.3 27.1
Kerala 100.0 72.2 73.7 39.3 45.6 43.4
Tamil Nadu 21.4 68.9 61.8 36.7 45.1 40.8
India 60.3 73.3 71.7 50.0 60.3 56.3
* Cannot be estimated due to limited no. of cases.
Source: International Institute for Population Sciences (IIPS). National Family Health Survey, (NFHS-3), 2005-06: India.
Mumbai.

217
A study by SEARCH in the Gadchiroli district, Maharashtra, has reported 60 percent
prevalence of tobacco use in tribal population. The estimated annual expenditure on
purchasing tobacco products in the district was Rs. 73 crores, which is much more
than the expenditure on health and nutrition schemes by the Government106. The
authors of this study suggested that tobacco contributes to poverty and impedes
development of tribal population
7.10.2 Consumption of Alcohol
Consumption of alcohol is a part of social rituals in many tribal communities. Alcohol
consumption among Scheduled Tribe and Non-Scheduled Tribe men, aged 15-54
years is shown in Table 7.10. At the national level, it is noted that about half of
Scheduled Tribe men (51 percent) consume some form of alcohol. The prevalence of
alcohol consumption was found to be much lower among non-Scheduled Tribe men
(30 percent). Therefore, such a pattern of drinking alcohol among Scheduled Tribe
men is bound to have negative effect on their health. The estimated prevalence among
Scheduled Tribes is found to be higher in the eastern states like Assam (70 percent),
West Bengal (70 percent), Odisha (69 percent), Chhattisgarh (67 percent), Jharkhand
(67 percent) followed by Arunachal Pradesh (66 percent) and Andhra Pradesh (66
percent). On the other hand, states like Himachal Pradesh, Maharashtra, Gujarat, and
Rajasthan show relatively lower prevalence of alcohol consumption (around 30
percent). In a few exceptional cases like Sikkim, Manipur, West Bengal, Maharashtra
and Goa, a higher proportion of urban Scheduled Tribe men drink alcohol as
compared to their rural counterparts.
106 Santosh Sawalkar et al, Tobacco vs Development: Private Spending on tobacco in Gadchiroli district, Economic and Political
Weekly, Vo. XLVII, No.5, February 2, 2013.
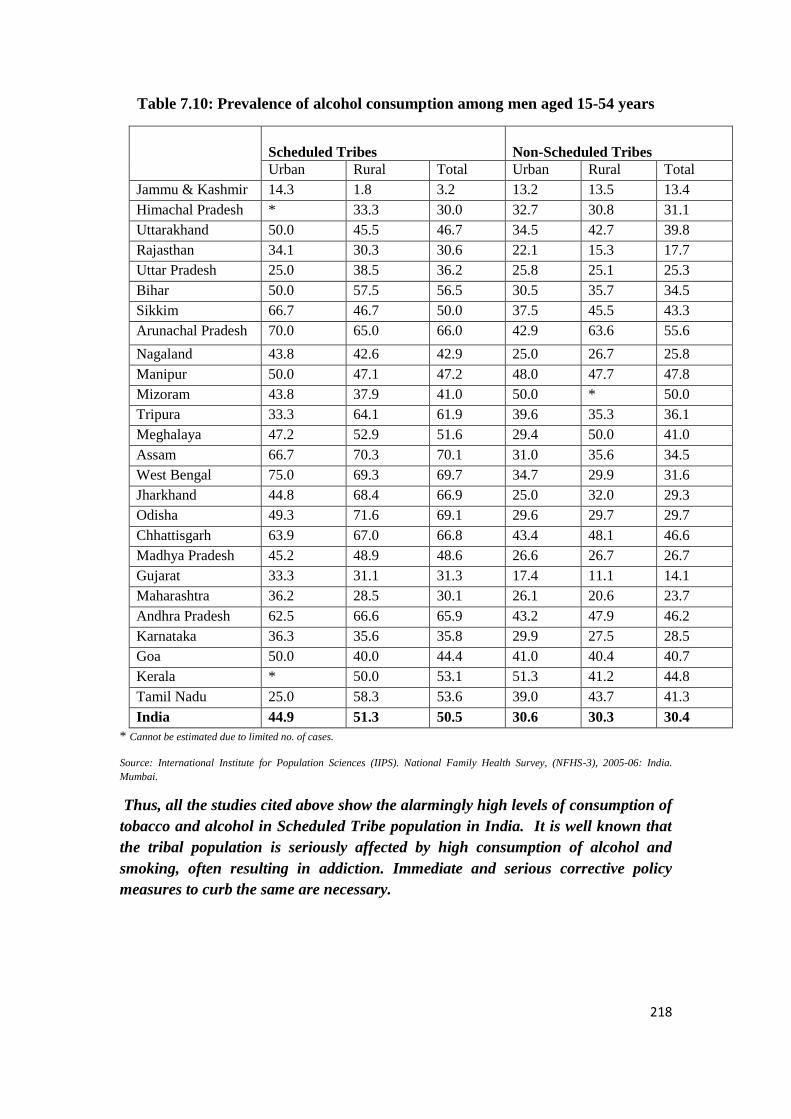
218
Table 7.10: Prevalence of alcohol consumption among men aged 15-54 years
Scheduled Tribes
Non-Scheduled Tribes
Urban Rural Total Urban Rural Total
Jammu & Kashmir 14.3 1.8 3.2 13.2 13.5 13.4
Himachal Pradesh * 33.3 30.0 32.7 30.8 31.1
Uttarakhand 50.0 45.5 46.7 34.5 42.7 39.8
Rajasthan 34.1 30.3 30.6 22.1 15.3 17.7
Uttar Pradesh 25.0 38.5 36.2 25.8 25.1 25.3
Bihar 50.0 57.5 56.5 30.5 35.7 34.5
Sikkim 66.7 46.7 50.0 37.5 45.5 43.3
Arunachal Pradesh 70.0 65.0 66.0 42.9 63.6 55.6
Nagaland 43.8 42.6 42.9 25.0 26.7 25.8
Manipur 50.0 47.1 47.2 48.0 47.7 47.8
Mizoram 43.8 37.9 41.0 50.0 * 50.0
Tripura 33.3 64.1 61.9 39.6 35.3 36.1
Meghalaya 47.2 52.9 51.6 29.4 50.0 41.0
Assam 66.7 70.3 70.1 31.0 35.6 34.5
West Bengal 75.0 69.3 69.7 34.7 29.9 31.6
Jharkhand 44.8 68.4 66.9 25.0 32.0 29.3
Odisha 49.3 71.6 69.1 29.6 29.7 29.7
Chhattisgarh 63.9 67.0 66.8 43.4 48.1 46.6
Madhya Pradesh 45.2 48.9 48.6 26.6 26.7 26.7
Gujarat 33.3 31.1 31.3 17.4 11.1 14.1
Maharashtra 36.2 28.5 30.1 26.1 20.6 23.7
Andhra Pradesh 62.5 66.6 65.9 43.2 47.9 46.2
Karnataka 36.3 35.6 35.8 29.9 27.5 28.5
Goa 50.0 40.0 44.4 41.0 40.4 40.7
Kerala * 50.0 53.1 51.3 41.2 44.8
Tamil Nadu 25.0 58.3 53.6 39.0 43.7 41.3
India 44.9 51.3 50.5 30.6 30.3 30.4
* Cannot be estimated due to limited no. of cases.
Source: International Institute for Population Sciences (IIPS). National Family Health Survey, (NFHS-3), 2005-06: India.
Mumbai.
Thus, all the studies cited above show the alarmingly high levels of consumption of
tobacco and alcohol in Scheduled Tribe population in India. It is well known that
the tribal population is seriously affected by high consumption of alcohol and
smoking, often resulting in addiction. Immediate and serious corrective policy
measures to curb the same are necessary.

219
7.11 Determinants of Health: Drinking water, sanitation and fuel
Understanding of households’ access to basic amenities, such as improved sources of
drinking water, clean fuel, electricity and sanitation, is essential to assess the overall
socio-economic status, but also fundamental to the health of the society.
Available survey and census data indicate that very few tribal households have access
to improved source of drinking water and sanitation. Census of India, 2011 shows that
just about 11 percent of tribal households in the country have access to tap water and
only three percent households have tap water from treated source (Table 7.11).
Accessibility to tap water, including those treated, differs widely across the states.
Availability of tap water in the tribal households ranges from two percent in Odisha to
49 percent in Sikkim and 54 percent in Goa.

220
Table 7.11: Availability of tap water within the households in India and
States/UTs
States/UTs
Availability of tap water Tap water from treated source
Scheduled Tribes Non-Scheduled
Tribes Scheduled Tribes Non-Scheduled Tribes
1T 2R 3U 1T 2R 3U 1T 2R 3U 1T 2R 3U
Jammu & Kashmir 12.9 10.7 41.3 42.7 28.1 79.4 6.4 4.2 34.0 29.2 14.3 66.7
Himachal Pradesh 47.7 44.7 80.3 54.3 50.5 83.5 45.8 42.7 79.0 52.4 48.5 82.7
Uttarakhand 35.0 27.4 65.4 41.8 29.1 71.4 28.3 19.8 62.3 36.6 23.4 67.3
Rajasthan 6.4 2.8 53.0 33.4 18.1 73.7 5.4 2.0 49.2 28.6 13.2 69.1
Uttar Pradesh 19.8 9.7 43.4 19.3 11.8 45.2 16.7 7.2 38.8 15.3 8.1 40.3
Bihar 3.0 1.5 18.8 2.8 1.1 16.6 2.3 1.1 15.2 2.2 0.9 13.1
Sikkim 48.6 39.9 79.1 54.2 43.2 78.8 19.7 6.7 65.2 24.8 8.3 61.4
Arunachal Pradesh 30.7 22.5 66.2 34.2 19.2 59.0 14.8 8.5 41.9 17.6 8.9 32.0
Nagaland 15.0 12.3 23.9 14.9 9.4 17.9 2.4 1.8 4.4 4.2 2.0 5.4
Manipur 9.8 7.5 26.3 15.0 3.2 29.3 5.2 2.8 22.8 14.1 2.5 28.1
Mizoram 29.7 5.7 52.2 42.1 6.9 55.8 26.1 3.2 47.6 38.3 3.7 51.8
Tripura 4.6 2.7 40.1 18.6 8.0 35.8 3.0 1.4 33.8 14.4 4.4 30.6
Meghalaya 12.6 5.5 46.5 31.7 5.7 63.4 10.5 3.7 42.7 29.4 4.4 60.0
Assam 3.0 1.3 21.6 6.1 2.3 24.6 2.5 1.0 19.7 5.5 2.0 22.6
West Bengal 5.0 2.1 25.8 13.2 2.9 34.2 3.9 1.2 23.1 11.7 1.9 31.5
Jharkhand 2.0 0.3 17.3 9.8 1.1 30.5 1.8 0.2 15.7 8.8 0.8 27.7
Odisha 1.6 0.6 15.7 7.7 1.8 34.0 1.3 0.4 14.7 6.7 1.2 31.2
Chhattisgarh 2.8 0.9 25.1 12.9 3.6 36.1 1.8 0.4 18.8 9.3 1.5 28.8
Madhya Pradesh 3.2 1.4 26.1 16.9 5.6 42.6 2.4 0.7 22.7 13.2 2.8 36.7
Gujarat 17.6 9.5 57.4 62.2 48.2 76.6 10.8 3.3 47.0 38.8 15.1 63.2
Daman & Diu 47.4 42.4 51.8 58.7 68.3 56.3 36.5 34.9 37.9 44.1 63.0 39.5
Dadra & Nagar Haveli 14.4 13.1 20.4 39.2 32.6 40.9 6.9 5.3 14.2 27.2 13.7 30.6
Maharashtra 27.2 16.0 63.5 54.1 34.8 75.2 22.1 10.1 61.1 47.8 24.3 73.3
Andhra Pradesh 16.7 11.1 48.2 37.2 25.5 60.4 11.3 5.3 44.8 29.3 15.4 56.7
Karnataka 21.3 12.5 49.0 35.6 17.6 61.0 15.5 6.4 44.2 28.5 9.4 55.3
Goa 54.3 45.9 65.9 76.1 66.5 81.6 51.3 41.8 64.3 74.2 63.9 80.1
Lakshadweep 16.4 30.4 11.9 21.0 19.8 21.2 5.6 0.7 7.2 16.3 0.0 18.7
Kerala 14.5 11.9 29.7 21.7 16.8 27.1 10.6 7.8 26.2 17.4 11.8 23.6
Tamil Nadu 17.3 5.7 36.5 28.8 13.3 45.3 15.0 4.0 33.3 24.3 9.0 40.5
Andaman & Nicobar Islands 59.8 57.6 95.5 58.2 41.6 99.9 54.7 52.4 89.7 50.6 31.5 95.5
India 10.7 5.6 42.9 28.5 15.2 54.5 7.9 3.0 38.2 23.3 9.7 49.8
Note: 1-Total, 2-Rural, 3-Urban
Source: Census of India, 2011.

221
Table 7.12 shows sanitary facility in Scheduled Tribe and non-Scheduled Tribe
households in the country by residence, in which access to improved sanitary facilities
and open defecation has been compared. Only 17 percent of Scheduled Tribe
households have access to improved sanitary facilities as compared with 44 percent
among non-Scheduled Tribe households. The urban-rural difference in accessing
improved sanitary facility is very high, with 10 percent of Scheduled Tribes rural
households having access to improved sanitation facilities, compared to 61 percent of
urban households Among the states, access to improved sanitation facility by
Scheduled Tribes households is highest in Sikkim (76 percent), followed by Mizoram
(69 percent) and below 10 percent in Madhya Pradesh, Jharkhand and Rajasthan (7
percent each).
Table 7.12: Households with sanitary facility in India and States/UTs
States/UTs
*Improved sanitary facility Open defecation
Scheduled Tribes Non-Scheduled
Tribes Scheduled Tribes
Non-Scheduled
Tribes
1T 2R 3U 1T 2R 3U 1T 2R 3U 1T 2R 3U
Jammu & Kashmir 12.4 9.0 57.6 33.7 20.7 66.6 71.1 74.7 24.3 42.3 55.1 10.2
Himachal Pradesh 55.8 53.2 84.8 66.8 64.2 86.9 36.7 39.4 8.2 29.2 32.1 6.8
Uttarakhand 43.6 33.0 85.9 63.7 52.0 91.0 51.5 61.9 9.9 32.5 44.4 4.6
Rajasthan 6.9 2.8 59.7 33.7 17.6 76.2 91.7 96.1 34.5 59.7 76.3 15.9
Uttar Pradesh 31.5 12.8 75.5 31.4 18.0 77.6 62.3 81.8 16.3 63.0 77.1 14.8
Bihar 11.3 7.3 55.2 19.7 14.5 63.4 85.0 89.6 35.3 75.6 81.2 28.8
Sikkim 76.0 71.5 91.7 79.4 73.8 91.8 12.8 15.9 2.0 10.5 14.2 2.3
Arunachal Pradesh 28.6 17.8 75.4 40.9 23.2 70.1 38.8 46.1 7.1 27.1 39.7 6.4
Nagaland 46.7 37.1 77.7 64.5 36.4 80.0 17.8 22.5 2.2 8.2 19.1 2.2
Manipur 42.1 38.1 71.4 48.7 37.1 62.7 16.4 18.5 1.5 5.0 7.1 2.5
Mizoram 69.0 51.2 85.7 73.3 45.5 84.1 6.6 12.8 0.8 6.0 16.3 2.0
Tripura 39.3 37.0 84.0 72.8 67.5 81.3 30.3 31.7 3.9 3.1 4.3 1.1
Meghalaya 33.0 22.9 81.3 55.7 27.4 90.4 36.2 43.2 3.0 23.4 41.6 1.2
Assam 19.1 14.4 72.0 32.4 23.3 77.4 54.0 58.3 5.8 29.9 34.9 4.9
West Bengal 18.2 11.9 62.5 50.6 35.8 80.9 73.2 79.8 26.1 36.3 48.8 10.9
Jharkhand 7.2 2.8 45.8 25.6 8.1 67.2 90.8 95.5 49.3 71.7 89.8 28.6
Odisha 5.0 3.3 29.2 22.3 13.1 62.9 91.6 93.4 65.7 72.1 81.7 29.6
Chhattisgarh 10.7 8.2 40.8 26.0 12.1 60.8 84.6 87.2 54.0 69.2 84.0 32.0
Madhya Pradesh 6.7 3.5 45.6 31.9 13.6 73.3 90.9 94.3 48.5 64.3 83.5 20.7
Gujarat 22.3 12.8 68.6 62.0 36.9 87.7 73.5 83.9 23.0 34.5 60.5 7.9
Daman & Diu 36.4 19.6 51.1 80.0 54.6 86.2 54.1 76.6 34.6 7.9 28.3 2.9
Dadra & Nagar Haveli 15.8 9.3 45.0 85.6 79.6 87.2 80.8 88.2 47.5 5.7 11.8 4.1
Maharashtra 26.9 17.8 56.6 52.8 37.6 69.3 59.7 73.3 15.2 31.0 52.9 7.3
Andhra Pradesh 17.8 9.0 67.6 49.4 32.6 82.6 78.0 87.3 25.9 45.6 62.9 11.4
Karnataka 26.9 14.3 66.7 50.6 27.9 82.7 66.9 80.8 23.0 43.3 66.9 10.2
Goa 53.6 46.7 63.2 77.0 67.8 82.3 36.3 45.0 24.4 14.1 24.1 8.4

222
Lakshadweep 97.9 97.8 97.9 89.2 97.7 87.9 1.5 1.7 1.4 7.1 1.2 8.0
Kerala 62.8 58.4 88.1 90.3 88.3 92.5 25.7 29.5 4.2 3.4 4.9 1.7
Tamil Nadu 32.2 11.6 66.2 46.1 21.7 72.0 60.3 83.5 21.9 45.4 73.0 16.1
Andaman & Nicobar Islands
87.4 86.9 95.7 63.6 48.9 86.2 11.5 12.1 2.4 28.9 42.7 7.8
India 17.4 10.4 61.2 44.3 27.1 77.9 74.7 82.4 26.1 47.2 65.3 12.1
Note: * Flush/Pour latrine connected to Piped Sewer system or Septic tank and Pit Latrine with Slab/Ventilated Improved Pit;
1-Total 2-Rural 3-Urban
Source: Census of India, 2011.
As the national level data shows, substantial proportion of households, do not have
access to sanitation facility, people have either the option of using paid public
facilities or are forced to resort to open defecation. The proportion reporting open
defecation in both rural and urban areas is quite large, which is a matter of great
concern. About 65 percent of non-Scheduled Tribe households and 75 percent of
Scheduled Tribe households reported defecating in the open. The proportion is much
higher in rural areas for Scheduled Tribes (82 percent) as compared to urban areas (26
percent). Similarly, open defecation is also quite sizeable among Non-Scheduled
Tribe households (47 percent), even in urban areas (12 percent). The situation is
deplorable when we observe the state level data, where Scheduled Tribe households
are at greater disadvantage in states like Rajasthan, Odisha, Jharkhand and Madhya
Pradesh as they have lesser access to improved sanitary facilities and mostly resorted
to open defecation. These states account for more than 50 percent of tribal population.
The other important component of household and neighborhood environment that
affects health is the drainage facility. As shown in Table 7.13, only about 6 percent
of the Scheduled Tribe households have closed drainage facility, and about 17 percent
of Scheduled Tribe households have open drainage facility and above three-fourths
(77 percent) of Scheduled Tribe households do not have any drainage facility.
Scheduled Tribe households in states like Jammu and Kashmir Rajasthan, Bihar,
Sikkim Nagaland, Manipur, Meghalaya Assam, West Bengal, Tripura, Jharkhand,
Orissa, Chhattisgarh, Madhya Pradesh, and Union Territories of Dadra and Nagar
Haveli have closed drainage facility which is below the national average. Similar
situation is observed in case of open drainage facility. Overall, the situation of
Scheduled Tribe households are better-off in the West and South Indian states where
there are better drainage facilities as these states are also more urbanized compared to
other states.
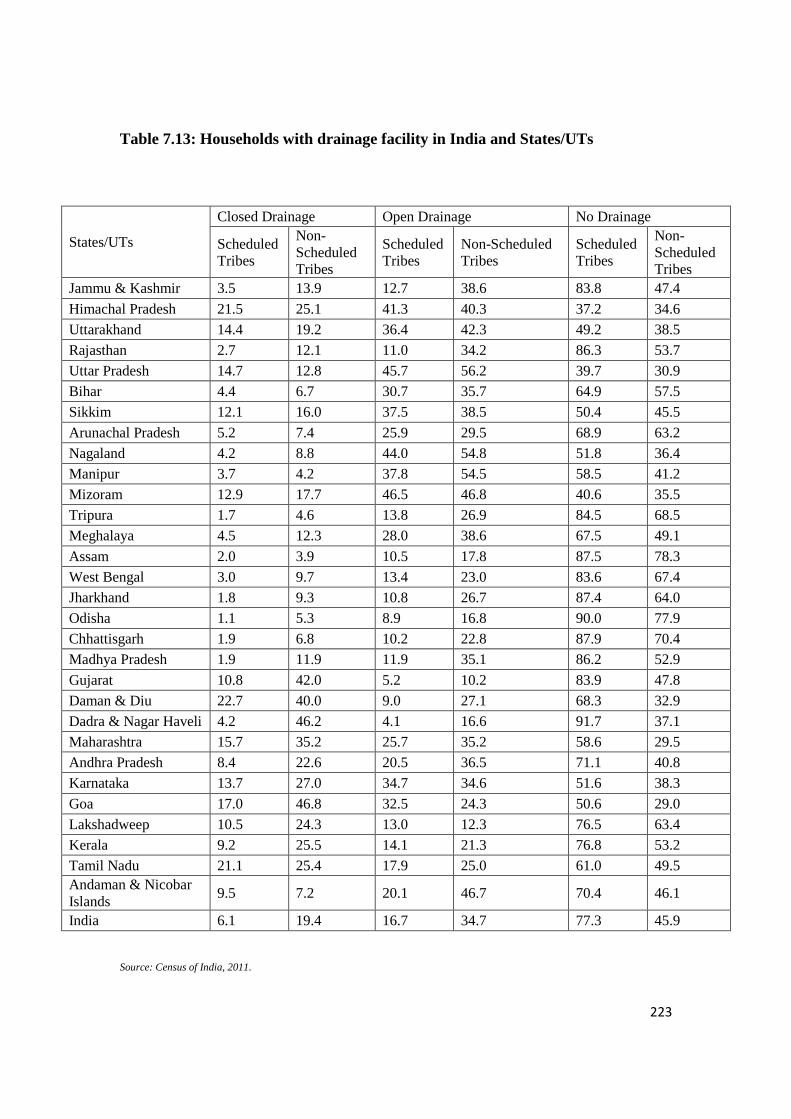
223
Table 7.13: Households with drainage facility in India and States/UTs
Source: Census of India, 2011.
States/UTs
Closed Drainage Open Drainage No Drainage
Scheduled
Tribes
Non-
Scheduled
Tribes
Scheduled
Tribes
Non-Scheduled
Tribes
Scheduled
Tribes
Non-
Scheduled
Tribes
Jammu & Kashmir 3.5 13.9 12.7 38.6 83.8 47.4
Himachal Pradesh 21.5 25.1 41.3 40.3 37.2 34.6
Uttarakhand 14.4 19.2 36.4 42.3 49.2 38.5
Rajasthan 2.7 12.1 11.0 34.2 86.3 53.7
Uttar Pradesh 14.7 12.8 45.7 56.2 39.7 30.9
Bihar 4.4 6.7 30.7 35.7 64.9 57.5
Sikkim 12.1 16.0 37.5 38.5 50.4 45.5
Arunachal Pradesh 5.2 7.4 25.9 29.5 68.9 63.2
Nagaland 4.2 8.8 44.0 54.8 51.8 36.4
Manipur 3.7 4.2 37.8 54.5 58.5 41.2
Mizoram 12.9 17.7 46.5 46.8 40.6 35.5
Tripura 1.7 4.6 13.8 26.9 84.5 68.5
Meghalaya 4.5 12.3 28.0 38.6 67.5 49.1
Assam 2.0 3.9 10.5 17.8 87.5 78.3
West Bengal 3.0 9.7 13.4 23.0 83.6 67.4
Jharkhand 1.8 9.3 10.8 26.7 87.4 64.0
Odisha 1.1 5.3 8.9 16.8 90.0 77.9
Chhattisgarh 1.9 6.8 10.2 22.8 87.9 70.4
Madhya Pradesh 1.9 11.9 11.9 35.1 86.2 52.9
Gujarat 10.8 42.0 5.2 10.2 83.9 47.8
Daman & Diu 22.7 40.0 9.0 27.1 68.3 32.9
Dadra & Nagar Haveli 4.2 46.2 4.1 16.6 91.7 37.1
Maharashtra 15.7 35.2 25.7 35.2 58.6 29.5
Andhra Pradesh 8.4 22.6 20.5 36.5 71.1 40.8
Karnataka 13.7 27.0 34.7 34.6 51.6 38.3
Goa 17.0 46.8 32.5 24.3 50.6 29.0
Lakshadweep 10.5 24.3 13.0 12.3 76.5 63.4
Kerala 9.2 25.5 14.1 21.3 76.8 53.2
Tamil Nadu 21.1 25.4 17.9 25.0 61.0 49.5
Andaman & Nicobar
Islands 9.5 7.2 20.1 46.7 70.4 46.1
India 6.1 19.4 16.7 34.7 77.3 45.9
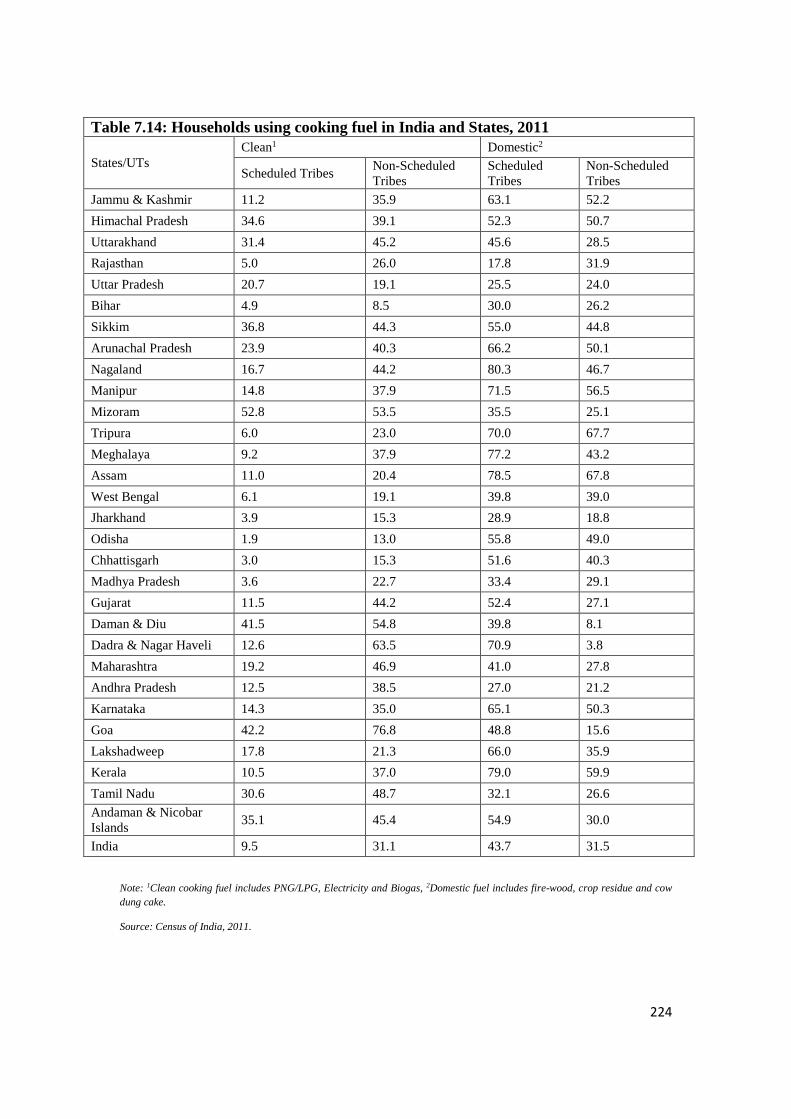
224
Note: 1Clean cooking fuel includes PNG/LPG, Electricity and Biogas, 2Domestic fuel includes fire-wood, crop residue and cow
dung cake.
Source: Census of India, 2011.
Table 7.14: Households using cooking fuel in India and States, 2011
States/UTs
Clean1 Domestic2
Scheduled Tribes Non-Scheduled
Tribes
Scheduled
Tribes
Non-Scheduled
Tribes
Jammu & Kashmir 11.2 35.9 63.1 52.2
Himachal Pradesh 34.6 39.1 52.3 50.7
Uttarakhand 31.4 45.2 45.6 28.5
Rajasthan 5.0 26.0 17.8 31.9
Uttar Pradesh 20.7 19.1 25.5 24.0
Bihar 4.9 8.5 30.0 26.2
Sikkim 36.8 44.3 55.0 44.8
Arunachal Pradesh 23.9 40.3 66.2 50.1
Nagaland 16.7 44.2 80.3 46.7
Manipur 14.8 37.9 71.5 56.5
Mizoram 52.8 53.5 35.5 25.1
Tripura 6.0 23.0 70.0 67.7
Meghalaya 9.2 37.9 77.2 43.2
Assam 11.0 20.4 78.5 67.8
West Bengal 6.1 19.1 39.8 39.0
Jharkhand 3.9 15.3 28.9 18.8
Odisha 1.9 13.0 55.8 49.0
Chhattisgarh 3.0 15.3 51.6 40.3
Madhya Pradesh 3.6 22.7 33.4 29.1
Gujarat 11.5 44.2 52.4 27.1
Daman & Diu 41.5 54.8 39.8 8.1
Dadra & Nagar Haveli 12.6 63.5 70.9 3.8
Maharashtra 19.2 46.9 41.0 27.8
Andhra Pradesh 12.5 38.5 27.0 21.2
Karnataka 14.3 35.0 65.1 50.3
Goa 42.2 76.8 48.8 15.6
Lakshadweep 17.8 21.3 66.0 35.9
Kerala 10.5 37.0 79.0 59.9
Tamil Nadu 30.6 48.7 32.1 26.6
Andaman & Nicobar
Islands 35.1 45.4 54.9 30.0
India 9.5 31.1 43.7 31.5

225
Table 7.14 shows distribution of households by type of cooking fuel used in India and
States as per Census of India, 2011. Two different types of fuel used by households are
clean fuel and smoke-producing domestic fuel. Clean fuel includes PNG/LPG, electricity
and biogas. On the other hand, domestic fuel includes fire-wood, crop residue and cow
dung cake. Use of domestic fuel among Scheduled Tribe households is highest in
Nagaland (80 percent), followed by Kerala and Assam (79 percent), Meghalaya, Manipur
and Tripura (70-77 percent). The use of domestic cooking fuel in these states is much
higher than the national average. Overall, use of domestic fuel is much lower among the
non-Scheduled Tribe households across states and union territories.
Although the domestic air pollution has been identified as one of the most important
preventable risk factors for disease burden globally and in India, only 9.5 percent
Scheduled Tribe households are using clean fuel, which needs to be addressed.
7.12 Public Health Infrastructure and Human Resources for Health in Tribal Areas
Public health care infrastructure pattern remains same for tribal areas as for the rural areas
except for a lower population ratio. Thus, at the village/hamlet level is ASHA and
Anganwadi, usually 1 each per 1000 population in the rural area, but at a much relaxed
norm in the tribal area where these often are 1 per 300 to 500 population. One health sub
centre per 3000 population in tribal areas as against per 5000 population in rural areas, and
one Primary Health Centre per 20,000 in tribal against per 30,000 in rural areas. Above
this level are a Community Health Centre (CHC) per block, and a district hospital per
district.
The National Population Policy (2000) aimed at fulfilling unmet needs in contraception
and strengthening human resources and infrastructure at primary level health facilities.
The policy document also recognized tribal population as an under-served group.
However, it could not achieve its goal till date as evident from the data on availability of
human resources, equipment, emergency services and essential drugs required for primary
health care.
Rural health statistics (2012) provided by the Health Intelligence Bureau, Ministry of
Health and Family Welfare, Government of India, reported a huge shortfall of Physicians,
Pediatricians, or any other specialist at community health centers (CHCs) and doctors at
primary health centers (PHCs) in Tribal areas. Odisha, Madhya Pradesh, Jharkhand, West
Bengal, Gujarat, Rajasthan, Andhra Pradesh, Bihar and Tamil Nadu show huge shortfall in
terms of availability of Physicians. On the other hand, Maharashtra, Kerala, Andaman and
Nicobar Islands, Sikkim and Manipur shows large shortfall in availability of Pediatrician.
Shortfall of any kind of specialist is also high in the states like Andhra Pradesh, Jammu

226
Kashmir, Jharkhand, Kerala, Maharashtra, Meghalaya and Nagaland and Rajasthan (Fig.
7.16 and Table 7.15).
Figure 7.16:
Source: Rural Health Statistics, Health Intelligence Bureau, Ministry of Health and Family Welfare, Government of India, 2012

227
Table 7.15: Physicians, Pediatricians, and Specialists at community health
centers (CHCs) in tribal areas, 2012
Physicians Paediatrician Any Specialist
States/UTs
Required Shortfal
l
Required Shortfal
l
Required Shortfal
l
Andaman & Nicobar
Islands
1 1 34 29 136 119
Andhra Pradesh 34 30 0 0 192 191
Assam 29 20 1 1 116 59
Bihar 0 0 48 47 0 0
Chhattisgarh 84 75 0 0 0 0
Dadra & Nagar Haveli 1 1 0 0 280 280
Daman & Diu 0 0 84 73 0 0
Goa 0 0 0 0 44 30
Gujarat 70 70 0 0 360 NA
Himachal Pradesh 9 9 70 70 48 NA
Jammu & Kashmir 11 5 9 8 416 361
Jharkhand 90 84 0 0 268 201
Karnataka 28 11 11 9 20 20
Kerala 12 NA 90 85 116 107
Lakshadweep 0 0 28 13 36 NA
Madhya Pradesh 104 103 12 NA 84 75
Maharashtra 67 59 104 90 540 372
Manipur 5 5 67 43 0 0
Meghalaya 29 27 5 5 200 161
Mizoram 9 NA 29 28 0 0
Nagaland 21 20 9 NA 80 80
Odisha 135 112 21 17 20 NA
Rajasthan 50 33 0 0 312 276
Sikkim 0 0 50 47 4 4
Tamil Nadu 20 20 0 0 0 0
Tripura 5 NA 20 20 4 4
Uttarakhand 8 7 5 NA 0 0
Uttar Pradesh NA NA NA NA 0 0
West Bengal 78 78 8 4 0 0 Source: Rural Health Statistics, Health Intelligence Bureau, Ministry of Health and Family Welfare, Government of India, 2012
Doctors’ shortfall at PHCs level in tribal areas is huge in the states like Assam,
Chhattisgarh, Gujarat, Madhya Pradesh, West Bengal and Orissa. On the contrary, Andhra
Pradesh, Andaman and Nicobar Islands, Jammu and Kashmir, Karnataka, Maharashtra,
Manipur, Rajasthan, Sikkim, Tamil Nadu, Tripura and Uttarakhand show surplus of doctors
at PHCs level (Table 7.16) at least on paper.

228
Table 7.16: Doctors at PHCs in Tribal areas, 2012
States/UTs Required Shortfall/Surplus
Andhra Pradesh 223 *
Andaman & Nicobar Islands 4 *
Arunachal Pradesh 97 5
Assam 282 143
Bihar 6 5
Chhattisgarh 403 233
Dadra & Nagar Haveli 6 0
Daman & Diu 0 0
Goa 0 0
Gujarat 358 112
Himachal Pradesh 43 5
Haryana 43 1
Jammu & Kashmir 123 *
Jharkhand 337 12
Karnataka 131 *
Kerala 0 0
Madhya Pradesh 328 117
Maharashtra 315 *
Manipur 44 *
Meghalaya 109 5
Mizoram 51 8
Nagaland 126 27
Orissa 403 87
Punjab 0 0
Rajasthan 156 *
Sikkim 12 *
Tamil Nadu 66 *
Tripura 35 *
Uttar Pradesh NA NA
Uttarakhand 10 *
West Bengal 284 167 Source: Rural Health Statistics, Health Intelligence Bureau, Ministry of Health and Family Welfare, Government of India,
2012; * Surplus.
Mere availability of human resources cannot improve primary health care
infrastructure. Therefore, an assessment of availability of services offered, functional
establishments, emergency drugs and essential drugs is essential. Table 7.17 and
Table 7.18 show the prevailing situation at CHCs and PHCs in seven Schedule V
States derived from the District Level Household and Facility Survey (2013-14). In
this survey, all CHCs in the country have been covered, whereas only selected sample
PHCs (located in sample villages) were covered for gathering the data.

229
Table 7.17: Human resources, services, equipment, emergency and essentials
drugs availability at CHCs
Source: International Institute for Population Sciences (IIPS). District Level Household and facility Survey, (DLHS-4), 2013-14:
India. Mumbai.
The data for remaining two Schedule V States, namely Andhra Pradesh and Gujarat is
not yet processed, therefore, was not placed in these tables.
It is observed that CHCs preparedness as first referral unit is quite low in all seven
states. Out of four selected services, slightly more than one-third of CHCs, except
Odisha and Jharkhand, provides all these four essential services. The availability of
medical officers (at least one MO, one Pediatrician, and one
Obstetrician/Gynecologist) is also minimal. While indicators such as availability of
paramedic staff and anti-venom drugs are positive, efforts need to stepped up to
ensure availability of equipment and essential drugs. The situation in Maharashtra is
much better as compared to other states, whereas Jharkhand fares poorly in terms of
availability of any of the equipment or drugs (Table 7.17).
In case of primary health care centers, more or less similar components of assessment
have been taken into account (Fig 7.17 and Table 7.18). Availability of all paramedic
staff required is quite worrisome in almost all the states. Similarly, the availability of
labour room, functional OT and new born care corner is found to be dismal in all the
107 Services include administration of parental oxytocin and antibiotics, management of post-partum hemorrhages and new born
care services. 108 Medical Officer (regular/contract) includes at least one of medical officer (general physician), at least one Pediatrician and
at least one Obstetrician /Gynecologist. 109 Paramedic Staff includes at least one Public Health Nurse (PHN)/ Auxiliary Nurse Midwife (ANM)/ Staff Nurse/ Nurse/
Midwife/ Dresser and at least one Pharmacist/ Compounder and at least one Lab. Technician. 110 Equipments include availability of one Labour table with McIntosh sheet, one Suction machine, one surgical set for
Episiotomy and minor procedures, one Ambu bag with mask, one Radiant warmer, ILR (large/small) and one Deep freezer
(large/small). 111 Emergency Drugs include availability of Oxytocin injection, Diazepam Injection, Magnesium Sulphate Injection, Lignocaine
Hydrochloride Injection, and Nifedipine Tablet on the day of survey. 112 Essential drugs include availability of Anti-allergic and drugs used in Anaphylaxis, Anti Tubercular, Anti Leprosy, Anti
Bacterials, Anti Helminthic, Essential Obstetric Care drugs, and Anti Protozoal on the day of survey.
States
FRU
Status Services107
Medical
Officer108
Paramedic
Staff109
Equip-
ments110
Emergency
drugs111
Essential
drugs112
Anti
Venom
No. of
CHCs
Himachal
Pradesh 13.0 32.5 5.2 81.8 55.8 39.0 18.2 85.7 77
Rajasthan 20.1 33.7 11.8 82.4 42.9 54.5 44.4 84.8 448
Jharkhand 6.7 26.7 6.7 63.9 42.8 33.9 38.9 47.8 180
Odisha 27.2 31.7 12.2 79.7 38.9 40.3 56.1 88.9 360
Chhattisgarh 12.4 35.8 7.4 86.4 30.3 53.7 51.2 92.6 162
Madhya Pradesh 9.0 39.5 4.6 66.8 59.1 79.6 71.4 90.2 367
Maharashtra 17.3 38.4 25.7 83.1 71.9 85.1 60.2 98.8 249

230
selected states, except in Maharashtra. Jharkhand and Himachal Pradesh need to
improve on most of the components. More than 50 percent surveyed PHCs did not
even have anti-venom drugs in Jharkhand.
Figure 7.17:
Note: *Equipment include one Suction machine, one autoclave sterilizer, one Surgical set for Episiotomy and minor procedures,
one normal delivery kit and one Ambu bag with mask, one Radiant warmer, any other baby warm mechanism, ILR (large/small)
and one Deep freezer (large/small).

231
Table 7.18: Human resources, services, equipment, emergency and essentials
drugs availability at sampled PHCs
States
24X7
Status Services113 MO114 Paramedics115
Establish-
ments116
Emergency
drugs117
Essential
drugs118
Anti
Venom
Sampled
PHCs
Himachal
Pradesh 11.1 3.9 92.8 11.8 7.2 3.9 11.1 49.0 153
Rajasthan 10.9 23.7 90.0 1.4 14.0 19.3 25.4 56.1 722
Jharkhand 36.4 1.8 72.7 9.1 5.5 9.1 3.6 10.9 55
Odisha 8.7 1.2 93.8 1.9 3.4 4.2 11.7 31.8 566
Chhattisgarh 22.9 18.1 72.9 15.6 11.0 18.8 28.8 25.9 410
Madhya
Pradesh 19.6 14.3 70.4 4.8 20.7 41.1 21.9 43.9 560
Maharashtra 34.7 46.1 99.4 20.3 78.0 30.3 78.9 97.6 778 Source: International Institute for Population Sciences (IIPS). District Level Household and facility Survey, (DLHS-4), 2013-14:
India. Mumbai.
7.13 Treatment Seeking Behaviour
Majority of Scheduled Tribe population depends on the public health system, as
private providers do not have any interest to work in the tribal dominated areas.
Therefore, improving the existing public health system becomes all the more
important in that case. More than three-fourths of Scheduled Tribe population seeks
treatment from Government funded health facilities, as compared to only 47 percent
of Non-Scheduled Tribes. One-fifth of Scheduled Tribes seeks health care services
from private sources (Table 7.19). But the majority of Scheduled Tribes sought
treatment from public sources. Therefore, public health system needs to be improved
as its efficiency can directly affect health of tribes.
113 Services include administration of parental oxytocis and antibiotics, management of post-partum hemorrhages, resuscitation,
thermal protection and laboratory services. 114 Medical Officer (regular/contract) includes at least one of medical officer (Male/Female/Ayush). 115 Paramedic Staff includes at least one Public Staff Nurse, at least one Pharmacist and at least one Lab. Technician. 116 Establishments include OT, Labour room and Newborn care corner 117 Emergency Drugs include availability of Oxytocin injection, Diazepam Injection, Magnesium Sulphate Injection, Lignocaine
Hydrochloride Injection, Nifedipine Tablet and Misoprostol Tablet on the day of survey. 118 Essential drugs include availability of Anti-allergic and drugs used in Anaphylaxis, Anti Tubercular, Anti Leprosy, Anti
Bacterials, and Anti Helminthic on the day of survey.

232
Table 7.19: Sources of treatment seeking among Scheduled Tribes and Non-
Scheduled Tribes
Scheduled Tribes Non-Scheduled Tribes
States/UTs Public Private
Others/
NGOs Public Private
Others
/
NGOs
Jammu & Kashmir 94.8 4.3 0.9 81.2 18.3 0.4
Himachal Pradesh 95.8 4.0 0.3 85.7 13.9 0.4
Uttarakhand 72.9 26.4 0.7 67.5 31.1 1.4
Rajasthan 87.2 11.8 0.9 79.0 19.5 1.6
Uttar Pradesh 26.5 70.4 3.1 22.5 73.0 4.5
Bihar 11.5 66.9 21.6 10.2 71.5 18.3
Sikkim 95.2 3.8 1.0 93.7 6.0 0.3
Arunachal Pradesh 96.5 2.5 1.0 94.4 5.0 0.6
Manipur 92.9 5.6 1.6 88.7 10.2 1.1
Mizoram 95.1 3.2 1.7 93.1 4.6 2.3
Tripura 91.6 7.8 0.5 82.3 16.8 0.9
Meghalaya 79.7 15.5 4.8 74.9 20.7 4.3
Assam 88.1 6.8 5.0 79.5 17.9 2.5
West Bengal 57.6 19.4 23.0 44.6 27.5 28.0
Jharkhand 34.6 60.2 5.1 34.1 62.9 2.9
Odisha 92.9 6.3 0.9 88.3 10.6 1.1
Chhattisgarh 72.7 22.6 4.7 50.1 46.5 3.4
Madhya Pradesh 59.9 38.8 1.2 49.3 49.6 1.1
Gujarat 71.4 28.0 0.6 45.9 52.9 1.3
Daman & Diu 64.5 35.4 0.2 50.5 49.0 0.5
Dadra & Nagar Haveli 91.8 7.4 0.8 60.5 37.9 1.5
Maharashtra 53.9 45.4 0.7 36.9 62.6 0.5
Andhra Pradesh 71.6 26.1 2.3 41.3 55.5 3.2
Karnataka 47.2 51.8 1.0 41.0 58.1 0.9
Goa 52.1 47.9 0.0 43.1 56.3 0.6
Lakshadweep 99.9 0.1 0.0 96.4 3.6 0.0
Kerala 89.8 9.5 0.6 60.4 39.1 0.5
Tamil Nadu 77.3 17.9 4.8 63.5 35.8 0.7
Andaman & Nicobar Islands 89.4 10.6 0.0 96.7 3.0 0.3
India 77.3 20.2 2.6 47.7 47.2 5.1 Source: International Institute for Population Sciences (IIPS). District Level Household and facility Survey, (DLHS-3), 2007-08:
India. Mumbai.
Table 7.19 shows that utilization of public health system is low in states such as Bihar
(12 percent), Uttar Pradesh (27 percent), Jharkhand (35 percent) and Karnataka (47
percent). It is observed from the data (Table 7.20) that popularity of traditional healers
for seeking health care services is still quite high in the Eastern region.

233
Table 7.20: Households seeking health care from traditional healers in India
States/UTs Less than 1
percent
1-10
percent
10-25
Percent
25 and above
Percent
Jammu and Kashmir - 3 - 6
Himachal Pradesh 1 - 1 2
Uttarakhand - - - 1
Rajasthan 4 - 3 17
Uttar Pradesh 19 - 2 9
Bihar 10 - 3 16
Arunachal Pradesh 2 2 7 5
Manipur 3 4 1 -
Mizoram 1 7 - -
Tripura 1 1 2
Meghalaya - - - 7
Assam 1 1 3 19
West Bengal 2 1 12
Jharkhand - - - 22
Odisha 1 3 22
Chhattisgarh - - 4 11
Madhya Pradesh 17 4 4 20
Gujarat 9 4 6 3
Daman &Diu 1 - 1 -
Dadra & Nagar Haveli - - 1 -
Maharashtra 14 2 9 6
Andhra Pradesh 14 2 3
Karnataka 13 1 3 8
Goa 2 - - -
Lakshadweep 1 - - -
Kerala 3 1 - -
Tamil Nadu 12 - - -
Andaman & Nicobar Islands 2 - - -
India 133 29 55 191 Source: International Institute for Population Sciences (IIPS). District Level Household and facility Survey, (DLHS-3), 2007-08:
India. Mumbai.
7.14 Maternal and Child Health Care Program Coverage
7.14.1 Maternal Care
The following tables (Table 7.21 and 7.22) present data on access to maternal care by
Scheduled Tribes and Non-Scheduled Tribes. The Full Antenatal Care119 and
institutional delivery are considered to be key to reduce maternal mortality. It may be
119 Minimum of three ANC check-ups, at least one TT injection and 100 IFA tablets are defined as “Full Antenatal Care.”

234
noted that the coverage among Scheduled Tribes is very poor (of course, it is linked
with state overall performance). There is urgent need to increase the coverage of
antenatal care. Data from the latest AHS and DLHS-4 will better indicate the impact
of Janani Suraksha Yojana and Janani Shishu Swasthya Karyakram under National
Rural Health Mission.
Figure 7.18:

235
Table 7.21: Full Antenatal check-up in ever-married women aged 15-49, by state
Scheduled Tribes Non-Scheduled Tribes
States/UTs Percentage Sample Percentage Sample
Jammu & Kashmir 12.9 1046 33.1 4192
Himachal Pradesh 34.6 294 30.8 2300
Uttarakhand 9.3 94 15.7 4061
Rajasthan 4.1 2116 7.0 10457
Uttar Pradesh 1.6 598 3.3 37612
Bihar 2.1 482 4.6 21151
Sikkim 26.3 706 27.9 744
Arunachal Pradesh 4.7 2540 7.8 716
Manipur 4.3 1886 21.4 1700
Mizoram 33.0 2875 21.9 84
Tripura 6.4 704 18.7 849
Meghalaya 14.2 2923 18.9 223
Assam 6.2 2229 9.2 7881
West Bengal 15.4 560 19.8 5968
Jharkhand 6.2 4118 10.6 7356
Orissa 14.6 2241 26.7 5547
Chhattisgarh 10.9 2647 15.6 3586
Madhya Pradesh 3.9 4402 10.3 11709
Gujarat 11.4 2193 23.2 5410
Daman & Diu 38.7 94 44.6 539
Dadra & Nagar Haveli 20.1 247 29.2 116
Maharashtra 31.7 2178 34.3 8251
Andhra Pradesh 26.9 632 42.4 4549
Karnataka 39.9 813 52.2 6926
Goa 86.1 36 91.4 371
Lakshadweep 67.5 466 100.0 9
Kerala 56.3 71 72.6 3264
Tamil Nadu 41.2 121 52.1 6440
Andaman & Nicobar Islands 25.0 29 49.4 469
India 14.8 39341 19.6 178635 Note: # Women who had their last live/still birth from 01-01-2004.Full antenatal check up: at least three visits from antenatal
check-up, at least one TT injection received and 100+IFA tablets/syrup consumed.
Source: International Institute for Population Sciences (IIPS). District Level Household and facility Survey, (DLHS-3), 2007-08:
India. Mumbai.

236
Table 7.22: Institutional delivery in ever-married women aged 15-49#, by state
Scheduled Tribes Non-Scheduled Tribes
States/UTs Percentage Sample Percentage Sample
Jammu & Kashmir 39.3 1046 58.8 4192
Himachal Pradesh 48.6 294 48.2 2300
Uttarakhand 33.7 94 29.7 4061
Rajasthan 39.9 2116 46.5 10457
Uttar Pradesh 14.4 598 24.6 37612
Bihar 14.3 482 27.8 21151
Sikkim 45.8 706 53.0 744
Arunachal Pradesh 44.3 2540 57.1 716
Manipur 21.5 1886 63.0 1700
Mizoram 57.0 2875 54.2 84
Tripura 29.2 704 59.8 849
Meghalaya 23.8 2923 38.3 223
Assam 34.2 2229 35.1 7881
West Bengal 30.9 560 50.8 5968
Jharkhand 7.9 4118 23.0 7356
Orissa 20.7 2241 53.2 5547
Chhattisgarh 10.6 2647 23.4 3586
Madhya Pradesh 28.4 4402 53.8 11709
Gujarat 34.4 2193 64.9 5410
Daman & Diu 79.6 94 61.2 539
Dadra & Nagar Haveli 29.9 247 75.4 116
Maharashtra 34.1 2178 71.3 8251
Andhra Pradesh 32.9 632 76.7 4549
Karnataka 49.5 813 66.7 6926
Goa 100.0 36 95.9 371
Lakshadweep 90.6 466 88.9 9
Kerala 85.9 71 99.6 3264
Tamil Nadu 64.7 121 94.6 6440
Andaman & Nicobar Islands 68.9 29 77.2 469
India 32.8 39423 49.8 178635 Note: # Women who had their last live/still birth from 01-01-2004. Percentage is weighed and sample size is un-weighted.
Source: International Institute for Population Sciences (IIPS). District Level Household and facility Survey, (DLHS-3), 2007-08:
India. Mumbai.
The most important observation from the data is the gap between Scheduled Tribes
and Non-Scheduled Tribes. Figure 7.18 indicates the gap in institutional delivery.
With some exceptions, there appear to be fewer gaps in Couple Protection Rate
(CPR).
However, a large gap is observed in institutional delivery and this may be due to
access issues (social and economic). A thorough understanding of the barriers is
needed in order to address the issues.

237
7.14.2 Child Health Care
Tables 7.23 through 7.25 present data on utilization of services related to children.
Table 7.23 indicates the coverage under new born care, which is important to reduce
IMR and child mortality. For India, (Table 7.23), it is noted that the coverage of
newborn care is about 34 percent for Scheduled Tribe children, whereas it is slightly
above 50 percent among Non-Scheduled Tribe children. The condition in rural areas
is much worse, but even in urban areas, newborn check-up is not universal.
Table 7.23: Newborns who received check-up within 24 hours of birth (percent)
States/UTs
Rural Urban Total
Scheduled
Tribes
Non-
Scheduled
Tribes
Scheduled
Tribes
Non-
Scheduled
Tribes
Scheduled
Tribes
Non-
Scheduled
Tribes
Jammu & Kashmir 37.9 53.6 61.4 84.3 40.0 59.9
Himachal Pradesh 49.6 48.0 72.7 68.6 50.4 51.1
Uttarakhand 30.2 26.1 28.0 57.3 29.9 32.3
Rajasthan 33.6 34.0 40.3 58.2 34.0 41.7
Uttar Pradesh 20.6 29.4 43.0 49.9 23.7 34.5
Bihar 12.2 24.5 44.9 42.3 15.4 27.4
Sikkim 38.8 47.4 88.0 74.0 39.9 49.1
Arunachal Pradesh 35.0 42.7 46.9 54.8 37.2 47.9
Manipur 23.0 54.4 36.2 76.1 23.3 64.4
Mizoram 36.5 30.6 68.5 84.1 49.2 44.6
Tripura 14.4 29.1 0.0 44.6 14.3 32.0
Meghalaya 22.7 29.4 55.3 70.7 26.3 42.9
Assam 28.0 27.3 54.9 61.9 30.5 33.1
West Bengal 31.3 52.5 48.4 78.4 32.5 58.1
Jharkhand 17.0 32.7 45.2 60.9 18.6 38.3
Orissa 15.8 34.5 30.8 45.8 16.8 36.9
Chhattisgarh 28.1 43.1 52.8 64.3 29.9 50.0
Madhya Pradesh 24.6 36.2 52.8 59.6 26.7 44.8
Gujarat 36.6 59.7 72.2 81.8 39.1 67.6
Daman & Diu 88.1 80.9 87.3 84.5 87.8 82.9
Dadra & Nagar Haveli 41.6 58.6 69.2 89.6 42.4 70.2
Maharashtra 54.1 75.9 82.6 89.5 56.8 80.9
Andhra Pradesh 39.2 76.8 73.7 86.2 43.9 81.0
Karnataka 47.7 64.6 77.6 80.5 54.6 70.4
Goa 100.0 97.6 100.0 95.3 100.0 95.9
Lakshadweep 92.1 75.0 96.5 100.0 94.6 89.5
Kerala 85.0 99.5 100.0 99.2 86.0 99.4
Tamil Nadu 68.2 83.0 91.2 91.5 71.7 87.1
Andaman & Nicobar
Islands
65.7 74.4 89.5 82.6 74.1 76.5
India 30.4 43.0 63.0 69.8 34.4 51.4 Source: International Institute for Population Sciences (IIPS). District Level Household and facility Survey, (DLHS-3), 2007-
08: India. Mumbai.

238
Table 7.24 shows the extent of exclusive breast feeding. However, it may be observed
that Scheduled Tribes have higher level of exclusive breast feeding as compared to
Non-Scheduled Tribes. State level sample is small in most of the cases.
Table 7.24: Percentage of children aged 0-5 months who received exclusive
breast feeding
States/UTs
Scheduled Tribes Non-Scheduled Tribes
Percentage Sample Percentage Sample
Jammu & Kashmir 66.7 189 72.3 614
Himachal Pradesh 65.1 43 57.7 352
Uttarakhand -- 16 51.1 572
Rajasthan -- 394 64.9 1947
Uttar Pradesh 67.4 102 18.9 6141
Bihar 27.5 78 37.8 3657
Sikkim 53.9 67 47.5 79
Arunachal Pradesh 31.3 269 54.7 77
Manipur 50.4 292 73.1 194
Mizoram 67.9 411 63.6 11
Tripura 55.5 122 33.0 91
Meghalaya 42.6 493 50.0 24
Assam 47.8 310 62.6 1082
West Bengal 79.7 80 42.3 806
Jharkhand 51.3 703 72.7 1217
Orissa 79.3 354 47.9 769
Chhattisgarh 65.5 387 76.7 552
Madhya Pradesh 78.8 865 49.0 2034
Gujarat 56.0 347 37.8 723
Daman & Diu 50.4 21 39.7 63
Dadra & Nagar Haveli 66.7 38 13.3 15
Maharashtra 63.2 333 51.8 1096
Andhra Pradesh 58.8 90 42.7 662
Karnataka 47.8 106 66.8 846
Goa 80.0 2 39.3 28
Lakshadweep 100.0 53 -- --
Kerala 73.6 10 67.9 439
Tamil Nadu 80.0 17 63.4 884
A & N Islands 58.8 4 54.6 98
India 61.1 6207 43.3 27099 Note: Table based on youngest living child born since 01.01.2004. Percentage is weighed and sample size is un-weighted.
Source: International Institute for Population Sciences (IIPS). District Level Household and facility Survey, (DLHS-3), 2007-08:
India. Mumbai.

239
In Table 7.25, coverage of children for immunization is presented. In India, there is
gap of 10 per cent points between Scheduled Tribes and non-Scheduled Tribes (46
percent versus 55 percent). There are variations across states, but one observation is
the coverage is very much dependent on overall performance of the states, as far as
MCH services are concerned.
Table 7.25: Percentage of children aged 12-23 months who received full
immunization# by state
States/UTs
Scheduled Tribes Non-Scheduled Tribes
Percentage Sample Percentage Sample
Jammu & Kashmir 56.6 296 63.5 1226
Himachal Pradesh 78.8 80 82.6 698
Uttarakhand 32.3 30 63.6 1315
Rajasthan 50.9 610 48.3 3011
Uttar Pradesh 20.8 174 30.3 11967
Bihar 29.0 162 41.7 6881
Sikkim 75.3 186 77.9 217
Arunachal Pradesh 15.2 489 7.05 156
Manipur 35.6 478 59.2 480
Mizoram 54.6 749 36.4 22
Tripura 17.2 187 54.9 230
Meghalaya 32.5 830 40.0 62
Assam 48.2 621 51.4 2210
West Bengal 81.3 177 75.1 1676
Jharkhand 51.5 1130 55.3 2288
Orissa 44.5 683 69.4 1703
Chhattisgarh 55.3 789 62.2 1084
Madhya Pradesh 24.6 1287 40.1 3544
Gujarat 44.3 693 59.1 1702
Daman & Diu 93.6 31 84.1 156
Dadra & Nagar Haveli 47.8 71 79.4 37
Maharashtra 52.2 702 73.8 2445
Andhra Pradesh 49.2 177 68.9 1372
Karnataka 72.3 238 77.2 2100
Goa 100.0 11 88.6 104
Lakshadweep 86.1 117 100.0 3
Kerala 84.6 13 79.5 908
Tamil Nadu 63.6 33 81.9 1988
A & N Islands 85.7 7 83.5 104
India 45.5 11076 55.0 52826 Note: Table based on youngest living child born since 01.01.2004.
# BCG, three injections of DPT, three doses of Polio (excluding Polio 0) and measles. Percentage is weighed and sample size is
un-weighted. Source: International Institute for Population Sciences (IIPS). District Level Household and facility Survey, (DLHS-3), 2007-08:
India. Mumbai.

240
7.15 Conclusions
Examination of the available facts about health of Scheduled Tribe population
in India reveals that:
1. Population size: Total fertility rate in Scheduled Tribe population, though
reduced to 3.12, is still above the replacement level.120 During 2001 to 2011,
the Scheduled Tribes population in India has annually increased by 2.12
percent, constituting 8.6 percent of the total population of India in 2011,
amounting to about 10 crores in absolute number.121 Health of the ten crores
vulnerable people should become an important national concern. At the same
time negative Scheduled Tribe population growth in Nagaland and in the
Great Andamanese tribe in Andaman & Nicobar is a concern. 122
2. The mortality indicators of Scheduled Tribe population have certainly
improved during the past decades. However, these are significantly worse
than of the general population. A comparison on a few important child
mortality indicators is as follows:
Indicators ST Other % diff.
1. Infant Mortality Rate 62 49 27%
2. Under Five Year Child
Mortality Rate
96 59 39%
The infant and child mortality rates (most likely to be underestimates) in the
Scheduled Tribes have shown improvement but slower than in the total
population, 123 with the result that these rates in Scheduled Tribes are higher
by about one third than in the other population. Moreover, these show a huge
variation between the states, and are particularly high in 7 states.
3. The life expectancy at birth in the Scheduled Tribe population was 61 years,
several years less than in the general population in 2001.124 It is a commentary
on the national data systems that updated information on life expectancy in
tribal population is not available.
120 National Family Health Survey, (NFHS) 2005-6. 121 Census of India, 2011. 122 Census of India 2001 and 2011. 123 NFHS1 (1992-93) and NFHS2 (1998-99). 124 Census of India, 2001.
241
4. The nutritional status of Scheduled Tribe children as well as of adults
reveals a sad picture.125
i) 53 percent boys and 50 percent girls in preschool age were
underweight, and 57 percent boys and 52 percent girls were stunted
in height.
ii) 49 percent of Scheduled Tribe women had a body mass index less
than 18.5 indicating chronic energy deficiency.
iii) 40.2 percent of Scheduled Tribe men had a body mass index of less
than 18.5 including chronic energy deficiency.
iv) Dietary intake of tribal households showed large deficiencies in
protein, energy, fats, iron, calcium, vitamin A and riboflavin.
The under-nutrition in children and adults in Scheduled Tribe population has
certainly decreased over a time period (from 1985-87 to 2007-08), yet the present
levels of deficient food intake and under-nutrition are unacceptably high, almost
always higher than in the non ST counterparts.
5. The diseases prevalent in tribal areas can be broadly classified into following
categories.
Malnutrition – Low birth weight, under-nutrition of children, lower body
size of adults, anemia, iron and vitamin A and B deficiency.
Maternal and child health problems – higher IMR, <5MR, neonatal
mortality, acute respiratory infections, diarrhea,
Communicable diseases – malaria, filaria, tuberculosis, leprosy, skin
infections, sexually transmitted diseases, HIV, typhoid, cholera, diarrheal
diseases, hepatitis, viral fevers etc.
Accidents and injuries – including the burns, falls, animal bites, snake
bites, violence due to conflicts, and more recently motor cycle accidents.
Addictions – especially to alcohol and tobacco generally and to drugs in
the North East region.
Hereditary diseases such as the Hemoglobinopathies (Sickle Cell) and G-6
PD deficiency.
Mental health problems – especially in the areas affected by conflicts.
Speciality problems – especially the orthopedic and surgical problems,
gynecological problems, oro-dental problems and eye problems.
Non-communicable illnesses – Hypertension, stroke, diabetes, cancers.
Generally, we may conclude, that Scheduled Tribes in India suffer
predominantly from A) the diseases of underdevelopment (malnutrition,
125 National Nutrition Monitoring Bureau, Technical Report 25, 2009.

242
communicable diseases, maternal and child health problems), B) Diseases
particularly common in Scheduled Tribes population (Sickle cell disease,
animal bites, accidents) and C) Diseases of modernity (Hypertension,
addiction, mental stress).
6. The social determinants of health are heavily pitted against the health of the
Scheduled Tribe population. For example, the following differences are noted
among Scheduled Tribes in comparison to the general population.
Indicators Scheduled Tribes Non-Scheduled Tribes
Illiteracy126 41 31
Occupation ratio primary to
tertiary sector
9:2 3 : 2
Tap water supply at home127 10.7 28.5
Toilet facility at home 17.4 44.3
Smoke free fuel (gas) 9.5 31.1
7. The sex ratio (number of females per 1000 males) in ST population at 990 as
compared to 938 in non-Scheduled Tribes stands out as the best in India
(2011). That speaks about an egalitarian social norm towards women.
Unfortunately, with the exposure to the outside world, the sex ratio in tribal
population is recently showing a decline.
8. Tribal people carry a traditional worldview with large number of beliefs and
practices which affect their health, sometimes favorably, but sometimes
unfavorably. There exists a severe gap of scientific knowledge about why
diseases are caused and how to prevent them. This offers a great opportunity
for improvement by way of spreading health literacy.
9. Tribal cultures have carried a heritage of traditional healing methods
through the use of medicinal herbs, which address both mind and body. These
traditional beliefs and methods are different from the modern scientific
worldview and emerge from their living in forests rich with medicinal plants.
This belief and healing system has a strong influence on the health practices
and health seeking behavior and choices of tribal people. In order to study
these systems in a holistic manner, there is a need to distinguish harmful and
beneficial practices.
126 National Sample Survey, 68th round. 127 Census of India, 2011.

243
10. Public Health Service to Scheduled Tribe population is one of the weakest
links. It suffers from several handicaps.
i) It is often inappropriate for the needs in the Scheduled Areas, being a
rubber stamp version of the national model primarily designed for the
non-tribal areas. It does not take into account the different belief system,
different disease burden and health care needs as well as the difficulties
in delivering health care in a geographically scattered, culturally different
population surrounded by forests and other natural forces. It is surprising
that no serious thought was earlier given to design a public health care
plan for Scheduled Areas.
ii) The other major difficulty in delivering public health care to tribal
population is the lack of health care human resource that is willing,
trained and equipped to work in Scheduled Areas. There is a shortage, –
vacancy, absenteeism or half-heartedness of doctors, nurses, technicians
and managers in public health care system in Scheduled Areas.
iii) Though buildings are built and health care institutions created in the form
of health sub-centers, PHCs and CHCs, they often remain dysfunctional
resulting in poor delivery of health care. This is further compounded by
inadequate monitoring, poor quality of reporting, and accountability.
iv) Factors such as unfriendly behavior of the staff, language barrier, large
distances, poor transport, low literacy and low health care seeking, lead to
lower utilization of the existing health care institutions in Scheduled
Areas.
v) Access to hospital care for all ailments remains very low in tribal areas.
Thus, the public health care system in Scheduled Areas is characterized by low
output, low quality and low outcome delivery system often targeting wrong
priorities. Restructuring and strengthening this should be one of the highest
priorities for the Ministries of Health and Family Welfare in states and at the
Centre.
11. A reason for the inappropriately designed and poorly managed health care in
Scheduled Areas is the near complete absence of participation of Scheduled
Tribes people or their representatives in shaping policies, making plans or
implementing services in the health sector. This is true from the village level
to the national level. Even though the PESA gives Gram Sabhas the right and
the role of influencing social sector schemes, which include health, there are
no mechanisms in place for such participation or oversight at the village level.
Similar situation is observed at the ITDP, district and the state levels. At the
Central level, the Ministry of Health and Family Welfare has no separate body
to shape policies or monitor programs in Scheduled Areas. This is in complete
disregard to the promise of the Constitution and the Panchsheel guidelines.

244
12. In addition to the various weaknesses listed above, there is a common
perception and complaint that funds for health care in tribal areas are
underutilized, diverted to other areas, or utilized inefficiently, and worst,
siphoned off by way of corruption.
13. Coverage with medical insurance including the Rashtriya Swasthya Bima
Yojana (RSBY) remains extremely low in the Scheduled Areas. Thus the
Scheduled Tribes populations are almost completely without financial
protection against acute and catastrophic illnesses.
14. From the pre-independence period to the present day, voluntary
organizations including the missionary or religious or the non-government
organizations (NGOs), have made laudable attempts to provide health care to
tribal people. They have often reached out to underserved areas or pioneered
better ways of delivering health care. However, such efforts remain localized
and predominantly curative.
15. There is a near complete absence of basic data required to make situational
diagnosis of health and health care in Scheduled Areas. The Sample
Registration System, the NFHS, DLHS, AHS, NSSO – none are designed to
give reliable, robust, timely and segregated estimates of health outcomes in
Scheduled Tribes populations. Such data are completely subsumed in the data
for the whole population making any assessment of the health of Scheduled
Tribes populations very difficult if not impossible. In the absence of such
quantitative estimates, the evidence-based insights and professionally sound
efforts for correction have been missing.
7.16 Recommendations
1. The first principle of any policy or program for tribal people is participation.
Tribal people as a population segment are not politically very vocal. However,
they have different geographical, social, economic and cultural environments,
different kind of health cultures and health care needs. Hence their views and
priorities must get due place in any health care program, meant for them. We
suggest making use of three types of existing institutional mechanisms to improve
the programs.
Tribal Health Assembly: From the Gram Sabhas at village level, upto the
national level, Tribal Health Assemblies should be annually organized in
which the people (at the level of village) or their representatives (at the
higher levels) participate. For instance, such a ‘Tribal Health Assembly’ is
245
annually organized for the past 15 years by an NGO, SEARCH, in
Gadchiroli district (Maharashtra) for three purposes, a) to listen to the
health problems and priorities of the people, b) to get approval for the
proposed health solutions and activities, c) to get their feedback on
ongoing activities. This can serve as a model at the local level in other
Scheduled Areas. At least one Gram Sabha meeting annually should be
exclusively dedicated to the purpose of health and related subjects.
Tribal Health Councils: These should be constituted by including elected
representatives, NGOs, experts and government officers for the purpose of
planning and monitoring of programs. Such councils should be constituted
at the block or ITDP level, district, state and national level. These should
be empowered to shape the health plans and monitor implementation.
These sub-committees of Panchayat level, district level and Zilla Parishad
could function as Tribal Health Councils.
Tribes Advisory Councils at the state level: These Councils should
approve the health plans prepared by the Tribal Health Councils, and to
review the performance of implementation.
2. In view of the enormous diversity among nearly 700 tribes in India, the second
principle to be followed is of area specific and tribe-sensitive local planning.
The PESA provides an institutional basis for this. The three institutional
mechanisms suggested above, when created and made operational at the block,
district and state level, will allow local planning.
3. Social determinants of health – literacy, income, water, sanitation, fuel, food
security and dietary diversity, gender sensitivity, transport and connectivity – play
very important role in determining the health outcomes. Hence, inter-sectoral
coordination for improvement in other sectors is as important, if not more, as
health care. Some specific suggestions for improving health are:
The construction of drainage system, village sanitation infrastructure,
personal toilets and the environmental measures to control mosquito-
breeding can be included in the MGNREGA scheme and completed on
priority basis in Scheduled Areas.
To reduce the household use of unclean fuels and biomass burning, the
solar energy, especially the solar cooker, water heaters and lights be
promoted in Scheduled Areas. This will also help save trees.
Improving nutrition of children, adolescents and pregnant and lactating
women is critical for the Scheduled Tribes population. The nutrition
awareness and feeding programs in the Scheduled Areas can be better
implemented in collaboration with the National Rural Livelihood Mission
and the women’s saving groups in the villages.
Health and income available for family will show improvement by
controlling alcohol and tobacco.

246
4. Empowerment of the Scheduled Tribe people is another cardinal principle.
Building their capabilities to care for their health is the long term solution far
superior to a perpetual dependence. This however does not mean that the
government or the rest of the society can abdicate their responsibility towards
tribal people. But this responsibility can be better served in long run by building
local capacity. In other words, instead of ‘giving’ health care, the policy should
be to build ‘capacity to care for health’. This principle should guide in planning
health care – especially in the choice of who will provide health care, where, when
and how.
5. To bridge the scientific knowledge gap of centuries, health care for Scheduled
Areas should give paramount importance to spreading ‘health literacy’ by way of
mass educational methods, folk media, modern media and school curriculum.
Enormous scope exists for communication in local dialects and for the use of
technology.
6. A large number of Scheduled Tribe children and youth – more than one crore –
are currently in schools. This provides a great opportunity – both for improving
their health and for imparting health related knowledge and practices. Schools,
including the primary schools, middle schools, high schools, ashram shalas and
also the Anganwadis should become the Primary Health Knowledge Centers.
7. Special attention should be given to women, children, old and disabled people in
the Scheduled Tribe population as these are the most vulnerable.
8. Traditional healers and Dais play an important role in the indigenous health
care. Instead of alienating or rejecting them, a sensitive way of including them or
getting their cooperation in health care, must be explored. Traditional herbal
medicines should be protected through community ownership. The ownership
and intellectual property rights of tribal community over their own herbal
medicines and practices should be ensured.
9. Apart from the physical distance, a huge cultural distance separates the tribal
population from others. Health care delivery to the Scheduled Tribe population
should be culture-sensitive and in the local language in order to overcome this
distance.
10. Health care delivery system for Scheduled Areas must keep as its guiding
principle the Chinese axiom – How far can a mother walk on foot with a sick
baby? Health care must be available within that distance. This, for the tribal
communities living in forests, means health care must be available in their
village/hamlet. Sixty years of failure should teach us that health care from outside
is not a feasible solution. The design of health care in Scheduled Areas should be
such that major share of health promotion and prevention and a sizable

247
proportion of curative care is generated and provided within the village or
hamlet.
11. In light of these principles and in view of the common disease pattern and needs
listed earlier in the conclusions section, we recommend that the Ministry of
Health and Family Welfare should redesign the primary and secondary
health care services in Scheduled Areas. The new pattern should not be
enforced as a top-down, vertical, uniform national program, but should provide a
framework for local planning with local participation. Thus, the ‘Tribal Health
Plan’ will have three feature: one, a process framework about ‘how’ to prepare
the local plan, which will be in the form of guidelines on mechanisms; second, a
series of locally developed need-based contents of the plan and third, a design or
structure of the health care system to deliver such services in all Scheduled
Areas. This ‘Tribal Health Plan’ should become an essential feature of the
National Health Mission and of the Tribal Sub Plan. The goals and monitoring
indicators of this plan will be different than the regular MIS of the NHM.
12. Human Resource for Health: The well-known difficulties in deploying doctors,
nurses and other technical personnel from outside into Scheduled Areas have
made the problem of human resources the Achilles’ heel of health care in
Scheduled Areas. We recommend that, instead of making futile efforts to import
unwilling and unstable personnel from outside, the most feasible and effective
long term solution will be to select, train and deploy local Scheduled Tribe
candidates. This should be done at the following levels:
The Accredited Social Health Activists (ASHAs) and Anganwadi
workers – from the same village or the hamlet.
The ANMs and paramedic workers – from the same block.
The doctors and public health program managers – to a large extent,
from the same district.
The candidates must be local, belong to Scheduled Tribes, be fluent in local tribal
dialects, be selected on merit and should be committed to serve in the local
Scheduled Area for at least ten years.
The ASHA workers, Anganwadi workers and ANMs will continue to be the
mainstay of health care in rural and tribal areas. Due to the physical isolation of
tribal communities, compounded by a lack of doctors, it will be pragmatic to train,
equip and empower the three ‘As’ – ASHA workers, Anganwadi workers and
ANMs – in tribal areas to a higher level.
Since the selection for medical education is through a statewide and all India
competitive process, the local Scheduled Tribe candidates may not get selected.
Hence, we recommend that separate Medical Colleges for Tribal Areas be

248
opened in selected scheduled districts, one college per three million Scheduled
Tribe population in the state. All seats are to be reserved for such committed
Scheduled Tribe candidates, to be selected from the respective Scheduled Areas,
depending on the population and need for doctors in each Scheduled Area. The
aim should be to provide, in ten years, the required number of appropriately
trained doctors to serve in these areas. The High Level Expert Group (HLEG) on
Universal Health Care, appointed by the Planning Commission, in its report
(2011), has recommended that the District Knowledge and Training Centers be
developed and made into medical colleges attached to district hospitals, and nearly
187 new medical colleges should be opened in the country, especially in
undeveloped regions. These recommendations can be used to open Medical
Colleges for Tribal Areas. Approximately 30 new medical colleges for tribal
areas, each with 60 seats per year, will be able to produce nationally about 1800
new doctors per year, selected from, trained and legally committed to work in
the Scheduled Area of their origin.
The Medical Education for Tribal Areas (META) should be, to some extent,
different from the regular MBBS, and hence, should not entirely follow the
curriculum of the Medical Council of India. Besides the regular medical
curriculum, some modifications are necessary such as: i) knowledge of and
sensitivity towards tribal culture and language, ii) methods of communication iii)
training and management of a health team, iv) competencies in preventing and
managing health problems common among the Scheduled Tribe population by
way of clinical, outreach and public health approaches, v) collaboration with other
sectors of development affecting health, eg. sanitation, nutrition, education,
forestry. If necessary, the MCI recognition for this degree may not be sought, or a
new degree different than MBBS be created, with legal permission to function as a
doctor in Scheduled Areas.
13. Addiction has serious effects on the socio-economic fabric of tribal society. It
affects not only health but also productivity, family economy, social harmony and
ultimately, development. Hence, i) the Excise Policy for Scheduled Areas,
approved by the Ministry of Home Affairs, Government of India, in 1976 and
accepted by the states, should be implemented effectively, ii) the availability and
consumption of tobacco and drugs should be severely controlled and iii) the
availability and use of alcohol and tobacco products among the Scheduled Tribe
population, and the implementation of control policies by the states, should be
monitored on selected indicators. These efforts should become a critical part of
the Tribal Sub-Plan.
14. The TSP budget, in proportion to the Scheduled Tribe population, should be an
additional input and not a substitute to the regular budget for routine activities of

249
the Health Department in Scheduled Areas. At least ten percent of the total TSP
budget should be committed to the health sector, the Tribal Health Plan in the
Scheduled Areas, in addition to the regular health budget for these areas.
15. Data on the Scheduled Tribe population is a basic ingredient for planning,
monitoring and evaluating health programs in Scheduled Areas. All national data
systems – the Census, SRS, NFHS, NSSO, and DLHS – should be asked to plan
for and generate Scheduled Tribe-specific estimates on health indicators at the
district level and above. One percent of the total budget for the Scheduled Tribe
population (TSP) should be allocated to the generation of reliable, timely, and
relevant segregated data on Scheduled Tribes population, from the local to
national level. This will provide the crucial instrument – the facts – necessary to
guide program managers, policy makers and the Scheduled Tribe population itself.
Towards this, the specific measures recommended are –
Construction of a composite Tribal Development Index (TDI)
Construction of a composite Tribal Health Index (THI) including the
indicators on health status, determinants and health care.
Ranking of 151 districts with more than 25 percent Scheduled Tribes
population and of states on these indices.
Creation of a high power national body under the Ministry of Health and
Family Welfare to facilitate the commissioning and collection of relevant data
and monitoring of the indices and progress. This body should complete the
work through the various existing agencies/surveys such SRS, NSSO, NFHS,
DLHS, AHS, NNMB, the TRTIs in the states, the ICMR institutes network on
tribal health, and finally, the health ministries in the states. Necessary
administrative and financial authority should be provided to this body.
Broadly, one percent of the total health budget for tribal areas (the regular
health budget for Scheduled Areas, including the health component in the
TSP) should be devoted for this purpose.
16. Research: From the public health point of view, certain aspects of tribal health
need research. These are:
Epidemiology, disease patterns and mortality rates in Scheduled Areas
Traditional belief systems and practices, and effective communication
methods
Tribal healing systems
Methods of health care delivery in Scheduled Areas.
The AYUSH (Ayurveda, Yoga, Unani, Siddha, and Homeopathy) department and the
Indian Council of Medical Research should incorporate these into their scope of
working.

250
17. The Proposed Goals of the Tribal Health Plan should be:
To attain the Millennium Development Goals (2015) on health and nutrition
for the Scheduled Tribe population in India by the year 2020
To bring the health, sanitation and nutrition status of the Scheduled Tribe
population to the same level as that of the non-Scheduled Tribe population in
the respective states by the year 2025
To create the human resources necessary for provision of healthcare in
Scheduled Areas, as per the norms set by the High Level Expert Group on
Universal Health Coverage (2011), by the year 2025
To create and make functional the institutions for participatory governance
(Tribal Health Assemblies and Councils) at all levels in the Scheduled Areas
by the year 2016
To annually generate Tribal Health Plans at all levels by the year 2017
To annually allocate and spend 8.6 percent, in proportion to the Scheduled
Tribes population, of the total Health Sector Plan and Non-plan budget, plus
10 percent of the TSP for the implementation of the Tribal Health Plan.

251
8. Land Alienation, Displacement and Enforced Migration
8.1 Introduction
Tribal communities of India reside in hill areas that are rich in minerals and forest
cover. Land is the basis of their socio-cultural and religious identity, livelihood and
their very existence. Their lives are closely interlinked with forests for food, fuel,
medicine, fodder and livelihood. Their God and guardian spirits reside in hills, forests,
groves etc. Traditionally, ownership of land was by the community and economic
activity mainly agrarian, including shifting cultivation, which fostered egalitarian
values which influenced their power relations and organizational system. Forest and
hills are the main source of tribal identity.128 It is in this context that the devastation of
lives of tribal people caused by loss of access to forest and involuntary displacement
from their land has to be understood. Dispossession takes place both directly by
depriving tribal communities of their land, habitat, livelihood, political system,
culture, values and identity and indirectly through denials of benefits of development
and of their rights.129 With their control over resources diminishing, tribal
communities remain the most vulnerable and marginalized community in the country.
8.1.1 Background
The Development model in India is a carry forward from the pre-independence British
period which was based on exploitation of natural resources and human capital for
extraction and export of surplus for boosting industrial revolution in Britain. The only
difference is that this model of primitive accumulation is being used within the
country for development of capital goods sector and in due course this model
remained relevant for growth of production in the private sector. In spite of all the
promises in the Constitution for protection and special treatment for tribal people and
other weaker groups this colonial emphasis did not change in independent India. Due
attention and importance was not given to social costs consequently a large number of
people were displaced for economic development without regard to proper and
holistic rehabilitation of displaced tribal communities and other weaker groups.
8.1.2 Constitutional Provisions
Schedule V of the Constitution lays down provisions for protection of land, and
welfare and advancement of Scheduled Tribes. Legal protection is provided in
Schedule V under which laws are to be framed by State Governments to ‘prohibit or
restrict the transfer of land by or among members of the Scheduled Tribes’ in
128 Ekka, Alex, , ‘Displacement of tribals in Jharkhand: A violation of Human Rights’, in Nathan and Xaxa (eds.) ‘Social exclusion and Adverse inclusion- Development and deprivation of Adivasis in India, Oxford University Press, New Delhi, 2012,
pp. 52-53. 129 Areeparampil, Matthew, ‘Industries, mines and dispossession of indigenous peoples: The case of Chotanagpur’, Social
Action, Vol. 38, July-September 1988.

252
Scheduled Areas. State Governments did enact legislations, but in connivance with
the state machinery, loopholes were exploited for defrauding tribal people of their
land and illegal alienation of tribal land by non-tribal people continued as an ongoing
process even after independence. This alienation of land has led to decrease in corpus
of tribal land and is a contributory factor in ‘forced’ migration.
It is in this context that the Samatha judgment delivered by the Supreme Court in
1997 is an important landmark as it upholds and protects the land rights of Scheduled
Tribes in Scheduled Areas. The judgment states that “the members of (Constituent)
Assembly deliberated to protect tribal land for the economic empowerment, economic
justice, social status and dignity of tribal persons. This entailed retention of land with
the tribals, not only the land belonging to them, but also Government land in
Scheduled Areas. …This manifested the intent of the founding fathers...to prohibit
transfer between tribals and non-tribals and provided for allotment of land to the
members of the Scheduled Tribes in such areas.”130 The Samatha judgment, delivered
in the context of Andhra Pradesh Scheduled Area Land Transfer Regulation 1959,
held that private mining industries are a non-tribal ‘person’ therefore, mining leases to
private industries in tribal lands of Scheduled Areas are null and void and any transfer
of land to a non-tribal was prohibited. The judgment went on to state that in
Scheduled Areas, every Gram Sabha should prevent alienation of land, and minerals
of these areas should be exploited by the tribal people themselves.131 But both the
provisions of the Fifth Schedule and the Samatha judgment could not protect the
interests of tribal communities and their lands.
The Sixth Schedule of the Constitution lays down provisions as to the administration
of tribal areas in the States of Assam, Meghalaya, Tripura and Mizoram. Under these
provisions Autonomous Districts and Autonomous Regions have powers to make
laws relating to land, for the management of any forest not being a reserved forest, the
inheritance of property, use of water course and canal for purpose of agriculture, etc.
But there is a proviso to 3 (a) of the Sixth Schedule which reads as follows:
‘Provided that nothing in such laws shall prevent the compulsory acquisition of any land,
whether occupied or unoccupied, for public purposes in accordance with the law for the time
being in force authorizing such acquisition’.
On the basis of this proviso, land and Common Property Resources (CPR) have been
acquired and tribal people have been displaced. Moreover, land is one of the reasons
for conflicts in some parts of the Northeast and this has caused displacement of
people.
130 Dias, Anthony, ‘Development and its human cost: Land acquisition, displacement and rehabilitation of tribals. New Delhi: Rawat Publications, 2012. 131 Samatha v. State of Andhra Pradesh (1997) 8 SCC 191; see also Rebbapragada, R and Kalluri, B. ‘The Samatha Judgment’ in Mehta, Lyla (ed) ‘Displaced by development: Confronting marginalization and gender injustice’. Sage Publications India, New
Delhi, 2009, pp. 249-253.

253
8.2 Right to Land
Right to property is today a Constitutional right (as distinct from a fundamental right).
The fundamental right to property was taken away by amendments to the Constitution
for zamindari abolition and bank nationalization. Way back in 1956, when the Fourth
Amendment was being made to take compensation for land acquisition out of judicial
review, the tribal leader, Shri. Jaipal Singh had emphasized that ‘for the poor man’s
sake compensation must be justifiable, for the right to approach the courts is the most
effective guarantee against executive tyranny’.132 Today we see how the right to
property being a legal right and not a fundamental right has worked as a disadvantage
against displaced belonging to weaker sections, particularly against the tribals.
8.2.1 Conceptual framework of Land Acquisition Act, 1894: ‘Eminent domain’
and ‘Public purpose’
The State has succeeded in acquiring vast tracts of land and diverting common
property resources for construction of dams, infrastructure development, mining and
industry, Special Economic Zone (SEZ), etc. Private land has been acquired under
provisions of the Land Acquisition Act 1894, under the concept of ‘eminent domain’
based on the principle that the interest and claim of the whole community is always
superior to an interest of the individual. This principle of ‘eminent domain’ has been
upheld in judgments of the Supreme Court. Researchers while discussing changes in
the law had brought out that ‘eminent domain’ had three essential ingredients– first,
power of the State to take over private land; second, exercise of this power for public
good (public purpose); and third, the State had to compensate those whose lands were
acquired for public purpose.133 Ramanathan placed the concept of ‘eminent domain’
in the context of injustice in the model of development and displacement. Under this
model, only land owners had a right to be compensated and others such as landless,
who had no legal title were excluded and this disregard for segment of the population
was ‘because of the limited mandate imposed on the State by the eminent domain
doctrine’.134
With the enactment of ‘The Right to Fair Compensation and Transparency in Land
Acquisition, Rehabilitation and Resettlement Act, 2013’ comprehensive resettlement
has been legally mandated and people affected by the Project have been included. But
till this new law came into being, much harm had been caused by the misuse of the
concept of ‘eminent domain’.
Customary laws and the special provisions of Fifth and Sixth Schedules for protection
of tribal land escape notice when judgments such as the Supreme Court order of 2004,
132 Austin 2000, pg. 109 quoted in Sundar, Nandini. ‘Laws, Policies, and Practices in Jharkhand’ in Sundar, N (ed). ‘Legal
Grounds: Natural resources, identity, and the Law in Jharkhand. Oxford University Press. New Delhi 2009:pg 12 133 Desai, Mihir. 2011. ‘Land acquisition law and the proposed changes. Economic and Political Weekly, Vol. Nos 26&27. June
25, 2011, pg. 12 134Ramanathan, Usha. ‘A word on eminent domain’ in Mehta, Lyla (ed). ‘Displaced development: Confronting marginalization
and gender justice’. Sage Publications, India. New Delhi, 2009

254
regarding dispute over source of water in Nagaland, are passed stating ‘So far as
natural resources like land and water are concerned, dispute of ownership is not very
relevant because undoubtedly the State is the sovereign dominant owner.’135 Further,
in another matter, the January 2003 Supreme Court judgment declares:
‘The power to acquire by State the land owned by its subjects hails from the right of eminent
domain vesting in the State, which is essentially an attribute of sovereign power of the State.
So long as the public purpose subsists, the exercise of the power by the State to acquire land
of its subjects without regard to the wishes of the owner or person interested in the land
cannot be questioned’.136
So long such judge–made law, that speaks of ‘subject’ and not ‘citizen’ and
emphasizes sovereign power and not the Constitutional notion that ‘it is the people
who are sovereign’, the power of eminent domain will continue to displace and
impoverish.137
‘Public purpose’ has not been clearly defined in the Land Acquisition Act, 1894. In
fact, the amendment brought about in the colonial Land Acquisition Act, 1894 added
land for residential purposes and developments carried out by local authorities and
private companies, within the ambit of ‘public purpose’ which increased the extent of
acquisition of private land and diversion of forest and other CPR.
The Right to Fair Compensation and Transparency in Land Acquisition,
Rehabilitation and Resettlement Act, 2013 has come many years too late, but is
progressive in that it is the first to legally mandate comprehensive Resettlement and
Rehabilitation of Project-Affected Persons; but the definition of ‘public purpose’
remains too wide and will not help in minimizing displacement. It also includes the
idea of acquisition for private companies even from Scheduled Areas which expands
the power of acquisition and alienation beyond what it was under the 1894 Act.
8.2.2 Forest laws
The colonial Government passed the Indian Forest Act, 1865 for acquisition of forest
lands for creation of infrastructure such as railways. Later, through the enactment of
Indian Forest Act, 1878, the State got monopoly control over forest lands for
commercialization purpose. Subsequently, The Indian Forest Act, 1927 was enacted,
which was carried over after independence and formed the basis of all forest laws in
India. Under its provision new rights were acquired by the State under the principle of
eminent domain and cultivation by people, who are descendants of original settlers of
land, was categorized as illegitimate. Forests were categorized into three types:
Reserved Forests, Protected Forests and Village Forests. The earlier customary rights
of tribal people/communities in forests and common lands as included in a record of
rights under State tenancy laws (such as that of Chotanagpur and Santhal Parganas
135 Tekaba AO v. Sakumeren AO (2004) 5 SCC 672. 136 Sharda Devi v. State of Bihar (2003) SCALE 85 at pg. 98, para 31. 137Ramanathan, Usha. 2009. ‘A word on eminent domain’ in Mehta, Lyla (ed) 2009: pg 134.

255
regions in erstwhile Bihar and now Jharkhand) included rights such as right to take
forest-produce from forest land, graze cattle, to fish, to reclaim jungle land or
wasteland or to convert land into cultivable land were restricted. Recording of Forest
rights of tribal people was discontinued Forest rights of tribal people as Reserved
Forests and Protected Forests were ‘brought outside the scope of legal rights
settlement’.138 The Wild Life Protection Act, 1972, the Forest Conservation Act,
1980, the Tree Prevention Act and the Forest Policy, 1988, also affected tribal
people.139 Further, the Supreme Court order of 1996 in Godavarman case declared all
lands recorded as forest in Government records and brought them under the purview
of the Forest Conservation Act, 1980. Thus land earlier recorded as scrub forests,
areas of worship, sacred groves and small areas of Sal forests, which were categorized
as common land came under the control of the Forest Department. Due to these Forest
laws, tribal people of central India who were Forest owners became encroachers and
were arrested and imprisoned for minor offences.140
The Scheduled Tribes and other Traditional Forest Dwellers (Recognition of Forest
Rights) Act, 2006 is an important Act, as it has begun the process of recognizing their
rights and will be the legal basis for computation of compensation in case of diversion
of Forest for development projects. But much harm had already been caused to tribals
before enactment of this law.
8.2.3 Ways in which tribal land alienation takes place
Alienation of land of tribal communities and loss of rights to Common Property
Resources, mainly forests and large scale displacement and enforced migration takes
place in following ways:
Development-induced displacement by acquisition of land by the State based
on principle of ‘eminent domain’ for ‘public purpose’ without a ‘land for land’
provision for rehabilitation. Acquisition by the State for development projects
also leads to alienation of land and displacement due to environmental
pollution and damage to land in the area near projects but tribal people so
displaced are not entitled to any compensation.
Illegal land alienation takes place due to participation of revenue functionaries
and officials, and incorrect interpretation of laws, manipulation of records and
permission accorded to alienate land. State Laws are amended to include
provisions that facilitate land alienation of tribal communities.
Community land of tribal communities is recorded as Government land in
survey and settlement operations and most State tenancy laws recognize only
138 Vasan, Sudha. 2009 ‘Forest law, ideology, and practice’ in Sundar, Nandini (ed.) ‘Legal Grounds: Natural resources,
identity, and the law in Jharkhand’. Oxford University Press, New Delhi, 2009, pg 115- 121. 139 Saxena, KB 2012. ‘Development is war; Underdevelopment is benign: Political Economy of tribal displacement in India’ in
Ghosh, AK and Munda, Ram Dayal (eds). ‘The other side of development: The tribal story”, Konark Publishers Pvt Ltd. New Delhi, 2012 140Vasan, Sudha. 2009, pg 122,127
256
individually owned registered land. Such lands have not been fully surveyed
and there is no record of user practices, which would be shown as Government
land.
State action of acquiring tribal lands for settling refugees has resulted in land
alienation and displacement. There is also encroachment of tribal land by
immigrants.
Creation of National Parks have resulted in alienation of rights and consequent
displacement and forced migration of tribal people.
Conflicts in the Northeast have resulted in tribal people losing everything and
being displaced from their home ground.141
8.2.4 Process of involuntary displacement
Mineral and hydro-electric resource-rich States of India tend to be the very places,
which are home to vast majority of tribal people. Baxi142 has highlighted that people
are not partners in the process of decision making regarding construction of dams,
areas of submergence, environment impact, allocation of resources and allocation of
benefits and adverse impacts of development. Displacement is a process in which
marginalized sections, the majority being tribal people, are pushed out of their own
habitat and dispossessed of their resources and indeed their universe around them. In
post-independence period, their experience of displacement is as dehumanizing as
before independence.
The unrestricted power of the State to acquire privately-owned land without any
obligation on the State to rehabilitate persons affected has resulted in large number of
cases of inadequate compensation, forcible acquisition even without payment of
compensation, without replacement of livelihood, without provision of alternative
land, without preparation of resettlement sites and without recognition of loss of right
to access forest, other CPR and loss of community ties, cultural and religious heritage.
Social injustice of State action in reducing every right and interest of tribal people and
other marginalized people in their lands to a claim for monetary compensation and the
incorrect assumption that money can compensate for all losses, that all displaced are
familiar with money market and would know how to handle compensation money. In
the case of displaced tribal people their unfamiliarity with money market led to
devastating consequences.143 All this has led to ‘abject and chronic
141Based on ‘Report of Committee on State Agrarian Relations and Unfinished Task of Land Reforms’, Ministry of Rural
Development, GOI, 2009. Fernandes and Barbora. Saxena, KB, 2012.’ Development is War; Underdevelopment is benign:
Political economy of tribal displacement in India’ Mehta, L. (ed) 2012. Ekka, A. 2012. ‘Status of Adivasis/ Indigenous Peoples
land series- 4. Aakar Books, New Delhi. 2011. 142Baxi, Upendra, 2008. Development, displacement and resettlement: A human rights perspective’ in ‘India social development
report 2008’. ‘Development and displacement’. New Delhi: Center for Social Development, Oxford University Press. 143 Based on Fernandes, Walter. 2008. ‘Development- induced displacement in India: Scale, impacts, and the search for alternatives’ in ‘India Social development report: Development and displacement’. Centre for Social Development, Oxford
University Press. 2008. Fernandes. Fernandes, W and S. Anthony Raj, 1992. ‘Development, displacement and rehabilitation in the tribal areas of Orissa’. New Delhi: Indian Social Institute. Fernandes. 1991, ‘Power and Powerlessness: Development and
displacement of tribals. Social Action, 41 (3). Mahapatra, Lakshman K. 1999. ‘Resettlement, impoverishment and reconstruction
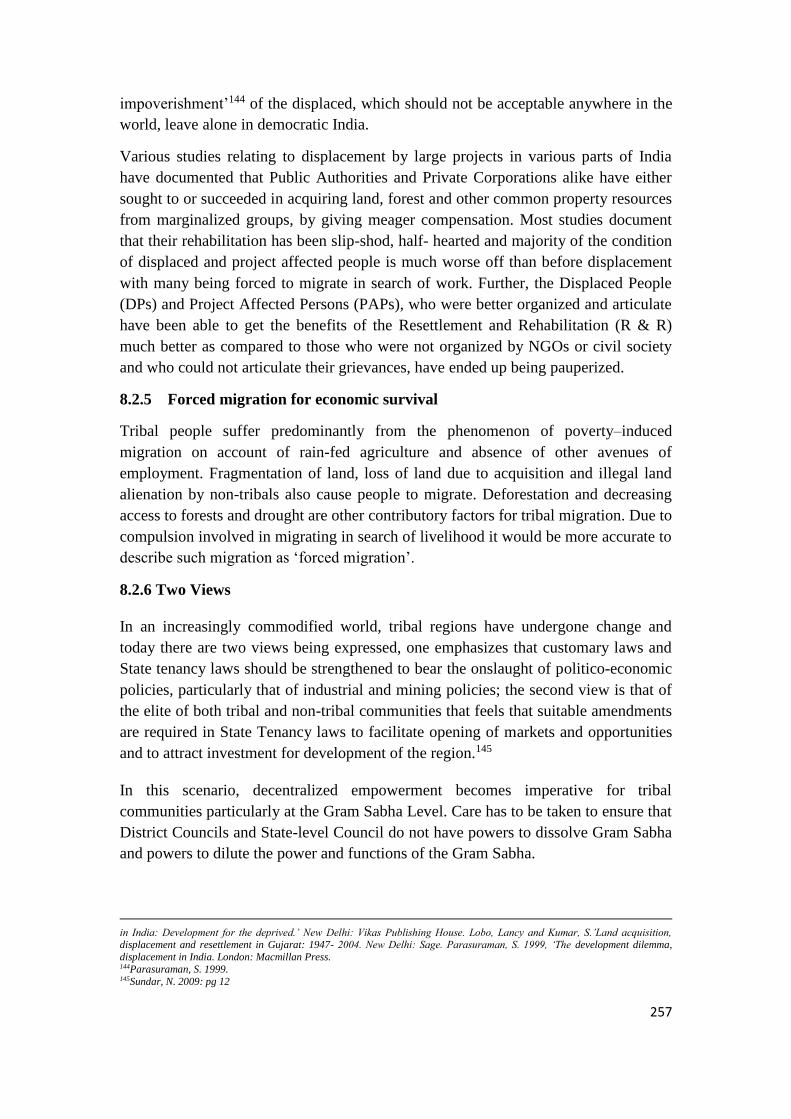
257
impoverishment’144 of the displaced, which should not be acceptable anywhere in the
world, leave alone in democratic India.
Various studies relating to displacement by large projects in various parts of India
have documented that Public Authorities and Private Corporations alike have either
sought to or succeeded in acquiring land, forest and other common property resources
from marginalized groups, by giving meager compensation. Most studies document
that their rehabilitation has been slip-shod, half- hearted and majority of the condition
of displaced and project affected people is much worse off than before displacement
with many being forced to migrate in search of work. Further, the Displaced People
(DPs) and Project Affected Persons (PAPs), who were better organized and articulate
have been able to get the benefits of the Resettlement and Rehabilitation (R & R)
much better as compared to those who were not organized by NGOs or civil society
and who could not articulate their grievances, have ended up being pauperized.
8.2.5 Forced migration for economic survival
Tribal people suffer predominantly from the phenomenon of poverty–induced
migration on account of rain-fed agriculture and absence of other avenues of
employment. Fragmentation of land, loss of land due to acquisition and illegal land
alienation by non-tribals also cause people to migrate. Deforestation and decreasing
access to forests and drought are other contributory factors for tribal migration. Due to
compulsion involved in migrating in search of livelihood it would be more accurate to
describe such migration as ‘forced migration’.
8.2.6 Two Views
In an increasingly commodified world, tribal regions have undergone change and
today there are two views being expressed, one emphasizes that customary laws and
State tenancy laws should be strengthened to bear the onslaught of politico-economic
policies, particularly that of industrial and mining policies; the second view is that of
the elite of both tribal and non-tribal communities that feels that suitable amendments
are required in State Tenancy laws to facilitate opening of markets and opportunities
and to attract investment for development of the region.145
In this scenario, decentralized empowerment becomes imperative for tribal
communities particularly at the Gram Sabha Level. Care has to be taken to ensure that
District Councils and State-level Council do not have powers to dissolve Gram Sabha
and powers to dilute the power and functions of the Gram Sabha.
in India: Development for the deprived.’ New Delhi: Vikas Publishing House. Lobo, Lancy and Kumar, S.’Land acquisition, displacement and resettlement in Gujarat: 1947- 2004. New Delhi: Sage. Parasuraman, S. 1999, ‘The development dilemma,
displacement in India. London: Macmillan Press. 144Parasuraman, S. 1999. 145Sundar, N. 2009: pg 12

258
8.2.7 Protests and agitations
It is the fear of impoverishment that has made people, particularly tribal communities
to launch protests against land acquisition and displacement and is one of the reasons
for Left Wing Terrorism in tribal regions of Central India. The response of the State
ought to be to engage with tribal people to find out what they want.
8.3 Extent of Displacement
8.3.1 Data regarding Displaced Persons and Project Affected Persons
The Centre has not maintained either district-wise or State-wise data of Community
wise Displaced Persons/Project-affected persons or their rehabilitation and
resettlement, which is symptomatic of the States’ disregard for the adverse impact of
displacement on various communities.
The narrow definition of displaced person to mean ‘a person who due to loss of home
has to be resettled’ and only landowners to be compensated has led to exclusion of
project-affected persons (PAPs), who were deprived of their livelihood base,
displaced from community land and socio-cultural and environmental resources.
Fernandes and Paranjype146 estimated that the number of people displaced due to
dams, mines, wildlife sanctuaries, industries during the first four decades of
independence was about 21 million and as per Government sources at least 75 percent
have not been rehabilitated. Mahapatra147 pegs the number at 25 million people from
1947–1999. Walter Fernandes, by updating data and by extrapolation based on
available studies and case studies in States, where comprehensive studies have not
been done, estimated that there were about 60 million DPs/PAPs, since independence
to 2000. It was also estimated that 20 per cent were Dalits and another 20 per cent
from other rural poor communities, like fisher-folk and quarry workers.148Researchers
suggest that around 25 per cent of India’s tribals become DP or PAP at least once,
because their regions are rich in natural resource. In absence of official data the
Planning Commission report quotes the estimate 60 million DPs/PAPs arrived at by
researchers. The Expert Group on Prevention of Alienation of Tribal Land and its
Restoration set up by the Government of India estimates that, of the total displaced
due to development projects, 47 per cent are tribal population.
8.3.2 Views of National Human Rights Commission
The National Human Rights Commission (NHRC) has noted that, there has been large
scale displacement in four States with large tribal population viz., Andhra Pradesh,
146 Fernandes, F and Paranjype, V.1997. ‘Hundred years of displacement in India: Is the rehabilitation policy an adequate
response? in Fernandes and Paranjype (eds) ‘Rehabilitation : Policy and law in india: Right to livelihood’. Indian Social
Institute, New Delhi. 1997 147 Mahapatra, L.K. 1999. 148 Fernandes, W. (2008).’ Sixty years of development- induced displacement in India: Impacts and the Search for alternatives ‘in Mathur, Hari Mohan (ed) ‘India social development report 2008: Development and displacement’. Council for Social
Development, Oxford University Press.
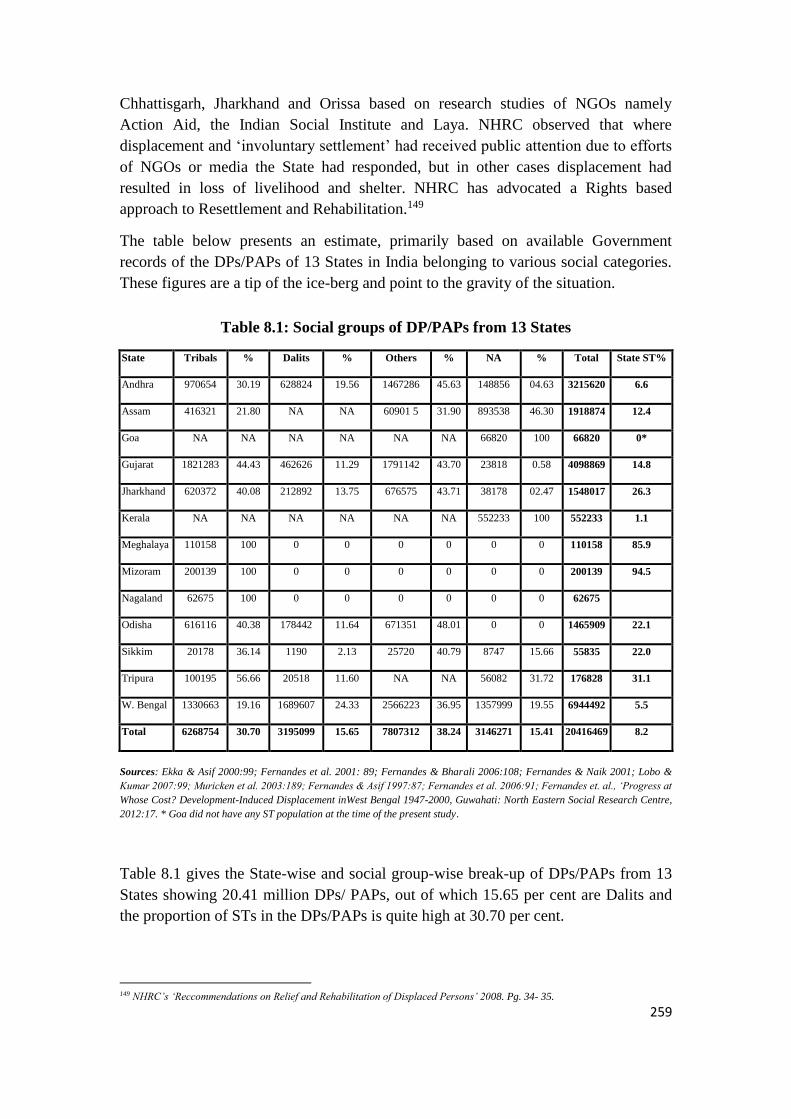
259
Chhattisgarh, Jharkhand and Orissa based on research studies of NGOs namely
Action Aid, the Indian Social Institute and Laya. NHRC observed that where
displacement and ‘involuntary settlement’ had received public attention due to efforts
of NGOs or media the State had responded, but in other cases displacement had
resulted in loss of livelihood and shelter. NHRC has advocated a Rights based
approach to Resettlement and Rehabilitation.149
The table below presents an estimate, primarily based on available Government
records of the DPs/PAPs of 13 States in India belonging to various social categories.
These figures are a tip of the ice-berg and point to the gravity of the situation.
Table 8.1: Social groups of DP/PAPs from 13 States
Sources: Ekka & Asif 2000:99; Fernandes et al. 2001: 89; Fernandes & Bharali 2006:108; Fernandes & Naik 2001; Lobo &
Kumar 2007:99; Muricken et al. 2003:189; Fernandes & Asif 1997:87; Fernandes et al. 2006:91; Fernandes et. al., ‘Progress at
Whose Cost? Development-Induced Displacement inWest Bengal 1947-2000, Guwahati: North Eastern Social Research Centre,
2012:17. * Goa did not have any ST population at the time of the present study.
Table 8.1 gives the State-wise and social group-wise break-up of DPs/PAPs from 13
States showing 20.41 million DPs/ PAPs, out of which 15.65 per cent are Dalits and
the proportion of STs in the DPs/PAPs is quite high at 30.70 per cent.
149 NHRC’s ‘Reccommendations on Relief and Rehabilitation of Displaced Persons’ 2008. Pg. 34- 35.
State Tribals % Dalits % Others % NA % Total State ST%
Andhra 970654 30.19 628824 19.56 1467286 45.63 148856 04.63 3215620 6.6
Assam 416321 21.80 NA NA 60901 5 31.90 893538 46.30 1918874 12.4
Goa NA NA NA NA NA NA 66820 100 66820 0*
Gujarat 1821283 44.43 462626 11.29 1791142 43.70 23818 0.58 4098869 14.8
Jharkhand 620372 40.08 212892 13.75 676575 43.71 38178 02.47 1548017 26.3
Kerala NA NA NA NA NA NA 552233 100 552233 1.1
Meghalaya 110158 100 0 0 0 0 0 0 110158 85.9
Mizoram 200139 100 0 0 0 0 0 0 200139 94.5
Nagaland 62675 100 0 0 0 0 0 0 62675
Odisha 616116 40.38 178442 11.64 671351 48.01 0 0 1465909 22.1
Sikkim 20178 36.14 1190 2.13 25720 40.79 8747 15.66 55835 22.0
Tripura 100195 56.66 20518 11.60 NA NA 56082 31.72 176828 31.1
W. Bengal 1330663 19.16 1689607 24.33 2566223 36.95 1357999 19.55 6944492 5.5
Total 6268754 30.70 3195099 15.65 7807312 38.24 3146271 15.41 20416469 8.2

260
Researchers who have made the estimation point out that dams that submerge revenue
land or forest CPRs but dependent DPs/PAPs are not counted. For example, in
Hirakud project of Orissa DPs/PAPs dependent on CPR were not included in the
official list of 110,000 DPS/PAPs and after their inclusion by researchers, the number
of DPS/PAPs increased to 180,000. By updating data and by extrapolation based on
these studies and case studies in States, where comprehensive studies have not been
done it has been estimated that, there were 60 million DPs/PAPs in1947-2000.150 The
updated estimates reveal Jharkhand with 3 million DPs, Odisha with 3 million,
Andhra Pradesh with 5 million, Kerala with 1 million and Goa with 1,00,000.
Researchers estimate that people were displaced from 25 million hectares including 7
million hectares of forests and 6 million hectares of other CPRs.151 The large-scale
displacement of tribal people calls for minimising of displacement.
8.4 Resettlement of the Displaced
Table 8.2: A conservative estimation of displaced by development projects in
India, percentage of STs (1951-1990) and number resettled (in lakhs)
Types All
DPs
(lakhs)
%
of
DPs
DPs
Resettled
% of
Resettled
DPs
Backlog % of
Back-
log
Tribal
DPs
% of All
DPs
Tribal
DPs
Resettled
% of
Tribal
DPs
Backlog
of
Tribal
DPs
% of
Back
log
Dams 164.0 77 41.00 25.0 123.00 75.0 63.21 38.5 15.81 25.00 47.40 75
Mines 25.5 12 6.30 24.7 19.20 75.3 13.30 52.20 3.30 25.00 10.00 75
Industries 12.5 5.9 3.75 30.0 8.75 70.0 3.13 25.0 0.80 25.0 2.33 75
Wild Life 6.0 2.8 1.25 20.8 4.75 79.2 4.5 75.0 1.00 22.0 3.50 78
Others 5.0 2.3 1.50 30.0 3.50 70.0 1.25 25.0 0.25 20.2 1.00 80
Total 213 100 53.80 25.0 159.20 75.0 85.39 40.9 21.16 25.0 64.23 79
Source: Fernandes1994: 22-32 in Pati 2000 as cited by Nihar Ranjan Mishra & Kamal K Mishra in Displacement and Rehabilitation:
Solutions for the Future, Gyan Publications, 2012.
There is a lack of official disaggregated data and it is committed researchers who have
computed these comparative statements at least for some projects. Dams have
displaced the highest number of people. Out of the 21.3 million DPs; about 77 per
cent have been displaced by dams out of which 38.5 per cent are tribal DPs. As far as
resettlement of DPs is concerned 5.38 million (25 per cent) have been resettled out of
which 2.11 million are tribal DPs; and out of a backlog of 15.92 million DPs, 6.42
million (79 per cent) are tribal DPs. Based on field studies, researchers point out that
150Fernandes, W.2008. ‘Sixty Years of Development- induced displacement in India: Scale, impacts, and the search for
alternatives’. India Social Development Report- Development and Displacement’. Centre for Social Development. 2008, Oxford University Press. New Delhi. 151Fernandes, W. 2008. ‘Sixty Years of Development- induced displacement in India: Scale, impacts, and the search for alternatives’. India Social Development Report- Development and Displacement’. Centre for Social Development. 2008, Oxford
University Press. New Delhi.

261
when Common Property Resources (CPRs) are acquired tribal people are not counted
among the land losers.
These estimates are for the period 1951- 1990 and it is probable that the backlog
number would have increased greatly. Policy makers disregard the huge backlog of
the marginalized, particularly the tribal DPs/PAPs and the new law also does not take
cognizance of the backlog. It is precisely the neglect of the backlog and the fear of
destitution that has made tribal people launch protests against further land acquisition.
It is the responsibility of the State to collect data of the backlog DPs/PAPs and to
rehabilitate and reconstitute their livelihood.
Displacement, Resettlement and Rehabilitation in Subsidiaries of Coal India Ltd.
The Table below shows that since 1973, 86728 people have been displaced by
Subsidiaries of Coal India Ltd out of which 14487 were tribals. 32271.24 hectares of
forest land and 5460.44 hectares of CPR have been acquired in addition to
1,24,506.25 hectares of private land, which is an indication of the great loss of land
and resources as against which the displaced were given only 634.45 hectares.
Moreover, people who lost their livelihood due to acquisition of CPR and forest land
were probably not considered eligible for compensation.
In the case of tribal displaced, they lost 1,39,56.84 hectares of land, but were given
only 91.16 hectares under R&R, only 10,097 were given jobs and 81 employed as
casual labour. Tribal people are mainly agriculturists and they depend on CPR and
Forest for livelihood and sustenance and not being compensated for this loss affects
them adversely. Jobs given in lieu of land cannot compensate for land which was a
capital resource to be inherited from generation to generation. No attempt is made for
skill development and as a consequence displaced tribals have no option, but look for
employment opportunities elsewhere. The table below reveals that title deed is not
given for homestead land settled with the displaced. Due to lack of title deed the
displaced are unable to access public facilities such as PDS provided by Block Offices
and it also leads to loss of identity as they find it difficult to get a Scheduled Tribe
certificate.152 This needs to be rectified.
The PSU does not have managerial capacity for carrying out rehabilitation
programmes and the focus and vision of the organization is to maximize coal
production. Therefore, rehabilitation of the displaced is not given all that importance.
The PSU should think of building capacity to deliver on promises made in their R&R
Policy.
152 Basant, J. 2013 evidence of field work of MPhil dissertation in ‘Impact of Development- induced displacement and
rehabilitation: A study of Piparwar Coal Area of Central Coal Fields Ltd. In Chatra District of Jharkhand.’ TISS, Mumbai.

262
Table 8.3: Information from PSU Coal India regarding Displaced Persons,
Resettlement and Rehabilitation
PSU – Coal India/Subsidiary Company
S.No Details ST Others Total
1. No. of persons displaced 14487 72241 86728
2. No. of displaced person rehabilitated/resettled 11621 60583 72204
3. No. of displaced person given land under
R&R
8652 39236 47888
4. Total area of land given in hectares under
R&R
91.16 543.29 634.45
5. No. of displaced persons employed as casual
labour as part of R&R
81 248 329
6. No. of persons given jobs as part of R&R 10097 45997 56094
7. Area acquired in hectares from 13956.84 110549.41 124506.25
8. Area of CPR acquired in hectares 63.84 5396.60 5460.44
9. Area of Forest land acquired in hectares 0 32271.24 32271.24
10. Reason for not giving title deed for land
settled as homestead plot with displaced
family as part of R&R
Rehabilitation sites are established on land
acquired vide provision of CBA(A&D) Act,
1957 or obtained by virtue of Coal Mines
Nationalization Act, 1973 and cannot be
transferred/mutated into the respective
allottees of residential plots.
Note-the above information/data is from the year 1973 onwards)

263
8.4.1 Extent of Private, Common and Forest Land Taken For Projects
Table 8.4: Extent and Proportion of Common Land/Forest Diverted and Private
Land Acquired
State Private % Common % Forest % NA % Total
Andhra 684725.10 67.99 255077.73 25.33 67362.75 06.69 00 00 1007165.59
Assam 159205.14 28.06 316041.66* 55.71 92034.49 16.23 567281.29
Goa 12649.74 77.85 2880.00 17.72 720.00 04.43 00 00 16249.74
Gujarat 3126527.00 61.54 312653.00 6.15 1641427.00 32.31 00 00 5080607.00
Jharkhand 344952.75 55.11 141226.07 22.56 139710.67 22.32 00 00 625889.49
Kerala 66759.25 43.00 1222.32 0.79 40673.62 26.20 46608.33 30.02 155263.52
Meghalaya 43685.69 58.81 8022.07* 10.80 22492.37 30.28 74200.13
Mizoram 3471.11 16.48 1712.48* 8.14 15874.42 75.38 21058.01
Nagaland 1353.56 5.26 15985.47 61.97 1762.58 6.82 6668.50 25.92 25770.11
Orissa 399859.05 41.81 264648.15 27.99 288845.85 30.20 00 00 956353.05
Sikkim 47031.62 95.16 NA NA 2184.67 4.84 00 49216.89
Tripura 51177.40 60.38 27762.45* 32.76 5811.81 6.86 84751.66
W.Bengal 1600404.86 85.98 328340.08* 17.02 00 00 1928744.94
Total 6541802.27 60.46 3853545.48 37.55 189489.92 1.92 10592551.42 *The forest common revenue division could not be got fully. So they are combined.
Source: as in Table 8.1
The extent and proportion of common and private land in 13 States is given in the
table above from which it appears that 60.46% is private land and 37.55% common
and forest land. Most tribal people and others who have been dependent on these
revenue and forest CPR were not included in official lists. Research studies of Dalli
Rajhara mines, Rajnandgaon district, Chhattisgarh, Hirakud dam in Orissa,
Nagarjunasagar dam in Andhra Pradesh and Dumbur dam in Tripura are examples of
non- inclusion of PAPs which has had devastating consequences for them. It is the
same for Dalits and other landless labourers who provided services and whose
livelihood has been lost due to land acquisition but who have not been included in the
list of DPs/PAPs.153
Report of the Committee on ‘State Agrarian Relations and the Unfinished Task- Land
Reforms’ set up by the Ministry of Rural Development, Government of India
indicates that approximately 4.3 million forest lands had been diverted to non-
forestry use during the period, from1952 to1976. Till 1976, forests was in the State
list and the State Governments were responsible for the management of forests and
after that mandatory consultation with Government of India in respect of diversion of
more than 10 hectares of land was introduced. From 1976 to 2008, 7.76 MH of forest
land was diverted and 55 per cent of this diversion took place after 2001. In
Chhattisgarh, 1.71 Lakh hectares of forest land was diverted during 1980 to 2003 of
which 67.22 per cent was for mining.
No Government consolidated data exists regarding private land acquired and CPR and
Forest land diverted. Researchers have diligently worked out estimates to show the
extent of the problem. Research studies have brought out that excess land has been
153 Fernandes and Chetri et al. ‘Progress: At whose cost?’ North Eastern Social Research Centre, Guwahati. 2012. Pg 18-23.

264
acquired for projects and there are agitations and demands for return of land to the
original owners. Policy makers need to understand the devastation caused to tribal
communities because of loss of land, CPR and forest and it is then that they will be
able to respond in a positive manner to the resistance of numerous tribal groups
throughout the tribal region against acquisition of their land and resources.
8.5 Analysis of DPs/PAPs in various states154
a. Andhra Pradesh
Table 8.5: Project-wise number of DPs/PAPs in Andhra Pradesh (1951-95)
S
o
u
r
c
e
:
F
e
r
n
a
n
d
e
s
W
a
l
t
R, D’Souza. Nafisa Goga, Choudhary Arundhuti Roy & Asif Mohammed, Development-Induced Displacement
In Andhra Pradesh 1951-1995: A Quantitative and Qualitative Study of its Extent and Nature, Indian Social
Institute, New Delhi and North Eastern Social Research Centre, Guwahati; 2001.
The highest number of displacement has been caused by dams.
Table 8.6: Distribution of DPs and PAPs by social group in Andhra Pradesh
Social group DPs % PAPs %
Dalits 2,67,766 16.7 1,08,238 20
Adivasis 12,23,709 76.1 12,17,770 59.6
OBC 1,15,590 7.2 4,18,364 20.5
General 334 0.02 438 0.02
Total 16,07,399 100 17,44,810 100.00 Source: Government records, research documents, press note& knowledgeable persons as cited in Andhra
Pradesh report, March 2009: 46, LAYA and Action Aid India; Note: This data includes both already displaced
and to be displaced
154 Based on data collated by Kujur, JM, Asst. Director, Indian Social Institute, Consultant to the Committee
Project No. of DPs / PAPs
Water 1865471
Industry 539877
Mines 100541
Power 87387
Defence 33512
Environment 135754
Transport 46671
Refugees NA
Farms NA
Hum Res. NA
Health NA
Admin/Office NA
Welfare 37560
Tourism 0
Urban 103310
Others 265537
Total 32,15,620

265
Data from the table reveals that Scheduled Castes and tribal people are the worst
sufferers by development projects, when compared to others. The table shows that
tribals are in majority among the displaced and project affected persons in Andhra
Pradesh. More than 60 per cent displaced by large dams in India belong to Scheduled
Tribes and Scheduled Castes, according to the India country study for the World
Commission on Dams.

266
b. Jharkhand
Table 8.7: Total and type of land acquired; extent of DPs/PAPs according to social group in Jharkhand, 1951-1995
Project
Type
Total no.
of
DPs/PAPs
No. of
DPs
(ST)
Total
no. of
DPs
(SC)
Others
(DPs)
Total no. of
DPs/PAPs
rehabilitated
No. of
rehabilitated
ST
Areas of
forest
Land
Acquired
Areas of
CPR
acquired
Areas of
private
land
acquired
Total areas
of land
acquired
Water
%
232,968
175,127
[75.2]
17,554
[07.5]
40,287
[17.3]
NA NA
48498 94808 364646 507952
Industry
%
87,813
29,888
[34.0]
19,956
[22.7]
37,969
[43.2]
NA NA
13435.91 63768.68 98525.59 175730.18
Mines
% 366,971
83,543
[29.6]
63,352
[15.7]
220,076
[54.6]
NA NA
174614.4 156341.19 184169 515124.59
Power 0 NA NA 894.04 2534.38 2598.45 6026.87
Defence
%
264,353
237,147
[89.7]
18,529
[07.0]
8,677
[03.2]
NA NA
78610.57 11134.93 22543.61 112289.11
Environment
% 507,734
80,867
[15.8]
87,601
[17.1]
339,266
[66.5]
NA NA NA NA NA
NA
Infrastructure
development
50,000
13,800
27.6
5,900
11.8
30,300
60.6
NA NA NA NA NA
NA
Urban NA NA NA NA NA NA
17882.43 8941.21 152000.65
178824.29
Misc.
Schemes
NA
NA
NA NA NA NA
Missing
scheme
NA
NA
NA NA NA NA
11150 113000 27550 50000
Total 15,48,017 6,20,372 2,12,892 6,76,575 70,820 21,000 3,45,085.35 3,48,828.39 8,52,033.3 15,45,947.04 Source : Data for DPs, type of land acquired and total number of Displaced ST, SC and other population: Database on Development-induced Displacement and Rehabilitation in Jharkhand 1951-1995,
Indian Social Institute 2000:67,95; Data for R&R : Lok Sabha Secretariat, No.30/RN/Ref./December/2013:2]

267
It can be observed that between 1951 and 1995, Jharkhand has lost 15,45,947 acres
(or 6, 25,889.47 hectares) of land. Out of the total land lost, 8,52,033.3 acres of
private land, 3, 48,828.3 acres of Common land and 3,45,085.35 acres of forest land,
have gone for various development projects in the State. Category wise, the above
table shows that most of the land (5,15,124.5 acres) has gone for mining activities,
followed by water resource projects (5,07,952 acres).
Approximately 15,48,017 people displaced or affected by various development
projects. Category wise mining projects have displaced and affected the most with a
total of 4,02,882 persons; ST constitute 40.07 per cent, SC 13.75 per cent and others
43.7 per cent.155
As mentioned earlier, the study by Walter Fernandes shows that by updating data the
estimates will increase to about 3 million DPs/PAPs in Jharkhand.What is of great
concern is that 74.74 percent of displaced persons were not rehabilitated and that tribal
displaced faced impoverishment.
c. Odisha
The table below shows that more than 23 lakh acres of land has been alienated in
Odisha. A major portion (65.33%) of the land (15,43,328.25 acres) has gone to water
resource projects. The table also shows that 41.81 per cent of all land acquired by
various development projects was private, 27.99 per cent was CPR, and 30.20 per
cent was forest land.
Water resource projects have caused the biggest displacements followed by mines.
Out of the total number of 1465909 DPs/PAPs, 42.02 per cent were Scheduled Tribes
and 12.10 percent were Scheduled Castes. Researchers conclude that Scheduled
Castes and Scheduled Tribes are peripheral to what is considered the mainstream
society and loss of assets, due to involuntary displacement marginalizes them
further.156
As mentioned earlier, Walter Fernandes in his study had pointed out that this data is
incomplete as it is for the period 1951-1995 and that by updating estimates, the figure
of DPs/ PAPs would increase to about 3 million.
155 Ekka and Asif, 2000, ‘Development- induced displacement and rehabilitation in Jharkhand, 1951- 1995: A Database on its
extent and Nature’ Indian Social Institute, New Delhi, pg. 95. 156 Fernandes and Asif, March, 1995. ‘Development- induced displacement in Odisha: A database on its extent and nature’.
Indian Social Institute. New Delhi, pg. 113.

268
Table 8.8: Total and type of land acquisition, DPs/PAPs and resettlement in Odisha
Source: Fernandes and Asif, March 1997: 84,112, 134, 135, Development-induced Displacement and rehabilitation in Odisha 1951 -1995: A Database on its extent and Nature, A study Funded by the
Indian Council of Social Science Research, Indian Social Institute.
*18, 29,121.45 acres of land have not been included in the total in which people have no access to NTFP (Fernandes & Asif 1997:84)
Project/Type
Total No. of
DPs/PAPs
Total no.
of ST
DPs/PAPs
Total no.
of SC
DPs/PAPs
Total no.
of DPs/
PAPs
(Other)
No. of
Displaced
(1951-95)
No. of DPs
resettled
(1951-95)
Total land
acquired
1951-95
(acres)
Areas of forest
Land 1951-95
(acres)
Areas of
CPR a1951-
95 (acres)
Areas of
private land
1951-95 (acres)
Water
8,00,000 3,08,370 80,321 411,309 3,25,000
90,000
(27.69 %) 15,43,328.25 31,6341.77 4,23,436.85 8,03,549.63
Industry
1,58,069 40,656 24,331 93,082 71,794
27300
(38.03) 1,06,626.54 9,168.82 34,521.65 62,936.07
Mines
3,00,000 1,50,000 45,000 1,05,000 1,00,000
60000
(60.00) 4,10,137.24 1,75,169.62 1,66,638.76 68,328.86
Power NA NA NA NA NA NA NA NA NA NA
Defence NA NA NA NA NA NA NA NA NA NA
Envt 1,07,840 81,090 16,050 10,700 NA NA NA NA NA NA
Miscel NA NA NA NA
50000
15540
(31.08) 302100 2,12,769.03 36,493.68 52,837.29
Others 1,00,000 36,000 11,740 51260
Total 1,465,909 6,16,116 1,77,442 6,71,351 5,46,794 1,92,840 23,62,192.03 7,13,449.24 6,61,090.94 9,87,651.85

269
There is a conflict between State and tribal communities in Odisha. The State is an
emerging steel producing hub in Asia and has attracted a number of steel companies
such as Pohang Iron and Steel Company (POSCO), Tata Steel, Mittal Steel, etc. to
invest in the State and to establish their production facilities. The establishment of
these industries and other development projects has brought tribal communities
directly into conflict with the State, sometimes with such brute force that ‘Kalinga
Nagar’ will remain in collective memory as one of the most violent instances of land
acquisition and involuntary resettlement.
d. Gujarat
The tables below reflect the extent of land acquisition and displacement in the State of
Gujarat. These figures are for the period up to 2004. Updated figures would be higher.
Table 8.9: Land acquisition, utilization and DPs/PAPs by project categories
S.L.
No Categories
Total land
acquisition
(ha)
Type of land utilized (in Ha)
Total land
utilized (ha)
Total no. of
DPs/PAPs family
Number of
DPS/PAPs Revenue Forest Govt.
1 Water Res. 19,18,392 19,21186 10,08,623 1,92,119 31,21,928 457,414 2378553
2 Industries 180228.62 1,80,296.1 94,655 18,030 2,92,981.1 27,101 1,40,924
3 Mines 7,063 7,063 3,708 706 11,477 794 4,127
4 Non-Hydel 16,287.32 16,925.88 8,886 1,693.00 27,504.88 2,181 11,344
5 Defence 6,791.19 6,872.38 3,608.00 687.00 11,167.38 475 2,471
6
Envt
Protection 1,848.13 1,848.13 970.00 185.00 3,003.13 504 2,620
7
Trans &
Comm. 7,19,802.49 7,20,016.5 3,78,009 72,002 11,70,027.5 2,60,784 13,56,076
8 Human res 70,425.44 70,425.44 36,973.00 7,043.00 1,14,441.44 3,143 16,342
9 Farm & fish 3,745.99 3,745.99 1,967.00 375.00 6,087.99 1,374 7,141
10 Urban Devt 1,36,917.84 1,36,917.80 71,882.00 13,692.00 2,22,491.8 16,387 85,213
11 Refugee res 869.34 869.34 456 87 1,412.34 124 645
12
Social
welfare 30,387.01 30,387.02 15,953.00 3,039.00 49,379.02 3,936 20,470
13 Tourism 625.42 625.43 328 63 1016.43 124 645
14 Govt. Offices 21,712.44 21,712.45 11,399.00 2,171.00 35,282.45 1,431 7,441
Unknown 7,517.11 7,636.49 4,009.00 764.00 12,409.49 2,972 15,453
Total 31,22,613 31,26,528 16,41,426 3,12,656 50,80,610 7,78,744 40,49,465 Source: Lobo and Kumar 2009:95, 98.
Gujarat has acquired an estimated 19,18,392 hectares (47,40,449.87 acres) of land
under the Land Acquisition Act for various water resource projects since 1947 to
2004. An estimated 10,08,623 hectares (24,92,361.712 acres) forest land and
19,21,186 hectares (47,47,353.994 acres) of Government land have been utilized by

270
water resource projects in the State. Majority of the land has been utilized by major
water resource projects.157
Table 8.10: Social background of DPs/PAPs in Gujarat
State Tribals Dalits Other Total
Gujarat 18,21,283 4,62,626 17,91,142 40,75,051
Percentage 44.69 11.35 43.96 100
Source: Lobo and Kumar 2009
Table 8.10 gives the social background of the displaced and project affected people in
the State of Gujarat. Out of total number of 40,75,051 displaced and project affected
people, tribals are the majority among DPs/PAPs (44.69 per cent) and are the worst
sufferers. Field study of 2004 shows that displaced tribal people faced extreme
poverty and were forced to work as labourers in adjoining areas or seasonally migrate
and that they were exploited by money- lenders.158
e. Chhattisgarh
The data in the Table below is based on gazette notifications in Madhya Pradesh prior
to its bifurcation. This data reveals that development projects in Bilaspur acquired the
highest amount of land that is 54,928.6 (35.65%) acres of the entire land acquired in
Chhattisgarh during 1982-90 and 1991-07.159
157 Lobo, Lancy and Kumar S. 2009. Land Acquisition, displacement and resettlement in Gujarat: 1947- 2004. New Delhi. Sage. 158 Ibid. 159 Kujur, J. M. 2008. ‘Development- induced Displacement in Chhatisgarh: A Case study from a tribal perspective’ in Social
Action. Volume 58. January – March 2008.
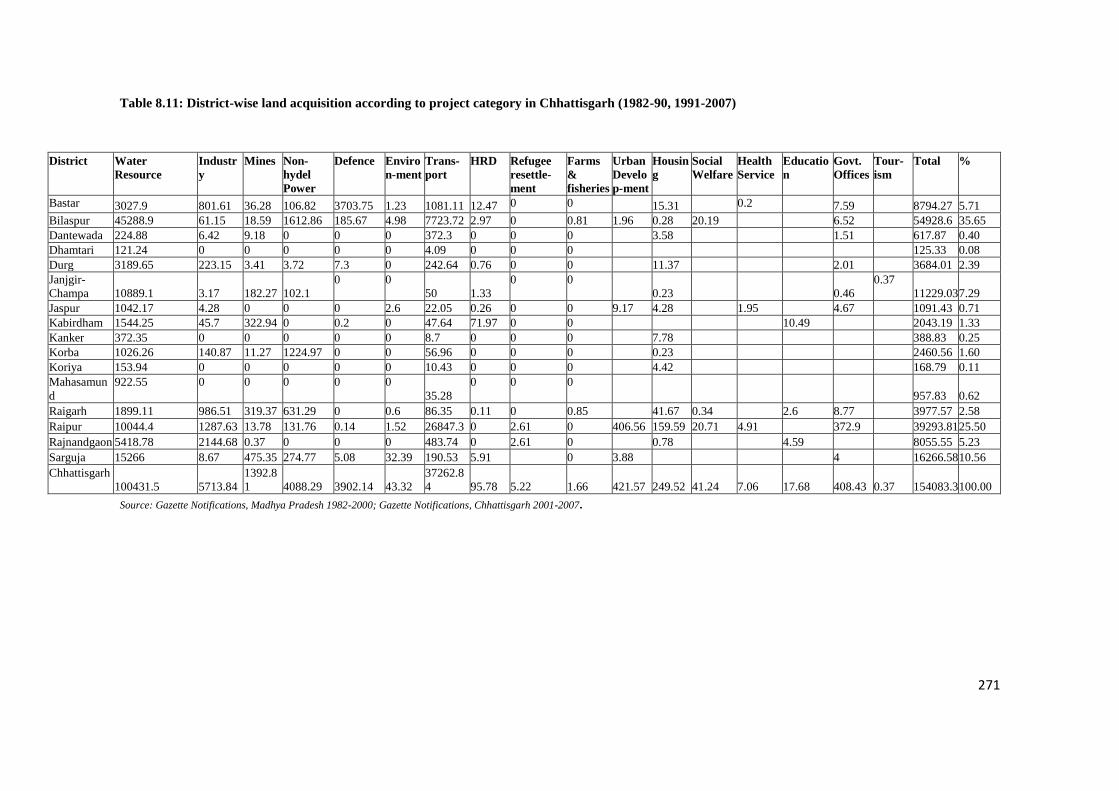
271
Table 8.11: District-wise land acquisition according to project category in Chhattisgarh (1982-90, 1991-2007)
Source: Gazette Notifications, Madhya Pradesh 1982-2000; Gazette Notifications, Chhattisgarh 2001-2007.
District Water
Resource
Industr
y
Mines Non-
hydel
Power
Defence Enviro
n-ment
Trans-
port
HRD Refugee
resettle-
ment
Farms
&
fisheries
Urban
Develo
p-ment
Housin
g
Social
Welfare
Health
Service
Educatio
n
Govt.
Offices
Tour-
ism
Total %
Bastar 3027.9 801.61 36.28 106.82 3703.75 1.23 1081.11 12.47 0 0 15.31 0.2 7.59 8794.27 5.71
Bilaspur 45288.9 61.15 18.59 1612.86 185.67 4.98 7723.72 2.97 0 0.81 1.96 0.28 20.19 6.52 54928.6 35.65
Dantewada 224.88 6.42 9.18 0 0 0 372.3 0 0 0 3.58 1.51 617.87 0.40
Dhamtari 121.24 0 0 0 0 0 4.09 0 0 0 125.33 0.08
Durg 3189.65 223.15 3.41 3.72 7.3 0 242.64 0.76 0 0 11.37 2.01 3684.01 2.39
Janjgir-
Champa 10889.1 3.17 182.27 102.1
0 0
50 1.33
0 0
0.23
0.46
0.37
11229.03 7.29
Jaspur 1042.17 4.28 0 0 0 2.6 22.05 0.26 0 0 9.17 4.28 1.95 4.67 1091.43 0.71
Kabirdham 1544.25 45.7 322.94 0 0.2 0 47.64 71.97 0 0 10.49 2043.19 1.33
Kanker 372.35 0 0 0 0 0 8.7 0 0 0 7.78 388.83 0.25
Korba 1026.26 140.87 11.27 1224.97 0 0 56.96 0 0 0 0.23 2460.56 1.60
Koriya 153.94 0 0 0 0 0 10.43 0 0 0 4.42 168.79 0.11
Mahasamun
d
922.55 0 0 0 0 0
35.28
0 0 0
957.83 0.62
Raigarh 1899.11 986.51 319.37 631.29 0 0.6 86.35 0.11 0 0.85 41.67 0.34 2.6 8.77 3977.57 2.58
Raipur 10044.4 1287.63 13.78 131.76 0.14 1.52 26847.3 0 2.61 0 406.56 159.59 20.71 4.91 372.9 39293.81 25.50
Rajnandgaon 5418.78 2144.68 0.37 0 0 0 483.74 0 2.61 0 0.78 4.59 8055.55 5.23
Sarguja 15266 8.67 475.35 274.77 5.08 32.39 190.53 5.91 0 3.88 4 16266.58 10.56
Chhattisgarh
100431.5 5713.84
1392.8
1 4088.29 3902.14 43.32
37262.8
4 95.78 5.22 1.66 421.57 249.52 41.24 7.06 17.68 408.43 0.37 154083.3 100.00

272
Table 8.12 below shows the land acquisition for different categories of development
projects in the State of Chhattisgarh before and after its formation in 2000.
Table 8.12: Land acquisition by project category in Chhattisgarh (1982-90,
1991-2007) (in acres)
S. N. Project Category 1982-1990 % 1991-07 % Total %
1 Water Resources 49001.96 96.05 51429.54 49.90 100431.5 65.18
2 Industry 279.73 0.55 5434.11 5.27 5713.84 3.71
3 Mines 62.05 0.12 1330.76 1.29 1392.81 0.90
4 Non-hydel Power 5.25 0.01 4083.04 3.96 4088.29 2.65
5 Defence 3.74 0.01 3898.4 3.78 3902.14 2.53
6 Environment
Protection
39.23
0.08
4.09
0.00
43.32
0.03
7 Transport 1480.6 2.90 35782.24 34.72 37262.84 24.18
8 HRD 0.11 0.00 95.67 0.09 95.78 0.06
9 Refugee Resettlement 5.22 0.01 0 0.00 5.22 0.00
10 Farms & Fisheries 0 0.00 1.66 0.00 1.66 0.00
11 Urban Development 39.68 0.08 381.89 0.37 421.57 0.27
12 Housing 57.34 0.11 192.18 0.19 249.52 0.16
13 Social Welfare 0.34 0.00 40.9 0.04 41.24 0.03
14 Health 0 0.00 7.06 0.01 7.06 0.00
15 Education 9.9 0.02 7.78 0.01 17.68 0.01
16 Govt. Offices 31.41 0.06 377.02 0.37 408.43 0.27
17 Tourism 0 0.00 0.37 0.00 0.37 0.00
Chhattisgarh 51,016.56 100.0 1,03,066.7 100.00 1,54,083.3 100.00 Source: Gazette Notifications, Madhya Pradesh 1982-2000; Gazette Notifications, Chhattisgarh 2001-2007.
Compiled by Kujur,J.M.
When the two time periods of the above study, namely 1982-90 and 1991-2007 are
compared one finds that, while 96.05 percent of the water projects were notified in the
decades of the 1980s, only 49.90 percent of the water resource projects were notified,
from 1990s till date. However, whereas industry projects were only 0.55 percent
during 1982-90, they are much higher now with 5.27 percent. Similarly, there was a
jump in the non-hydel power projects as well from 0.01 percent in 1982-90 to 3.96 in
1991-07. A similar increase was very sharp in transport and communication sector
from 2.90 percent in 1982-90 to 34.72 percent during 1991-07. Even in the category
of mine projects, an increase can be seen from 0.12 percent during 1982-90 to 1.29
percent in 1991-07.160
There is a clear shift from the past to the present. However, the above data is only an
indicator of the process of industrialization that is taking place now.
160 Ibid.

273
Displacement in Chhattisgarh due to conflict
One of the reasons for displacing tribal people is conflict between the Maoist and
Governments (both centre and State) and ‘Salwa Judum’, a State sponsored armed
campaign that was launched to combat Maoists. Though it is argued that Salwa Judum
was a spontaneous reaction of the civilians to the Maoists, there are evidences to show
the hand of the State machinery in the whole process. Shri. K. S. Subramanian, a
former Director General of Police, was quoted as saying-
“While official sources maintain that the campaign, led by a local legislator, is hugely
successful with the tribal people joining it in large numbers, local enquiries revealed a
different picture. In the name of Salwa Judum, the tribal people are being forced to join a far
from spontaneous mobilization [sic]… Hundreds have been killed on both sides. A large area
of land remains uncultivated; tribal people who are meant to work on the land have deserted
the villages and are living under open skies and are starving. A vast amount of corruption has
crept in as a result of this misconceived campaign with the Ruling party spending huge
amounts on it.”161
During the visit of HLC to Bastar, NGO representatives had narrated the problem of
innocent tribal villagers being caught between security forces and Left Wing
Extremists and claimed that thousands of villagers had been displaced as a result of
counter-insurgency movements many had been forced to migrate and that one lakh
tribal people were missing. Neither the Central nor the State Government monitors the
number of people displaced due to conflict.. Whatever data is available on the
displaced persons in Chhattisgarh concentrates only on displacement caused by Salwa
Judum from 2005 to 2007. Based on number of camp residents staying as on
21/1/2007 in twenty camps located in 11 Blocks of three districts it has been surmised
that 47238 persons were affected by Salwa Judum. Researchers feel that this may not
give the total picture Out of 1354 villages in undivided Dantewada district, 644
villages were affected by Salwa Judum.162 In addition 20,000 tribal people have fled
to the forests of Andhra Pradesh as mentioned in the report of The Internal
Displacement Monitoring Centre of the Norwegian Refugee Council.
The State government should collect data of tribal people affected by conflict and take
up measures to ensure that displaced people are resettled and rehabilitated in their
villages and it is the responsibility of the State to provide security and promote peace
between those who joined Salwa Judum and those who did not. The tribals who were
displaced, due to the conflict should not face alienation of their land.
161 Ibid. 162 Sundar, Nandini. 2010. Pleading for Justice, Seminar, 607. Available at http://www.india-
seminar.com/2010/607/607_nandini_sundar.htm

274
f. Madhya Pradesh
Table 8.13: Land Acquisition, displacement and R&R data, Madhya Pradesh
S.N. Details Information received on 14
March 2014
ST Other Total
1 No. of persons displaced 28718 68878 97596
2 No. of families displaced NA NA NA
3 No. of displaced persons rehabilitated/resettled 27380 66020 93400
4 No. of displaced families rehabilitated/resettled NA NA NA
5 No. of displaced persons given land under R&R 5344 1912 7256
6 No. of displaced families given land under R&R NA NA NA
7 Total area of land given in hectares under R&R to 8411.66 3192.1 11603.8
8 No. of displaced persons employed as casual labour as part
of R&R
219 243 462
9 No. of persons given jobs as part of R&R 75 52 127
10 Areas acquired in hectares from 8923.333 58863.58 68490.23
11 Area of CPR acquired in hectares NA NA NA
12 Areas of Forest land acquired in hectares NA 12670.9 16062.32
13 Reason for not giving title deed for land settled as homestead
plot with displaced family as part of R&R
NA NA NA
Source: Additional Director, Tribal Area Development Planning, Bhopal, 24 March 2014.
The table indicates that the total area of land acquired by different projects in Madhya
Pradesh is 68,490.23 hectares, out of which 8,923.33 hectares have been taken from
Schedule Tribes. Similarly, the areas of forest land acquired are 16,062.32 hectares.
Out of total 97,596, the number of Scheduled Tribes displaced is 28,718.
The data of the State Government does not indicate the period for which data has been
given nor does it give the complete picture of PAPs. No information has been given of
CPR acquired and data of forest land diverted is also incomplete. There is a need for
the State, to gather complete data in order to compensate people displaced,
particularly tribal displaced as they are affected most with loss of forest resources.
Moreover, the data reveals that tribals have not been adequately compensated for their
loss of capital resource-land and the number of jobs given does not fully compensate
loss of livelihood.
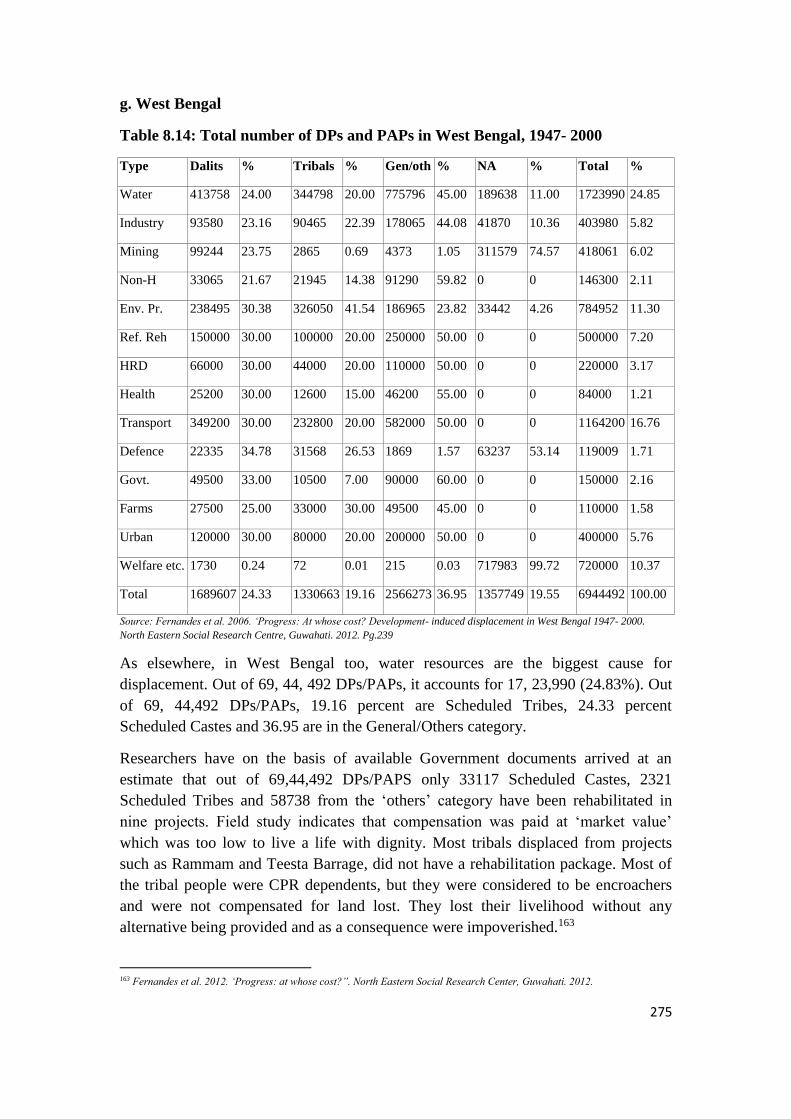
275
g. West Bengal
Table 8.14: Total number of DPs and PAPs in West Bengal, 1947- 2000
Type Dalits % Tribals % Gen/oth % NA % Total %
Water 413758 24.00 344798 20.00 775796 45.00 189638 11.00 1723990 24.85
Industry 93580 23.16 90465 22.39 178065 44.08 41870 10.36 403980 5.82
Mining 99244 23.75 2865 0.69 4373 1.05 311579 74.57 418061 6.02
Non-H 33065 21.67 21945 14.38 91290 59.82 0 0 146300 2.11
Env. Pr. 238495 30.38 326050 41.54 186965 23.82 33442 4.26 784952 11.30
Ref. Reh 150000 30.00 100000 20.00 250000 50.00 0 0 500000 7.20
HRD 66000 30.00 44000 20.00 110000 50.00 0 0 220000 3.17
Health 25200 30.00 12600 15.00 46200 55.00 0 0 84000 1.21
Transport 349200 30.00 232800 20.00 582000 50.00 0 0 1164200 16.76
Defence 22335 34.78 31568 26.53 1869 1.57 63237 53.14 119009 1.71
Govt. 49500 33.00 10500 7.00 90000 60.00 0 0 150000 2.16
Farms 27500 25.00 33000 30.00 49500 45.00 0 0 110000 1.58
Urban 120000 30.00 80000 20.00 200000 50.00 0 0 400000 5.76
Welfare etc. 1730 0.24 72 0.01 215 0.03 717983 99.72 720000 10.37
Total 1689607 24.33 1330663 19.16 2566273 36.95 1357749 19.55 6944492 100.00
Source: Fernandes et al. 2006. ‘Progress: At whose cost? Development- induced displacement in West Bengal 1947- 2000.
North Eastern Social Research Centre, Guwahati. 2012. Pg.239
As elsewhere, in West Bengal too, water resources are the biggest cause for
displacement. Out of 69, 44, 492 DPs/PAPs, it accounts for 17, 23,990 (24.83%). Out
of 69, 44,492 DPs/PAPs, 19.16 percent are Scheduled Tribes, 24.33 percent
Scheduled Castes and 36.95 are in the General/Others category.
Researchers have on the basis of available Government documents arrived at an
estimate that out of 69,44,492 DPs/PAPS only 33117 Scheduled Castes, 2321
Scheduled Tribes and 58738 from the ‘others’ category have been rehabilitated in
nine projects. Field study indicates that compensation was paid at ‘market value’
which was too low to live a life with dignity. Most tribals displaced from projects
such as Rammam and Teesta Barrage, did not have a rehabilitation package. Most of
the tribal people were CPR dependents, but they were considered to be encroachers
and were not compensated for land lost. They lost their livelihood without any
alternative being provided and as a consequence were impoverished.163
163 Fernandes et al. 2012. ‘Progress: at whose cost?”. North Eastern Social Research Center, Guwahati. 2012.
276
h. Northeastern States
The processes of land alienation
Traditionally, this region had a three-tier land ownership and control system: first,
community land; second, individual land; and third, clan land. Every community had
well-defined boundaries and traditional administration systems based on customary
law. There were definite rules on who could cultivate what land and in which season
and generally was controlled by the village council made up of men alone.164
Changes have been conditioned both by external forces and internal dynamism. Land
has become a marketable commodity, its exchange happens both within and outside
the community. Internal transfer of land or mortgage has resulted in inequalities in its
distribution and control. Such internal disparity is one form of land alienation within
the community. Among several causes of land alienation within the community, the
most important is the growing indebtedness, because of the need for money for
medical care and education.165
The external cause of land alienation is the high demand for land for development
projects. The second demand comes from the immigrants who encroach on tribal land.
Development projects, especially major dams, being planned in the region, will put
pressure on tribal land. A consequence of these processes is shortage of land and
ethnic conflicts around it.166
State action of acquisition of land, migration of outsiders and occupation of tribal
lands are among the major processes, resulting in tribal people losing control over
their land.
Development-induced displacement
Development projects are one of the main causes of tribal land alienation, for
example the National Highway 37 that changed the scene completely. The land used
for the bypass near Guwahati, including the Games Village, was once the basis for
tribal livelihood. Several tribes, especially the Karbi, Tiwa and Garo were earlier
found in sizeable numbers in these areas. Dubious means were used by the State and
contractors to lure the original occupants to part with their land. Karbis in and around
Ganeshpur-Dispur area lived off the land that was fertile and yielded abundant fruit.
This fertile area today has been privatised and lost forever.167
Another example is that of 20,000 MHz Siang Dam in Arunachal Pradesh, which has
submerged the habitat of tribal people, affecting their lives adversely. Laws have
made Forests State property leading to loss of access to forest on which tribal people
depended for livelihood. The amendment of the Assam Land Reforms and Land
164 Shimray, U.A. 2006. ‘Tribal land alienation in North- East India: Laws and land relations’. Guwahati: Indigenous Women’s Forum of North East India and North Eastern & North Eastern Social Research Centre, 2006. 165 Ibid. 166 Ibid. 167 Ibid.

277
Regulations Act, 1886, in 1947 has gone against tribal people, because it facilitates
manipulation of records. Land grabbers have become more active, after it came into
effect, resulting in only 25 of the 35 belts and blocks remaining under the tribes.168
A perennial problem in Assam is river bank erosion by the Brahmaputra. It has eaten
up more than 700 villages in the last two decades. However, when a stronger
community is affected, it usually encroaches on the land of a weaker group and in this
case tribal land. Such processes that affect all communities have a more serious
impact on tribals than on others.169
The resettlement of external refugees has caused many internal refugees. Mizoram
had been hosting temporarily, a Burmese population of 70,000 to 1,00,000 people,
who had fled political repression and military oppression. By the end of 1957, 53,318
refugee families had settled in Tripura, out of which, 43,322 families settled down in
rural areas (Report of the Administration of the Union Territory of Tripura for the
year 1957-58). Since a large number of refugee families were settled in agriculture, it
put pressure on agricultural land and eventually put pressure on areas reserved for
tribals, which were used by them for Jhum cultivation.170 There was, therefore,
resentment in Tripura, where Bangladeshi Hindu immigrants had occupied more than
60 per cent of the tribal land by 1970. The tribal displaced were not able to defend
their livelihood although these lands were CPR, according to their customary law but
land laws recognized only individual ownership. Researchers point out that further
diversion of CPR through displacement for the Dumbur dam in the 1970s resulted in
the insurgency.171
A field study conducted in Assam shows that out of 19,18,874 DPs/PAPs displaced in
the period (1947- 2000), 416321 (21.80 per cent) were tribal DPs/ PAPs. Researchers
have estimated that 14,05,192.92 acres have been acquired/ diverted for projects, out
of which 28.05 per cent is private land, 55.65 per cent is CPR, for 16.30 per cent the
type of land was not available. Tribal and other poor DPs/ PAPs, dependent on CPR
for livelihood were not compensated.172
168Ibid. 169Ibid. 170 Bhattacharya, C. 1988 ‘Refugee Rehabilitation and its impact on Tripura’s economy’. Omsons Publications, New Delhi 171 Bhaumik, Subir. 2003. ‘Tripura’s Gumti Dam must go’ in Fernandes and Bharali, Gita ‘Uprooted for Whose benefit?’. North
Eastern Social Research Centre, Guwahati, 2011. 172Fernandes and Bharali. 2011. ‘Uprooted for Whose Benefit? Development- induced displacement in Assam 1947-2000. North
Eastern Social Research Centre, Guwahati. 2011.

278
Displacement in the Northeast due to conflicts
The Northeastern States have witnessed a series of armed conflict and violence, since
India’s independence in 1947, which have caused massive internal displacement, of
hundreds of thousands of people. The region has also received a steady flow of
refugees from neighbouring East Pakistan/Bangladesh, Tibet and Myanmar. In fact,
immigration has reduced the number of tribal communities, to a minority in some
parts of the region. Though, the Sixth Schedule of the Constitution has become a
major tool to provide protection to tribal people in Northeastern States, the problem
lies in the fact that many of these groups do not live in distinct areas and their demand
for ethnic homeland often overlap with other groups. As a result, their demand for
homeland leads to conflict and violence, which has, in turn caused internal
displacement. In Manipur, (1992) the conflict between Kukis and Nagas displaced
11,000 population including Kukis and Nagas from their particular places. Mizoram
also experienced ethnic violence between Kukis/Paites in 1997 and this led to
displacement of 62,880 persons. Bru tribals were displaced for years.
Immigration has come to be linked closely to land, because of the influx of labourers
from outside the region. Often these labourers are treated as ‘outsiders’ by the local
community, in the controversy of indigenous versus non-indigenous population. The
tea garden workers, who are originally from the central tribal belt, demand
recognition as a tribal group which is vehemently opposed by the local community.173
Migration to western Assam from East Bengal, now Bangladesh, began in the 1920s,
as a deliberate British policy to settle people on waste land; this created a problem as
the Boro depended on that land for livelihood. Post-1947 era has witnessed an influx
of immigrants from the Hindi speaking regions of North India and from Bangladesh
in search of a livelihood. Till 1947, only Assam and to some extent, Tripura
experienced immigration from outside the region. Today, most States of the region
have to face this problem. It is difficult to make an estimate of the exact number of
immigrants, especially of the Bangladeshi, because of political reasons.174
The conflicts in this region are mostly linked to land alienation, due to influx of
outsiders as people are fighting for natural resources in the same geographical space.
A study of Guwahati University showed that a large number of youth, who joined
militant groups had employment as one of the motives.175 During the visit of the
Committee to Assam, NGOs representing tribal interests expressed their angst that if
nothing was done to stop the influx of outsiders, they would be doomed and vanish as
a community. In this background, State inaction in solving problems of tribal people
173 Fernandes and Pereira, M. 2005. ‘Changing Land Relations and ethnic conflicts: The case of North- Eastern India’. North
Eastern Social Research Centre. Guwahati. 174Ibid.

279
of the region has led to tribal people losing control over land and community
resources and resultant displacement.
The State Government should be proactive in protecting the interests of tribal people
and in preventing alienation of their resources, in tribal land restoration, poverty
alleviation and human resource development. The problem of unemployment has to
be addressed. Tribal communities should be made participants in the processes of
development.
8.6 Alienation of Tribal Land by Non-tribals
In spite of Constitutional safeguards and State Schedule Area Regulations and
Tenancy laws for the protection of tribal land there is a continuous process of land
alienation by non-tribals in connivance with the instruments of the State.
Case Study
Kamal K. Mishra’s ‘Study of alienation of tribal lands in Scheduled V Areas (2002)176
of Andhra Pradesh, undivided M.P. and Odisha is a comprehensive study of tribal
land alienation. The study revealed that 1,396 tribal households out of the 6,358
sample households (21.95 percent) had lost 6185.5 acres of their land constituting
24.69 percent of the total tribal land in villages under study between1999-2000.
Tribal to tribal transfer of land accounted for 14.04 percent, while tribal to non-tribal
transfer was 85.95 percent. The study showed that prolonged indebtedness of the
tribal households was the main cause of tribal land alienation. This has happened in
spite of a slew of pre-independence and post-independence legislative safeguards
against tribal land alienation.
Mishra’s study highlights that tribals were less politically organized and unaware of
their Constitutional rights. More than 85 percent did not know that there were laws
against transfer of tribal land. Most of the surveyed households earned less than
Rs.5000/- per annum. With the depletion of the forests and access to CPRs, they had
become more dependent on purchase of house construction materials like bamboos/
tiles from the market. About 82.11 per cent of tribal households surveyed were in
debt. Unwanted urbanization and industrialization in tribal areas, led to land scarcities
and land alienation. Expansion of easy communication facilities to tribal areas has led
to influx of non-tribals from outside leading to increased land-alienation among the
tribals. This study identifies the methods by which lands are transferred from the
tribal landowner to another tribal or to a non-tribal person. There are eight different
methods adopted by the land transferees in the study villages, namely by (i) sale, (ii)
mortgage, (iii) benami transfer, (iv) forcible occupation, (v) oral transfer of
176Misra, K.K. 2002. ‘Andhra Pradesh, Madhya Pradesh (undivided) and Odisha: A study of land alienation of tribal lands in
Schedule V Areas. Hyderabad. 2002.

280
possession, (vi) marital alliance, (vii) in the name of concubines, and (viii) by other
fraudulent means. Indebtedness on account of religious and social obligations and
expenses on litigation, medical treatment and alcoholism has further accentuated the
problem of tribal land alienation. The study mentions the apathy and insensitive
attitude of officials handling land issues of tribals. All these factors with penetration
of market forces in tribal areas were threatening to dispossess tribals of their land
resources, on as large a scale through land alienation as development-induced
displacement. The study also made detailed recommendations about loopholes in the
law that needed to be plugged and the need for monitoring, providing legal aid and
creating awareness.177
State-wise position of cases filed for restoration of tribal land
State Governments are required to take legal action to restore land to tribal people in
Scheduled Areas, to monitor disposal of cases and provide legal aid. The table below
gives the State -wise position regarding cases.
177Ibid.

281
Table 8.15: State-wise information on alienation and restoration of tribal lands
Sl.N
o.
State No. of cases
filed in court
Area Cases
disposed
of by
Court
Area Cases
rejected
Area Cases
decided in
favour of
STs
Area Cases in
which land
was restored
to STs
Area Cases
Pendin
g in
Court
Area
1 Andhra 65,875 287,776 58,212 256,452 31,737 150,227 26,475 106,225 23,383 94,312 7,663 31,324
2 Assam 2,042 4,211 50 19 - - 50 19 50 19 1,992 4,192
3 Bihar 86,291 104,893 76,518 95,151 31,884 49,730 44,634 45,421 44,634 45,421 9,773 9,742
4 Chhattisgarh 47,304 NR 46,807 NR NR NR 21,348 43,803 21,269 43,620 79 181
5 Gujarat 20,704 75,966 19,819 73,317 497 1,353 19,322 71,965 376 1,942 885 2,649
6 Jharkhand 5,382 4,002 1,362 NA 283 NA 1,079 860 1,079 860 4,020 NA
7 Karnataka 42,582 130,373 38,521 115,021 16,687 47,159 21,834 67,862 21,834 67,862 4,061 15,352
8 Madhya
Pradesh.
53,806 158,398 29,596 97,123 29,596 97,123 NR NR NR NR 24,210 61,275
9 Maharashtra 45,634 NR 44,624 99,486 24,681 NR 19,943 99,486 19,943 99,486 1,010 NR
10 Orissa 105,491 104,742 104,644 103,556 43,213 46,677 61,431 56,879 61,364 56,854 847 1,186
11 Rajasthan 2,084 6,615 1,257 3,978 53 187 187 587 187 587 1,067 2,355
12 Tripura 29,112 25,441 9,040 7,269 20,043 18,131 9,040 7,269 8,945 7,165 95 104
Total 506,307 902,417 430,450 851,372 198,674 410,587 225,343 500,376 203,064 418,128 55,702 128,360
Total in hectares 365,351 344,685 166,129 202,581 169,283 51,968
Source: Annual Report 2007-08, Department of Land Resources, p.276

282
The above table gives State-wise details of progress made in cases filed under the
State laws for restoration of alienated land. The table shows that 506,307 cases of
tribal land alienation had been filed, which covered land area of 9,02,417 acres, out of
which 2,25,343 cases, were decided in favour of tribals with an area 5,00,376 acres
land. The total number of cases rejected by the Courts on various grounds are 1.99
lakh, covering an area of 4.11 lakh acres. The high proportion of cases rejected is a
cause of concern and could be due to loopholes in law and apathy, or connivance of
State machinery. Odisha has the highest number of filed cases in the court, which is
around 1,05,491. The performance of Madhya Pradesh is dismal, as no case of
disposal in favour of the tribals has been reported. In Gujarat, there is a huge gap
between the number of cases-1,93,22 decided in favour of restoration and the number
of cases- 376 in which land was restored. This could be deliberate or due to stay
orders given by Appellate Court.
The above data gives an idea of cases that have been filed and shows that the progress
of restoration of tribal land is not satisfactory. Moreover, there may be many instances
of land alienation, for which cases have not been initiated. The Committee on ‘State
Agrarian Relations and the Unfinished Task- Land Reforms’ set up by the
Government of India has observed that the ‘ process of restoration of alienated land is
worse than alienation’ and further notes that, the ‘Courts, bureaucrats and mostly
public men, are often formidably interlocked against the tribals.’
There is a need for the State to be proactive in restoring land to tribals for ensuring
fast disposal of cases and proactive in plugging loopholes in tenancy laws, removing
ambiguities in law and in modifying Survey and Settlement procedures to take into
account tribal interests and particularly being vigilant to prevent instruments of the
State from conniving with the unscrupulous for defrauding tribal people of their land.
Further, States need to take action to suitably amend tenancy laws to empower Gram
Sabhas in Schedule V areas to protect tribal land. Priority should be given to tribal
people in settlement of Ceiling surplus land and wasteland, as they are primarily
agriculturists and land fragmentation leading to small holdings, loss of land due to
acquisition and illegal alienation is a factor for their enforced migration for economic
survival.
Case Study of Tribal land alienation by corporate houses in Chhattisgarh
A case study based on field study conducted by Stanislaus Tirkey, Secretary, CBCI
Tribal Affairs, Delhi, has brought to light several cases of land alienation by corporate
sector, for example 90 acres of tribal land has been acquired for Gulu Hydroelectric
Power Private. Ltd. in Manora Block of Jashpur (Chhattisgarh). According to the
researcher, cheques for 31 affected families were given fraudulently, under the pretext
of bonus for farmers in a so-called Kisan Mela at Manora block. People were unaware
about the compensation given to them. The project affects 22 villages around Gulu,

283
Jhargaon, Matlonga and Alori. Information collected through RTI by researchers,
reveal that the consent of the actual Gram Sabha was not obtained as per provisions of
PESA.
Similarly, tribal land was acquired from 38 farmers for Loker Dam in the name of a
Gram Sabha. Researchers have stated that the minutes book and records of
Panchayats of Rede, Saraitola, Bangaon B, Pemla, Jamargi B, Chiknipani
(Karradanr), Loker and Godhi, show that no Gram Sabha meeting has ever taken
place to approve the project. This project will affect nine Panchayats in the area.
The case study reveals that Avantha Group has acquired 43.7 hectare of tribal land in
the name of eight tribals in Pusaur in Raigarh district:
Sharda Energy and Minerals Limited has purchased the entire tribal land in
Kerkachhar village of Baloda block in Janjgir-Champa in the name of only three
tribals. One Jaykumar Paraste has bought 24 hectares of land worth 2.84 crores from
35 tribals. However, no one knows the whereabouts of Paraste. Videocon bought 28
hectares of agricultural land worth 3.36 crore in the tribal villages of Gond and
Gadpali in Janjgir Champa to set up 1,200 MW power plant. It bought land in the
name of Bilam Singh from Kabeerdham.
Further, the case study indicates that Government land records show at least 1,981
cases of transfer of tribal land to non-tribals in the past three years. In Mahasamund,
150 cases of such kind were recorded for investigation by the Commissioner in 2011.
In Bastar, a Scheduled Area district, 63 cases of tribal land transfers to non-tribals,
were registered.
According to a 1964 Act that is in force in Chhattisgarh, a non-tribal may not buy a
tribal land; he can only do so with the permission of the Collector and the
Commissioner. Therefore, researchers have raised the question as to how tribal land,
on such a large scale has been alienated. Further, there have been violations of PESA
which endow Gram Sabha “the power to prevent land alienation of land in the
Scheduled Areas and to take appropriate action to restore any unlawful alienated land
of a Scheduled Tribe.”
The case study reveals that people have started organizing themselves to protect
natural resources and resources of their livelihood under the banner of Jashpur Jan
Sangharsh Samittee, Jashpur and Chhattisgarh Visthapan Virodhi Manch, Raipur
against the unconstitutional and illegal way of exploring minerals and alienating tribal
land in the name of development and thereby destroying their traditions and
distinctive cultures and disrupting well-knit communities. It is clear that all this is
taking place with the connivance of official machinery.
In such specific cases as brought out by the case study, the State should get the matter
enquired and take action for restoration and prevent further tribal land alienation.
NGO support in such cases is invaluable.

284
8.7 Impact of Migration on Tribal Communities
Deficiencies in NSSO/ Census Data
The main sources of data on migration are the Census of India, Office of the Registrar
General and the National Sample Survey. Both these data do not throw full light on
seasonal and circular migration and do not capture various forms of child labour.
Smaller studies show that child migrants from families of weaker sections such as
from tribal communities form a large part of the work force in several sectors such as
construction, brick- kilns, small industries, domestic work etc.
The 55th round of NSSO was the first to cover short- term duration migration.
The Registrar General of India, Dr. C. Chandramouli while commenting on increase
in urban growth indicated in Census 2011, made it clear
‘ ........This would suggest migration as a significant factor in urban growth. But what kind of
migration we can only ascertain or comment on when their patterns emerge more clearly. The
Census in itself is not structured to capture short- term or footloose migration’.178
It is recommended that Census capture seasonal/ circular migration data social group-
wise.
An Analysis of Social Groups and Migration
In 2001, for the first time, the census data tabulated figures for social groups such as
the SCs and STs in the country. The migration level among SCs and STs indicates
that about 25.3 per cent of SCs and 25.4 per cent of STs were reported as migrants
within the same State, based on the place of last residence (PLR). Of the total migrant
population within the State, more than three fourths were reported to move within the
district (intra-district-76.9 per cent for SCs and 83.5 per cent for STs).
An analysis of the NSSO data for the 49th round (9 Jan- June 1993) and 64th round
(July 2007- June2008) shows that the proportion of migrant households among ST in
rural areas decreased between 1993 and 2007- 08, but the trend was the opposite in
urban areas. The NSS 64th round shows that in urban areas, the proportion of ST
migrant households was higher than the proportion of migrant households of other
social groups.
Causes for tribal migration
Migration-poverty interface
There are three important constraints that perpetuate poverty among migrants in the
Indian situation. These are: poor education, discrimination, and a hostile policy
178 Quoted in ‘Exploring Rural- Urban dynamics: A study of Inter- State migrants in rural Gurgaon’. March, 2014. Society for
Labour and Development, New Delhi.

285
environment.179 In the case of tribal migrants, the literacy rate is low, not much is
being done for developing skills and they do not have access to public facilities such
as PDS in the place they migrate to. The State’s apathy and lack of capacity to
implement protective migration/labour laws compounds the problem. Moreover, the
wage rate is very low. Circular/seasonal migration is the dominant form of migration
of poor tribal people. They leave their village after completing agriculture work and
migrate as casual, low skilled workers and return after completion of work. Since
tribal migrants have little or no education and low skills, which translate into low
marketable skills for both rural and urban employment, they form a part of the
unorganized sector and have little bargaining power.
The poorest and deprived areas of the tribal belt in Central India such as Chhattisgarh,
Telengana region, Jharkhand, southern Madhya Pradesh have become labour pools,
from where cheap labour can be drawn on seasonally. Due to poverty and lack of
employment opportunities, tribal families send unmarried daughters to cities in search
of work. Single women and tribal girls are, however, prone to exploitation not only by
employers, but also by anti-social elements. Migration is an important livelihood
activity and research by Mosse et.al,180 in the tribal districts of southern Madhya
Pradesh revealed that 65 per cent of households included migrants, who worked
mainly in the construction sector. Migration grew in the area as a few years later,
another study in the same area found that, in many villages up to three-quarters of the
population were absent between November and June.
Displacement
Development-induced displacement has resulted, not only in loss of land due to
acquisition for the project but also in influx of non-tribal outsiders in these areas, who
illegally alienate tribal land and take the benefits of the new economic opportunities
in commerce, trade and industry. Migration of displaced Scheduled Tribes is
indicative of Government’s failure to provide livelihood in the new environment.
Deforestation
Uprooting of tribals from their traditional habitat, receding forest cover combined
with low agricultural productivity and rain-fed agriculture, create the need for credit
and this leads to seeking employment and livelihoods under bondage, often through
migration. For example, tribal migration from Jhabua in Madhya Pradesh and tribal
areas of Chhattisgarh is a compulsion.181 Tribals in Jharkhand migrate in streams to
the brick kilns of Uttar Pradesh or rice mills of neighbouring states to the
agriculturally prosperous areas of Bihar, Bengal, Uttar Pradesh or Punjab mainly for
179 Deshingkar, Priya and Farrington, J. 2009. ‘A framework for understanding circular migration’ in Deshingkar and
Farrington (eds) ‘Circular migration and multilocational livelihood strategies in rural India’. Oxford University Press. New
Delhi. 2009. 180Mosse, David et al 1997. ‘Seasonal labour migration in tribal (Bhil) western India. Swansea: Centre for Development Studies,
University of Wales. 181Joshi, 1997.

286
sowing / transplanting/ harvesting of paddy and wheat and to the metropolitan towns
and cities as domestic workers and maid servants.182
Drought
In contrast to seasonal migration, distress-induced migration is primarily the result of
factors which include drought, land alienation, debts and high levels of food
insecurity. This form of migration, which had increased in Kalahandi in the 1990s, is
a final resort when other coping strategies fail. Such migration usually starts as early
as September-October, when there is little possibility of harvesting a crop. Recruiting
agents take the opportunity to recruit even cheaper labour than they can normally
expect. Due to three successive droughts in 1996- 2000, distress-induced migration
had become ‘seasonal’ in character and an integral part of the regular coping
strategies.183 A significant number of tribals, mainly from drought prone areas of
Andhra Pradesh, Karnataka and Maharashtra, migrate to work in construction, tile
factory, brick-kiln and crop-cutting in Maharashtra.184
Costs and risks of migration
Migration has both positive and negative consequences for migrants. While it saves
them from starvation at home, it exposes them to appalling living and working
conditions at construction and other work sites. Additionally, migrants also do not
have access to pro-poor schemes such as subsidized food, health care and schooling
and must pay for everything.
On the positive side, migration has given tribal people an exposure to the outside
world including new skills. Their remittances have helped the family in consumption,
repayment of loans, fulfilling social obligations and to finance working capital
requirements in agriculture as well as investment in better housing and purchase of
consumer durables.
On the negative side, they suffer from family and social disorganization, harsh and
unhygienic living conditions at work sites and physical and sexual violence in the
case of female domestic workers. Empirical evidence collected by case- studies in
tribal areas of Central India indicate that women domestic workers on their return to
the village are viewed with distrust, as they show signs of having been influenced by
an alien culture. Such women workers are exploited and harassed, when they migrate
and are regarded with suspicion when they return. Comparison made between tribal
families who migrate and those who do not, reveals that the non- migrating families
own more land comparatively and are in a better position to access and benefit from
various development schemes available for them and so are able to improve their
standard of living and educate their children. On the other hand, migrating tribal
182 Toppo, Ranjit. 2007. ‘Dynamics of tribal migration in India’. Xavier Institute of Social Services, Ranchi. 183 Banik, Dan. 2007. ‘Starvation and India’s Democracy’. London: Routledge Advances in South Asian Studies. 184 Pandey 1998 cited in Srivastava, R, et al 2003 ‘An overview of migration in India. Its impacts and key issues.’ UK:
Department fpr International Development.

287
families have less land, lower level of literacy and on migrating, suffer from
exploitation and harassment and low wages. They are able to stave off starvation, but
do not earn enough to improve living standards. Moreover, their children do not get
education and so the future of the next generation is equally bleak. Added to this, is
the tendency of the unskilled youth to prefer employment in non-agriculture sectors,
as farming does not give adequate returns. This is a challenge for both rural and urban
planners.185
Keeping in view that tribal livelihoods are conditioned by the eco-system and they are
dependent on agriculture, large scale migration due to poor economic conditions is a
serious cause of concern.
8.8 Involuntary Displacement and Tribal Situation: Before and After
From Self-sufficient Tribal Communities to Marginalization and Impoverishment
The traditional livelihood systems of tribal people based on shifting cultivation and
collection of non-timber forest produce was rendered sustainable, by a level and
pattern of utilization of land and forest resources, which ensured their self-generating
capacity. Later, they took to settled agriculture and their livelihood system provided
for a nutritionally balanced food consumption basket that was rooted in both
subsistence and conservation ethics.186 The traditional livelihood system was based on
customary rights of tribal communities over land and forests, which was also an
‘extensive’ system of production. The ‘common pool’ of resources supported
customary rights and prevented the intensification of production, in the interest of
conserving and sustaining the long-term productivity of livelihood resources.187 The
customary rights of tribal people over livelihood resources and their territorial
sovereignty (in so far as land was territory, not property) came in to conflict with the
forces of ‘modernisation’ and the development process in which they were not
participants. In keeping with the politico-economic policies of the country, large
projects, which came up in tribal areas rich in hydro and mineral resources,
encroached on tribal people’s ancestral lands and thereby displaced them.
In order to take measures against the socio-economic deterioration of displaced tribal
people, it is important to understand the extent of displacement-induced
impoverishment. Displacement is marginalisation, not merely economic deprival.
Therefore, in defining impoverishment, it is necessary to go beyond the economic
factor and it is incorrect to calculate losses and gains on the basis of monetary income
alone or to conclude that the status of the DPs improves after displacement, because
185 Based on Datta, S. et al (eds.) 2012. ‘State of India’s livelihoods Report 2011. New Delhi: Sage Publications. Mosse et al
2005. ‘On the margins in the city: Adivasi seasonal labour migrants in Western India’ in Economic and Political Weekly, 40
(28). Pp. 3025- 3038. Toppo, R, 2007. ‘Dynamics of tribal migration in India.’ Xavier Institute of Social Services. Ranchi 186 Padhi, Sakti and Panigrahi, Nilakantha, 2011. ‘Tribal movements and livelihoods: Recent Developments in Orissa’. CPRC-
IIPA Working Paper No. 51. 187 Ibid.

288
their monetary income rises. In making an assessment, it would not be right to ignore
the fact that before displacement, most DPs/PAPs belonged to the non-monetised
informal economy and often depended on the CPRs or services to the village as a
community.188
Before displacement, the DPs/PAPs were poor, but it is due to deprival of their
livelihood that they experience deterioration of their economic status. This
dispossession is accompanied with environmental degradation, which is a basic
additional factor causing impoverishment. The decision to alienate their resources is
without their consent; they are not compensated and rehabilitated, resulting in their
subordination. This marginalization leads to low self-esteem. The sustainable tribal
culture that had ensured renewal and equal distribution of resources is weakened,
leading to shortage of resources. The tragedy is that for sheer survival, the tribal
DPs/PAPs are forced to ‘make a transition from constructive to destructive
dependence on the same resources’. This causes great psychological stress.189
Factors that accentuate loss faced by tribal people
Researchers have identified certain characteristics of tribal society that aggravate the
impact of involuntary displacement, they are:190
Land for tribes is a source of livelihood and source of identity, ethnicity and
cultural distinction. Thus, the loss of land plays havoc with the lives of the
displaced tribal communities. Under R&R programmes, land is not replaced
and there is no reconstitution of livelihoods. Loss of their cultural space and
identity leads to cultural impoverishment, which is not addressed.
Dependence on forests for food in the form of shifting cultivation, fruits and
flowers, small game, tubers; for medicines, fodder, material for house
building; raw material for traditional art and crafts; income by selling
firewood, leaf-plates, fruits etc.191 This loss, due to displacement is not
compensated and affects food security.
Lack of proper legal recognition of tribes over the forest land and hill tracts
compounds the problem, when it comes to the question of compensation.
Lack of social relations outside the closely-knit kin-centered society.
Displacement leads to disruption in family life and to loss of social network.
The land rights structure in tribal societies is altogether different from what it
is in other societies. Tribal communities do not confer any individual rights in
a legal sense. The community rights they confer are the utilitarian rights on
nature but not the proprietary rights which attract the provisions of
188Fernandes, Walter. 2001. ‘Development- induced displacement and sustainable development’. Social Change. Vol. 31 Nos
1&2. 189Fernandes, W, et al ‘Progress: at whose cost?’ 2012. North Eastern Social Research Centre. Guwahati. Pp 29-31. 190 Based on Saxena. 2012 ‘Development is war; Underdevelopment is benign: Political economy of tribal displacement in India’
in Ghosh & Munda (eds) ‘The other side of development’. Konark Publishers, New Delhi. 191Fernandes 1993 cited in Saxena, K.B. ‘Development is war; Underdevelopment is benign: Political economy of tribal
displacement in India’ in Ghosh and Munda (eds) ‘The other side of development: the tribal story’ Konark Publishers
International. New Delhi, 2012.

289
compensatory measures. Many a time, displaced tribal people were deprived
of compensation and rehabilitation benefits as per the Land Acquisition Act,
1894 because they did not possess any legal documents to prove their
ownership right on the land they occupy and earn their livelihood from.192
Contrast in coping mechanism: Vulnerability of the tribal displaced
Other social groups are in better position to benefit from R&R programmes. For
example, about 88 percent of land acquired for the National Aluminium Corporation
at Angul, a non-tribal district in Odisha, in the mid-1980s was private. Its owners,
who mainly belonged to a dominant and influential social group were paid Rs 62,000
per hectare. At Damanjodi in Koraput district, 60 per cent of the land acquired for the
company's second unit that same year was Common Property Resource, belonging to
tribal population. No compensation was paid for it, because community owned
resource/land was considered as State’s property. For the little private land they
owned, tribal families were paid an average of Rs 6,700 per hectare, a totally
inadequate sum to start a new life.193 Another example is that of Maharashtra
Irrigation Project on Krishna River in Satara district, where 75 per cent of households
affected belonged to the influential Maratha community, who used political clout to
obtain facilities under R&R.194
Research studies show that the displaced tribals cope with their loss and changed
conditions better than Dalits and other weaker sections as long as they are allowed to
continue to live in their traditional habitat, as they have honed skills for the
management of their habitat. It is when they are forced to migrate or are resettled
outside their territory that they are not able to adjust and operate in an alien territory
and new society. The tribal way of life centers on their community. This extends from
support in basic agrarian work to solidarity in times of trouble. Any displacement and
scattered rehabilitation will destroy this collective welfare system that binds them
together.195
Deterioration in Quality of life of Tribal DPs/ PAPs after displacement and
Resettlement
Impact of Losses without Recompense
Researchers such as Fernandes, Parasuraman, Mahapatra, Tripathy, Alex Ekka,
Mohammad Asif, Lancy Lobo, Das, Rao to name a few, based on their extensive
research and field work, have brought out the stark reality of displacement without
192 Saxena, KB, 2012. ‘Development is war; Underdevelopment is benign: Political economy of tribal displacement in India’ in
Ghosh and Munda ‘The other side of development’ Konark Publishers. New Delhi.2012. 193 Fernandes. 194 Parasuraman, S. 1999. ‘The development dilemma. Displacement in India. London Macmillan Press. 195 Saxena, K.B. 2012

290
provision of alternative land and reconstitution of livelihood, causing impoverishment
of the displaced. Many DPs/PAPs are forced to migrate. For example, the findings of
the Ombudsmen appointed by the Supreme Court revealed that, about 30,000 people
working for construction of facilities in abject conditions for the Asian Games in New
Delhi in 1982, were people who had lost their livelihood due to deforestation by
industry or had been displaced by Hirakud dam and other projects.196
In the context of Cernea’s eight fold risks, empirical evidence collected by researchers
shows that the DPs/PAPs in India, 40 per cent of whom belonged to tribal
communities, experienced landlessness, joblessness, homelessness, marginalization,
food insecurity, increased morbidity and mortality, loss of Common Property
Resources and social disarticulation. Apart from land and forest, access to CPRs like
wells, ponds and grazing grounds has been diminished by development projects,
adversely affecting tribal occupations such as cattle rearing. Further, empirical
evidence shows that the reconstruction aspect of the ‘Impoverishment risks and
livelihood Model’ of Cernea has been totally neglected, due to absence of a legally
mandated provision for alternative land and livelihood and Resettlement and
Rehabilitation Framework as well as poor management of R&R. All this led to
impoverishment of the displaced.197
Indian researchers have also included the risks caused by loss of education and loss of
access to public facilities. Empirical evidence points to the existence of resettlement
sites without basic facilities such as schools. In fact, migrants lose access to public
facilities as they are not recognized in their new place of work. The process of land
acquisition and the completion of the project take years. During this period,
development works are not taken up in the region, adversely affecting project-affected
people.
The following case studies highlight the deterioration in the quality of life of tribal
people after displacement and the process of impoverishment.
1) The Heavy Engineering Corporation Ltd. established in Hatia, Ranchi district,
Jharkhand, in the early 1960s is an example of the adverse impact of
displacement on tribal communities. In addition, excess land was acquired in
the name of ‘public purpose’ – a total of 7,748.80 acres, including 6,356 acres
of private land was acquired for the purpose of constructing factories,
township, railways, dams, etc. but about 2,600 acres of land was not utilised.
There was complete displacement of 13 villages and partial displacement of
22 villages. Out of the 3090 families displaced, 2274 families belonged to the
Oraon and Munda tribes. According to an evaluation report carried out by the
196 Fernandes and Chetri et al ‘Progress: At whose cost?’ 2012. North Eastern Social Research Centre. Guwahati. 197 Based on Mahapatra, Lakshman K. 1999; Parasuraman, S (1999); Lobo, Lancy and Kumar, S (2009); Frenandes, W &
Bharali, G (2006); Kujur, J.M (2008); Fernandes, W, Chetri, S et al (2012); Mankodi, 1992. ‘Resettlement and rehabilitation of
dam oustees: A case study of Ukai Dam’ in Thukral, E.G (ed) ‘Big dams, displacement people: Rivers of sorrow, rivers of
change’. Sage Publications, New Delhi.

291
State Government Tribal Research Institute, Ranchi, in 1993, ten to twenty
decimals land was given to the displaced for homestead. Some of the
displaced were compensated with land, but these were wastelands. As against
the assurance by the State Government and the Project Authorities before land
acquisition that a job would be given to each displaced family, in actual fact,
one job was given to 4-5 families clubbed together. The normal practice of the
Government was to pay prevailing market rate, which was calculated as an
average of registered sale prices of land of similar quality and location in the
preceding three or five years. However, most land transactions are grossly
undervalued to evade registration fees. As a result, compensation ranged from
Rs. 7360 per acre to Rs.3200 per acre. Most of the displaced, who were not
used to handling money, frittered away their cash compensation in a very short
time. Before displacement, the displaced families owned land and were
engaged in agriculture and animal husbandry activities, which provided them
enough food grain and basic necessities. After displacement, they lost their
capital resource - land linked to food security. There was no attempt to
reconstitute livelihoods. Consequently, displaced families did not have enough
food grain to feed themselves through the year. Post displacement, a majority
of the families faced unemployment, poverty and distress. The evaluation
report concludes by pointing out that, from poor, but self- sufficient and self-
respecting members of a community, the displaced families had been reduced
to daily wage labourers, moving from place to place in search of work.198
2) In a study on mining and displacement problems in Odisha, it has been found
that about 8117 families from 1446 villages were displaced, due to
development projects in the period 1950-1993.199 The aftermath of
development induced displacement is that landlessness takes the form of
downward mobility from large to medium land holders from medium/small to
marginal farmers, and from small/marginal farmers to landless. Among
mining-displaced families, 16.7 percent of tribal people and 13 percent of
Dalit-displaced, became landless against 3.6 percent of the general castes.
Another study shows that people displaced by mining lost their land and were
forced to become wage labourers in mines, but later due to mechanization,
they were the first ones to lose their jobs and become completely
impoverished.200
198 Director, Tribal Research Institute, Ranchi, May 1993. ‘Evaluation Report of Heavy Engineering Corporation Displaced Persons; Unpublished report submitted to Government of Bihar. (Translated from Hindi). 199 Tripathy, S.N. ‘Mining and Displacement Problems in Orissa’ in Nihar Ranjan Mishra and Kamal K. misra (eds .):
Displacement and rehabilitation Solutions for the future’. Indira Gandhi Rashtriya Manav Sangrahalaya, Bhopal, Gyan Publishing House, Bhopal. 200 Sarangi, Debaranjan, 2004. “Mining ‘Development’ and MNCs”; Economic and Political Weekly. Vol. 39. No. 17 (April, 24-
30) pp1648-1652.

292
3) An evaluation of the condition of tribal oustees of Mahi Bajaj Sagar Project,
Rajasthan, twenty years after their displacement (which took place in the
1970s), shows that the quality of facilities in the resettlement colonies were
poor, with no proper provision for schooling, which adversely affected the
education of children. It was observed that the displaced had limited skills and
low levels of literacy and were unable to utilize compensation money
properly. Since they were primarily agriculturists, they had very little
knowledge of running a business or providing a service and in absence of a
rehabilitation plan to address the needs of education and training, the deprived
tribal people were unable to find alternative livelihood. The displaced who
could not get possession of allotted agricultural land were forced to lead
subsistence lives on encroached land with many of them forced to migrate to
nearby towns as low skilled labourers after Kharif season.201
4) Parasuraman, in his research study on displacement due to Bolani Iron Ore
Mines in Keonjhar district of Orissa, describes the pre-displacement situation
in the villages of Bolani, Champua and Balagoda as being thinly populated
tribal villages.202 Every household owned land, surviving on cultivating coarse
cereals and millets, rearing cows, goats and bullocks and depending on forest
for fruits, Mahua trees for liquor and small game for their protein
requirements. They were self-sufficient because they had access to alternative
sources of production. As in other cases of acquisition, excess land of 1320
hectares was acquired whereas only 500 acres was actually utilized for mining,
township etc. Deprived of their resources, the displaced cleared thick forests
for cultivation; had they not done this, the tribals ousted would have been in a
worse position. All households who lost land to mines were compensated with
one job per family. Those who lost land to Public Works or Railways only got
cash compensation. Out of the 218 tribal households, 180 were offered
employment in mines. But the living and working conditions in the mines was
different from the tribal way of life and consequently, over a period of time,
many displaced lost the mining jobs to non- tribal migrant workers from
outside. Moreover, those managing mines did not understand the tribal way of
life, their cultural beliefs and customs and made the tribals displaced, feel
unwanted. Mining activities led to environmental degradation, deforestation,
pollution of river and decrease in soil fertility. Tribal people lost
disproportionately, due not only to loss of land but their habitat for which they
were not prepared by training and psychological mentoring for the transition
from agriculture to mine-related employment. There was no provision for land
and the alternative jobs provided did not suit them. The displaced have
201 Sekhar, B. 1995 ‘The oustees of Mahi Bajaj Sagar Project: Twenty years After’ in Hari Mohan (ed) ‘The resettlement of
project affected people’ 1995. HCM Rajasthan State Institute of Public Administration, Jaipur. 202 Parasuraman, S (1999).

293
become strangers in their own land and have nowhere to go, following the
destruction of their forest-based habitat and livelihood system.
5) A case study of displacement caused by the Sardar Sarovar dam in Madhya
Pradesh focused on problems faced by the Project Affected Families of the
Sardar Sarovar Project (SSP) in Madhya Pradesh, after the dam height was
raised to 119 metres by June 2006. Out of a total of 245 villages in the
Submergence Zone, 193 villages are in Madhya Pradesh, 33 in Maharashtra
and 19 in Gujarat.203 The study emphasises that India is a signatory to ILO
Conventions 107 and 169 on the rights of indigenous and tribal peoples.
Article 16 of ILO 169 states: “Where the relocation of these peoples is
considered necessary as an exceptional measure, such relocation shall take
place only with their free and informed consent.” Where a return to the
traditional lands is not possible in the future, Governments must provide
“lands of quality and legal status at least equal to that of the lands previously
occupied by them.” However, the finding of the field study was that Gram
Sabhas had not been formally consulted before notifications under the LAA,
1894, were issued; few attempts were made to inform the largely illiterate
tribal populations about their rights as stated in the NWDT Award; and the
option of ‘land for land’ within Madhya Pradesh was never formally
communicated to the Gram Sabhas.
The survey based on 20 R&R sites indicated that only 344 families were
actually living in the R&R sites prepared for them. The survey found almost
all the sites to be “very poor”. The Government apparently bought 1636.9
hectares (4141.4 acres) of mainly black cotton soil for 86 R&R sites, most of
which are totally unsuitable for building houses. The study recommended that
all the adult sons, unmarried adult daughters, widows, divorcees and
abandoned wives be treated as separate PAPs.
The study found that most Gram Sabhas in the 171 villages had held meetings
and written letters to the Madhya Pradesh Government, but received no
response. Only when writ petitions were filed in the Supreme Court for
villages like Picchodi and Jalsindhi, were judgments made in their favour.
6) Another study of R&R in Gujarat of the Narmada Project reveals that the
reason for defective R&R programme and policies was because
implementation of R&R depends on a bureaucracy who has prejudices and
biases against tribal people and lack of understanding of their society. The
203 Fernandes, Denzil, Roy, Prodipto, Sinha, Archana, Sebak, Dillip K., Roy, Joya (2007) Submergence of Justice, New Delhi:
Indian Social Institute.

294
findings were that there was no consultation with displaced and project
affected people, lack of communication, cultural differences were disregarded,
faulty land–compensation procedures that did not take into consideration
rights of tribal DPs/PAPs and added to this fraud and corruption. The study
also found cases of coercion and human rights violations, where people were
forced to leave and stay at resettlement locations. False promises were made
but once the tribal people shifted, Government officials avoided them and
there was absence of a system to address grievances and complaints.204
The above case studies are examples of R&R which failed to provide alternative land
and sustainable livelihood, leading to pauperisation of tribal DPs/PAPs. Further, these
are examples of tardy implementation, of unfulfilled promises and violation of laws
and rules by the very machinery expected to protect the interest of marginalised
displaced such as tribals. The studies also highlight the lack of managerial capacity in
the State to implement R&R and incapability to plan imaginative rehabilitation plans.
It reflects the lack of commitment on the part of R&R machinery, which did not
recognise the fact that rehabilitation is a continuous process and after taking
possession of acquired land, they left the tribal DPs/PAPs to fend for themselves.
Loss of status of women after displacement
Women in tribal societies, have a relative equal status on par with their men when
compared with neighbouring caste societies. Prior to displacement, women belonging
to the project-affected villages were actively participating in household work, such as
cooking, child rearing and collecting of Non-Timber Forest Produce (NTFP) and
firewood. However, in resettlement colonies, adverse conditions force adult and
young women to go out in search of work with a view to earn and support their
families, due to loss of permanent income sources of land and forest.
Parasuraman discusses the impact of displacement on the social and economic
condition of women by different development projects, where it was found that loss of
access to traditional sources of livelihood, land, forest, river, pasture, cattle, etc.
marginalizes women in the labour force.205 It is only when land and other sources are
replaced that women at least partially regain their economic status. Under R&R
policies, there is marked gender disparity as women members of the family such as
adult unmarried daughters, widows, deserted divorcees have not been considered as a
separate family. Women are traumatized due to loss of resources and break up of
family and social networks and there is no strategy to address these adverse
impacts.206
204 Bhatia, Bela. 2000. ‘Forced evictions in the Narmada Valley’ in Dreze, Jean et al ‘The Dam and the Nation: Displacement
and Resettlement in the Narmada Valley”. Oxford University Press. New Delhi, 2000. 205 Parasuraman, S. 1999; Parasuraman, S. 1996. ‘Development projects, displacement and outcomes for displaced: two case
studies. EPW, xxxi (24), 1529- 1532). 206 Saxena, K.B. (2009)

295
Traditionally, tribal areas had a better sex-ratio than urban areas, but now, there is a
decline in the sex ratio of tribal women in areas around development projects and
areas facing degradation of CPR forests in Jharkhand.207 This is disquieting, as it
reflects the drop in status of women in the tribal community.
Deterioration of health
Almost all the R&R colonies lack proper public health facilities, protected drinking
water, marketing and transportation. Due to unhygienic conditions, health is a major
problem of displaced tribal people, who are affected by various diseases such as
malaria, typhoid, viral fevers, diarrhoea, cholera, skin diseases and jaundice. In
mining projects, resettlement sites are situated close to mining operations, which
result in respiratory diseases. Ill-health causes them to spend most of their earnings
towards allopathic medical treatment, due to non-availability of herbal medicines.
Disregard for Right to Livelihood: Adverse integration
Planning Commission Five Year Plan documents, NFHS and NSSO data clearly
reveal that, over the years, there have been poor human development indicators in
regions with high concentration of tribal people. As a consequence of poverty,
illiteracy and lack of skills, tribal people have not been able to take advantage of
employment opportunities created by development projects. The State and the
corporate sector have neglected investment in skill/technical training of development-
induced-displaced tribal communities. There was no provision or attempt to provide
jobs or livelihood opportunities, as emphasis was on monetary compensation.
Moreover, research studies also show that, due to neglect of children and youth by not
providing them with education and skills, they are worse-off when the head of the
family retires as they have lost their land which was passed on from generation to
generation.
Diverse research studies have revealed lack of basic civic amenities in rehabilitation
sites, absence of land or poor quality of land settled, and lack of employment avenues,
results in stark decrease in standard of living after displacement and forces the
displaced to migrate. Research studies show many have been forced to take up menial
jobs and have become drifting agricultural and industrial migrant labourers. The work
is commonly poorly paid and insecure and it affects their self- esteem and identity,
but they are forced to take up such work for survival.
Development Projects have failed to create employment opportunities for Tribal
DPs/PAPs instead it has led to unemployment and forced migration.
Occupational change
An analysis of decadal changes in access to cultivated land among Scheduled Tribes
of four States with substantial tribal population, namely Chhattisgarh, Madhya 207 Mullick, Samar Bosu. 2013 ‘The status of indigenous women and land rights in Jharkhand’ in Govind Kelkar and Krishnaraj
(eds) ‘Women, land and power in Asia’. New Delhi. Routledge. 2013

296
Pradesh, Andhra Pradesh and Jharkhand, indicates increasing landlessness amongst
tribal households. The percentage of marginal holdings below one hectare has shown
a marked increase in all the four States. This indicates that medium-size land
holdings are getting fragmented. It is significant that Chhattisgarh and Madhya
Pradesh have the highest rate of diversion of forest lands for non-forest purposes, e.g.
mining. In Madhya Pradesh (including Chhattisgarh), landlessness has increased by
23.1 percent between 2001 and 2011, and in Jharkhand by 8.2 percent between 2005
and 2011.
Even though there is a general all-India increase in the total work participation rate for
Scheduled Tribes, it is largely the result of increasing rates of marginal rural and
urban work, especially among tribal women. The numbers of tribal cultivators has
declined by more than 10 percent in the four states, except Odisha where rate of
decline is less than the all India average. The rate of decline of female cultivators in
several areas is higher than males, which shows that female-headed households are
more vulnerable. In the States of Odisha and Jharkhand, there is a sharp rise in male
and female rural ‘other workers’ due to mining and construction work in rural areas.
Thus, the occupational status of Scheduled Tribes is now changing from farmer to
rural and urban worker.208
This calls for a comprehensive strategy encompassing the following: restoring tribal
land, preventing land alienation, giving priority to Scheduled Tribes in settlement of
ceiling surplus and wasteland, support to small and marginal tribal farmers for taking
up high-value horticulture etc., and skill development to reap the benefits of growth in
labour-intensive manufacturing sector.
Impoverishment of Tribal DPs/PAPs adds to problem of alleviating poverty
The loss of land and CPR resources without adequate recompense has led to
pauperization of tribal DPs/PAPs, adding to the problem of poverty in the country.
The poverty ratios for Scheduled Tribes are significantly higher as compared to
general population in the year 1999-2000. As against 27 per cent of all population
living below the poverty line in the rural areas, 45.86 per cent of Scheduled Tribe
population lived below the poverty line. There are large variations in the proportion of
ST population living below the poverty line across the States. The Twelfth Plan
Document Volume III (‘Social Inclusion’, pg.229) states that, during the period,
1993-94 to 2004-05, the share of ST among the poor in the country increased from
15.83 to 20.49 per cent. It is ironic that ‘development’ projects have added to the
problem of unemployment and poverty in tribal regions.
Decline in Percentage of Tribal Population: Loss of identity
Development projects, which have displaced tribal people, have opened up tribal
areas, leading to influx of people from outside the tribal region seeking employment
208Archana Prasad, ‘Structural Transformations - Evidence from some ‘least developed’ States’ Yojana, January 2014.

297
in industry, mines, transport, Government service, trade and commerce, etc. This has
resulted in increasing urbanization of tribal areas and the large influx of immigrants
from outside gathered the benefits from development, while on the other hand, the
condition of tribal people became worse. Consequently, the percentage of tribal
population in these areas declined. For example, in Bihar, the percentage of tribal
population declined from10.7 percent in 1951 to 7.66 percent in 1981. In Dhanbad
district, the decline was from 15.65 percent in 1951 to 9.12 percent in 1981; similarly,
in Santhal Pargana, the decline was from 44.6 percent to 36.80 percent during the
same period.209 This trend continues in Jharkhand in recent decades, as observed in
Ranchi district (falling from 43.56 percent in 1991 to 35.76 percent in 2011).
Decrease in proportion of tribal population is evident in urbanized areas as well as
rural districts, where involuntary displacement and forced migration have occurred
and where urbanization and development has led to inflow of outsiders.
Tribal people find themselves placed in a subordinate position to outsiders in their
own homeland and have developed a negative identity. Tribal society is egalitarian,
but they now have to deal with a hierarchical and exploitative society. Tribal people
faced with influx of immigrants, fear loss of identity, land, destruction of forests, jobs
and losing political control.
209 Xaxa, V. 2012. ‘Tribes and development: Retrospect and prospect’, in Nathan & Xaxa (eds.) ‘Social Exclusion and Adverse
Inclusion’. 2012. Oxford University Press. New Delhi. 2012.

298
8.9 Conclusion
The large body of research carried out by scholars on the extent of displacement and
impoverishment of tribal people caused by compulsory acquisition of land by the
State, calls into serious question the commitment or ability of the Indian State to
upholding Constitutional safeguards for the protection of land and resources and
welfare of tribal communities. There is dearth of data of the displaced (DPs) and
project-affected people (PAPs), and official figures, wherever available,
underestimate the number of DPs/PAPs. Of the estimated 60 million DPs/PAPs, about
40 per cent are tribal people, 20 per cent are Scheduled Caste and 20 per cent belong
to other social groups, like OBCs. Based on available government records and
estimates, researchers have estimated that people have been displaced from 25 million
hectares, including 7 million hectares of forests and 6 million hectares of other CPRs.
It is also estimated that only 25 per cent of all DPs have been resettled and only 21.16
per cent tribal DPs have been resettled, with a back log of 79 per cent. Further, a
distinction must be made between resettlement, which is a onetime process, and
comprehensive rehabilitation, which is a longer process for socio-economic
reconstitution of DPs/PAPs. The new legislation ‘The Right To Fair Compensation
and Transparency in Land Acquisition, Rehabilitation And Resettlement Act, 2013’,
does not consider the backlog of DPs/PAPs. The magnitude of the problem and
gravity of the situation has to be addressed by the State and corporate sector.
Under policy of liberalisation, the effort is to create a climate favourable to
investment and this will increase demand for more land than in the past. However,
this policy lacks a social thrust. Projects that displace tribal communities by
transferring their resources for the development of dominant sections of society can
never be development in the true sense. Disproportionately large tracts of land in
excess of actual needs have been acquired and CPR diverted for infrastructure
projects, mines, dams, and industries, mainly in tribal regions. This is done for a
pittance, without much thought to sharing the fruits of development with weaker
sections, particularly tribal DPs/PAPs and the tribal community at large. A reason for
their neglect is that they do not have a strong political voice. Studies have shown that
powerful social groups with political clout are able to get much better R&R assistance
as compared to tribal DPs/PAPs. Left-Wing Extremists have tried to fill this vacuum
in tribal areas and channel tribal disaffection against massive land alienation and
displacement. The State needs to send out a strong message to all its instrumentalities
as well as the corporate sector that there shall be no forcible and extortionist land
acquisition in tribal areas, and that wherever tribal land has to be acquired of
necessity, it must be preceded by comprehensive R&R within a framework of full and
free consultation and tribal participation in development and its benefits in the area of
displacement.

299
8.10 Recommendations
1. Serious effort is required by the State to minimize displacement. There
should be a rights- based approach to comprehensive rehabilitation for
socio-economic reconstitution of victims of development, including for the
backlog of displaced.
2. The problem is with the expansive interpretation that has been given to the
doctrine of ‘eminent domain’ by political and managerial elites. In this
context, it is essential that the whole process of displacement should be
democratic and rights of tribal communities to say ‘no’ to acquisition of
their land and to access and manage forests and other CPRs, be recognised.
3. The new legislation, ‘The Right To Fair Compensation and Transparency in
Land Acquisition, Rehabilitation And Resettlement Act, 2013, is
progressive in the sense that it is the first to legally mandate rehabilitation of
PAPs. However, it fails to address the need for minimizing of acquisition of
land and resources. This is not surprising, since the objective of the Act,
which seeks to address concerns of those whose livelihoods are affected,
simultaneously aims at facilitating land acquisition for industrialization and
urbanization. This is in keeping with the broader liberalization policies. Such
policies will result in more displacement in Central India for mining and in
the Northeast for dams.
The 2013 Act already has a provision for safeguarding food security
and states that multi-crop irrigated land will not be acquired, except as
a last resort measure. Further, the State Government is to set limits on
the acquisition of such land under this law. States are also required to
set a limit on the area of agricultural land that can be acquired in any
given district. However, there is no mention of the need to protect
tribal land and community resources. Hence, a suitable provision is
required to be incorporated in the Act, to safeguard tribal land and
community resources in Scheduled Areas and disallow acquisition by a
non-tribal, including private companies.
The definition of ‘public purpose’ in the new law is very wide and will
only lead to greater acquisition and displacement in Scheduled Areas.
The exercise of ‘eminent domain’ and definition of ‘public purpose’
should be severely limited.
Government agencies acquiring land with the ultimate purpose to
transfer it to private companies for stated public purpose, should be
kept outside the ambit of the new law, as the Public-Private Partnership
mode of acquiring land is simply a backdoor method of alienating land

300
in violation of the Constitutional provision to prohibit or restrict
transfer of tribal land to non-tribals in Scheduled Areas.
It is recommended that, as directed in the landmark Samatha judgment
and the PESA Act, every Gram Sabha should have the power to
prevent alienation of tribal land and further that minerals should be
exploited by tribal people themselves. The stringent provisions of the
amended Andhra Pradesh Scheduled Areas Land Transfer Regulation,
1959, should be adopted by other States, particularly the provision that
facilitates the formation of Registered Scheduled Tribe Co-operative
Societies, which could take up mining activities in Scheduled Areas.
By doing so, the Samatha Judgment would hold good for all States
with Scheduled Areas. It should be the responsibility of the State to
facilitate the formation of cooperatives of tribal people for the above
purpose.
Gram Sabha consent should be mandatory for acquisition of land by
the Government for its own use as well.
The Act does not have a provision to the effect that exploitation of
natural resources in Scheduled Areas must be with the consent of the
Gram Sabha. This should be rectified.
4. In the interest of weaker sections such as tribal communities, the threshold
should be kept very low and R&R provisions of the new law should apply to
all cases.
5. There is plenty of unutilized tribal land available with Central/State/PSUs,
and Central/State Governments which is not being used for the purpose for
which it was acquired. Governments should be legally mandated to return
such land to the original landowner/successors or use the same for
resettlement of displaced tribals. This should not be left to the discretion of
the State Government. One example of this is of HEC, Hatia, Ranchi, where
excess tribal land had been acquired and people are agitating for the return
of the land, but the State wishes to utilize it for other purposes. In such
cases, land should be returned to the original displaced families.
The Vijay Kelkar Committee on Fiscal Consolidation (2012) said,
“Over the next 24-36 months, there is yet another policy instrument for raising
resources for development and that is monetizing the government’s unutilized and
under-utilized land resources. These resources can finance infrastructure needs,
particularly in urban areas. Such a policy has been effectively utilized in many
countries including USA, France, Canada, Australia and China. For monetizing
land resources, the potential is considerable given the under-utilized prime lands of

301
PSUs, Port Trusts, Railways, etc. Toward this, we recommend setting up of a group
to work out the policy framework and institutional modalities.”210
The suggestion of the Vijay Kelkar Committee on Fiscal Consolidation
(2012) that “unutilized and under-utilized land resources” be used for
“raising resources” to “finance infrastructure needs particularly in urban
areas” is against the purpose and intent of the land acquisition law and
should be roundly rejected, and unused land should be returned to the loser
of the land and to the community.
6. There has been inadequate recognition at the policy level that land represents
an inalienable resource, passed on from generation to generation in tribal
communities, who otherwise have no education and skill development.
Studies have documented that those DPs who got jobs in lieu of land and
whose children did not receive education or training were worse off after the
job-holder retired from service. It is recommended that the objective of R&R
should be to ensure that the socio-economic status of tribal DPs/PAPs after
displacement, should improve positively rather than deteriorate further. Loss
of land and CPR can be compensated only by proper R&R which envisages
restoration of livelihoods, health and education facilities and skill
development for the whole family and community of tribal DPs/PAPs. There
should be provision of ‘land for land’, in acquisition of tribal lands.
Compensatory land provided must be made cultivable with irrigation and
agricultural inputs. Rehabilitation should be treated as a continuous process
to be monitored by the Project Authority and State until the alternative
livelihood becomes economically viable. They must be given a stake in the
assets and economic activities being created on their acquired land and CPRs
(for example, land in command area, irrigation of tribal land in the vicinity,
jobs in industries, or shops/jobs in industrial projects/townships). An
expanding economy, particularly expanding labour-intensive manufacturing
sector together with adequate emphasis on health, education and skill
development, hold the key to humane R&R.
7. The 2013 Act is weak in matters relating to skill development and provision
for livelihood for DPs/PAPs. During a meeting between the HLC and
representatives of displaced tribal people in Bastar, Chhattisgarh, anger was
expressed at the non-fulfillment of promises to give jobs to the educated
displaced persons. They were unhappy with the cash allowance being given
in lieu of jobs. The official response, that there were not enough jobs to
accommodate all displaced people, did not satisfy the aggrieved parties. A
210 Report available at http://finmin.nic.in/reports/Kelkar_Committee_Report.pdf

302
sum of two thousand rupees per month per family as annuity for 20 years,
with appropriate index for inflation in lieu of jobs, as stipulated in the new
Act, is too low. Clearly, more has to be done for skill development and
creation of alternative livelihoods. One of the ways to ensure that jobs are
provided to displaced people, including tribal families, is to create a State
level/National-level Virtual Employment Exchange with complete data of
age, sex, educational qualifications, and skill-set of persons displaced in the
past, present and in near future, for providing them employment and/or
preparing them for employment/self-employment. Global best practices
could be studied for providing alternative livelihoods, which could include
imaginative self-employment schemes with backward and forward linkages
to be provided by Project Authorities.
8. Research studies stress that gross undervaluation of losses, replacement
value of loss and costs of resettlement, has led to inadequate financing of
R&R and externalization of costs of R&R to the displaced and the future
generations. The new law has expanded the definition of ‘displaced’ to
include project-affected persons; however, care has to be taken to ensure that
all genuine cases are included and compensation is properly computed.
In computing losses, it has to be recognized that there are instances of
tribal DPs who do not have documents to support their genuine claim
but who base their ownership rights on oral tradition. Such claims
should not be rejected.
Forest rights have been covered under the Forest Rights Act, but other
CPRs such as Government land and Panchayat land has not been
covered by any legislation. This needs to be rectified. Moreover,
survey by Government is incomplete – as a consequence, community
land is recorded as Government land and tribal communities, primarily
tribes who practice shifting cultivation on such land, are denied
compensation. This problem needs to be addressed by measures to
include such cases under R&R provision.
Women require special consideration and affirmative action. Widows
and unmarried adult daughters should be recognized as a separate unit.
The principle for working out land compensation has been spelt out.
For all other assets, compensation should be based on replacement
value or net present value of assets lost/destroyed.
While preparing the project cost estimates, the full cost for R&R
should be included, and no attempt should be made to reduce costs for
a favourable cost-benefit ratio.
The rehabilitation package and process should take into account, the
cultural displacement, and loss of customs and tradition. For tribal
people, their strength is their community, and therefore, it is imperative

303
that they be resettled and rehabilitated as a community, if they so
desire.
Infrastructural amenities to be provided in the resettlement area have
been mentioned in the new law, but provision of banking facilities has
been missed out. With primary emphasis on monetary compensation, it
is essential that displaced tribals, who may not have experience in
handling money and understanding of the monetary economy, should
be advised on handling their cash compensation. Banking facilities
should made available for keeping their money safe and credit facilities
should be provided by the State (to avoid exploitation by money-
lenders).
9. Land and water sources polluted by industrial and mining projects in tribal
regions require attention and the onus for taking corrective measures should
be on the Project Authorities. The schemes of the Government could be
utilized to treat polluted land and water resources of tribal people.
10. The role of the Governor is crucial for protecting land, community assets,
culture and traditional institutions of tribal people and to ensure that they are
treated fairly. This role extends to ensuring socio-economic reconstitution of
tribal DPs/PAPs. This raises the issue of suitability of persons who occupy
the important position of Governor and other offices, such as
Commissioners, Deputy Commissioners and District Magistrates, in
Scheduled Areas. It is imperative that the antecedents and experience of
persons be taken into consideration by the Government to check whether
they can protect the interest of tribal communities and are suitable for such
appointments, in view of the special role assigned to them in such States.
11. Implementation of the new law will be difficult in the absence of
resettlement and rehabilitation capacities in the local administration, local
community and corporate entities. It is essential that the State and corporate
sector create such capacity by introducing professional training and
orientation courses for following the best R&R practices worldwide and
replicating them in the Indian situation. Offering tribal people monetary
compensation and making promises without attendant capacity to deliver on
them will not resolve the impasse that has brought land acquisition to a
standstill. Sporadic attempts by instruments of the State to use force to
acquire land is unethical and unacceptable. Only a genuine and bonafide
effort at comprehensive and pragmatic R&R can persuade tribal people to
part with their land.
12. The new legislation lays considerable emphasis on consultation and consent
of Gram Sabhas. It is essential that the State be vigilant through adequate

304
monitoring mechanisms for ensuring that consent is obtained freely and
every displaced person gets adequate and comprehensive R&R in lieu of
land/livelihoods lost. The State must put in place a system to collect
disaggregated data of DPs/PAPs for all social groups. Oversight mechanisms
must be created at the District, State and Central levels, comprising officials
and non-officials with proven competence, integrity and commitment to
public good. There is a view that, though the new legislation has been
enacted by the Centre, R&R is a State subject, which should continue.
However, the Centre has a responsibility along with the states to ensure
comprehensive R&R. The Central Government should decide on the
monitoring mechanism to be put in place. One possibility is to establish an
Authority/nodal agency with a multidisciplinary team under the Ministry of
Land Resources.
13. In view of the large-scale discontent among displaced tribal people
regarding poor R&R, a High-Level Fact-finding Committee/Enquiry
Committee should be set up to investigate the quality of R&R in all medium
and major development projects undertaken in the last fifty years in
Scheduled Areas and tribal-dominated districts of States without Scheduled
Areas. This Committee should be mandated to suggest ways and means to
deliver justice to the displaced families, who have not received any proper
rehabilitation. This is essential, in view of the fact that, the new law has not
taken cognizance of the backlog of displaced people, a majority of whom are
tribal people.
14. Myriad grassroot movements against exploitation of tribal people and other
weaker sections hold the key to greater socio-economic justice. It would be
desirable if the State recognizes this and engages with democratic grassroot
movements, instead of crushing these movements.
15. Tribal people who have been displaced by conflict in Chhattisgarh and the
Northeast should be rehabilitated by the State Government in their villages
and provided facilities of housing, safe drinking water, health and education,
skill development, electricity supply, irrigation facilities, and agricultural
inputs. It is for the State to take preventive action and ensure safety and
prevent tribal land alienation in such areas. During a visit of HLC to Assam,
civil society groups and representatives of Autonomous Tribal Councils
emphasized that influx of outsiders was a real threat to the tribal
communities. They also alleged that inter-tribal conflict was being instigated
by outsiders. It is the responsibility of the State Government to take
measures to prevent such conflicts.

305
16. Under the ‘Coal Bearing Areas (Acquisition and Development) Act, 1957,
pattas/legal titles for houses allotted in resettlement sites are not issued to the
displaced. As a result, the displaced lose their identity and are unable to
access public facilities provided by the local administration, thereby facing
difficulty in obtaining Caste/Tribe certificates. Further, there is no provision
for payment of compensation before taking possession of land. The
provision for returning land to original landholders post-mining is rarely
complied with. Clearly, there is a need to make amendments in the Act.
17. Development projects have opened up tribal areas leading to influx of people
from outside the tribal region, seeking employment in various sectors. All
this has resulted in increasing urbanization of tribal areas and immigrants,
rather than tribals, have benefited from this. Consequently, the percentage of
tribal population in some Scheduled Areas has declined, although
historically, these areas were almost exclusively occupied by tribal people.
Hence, it is recommended that there should be no reduction in the areas
declared to be Scheduled Areas as this will harm the interests of already
deprived tribal communities by diminishing their space and their resources.
Rather, the representation of tribal communities should be enhanced and
strengthened in the politico-administrative institutions within Scheduled
Areas.
18. Tribal people suffer predominantly from the phenomenon of poverty-
induced migration, also known as forced migration. An analysis of the
Census data shows that there has been an occupational change and the
number of tribal cultivators has reduced while the number of tribal marginal
workers has increased. Micro studies indicate the increase in
seasonal/circulatory migration of tribal workers, which may help them to
avoid starvation, but is not enough to improve their standard of living.
Hence, it is recommended that:
The Census and National Sample Surveys should gather data on the
phenomena of seasonal/circulatory migration, migration of children
across social groups and poverty-induced migration.
Priority should be given to STs in settlement of ceiling surplus land
and wasteland, investments to improve agriculture, support for high
value horticulture, employment opportunities in rural areas, access
to credit facilities and skill-development to rural youth for
employment in labour-intensive manufacturing sector.
Complaints have been received that, due to seasonal migration of
tribal people, they are not enumerated in the Census and therefore,

306
Census data is not a true reflection of tribal population. This
grievance requires to be redressed.
Apathy and incapacity of the State to implement the Inter-State
Migrant Workmen (Regulation of Employment and Conditions of
Service) Act, 1979, has led to exploitation of tribal migrant
families. In particular, tribal women and children suffer greatly.
There is a growing demand for enactment of a comprehensive
Migrants Rights Legislation, which deserves serious consideration.
19. Recommendations for measures to prevent illegal land alienation of tribal
land are as follows:
In pursuance of the PESA, 1996, Land Transfer
Regulations/Tenancy laws of all Schedule V Areas should be
suitably amended to ensure Gram Sabha participation in the
identification, investigation and restoration of lands to tribal
people. Gram Sabhas require to be strengthened by State
Governments to undertake these responsibilities.
Plenary powers could be given to Gram Sabhas to fight cases of
tribal land alienation collectively, as an individual tribal cannot
afford to face prolonged legal battles, given their socio-economic
conditions.
The Gram Sabha should be empowered to restore the alienated
land on detection, pending the long legal battle, in order to
potentially discourage a prospective non-tribal buyer of land in
Scheduled Areas. This needs to be legally examined.
Care has to be taken to ensure that District Councils and State-
level Council do not have powers to dissolve Gram Sabhas or to
dilute the powers and functions of the Gram Sabha
Legal loopholes and ambiguities in all Scheduled Area Land
Regulations and Tenancy laws should be removed. For example,
such a removal must ensure that tribal land is not transferred for
purposes such as settlement of refugees, housing, etc.
There is a provision in the Andhra Pradesh Act, wherein
immovable property of tribals can be mortgaged to banks and, in
case of default, the property to be sold back only to tribal people
or tribal cooperative societies exclusively formed by tribal people.
This provision needs to be evaluated to explore replication in
other Scheduled Area States. There is an urgency in doing so to
meet the financial needs of tribal youth.
There is a presumption clause in the Andhra Pradesh Act that,
until the contrary is proved, any immovable property in the
Scheduled Areas and in possession of a person who is not a

307
member of a Scheduled Tribe shall be presumed to have been
acquired by the person or his predecessors through a transfer made
to him by a member of a Scheduled Tribe. This clause should be
examined by other States for adoption and inclusion in their laws.
Suitable amendments should be made in all land laws for
protection of tribal land in Scheduled Area States to the effect that
there should not be any time limit for restoring tribal land.
Suitable provision should be made in land laws so as to bring all
benami transfers, transfers in the names of concubines, tribal
servants or others into the purview to prevent fraudulent land
transfer in Scheduled Areas.
The move to notify rural areas as urban areas in order to nullify
PESA provisions should be stopped forthwith. Use of Master Plan
in urban areas to alienate/displace tribal people from their land
should be curbed.
Increased investment is required to be made by State
Governments to provide legal aid to tribal petitioners so that they
are in a position to hire competent lawyers to fight cases. The
Government must also provide legal training, literacy and
awareness programs for youth and women on State and customary
laws contextualized with modernity processes, with the
participation of NGOs.
Ultimately, it is the duty of State Governments, to ensure that all
officials and lower-level functionaries do not connive in
defrauding tribal people of their land. Regular monitoring at the
State and Central levels of disposal of cases and proactive efforts
for restoration of tribal land is required. It is the responsibility of
the State to address the problem of contradictory judicial
pronouncements that jeopardize implementation of protective land
laws by removing ambiguities in all relevant laws.

308
9. Legal and Constitutional Issues
9.1 Introduction
This chapter presents the issues and debates concerning the implementation of the
Forest Rights Act 2006, the Provisions of Panchayats (Extension to Scheduled Areas)
Act 1996, some socio-economic issues relating to Particularly Vulnerable Tribal
Groups (PVTGs), the use of criminal law in tribal areas, Salwa Judum, the Niyamgiri
experience, matters of migration and exploitative labour.
Provisions of the Panchayat (Extension to Scheduled Areas) Act 1996 (PESA) has
made fundamental changes in the matter of autonomy of tribal communities in Fifth
Schedule Areas211. The Scheduled Tribes and Other Traditional Forest Dwellers
(Recognition of Forest Rights) Act, 2006 (FRA) has, for the first time since the
colonial state took over control and commercial interest in forests, recognized the
relationship between forest dwelling communities and the forest. Both these
legislations are premised on setting right historical wrongs that had caused processes
of marginalisation, impoverishment and increased vulnerability of tribal and forest
dependent communities. The committee studied the implications of these laws on the
relationship between tribals, land, forest, other resources and the state. The conflict
between a model of development that seeks to exploit or divert mineral and forest
resources, often through the agency of companies, and the autonomy under PESA and
the recognition of rights in the FRA, was specially in focus. The experience with
autonomy in the Niyamgiri hills has acquired iconic status. The state practice
encapsulated in Salwa Judum came up before the committee. A noticeable feature was
the encounter of tribals with criminal law, especially in places that were seen as
‘naxal affected’, and in places, where mining and development projects have been
proposed. The persistence of laws such as the Habitual Offenders Act and Anti-
Beggary laws and their effect on De-notified Tribes is a matter that came up before
the committee. Bonded labour and trafficking are facets of forms of servitude that
continue into the present.
9.2 Forest Rights Act
The enactment of the FRA has been a very important move in taking away the burden
of illegality from the shoulders of tribals, and forest dwelling and dependent
communities. The Indian Forest Act, 1927 and its predecessor Act of 1878 vested
control over the forest resources in the state. Forest area covers 23 percent of land
mass and over the years, forest communities have been treated as encroachers and
their activities in forest areas as ‘forest offences’.
211 The legal, constitutional and administrative issues pertaining to Sixth Schedule Areas have been dealt with in Chapter 4.

309
9.2.1 Implementation of the FRA
Implementation of the FRA has been weak. In 2010, the Ministry of Tribal Affairs
(MoTA) and Ministry of Environment and Forests jointly constituted a committee to
study the factors that aid or impede the implementation of the law and recommend
necessary policy changes (hereinafter ‘2010 Joint Committee Report’).212 It appears
that many of their findings persist and recommendations remain relevant. These
include:
The implementation of the FRA has been poor, and therefore it’s potential to
achieve livelihood security and changes in forest governance along with
strengthening of forest conservation, has hardly been achieved.213
There have been serious flaws in many states relating to the constitution of the
Forest Rights Committee (FRC) at the grassroots level which has the crucial
role of assisting the Gram Sabha (GS) in determining the claims from
individuals by receiving, consolidating and verifying them on the ground.214
Several states have utilized GPS technology for plot delineation. It is
recommended that a special set of guidelines need to be worked out for the
proper use of spatial technology in the delineation, location, and status
verification of claims filed, to ensure reliability, objectivity and
transparency.215
The FRA stipulates that forest-dwelling Scheduled Tribes and Other
Traditional Forest Dwellers (OTFDs) are not to be evicted or removed from
forest land under their occupation till the process of recognition and
verification of their rights is complete. The committee members found that this
provision of the Act has been violated such as in Thane, Maharashtra where
FRA claimants were evicted even as their claims were pending with no
notice.216
The relocation from Protected Areas including Tiger Reserves without having
completed the procedures under the FRA was identified as a gross violation of
the FRA.217
Though the FRA does not and should not provide any deadline for completion
of the process, states should expedite recognition of rights within an
212 Manthan, Report of the National Committee on National Forest Rights Act, 2010 (A Joint Committee of MoEF and MoTA,
Government of India). 213 Ibid at p.10 214 Ibid at p.11 215 Ibid at p.11 216 Ibid at p.12, 50. 217 Ibid at p.129
310
appropriate time frame which is to be decided in consultation with the forest
dwellers and civil society, so that governments do not slacken off on
implementation.218
The MoTA should issue a clarification that OTFDs as defined under the FRA
are all those who can prove seventy five years of residence in the area (not
necessarily on the plot being claimed), and dependence on the forest land as of
December, 2005. The MoTA should also clarify what kinds of evidences may
be used for such proof and how these are to be made available to the villagers.
MoTA should also clarify that no disqualifications on the basis of possession
of additional revenue land or jobs, or location of residence on revenue land,
etc. are permissible under the FRA.219
State governments should review their State Level Management Committees,
District Level Committees, and Sub-Divisional Level Committees, regarding
their composition, functioning, public interface, and transparency, and issue
directions for necessary correctives in each of these institutions.
Most states have concentrated almost entirely on implementing the provisions
for individual forest rights (IFR).220
Claims are being rejected without assigning reasons, or based on wrong
interpretation of the ‘OTFD’ definition and the ‘dependence’ clause, or simply
for lack of evidence or ‘absence of GPS survey’ (lacunae which only require
the claim to be referred back to the lower-level body), or because the land is
wrongly considered as ‘not forest land’, or because only forest offence receipts
are considered as adequate evidence. The rejections are not being
communicated to the claimants, and their right to appeal is not being explained
to them nor its exercise facilitated.221
Section 3 (1) (m) of the FRA, regarding the rights of persons illegally
displaced or evicted by development projects without proper compensation,
has not been implemented at all.222
The Committee finds that these problems persist. While on one hand, we see an
absence of the procedure stipulated in the FRA, on the other, strict adherence to
conditions not even required or permitted under the Act are used to disregard claims.
218 Ibid at p.13 219 Ibid at p.13 220 Ibid at p.14 221 Ibid at p.14 222 Ibid at p.15

311
The term “individual forest rights” isn’t actually used in the FRA, it has found its way
to official records and common parlance to denote rights to forest land with individual
tenure. Section 3 of the Act includes: “right to hold and live in the forest land under
the individual and common occupation for habitation or for self- cultivation for
livelihood by a member or members of a forest dwelling Scheduled Tribe or other
Traditional Forest Dwellers”.
According to data with the MoTA, the status of individual and community right
claims under the FRA, as of 31st January 2014, is as follows:
Table 9.1: FRA claims status as of January 31, 2014223
S.No. State No. of Claims
Received
No. of titles
Distributed
No. of
claims
rejected
Total No of
Claims
Disposed
1. Andhra
Pradesh
4,11,012
(4,00,053 individual;
10,959 community)
1,69,370
(1,67,263 individual;
2,107 community)
1,65,466
3, 34,836
2. Bihar 2,930 28 1,644 1,672
3. Chhattisgarh 7,56,062 3,06,184 4,23,149 7,29,333
4. Jharkhand 42,003 15,296 16,958 32,254
5. Madhya
Pradesh
4,98,346
(4,80,551 individual;
17,795 community)
1,83,608
(1,72,539 Individual ;
11,069 community)
and 9,172 ready
2,78,887
(ST-40.90%)
(OTD-96.26%)
4, 62,495
6. Maharashtra
3,46,230
(3,41,085 individual;
5,145 community)
1,03,797 (1,01,426
individual;
2,371 community)
2,33,720
(2,31,641
individual;
2,079
community)
3, 37,517
7. Odisha 5,45,279
(5,34,275 individual;
11,004 community)
3,28,580 distributed
(3,25,449 Individual;
3,131 community)
1,39,519
(1,38,905
individual ;
614
community)
4, 66,434
8. Uttar Pradesh 92,433
(91,298 individual;
1,135 community)
17,705
(16,891 individual; 814
community
73,028
90,733
9. West Bengal 1,37,278
(1,29,454 individual;
7,824 community)
29,852
(29,744 individual ;
108 community;
2,969 ready)
79,891
1, 09,743
Total 28,31,573
(27,77,711individual;
53,862 community)
11,54,420
(11,34,820 Individual;
19,600 community)
14,12,262
25,66,682
Source: www.tribal.gov.in
While looking at these figures, it must be kept in mind, that there is generally a gap
between the land claimed and the actual extent of the titles issued to the claimant.
Field studies reveal that although revenue officials generally demarcate all the land as
223www.tribal.gov.in, available at
http://tribal.nic.in/WriteReadData/CMS/Documents/201402260212590468750MPRforthemonthofJanuary2014.pdf.

312
per the application of the claimants, titles issued to them are for lesser areas than their
actual occupation and claims. As the table demonstrates, implementation has been
low and where claims have been filed there has been a high rate of rejection of claims.
Also, most state governments have focused their attention on individual claims, and
not community right claims.
In addition to the findings from the Joint Committee Report, 2010, we find that:
A common ground of rejection is that the person is not a Scheduled Tribe (ST)
even though the FRA unambiguously states that rights to forest land are
available to “Scheduled Tribe or other Traditional Forest Dweller” Claims are
often rejected due to absence of ST community certificates.224 OTFD claims in
Andhra Pradesh have largely not been entertained due to lack of evidence.225
In Odisha, OTFD’s have mainly been discouraged from filing claims and most
of their claims have been rejected at the Gram Sabha level itself or not
accepted by the FRC.226 Claims have also been rejected due to inability to
prove plot cultivation for seventy five years prior to 13th December 2005.227
There are reports of claims being rejected on the ground that the claimed land
is ‘disputed’. As per SCSTRTI Report, 2013: “In Chhattisgarh, the issue of
Ghas zameen (revenue land) is disputed by villagers in many sites which they
consider as narangikshetra, something that is popularly known as ‘orange
areas’ in government parlance, an area, ownership of which is disputed
between the forest and revenue department. It must be noted that these orange
areas are recorded in records of both forest and revenue department and so
long as the land is recorded as forest land, it comes under the ambit of the
FRA. Thus, denying rights over such lands is in violation of the law”228A
dispute between two departments cannot be a reason for denying people their
due under the law.
9.2.2 Community Forest Rights
The FRA recognizes various community forest rights which could potentially operate
as a powerful, and meaningful, way for forest dwelling communities to protect their
way of life. Till as late as 2012, however, these rights were almost entirely ignored.
Most often, they were confused with the Section 3(2) provisions which provide
communities with education and health facilities and connectivity when there was
224Joint Committee Report, at page 75; Ministry of Tribal Affairs, 2012 Regional Consultations on Implementation of the Forest
Rights Act: Amendments in the Rules and the Way Forward, at page 11. 225 SCSTRTI, National Research Study of Implementation of FRA in Neighboring States of Odisha, 2013 at page 322-323. 226 Ibid. 227 Ibid. 228 SCSTRTI, National Research Study of Implementation of FRA in Neighbouring States of Odisha, 2013 at p, 209.

313
diversion of forest land for non-forest purposes.229
Despite very poor implementation of community rights, the Joint Committee Report,
2010 was quick to caution that “the current status of community claims is not
indicative of the potential of such claims. If the various shortcomings in
implementation described below are removed, the claims could spread to several
million hectares in the next few years.”230
It is clear that unless enforcement of CFR is a community driven process, its
implementation will be incomplete. When it comes to community rights awareness
among claimants and FRC members is still abysmally low, even when compared to
awareness regarding individual claims. This is corroborated by surveys conducted on
the Status of level of Awareness amongst Multiple Stakeholders (percent) by
SCSTRTI in 2013.231
In many cases, the Forest Department is actively impeding the process of CFR rights
and recognition. For example, as per a recent study conducted, 27 CFR titles have
been claimed and even conferred in Sarguja district of Madhya Pradesh but the Forest
Department does not recognize them.232
The general misunderstanding is that FRA is a “scheme for tribals” to the exclusion of
OTFDs and therefore, CFR titles will be granted to “Scheduled Tribes only” villages.
Right from its first phase of implementation, it is noted that district administrations
refuses to accept oral evidence from elders although it is allowed as per the Act.233
Authorities are also incorrectly requiring proof of “occupation” (and not proof of
“residence” as stipulated under the FRA and as clarified by the guidelines issued by
MoTA) of forest land for three generations prior to 13th December, 2005.234 In the
Nayagarh district of Odisha, CFRs have not been recognized in villages with a mixed
population of Scheduled Tribes and OTFDs. In Jharkhand as well, 73 claims out of
229 Desor, S. (ed.), 2013, Community Forest Rights under Forest Rights Act: Citizens’ Report 2013, Kalpavriksh, Pune and
Vasundhara, Bhubaneshwar with Oxfam India, Delhi, on behalf of Community Forest Rights Learning and Advocacy Process, at
page 99 , 115 stating “In regions like Chhattisgarh, Rajasthan, Dadra and Nagar Haveli, Jharkhand and parts of Maharashtra,
such as Raigad district, rights under section 3(2) of FRA (i.e. public utilities) are predominantly - and mistakenly - being granted
as CFRs”; see also SCSTRTI, National Research Study of Implementation of FRA in Neighbouring States of Odisha, 2013 at
page 216 that “In Odisha, the thrust on recognizing developmental rights as community rights was similar as in the other two
states in the initial phases based on similar set of confusion. However, in 2010, the ST & SC Development department of Odisha
issued exclusive FAQs on determination and recognition of community forest rights in order to eliminate the confusion persisting
at ground level with regard to Community Forest Rights and Developmental facilities under section 3(2) of the Act. The said
departmental order mentions that “most of the reporting of the recognition of Community Forest Rights so far has actually been
for the diversion of forestland for developmental facilities provided under the section 3(2) of the Act. The process for diversion of
forest land for developmental facilities under section 3(2) of the Act is totally different from the recognition of Community Forest
Rights as envisaged in section 3(1) of the Act.” 230 Joint Committee Report, at page 86 231 SCSTRTI, National Research Study of Implementation of FRA in Neighbouring States of Odisha, 2013 (Draft Report at page
225. 232 SCSTRTI, National Research Study of Implementation of FRA in Neighbouring States of Odisha, 2013 (Draft Report at page
216. 233Desor, S. (ed.), 2013, at page 66. 234 A Report of the National Level Public Hearing on Community Forest Rights, December 14, 2013, pg. 9.

314
147 claims filed by OTFDs, have been rejected (i.e. 50 percent rejection). 235
In Chhattisgarh, there are continuing reports of Forest Rights Committees (FRCs)
being constituted at Panchayat level overseeing several villages.236 In most cases,
members of such FRCs are not aware of their membership and their duties. Lack of
awareness, information and training on filing CFR claims in such FRCs prevents
interested communities from filing claims. There are also reports of such FRCs being
manipulated by village elites leading to conflicts.237
In Tamil Nadu, it is the Court that has restricted recognition of these rights. The
Madras High Court order238 dated 30th April 2008 restricted the issuance of titles
under Section 3(1) unless approved by the Court. The order clarified that the process
of verification of the claim shall continue but even so implementing authorities
interpreted the order to mean that no action is to be taken on the claims, including the
process of recognition of claims, without the High Court order being vacated.239 On
2nd September 2008, the Court clarified that the process of identity and recognition
may go on and only the final decision shall not be taken without leave of the Court.240
Exercise of rights over the Minor Forest Produce (MFP), a community right under the
FRA, remains a big challenge across the states. There is no institutional mechanism
developed so far to support the rights holders in the process of exercising the MFP
rights particularly in the disposal and marketing of the produce.241 The problem is
seen more in case of nationalized produce like Bamboo242 and Tendu leaves.243 Apart
from these challenges in the trade of MFP, the non-commercial values of such
produce are of critical importance to the lives of forest dwelling communities.
235 See detailed case studies in Desor, S. (ed.), 2013 at page 36. 236 Recommendations of the communities as documented at the National Public Hearing, December 2013, organized by
Community Forest Rights Learning and Advocacy Process (CFR-LA) and Adivasi Janjati Adhikar Manch (AJAM) at page 5. 237 Recommendations of the communities as documented at the National Public Hearing, December 2013, organized by
Community Forest Rights Learning and Advocacy Process (CFR-LA) and Adivasi Janjati Adhikar Manch (AJAM) at page 5. 238 V. Sambasivam v. Government of India, Writ Petition no. 4533/2002, Madras High Court, dated 30th April 2008. 239Desor, S. (ed), 2013, Community Forest Rights under Forest Rights Act: Citizens’ Report 2013, Kalpavriksh, Pune and
Vasundhara, Bhubaneshwar with Oxfam India, Delhi, on behalf of Community Forest Rights Learning and Advocacy Process; A
Report Of The National Level Public Hearing On Community Forest Rights, 14th December, 2013, organized by Community Forest Rights Learning and Advocacy Process (CFR-LA) and Adivasi Janjati Adhikar Manch (AJAM) at page 5. 240See Order dated 2.9.2008 passed by Orissa High Court in WP 4933/2008; Order dated 12.8.2009 passed by Orissa High
Court in WP 4933/2008) 241 Desor, S. (ed), 2013, Community Forest Rights under Forest Rights Act: Citizens’ Report 2013, Kalpavriksh, Pune and
Vasundhara, Bhubaneshwar with Oxfam India, Delhi, on behalf of Community Forest Rights Learning and Advocacy Process at
page 90, 102, 109. 242 Desor, S. (ed), 2013, Community Forest Rights under Forest Rights Act: Citizens’ Report 2013, Kalpavriksh, Pune and
Vasundhara, Bhubaneshwar with Oxfam India, Delhi, on behalf of Community Forest Rights Learning and Advocacy Process at
page 74, 82. 243 Case study from Narigaon, Odisha on deregulation of Kendu leaves trade in the context of Forest Rights Act (Draft),
Vasundhara (2013).

315
9.2.3 Joint Forest Management
In areas where Joint Forest Management (JFM) was in practice, there were complaints
that the FRA was sought to be kept out.244 Further, attempts were to convert the
village forest committees set up into forest rights committees under the FRA, which is
not in consonance with the law.
In Andhra Pradesh, the SCSTRTI study notes that “community forest rights were
generally understood as rights over areas of Vana Samrakhyan Samiti (VSS), an
institution created by the Forest Department under the Joint Forest Management
Program.245 Instead of conferring title to the Gram Sabha, CFR titles have been found
to have been issued in the name of individuals like VSS chairperson or village elder
or Sarpanch, which is a clear violation of the law”.246
In a letter addressed to the State Forest Department, dated 17th August 2013, MoTA
clarified that the grant of community rights titled in the name of VSSs under the FRA
was a violation of the Act and such JFM committees could not be claimants under the
FRA.
In Gadchiroli, Maharashtra a study reports “In almost all the villages we visited in
Gadchiroli, JFM has been implemented, even after the CFR titles have been granted.
The reason given by facilitators is that for works taken up under JFM, funding is
provided by the Forest Department. CFR rights come with the responsibility of
protecting, conserving and regenerating their forests. However, there is no provision
of funding for work related to these responsibilities. Also, though the CFR titles have
been granted, the forests given under CFR to many villages do not have bamboo or
any other NTFPs, which could help communities earn livelihood.” In Tamil Nadu,
“they have not been allowing filing of CFRs (as in Madurai, Virudhunagar, and
Tirunelveli districts of Tamil Nadu) because forests rights like grazing have been
curtailed under former JFM programs.”247
In Uttarakhand, “considering the historical background of Van Panchayats and clash
with JFM strongholds, there is poor awareness about FRA at the village and
244 SCSTRTI, National Research Study of Implementation of FRA in Neighbouring States of Odisha, 2013 (Draft Report at page
199); see also Madhu Sarin, Presentation on Issues in State Action Plans (regional consultations) dated 16th March 2013; CFR
LA Kalpavrikra – Vasundhara, A National Report on Community Forest Rights under Forest Rights Act: Status & Issues, 2012 at
page 46. 245 SCSTRTI, National Research Study of Implementation of FRA in Neighbouring States of Odisha, 2013 (Draft Report at page
199); see also Madhu Sarin, Presentation on Issues in State Action Plans (regional consultations) dated 16th March 2013; CFR
LA Kalpavriksh – Vasundhara, A National Report on Community Forest Rights under Forest Rights Act: Status & Issues, 2012 at
page 70. 246 SCSTRTI, National Research Study of Implementation of FRA in Neighbouring States of Odisha, 2013 (Draft Report) at page
216. 247 SCSTRTI, National Research Study of Implementation of FRA in Neighbouring States of Odisha, 2013 (Draft Report) at page
216.

316
administrative level and a negation of the hamlet level process of FRC constitution
and recognition of OTFDs and of community forest rights.”248
9.2.4 Particularly Vulnerable Tribal Groups: Food Security and Habitat Rights
The Right to Food Commissioner’s Report identifies Particularly Vulnerable Tribal
Groups (PVTGs) as most susceptible to malnutrition.249 The report acknowledges that
these communities derive their nutrition from the forest and habitat they live in.
Tribals are denied access to the forest and its produce, often due to persistent lobbying
by conservationists and environmentalists.
PVTGs inhabit areas that are inaccessible by road, and therefore cannot travel easily
to Anganwadi centers, where food is prepared. Moreover, their hamlets are
considered too small to open an Anganwadi centre. As far as the Midday Meal
Schemes are concerned, tribals are wary of their children attending mainstream
schools, either due to fear of stigmatization in school or physical distance. 250
A spate of infant deaths among the PVTG in Attapadi in the Palakkad district of
Kerala brought back the spectre of malnourishment, anaemia and extreme poverty.
The report of the advisor to the commissioners in the Right to Food petition before the
Supreme Court received information that 36 children had died in the six months
preceding his visit in May 2013.251
Severe anemia, malnourishment, the lack of potable water, the absence of specialized
doctors and of equipment led to the precarious nature of health care and protection in
Attapadi, leading to the death of infants. At a public hearing in Attapadi, speaker after
speaker spoke of the distance between the dwellings of Kurumba tribals and the ration
shop, the paucity of minor irrigation projects that could ensure drinking water and
irrigation to the tribal community, the inaccessibility to remote tribal villages and the
problem brought on by drought. One issue that was raised was about forest-dwelling
communities which have had a sudden shift in their nutrition status after rules that
have been made which prevent killing of animals without providing them with
alternatives that would make up for the loss of nourishment.
Attapadi has again highlighted the implications of extreme poverty and
inaccessibility. Attapadi is a stark reminder of how forgotten tribal communities can
become and what contexts of direness are produced by extreme poverty, remoteness
and the non-provision of services by an administration.
248 SCSTRTI, National Research Study of Implementation of FRA in Neighbouring States of Odisha, 2013 (Draft Report) at page
216. 249 Right to Food Commissioners, A Special Report on Most Vulnerable Social Groups and Their Access to Food, 8 th Report of
the Commissioners of the Supreme Court in the case: PUCL v. UOI & Ors. Writ Petition (Civil) No. 196 of 2001, August 2008. 250 Ibid. 251Deaths of unnamed children: Malnutrition and Destitution among Adivasis in Kerala, Adv. Clifton D’ Rozario Advisor to
Commissioners of the Hon’ble Supreme Court in the case: P.U.C.L. versus UoI & Ors., (W.P. No. 196 of 2001) May 2013.

317
An ‘Attapadi package’ was put together “intended to improve the health services,
functioning of the Anganwadis and also revive traditional agricultural practices in the
region, along with implementation of the Kurumba package which itself includes
house construction, buying of land, electrical works, soil conservation, drinking water
program, road, health, poverty alleviation, community area development, etc.”
Although this was a response to an emergency, it reveals the extent of systemic
changes needed to deal with situations of extreme poverty and vulnerability.
Years of deprivation has caused malnutrition rates to escalate. Control over forest
resources is, therefore, essential for the survival of PVTGs. In recognition of this
vulnerability, the FRA has a special provision for PVTGs for “rights including
community tenures of habitat and habitation” under Section 3(1) (e). Habitat is
defined as including the ‘area comprising the customary habitat and such other
habitats in Reserved Forests and Protected Forests’.252
In the Orissa Mining Corporation. v. MoEF case,253 the Court pointed to the FRA
Rules, 2012 which state:
(c) “In view of the differential vulnerability of Particularly Vulnerable Tribal Groups (PTGs)
amongst the forest dwellers, District Level Committee should play a pro-active role in
ensuring that all PTGs receive habitat rights in consultation with the concerned PTGs’
traditional institutions and their claims for habitat rights are filed before the concerned Gram
Sabhas.” 254
The Rules further state that the DLC is also vested with the function of examining
whether claims filed by PVTGs have been addressed keeping in mind the objectives
of the FRA.255
For PVTGs, the implementation of FRA has been poorest since their habitat rights are
not clearly defined or understood by the Forest Department. No disaggregated
information and data at the national level on status of the implementation of the
provision for rights of PVTGs particularly of habitat rights under the FRA. The Joint
Committee Report, 2010, found that “Orissa is the only state that has taken some pro-
active steps on PTGs and issued a number of circulars focusing their rights, and
entrusted the responsibility on the micro-project officers and project administrators of
ITDAs, but neither ‘habitat right’ nor CFRs in any case has been finalized.”256 Out of
the 75 PVTGs, there are hardly one or two examples of habitat rights claims (claims
252 S. 2(h) of the FRA states “"habitat" includes the area comprising the customary habitat and such other habitats in reserved
forests and protected forests of primitive tribal groups and pre-agricultural communities and other forest dwelling Scheduled
Tribes” 253 Orissa Mining Corporation v. MoEF (2013) 6 SCC 476. 254 Rule 12B, FRA Rules, 2012. 255 Rule 8B, FRA Rules, 2012. 256 Report, National Committee on the Forest Rights Act, December 2010, A Joint Committee of Ministry of Environment and
Forests and Ministry of Tribal Affairs, Government of India.

318
by the Juangs in Keonjhar, Odisha and by Madia in Bhamragarh of Maharashtra). The
claims by the Juangs are still pending.257
Some problems that arise for tribal communities in claiming habitat rights include:
lack of clarity over definition and interpretation of what is entailed in habitat rights;
multiple interpretations of habitat, especially if the user rights of other, non-PVTG
groups sharing the same territory are involved; or if the traditional habitat boundaries
of PVTGs overlap with wildlife habitats; and a lack of awareness among such
communities about the terms in which to articulate such claims. The definition of
‘habitat’ among PVTGs is still evolving. One example is the work being done in the
Baigachak area of Dindori district, Madhya Pradesh to document the traditional
‘garhs’ or places of origin of the Baigas, a forest-dependent PVTG belonging to
Madhya Pradesh and Chhattisgarh. Garhs are sacred paces (villages, trees, rocks, or
caves) that could extend much further than the traditional village or forest boundaries
of Baigas resident in one particular area. Garhs are often in Reserved Forests, and are
associated with deities, sacred plants and totemic animal species revered and
protected by particular clans of the Baigas. The worship of garhs is a living tradition.
Activists in Dindori are attempting, through tracing the garhs of various Baiga clans,
to establish a history of the range and pattern of movement through which Baigas
have settled in their present habitations.
The difference between states of poverty and of vulnerability has been explored in the
context of PVTGs. It is doubtless true, that many communities of Scheduled Tribes,
and more particularly of PVTG, can be classified as being in poverty. Yet, their
access to resources in forests makes a difference to the extent of their vulnerability.
Where there has been a depletion of forest cover, and the emphasis is on timber trees,
it was pointed out that the effect was to add to the vulnerability of PVTGs. Where, on
the other hand, the resources are safeguarded and the community has access, the
ability to prevent nutritional distress can be augmented.
There are attempts underway to document and give value to the resources which are
found in PVTG areas. The Jana Swasthya Sahyog in Chhattisgarh has, for instance,
identified the various food, fruits and flora in the region and explained the nutritional
value of the produce (Annexure 4).
The depletion of these resources, or denial of access to the resources, threatens a
descent from poverty to vulnerability. This is a tangible loss and must be accounted
for, and averted, when any program or project is proposed.
257A Report of The National Level Public Hearing On Community Forest Rights on 14th December 2013 Organized by
Community Forest Rights Learning and Advocacy Process (CFR-LA) and Adivasi Janjati Adhikar Manch (AJAM) Community
Forest Rights-Learning and Advocacy Process (CFR-LA).

319
9.2.5 Women
The committee has noted that women’s participation in processes under the FRA
remains low. Women are dependent on forest and forestland for their livelihood and
active participants in the various forest activities. In a telling statement, the women’s
cooperative President in Panibhandar village in Odisha reportedly said in an
interview, “My land and forest is important for me, what will I do with other things if
there is no right over forest. Forest is the only resource from which women are getting
income.”258 The absence of their voice at various levels (from Gram Sabhas to forest
committees) means that critical issues are often overlooked.
Empowering provisions for women under FRA include:
Section 2(g) of the Act provides for the full and unrestricted participation of
women in Gram Sabha
Rule 4 (2) provides that “The quorum of the Gram Sabha meeting shall be not
less than one-half of all members of such Gram Sabha: Provided that at least
one-third of the members present shall be women
Rule 3 (1) provides that not less than 1/3rd of the members of the FRC shall be
women
Rule 5 (c) requires that at least one of the three PRI members nominated to the
SDLC shall be a woman.
Similarly, rule 7 (c) requires that out of the three members of the district
panchayat to be nominated to the DLC by the district panchayat, at least one
shall be a woman
Section 4 (4) A right conferred by sub-section (1) shall be heritable but not
alienable or transferable and shall be registered jointly in the name of both the
spouses in case of married persons and in the name of the single head in the
case of a household headed by a single person.
There has been little perceptible effort to create awareness among women regarding
the process of claim making, verification and the rules relating to it.259 However,
according to the field study, most women gain awareness through NGOs working in
their area and through their cooperative societies. A large majority (80 percent) are
not aware of the amount of land claimed by their husbands and how much land is
recognized.260
258 Vasundhara, Draft Report on Women and Land: Scope under Forest Rights Act, Odisha, 2014 at page 16. 259 Vasundhara, Draft report on Women and Land: Scope under Forest Rights Act, Odisha, 2014 at page 19. 260 Vasundhara, Draft report on Women and Land: Scope under Forest Rights Act, Odisha, 2014 at page 16.
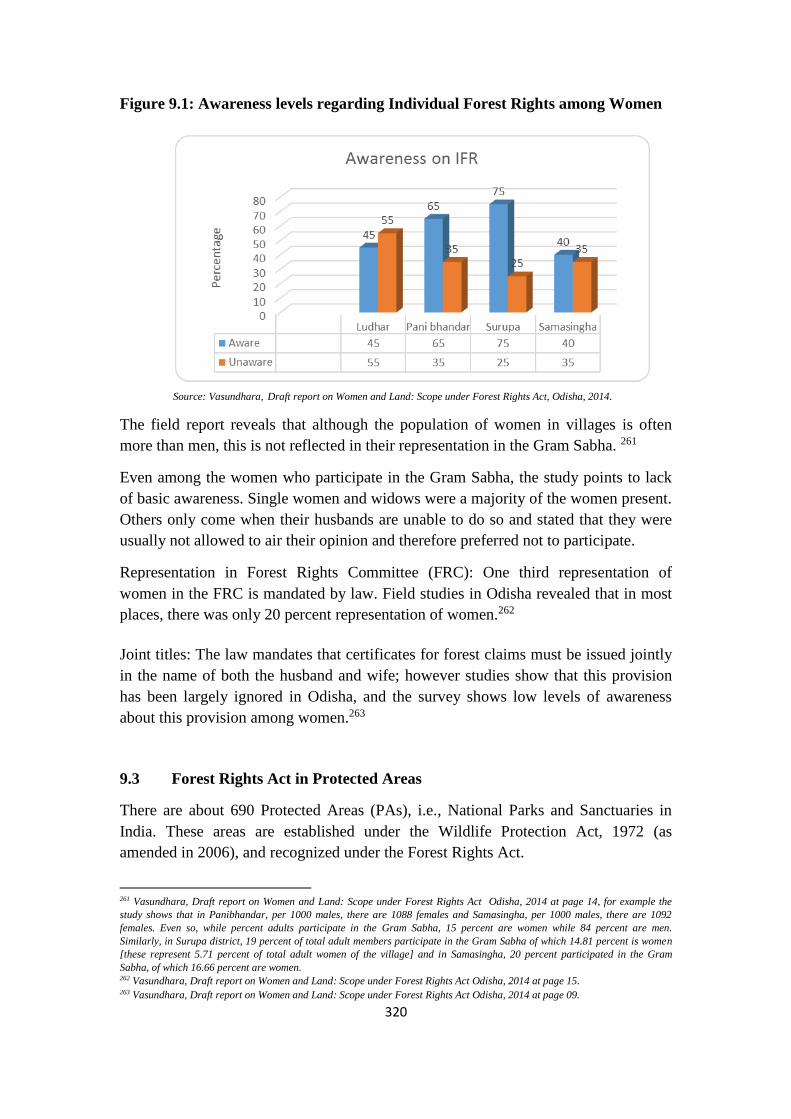
320
Figure 9.1: Awareness levels regarding Individual Forest Rights among Women
Source: Vasundhara, Draft report on Women and Land: Scope under Forest Rights Act, Odisha, 2014.
The field report reveals that although the population of women in villages is often
more than men, this is not reflected in their representation in the Gram Sabha. 261
Even among the women who participate in the Gram Sabha, the study points to lack
of basic awareness. Single women and widows were a majority of the women present.
Others only come when their husbands are unable to do so and stated that they were
usually not allowed to air their opinion and therefore preferred not to participate.
Representation in Forest Rights Committee (FRC): One third representation of
women in the FRC is mandated by law. Field studies in Odisha revealed that in most
places, there was only 20 percent representation of women.262
Joint titles: The law mandates that certificates for forest claims must be issued jointly
in the name of both the husband and wife; however studies show that this provision
has been largely ignored in Odisha, and the survey shows low levels of awareness
about this provision among women.263
9.3 Forest Rights Act in Protected Areas
There are about 690 Protected Areas (PAs), i.e., National Parks and Sanctuaries in
India. These areas are established under the Wildlife Protection Act, 1972 (as
amended in 2006), and recognized under the Forest Rights Act.
261 Vasundhara, Draft report on Women and Land: Scope under Forest Rights Act Odisha, 2014 at page 14, for example the
study shows that in Panibhandar, per 1000 males, there are 1088 females and Samasingha, per 1000 males, there are 1092
females. Even so, while percent adults participate in the Gram Sabha, 15 percent are women while 84 percent are men.
Similarly, in Surupa district, 19 percent of total adult members participate in the Gram Sabha of which 14.81 percent is women
[these represent 5.71 percent of total adult women of the village] and in Samasingha, 20 percent participated in the Gram
Sabha, of which 16.66 percent are women. 262 Vasundhara, Draft report on Women and Land: Scope under Forest Rights Act Odisha, 2014 at page 15. 263 Vasundhara, Draft report on Women and Land: Scope under Forest Rights Act Odisha, 2014 at page 09.

321
Table 9.2: Protected Areas of India264
Protected Areas No. Area (km2) Percent of Geographical Area
of India
National Parks 102 40075 1.22
Wildlife Sanctuaries 526 124239 3.78
Conservation Reserves 57 2017.94 0.06
Community Reserves 4 20.69 0.0
Protected Areas 689 166352.63 5.06
Geographical Area of India (FSI, 1999) = 32,87,263 km2
Recorded Forest Area of India (FSI, 2001) = 768,436 km2
Forest Area = 23.38 percent of Geographical Area of India
Approximately, three million people in India, most of whom are tribals, live inside
PAs and are dependent on them for forest resources. However, in the decades running
into a century, forest dwelling and forest dependent tribal communities were treated
as encroachers and forest offenders even when, for instance, they would be found
collecting minor forest produce. The FRA recognizes not only the right that the tribals
and the Other Traditional Forest Dwellers(OTFDs)265 have in relation to the forest,
but it also empowers the holders of any forest right, Gram Sabha and village level
institutions in areas where there are holders of any forest right under this Act to:
“(a) Protect the wild life, forest and biodiversity;
(b) Ensure that adjoining catchments area, water sources and other ecological sensitive
areas are adequately protected;
(c) Ensure that the habitat of forest dwelling Scheduled Tribes and other traditional
forest dwellers is preserved from any form of destructive practices affecting their
cultural and natural heritage;
(d) Ensure that the decisions taken in the Gram Sabha to regulate access to community
forest resources and stop any activity which adversely affects the wild animals, forest
and the biodiversity are complied with.”266
264 Data prepared by ENVIS Centre on Wildlife and Protected Areas, hosted by Wildlife Institute of India, Dehradun, Sponsored
by Ministry of Environment and Forests, Govt. of India entitled “Protected Areas of India from 2000-2013” available at
http://wiienvis.nic.in/Database/Protected_Area_854.aspx. Last accessed on 4.4.2014. Data updated as on 31.3.2013. 265 Under S.2 (o) of the FRA, other traditional forest dwellers (OTFDs) are defined as any member of the community who has for
at least three generations prior to the 13th day of December, 2005, primarily resided in and who depend on the forest or forests
land for bona fide livelihood needs. Under S. 3 of the FRA, OTFDs are vested with a host of rights including individual and
community forest rights. 266 S. 5 of the FRA

322
There have been situations where tribals and OTFDs have continued to be viewed as
communities who should be evicted from the forest so as to pursue other conservation
goals. Most states exclude PAs from the application of the FRA due to a lack of
understanding and awareness of the law, and that the tribal population is a menace to
wildlife in those areas.267 Moreover, forced eviction, relocation and harassment by
forest officials is commonplace.268 Reports suggest that between 100,000 and 300,000
people have been evicted from protected areas at different times269. This is despite the
law stating that eviction before verification and settlement of claims under the FRA is
complete, is unlawful.270 Yet widespread displacement of tribals continues to occur.271
This has caused a decline in their economic status, as well as erosion of their
customary forest practices.272 A detailed issue-based analysis is provided below.
9.3.1 Critical Wildlife Habitats (CWH)
Critical Wildlife Habitats (CWH) are a specific kind of protected area, defined under
the FRA as, “areas of National Parks and Sanctuaries where it has been specifically
and clearly established, case by case, on the basis of scientific and objective criteria,
that such areas are required to be kept as inviolate for the purposes of wildlife
conservation as may be determined and notified by the Central Government in the
Ministry of Environment and Forests after an open process of consultation by an
Expert Committee, which includes experts from the locality appointed by that
Government wherein a representative of the Ministry of Tribal Affairs shall also be
included, in determining such areas according to the procedural requirements arising
from sub-sections (1) and (2) of section 4.”273
The following constitute the conditions laid down under the FRA, all of which must
be fulfilled, before declaring CWHs.
a. The process of recognition of forest rights in PAs must be complete
b. The impact caused by the presence of the rights holders must be sufficient to
cause irreversible damage to the species and their habitat
267 Regional Consultations on Implementation of the Forest Rights Act: Amendments in the Rules and the Way Forward
organized by Ministry of Tribal Affairs in collaboration with UNDP hosted by the State Tribal Welfare Departments. 268Standing Committee on Social Justice and Empowerment (2011 - 2012) (Fifteenth Lok Sabha) by Ministry of Tribal Affairs 269Lasgorceix, A., and A. Kothari, 2009. “Displacement and relocation of Protected Areas: A synthesis and analysis of case
studies”. Economic and Political Weekly, 44(49): 37-47. 270 See S. 4(2) of FRA 271 Summary of Recommendations by National Advisory Council on FRA 272Recognition of Rights and Relocation in relation to Critical Tiger Habitats (CTHs) Status under The Scheduled Tribes and
Other Traditional Forest Dwellers (Recognition of Forest Rights) Act (FRA), 2006, and Wild Life (Protection) Amendment Act
(WLPA), 2006, Legislation Brief by Kalpavriksh. 273 S. 2(b) of FRA states “"critical wildlife habitat" means such areas of National Parks and Sanctuaries where it has been
specifically and clearly established, case by case, on the basis of scientific and objective criteria, that such areas are required to
be kept as inviolate for the purposes of wildlife conservation as may be determined and notified by the Central Government in the
Ministry of Environment and Forests after open process of consultation by an Expert Committee, which includes experts from the
locality appointed by that Government wherein a representative of the Ministry of Tribal Affairs shall also be included, in
determining such areas according to the procedural requirements arising from sub-sections (1) and (2) of section 4”

323
c. The State government concludes that co-existence is not possible
d. A resettlement package has been prepared and communicated to the affected
communities
e. Free and informed consent of the Gram Sabha to the proposed resettlement has
been taken
f. No resettlement to take place until land allocation according to the promised
package is complete.274
Rushed notification of CWH by government agencies leads to a host of problems that
overlook the conditions required by FRA.275
9.3.2 Non-recognition and rejection of Community Forest Rights claims
CFRs assume special importance in PAs as the FRA defines the use of community
forest resource to which the community had traditional access within protected areas
like national parks and sanctuaries.276 There are certain incorrect assumptions
regarding implementation of the FRA. At the Forest Department level, it was
believed that rights under FRA couldn’t be claimed in PAs or when resettlement was
already underway before the FRA was enacted, and that FRA is not applicable in
Tiger Reserves.277 In Tamil Nadu’s State Action Plan, it is stated that Minor Forest
Produce collection in PAs is not affected by FRA because it is not a traditional right.
The Government of Sikkim via a notification dated 28.1.2008 constituted an Expert
Committee for identification of Critical Wildlife habitats in Protected Areas. It has
also constituted other Committees under the Act namely SDLC, DLC and SLMC.
However, the Government has remarked that ‘In Sikkim, there are no Forest Dwelling
274 S. 4(2) of FRA states “Recognition of, and vesting of, forest rights in forest dwelling Scheduled Tribes and other traditional
forest dwellers. - (1) Notwithstanding anything contained in any other law for the time being in force, and subject to the
provisions of this Act, the Central Government hereby recognizes and vests forest rights in- (a) the forest dwelling Scheduled
Tribes in States or areas in States where they are declared as Scheduled Tribes in respect of all forest rights mentioned in section
3; (b) the other traditional forest dwellers in respect of all forest rights mentioned in section 3. (2) The forest rights recognized
under this Act in critical wildlife habitats of National Parks and Sanctuaries may subsequently be modified or resettled, provided
that no forest rights holders shall be resettled or have their rights in any manner affected for the purposes of creating inviolate
areas for wildlife conservation except in case all the following conditions are satisfied, namely:-(a) the process of recognition
and vesting of rights as specified in section 6 is complete in all the areas under consideration; (b) it has been established by the
concerned agencies of the State Government, in exercise of their powers under the Wild Life (Protection) Act, 1972 that the
activities or impact of the presence of holders of rights upon wild animals is sufficient to cause irreversible damage and threaten
the existence of said species and their habitat; (c) the State Government has concluded that other reasonable options, such as,
co-existence are not available; (d) a resettlement or alternatives package has been prepared and communicated that provides a
secure livelihood for the affected individuals and communities and fulfils the requirements of such affected individuals and
communities given in the relevant laws and the policy of the Central Government; (e) the free informed consent of the Gram
Sabhas in the areas concerned to the proposed resettlement and to the package has been obtained in writing; (f) no resettlement
shall take place until facilities and land allocation at the resettlement location are complete as per the promised package:
Provided that the critical wildlife habitats from which rights holders are thus relocated for purposes of wildlife conservation
shall not be subsequently diverted by the State Government or the Central Government or any other entity for other uses.” 275 See Ajay Dubey. V National Tiger Conservation Authority and Ors, Petition for Special Leave to Appeal (Civil) No(s).
21339/2011 276 S. 2(a) of FRA states “"community forest resource" means customary common forest land within the traditional or customary
boundaries of the village or seasonal use of landscape in the case of pastoral communities, including reserved forests, protected
forests and protected areas such as Sanctuaries and National Parks to which the community had traditional access.” 277 Report, National Committee on the Forest Rights Act, December 2010, A Joint Committee of Ministry of Environment and
Forests and Ministry of Tribal Affairs, Government of India.

324
Scheduled Tribes and Other Traditional Forest Dwellers in the true sense of the terms.
Most of the Scheduled Tribes of Sikkim hold revenue land in their own name and
they are not solely dependent on the forests for their livelihood.’ This kind of
misinterpretation and non-implementation of the FRA makes recognizing CFRs more
problematic in PAs.
Pending claims are common in PAs, since officials incorrectly believe that FRA is not
applicable in these areas. In the Palamu Tiger Reserve in Jharkhand, CFR claims have
been pending since 2011. In Biligiri Rangaswamy Temple Sanctuary (Karnataka),
Soliga adivasis have applied for CFRs with detailed documentation and maps, yet
their claims have been pending. In Wadala, in Tadoba Andhari Tiger Reserve, CFR
claims were rejected by the SDLC, because the villagers would have a negative
impact on the area. In Badrama Wild life Sanctuary in Sambalpur CFR rights are not
being recognized.278 The Raika tribe in Rajasthan are a pastoral community. However,
for grazing cattle in Kumbhalgarh Sanctuary of Rajasthan, no permits have been
issued to them since 2002, though higher penalties are being imposed for grazing in
the PAs.279,280 A possible reason for rejection of claims is that the area claimed does
not use new technology like satellite imagery and instead relies on traditional methods
of land demarcation.281
9.3.3 Consultation with and consent of the Gram Sabha
Both the FRA and the Wildlife Protection Act, 1972 amended in 2006(WLPA),
require that the Gram Sabhas of the affected areas be consulted before declaring
CWHs or PAs. Examples indicate that this provision remains in disuse. In Yawal
Wildlife Sanctuary of Maharashtra, a committee was formed for demarcation of a
CWH minus participation from the affected villagers.282 Often Gram Sabhas are
neither sent notices for consultation, nor are their consent signatures taken by the
Government for declaring CWHs.283 Further field visits to Sariska tiger reserve have
indicated that Gram Sabha Consent has not been taken, only individual families have
been approached by the Forest Department. Further, they have been ‘informed’ that
they must consent to one of two options under the compensation scheme-cash for
land, or land for land. If they do not choose either, they will have missed the
opportunity.284
278Desor. S(ed.) 2013 , Community Forest Rights under Forest Rights Act: Citizens Report 2013, Kalpavriksh, Pune and
Vasundhara, Bhubhaneshwar, with Oxfam, Delhi, on behalf of Community Forest Rights Learning and Advocacy Process 279 See Ibid. 280 See Ibid. 281 Regional Consultations on Implementation of the Forest Rights Act: Amendments in the Rules and the Way Forward
organized by Ministry of Tribal Affairs in collaboration with UNDP hosted by the State Tribal Welfare Departments in 2012. 282 See Ibid. 283 See Ibid 284 Legislation Brief by Kalpavriksh, “Recognition of Rights and Relocation in relation to Critical Tiger Habitats (CTHs) Status
under The Scheduled Tribes and Other Traditional Forest Dwellers (Recognition of Forest Rights) Act (FRA), 2006, and Wild
Life (Protection) Amendment Act (WLPA), 2006.” This legislation brief is based on analysis and interpretation of those
provisions of Wild Life (Protection) Amendment Act (WLPA), 2006 and The Scheduled Tribes and Other Traditional Forest

325
9.3.4 Relocation without following process under WLPA and FRA
The FRA makes it abundantly clear that relocation cannot be undertaken without
rights recognition and consent of the Gram Sabha, among other conditions. The focus
remains on relocation instead of exploring co-existence.285 Even so, there are
examples of illegal relocation in the areas of Bandipur and Nagarhole National Park
in Karnataka, Simlipal in Odisha, Sariska in Rajasthan, and Udanti and Achanakmar
in Chhattisgarh.286 A letter by the Additional Inspector General (FC), MoEF (FP
Section) compelled the Scheduled Tribes in the National Parks and Wildlife
Sanctuaries to leave the premises of National Parks and Wildlife Sanctuaries without
settling the rights under the provisions of the FRA.287 In 2012 the Ministry of Tribal
Affairs communicated to the Chief Ministers of State Governments that tiger and
wildlife habitats were being demarcated in violation of the law, and affected tribals
were being asked to relocate without settlement of rights.288
9.3.5 Tiger Reserves
There are 41 Tiger Reserves in India declared under the WLPA 2006. The Tiger
Reserve areas largely overlap with the Scheduled Areas where the population is
predominantly tribal. The WLPA defines critical tiger habitat and ‘core’ or ‘buffer’
areas. The purpose of this Act was to attain the objectives of ‘tiger conservation’
while ensuring that the rights of tribal people living in and around Tiger Reserves are
not impeded. Tiger Reserves are to be notified by the State Governments on the
recommendations of National Tiger Conservation Authority (NTCA).289 Core and
buffer/peripheral areas must also be designated and included in the tiger reserve, at
the time of notification. As per explanation (i) of Section 38(v) (4) of Wildlife
Protection Act:
“For the purposes of this section, the expression “Tiger Reserve” includes Core or Critical
Tiger Habitat (CTH) areas of national parks and wildlife sanctuaries where it has been
established on the basis of scientific and objective criteria, that such areas are required to be
kept as inviolate for the purposes of tiger conservation, without affecting the rights of the
Dwellers (Recognition of Forest Rights) Act (FRA), 2006 which deal with relocation from Tiger Reserves and Critical Wildlife
Habitats; Data was obtained from field visits to Melghat and Sariska Tiger Reserves; from the NGO Khoj, Melghat
(Maharashtra) and the NGO Krapavis, Alwar (Rajasthan), respectively. Also referred to was a December 2010 report entitled
Land Rights Violations at Achanakmar Wildlife Sanctuary (Chhattisgarh) by Nadi Ghati Morcha, Baiga Mahapanchayat, and
Equations, and other documents obtained from National Tiger Conservation Authority (NTCA) using the Right to Information
(RTI) Act. 285 Regional Consultations on Implementation of the Forest Rights Act: Amendments in the Rules and the Way Forward
organized by Ministry of Tribal Affairs in collaboration with UNDP hosted by the State Tribal Welfare Departments in 2012. 286 Report, National Committee on the Forest Rights Act, December 2010, Joint Committee of Ministry of Environment and
Forests and Ministry of Tribal Affairs, Government of India. 287 Letter by Shri. Mohan Lal, AIG(FC) dated 21st June 2010 288 Letter from MoTA to Chief Ministers of Himachal Pradesh, Nagaland, Mizoram, Manipur, Assam, Meghalaya, Chhattisgarh,
Madhya Pradesh, Maharashtra, Odisha, Uttarakhand, Tripura, Arunachal Pradesh, Kerala, Karnataka, Tamil Nadu and Andhra
Pradesh, dated 24.5.2012 289 S. 38V (1) of the Wildlife Protection Amendment Act, 2006 states “The State Government shall, on the recommendation of the
Tiger Conservation Authority, notify an area as a tiger reserve.”

326
Scheduled Tribes or such other forest dwellers, and notified as such by the State Government
in consultation with an Expert Committee constituted for the purpose”.(emphasis supplied)
Tiger Reserves have assumed greater complications in light of the judicial
intervention by the Supreme Court in a case that has been challenging tiger tourism.290
On 24th July 2012, the Supreme Court issued an order291, stating, among other things
that “till the final directions issued by this court with reference to the guidelines
submitted by the National Tiger Conservation Authority (NTCA), core zone or core
areas in the Tiger Reserved Areas will not be used for tourism.”292 The Court had
directed concerned state governments with tiger reserve areas, to issue and submit
their notifications in relation to core and buffer areas, within 3 weeks from the date of
the order. On 3rd April 2012 the court had also ordered a time bound issuance of
notification viz. within 3 months from the date of that order.
The problem is the disproportionate haste with which state governments have issued
notifications of buffer areas, without following the processes prescribed under the
FRA and the Wildlife Protection Act, of rights settlement, exploring coexistence and
free and informed Gram Sabha consent. The NTCA Relocation Committee Report,
2010, highlights the following issues in connection with the FRA:293
No rights recognition happening in Achankmar, Panna, Sariska reserves
Mostly individual consent, no evidence of ‘Gram Sabha consent’ and
‘informed’ consent. Field investigations of the Sariska reports reveals a lack of
FRA information, while the Achanakmar report mentions only individual
consent
Land option and compensation for actual assets not being made available,
inconsistencies in resettlement package were reported from Sariska, Panna,
Ranthambore, Achanakmar, Panna and Bandhavgarh Tiger Reserves
Insufficient water facilities leading to scarcity for drinking and irrigation in the
resettled land in Achanakmar and Panna.
The Supreme Court orders led the Ministry of Tribal Affairs to intervene. In an
affidavit before the Court, the MoTA stated that core areas and buffer areas categories
have been in existence for a long time. Any further declaration of additional buffer
areas will incorporate large areas of private lands, revenue lands, or forest lands, on
which Scheduled Tribes and other traditional forest dwellers are exercising pre-
290 See Ajay Dubey. V National Tiger Conservation Authority and Ors, Petition for Special Leave to Appeal (Civil) No(s).
21339/2011 291 See Ajay Dubey. V National Tiger Conservation Authority and Ors, Petition for Special Leave to Appeal (Civil) No(s).
21339/2011 292 See Order of the Supreme Court in Ajay Dubey. V National Tiger Conservation Authority and Ors, Petition for Special Leave
to Appeal (Civil) No(s). 21339/2011 293 A study of 4 Tiger Reserves (Simlipal Tiger Reserve in Odisha, Sariska Tiger Reserve in Rajasthan, Melghat Tiger Reserve in
Maharashtra and Achanakmar Tiger Reserve in Chhattisgarh) found that legal requirements (as mentioned above) for creating
CTH or for relocation were not carried out in these. The reports of the NTCA monitoring committees also mention these
violations, as summarized in the table.

327
existing rights. Therefore, “declaration of further Buffer Areas by the State
Governments will cause enormous hardship to the Scheduled Tribes and forest
dwellers who eke out their livelihood in these areas.”294 It goes on to say that
consultation with the local communities, a prerequisite under PESA and FRA, has
been inadequate and non-existent, because of the time bound nature of the orders of
the Supreme Court, causing state governments to respond hastily and without
following the law.
Though, the MoEF has issued a multitude of circulars and guidelines stating that
relocation can only occur if processes under FRA and WLPA are implemented,
ground reality suggests otherwise.295
294 Affidavit of the MoTA in Ajay Dubey v. National Tiger Conservation Authority and Ors, Intervention Application No. of 2012
in SLP(Civil) No. 21339 of 2011. 295 Refer to letter by MoTA to the Chief Ministers dated 24.5.2012 and letter by Shri. Mohan Lal AIG (FC) dated 21.6.2010.

328
Source: Note on Implementation of Forest Rights Act in Simlipal Tiger Reserve and Relocation of Villages-Report prepared by
Vasundhara, February 2014; Tiger protection, Maoism and the Forest Rights Act: The story of Jenabil-Report Prepared
by Puspanjali Satpathy and Gunjan Jain, March 2010 also available at http://www.fra.org.in/Jenabil%20displacement.pdf; The
FRA process in Mayurbhanj: An attempt to undo the wrongs of the past-Report prepared by Vasundhara, 2013
9.3.6 Elephant Corridor
In April 2011, the Madras High Court heard a case in which the Principal Chief
Conservator of Forest and the Chief Wildlife Warden had suggested that the
private/patta land forming the traditional movement corridors of animals particularly
the elephants, be brought under the control of the Forest Department by acquiring the
land and paying compensation to the owners.296 The Expert Committee set up by the
court, comprising five senior forest officials, has stated in its report that “all revenue
296 In Defence of Environment and Animals v. The Principle Chief Conservator of Forest and Ors, WP No. 10098 of 2008.
Case study of Simlipal Tiger Reserve
Problems in connection with the notification of the Simlipal Tiger Reserve include relocation and
resettlement without following the process under the FRA and WLPA, as well as tribals being
restricted by forest guards from using Non Timber Forest Produce (NTFP) within the reserve.
The Simlipal tiger reserve is located in the Mayurbhanj district of Odisha. There are 65 villages
situated inside the Sanctuary area of which 61 villages are in the buffer area and 4 villages are in the
core area. According to the 2001 Census, the Scheduled Tribe population in the Simlipal area is around
11,520 (91.77per cent) and includes two particularly vulnerable tribal groups (PVTGs), namely,
Khadia and Mankidia, who depend primarily on the forests of Simlipal. These communities are
originally nomadic tribes, known for making siali ropes, catching and eating monkeys and live in areas,
which are now part of the Simlipal Tiger Reserve. Their nomadic pattern is seasonal and depends on
availability of non-timber forest products (NTFPs). In order to discourage this custom of killing
monkeys and to decrease their use of siali (which is one of the main sources of food for elephants),
many PVTGs in Mayurbhanj were relocated by the State government from the Simlipal Tiger Reserve
areas into permanent colonies run by the Integrated Tribal Development Agency (ITDA). These
PVTGs are restricted by forest guards to enter into the Similipal area to collect NTFPs such as the Siali
Bark, amra, mahua, char and sal leaves, which they have always traditionally collected.
Field studies indicate that 61 families belonging to the Khadia community were relocated from the
village of Jenabil within the Similipal reserve, to Ambadiha colony in 2010. However, as per
information shared by the families, the relocation was carried out without recognition of their rights
under FRA and WLPA. Reportedly, individual land claims under the FRA had been made by Jenabil
residents, however, they were immediately struck down by Forest Department officials, as they were in
a Tiger reserve area. Post-relocation facilities in Ambadiha are also poor. Land was demarcated for
them to cultivate but was not yet formally handed over to the relocated families, neither were there
irrigation facilities. Another village, Kabataghai, which is a revenue village, in the Jashipur block is
one of the core villages to be relocated. The village consists of 35 households of Scheduled Tribes. The
villagers organized a Palli Sabha in June 2011 to discuss the proposed relocation where they opposed
it. They have also submitted 23 individual forest rights claims which are yet to be recognized. Petitions
have been filed by the Kabatghai village with the State Level Monitoring Committee in 2011 against
the relocation process. About 32 families residing in both UparBarhakamuda and Bahaghara
settlements have been relocated from the core area in November 2013. As, in other relocations, in this
case, too the legal procedure under FRA and WLPA has not been followed.

329
lands within the elephant corridor area should be handed over to the Forest
Department.”
The High Court had said that:
with regard to the forest dwellers whose interests are protected under the FRA, the State
government is directed to strictly adhere to and comply with the Act (FRA) when dealing with
forest dwellers and others who fall within the ambit of the act and the case of any forest
dweller who is evicted from the identified elephant corridor, they be provided with best
alternate and suitable accommodation.’
This matter is now before the Supreme Court.
The local tribals were apprehensive that the order would be used to evict them from
areas that were being declared as part of the elephant corridor. This anxiety is also
reflected in the affidavit of the Ministry of Environment and Forest in the Supreme
Court, which speaks of 700 families mostly dalits and tribals, who are dependent on
the land for their livelihood. The affidavit filed in 2012, points out that the rights of
the occupants have not been settled yet under the FRA. The Elephant Task Force in
2010297 had categorically stated that “the Task Force is convinced that local people
resident in the reserve area should be partners and allies for conservation and not be
treated as adversaries.” This is in keeping with the provisions of the FRA cited above.
Tribals whom the Committee spoke to near the Mudumalai Reserve in Tamil Nadu
spoke with a conviction that their eviction was a means for the Forest Department to
reassert control over their land. This was a common refrain in places where the
elephant corridor is seen as threatening to dispossess tribals. It was also a sign of a
breakdown of trust between the tribals and the Forest Department which needs to be
urgently addressed.
Both the Tiger Reserve and Elephant Corridor cases demonstrate the deliberate
circumvention of provisions of the PESA and the FRA by state governments. It also
shows how tribals find themselves caught between conservationists and the forest
bureaucracy.
9.3.7 Evictions: Letter dated May 3, 2002
The preamble of the FRA recognizes the rights of forest dwelling communities
evicted from their lands at the hands of the state: “and whereas it has become
necessary to address the long standing insecurity of tenurial and access rights of forest
dwelling Scheduled Tribes and other traditional forest dwellers including those who
were forced to relocate their dwelling due to state development interventions”.
297 Gajah, Securing the future of Elephants in India, the Report of the Elephant Task Force, Ministry of Environment and
Forests, August 31st 2010.

330
This recognition comes in light of a long history of arbitrary forced evictions of these
communities. The colonization of forest land took place, first through the operation of
the Indian Forest Act, by earmarking ‘reserved forests’, and thereafter evicting forest
dwelling communities. Evictions have continued in the post-colonial phase,
sometimes for “conservation” and at others for “scientific forestry”.
In a letter dated 28th May 1990, the Commissioner for Scheduled Castes and
Scheduled Tribes highlighted how state government orders which recognized the
rights of tribal communities were being openly disregarded. The MoEF in turn issued
six circulars which also remained dead letter.
On 3rd May, 2002, the Inspector General of Forests (IGF) issued a letter to the Chief
Secretaries of all States, directing State authorities to prepare a time bound program
for summary eviction of all encroachments not eligible for regularization. This was
supposedly in a follow up to a Supreme Court order in Godavarman Thirumulpad v.
UOI dated 23rd November, 2001.
What this court order actually did was merely restrain the Central government from
regularizing encroachments in the country, without the court’s permission. The IGF’s
letter was, in effect, a misinterpretation of this order of the court. What resulted was
large scale forced evictions of tribal communities by the state. The scale is indicated
in the figures below:
Table 9.3: Figures on Encroachments, Regularization and Evictions (31.3.2004)
State/UT Existing
encroachment
(pre and post
1980) in ha
Total (pre-1980)eligible
encroachments regularized over
forest area by Central
Government(in ha)
Encroachments evicted
from forest lands since
May, 2002 (in
hectares)
Andhra Pradesh 2,95,383.000 0.000
Assam 2,99,710.000 71,740.000
Arunachal
Pradesh
3887.810 13,419.290 150.190
A& N Islands 2057.490 1367.000 2580.400
Bihar 251.869 602.3131
Chandigarh 0.000 0.000
Chhattisgarh 150,495.000 0.000
Delhi 0.000 0.000
Daman & Diu 87.960 0.000
D& Nagar Haveli 614.350 0.000
Gujarat 22,139.540 31,982.800 14,416.860
Goa 1012.000 0.000
Haryana 1274.060 873.840
Himachal
Pradesh
2841.875 84.124
J&K 9284.000 1806.000
Jharkhand 48,438.410 1,739.390
Karnataka 67710.000 14848.830 19,948.000
Kerala 7,290.000 28,588.159 2,183.000
Lakshwadeep 0.000 0.000

331
Maharashtra 79,641.730 13,557.660
Manipur 533.240 2.750
Meghalaya 6584.490 0.000
Madhya Pradesh 138,110.585 275,405.692 8,071.640
Mizoram 18759.616 0.000
Nagaland 0.000 0.000
Orissa 42,605.530 29.940 2463.434
Punjab 6812.806 420.767
Pondicherry 0.000 0.000
Rajasthan 6712.742 8360.412
Sikkim 3499.640 50.450
Tamil Nadu 17555.564 1698.284
Tripura 59,336.150 27.400 0.000
Uttaranchal 9668.000 280.800
Uttar Pradesh 27,214.630 361.900
West Bengal 13,834.536 1007.896
Total 13,43,346.622 3,65,669.111 1,52,400.110 Source: Reply to Lok Sabha Starred Question No. 284 by Shri Tathagata Satpathy and Shri Mahavir Bhagora regarding
regularization of encroachments on forest land, due for reply on 16.8.2004, Annexures I-III. MoEF data as on 31-3-2004,
collected from the States/UTs.
In Bihar the area evicted appears to exceed the existing encroachments. The evictions
have not been reversed, and in most places those evicted have not been able to access
their rights under the FRA. This is a situation where restorative justice and reparation
must be given to those wrongfully evicted.
9.4 Panchayats (Extension to the Scheduled Areas) Act, 1996, (PESA)
Scheduled Areas, because of their richness in natural resources, are, as a letter from
the Ministry of Panchayati Raj stated, historically characterized as susceptible to
pressure from “unscrupulous elements indulging in illegal mining & forest felling”
leading to land alienation, exploitation and “dislocation of the communities and loss
of major sources of livelihood.” Therefore it was vital that customs, rights and
livelihoods of those living in Scheduled Areas were protected.298 Accordingly, the
Provisions of the Panchayats (Extension to the Scheduled Areas) Act, 1996, (PESA),
was enacted, extending Part IX of the Constitution to the Schedule V Areas. In
enabling the Panchayats to ‘function as institutions of self-government’, a state
government is mandated to ensure that the Panchayats at various levels and the Gram
Sabha are endowed inter alia with:
power to prevent alienation of land in the Scheduled areas and to take
appropriate action
to restore any unlawfully alienated land of a Scheduled Tribe
ownership of minor forest produce
298Letter No. N-11012/1/2007-PESA (Pt) from Ministry of Panchayati Raj, New Delhi dated 21st May, 2010 to Chief Secretary,
PESA States.

332
power to enforce prohibition, or to regulate or restrict the sale and
consumption of any intoxicant
power to exercise control over money lending to the Scheduled Tribes
power to exercise control over institutions and functionaries in all social
sectors
power to control local plans, and resources for such plans including tribal sub-
plans
power of prior recommendation in granting prospecting license or mining
leases for minor minerals as well as for grant of concessions for the
exploitation of minor minerals by auction
right to be consulted on matters of land acquisition
power to issue utilization certificates for government works undertaken in
their village.

333
PESA is an acronym for the Provisions of Panchayats (Extension to Scheduled Areas) Act 1996. Article
243-M (4)(b) of the Constitution states that “Parliament may, by law extend the provisions of this Part
(Part IX relating to Panchayats) to the Scheduled Areas…subject to such exceptions and modifications
as may be specified in such law”. And “no such law shall be deemed to be an amendment of this
Constitution…”. It bears reiteration that the provisions of the 73rd Amendment relating to Panchayats do
not automatically apply in Scheduled Areas. They have to be extended to Scheduled Areas by
Parliament subject to “exceptions and modifications”. [Article 243M (4)(b), Constitution of India] This
was in recognition of "the unique characteristics of tribal communities in the Scheduled Areas”[Union of
India v. Rakesh Kumar, (2001) 4 SCC 309, at Para 8]
While Parliament has enacted a law in relation to Panchayats, there is as yet no law on Nagar Palikas in
Scheduled Areas. Article 243-ZC (3) contains a provision parallel to Section 243-M(4)(b). The
committee had their attention drawn to the proliferation of Nagar Palikas in Scheduled Areas and to the
expansion of already established towns and municipalities. This is being done without the consent of
Gram Sabhas which are affected by the proposal to establish or extend a Nagar Palikas or to be merged
with one already in existence. This, as a report points out, creates pockets of `unscheduled areas’
[Shankar Gopalakrishnan, India and the Rights of Indigenous Peoples: Illusion and Disillusion;
Constitutional, Legislative and Administrative Provisions Concerning Indigenous and Tribal Peoples,
2010.] within Scheduled Areas, as cities and towns lose the dynamic that animates villages and hamlets.
In 2008, the Jharkhand High Court held that, despite Article 243-ZC, the law relating to municipalities
that pre-existed the 74th amendment would continue to apply in Scheduled Areas too, because that is
what Article 243-ZF says should be done till the legislature or other competent authority amends or
repeals it. [Uday Shankar Ojha and Ors vs. Jharkhand State Election Commission and Anr, judgment
and order dated 29.02.2008; High Court of Jharkhand; 2008 (2) JCR 249 (Jhr) referred to in ibid.] This
decision does not recognize that the 74th Amendment makes a distinction between other municipalities
and those in Scheduled Areas, and that it is Parliament that has to make a law with `such exceptions and
modifications’ so as to ensure that the constitutional protections that extend to Scheduled Areas do not
get diluted or negated. That Parliament has not performed the task of law making regarding
municipalities in Scheduled Areas cannot be a reason for denying the protections to the tribals. This
would be a way of defeating the purpose of the special status that has been given constitutional
recognition in Article 243-ZC. The law relating to municipalities, without setting out the `exceptions and
modifications’, cannot be constitutionally valid in Scheduled Areas. Till Parliament makes a law that
sets out the `exceptions and modifications’ while extending the law relating to municipalities to
Scheduled Areas, or it makes a fresh legislation for municipalities in Scheduled Areas, any extension of
municipalities or the establishing of new municipalities would be legally untenable.
It may be recalled that in 2001, the Municipalities (Extension to Scheduled Areas) Act was introduced in
the Rajya Sabha. This Bill was referred to the Standing Committee of Parliament on Urban
Development and Poverty Alleviation which, in its fiftieth report in 2003, recommended its adoption
with some modifications. After being listed a few times in the list of business of Parliament, the Bill has
gone into oblivion, indicating a lack of urgency that is contradictory to the constitutional requirement of
a law on municipalities in Scheduled Areas.
However, state wide incorporation of the PESA tenets has been largely absent. Forest Departments in
several states continue to have control over forest produce, and deny access to the tribals. Further, Gram
Sabha consultations have to be merely ‘considered’ by government officials when deciding land
acquisition proposals. Though consideration is mandatory, the choice of words indicates that the final
say rests with the Land Acquisition Officer and not the Gram Sabha. Forged and manipulated Gram
Sabha resolutions, lack of consent before land acquisition and other grave issues still persist in the
implementation of the PESA.

334
9.4.1 The Rules framed by state governments are not compliant with PESA
Definition of Village
Sec 4(b) of the PESA states that “a village shall ordinarily consist of a habitation or a
group of habitations or a hamlet or a group of hamlets comprising a community and
managing its affairs in accordance with traditions and customs.” This is in keeping
with the spirit behind the 73rd constitutional amendment and the PESA, since takes
into consideration the smallest unit of democratic participation, i.e. a village. States
have not respected this provision.
In Orissa for example, the Orissa Gram Panchayat Act, 1964, stipulates that the
‘Grama’ shall have a population of 2000-10000, which, in the case of tribal
habitations, is usually not the case since they have small populations.299 The Himachal
Pradesh Panchayati Raj (Extension to the Scheduled Areas) Rules, 2011 does not
define village at all. It only states that the Gram Sabha shall consist of persons, whose
names are on electoral rolls in the Gram Panchayat.300 All these instances violate
PESA and attack its very core of empowering the Gram Sabha of the village at the
habitation/hamlet or group of habitations/hamlets.
Traditional System of Leadership
PESA also empowers the Gram Sabha under Sec.4 (d), “to be competent to safeguard
and preserve the traditions and customs of the people, their cultural identity,
community resources and the customary mode of dispute resolution.”
In Rajasthan, however, the meeting of the Gram Sabha is presided over by the
Sarpanch of the Gram Panchayat concerned and, in his absence, by the Up-
Sarpanch.301
In Andhra Pradesh, the Sarpanch of the Gram Panchayat is to be the President of the
Gram Sabha and only in his absence can the traditional village leader of the habitation
preside.302 This is completely contrary to the PESA that preserves traditional methods
of leadership.
299 Extracted from an unpublished study titled ‘Local Governance in Scheduled Tribal Areas in the light of Panchayat Raj
(Extension to Scheduled Areas) Act of 1996’, A case study of Maharashtra and Odisha by C.R. Bijoy, Martin Kamodang, Brian
Lobo, Nikunj Bhutia and Mithika D’cruz, Indian Institute of Dalit Studies, New Delhi, June, 2012 300 S 2(d) of the Himachal Pradesh Panchayati Raj (Extension to the Scheduled Areas ) Rules, 2011 defines Gram Sabha as
meaning and consisting of “persons whose names are included in the electoral rolls of a Gram Panchayat” 301 Rule 7 of the Rajasthan Panchayati Raj (Modification of Provisions in their Application to the Scheduled Areas) Rules, 2011
states that “The meeting of the Gram Sabha shall be presided over by the Sarpanch of Gram Panchayat concerned, in his
absence by the Up-Sarpanch. In the absence of both the Sarpanch and the Up-sarpanch, meeting shall be presided over by a
member of the Gram Sabha to be elected for the purpose by a majority of the members present in the meeting.” 302 Rule 4(ii) of the Andhra Pradesh Panchayats Extension to Scheduled Areas (PESA) Rules, 2011 states that “The Sarpanch of
the Gram Panchayat shall be the President of the Gram Sabha.”

335
Consultation on Acquisition of Land, Resettlement and Rehabilitation
Section 4(i) of the PESA states that the “Gram Sabha or the Panchayats at the
appropriate level shall be consulted before making the acquisition of land in the
Scheduled Areas for development projects and before re-settling or rehabilitating
persons affected by such projects in the Scheduled Areas; the actual planning and
implementation of the projects in the Scheduled Areas shall be coordinated at the
State level.”
In Andhra Pradesh, such process is confined only to land owning displaced persons.303
It also states that only Mandal Parishads would be informed of such acquisition,
displacement, rehabilitation and resettlement programs.304 While PESA makes it
mandatory for the government to follow recommendations of Gram Sabha and Gram
Panchayat before granting of mining or prospective licenses and lease of exploration
of minor minerals by auction, the state act instead reduces it to mere consideration of
these recommendations at best and too as prescribed by the state.305
In Himachal Pradesh, the rules in force vest power in the Land Acquisition Officer to
‘consider’ the recommendation of the Gram Sabha regarding the land acquisition
proposal.306 Consultation and consent with the Gram Sabha are virtually non-existent.
In Rajasthan, the recommendation of Gram Sabha shall be considered by the
Government or the authority concerned. If after a second consultation, the
Government or the authority concerned passes an order against the recommendations
of the Gram Sabha, record the reasons for doing so in writing. This is similar to the
rules in Himachal Pradesh.307
303 Rule 5(3) states of the Andhra Pradesh Panchayats Extension to Scheduled Areas (PESA) Rules, 2011 “The Mandal Praja
Parishad after considering all the facts shall make a recommendation regarding the proposed land acquisition and rehabilitation
plan of persons displaced.” 304Rule 5 (1) of the Andhra Pradesh Panchayats Extension to Scheduled Areas (PESA) Rules, 2011 states that ‘When the
Government considers land acquisition under any Act, the Government or the concerned authority will submit to the Mandal
Praja Parishad the following written information along with the proposal: - (i) The complete outline of the proposed project
including the possible impact of the project. (ii) Proposed land acquisition. (iii) New people likely to settle in the village and
possible impact on the area and society, and (IV) The proposed participation amount of compensation, job opportunities, for the
people of the village.’ 305 Rule 5 of the Andhra Pradesh Panchayats Extension to Scheduled Areas (PESA) Rules, 2011 states that “(4) the
recommendation of the Mandal Praja Parishad shall be considered by the Land Acquisition Officer. (5) In case the Land
Acquisition Officer is not in agreement with the recommendations of the Mandal Praja Parishad, he will send the case again to
the Mandal Praja Parishad for consideration. (6) If after a second consultation, the Land Acquisition Officer passes an order
against the recommendations of the Mandal Praja Parishad, he shall record the reasons for doing so in writing. 306 Rule 9(4) of the Himachal Pradesh Panchayati Raj (Extension to the Scheduled Areas) Rules, 2011, states that “the
recommendation of the Gram Sabha shall be considered by the land Acquisition Officer.” 307 Rule 18 of the Rajasthan Panchayati Raj (Modification of Provisions in their Application to the Scheduled Areas) Rules, 2011,
states that “(4) the recommendation of Gram Sabha shall be considered by the Government or the authority concerned. (5) In
case the Government or the authority concerned does not agree with the recommendations of Gram Sabha, it/they shall send the
case again to the Gram Sabha for reconsideration. (6) If after a second consultation, the Government or the authority concerned
passes an order against the recommendations of the Gram Sabha, record the reasons for doing so in writing. (7) In case of
industrial projects, all the Gram Sabhas that are affected by such projects shall be consulted.”

336
Access to and ownership of Minor Forest Produce is not PESA compliant under
various state rules
The FRA defines minor forest produce as including “all non-timber forest produce of
plant origin including bamboo, brush wood, stumps, cane, tussar, cocoons, honey,
wax, lac, tendu or kendu leaves, medicinal plants and herbs, roots, tubers and the
like”.308 The PESA confers the ownership of minor forest produce on the Gram
Sabha.309 However, a Planning Commission report acknowledges that “in absence of
a comprehensive national/central policy/approach, contradictory legal provisions still
prevail while differential state regimes create some of the biggest limitations which
constrain a healthy growth of the Non Timber Forest Produce (NTFP) sector.
Bamboo, for instance, is defined as a ‘minor forest produce’ in the Forest Rights Act,
2006 whereas the Indian Forest Act, 1927 treats it at par with timber. PESA, 1996
gives ownership rights to local communities over MFPs whereas the regime created
under Wildlife Protection Act doesn’t.”310 The report goes on to say that the then
Minister for Environment and Forests wrote letters to state Chief Ministers to
recognize bamboo as a minor forest produce and transfer ownership of the same to
local communities, but the state Forest Departments were unwilling to accept that.
Though monopoly rights of states are legally questionable they continue with this
practice.311
Gadchiroli, Maharashtra is seen an example of how control over bamboo was vested
from the Forest Department and rightly handed over to the Gram Sabha.312 However,
in Andhra Pradesh a state-owned agency, Girijan Cooperative Corporation (GCC),
has obstructed tribals from taking away their non-timber forest produce (hill brooms)
from the Scheduled Areas of East Godavari district. In response, the community
submitted a memorandum to the concerned officials under the FRA. 313 The Andhra
Pradesh Rules on ownership and mode of disposal of minor forest produce states that
it “shall vest with the individual members of Gram Sabha subject to monopoly rights
of GCC … for procurement of MFP, except Bamboo and Beedi leaf. In respect of
Bamboo and Beedi leaf, management, harvesting and disposal shall be done by the
Forest Department…(which) shall pass on the net revenue from such disposal of the
Bamboo and Beedi leaf harvesting from the area allotted to the Gram Sabha, to the
308 S. 2(i) of the FRA 309 S. 4(m) of the PESA. See Ibid. 310 Report of the Sub Group II on NTFP and their Sustainable Management in the 12th 5-Year Plan, September 2011. Submitted
under the Planning Commission’s Working Group on Forests and Natural Resource Management. 311 See “After a century, Odisha villagers get back bamboo rights”, Prafulla Das, The Hindu, 4th March 2013. Available at
http://www.thehindu.com/todays-paper/tp-national/after-a-century-odisha-villagers-get-back-bamboo-rights/article4473425.ece
Last accessed on 4.4.2014 at 6 pm. 312 Report of the Regional Consultation on FRA Implementation in LWE Affected Areas, Organized by Ministry of Tribal Affairs,
Government of India, in collaboration with United Nations Development Program, Hosted by Welfare Department, Government
of Jharkhand, on 30th -31st July, 2013. Also See “Cabinet okays state's first bamboo unit in Gadchiroli”, RamuBhagwat, 6th Feb.
2014. Available at http://timesofindia.indiatimes.com/city/nagpur/Cabinet-okays-states-first-bamboo-unit-in-
Gadchiroli/articleshow/29922491.cms. Last accessed on 3.3.2014 at 745 pm. 313Issues Related to Implementation of the Forest Rights Act in Andhra Pradesh, M Gopinath Reddy, K Anil Kumar, P Trinadha
Rao, Oliver Springate-Baginski, Economic& Political Weekly, April 30, 2011, Vol. XLVI.No. 18

337
respective Gram Sabha.”314 While tribal communities may find support for marketing
and investment of proceeds of sales helpful, the erosion of their autonomy is against
the purpose for which PESA was enacted.
Further, the table below indicates that nearly all state rules are not compliant with
PESA regarding ownership and control over minor forest produce.
Table 9.4: State Position on Minor Forest Produce (as on 2010)
S.No State Status of Minor Forest Produce
1 Andhra
Pradesh
Under Section 242(I) (1) (b) of the Andhra Pradesh Panchayati Raj Act, 1994 the
Gram Panchayat or the Gram Sabha, has powers as may be prescribed in respect of
ownership of Minor Forest Produce(MFP). But the subject law on MFP is not in
compliance with PESA.
2 Chhattisgarh The Federation of the MFP has been set up in the States under Co-operative act of the
State. Collection charges for tendu leaves, dividend and bonus are distributed to the
shareholders, i.e., the tribals who collect leaves. Outsiders do not have any right to
collect MFP in the Scheduled Areas. Subject laws on MFP are not in compliance with
PESA, 1996.
3 Gujarat Under Section 108 (5) (a) of the Gujarat Panchayat Act, 1993 ownership of MFP is
vested with Village Panchayat except MFP found in the areas of National Parks or
Sanctuaries.
4 Himachal
Pradesh
Section 97-I (1) (a) of the Himachal Pradesh Panchayati Raj Act, 1994 vests
the ownership of MFP with the Gram Panchayat or as the case may be, the
GramSabha which shall exercise such functions in such manner and to such extent as
may be prescribed in respect of the ownership of MFP. Subject laws on MFP are not in
compliance with PESA, 1996.
5 Jharkhand Under Section 10 of the Jharkhand Panchayati Raj Act, 2001 the Gram Sabha has been
authorized to decide on the issue of MFP. Subject laws on MFP are not in compliance
with PESA, 1996.Regarding inclusion of the provision in the State
Forest Regulation, the State Forest Department has reported that the issue of
transferring ownership to the Gram Sabha regarding MFP is under process.
6 Madhya
Pradesh
There is a MFP federation that gives back the money collected by the sale of MFP to
the individuals concerned. Subject laws on Minor Forest Produce are not in
compliance with PESA.
7 Maharashtra 54B (g) of the Bombay Village Panchayat Act, 1958 provides that every Panchayat in
the Scheduled Areas shall be competent to regulate exploitation, management and
trade of MFP vested in it, subject to the provisions of the Maharashtra Transfer of
Ownership of Minor Forest Produce in the Scheduled Areas, and
the Maharashtra Minor Forest Produce (regulation of Trade) (Amendment) Act, 1997.
Subject law on MFP is not in compliance with PESA.
8 Orissa Section 44(2) (b) of the Orissa Gram Panchayat Act, 1964 provides that ownership of
the MFPs in the Scheduled Areas is vested in the Gram Panchayats.
The Orissa Gram Panchayat Minor Forest Produce (Administration) Rules, 2002
prescribes the manner in which regulation and control of trade in MFP is to be done by
Gram Panchayats in Scheduled Areas. There are 69 items included in list of MFP.
9 Rajasthan Section 8E of the Rajasthan Panchayati Raj Act, 1994 entrusts the power of
management of MFP to the Gram Sabha subject to such conditions and up to such
extent and in such manner as may be specified by the State Government from time to
time. Source: Press Information Bureau, Government Of India. Last accessed on 1.5.2014 at 3.15 pm. Available
athttp://www.pib.nic.in/newsite/erelease.aspx?relid=60950.
314 Rule 8(II) of the Andhra Pradesh Panchayats Extension to Scheduled Areas (PESA) Rules, 2011.

338
Gram Sabha consent is frequently overridden and forest land is illegally
diverted, as the examples below will indicate:
Example 1: Essel and Mining Company Ltd case in Keonjhar district, Orissa
It appears that no recognition of rights under the FRA is taking place in the mineral
rich mining areas of districts like Keonjhar (under Schedule V). Instead, the
administration has been facilitating illegal diversion of forest land to mining
companies by engineering fraudulent Gram Sabhas of the concerned villages. In a
case concerning diversion of forest land for Essel and Mining Company Ltd., an MLA
from Jharsuguda, Naba Kishore Das, wrote a complaint to the Union Tribal Affairs
Secretary, MoTA. The Union Secretary called for records pertaining to the alleged
Gram Sabha approval of the forest land diversion. During his visit to the area, the
Secretary examined Gram Sabha records and found that Gram Sabhas were held in
Jalahari, Bholbeda, Jajanga Jurudi, Banspani and Khuntpani villages coming under
Joda –Badbil Tahasil on 1st Nov 2013 for obtaining their consent for the diversion of
342.602 ha of forest land out of the total area of 456.1 ha for Essel Mining and
Industries Ltd. It was found that in the same meeting it was decided that the villagers
had no forest rights and that they had no objection to the diversion of the concerned
forest land. His observations were as follows:
“The notice which had been issued showed that a meeting had been convened to obtain
approval of Gram Sabha for transfer of forest land to Essel Mining and Industries Limited. In
the same meeting, forest rights were to be ascertained. The minutes of the meeting show that
in the same meeting it was decided that the villagers have no forest rights. It was also decided
that they had no objection to transfer of forest land to the firm. This is in complete violation of
FRA. The process envisaged under FRA has to be completed before the transfer of forest land
for non-forest use is considered under the Forest Conservation Act. Therefore, the transfer of
forest to the firm is invalid.”
Terming the procedure in violation of the FRA as completion of the recognition of
rights needs to be undertaken prior to any discussion on the diversion of forest land,
the Secretary termed the approval for diversion invalid and advised the Collector to
withdraw the approval.
On further investigation, the district administration has claimed that no claims were
received for forest rights during Gram Sabha meetings held earlier and it is only after
that that the Gram Sabhas seeking consent for forest diversion were held. The matter
is under further investigation as a large number of the tribal families in the above
villages have no titles for the land they are cultivating yet none of them ostensibly
filed any claims for recognition of forest rights.
Example 2: Mahan Coal block in Singrauli district, Madhya Pradesh
The Mahan coal block was granted in-principle (Stage I) forest clearance by the
MoEF on 18th October 2012, after substantial pressure from the Group of Ministers

339
(GoM) on coal mining, after the MoEF had rejected it on environmental and
ecological grounds. This approval was for the diversion of 1182.351 ha of forest land
and was conditional on, among others, completion of the recognition of forest rights.
Yet, not a single community forest right has been recognized in the Singrauli district
where there are a large number of forest land diversions taking place for non-forest
use. Several representations written by the affected parties to the authorities on the
issue of non-implementation of FRA in this region have yielded no results
whatsoever.
Villagers in Amelia and Suhira were not allowed to make their CFR claims at the
Gram Sabha meeting held on 15th August 2012 despite the fact that 300 people
attended the meeting that day. Stage- I conditional forest clearance was granted for
mining of the Mahan Coal Block in Madhya Pradesh on 30th October 2012 without
detailed assessments of social and ecological impacts or obtaining Gram Sabha
consent required under MoEF’s 2009 order.
Following this, the administration organized a special Gram Sabha on March 6, 2013
which was attended by only 184 persons. However, over 11000 signatures were
forged onto the resolution which included the signatures of some dead people. Despite
strong protests by the villagers, including letters written in their support by the
Minister of Tribal Affairs to the Madhya Pradesh Governor and Chief Minister,
MoEF granted final forest clearance for the Mahan coal block in February 2014. 315
Example 3: Polavaram Project
The Polavaram Project has now been given national status. The Union Cabinet has
approved the setting up of the Polavaram Project Authority, where the Centre will
provide funds for the project and help in getting environmental and forest
clearances.316 The Environmental Impact Assessment (EIA) of the project says 276
villages will be affected; an estimated 177,275 people live in these villages. The
Polavaram Project Environmental Impact Appraisal Report of 1985 expected 150,697
people to be displaced in 226 villages. But the population of these villages according
to the Census 2001 is much higher—236,834. State officials find it hard to explain the
difference of 59,559 while estimating the number of people who will be
315See also, “Deo slams Madhya Pradesh government for denying forest rights to tribals in Mahan”,
Anupam Chakravarty, Down to Earth, Jul 20, 2013. Available at
http://www.downtoearth.org.in/content/deo-slams-mp-government-denying-forest-rights-tribals-mahan. Last accessed on
7.5.2014 at 5.15 pm. 316 See “Centre clears Polavaram Project Authority”, M.L. Melly Maithreyi, The Hindu, 1st May 2014. Available at
http://www.thehindu.com/news/national/andhra-pradesh/centre-clears-polavaram-project-authority/article5966536.ece. Last
accessed on 3.5.2014 at 5.00 pm.; “Polavaram project: Odisha awaiting Union Cabinet's report”, BS Reporter, Business
Standard, 3rd May 2014. Available at
http://www.business-standard.com/article/economy-policy/polavaram-project-odisha-awaiting-union-cabinet-s-report-
114050300764_1.html. Last accessed on3.5.2014 at 240 pm.
340
displaced.317According to a report by the Central Empowered Committee the table
below illustrates the number of affected families.
Table 9.5: Number of settlements and people affected by Polavaram Project
State
No.of settlements
No. of project affected
families
No. of population
affected
Andhra Pradesh
276
44,574
1,77,275
Chhattisgarh
4
2,335
11,766
The report also says that “out of the above, 14.94 percent are Scheduled Castes, 48.67
percent Scheduled Tribes, 17.45 percent backward classes and the balance 18.94
percent, fall in other categories.”318 However, this report is dated 2006. The figures
have not been updated since then. This is contrary to the Draft National Tribal Policy
that states,
“There shall be a threshold of displacement viz. the maximum number of persons that can be
displaced in one project. Projects involving displacement of more than a fixed number, say
50000, would not be considered, if the majority are Scheduled Tribes, or would be subjected
to more stringent appraisal norms.”
However, the project has acquired greater complexity in light of the Andhra Pradesh
Reorganization Bill, approved by the Union Government, whereby the villages to be
submerged are now located in Seemandhra, originally in the Telangana region. The
bill as passed by the Lok Sabha States that:
“90. (1) The Polavaram Irrigation Project is hereby declared to be a national project.
(2) It is hereby declared that it is expedient in the public interest that the Union should
take under its control the regulation and development of the Polavaram Irrigation
Project for the purposes of irrigation
(3) The consent for Polavaram Irrigation Project shall be deemed to have been given by
the successor State of Telangana.
(4) The Central Government shall execute the project and obtain all requisite clearances
including environmental, forests, and rehabilitation and resettlement norms.”319
Though, the clearance of the project is subject to the settlement of claims under the
Forest Rights Act,320 a number of people have had their claims rejected. The reason
317 See “Why Polavaram is a pointless project”, Cover Story, Down to Earth, 15 th May 2011. Available at
http://www.downtoearth.org.in/content/why-polavaram-pointless-project. Last accessed on 26.2.2014 at 430 pm. 318 See Report by Central Empowered Committee, Constituted by the Supreme Court of India in Writ Petition NO. 202/95 AND
171/96) bearing number F. No. 1-19/CEC/SC/2006-Pt. XII dated 15.11.2006. 319 See S. 90 of the Andhra Pradesh Reorganization Bill, Bill No. 8-C of 2014, as passed by Lok Sabha on 18.2.104. A copy of the
bill is available at
http://www.prsindia.org/uploads/media/Telangana/Telangana percent20Bill%20as%20passed%20by%20LS.pdf.

341
was that their villages were going to be submerged anyway.321A fact finding team
comprising Dr. B.D. Sharma, Former National Commissioner for Scheduled Castes
and Tribes, Dr. Jayashankar, former Vice-chancellor, Kakatiya University, Dr. I.
Thirumali, Reader in History, Sri Venkateswara College, University of Delhi, G N
Saibaba, Lecturer in English, University of Delhi, Shirish Medhi, Social Activist from
Mumbai, Dr. Gopinath, Eminent Cardiologist, Andhra Pradesh, Rona Wilson,
Research Scholar, Jawaharlal Nehru University, Ajay Mishra, Reporter, Sunday Post
(Hindi), Suresh Kumar, Advocate, Hyderabad, Ch. Prabhakar, Advocate, Hyderabad
and Ravichandra, Teacher, AP Government Residential Schools, toured nine mandals
in the districts of Khammam, East and West Godavari districts that are to be affected
by the Polavaram Dam Project between 3nd March and 6th March, 2007. They
reached the following conclusions:
In Maredubaka village in Kukunoor Mandal, people passed resolutions against
Polavaram dam and the Resettlement& Rehabilitation package offered by the
Government. Resolutions were ignored, suppressed and manipulated. Some Mandal
Praja Parishads (MPP) also have passed resolutions against the construction of the
dam but time and again over the last one year the officials have not accepted or
recorded the written resolutions sent by the MPPs as told by Kantepale Raju,
Sarpanch of Maredubaka and also by the sarpanch of Amaravaram of Kukkunoor
mandal.322 They also noted that in Paidipakka village in Polavaram mandal, the
District Collector sat in the Gram Sabha along with armed police force. There he told
the people that the government can’t pay more than 1.3 lakhs and the villagers had no
other option but to leave.323 This is in keeping with other reports that state an absence
of public hearings and faulty clearances. 324
Example 4: Public hearings are mandated both under the Environmental Impact
Assessment Notification, 2006325 as well as the PESA
In an appeal before the National Green Tribunal (NGT) challenging the
Environmental Clearance (EC) granted to a Coal Mining Project by M/s Jindal Steel
and Power Limited at Raigarh District of Chhattisgarh State by the Ministry of
320 See Press Release by MoEF, “Indira Sagar(Polavaram) Multipurpose Project on Godavari River in Andhra Pradesh given
final clearance under FCA, 1980”, dated 28th July 2010. Available at http://moef.nic.in/downloads/public-
information/Indira%20Sagar%20(%20Polavaram).pdf 321 See “Telangana betrays its tribals”, M. Suchitra, Down to Earth, 15th March 2014. Available at
http://www.downtoearth.org.in/content/telangana-betrays-its-tribals. Last accessed on 30.3.2014 at 127 pm. 322 See http://singur-singur.blogspot.in/2007/04/all-india-fact-finding-report-on.html and also
http://www.downtoearth.org.in/content/polavaram-fraud 323 See All India Fact-finding Report on Polavaram Dam Project, Preliminary Report, published on a blogpost entitled “Singur”
on 1st April 2007. Available at
http://singur-singur.blogspot.in/2007/04/all-india-fact-finding-report-on.html. Last accessed on
1.5.2014 at 345 pm. 324See “Polavaram project in legal wrangle”, Kirthiman Awasthi, Down to Earth, 31st January 2008. Available at
http://www.downtoearth.org.in/node/4085. Last accessed on 16.3.2014 at 1125 am. 325A notification under sub-rule (3) of Rule 5 of the Environment (Protection) Rules, 1986 dated 14th September, 2006 by the MoEF states that “III. Stage (3) - Public Consultation:(i) “Public Consultation” refers to the process by which the concerns of
local affected persons and others who have plausible stake in the environmental impacts of the project or activity are ascertained
with a view to taking into account all the material concerns in the project or activity design as appropriate.”
342
Environment and Forests, the NGT in an order dated 20th April, 2012326 held that the
public hearing conducted on 5.1.2008, was a “farce” and a “mockery” of the
procedure required to be followed.
The Tribunal went on to say that:
“the way in which the proceedings are conducted is nauseating and no reasonable person
would accept that it was conducted fairly and much less properly. This is not a case where
there are a few ignorable procedural lapses in conducting the public hearing. This is a case
of a mockery of public hearing, one of the essential parts of the decision making process, in
the grant of Environmental Clearance. This is a classic example of violation of the rules and
the principles of natural justice to its brim.”
Similarly, in Chhattisgarh, Korba district, villagers are resisting 36 coal-fired power
plants that seek to acquire close to 40,000 acres. In 2010, after a Gram Sabha hearing
to discuss the land acquisition proceedings, the District Collector there reportedly
recorded that there is no legal basis for the Gram Sabha's objections and the issues
raised.327
9.4.2 Amendment to the PESA
The proposed PESA Amendment seeks to change the existing law by providing for
“prior informed consent” of the Gram Sabha to be mandatory before any land
acquisition, which will bring it in tune with international developments where free
prior informed consent has evolved as a precondition to the location of projects, and
its consequences.328 The proposed amendment also mandates “prior informed
consent” of the Gram Sabhas before granting of prospecting license or mining lease
for minor minerals in the Scheduled Areas and before granting of concession for the
exploitation of minor minerals by auction. 329
9.4.3 Linear Projects
On 5 February 2013, a letter was issued from the MoEF exempting linear projects
from the requirement of obtaining consent from Gram Sabhas under the Forest Rights
326See Adivasi Majdoor Kisan Ekta Sangthan and Jan Chetna v. MoEF,
Chhattisgarh Environment Conservation Board, M/s Jindal Steel & Power Limited, Appeal No. 3/2011 (T) (NEAA No. 26 of
2009) 327 See “No public, just hearings for mega projects”, Aman Sethi, The Hindu, 15th January 2012. Available at
http://www.thehindu.com/todays-paper/tp-miscellaneous/tp-others/no-public-just-hearings-for-mega-projects/article2802951.ece. Last accessed on 24.1.2014 at 300 pm. 328Draft amendment Panchayats (Extension to the Scheduled Areas) Bill, 2013, “In section 4 (i) of the Principal Act, the word ‘Prior
informed consent of’ shall be inserted before the words ‘the Gram Sabha or the Panchayats’ and the word ‘consulted’ shall be substituted by the word ‘taken’ after the words ‘appropriate level shall be’ and before the words ‘before making the acquisition’.
329 See Draft Amendment Panchayats (Extension to the Scheduled Areas) Bill, 2013, “In section 4 (k) of the Principal Act, - For the word ‘recommendations’, the word ‘prior informed consent’ shall be substituted. Before the words ‘minor minerals’, the word ‘major and’ shall
be inserted.
343
Act: ‘This ministry has received representations from various ministries to exempt
projects … where linear diversion of forest land in several villages are involved, from
the requirement of obtaining consent of Gram Sabha, as stipulated in this ministry’s
said letter dated 3-8-2009.’330
The matter has also been examined by an inter-ministerial committee.331 The
committee, after examination of the matter had inter alia recommended that a
resolution of the Gram Sabha of the area based on full and prior information of the
project and a public hearing, endorsing that the project is in the interest of the people
living on forest land, use of which is proposed to be diverted for non-forest purposes
may not be required for the projects like construction of roads, canals, laying of
pipelines/optical fibres and transmission lines etc. where linear diversion of use of
forest land in several villages are involved, unless recognized rights of Primitive
Tribal Groups (PTG) and Pre-Agricultural Communities (PAC) are being affected.”
The letter says that the Minister for Tribal Affairs had agreed with this
recommendation.
There were further circulars to this effect on 3rd August, 2009 and 15th January, 2014.
On 7th March, 2014, the Ministry of Tribal Affairs had to issue a notice to all Chief
Secretaries clarifying ‘the correct position in law’.332 It said:
The FRA “does not provide any exemption to any category of
projects”.
“Compliance with the provisions of FRA in no way counters the
provision of basic developmental initiatives, particularly in less
developed Scheduled Areas. In fact, Section 3(2) of the Act expedites
projects meant for forest dwellers”.
“The central role of the Gram Sabha in the developmental initiatives is
not unique to the FRA 2006. It also finds mention in the PESA where
consultation with Panchayats is a necessary precondition for alienation
of any land in the Scheduled Areas for development projects. The
Right of Fair Compensation and Transparency in Land Acquisition,
Rehabilitation and Resettlement Act, 2013 also requires consent of the
Gram Sabha for acquisition of land in Scheduled Areas for
development”.
The Supreme Court, in its 2013 decision where the tribal hamlets in
Niyamgiri were asked to be consulted in their Gram Sabha, has
reiterated that the proper process has to be followed for the
determination of community forest resource rights and that the
decision has to be taken by the Gram Sabha.
330Letter dated 5th February 2013, F.No11-9/98-FC (pt.) Government of India, MoEF (FC Division). 331 Ibid. 332 Letter from MoTA dated 7th February 2014, No.23011/02/2014-FRA.

344
“In view of the above, compliance with FRA is a mandatory requirement before forest
land can be diverted. Failure to do so would be a violation of law.”
This was issued with the approval of the Minister, Tribal Affairs and Panchayati Raj.
This instance is symptomatic of the disregard for laws that have been enacted to
protect the interests of Scheduled Tribes and Other Traditional Forest Dwellers. There
is no answerability when this deliberate disrespect for the law is manifest. It was
pointed out to us that the Scheduled Caste and Scheduled Tribes (Prevention of
Atrocities) Act 1989 prescribes punishment where a person, not being a member of a
Scheduled Caste or Scheduled Tribe “wrongfully dispossesses a member of a
Scheduled Caste or a Scheduled Tribe from his land or premises or interferes with the
enjoyment of his rights over any land, premises or water”.333 The serious
consequences of depriving tribals of their land is recognized in the Atrocities Act,
1989, and must inform public policy. Development projects and infrastructure
projects are being allowed to relegate laws made to safeguard tribal interests to
irrelevance.
Any land that may have been taken over by following the letters/notices of the MoEF
dated 5th February, 2013, 5th July, 2013 and 15th January, 2014 must be restored to the
community.
9.5 Land Acquisition Law of 2013, Forest Rights Act, 2006 and PESA, 1996
The Land Acquisition Law, 2013334 that replaced the Land Acquisition Act, 1894
brings the Scheduled Tribes and those covered by the Forest Rights Act within this
law, and considers the possibility of involuntary displacement from land and habitat.
Unlike the 1894 Act, this law expressly provides for acquisition for private companies
and for projects to be executed through public-private partnership. There is an implicit
erosion of the principles relating to land alienation in the Fifth Schedule areas which
does not allow transfer of land from a tribal to a non-tribal. Just by way of
clarification, private companies are non-tribals.
The Land Acquisition Law, 2013 has been enacted at a time when the potential of the
Forest Rights Act to bring forest dwellers out of the disabilities induced by illegality
is still being worked out. There are multiple hurdles that communities have been
experiencing in having their rights to the forest recognized. While there has been
some movement on recognition of individual rights, community rights and the rights
of access are still in the initial stages of being understood and implemented. The 2013
law, however, reveals an impatience to get forest and Fifth Schedule land into the
333 Section 3(1), The Scheduled Castes and Scheduled Tribes (Prevention of Atrocities) Act, 1989. 334 The Right to Fair Compensation and Transparency in Land Acquisition, Rehabilitation and Resettlement Act, 2013
[hereinafter, Land Acquisition Act, 2013].

345
process of forcible acquisition. Although the 2013 law acknowledges that there are
special provisions in relation to land in Scheduled Areas, and that the Forest Rights
Act is a piece of legislation that is about recognizing rights and not about opening up
the land for transactions, yet it speaks of involuntary displacement for a project.335 So,
in Section 41of the 2013 law, it says:
“(1) As far as possible, no acquisition of land shall be made in the Scheduled Areas. (2)
Where such acquisition does take place it shall be done only as a demonstrable last resort.”
The qualifying phrases leave the field wide open to interpretation and use. In clause (3) the
law speaks of prior consent of the Gram Sabha or Panchayat or Autonomous District
Council. Yet, this is immediately followed with provision for “projects involving land
acquisition on behalf of a requiring body which involves involuntary displacement of the
Scheduled Castes' or the Scheduled Tribes’ families…”
The Constitution does not treat eminent domain as a flat doctrine. It does not apply
equally or in an identical manner in all territory within India. Scheduled Areas,
forests, and the rights of tribal communities to land have been specifically treated
distinctly from other private holdings of land. The Land Acquisition Law, 2013, in
attempting to make more land available for development projects, is still poised to
defy the constitutional and legal principles in relation to landholding, land ownership,
land use and land alienation in tribal areas.
9.6 Land alienation: Kerala
In 2001, landless tribal communities in Kerala, represented by their leader Shri C.K.
Janu, entered into an agreement with the Chief Minister under which all landless tribal
families in the State would get land not exceeding 5 acres.336 Two years on, and the
land allotments promised were not implemented at all. In a symbolic and strategic
move, the community decided to enter the Muthanga forests and occupy the land.337
The decision to move to Muthanga evolved out of widespread consultative process
across the state’s tribal belt- where a 60 member tribal court declared that since the
agreement was being openly disregarded, the community should assert their rights by
occupying the land. A month later, a part of the forest area occupied by the tribals
including hutments were set on fire and property destroyed allegedly by police and
government officials. The tribals ‘took captive’ about twenty state police and Forest
Department officials. Statements of these officials were recorded, and thereafter, they
were handed over, unharmed, to the District Collector. Meanwhile, 500 armed
policemen and forest officials descended on the area, and around 300 tribals were
reportedly arrested. According to the People’s Judicial Enquiry Commission headed
by Justice Shamsher and Justice Shamshuddin, men and women were rounded up and
335 Section 41(4), Land Acquisition Act, 2013. 336 R. Krishnakumar, The Muthanga misadventure, The Frontline, March 15 - 28, 2003. 337 C.R. Bijoy, Adivasis Betrayed: Adivasi Land Rights in Kerala, Economic and Political Weekly 29 May, Vol. XXXIV, No. 22,
1999.

346
taken to the police station and many were beaten ruthlessly.338 Though the
government record states that there were two deaths, a tribal and the other a
policeman- many unofficial accounts point to a higher number of deaths.
The intensity of conflict this demonstrates can be explained in the context of a long
history of marginalization, perpetual landlessness, laws that have bypassed
constitutional obligations, and High Court orders that have been consistently ignored
by the Government. In Kerala, more than 30 per cent tribal households are landless
and the highest proportions are from Wayanad and Palakkad districts. Given the large
influx of non-tribals, large tracts of arable land have been encroached upon.
The sub-committee constituted by the Kerala state assembly in 1976 conducted a
study on land alienation in the Wayanad district. The study examined 298 cases and it
was found that 71 were grabbed by force, 67 were grabbed for miniscule sums, while
the rest for a very small amount.339
In 1975, the State government passed the Kerala Scheduled Tribes Act (Restriction on
Transfer of Lands and Restoration of Alienated Lands), later incorporated into the
Ninth Schedule. The Act renders all transactions of adivasi lands between 1960 and
1982 invalid and restores land to the original owners. The Act also restricts transfer of
adivasi lands to non-adivasis from 1982, without the prior consent of the authorities.
The 1986 Rules finally operationalized the Act, but even so there were no steps taken
towards their implementation. Of the 8754 claims, filed by adivasis for about 9910
hectares till 1991, only about 545 hectares were restored. Acting on a petition filed in
1988, in October 1993, the High Court passed an order directing the government to
“dispose of the applications pending before them within six months”.
Faced with pressure from the High Court, an amendment the ‘Scheduled Tribes
(Restriction on Transfer of Lands and Restoration of Alienated Lands) Amendment
Bill, was passed in 1996 to avoid contempt of court proceedings. The President of
India, however, rejected this amendment which substituted restoration of original
lands with providing ‘alternate lands’ up to 5 acres only. Finally, in 1999, the state
government replaced the 1975 legislation with the Kerala Restriction on Transfer and
Restoration of Lands to Scheduled Tribes Act, 1999. The Act provided that only land
in excess of two hectares would be restored, and in all other cases alternate land
would be given to the extent of two hectares. The number of applicants claiming more
than two hectares was negligible, so in practical terms, the stated intent of the law to
provide for ‘restoration’ of land was rendered meaningless.
338 People's Judicial Enquiry Commission, Preliminary report on Muthanga, 17 March 2003 available at
http://www.pucl.org/Topics/Dalit-tribal/2003/muthanga-report.htm. 339 C.R. Bijoy, Adivasis Betrayed: Adivasi Land Rights in Kerala, Economic and Political Weekly 29 May, Vol. XXXIV, No. 22,
1999.

347
It is pertinent to note that neither the 1975 Act nor its successor, the 1999 Act, were
able to address the issues of lack of documentary proof to establish past land
ownerships.
The intention behind the 1975 Act was entirely negated, first, through systematic
refusal to implement and then through the enactment of the 1999 Act, which renders
that intention meaningless. Judicial response has been weak and unable to curb
inaction and evasion by the State. Finally the brutal repression of the occupation of
the Muthanga forests by tribals has only spurred a spate of such occupations- a
demonstration of anger and loss of faith in the state machinery.
9.7 Memoranda of Understanding (MoUs)
In recent years, state governments and corporations have been entering into MoUs
which impose a responsibility on the state to facilitate various aspects of their
projects.340 The proliferation of such MoUs is noticeable. For instance, Chhattisgarh
has reportedly entered into 121 MoUs for industries relating to coal, sponge iron,
railways, and electricity. Jharkhand has also signed 74 MoUs for Mega Investment,
indicating a total investment of Rs 2,93,360.33 crores in Project Cost.341 As on 2011,
there are another 25 MoUs Jharkhand has signed with a total investment cost of
Rs78,871.83 Cr and reportedly providing employment to 1,20,320 persons.342
Many of these MoUs pertain to Fifth Schedule Areas. These are some common
clauses found in these MoUs:
“The Government agrees to acquire, the required land……and hand over the required land
free from all encumbrances to SEL through Orissa Industrial Development Corporation
(IDCO) for the project and allied facilities.”
Source:MOU between Sterlite Energy(P) Ltd. And the Govt. of Orissa dated 29th Sept. 2006
“Government agree to assist BEL .in obtaining all clearance/permits/approvals from the
Central Government, State Government departments or agencies, Regulatory Commissions
and Local Bodies(Municipal, Panchayat, etc.)”
Source:MOU between Bhusan Energy(P) Ltd. And the Govt. of Orissa dated 29th Sept. 2006
“(a) The Govt. of Jharkhand agrees to forward proposal of M/s Essar Steel Jharkhand
Ltd.(ESJL) in obtaining NOC through the State Pollution Control Board for the construction
of Plant, the housing colony, mines, pipelines etc.
(b) Government. of Jharkhand agrees to forward proposal of M/s Essar Steel Jharkhand Ltd.
In obtaining necessary clearances from the Central Government.
340 Individual copies of signed MOUs from the websites of the Governments of Odisha and Jharkhand are available. A list of
MOUs entered into by the Government of Chhattisgarh is available. 341 Development via State Terror in Jharkhand(A report by the INSAF Fact Finding Team into the Police Firing on 6th
December, 2008 at Kathikund, Dumka District, Jharkhand). 342 See a copy of list of MoUs available at http://jharkhandindustry.gov.in/ last accessed on 9.5.2014 at 12.00 pm.

348
(c) M/s Essar Steel Jharkhand Ltd. Will arrange to conduct a Rapid Environment Impact
Assessment (EIA) an detailed EIA and prepare an Environment management Plan(EMP) for
the project. The Govt. of Jharkhand agrees to extend any assistance in the shape of providing
data/information available with it during the time when the EIA is conducted and EMP is
prepared.”
Source: MOU between Essar Steel Jharkhand Ltd. and the Government of Jharkhand dated 6 th July
2007
These MoUs, it has been pointed out to us, change the relationship between the state
and the corporation, and the state and project affected people. For instance, in Fifth
Schedule Areas, it is the legal and constitutional obligation of the state to ensure that
tribal land alienation does not occur, causing detriment to the interests of the
tribals.343 The Samatha judgment344 of the Supreme Court was a reflection of this
understanding. The court in that case held, “the State Government….stands prohibited
to transfer by way of lease or any other form known to law, the Government land in
Scheduled Area to non-tribal person, be it natural or juristic person except to its
instrumentality or a Co-operative Society composed solely of tribes”. Yet, MoUs such
as those described here, or the one that the Orissa Mining Corporation entered into
with Vedanta, conveniently makes the transfer of land in Scheduled Areas into a
contractual arrangement, in a complete breakdown of constitutional principles
safeguarding tribal interests.
In 2005, when the Government of Orissa entered into a MoU with POSCO, which is
now a contentious project and where local people including tribals have been
protesting land acquisition for the project, it included a clause that read:
“(i) The Government of Orissa agrees to facilitate and use its best efforts to enable the
Company to obtain a “No Objection Certificate” (NOC) through the State Pollution Control
Board in the minimum possible time for the development and operation of the Project.
(ii) The Company will conduct a rapid Environment Impact Assessment (“EIA”) and
prepare a detailed EIA Report and an Environment Management Plan (“EMP”) for the
Project. The Government of Orissa agrees to provide any assistance requested by the
Company during the time the EIA is conducted and the EMP is prepared.
(iii) The Government of Orissa agrees to use its best efforts to procure the grant of all
environmental approvals and forest clearances from the Central Government within the
minimum possible time for the Project.”345
Again, environmental laws have been made to protect both the environment and those
depending on it. The onus that the state casts on itself through such MoUs results in a
343 This is despite the report of the Comptroller and Auditor General of India revealing irregularities in Odisha’s land
acquisition proceedings as well as failure to comply with sanctions contained in the MOUs that it signs with companies. See
Audit Report (Civil) for the year ended 31 March 2011, Report of the Comptroller and Auditor General of India on the
Government of Odisha. 344Samatha v. State of Andhra Pradesh, AIR 1997 SC 3297 345 A copy of the MoU is available at http://www.odisha.gov.in/posco/POSCO-MoU.htm last accessed on 9.5.2014 at 4.00 pm.
349
dilution of procedures such as EIA. This amounts to a clear overriding of statutory
provisions.
These MoUs have been criticized for prioritizing the interests of the corporations over
those of the tribals and local populations. The state is expected to protect the tribal
from losing land through land alienation, preserve the environment and protect the
forest. Even if the state’s prerogative is ‘rapid industrialization’, the responsibilities it
sets for itself through the MoUs would dilute the law346, and this is a disturbing trend
that has spread across states. For example, the MoU between the Government of
Orissa and POSCO (2005) includes these clauses:
“A dedicated High Powered Committee shall be constituted jointly by the Government of
Orissa and the Company to ensure that the Project proceeds as per the planned schedule.
The High Powered Committee shall include as permanent members, senior officers of the
departments of Steel and Mines, Industries, Energy, Water Resources, Works, Commerce and
Transport, Environment and Forests and representatives from the Company. The
Government of Orissa shall arrange for representatives of other departments to be present for
each meeting as required.”
“Immediately following the execution of this MoU, the Government of Orissa shall second (at
its own cost) to the Company’s Project office in Bhubaneswar, an Officer of the appropriate
level to be dedicated to the facilitation of the Project”
Source: MOU between Govt. of Odisha and M/s POSCO dated 22nd June, 2005
The altered understanding of the role that government officials are claiming for
themselves, namely getting projects started, is setting at naught, the responsibilities
that they owe the tribals, and subverts the law.347
There is a further clause that is found in recent MoUs, to which our attention was
drawn. It reads:
“The Government and its concerned departments or agencies will facilitate and assist JSPL
during various stages of the project as also of the captive coal mine, in a smooth and
unhampered manner by maintaining the law and order in the Project area and its vicinity.”
Source: Copy of the MOU between Jindal Steel and Power Ltd. and the Government of Orissa dated 7 th
February, 2009
346 The State of Jharkhand’s Industrial Policy states that, “After the creation of the State of Jharkhand on 15th November 2000,
to optimally utilize the available resources of the State in a planned manner and to accelerate the industrial development of the
State, an Industrial Policy has been formulated. To achieve expected industrial growth, the districts of the State have been
categorized into three categories, so as to capitalize the industrial potential through planned utilization and development of
natural and human resources and to gradually increase the employment opportunities.”
Available at http://www.jharkhandindustry.gov.in/industry-policy.html. Last accessed on 9.5.2014 at 2.00 pm. 347 The Government of Jharkhand in an MoU dated 9th July 2007 with M/s Essar Steel Jharkhand Ltd. has stated that it is
“desirous of utilization of its natural resources and rapid industrialization of the State, so as to bring about prosperity and
wellbeing to its people and has been making determined efforts to facilitate setting up new industries in different locations in the
State. In this context the Govt. of Jharkhand is willing to extend assistance to suitable promoters to set up new industries.” The
MOU goes on to ensure Essar Steel of rapid environmental and forest clearances, No Objection Certificates, supply of water,
iron ore, coal and land, all of which will be provided by the Government of Jharkhand.

350
“The Government of Orissa will take action to provide overall security as per applicable law,
as may be required to all parts of the Project during the operation phase. All necessary steps
in this regard including setting up of police stations, if required, would be taken by
Government of Orissa.”
Source: Copy of the MOU between POSCO and the Government of Orissa dated 22nd June, 2005
The development paradigm adopted by states has raised questions from many
quarters, and is manifest as protest, resistance, dharnas and court challenges. It is
frequently seen that protestors are subjected to the heavy hand of the law, and find
themselves arrested, charged with a variety of offences including even stringent
provisions of the law such as sedition. There have been many occurrences of
crackdown on displaced people, people from whom land has been taken for the
project and on those protesting the location of a project. These have been documented
in a variety of ways including video recordings348, fact-finding reports, and in national
dailies and magazines. There is little to indicate that the concerns of the local people
which is expressed in the protests and movements of resistance is being addressed.
(see later section). This has had the effect of criminalizing protest.
It appears that some MoUs have begun to take shape between the state and civil
society organizations. Its purpose is significantly different from that seen in MoUs of
the state with corporations. Where the latter sought to ensure that the law would not
be a hurdle to the progress of their project, the former was to work for the
implementation of the law. The draft MoU that the committee saw was a
memorandum to ensure that the Forests Rights Act is properly implemented.
9.8 Cabinet Committee on Investment (CCI)
The Cabinet Committee on Investments was an institutional apparatus set up to aid
the government in pushing ahead with its agenda of growth and project development,
especially of large projects.349 The logic, and functioning, of the CCI shows an
impatience with what the law says, with Gram Sabha autonomy, and with the FRA.
The CCI was constituted in 2013 specifically to expedite clearances of projects worth
Rs. 1000 crores or more.350 The CCI raison d’etre was the expeditious clearance to be
given to projects and to remove impediments that the CCI saw as delaying projects.
Disturbingly but not unexpectedly, land acquisition, FRA implementation,
environmental clearances and Gram Sabha consent were in focus. Decisions made by
348 See “Blood Stains in Jindal Steel, Orissa”, a video dated 25th January 2012 by Samadrusti Televisions at
http://www.youtube.com/watch?v=1tU7uphTnLw. Last accessed on 9.5.2014 at 1.00 pm. 349 The Cabinet Committee on Investment was constituted with the approval of the Prime Minister on 2nd January 2013 vide
notification No. 1/11/3//2012-Cab, Govt. Of India, Cabinet Secratariat. Available at
http://cabsec.nic.in/showpdf.php?type=cci_notification. Last accessed on 17.4.2014 at 4 pm. 350 The functions of the CCI are, among others, “to identify key projects required to be implemented on a time bound basis,
involving investments of Rs 1000 crores or more, or any other critical projects, as may be specified by the Committee, in sectors
such as infrastructure, manufacturing, etc.” Available at http://cabsec.nic.in/showpdf.php?type=cci_notification. Last accessed
on 17.4.2014 at 4 pm.

351
the CCI allow the FRA to be bypassed. The status report of the CCI dated
22.3.2013351 stated that since obtaining Gram Sabha consent for each linear projects is
time consuming, the MoEF issued an OM stating that this is not necessary anymore.
Further, the notification also says that “for one time capacity expansion of 25 percent
or less, coal mining projects have now been exempted from public hearing provided
that public hearing had taken place at the time of obtaining the existing EC and the
mining is confined to the existing lease area. This would help boost production of coal
which is in short supply in the country.” This limit has now increased to 50 percent, as
per a MoEF OM, 2014 also exempt from public hearing. The CCI has iterated that
this is a good policy decision to avoid delays in projects.
This is a blatant instance of the flouting of laws, relating to Scheduled Tribes, OTFD,
forests and the environment. This is a case of expediency, as defined by the executive
government – over principle, law and the lives of tribal communities. This deliberate
subversion of the law is possible, because there are no consequences for such
breaches of law. It is necessary both to review the decisions that have been made by
the CCI to undo the illegalities, which have resulted from its functioning; and to
provide for penalties in the law, for such defiance of the law.
9.9 Niyamgiri
The FRA recognizes individual, community, traditional and cultural rights of
Scheduled Tribes and other Traditional Forest Dwellers. This is a definite shift away
from the Indian Forest Act, 1927 and its preceding laws which kept forest dwelling
and forest dependent communities on the margins of legality. In 2006, when the FRA
was enacted, the preamble to the Act acknowledged this when it said that this was “an
Act to recognize and vest the forest rights and occupation in forest land in forest
dwelling Scheduled Tribes and other Traditional Forest Dwellers who have been
residing in such forests for generations but whose rights could not be recorded…”
The forest laws that culminated in the Forest Act of 1927 vested control over the
forests in the colonial state to assist it in its expansionist enterprise. It was with the
Forest Conservation Act, 1980 that the extent to which forests were being lost to
industrial and mining projects became a concern that had to be addressed urgently.
Yet, the FCA 1980 only shifted the decision making from the states to the centre,
even as ‘Environment and Forests’ was moved from the state to the Concurrent
legislative list in the Seventh Schedule to the Constitution. While this may have
provided pause in the decisions made to divert forests to non-forest uses, the model of
development adopted, and the priorities of different governments, has made relentless
demands that conservation and protection agenda be put aside and the interests of
foreign direct investment, growth rate and corporate involvement in the economy be
351 Cabinet Secretariat, Cabinet Committee on Investment Status update (as on 22.03.2013), available at
http://cabsec.nic.in/showpdf.php?type=cci_status Last accessed on 17.4.2014 at 430 pm.

352
given priority. As the state has begun to enter into MoUs and agreements with
corporations with promises of land, water, clearances and law and order, the concerns
of local populations have been relegated to the periphery. This has also been a time
when, even as laws are made to protect tribals, forest dwellers, the environment
including forests, the law has been ignored and sidestepped.
It is in this context that the processes of decision-making in tribal areas have not been
adhered to in many instances. The Supreme Court’s decision in the Lafarge case352is
revealing about how procedures could get subverted in the process of grant of
permission for diversion of forest land for non-forest purposes in places inhabited by
tribal communities. Lafarge was about quarrying for limestone in Meghalaya, and the
forest clearance had been sought on the basis of a report that said that there were no
forests in the area. This was later demonstrated that it is not an accurate statement of
fact. Although there were around 1800 tribals in the affected area, in the first instance,
it was recorded that 31 tribals had been consulted and, at a later date when the matter
was in court, the views of 200 of them were said to have been heard. The spectrum of
agencies had worked in ways that revealed severe weaknesses in regulation.
The court allowed the company to continue mining, while saying,
“at times the court is faced with conflicting reports.”
Similarly, the government is also faced with a fait accompli kind of situation,
which in the ultimate analysis leads to grant of ex facto clearance.” This is a severe
indictment of how processes are violated and the purpose of the law overturned.
The Niyamgiri experience is iconic, demonstrating a clear break from before the time
that the FRA was enacted. Niyamgiri hills is inhabited by the Dongria Khond, a
Particularly Vulnerable Tribal Group. Vedanta Aluminium Ltd. approached the
Supreme Court asking that the company be allowed to mine bauxite in the Niyamgiri
hills to feed their aluminium plant located at the foothills. The Dongria Khonds
opposed the mining, After two rounds of consideration by the Supreme Court, a
hearing before the National Environment Appellate Authority,353 and two reports on
the effect the project may have on the Dongria Khonds,354 the Supreme Court
352 Lafarge Umiam Mining Private Limited v. Union of India & Ors. [(2011) 7 SCC 338] 353 See order of the NEAA dated 15th September 2010 in Shri Prafulla Samantra v. MoEF and Ors., Appeal No. 18/2009,Appeal
No.19/2009, Appeal No. 20/2009, Appeal No.21/2009 where the NEAA remitted the matter to the Ministry of Environment and
Forest, “with direction to revisit environment clearance including the aspect of public hearing and take appropriate action. Till
this process is over, the environment clearance stands suspended." 354 See Site Inspection Report Concerning Violation for Diversion of 660.749 ha of Forest Land in Kalahandi (South) Forest
Division and Rayagada Forest Division in favour of the Orissa Mining Corporation Ltd(OMC) for mining of bauxite in
Lanjigarh Bauxite Mines, by Dr. Usha Ramanathan, Dr. Vinod Rishi, ShriJ.K.Tewari dated 11th February 2010; Report of the
Four Member Committee for Investigation into the Proposal Submitted by the Orissa Mining Company for Bauxite Mining in
Niyamgiri dated August 16, 2010 by Dr N C Saxena, Dr S Parasuraman , Dr Promode Kant, Dr Amita Baviskar, Submitted to
the MoEF, Govt. of India. Also see Recommendations of the Forest Advisory Committee in its meeting convened on 20th August
2010 in the Report of the Four Member Committee for Investigation into a Proposal submitted by the Orissa Mining Corporation
Ltd. for Bauxite Mining in Niyamgiri (F.No. 8-23/2005-FC).

353
directed, on 18th April, 2013, that the Gram Sabha needed to consider the rights that
were being affected by the proposed mining.355 Excerpts:
39. “Many of the Scheduled Tribes and other Traditional Forest Dwellers are totally
unaware of their rights. They also experience lot of difficulties in obtaining effective access to
justice, because of their distinct culture and limited contact with mainstream society. Many a
times, they do not have the financial resources to engage in any legal actions against
development projects undertaken in their abode or the forest in which they stay. They have a
vital role to play in the environmental management and development because of their
knowledge and traditional practices. State has got a duty to recognize and duly support their
identity, culture and interest so that they can effectively participate in achieving sustainable
development.
55. Religious freedom guaranteed to Scheduled Tribes and the OTFDs under Articles 25 and
26 of the Constitution is intended to be a guide to a community of life and social demands.
The above mentioned Articles guarantee them the right to practice and propagate not only
matters of faith or belief, but all those rituals and observations which are regarded as
integral part of their religion. Their right to worship the deity Niyam-Raja has, therefore, to
be protected and preserved.
58. We are, therefore, of the view that the question whether Scheduled Tribes and OTFDs,
like Dongria Khond, Kutia Konds and others, have got any religious rights, i.e. rights of
worship over the Niyamgiri hills, known as Nimagiri, near Hundaljali, which is the hill top
known as Niyamraja, have to be considered by the Gram Sabha. The Gram Sabha can also
examine whether the proposed mining area Niyama Danger, ten km away from the peak,
would in any way affect the abode of Niyam-Raja. Needless to say, if the BMP, in any way,
affects their religious rights, especially their right to worship their deity, known as Niyam
Raja, in the hills top of the Niyamgiri range of hills, that right has to be preserved and
protected. We find that this aspect of the matter has not been placed before the Gram Sabha
for their active consideration, but only the individual claims and community claims received
from Rayagada and Kalahandi districts, most of which the Gram Sabha has dealt with and
settled.
59. The Gram Sabha is also free to consider all the community, individual as well as cultural
and religious claims, over and above the claims which have already been received from
Rayagada and Kalahandi districts. Any such fresh claims should be filed before the Gram
Sabha within six weeks from the date of this judgment. State Government as well as the
Ministry of Tribal Affairs, Government of India, would assist the Gram Sabha for settling of
individual as well as community claims.”
The ‘Palli Sabhas’ were held in Niyamgiri between 18thJuly and 19thAugust, 2013 in
twelve hamlets in Rayagada and Kalahandi districts, which the state government
considered were likely to be affected by the mining.356 The proposed mining was
unequivocally rejected by all twelve Palli Sabhas.
355 Orissa Mining Corporation v. Ministry of Environment & Forest & Others, Writ Petition (Civil) No. 180 of 2011 356 English translation of Palli Sabha resolutions between 18th July and 19th August 2013 provided by the state government, on
file with committee.

354
9.10 Salwa Judum
Salwa Judum, translated variously as peace march, people’s resistance movement or
as purification hunt, was a government initiative in Bastar region. It was set up in
2005, to counter the naxalites presence in the area. Its mainstay was the SPOs (Special
Police Officers) who were local tribal youth, some as young as 16 years, who were
recruited, paid a stipend, armed and handed the task of fighting the naxalites. What
resulted was a civil strife which displaced whole villages, rapes, excesses of power,
murders and the burning of houses. The SPOs were projected as an essential part of
the security apparatus of the state and they would act as guides, spotters and
translators, and work as a source of intelligence, and firearms were provided to them,
for their self-defense. The civil strife that ensued resulted in the emptying out of
villages, forced migration in many cases into neighboring states, and the abandoning
of their agricultural land, their livestock and other means of production and
livelihood.
A report of the Planning Commission said:357
“This involuntary displacement and migration has caused further distress among the
tribals…..Through this process of forced migration, large mineral areas got vacated, where
the mining corporate lessees are starting operation. Often the displaced
people/villagers/tribals look on hopelessly and sometimes they seek support of the naxalite
groups. Such situations create space for naxalite interventions.” Over the years, SPOs have
turned into an institutionalised category, with greater numbers of unemployed tribal youth
signing up as SPOs.358
In a writ petition challenging the constitutionality of the Salwa Judum and the
situation of human rights violations, it was perpetrating in Chhattisgarh in July, 2011,
the court condemned the state of Chhattisgarh for allowing such atrocities to continue
and raised concerns about the manner of recruitment, the qualifications and training of
the SPOs. The judgment unequivocally condemned the use of local untrained youth as
SPOs, arming them and giving them the task of becoming part of the security
establishment with no preparedness to perform the task.359
Two important developments arose subsequent to the Salwa Judum judgment. One, a
clarification was issued by the Supreme Court stating that: “Under the July 5
judgment we have asked the Union of India to cease and desist from using any funds
directly or indirectly for SPOs. The order as passed was in the context of Chhattisgarh
and (the) Solicitor-General….has observed that it should be confined to Chhattisgarh,
otherwise it will create a great deal of law and order problem in other States.” This
357 Development Challenges in Extremist Affected Areas — Report of an Expert Group to Planning Commission, Government of
India, April 2008 358See “Chhattisgarh SPOs likely to return as 'auxiliary force'”, Supriya Sharma, 26th July 2011, Times Of India. Available at
http://timesofindia.indiatimes.com/india/Chhattisgarh-SPOs-likely-to-return-as-auxiliary-force/articleshow/9374718.cms. Last
accessed on 10.5.2014 at 332 pm. 359 See Nandini Sundar and Ors. v. State of Chhattisgarh, (2011) 7 SCC 547.

355
order was issued pursuant to concerns expressed by the Central Government that if
the July 5th 2011 order was fully implemented, the government would have severe
difficulties in undertaking anti-insurgency operations in the Northeast, Jammu and
Kashmir, Andhra Pradesh, Orissa, Bihar and other parts of the country.360 This
modification is likely to have consequences for other parts of the country which
would include the tribal dominated areas in the country that are victims of Maoist and
state excesses.
Secondly, two months after the July 5th 2011 judgment, the Chhattisgarh Assembly
passed the Chhattisgarh Auxiliary Armed Police Force Act, 2011 (the Act)
authorising an “auxiliary armed force to assist security forces in prevention and
control and combating maoist/naxal violence.” The object of the Act is to “establish a
trained armed force of persons having knowledge of local area and topography and
local language/dialect” since inaccessible tribal areas in Chhattisgarh are affected by
Naxal violence. S. 11 of the Act regularises existing SPOs and inducts them into the
auxiliary armed force.361 S.14 grants them impunity in respect of any act committed
by them under the Act.362 This is despite the Supreme Court ordering that, “The State
of Chhattisgarh immediately cease and desist from using SPOs in any manner or form
in any activities, directly or indirectly, aimed at controlling, countering, mitigating or
otherwise eliminating Maoist/Naxalite activities in the State of Chhattisgarh”.
Though the court has expressed shock, dismay and anger over the Chhattisgarh
Government’s abuse of power, the Act explicitly defies the court order, continuing its
earlier violent policies to combat extremism, the very same that the court declared
constitutionally impermissible and abhorrent. Unless there is a conscious commitment
by the state to move away from this skewed notion of protecting its citizenry, the
vicious circle of violence and counter violence will continue.363
9.11 Criminal Law
An extremely disturbing feature that we witnessed in Scheduled Areas, where projects
are being located, is the filing of cases against local people and their supporters. Land
acquisition, displacement and the commencement of project work without settling
360 See “SPOs ban will apply only to Chhattisgarh: court”, J Venkatesan, The Hindu, 18th November 2011. Available at
http://www.thehindu.com/news/national/spos-ban-will-apply-only-to-chhattisgarh-court/article2639134.ece. Last accessed on
10.5.2014 at 500 pm. 361 S.11 of the Act under the heading “Provisions in respect of existing Special Police Officers” states “Notwithstanding anything
contained in any order of any court, every Special Police Officer who is found eligible by a screening committee for appointment
to the Auxiliary Armed Police Force under this Ordinance, shall be deemed to be a member of the Auxiliary Armed Police
Force.” 362 S.14 of the Act under the heading “Protection for acts of members of the Auxiliary Armed Police Force” states “No suit,
prosecution or other legal proceeding shall lie against any member of the force for any act which is in good faith done or
purported to be done or omitted to be done during the course of performance of his duty under the Ordinance.” 363 Development Challenges in Extremist Affected Areas — Report of an Expert Group to Planning Commission, Government of
India, April 2008
356
issues that arise in the context of the project have given rise to various forms of
protest and resistance. Local people complained that when they raised their voices
against a project proposal that was brought to them, they invariably found themselves
charged with criminal cases. Many of them spoke of attending Court in relation to
cases filed against them. They were not always aware of what they were charged with,
but they appeared to have an understanding of what they had done which had
provoked the administration to bring the law down on them. For instance, in a village
that the committee visited in Orissa, a woman and her husband were having to attend
Court because they had led a resistance against the diversion of land for building a jail
and a courthouse in their village. In project areas, persons opposing land acquisition
or the location of projects in that area find themselves charged with multiple
offences.364
It appears to have become commonplace to file cases against those participating in
these protests. The large numbers of FIRs include charges under Section 147, 148,
149, 120B, 307, 506 of the Indian Penal Code and Sections 25 and 26 of the Arms Act
and under Goonda Act in states, as well as the Chhattisgarh Special Public Security
Act. Often, arrests occur and, it is not unusual to see further charges being added on in
relation to persons already charged. Persons charged with these offences are brought
within the entrails of the criminal justice system.
In Chhattisgarh, for instance, the committee found that a large number of tribals have
been languishing in jails for long years without their trial concluding. When the
under-trial women in Jagdalpur jail were asked to explain with what offences they had
been charged, the answer almost invariably was ‘naxal offence’. There is of course,
no such offence defined in law. Here too, after the first FIR lodged against them, there
would be further FIRs filed over a period of time implicating them in various episodes
of violence. Persons charged with naxal offences find it extremely difficult to get bail,
and so end up spending long years in jail. Trials do not conclude in many cases
because official witnesses were absent. This may happen because a member of
paramilitary force cited as a prosecution witness had been repatriated with his unit
and was no longer in the state. The committee also met with criminal lawyers in
Dantewada courts. They assessed that over 95 percent of the cases were baseless and
it was no surprise that the acquittal rate in cases where trials ended, resulted in
acquittal. In reply to an RTI application, the court registers for all cases disposed of
between 2005 and 2012 revealed that average rate of acquittal over these years was
95.7 percent.365
The problem posed by this application of criminal law has, in fact, been recognized by
the State Government which, in May 2012 set up a committee chaired by Ms. Nirmala
Buch to review the delay in prosecution of under trials in Chhattisgarh jails.366 It has
364 Alternative Law Forum Delhi Forum, Captive Democracy: A Fact Finding Report On Abuse of the Criminal System to Curb
dissent against the POSCO Steel Plant in Odisha, February 2013; Anhit newsletters. 365 Based on information provided by members of Jagdalpur Legal Aid Group, Chhattisgarh. 366 Staff Reporter, 8th meeting of Standing Panel chaired by Ms. Nirmala Buch to review pending cases, Hitavad, May 7 2014.

357
applied itself to the question of expediting bail applications. The committee has
recommended grant of bail, in most cases on the ground of poverty of the person and
in some others on the ground of ill-health.367
The situation in various places of conflict between local communities and the state
and project authorities is grim. It is important to urgently establish a judicial
commission that will go into the cases pending against tribals and their supporters
where either they are charged with the expression of their concerns about projects and
project implementation, or where the tag of naxal offences is sending people into
prisons and courts. It is a significant fact that tribals are getting caught in the conflict
between the state and the naxals. While the state may consider deploying various
devices to deal with the issue of naxalism, it should not lead to a situation of
oppression of the tribals.
The committee was informed that there are, indeed, occasions when villagers are
called upon by the naxalites to attend meetings, and that they are often not in a
position to exercise a choice on whether or not to go. Merely attending these
meetings, they said, is being treated as support for naxalism. Where is the state to
protect us if we were in fact to refuse, they asked. The notion that tribals are either
with the state or with the naxalites has to be abandoned for a wider and more real
assessment of the situation.
Naxal attacks that have left large numbers dead has placed an enormous burden on
the state to address both the causes of the violence and the violence itself, without
adversely impacting local communities. The attacks which took place on 25th May,
2013 in which 18 Congress leaders and workers died in Bastar when they were
returning from Sukma after an election rally, and on 6th April, 2010, killing seventy
four members of the CRPF and two policemen from Chhattisgarh, has understandably
shaken the establishment.368
The occurrence of encounter killings where state forces have shot and killed villagers
has also raised the pitch of the conflict and left a gulf between the state and local
communities.369 The Edasmeta killings in Bijapur district where eight villagers
including three children were shot dead on 17th May, 2013 was explained by the
CRPF as having being caused by the return of fire in an encounter with naxals.370 The
villagers, however, have been vehemently denying that such an encounter took place.
In Sarkeguda, seventeen people were shot dead by the CRPF on the night of 29th June,
2012. This was, again, attempted to be explained as based on intelligence received on
the presence of naxal leaders and a major naxal movement in the area. Seventeen
367 High Powered Standing Committee (Chaired by Ms. Nirmala Buch) Report, 2014.
368 Suvojit Bagchi, Mahendra Karma killed, V.C. Shukla injured in Maoist attack, The Hindu, May 26 2013 available at http://www.thehindu.com/news/national/other-states/mahendra-karma-killed-vc-shukla-injured-in-maoist-
attack/article4750467.ece
369 A Fact Finding Report on Unlawful Police Activities in Two Panchayats of North Bastar, Chhattisgarh, People's Union for Civil Liberties (PUCL), May 2013. 370 Press Trust of India, Chhattisgarh: Cong seeks CBI probe into 'fake' encounter in Bijapur, May 22nd 2013 available at
http://ibnlive.in.com/news/chhattisgarh-cong-seeks-cbi-probe-into-fake-encounter-in-bijapur/393199-37-64.html

358
villagers, including seven minors, were declared dead. A judicial commission is
looking into this encounter.371
In Orissa there are cases questioning the killing of persons in what were termed
encounters.372 Encounter killings do not have the sanction of the law beyond the
exercise of the right of self-defense. `Encounters' as a way of dealing with the naxal
issue needs to be done away with, and lawful ways found to deal with it. Where
encounters do occur, an FIR must be registered and the incident investigated to make
sure that it was a legitimate use of force. This is the minimum that needs to be done in
these circumstances.
Leadership emerging from tribal communities and public defenders working for the
tribal interest also have cases registered against them: illustratively, Dayamani Barla,
Lado Sikakaand, Ramesh Aggarwal. Dayamani Barla has been at the forefront of land
struggle in Jharkhand.373 Since 2006, when she spearheaded a protest against Arcelor
Mittal’s proposed steel plant on 11,000 acres of land in Gumla and Khunti where the
Chotanagpur Tenancy Act prohibits the sale of tribal land to non-tribals, she has been
charged in connection with other protests in the region: for having led a march
demanding that villagers be given MGNREGS job cards or given unemployment
allowance in villages in Angada block in Ranchi district, for “leading a group of over
100-150 farmers, who entered the plot where NUSRL and IIM had already
constructed boundary walls and cultivated the land” in a place 25 kms from Ranchi
where land had been taken over for a Law University and an Indian Institute of
Management.374 Lado Sikakawas picked up by the police on 9thAugust, 2010 and
released three days later following an outcry. The police said they had picked him up
because they thought he may be a Maoist and let him off when they found he was not.
Lado Sikaka is a Dongria Khond tribal who has been leading the resistance against
Vedanta’s plans to mine in Niyamgiri.375
Dayamani Barla has been awarded Cultural Survival’s Ellen L. Lutz Indigenous
Rights Award.376 Ramesh Aggarwal, who was shot at by gunmen, disabling him,
soon after he had led from the front in the closing down of a coal mine in Raigarh377
was recently awarded the Goldman Environmental Prize (commonly known as the
371Anil Mishra, Another Volley of Bullets for Bastar’s Tribals, Tehelka, 1June 2013 available at http://www.tehelka.com/another-volley-of-bullets-for-bastars-tribals/. 372Hube Majhi & Anr. v. State of Orissa &Ors, Writ Petition No. 21821 of 2013; Maria Kadaisma v. State of Orissa &ors, Orissa
HC Writ Petition no. 13508. 373Moushumi Basu, The Voice of Jharkhand, Economic & Political Weekly, Vol - XLVIII No. 23, June 08, 2013. 374Anumeha Yadav, Activist Dayamani Barla gets bail, December 21 2012, available at
http://www.thehindu.com/news/national/other-states/activist-dayamani-barla-gets-bail/article4226094.ece. 375Debabrata Mohanty, In U-turn, cops say ‘Maoist sympathiser’ on Rahul Niyamgiri stage ordinary tribal, Indian Express,
August 28 2010 available at http://archive.indianexpress.com/news/in-uturn-cops-say--maoist-sympathiser--on-rahul-niyamgiri-
stage-ordinary-tribal/673564/0 376Uttara Chowdhary, Tribal rights activist Dayamani Barla wins Ellen L Lutz award, First Post, May 14 2013, available at
http://www.firstpost.com/world/tribal-rights-activist-dayamani-barla-wins-ellen-l-lutz-award-
779193.html?utm_source=ref_article. 377 The chargesheet includes the names of a Jindal employee, a retired army brigadier, KK Chopra and his associate SN
Panigrahi, who run a security agency, Superior Fire and Security Service, which provides security for Jindal Steel and Power
Limited in Raigarh. The company has denied all connection with the incident.

359
'Green Nobel').378 This seems to indicate the existence of two divergent world views
in the understanding of offence and protection.
While the committee was visiting Jagdalpur, we were informed that Prof. Nandini
Sundar was accused of links with the Maoists. Prof Nandini Sundar was a lead
petitioner in the case in the Supreme Court that challenged the Salwa Judum policy,
and is held in high esteem in the region for having brought Salwa Judum to a close.
Social activists like Himanshu Kumar (who used to run the Vanvasi Chetna Ashram
NGO in Dantewada, before it was demolished by police), Swami Agnivesh and writer
Arundhati Roy have also been “branded” as having links with Maoists. The Supreme
Court has, in Nandini Sundar v. State of Chhattisgarh,379 commented on this practice
of the State:
“We must state that we were aghast at the blindness to constitutional limitations of the State
of Chhattisgarh, and some of its advocates, in claiming that anyone who questions the
conditions of inhumanity that are rampant in many parts of that state ought to necessarily be
treated as Maoists, or their sympathizers, and yet in the same breath also claim that it needs
the constitutional sanction under our Constitution, to perpetrate its policies of ruthless
violence against the people of Chhattisgarh to establish a Constitutional order.”
9.11.1 Soni Sori Case
Soni Sori was picked up from a marketplace in Dantewada district, Chhattisgarh on
4thOctober, 2011. She, along with Lingaram Kodopi, was accused of acting as a
conduit between the naxalites and Essar for payment of money from Essar. D.V.C.S
Verma, the Essar general manager and B.K. Lala, the company’s chief contractor,
were also arrested in connection with this charge in September, 2011. Two others,
accused of being naxal commanders, have been absconding. The Dantewada district
court granted bail to D.V.C.S. Verma in January, 2012, and to B.K. Lala in February,
2012. More than two years later, in an appeal against an order of the Chhattisgarh
High Court, on 7th February, 2014, the Supreme Court directed that Soni Sori and
Lingaram Kodopi be released on bail.
Soni Sori complained of severe torture and of being sexually assaulted when she was
held in police custody. On 19th October, 2011, the Supreme Court directed that Soni
Sori be examined by doctors in a Kolkata hospital in connection with the injuries she
sustained in police custody. The medical report from the hospital found two stones in
her private parts and rectum, confirming her complaint of rape.380
378 Associated Press, Indian activist Ramesh Agrawal wins 'Green Nobel', April 28th 2014, available at
http://timesofindia.indiatimes.com/home/environment/pollution/Indian-activist-Ramesh-Agrawal-wins-Green-
Nobel/articleshow/34333193.cms. 379NandiniSundar and Ors. v. State of Chhattisgarh, (2011) 7 SCC 547. 380 NRS Medical College and Hospital Kolkata, Medical Report dated 11 November 2011[On file with Committee]; see also
Legal Correspondent, Court anguished at SoniSori's medical report, The Hindu, December 3rd 2011.

360
In a series of letters addressed to the Supreme Court, Soni Sori had charged Ankit
Garg, Superintendent of Police of Dantewada police station, of verbally abusing her
and directing police personnel to strip her naked and administer electric
shocks.381Ankit Garg was given the Presidents Gallantry Award soon after.
There are serious questions about each of these issues: Soni Sori’s father was shot in
his leg by the naxalites: why would anyone say that Soni would support the naxalites,
he asked, when the committee met him. Why was no FIR filed and investigation done
either, when Soni Sori complained of torture, or when the Kolkata hospital found
evidence of the torture, including sexual torture? Why was Ankit Garg given the
Gallantry Award, when there were serious charges that had been made against him
which had not yet been investigated. The DGP (Home Guards) reportedly said, in
explanation: “The Police Medal for Gallantry is for a specific instance… it is not like
the award for Meritorious Service … Ankit Garg led one of the teams in the
Mahasamund [encounter].”382
9.11.2 Narayanpatna
Narayanpatna block, Koraput district in Odisha has been the site of a powerful
movement on issues of bonded labour, a dominant liquor mafia and land grabbing by
non-tribals. Nachika Linga, the leader of the tribal collective Chausi Mulia Adivasi
Sangh (CMAS) was liberated from bonded labour after five generations of his family
had suffered under its yoke. The CMAS was also at the forefront of resistance to
mining operations for bauxite in the Mali Parbat and Deomali areas.383
Despite the non-violent nature of their activities, government and police forces have
branded them as Maoists and launched brutal operations against them with this
justification.
In the last few years, Narayanpatna has become a heavily militarized zone, with three
BSF camps in the block384 and several allegations against central security forces for
brutal attacks and repression of dissent. On 20thNovember, 2009, when hundreds of
CMAS activists protested the acts of the security forces outside the Narayanpatna
police station, police opened fire killed two leading figures of the movement, and
arrested and jailed several others.385 We were told that many had died in prison due
to lack of proper medical facilities. Widows of this incident had approached the
Odisha High Court for justice where the court directed payment of compensation.386
381Aman Sethi, Activists shocked at gallantry award for Chhattisgarh cop, February 12 2012, available at http://www.thehindu.com/news/national/activists-shocked-at-gallantry-award-for-chhattisgarh-cop/article2834675.ece. (Last
visited 17.5.2014, 4.30pm). 382 Ibid. 383 See Javed Iqbal, Narayanpatna’s nightmares, 6th February, 2011, available at
http://www.newindianexpress.com/magazine/article393614.ece?service=print; see also Special Correspondent, State urged to
restore peace in Narayanpatna, The Hindu, December 12 2013. 384 Ibid. 385 Ibid. 386 Kamala Tadingi v. State of Orissa, 2011 ( II ) ILR- CUT- 570

361
According to a press statement in 2010, the number of persons taken into judicial
custody from Narayanapatna block in Koraput district touched 104, including tribal
children. There are around 15 children below the age of 14 confined in Koraput
District Jail. The children do not know the language (Odia) which the jail authorities
speak and are unaware about why they are in jail.387
In a press statement, several Panchayat functionaries of the block alleged that the
State government was not allowing them to function and was unleashing a “reign of
terror” in the area.388
Narayanpatna seems caught in the crossfire between state agencies and Maoist
groups. On the one hand, many in the CMAS movements have been labeled as
Maoists and persecuted on that basis. Simultaneously, there have been several attacks
by Maoists on leaders of movements in the area as well as those accused of being
“informants” to the State. In 2010, there was an IED blast that killed four civilian
lives and another on 11th January 2011 that injured three government officials.389
Militarization has also made it difficult for outsiders, including journalists and others,
to go to the area. This has led to the isolation of Narayanpatna and left its residents
neglected and beleaguered after years of conflict.
9.11.3 De-notified Tribes (DNT)
The Criminal Tribes Act, 1862, stigmatized and illegalized whole communities. After
the Constitution was promulgated in 1952, and the report of the Criminal Tribes
Enquiry Committee submitted in 1952, the Criminal Tribes Act was repealed. This
should have seen the end of the stigmatization and illegalization of the
communities.390 Yet, and as we have been reminded through the years,391 the tag of
criminality attached to DNTs and to the nomadic way of life of nomadic tribes
persists to the present day. The explanation lies, in good measure, in the Criminal
Tribes Act being replaced in many states by the Habitual Offenders Act.392 Over the
387 K. Sudhakar Patnaik, Tribal children of Narayanapatna confined in Koraput Jail violating Juvenile Justice Act, Jan 5 2010 available at http://sanhati.com/narayanpatna/#10 388 Press meet, Stop Repression in Narayanpatna: Respect democracy, Bhubaneshwar, December 11 2013. 389 Javed Iqbal, Narayanpatna’s nightmares, 6th February, 2011, available at
http://www.newindianexpress.com/magazine/article393614.ece?service=print 390 Clarification: DNT are not one composite community and stay distributed between ST, SC and OBC. 391 In February 2000, the National Human Rights Commission recommended the repeal of the Habitual Offenders Act, see Dr.
Meena Radhakrishna, Dishonoured by History, The Hindu, July 16th 2000 available at
http://www.hindu.com/folio/fo0007/00070240.htm. The NHRC also noted that "Though the Criminal Tribes Act, 1871 was annulled soon after independence, the police, as well as members of the public, frequently and most regrettably continue to treat
persons belonging to these communities as "born criminals" and "habitual criminals". They, therefore, remain amongst the most
discriminated and disadvantaged groups in the country." - NHRC issues, available at http://nhrc.nic.in/hrissues.htm; In 2007, the Report of the United Nations General Assembly Committee on the Elimination of Racial Discrimination, Official Records of
62nd Session, Supplement No.18 (A/62/18), states that "The Committee is concerned that the so-called denotified and nomadic
tribes, which were listed for their alleged 'criminal tendencies' under the former Criminal Tribes Act (1871), continue to be stigmatized under the Habitual Offenders Act... The Committee recommends that the State party repeal the Habitual Offenders
Act and effectively rehabilitate the denotified and nomadic tribes concerned." 392 The Punjab Act makes explicit the relationship between the Criminal Tribes Act and the Habitual Offenders Act when it states
that "Notwithstanding the repeal of the Criminal Tribes Act, 1924, every person who stood registered under that Act at the
commencement of this Act and who is a habitual offender, as defined in sub section (3) of section 2 of this Act, shall be deemed to
362
years, the enactment of laws that treat the activities of DNTs as criminal, even if there
is no attribute of a crime in such activities, has oppressed these communities. For
instance, anti-beggary laws in many states impose criminality on acts such as
performing, acrobatics and juggling on the streets. For example, the Bombay
Prevention of Begging Act, 1959 has, in its definition of beggary, “singing, dancing,
fortune-telling, performing or offering any article for sale.”
This is a formula that has been reproduced in legislation across states. The
relationships between DNTs who make a living training animals, has per se, been
rendered unlawful. The Wildlife Protection Act and the Prevention of Cruelty to
Animals Act has been routinely applied over the years to communities that have had
relationships with animals. While changing the law to make it illegal to keep animals
with them and thereby criminalizing their traditional occupations, there has been little
or no effort in helping the communities, make the transition to alternate means of
livelihood.
It is difficult for these communities to find decent livelihood. Discrimination in
educational institutions and the inflexibility of such institutions which do not account
for the nomadic nature of some communities has left them outside the aspirations that
others in society have. Communities also report that among them there are specific
communities, which have many single women and where prostitution is common
practice, not as a matter of choice but as a means of survival of the community.
For some years now, one of the major demands of the community has been the repeal
of the Habitual Offenders Act. In February 2000, the National Human Rights
Commission recommended that the Habitual Offenders Act be repealed.393 More
recently, in March 2007, the United Nations Committee on the Elimination of Racial
Discrimination stated:
“The Committee is concerned that the so-called de-notified and nomadic tribes, which were
listed for their alleged 'criminal tendencies' under the former Criminal Tribes Act (1871),
continue to be stigmatized under the Habitual Offenders Act... The Committee recommends
that the State party repeal the Habitual Offenders Act and effectively rehabilitate the de-
notified and nomadic tribes concerned.”394
One of the very disturbing features that was reported to us, was the routine manner
with which these communities experience police brutality and violence. The label of
criminality has done little to help them combat these police practices, whose illegality
has not been recognized, despite its frequency.
be a registered person under this Act” and further that all orders passed under Section 10,11 and 16 the Criminal Tribes Act
against such persons shall “be deemed to have been passed” under the provisions of Habitual Offenders Act." 393See Dr. Meena Radhakrishna, Dishonoured by History,The Hindu, July 16th, 2000 available at
http://www.hindu.com/folio/fo0007/00070240.htm. 394 Report of the United Nations General Assembly Committee on the Elimination of Racial Discrimination, Official Records of
62nd Session, Supplement No.18 (A/62/18)

363
There are various sources that helped the committee understand the conditions in
which these communities (Nomadic tribes, Semi-nomadic tribes and De-notified
tribes) survive.395 There were also four regional consultations that the communities
organized to assist the committee in formulating its report.396
The main recommendations that emerge are:
Immediate repeal of the Habitual Offenders Act.
The anti-beggary laws be revisited to remove the element of criminality that
exists in these laws, especially the provisions in these laws that make “singing,
dancing, fortune telling, performing or offering any article for sale.” activities
punishable by law. These, in fact, represent a set of talents and skills that exist
among these communities. These need to be recognized as such, and as
suggested in the report of the consultations, the Ministry of Culture may work
with the communities in the development of these skills and talents.
One of the most tragic aspects that came up repeatedly in their consultations
was the pervasiveness of police harassment and ill-treatment, including
custodial violence and custodial rape. This is an extremely disturbing part of
their report, which the government must urgently address. Such harassment
and brutality must stop.
The removal of discrimination and stigma is essential to help the communities
gain access to schools, work and health services.
The history of the law, their criminalization and stigmatization has had
consequences for women. There are communities with large numbers of single
women, where prostitution is widely practiced and had been a route to
livelihood. The community expressed a keenness not to perpetuate this,
including an end to stigma and discrimination.
Apart from the Habitual Offenders Act and the Anti-Beggary Law, the
Prevention of Cruelty to Animals Act, the Wildlife Protection Act and the
Excise law be applied acknowledging the problems that the communities face
in the application of these laws.
The interests of nomadic tribes should be protected. They require special
attention and their specific situation be recognized, including in relation to
education, work, ‘citizenship entitlements’ and the needs of the elderly.
Citizenship entitlements include identification documents, access to schools,
food security and right to move around freely.
395 Milind Bokil, De-notified and Nomadic Tribes, Economic & Political Weekly, Vol - XXXVII No. 02, January 12, 2002; Dilip
D’souza, Branded By Law, 2001. 396 Recommendations from Regional Meetings on Nomadic and De-Notified and Semi-Nomadic Tribes in India, organized by
Budhan Theatre and TISS, given to Committee in January 2014.

364
9.12 Andaman and Nicobar Islands
In May 2002, the Supreme Court ordered a closure of the Andaman Trunk Road
where it runs alongside or through the forests of the Jarawa reserve397. This order has
not been implemented so far. The administration had instead, in December 2004
produced a ‘Policy on Jarawa tribe of Andaman Islands’ which spoke of ‘regulation
of traffic on Andaman Trunk Road’ (ATR) and not of its closure. The consequences
have been severe. It is now widely reported that the ATR spawned a variety of
tourism that makes a spectacle of Jarawa tribals. In 2012, a Guardian report about
tourists escorted by a policeman through the ATR captured on camera naked Jarawa
women dancing for them, at the behest of the policeman. A video clip accompanied
the news report. The report, which is corroborated by activists working in the
Andamans, speaks of convoys of buses and cars, which travel the ATR seeking this
‘safari’ as a tourist attraction. In January, 2013, the Supreme Court ordered that all
commercial and tourism activities within five km radius of the Jarawa Tribal Reserve
be banned. A newspaper reports; “Except 30 villages notified in the schedule, the
notification declares a buffer zone of an area up to a five-km radius, adjacent and
contiguous to the Jarawa Tribal Reserve Area, starting from the Constance Bay in
South Andaman to Lewis Inlet Bay in Middle Andaman. No person shall operate any
commercial or tourist establishment directly or indirectly in the buffer zone.
Furthermore, no one shall carry out any activity, which may be prejudicial to the
safety, security and interests of the Jarawas in any of the settlement villages.”398 The
Supreme Court directed further that only government officials, persons residing in the
reserve and vehicles carrying essential commodities for the Jarawas would be allowed
on the ATR.
The Calcutta High Court has adopted a different approach which was contrary to the
orders of the Supreme Court, and which now stands overruled. In the case in the
Calcutta High Court, a former director of the Anthropological Survey of India argued;
“ATR is like a public thoroughfare through a private courtyard… In the whole of
human history, we find that the dominant group for their own advantage has always
won over the minorities, not always paying attention to the issue of ethics. Closure of
the ATR would perhaps be the first gesture of goodwill on part of the dominant
towards an acutely marginalized group, almost on the verge of extinction”.399
The situation has progressively deteriorated. In January, 2014, there was apprehension
of incidence of sexual exploitation of Jarawas. Eight Jarawa women were abducted on
January 15, allegedly by local poachers who, as alleged, lure the Jarawa girls with
397 T.N Godavarman Thirumulpad v. Union of India &Ors., Order dated 7 May 2002, I.A. No. 502 in WP (C) No. 202/1995. 398J. Venkatesan, Supreme Court bans tourists from taking trunk road passing through Jarawa area in Andamans, The Hindu,
January 22 2013, available at http://www.thehindu.com/news/national/supreme-court-bans-tourists-from-taking-trunk-road-
passing-through-jarawa-area-in-andamans/article4329360.ece.(Last visited 17.5.2014, 4.30pm) 399Pankaj Sekhsaria, 'Because Andaman's forests are Jarawa infested …, The Hindu, January 19th 2012, available at
'http://www.thehindu.com/opinion/op-ed/because-andamans-forests-are-jarawa-infested/article2811842.ece. (Last visited
17.5.2014, 4.30pm)

365
food and drink and exploit them sexually’.400 This episode has drawn a member of the
tribe to contact the outside world to protest about the sexual abuse of young women
by outsiders. 401
There is now discussion about integration of Jarawas with the outside world. The
committee is emphatic that such integration should not be forced on them and it must
be only when the Jarawas are ready to make the ecological shift. Until then, a policy
of integration should not be pursued.
In February 2010, the last member of the Bo tribe, a tribe that is believed to have
inhabited the Islands for 65,000 years, died.402 It is a somber reminder of the fragility
of indigenous communities, a loss that has not yet been interpreted and understood.
Genetic studies have been expanding in the scientific community around the world. In
August 2013, it was reported that a geneticist from the Centre for Cellular and
Molecular Biology, Hyderabad had travelled to the Andaman Islands to collect blood
samples from Andamanese tribals.403 He reportedly explained that this would ‘help
him understand the pivotal moment in India’s genetic history’. The report proceeds to
say “the tribesmen had never heard of a gene before or an academic study for that
matter, and the whole pitch struck them as an interesting diversion from their usual
routine of spearfishing.” “They mostly laughed,” the geneticist reportedly said, and
continues: “before they offered up their arms in exchange for food. A few needle
pricks later, they returned to their boats to fling short wooden spears into the water
with uncanny aim, while (the geneticist) made the long journey home to Hyderabad.
He deposited the latest samples into a blood bank, alongside another 32,000 samples
from his countrymen.”404
There is no mention of the protocols that they follow in collecting the blood sample,
and efforts by the committee to secure these protocols failed. The question of consent,
especially, is too serious to ignore. This report requires further weight, when
considered in the context of the draft Human DNA Profiling Bill, 2012, which
proposes to database the DNA of various classes and groups of people.405
400 Tapas Chakraborty, Jarawa kidnap raises abuse fear, The Telegraph, January 21st 2014, available at http://www.telegraphindia.com:8080/1140121/jsp/nation/story_17847180.jsp#.U2_KfOC9ywl. (Last visited 17.5.2014, 4.30pm) 401Gethin Chamberlain, Jarawa tribe now face sexual abuse by outsiders on Andaman Islands, The Guardian Observer,
available at http://www.theguardian.com/world/2014/feb/01/andaman-islands-jarawa-sex-abuse-outsiders. (Last visited 17.5.2014, 4.30pm) 402 Annie Shaw, Last member of 65,000-year-old tribe dies, taking one of world's earliest languages to the grave, 10 February
2010, available at http://www.dailymail.co.uk/sciencetech/article-1248754/Last-member-65-000-year-old-tribe-dies-taking-worlds-earliest-languages-grave.html. (Last visited 17.5.2014, 4.30pm) 403 Dan Kedmey, What DNA Testing Reveals About India’s Caste System, Time, 27 August 2014, available at
http://world.time.com/2013/08/27/what-dna-testing-reveals-about-indias-caste-system. (Last visited 17.5.2014, 4.30pm) 404 Ibid. 405 This Bill can be viewed on the website of the Department of Biotechnology, available at
http://www.dbtindia.nic.in/biotechstrategy/DNA_Bill.pdf. (Last visited 17.5.2014, 4.30 pm)

366
9.13 Bonded Labour
The Bonded Labour System (Abolition) Act, 1976 was official acknowledgement of
the existence of a form of forced labour which had both traditional and economic
roots. Since then, there have been some efforts at ending this system of exploitative
labour and relationships in bondage. The law provides for identification, release and
rehabilitation of bonded labourers as well as punishment for employers of bonded
labour. Close to 40 years after the enactment of a law that recognizes and outlaws
bonded labour, the practice has not disappeared. The Ministry of Labour and
Employment in their Annual Report of 2007-2008 record 2,86,839 identified bonded
labourers, of whom 93 percent are reported to have been rehabilitated. The maximum
numbers of bonded labourers were reportedly rehabilitated in the early 1980s. This
was the period when the Supreme Court in its public interest jurisdiction was also
actively engaged in lending weight to the Bonded Labour Act and monitoring the
progress of identification, release and rehabilitation.406 It is not immediately evident
how many bonded labourers continue in various states of servitude that remain
unidentified.
The study done for the Planning Commission reports that 83 percent of the
rehabilitated bonded labourers belong to Scheduled Tribes and Scheduled Castes. 43.6
percent of the rehabilitated bonded labourers belong to Scheduled Tribes.407
Indebtedness has been cited as the main reason for landing in bondage, and 70.7
percent of those surveyed gave loan as the main reason for bondage and 92.3 percent
of those who did take the loan, did so for “consumption/food”.
There are several emerging studies that indicate that this practice of bondage
continues to exist, particularly in tribal dominated districts. An activist in the field
reported to us that the Yanadis in Nellore districts in Andhra Pradesh, Irulas in
Tiruvallur, Cuddalore and Vellore in Tamil Nadu, the Sahariyas in Baran districts of
Rajasthan, Shivpuri in Madhya Pradesh and Lalitpur and Banda in Uttar Pradesh are
among the tribal communities among whom extreme conditions of inhuman bondage
can be found. Landlords in these areas are often politically powerful and have no
trouble evading criminal processes initiated against them in this context.408
406 See Bandhua Mukti Morcha v. Union of India and Ors, 1984 SCR (2) 67 407 A Report on Bonded Labour Rehabilitation Scheme under Centrally Sponsored Bonded Labour System (Abolition) Act, 1976
in the state of Madhya Pradesh, Orissa, Rajasthan, Tamil Nadu and Uttar Pradesh, by Socio Economic and Educational
Development Society (SEEDS), sponsored by the Planning Commission of India & Report of the Expert Group on Bonded
Labour set up by the National Human Rights Commission in 2001. 408 For e.g., A Report on Bonded Labour Rehabilitation Scheme under Centrally Sponsored Bonded Labour System (Abolition)
Act, 1976 in the state of Madhya Pradesh, Orissa, Rajasthan, Tamil Nadu and Uttar Pradesh, by Socio Economic and
Educational Development Society (SEEDS), sponsored by the Planning Commission of India & Report of the Expert Group on
Bonded Labour set up by the National Human Rights Commission in 2001.

367
In 2013, the Government of India acknowledged the continuing prevalence of bonded
labour in the country and identified ten districts, including Gaya in Bihar, Bastar and
Kondagaon in Chhattisgarh, Prakasam and Chittoor in Andhra Pradesh, Kanchipuram
and Vellore in Tamil Nadu, Bolangir in Odisha and Gumla in Jharkhand.409 What this
campaign has thrown up are repeated traces of modern day forms of bondage.
There is a close relationship between trafficking and bonded labour that recent reports
reveal. In February 2014, a newsmagazine published its report after travelling to
hamlets in Narayanpur and Kanker districts of Chhattisgarh. The report speaks of
tribal women being lured by promises, sometimes of work and sometimes of other
journeys.410 Official records, it says, show that 9000 girls have gone missing from
Chhattisgarh in the past ten years. These are complaints that have been registered with
the police, most of which are from Raipur. The report says that the government claims
that the police have traced the whereabouts of 8000 girls, while a 1000 remain
missing. Activists warn that the figure of missing girls could be closer to 90,000.
Placement agencies and local agents active in the region send them to become
exploited labour in factories in Andhra Pradesh, Tamil Nadu, Delhi, Mumbai and
other parts of Maharashtra. While there are some reports of the agents being arrested
for human trafficking, there are no indications of any action being initiated in the
factories and workplaces, who are using the labour of the girls.
There are capacities created by the law for state governments to protect the workforce
that travels from their state to another state from exploitation. The Inter-state Migrant
Workmen (Regulation of Employment and Conditions of Service) Act, 1979 has been
on the statute books since 1979. This law enables the government of a state from
where workers migrate to reach into state where they are taken for work. In 1990 the
Supreme Court made it easier for the officers of the state from where workers migrate
to protect the workers from exploitation: "This is a beneficial legislation for satisfying
the provisions of the Constitution and the obligation in international agreements to
which India is a party. We do not think there can be any valid justification for not
permitting the officers of the Originating State to hold appropriate enquiries in the
Recipient State in regard to persons of the Originating State working as migrant
labour in the Recipient State. ... We make a direction that to implement the provisions
of the Act of 1979 ... every State and Union Territory in India would be obliged to
permit officers of originating States of migrant labour for holding appropriate
409 See “Govt to rehabilitate bonded labourers: Ramesh”, Press Trust of India, 18 th October 2013. Available at
http://www.business-standard.com/article/politics/govt-to-rehabilitate-bonded-labourers-ramesh-113101800475_1.html. Last
accessed on 16.5.2014 at 5:00 pm. 410 See “Slaves to the Grind”, Priyanka Kaushal, Tehelka, Issue 6 Volume 11, 8th February 2014. Available at
http://www.tehelka.com/slaves-to-the-grind/?singlepage=1. A report about Uttarakhand entitled “Uttarakhand tribal community
bound to bonded labour”, Archi Rastogi, Down to Earth, 31st March 2007 is available at
http://www.downtoearth.org.in/node/5758. Last accessed on 5.4.2014 at 1100 am.

368
inquiries within the limits of the Recipient States for enforcement of the statute and no
Recipient State shall place any embargo or hindrance in such process.”411
The study submitted to the Planning Commission reports that 95.2 percent of those
surveyed said that it was the help provided by the state government that had helped
them come out of bondage. It is without doubt that the intervention of state
government is imperative in preventing human trafficking, practices of bonded labour
and protection against exploitation of persons and communities migrating outside the
state.
It would be trite to say that it is persons in various states of poverty who become
susceptible to these forms of exploitation. The bonded labour law, and an
acknowledgement of the prevalence of bonded labour has been around for close to 40
years. That this practice has not abated, that modern forms of slave-like practices have
emerged, and that there is a preponderance of Scheduled Tribes, along with Scheduled
castes in the population that makes up bonded labour is inexcusable. Dealing with this
issue, while not adversely affecting the right of the free movement of all persons, is a
matter that needs to be urgently attended to.
9.14 Recommendations
1. The past twenty years have been dramatic in the changes in the economy, and
in the effect that economic policy has had on tribal communities. This has also
been the period when laws, notably the Provisions of Panchayats (Extension to
Scheduled Areas) Act, 1996 and the Scheduled Tribes and Other Traditional
Forest Dwellers (Recognition of Forest Rights) Act, 2006, have been enacted
which recognize autonomy and rights of tribal communities.
2. The implementation of these laws is, however, sputtering and reluctant. The
FRA framework includes provisions for: (i) recognition and vesting of rights
(towards a secure tenure and livelihood/food security of the Scheduled Tribes
and Other traditional forest dwellers), (ii) protection of the rights till the
recognition and vesting process is completed, and (iii) control over forests of
the local community and the Gram Sabhas. This framework, however, is
missing from the process adopted for implementation of the law and the
implementation structure does not have the necessary mechanisms and the
vision to realize the objectives of the law. What is needed foremost is to
strengthen the institutional system to support the process of implementation,
including strengthening of the Gram Sabhas and FRCs, streamlining
411 Dr Damodar Panda v. State of Orissa, (1990) 3 SCR 390.

369
functioning of the sub-divisional and district level committees, strengthening
the functioning of the state level monitoring committees and a dedicated
structure within the nodal ministry (Ministry Of Tribal Affairs).
3. The implementation of the community forest rights has hardly taken off. It
needs to have a clear mechanism and plan for recognition of various
community forest rights and rights of vulnerable communities such as PVTGs
and pastoralist communities.
4. The implementation of the protective provisions in the law and the process of
recognition and assertion of forest rights is so far largely affected (obstructed)
by contradictory processes like: diversion of forest land which, among other
things, is displacing Scheduled Tribes/OTFDs and alienating their rights,
displacement from the protected areas and Tiger Reserves, and displacement
due to intervention by the Forest Department through forceful plantation in the
forest lands. While the protective clause under FRA is meant to prevent such
cases of violation of forest rights, the implementation process has almost
entirely ignored the protective parts of the law.
5. The democratic structure in forests with the Gram Sabhas as laid out in the
FRA faces great resistance from the current forest regime and the various
forestry institutions and programs implemented by the Forest Department and
the MoEF. In the Joint Forest Management program, for instance, the
operation of working plans are found to be obstructing the process of assertion
of rights by the Gram Sabhas. It is necessary to remodel the entire structure of
forest administration, the Forest Department, the MoEF and its programs to
complement and enable the control and management of forests by Gram
Sabhas and local communities.
6. The changed paradigm has not yet permeated administration, and projects and
plans continue to approach forests as the exclusive domain of the state. This is
resulting in multiple ways and situations in which the laws are subverted, and
the rights of tribal communities denied. The exception to linear projects and
the decisions of the Cabinet Committee on Investment illustrate the point.
Such deliberate flouting of the law currently has no penalties attaching to it.
Such penalties that will deter the breaching of the FRA need to be introduced.
7. The FRA mandates the representation of women in Gram Sabha and in the
other tiers prescribed by the law. Effective participation has, however, been
370
elusive. Given the close relationship between forests, forest produce and
women’s lives, there is work to be done to turn this around.
8. The difference between states of poverty and of vulnerability has been
explored in the context of PVTGs. Access to resources in forests makes a
difference in the extent of their vulnerability. Where there has been a depletion
of forest cover, and the emphasis is on timber trees, the effect is to add to the
vulnerability of PVTGs. Where, on the other hand, the resources are
safeguarded and the community has access, the ability to prevent nutritional
distress can be augmented.
9. Displacement for creating Tiger Reserves and Elephant Corridors take away
from the provisions that recognize that tribals need to be asked to be displaced
only if co-existence is impossible and with Gram Sabha consent. The
resettlement experience of those displaced speaks to continued marginalization
of affected communities. This is a common tale, and that is the way it has
largely been through the years. Even where the decision to displace is taken
reasonably and according to the process prescribed, the inability displayed in
effecting rehabilitation has to be acknowledged. There is an urgent need to
review the ability of administrators who are responsible for rehabilitation, and
for revising the rehabilitation process. Failed rehabilitation has consequences
that have been ignored for far too long.
10. The import of PESA has not been internalized into administrative practice, and
government officials including Forest Departments continue to deny access to
tribals to that which is their right. Bureaucracies and judicial institutions need
to be introduced to the changes that PESA has brought into administration and
control in Fifth Schedule areas.
11. An exercise to bring rules made by state governments in conformity with
PESA needs to be undertaken.
12. Government officials who were the agencies to prevent tribal loss of land are
increasingly being seen to be negotiators on behalf of project authorities. This
is a very disturbing trend, where the very authority who had been tasked with
preventing land alienation from a tribal to non-tribals becomes an agent for
effecting such alienation. This must be stopped.

371
13. There have been recorded cases of Gram Sabha consent being fraudulently
obtained or forged; such conduct must face penalties, and projects that proceed
on the basis of consent so obtained cannot be allowed to proceed. If such
consequences do not flow, there will be no incentive to refrain from such
actions.
14. Given the constitutional provision in Article 243-ZC, the creation of new
Nagar Palikas or the extension of those already in existence in Fifth Schedule
areas and tribal areas, as defined in the provision, must be preceded by a law
made by Parliament, which sets out the exceptions and modifications from the
chapter on Municipalities introduced by the 74thAmendment to the
Constitution.
15. The amendments proposed to PESA has an important component of prior
informed consent. This is a necessary condition for the effective
implementation of PESA.
16. There has been a proliferation of MoUs between states and companies that
imposes responsibility on the state to facilitate various aspects of project
clearances including in matters of environmental and forest clearances.
Increasingly, the state undertakes to maintain law and order for the smooth
execution of the project. These MoUs make the state a party to an agreement
and take away the neutrality of the state. The idea such MoUs needs to be
reviewed. Institutions such as the Cabinet Committee on Investment that set
priorities and pursue them even where it is in direct breach of the law amounts
to deliberate flouting of the law and such practices of expediency need be
halted.
17. Public policy and practice must draw on the iconic experience of Niyamgiri,
and the adverse lessons from the Salwa Judum.
18. The encounter of the tribal with criminal law has been one of the disturbing
aspects in the past decade. Large numbers of tribals, men and women, are in
jails for what are termed ‘naxal offences’. There is, of course, no legal basis
for terming anything a ‘naxal offence’. Others are charged in areas where
there is resistance and protest against projects, provoking the assessment that
the criminal law is being used as a tool of the state to suppress dissent. The
acquittal rate is extraordinarily high, raising doubts about the use of criminal
law. Yet, the years spent in jail, multiple charges that are imposed on the
tribals and the charges on tribal leadership and on supporters have become the
new normal. The committee is of the view that a Judicial Commission needs to
be appointed to investigate cases filed against tribals and their supporters; only

372
this will allay the concerns that have risen about the misuse of criminal law by
the state.
19. De-notified Tribes have been asking that steps be taken to remove stigma and
prejudice from their lives. More specifically, the Habitual Offenders Act,
which has served to continue to attach criminality to them, be repealed. Anti-
beggary laws render the talents that they possess, such as juggling and
acrobatics, into punishable conduct; there are earnest demands for the repeal
of these provisions in the law. Women bear the brunt of this attribution of
criminality, and whole communities of women find themselves in prostitution
without a choice. Complaints about police brutality including custodial rape
were rife, speaking of lawlessness among the law enforcers. Such lawlessness
is unacceptable and action must be taken in accordance with law.
20. The Andaman Trunk Road which the Supreme Court ordered to be closed in
2002 still continues to be open to traffic. Although there are formal directions
against plying commercial traffic on the road, these have been observed only
in the breach. Tourist vehicles including buses and taxis ply on this road. In
the past few years, the exploitation of Jarawas as a tourist attraction, and the
sexual exploitation of the Jarawas has been recorded and reported on. The
problem has however not abated. The Andaman Trunk Road will have to be
closed if the Jarawas are to be protected from such unwelcome interest. DNA
testing on Jarawas has been reported. Efforts to get the protocols used to
ensure the consent of the indigenous population did not yield result. This
becomes of especial significance in the context of the Human DNA Bill, 2012
which proposes the creation of DNA data bases. Informed consent is a
necessary part of such exercises, also among the indigenous population.
21. The persistence of bonded labour, and the trafficking, in large measure, of
women from tribal areas needs a concerted effort to end it. The state has to
take primary responsibility to identify, release and rehabilitate bonded labour,
wherever they are found.

373
10. Delivery of Public Goods and Services412
10.1 Introduction
The Planning process in India has, since its inception, emphasized inclusion of
marginalized communities, including the Scheduled Tribes. Initially, it focused on
directing sufficient resources for the development of Scheduled Tribes, along with
establishing institutions and mechanisms for delivery of goods and services. These
processes were set in motion, under various schemes and programmes. The strategy
changed from Plan to Plan and evolved over time. The first of these institutions
created were the special Multipurpose Tribal Development Projects (MTDPs),
established towards the end of the First Plan and continued during the Second Plan.
However, these could not fully serve the interests of the tribal people, as there were
several schemes that were broad in nature. A different strategy was adopted during the
Third Plan, wherein all the Community Development Blocks with tribal population of
66 per cent and above were converted into Tribal Development Blocks (TDBs). By
the end of the Fourth Plan, there were 504 TDBs in the country. This strategy too, had
its limitations, as it was unable to address the interests of over 60 percent, tribal
population living outside the TDBs.
During the Fifth Five Year Plan, the strategy of the Tribal Sub Plan (TSP) was
adopted, and saw the creation of more robust institutions like ITDP and ITDA.
Simultaneously, the exercise of identification of tribal majority blocks in the country,
was undertaken in the Fifth Plan period (1974-79) and completed in the Sixth Plan
period (1980-85). The basic objective of the Tribal Sub-Plan (TSP) is to allocate
government resources equitably between the overall population and tribal population.
Funds earmarked under the TSP had to be at least equal in proportion to the
Scheduled Tribe population of each State or UT. Similarly, all Central Ministries had
to provide funds, in proportion to the population of Scheduled Tribes at the all India
level.
When first formulated, the important constituents of the Tribal Sub Plan were:
identification of development blocks having, generally, a majority of ST
population and approximately constituting them into ITDPs;
preparation of a project report for each ITDP based on the natural
resource endowment therein, available financial resources and the
avocations, skills and aptitudes of the people of the ITDP
412 The views of the Secretary, Ministry of Tribal Affairs are presented in this chapter.

374
ensuring availability of at least population-proportionate, pooled
financial resources earmarked from the State Plan funds, funds of
Central and Centrally sponsored programmes, special Central assistance,
institutional finance and any other source, and
placement of a suitable techno-administrative structure in the ITDP for
execution of programmes, schemes, etc. (generally a full-fledged
hierarchy for execution of projects and scheme with a Project Director or
Project Administrative heading a few selected sector specialists was
brought into being).
Integrated multi-sectoral project reports, with pooled funds garnered from various
sources, were prepared during the Fifth and Sixth Plans for a large number of ITDPs
and executed during the Seventh Plan. The first State TSPs were finalized in 1975-76.
Separate sub-heads for TSPs were also introduced in State Budgets at approximately
the same time.
Partly modifying the guidelines, in 2010, the Planning Commission laid down
differentiated Ministry/Department-wise earmarking of Plan funds under TSP. It also
improved follow up with States and Central Ministries. As a result, in recent years,
i.e., 2010-11 onwards, the total outlays available for TSP, in nominal terms, have
increased substantially. Central outlay for TSP has increased in recent years but
continues to be less than the share of STs in total population (Tables 10.1 and 10.2)
Table 10.1: Central Government Annual Outlay for Tribal Sub-Plan
Year Total Gross Budgetary
Support (GBS) (BE)
(Rs. Crores)
TSP (Rs.
Crores) TSP as % of GBS
2010-11 280599.99 8616.49 3.07 2011-12 335521.00 18462.30 5.5 2012-13 391027.00 21710.11 5.55

375
Table 10.2: Ministry-wise TSP Outlay
S.No. Ministry/Department Mandated
TSP (%)^^ TSP Outlays (%GBS)
2012-13# 20136-14# TSP % TSP %
1 D/o Telecommunications 0.25 12.00 0.25 14.50 0.25
2 Ministry of Textiles 1.20 84.00 1.20 55.57 1.20
3 Ministry of Water Resources 1.30 19.50 1.30 19.50 1.30
4 D/o Food and Public
Distribution
1.40 4.06 3.22 6.28 2.42
5 Ministry of Culture 2.00 17.28 2.00 28.70 2.00
6 Department of AYUSH 2.00 19.80 2.00 21.38 2.00
7 Ministry of HUPA 2.40 27.72 2.40 35.04 2.40
8 Ministry of Tourism 2.50 30.25 2.50 32.05 2.50
9 Department of Science &
Technology
2.50 61.93 2.50 69.43 2.50
10 Ministry of Road Transport &
Highways
3.50 500.00 2.17 800.00 3.40
11 D/o Agriculture Research &
Education
3.60 116.00 3.60 123.00 0.36
12 Ministry of Mines 4.00 8.72 3.59 9.72 2.08
13 D/o Information Technology 6.70 201.00 6.70 201.00 6.70
14 D/o Higher Education 7.50 1159.35 7.50 1219.59 7.52
15 D/o Agriculture &Cooperation 8.00 882.59 8.03 932.50 8.00
16 Ministry of MSME 8.20 139.48 4.92 244.21 8.20
17 Ministry of Coal 8.20 31.00 6.89 31.60 7.02
18 Ministry of Youth Affairs and
Sports##
8.20 85.60 8.22 90.28 8.26
19 Ministry of Labour and
Employment
8.20 202.54 8.20 206.95 8.20
20 Ministry of Panchayati Raj 8.20 17.44 5.81 37.55 7.51
21 Ministry of Women & Child
Development
8.20 1517.00 8.20 1668.70 8.20
22 D/o Health & Family Welfare 8.20 2224.41 8.20 2391.53 8.20
23 Department of Land Resources 10.00 320.05 10.00 576.45 10.00
24 D/o Drinking Water and
Sanitation
10.00 1400.00 10.00
1526.00
10.00
25 D/o School Education &
Literacy
10.70 4918.68 10.70 5313.52 10.70
26 D/o Rural Development 17.50 3460.37 4.73 4452.03 5.98
27 Ministry of Tribal Affairs** 100.00 4090.00 260.01 4279.00 242.85
28 Ministry of Environment and
Forests*
0.00 16.00 0.66 16.00 0.66
29 Department of AIDS Control* 0.00 139.40 8.20 146.37 8.20
30 Ministry of Social Justice and
Empowerment*
0.00 46.00 0.69
NOTE: Statement 21-A Expenditure Budget Volume 1
## At the time of Task force Report, these were shown as two separate departments. However, in statement-21-A of
2012-2013 and 2013-14, these are shown as a single department. * Not mandated to compulsorily earmark for TSP.
** The TSP allocation is in excess of 100% of GBS because the GBS does not include allocations under SCA to TSP
and Grants under and Article 275(1) of the Constitution, but these allocations are included in computing total TSP of the Ministry of Tribal Affairs.
^^ TSP proportion as recommended by Task force and accepted by Planning Commission.

376
The TSP strategy specially implemented for Scheduled Tribes has not yielded desired
results. As per the Sub-Plan approach, the Central Government is required to ensure
that out of its total Plan budget, at least 8.6 percent (as per 2011 Census) is earmarked
for the development of Scheduled Tribes in the Union Budget. But, the decline in the
budget allocations for TSP in proportion to the Scheduled Tribe population is a cause
for serious concern. This anomaly has to be seriously addressed.
Such shortfall of funds for TSP in the budget allocations is also evident from the
previous financial years. For instance, only about 5 percent of funds were allocated
from Central plan to TSP during 1997-2000 against about 8 percent of population
share of Scheduled Tribes during that period. Thus, the actual allocation of funds
under the TSP was much lower than what was actually desired.413 Such trends
indicate that the Central Government itself is not following the Planning Commission
guidelines in earmarking adequate funds for Scheduled Tribes. Added to this, there
has been poor utilization of the allocated funds for the welfare of Scheduled Tribes.
The State governments have also not earmarked adequate funds for Scheduled Tribes.
Inadequate allocation of funds is evident from seven States, out of 22 TSP States, as
evident from the following table:
Table 10.3: Tribal Sub-Plan outlay for selected States
State Percent of ST
Population
(2001 Census)
Total Plan (annual)
outlay (Rs. in
crores)
Outlay for
TSP (Rs. in
crores)
Percent of
TSP
allocation
Assam 12.4 14537.33 491.21 3.3
Chhattisgarh 31. 8 23480.00 7356.00 31.3
Goa 12.06 4700.00 566.42 12.0
Gujarat 14. 8 51000.00 6682.41 13.1
Karnataka 6.6 42030.01 2075.00 4.9
Maharashtra 8.9 61803.51 4005.00 6.4
Sikkim 20.6 1877.00 151.33 8.0
Source: Annual Report 2012-13, Ministry of Tribal Affairs, Government of India.
As per guidelines issued by the Planning Commission, the Tribal Sub Plan funds are
to be non-divertible and non-lapsable. But, most of the funds meant for TSP have
been diverted to other sectors and purposes, and some of them have also been lapsed
due to their improper utilization or failure of administrative machinery. Such
413Thorat, Sukhadeo and Chittaranjan Senapati. 2007. Reservation in Employment, Education and Legislature: Status and
Emerging issues. Working Paper Series, Vol. II, No.5. New Delhi: Indian Institute of Dalit Studies. www.dalitstudies.org.in

377
inadequate allocation, underutilization, diversion, and lapse of funds are evident in the
case of Andhra Pradesh.
Table 10.4: Tribal Sub Plan Allocation
Year Total Plan
(annual)
outlay
TSP
allocation
Percent
of TSP
allocation
TSP
expenditur
e
Percent of
TSP exp.
to total
plan exp.
Difference/
Diversion/
lapse of
funds
2002-2003 8553.19 639.27 7.47 508.35 6.11 130.92
2003-2004 10970.46 761.48 6.94 705.17 6.55 56.31
2004-2005 13291.2 777.46 5. 85 856.93 7.48 -79.47
2005-2006 15650.76 915.26 5. 85 776.97 5.78 138.29
2006-2007 2000 1184.85 5.92 1411.05 7.89 -226.2
2007-2008 30500 2454.82 8.05 2357.59 8.77 97.23
2008-2009 44000 3331.96 7.57 1690.8 5.12 1641.16
2009-2010 33496.75 2370.86 7.00 1527.58 5.14 843.28
2010-2011 36727.96 2529.19 6.77 555.43 9.74 1973.76
2011-2012 42915.54 2292.29 5.34 Source: Palla et.al, 2012
The State government of Andhra Pradesh which brought the legislation on Tribal Sub
Plan (Andhra Pradesh Scheduled Castes Sub-Plan and Tribal Sub-Plan Act 2013) for
making mandatory fund allocation in the budget and its utilization on the basis of
population ratio of Scheduled Tribes has failed to implement it. The report of the
Comptroller and Auditor General of India (CAG) submitted to the legislature revealed
that the objective did not materialize even after the legislation. While the Government
should earmark at least 6.6 percent of its Plan outlay in the budget exclusively for
Scheduled Tribes, the actual allotment was only 4 percent of State budget for
Scheduled Tribes in 2012-13, according to the CAG. CAG also revealed that funds
for TSP were released below the stipulated percentage in the last five years.414
Even if fund allocation is disproportionate to the Scheduled Tribe population and its
non-utilization or low-utilization, whatever allocation is made for TSP, the benefit has
not been proportionate. No compromise should be made with regard to TSP fund
allocation and its proper expenditure for the benefit of the Scheduled Tribes. Perhaps
a computation of non-utilized, under-utilized and diverted funds from the TSP
allocation for a period of 10 years at the all-India level by MoTA would highlight the
injustice done to the Scheduled Areas and Scheduled Tribes. Sub-Plan expenditure
has not resulted in the benefits optimally because of the complexity of programs and
their tardy implementation. Therefore, there is a need for simplicity of programs,
increasing awareness about the programs, particularly in remote areas, and need-based
programs in consultation with the communities.
414 The Hindu, 2014. Andhra fails to make mandatory allocation for SC/ST sub-plans. Hyderabad, February 14, 2014.

378
However, this increase in funds has not generally translated into better socio-
economic outcomes for tribal populations for a variety of reasons. Foremost is the fact
that the majority of the tribal population is less vocal, has been traditionally
disadvantaged and live in remote places. In addition to the problems of physical
access, the absence of functionaries of line departments and language of
communication are serious barriers. As a result, this money allocated for the tribal
population, lapses and is, in effect, transferred to non-tribal people, in the subsequent
financial year. Further, the per-capita cost of infrastructure for tribal areas is higher
than the rest of the population, because tribal population is dispersed, often in remote
hamlets and in hilly, inaccessible areas. The problem has been exacerbated by (a)
continuous presence of extremist groups, which prevent the implementation of basic
programs like health, education, livelihood, in certain instances and (b) large scale
displacement on account of irrigation, mining and other projects, as well as
declaration of their habitats as reserve forests and wild life sanctuaries. Another
reason for increased outlays under Plan schemes not translating into better outcomes
for Scheduled Tribe population is that the delivery system of public goods and
services has remained weak.
The utilization of funds under the Centrally Sponsored Schemes (CSS) in the social
sector, livelihood schemes and access to goods and services in the field, were to be
facilitated by the State Governments through appropriate institutional arrangements.
These included Integrated Tribal Development Projects (ITDP) or Integrated Tribal
Development Authorities (ITDA) in areas, which are generally contiguous areas of
the size of at least tehsil/block, in which the ST population is 50 percent or more;
development was also focused on MADA pockets which have 50 percent or more ST
population with a minimum population of 10000; and clusters which are identified
pockets having at least 50 percent population with a minimum population of 5000. At
the time of their initial identification and establishment, the ITDAs / ITDPs were
sound institutions, but over time States did not pay enough attention for maintaining
and strengthening their institutional capabilities, providing manpower and modern
infrastructure. On the part of the Union Government, the focus on these institutions
was lost, particularly since 1990s, as these were considered State government
institutions, which was not the case. In contrast, the DRDAs continued to be stronger,
partly because the budget for Rural Development went up manifold, while that for
tribals under Article 275(1) stagnated or declined in real terms. As a result,
ITDAs/ITDPs have not been able to grow to the desired level. Thus, even as several
scheme-specific bodies at district level, including DRDAs, have become stronger over
the years, ITDAs have become weak in most of the States. (One exception is Andhra
Pradesh). As a consequence, the absorption of funds available under various CSS
schemes and the efficiency in utilization of funds has been low.
Clearly, rapid socio-economic development of Scheduled Tribes and bridging of gaps
vis-à-vis the general population, cannot be achieved unless robust institutions are in
place at field level, for delivery of public goods and services that are created under the

379
various plan schemes; institutions that can ensure efficient and effective use of
available resources and effective outreach to the tribal people. The ITDAs have to be
strengthened and fresh thinking on creation and strengthening of institutions of
delivery is required to address the numerous physical and geographical barriers faced
by tribal areas. In smaller concentration of tribals who are particularly in need of
support, micro projects have to be strengthened or set up where they do not exist.
ITDAs must be established in all blocks, where ST population is higher than 50
percent. In most urban areas, there is very little manpower for addressing problems of
tribals. There has been a significant increase in urban tribal population, during 2001-
11, which is a pointer to their ‘push’ migration. Therefore, new agencies need to be
created and functionaries from the Department of Tribal Welfare need to be deputed
to urban areas.
10.2 Twelfth Five Year Plan and Beyond
The Twelfth Five Year Plan, with its focus on faster, sustainable and more
inclusive growth, recognizes the importance of administrative strengthening
and improved governance. In addition, it emphasizes the following areas for
addressing socio-economic conditions of Scheduled Tribes:
Education and health
Livelihood support and employment, imparting of skills and creation of
employment opportunities near ST habitations
Improved infrastructure
Issues of land acquisition
Resettlement and rehabilitation of displaced tribal populations
Connectivity in Left Wing Extremism and tribal areas
Implementation of provisions of PESA and FRA.
In the foregoing chapters of this Report, we have underscored the vast differences
between STs and other social groups on a range of socio-economic parameters (some
of these are summarized in Table 10.5), implying thereby that the areas of focus
identified by the Twelfth Five-Year Plan would continue to need attention in
subsequent Plan periods. These would, no doubt, require greater infusion of financial
resources, although enhanced financial resources are not a sufficient condition for
achieving development of STs and PVTGs.

380
Table 10.5: Selected Socio- economic Indicators
Indicators Sub-Indicators Rural Urban Poverty* Population Below
Poverty Line (%)
2004-05*
ST SC OBC Others ST SC OBC Others
47.3 36.8 26.7 16.1 33.3 39.9 31.4 16
Health** (Haemoglobin less
than 12g/dl) All India
Women Men ST SC OBC Others ST SC OBC Others
68.5 58.3 54.4 51.3 39.6 26 22.3 20.9 Education*** GER (2009-10) All India
ST SC All Categories
Boys Girls Boys Girls Boys Girls
Elementary 119.7 115.2 111.9 111.1 102.
5 100.4
Secondary 55.3 45.8 71.2 63.9 66.7 58.7
Senior Secondary 31.3 22.6 37.5 33.8 38.5 33.5
Access to
Drinking
Water****
Source All India
ST SC General
Within premises 19.7 35.4 52.8
Near premises 46.7 43.6 32.5
Away 33.6 21 14.6
Electricity as main source of
Lighting**** ST SC General
61.7 69.0 71.3
Sources: * Planning Commission
** NFHS 3, 2005-06
*** Statistics of School Education, 2009-10, MoHRD, 2014 **** Census of India, 2011
10.3 Strengthening of Institutions: ITDAs/ITDPs
As per the existing arrangements, the ITDAs/ITDPs are the administrative units
adopted by a number of States for the purpose of delivery of programmes and services
to tribal individuals, households and habitations. Till date, about 194 ITDPs/ITDAs
have been set up in the states of Andhra Pradesh, Assam, Bihar, Gujarat, Himachal
Pradesh, Karnataka, Kerala, Madhya Pradesh, Maharashtra, Manipur, Odisha,
Rajasthan, Sikkim, Tamil Nadu, Tripura, Uttar Pradesh, West Bengal and Union
Territories of Andaman and Nicobar Island and Daman & Diu. The ITDP/ITDAs are
expected to undertake planning and implementation of various programmes and
projects of the State Governments as well as of the Government of India in their
respective areas. They are responsible for infrastructural development, income-
generation activities, health and education related service delivery as well as
implementation of Forest Rights Act within their areas. These institutions were
established with the primary objective of ensuring an integrated implementation of
development programmes for tribals in the sub-plan areas. In the years 1975-1990,
they were capable of delivery of services to tribal areas, including remote,
inaccessible tribal habitations, with due regard to language and cultural context. Some
States, like Odisha, also developed the institution of micro-projects for development
of PVTGs. The weakening of these delivery institutions in tribal areas over the last
381
two and a half decades has become an area of major concern. It has created a self–
perpetuating cycle of poor performance, low financial allocations, which in turn,
result in low expenditure under CSS and poor delivery of goods and services, leading
to lower subsequent allocations. While there is no shortage of funds for livelihood
sectors like agriculture, animal husbandry, horticulture, handicrafts, handloom and
skill development under various Centrally Sponsored Schemes, for reasons mentioned
earlier, the access of tribal population to such schemes continues to be poor.
Depletion of forests and displacement has further exacerbated livelihood problems.
Against this background, the role of ITDA/micro projects has become more important
than it was decades ago.
The Forest Rights Act has also cast additional responsibility on the field staff of the
Tribal Welfare Department. The main responsibility is to enable Gram Sabhas to take
informed decisions. These agencies must be pro-active, when the rights of the forest
dwellers are adversely affected. While MGNREGA supports land and watershed
development for increased productivity of land settled under FRA, absence of
supporting staff for implementing the scheme has resulted in low absorption of funds
available for supervision of these works. This requires additional technical staff for
ITDA / micro projects etc.
The actual structure of an ITDA/ITDP, in terms of core manpower and control of the
Project Manager, ITDA on personnel of related line Departments varies considerably
across states, thereby affecting service delivery. A substantial amount of TSP funds
are still utilized for infrastructure creation. In the absence of a dedicated engineering
wing with the ITDAs/ITDPs and/or the Tribal Welfare Department, the responsibility
lies with PWD, for whom tribal development is not a priority. This leads to delay in
execution of programmes.
Andhra Pradesh exemplifies a good model of ITDA, where each unit is equipped with
engineering, health and education personnel accountable to the Project Manager. The
presence of the core staff enables smooth functioning of the agency. In 1986, the
Government of Andhra Pradesh issued an order establishing a single line
administrative system in the ITDA areas with the primary objective of ensuring an
integrated approach for implementation of development programmes for the tribal
people in the sub-plan areas. In order to facilitate better coordination among all the
functionaries operating in the sub-plan areas, the departments working in the sub-plan
areas were brought under the administrative control of the Project Officer, ITDA. This
has facilitated tribal people to use a single agency for redressing their grievances on
development as well as regulatory matters. Subsequently, in early 2014, the State
government strengthened this single line system by issuing comprehensive guidelines
so as to enable the Project Officers of ITDAs to exercise their responsibilities towards
tribal development.415 An indicative staffing pattern of ITDA in Andhra Pradesh and
415 These guidelines, inter alia, include, (i) that project officer (PO) of the ITDAs shall be, as far as possible, from the senior time
scale of IAS; (ii) every PO will be supported by an additional PO, preferably in the rank of Special Duty Collector; (iii) powers

382
letter dated 30th April, 2014 issued by Ministry of Tribal Affairs along with Orders
issued by the Government of Andhra Pradesh are presented in Annexure 5.
10.4 Strengthening of Institutions for PVTGs
Apart from areas covered under the ITDAs/ITDPs, smaller concentrations of tribals
scattered both within and outside ITDA areas are particularly in need of institutional
support, to translate the programmes into actual flow of benefits. There has also been
considerable displacement of tribals from their traditional hamlets, initially because of
declaration of their habitat as Reserved Forests and irrigation projects and later,
because of mining projects and violence. In the Northeast, there has been
displacement of tribal people, because of inter-ethnic conflict. Many of them lack
housing and other amenities in the new locations. New micro agencies need to be
created in such pockets to cater to displaced tribal groups. Micro-projects with an
administrative unit with core financial resources, flexibility to address various issues,
for a defined population in a given geographical area have been found to be
successful. For instance, in Odisha, a micro-project model of providing services to
PVTGs has been found to be effective. This model of micro projects is being
effectively used in Odisha. Between 1976-77 and 1994-95, the Government of Odisha
established micro-projects in 17 Blocks to cater to 11 PVTGs spread over 541
villages. Other States should create similar agencies for PVTGs.
10.5 Creation of Institutions in Urban areas
A large proportion of Scheduled Tribes are migrating to urban areas for reasons
mentioned earlier. During the census decade, 2001-2011, the number of STs in urban
areas increased from 66.19 lakhs to 104.62 lakhs, which is an increase of 5.8 percent
per annum. Many of these people have become wage labourers in urban areas. These
STs who migrate from rural areas to urban areas suffer loss of identity, community
solidarity, land, entitlements such as ration cards, and common resources. Many
people who live in urban areas have no records to prove they belong to Scheduled
Tribes making it difficult to get certificates. It is imperative that States work towards
the creation of micro projects in urban areas which have substantial ST population to
assist them. For setting up the micro projects in urban areas, each State can consider
which are exercised by the Collectors/Joint Collectors/District Revenue Officers in specified districts as well as under particular
laws relating to Forests, Health and cooperative societies, etc. shall be exercised by the PO of ITDAs in so far as tribal sub plan
areas are concerned; (iv) officers in charge of DRDA and DWMA responsible for implementation of rural development
programs in ITDA areas shall work under the administrative control of PO, ITDA; (v) Panchayati Raj Department shall delegate
powers of CEO, Zilla Parishad over MPDOs, to PO, ITDA to the extent of ITDA mandal so that single line administration works
effectively; (vi) the budgets of various development/welfare activities should be bifurcated at the departmental level between TSP
and non-TSP in the case of districts with ITDAs. The TSP projects/proposals of such districts shall be approved by the ITDAs
concerned. PO, ITDA shall monitor the implementation of all programs in the ITDA areas.

383
the towns listed in recent Census that have an ST population of more than 10,000,
which could serve as a first step.
In metropolitan areas, the immigrant tribals are facing a plethora of problems. The
violence against people coming from Northeast in Delhi, Bangalore and other cities,
and the perception of these people that all violence is racist have become two serious
issues. Violence against women in public places, road rage, etc. are common in Delhi.
Some such violence may be targeted racially, but the bulk of violence is similar to that
which happens to any other community who has come to the city from another part
recently, and may not be racist. There is also trafficking from Schedule V areas of
tribal women (and men and children) to cities to work as domestics. In metropolis,
absence of habitat is the biggest issue, which makes the migrant population
vulnerable. Some of this problem has to be tackled at the place of push migration
which we have discussed throughout the report. But in some big cities, there is need
for centers which will provide registration, counseling and information. These centers
should also assist in the States where such migration originates.
10.6 Knowledge and capacity-building institutions – Tribal Research
Institutions
The Government of India has always recognized the need for continued research on
cultural, anthropological, socio-economic and related issues concerning tribals. The
outcome of this research and documentation work is expected to feed into the policy
and programmes for tribal development. In view of this, the Ministry of Tribal Affairs
has been supporting Tribal Research Institutes (TRIs) in 18 States on 50:50 sharing
basis between States and the Centre and one TRI in the Andaman and Nicobar Island
Union Territory with 100 percent grant. In addition, 100 percent grants are given for
specific research projects from the Ministry of Tribal Affairs. These institutions are
required to undertake studies, research & documentation so as to provide planning
inputs to the State Governments and also conduct training, seminars and workshops,
documentation of customary laws, setting up of tribal museum for exhibiting tribal
artefacts, and other related activities. However, most of the TRIs are facing financial
and manpower constraints. In view of the fiscal responsibility laws, recruitments to
existing posts has been frozen in several areas in most of the States, and Tribal
Research Institutions have been neglected in the process. There is a need for
strengthening and broadening research and training activities by these institutions.
The main functions/ responsibilities of the TRIs should be:
To develop a repository of knowledge and research
To support evidence-based policy, planning and legislations
To provide basic training, post-recruitment to Tribal Welfare Service
officials

384
To build capacity of tribal people, functionaries engaged in tribal
welfare programs/ schemes, Self Help Groups and elected
representatives on matters relating to livelihood as well as laws such as
Forest Rights Act (FRA), PESA Act and Regulations in Scheduled Areas
To disseminate information and create awareness on tribal issues,
entitlements, schemes and programmes
To achieve these goals, the TRIs would need to:
Build capacity to coordinate and network with related research institutes
and organizations as well as academic bodies;
Create basic minimum infrastructure with a research wing, conference
hall, library, training hostel and museum as part of the TRI structure.
Assist in recruitment of a core group of professionals, which shall
comprise experts from various disciplines including Anthropology,
Tribal Studies, Development Studies, Culture Studies, Ethnography and
Statistics. Director of TRIs should be a full time officer.
Having seen the impact of fiscal responsibility regimes, which have resulted in staff
reduction in TRIs, we recommend that the Union Government will have to support
emolument for the manpower at least for five years. The support for research and
contractual staff on 100 percent grant basis should continue.
10.7 Anthropological Survey of India
The Anthropological Survey of India (AnSI) is one of the many organizations under
the Ministry of Culture. However, the primary focus of AnSI is study of tribals. Our
interaction with present and former officials suggests that AnSI can become a more
relevant and functional organization, if it is brought under the administrative control
of Ministry of Tribal Affairs. This will enable MoTA to have a one-source technical
body on tribal issues.
10.8 Prioritizing Grants under Special Area Programmes
The Ministry of Tribal affairs is seriously considering this matter and has issued new
‘Operational Guidelines for formulation, implementation and monitoring of Tribal
Sub-Plan and Article 275(1) Grants’ in 2013-14, which prioritize expenditure for
strengthening of ITDAs and TRIs. The order of priority is as follows:
Strengthening of ITDAs/dedicated micro projects/create new ITDAs
Supporting additional manpower in livelihood and engineering wings
within ITDAs

385
Strengthening Tribal Research Institutes
Support to Residential Schools and Government hospitals in tribal areas
Support to linkage with livelihood projects
Any other project relating to wellbeing of tribals.
The guidelines mention that Stand-alone projects without forward and backward
linkages will not be supported. There is concern that the Ministry will be constrained
in its objectives on account of the stagnation of budget outlays, under its two Special
Area Programmes. Grants under both these programmes are broadly intended at
providing additive support to the efforts of State Governments towards overall socio-
economic growth of the Scheduled Tribe population. Grants under Article 275 (1) of
the Constitution of India are given for helping States in promoting the welfare of STs
and raise the level of administration in Tribal areas to bring them at par with that in
the rest of the State to ensure effective implementation of development projects. A
part of the grants under Article 275 (1) of the Constitution are also used for meeting
the capital and recurring costs Eklavya Model Residential Schools (EMRS) in the
States/UTs for providing quality education to Scheduled Tribe students in remote
areas. These outlays have been declining in real terms (Figure 10.1) in recent years,
severely limiting the Ministry’s ability to extend assistance to States and, in turn,
States ability to undertake upgradation of administration in tribal areas.
Figure 10.1
386
10.9 Union Finance Commission
Why Union Finance Commission (UFC) should make recommendations under Article
275(1) including provisos:
It is seen from the Terms of Reference of the Fourteenth Finance
Commission (FFC) that determination of principles for transfer of funds
under the provisos to Clause 1 of Article 275 of the Constitution of India
are specifically excluded. This exception may have been made on the basis
of a communication from the Ministry of Finance way back in 1956 to the
then Finance Commission which stated that a proviso to a particular
provision of the statute carves out an exception to the main provision and
that, therefore, the proviso to Article 275 of the Constitution is distinct
from Article 275(1). In this context, Ministry of Tribal Affairs has written
to the Fourteenth Finance Commission clearly explaining why the Union
Finance Commission should recommend on Article 275 grants including
the provisos. This view of the Ministry may be reiterated to emphasise that
throughout the Constitution, when a reference is made to an Article or
clause, no express provision has been made to exclude or include the
proviso to that particular Article.
In this context, the order of the Apex Court of 1985416 cited at page 9277
states that the proviso to Article 275 is one of the provisions under the
Scheme of the Constitution which aims at the protection, advancement and
prevention of exploitation of tribal people and therefore, is an integral part
of Article 275.
The grants under Article 275 are fixed on the basis of the
recommendations of the Finance Commission.417 This makes no
distinction between so-called main clause and proviso.418
The grants given to States as well as the Ministry are charged on the
Consolidated Fund of India and therefore, this means that both the funds
under Article 275(1) and the proviso are on the same footing. The
observation in 1956 was:
“The effect of provisos to clause (1) is thus to carve out an exception to that
clause by taking away the power conferred on Parliament under its
substantive part so far as grants in aid covered by the said provisos are
concerned”.
Since the grants under Article 275 (1) and its proviso are both 'charged' and not
‘voted’, therefore, there is no distinction between these two forms of grant-in-aid as
416 Lingappa Pochanna Appealwar V. State of Maharashtra, AIR 1985 SC 389: (1985)| SCC 479. 417 Durga Das Basu's Commentary on the Constitution of India, Eighth Edition, Vol. 8, 2011. 418 Ibid, page 9278.

387
far as the powers of the Parliament are concerned. Therefore, the above view of 1956
does not conform to the Constitution.
The mandate of the Union Finance Commission under Article 275 is in
addition to the mandate under Article 280 because Article 280 does not
include expressly the provision of Article 275. In view of this, Article 275
has to be read in addition to Article 280.
The scope of Article 275 and Article 275(1) does not distinguish between
the so-called 'main' clause and the proviso.419
The Eighth Finance Commission had made recommendations under the
proviso to Article 275(1).420 The 13th Finance Commission also made
recommendations relating to Fifth and Sixth Schedule Areas, though their
ToR was same as that of FFC and these recommendations were accepted.
The principles governing grant-in-aid under Article 280 (3) includes the
proviso in Article 275(1).421
The above clearly shows that the Constitutional provisions, case law,
interpretation by Constitutional experts and precedents mandate the Union
Finance Commission to make recommendations relating to grants under
Article 275, including provisos.
The scheme-based grants under the proviso were used to maintain the
institutions for administration and development of tribal people. However,
the funds available for MoTA (which essentially means scheme approved
by the Union Government) (Figure 10.1) have declined in real terms.
When bulk of the funds were released to the States under Article 275(1)
‘main’ clause, the Institutions like ITDAs and Tribal Research Institutions
have been allowed to wither away in most states.
It is for these reasons that every Finance Commission constituted by the
Government of India should recommend on Article 275 grants, including
the provisos.
419 Ibid, page 9277-9278. 420 Ibid, page 9280. 421 Ibid, page 9301-02.

388
10.11 Recommendations
1. The Andhra Pradesh model for ITDAs should be used as a reference
point for restructuring of ITDAs to ensure effective delivery of benefits
to the tribal people. In case of PVTG/extremely backward tribal
communities whether recognized as ST or not, the model of
‘microprojects’ of Odisha could be a model, at least as it existed
earlier. In the case of dispersed population of tribals outside the
geographical limit of existing ITDAs/ITDPs, there is no agency
dedicated to deliver the programs meant for STs in an effective
manner. Thus, new ITDPs/ITDAs need to be created in the blocks,
where ST population is 25 percent or higher or 10,000 or higher.
2. In case of dispersed population of tribals and displaced population (due
to infrastructure projects, conflicts) in some States, including the
Northeastern region, there is no agency dedicated to deliver the
programs. Therefore, new micro-agencies need to be created in such
pockets to cater to specific tribal groups.
3. Absence of supporting staff for implementing the MGNREGA and
FRA has resulted in low absorption of funds available for supervision
of these works. This requires additional technical staff for ITDA/micro
projects etc.
4. Many tribals have migrated to urban areas and are wage-earners. It is
imperative that States work towards the creation of micro projects in
urban areas which have substantial ST population. We are of the view
that each State can take the towns listed in Census 2011 that have an
ST population of more than 10000, as a starting point.
5. Most Tribal Research Institutions (TRIs) are facing financial and
manpower constraints and are finding it difficult to perform their
functions effectively. There is an urgent need for strengthening and
broadening research and training activities by these institutions.
6. The transfer of TRI, Madhya Pradesh, to the Department of Culture
has weakened the TRI. This Institution had been built primarily with
resources from Tribal Development funds. This should be restored to
the Department of Tribal Affairs of the State Government so that this
functions as the capacity-building component of TRI and not just as a
place of tourist attraction.

389
7. The Anthropological Survey of India (AnSI) is one of the many
organizations under the Ministry of Culture. However, the primary
focus of AnSI is study of tribals. Interaction with present and former
officials suggests that AnSI can become a stronger organization if it
comes under Ministry of Tribal Affairs. The Ministry officials are also
of the view that if the AnSI comes under MoTA, then MoTA will have
a one-source technical body on issues relating to tribals.
8. Funds available to the Ministry of Tribal Affairs for giving grants to
States under Article 275 (1) of the Constitution should be substantially
enhanced so as to enable the Ministry to provide larger support to the
States for strengthening of institutions and upgradation of
administration in tribal areas in accordance with priorities laid down
under its operational guidelines. These funds may be provided from
both the Planning Commission as well as successive Finance
Commissions.

390
Recommendations at a Glance
Tribes: Legal and Administrative Framework
1. During the colonial period, tribal communities inhabited areas were divided
into ‘excluded’ and ‘partially excluded’ areas for purpose of administration.
Such administrative arrangements have found continuation in post-
independence India in the form of Sixth and Fifth Schedules of the
Constitution. Laws enacted by the Governor-General in Council or Governor
in Council were not automatically applicable in these areas in colonial India
unless Governor General or Governor thought otherwise. In post-
Independence India, this legal provision has been continued in Sixth Schedule
Areas, but not in Fifth Schedule Areas. Thus, laws passed by the Parliament or
State Legislature are not directly applicable in Sixth Schedule Areas unless the
Governor thinks it desirable. In the Fifth Schedule Areas, laws passed by these
bodies are automatically applicable, unless the Governor thinks it to be not in
the interest and welfare of the tribal communities of the State.
There have been laws and policies passed by the Parliament and State
Legislatures such as the Forest Conservation Act, 1980, the Wildlife
Protection Act, 1972, the Panchayat Acts (prior to the passing of the 73rd
Amendment in 1992), and so on which have had an adverse and detrimental
impact on tribal communities. Yet the Governors have not exercised their
constitutional power towards the protection and welfare of the tribal
communities. This opens up two possibilities:
(i) Laws and policies enacted by the Parliament and State Legislatures
should not be automatically applied in the Fifth Schedule areas (as was
the case under colonial rule or as is presently the case in the Sixth
Schedule areas). Its applicability should be made contingent on the
discretion of the Governor who would determine its applicability or
non-applicability or applicability with modifications/amendments on
the advice of Tribes Advisory Council and issue a Statement of
Objectives and Reasons for decisions on both applicability and
inapplicability of laws and policies.
(ii) In case the above is untenable, the Governor should be mandated to
take the advice of the Tribes Advisory Council and examine
legislations and policies (particularly, though not exclusively, those
pertaining to issues such as forests, land acquisition, conservation,
mines and minerals, health and education) passed by the Parliament or
State Legislatures and the implications of the same on tribal welfare. A
mechanism for such examination and action should be clearly stated
and established.

391
2. Actions taken by the Governor for safeguarding the interests of tribal communities
should be clearly mentioned in the annual Governor’s Reports submitted to the
President. The Governors must be mandated to ensure the timely submission of these
reports. To this end, the Governor’s office must be adequately assisted by specially
set up competent and dedicated team in the form of Governor’s Cell for Scheduled
Tribes (as has already been initiated in some States).
3. The Tribes Advisory Council is an integral part of the administrative structure of
the Fifth Schedule. Currently, the TAC consists of 20 members, of which two-thirds is
comprised of elected members in the State Legislature belonging to the Scheduled
Tribes. The rest are nominated members who generally tend to be government
officials working in Ministries and Departments associated with tribal development.
In this regard, we recommend that:
(i) There needs to be a radical restructuring of the composition of the
TAC. Instead of two-thirds elected members from the State Legislature,
this should be restricted to half the members of the TAC. Moreover,
these elected representatives must come from different political parties,
rather than only from the ruling party. The remaining one-half should
be comprised of Chairpersons of the district Panchayat bodies (or
chairpersons of the Autonomous Council, wherever established) of the
Scheduled Areas on a rotational basis.
(ii) Tribes Advisory Council should be empowered, made active and
responsible for the tribal affairs in the State through the following
measures:
The scope and responsibilities of TAC should be widened to
transform it into the Tribes Advisory, Protective and
Developmental Council. Constitutional provisions, laws,
policies, and administrative matters pertaining to the Scheduled
Tribes must come under its ambit.
The tribal development plan of a State and its outlay should be
approved by the TAC before it is placed before the Legislative
Assembly.
In view of the serious responsibility placed on the TAC, it
should be made compulsory for the Council to meet at least
four times a year.
The Tribal Welfare Department should be made accountable to
the TAC. It should present its annual plan, budget and
performance report to the TAC and receive its approval for the
next year.
The agenda for the TAC meetings should be prepared through
due consultation with the members.
392
The Governor should be made responsible for the overall
functioning of the TAC.
4. The provisions of the Sixth Schedule provide considerable space for autonomy and
self-governance. Through the Autonomous Councils, tribals have the opportunity to
enact legislations, execute programmes and adjudicate at a scale larger than their
individual villages. Such a provision has helped tribes of the Northeast to protect their
habitat, land, forests, natural resources, culture and identity. They have not
experienced displacement and land alienation on the scale that tribes in ‘mainland’
India have. In view of these powers of political autonomy, the tribal communities in
the Northeast region have fared much better in respect of socio-economic, educational
and health status.422 In contrast, the tribes in mainland have fared miserably in all
these spheres. Hence, there is an urgent need for extending the pattern of the Sixth
Schedule in the form of Autonomous Councils in the Fifth Schedule areas as has been
provided for in the Provisions of Panchayat (Extension to Scheduled Areas) Act,
1996. The specific provision notes that, “the State Legislature shall endeavour to
follow the pattern of the Sixth Schedule to the Constitution while designing the
administrative arrangements in the Panchayats at district levels in the Scheduled
Areas”.
This pattern would provide tribal areas with an institutional structure that mediates
between the State Government and hamlet-level Gram Sabha. There are various forms
of Autonomous Councils in the Sixth Schedule areas. These are represented by
Meghalaya, Mizoram, Tripura and Assam. On the question of which pattern would
best suit the ‘mainland’ tribal regions should be seriously deliberated and worked
upon by the States with Fifth Schedule areas.
5. There are a large number of States wherein tribes form a sizeable population in
blocks or villages, for example, in States like West Bengal, Kerala, Tamil Nadu,
Karnataka, Goa, etc. Tribal areas in these States must be brought under the ambit of
Scheduled Areas.
6. There are various impediments to the smooth and inclusive working of the
Autonomous Councils in Sixth Schedule areas which must be addressed. In order to
do so, we propose the following:
Autonomous Councils must be covered under State Finance Commission that
is empowered to review periodically the financial position and lay down
appropriate principles of resource distribution between State and the
Autonomous Council. Funding should not be left to arbitrary discretion of the
State Governments.
The ADC should be reconstituted within six months of its dissolution.
422 There are several other reasons for this situation, most importantly, the relative homogeneity of the population in
Northeastern states, a tribal majority in many states and a history of missionary activity. However, the provisions of the Sixth
Schedule have also made a significant contribution.

393
There should be provision for reservation for tribal women (one-third) as well
as smaller tribal groups in the ADCs and other political institutions.
Traditional political institutions at the village/hamlet level should be formally
recognized by the State.
Livelihoods and Employment Status
1. There is a dire need to establish agro-based training institutions and related
labour-intensive processing industries in tribal regions. Terms and quantum of
micro-credit should be made reasonable for individuals, SHGs, cooperative
institutions and Gram Sabhas in Scheduled Areas for the tribes to pursue these
occupations.
2. In order to make use of land available with the tribal farmers, they should be
motivated to undertake organic farming and eco-forestry. This requires
concerted efforts by the Departments of Agriculture and Forest to motivate the
tribal farmers to undertake such activities.
3. Although a majority of Scheduled Tribes have land, and cultivation is their
main occupation, water for agriculture is the greatest impediment in
production. Micro watershed development program with people-centered
participatory approach is a good method for poverty reduction through natural
resource management in tribal regions. Therefore, micro watershed should be
given top-most priority in tribal areas to enhance agricultural productivity.
4. It is imperative to strategize water management in degraded and undulating
land, dependent on erratic monsoon. Water conservation through large dams
has been proved contrary to the interests of the tribes. Therefore, the best
strategy would be to construct water harvesting structures on various small
and large water sources. Even on big rivers, small water harvesting structures
could be constructed, which would be environment friendly.
5. The deprivation of STs of cultivated land adds to their marginalization and
penury. This warrants the prevention of all kinds of tribal land alienation
through strict enforcement of laws and restoration of alienated land to the
tribal owners as per the provisions of the PESA and the confirmatory Acts by
various States. There should be monitoring agencies at the National and State
levels to prevent alienation of tribal land and its restoration.
6. Since tribal inhabited regions have good forest cover (with or without trees
now), they should be allowed to participate in the protection and management
of forests. The newly acquired land under FRA, 2006 could be utilized in eco-

394
forestry rather than for food grain cultivation, which could give more return to
the ST farmers, in case they want to opt for it.
7. Credit and marketing facilities need to be extended to the STs. Delivery of
social justice must be monitored by the National Commission for Scheduled
Tribes, both at the national and state levels.
8. There is severe under-representation of STs and pending vacancies in Central
Government services. As far as the representation of STs in Public Sector
Banks, Financial Institutions and Insurance Companies, STs accounts for 6.55
per cent, which is less than the mandatory 7.5 per cent of ST reservations to be
followed by these institutions. Therefore, the Government should follow a
transparent policy with regard to jobs for STs in public sector. No ST
candidates who fulfill the basic eligibility criteria for a specific post should be
rejected on the ground of no suitable candidates found.
9. The discriminatory credit policy of the financial institutions is a major
deterrent in the participation of STs in business. Entrepreneurs among STs
must be given credit facility on par with other social groups. Further, all steps
must be taken by the Government for skill development among the tribal
youth to make them employable or self-employed, according to their
aspirations.
10. The participation of STs in MGNREGA has been decreasing from its
inception in 2006. This trend is very disturbing, which should be investigated
and monitored by a special agency under the administrative control of MoTA.
11. Tribals should be encouraged to use their traditional knowledge to meet their
needs by recreating their forest ecosystem and forest-based livelihood.
12. The Particularly Vulnerable Tribal Groups (PVTGs) among the tribes need
special attention due to their vulnerability in the present situation. Their
customary right to land, forest and sources of livelihood must be respected and
protected. The issue of nomenclature must be addressed by commissioning a
special study. MoTA should ensure that all states having PVTGs should take
steps to have micro-projects for individual PVTGs to utilize the grants
received under SCA. The Project Offices for PVTGs should be made to report
to the MoTA about the development activities undertaken for the PVTGs
under their jurisdiction, rather than submitting allocation and expenditure
statements.
13. Data on development parameters with respect to STs are not available for the
purpose of policy planning and implementation. Therefore, a National Institute

395
of Tribal Development, an autonomous research organization, has to be set up
exclusively for undertaking research on STs.
Education
1. The purpose of education anywhere, including in tribal areas, should be to
provide chidren with an understanding of the environment and society in
which they live and to endow them with the capability to earn a livelihood in
the local society and, for those who have the desire and ability, in the national
job market.
2. There is a marked gender gap with respect to education in tribal society. This
is reflected in the disparity in literacy levels, drop-out rates and enrolment in
higher education. Hence, there is a need for greater gender focus and social
mobilization to encourage education of girls. The State must develop certain
mechanisms to this effect.
3. Since the educational scenario in tribal areas is marked by poor infrastructure,
providing adequate infrastructure, such as classrooms, teachers and teaching
aids as well as basic facilities like electricity, water, boundary walls and toilets
is absolutely essential for the proper functioning of these schools and from the
perspective of security and safety of children.
4. In view of the deteriorating condition of elementary education in tribal areas,
where Sarva Siksha Abhiyan has hardly been of help, recourse should be taken
to the Right of Children to Free and Compulsory Education Act, 2009 which
provides for compulsory enrolment of all children between the age group 6 to
14, re-enrolment of those who have dropped out with the facility of special
coaching for admission in a class appropriate to his or her age, and admission
of a child in a neighbouring school of his or her choice. The Act should be
stringently implemented.
5. Keeping in view the difficulties of adjusting to a new cultural environment,
teachers for schools in the tribal regions should be recruited locally. Along
with the teaching staff, the administrative staff dealing with tribal education
should have regular orientation courses to appreciate tribal culture and way of
life. To facilitate such training, the centers of training should be located in the
tribal areas. There should be a separate cadre of teaching and administrative
staff, who will serve among the tribal schools over the long run.
6. New teacher training institutions should be opened in the TSP areas to meet
the full requirement of qualified and trained teachers. The curriculum for the
training should be drawn up very carefully, taking into account the socio-
cultural milieu, tribal ethos, language etc.

396
7. The dearth of teachers fulfilling the eligibility criteria set out under the RTE
Act is an impediment to achieving the right to education in tribal areas. For
addressing the current crisis of absence of teachers in tribal areas, special
efforts need to be made to produce more teachers who have qualified the
Teachers Ability Test. This must be done on an emergency basis. In the
interregnum, teachers appointed in educational institutions must be given a
term within which they qualify the Teachers Eligibility Test, and facilities be
provided to assist them in taking this test, including training, courses and
access to materials.
8. The State Governments should develop a policy for multilingual education, so
that early learning is conducted in the local language.
9. The experiment with the Model Primer developed in Odisha and other similar
ventures may be worked upon in TSP areas and in tribal languages in other
states as well.
10. Inclusion of local culture, folklore and history in the curriculum can help in
building confidence of tribal children and enhance the relevance of education
in their lives. Music and dance are a central part of tribal life. Therefore,
storytelling, theatre, painting, music and dance performances should be
promoted. Similarly, sports such as football, archery and other popular local
sports are extremely beneficial and therapeutic for children, and should be
promoted.
11. Recognizing that the tribal people have certain cultural ‘genius’, different
aspects of ‘indigenous knowledge’ should be documented, researched and
promoted. For developing better understanding of the tribal cultures and their
promotion, there should be appropriate number of tribal cultural academies in
regional centres. An important step in this direction is teaching tribal history
and culture in schools for both tribal and non-tribal children.
12. To address the problem of low representation of the tribals in higher
education, it is necessary to refurbish primary and secondary school education
through special coaching.
13. Institutions of ITDAs/ITDPs and micro-projects support to the tribal schools
should be strengthened for prevention of dropouts.
14. The policy of no-detention needs a review. When the student, teachers, or
parents of the student request for retention of a child to enable him/her to
acquire skills to move to the next class, he/she should be retained.
15. In light of the harsh terrain of tribal inhabitations, norms concerning distance
and Pupil-Teacher Ratio, at all levels of school education, should be reviewed.

397
16. The policy of vocational education at the secondary and senior secondary level
needs further integration and strengthening.
17. There is a marked absence of quality secondary and higher secondary schools
in tribal areas. The Government needs to establish well-run residential schools
such as Jawahar Navodaya Vidyalayas closer to the habitations (within a
radius of ten kilometres) up to Class XII. These schools must provide
comprehensive facilities for marginalized children including quality education,
health care and academic support classes.
18. Residential schools should be set up specifically for Nomadic Tribes. The
basic principles are: (a) The residential schools should be in places where the
weather is least harsh, (b) there should be special security for the children,
including girl children for whom there should be women wardens, (c) the
parents of students should be brought to these institutions so that they are
informed about the education, and quality of life, of their children, (d) there
should be proactive efforts by Tribal Affairs officials of the State to approach
every family to help them make an informed choice to send their children to
the schools, (e) the holidays for these schools should be fixed in such a way
that the children can meet their family, when the family returns to the place
where they celebrate festivals, weddings, etc.
19. In residential schools, which are often in the news for incidents of sexual
abuse of students, strong mechanisms should be put in place to protect the
students from abuse, neglect, exploitation and violence.
20. There is a need to recognise the adverse impact of violence on children’s
education. No schools or areas in the immediate vicinity of schools should be
occupied by security forces or the police, as has been the case in conflict zones
in tribal areas. Demilitarisation of schools is vital in order to restore schools as
a place of safety, security and scholarship for students.
21. Involvement of community in educational interventions through the
Panchayati Raj Institutions needs to be institutionalized. Information on
various schemes and benefits to beneficiaries should be provided to the Gram
Sabhas and Gram Panchayats, which would create transparency and increase
awareness about their entitlements.
22. There is a need for regular social audits to monitor the functioning of schools.
To this end, a monitoring committee at the block level for primary and middle
schools and district level for high and higher secondary schools should be set
up.

398
23. Most of the educational ‘missions’ do not reach the tribal areas and where they
do reach, they are too rare to have any significant impact. The State
educational machinery is largely responsible for this situation. There should be
proper accountability of the State educational administration to end the
longstanding stagnation in education in tribal areas.
24. The scope of education needs to be expanded for the purpose of scholarships
and should include tribal painting, art, craft, song, music and dance, etc. While
the Ministry of Tribal Affairs is now supporting scholarships for students
belonging to Scheduled Tribes, the UGC and the MoTA should support
scholarships for tribal studies for non-tribal students also. A single window
scholarship portal targeting the Scheduled Tribe students should be established
to provide information on different scholarship schemes.
25. Regional Resource Centres in States with significant tribal populations should
be established to provide training, academic and other technical support for
development of pedagogic tools and education materials catering to
multilingual situation.
26. It is suggested that owing to poor condition of the State Tribal Research
Institutes, there is the need to improve the same in terms of infrastructure,
quality of staff, research output and direction for policy. It is also
recommended that a Central Tribal Research Institute, as has been planned by
the Central Government, be launched.
27. It is recommended that a Tribal Chair be established by the UGC in
Universities in every State comprising Fifth Schedule Areas.
Health
1. The first principle of any policy or program for tribal people is participation.
Tribal people as a population segment are not politically very vocal. However,
they have different geographical, social, economic and cultural environments,
different kind of health cultures and health care needs. Hence their views and
priorities must get due place in any health care program, meant for them. We
suggest making use of three types of existing institutional mechanisms to
improve the programs.
Tribal Health Assembly: From the Gram Sabhas at village level, upto the
national level, Tribal Health Assemblies should be annually organized in
which the people (at the level of village) or their representatives (at the
higher levels) participate. For instance, such a ‘Tribal Health Assembly’ is
annually organized for the past 15 years by an NGO, SEARCH, in
Gadchiroli district (Maharashtra) for three purposes, a) to listen to the
health problems and priorities of the people, b) to get approval for the
399
proposed health solutions and activities, c) to get their feedback on
ongoing activities. This can serve as a model at the local level in other
Scheduled Areas. At least one Gram Sabha meeting annually should be
exclusively dedicated to the purpose of health and related subjects.
Tribal Health Councils: These should be constituted by including elected
representatives, NGOs, experts and government officers for the purpose of
planning and monitoring of programs. Such councils should be constituted
at the block or ITDP level, district, state and national level. These should
be empowered to shape the health plans and monitor implementation.
These sub-committees of Panchayat level, district level and Zilla Parishad
could function as Tribal Health Councils.
Tribes Advisory Councils at the state level: These Councils should
approve the health plans prepared by the Tribal Health Councils, and to
review the performance of implementation.
2. In view of the enormous diversity among nearly 700 tribes in India, the second
principle to be followed is of area specific and tribe-sensitive local planning.
The PESA provides an institutional basis for this. The three institutional
mechanisms suggested above, when created and made operational at the block,
district and state level, will allow local planning.
3. Social determinants of health – literacy, income, water, sanitation, fuel, food
security and dietary diversity, gender sensitivity, transport and connectivity –
play very important role in determining the health outcomes. Hence, inter-
sectoral coordination for improvement in other sectors is as important, if not
more, as health care. Some specific suggestions for improving health are:
The construction of drainage system, village sanitation infrastructure,
personal toilets and the environmental measures to control mosquito-
breeding can be included in the MGNREGA scheme and completed on
priority basis in Scheduled Areas.
To reduce the household use of unclean fuels and biomass burning, the
solar energy, especially the solar cooker, water heaters and lights be
promoted in Scheduled Areas. This will also help save trees.
Improving nutrition of children, adolescents and pregnant and lactating
women is critical for the Scheduled Tribes population. The nutrition
awareness and feeding programs in the Scheduled Areas can be better
implemented in collaboration with the National Rural Livelihood Mission
and the women’s saving groups in the villages.
Health and income available for family will show improvement by
controlling alcohol and tobacco.
4. Empowerment of the Scheduled Tribe people is another cardinal principle.
Building their capabilities to care for their health is the long term solution far
400
superior to a perpetual dependence. This however does not mean that the
government or the rest of the society can abdicate their responsibility towards
tribal people. But this responsibility can be better served in long run by
building local capacity. In other words, instead of ‘giving’ health care, the
policy should be to build ‘capacity to care for health’. This principle should
guide in planning health care – especially in the choice of who will provide
health care, where, when and how.
5. To bridge the scientific knowledge gap of centuries, health care for Scheduled
Areas should give paramount importance to spreading ‘health literacy’ by way
of mass educational methods, folk media, modern media and school
curriculum. Enormous scope exists for communication in local dialects and for
the use of technology.
6. A large number of Scheduled Tribe children and youth – more than one crore
– are currently in schools. This provides a great opportunity – both for
improving their health and for imparting health related knowledge and
practices. Schools, including the primary schools, middle schools, high
schools, ashram shalas and also the Anganwadis should become the Primary
Health Knowledge Centers.
7. Special attention should be given to women, children, old and disabled people
in the Scheduled Tribe population as these are the most vulnerable.
8. Traditional healers and Dais play an important role in the indigenous health
care. Instead of alienating or rejecting them, a sensitive way of including
them or getting their cooperation in health care, must be explored. Traditional
herbal medicines should be protected through community ownership. The
ownership and intellectual property rights of tribal community over their own
herbal medicines and practices should be ensured.
9. Apart from the physical distance, a huge cultural distance separates the tribal
population from others. Health care delivery to the Scheduled Tribe
population should be culture-sensitive and in the local language in order to
overcome this distance.
10. Health care delivery system for Scheduled Areas must keep as its guiding
principle the Chinese axiom – How far can a mother walk on foot with a sick
baby? Health care must be available within that distance. This, for the tribal
communities living in forests, means health care must be available in their
village/hamlet. Sixty years of failure should teach us that health care from
outside is not a feasible solution. The design of health care in Scheduled Areas
should be such that major share of health promotion and prevention and a
sizable proportion of curative care is generated and provided within the village
or hamlet.

401
11. In light of these principles and in view of the common disease pattern and
needs listed earlier in the conclusions section, we recommend that the Ministry
of Health and Family Welfare should redesign the primary and secondary
health care services in Scheduled Areas. The new pattern should not be
enforced as a top-down, vertical, uniform national program, but should
provide a framework for local planning with local participation. Thus, the
‘Tribal Health Plan’ will have three feature: one, a process framework about
‘how’ to prepare the local plan, which will be in the form of guidelines on
mechanisms; second, a series of locally developed need-based contents of the
plan and third, a design or structure of the health care system to deliver such
services in all Scheduled Areas. This ‘Tribal Health Plan’ should become an
essential feature of the National Health Mission and of the Tribal Sub Plan.
The goals and monitoring indicators of this plan will be different than the
regular MIS of the NHM.
12. Human Resources for Health: The well-known difficulties in deploying
doctors, nurses and other technical personnel from outside, into Scheduled
Areas have made the problem of human resources the Achilles’ heel of health
care in Scheduled Areas. We recommend that, instead of making futile efforts
to import unwilling and unstable personnel from outside, the most feasible and
effective long term solution will be to select, train and deploy local Scheduled
Tribe candidates. This should be done at the following levels:
Accredited Social Health Activists (ASHA) and Anganwadi workers –
from the same village or the hamlet.
The ANMs and paramedic workers – from the same block.
The doctors and public health program managers – to a large extent,
from the same district.
The candidates must be local, belong to Scheduled Tribes, be fluent in local tribal
dialects, be selected on merit and should be committed to serve in the local
Scheduled Area for at least ten years.
The ASHA workers, Anganwadi workers and ANMs will continue to be the
mainstay of health care in rural and tribal areas. Due to the physical isolation of
tribal communities, compounded by a lack of doctors, it will be pragmatic to train,
equip and empower the three ‘As’ – ASHA workers, Anganwadi workers and
ANMs – in tribal areas to a higher level.
Since the selection for medical education is through a statewide and all India
competitive process, the local Scheduled Tribe candidates may not get selected.
Hence, we recommend that separate Medical Colleges for Tribal Areas be opened
in selected scheduled districts, one college per three million Scheduled Tribe

402
population in the state. All seats are to be reserved for such committed Scheduled
Tribe candidates, to be selected from the respective Scheduled Areas, depending
on the population and need for doctors in each Scheduled Area. The aim should
be to provide, in ten years, the required number of appropriately trained doctors to
serve in these areas. The High Level Expert Group (HLEG) on Universal Health
Care, appointed by the Planning Commission, in its report (2011), has
recommended that the District Knowledge and Training Centers be developed and
made into medical colleges attached to district hospitals, and nearly 187 new
medical colleges should be opened in the country, especially in undeveloped
regions. These recommendations can be used to open Medical Colleges for Tribal
Areas. Approximately 30 new medical colleges for tribal areas, each with 60
seats per year, will be able to produce nationally about 1800 new doctors per year,
selected from, trained and legally committed to work in the Scheduled Area of
their origin.
The Medical Education for Tribal Areas (META) should be, to some extent,
different from the regular MBBS, and hence, should not entirely follow the
curriculum of the Medical Council of India. Besides the regular medical
curriculum, some modifications are necessary such as: i) knowledge of and
sensitivity towards tribal culture and language, ii) methods of communication iii)
training and management of a health team, iv) competencies in preventing and
managing health problems common among the Scheduled Tribe population by
way of clinical, outreach and public health approaches, v) collaboration with other
sectors of development affecting health, eg. sanitation, nutrition, education,
forestry. If necessary, the MCI recognition for this degree may not be sought, or a
new degree different than MBBS be created, with legal permission to function as a
doctor in Scheduled Areas.
13. Addiction has serious effects on the socio-economic fabric of tribal society. It
affects not only health but also productivity, family economy, social harmony and
ultimately, development. Hence, i) the Excise Policy for Scheduled Areas,
approved by the Ministry of Home Affairs, Government of India, in 1976 and
accepted by the states, should be implemented effectively, ii) the availability and
consumption of tobacco and drugs should be severely controlled and iii) the
availability and use of alcohol and tobacco products among the Scheduled Tribe
population, and the implementation of control policies by the states, should be
monitored on selected indicators. These efforts should become a critical part of
the Tribal Sub-Plan.
14. The TSP budget, in proportion to the Scheduled Tribe population, should be an
additional input and not a substitute to the regular budget for routine activities of
the Health Department in Scheduled Areas. At least ten percent of the total TSP
budget should be committed to the health sector, the Tribal Health Plan in the
Scheduled Areas, in addition to the regular health budget for these areas.

403
15. Data on the Scheduled Tribe population is a basic ingredient for planning,
monitoring and evaluating health programs in Scheduled Areas. All national data
systems – the Census, SRS, NFHS, NSSO, and DLHS – should be asked to plan
for and generate Scheduled Tribe-specific estimates on health indicators at the
district level and above. One percent of the total budget for the Scheduled Tribe
population (TSP) should be allocated to the generation of reliable, timely, and
relevant segregated data on Scheduled Tribes population, from the local to
national level. This will provide the crucial instrument – the facts – necessary to
guide program managers, policy makers and the Scheduled Tribe population itself.
Towards this, the specific measures recommended are:
Construction of a composite Tribal Development Index (TDI)
Construction of a composite Tribal Health Index (THI) including the
indicators on health status, determinants and health care.
Ranking of 151 districts with more than 25 percent Scheduled Tribes
population and of states on these indices.
Creation of a high power national body under the Ministry of Health and
Family Welfare to facilitate the commissioning and collection of relevant
data and monitoring of the indices and progress. This body should
complete the work through the various existing agencies/surveys such
SRS, NSSO, NFHS, DLHS, AHS, NNMB, the TRTIs in the states, the
ICMR institutes network on tribal health, and finally, the health ministries
in the states. Necessary administrative and financial authority should be
provided to this body. Broadly, one percent of the total health budget for
tribal areas (the regular health budget for Scheduled Areas, including the
health component in the TSP) should be devoted for this purpose.
16. Research: From the public health point of view, certain aspects of tribal health
need research. These are:
Epidemiology, disease patterns and mortality rates in Scheduled Areas,
Traditional belief systems and practices, and effective communication
methods,
Tribal healing systems,
Methods of health care delivery in Scheduled Areas.
The AYUSH (Ayurveda, Yoga, Unani, Siddha, and Homeopathy) department and the
Indian Council of Medical Research should incorporate these into their scope of
working.
17. The Proposed Goals of the Tribal Health Plan should be:
To attain the Millennium Development Goals (2015) on health and nutrition
for the Scheduled Tribe population in India by the year 2020,

404
To bring the health, sanitation and nutrition status of the Scheduled Tribe
population to the same level as that of the non-Scheduled Tribe population in
the respective states by the year 2025,
To create the human resources necessary for provision of healthcare in
Scheduled Areas, as per the norms set by the High Level Expert Group on
Universal Health Coverage (2011), by the year 2025,
To create and make functional the institutions for participatory governance
(Tribal Health Assemblies and Councils) at all levels in the Scheduled Areas
by the year 2016,
To annually generate Tribal Health Plans at all levels by the year 2017,
To annually allocate and spend 8.6 percent, in proportion to the Scheduled
Tribes population, of the total Health Sector Plan and Non-plan budget, plus
10 percent of the TSP for the implementation of the Tribal Health Plan.
Land Alienation, Displacement and Enforced Migration
1. Serious effort is required by the State to minimize displacement. There
should be a rights- based approach to comprehensive rehabilitation for
socio-economic reconstitution of victims of development, including for the
backlog of displaced.
2. The problem is with the expansive interpretation that has been given to the
doctrine of ‘eminent domain’ by political and managerial elites. In this
context, it is essential that the whole process of displacement should be
democratic and rights of tribal communities to say ‘no’ to acquisition of
their land and to access and manage forests and other CPRs, be recognised.
3. The new legislation, ‘The Right To Fair Compensation and Transparency in
Land Acquisition, Rehabilitation And Resettlement Act, 2013, is
progressive in the sense that it is the first to legally mandate rehabilitation of
PAP. However, it fails to address the need for minimizing of acquisition of
land and resources. This is not surprising, since the objective of the Act,
which seeks to address concerns of those whose livelihoods are affected,
simultaneously aims at facilitating land acquisition for industrialization and
urbanization. This is in keeping with the broader liberalization policies. Such
policies will result in more displacement in Central India for mining and in
the Northeast for dams.
The 2013 Act already has a provision for safeguarding food security
and states that multi-crop irrigated land will not be acquired, except as
a last resort measure. Further, the State Government is to set limits on
the acquisition of such land under this law. States are also required to

405
set a limit on the area of agricultural land that can be acquired in any
given district. However, there is no mention of the need to protect
tribal land and community resources. Hence, a suitable provision is
required to be incorporated in the Act, to safeguard tribal land and
community resources in Scheduled Areas and disallow acquisition by a
non-tribal, including private companies.
The definition of ‘public purpose’ in the new law is very wide and will
only lead to greater acquisition and displacement in Scheduled Areas.
The exercise of ‘eminent domain’ and definition of ‘public purpose’
should be severely limited.
Government agencies acquiring land with the ultimate purpose to
transfer it to private companies for stated public purpose, should be
kept outside the ambit of the new law, as the Public-Private Partnership
mode of acquiring land is simply a backdoor method of alienating land
in violation of the Constitutional provision to prohibit or restrict
transfer of tribal land to non-tribals in Scheduled Areas.
It is recommended that, as directed in the landmark Samatha judgment
and the PESA Act, every Gram Sabha should have the power to
prevent alienation of tribal land and further that minerals should be
exploited by tribal people themselves. The stringent provisions of the
amended Andhra Pradesh Scheduled Areas Land Transfer Regulation,
1959, should be adopted by other States, particularly the provision that
facilitates the formation of Registered Scheduled Tribe Co-operative
Societies, which could take up mining activities in Scheduled Areas.
By doing so, the Samantha Judgment would hold good for all States
with Scheduled Areas. It should be the responsibility of the State to
facilitate the formation of cooperatives of tribal people for the above
purpose.
Gram Sabha consent should be mandatory for acquisition of land by
the Government for its own use as well.
The Act does not have a provision to the effect that exploitation of
natural resources in Scheduled Areas must be with the consent of the
Gram Sabha. This should be rectified.
4. In the interest of weaker sections such as tribal communities, the threshold
should be kept very low and R&R provisions of the new law should apply to
all cases.
5. There is plenty of unutilized tribal land available with Central/State/PSUs,
and Central/State Governments which is not being used for the purpose for
which it was acquired. Governments should be legally mandated to return
such land to the original landowner/successors or use the same for

406
resettlement of displaced tribals. This should not be left to the discretion of
the State Government. One example of this is of HEC, Hatia, Ranchi, where
excess tribal land had been acquired and people are agitating for the return
of the land, but the State wishes to utilize it for other purposes. In such
cases, land should be returned to the original displaced families.
The Vijay Kelkar Committee on Fiscal Consolidation (2012) said,
“Over the next 24-36 months, there is yet another policy instrument for raising
resources for development and that is monetizing the government’s unutilized and
under-utilized land resources. These resources can finance infrastructure needs,
particularly in urban areas. Such a policy has been effectively utilized in many
countries including USA, France, Canada, Australia and China. For monetizing
land resources, the potential is considerable given the under-utilized prime lands of
PSUs, Port Trusts, Railways, etc. Toward this, we recommend setting up of a group
to work out the policy framework and institutional modalities.”423
The suggestion of the Vijay Kelkar Committee on Fiscal Consolidation
(2012) that “unutilized and under-utilized land resources” be used for
“raising resources” to “finance infrastructure needs particularly in urban
areas” is against the purpose and intent of the land acquisition law and
should be roundly rejected, and unused land should be returned to the loser
of the land and to the community.
6. There has been inadequate recognition at the policy level that land represents
an inalienable resource, passed on from generation to generation in tribal
communities, who otherwise have no education and skill development.
Studies have documented that those DPs who got jobs in lieu of land and
whose children did not receive education or training were worse off after the
job-holder retired from service. It is recommended that the objective of R&R
should be to ensure that the socio-economic status of tribal DPs/PAPs after
displacement, should improve positively rather than deteriorate further. Loss
of land and CPR can be compensated only by proper R&R which envisages
restoration of livelihoods, health and education facilities and skill
development for the whole family and community of tribal DPs/PAPs. There
should be provision of ‘land for land’, in acquisition of tribal lands.
Compensatory land provided must be made cultivable with irrigation and
agricultural inputs. Rehabilitation should be treated as a continuous process
to be monitored by the Project Authority and State until the alternative
livelihood becomes economically viable. They must be given a stake in the
assets and economic activities being created on their acquired land and CPRs
(for example, land in command area, irrigation of tribal land in the vicinity,
423 Report available at http://finmin.nic.in/reports/Kelkar_Committee_Report.pdf

407
jobs in industries, or shops/jobs in industrial projects/townships). An
expanding economy, particularly expanding labour-intensive manufacturing
sector together with adequate emphasis on health, education and skill
development, hold the key to humane R&R.
7. The 2013 Act is weak in matters relating to skill development and provision
for livelihood for DPs/PAPs. During a meeting between the HLC and
representatives of displaced tribal people in Bastar, Chhattisgarh, anger was
expressed at the non-fulfillment of promises to give jobs to the educated
displaced persons. They were unhappy with the cash allowance being given
in lieu of jobs. The official response, that there were not enough jobs to
accommodate all displaced people, did not satisfy the aggrieved parties. A
sum of two thousand rupees per month per family as annuity for 20 years,
with appropriate index for inflation in lieu of jobs, as stipulated in the new
Act, is too low. Clearly, more has to be done for skill development and
creation of alternative livelihoods. One of the ways to ensure that jobs are
provided to displaced people, including tribal families, is to create a State
level/National-level Virtual Employment Exchange with complete data of
age, sex, educational qualifications, and skill-set of persons displaced in the
past, present and in near future, for providing them employment and/or
preparing them for employment/self-employment. Global best practices
could be studied for providing alternative livelihoods, which could include
imaginative self-employment schemes with backward and forward linkages
to be provided by Project Authorities.
8. Research studies stress that gross undervaluation of losses, replacement
value of loss and costs of resettlement, has led to inadequate financing of
R&R and externalization of costs of R&R to the displaced and the future
generations. The new law has expanded the definition of ‘displaced’ to
include project-affected persons; however, care has to be taken to ensure that
all genuine cases are included and compensation is properly computed.
In computing losses, it has to be recognized that there are instances of
tribal DPs who do not have documents to support their genuine claim
but who base their ownership rights on oral tradition. Such claims
should not be rejected.
Forest rights have been covered under the Forest Rights Act, but other
CPRs such as Government land and Panchayat land has not been
covered by any legislation. This needs to be rectified. Moreover,
survey by Government is incomplete – as a consequence, community
land is recorded as Government land and tribal communities, primarily
tribes who practice shifting cultivation on such land, are denied

408
compensation. This problem needs to be addressed by measures to
include such cases under R&R provision.
Women require special consideration and affirmative action. Widows
and unmarried adult daughters should be recognized as a separate unit.
The principle for working out land compensation has been spelt out.
For all other assets, compensation should be based on replacement
value or net present value of assets lost/destroyed.
While preparing the project cost estimates, the full cost for R&R
should be included, and no attempt should be made to reduce costs for
a favourable cost-benefit ratio.
The rehabilitation package and process should take into account, the
cultural displacement, and loss of customs and tradition. For tribal
people, their strength is their community, and therefore, it is imperative
that they be resettled and rehabilitated as a community, if they so
desire.
Infrastructural amenities to be provided in the resettlement area have
been mentioned in the new law, but provision of banking facilities has
been missed out. With primary emphasis on monetary compensation, it
is essential that displaced tribals, who may not have experience in
handling money and understanding of the monetary economy, should
be advised on handling their cash compensation. Banking facilities
should made available for keeping their money safe and credit facilities
should be provided by the State (to avoid exploitation by money-
lenders).
9. Land and water sources polluted by industrial and mining projects in tribal
regions require attention and the onus for taking corrective measures should
be on the Project Authorities. The schemes of the Government could be
utilized to treat polluted land and water resources of tribal people.
10. The role of the Governor is crucial for protecting land, community assets,
culture and traditional institutions of tribal people and to ensure that they are
treated fairly. This role extends to ensuring socio-economic reconstitution of
tribal DPs/PAPs. This raises the issue of suitability of persons who occupy
the important position of Governor and other offices, such as
Commissioners, Deputy Commissioners and District Magistrates, in
Scheduled Areas. It is imperative that the antecedents and experience of
persons be taken into consideration by the Government to check whether
they can protect the interest of tribal communities and are suitable for such
appointments, in view of the special role assigned to them in such States.

409
11. Implementation of the new law will be difficult in the absence of
resettlement and rehabilitation capacities in the local administration, local
community and corporate entities. It is essential that the State and corporate
sector create such capacity by introducing professional training and
orientation courses for following the best R&R practices worldwide and
replicating them in the Indian situation. Offering tribal people monetary
compensation and making promises without attendant capacity to deliver on
them will not resolve the impasse that has brought land acquisition to a
standstill. Sporadic attempts by instruments of the State to use force to
acquire land is unethical and unacceptable. Only a genuine and bonafide
effort at comprehensive and pragmatic R&R can persuade tribal people to
part with their land.
12. The new legislation lays considerable emphasis on consultation and consent
of Gram Sabhas. It is essential that the State be vigilant through adequate
monitoring mechanisms for ensuring that consent is obtained freely and
every displaced person gets adequate and comprehensive R&R in lieu of
land/livelihoods lost. The State must put in place a system to collect
disaggregated data of DPs/PAPs for all social groups. Oversight mechanisms
must be created at the District, State and Central levels, comprising officials
and non-officials with proven competence, integrity and commitment to
public good. There is a view that, though the new legislation has been
enacted by the Centre, R&R is a State subject, which should continue.
However, the Centre has a responsibility along with the states to ensure
comprehensive R&R. The Central Government should decide on the
monitoring mechanism to be put in place. One possibility is to establish an
Authority/nodal agency with a multidisciplinary team under the Ministry of
Land Resources.
13. In view of the large-scale discontent among displaced tribal people
regarding poor R&R, a High-Level Fact-finding Committee/Enquiry
Committee should be set up to investigate the quality of R&R in all medium
and major development projects undertaken in the last fifty years in
Scheduled Areas and tribal-dominated districts of States without Scheduled
Areas. This Committee should be mandated to suggest ways and means to
deliver justice to the displaced families, who have not received any proper
rehabilitation. This is essential, in view of the fact that, the new law has not
taken cognizance of the backlog of displaced people, a majority of whom are
tribal people.
14. Myriad grassroot movements against exploitation of tribal people and other
weaker sections hold the key to greater socio-economic justice. It would be

410
desirable if the State recognizes this and engages with democratic grassroot
movements, instead of crushing these movements.
15. Tribal people who have been displaced by conflict in Chhattisgarh and the
Northeast should be rehabilitated by the State Government in their villages
and provided facilities of housing, safe drinking water, health and education,
skill development, electricity supply, irrigation facilities, and agricultural
inputs. It is for the State to take preventive action and ensure safety and
prevent tribal land alienation in such areas. During a visit of HLC to Assam,
civil society groups and representatives of Autonomous Tribal Councils
emphasized that influx of outsiders was a real threat to the tribal
communities. They also alleged that inter-tribal conflict was being instigated
by outsiders. It is the responsibility of the State Government to take
measures to prevent such conflicts.
16. Under the ‘Coal Bearing Areas (Acquisition and Development) Act, 1957,
pattas/legal titles for houses allotted in resettlement sites are not issued to the
displaced. As a result, the displaced lose their identity and are unable to
access public facilities provided by the local administration, thereby facing
difficulty in obtaining Caste/Tribe certificates. Further, there is no provision
for payment of compensation before taking possession of land. The
provision for returning land to original landholders post-mining is rarely
complied with. Clearly, there is a need to make amendments in the Act.
17. Development projects have opened up tribal areas leading to influx of people
from outside the tribal region, seeking employment in various sectors. All
this has resulted in increasing urbanization of tribal areas and immigrants,
rather than tribals, have benefited from this. Consequently, the percentage of
tribal population in some Scheduled Areas has declined, although
historically, these areas were almost exclusively occupied by tribal people.
Hence, it is recommended that there should be no reduction in the areas
declared to be Scheduled Areas as this will harm the interests of already
deprived tribal communities by diminishing their space and their resources.
Rather, the representation of tribal communities should be enhanced and
strengthened in the politico-administrative institutions within Scheduled
Areas.
18. Tribal people suffer predominantly from the phenomenon of poverty-
induced migration, also known as forced migration. An analysis of the
Census data shows that there has been an occupational change and the
number of tribal cultivators has reduced while the number of tribal marginal

411
workers has increased. Micro studies indicate the increase in
seasonal/circulatory migration of tribal workers, which may help them to
avoid starvation, but is not enough to improve their standard of living.
Hence, it is recommended that:
The Census and National Sample Surveys should gather data on the
phenomena of seasonal/circulatory migration, migration of children
across social groups and poverty-induced migration.
Priority should be given to STs in settlement of ceiling surplus land
and wasteland, investments to improve agriculture, support for high
value horticulture, employment opportunities in rural areas, access
to credit facilities and skill-development to rural youth for
employment in labour-intensive manufacturing sector.
Complaints have been received that, due to seasonal migration of
tribal people, they are not enumerated in the Census and therefore,
Census data is not a true reflection of tribal population. This
grievance requires to be redressed.
Apathy and incapacity of the State to implement the Inter-State
Migrant Workmen (Regulation of Employment and Conditions of
Service) Act, 1979, has led to exploitation of tribal migrant
families. In particular, tribal women and children suffer greatly.
There is a growing demand for enactment of a comprehensive
Migrants Rights Legislation, which deserves serious consideration.
19. Recommendations for measures to prevent illegal land alienation of tribal
land are as follows:
In pursuance of the PESA, 1996, Land Transfer
Regulations/Tenancy laws of all Schedule V Areas should be
suitably amended to ensure Gram Sabha participation in the
identification, investigation and restoration of lands to tribal
people. Gram Sabhas require to be strengthened by State
Governments to undertake these responsibilities.
Plenary powers could be given to Gram Sabhas to fight cases of
tribal land alienation collectively, as an individual tribal cannot
afford to face prolonged legal battles, given their socio-economic
conditions.
The Gram Sabha should be empowered to restore the alienated
land on detection, pending the long legal battle, in order to
potentially discourage a prospective non-tribal buyer of land in
Scheduled Areas. This needs to be legally examined.

412
Care has to be taken to ensure that District Councils and State-
level Council do not have powers to dissolve Gram Sabhas or to
dilute the powers and functions of the Gram Sabha
Legal loopholes and ambiguities in all Scheduled Area Land
Regulations and Tenancy laws should be removed. For example,
such a removal must ensure that tribal land is not transferred for
purposes such as settlement of refugees, housing, etc.
There is a provision in the Andhra Pradesh Act, wherein
immovable property of tribals can be mortgaged to banks and, in
case of default, the property to be sold back only to tribal people
or tribal cooperative societies exclusively formed by tribal people.
This provision needs to be evaluated to explore replication in
other Scheduled Area States. There is an urgency in doing so to
meet the financial needs of tribal youth.
There is a presumption clause in the Andhra Pradesh Act that,
until the contrary is proved, any immovable property in the
Scheduled Areas and in possession of a person who is not a
member of a Scheduled Tribe shall be presumed to have been
acquired by the person or his predecessors through a transfer made
to him by a member of a Scheduled Tribe. This clause should be
examined by other States for adoption and inclusion in their laws.
Suitable amendments should be made in all land laws for
protection of tribal land in Scheduled Area States to the effect that
there should not be any time limit for restoring tribal land.
Suitable provision should be made in land laws so as to bring all
benami transfers, transfers in the names of concubines, tribal
servants or others into the purview to prevent fraudulent land
transfer in Scheduled Areas.
The move to notify rural areas as urban areas in order to nullify
PESA provisions should be stopped forthwith. Use of Master Plan
in urban areas to alienate/displace tribal people from their land
should be curbed.
Increased investment is required to be made by State
Governments to provide legal aid to tribal petitioners so that they
are in a position to hire competent lawyers to fight cases. The
Government must also provide legal training, literacy and
awareness programs for youth and women on State and customary
laws contextualized with modernity processes, with the
participation of NGOs.
Ultimately, it is the duty of State Governments, to ensure that all
officials and lower-level functionaries do not connive in
defrauding tribal people of their land. Regular monitoring at the

413
State and Central levels of disposal of cases and proactive efforts
for restoration of tribal land is required. It is the responsibility of
the State to address the problem of contradictory judicial
pronouncements that jeopardize implementation of protective land
laws by removing ambiguities in all relevant laws.
Legal and Constitutional Issues
1. The past twenty years have been dramatic in terms of the changes in the
economy, and in the effect that economic policy has had on tribal
communities. This has also been the period when laws, notably the Provisions
of Panchayats (Extension to Scheduled Areas) Act, 1996 and the Scheduled
Tribes and Other Traditional Forest Dwellers (Recognition of Forest Rights)
Act, 2006, have been enacted which recognize autonomy and rights of tribal
communities.
2. The implementation of these laws is, however, sputtering and reluctant. The
FRA framework includes provisions for: (i) recognition and vesting of rights
(towards a secure tenure and livelihood/food security of the Scheduled Tribes
and Other traditional forest dwellers), (ii) protection of the rights till the
recognition and vesting process is completed, and (iii) control over forests of
the local community and the Gram Sabhas. This framework, however, is
missing from the process adopted for implementation of the law and the
implementation structure does not have the necessary mechanisms and the
vision to realize the objectives of the law. What is needed foremost is to
strengthen the institutional system to support the process of implementation,
including strengthening of the Gram Sabhas and FRCs, streamlining
functioning of the sub-divisional and district level committees, strengthening
the functioning of the state level monitoring committees and a dedicated
structure within the nodal ministry (Ministry Of Tribal Affairs).
3. The implementation of the community forest rights has hardly taken off. It
needs to have a clear mechanism and plan for recognition of various
community forest rights and rights of vulnerable communities such as PVTGs
and pastoralist communities.
4. The implementation of the protective provisions in the law and the process of
recognition and assertion of forest rights is so far largely affected (obstructed)
by contradictory processes like: diversion of forest land which, among other
things, is displacing Scheduled Tribes/OTFDs and alienating their rights,
displacement from the protected areas and Tiger Reserves, and displacement

414
due to intervention by the Forest Department through forceful plantation in the
forest lands. While the protective clause under FRA is meant to prevent such
cases of violation of forest rights, the implementation process has almost
entirely ignored the protective parts of the law.
5. The democratic structure in forests with the Gram Sabhas as laid out in the
FRA faces great resistance from the current forest regime and the various
forestry institutions and programs implemented by the Forest Department and
the MoEF. In the Joint Forest Management program, for instance, the
operation of working plans are found to be obstructing the process of assertion
of rights by the Gram Sabhas. It is necessary to remodel the entire structure of
forest administration, the Forest Department, the MoEF and its programs to
complement and enable the control and management of forests by Gram
Sabhas and local communities.
6. The changed paradigm has not yet permeated administration, and projects and
plans continue to approach forests as the exclusive domain of the state. This is
resulting in multiple ways and situations in which the laws are subverted, and
the rights of tribal communities denied. The exception to linear projects and
the decisions of the Cabinet Committee on Investment illustrate the point.
Such deliberate flouting of the law currently has no penalties attaching to it.
Such penalties that will deter the breaching of the FRA need to be introduced.
7. The FRA mandates the representation of women in Gram Sabha and in the
other tiers prescribed by the law. Effective participation has, however, been
elusive. Given the close relationship between forests, forest produce and
women’s lives, there is work to be done to turn this around.
8. The difference between states of poverty and of vulnerability has been
explored in the context of PVTGs. Access to resources in forests makes a
difference in the extent of their vulnerability. Where there has been a depletion
of forest cover, and the emphasis is on timber trees, the effect is to add to the
vulnerability of PVTGs. Where, on the other hand, the resources are
safeguarded and the community has access, the ability to prevent nutritional
distress can be augmented.
9. Displacement for creating Tiger Reserves and Elephant Corridors take away
from the provisions that recognize that tribals need to be asked to be displaced
only if co-existence is impossible and with Gram Sabha consent. The
resettlement experience of those displaced speaks to continued marginalization
of affected communities. This is a common tale, and that is the way it has

415
largely been through the years. Even where the decision to displace is taken
reasonably and according to the process prescribed, the inability displayed in
effecting rehabilitation has to be acknowledged. There is an urgent need to
review the ability of administrators who are responsible for rehabilitation, and
for revising the rehabilitation process. Failed rehabilitation has consequences
that have been ignored for far too long.
10. The import of PESA has not been internalized into administrative practice, and
government officials including Forest Departments continue to deny access to
tribals to that which is their right. Bureaucracies and judicial institutions need
to be introduced to the changes that PESA has brought into administration and
control in Fifth Schedule areas.
11. An exercise to bring rules made by state governments in conformity with
PESA needs to be undertaken.
12. Government officials who were the agencies to prevent tribal loss of land are
increasingly being seen to be negotiators on behalf of project authorities. This
is a very disturbing trend, where the very authority who had been tasked with
preventing land alienation from a tribal to non-tribals becomes an agent for
effecting such alienation. This must be stopped.
13. There have been recorded cases of Gram Sabha consent being fraudulently
obtained or forged; such conduct must face penalties, and projects that proceed
on the basis of consent so obtained cannot be allowed to proceed. If such
consequences do not flow, there will be no incentive to refrain from such
actions.
14. Given the constitutional provision in Article 243-ZC, the creation of new
Nagar Palikas or the extension of those already in existence in Fifth Schedule
areas and tribal areas, as defined in the provision, must be preceded by a law
made by Parliament, which sets out the exceptions and modifications from the
chapter on Municipalities introduced by the 74thAmendment to the
Constitution.
15. The amendments proposed to PESA has an important component of prior
informed consent. This is a necessary condition for the effective
implementation of PESA.

416
16. There has been a proliferation of MoUs between states and companies that
imposes responsibility on the state to facilitate various aspects of project
clearances including in matters of environmental and forest clearances.
Increasingly, the state undertakes to maintain law and order for the smooth
execution of the project. These MoUs make the state a party to an agreement
and take away the neutrality of the state. The idea such MoUs needs to be
reviewed. Institutions such as the Cabinet Committee on Investment that set
priorities and pursue them even where it is in direct breach of the law amounts
to deliberate flouting of the law and such practices of expediency need be
halted.
17. Public policy and practice must draw on the iconic experience of Niyamgiri,
and the adverse lessons from the Salwa Judum.
18. The encounter of the tribal with criminal law has been one of the disturbing
aspects in the past decade. Large numbers of tribals, men and women, are in
jails for what are termed ‘naxal offences’. There is, of course, no legal basis
for terming anything a ‘naxal offence’. Others are charged in areas where
there is resistance and protest against projects, provoking the assessment that
the criminal law is being used as a tool of the state to suppress dissent. The
acquittal rate is extraordinarily high, raising doubts about the use of criminal
law. Yet, the years spent in jail, multiple charges that are imposed on the
tribals and the charges on tribal leadership and on supporters have become the
new normal. The committee is of the view that a Judicial Commission needs to
be appointed to investigate cases filed against tribals and their supporters, only
this will allay the concerns that have risen about the misuse of criminal law by
the state.
19. De-notified Tribes have been asking that steps be taken to remove stigma and
prejudice from their lives. More specifically, the Habitual Offenders Act,
which has served to continue to attach criminality to them, should be repealed.
Anti-beggary laws render the talents that they possess, such as juggling and
acrobatics, into punishable conduct; there are earnest demands for the repeal
of these provisions in the law. Women bear the brunt of this attribution of
criminality, and whole communities of women find themselves in prostitution
without a choice. Complaints about police brutality including custodial rape
were rife, speaking of lawlessness among the law enforcers. Such lawlessness
is unacceptable and action must be taken in accordance with law.
20. The Andaman Trunk Road which the Supreme Court ordered to be closed in
2002 still continues to be open to traffic. Although there are formal directions
against plying commercial traffic on the road, these have been observed only
in the breach. Tourist vehicles including buses and taxis ply on this road. In

417
the past few years, the exploitation of Jarawas as a tourist attraction, and the
sexual exploitation of the Jarawas has been recorded and reported on. The
problem has however not abated. The Andaman Trunk Road will have to be
closed if the Jarawas are to be protected from such unwelcome interest. DNA
testing on Jarawas has been reported. Efforts to get the protocols used to
ensure the consent of the indigenous population did not yield result. This
becomes of especial significance in the context of the Human DNA Bill, 2012,
which proposes the creation of DNA data bases. Informed consent is a
necessary part of such exercises, also among the indigenous population.
21. The persistence of bonded labour, and the trafficking, in large measure, of
women from tribal areas needs a concerted effort to end it. The state has to
take primary responsibility to identify, release and rehabilitate bonded labour,
wherever they are found.

418
Annexure 2
State-wise List of Districts with ST Population more than 50%
S.
No.
State Name
District Name No. of
Househ
olds
Total
Population
ST
Populatio
n
% of ST
1 Andaman & Nicobar
Islands
Nicobars 9288 36842 23681 64.3
2 Arunachal Pradesh Kurung Kumey 15037 92076 90764 98.6
3 Arunachal Pradesh Upper Subansiri 15869 83448 78323 93.9
4 Arunachal Pradesh East Kameng 14508 78690 72400 92.0
5 Arunachal Pradesh Tirap 20611 111975 98372 87.9
6 Arunachal Pradesh Lower Subansiri 15249 83030 72911 87.8
7 Arunachal Pradesh West Siang 21231 112274 92783 82.6
8 Arunachal Pradesh Upper Siang 7324 35320 28468 80.6
9 Arunachal Pradesh Anjaw 4612 21167 16451 77.7
10 Arunachal Pradesh Dibang Valley 1952 8004 5701 71.2
11 Arunachal Pradesh East Siang 19107 99214 69979 70.5
12 Arunachal Pradesh Tawang 10062 49977 34811 69.7
13 Arunachal Pradesh Papum Pare 35730 176573 117216 66.4
14 Arunachal Pradesh West Kameng 18159 83947 46380 55.2
15 Assam Dima Hasao 42252 214102 151843 70.9
16 Assam Karbi Anglong 177646 956313 538738 56.3
17 Chhattisgarh Bijapur 54757 255230 204189 80.0
18 Chhattisgarh Narayanpur 27982 139820 108161 77.4
19 Chhattisgarh Dakshin Bastar
Dantewada
120850 533638 410255 76.9
20 Chhattisgarh Bastar 311538 1413199 931780 65.9
21 Chhattisgarh Jashpur 192570 851669 530378 62.3
22 Chhattisgarh Uttar Bastar
Kanker
160937 748941 414770 55.4
23 Chhattisgarh Surguja 526049 2359886 1300628 55.1
24 Dadra & Nagar
Haweli
Dadra & Nagar
Haveli
76458 343709 178564 52.0
25 Gujarat The Dangs 44699 228291 216073 94.6
26 Gujarat Tapi 177091 807022 679320 84.2
27 Gujarat Narmada 122174 590297 481392 81.6
28 Gujarat Dohad 334272 2127086 1580850 74.3
29 Gujarat Valsad 364403 1705678 902794 52.9
30 Himachal Pradesh Lahul & Spiti 6674 31564 25707 81.4
31 Himachal Pradesh Kinnaur 19976 84121 48746 57.9
32 Jammu & Kashmir Kargil 18338 140802 122336 86.9
33 Jammu & Kashmir Leh(Ladakh) 21909 133487 95857 71.8
34 Jharkhand Khunti 103700 531885 389626 73.3
35 Jharkhand Simdega 118288 599578 424407 70.8
36 Jharkhand Gumla 188988 1025213 706754 68.9
37 Jharkhand Pashchimi
Singhbhum
302046 1502338 1011296 67.3
38 Jharkhand Lohardaga 88638 461790 262734 56.9
39 Lakshadweep Lakshadweep 11574 64473 61120 94.8
40 Madhya Pradesh Alirajpur 123800 728999 648638 89.0
41 Madhya Pradesh Jhabua 194157 1025048 891818 87.0
42 Madhya Pradesh Barwani 243277 1385881 962145 69.4
43 Madhya Pradesh Dindori 169630 704524 455789 64.7
44 Madhya Pradesh Mandla 250146 1054905 610528 57.9
45 Madhya Pradesh Dhar 425914 2185793 1222814 55.9
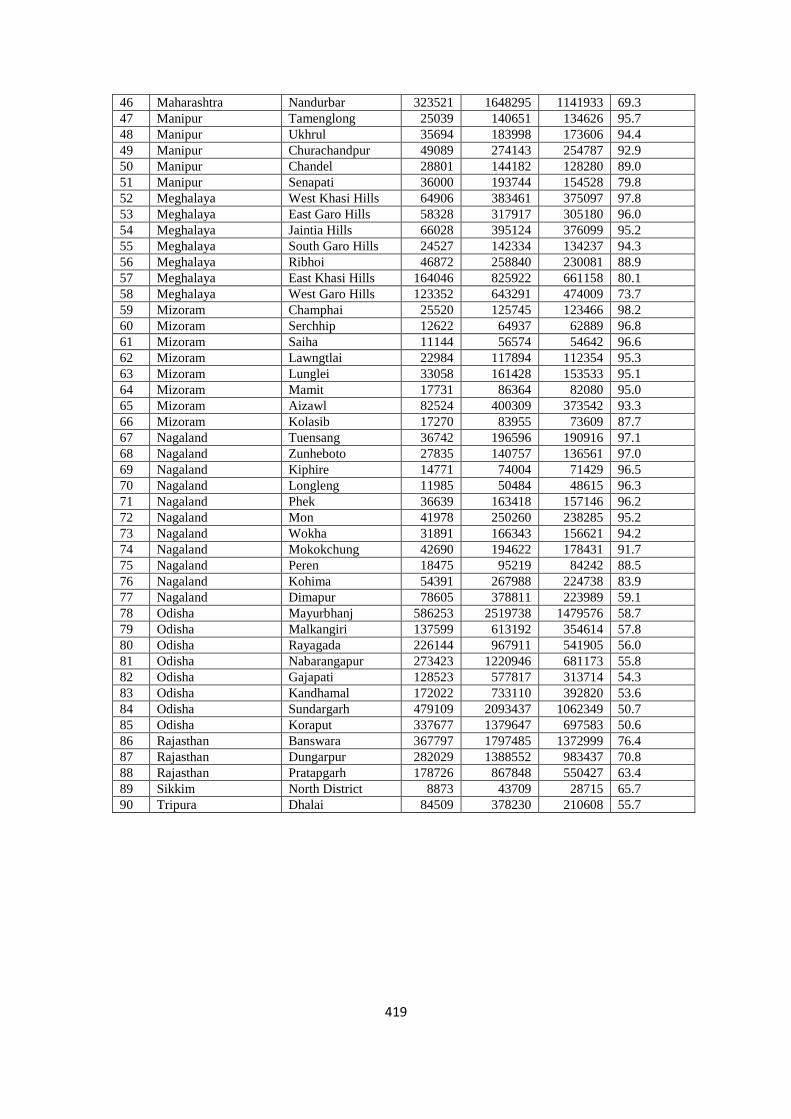
419
46 Maharashtra Nandurbar 323521 1648295 1141933 69.3
47 Manipur Tamenglong 25039 140651 134626 95.7
48 Manipur Ukhrul 35694 183998 173606 94.4
49 Manipur Churachandpur 49089 274143 254787 92.9
50 Manipur Chandel 28801 144182 128280 89.0
51 Manipur Senapati 36000 193744 154528 79.8
52 Meghalaya West Khasi Hills 64906 383461 375097 97.8
53 Meghalaya East Garo Hills 58328 317917 305180 96.0
54 Meghalaya Jaintia Hills 66028 395124 376099 95.2
55 Meghalaya South Garo Hills 24527 142334 134237 94.3
56 Meghalaya Ribhoi 46872 258840 230081 88.9
57 Meghalaya East Khasi Hills 164046 825922 661158 80.1
58 Meghalaya West Garo Hills 123352 643291 474009 73.7
59 Mizoram Champhai 25520 125745 123466 98.2
60 Mizoram Serchhip 12622 64937 62889 96.8
61 Mizoram Saiha 11144 56574 54642 96.6
62 Mizoram Lawngtlai 22984 117894 112354 95.3
63 Mizoram Lunglei 33058 161428 153533 95.1
64 Mizoram Mamit 17731 86364 82080 95.0
65 Mizoram Aizawl 82524 400309 373542 93.3
66 Mizoram Kolasib 17270 83955 73609 87.7
67 Nagaland Tuensang 36742 196596 190916 97.1
68 Nagaland Zunheboto 27835 140757 136561 97.0
69 Nagaland Kiphire 14771 74004 71429 96.5
70 Nagaland Longleng 11985 50484 48615 96.3
71 Nagaland Phek 36639 163418 157146 96.2
72 Nagaland Mon 41978 250260 238285 95.2
73 Nagaland Wokha 31891 166343 156621 94.2
74 Nagaland Mokokchung 42690 194622 178431 91.7
75 Nagaland Peren 18475 95219 84242 88.5
76 Nagaland Kohima 54391 267988 224738 83.9
77 Nagaland Dimapur 78605 378811 223989 59.1
78 Odisha Mayurbhanj 586253 2519738 1479576 58.7
79 Odisha Malkangiri 137599 613192 354614 57.8
80 Odisha Rayagada 226144 967911 541905 56.0
81 Odisha Nabarangapur 273423 1220946 681173 55.8
82 Odisha Gajapati 128523 577817 313714 54.3
83 Odisha Kandhamal 172022 733110 392820 53.6
84 Odisha Sundargarh 479109 2093437 1062349 50.7
85 Odisha Koraput 337677 1379647 697583 50.6
86 Rajasthan Banswara 367797 1797485 1372999 76.4
87 Rajasthan Dungarpur 282029 1388552 983437 70.8
88 Rajasthan Pratapgarh 178726 867848 550427 63.4
89 Sikkim North District 8873 43709 28715 65.7
90 Tripura Dhalai 84509 378230 210608 55.7

420
State-wise List of Districts with ST Population between 25% and 50%
S.
No.
State Name District Name No of
Househo
lds
Total
Populatio
n
ST
Populatio
n
% of ST
1 Andhra Pradesh Khammam 754034 2797370 765565 27.4
2 Arunachal Pradesh Lower Dibang
Valley
11600 54080 25974 48.0
3 Arunachal Pradesh Changlang 29521 148226 53878 36.3
4 Arunachal Pradesh Lohit 30005 145726 47410 32.5
5 Assam Dhemaji 129869 686133 325560 47.4
6 Assam Chirang 97395 482162 178688 37.1
7 Assam Baksa 191701 950075 331007 34.8
8 Assam Udalguri 168717 831668 267372 32.1
9 Assam Kokrajhar 181081 887142 278665 31.4
10 Chhattisgarh Koriya 153274 658917 304280 46.2
11 Chhattisgarh Korba 280073 1206640 493559 40.9
12 Chhattisgarh Raigarh 367962 1493984 505609 33.8
13 Chhattisgarh Jamtara 155275 791042 240489 30.4
14 Chhattisgarh Purbi Singhbhum 476931 2293919 653923 28.5
15 Chhattisgarh Mahasamund 248561 1032754 279896 27.1
16 Chhattisgarh Rajnandgaon 318488 1537133 405194 26.4
17 Chhattisgarh Dhamtari 170951 799781 207633 26.0
18 Gujarat Navsari 295131 1329672 639659 48.1
19 Gujarat Bharuch 333483 1551019 488194 31.5
20 Gujarat Panch Mahals 446611 2390776 721604 30.2
21 Gujarat Vadodara 877106 4165626 1149901 27.6
22 Himachal Pradesh Chamba 102460 519080 135500 26.1
23 Jammu & Kashmir Punch 90261 476835 176101 36.9
24 Jammu & Kashmir Rajouri 130401 642415 232815 36.2
25 Jammu & Kashmir Reasi 56689 314667 88365 28.1
26 Jharkhand Latehar 133381 726978 331096 45.5
27 Jharkhand Dumka 275019 1321442 571077 43.2
28 Jharkhand Pakur 182317 900422 379054 42.1
29 Jharkhand Ranchi 569444 2914253 1042016 35.8
30 Jharkhand Saraikela-
Kharsawan
221232 1065056 374642 35.2
31 Jharkhand Sahibganj 227023 1150567 308343 26.8
32 Madhya Pradesh Anuppur 170715 749237 358543 47.9
33 Madhya Pradesh Umaria 145024 644758 300687 46.6
34 Madhya Pradesh Shahdol 251452 1066063 476008 44.7
35 Madhya Pradesh Betul 329832 1575362 667018 42.3
36 Madhya Pradesh Khargone (West
Nimar)
367988 1873046 730169 39.0
37 Madhya Pradesh Seoni 314767 1379131 519856 37.7
38 Madhya Pradesh Chhindwara 443361 2090922 769778 36.8
39 Madhya Pradesh Khandwa (East
Nimar)
266655 1310061 459122 35.0
40 Madhya Pradesh Singrauli 243925 1178273 383994 32.6
41 Madhya Pradesh Burhanpur 146341 757847 230095 30.4
42 Madhya Pradesh Ratlam 296683 1455069 409865 28.2
43 Madhya Pradesh Harda 113379 570465 159678 28.0
44 Madhya Pradesh Sidhi 238448 1127033 313304 27.8
45 Maharashtra Gadchiroli 250435 1072942 415306 38.7
46 Maharashtra Dhule 408874 2050862 647315 31.6
47 Maharashtra Nashik 1222887 6107187 1564369 25.6
48 Odisha Kendujhar 405272 1801733 818878 45.4
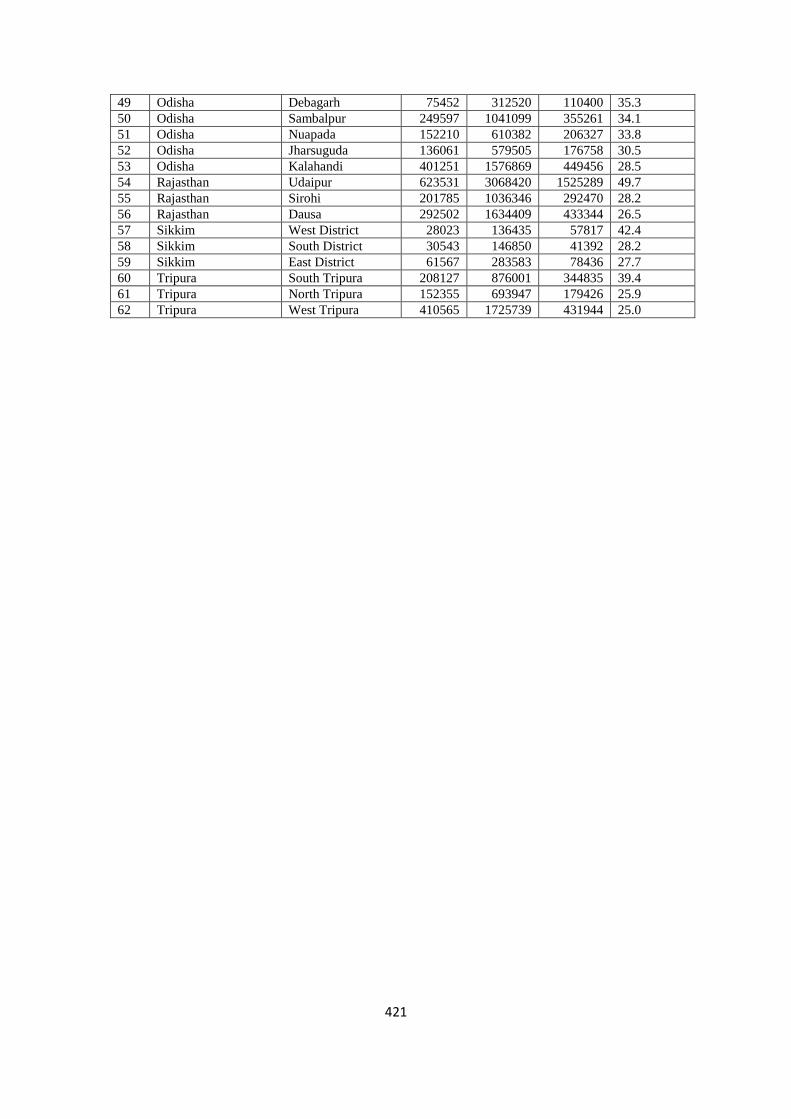
421
49 Odisha Debagarh 75452 312520 110400 35.3
50 Odisha Sambalpur 249597 1041099 355261 34.1
51 Odisha Nuapada 152210 610382 206327 33.8
52 Odisha Jharsuguda 136061 579505 176758 30.5
53 Odisha Kalahandi 401251 1576869 449456 28.5
54 Rajasthan Udaipur 623531 3068420 1525289 49.7
55 Rajasthan Sirohi 201785 1036346 292470 28.2
56 Rajasthan Dausa 292502 1634409 433344 26.5
57 Sikkim West District 28023 136435 57817 42.4
58 Sikkim South District 30543 146850 41392 28.2
59 Sikkim East District 61567 283583 78436 27.7
60 Tripura South Tripura 208127 876001 344835 39.4
61 Tripura North Tripura 152355 693947 179426 25.9
62 Tripura West Tripura 410565 1725739 431944 25.0

422
Annexure 3
The details of representation of Scheduled Tribes (group-wise) in the Public Sector
Banks, Financial Institutions and Insurance Companies as on 31-12-2012 (Tables 1-
4), as per the information provided by the Department of Financial Services, Ministry
of Finance, Government of India.
Table 1: Representation for Scheduled Tribes for Group A & B (Officers)
Name of the Bank, Financial
Institutions and Insurance
Companies
Number of Employees
Percentage Total Scheduled Tribes
Allahabad Bank 11535 853 7.39
Andhra Bank 8540 617 7.22
Bank of Baroda 16884 1206 7.14
Bank of India 17303 1250 7.22
Bank of Maharashtra 5041 353 7.00
Canara Bank 17907 1205 6.73
Central Bank of India 13433 790 5.88
Corporation Bank 6538 357 5.46
Dena Bank 4650 455 9.78
Indian Bank 8137 523 6.42
Indian Overseas Bank 11817 930 7.87
Oriental Bank of Commerce 9933 521 5.24
Punjab National Bank 23484 1427 6.08
P&S Bank 6039 287 4.75
Syndicate Bank 10555 772 7.31
Union Bank 16212 1072 6.61
United Bank 6636 490 7.38
UCO Bank 10184 691 6.78
Vijaya Bank 5640 362 6.42
State Bank of India 81427 5338 6.55
State Bank of Bikaner & Jaipur 5418 509 9.39
State Bank of Patiala 5820 215 3.69
State Bank of Hyderabad 7208 463 6.42
State Bank of Mysore 3705 256 6.91
State Bank of Travancore 244 9 3.69
lDBI 13247 529 3.99
RBI 7058 503 7.13
NABARD 2852 226 7.92
SIDBI 895 56 6.26
Exim Bank 287 19 6.62
NHB 94 3 3.19
IIFCL 51 2 3.92
LIC 53686 3781 7.04
GIC 331 16 4.83
NIACL 8659 463 5.35
NICL 7061 360 5.09
OICL 6481 368 5.68
UIICL 7315 363 4.96

423
AICL 213 20 9.39
Total 422520 27660 6.55
Table 2: Representation for Scheduled Tribes for Group C (Clerks)
Name of the Bank
Number of Employment
Percentage Total
Scheduled
Tribes
Allahabad Bank 7003 353 5.04
Andhra Bank 4886 320 6.55
Bank of Baroda 17081 1212 7.09
Bank of India 17795 1762 9.90
Bank of Maharashtra 6166 421 6.83
Canara Bank 16670 998 5.99
Central Bank of India 14014 1157 8.26
Corporation Bank 5965 338 5.67
Dena Bank 4399 saz 12.09
Indian Bank 8745 340 3.89
Indian Overseas Bank 11715 571 4.87
Oriental Bank of Commerce 5683 251 4.42
Punjab National Bank 24059 1044 4.34
P&S Bank 1724 40 2.32
Syndicate Bank 10173 595 5.85
Union Bank --
United Bank 9815 55S 5.65
UCO Bank 6368 401 6.29
Vijaya Bank 8841 502 5.68
State Bank of India 3882 178 4.58
State Bank of Bikaner & Jaipur 93053 8987 9.66
State Bank of Patiala 4601 466 10.13
State Bank of Hyderabad 5685 72 1.27
State Bank of Mysore 5782 371 6.42
State Bank of Travancore 4960 233 4.69
lDBI 21 - --
RBI 1285 39 3.03
NABARD 3199 351 10.97
SIDBI 713 56 7.85
Exim Bank 94 7 7.45
NHB Exim Bank has no Employees in Clerical cadre
IIFCL - -
LIC - -
GIC 57537 4474 7.77
NIACL 107 11 10.28
NICL 8221 680 8.27
OICL 6468 461 7.13
UIICL 6023 498 8.27
AICL 7256 5p 7.04
Allahabad Bank 23 4 17.39
Total 390012 28791 7.38

424
Table 3: Representation for Scheduled Tribes for Group D (Excluding Safai
Karamchari)
Name of the Bank
Number of Employees
Percentage Total
Scheduled
Tribes
Allahabad Bank 2064 113 5.47
Andhra Bank 3011 204 6.77
Bank of Baroda 7119 653 9.17
Bank of India 5543 534 9.63
Bank of Maharashtra 2545 244 9.59
Canara Bank 7311 310 4.24
Central Bank of India 5379 488 9.07
Corporation Bank 3036 203 6.69
Dena Bank 1831 273 14.91
Indian Bank 2190 86 3.93
Indian Overseas Bank 4500 169 3.75
Oriental Bank of Commerce 3413 221 6.47
Punjab National Bank 9192 563 6.12
P&S Bank 991 33 3.33
Syndicate Bank 3783 266 7.03
Union Bank 4104 342 8.33
United Bank 3120 138 4.42
UCO Bank 2869 143 4.98
Vijaya Bank 2192 160 7.29
State Bank of India 33467 2554 7.63
State Bank of Bikaner & Jaipur 2271 246 10.83
State Bank of Patiala 3158 59 1.87
State Bank of Hyderabad 2310 133 5.76
State Bank of Mysore 2128 139 6.53
State Bank of Travancore 56 3 5.36
IDBI 837 63 7.53
RBI 4162 454 10.91
NABARD 828 103 12.44
SIDBI 70 14 20.00
Exim Bank 4 -- ---
NHB -- -- --
IIFCL 1 -- --
LIC 5942 293 4.93
GIC 28 1 3.57
NIACL 1304 127 9.74
NICL 1108 87 7.85
OICL 1338 36 2.69
UIICL 2104 141 6.70
AICL 4 -- --
Total 135313 9596 7.09

425
Table 4: Representation for Scheduled Tribes for Group D (Safai Karamchari)
Name of the Bank
Number of Employees
Percentage Total
Scheduled
Tribes
Allahabad Bank 2285 123 5.38
Andhra Bank 1727 131 7.58
Bank of Baroda 1068 98 9.18
Bank of India 2426 280 11.54
Bank of Maharashtra 1402 86 6.13
Canara Bank 1473 72 4.89
Central Bank of India 2414 183 7.58
Corporation Bank -- -- --
Dena Bank 321 32 9.96
Indian Bank 710 22 3.09
Indian Overseas Bank -- -- --
Oriental Bank of Commerce 2 1 50
Punjab National Bank 4626 194 4.19
P&S Bank 814 9 1.10
Syndicate Bank 2098 103 4.91
Union Bank 1942 191 9.83
United Bank 1364 57 4.18
UCO Bank 1676 56 3.34
Vijaya Bank 526 40 7.60
State Bank of India 4411 340 7.71
State Bank of Bikaner & Jaipur 767 17 2.22
State Bank of Patiala 741 8 1.08
State Bank of Hyderabad 1436 89 6.19
State Bank of Mysore -- -- --
State Bank of Travancore 3 -- --
lDBI 239 18 7.53
RBI 914 100 10.94
NABARD -- -- --
SIDBI 3 -- --
Exim Bank Exim Bank has no Employees in this cadre
NHB -- -- --
IIFCL -- -- --
LIC 857 47 5.48
GIC -- -- --
NIACL 723 48 6.64
NICL 744 44 5.91
OICL 726 125 17.22
UIICL 90 4 4.44
AICL 3 -- --
Total 38533 2518 6.53

426
Annexure 4
Nutritional Value of Foods
Grains(Per 100 gram) Protein (gram) Calories per
Kcal
Calcium (mg) Iron (mg)
Finger millet/Ragi
(Madia)
7.3 328 344 3.9
Wheat(gehu) 12.8 346 41 5.3
Maize(Makka) 11.1 342 10 2.3
Sorghum(Juar) 10.4 349 25 5.8
Pearl Millet(Bajra) 11.6 361 42 8
Italian Millet(Kang) 12.3 331 31 12.9
Samai(Sava) 6.2 307 20 5
Kodo Millet(kodo) 8.3 309 27 5.2
Little Millet(Kutki) 7.7 341 17 5.2
Dhan 6.8 345 10 3.2 (when cut
by hand);
0.7 (mill
processed)
Amaranth Seed (Rajgira) 16.5 364 223 17.6
Barley (Jau) 11.5 336 26 1.67
Paddy(Baas Beej) 13.1 367 37 6.4
Pulses and legumes (Per
100 gram)
Protein (gram) Cal per Kcal Vitamin (mg) Potassium
(mg)
Hirva 22 321 71 762
Tivra 28.2 345 120 644
Black Gram (Urid) 24 347 38 800
Semi (Field Bean) 24.9 347
Red Gram (Arhar) 22.3 335 132 1104
Bengalgram Whole
(Chana/Sabut)
17.1 360 189 808
Pink Lentil (Masoor) 25.1 342 270 629
Peas (Matar) 19.7 315 39 725
Cow Pea (Barbatti) 24.1 323 12 1131
Greengram (Moong dal) 24.5 334 94 1150
Green Peas (Hari matar) 7.2 93 83 79
Soya Bean 43.2 432 426 -
Rough Green lentil
(Kacchi hari Arhar)
9.8 116 469 463
Bengal gram Dal (Chana
Dal)
20.8 372 129 720
Seeds (Per 100 gram) Protein (gram) Cal per Kcal Iron (mg) Calcium (mg)
Coconut (Nariyal) 6.8 662 2.7 400
Sesame Seed (Til) 18.3 563 10.5 1450
Groundnut (Moongphali) 26.1 567 2.8 90
Flax Seed (Alsi) 20.3 530 2.7 170
Mustard (Sarso) 20 541 17.9 490
Niger Seed (Ramtil) 23.9 515 56.6 300
Ceylon Oak
(Kusum/bare)
13.5 356 236
Soya Bean 43.2 432 10.4 240

427
Roots and tubers (Per
100 gram)
Cal per mg Micro Iron Vitamin A (g) Vitamin C (mg)
Carrot (Gajar) 48 1.03 6460 3
Lotus Plant (Kamal Ka
Jhad)
53 22
Colacassia (Arvi/kochai) 97 0.42
Onion (Pyaaj) 50 0.6 11
Potato (alu) 97 0.48 24 17
Radish (Muli) 17 3 15
Sweet Potato
(Shakarkand)
120 0.21 6 24
Golden Eye Grass (Kaali
Musli)
123
Yam (Jimi Kanda) 111 1.19 78 Source: Jan Swasthya Sahyog

428
Annexure 5
Staffing Pattern of ITDA, Paderu, Andhra Pradesh
Project Officer
Assistant Project Officer (General)
o Administration
Administrative Officer
o Accounts
Assistant Accounts Officer
o Monitoring
Deputy Statistical Officer
Data Processing Officer & other Computer Operators
o Horticulture
Project Horticulture Officer
Horticulture Officers, Sub Assts. & Technical Assts.
o Agriculture
Project Agriculture Officer
Assistant Directors of Agriculture
Agriculture Officers, Agrl.Extension Officers.
o Coffee
Assistant Dt.Director (Coffee)
Coffee Sub Assts.
o Tribal Welfare Engineering
Executive Engineer(Tribal Welfare)
Head Draftsmen/ Superintendent& other clerical staff
Deputy Executive Engineers & Assistant Executive Engineers
o Education
Deputy Director(Tribal Welfare)
Superintendent & other clerical staff
Assistant Tribal Welfare Officers & Hostel Welfare Officers
District Educational Officer (Agency)
Mandal Educational Officers
Mandal Resource Persons &Community Resource Persons
o Medical & Health
Additional District Medical & Health Officer (Tribal)
Superintendent & other clerical staff

429
Senior Public Health Officers, Medical Officers & other health
officials
Dist.Malaria Officer
Particularly Vulnerable Tribal Groups Development
o Assistant Project Officer (PVTG)
In addition to the above staff, there are other staff under line department’s viz.
Education, Medical & Health, Malaria, Engineering, Indira Kranthi
Padhakam, MGNREGA etc., as follows.
Engineering
o Panchayat Raj Engineering
Head Draftsmen/ Supdt. & other clerical staff
Deputy Executive Engineer & Assistant Executive Engineers
o Rural Water Supply
Head Draftsmen/ Supdt. & other clerical staff
Deputy Executive Engineer & Assistant Executive Engineers
o Roads & Buildings
Head Draftsmen/ Supdt. & other clerical staff
Deputy Executive Engineer & Assistant Executive Engineers
o Spl.Minor Irrigation
Head Draftsmen/ Supdt. & other clerical staff
Deputy Executive Engineer & Assistant Executive Engineers
o Housing
Head Draftsmen/ Supdt. & other clerical staff
Deputy Engineer & Assistant Engineer
o Indira Kranthi Padhakam
Additional Project Director
Area Coordinators
Assistant Project Managers
District Project Managers
Community Coordinator s and Administrative Assistants
Mahatma Gandhi National Rural Employment Guarantee Act
o Project Director, MGNREGA
Assistant Project Directors of MGNREGA
Engineering Consultants
Computer Operators
Integrated Child Development Scheme (ICDS)
o Child Development Project Officers
Supervisors

430
Electricity
o Assistant Divisional Engineer, AP Transco
Assistant Engineers
Girijan Cooperative Corporation
o Divisional Manager
Superintendent & other clerical staff
Sales Managers

431
Members of the High Level Committee
(Prof. Virginius Xaxa) (Dr. Kamal K. Misra)
Chairman Member
(Dr. Usha Ramanathan) (Dr. Joseph Bara)
Member Member
(Ms. Sunila Basant) (Dr. Abhay Bang)
Member Member
(Dr. Hrusikesh Panda)
Member Secretary