Report of the Diagnostic Review Team for Stuart...
69
Report of the Diagnostic Review Team for Stuart Middle 4601 Valley Station Road Louisville KY 40272 US Ms. Rolanda Renee Bledsoe Principal Date: November 8, 2015 - November 11, 2015 Document Generated On December 16, 2015
-
Upload
hoangtuyen -
Category
Documents
-
view
214 -
download
0
Transcript of Report of the Diagnostic Review Team for Stuart...

Report of theDiagnostic Review Team
forStuart Middle
4601 Valley Station RoadLouisville
KY 40272US
Ms. Rolanda Renee BledsoePrincipal
Date: November 8, 2015 - November 11, 2015
Document Generated On December 16, 2015

Copyright (c) 2015 by Advance Education, Inc. AdvancED™ grants to the Institution, which is the subject of the Diagnostic Review Team Report, and its
designees and stakeholders a non-exclusive, perpetual, irrevocable, royalty-free license and release to reproduce, reprint, and distribute this report in
accordance with and as protected by the Copyright Laws of the United States of America and all foreign countries. All other rights not expressly
conveyed are reserved by AdvancED™.
Document Generated On December 16, 2015
Kentucky Department of Education Stuart Middle
© 2015 Advance Education, Inc. All rights reserved unless otherwise granted by written agreement. Page 2

Table of Contents Introduction 4
Results 7
Teaching and Learning Impact 7
Standard 3 - Teaching and Assessing for Learning 8
Standard 5 - Using Results for Continuous Improvement 9
Student Performance Diagnostic 9
Effective Learning Environments Observation Tool (eleot™) 10
eleot™ Data Summary 13
Findings 16
Leadership Capacity 22
Standard 1 - Purpose and Direction 23
Standard 2 - Governance and Leadership 23
Stakeholder Feedback Diagnostic 23
Findings 24
Resource Utilization 28
Standard 4 - Resources and Support Systems 28
Findings 29
Conclusion 31
Addenda 33
Team Roster 33
About AdvancED 35
References 36
Attachments 37
Document Generated On December 16, 2015
Kentucky Department of Education Stuart Middle
© 2015 Advance Education, Inc. All rights reserved unless otherwise granted by written agreement. Page 3
Kentucky Department of Education Stuart Middle
© 2015 Advance Education, Inc. All rights reserved unless otherwise granted by written agreement. Page 3
-
-
IntroductionThe Diagnostic Review is carried out by a team of highly qualified evaluators who examine the institution's
adherence and commitment to the research-aligned AdvancED Standards. The Diagnostic Review Process is
designed to energize and equip the leadership and stakeholders of an institution to achieve higher levels of
performance and address those areas that may be hindering efforts to reach desired performance levels. The
Diagnostic Review is a rigorous process that includes examination of evidence and relevant performance data,
interviews with stakeholders, and observations of instruction, learning and operations.
The Diagnostic Review Team used the AdvancED Standards and related criteria to guide its evaluation,
looking not only for adherence to standards, but also for how the institution functioned as a whole and
embodied the practices and characteristics of quality. Using the evidence at their disposal, the Diagnostic
Review Team arrived at a set of findings contained in this report.
Standards help to delineate what matters. They provide a common language through which an education
community can engage in conversations about educational improvement, institution effectiveness, and
achievement. They serve as a foundation for planning and implementing improvement strategies and activities
and for measuring success. AdvancED Standards were developed by a committee comprised of talented
educators and leaders from the fields of practice, research and policy who applied professional wisdom, deep
knowledge of effective practice, and the best available research to craft a set of robust standards that define
institutional quality and guide continuous improvement. Prior to implementation, an internationally recognized
panel of experts in testing and measurement, teacher quality and education research reviewed the standards
and provided feedback, guidance and endorsement.
The AdvancED Diagnostic Review Team uses AdvancED Standards, associated Indicators and criteria related
to student performance and stakeholder engagement to guide its evaluation. The Standards, Indicators and
related criteria are evaluated using Indicator-specific performance levels. The Team rates each Indicator and
criterion on a scale of 1 to 4. The final scores assigned to the Indicators and criteria represent the average of
the Diagnostic Review Team members' individual ratings.
Use of Diagnostic ToolsA key to examining the institution is the design and use of diagnostic tools that reveal the effectiveness with
which an institution creates conditions and implements processes and practices that impact student
performance and success. In preparation for the Diagnostic Review, the institution conducted a Self
Assessment using the AdvancED Standards and provided evidence to support its conclusions vis a vis
organizational effectiveness in ensuring acceptable and improving levels of student performance.
An indicator-based tool that connects the specific elements of the criteria to evidence gathered by the
team;
a student performance analytic that examines the quality of assessment instruments used by the
institution, the integrity of the administration of the assessment to students, the quality of the learning
Document Generated On December 16, 2015
Kentucky Department of Education Stuart Middle
© 2015 Advance Education, Inc. All rights reserved unless otherwise granted by written agreement. Page 4
Kentucky Department of Education Stuart Middle
© 2015 Advance Education, Inc. All rights reserved unless otherwise granted by written agreement. Page 4
Kentucky Department of Education Stuart Middle
© 2015 Advance Education, Inc. All rights reserved unless otherwise granted by written agreement. Page 4

-
-
results including the impact of instruction on student learning at all levels of performance, and the
equity of learning that examines the results of student learning across all demographics;
a stakeholder engagement instrument that examines the fidelity of administration and results of
perception surveys seeking the perspective of students, parents, and teachers;
a state-of-the-art, learner-centric observation instrument, the Effective Learning Environments
Observation Tool (eleot™) that quantifies students' engagement, attitudes and dispositions organized
in 7 environments: Equitable Learning, High Expectations, Supportive Learning, Active Learning,
Progress Monitoring and Feedback, Well-Managed Learning, and Digital Learning. All evaluators must
be trained, reach acceptable levels of inter-rater reliability, and certified to use this research-based and
validated instrument.
The Diagnostic Review Team's findings and critical observations are shared in this report through the Indicator
ratings, identification of Powerful Practices and Improvement Priorities.
Powerful PracticesA key to continuous improvement is the institution's knowledge of its most effective and impactful practices.
Such practices, yielding a performance level of 4, serve as critical leverage points necessary to guide, support
and ensure continuous improvement. The Diagnostic Review process is committed to identifying conditions,
processes and practices that are having the most significant impact on student performance and institutional
effectiveness. The Diagnostic Review Team has captured and defined Powerful Practices that it identified as
essential to the institution's effort to continue its journey of improvement.
Improvement PrioritiesThe Diagnostic Review Team reviewed, analyzed and deliberated over significant bodies of evidence provided
by the institution and gathered by the team during the process. For those instances in which this analysis
yielded a Level 1 Indicator rating, an Improvement Priority has been identified by the team to guide
improvement efforts. Improvement Priorities are supported by extensive explanation and rationale to give
school leaders and stakeholders a clear understanding of the conditions, practices, policies, etc., revealed
through the Diagnostic Review process. Improvement Priorities are intended to be incorporated into the
institution's improvement plan.
The ReviewThe Stuart Middle School Diagnostic Review began with a conference call on October 28, 2015 that involved
the Lead Evaluator, Co-Lead Evaluator, school principal, and assistant principal for instruction. During this
conversation, the group discussed the schedule and logistics for the visit.
The Team began its off-site examination of artifacts provided by Stuart Middle School with a joint Team/school
conference call held on October 30, 2015. At that time the principal and assistant principal of instruction
addressed school operations and priorities with the seven Diagnostic Review Team Members. In addition, the
Document Generated On December 16, 2015
Kentucky Department of Education Stuart Middle
© 2015 Advance Education, Inc. All rights reserved unless otherwise granted by written agreement. Page 5
Kentucky Department of Education Stuart Middle
© 2015 Advance Education, Inc. All rights reserved unless otherwise granted by written agreement. Page 5
Kentucky Department of Education Stuart Middle
© 2015 Advance Education, Inc. All rights reserved unless otherwise granted by written agreement. Page 5

Lead Evaluator announced the AdvancED Standard and Domain chairpersons for the Team and explained
documents that were posted on the AdvancED workspace.
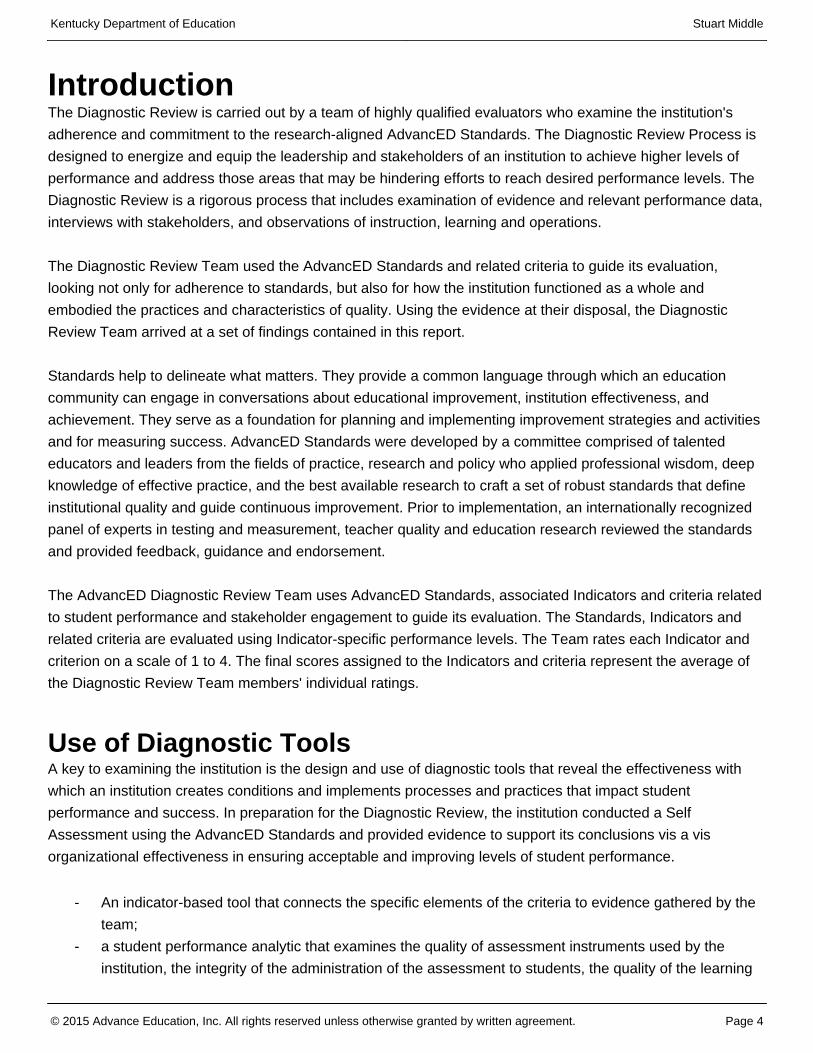
The Team began the on-site Diagnostic Review of Stuart Middle School with an evening work session at the
hotel on Sunday, November 8, 2015. The event was attended by the process coach and all Team Members.
Later during the evening, the school principal and leadership staff arrived to provide information for the Team
about school operations, student academic data analysis, progress toward existing improvement priorities, and
stakeholder involvement. Beginning on Monday, November 9, the team conducted stakeholder interviews,
classroom observations, observed school operations, and examined documents and artifacts. The Team
concluded their on-site review on Wednesday, November 11.
The Team would like to thank the Stuart Middle School principal, leadership staff, teachers, support staff,
district administrators, Kentucky Department of Education staff, parents, and students for the warm, friendly
welcome and for their cooperation throughout the process. The Team would also like to extend a special thank
you to the various persons who provided technology assistance. School personnel and other stakeholders who
participated in the review process were prepared for the visit with all events appropriately planned and
scheduled. Interviewees understood the review process and participated in the various scheduled activities.
There were open and honest discussions, interviews and informal visits with the principal and leadership team,
which provided valuable information to the Diagnostic Review Team.
The Team interviewed a total of 51 stakeholders and visited 29 classrooms during the visit.
Stakeholders were interviewed by members of the Diagnostic Review Team to gain their perspectives on
topics relevant to the institution's effectiveness and student performance. The feedback gained through the
stakeholder interviews was considered with other evidences and data to support the findings of the Diagnostic
Review. The following chart depicts the numbers of persons interviewed representative of various stakeholder
groups.
Using the evidence at their disposal, the AdvancED Diagnostic Review Team arrived at a set of findings
contained in this report. The report is presented in three sections: Results, Conclusion and Addenda.
Stakeholder Interviewed Number
Administrators 9
Instructional Staff 20
Support Staff 11
Students 7
Parents/Community/Business Leaders 4
Total 51
Document Generated On December 16, 2015
Kentucky Department of Education Stuart Middle
© 2015 Advance Education, Inc. All rights reserved unless otherwise granted by written agreement. Page 6
Kentucky Department of Education Stuart Middle
© 2015 Advance Education, Inc. All rights reserved unless otherwise granted by written agreement. Page 6
Kentucky Department of Education Stuart Middle
© 2015 Advance Education, Inc. All rights reserved unless otherwise granted by written agreement. Page 6

ResultsTeaching and Learning ImpactThe impact of teaching and learning on student achievement is the primary expectation of every institution.
The relationship between teacher and learner must be productive and effective for student success. The
impact of teaching and learning includes an analysis of student performance results, instructional quality,
learner and family engagement, support services for student learning, curriculum quality and efficacy, and
college and career readiness data. These are all key indicators of an institution's impact on teaching and
learning.
A high-quality and effective educational system has services, practices, and curriculum that ensure teacher
effectiveness. Research has shown that an effective teacher is a key factor for learners to achieve their highest
potential and be prepared for a successful future. The positive influence an effective educator has on learning
is a combination of "student motivation, parental involvement" and the "quality of leadership" (Ding & Sherman,
2006). Research also suggests that quality educators must have a variety of quantifiable and intangible
characteristics that include strong communication skills, knowledge of content, and knowledge of how to teach
the content. The institution's curriculum and instructional program should develop learners' skills that lead them
to think about the world in complex ways (Conley, 2007) and prepare them to have knowledge that extends
beyond the academic areas. In order to achieve these goals, teachers must have pedagogical skills as well as
content knowledge (Baumert, J., Kunter, M., Blum, W., Brunner, M., Voxx, T., Jordan, A., Klusmann, U.,
Krauss, S., Nuebrand, M., & Tsai, Y., 2010). The acquisition and refinement of teachers' pedagogical skills
occur most effectively through collaboration and professional development. These are a "necessary approach
to improving teacher quality" (Colbert, J., Brown, R., Choi, S., & Thomas, S., 2008). According to Marks, Louis,
and Printy (2002), staff members who engage in "active organizational learning also have higher achieving
students in contrast to those that do not." Likewise, a study conducted by Horng, Klasik, and Loeb (2010),
concluded that leadership in effective institutions "supports teachers by creating collaborative work
environments." Institutional leaders have a responsibility to provide experiences, resources, and time for
educators to engage in meaningful professional learning that promotes student learning and educator quality.
AdvancED has found that a successful institution implements a curriculum based on clear and measurable
expectations for student learning. The curriculum provides opportunities for all students to acquire requisite
knowledge, skills, and attitudes. Teachers use proven instructional practices that actively engage students in
the learning process. Teachers provide opportunities for students to apply their knowledge and skills to real
world situations. Teachers give students feedback to improve their performance.
Institutions with strong improvement processes move beyond anxiety about the current reality and focus on
priorities and initiatives for the future. Using results, i.e., data and other information, to guide continuous
improvement is key to an institution's success. A study conducted by Datnow, Park, and Wohlstetter (2007)
from the Center on Educational Governance at the University of Southern California indicated that data can
shed light on existing areas of strength and weakness and also guide improvement strategies in a systematic
and strategic manner (Dembosky, J., Pane, J., Barney, H., & Christina, R., 2005). The study also identified six
Document Generated On December 16, 2015
Kentucky Department of Education Stuart Middle
© 2015 Advance Education, Inc. All rights reserved unless otherwise granted by written agreement. Page 7
Kentucky Department of Education Stuart Middle
© 2015 Advance Education, Inc. All rights reserved unless otherwise granted by written agreement. Page 7
Kentucky Department of Education Stuart Middle
© 2015 Advance Education, Inc. All rights reserved unless otherwise granted by written agreement. Page 7
Kentucky Department of Education Stuart Middle
© 2015 Advance Education, Inc. All rights reserved unless otherwise granted by written agreement. Page 7

key strategies that performance-driven systems use: (1) building a foundation for data-driven decision making,
(2) establishing a culture of data use and continuous improvement, (3) investing in an information management
system, (4) selecting the right data, (5) building institutional capacity for data-driven decision making, and (6)
analyzing and acting on data to improve performance. Other research studies, though largely without
comparison groups, suggested that data-driven decision-making has the potential to increase student
performance (Alwin, 2002; Doyle, 2003; Lafee, 2002; McIntire, 2002).
Through ongoing evaluation of educational institutions, AdvancED has found that a successful institution uses
a comprehensive assessment system based on clearly defined performance measures. The system is used to
assess student performance on expectations for student learning, evaluate the effectiveness of curriculum and
instruction, and determine strategies to improve student performance. The institution implements a
collaborative and ongoing process for improvement that aligns the functions of the school with the expectations
for student learning. Improvement efforts are sustained, and the institution demonstrates progress in improving
student performance and institution effectiveness.
Standard 3 - Teaching and Assessing for Learning The school's curriculum, instructional design, and assessment practices guide and ensure teacher
effectiveness and student learning.
Indicator Description Review TeamScore
3.1 The school's curriculum provides equitable and challenging learning experiencesthat ensure all students have sufficient opportunities to develop learning,thinking, and life skills that lead to success at the next level.
1.71
3.2 Curriculum, instruction, and assessment are monitored and adjustedsystematically in response to data from multiple assessments of student learningand an examination of professional practice.
1.86
3.3 Teachers engage students in their learning through instructional strategies thatensure achievement of learning expectations.
1.29
3.4 School leaders monitor and support the improvement of instructional practices ofteachers to ensure student success.
1.71
3.5 Teachers participate in collaborative learning communities to improve instructionand student learning.
2.00
3.6 Teachers implement the school's instructional process in support of studentlearning.
1.71
3.7 Mentoring, coaching, and induction programs support instructional improvementconsistent with the school's values and beliefs about teaching and learning.
2.14
3.8 The school engages families in meaningful ways in their children's education andkeeps them informed of their children's learning progress.
1.71
3.9 The school has a formal structure whereby each student is well known by at leastone adult advocate in the school who supports that student's educationalexperience.
1.57
Document Generated On December 16, 2015
Kentucky Department of Education Stuart Middle
© 2015 Advance Education, Inc. All rights reserved unless otherwise granted by written agreement. Page 8
Kentucky Department of Education Stuart Middle
© 2015 Advance Education, Inc. All rights reserved unless otherwise granted by written agreement. Page 8
Kentucky Department of Education Stuart Middle
© 2015 Advance Education, Inc. All rights reserved unless otherwise granted by written agreement. Page 8
Kentucky Department of Education Stuart Middle
© 2015 Advance Education, Inc. All rights reserved unless otherwise granted by written agreement. Page 8

Standard 5 - Using Results for Continuous ImprovementThe school implements a comprehensive assessment system that generates a range of data about student
learning and school effectiveness and uses the results to guide continuous improvement.
Student Performance DiagnosticThe quality of assessments used to measure student learning, assurance that assessments are administered
with procedural fidelity and appropriate accommodations, assessment results that reflect the quality of
learning, and closing gaps in achievement among subpopulations of students are all important indicators for
evaluating overall student performance.
Indicator Description Review TeamScore
3.10 Grading and reporting are based on clearly defined criteria that represent theattainment of content knowledge and skills and are consistent across gradelevels and courses.
1.86
3.11 All staff members participate in a continuous program of professional learning. 2.00
3.12 The school provides and coordinates learning support services to meet theunique learning needs of students.
1.57
Indicator Description Review TeamScore
5.1 The school establishes and maintains a clearly defined and comprehensivestudent assessment system.
2.00
5.2 Professional and support staff continuously collect, analyze, and apply learningfrom a range of data sources, including comparison and trend data about studentlearning, instruction, program evaluation, and organizational conditions.
1.86
5.3 Professional and support staff are trained in the evaluation, interpretation, anduse of data.
2.00
5.4 The school engages in a continuous process to determine verifiableimprovement in student learning, including readiness for and success at the nextlevel.
2.00
5.5 Leadership monitors and communicates comprehensive information aboutstudent learning, conditions that support student learning, and the achievementof school improvement goals to stakeholders.
1.71
Evaluative Criteria Review TeamScore
Assessment Quality 2.00
Test Administration 2.29
Equity of Learning 1.29
Quality of Learning 2.00
Document Generated On December 16, 2015
Kentucky Department of Education Stuart Middle
© 2015 Advance Education, Inc. All rights reserved unless otherwise granted by written agreement. Page 9
Kentucky Department of Education Stuart Middle
© 2015 Advance Education, Inc. All rights reserved unless otherwise granted by written agreement. Page 9
Kentucky Department of Education Stuart Middle
© 2015 Advance Education, Inc. All rights reserved unless otherwise granted by written agreement. Page 9
Kentucky Department of Education Stuart Middle
© 2015 Advance Education, Inc. All rights reserved unless otherwise granted by written agreement. Page 9

Effective Learning Environments Observation Tool (eleot™)Every learner should have access to an effective learning environment in which she/he has multiple
opportunities to be successful. The Effective Learning Environments Observation Tool (eleot™) measures the
extent to which learners are in an environment that is equitable, supportive, and well-managed. An
environment where high expectations are the norm and active learning takes place. It measures whether
learners' progress is monitored and feedback is provided and the extent to which technology is leveraged for
learning.
Observations of classrooms or other learning venues are conducted for a minimum of 20 minutes per
observation. Every member of the Diagnostic Review Team is required to be trained and pass a certification
exam that establishes inter-rater reliability. Team members conduct multiple observations during the review
process and provide ratings on 30 items based on a four-point scale (4=very evident; 3=evident; 2=somewhat
evident; and 1=not observed). The following provides the aggregate average score across multiple
observations for each of the seven learning environments included in eleot™.
The Diagnostic Review Team conducted observations in 29 core content classes on November 9 and 10,
2015. One core content teacher was absent on long-term medical leave and an observation was not
conducted in this classroom.
All seven Learning Environments received overall ratings of less than 2.0 on a 4.0 scale. Only four indicators
received ratings of greater than 2.0. One of these, A2, "Equal access to classroom discussions, activities,
eleot™ Results
Review
A. E
quita
ble
Lear
ning
B. H
igh
Expe
ctat
ions
C. S
uppo
rtive
Lea
rnin
g
D. A
ctiv
e Le
arni
ng
E. P
rogr
ess
Mon
itorin
g an
d
Feed
back
F. W
ell-M
anag
ed L
earn
ing
G. D
igita
l Lea
rnin
g
0.0
0.5
1.0
1.5
2.0
2.5
3.0
3.5
4.0
Per
form
ance
Lev
els
1.78 1.69 1.78 1.71 1.681.97
1.02
Document Generated On December 16, 2015
Kentucky Department of Education Stuart Middle
© 2015 Advance Education, Inc. All rights reserved unless otherwise granted by written agreement. Page 10
Kentucky Department of Education Stuart Middle
© 2015 Advance Education, Inc. All rights reserved unless otherwise granted by written agreement. Page 10
Kentucky Department of Education Stuart Middle
© 2015 Advance Education, Inc. All rights reserved unless otherwise granted by written agreement. Page 10
Kentucky Department of Education Stuart Middle
© 2015 Advance Education, Inc. All rights reserved unless otherwise granted by written agreement. Page 10

resources, technology, and support," suggests that teachers are striving to ensure that students have equal
access to instructional materials and to ask questions of the teacher. The other three indicators which
received ratings of 2.0 or greater related to student conduct were A3, "Knows that rules and consequences are
fair, clear, and consistently applied" and F1 "Speaks and interacts respectfully with teachers(s) and peers."
While these ratings are somewhat higher, other data such as observations in public areas, survey data,
interviews, etc., suggest that the management of student behavior is an ongoing concern at the school.
Observations reveal that effective learning environments exist in the school but only in a few classrooms which
is reflected in the relatively low percentages of "very evident" or "evident" for many indicators. The data
indicates that observers infrequently detected differentiated learning opportunities, the existence of high
academic expectations including challenging and rigorous coursework, and the use of questioning that
required students to use higher order thinking skills, high levels of student engagement, and the use of
technology.
The Team eleot average score for the Equitable Learning Environment was 1.78 on a 4.0 scale. Instances in
which students were provided "differentiated learning opportunities and activities to meet her/his needs," (A1)
were evident in 28 percent of classrooms. Observers did not detect any differentiated instructional activities in
55 percent of classrooms. These data validated the importance of the school decision earlier this year for all
teachers to participate in a book study addressing differentiation of instruction. Instances in which students
demonstrated that they knew that "rules and consequences are fair, clear and consistently applied" (A3) were
evident/very evident in 31 percent of classrooms. Observers frequently noted that students did not follow
established procedures or routines in many classrooms. It was obvious to the observers that these routines
had either not been taught or that teacher expectations were low or unclear concerning behavior.
The average overall score for the High Expectations Learning Environment was 1.69 on a 4.0 scale. Instances
in which observers detected that students knew and were striving "to meet the high expectations established
by the teacher" (B1) were evident/very evident in 28 percent of classrooms. Similarly, it was evident/very
evident in 31 percent of classrooms that students were being tasked with "activities and learning that are
challenging but attainable" (B2). Instances in which observers detected that students were engaged in
"rigorous coursework, discussions and/or tasks" (B4) were evident/very evident in 21 percent of classrooms. Of
particular concern to the Team was that evidence of academic rigor was not observed in 55 percent of
classrooms. Finally, instances in which students were "asked and responded to questions that require higher
order thinking (e.g., applying, evaluating, synthesizing)" (B5) were evident in 14 percent of classrooms. These
results stand in contrast to the school's stated vision and commitment to high expectations for all students.
The average overall score for the Supportive Learning Environment was 1.78 on a 4.0 scale. Instances in
which students were provided "support and assistance to understand content and accomplish tasks" (C4) were
evident/very evident in 31 percent of classrooms. Similarly, instances in which observers detected that
students were provided "additional or alternative instruction and feedback at the appropriate level of challenge
for her/his needs" (C5) were evident in 14 percent of classrooms. Observers noted that, with rare exception,
instruction was whole group and teacher centered. In a few instances, students were working in pairs but were
all completing the same low level tasks. Instances in which students demonstrated that they felt comfortable in
Document Generated On December 16, 2015
Kentucky Department of Education Stuart Middle
© 2015 Advance Education, Inc. All rights reserved unless otherwise granted by written agreement. Page 11
Kentucky Department of Education Stuart Middle
© 2015 Advance Education, Inc. All rights reserved unless otherwise granted by written agreement. Page 11
Kentucky Department of Education Stuart Middle
© 2015 Advance Education, Inc. All rights reserved unless otherwise granted by written agreement. Page 11
Kentucky Department of Education Stuart Middle
© 2015 Advance Education, Inc. All rights reserved unless otherwise granted by written agreement. Page 11

taking "risks in learning (without fear of negative feedback)" (C3) were evident/very evident in 17 percent of
classrooms. Observers noted that few questions asked by teachers were challenging and did not require
students to use higher order thinking skills.
The overall average score for the Active Learning Environment was 1.71 on a 4.0 scale. Instances in which
students were able to "make connections from content to real-life experiences" (D2) were evident/very evident
in only 7 percent of classrooms. Opportunities for students to solve problems, apply their learning, make
connections to other academic disciplines, discuss or share their perspectives with peers, etc. were very rare.
Similarly, instances in which observers were able to detect that students were "actively engaged in learning
activities" (D3) were evident in 14 percent of classrooms. Observers noted that while students had some
opportunities to engage in recall or comprehension discussions with the teacher, few opportunities were
afforded students to engage in discussions with each other. Instances in which students were expected to ask
questions, engage in cooperative group work, or complete an activity or task, etc. were rarely observed. Data
suggest that, to a very large extent, students were expected to learn by passively listening to the teacher.
The overall average score for the Progress Monitoring and Feedback Learning Environment was 1.68 on a 4.0
scale. Instances in which students were "asked and/or quizzed about individual progress/learning" (E1) were
evident/very evident in 17 percent of classrooms. Similarly, instances in which it was apparent that students
understood "how her/his work is assessed" (E4) were evident in 17 percent of classrooms. Observers noted
that formative assessment practices were infrequently observed, i.e., responding to probing questions from the
teacher, use of quizzes or exit slips. The Team seldom observed the use of exemplars or high quality student
work to communicate learning expectations or the use of rubrics or opportunities for students to revise work
based on teacher feedback.
The overall average score for the Well-Managed Learning Environment was 1.97 on a 4.0 scale, which was the
highest rated learning environment. Observers detected that students spoke and interacted "respectfully with
teachers(s) and peers" (F1) in 45 percent of classrooms. These respectful behaviors and dispositions were not
observed, however, in 34 percent of classrooms, which is of significant concern to the Team. Instances in
which students knew "classroom routines, behavioral expectations and consequences" (F5) were evident in 31
percent of classrooms. The Team did not regularly observe that students understood classroom routines such
as listening for directions, transitioning smoothly between class activities, waiting their turn to speak, raising
hands to ask questions or staying in their learning spaces, etc. Observers further noted that no indicators of the
Well-Managed Learning Environment were observed in about one third of classrooms.
The Team eleot average rating for the Digital Learning Environment was 1.02 on a 4.0 scale which was the
lowest rated environment. While other data and observations confirmed that technology was available in the
school for student use, observers very rarely detected students using technology as tools or resources for
learning.
Document Generated On December 16, 2015
Kentucky Department of Education Stuart Middle
© 2015 Advance Education, Inc. All rights reserved unless otherwise granted by written agreement. Page 12
Kentucky Department of Education Stuart Middle
© 2015 Advance Education, Inc. All rights reserved unless otherwise granted by written agreement. Page 12
Kentucky Department of Education Stuart Middle
© 2015 Advance Education, Inc. All rights reserved unless otherwise granted by written agreement. Page 12
Kentucky Department of Education Stuart Middle
© 2015 Advance Education, Inc. All rights reserved unless otherwise granted by written agreement. Page 12

eleot™ Data Summary
A. Equitable Learning %
Item Average Description
Ver
yE
vid
ent
Evi
den
t
So
mew
hat
Evi
den
t
No
tO
bse
rved
1. 1.72 Has differentiated learning opportunitiesand activities that meet her/his needs
0.00% 27.59% 17.24% 55.17%
2. 2.10 Has equal access to classroomdiscussions, activities, resources,technology, and support
6.90% 31.03% 27.59% 34.48%
3. 2.03 Knows that rules and consequences arefair, clear, and consistently applied
6.90% 24.14% 34.48% 34.48%
4. 1.24 Has ongoing opportunities to learnabout their own and other'sbackgrounds/cultures/differences
0.00% 0.00% 24.14% 75.86%
Overall rating on a 4 point scale: 1.78
B. High Expectations %
Item Average Description
Ver
yE
vid
ent
Evi
den
t
So
mew
hat
Evi
den
t
No
tO
bse
rved
1. 1.97 Knows and strives to meet the highexpectations established by the teacher
3.45% 24.14% 37.93% 34.48%
2. 1.79 Is tasked with activities and learning thatare challenging but attainable
0.00% 31.03% 17.24% 51.72%
3. 1.48 Is provided exemplars of high qualitywork
0.00% 6.90% 34.48% 58.62%
4. 1.69 Is engaged in rigorous coursework,discussions, and/or tasks
3.45% 17.24% 24.14% 55.17%
5. 1.52 Is asked and responds to questions thatrequire higher order thinking (e.g.,applying, evaluating, synthesizing)
0.00% 13.79% 24.14% 62.07%
Overall rating on a 4 point scale: 1.69
Document Generated On December 16, 2015
Kentucky Department of Education Stuart Middle
© 2015 Advance Education, Inc. All rights reserved unless otherwise granted by written agreement. Page 13
Kentucky Department of Education Stuart Middle
© 2015 Advance Education, Inc. All rights reserved unless otherwise granted by written agreement. Page 13
Kentucky Department of Education Stuart Middle
© 2015 Advance Education, Inc. All rights reserved unless otherwise granted by written agreement. Page 13
Kentucky Department of Education Stuart Middle
© 2015 Advance Education, Inc. All rights reserved unless otherwise granted by written agreement. Page 13

C. Supportive Learning %
Item Average Description
Ver
yE
vid
ent
Evi
den
t
So
mew
hat
Evi
den
t
No
tO
bse
rved
1. 1.93 Demonstrates or expresses thatlearning experiences are positive
3.45% 20.69% 41.38% 34.48%
2. 1.93 Demonstrates positive attitude about theclassroom and learning
0.00% 27.59% 37.93% 34.48%
3. 1.59 Takes risks in learning (without fear ofnegative feedback)
3.45% 13.79% 20.69% 62.07%
4. 1.93 Is provided support and assistance tounderstand content and accomplishtasks
3.45% 27.59% 27.59% 41.38%
5. 1.52 Is provided additional/alternativeinstruction and feedback at theappropriate level of challenge for her/hisneeds
0.00% 13.79% 24.14% 62.07%
Overall rating on a 4 point scale: 1.78
D. Active Learning %
Item Average Description
Ver
yE
vid
ent
Evi
den
t
So
mew
hat
Evi
den
t
No
tO
bse
rved
1. 1.86 Has several opportunities to engage indiscussions with teacher and otherstudents
6.90% 13.79% 37.93% 41.38%
2. 1.55 Makes connections from content to real-life experiences
3.45% 3.45% 37.93% 55.17%
3. 1.72 Is actively engaged in the learningactivities
0.00% 13.79% 44.83% 41.38%
Overall rating on a 4 point scale: 1.71
Document Generated On December 16, 2015
Kentucky Department of Education Stuart Middle
© 2015 Advance Education, Inc. All rights reserved unless otherwise granted by written agreement. Page 14
Kentucky Department of Education Stuart Middle
© 2015 Advance Education, Inc. All rights reserved unless otherwise granted by written agreement. Page 14
Kentucky Department of Education Stuart Middle
© 2015 Advance Education, Inc. All rights reserved unless otherwise granted by written agreement. Page 14
Kentucky Department of Education Stuart Middle
© 2015 Advance Education, Inc. All rights reserved unless otherwise granted by written agreement. Page 14

E. Progress Monitoring and Feedback %
Item Average Description
Ver
yE
vid
ent
Evi
den
t
So
mew
hat
Evi
den
t
No
tO
bse
rved
1. 1.72 Is asked and/or quizzed about individualprogress/learning
3.45% 13.79% 34.48% 48.28%
2. 1.66 Responds to teacher feedback toimprove understanding
3.45% 13.79% 27.59% 55.17%
3. 1.93 Demonstrates or verbalizesunderstanding of the lesson/content
3.45% 24.14% 34.48% 37.93%
4. 1.55 Understands how her/his work isassessed
0.00% 17.24% 20.69% 62.07%
5. 1.52 Has opportunities to revise/improvework based on feedback
3.45% 13.79% 13.79% 68.97%
Overall rating on a 4 point scale: 1.68
F. Well-Managed Learning %
Item Average DescriptionV
ery
Evi
den
t
Evi
den
t
So
mew
hat
Evi
den
t
No
tO
bse
rved
1. 2.14 Speaks and interacts respectfully withteacher(s) and peers
3.45% 41.38% 20.69% 34.48%
2. 2.10 Follows classroom rules and works wellwith others
3.45% 34.48% 31.03% 31.03%
3. 1.93 Transitions smoothly and efficiently toactivities
3.45% 24.14% 34.48% 37.93%
4. 1.72 Collaborates with other students duringstudent-centered activities
3.45% 20.69% 20.69% 55.17%
5. 1.97 Knows classroom routines, behavioralexpectations and consequences
0.00% 31.03% 34.48% 34.48%
Overall rating on a 4 point scale: 1.97
Document Generated On December 16, 2015
Kentucky Department of Education Stuart Middle
© 2015 Advance Education, Inc. All rights reserved unless otherwise granted by written agreement. Page 15
Kentucky Department of Education Stuart Middle
© 2015 Advance Education, Inc. All rights reserved unless otherwise granted by written agreement. Page 15
Kentucky Department of Education Stuart Middle
© 2015 Advance Education, Inc. All rights reserved unless otherwise granted by written agreement. Page 15
Kentucky Department of Education Stuart Middle
© 2015 Advance Education, Inc. All rights reserved unless otherwise granted by written agreement. Page 15

FindingsImprovement PriorityDevelop, implement and monitor a process to continuously and systematically use data to identify student
learning needs and to design instruction to meet those needs that results in improvement in student
achievement. Provide ongoing professional development to support the use of data to make instructional and
programmatic decisions. Monitor the implementation of professional learning to ensure it translates to effective
instructional practices thereby meeting the needs of students.
(Indicator 3.12)
Primary Indicator
Indicator 3.12
Evidence and Rationale
Student Performance Data:
Student performance data, as detailed in the attachment of this report, do not suggest that the school has been
effective in addressing the learning needs of a significant portion of the student population. Of particular
concern to the Team, the 2014-2015 school accountability scores for combined reading and math Gap Delivery
Targets for proficient and distinguished was 26 percent. Results indicate that the actual score was 18 percent
indicating that the school did not meet its target for combined reading and mathematics for its gap population.
The school also did not meet the Gap Delivery Targets for proficient/distinguished for the 2014-2015 school
year in the individual content areas of reading, mathematics, social studies and writing.
Classroom Observation Data:
G. Digital Learning %
Item Average Description
Ver
yE
vid
ent
Evi
den
t
So
mew
hat
Evi
den
t
No
tO
bse
rved
1. 1.07 Uses digital tools/technology to gather,evaluate, and/or use information forlearning
0.00% 3.45% 0.00% 96.55%
2. 1.00 Uses digital tools/technology to conductresearch, solve problems, and/or createoriginal works for learning
0.00% 0.00% 0.00% 100.00%
3. 1.00 Uses digital tools/technology tocommunicate and work collaborativelyfor learning
0.00% 0.00% 0.00% 100.00%
Overall rating on a 4 point scale: 1.02
Document Generated On December 16, 2015
Kentucky Department of Education Stuart Middle
© 2015 Advance Education, Inc. All rights reserved unless otherwise granted by written agreement. Page 16
Kentucky Department of Education Stuart Middle
© 2015 Advance Education, Inc. All rights reserved unless otherwise granted by written agreement. Page 16
Kentucky Department of Education Stuart Middle
© 2015 Advance Education, Inc. All rights reserved unless otherwise granted by written agreement. Page 16
Kentucky Department of Education Stuart Middle
© 2015 Advance Education, Inc. All rights reserved unless otherwise granted by written agreement. Page 16

Classroom observation data, as discussed in the Teaching and Learning Impact section of this report, did not
confirm that data are used to monitor and adjust instruction based on the learning needs of all students.
Instances in which students had differentiated learning opportunities and activities that met their needs, for
example, were evident/very evident in 28 percent of classrooms (A1). Furthermore, it was evident/very evident
in 14 percent of classrooms that teachers provided additional or alternative instruction and feedback to
students at the appropriate level of challenge (C5). Observers noted that nearly all instruction was whole group
which offered students little or no differentiated learning opportunities.
Stakeholder Survey Data:
Survey data is very mixed suggesting little agreement among stakeholders that effective policies, practices,
conditions, and culture ensure the use of differentiated instruction strategies to address student needs. For
example, 80 percent of staff indicated that they agreed/strongly agreed with the statement, “All teachers in our
school personalize instructional strategies and interventions to address individual learning needs of students.”
These results stand in contrast to the 58 percent of students who agreed/strongly agreed with the statement,
“All of my teachers change their teaching to meet my learning needs” suggesting that these highly effective
practices are not consistent across the school. Similarly, 58 percent of parents agreed/strongly agreed with
the statement, “All of my child's teachers meet his/her learning needs by individualizing instruction” suggesting
a significant percentage of the parents could not confirm these practices exist across the school.
Stakeholder Interviews:
Teacher generated common formative assessments were administered bi-weekly or weekly, depending on the
teacher. The quality of these assessments was monitored by the goal clarity coach. Interview data revealed
that common formative assessment data is not consistently used to identify the unique learning needs of
students. The school did, however, have some systems to target the needs of students displaying unique
learning needs. These systems include some Response to Intervention services. Many teachers, however,
could not articulate a school-wide process and criteria used to identify students who need Response to
Intervention services.
Documents and artifacts:
A review of documents and artifacts revealed that the school has developed a calendar for embedded
professional development that occurs during Professional Learning Community meetings. The Team found
additional professional development PowerPoint slides and meeting agendas that addressed individualized
instruction. Other data and information including classroom observations do not suggest that these
professional development activities have resulted in any improvement in professional practice or student
achievement. The school provided minimal documentation that illustrated teachers use data to systematically
identify and adjust instruction as a means to target the unique learning needs of all students.
Improvement PriorityFurther refine policies, practices and conditions that ensure a formal structure (i.e., homeroom, advisory
Document Generated On December 16, 2015
Kentucky Department of Education Stuart Middle
© 2015 Advance Education, Inc. All rights reserved unless otherwise granted by written agreement. Page 17
Kentucky Department of Education Stuart Middle
© 2015 Advance Education, Inc. All rights reserved unless otherwise granted by written agreement. Page 17
Kentucky Department of Education Stuart Middle
© 2015 Advance Education, Inc. All rights reserved unless otherwise granted by written agreement. Page 17
Kentucky Department of Education Stuart Middle
© 2015 Advance Education, Inc. All rights reserved unless otherwise granted by written agreement. Page 17

period, etc.) exists which ensures that each student is well known by at least one adult advocate. Further
ensure that the structure also focuses on school personnel building positive relationships with students to gain
insight into their needs regarding learning, thinking and life skills.
(Indicator 3.9)
Primary Indicator
Indicator 3.9
Evidence and Rationale
Stakeholder Survey Data:
Survey data is very mixed and suggests little agreement among all three stakeholder groups with regard to the
existence of an effective program that ensures each student is well known by at least one adult advocate.
Eighty-six percent of staff indicated in surveys that they agreed/strongly agreed with the statement, “In our
school, a formal structure exists so that each student is well known by at least one adult advocate in the school
who supports that student’s educational experience.” On the other hand, 61 percent of students surveyed
agreed/strongly agreed with the statement “My school makes sure there is at least one adult who knows me
well and shows interest in my education and future” suggesting that nearly 40 percent of students cannot
confirm this practice exists across the school. Similarly, 61 percent of parents indicated that they
agreed/strongly agreed that their child had at least one adult advocate in the school. The Team was
particularly concerned about survey data regarding “respect” in the school. Fifty-one percent of students
surveyed agreed/strongly agreed with the statement “In my school, all students are treated with respect”
suggesting that nearly half disagreed or are ambivalent as to the existence of these conditions. Similarly, 37
percent of students surveyed agreed/strongly agreed with the statement, “In my school students treat adults
with respect.” Open responses in the student survey noted several instances of bullying and negative behavior
towards other students and teachers.
Stakeholder Interviews:
Interview data revealed that teachers, students, parents and administrators could not consistently articulate a
process to ensure that all students have at least one adult who advocated for their educational experience.
Some teachers noted that their first period class was used to build connections with students; however, one
teacher stated that “This year homeroom is only ten minutes compared to the past year’s longer homeroom
time, and that no intentional purpose to build positive relationships with students is possible this year.”
Documents and artifacts:
Review of teacher contact logs, student advocacy and support programs, student behavior Response to
Intervention, Tell Survey data, Math, Science and Technology Night Survey results, Embedded Professional
Development Survey findings, Comprehensive Student Survey data and the new Teacher Professional
Learning Community Survey results, among other artifacts did not reveal evidence that school personnel are
building long-term, positive relationships with students. Evidence did not reveal that the existing “formal
Document Generated On December 16, 2015
Kentucky Department of Education Stuart Middle
© 2015 Advance Education, Inc. All rights reserved unless otherwise granted by written agreement. Page 18
Kentucky Department of Education Stuart Middle
© 2015 Advance Education, Inc. All rights reserved unless otherwise granted by written agreement. Page 18
Kentucky Department of Education Stuart Middle
© 2015 Advance Education, Inc. All rights reserved unless otherwise granted by written agreement. Page 18
Kentucky Department of Education Stuart Middle
© 2015 Advance Education, Inc. All rights reserved unless otherwise granted by written agreement. Page 18

structure” ensured that students had an adult who advocated for their needs regarding learning, thinking and
life skills.
Improvement PriorityPart A. Coach teachers in and monitor the use of instructional strategies that ensure instruction is effective,
student centered, highly engaging and aligned to learning expectations.
Engaging instructional strategies would include: 1) student collaboration, 2) self-reflection, 3) development of
critical thinking skills, 4) application of content knowledge and skills, 5) integration of content knowledge and
skills with other disciplines, 6) use of technology as instructional resources and learning tools.
Part B. Ensure that on-task behavior and appropriate classroom management strategies are used to create a
safe learning environment that fosters high levels of student engagement designed to meet individual needs
and improve student achievement.
(Indicator 3.3)
Primary Indicator
Indicator 3.3
Evidence and Rationale
Student Performance Data:
Student performance data, as detailed in the attachments of this report, show that KPREP assessment results
are stagnant or have declined between 2013 and 2015 with the exception of 6th grade reading. In addition,
student performance is consistently well below state averages. For example, 21.6 percent of Stuart 8th graders
performed at the proficient or distinguished level in reading on the 2014-15 assessment as compared to 54.1
percent of 8th graders state-wide. Data suggested that the school has not been effective in consistently
providing instruction that ensures achievement of learning expectations through the use of differentiation and
interventions to address the wide ranging learning needs of all students. Of particular concern to the Diagnostic
Review Team was that on the 2014-2015 KPREP, only 16 percent of sixth grade students, 14 percent of
seventh grade students and 12 percent of eighth grade students performed at the distinguished or proficient
levels in mathematics.
Classroom Observation Data:
Classroom observation data, as detailed in the Teaching and Learning Impact section of this report, suggested
that teachers are not consistently and effectively using differentiated instructional strategies. Further, these
data also revealed that it was evident/very evident in only 14 percent of classrooms that students respond to
questions that required higher order thinking (e.g., applying, evaluating, synthesizing) (B5). In 20.69 percent of
classrooms, it was evident/very evident that students were engaged in rigorous coursework, discussions
and/or tasks (B4). Instances of students being actively engaged in their learning activities (D3) were
evident/very evident in just 14 percent of classrooms. Observers noted with regularity that students were off-
Document Generated On December 16, 2015
Kentucky Department of Education Stuart Middle
© 2015 Advance Education, Inc. All rights reserved unless otherwise granted by written agreement. Page 19
Kentucky Department of Education Stuart Middle
© 2015 Advance Education, Inc. All rights reserved unless otherwise granted by written agreement. Page 19
Kentucky Department of Education Stuart Middle
© 2015 Advance Education, Inc. All rights reserved unless otherwise granted by written agreement. Page 19
Kentucky Department of Education Stuart Middle
© 2015 Advance Education, Inc. All rights reserved unless otherwise granted by written agreement. Page 19

task during instructional time, which led to classroom disruptions that created barriers to student learning. In
some instances, student misbehavior issues interfered with the planned instruction for the entire class. In a few
classrooms, observers noted students using profanity directed at teachers and other students and showing
blatant disrespect for teachers as they attempted to control the class. The Team also noted student behavior in
hallways during class change time was frequently unsafe (i.e., running, pushing, use of profanity, disregard to
teachers’ instructions, etc.).
Stakeholder Survey Data:
Stakeholder survey data revealed mixed results related to the systematic use of effective instructional practices
suggesting that systems and processes that support high levels of student engagement have not been
consistently implemented. Seventy-eight percent of staff, for example, indicated that they agreed/strongly
agreed with the statement, “All teachers in our school regularly use instructional strategies that require student
collaboration, self-reflection, and development of critical thinking skills.” On the other hand, 62 percent of
parents agreed/strongly agreed with the statement, “All of my child’s teachers use a variety of teaching
strategies and learning activities.” Likewise, 58 percent of parents agreed/strongly agreed with the statement,
“All of my child’s teachers meet his/her learning needs by individualizing instruction.” Finally, 73 percent of
students indicated that they agreed/strongly agreed with the statement, “All of my teachers use a variety of
teaching methods and learning activities to help me develop the skills I will need to succeed” suggesting that
over one fourth cannot confirm the existence of these practices across the school.
Stakeholder Interviews:
Stakeholder interview data revealed that teachers and administrators consistently articulated that classroom
differentiation is a focus for both school and district level professional development activities. On Thursdays
during job-embedded professional development, teachers and staff are studying the book, “The Differentiated
Classroom.” Teachers, however, could not articulate a systematic process for transferring professional
learning from these sessions to their instructional practices. While administrators and teachers referenced
specific required components of lesson plans (e.g., opener, daily target, instructional strategy, exit strategy),
personalized instruction did not emerge as a focus. Administrator interview data revealed that monitoring the
impact of professional development was managed to some extent through professional learning communities.
The Team, however, noted that the degree to which transference of professional learning to teacher practices
was minimal based on school and classroom observations. In addition, students reported that disruptive
behaviors in some classrooms prevented them from participating in instructional activities and learning. One
student said, “Some [classmates] try to listen while others are screaming, yelling jokes across the room,
running…Teachers try to stop them, but the students will not stop.”
Documents and artifacts:
While the review of meeting agendas, job-embedded professional development calendars, PowerPoint
presentations, and Common Formative Assessment Reflection Sheets verified that professional development
activities occurred, these documents did not reveal the existence of a consistent focus on instructional
Document Generated On December 16, 2015
Kentucky Department of Education Stuart Middle
© 2015 Advance Education, Inc. All rights reserved unless otherwise granted by written agreement. Page 20
Kentucky Department of Education Stuart Middle
© 2015 Advance Education, Inc. All rights reserved unless otherwise granted by written agreement. Page 20
Kentucky Department of Education Stuart Middle
© 2015 Advance Education, Inc. All rights reserved unless otherwise granted by written agreement. Page 20
Kentucky Department of Education Stuart Middle
© 2015 Advance Education, Inc. All rights reserved unless otherwise granted by written agreement. Page 20

strategies (e.g., use of technology as a learning tool, integrating content and skills from other disciplines,
personalized instruction, student groupings) to improve student engagement. The 2014-2015 Stuart Middle
School Professional Development Survey results indicate that classroom management and student
engagement ranked as the top two concerns for teachers in 2015-2016.
Document Generated On December 16, 2015
Kentucky Department of Education Stuart Middle
© 2015 Advance Education, Inc. All rights reserved unless otherwise granted by written agreement. Page 21
Kentucky Department of Education Stuart Middle
© 2015 Advance Education, Inc. All rights reserved unless otherwise granted by written agreement. Page 21
Kentucky Department of Education Stuart Middle
© 2015 Advance Education, Inc. All rights reserved unless otherwise granted by written agreement. Page 21
Kentucky Department of Education Stuart Middle
© 2015 Advance Education, Inc. All rights reserved unless otherwise granted by written agreement. Page 21

Leadership CapacityThe capacity of leadership to ensure an institution's progress towards its stated objectives is an essential
element of organizational effectiveness. An institution's leadership capacity includes the fidelity and
commitment to its institutional purpose and direction, the effectiveness of governance and leadership to enable
the institution to realize its stated objectives, the ability to engage and involve stakeholders in meaningful and
productive ways, and the capacity to enact strategies to improve results of student learning.
Purpose and direction are critical to successful institutions. A study conducted in 2010 by the London-based
Chartered Institute of Personnel and Development (CIPD) reported that "in addition to improving performance,
the research indicates that having a sense of shared purpose also improves employee engagement" and that
"lack of understanding around purpose can lead to demotivation and emotional detachment, which in turn lead
to a disengaged and dissatisfied workforce."
AdvancED has found through its evaluation of best practices in more than 32,000 institutions around the world
that a successful institution commits to a shared purpose and direction and establishes expectations for
student learning that are aligned with the institutions' vision and supported by internal and external
stakeholders. These expectations serve as the focus for assessing student performance and overall institution
effectiveness.
Governance and leadership are key factors in raising institutional quality. Leaders, both local administrators
and governing boards/authorities, are responsible for ensuring all learners achieve while also managing many
other facets of an institution. Institutions that function effectively do so without tension between the governing
board/authority, administrators, and educators and have established relationships of mutual respect and a
shared vision (Feuerstein & Opfer, 1998). In a meta-analysis of educational institution leadership research,
Leithwood and Sun (2012) found that leaders (school and governing boards/authority) can significantly
"influence school conditions through their achievement of a shared vision and agreed-on goals for the
organization, their high expectations and support of organizational members, and their practices that
strengthen school culture and foster collaboration within the organization." With the increasing demands of
accountability placed on institutional leaders, leaders who empower others need considerable autonomy and
involve their communities to attain continuous improvement goals. Leaders who engage in such practices
experience a greater level of success (Fink & Brayman, 2006). Similarly, governing boards/authorities that
focus on policy-making are more likely to allow institutional leaders the autonomy to make decisions that
impact teachers and students and are less responsive to politicization than boards/authorities that respond to
vocal citizens (Greene, 1992).
AdvancED's experience, gained through evaluation of best practices, has indicated that a successful institution
has leaders who are advocates for the institution's vision and improvement efforts. The leaders provide
direction and allocate resources to implement curricular and co-curricular programs that enable students to
achieve expectations for their learning. Leaders encourage collaboration and shared responsibility for school
improvement among stakeholders. The institution's policies, procedures, and organizational conditions ensure
equity of learning opportunities and support for innovation.
Document Generated On December 16, 2015
Kentucky Department of Education Stuart Middle
© 2015 Advance Education, Inc. All rights reserved unless otherwise granted by written agreement. Page 22
Kentucky Department of Education Stuart Middle
© 2015 Advance Education, Inc. All rights reserved unless otherwise granted by written agreement. Page 22
Kentucky Department of Education Stuart Middle
© 2015 Advance Education, Inc. All rights reserved unless otherwise granted by written agreement. Page 22
Kentucky Department of Education Stuart Middle
© 2015 Advance Education, Inc. All rights reserved unless otherwise granted by written agreement. Page 22

Standard 1 - Purpose and DirectionThe school maintains and communicates a purpose and direction that commit to high expectations for learning
as well as shared values and beliefs about teaching and learning.
Standard 2 - Governance and LeadershipThe school operates under governance and leadership that promote and support student performance and
school effectiveness.
Stakeholder Feedback DiagnosticStakeholder Feedback is the third of three primary areas of evaluation in AdvancED's Performance
Accreditation model. The AdvancED surveys (student, parent, and teacher) are directly correlated to the
AdvancED Standards and indicators. They provide not only direct information about stakeholder satisfaction
but also become a source of data for triangulation by the External Review Team as it evaluates indicators.
Indicator Description Review TeamScore
1.1 The school engages in a systematic, inclusive, and comprehensive process toreview, revise, and communicate a school purpose for student success.
1.86
1.2 The school's leadership and staff commit to a culture that is based on sharedvalues and beliefs about teaching and learning and supports challenging,equitable educational programs and learning experiences for all students thatinclude achievement of learning, thinking, and life skills.
1.86
1.3 The school's leadership implements a continuous improvement process thatprovides clear direction for improving conditions that support student learning.
1.29
Indicator Description Review TeamScore
2.1 The governing body establishes policies and supports practices that ensureeffective administration of the school.
2.00
2.2 The governing body operates responsibly and functions effectively. 2.00
2.3 The governing body ensures that the school leadership has the autonomy tomeet goals for achievement and instruction and to manage day-to-dayoperations effectively.
1.86
2.4 Leadership and staff foster a culture consistent with the school's purpose anddirection.
2.00
2.5 Leadership engages stakeholders effectively in support of the school's purposeand direction.
1.86
2.6 Leadership and staff supervision and evaluation processes result in improvedprofessional practice and student success.
1.43
Document Generated On December 16, 2015
Kentucky Department of Education Stuart Middle
© 2015 Advance Education, Inc. All rights reserved unless otherwise granted by written agreement. Page 23
Kentucky Department of Education Stuart Middle
© 2015 Advance Education, Inc. All rights reserved unless otherwise granted by written agreement. Page 23
Kentucky Department of Education Stuart Middle
© 2015 Advance Education, Inc. All rights reserved unless otherwise granted by written agreement. Page 23
Kentucky Department of Education Stuart Middle
© 2015 Advance Education, Inc. All rights reserved unless otherwise granted by written agreement. Page 23

Institutions are asked to collect and analyze stakeholder feedback data, then submit the data and the analyses
to the External Review Team for review. The External Review Team evaluates the quality of the administration
of the surveys by institution, survey results, and the degree to which the institution analyzed and acted on the
results.
FindingsImprovement PriorityCreate, implement and monitor for fidelity a clear, continuous, collaborative and goal-oriented school
improvement planning process that results in measurable improvement in academic achievement.
(Indicator 1.3)
Primary Indicator
Indicator 1.3
Evidence and Rationale
Student Performance Data:
Student performance trend data, as detailed in an attachment to this report, do not suggest that the school has
established effective policies, practices and culture for the implementation of continuous improvement
processes that consistently yield higher levels of student achievement. Data show a downward trend in overall
academic performance. Scores are consistently and dramatically lower than the state average in all tested
areas. Kentucky Performance Rating for Educational Progress (KPREP) data from the 2014-2015 school year
indicated lower student performance than the previous year. Little evidence to demonstrate improved student
learning and academic achievement from recent assessment data at the school level was evident.
Classroom Observation Data:
Classroom observation data, as detailed in the Teaching and Learning Impact section of this report, do not
suggest that the school’s improvement planning initiatives have been effective in improving professional
practice across the school, i.e., use of differentiated instruction practices, effective classroom management,
and communication of learning expectations. Classroom observation data revealed that overall ratings within
all learning environments are less than 2.0 on a 4.0 scale.
Stakeholder Survey Data:
Evaluative Criteria Review TeamScore
Questionnaire Administration 3.29
Stakeholder Feedback Results and Analysis 2.57
Document Generated On December 16, 2015
Kentucky Department of Education Stuart Middle
© 2015 Advance Education, Inc. All rights reserved unless otherwise granted by written agreement. Page 24
Kentucky Department of Education Stuart Middle
© 2015 Advance Education, Inc. All rights reserved unless otherwise granted by written agreement. Page 24
Kentucky Department of Education Stuart Middle
© 2015 Advance Education, Inc. All rights reserved unless otherwise granted by written agreement. Page 24
Kentucky Department of Education Stuart Middle
© 2015 Advance Education, Inc. All rights reserved unless otherwise granted by written agreement. Page 24

Survey data is mixed and do not suggest improvement planning processes are systematically implemented
across the school. Ninety-two percent of staff indicated that they agreed/strongly agreed with the statement,
“Our school has a systematic process for collecting, analyzing, and using data.” This contrasts somewhat to
parent surveys which revealed that 68 percent agreed/strongly agreed with the statement, “Our school has
established goals and a plan for improving student learning.” Ninety percent of staff indicated that they
agreed/strongly agreed with the statement, “Our school uses data to monitor student readiness and success at
the next level.” This contrasts to parent surveys which revealed that 66 percent indicated they agreed/strongly
agreed with the statement, “My child is prepared for success in the next school year.” Survey data indicated 57
percent of students agreed/strongly agreed that teachers “change teaching to meet their learning needs” which
suggests the use of data to guide instructional decision-making may be limited.
Stakeholder Interviews:
Interview data indicated that school improvement relies heavily on professional development. Teachers
recalled previous professional learning topics but were unclear how the learning impacted their instruction
and/or caused improvement in student learning. Teachers also reported that there were a great deal of
committee, faculty, other meetings and paperwork associated with attending professional development and
implementing learning, but most teachers were unable to connect these activities with improving student
learning.
Documents and artifacts:
The school improvement plan identified a section called “big rock #3” that was about improving parent
involvement. According to interview data, teachers reported that parent involvement and communication need
to be improved. In addition, teachers noted that at the beginning of the school year homeroom teachers called
parents, but those calls have decreased as the year has progressed. Little evidence was found to indicate that
a communication tool called Remind has been regularly used to communicate with parents.
Improvement PriorityDevelop, implement and monitor supervision and evaluation processes to ensure that they are improving
professional practice and increasing student achievement.
(Indicator 2.6)
Primary Indicator
Indicator 2.6
Evidence and Rationale
Student Performance Data:
KPREP student performance data, as detailed in an attachment to this report, do not suggest that the school
has developed effective supervision and evaluation processes that are resulting in improvement in student
Document Generated On December 16, 2015
Kentucky Department of Education Stuart Middle
© 2015 Advance Education, Inc. All rights reserved unless otherwise granted by written agreement. Page 25
Kentucky Department of Education Stuart Middle
© 2015 Advance Education, Inc. All rights reserved unless otherwise granted by written agreement. Page 25
Kentucky Department of Education Stuart Middle
© 2015 Advance Education, Inc. All rights reserved unless otherwise granted by written agreement. Page 25
Kentucky Department of Education Stuart Middle
© 2015 Advance Education, Inc. All rights reserved unless otherwise granted by written agreement. Page 25

performance. Performance data reveal that while results from sixth grade reading assessment show an upward
trend, eighth grade scores in all assessed areas show a significant decrease, and all assessed areas in grades
six through eight are significantly below state averages. Writing scores also have declined. Data also revealed
that the school did not meet its delivery targets for proficiency and gap or its Annual Measureable Objectives.
Classroom Observation Data:
Classroom observation data, as detailed previously in this report, do not suggest that supervision and
evaluation processes have been effective in ensuring that all students are provided equitable and challenging
learning experiences leading to next level success. Observation data reveal widely varying levels of
instructional effectiveness across the school. All Learning Environments were rated below 2.0 on a 4.0 scale.
Observers very infrequently detected the use of research aligned instructional practices such as 1)
differentiated instruction, 2) existence of high academic expectations, 3) appropriate levels of rigor and
challenge, 4) active and authentic student engagement in learning, 5) use of formative assessment practices,
and 6) opportunities for students to use technology as learning resources and tools.
Stakeholder Survey Data:
Survey data suggest that the staff is well satisfied with existing supervision and evaluation procedures. For
example, 95 percent of staff indicated that they agreed/strongly agreed with the statement, “Our school’s
leaders regularly evaluate staff members on criteria designed to improve teaching and learning.” Further, 84
percent of staff indicated that they agreed/strongly agreed with the statement, “Our school leaders hold all staff
members accountable for student learning.” This data contrasts to some student and parent perceptions
regarding school effectiveness. For example, 73 percent of students indicated that they agreed/strongly
agreed with the statement, “All of my teachers use a variety of teaching methods and learning activities to help
me develop the skills I will need to succeed.” Seventy-four percent of students indicated that they
agreed/strongly agreed with the statement, “My school provides me with challenging curriculum and learning
experiences.” Similarly, 65 percent of parents indicated that they agreed/strongly agreed with the statement,
“All of my child’s teachers provide an equitable curriculum to meet his/her learning needs.” Sixty-one percent of
parents indicated that they agreed/strongly agreed with the statement, “All of my child’s teacher give work that
challenges my child.”
Stakeholder Interviews:
Stakeholder interviews revealed that staff input was intentionally solicited and resulted in a focus on
differentiated instruction and student learning task. The Team found little evidence to indicate that supervision,
evaluation, monitoring and feedback have positively impacted the instructional program related to using
differentiated instructional strategies. Some evidence indicated that school leaders provided written feedback
to teachers to improve professional practices; however, this feedback has not resulted in effective instructional
practices or increased student learning. Moreover, interview data highlighted inconsistencies in monitoring of
and follow up for teacher instructional practices. Teacher comments in the interview also indicated a lack of
focus on improving teacher effectiveness and student learning.
Document Generated On December 16, 2015
Kentucky Department of Education Stuart Middle
© 2015 Advance Education, Inc. All rights reserved unless otherwise granted by written agreement. Page 26
Kentucky Department of Education Stuart Middle
© 2015 Advance Education, Inc. All rights reserved unless otherwise granted by written agreement. Page 26
Kentucky Department of Education Stuart Middle
© 2015 Advance Education, Inc. All rights reserved unless otherwise granted by written agreement. Page 26
Kentucky Department of Education Stuart Middle
© 2015 Advance Education, Inc. All rights reserved unless otherwise granted by written agreement. Page 26

Documents and artifacts:
Reviews of feedback from administration, walk-through data, professional learning community meeting minutes
and other artifacts revealed that the supervision and evaluation process have not significantly and positively
impacted improvement in professional practices.
Document Generated On December 16, 2015
Kentucky Department of Education Stuart Middle
© 2015 Advance Education, Inc. All rights reserved unless otherwise granted by written agreement. Page 27
Kentucky Department of Education Stuart Middle
© 2015 Advance Education, Inc. All rights reserved unless otherwise granted by written agreement. Page 27
Kentucky Department of Education Stuart Middle
© 2015 Advance Education, Inc. All rights reserved unless otherwise granted by written agreement. Page 27
Kentucky Department of Education Stuart Middle
© 2015 Advance Education, Inc. All rights reserved unless otherwise granted by written agreement. Page 27

Resource UtilizationThe use and distribution of resources must be aligned and supportive of the needs of an institution and the
students served. Institutions must ensure that resources are aligned with the stated mission and are distributed
equitably so that the needs of students are adequately and effectively addressed. The utilization of resources
includes an examination of the allocation and use of resources, the equity of resource distribution to need, the
ability of the institution to ensure appropriate levels of funding and sustainability of resources, as well as
evidence of long-range capital and resource planning effectiveness.
Institutions, regardless of their size, need access to sufficient resources and systems of support to be able to
engage in sustained and meaningful efforts that result in a continuous improvement cycle. Indeed, a study
conducted by the Southwest Educational Development Laboratory (Pan, D., Rudo, Z., Schneider, C., & Smith-
Hansen, L., 2003) "demonstrated a strong relationship between resources and student success... both the
level of resources and their explicit allocation seem to affect educational outcomes."
AdvancED has found through its own evaluation of best practices in the more than 32,000 institutions in the
AdvancED Network that a successful institution has sufficient human, material, and fiscal resources to
implement a curriculum that enables students to achieve expectations for student learning, meets special
needs, and complies with applicable regulations. The institution employs and allocates staff members who are
well qualified for their assignments. The institution provides a safe learning environment for students and staff.
The institution provides ongoing learning opportunities for all staff members to improve their effectiveness and
ensures compliance with applicable governmental regulations.
Standard 4 - Resources and Support SystemsThe school has resources and provides services that support its purpose and direction to ensure success for
all students.
Indicator Description Review TeamScore
4.1 Qualified professional and support staff are sufficient in number to fulfill theirroles and responsibilities necessary to support the school's purpose, direction,and the educational program.
2.57
4.2 Instructional time, material resources, and fiscal resources are sufficient tosupport the purpose and direction of the school.
2.00
4.3 The school maintains facilities, services, and equipment to provide a safe, clean,and healthy environment for all students and staff.
2.14
4.4 Students and school personnel use a range of media and information resourcesto support the school's educational programs.
2.00
4.5 The technology infrastructure supports the school's teaching, learning, andoperational needs.
1.43
4.6 The school provides support services to meet the physical, social, and emotionalneeds of the student population being served.
1.71
Document Generated On December 16, 2015
Kentucky Department of Education Stuart Middle
© 2015 Advance Education, Inc. All rights reserved unless otherwise granted by written agreement. Page 28
Kentucky Department of Education Stuart Middle
© 2015 Advance Education, Inc. All rights reserved unless otherwise granted by written agreement. Page 28
Kentucky Department of Education Stuart Middle
© 2015 Advance Education, Inc. All rights reserved unless otherwise granted by written agreement. Page 28
Kentucky Department of Education Stuart Middle
© 2015 Advance Education, Inc. All rights reserved unless otherwise granted by written agreement. Page 28

FindingsImprovement PriorityEnsure the technology infrastructure is fully functional and meets the needs of all stakeholders. Develop and
administer a needs assessment to ascertain information about the use of technology by all stakeholders.
Develop, implement and monitor a technology plan that helps to make students active participants in their
learning and addresses the professional learning needs of teachers.
(Indicator 4.4, Indicator 4.5)
Primary Indicator
Indicator 4.5
Evidence and Rationale
Classroom Observation Data:
Classroom observation data, as discussed in the Teaching and Learning Impact section of this report, suggest
that technology is not being utilized as an instructional tool or resource in the school. The Digital Learning
Environment was the lowest rated receiving an overall score of 1.02 on a 4.0 scale suggesting that technology
is very seldom used by students.
Stakeholder Survey Data:
Stakeholder survey data suggest that all three stakeholder groups hold unfavorable perceptions regarding the
use of technology across the school. For example, 71 percent of staff agreed/strongly agreed that the “School
provides a plan for the acquisition and support of technology to support student learning.” Sixty-eight percent
of students agreed/strongly agreed that “In my school, computers are up-to-date and used by teachers to help
me learn.” And, 67 percent of students agreed/strongly agreed with the statement, “In my school, a variety of
resources are available to help me succeed.”
Stakeholder Interviews:
Interview data revealed that teachers have not consistently put technology in the hands of students. Though
many teachers indicated that they had classroom sets of clicker (automated response) systems, observers did
not see these devices being used, and teachers rarely mentioned how these were used to enhance student
learning. Many teachers also stated that they had a limited number of computers available for use in their
classrooms. Most teachers noted that the computers were seldom used. Although the principal shared that a
set of iPads was available for check out and use, teachers did not reference these devices. Students reported
in interviews that they occasionally were able to use the SMART Board in the classroom; however, they noted
Indicator Description Review TeamScore
4.7 The school provides services that support the counseling, assessment, referral,educational, and career planning needs of all students.
1.86
Document Generated On December 16, 2015
Kentucky Department of Education Stuart Middle
© 2015 Advance Education, Inc. All rights reserved unless otherwise granted by written agreement. Page 29
Kentucky Department of Education Stuart Middle
© 2015 Advance Education, Inc. All rights reserved unless otherwise granted by written agreement. Page 29
Kentucky Department of Education Stuart Middle
© 2015 Advance Education, Inc. All rights reserved unless otherwise granted by written agreement. Page 29
Kentucky Department of Education Stuart Middle
© 2015 Advance Education, Inc. All rights reserved unless otherwise granted by written agreement. Page 29

that the primary use of this technology was for teachers to display information.
Documents and artifacts:
A review of documents and artifacts provided to the Diagnostic Review team indicated that some types of
technology are available for teachers, including computer labs for related arts classes, an iPad cart, SMART
Boards, projectors and document cameras. Though this technology exists, the school-wide technology plan
does not describe a fully functional technology infrastructure. Furthermore, there was no evidence that the
school conducted a needs assessment to support the teaching, learning, and operational needs related to the
use of technology throughout the school. Although the school has a technology coordinator who is responsible
for administering the 21st Century Skills Assessment, inventorying software and computers, and developing
procedures for reporting and addressing technology issues, little evidence was found that indicated how the
school coordinated services (e.g., assistance) to teachers and students using technology.
Document Generated On December 16, 2015
Kentucky Department of Education Stuart Middle
© 2015 Advance Education, Inc. All rights reserved unless otherwise granted by written agreement. Page 30
Kentucky Department of Education Stuart Middle
© 2015 Advance Education, Inc. All rights reserved unless otherwise granted by written agreement. Page 30
Kentucky Department of Education Stuart Middle
© 2015 Advance Education, Inc. All rights reserved unless otherwise granted by written agreement. Page 30
Kentucky Department of Education Stuart Middle
© 2015 Advance Education, Inc. All rights reserved unless otherwise granted by written agreement. Page 30

ConclusionThere were several areas of strength noted by the Team. Evidence suggested that Stuart Middle School
teachers had begun to work collaboratively to review data, make informed instructional decisions and plan
improvement efforts. Meetings involving various faculty groups were held weekly to focus discussions on
student academic improvement. The Team noted that teachers had been given an additional planning period
daily to address the learning needs of the school and have completed a book study addressing differentiated
instruction models. Teacher interviews and examination of meeting minutes verified the meeting agendas and
direction of topics discussed during the meetings.
There was also evidence that the administration had created an instructional monitoring process to include
unannounced teacher classroom walkthroughs and follow-up post conferences. Meeting agendas and minutes
as well as survey and interview data indicated that Professional Learning Communities have recently been
established at the school.
Stuart Middle School staff members have received abundant training, resources and support from district and
state personnel over a multi-year period. These resources include professional development and coaching
from Solution Tree, a school improvement grant, spacious and inviting facilities, highly qualified teachers in
every core class, technology coordinator support position, additional instructional support personnel and
teaching, learning and curriculum support from the Kentucky Department of Education.
Although Stuart Middle School has received abundant training, resources and support from both the district
and the Kentucky Department of Education over a multi-year period, limited evidence exists of systemic
continuous improvements. Further, artifacts and documents revealed a lack of parental involvement in
decision making and planning. The Diagnostic Review Team's observation data raised concern about the
school's climate for learning (e.g., student behavior, student performance). Interviews and survey data also
suggested that the school leadership team has not been effective in ensuring the implementation of effective
instructional strategies. Moreover, professional development opportunities have been ineffective in improving
classroom instruction and have had little to no impact on student academic performance.
As detailed in the attachments to this report, student performance data do not suggest that current
improvement strategies have been effective in increasing student achievement. Stuart Middle School has
attempted to improve the classroom learning environment and student performance by adding job-embedded
professional development opportunities. The focus of these trainings was to learn to differentiate instruction,
create common formative assessments and use professional learning communities to provide a platform to
discuss student achievement data, curriculum, instruction and assessment. The Team, however, found little
evidence of professional development positively impacting classroom practices or student achievement. As a
result of the aforementioned findings, the Team recommends that school leaders and staff implement
improvement initiatives focusing on a results-driven process as opposed to the current compliance-driven
environment.
Document Generated On December 16, 2015
Kentucky Department of Education Stuart Middle
© 2015 Advance Education, Inc. All rights reserved unless otherwise granted by written agreement. Page 31
Kentucky Department of Education Stuart Middle
© 2015 Advance Education, Inc. All rights reserved unless otherwise granted by written agreement. Page 31
Kentucky Department of Education Stuart Middle
© 2015 Advance Education, Inc. All rights reserved unless otherwise granted by written agreement. Page 31
Kentucky Department of Education Stuart Middle
© 2015 Advance Education, Inc. All rights reserved unless otherwise granted by written agreement. Page 31
Kentucky Department of Education Stuart Middle
© 2015 Advance Education, Inc. All rights reserved unless otherwise granted by written agreement. Page 31

-
-
-
-
-
-
Improvement PrioritiesThe institution should use the findings from this review to guide the continuous improvement process. The
institution must address the Improvement Priorities listed below:
Create, implement and monitor for fidelity a clear, continuous, collaborative and goal-oriented school
improvement planning process that results in measurable improvement in academic achievement.
Develop, implement and monitor a process to continuously and systematically use data to identify
student learning needs and to design instruction to meet those needs that results in improvement in
student achievement. Provide ongoing professional development to support the use of data to make
instructional and programmatic decisions. Monitor the implementation of professional learning to ensure
it translates to effective instructional practices thereby meeting the needs of students.
Develop, implement and monitor supervision and evaluation processes to ensure that they are improving
professional practice and increasing student achievement.
Ensure the technology infrastructure is fully functional and meets the needs of all stakeholders. Develop
and administer a needs assessment to ascertain information about the use of technology by all
stakeholders. Develop, implement and monitor a technology plan that helps to make students active
participants in their learning and addresses the professional learning needs of teachers.
Further refine policies, practices and conditions that ensure a formal structure (i.e., homeroom, advisory
period, etc.) exists which ensures that each student is well known by at least one adult advocate.
Further ensure that the structure also focuses on school personnel building positive relationships with
students to gain insight into their needs regarding learning, thinking and life skills.
Part A. Coach teachers in and monitor the use of instructional strategies that ensure instruction is
effective, student centered, highly engaging and aligned to learning expectations.
Engaging instructional strategies would include: 1) student collaboration, 2) self-reflection, 3)
development of critical thinking skills, 4) application of content knowledge and skills, 5) integration of
content knowledge and skills with other disciplines, 6) use of technology as instructional resources and
learning tools.
Part B. Ensure that on-task behavior and appropriate classroom management strategies are used to
create a safe learning environment that fosters high levels of student engagement designed to meet
individual needs and improve student achievement.
Document Generated On December 16, 2015
Kentucky Department of Education Stuart Middle
© 2015 Advance Education, Inc. All rights reserved unless otherwise granted by written agreement. Page 32
Kentucky Department of Education Stuart Middle
© 2015 Advance Education, Inc. All rights reserved unless otherwise granted by written agreement. Page 32
Kentucky Department of Education Stuart Middle
© 2015 Advance Education, Inc. All rights reserved unless otherwise granted by written agreement. Page 32
Kentucky Department of Education Stuart Middle
© 2015 Advance Education, Inc. All rights reserved unless otherwise granted by written agreement. Page 32
Kentucky Department of Education Stuart Middle
© 2015 Advance Education, Inc. All rights reserved unless otherwise granted by written agreement. Page 32

AddendaTeam Roster
Member Brief Biography
Dr. David E Gullatt David E. Gullatt, Ph.D, is a graduate of Louisiana Tech University in Ruston, LAand the University of Kansas at Lawrence. He served 29 years as a supervisorof administration and curriculum, an elementary and secondary principal, and amathematics teacher within the public schools of Louisiana. For 15 yearsfollowing those assignments he held teaching, administrative, and supervisorypositions in higher education at both Northwestern State University (LA) andLouisiana Tech University. Dr. Gullatt has served as Program Head, DepartmentHead, and Dean of the College of Education at Louisiana Tech University inRuston, LA, retiring in 2012. For the past 9 years he has served on SACS,NCA, and NWAC AdvancED System Accreditation visits as Lead Evaluator forover 45 system, digital, corporate, and diagnostic accreditation visits. PresentlyDr. Gullatt is Vice-Chair of the Louisiana SACS-CASI Council and is a fieldrepresentative for AdvancED in Louisiana. He also serves various states as acertified AdvancED professional development trainer. Dr. Gullatt also serves asan adjunct professor of educational leadership and doctoral research atLouisiana Tech University and is a Turnaround School Specialist.
Mrs. Susan Ann Greer Susan Ann Greer has served public schools through a variety of roles for the last26 years. Mrs. Greer served as a language arts teacher/gifted education teacherat the middle school and high school levels for 9 years. Following theseexperiences she was a high school vice principal over curriculum and instructionfor 10 years. Mrs. Greer left this position to become a Highly Skilled Educatorwith the Kentucky Department of Education to serve low performing schools.After one year, she was named an Educational Recovery Leader and hascoordinated school and district turnaround work since. Currently, she iscontinuting this work as the Educational Recovery Director for the West Regionand is in her second year as a certified National Institute for School Leadershipfacilitator. Mrs. Greer has served on review teams with AdvancEd and theKentucky Department of Education for the last seven years.
Mrs. Stephanie Emmons Stephanie Emmons is the principal at Fleming County High School. Herexperience includes being a collaborative special education teacher at theelementary and high school level. She also has served as principal atFlemingsburg Elementary before moving to a high school principal.
Dr. Tim Parson Dr. Tim Parson is Principal of Cumberland County Middle School, which wasrecently named a Distinguished, High Performing and High Progress School byKDE. Cumberland County Middle School is a 1:1 Google Apps for EducationSchool. He is a Google Certified Educator, presenter and professor. Dr. Parsonleads a district initiative to grow future school and district leaders and is certifiedas a Director of Special Education, Pupil Personnel and Superintendent.
Mr. John Slone Mr. Slone is currently the Principal of Bath County Middle School. He has 20years of educational experience as both a Teacher and an Administrator. Mr.Slone received his Bachelors and Masters in Vocational Education at MoreheadState University. He received his Rank I in Educational Administration fromXavier University. Mr. Slone served as an Assistant Principal for 8 years at ScottHigh School in Northern Kentucky where he developed his skills in curriculumdevelopment and continuous school improvement. As an Agriculture Teacher heworked in Ohio and Kentucky with students on leadership development andserved as a state officer for the Kentucky Vocational Agriculture TeachersAssociation. Mr. Slone also received training through the Center for CreativeLeadership
Document Generated On December 16, 2015
Kentucky Department of Education Stuart Middle
© 2015 Advance Education, Inc. All rights reserved unless otherwise granted by written agreement. Page 33
Kentucky Department of Education Stuart Middle
© 2015 Advance Education, Inc. All rights reserved unless otherwise granted by written agreement. Page 33
Kentucky Department of Education Stuart Middle
© 2015 Advance Education, Inc. All rights reserved unless otherwise granted by written agreement. Page 33
Kentucky Department of Education Stuart Middle
© 2015 Advance Education, Inc. All rights reserved unless otherwise granted by written agreement. Page 33
Kentucky Department of Education Stuart Middle
© 2015 Advance Education, Inc. All rights reserved unless otherwise granted by written agreement. Page 33
Kentucky Department of Education Stuart Middle
© 2015 Advance Education, Inc. All rights reserved unless otherwise granted by written agreement. Page 33

Member Brief Biography
Mrs. Sara Smith Mrs. Sara Smith is a native of the small town of South Shore, KY, which islocated in Greenup County. From 2011-2015 she taught Spanish and History atGreenup County High School. GCHS was a priority school throughout theduration of her time spent there. During her time there, Sara served as a memberof the school leadership team and various committees that promoted schoolimprovement. As a teacher at GCHS, Sara experienced three DiagnosticReviews and was a lead for collecting evidence, as well as writing the reports.During the summer of 2015, Sara accepted the position of Curriculum,Instruction, and Assessment Specialist at Fleming County High School, which isa priority school. My work at FCHS includes leading PLC meetings, coachingteachers, providing Professional Learning experiences focused on instruction,serving as AP Coordinator, and working as a part of the school leadership teamto continually monitor improvement efforts.
Mrs. Tammy Stephens Tammy Stephens is an educator, facilitator, and collaborator. Experiencesinclude working with middle school students in grades 5-9 in English LanguageArts, reading and writing interventionist, literacy/curriculum coach, and districtdirector of secondary education. Currently, Tammy works as EducationRecovery Specialist for the Kentucky Department of Education. Other projectscompleted for KDE include literacy/strategies consultant and English LanguageArts Content Specialist.
Document Generated On December 16, 2015
Kentucky Department of Education Stuart Middle
© 2015 Advance Education, Inc. All rights reserved unless otherwise granted by written agreement. Page 34
Kentucky Department of Education Stuart Middle
© 2015 Advance Education, Inc. All rights reserved unless otherwise granted by written agreement. Page 34
Kentucky Department of Education Stuart Middle
© 2015 Advance Education, Inc. All rights reserved unless otherwise granted by written agreement. Page 34
Kentucky Department of Education Stuart Middle
© 2015 Advance Education, Inc. All rights reserved unless otherwise granted by written agreement. Page 34
Kentucky Department of Education Stuart Middle
© 2015 Advance Education, Inc. All rights reserved unless otherwise granted by written agreement. Page 34
Kentucky Department of Education Stuart Middle
© 2015 Advance Education, Inc. All rights reserved unless otherwise granted by written agreement. Page 34

About AdvancEDAdvancED is the world leader in providing improvement and accreditation services to education providers of all
types in their pursuit of excellence in serving students. AdvancED serves as a trusted partner to more than
32,000 public and private schools and school systems – enrolling more than 20 million students - across the
United States and 70 countries.
In 2006, the North Central Association Commission on Accreditation and School Improvement (NCA CASI),
the Southern Association of Colleges and Schools Council on Accreditation and School Improvement (SACS
CASI), both founded in 1895, and the National Study of School Evaluation (NSSE) came together to form
AdvancED: one strong, unified organization dedicated to education quality. In 2011, the Northwest
Accreditation Commission (NWAC) that was founded in 1917 became part of AdvancED.
Today, NCA CASI, NWAC and SACS CASI serve as accreditation divisions of AdvancED. The Accreditation
Divisions of AdvancED share research-based quality standards that cross school system, state, regional,
national, and international boundaries. Accompanying these standards is a unified and consistent process
designed to engage educational institutions in continuous improvement.
Document Generated On December 16, 2015
Kentucky Department of Education Stuart Middle
© 2015 Advance Education, Inc. All rights reserved unless otherwise granted by written agreement. Page 35
Kentucky Department of Education Stuart Middle
© 2015 Advance Education, Inc. All rights reserved unless otherwise granted by written agreement. Page 35
Kentucky Department of Education Stuart Middle
© 2015 Advance Education, Inc. All rights reserved unless otherwise granted by written agreement. Page 35
Kentucky Department of Education Stuart Middle
© 2015 Advance Education, Inc. All rights reserved unless otherwise granted by written agreement. Page 35
Kentucky Department of Education Stuart Middle
© 2015 Advance Education, Inc. All rights reserved unless otherwise granted by written agreement. Page 35
Kentucky Department of Education Stuart Middle
© 2015 Advance Education, Inc. All rights reserved unless otherwise granted by written agreement. Page 35

-
-
-
-
-
-
-
-
-
-
-
-
-
-
-
-
-
-
ReferencesAlwin, L. (2002). The will and the way of data use. School Administrator, 59(11), 11.
Baumert, J., Kunter, M., Blum, W., Brunner, M., Voxx, T., Jordan, A., Klusmann, U., Krauss, S.,
Nuebrand, M., & Tsai, Y. (2010). Teachers' mathematical knowledge, cognitive activation in the
classroom, and student progress. American Educational Research Journal, 47(1), 133-180.
Chartered Institute of Personnel and Development. (2012). Shared purpose: the golden thread?
London: CIPD.
Colbert, J., Brown, R., Choi, S., & Thomas, S. (2008). An investigation of the impacts of teacher-driven
professional development. Teacher Education Quarterly, 35(2), 134-154.
Conley, D.T. (2007). Redefining college readiness (Vol. 3). Eugene, OR: Educational Policy
Improvement Center.
Datnow, A., Park, V., & Wohlstetter, P. (2007). Achieving with data: How high-performing school
systems use data to improve instruction for elementary students. Los Angeles, CA: Center on
Educational Governance, USC.
Dembosky, J., Pane, J., Barney, H., & Christina, R. (2005). Data driven decision making in
Southwestern Pennsylvania school districts. Working paper. Santa Monica, CA: RAND.
Ding, C. & Sherman, H. (2006). Teaching effectiveness and student achievement: Examining the
relationship. Educational Research Quarterly, 29 (4), 40-51.
Doyle, D. P. (2003). Data-driven decision making: Is it the mantra of the month or does it have staying
power? T.H.E. Journal, 30(10), 19-21.
Feuerstein, A., & Opfer, V. D. (1998). School board chairmen and school superintendents: An analysis
of perceptions concerning special interest groups and educational governance. Journal of School
Leadership, 8, 373-398.
Fink, D., & Brayman, C. (2006). School leadership succession and the challenges of change.
Educational Administration Quarterly, 42 (62), 61-89.
Greene, K. (1992). Models of school-board policy-making. Educational Administration Quarterly, 28
(2), 220-236.
Horng, E., Klasik, D., & Loeb, S. (2010). Principal time-use and school effectiveness. American
Journal of Education 116, (4) 492-523.
Lafee, S. (2002). Data-driven districts. School Administrator, 59(11), 6-7, 9-10, 12, 14-15.
Leithwood, K., & Sun, J. (2012). The Nature and effects of transformational school leadership: A meta-
analytic review of unpublished research. Educational Administration Quarterly, 48 (387). 388-423.
Marks, H., Louis, K.S., & Printy, S. (2002). The capacity for organizational learning: Implications for
pedagogy and student achievement. In K. Leithwood (Ed.), Organizational learning and school
improvement (p. 239-266). Greenwich, CT: JAI Press.
McIntire, T. (2002). The administrator's guide to data-driven decision making. Technology and
Learning, 22(11), 18-33.
Pan, D., Rudo, Z., Schneider, C., & Smith-Hansen, L. (2003). Examination of resource allocation in
education: connecting spending to student performance. Austin, TX: SEDL.
Document Generated On December 16, 2015
Kentucky Department of Education Stuart Middle
© 2015 Advance Education, Inc. All rights reserved unless otherwise granted by written agreement. Page 36
Kentucky Department of Education Stuart Middle
© 2015 Advance Education, Inc. All rights reserved unless otherwise granted by written agreement. Page 36
Kentucky Department of Education Stuart Middle
© 2015 Advance Education, Inc. All rights reserved unless otherwise granted by written agreement. Page 36
Kentucky Department of Education Stuart Middle
© 2015 Advance Education, Inc. All rights reserved unless otherwise granted by written agreement. Page 36
Kentucky Department of Education Stuart Middle
© 2015 Advance Education, Inc. All rights reserved unless otherwise granted by written agreement. Page 36
Kentucky Department of Education Stuart Middle
© 2015 Advance Education, Inc. All rights reserved unless otherwise granted by written agreement. Page 36

1.
2.
3.
4.
AttachmentsThe following attachments have been included in this report.
Student Performance Team Worksheet- Final
Stakeholder Survey Plus/Delta- Final
Diagnostic Review Team Schedule- Final
Leadership Assessment Addendum- Final
Document Generated On December 16, 2015
Kentucky Department of Education Stuart Middle
© 2015 Advance Education, Inc. All rights reserved unless otherwise granted by written agreement. Page 37
Kentucky Department of Education Stuart Middle
© 2015 Advance Education, Inc. All rights reserved unless otherwise granted by written agreement. Page 37
Kentucky Department of Education Stuart Middle
© 2015 Advance Education, Inc. All rights reserved unless otherwise granted by written agreement. Page 37
Kentucky Department of Education Stuart Middle
© 2015 Advance Education, Inc. All rights reserved unless otherwise granted by written agreement. Page 37
Kentucky Department of Education Stuart Middle
© 2015 Advance Education, Inc. All rights reserved unless otherwise granted by written agreement. Page 37
Kentucky Department of Education Stuart Middle
© 2015 Advance Education, Inc. All rights reserved unless otherwise granted by written agreement. Page 37
Kentucky Department of Education Stuart Middle
© 2015 Advance Education, Inc. All rights reserved unless otherwise granted by written agreement. Page 37

Student Performance Team Worksheet Template for Middle Schools
School Name: Stuart Middle School
Plus
6th grade reading shows a slight upward trend that is sustained.
7th grade reading shows the highest percent of proficient/distinguished scores.
6th grade language mechanics scores have recovered from declining scores by a total of 8
points.
Delta
All scores are significantly below state average.
8th grade scores all show a significant decline.
Annual Measurable Objective (AMO)
Year Prior Year Overall Score
AMO Goal
Overall Score
Met AMO Goal
Met Participation
Rate Goal
Met Graduation Rate Goal
2014-2015 47.4 48.4 46.7 N Y NA
2013-2014 49.1 50.1 48.3 N Y NA
Plus
There are no pluses evidenced by the team pertaining to this data set.
Delta
AMO was not met either year.
The school’s overall score dropped both years.

Percentages of Students Scoring at Proficient/Distinguished (P/D) Levels on the K-PREP Assessment at the School and in the State (2012-2013, 2013-2014, 2014-2015)
Content Area %P/D School (12-13)
%P/D State (12-13)
%P/D School (13-14)
%P/D State (13-14)
%P/D School (14-15)
%P/D State (14-15)
Reading 6
th grade 18.6 46.3 22.9 52.8 23.5 52.9
7th
grade 29.7 54.7 30.6 54.4 25.5 54.5 8
th grade 26.4 52.4 24 52.2 21.6 54.1
Math 6
th grade 15.5 38.5 15.5 47.3 15.5 43.2
7th
grade 17.4 38.6 15.6 42.1 14.2 40.9 8
th grade 17.4 45.1 19.2 45.2 11.9 44.2
Science 7
th grade 27.4 61.2 28.7 64.2 N/A N/A
Social Studies
8th
grade 32.5 59.2 22 59.4 18.8 58.6
Writing 6
th grade 24.3 48.0 16.1 52.3 15.9 44.1
8th
grade 13.6 38.6 11.3 35.2 7.8 34.3
Language Mech.
6th
grade 18.6 43.8 10.3 40.3 18.3 46.1
Plus
6th grade reading increased incrementally each year.
6th grade language mechanics gained 8 points in %proficient/distinguished.
Delta
A significant decrease in 8th grade math scores is evident.
A significant decrease in 8th grade writing scores (4 point drop) is apparent.
In 2014-15, 8th grade scores in math and reading were lower than 6th grade math and reading scores.

Grade 8 Percentages of Students Meeting Benchmarks on EXPLORE at School and State, 2014-2015
English School
English State
Math School
Math State
Reading School
Reading State
Science School
Science State
11.5 14.4 11.3 14.9 11.6 14.3 13.8 16.5
Plus
The team found no pluses in relation to this data set.
Delta
The percentage of students meeting EXPLORE benchmarks at Stuart Middle was below the state average
in all areas.
School Achievement of Proficiency and Gap Delivery Targets (2014-2015) Tested Area Proficiency
Delivery Target for % P/D
Actual Score Met Target (Yes or No)
Gap Delivery
Target for % P/D
Actual Score
Met Target (Yes or
No)
Combined Reading &
Math
27.6 18.6 N 25.9 17.6 N
Reading 31.4 23.5 N 29.3 22.5 N
Math 23.8 13.7 N 22.6 12.7 N
Social Studies 34.4 18.8 N 32.0 17.1 N
Writing 23.9 11.4 N 23.4 10.9 N
Plus
Reading scores were higher than in other content areas.
Delta
No target was met.

Program Reviews 2014-2015 Program
Area Curriculum
and Instruction
3 pts possible
Formative & Summative Assessment
3 pts possible
Professional Development
3 pts possible
Administrative/ Leadership
Support
3 pts possible
Total Score
12 points possible
Classification
Arts and Humanities
2.18 2.29 1.89 1.90 8.3 Proficient
Practical Living
2.04 2.33 2.44 2.08 8.9 Proficient
Writing
2.00 2.00 1.89 2.00 7.9 Needs Improvement
Plus
The school scored in the proficient category in two program review areas.
Delta
The school scored in the needs improvement category in writing.

Stakeholder Survey Plus/Delta
The Survey Plus/Delta is the team’s brief analysis all stakeholder survey data which is intended to
highlight areas of strength (pluses) that were identified through the survey process as well as leverage
points for improvement (deltas).
Teaching and Learning Impact
Plus: (minimum of 75 percent strongly agree/agree)
1. 76 percent of students strongly agree/agree with the statement, “My school gives me multiple
assessments to check my understanding of what was taught.”
2. 90 percent of staff strongly agree/agree with the statement, “All teachers in our school participate in
collaborative learning communities that meet both informally and formally across grade levels and
content areas.”
Delta:
1. 58 percent of parents strongly agree/agree with the statement, “All of my child’s teachers meet
his/her learning needs by individualizing instruction.”
2. 67 percent of staff strongly agree/agree with the statement, “All teachers in our school use a variety
of technologies as instructional resources.”
Leadership Capacity
Plus: (minimum of 75 percent strongly agree/agree)
1. 94 percent of staff strongly agree/agree with the statement, “Our school leaders expect staff
members to hold all students to high academic standards.”
2. 82 percent of staff strongly agree/agree with the statement, “Our school’s purpose statement is
formally reviewed and revised with involvement from stakeholders.”
Delta:
1. 60 percent of parents strongly agree/agree with the statement, “Our school provides
opportunities for stakeholders to be involved in the school.”
2. 57 percent of parents strongly agree/agree with the statement, “Our school shares
responsibility for student learning with its stakeholders.”

Resource Utilization
Plus: (minimum of 75 percent strongly agree/agree)
1. 81 percent of staff strongly agree/agree with the statement, “Our school maintains facilities that
contribute to a safe environment.
2. 90 percent of staff strongly agree/agree with the statement, “Our school provides instructional
time and resources to support our school’s goals and priorities.”
Delta:
1. 60 percent of students strongly agree/agree with the statement, “In my school the buildings and
grounds are safe, clean and provide a healthy place for learning.”
2. 68 percent of staff strongly agree/agree with the statement, “Our school provides a plan for the
acquisition and support of technology to support the school’s operational needs.”

2015 School Diagnostic Review Schedule
November 8-11, 2015
Stuart Middle School (KY)
Sunday, November 8, 2015
Time Event Where Who
1:00 p.m. - 3:00 p.m. Hotel Check-in Louisville Marriott, East 1903 Embassy Square, Louisville, KY 40299
Diagnostic Review Team Members
4:00 p.m. -5:30 p.m. Orientation and Planning Session Hotel Conference Room Diagnostic Review Team Members
5:30 p.m. – 6:30 p.m. Dinner Hotel Conference Room
Diagnostic Review Team Members
6:30 p.m. – 7:30 p.m.
Principal’s Overview Presentation
Standards Presentation - Questions/topics to be addressed:
1. Vision, i.e., where has the school come from, where is the school now, and where is the school trying to go from here?
This presentation should specifically address the findings from the Leadership Assessment Report completed two years ago. It should point out the impact of school improvement initiatives begun as a result of the previous Leadership Assessment, and it should provide details and documentation as to how the school has improved student achievement as well as conditions that support learning.
2. Overview of the School Self Assessment - review and explanation of ratings, strengths and potential improvement priorities.
3. How did the school and system ensure that the Internal Review process was carried out with integrity at the school level?
Hotel Conference Room Diagnostic Review Team Members,
School Principal, and
School Leadership Team

4. What has the school and system done to evaluate, support, monitor and ensure improvement in student performance as well as conditions that support learning?
5. What has been the result of school/system efforts at the school? What evidence can the school present to indicate that learning conditions and student achievement have improved?
6. What professional development has the school provided in the last two years targeting improvement in teacher professional practice and student success? What should the team be looking for in their classroom observations to gage the impact of the professional development program, ( i.e., differentiation, higher order thinking, formative assessment, student engagement, etc.)?
7:30 p.m.– 10:00 p.m. Team Work Session #1
Review initial indicator ratings.
Review team schedule and individual team member responsibilities
Review classroom observation procedures and interview procedures
Prepare questions for principal, teachers, students, and stakeholder interviews
Determine other questions that the team needs to have answered
Hotel Conference Room Diagnostic Review Team
Members
Monday, November 9, 2015
Time Event Where Who
6:00 – 6:30 a.m. Breakfast Hotel Restaurant Diagnostic Review Team
Members
6:40 a.m. Meet in Hotel Lobby to Depart to School Hotel Lobby Diagnostic Review Team
Members
7:45 a.m. Team arrives at school Assigned Meeting Room Diagnostic Review Team
Members
8:00 a.m. – 8:45 a.m. Principal Interview Assigned Meeting Room Diagnostic Review Team
Members
8:50 a.m. – 11:45 a.m. Begin school and classroom observations Various Classrooms as
Assigned
Diagnostic Review Team
Members (working in
pairs or as individuals)
11:45 a.m.-12:35 p.m. Lunch & Team Meeting Assigned Meeting Room Diagnostic Review Team

Members
12:35 p.m. – 4:00 p.m. School and classroom observations continue
(Some team members may be assigned to interview
individuals or groups during this time.)
Various Classrooms Diagnostic Review Team
Members
(working in pairs or as
individuals)
Individual interviews:
1. all administrators
2. 25% of professional staff (representing a cross-section
of the faculty)
Various Classrooms as
Assigned
Diagnostic Review Team
Members
(working in pairs or as
individuals)
Small groups (3-5 persons) interviews should be scheduled
for
1. parent leaders 2. students 3. support staff
Assigned Meeting Room
and
Additional Meeting
Room as Assigned
Diagnostic Review Team
Members
(working in pairs or as
individuals)
Review of paper artifacts and documentation that could
not be provided electronically.
(Documents and artifacts provided in the advance to the
DR team electronically organized by standard, i.e., Google
Docs or via a flash drive)
Interviewing of Educational Recovery Staff during this time
or at the hotel per their request.
Assigned Meeting Room Diagnostic Review Team
Members
(working in pairs or as
individuals)
4:00 p.m. Team returns to hotel Diagnostic Review Team
Members
5:30 – 6:30 p.m. Dinner Hotel Conference Room Diagnostic Review Team
Members
6:30 – 10:00 p.m. Evening Work Session #2
(Agenda provided by Lead Evaluator)
Tabulate classroom observation data from Day #1
Reach consensus on second ratings for all indicators
Discuss potential Powerful Practices and Improvement Priorities
Begin DRAFTING the DR Report, i.e., eleot ratings summaries, Improvement Priorities, Summary of the Team’s Activities, etc.
Prepare for Day 2
Hotel Conference Room
Diagnostic Review Team
Members

Tuesday, November 10, 2015
Time Event Where Who
6:00 – 6:30 a.m. Breakfast Hotel Restaurant Diagnostic Review Team
Members
6:40 a.m. Team Meets in Lobby to Depart to School Hotel Lobby Diagnostic Review Team
Members
7:45 a.m. Team arrives at school Assigned Meeting
Room
Diagnostic Review Team
Members
8:00 a.m.– 11:45 a.m. School and classroom observations
Various Assigned
Classrooms
Diagnostic Review Team
members
(working in pairs or as
individuals)
Continue interviews as necessary not completed on day #1
Various Assigned
Classrooms
Diagnostic Review Team
Members
(working in pairs or as
individuals)
Continue artifact review as necessary not completed on
day #1
Assigned Meeting
Room
(working in pairs or as
individuals)
11:45 a.m.-12:35 p.m.
Lunch & Team Meeting Assigned Meeting
Room
Diagnostic Review Team
Members
12:35 p.m. - 4:00 p.m. School and classroom observations
Artifacts review
Complete interviews as necessary
Assigned Meeting
Room or Various
Classrooms
Diagnostic Review Team
Members
(working in pairs or as
individuals)
5:30 p.m. – 6:30 p.m. Dinner Hotel Restaurant Diagnostic Review Team
Members
6:30 – 10:00 p.m. Evening Work Session #3 (Agenda provided by Lead
Evaluator)
Hotel Conference Room
Diagnostic Review Team
Members
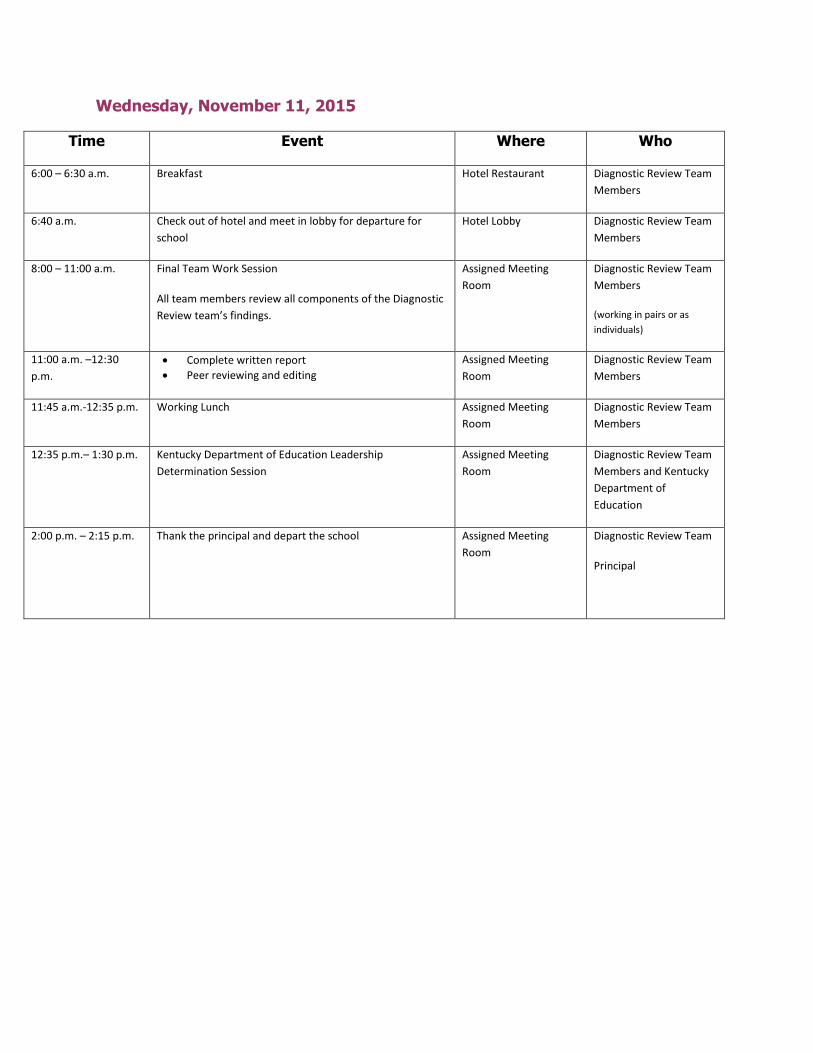
Wednesday, November 11, 2015
Time Event Where Who
6:00 – 6:30 a.m. Breakfast Hotel Restaurant Diagnostic Review Team
Members
6:40 a.m. Check out of hotel and meet in lobby for departure for
school
Hotel Lobby Diagnostic Review Team
Members
8:00 – 11:00 a.m. Final Team Work Session
All team members review all components of the Diagnostic
Review team’s findings.
Assigned Meeting
Room
Diagnostic Review Team
Members
(working in pairs or as
individuals)
11:00 a.m. –12:30
p.m.
Complete written report
Peer reviewing and editing
Assigned Meeting
Room
Diagnostic Review Team
Members
11:45 a.m.-12:35 p.m. Working Lunch Assigned Meeting
Room
Diagnostic Review Team
Members
12:35 p.m.– 1:30 p.m. Kentucky Department of Education Leadership
Determination Session
Assigned Meeting
Room
Diagnostic Review Team
Members and Kentucky
Department of
Education
2:00 p.m. – 2:15 p.m. Thank the principal and depart the school Assigned Meeting
Room
Diagnostic Review Team
Principal

2015 LEADERSHIP ASSESSMENT/DIAGNOSTIC REVIEW ADDENDUM The purpose of this addendum is to provide feedback on progress made in addressing identified Improvement Priorities from the 2013-2014 Diagnostic Review or Progress Monitoring Visit for Stuart Middle School.
Improvement Priority 1
Indicator 1.1
2013-14
Team Rating 2015-16
School/Distri
ct Self-
Rating
2015-16
Team
Rating
The school engages in a systematic, inclusive, and comprehensive process to review, revise, and communicate a school purpose for student success.
1 2 1.86
1.1. Improvement Priority (2013-14)
Establish a process to regularly and formally review, revise, and communicate the school’s mission and purpose that includes active participation from a broad range of stakeholders including parents and students.
School Self-
Rating Team Rating
This Improvement Priority has been addressed in an exemplary manner.
This Improvement Priority has been addressed satisfactorily.
This Improvement Priority has been partially addressed. X X
There is little or no evidence that this Improvement Priority has been addressed.

School Evidence: Examples of communications to stakeholders about the school's purpose (i.e. website, newsletters, annual report, student handbook) Communication plan to stakeholders regarding the school's purpose Minutes from meetings related to development of the school's purpose Documentation or description of the process for creating the school's purpose including the role of stakeholders Examples of Mission/Vision Revision Survey
School Supporting Rationale: The SBDM has adopted a policy outlining the process for reviewing and/or revising the school’s Mission and Vision statements. This process was developed by the efficiency and planning committee. The last review of our Mission and Vision occurred in the Winter/Spring of 2015. There was minimal participation from stakeholders.
Team Evidence: • Self Assessment • Executive Summary • Review of artifacts and documents • Student and staff survey data • Stakeholder interviews • Classroom observations • 2014 Leadership Assessment
Team Supporting Rationale: The team supports the school’s rating for this priority. Documentation and interviews reveal that the school has engaged in a process to review the school’s formal statement of mission and purpose; however, that process resulted in no revisions to the mission statement which was originally developed several years ago. Interviews and survey data suggest that staff were involved in the process. Eighty-two percent of staff indicated that they agreed/strongly agreed with the statement, “Our school’s purpose statement is formally revised and revised with involvement of stakeholders.” On the other hand, 58 percent of parents indicated that they agreed/strongly agreed with the statement, “Our school’s purpose statement is formally revised and revised with involvement from parents.” The school’s formal statement of purpose expresses a commitment to high expectations.

Improvement Priority 2
Indicator 1.2
2013-14
Team Rating 2015-16
School/Distri
ct Self-
Rating
2015-16
Team Rating
The school leadership and staff commit to a culture that is based on shared values and beliefs about teaching and learning and supports challenging, equitable educational programs and learning experiences for all students that include achievement of learning, thinking, and life skills.
1 2 1.86
1.2. Improvement Priority (2013-14) Commit to a culture that (1) is based on shared values and beliefs about teaching and learning; (2) supports challenging, equitable educational programs; and, (3) provides learning experiences for all students that include achievement of learning, thinking, and life skills.
School Self-
Rating Team Rating
This Improvement Priority has been addressed in an exemplary manner.
This Improvement Priority has been addressed satisfactorily.
This Improvement Priority has been partially addressed. X
There is little or no evidence that this Improvement Priority has been addressed.
X
School Evidence: The master schedule provides for daily PLC times with grade level teachers. ILT meets monthly to analyze data and develop next steps (ILT Minutes) Partnership with Solution Tree to support and fully develop PLC work (samples of PD power points and materials) The Spartan Way The Mission/Vision Process Surveys Book Studies (Teach Like a Champions and The Differentiated Classroom)

School Supporting Rationale: Although we have made an intentional effort to develop collaborative PLCs, we are not consistent with providing instruction that actively engage students in in-depth application of knowledge and skill. We also have systems in place to address issues with discipline and instruction but all staff is not consistent with implementation. To address this inconsistency we are using Embedded PD, Book Studies, Classroom Modelling, and After School PD.
Team Evidence: • Self-Assessment • Executive Summary • Review of artifacts and documents provided by the school • Student and staff survey data • Stakeholder interviews • Classroom observations • SBDM Agendas and Minutes • PLC Meeting Agendas and Minutes • Book Studies • Response to Intervention (RtI) Process • Master Schedule • 2014 Leadership Assessment • Student performance data
Team Supporting Rationale: Student performance data, as detailed in the attachments to this report, shows a school-wide downward trend in overall academic performance and is consistently lower than state averages in all tested areas. Data does not suggest that all students have access to challenging and equitable learning experiences. The extent to which school leaders have established a culture that is truly committed to providing challenging, equitable educational programs and learning experiences for all students is very limited. Classroom observation data, as detailed in the Teaching and Learning Impact section of the report, reveals widely varying levels of instructional effectiveness across the school. In particular, the High Expectations Learning Environment received an overall rating of 1.69 on a 4.0 scale. Instances in which students were “engaged in rigorous coursework, discussions, and/or tasks,” (B4) were evident/very evident in 21 percent of classrooms. Similarly, the Active Learning Environment received an overall rating of 1.71 on a 4.0 scale. Instances in which observers detected that students were “actively engaged in learning activities” (D3) were evident in 14 percent of classrooms. Stakeholder survey data is very mixed and does not suggest that the school is providing challenging and equitable learning experiences for all students. Eighty percent of staff indicated that they agreed/strongly agreed with the statement, “In our school, challenging curriculum and learning experiences provide equity for all students in the development of learning, thinking and life skills.” Seventy-four percent of students indicated that they agreed/strongly agreed with the statement, “My school provides me with challenging curriculum and learning experiences.” And, 65 percent of parents

indicated agreement to the statement, “All of my child’s teachers provide an equitable curriculum that meets his/her learning needs.”
Improvement Priority 3
Indicator 2.4
2013-14
Team Rating 2015-16
School/Distri
ct Self-
Rating
2015-16
Team Rating
Leadership and staff foster a culture consistent with the school’s purpose and direction.
1 3 2.00
1.4. Improvement Priority (2013-14) Evaluate the effectiveness of current systems and processes used by the school leaders and staff to align their decisions and actions toward continuous improvement to achieve the school’s purpose. Use the results of this evaluation to improve stakeholder communication and engagement in shaping decisions, providing feedback to school leaders, working collaboratively on school improvement efforts, and allowing stakeholders to serve in meaningful leadership roles.
School Self-
Rating Team Rating
This Improvement Priority has been addressed in an exemplary manner.
This Improvement Priority has been addressed satisfactorily. X
This Improvement Priority has been partially addressed. X
There is little or no evidence that this Improvement Priority has been addressed.

School Evidence: Survey data (TELL, Perception, CSS, Safe & Drug Free) Walk through data Minutes from ILT, Committees, SDBM, and department meetings Spartan Way (student creed) CFA Analysis Sheets CSIP Multi-Tiered Framework for Spartan Leadership Master Schedule
School Supporting Rationale: Stuart consistently fosters a culture that coincides with the school’s purpose and direction. First, our master schedule is organized to allow for continuous collaboration and professional development. Next, we have standing SBDM committees that support shared leadership, continuous improvement, and an overall sense of community amongst all stakeholders. It is evident in our surveys that stakeholders feel a part of our school community.
Team Evidence: • Self Assessment • Executive Summary • Review of artifacts and documents provided by the school • Survey data • Stakeholder interviews • Classroom observations • School Based Decision Making (SBDM) Council Agendas and Minutes • Professional Learning Community (PLC) Meeting Agendas and Minutes • Master Schedule • 2014 Leadership Assessment • Missing Piece Diagnostic • Student performance data
Team Supporting Rationale: Surveys, interviews, observations, performance data and documentation do not suggest that the school has improved practices that ensure decisions and actions toward continuous improvement are consistently made. Nor is there consistent evidence to suggest that stakeholders, including parents, are meaningfully engaged in the school. Interviews and documentation did not reveal that parents are consistently engaged in school decision-making or that they are offered opportunities to provide feedback or help shape decisions. The Missing Piece Diagnostic, completed by school staff members only, indicates a rating of “novice” or “apprentice” for many indicators relating to meaningful parent engagement. For example, an “apprentice” rating was given for these indicators:

Indicator 2.4 – School staff implements systematic steps to encourage parents to attend school activities and participate in decision about their children’s learning. Indicator 2.7 – All parents are asked for feedback on the school’s efforts to welcome and engage parents and the feedback is used to improve the school’s efforts. Survey data do not suggest that the school has been effective in developing opportunities for parents and other stakeholders to be meaningfully engaged in the school. For example, 57 percent of parents agreed/strongly agreed with the statement, “Our school shares responsibility for student learning with its stakeholders.” And, 56 percent indicated that they agreed/strongly agreed with the statement, “Our school provides opportunities for stakeholder to be involved in the school.” This contrasts to 84 percent of the staff who indicated that they agreed/strongly agreed with the statement, “Our school’s leaders provide opportunities for stakeholder to be involved in the school.” On the other hand, 61 percent of students indicated that they agreed/strongly agreed with the statement, “My school offers opportunities for my family to become involved in the school activities any my learning.”
Improvement Priority 4
Indicator 3.1
2013-14
Team Rating 2015-16
School/Distri
ct Self-
Rating
2015-16
Team Rating
The school’s curriculum provides equitable and challenging learning experiences that ensure all students have sufficient opportunities to develop learning, thinking, and life skills that lead to success at the next level.
1 2 1.71
1.1. Improvement Priority (2013-14) Ensure that all students are appropriately challenged through the use of differentiated instruction that supports achievement of learning expectations.
School Self-
Rating Team Rating
This Improvement Priority has been addressed in an exemplary manner.
This Improvement Priority has been addressed satisfactorily.
This Improvement Priority has been partially addressed. X
There is little or no evidence that this Improvement Priority has been addressed.
X

School Evidence: Provide PD on differentiated instruction to teachers. (power points and materials) Allow teachers time to unpack standards, including differentiation strategies. Student data Analysis during weekly PLCs. Walk-through data Book study of Differentiation in the Classroom Common grade level planning for lesson planning purposes Life skill classes to address Reading and Math
School Supporting Rationale: Challenging and equitable opportunities are provided in most classrooms; however we are working on differentiation to meet the needs of all students. We will continue with our differentiation book study and strategy sessions. We will also continue the PLC process for lesson planning, analysis of student work and data analysis. We also plan to complete a schoolwide learning styles inventory in the spring. The first school wide inventory was completed in January 2015 after winter break.
Team Evidence: • Self Assessment • Executive Summary • Review of artifacts and documents provided by the school • Student and staff survey data • Stakeholder interviews • Classroom observations • SBDM Agendas and Minutes • PLC Meeting Agendas and Minutes • Master Schedule • 2014 Leadership Assessment • Student performance data
Team Supporting Rationale: Student performance data, as detailed in the attachments to this report, shows a school-wide downward trend in overall academic performance which do not suggest that the school has been effective in meeting the learning needs of a wide range of students through the use of varied and differentiated instruction practices. Teacher interviews and documentation revealed that training on differentiation of instruction in the classroom has been provided to the teachers of Stuart; however, classroom observation data indicates limited use of differentiation practices in classrooms. For example, instances in which students had “differentiated learning opportunities and activities that meet her/his needs,” (A1) were evident in 28 percent of classrooms. Observers detected no differentiation practices in 55 percent of classrooms. Teacher interviews revealed that input was collected to support the need for more professional development addressing differentiation. However, there had been no consistent monitoring, support or evaluation of any new strategies in classrooms addressing differentiation following the school book study.

Survey data with regard to the differentiation of instruction is very mixed and does not suggest the consistent use of differentiation instructional strategies across the school. For example, 80 percent of staff indicated that they agreed/strongly agreed with the statement, “All teachers in our school personalize instructional strategies and interventions to address individual learning needs of students.” On the other hand, 57 percent of parents indicated that they agreed/strongly agreed with the statement, “All of my child’s teachers meet his/her learning needs by individualizing instruction.” Similarly, 58 percent of students indicated that they agreed/strongly agreed with the statement, “All of my teachers change their teaching to meet my learning needs.”
Improvement Priority 5
Indicator 3.2
2013-14
Team Rating 2015-16
School/Distri
ct Self-
Rating
2015-16
Team Rating
Curriculum, instruction, and assessment are monitored and adjusted systematically in response to data from multiple assessments of student learning and an examination of professional practice.
1 2 1.86
1.2. Improvement Priority (2013-14) Design and implement more effective policies and practices that will ensure the curriculum is monitored and adjusted in response to data from multiple assessments of student learning and an examination of professional practice. Ensure vertical and horizontal curriculum alignment and alignment with the school’s goals for achievement and instruction and statement of purpose.
School Self-
Rating Team Rating
This Improvement Priority has been addressed in an exemplary manner.
This Improvement Priority has been addressed satisfactorily.
This Improvement Priority has been partially addressed. X
There is little or no evidence that this Improvement Priority has been addressed.
X
School Evidence: Completion of weekly PLC Monitoring Sheet (which includes data questions and individual teacher reflections) Referral to RTI using student data sheets Student Data Conference Sheets (student data folders/binders/portfolios) Completion of monthly student data logs and conferences/checks with evidence of parent conference (via phone, email, or note home) Completion of all District Assessment by due dates PLC work, training as provided by Solution Tree 30-60-90 day plan PD survey Book study on Differentiation in the Classroom Book study on Teach Like a Champion Department Meetings CFA Reflection Sheets EPD Schedule
School Supporting Rationale: Stuart Middle School has a policy that calls for the alignment of the curriculum to the JCPS Core Content, KCAS, The Common Core and the Kentucky Program of Studies. There is also a policy that outlines the development of instructional practices. In addition, our master schedule provides a time for teachers to meet in grade level PLCs to analyze data, plan lessons, participate in EPD, and implement the RtI process. Teachers also use this time to plan or analyze common formative assessments as well as analysis of district assessments.
Team Evidence: • Self Assessment • Executive Summary • Review of artifacts and documents provided by the school • Student and staff survey data • Stakeholder interviews • Classroom observations • SBDM Agendas and Minutes • PLC Meeting Agendas and Minutes • Student performance data

Team Supporting Rationale: Student performance data, as detailed in the attachments to this report, do not suggest that school leadership has developed practices and policies that ensure curriculum implementation leading to higher levels of student success are effectively monitored. While submitted school documents included walkthrough summaries provided by administrators, much of the feedback was provided by the checking off of a standard list of instructional criteria. Some individual feedback was offered but there is no evidence that this feedback had any impact on lesson revision. In interviews, several teachers indicated that they do not believe they are receiving adequate feedback from administrators on their instructional effectiveness based on walkthrough data which is collected periodically. This contrasts to some staff survey data. For example, 89 percent of staff indicated that they agreed/strongly agreed with the statement, “Our school’s leaders ensure all staff members use supervisory feedback to improve student learning.” In addition to monitoring through direct classroom observation such as the walkthroughs, lesson and unit plans are monitored through the Professional Learning Community (PLC) by other teachers or department chairpersons. While there are administrators who are “in and out” of the PLC meeting, the effectiveness of these monitoring processes that are actually resulting in improved delivery of curriculum content is not apparent. Many of the planning forms designed for use in these meetings were blank and appeared to have been included as templates. Interim and summative student performance data is examined through the PLC as well. The extent to which this data is also examined by school administrators for the purpose of monitoring curriculum and instruction is not clear based on interviews and review of PLC documentation.
Improvement Priority 6
Indicator 3.3
2013-14
Team Rating 2015-16
School/Distri
ct Self-
Rating
2015-16
Team Rating
Teachers engage students in their learning through instructional strategies that ensure achievement of learning expectations.
1 2 1.28

1.3. Improvement Priority (2013-14) Design and implement new practices and processes that ensure teachers engage students in their learning through the use of instructional strategies such as personalization of learning, authentic use of technology, student collaboration, development of critical thinking skills, etc. Monitor and evaluate implementation of these strategies and the extent to which they have been effective in more authentically engaging students in their learning and improving performance.
School Self-
Rating Team Rating
This Improvement Priority has been addressed in an exemplary manner.
This Improvement Priority has been addressed satisfactorily.
This Improvement Priority has been partially addressed. X
There is little or no evidence that this Improvement Priority has been addressed.
X
School Evidence: PD on differentiated instruction Master schedule allows time for PLCs and daily embedded PD on various topics including but not limited to unpacking standards, including differentiation strategies, analyzing student data, and working as tuning teams. Use of various differentiated strategies through lesson plans and unit plans as evidenced through walkthroughs and evidence binders.
School Supporting Rationale: Most teachers engage students in their learning through instructional strategies that facilitate achievement. However, we do not consistently provide students with time to collaborate or self-reflect so that the depth of knowledge is deeper. In addition to school based professional development, Solution Tree, Code X, and Math in Focus are professional development programs that we use to train our teachers to become more efficient and develop strategies for differentiation.

Team Evidence: • Self Assessment • Executive Summary • Review of artifacts and documents provided by the school • Stakeholder survey data • Stakeholder interviews • Classroom observations • SBDM Agendas and Minutes • PLC Meeting Agendas and Minutes • Master Schedule • 2014 Leadership Assessment • Student performance data
Team Supporting Rationale: As previously detailed in this report, student performance data does not show improvement in student achievement suggesting that current instructional practice including strategies that ensure the student engagement, differentiation, etc. have not resulted in higher levels of student success. Classroom observation data, as referenced in an earlier section of this report, indicates low levels of student engagement and rigor across the school. While there are a few notable exceptions, classroom observations generally showed very few students engaged in rigorous work, participating in discussions requiring higher-order thinking, etc. The Active Learning Environment received an overall rating of 1.71 on a 4.0 scale. Observers did not detect that students were engaged in learning activities in about 40 percent of classrooms. Further, the Digital Learning Environment received an overall rating of 1.02 on a 4.0 scale suggesting that students are infrequently exposed to authentic learning opportunities through the use of technology. According to school documents, all teachers received professional development to implement differentiation of instruction in the classroom. The extent to which this training has been effective in helping teachers to provide differentiated instruction intended to more effectively engage students in their learning is not apparent, however.

Improvement Priority 7
Indicator 3.6
2013-14
Team Rating 2015-16
School/Distri
ct Self-
Rating
2015-16
Team Rating
Teachers implement the school’s instructional process in support of student learning.
1 2 1.71
1.6. Improvement Priority (2013-14) Implement a school-wide instructional process that clearly informs students of learning expectations and standards of performance, uses exemplars to further guide and inform students of learning targets, uses formative assessments to inform the ongoing modification of instruction, and ensure that students are provided with specific and immediate feedback about their learning.
School Self-
Rating Team Rating
This Improvement Priority has been addressed in an exemplary manner.
This Improvement Priority has been addressed satisfactorily.
This Improvement Priority has been partially addressed. X
There is little or no evidence that this Improvement Priority has been addressed.
X

School Evidence: EPD Faculty meetings Department meetings every second Tuesday Evidence Binders Common planning time provided daily through the master schedule Buddy system for teachers (M and M) PLC (Training with Solution Tree) Tuning Teams Admin/Instructional Leadership weekly walk-throughs Book study Students will receive quick, timely, feedback on their academic progress (See grade reporting protocol) Students receive daily accountability tools, such as Warm Ups, Sponges, and Exit Slips to inform their learning and provide daily formative assessments for teacher instructional use RtI CFAs, Proficiencies, Diagnostics, and MAP scores are used Use of Cascade Data Reflection Sheets
School Supporting Rationale: CFAs, Proficiencies, Diagnostics, and MAP scores are used to monitor student progress, modify instruction, and provide revisions to curriculum. Teachers use the time allowed for EPD to analyze data, plan lessons, and create CFAs. Instructional processes to inform students of learning expectations are used by most teachers. There is a protocol that provides for students/parents to receive feedback every three weeks through the distribution of progress reports. We need to improve on consistently providing students with specific and timely feedback.
Team Evidence: • Self Assessment • Executive Summary • Review of artifacts and documents provided by the school • Stakeholder survey data • Stakeholder interviews • Classroom observations • SBDM Agendas and Minutes • PLC Meeting Agendas and Minutes • 2014 Leadership Assessment • Student performance data

Team Supporting Rationale: Student performance data, as detailed in the attachments of this report, show a decline in student achievement scores across all grade levels. This data does not suggest that the school has been effective in systematically implementing an instructional process that effectively communicates learning expectations and ensures curriculum and instruction are modified and adjusted based on classroom formative assessment data. Observers noted that some teachers posted and/or discussed learning targets or otherwise communicated learning expectations to students at the beginning of class. Staff survey data revealed that 83 percent of staff agreed/strongly agreed with the statement, “All teachers in our school use a process to inform students of their learning expectations and standards of performance.” Observations revealed very limited use of exemplars of high quality student work to further communicate learning expectations. Instances in which students were provided exemplars (B3) were evident in 7 percent of classrooms. Observations also revealed that the use of formative assessment practices were infrequent. For example, instances in which teachers “asked or quizzed student about individual progress/learning” (E1) were evident/very evident in 17 percent of classrooms. Instances in which students had “opportunities to revise/improve work based on teacher feedback,” (E5) were evident/very evident in 17 percent of classrooms. Finally, 58 percent of students indicated in surveys that they agreed/strongly agreed with the statement, “All of my teachers change their teaching to meet my learning needs,” suggesting that the use of formative assessment practices to adjust or modify instruction are inconsistently implemented.
Improvement Priority 8
Indicator 3.8
2013-14
Team Rating 2015-16
School/Distri
ct Self-
Rating
2015-16
Team Rating
The school engages families in meaningful ways in their children’s education and keeps them informed of their children’s learning progress.
1 2 1.71
1.8. Improvement Priority (2013-14) Engage in a process to examine the effectiveness of current practices, culture, policies, surrounding family engagement and communication. Use the results of this examination to shape school culture and develop new strategies and approaches that yield more meaningful engagement of families in their children’s education.
School Self-
Rating Team Rating

This Improvement Priority has been addressed in an exemplary manner.
This Improvement Priority has been addressed satisfactorily.
This Improvement Priority has been partially addressed. X
There is little or no evidence that this Improvement Priority has been addressed.
X
School Evidence: Parent teacher conferences Spartan camp YSC sponsored activities SBDM PTSA Communication plan Parent-Teacher-Student Compact GCIPL (Governors Commonwealth Institute for Parent Leadership) Remind 101 Positive Phone Call logs Parent involvement plan Social media (Twitter) 3 week grade reporting Parent portal Newsletter (YSC and Counselor) School website Postcards School sponsored activities (academic and extracurricular clubs, Ladies of Leadership, and Men of Quality, sports) Home Visits (Attendance and Family Services)
School Supporting Rationale: Stuart uses Twitter, One Call, mass mailings and newsletters to inform and communicate upcoming events with parents. Most of our student performances are very well attended by families and friends; however, with our best efforts only 124 families were present at parent teacher conferences held in October. In order to help improve parent involvement, the Learning Environment Committee developed a policy for classroom visits to present to SBDM to adopt as a policy. The academic committee is also developing activities for school and community leaders to build parent understandings of academic expectations, school strategies and student achievement results. Counselors are also opening computer labs to parents and students to assist with the High school/Magnet application process.

Team Evidence: • Self Assessment • Executive Summary • Review of artifacts and documents provided by the school • Stakeholder surveys • Stakeholder interviews • SBDM Agendas and Minutes • PLC Meeting Agendas and Minutes • Missing Piece • School Website
Team Supporting Rationale: Interviews with teachers and parents consistently suggest that effective communication between parents and the school is an ongoing concern. Principal and teacher interviews indicated that the school has difficulty achieving and sustaining parental involvement. In interviews many teachers indicated that parents received grading progress of their child’s grades every three weeks. Additionally, teachers said that at the beginning of the school year they contacted the parents of their homeroom students to introduce themselves. The Missing Piece Diagnostic, which is in place to help guide improvement in parent involvement and engagement, indicates an” apprentice” or “novice” rating for several indicators including: Indicator 3.2 - School staff implements systematic efforts to inform parents about academic goals, class
work, grades and homework for their children in their home language. (For example, classroom
contracts, student assignment books, homework websites, and online grade books).
Indicator 3.7 - Stakeholder survey data is consistently used to plan school improvement efforts and to
evaluate their effectiveness.
Survey data regarding parent and stakeholder involvement is very mixed and does not suggest that the school has been effective in establishing culture, practices or policies that foster meaningful parent engagement. For example, 84 percent of staff indicated that they agreed/strongly agreed with the statement, “Our school’s leaders provide opportunities for stakeholder to be involved in the school.” On the other hand, 56 percent of parents indicated that they agreed/strongly agreed with the statement, “Our school provides opportunities for stakeholder to be involved in the school.” Similarly, 59 percent of parents indicated that they agreed/strongly agreed with the statement, “All of my child’s teachers keep me informed regularly of how my child is being graded,” suggesting that roughly 40 percent cannot confirm the existence of these effective practices. Neither documentation nor interviews confirmed that the school had engaged in a process to examine current practices used to engage and communicate with parents and to use that information to design and implement new strategies and approaches specifically intended to yield more meaningful parent engagement.

Improvement Priority 9
Indicator 3.12
2013-14
Team Rating 2015-16
School/Distri
ct Self-
Rating
2015-16
Team Rating
The school provides and coordinates learning support services to meet the unique learning needs of students.
1 2 1.57
1.12. Improvement Priority (2013-14) Systematically and continuously use data to identify unique learning needs of all students at all levels of proficiency providing and coordinating the full use of all available learning support services.
School Self-
Rating Team Rating
This Improvement Priority has been addressed in an exemplary manner.
This Improvement Priority has been addressed satisfactorily.
This Improvement Priority has been partially addressed. X
There is little or no evidence that this Improvement Priority has been addressed.
X
School Evidence: Data analysis sheets Data walls in all contents Proficiency exams Reading and math programs for low performing reading and math students Analysis of assessment results Evidence Binders PLC –unit planning Tuning Teams PDSA cycle of ILT Data analysis policy RtI Course Recovery Transition Island/Center Grade Reporting Checklist

School Supporting Rationale:
Support services are provided using a systematic and continuous approach to student learning. Data from various sources is used to identify the learning needs of all students. Support services are monitored to determine next steps throughout the year. In the RtI process we use both academic and behavioral data to identify the specific needs of students and provide them with necessary services.
Team Evidence: • Self Assessment • Executive Summary • Review of artifacts and documents provided by the school • Stakeholder survey data • Stakeholder interviews • Classroom observations • SBDM Agendas and Minutes • PLC Meeting Agendas and Minutes • 2014 Leadership Assessment • Student performance data
Team Supporting Rationale: Student performance data, as detailed elsewhere in this report, do not suggest that the school has been effective in developing strategies and approaches that allow teachers to fully and authentically engage students with widely varying learning needs. Documentation and interviews revealed that the school has Response to Intervention (RtI) process in place to support students who are not meeting learning expectations and who may have unique learning needs; however, it is unclear that these processes are consistently used to identify and address these learning differences. As discussed previously in this report, use of differentiated instruction is very limited based on classroom observation data. Nearly all instruction is whole group, teacher-centered and requires that students be passive listeners. For example, instances in which students were provided additional/alternative instruction and feedback at the appropriate level of challenge for her/his needs,” was evident in 14 percent of classrooms. Instances in which observers were able to detect that students were “actively engaged in the learning activities” was evident in 14 percent of classrooms. Evidence of active engagement was not observed in 41 percent of classrooms. Survey data with regard to unique learning needs is very mixed and does not suggest the existence of broad agreement among all three stakeholder groups that student learning needs are satisfactorily addressed by teachers. Eighty-five percent of staff indicated that they agreed/strongly agreed with the statement, “In our school, all staff members use student data to address the unique learning needs of all students.” Parent and student perceptions, on the other hand, differ significantly. Fifty-eight percent of parents indicated that they agreed/strongly agreed with the statement, “All of my child’s teachers meet his/her learning needs by individualizing instruction.” And, 58 percent of students indicated that they agreed/strongly agreed with the statement, “All of my teachers change their teaching to meet my learning needs.”

School Diagnostic Review Summary Report
Stuart Middle School
Jefferson County Public Schools
11/08/2015 – 11/11/2015
The members of the Stuart Middle School Diagnostic Review Team are grateful to the district and school leadership, staff, students, families and community for the cooperation and hospitality extended to us during the assessment process. Pursuant to KRS 160.346, the Diagnostic Review Team has examined extensive evidence and arrived at the following recommendations: Principal Authority: The principal does not have the ability to lead the intervention and should not remain as principal of Stuart Middle School to continue her roles and responsibilities established in KRS 160.345. Council Authority:
School council of Stuart Middle School does have the ability to continue its roles and responsibilities established in KRS 160.345.
I have reviewed the recommendations of the Diagnostic Review Team and adopt them as my determination pursuant to KRS 160.346. Commissioner, Kentucky Department of Education ________________________________________________Date:________________ I have received the diagnostic review report for Stuart Middle School. Principal, Stuart Middle School ________________________________________________Date:________________ Superintendent, Jefferson County Public Schools ________________________________________________Date:________________