Report of the Commissioner of Insurance
113
2007 INSURANCE ANNUAL REPORT Report of the Commissioner of Insurance for the year ended 31 st December, 2007
Transcript of Report of the Commissioner of Insurance

2007 INSURANCE ANNUAL REPORT
Report of the
Commissioner
of Insurance for the year ended
31st December, 2007

Insurance Regulatory Authority
ii
2007 INSURANCE ANNUAL REPORT
Prepared by
Insurance Regulatory Authority
Location of Office:
Zep-Re Place
NAIROBI
Address:
P.O. Box 43505
00100 NAIROBI
Tel: 254-020-2710126
Telefax: 254-020-311389
e-mail:[email protected]
Web-site: www.ira.go.ke

Insurance Regulatory Authority
iii
2007 INSURANCE ANNUAL REPORT
OUR VISION
A World Class Insurance Industry
OUR MISSION
To effectively and professionally regulate, supervise and develop
the insurance industry as provided for under Insurance Act.
OUR CORE VALUES
Integrity
Professionalism
Team spirit
Respect
Customer oriented
TABLE OF CONTENTS
I R A

Insurance Regulatory Authority
iv
2007 INSURANCE ANNUAL REPORT
Transmittal Letter …………………… v
Rider
……………………
vi
Members of the Board
…………………….
vii
Chairman’s Statement
……………………
ix
Chief Executive’s Report
……………………
x
Part 1: Working of the Insurance Act
……………………
1
Part 2: Industry Highlights
……………………
11
Part 3: Insurance Activities
……………………
13
Part 4: Reinsurance Activities
……………………
25
Part 5: Balance Sheet
……………………
33
Part 6: Investments
……………………
35
Part 7: Industry Profit and Loss Statement
……………………
38
Part 8: Insurance Statistics
……………………
40
Part 9: Current Insurance Industry Directory
……………………
86

Insurance Regulatory Authority
v
2007 INSURANCE ANNUAL REPORT
MINISTER FOR FINANCE
P.O BOX 30007-00100
NAIROBI.
THE HONOURABLE MINISTER FOR FINANCE
Dear Sir,
RE: INSURANCE ANNUAL REPORT-2007
I have the honour to submit the Twentieth Insurance Annual Report in terms of Section 5(2) of
the Insurance Act, Cap 487, for the year ended 31st December 2007.
Yours Faithfully
SAMMY MUTUA MAKOVE
C.E.O/COMMISSIONER OF INSURANCE

Insurance Regulatory Authority
vi
2007 INSURANCE ANNUAL REPORT
RIDER
The information contained in this report has been obtained from the annual accounts, returns
and documents deposited with the Insurance Regulatory Authority, pursuant to the provisions
of Part VI of the Insurance Act, Cap 487, except where adjustments have been made in
consultation with the insurer.
The publication of any summary of an insurer’s return in the report does not necessarily mean
that the returns so summarized have satisfied all the requirements of the Insurance Act, Cap
487, or that the Commissioner of Insurance approves of the accuracy or the contents of the
returns.
All figures are given in thousands Kenya Shillings except where otherwise stated and where
necessary figures have been adjusted to eliminate errors in total due to rounding off.
BOARD MEMBERS OF THE INSURANCE REGULATORY (IRA)

Insurance Regulatory Authority
vii
2007 INSURANCE ANNUAL REPORT
Mr. Steve Omenge Johnson Mainda (Chairman) Qualifications: M.A., B.A. Experience: Chairman, Mediheal Hospital Eldoret 2006 to date; Chairman, Paybill Company and Fountech Africa Corporate ICT Solutions, 2006 to date; Chairman, Kooltel Kenya Ltd, 2006 to date; Managing Director, National Housing & National Construction Corporation, 1979-1990.
Mr Steve Omenge
S. M. Makove
Henry Rotich
Pro Njuguna Ndungu
Stella Kilonzo
Edward Odundo

Insurance Regulatory Authority
viii
2007 INSURANCE ANNUAL REPORT
Mr. Joseph Munene Murage Qualifications: MA, BCom, ACII, Chartered Insurer, AKIM Experience: Assistant Manager, Guardian royal Exchange and
Commercial Union Assurance; General manager and Executive Director, Lion of Kenya Insurance Co. Ltd. (formerly the Guardian Royal Exchange & Commercial Union Assurance Plc); Managing Director & Chief Executive Officer, First Assurance Co. Ltd., (formerly The Prudential Assurance, a U.K. Multinational) Managing Director & Chief Executive Officer, Concord Insurance Co. Ltd. Managing Director & Chief Executive Officer, Madison Insurance Co. Kenya Ltd
Ms. Chemutai W. Murgor
Qualifications: BCom (in Accounting) Experience: Head of Finance, Standard
Chartered Bank; Senior Manager, Deloitte and Touché; Training Manager, Deloitte
and Touché; Accounting & Technical Manager, Deloitte and Touché.
Ms. Grace A. Ngigi Qualifications:BCom (Insurance Option), MBA Experience: Acting Chief Manager, Kenya National Assurance Company, 1986-1996; Chief Insurance Officer, Kenya Power and Lighting Company.
Mr. Moses Buyuka Obonyo
Qualifications: L.L.B Experience: Practicing Advocate at Buyuka
Obonyo & Co Advocates; Specializing in Commercial Law, conveyancing and Civil Litigation; Advocate of the High Court of
Kenya for 20 years
Abdulaziz H. Mohamed Qualifications: Bachelor of Science Finance Experience: Currently Line Pilot, Captain – Jetlink Express Limited; 2004 to date First Officer – East African Safari Air; 2002-2004: Assistant Marketing Executive – Management, Corporate Insurance Company Ltd.; 2000-2002.
Joseph Murage
Chemutai Murgor
Grace Ngigi
Moses Obonyo
Abulaziz Mohamed
Jane Otieno

Insurance Regulatory Authority
ix
2007 INSURANCE ANNUAL REPORT
Chairman’s Statement

Insurance Regulatory Authority
x
2007 INSURANCE ANNUAL REPORT
Chief Executive’s Report
2007 Global Insurance Review and Outlook for 2008*
orld insurance premiums income amounted to USD 4,061
billion in 2007 . This was split into USD 2393 billion in
life and USD 1668 billion in non-life insurance. Life business
made up 59%, same as in 2006. According to New Swiss Re
sigma study (Sigma No. 3/2008) total premium volume grew by
3.3%, in real terms, with life premiums increasing by 5.4% and
non-life premiums by 0.7%.
In 2007, the life insurance premiums increased by 5.4%, which is
above the previous ten year average. In industrialised economies
sales of retirement and other wealth accumulation products
spurred the growth in life insurance.
The growth in life insurance business was driven to large extent by the trend towards single
premium business, pension and annuities products in countries where an aging population and
reductions in state social security benefits were causing a shift from the traditional life
insurance models to pension–driven models.
Global non-life insurance business was profitable despite slow growth of 0.7% in real terms.
Non-life premiums decreased by 0.3% in the industrialized economies and increased by 10% in
the emerging market displaying a continued divergence in performance between the
industrialised world and the emerging markets.
In emerging markets, strong economic performance and catch-up potential were key drivers of
the growth. Globally, downward pressure on premium rates continued in some countries,
though overall technical results were favourable and profitability remained sound.
Global Insurance business outlook
The prospects for growth in life insurance premium in 2008 is expected to moderate as capital
and stock market confusion dampen demand.
Non-life insurance premiums are expected to fall in the industrialised economies with a slightly
slower growth rate in the emerging economies. Rising global inflation is expected to increased
claims costs in long-tail business lines, which will eventually lower profitability.
W

Insurance Regulatory Authority
xi
2007 INSURANCE ANNUAL REPORT
Domestic Macro-Economic Review and Insurance Demand
The year 2007 being electioneering year there were a lot of uncertainties, which affected most
the industries. The anticipated Safaricom Initial Public Offer (IPO) also affected some sectors
of economy especially the financial sector.
During the same period there was laxity in laws enforcement especially in the transport sector
due to campaigns. This resulted to a 10% increase in persons injured or killed in road incidents
in 2007; from 23,264 in 2006 to 25,588 in 2007(Economic Survey 2008).
The economy expanded by 7.0% in 2007 compared to previous year revised growth of 6.4% in
real terms. The key growth drivers were Transport and Communications, taxes on products
Manufacturing, Wholesale and Retail Trade sectors. Insurance sector expanded by 6.0% in
2006.
During the period under review the financial sector recorded a growth of 6.5% compared to
5.5% growth in 2006. The financial sector growth can be attributed to improved public access
to financial services as a result of stiff competition within the sector, increased awareness and
participation in the capital market.
Real per capita grew by 4.0% in 2007 compared 3.5% revised growth in 2006. Average interest
rate on 91days treasury bills increased by 5.2% points by December 2007 to stand at 6.9%,
however in real terms all interest rates were negative owing to high inflation rate during the
period. The overall year on year inflation dropped from 14.5% in 2006 to 9.8% in 2007.
Financial Markets
The stock market (NSE) experienced a downward turn over the period under review. The
insurance industry invested Ksh29.7 billion in ordinary shares in 2007 compared to Ksh25.8
billion in 2006. This was a growth of 15.1% compared to 63.3% recorded in 2006. The share of
insurance industry investments in ordinary shares to total industry investments dropped from
26.9% in 2006 to 25.9% in 2007. On the other hand share of investments in Government
securities by insurers increased slightly above 2006 position of 32.4 to stand at 33.2 % up 2.5
% points in 2007.

Insurance Regulatory Authority
xii
2007 INSURANCE ANNUAL REPORT
Economic and Insurance Indicators
Item Years Percentage
Change
2006/07 2003 2004 2005 2006 2007
Gross Direct
Premium (Kshs.
billion)
29.2
32.5
36.3
41.5
48.01
15.7
GDP(% growth rate
) at constant 2001
prices
2.9
5.1
5.8
6.4
7.0
9.4
GDP(Market Prices)
Kshs. Billion
Revised
1,131.8
1,274.0
1,418.1
1,620.7
1,814.2
11.9
Insurance
Penetration ratio (%)
2.6
2.5
2.5
2.5
2.6
4.0
Insurance Density
(Kshs.)
884.8
955.9
1,037.1
1,152.8
1,290.6
12.0
Inflation adjusted
Gross Direct
Premium growth (%)
2.9
-0.3
1.4
1.7
5.9
247.1
Sources: GOK Annual Economic Survey and Annual Insurance Reports
Insurance penetration ratio increased by 4% to stand at 2.6% in 2007. Real premium growth
continued to improve rising from 1.7% in 2006 to 5.9% in 2007. On per capita basis
(Insurance density) an average of Kshs. 1,290.6 was spent on insurance.
Comparative Trends of Real GDPI, GDP and Insurance Penetration Ratio
-1
0
1
2
3
4
5
6
7
8
2003 2004 2005 2006 2007
Year
Perc
en
tag
es
Real growth in GDPI Insurance Penetration ratio Real growth in GDP

Insurance Regulatory Authority
xiii
2007 INSURANCE ANNUAL REPORT
During the year under review non-life underwriting results for the industry reduced by 67%.
This was mainly contributed by a decline in underwriting profits in the following classes:
Aviation, Fire Industrial, Marine, Motor Commercial, Motor Private and Workmen’s
Compensation.
The life insurance business grew by 29.7% during the year; however the penetration is still
very low at 0.9%. On the other hand general insurance business grew by 9.3% with a
penetration 1.7%.
Challenges facing the industry
The insurance industry faces a number of challenges, among them;
Over capacity and price wars
Poor corporate governance
Inadequate legislative and regulatory framework
Financially weak insurance organizations
Negative public perception and awareness of insurance
High cost of insurance
Corruption and fraud among the stakeholders
Overdependence on traditional products and distribution channels.
We have recognized the need to ensure that our restructuring processes, legislative
amendments, capacity building, and institutional strengthening remain aligned with our
operational goals as well as the government's strategic obligations as given in its vision 2030.
In conclusion, I would like to thank all the industry players for the support and cooperation
accorded to IRA and congratulates the IRA staff for showing such patience and resilience
during that period of change.
SAMMY MUTUA MAKOVE
C.E.O/COMMISSIONER OF INSURANCE

Insurance Regulatory Authority
1 2007 Insurance Annual Report
PART 1 - WORKING OF THE INSURANCE ACT
1.1 AMENDMENTS TO THE INSURANCE ACT
The Insurance (Amendment) Act 2006 which established the Insurance Regulatory Authority
(IRA) became effective on 1st May 2007. The Act stipulates the objects and functions of the
Authority, appointment of board members and their powers. The Act also mandated the
Authority to supervise, regulate and develop the insurance industry in Kenya.
During the year 2007, the following amendments were made to the Insurance Act:
The Sections repealed and amended by the said Insurance (Amendment) Act 2006.
The insurance (Amendment of Schedule) Order, 2007 where the Minimum Capital
requirement was raised to Kshs.300 million for general, Kshs.150 million for life
insurance and Kshs.450 million for composite companies.
1.2 CIRCULARS
The Commissioner issued a total of seven circulars during the year. A list of these circulars is
shown below:
Circular No. Addressed to Subject
IC 01/2007
All Insurers
Insurance (Amendment) Act 2006
on payment of levies to Insurance
Regulatory Authority
IC & RE 01/2007 All Insurers and Re-insurers Reinsurance proposals 2008
IB/01/2007 All Insurance Brokers Renewal of registration as an
Insurance Broker for the year 2008
IC & RE 02/2007 All Insurers and Re-insurers,
Renewal of registration for the year
2008
IB/MIP/12/2007
All Medical Insurance providers Renewal of registration as a Medical
Insurance Provider for the year 2008
IA/02/2007
All Claims Settling Agents,
Insurance Surveyors, Loss
Adjusters, Motor Assessors,
Insurance Investigators and Risk
Managers
Renewal of registration for the year
2008
IC 02/2007
All Insurers Renewal of registration of insurance
agents under the insurance Act, Cap.
487

Insurance Regulatory Authority
2 2007 Insurance Annual Report
1.3 REGISTRATION OF INSURERS
All insurance companies applied for renewal of registration for year 2008 within the statutory time
limit of 30th
November 2007.
The table below shows the number of insurers registered to transact long insurance business, general
insurance business or both classes of insurance business:
Number of Insurers Registered Under Each Class of Business
Category Number
Long term business insurers.......................................… 7
General business insurers...............................……..….. 20
Composite insurers.............................................…..….. 17
Reinsurance companies......................................……… 2
TOTAL...................................................................... 46
A long-term insurer can be registered to transact any or all of the four classes of long term insurance
business namely: bond investment, industrial life, ordinary life and superannuation.
On the other hand, a general business insurer can be registered to transact any or all the twelve classes
of general insurance business namely: aviation, engineering, fire-domestic, fire-industrial, liability,
marine, motor-private, motor-commercial, personal accident, theft, workmen’s compensation and
miscellaneous.
The table below shows the list of insurers who were registered to transact each class of business:
General Insurance Business
Serial Description Number Serial Description Number
Number Registered Number Registered
01 Aviation 6 02 Engineering 35
03 Fire - domestic 35 04 Fire - industrial 35
05 Liability 35 06 Marine 35
07 Motor - private vehicles 35 08 Motor - commercial 36
09 Personal accident 36 10 Theft 35
11 Workmen’s compensation 35 12 Miscellaneous 35
Long Term Insurance Business
Serial Description Number Serial Description Number
Number Registered Number Registered
31 Bond Investment 0 32 Industrial Life 0
33 Ordinary Life 21 34 Superannuation 22
Insurance Regulatory Authority
3 2007 Insurance Annual Report
Reinsurance Business
Both East Africa Reinsurance Company Limited and Kenya Reinsurance Corporation were registered
to transact all classes of long term and general reinsurance business during the year.
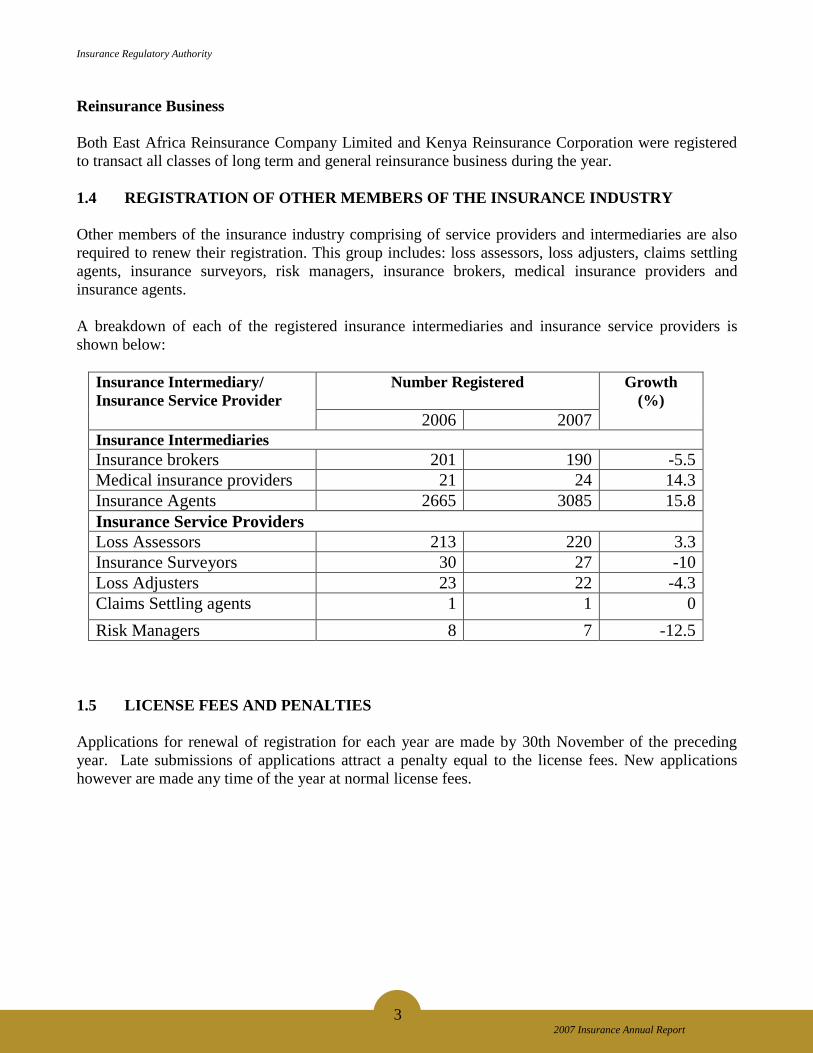
1.4 REGISTRATION OF OTHER MEMBERS OF THE INSURANCE INDUSTRY
Other members of the insurance industry comprising of service providers and intermediaries are also
required to renew their registration. This group includes: loss assessors, loss adjusters, claims settling
agents, insurance surveyors, risk managers, insurance brokers, medical insurance providers and
insurance agents.
A breakdown of each of the registered insurance intermediaries and insurance service providers is
shown below:
Insurance Intermediary/
Insurance Service Provider
Number Registered Growth
(%)
2006 2007 Insurance Intermediaries
Insurance brokers 201 190 -5.5
Medical insurance providers 21 24 14.3
Insurance Agents 2665 3085 15.8
Insurance Service Providers
Loss Assessors 213 220 3.3
Insurance Surveyors 30 27 -10
Loss Adjusters 23 22 -4.3
Claims Settling agents 1 1 0
Risk Managers 8 7 -12.5
1.5 LICENSE FEES AND PENALTIES
Applications for renewal of registration for each year are made by 30th November of the preceding
year. Late submissions of applications attract a penalty equal to the license fees. New applications
however are made any time of the year at normal license fees.

Insurance Regulatory Authority
4 2007 Insurance Annual Report
The license fees applicable in year 2007 are indicated in the table below:
Registration/
Renewal of registration for License fees in Kshs. Penalties in Kshs.
Reinsurer........................ 250,000 250,000
Insurer.............................. 150,000 150,000
Medical Insurance Provider … 10,000 10,000
Insurance Broker............ 10,000 10,000
Risk Manager................. 3,000 3,000
Loss Adjuster................ 3,000 3,000
Loss Assessor................ 3,000 3,000
Insurance Surveyor.............. 3,000 3,000
Claims Settling Agent........... 3,000 3,000
Insurance Agent.................. 1,000 1,000
1.6 CLOSED FUNDS
There exists a number of Closed Funds which are continuously monitored by this office in line with
the requirement of the Insurance Act.
1.7 TRANSFERS AND AMALGAMATIONS
There were no transfers or amalgamations during the year 2007.
1.8 INVESTIGATION OF INSURERS
No investigations were conducted in the year under review.
1.9 INSPECTION OF INSURANCE COMPANIES
During the year under review inspections on various insurance companies were conducted. Among the
issues inspected included premium rates, dealings with intermediaries, follow-ups on previous
inspections and general operations of the company. The companies so inspected were:
Apollo Insurance Company Limited
APA Insurance Company Limited
Co-operative Insurance Company Limited
Kenya Alliance Insurance Company Limited
Invesco Insurance Company Limited
Directline Insurance Company Limited
Standard Assurance Company Limited
First Assurance Company Limited
Lion of Kenya Insurance Company Limited
Heritage Insurance Company Limited
Fidelity Shield Insurance Company Limited
Madison Insurance Company Limited

Insurance Regulatory Authority
5 2007 Insurance Annual Report
Africa Merchant Assurance Company Limited
Gateway Insurance Company Limited
Blue Shield Insurance Company Limited
Corporate Insurance Company Limited
Metropolitan Life Insurance Company Limited
General Accident Insurance Company Limited
Kenindia Insurance Company Limited
Under Section 67(D), any person who upon inspection is found to be transacting insurance business
without registration, renewal of registration or authorization under the Insurance Act, or with person(s)
not so registered or authorized or charging a rate of premium other than that filed with the office of
Commissioner of Insurance as required by Section 75 of the Insurance Act shall be separately liable to
pay a penalty of two hundred thousand shillings. Companies found not to be in compliance were
penalized appropriately.
1.10 COMPLAINTS
The Authority during the year under review received complaints from policyholders and general public
against insurers and insurance intermediaries in which over 80% of them were resolved.
The highest number of complaints emanated from employees citing unauthorized deductions by their
employers and remitted to insurers for policies they have not signed for. This is normally a result of
misselling by insurance agents.
1.11 SUBMISSION OF RETURNS
Various returns are made to the Commissioner’s office either monthly, quarterly, or annually. These
include monthly summary of claims, monthly particulars of investments, quarterly un-audited accounts
and the annual audited accounts and returns among others.
Monthly returns are submitted within thirty days of the end of the month to which they relate. As for
quarterly accounts, submission should be within forty five days from the end of the quarter to which
they relate. Audited annual accounts and returns under Part VI of the Insurance Act are due for
submission within four months after the end of the period to which they relate.
Penalties are charged where an insurer fails to submit any document(s) under Section 61(1) of the
Insurance Act within the specified period prescribed or on late submission. The Penalty is two hundred
thousand Kenya shillings with a further penalty of ten thousand shilling for every day after the expiry
of the prescribed period during which the document(s) remain un-submitted.
All insurers submitted the annual returns within the statutory time limit with the exception of the
following:
Kenya National Assurance (2001) Limited, Kenya Reinsurance Corporation Limited, Geminia
Insurance Company Limited and Concord Insurance Company Limited were granted extension
of the submission dates.
Metropolitan Life Assurance Company Limited and Keya Alliance Insurance Company
Limited made late submissions and paid penalties amounting to Kshs.220,000 each.

Insurance Regulatory Authority
6 2007 Insurance Annual Report
1.12 SOLVENCY MARGINS
As at 31st December 2007 every insurer carrying on long term insurance business was
required to maintain a solvency margin of ten million Kenya shillings or 5% of admitted
liabilites in excess of admitted liabilities whichever is higher. On the other hand every insurer
carrying on general insurance business in Kenya is required to keep at all times admitted assets of not
less than the aggregate value of his admitted liabilities and ten million shillings, or 15% of
his net premium income during his last preceding financial year, whichever is the greater.
Insurers carrying on both long term and general insurance business were required to maintain separate
solvency margins. Analysis of the technical solvency of each insurer is included in the summaries.
The industry solvency margin ratio (SMR) for long term and general insurance business stood at 272%
and 502% respectively in 2007, implying that the industry was generally solvent. However the SMR
for six insurers were below 100%. The solvency margin ratio is calculated by taking available solvency
margin (ASM) divided by required solvency margin (RSM) as a percentage.
1.13 INSURANCE PREMIUM LEVY
The 1.5% premium levy and penalties collected as per section 197 is paid by both insurers and medical
insurance providers. Effective 1st May 2007 premium levies became payable to IRA and payment of
premium taxes to the Ministry of finance ceased. During the year insurers’ premium levy amounted to
Kshs.593.10 million against Kshs.508.42 million in 2006 representing a growth of 16.7%. The medical
insurance providers paid a total of KShs.27.82 million as premium levy during the year 2007 a growth
of 53.1% from the previous year.
On the other hand the 5% reinsurance premium levy and penalties amounted to Kshs.78.34 million
against Kshs.76.22 million in 2006 representing an increase of 2.8%.
1.14 INSURANCE TRAINING LEVY
The 0.2% insurance training levy is levied on the gross direct premium written by general insurers. The
levy is charged on the policyholders and collected by the insurers on behalf of Insurance Training and
Education Trust. During the year 2007, an amount of Kshs.61.63 million was collected compared to
Kshs.54.76 million in 2006 representing a growth of 12.5%.
1.15 POLICYHOLDERS’ COMPENSATION FUND
The Policyholders’ Compensation Fund (PHCF) was established on 24th
September 2004 by the
Minister for Finance pursuant to the provisions of Section 179 (2) of the Insurance Act.
The purpose of the Fund is to promote confidence in the insurance industry and also relief
policyholders of the suffering they may undergo in the event of unfortunate collapse of an insurer.
The Fund became effective from 1st January 2005 and collected Kshs.175.16 million during the year
2007 compared to Kshs.151.89 million in year 2006 representing a grow of 15.3%. Insurers and
policyholders contribute equally to the Fund through monthly levy of 0.5% on gross direct premium
written. The maximum compensation payable to policyholders by the Fund on any one claim is

Insurance Regulatory Authority
7 2007 Insurance Annual Report
Kshs.100,000. Claims arising out of policies issued before the commencement of the Fund operations
are not covered under the scheme.
The administration of the Fund is vested in a Board of Trustees. The Retirement Benefit Authority
(RBA) is the managing trustee of the Fund.
Board Members of PHCF during the year under review
1. Prof. Chege Waruingi – Chairman
2. Commissioner of Insurance
3. Bill Inamdar
4. Andrew Greenwood
5. Geoffrey Njenga
6. Anne Rama
7. Charles Mwaura
8 Retirement Benefits Authority – Managing Trustee and Secretary
1.16 ACTUARIAL VALUATIONS
All companies transacting long-term insurance business submitted their actuarial valuation reports.
Most of these valuations were carried out using the minimum basis set out under Section 58 and
Seventh Schedule to Regulation 15 of the Insurance Act.
Net actuarial liabilities for the industry before distribution of surplus amounted to Kshs.49.02 billion.
The total surplus arising in the valuations amounted to Kshs.8.97 billion. Of the total surplus, Kshs.2.2
billion was distributed to policyholders as bonus to participating individual policies or interest to
Deposit Administration Schemes. Kshs.0.7 billion went to shareholders while the balance was carried
forward un-appropriated in the life funds.
All insurers complied with Section 46(5) of the Insurance Act on the distribution of surplus to the
shareholders.
The table below shows total life-funds, net actuarial liabilities and distribution of surpluses:
Year
Total Life
Funds
Net actuarial
Liabilities
Total
Surpluses
Surplus distribution
Policyholders Shareholders
Carried
forward
2005 38,452,636 36,210,798 4,964,608 1,291,075 580,549 3,092,984
2006 50,283,070 43,575,871 7,170,868 2,259,856 751,984 4,159,028
2007 55,288,683 49,021,232 8,969,732 2,202,543 704,102 6,063,087
Figures in thousands Kshs.
The life fund grew by 9.95% compared to the net actuarial liabilities growth of 12.5%.
The graph below depicts the trend for total life funds, net actuarial liabilities and total surplus for the
years 2005 to 2007.

Insurance Regulatory Authority
8 2007 Insurance Annual Report
0
10,000,000
20,000,000
30,000,000
40,000,000
50,000,000
60,000,000
Fig
ure
s in
th
ou
san
ds K
sh
s
Life Fund Net Actuarial Liabilities Total surplus
Life fund, net actuarial liabilities and total surpluses
2005 2006 2007
The chart below shows the distribution of surplus for the year 2007:
Surplus distribution for the year 2007
Policyholders
25%
Shareholders
8%Carried forward
67%
1.17 REINSURANCE
The domestic market is served by two locally incorporated reinsurance companies, Kenya Reinsurance
Corporation (a Government Corporation) and East Africa Reinsurance Company (a private company).

Insurance Regulatory Authority
9 2007 Insurance Annual Report
There are also two regional reinsurance companies, the PTA Reinsurance Company and Africa
Reinsurance Corporation. Other international reinsurers serve the market either through reinsurance
brokers or directly through their own liaison offices.
The Kenya Reinsurance Corporation continues to enjoy 18% mandatory cessions on all treaties, which
is set to expire on 1st January 2011 or on privatization whichever comes earlier. PTA Reinsurance
Company and Africa Reinsurance Corporation enjoy mandatory treaty cessions of 10% and 5%
respectively. Note that for the purpose of the Insurance Act, reinsurance companies are generally
treated as insurance companies.
1.18 INSURANCE APPEALS TRIBUNAL
The Insurance Act authorizes the Minister to establish a Tribunal for the purpose of hearing appeals
under the Act.
The following are the members of the Tribunal appointed through the Kenya gazette dated 15th
September, 2005 for a period of three years.
Members of the Appeals Tribunal
1. Lee Muthoga – Chairman
2. Kenneth Akide
3. Catherine Kimura
4. Pratul Shah
5.
6.
Daniel Twiere Ole Kaata
Jacqueline Nanyama-Secretary
The tribunal did not hear any matter during the year under review.

Insurance Regulatory Authority
10 2007 Insurance Annual Report
1.19 INSURANCE REGULATORY AUTHORITY STAFF
The Authority had, at end of the review period 61 staff with a composition of 49% female and 51%
male. The Authority has continued to train its staff both professionally and academically. The
following is the current staffing and qualifications status:
University Graduates
With Masters degree/Postgraduate Diploma 8
With ACII qualifications 8
With AIIK qualifications 10
With CPA(K) qualifications 2
With CII Diploma qualifications 3
With part ACII/AIIK/AIII qualifications 14
With part Actuarial qualifications 5
Non-University Graduates
With Diploma qualifications 6
With Part AIIK qualifications 2
With professional Certificate qualifications 22
Other qualifications 25

Insurance Regulatory Authority
11 2007 Insurance Annual Report
PART 2 - INDUSTRY HIGHLIGHTS
2.1 INSURANCE INDUSTRY AT A GLANCE
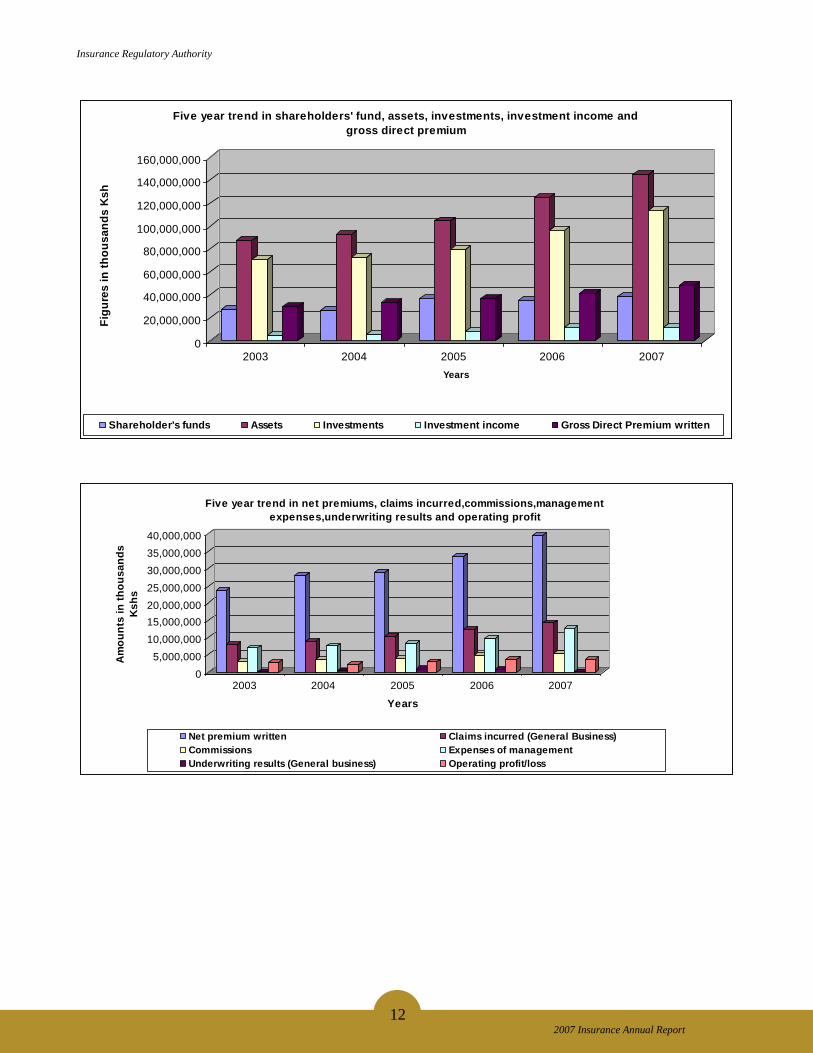
The table below shows income, investments, expenses, commissions and underwriting balances of the
insurance industry for the last five years:
Item YEARS
2003 2004 2005 2006 2007
Growth
(%)
Shareholder's funds 26,923,695 26,609,450 36,447,346 34,574,575 38,348,735 10.92
Assets 87,157,032 92,065,533 104,464,874 124,737,706 146,541,007 17.48
Investments 70,714,150 72,504,508 79,400,355 95,836,181 114,589,974 19.57
Investment income 4,455,714 5,580,197 7,583,790 11,227,800 11,141,669 -0.77
Gross Direct Premium
written 29,215,744 32,489,552 36,306,265 41,475,358 48,012,987 15.76
Net premium written 23,765,633 28,029,923 29,023,028 33,520,388 39,628,480 18.22
Claims incurred (General
Business) 7,933,129 8,827,577 10,383,822 12,359,561 14,235,405 15.18
Commissions 3,201,677 3,735,386 4,077,833 4,858,458 5,504,342 13.29
Expenses of management 7,009,998 7,664,556 8,348,766 9,853,675 12,902,101 30.94
Underwriting results
(General business) 224,457 412,094 936,212 715,860 236,011 -67.03
Operating profit/loss 2,843,659 2,320,364 3,085,230 3,836,587 3,549,898 -7.47
Commission ratio 13.5 13.3 14.1 14.4 13.9 -3.47
Management expense
ratio (%) 29.5 27.3 28.8 29.4 32.6 10.88 Figures in thousands Kshs.
The gross direct premium written for the industry grew by 15.8% while the net premium written grew
by 18.2%. There was a 67% decrease in underwriting results between the years 2006 and 2007 (from
Kshs.715.86 million to Kshs.236.01 million).
The decline in underwriting profit was mainly contributed by underwriting profit decline in the
following classes: Aviation (184.2%), Fire Industrial (70.9%), Motor Commercial (39%), Marine
(17.9%) and Miscellaneous (10.7%)
The investment income declined by 0.77% while the operating profit declined by 7.5%.
Insurance Regulatory Authority
12 2007 Insurance Annual Report
0
20,000,000
40,000,000
60,000,000
80,000,000
100,000,000
120,000,000
140,000,000
160,000,000
Fig
ure
s i
n t
ho
us
an
ds
Ks
h
2003 2004 2005 2006 2007
Years
Five year trend in shareholders' fund, assets, investments, investment income and
gross direct premium
Shareholder's funds Assets Investments Investment income Gross Direct Premium written
0
5,000,000
10,000,000
15,000,000
20,000,000
25,000,000
30,000,000
35,000,000
40,000,000
Am
ou
nts
in
th
ou
sa
nd
s
Ks
hs
2003 2004 2005 2006 2007
Years
Five year trend in net premiums, claims incurred,commissions,management
expenses,underwriting results and operating profit
Net premium written Claims incurred (General Business)
Commissions Expenses of management
Underwriting results (General business) Operating profit/loss

Insurance Regulatory Authority
13 2007 Insurance Annual Report
PART 3 INSURANCE ACTIVITIES.
3.1 PREMIUM INCOME
3.1.1 LONG TERM INSURANCE BUSINESS
The table below shows the Gross Direct Premium of the insurance industry under long-term business
over the last five years.
Gross Direct Premium
Class of business Years
2003 2004 2005 2006 2007
Bond investment 0 0 0 0 0
Industrial life 0 0 0 0 0
Ordinary life 3,708,064 4,367,501 4,875,222 6,071,610 6,188,155
Superannuation 4,811,951 5,654,206 6,417,588 7,084,989 10,869,388
TOTAL 8,520,015 10,021,707 11,292,810 13,156,599 17,057,543 Figures in thousands Kshs
The chart below illustrates the trend for the gross written premium for long term insurance business for
the years 2003 to 2007.
0
2,000,000
4,000,000
6,000,000
8,000,000
10,000,000
12,000,000
Fig
ure
s i
n t
ho
usan
ds K
sh
s
2003 2004 2005 2006 2007
Years
Long term gross written premium
Ordinary life Superannuation
Gross Direct Premium under long term insurance business amounted to Kshs.17.06 billion in the year
2007 compared to Kshs.13.16 billion in the year 2006 representing a 29.65% increase. Out of the total
Gross Direct Premium written, 36.3% relates to ordinary life business while 63.7% relates to
superannuation business. The average market premium was Kshs.710.73 million which increased from
Kshs.548.19 million in year 2006. Only eight companies exceeded this average.

Insurance Regulatory Authority
14 2007 Insurance Annual Report
The leading eight (8) long term insurers controlled 85.9% of the market in terms of gross direct
premium while the rest sixteen (16) controlled 14.1%. The eight are insurers with at least 5% of the
market share.
The chart below illustrates the distribution of the gross direct premium under long term insurance
business in the year 2007:
Classwise distribution of gross direct premium under long term insurance
business
Ordinary life
36%
Superannuation
64%
Ordinary life Superannuation
3.1.2 General Insurance Business
The table below shows the distribution of gross direct premium incomes per class over the last five
years.
GENERAL INSURANCE GROSS DIRECT INCOME PER CLASS
Class of business Years
2003 2004 2005 2006 2007
Aviation 294,404 252,002 158,007 171,313 257,046
Engineering 516,227 636,958 748,251 933,137 914,586
Fire Domestic 520,640 537,047 553,847 595,454 620,193
Fire industrial 2,843,122 2,886,409 3,056,866 3,339,838 3,429,946
Liability 634,085 654,103 619,672 704,104 731,882
Marine 1,035,418 1,174,384 1,205,723 1,268,284 1,494,747
Motor Private 3,153,812 3,708,869 4,162,757 4,692,590 5,162,054
Motor Commercial 5,549,879 6,135,711 6,833,071 7,725,967 8,229,243
Personal Accident 3,152,526 3,613,278 4,374,507 5,117,374 6,038,785
Theft 1,103,365 1,288,251 1,387,030 1,572,882 1,582,514
Workmen's Compensation 982,676 1,090,047 1,292,875 1,494,695 1,565,778
Miscellaneous 351,936 490,786 620,850 703,121 928,670
TOTAL 20,138,090 22,467,845 25,013,455 28,318,759 30,955,444 Figures in thousands Kshs.
Insurance Regulatory Authority
15 2007 Insurance Annual Report
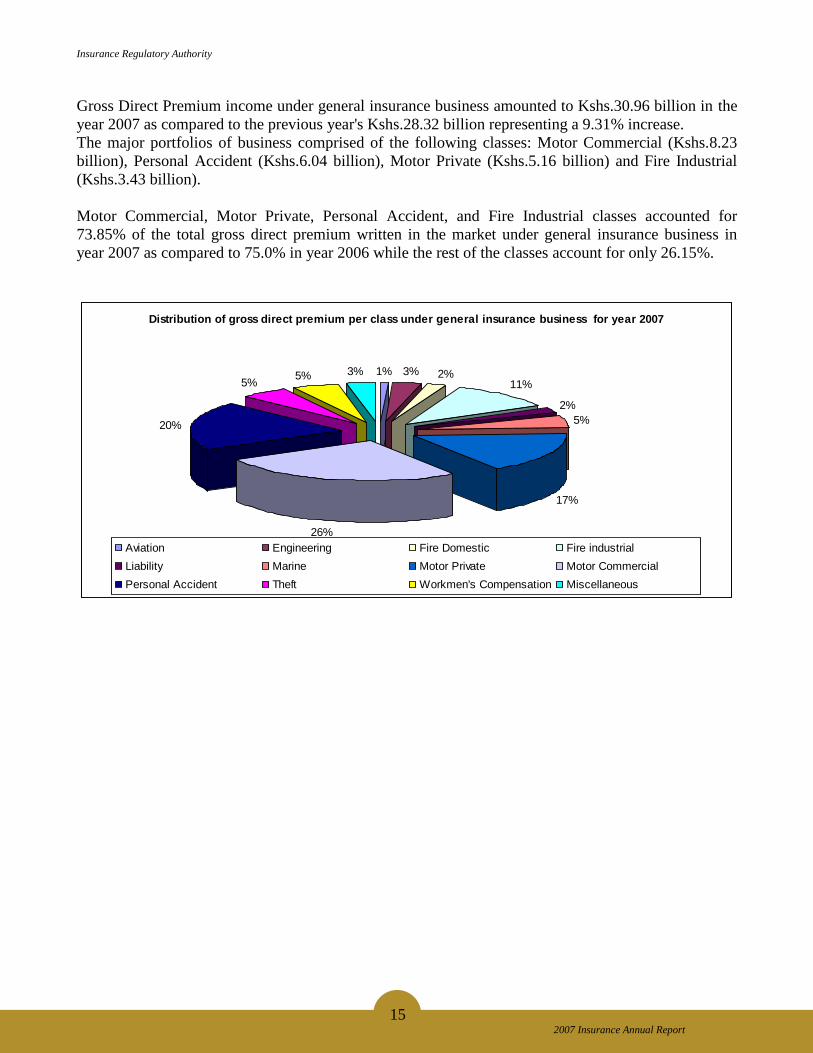
Gross Direct Premium income under general insurance business amounted to Kshs.30.96 billion in the
year 2007 as compared to the previous year's Kshs.28.32 billion representing a 9.31% increase.
The major portfolios of business comprised of the following classes: Motor Commercial (Kshs.8.23
billion), Personal Accident (Kshs.6.04 billion), Motor Private (Kshs.5.16 billion) and Fire Industrial
(Kshs.3.43 billion).
Motor Commercial, Motor Private, Personal Accident, and Fire Industrial classes accounted for
73.85% of the total gross direct premium written in the market under general insurance business in
year 2007 as compared to 75.0% in year 2006 while the rest of the classes account for only 26.15%.
Distribution of gross direct premium per class under general insurance business for year 2007
1% 3% 2%11%
2%
5%
17%
26%
20%
5%5% 3%
Aviation Engineering Fire Domestic Fire industrial
Liability Marine Motor Private Motor Commercial
Personal Accident Theft Workmen's Compensation Miscellaneous

Insurance Regulatory Authority
16 2007 Insurance Annual Report
3.2 INDUSTRY NET EARNED PREMIUM INCOME AND INCURRED CLAIMS
3.2.1 INSURERS
The table below shows the net claims breakdown for long term insurance business for the years 2003
to 2007:
Years Growth
Claims: 2003 2004 2005 2006 2007 (%)
by death 908,828 783,356 831,303 936,429 1,206,502 28.8
by maturity 945,602 1,092,218 1,124,367 1,522,035 1,403,509 -7.8
surrenders 2,614,237 2,893,070 3,123,765 3,100,090 4,378,925 41.3
bonus paid 44,846 -51,468 7,347 11,899 135,651 1,040.0
other claims 384,128 320,025 617,540 1,026,666 730,299 -28.9
Total Claims 4,897,641 5,037,201 5,704,322 6,597,119 7,854,886 19.1 Figures in thousands Kshs.
-500000
0
500000
1000000
1500000
2000000
2500000
3000000
3500000
4000000
4500000
Fig
ure
s i
n t
ho
usan
ds K
sh
s
2003 2004 2005 2006 2007
Years
Long term claims trend for the years 2003-2007
death maturity other claims surrenders bonus paid

Insurance Regulatory Authority
17 2007 Insurance Annual Report
The tables below show net earned premium, incurred claims and loss ratios for insurers under general
insurance business for the period 2003- 2007:
Net Earned Premium
Class of business Years
2003 2004 2005 2006 2007
Aviation 10,755 4,855 27,059 12,366 19,510
Engineering 128,488 149,014 191,475 189,577 275,423
Fire Domestic 363,405 358,659 381,479 416,461 439,455
Fire industrial 605786 609,709 733,938 786,422 791,836
Liability 249682 262,659 287,056 307,730 397,828
Marine 590,785 594,104 667,694 683,184 796,672
Motor Private 3,089,695 3,515,266 3,855,234 4,332,650 4,704,080
Motor Commercial 4,875,348 5,506,171 6,085,203 7,110,970 7,474,050
Personal Accident 1,974,841 2,494,897 3,004,372 3,855,678 4,751,499
Theft 578,880 665,428 718,268 824,524 989,647
Workmen's Compensation 883,184 997,543 1,145,629 1,326,965 1,452,485
Miscellaneous 307,880 379,497 415,144 441,660 541,302
TOTAL 13,658,729 15,537,802 17,512,551 20,288,187 22,633,787 Figures in thousands Kshs.
In 2007, net earned premium increased by 11.56%. This is lower than the growth of 15.8% witnessed
between 2005 and 2006.
Incurred Claims
Class of business YEARS
2003 2004 2005 2006 2007
Aviation 7,763 4,885 9,020 1,417 10,065
Engineering 68,405 52,339 86,446 98,767 81,340
Fire Domestic 94,299 98,591 107,195 111,847 115,465
Fire industrial 226,684 240,724 148,535 265,889 446,366
Liability 137,700 116,708 147,613 151,475 109,400
Marine 203,422 210,438 229,775 262,774 373,134
Motor Private 2,292,303 2,341,011 3,204,388 3,286,171 3,565,915
Motor Commercial 2,698,256 2,527,944 3,002,312 3,634,622 4,032,755
Personal Accident 1,352,562 1,605,748 1,879,278 2,769,091 3,232,202
Theft 396,916 379,967 366,789 487,050 512,778
Workmen's Compensation 937,214 1,100,988 1,090,642 1,182,637 1,542,377
Miscellaneous 78,607 148,234 111,830 107,821 213,608
T O T A L 8,494,131 8,827,577 10,383,822 12,359,561 14,235,405
Figures in thousands Kshs.

Insurance Regulatory Authority
18 2007 Insurance Annual Report
Claims incurred by general insurance companies in the year 2007 was Kshs.14.24 billion representing
an increase of 15.18% from the year 2006 figures. The increase is lower than the 19.0% increase in
2006 and 17.63% increase registered in 2005.
Incurred claims ratios
Class of business YEARS
2003 2004 2005 2006 2007
Aviation 17.16 100.6 33.3 11.5 51.6
Engineering 9.46 35.1 45.1 52.1 29.5
Fire Domestic 23.32 27.5 28.1 26.9 26.3
Fire industrial 33.06 39.5 20.2 33.8 56.4
Liability 55.03 44.4 51.4 49.2 27.5
Marine 31.95 35.4 34.4 38.5 46.8
Motor Private 67.49 66.6 83.1 75.8 75.8
Motor Commercial 53.78 45.9 49.3 51.1 54.0
Personal Accident 66.88 64.4 62.5 71.8 68.0
Theft 64.11 57.1 51.1 59.1 51.8
Workmen's Compensation 113.52 110.4 95.2 89.1 106.2
Miscellaneous 22.77 39.1 26.9 24.4 39.5
Total /industry average 40.62 56.80 59.3 60.9 62.9
Workmen’s Compensation, Motor Private, Personal accident, Fire industrial and Motor commercial
had the highest claims incurred ratios. These classes of general insurance business have claims ratios
of over 50.0%. The average claims ratio for the industry during the year was 62.9%. Motor private,
Personal Accident and Workmen’s Compensation had claim ratios higher than the industry average.
0
1,000,000
2,000,000
3,000,000
4,000,000
5,000,000
6,000,000
7,000,000
8,000,000
Fig
ure
s i
n t
ho
usan
ds K
sh
s
Avia
tion
Engin
eering
Fire D
om
estic
Fire in
dustr
ial
Lia
bility
Marine
Moto
r P
rivate
Moto
r
Com
merc
ial
Pers
onal
Accid
ent
Theft
Work
men's
Com
pensatio
n
Mis
cella
neous
Class of insurance business
Distribution of net earned premium and incurred claims per class of business in
year 2007
Net earned Premium Incurred Claims

Insurance Regulatory Authority
19 2007 Insurance Annual Report
Incurred clams ratios per class of general insurance business for the
year 2007
8%5%
4%
9%
4%
7%
12%9%
11%
8%
17%
6%
Aviation Engineering Fire Domestic Fire industrial
Liability Marine Motor Private Motor Commercial
Personal Accident Theft Workmen's Compensation Miscellaneous
3.2.2 REINSURERS
The distribution of net earned premium income per class is shown in the table below:
Class of business Years
2003 2004 2005 2006 2007
Aviation 4,097 66 14,201 16,650 11,352
Engineering 114,650 127,905 187,414 258,254 224,830
Fire Domestic 3,393 1,138 17,146 1,715 10,917
Fire industrial 675,483 1,075,270 1,125,119 1,271,691 1,257,503
Liability 42,422 49,124 77,767 56,336 49,222
Marine 95,509 59,492 282,779 277,000 275,672
Motor Private 12,961 7,816 3,049 5,411 2,245
Motor Commercial 247,837 264,099 274,087 258,640 354,164
Personal Accident 110,530 114,109 82,315 96,633 141,216
Theft 133,155 215,346 256,874 294,218 355,570
Workmen's Compensation 381 330 1,175 363 719
Miscellaneous 282,623 280,990 376,803 406,500 399,119
T O T A L 1,723,041 2,195,685 2,698,729 2,943,411 3,082,529 Figures in thousands Kshs.

Insurance Regulatory Authority
20 2007 Insurance Annual Report
Net earned premium increased by 4.7% between 2006 and 2007 against an increase of 9.1% recorded
between 2005 and 2006. Fire Industrial (40.8%), Theft (11.5%), Motor Commercial (11.5%) and
Miscellaneous (12.9%) accounted for 76.7% of net earned premium under general insurance classes of
business.
The graph below shows net earned premium under reinsurance contracts for the period 2003 – 2007:
0
500,000
1,000,000
1,500,000
2,000,000
2,500,000
3,000,000
3,500,000
Fig
ure
s in
th
ou
sa
nd
s K
sh
s
2003 2004 2005 2006 2007
Years
Net earned premiums for reinsurers for the years 2003-2007
Incurred Claims for Reinsurers
Class of business Years
2003 2004 2005 2006 2007
Aviation 3,853 -24 7,041 3,920 6,649
Engineering 53,557 129,267 39,210 102,319 -3,820
Fire Domestic 90 -965 2,527 561 3,864
Fire industrial 133,444 367,376 599,372 842,286 623,065
Liability 7,175 -396,872 15,870 10,962 -26,869
Marine 42,885 50,651 -15,586 199,281 163,635
Motor Private 4,460 -11,736 -10,864 6,633 31,810
Motor Commercial 157,805 154,156 33,666 236,408 202,833
Personal Accident 74,456 -21,120 40,805 29,520 185,971
Theft 123,224 340,868 147,061 178,568 69,376
Workmen's Compensation 64 -1,001 9,751 5,786 35,759
Miscellaneous 97,635 336,558 248,199 397,251 231,621
T O T A L 698,648 947,158 1,117,052 2,013,495 1,523,894 Figures in thousands Kshs.

Insurance Regulatory Authority
21 2007 Insurance Annual Report
Claims incurred decreased by 24.3%. This may be attributed to claim decrease in Engineering
103.7%), Liability (345.11%), Theft (61.15%) and Miscellaneous (41.7%).
Fire Industrial, Motor Commercial and Miscellaneous classes of business incurred the highest claims
amounts in 2007 accounting for 69.4% of the total claims incurred.
The graph below shows distribution of incurred claims under reinsurance contracts for the year 2007:
-100,000
0
100,000
200,000
300,000
400,000
500,000
600,000
700,000
Fig
ure
s in
th
ou
san
ds K
sh
s
Avia
tion
Engin
eering
Fire D
om
estic
Fire in
dustr
ial
Lia
bility
Marine
Moto
r P
rivate
Moto
r C
om
merc
ial
Pers
onal
Accid
ent
Theft
Work
men's
Com
pensatio
n
Mis
cella
neous
Classes of insurance business
Incurred claims for reinsurers for the year 2007
Incurred Claims ratios for reinsurers under General Insurance Business
Class of business Year
2003 2004 2005 2006 2007
Aviation 94.04 -36.13 49.58 23.54 58.57 Engineering 46.71 101.06 20.92 39.62 -1.70 Fire Domestic 2.65 -84.80 14.74 32.71 35.39 Fire industrial 19.76 34.17 53.27 66.23 49.55 Liability 16.91 -807.90 20.41 19.46 -54.59 Marine 44.9 85.14 -5.51 71.94 59.36 Motor Private 34.41 -150.15 -356.31 122.58 1,416.93 Motor Commercial 63.67 58.37 12.28 91.40 57.27 Personal Accident 67.36 -18.51 49.57 30.55 131.69 Theft 92.54 158.29 57.25 60.69 19.51 Workmen's Compensation 16.80 -302.67 829.87 1,593.94 4,973.44 Miscellaneous 34.55 119.78 65.87 97.72 58.03
Industry Average 40.55 43.14 41.39 68.41 49.44

Insurance Regulatory Authority
22 2007 Insurance Annual Report
The graph below shows the claim ratios for re-insurers’ between the years 2003 and 2007:
0
10
20
30
40
50
60
70
Avera
ge p
erc
en
tag
e
2003 2004 2005 2006 2007
Years
Industry reinsurance claims ratios
3.3 COMMISSIONS AND MANAGEMENT EXPENSES
The tables below show net premium, commissions, management expenses and some financial
performance indicators for the insurance industry during the last five years under long term insurance
business:
Main Financial Performance Indicators of Long Term Insurance Business
Years
Item 2003 2004 2005 2006 2007 Growth(%)
Net Premiums 7,995,129 9,329,458 10,447,538 12,226,833 15,915,372 30.2
Management expenses 2,082,824 2,230,176 2,614,601 3,016,030 3,346,175 10.9
Net Commissions 661,845 801,930 1,078,353 1,368,126 1,584,713 15.8
Claims Ratio 61.3 54.0 54.6 54.0 49.4 -8.5
Management Expense Ratio 26.1 23.9 25.0 24.7 21.0 -14.8
Net Commission ratio 8.3 8.6 10.3 11.2 10.0 -11.0
Expense Ratio 36.1 35.2 37.3 37.2 33.6 -9.7
Combined Ratio 97.4 89.2 91.9 91.2 82.9 -9.0
Investment Income Ratio 51.2 29.3 44.4 61.7 39.5 -35.9
Operating Ratio 46.2 59.9 47.4 29.5 43.4 47.2
Increase/decrease in life fund 3,458,077 2,779,739 4,842,346 7,643,013 7,444,830 -2.6
Figures in thousands Kshs.

Insurance Regulatory Authority
23 2007 Insurance Annual Report
0.0
10.0
20.0
30.0
40.0
50.0
60.0
70.0
Rati
os a
s a
perc
en
tag
e o
f n
et
pre
miu
m
2003 2004 2005 2006 2007
Years
Management expenses ratio, net commissions ratio and investment income ratio for the
years 2003-2007
Management Expense Ratio Net Commission ratio Investment Income Ratio
Trend for operating ratio and increase/ decrease in fund for the years 2003-2007
0
1,000,000
2,000,000
3,000,000
4,000,000
5,000,000
6,000,000
7,000,000
8,000,000
9,000,000
2003 2004 2005 2006 2007
Years
Incre
ase/D
ecre
ase in
fu
nd
in
th
ou
san
ds k
sh
s
0.0
10.0
20.0
30.0
40.0
50.0
60.0
70.0
Op
era
tin
g R
ati
o a
s p
erc
en
tag
e o
f n
et
pre
miu
m
Increase/decrease in life fund Operating Ratio

Insurance Regulatory Authority
24 2007 Insurance Annual Report
Under long term insurance business net commission ratio decreased marginally from 11.2% in 2006 to
10.0% in 2007. During the same period management expense ratio decreased from 24.7% to 21.0%.
General Insurance business
Years
Item 2002 2003 2004 2005 2006 2007
Net Earned Premium 13,848,830 13,658,729 15,537,802 17,512,551 20,288,187 22,633,787
Net Commission 779,622 807,830 1,125,793 1,188,215 1,293,620 1,645,216
Management Expense 3,786,926 4,129,426 4,710,436 5,004,302 5,919,148 6,517,155
Claim Ratio 57.52 59.28 56.81 59.29 60.92 62.89
Commision Ratio 5.63 5.91 7.25 6.78 6.38 7.27
Management Exp. Ratio 27.35 30.23 30.32 28.58 29.18 28.79
Combined Ratio 90.49 95.43 94.37 94.65 96.47 98.96
Investment Income Ratio 1.25 0.28 0.25 0.27 0.41 1.37
Operating Ratio 89.24 95.15 94.12 94.39 96.06 97.59
Underwriting Profit 296,520 224,537 412,094 936,212 715,860 236,011
Underwriting Profit Growth 35.60 -24.28 83.53 127.18 -23.54 -67.03
Figures in thousands Kshs.
During the last five years, commission ratio has been at an average of 11.8% while the management
expense ratio has increased from 22.5% in the year 2003 to 25.1% in the year 2007 under general
insurance business.
The graph below illustrates the trend in net commission, management expense and investment income
ratios under general insurance business for the years 2002 to 2007:
Commissions, Management and Investment Income Ratios for General Insurance
Business for the Years 2002 to 2007
0
5
10
15
20
25
30
35
2002 2003 2004 2005 2006 2007
Years
Ra
tio
(%
)
Commision Ratio Management Exp. Ratio Investment Income Ratio

Insurance Regulatory Authority
25 2007 Insurance Annual Report
The graph below illustrates the relationship between underwriting profit’s trend and operating ratio
under general insurance business for the years 2002 to 2008:
Underwriting Profit Vs Operating Ratio Under General Insurance Business for Years
2002 to 2007
0
100,000
200,000
300,000
400,000
500,000
600,000
700,000
800,000
900,000
1,000,000
2002 2003 2004 2005 2006 2007
Years
Am
ou
nt
('000)
84
86
88
90
92
94
96
98
100
Perc
en
tag
es(%
)
Underwriting Profit Operating Ratio
3.4 UNDERWRITING RESULTS
The distribution of the underwriting results per class for the years 2003 -2007 is as shown below.
Underwriting Results for Insurers 2003 – 2007
Class of business Years
2003 2004 2005 2006 2007
Aviation 6,536 10,162 18,888 8,609 -7,245
Engineering 28,413 92,145 34,500 77,611 123,178
Fire Domestic 109,341 83,299 82,695 87,272 98,021
Fire industrial 236,203 245,729 433,884 264,872 77,144
Liability 203,657 36,846 13,154 8,283 135,829
Marine 23,599 177,086 215,287 170,512 139,941
Motor Private -341,111 -171,377 -728,998 -553,773 -645,450
Motor Commercial 317,939 289,732 765,710 739,258 449,109
Personal Accident -86,307 22,805 205,601 19,122 221,728
Theft 53,755 116,881 174,126 114,113 166,709
Workmen's
Compensation -440,373 -542,056 -446,813 -425,340 -706,358
Miscellaneous 112,885 48,255 168,178 205,321 183,405
TOTAL 224,537 412,094 936,212 715,860 236,011 Figures in thousands Kshs.

Insurance Regulatory Authority
26 2007 Insurance Annual Report
Overall technical results for the industry registered an underwriting profit of Kshs.236 million in 2007
compared to the previous year's underwriting profit of Kshs.715.86 million. This shows a decrease in
underwriting results of 67% from the previous year.
As can be seen from the table above, motor private and workmen’s compensation classes of general
insurance business continued making underwriting losses.
Below is an illustration of the trend in underwriting results for insurers during the years 2003 - 2007.
0
100,000
200,000
300,000
400,000
500,000
600,000
700,000
800,000
900,000
1,000,000
Fig
ure
s i
n t
ho
usan
ds K
sh
s
2003 2004 2005 2006 2007
Years
Underwriting results for insurers for the years 2003-2007
Underwriting Results for Reinsurers 2003 – 2007
Class of business Years
2003 2004 2005 2006 2007
Aviation 6,942 -1,378 -512 4,443 1,855
Engineering 17 -53,140 65,530 35,919 128,671
Fire Domestic 2,000 1,814 6,447 592 -640
Fire industrial 320,602 202,489 -81,044 72,983 5,956
Liability 26,716 421,026 31,454 36,432 63,020
Marine 22,160 58,133 13,448 -19,608 -20,524
Motor Private 1,671 15,743 13,443 -2,133 -29,691
Motor Commercial 42,713 74,542 204,051 71,701 92,479
Personal Accident -15,863 99,210 12,434 32,184 -109,264
Theft -18,555 -226,167 642 23,957 120,292
Workmen's Compensation 231 1,139 -8,925 -5,230 -35,337
Miscellaneous 68,868 -181,977 -38,005 13,945 -16,179
TOTAL 457,502 411,434 218,963 265,185 200,638 Figures in thousands Kshs.

Insurance Regulatory Authority
27 2007 Insurance Annual Report
In the year 2007, the re-insurers’ underwriting profit decreased by 24.34% from Kshs.265.19 million in
2006 to Kshs.200.64 million in 2007.
The graph below shows the underwriting results for re-insurers for the years 2003 through 2007.
0
50,000
100,000
150,000
200,000
250,000
300,000
350,000
400,000
450,000
500,000
Fig
ure
s i
n t
ho
usan
ds K
sh
s.
2003 2004 2005 2006 2007
Years
Underwriting results for reinsurers for the years 2003-2007
Insurance Regulatory Authority
28 2007 Insurance Annual Report
PART 4 - REINSURANCE ACTIVITIES
All locally registered insurance companies are required under the Insurance Act to apply for prior
approval of their reinsurance arrangements by November of the year preceding renewal of registration.
All the insurers' proposed reinsurance arrangements were received within the prescribed time and all
approvals were granted.
In the following paragraphs, inward reinsurance premium income for insurers refers to all premiums
received by insurers by way of facultative acceptances and treaty arrangements. The figures also
include any reinsurance premium received from outside Kenya by insurers who accept reinsurance
business from their subsidiaries where applicable. Outward reinsurance premium on the other hand
includes all premiums ceded by insurers to re-insurers and insurers vide facultative placements and
arrangements.
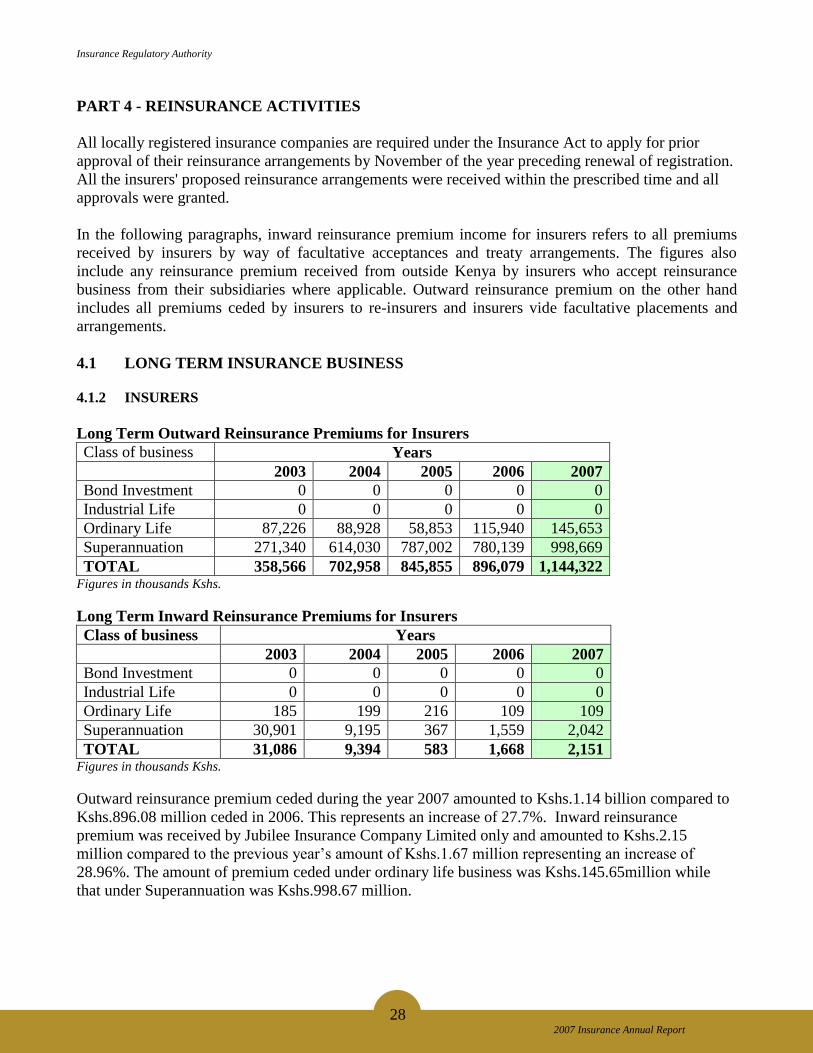
4.1 LONG TERM INSURANCE BUSINESS
4.1.2 INSURERS
Long Term Outward Reinsurance Premiums for Insurers
Class of business Years
2003 2004 2005 2006 2007
Bond Investment 0 0 0 0 0
Industrial Life 0 0 0 0 0
Ordinary Life 87,226 88,928 58,853 115,940 145,653
Superannuation 271,340 614,030 787,002 780,139 998,669
TOTAL 358,566 702,958 845,855 896,079 1,144,322 Figures in thousands Kshs.
Long Term Inward Reinsurance Premiums for Insurers
Class of business Years
2003 2004 2005 2006 2007
Bond Investment 0 0 0 0 0
Industrial Life 0 0 0 0 0
Ordinary Life 185 199 216 109 109
Superannuation 30,901 9,195 367 1,559 2,042
TOTAL 31,086 9,394 583 1,668 2,151 Figures in thousands Kshs.
Outward reinsurance premium ceded during the year 2007 amounted to Kshs.1.14 billion compared to
Kshs.896.08 million ceded in 2006. This represents an increase of 27.7%. Inward reinsurance
premium was received by Jubilee Insurance Company Limited only and amounted to Kshs.2.15
million compared to the previous year’s amount of Kshs.1.67 million representing an increase of
28.96%. The amount of premium ceded under ordinary life business was Kshs.145.65million while
that under Superannuation was Kshs.998.67 million.

Insurance Regulatory Authority
29 2007 Insurance Annual Report
0
200,000
400,000
600,000
800,000
1,000,000
1,200,000
Fig
ure
s i
n t
ho
usan
ds K
sh
s.
2003 2004 2005 2006 2007
Years
Long term outward reinsurance premium for insurers for the
years 2003-2007
0
5,000
10,000
15,000
20,000
25,000
30,000
35,000
Fig
ure
s i
n t
ho
usan
ds K
sh
s.
2003 2004 2005 2006 2007
Years
Long term inward reinsurance premium for insurers for the
years 2003-2007

Insurance Regulatory Authority
30 2007 Insurance Annual Report
Distributions of inward and outward premiums under long insurance business are illustrated by charts
below:
Long term outward reinsurance premium for insurers for the
year 2007
13%
87%
Ordinary Life Super Annuation
Long term inward reinsurance premium for insurers for the
year 2007
5%
95%
Ordinary Life Super Annuation

Insurance Regulatory Authority
31 2007 Insurance Annual Report
4.1.3 REINSURERS
Long Term Inward Reinsurance Premiums for Reinsurers
Class of business Years
2003 2004 2005 2006 2007
Bond Investment 0 0 0 0 0
Industrial Life 0 0 0 0 0
Ordinary Life 34,382 19,174 36,259 52,200 74,184
Superannuation 290,304 242,377 416,869 525,475 589,569
TOTAL 324,686 261,551 453,128 577,675 663,753 Figures in thousands Kshs.
Inward reinsurance premium for reinsurers includes all premiums received from direct insurers who
seek reinsurance protection. These companies ceded Kshs.663.75 million to reinsurance companies in
2007 representing an increase of 14.9% from the previous year.
The following charts depict the five year trend for inward reinsurance premium income for reinsurers
under long term insurance business and its distribution for the year 2007 respectively.
0
100,000
200,000
300,000
400,000
500,000
600,000
700,000
Fig
ure
s i
n t
ho
usan
ds K
sh
s
2003 2004 2005 2006 2007
Years
Long term inward reinsurance premium income for Reinsurers for the
years 2003-2007

Insurance Regulatory Authority
32 2007 Insurance Annual Report
Distribution of long term inward reinsurance premium for reinsurers for
year 2007
11%
89%
Ordinary Life Super Annuation
Outward reinsurance premium includes all premiums ceded by reinsurers vide their retrocession
programs.
Long Term Outward Reinsurance Premiums for Reinsurers
Figures in thousands Kshs.
Outward reinsurance premium ceded by reinsurance companies during the year 2007 amounted to
Kshs.46.23 million representing a decrease of 38.56% from the year 2006.
Class of business Years
2003 2004 2005 2006 2007
Bond Investment 0 0 0 0 0
Industrial Life 0 0 0 0 0
Ordinary Life 0 1,441 5,512 7,293 5,130
Superannuation 63,234 18,189 60,100 67,952 41,099
TOTAL 63,234 19,630 65,612 75,245 46,229

Insurance Regulatory Authority
33 2007 Insurance Annual Report
0
10,000
20,000
30,000
40,000
50,000
60,000
70,000
80,000
Fig
ure
s i
n t
ho
usan
ds K
sh
s
2003 2004 2005 2006 2007
Years
Long term outward reinsurance premiums for reinsurers for the years 2003-2007
4.2 GENERAL INSURANCE BUSINESS
4.2.1 INSURERS
General Business Inward Reinsurance Premiums for Insurers
Class of business Years
2003 2004 2005 2006 2007
Aviation 756 6 12,743 1,679 4,411
Engineering 81,200 95,388 83,978 120,977 126,243
Fire Domestic 610 1,047 2,029 1,911 626
Fire industrial 467,620 417,006 402,258 381,236 355,444
Liability 24,694 16,248 61,733 45,980 23,218
Marine 51,441 57,741 66,911 115,536 74,833
Motor Private 11,508 77,620 95,577 39,540 47,770
Motor Commercial 35,850 54,351 13,907 12,819 7,962
Personal Accident 25,925 63,128 78,286 110,099 103,614
Theft 23,245 23,428 31,863 38,934 34,047
Workmen's
Compensation -731 1,593 11,276 14,882 9,001
Miscellaneous 91,505 110,271 93,409 104,457 137,123
TOTAL 813,623 917,827 953,970 988,050 924,292 Figures in thousands Kshs.

Insurance Regulatory Authority
34 2007 Insurance Annual Report
The total inward reinsurance premiums in the year 2007 amounted to Kshs.924.29 million. Fire
industrial had the highest amount accounting for 38.46% of the total inward reinsurance business in the
industry in 2007.
0
100,000
200,000
300,000
400,000
500,000
600,000
700,000
800,000
900,000
1,000,000
Fig
ure
s i
n t
ho
usan
ds K
sh
s
2003 2004 2005 2006 2007
Years
General insurance business inward reinsurance premiums for insurers for the
years 2003-2007
General Business Outward Reinsurance Premiums for Insurers
Class of business Years
2003 2004 2005 2006 2007
Aviation 277,175 242,734 144,099 161,774 251,395
Engineering 476,059 583,994 622,658 817,674 794,860
Fire Domestic 182,052 173,840 166,931 170,565 161,099
Fire Industrial 2,754,947 2,715,244 2,715,686 2,900,857 3,011,348
Liability 355,380 383,992 381,145 406,824 340,579
Marine 513,461 618,410 606,760 650,943 755,353
Motor Private 420,896 183,900 235,417 222,142 243,221
Motor Commercial 680,011 344,677 393,220 399,813 400,934
Personal Accident 997326 1,046,292 1,071,939 1,147,874 1,039,090
Theft 570,048 629,522 680,206 719,561 625,369
Workmen's Compensation 154,768 52,314 77,240 114,167 66,288
Miscellaneous 238,357 232,167 296,634 336,414 477,092
TOTAL 7,620,480 7,207,086 7,391,936 8,048,609 8,166,628
Figures in thousands Kshs.

Insurance Regulatory Authority
35 2007 Insurance Annual Report
During the year 2007 a total of Kshs. 8.17 billion was ceded out as compared to Kshs. 8.05 billion in
the year 2006 representing an increase of 1.5%. Fire Industrial and Personal Accident accounted for
49.6% of the total outward insurance business in the industry in the year 2007.
The distribution of outward reinsurance premiums paid by insurers in the year 2007 is as shown below:
0
500,000
1,000,000
1,500,000
2,000,000
2,500,000
3,000,000
3,500,000
Fig
ure
s i
n t
ho
usan
ds K
sh
s
Avia
tion
Engin
eering
Fire D
om
estic
Fire Industr
ial
Lia
bility
Marine
Moto
r P
rivate
Moto
r
Com
merc
ial
Pers
onal
Accid
ent
Theft
Work
men's
Com
pensatio
n
Mis
cella
neous
Classes
General insurance business outward reinsurance premiums for insurers for the
year 2007
4.2.2 REINSURANCE COMPANIES
GENERAL BUSINESS INWARD REINSURANCE PREMIUMS FOR REINSURERS
Class of business Years
2003 2004 2005 2006 2007
Aviation 15,769 46 14,485 16,650 10,090
Engineering 63,787 146,446 202,359 282,813 240,579
Fire Domestic 3,444 550 17,647 2,026 14,851
Fire Industrial 551,055 1,387,511 1,554,755 1,548,079 1,641,469
Liability 26,871 68,384 87,868 61,177 48,585
Marine 129,521 80,518 376,652 366,749 360,742
Motor Private 17,204 2,361 3,851 5,411 895
Motor Commercial 270,480 269,856 270,715 318,398 433,803
Personal Accident 144,009 102,078 85,974 102,051 169,102
Theft 231,034 223,012 290,707 304,076 404,446
Workmen's Compensation 353 535 1,310 374 959
Miscellaneous 302,628 342,599 445,258 555,389 634,367
TOTAL 1,756,155 2,623,896 3,351,551 3,563,193 3,959,888 Figures in thousands Kshs.

Insurance Regulatory Authority
36 2007 Insurance Annual Report
The amount of inward reinsurance premiums for re-insurers was Kshs.3.96 billion in year 2007
representing an increase of 11.1% from year 2006. Fire Industrial registered the highest inward
reinsurance premium (Kshs.1.64 billion) accounting for 41.45% of the industry total inward premium.
The graph below illustrates the inward reinsurance premiums for the different classes of general
insurance business for re-insurers during the years 2006 and 2007.
0
200,000
400,000
600,000
800,000
1,000,000
1,200,000
1,400,000
1,600,000
1,800,000
Fig
ure
s in
th
ou
sa
nd
s K
sh
s
Avia
tion
Engin
eering
Fire D
om
estic
Fire Industr
ial
Lia
bility
Marine
Moto
r P
rivate
Moto
r
Com
merc
ial
Pers
onal
Accid
ent
Theft
Work
men's
Com
pensatio
Mis
cella
neou
s
Classes of insurance business
Inward reinsurance premiums for reinsurers for years 2006 and 2007
2006 2007
General Business Outward Reinsurance Premiums for Re-insurers
Figures in thousands Kshs.
Class of business Years
2003 2004 2005 2006 2007
Aviation 0 0 0 0 7
Engineering 23,815 11,908 18,638 24,559 24,477
Fire Domestic 0 0 0 311 1,949
Fire industrial 259,411 243,266 338,014 276,388 367,791
Liability 829 5,055 4,234 4,841 2,126
Marine 28,125 14,552 44,851 89,749 75,211
Motor Private 0 0 0 0 0
Motor Commercial 0 0 0 59,758 57,737
Personal Accident 3,714 11,761 7,027 5,418 6,861
Theft 7,078 10,158 7,153 9,858 8,031
Workmen's
Compensation 9 67 87 11 26
Miscellaneous 10,047 44,794 20,748 148,889 222,253
TOTAL 333,028 341,561 440,752 619,782 766,469

Insurance Regulatory Authority
37 2007 Insurance Annual Report
The total outward reinsurance premium for re-insurers amounted to Kshs. 766.47 million during the
year 2007 representing an increase of 23.67%. Fire industrial accounted for 47.99% of the industry’s
total outward reinsurance premium.
The graph below illustrates the distribution of outward reinsurance premium for the years 2003 – 2007:
0
100,000
200,000
300,000
400,000
500,000
600,000
700,000
800,000
Fig
ure
s in
th
ou
san
ds K
sh
s
2003 2004 2005 2006 2007
Years
General business outward reinsurance premiums for reinsurers for the
years 2003-2007

Insurance Regulatory Authority
38 2007 Insurance Annual Report
PART 5 - BALANCE SHEET
Industry Consolidated Balance Sheet
ITEM Years
2003 2004 2005 2006 2007
Paid-up capital 7,890,361 8,300,013 8,480,380 10,130,982 11,121,882
General Reserve 392,878 670,921 865,621 973,188 1,166,123
Investment Fluctuation
Reserves 5,550,045 4,728,224 5,378,997 4,542,769 3,948,670
Un-appropriated surplus [net] 9,222,916 6,955,537 16,321,812 12,301,678 12,103,763
Other Reserves 3,867,495 5,997,789 5,400,536 6,625,958 10,008,297
Total Paid-Up Capital &
Reserves 26,923,695 26,609,450 36,447,346 34,574,575 38,348,735
Underwriting provisions 51,135,885 56,508,286 56,422,867 77,893,904 94,000,152
Long term liabilities 1,539,002 1,741,738 4,082,149 3,911,527 2,343,697
Current liabilities 7,558,450 7,206,059 7,512,511 8,357,699 11,848,423
Total Paid-Up Capital,
Reserves & Liabilities 87,157,032 92,065,533 104,464,873 124,737,706 146,541,007
Land & Buildings 23,177,164 4,358,960 4,515,656 6,564,313 5,596,795
Investment property 0 17,442,046 14,968,216 10,396,336 16,951,744
Other Fixed Assets 1,460,605 1,260,144 1,562,414 2,656,829 2,101,482
Government Securities 24,833,564 25,175,281 29,559,893 30,975,505 37,988,915
Local Government securities 13,632 0 0 0 0
Other Securities 1,508,776 1,432,078 179,984 184,815 1,169,957
Debentures(Quoted &
Unquoted) 48,640 56,040 77,036 258,511 36,605
Preference Shares(Quoted &
Unquoted) 501 62,518 62,797 62,667 83,605
Investment in subsidiary - 163,419 763,309 771,021 1,409,766
Ordinary Shares(Quoted &
Unquoted) 11,223,221 12,244,125 15,800,223 25,850,332 29,675,196
Secured loans(including loans
on life insurance policies 3,168,358 3,800,655 4,422,070 4,561,070 5,795,484
Unsecured Loans 181,473 347,796 273,698 693,245 832,597
Deposits with Banks and
other financial institutions 6,558,821 7,421,590 8,777,473 15,518,366 15,049,310
Outstanding Premiums 6,342,620 6,922,828 7,321,586 8,351,454 7,532,163
Amounts due from Insurers 3,226,402 5,385,650 5,605,668 9,658,605 7,560,137
Cash 1,535,674 1,692,483 1,852,581 2,583,487 2,412,106
Miscellaneous 3,518,964 4,142,070 8,580,128 5,210,236 11,766,678
Intangible Assets 358,617 157,850 142,142 437,913 578,467
TOTAL ASSETS 87,157,032 92,065,533 104,464,873 124,737,706 146,541,007 Figures in thousands Kshs.

Insurance Regulatory Authority
39 2007 Insurance Annual Report
During the year 2007 the paid up capital in the insurance industry increased by 9.8%. Total assets
increased by 17.48% during the same period. In the year 2007 total admitted assets amounted to
Kshs.133.49 billion and the balance of Kshs.13.05 billion (8.9%) not admitted.
0
20,000,000
40,000,000
60,000,000
80,000,000
100,000,000
120,000,000
140,000,000
160,000,000
Fig
ure
s i
n t
ho
usan
ds K
sh
s
2003 2004 2005 2006 2007
Years
Total assets trend for the years 2003-2007
Insurance companies are expected to invest their assets bearing in mind the solvency, safety and
liquidity needs. Investment schedules spelt out in Section 50 of the Insurance Act should be used as a
minimum guide. Insurance companies should also carefully match their assets and liabilities.

Insurance Regulatory Authority
40 2007 Insurance Annual Report
PART 6 - INVESTMENTS
The total investments of the industry at the end of year 2007 amounted to Kshs.114.59 billion
compared to Kshs.95.84 billion in 2006 registering a growth 19.57% against the previous period
growth of 20.7%. An analysis of the industry's balance sheet shows that 78.2% of the total assets are in
form of investments.
The table below shows the combined industry investment channels.
INVESTMENT CHANNELS Years
2003 2004 2005 2006 2007
Land & Buildings 23,177,164 4,358,960 4,515,656 6,564,313 5,596,795
Investment property 17,442,046 14,968,216 10,396,336 16,951,744
Government Securities 24,833,564 25,175,281 29,559,893 30,975,505 37,988,915
Local Government securities 13,632 0 0 0 0
Other Securities 1,508,776 1,432,078 179,984 184,815 1,169,957
Debentures 48,640 56,040 77,036 258,511 36,605
Preference Shares 501 62,518 62,797 62,667 83,605
Investment in subsidiary 0 163,419 763,309 771,021 1,409,766
Ordinary Shares 11,223,221 12,244,125 15,800,223 25,850,332 29,675,196
Secured loans 3,168,358 3,800,655 4,422,070 4,561,070 5,795,484
Unsecured Loans 181,473 347,796 273,698 693,245 832,597
Deposits 6,558,821 7,421,590 8,777,473 15,518,366 15,049,310
TOTAL 70,714,150 72,504,508 79,400,355 95,836,181 114,589,974
Figures in thousands Kshs.
The table below shows the general insurance business investment channels.
INVESTMENT CHANNELS Years
2003 2004 2005 2006 2007
Government securities 7,766,014 7,132,791 8,949,720 9,103,790 9,529,781
Local authorities 12,144 0 0 0 0
Other securities 525,928 858,025 84,281 124,870 108,556
Debentures 21,239 31,869 41,145 24,352 15,252
Preference shares 501 501 780 650 21,295
Ordinary shares 6,484,823 6,579,179 7,738,067 12,367,008 12,998,834
Investment in subsidiary - 163,419 594,429 602,141 1,162,936
Secured loans 716,701 1,375,789 1,549,692 1,362,149 2,329,492
Unsecured loans 114,811 160,234 128,842 103,966 50,707
Bank deposits 4,393,592 3,829,097 5,030,414 6,368,237 8,333,967
Land & buildings 12,609,327 3,449,591 3,478,048 3,391,452 3,922,437
Investment Property - 8,503,565 6,186,958 6,474,909 7,636,836
TOTAL 32,645,080 32,084,060 33,782,376 39,923,524 46,110,093
Figures in thousands Kshs.

Insurance Regulatory Authority
41 2007 Insurance Annual Report
The table below shows the long term insurance business investment channels.
INVESTMENT CHANNEL Years
2003 2004 2005 2006 2007
Government securities 17,067,550 18,042,490 20,610,173 21,871,715 28,459,134
Local authorities 1,488 0 0 0 0
Other securities 982,848 574,053 95,703 59,945 1,061,401
Debentures 27401 24,171 35,891 234,159 21,353
Preference shares 0 0 62,017 62,017 62,310
Ordinary shares 4,738,398 5,664,946 8,062,156 13,483,324 16,676,362
Investment in subsidiary - 0 168,880 168,880 246,830
Secured loans 2,451,657 2,424,866 2,872,378 3,198,921 3,465,992
Unsecured loans 66,662 187,562 144,856 589,279 781,890
Bank deposits 2,165,229 3,592,493 3,747,059 9,150,129 6,715,343
Land & buildings 10,567,837 909,370 1,037,608 3,172,861 1,674,358
Investment Property - 8,938,481 8,781,258 3,921,427 9,314,908
TOTAL 38,069,070 40,358,432 45,617,929 55,912,657 68,479,881
Figures in thousands Kshs.
Investments by companies transacting long term insurance business accounted for 60% of industry
investments in the year 2007 (58.3% in 2006) while general insurance business contributed 40%.
The distribution of investments between long-term and general insurance business is illustrated by the
chart below.
Distribution of invesments between long term and general insurance
business for year 2007
40%
60%
General Insurance Business Long Term Insurance business

Insurance Regulatory Authority
42 2007 Insurance Annual Report
Long Term insurance business held more assets as well as invested assets than the general insurance
business, as shown in the table below.
Class of Business
Long-term
insurance Business
General insurance
business
Total Assets 74,458,700 72,082,307
Invested Assets 68,479,881 46,110,093
Percentage of investments to total assets (%) 91.97 63.97
The graph below shows different investment channels used by insurers.
0
5,000,000
10,000,000
15,000,000
20,000,000
25,000,000
30,000,000
35,000,000
40,000,000
Fig
ure
s i
n t
ho
usan
ds
Ksh
s
Land &
Build
ings
Investm
ent
pro
pert
y
Govern
ment
Securitie
s
Local G
overn
ment
securitie
s
Oth
er
Securitie
s
Debentu
res
Pre
fere
nce
Share
s
Investm
ent in
subsid
iary
Ord
inary
Share
s
Secure
d lo
ans
Unsecure
d L
oans
Deposits
Investment channels
Distribution of investment channels for the insurance industry for the
years 2006-2007
2006 2007
Percentage share of investment channels for the year 2007
Ordinary Shares
26% Others
3%
Government
Securities
34%
Investment property
14%Secured loans
5%
Deposits
13%
Land & Buildings
5%
Land & Buildings Investment property Government Securities
Others Ordinary Shares Secured loans
Deposits

Insurance Regulatory Authority
43 2007 Insurance Annual Report
PART 7 – INDUSTRY PROFIT AND LOSS STATEMENT
The table below shows the income and expenditure during the last five years:
Item Years
2003 2004 2005 2006 2007
Income:
Profits/loss transferred from revenue
accounts 1,609,046 1,340,264 1,569,845 2,020,670 1,107,627
Investment Income 2,294,321 2,803,082 2,900,764 3,607,871 4,540,716
0ther income 0 38,154 323,954 603,419 703,038
Total income: 3,903,367 4,181,500 4,794,563 6,231,960 6,445,028
Operating expenses:
Management expenses (not charged to any
particular fund or account) 180,808 840,002 183,957 556,558 714,261
Provision for taxation 511,250 375,461 983,129 1,084,498 1,175,895
Other Expenses 282,310 645,673 542,246 779,594 911,328
Total expenses 974,368 1,861,136 1,709,332 2,420,650 2,801,484
Profit/Loss after taxation 2,928,999 2,320,364 3,085,231 3,836,587 3,549,898 Figures in thousands Kshs.
The industry profit after tax decreased by 7.47% during the year 2007. Total industry income increased
by 3.42% while total expenses not charged to any particular fund or account increased by 15.73%.
Provision for taxation increased by 8.4%, as the profit transferred from revenue accounts decreased by
45.19%. Investment income increased by 25.86% during the same period.
INVESTMENT INCOME
Investment income (apportioned to various classes of business)
Long term business - Ordinary life 2,635,663,000
- Superannuation 3,654,951,000
General business - 310,339,000
Investment income not apportioned to any particular fund or account 4,540,716,000
Total 11,141,669,000
The overall investment income during the year 2007 amounted to Kshs.11.14 billion down from 11.23
billion recorded in the year 2006 representing a decrease of 0.8%.

Insurance Regulatory Authority
44 2007 Insurance Annual Report
The graph below illustrates the distribution of the industry’s investment income for the year 2007.
Distribution of industry investment income
24%
33%3%
40%
Ordinary life Superannuation General business Not Appropriated to any fund

Insurance Regulatory Authority
45 2007 Insurance Annual Report
No. Name of Insurer Profit (Loss) Investment Share in Other Management Expenses Other Provision for Unapprtd Total profit Transfers to Dividends Other Unapprtd
Transferred Income motor pool incomes (not charged to any Expenses Taxation Profit/Loss available for Reserves Apprtns Profit/Loss
Revenue particular fund/Account) B/F distribution C/F
1 AIG (K) 187,391 78,797 0 0 0 49,555 68,458 148,175 132398 280,573 88998 120,450 0 71,125
2 Amaco 48,257 8,907 0 0 0 14,359 12,842 29,963 35,683 65,646 0 0 0 65,646
3 APA -13,230 106,187 0 33,128 553 24,045 6,344 95,143 1,360,058 1,455,201 0 21,000 248,734 1,185,467
4 Apollo 0 24,788 0 13,462 3,792 4 25,826 8,628 0 8,628 0 0 0 8,628
5 Blue shied 249,242 90,110 0 0 0 215,753 43,477 80,122 33,586 113,708 0 0 0 113,708
6 British America 251,978 259,775 0 0 0 0 81,133 430,620 222,765 653,385 0 120,000 150,000 383,385
7 Canon 18,417 31,559 0 60,795 0 36,865 285 73,621 416,010 489,631 0 26,250 0 463,381
8 CFC Life 255,032 0 0 0 0 0 79,745 175,287 20,210 195,497 -5,564 163,830 1,411 35,820
9 Concord 52,241 20,137 3,036 1,163 48,652 0 8,339 19,586 6,784 26,370 0 0 0 26,370
10 Cooperative -25,848 39,513 0 17,988 0 0 15,797 15,856 27,915 43,771 -25,000 11,931 0 56,840
11 Corporate -1,800 12,181 0 0 0 0 0 10,381 -15,427 -5,046 0 0 0 -5,046
12 Direct Line 14,668 3,535 0 0 0 7,246 4,395 6,562 0 6,562 0 0 0 6,562
13 East Africa Re 17,986 116,033 0 0 4,516 10,303 36,201 82,999 189,536 272,535 0 0 0 272,535
14 Fidelity Shield 1,991 115,733 0 0 1,894 17,390 10,329 88,111 112,036 200,147 75,548 5,599 0 119,000
15 First Assurance 12,501 90,066 0 0 0 0 20,889 81,678 97,977 179,656 50,000 26,000 -69 103,725
16 Gateway -26,671 57,253 0 0 0 0 5,692 24,890 61,724 86,614 0 11,250 0 75,364
17 Geminia -9,200 32,225 0 7,323 1,274 5,882 4,379 18,813 27,755 46,568 0 0 0 46,568
18 General Accident 24,549 191,267 0 0 0 0 39,872 175,944 59,046 234,990 0 0 0 234,990
19 Heritage AII 28,379 271,034 0 0 2,668 15,291 45,261 236,193 575,499 811,692 0 92,000 0 719,692
20 ICEA 178,301 219,735 -538 0 0 7,566 123,028 266,904 605,932 872,836 0 160,000 0 712,836
21 Intra Africa 19,194 15,616 3,409 7,056 3,600 14,929 8,649 18,097 38,921 57,018 -146 7,500 0 49,664
22 Invesco
23 Jubilee 60,010 319,247 0 2,000 0 0 39,976 341,281 395,729 737,010 0 150,000 1,400 585,610
24 Kenindia -598,426 161,904 0 -1,560 7,847 185,745 0 -631,674 421,396 -210,278 0 0 0 -210,278
25 Kenya Alliance 3,614 82,589 0 -14,265 12,805 13,986 13,544 31,603 176,420 208,023 0 0 0 208,023
26 Kenya Orient 17,378 15,823 856 210 15,222 0 3,601 15,444 0 15,444 0 0 0 15,444
27 Kenya Re 366,739 939,326 0 333,019 476,240 197,098 236,482 729,264 2,707,814 3,437,078 0 218,779 0 3,218,299
28 KNAC (2001) -99,247 0 0 0 0 0 463 -99,710 115,094 15,384 0 0 0 15,384
29 Lion of Kenya -36,993 0 0 207,982 0 0 48,620 122,369 560,342 682,711 -1,820 110,000 0 574,531
30 Madison 29,286 18,115 0 0 0 10,754 10,993 25,654 162,269 187,923 0 6,500 0 181,423
31 MayFair -10,224 11,855 0 0 0 2,827 1,016 -2,212 -20,273 -22,485 0 0 0 -22,485
32 Mercantile -5,903 39,597 0 0 0 0 16,251 17,443 62,815 80,258 0 0 0 80,258
33 Metropolitan 24,973 0 0 -47,668 0 0 0 -22,695 -126,998 -149,693 0 0 0 -149,693
34 Occidental 33,974 48,256 0 465 19,669 513 16,123 46,390 45,066 91,456 0 0 52,500 38,956
35 Old Mutual -239,245 0 0 0 0 0 -12,303 -226,942 406,853 179,911 0 0 0 179,911
36 Pacis 26,610 0 0 0 0 0 5,939 20,671 -8,074 12,597 0 0 0 12,597
37 Pan Africa Life 175,534 0 0 0 0 0 0 175,534 0 175,534 53,684 0 121,850 0
38 Phoenix -49,873 97,163 3,814 220 0 39,039 -17,883 30,168 349,714 379,882 0 20,000 0 359,882
39 Pioneer -431 0 711 8,590 0 4,466 962 3,442 4,481 7,923 0 4,000 0 3,923
40 Real 30,219 82,029 0 0 2,937 16,835 25,572 66,904 39,145 106,049 0 35,000 0 71,049
41 Standard 15,759 4,014 0 -320 0 13,796 3,220 2,437 38,271 40,708 0 0 -2,795 43,503
42 Tausi -39,258 49,130 0 0 3,306 4,550 -654 2,670 -17,628 -14,958 -1,100 0 0 -13,858
43 The Monarch 14,224 0 1,115 10,045 14,482 2,531 1,137 7,234 -15,702 -8,468 0 0 0 -8,468
44 Trident 5,017 57,853 0 305 9,110 0 16,247 37,818 82,182 120,000 0 11,000 0 109,000
45 Trinity Life 6,632 0 0 0 0 0 0 6,632 1,671 8,303 -60,835 0 74,521 -5,383
46 UAP Provincial 93,880 829,364 0 50,697 85,694 0 125,647 762,600 1,090,292 1,852,892 0 402,000 0 1,450,892
TOTAL 1,107,627 4,540,716 12,403 690,635 714,261 911,328 1,175,894 3,549,898 10,479,287 14,029,186 173,765 1,723,089 647,552 11,484,780
Figures given in thousands Kshs.
PART 8 - INSURANCE STATISTICS
SUMMARY OF PROFIT AND LOSS ACCOUNTS (INCLUDING APPROPRIATION) OF INSURERS FOR THE YEAR ENDING 31.12.2007
Profit or loss
after taxation
Under Statutory Management

Insurance Regulatory Authority
46 2007 Insurance Annual Report
Long term General Total Long term General Total
1 AIG (K) 0 285,793 285,793 0 320,146 320,146
2 Amaco 0 48,425 48,425 0 199,673 199,673
3 APA 0 255,270 255,270 0 363,634 363,634
4 Apollo 15,082 0 15,082 40,032 0 40,032
5 Blue Shield 40,691 230,833 271,524 23,159 743,164 766,323
6 British American 473,091 103,464 576,555 463,499 96,811 560,310
7 Cannon 7,529 73,007 80,536 41,066 115,961 157,027
8 CFC Life 124,579 77,295 201,874 347,262 143,800 491,062
9 Concord 0 72,458 72,458 0 139,007 139,007
10 Cooperative 66,919 108,452 175,371 243,128 252,628 495,756
11 Corporate 23,269 32,867 56,136 16,446 102,274 118,720
12 Directline 0 34,521 34,521 0 122,557 122,557
13 East Africa Re 0 0 0 6,004 105,669 111,673
14 Fidelity Shield 0 87,181 87,181 0 146,683 146,683
15 First Assurance 2,423 141,394 143,817 3,149 148,145 151,294
16 Gateway 0 22,528 22,528 0 174,331 174,331
17 Geminia 2,345 62,985 65,330 3,537 98,617 102,154
18 General Accident 0 63,521 63,521 0 158,485 158,485
19 Heritage AII 12,836 199,073 211,909 41,894 397,197 439,091
20 ICEA 115,384 168,051 283,435 278,087 227,526 505,613
21 Intra Africa Assurance 0 22,218 22,218 0 125,512 125,512
22 Invesco
23 Jubilee 65,680 212,170 277,850 254,230 356,862 611,092
24 Kenindia 53,108 450,780 503,888 76,644 591,171 667,815
25 Kenya Orient 0 28,981 28,981 0 80,707 80,707
26 Kenya Re 0 0 0 96,830 576,508 673,338
27 Kenyan Alliance 3,843 43,508 47,351 8,488 112,764 121,252
28 KNAC (2001) 0 0 0 194,301 0 194,301
29 Lion of Kenya 0 152,302 152,302 0 140,331 140,331
30 Madison 72,886 60,054 132,940 210,774 137,997 348,771
31 Mayfair 0 40,391 40,391 0 45,958 45,958
32 Mercantile 4,933 18,476 23,409 20,077 92,554 112,631
33 Metropolitan 12,106 0 12,106 91,401 91,401
34 Occidental 0 46,073 46,073 0 142,264 142,264
35 Old Mutual 129,289 0 129,289 2,050,308 0 2,050,308
36 Pacis 0 18,887 18,887 0 44,414 44,414
37 Pan Africa Life 399,073 0 399,073 424,299 0 424,299
38 Phoenix 0 53,457 53,457 0 169,725 169,725
39 Pioneer 48,411 0 48,411 88,236 0 88,236
40 Real 0 104,620 104,620 0 166,855 166,855
41 Standard 0 50,797 50,797 0 216,982 216,982
42 Tausi 0 81,126 81,126 0 114,880 114,880
43 The Monarch 5,198 16,536 21,734 9,523 81,154 90,677
44 Trident 0 31,475 31,475 0 60,629 60,629
45 Trinity Life 4,187 0 4,187 27,229 0 27,229
46 UAP Provincial 47,141 275,370 322,511 85,799 443,124 528,923
Total 1,730,003 3,774,339 5,504,342 5,145,402 7,756,699 12,902,101
Amounts in thousands of Kshs.
COMMISSIONS AND MANAGEMENT EXPENSES FOR THE YEAR ENDED 31ST DECEMBER, 2007
Commissions Management Expenses
NO. NAME OF INSURER
Under Statotory Management

Insurance Regulatory Authority
47 2007 Insurance Annual Report
No ITEM APOLLO BLUE SHIELD BRITAK CANNON CFC LIFE COOPERATIVE CORPORATE E.A- RE
FIRST
ASSURANCE
1 Nominal Capital 150,000 50,000 100,000 50,000 62,340 130,000 51,200 0 50,000
2 Nominal Value of Unissued Share Capital 0 0 0 0 0 0 0 0 0
3 Isssued Capital 150,000 50,000 100,000 50,000 62,340 130,000 51,200 0 50,000
4 Paid up Capital 150,000 50,000 100,000 50,000 62,340 130,000 51,200 0 50,000
5 General Reserve 0 2,950 0 276,807 0 0 0 0 -1,914
6 Investment Flctn. Reserve 19,278 0 0 0 214,926 0 0 0 0
7 Unapprtd Surplus (Net) 685,176 0 35,988 0 0 0 0 0 0
8 Other Reserves 0 0 3,106,963 26,250 268,918 103,395 13,671 0 0
9 Total Paid up capital & reserves 854,454 52,950 3,242,951 353,057 546,184 233,395 64,871 0 48,086
10 Underwriting Provisions 298,143 236,613 5,468,539 406,902 7,550,494 715,338 79,718 90,373 4,335
11 Long term liabilities 425,300 0 0 0 1,398 0 1,843 0 13,424
12 Current liablities 196,446 156,767 378,014 150,523 524,290 141,550 2,923 6,982 100
13
TOTAL PAID-UP CAPITAL, RESERVES &
LIABILITIES 1,774,343 446,330 9,089,504 910,482 8,622,366 1,090,283 149,355 97,355 65,945
14 Land & buildings 0 6,641 159,973 35,560 638,667 205,500 0 0 0
15 Investment Property 230,550 20,843 869,958 322,560 89,124 94,500 75,000 0 0
16 Other Fixed Assets 3,438 1,297 54,207 3,478 108,467 33,407 329 0 2,868
17 Kenya Govt. Securities 170,928 160,081 994,370 250,447 3,660,627 254,348 29,593 41,509 16,013
18 Local Govt. Authority Securities 0 0 0 0 0 0 0 0 0
19 Other Securities 10,071 0 369,340 0 262,393 0 0 0 0
20 Debentures Quoted & Unquoted 0 0 0 0 0 0 0 0 0
21 Preference shares Quoted/Unquoted 0 0 0 0 0 0 0 0 0
22 Investment in subsidiary 246,830 0 0 0 0 0 0 0 0
23 Ordinary shares Quoted/Unquoted 793,010 0 4,401,414 159,299 2,124,237 579 4,213 17,909 0
24 Secured loans (incl.loans on life policies) 21,282 6,803 1,065,650 32,587 526,967 145,262 26,272 0 0
25 Unsecured loans 0 0 654,915 0 0 0 0 0 0
26 Deposits (with banks & other institutions) 39,516 98,172 45,513 63,822 678,046 148,607 6,911 29,244 28,679
27 Outstanding premiums 0 0 81,622 0 7,248 55,001 1,362 5,185 6,078
28 Amounts due from other insurers 53,197 11,002 53,336 0 12,443 11,818 0 0 10,798
29 Cash 28,657 31,553 110,193 12,704 165,966 18,530 3,525 3,453 1,214
30 Miscellaneous 176,864 109,938 194,617 30,025 121,963 105,132 2,150 55 295
31 Intangible assets 0 0 34,396 0 226,218 17,599 0 0
TOTAL ASSETS 1,774,343 446,330 9,089,504 910,482 8,622,366 1,090,283 149,355 97,355 65,945
Figures in Thousands Kshs.
SUMMARY OF BALANCE SHEETS OF INSURERS (long term business) AS AT 31ST DECEMBER 2007

Insurance Regulatory Authority
48 2007 Insurance Annual Report
Continued from the previous page
NO. ITEM GEMINIA HERITAGE A.I.I ICEA JUBILEE KENINDIA KENYA RE
KENYA
ALLIANCE KNAC (2001) MADISON
1 Nominal Capital 50,000 50,000 50,000 80,000 50,000 0 50,000 50,000 50,000
2 Nominal Value of Unissued Share Capital 0 0 0 0 0 0 0 0 0
3 Isssued Capital 50,000 50,000 50,000 80,000 50,000 0 50,000 50,000 50,000
4 Paid up Capital 50,000 50,000 50,000 80,000 50,000 0 50,000 50,000 50,000
5 General Reserve 0 38,100 0 0 253,273 6,000 0 0
6 Investment Flctn. Reserve 0 162,657 0 0 0 0 0 97,633
7 Unapprtd Surplus (Net) 0 234,384 0 0 0 0 15,384 26,800
8 Other Reserves 0 0 0 0 0 2,256,844 229,166 23,443 0
9 Total Paid up capital & reserves 50,000 485,141 50,000 80,000 303,273 2,256,844 285,166 88,827 174,433
10 Underwriting Provisions 107,869 1,085,549 16,138,694 7,739,392 5,515,165 0 4,503 1,349,248 1,713,403
11 Long term liabilities 0 127 73,359 62,267 0 0 2,601 0 0
12 Current liablities 15,933 43,710 228,423 82,989 69,873 20,576 1,411 96,828 122,127
13
TOTAL PAID-UP CAPITAL, RESERVES &
LIABILITIES 173,802 1,614,527 16,490,476 7,964,648 5,888,311 2,277,420 293,681 1,534,903 2,009,9630
14 Land & buildings 0 0 0 0 338,912 0 0 0 0
15 Investment Property 0 25,000 3,639,500 942,000 0 750,000 0 1,185,668 611,505
16 Other Fixed Assets 0 1,841 0 16,102 5,739 0 47 22,628 10,623
17 Kenya Govt. Securities 41,600 471,334 9,728,393 3,052,273 4,211,065 1,085,438 238,901 18,493 343,966
18 Local Govt. Authority Securities 0 0 0 0 0 0 0 0 0
19 Other Securities 0 213,667 44,596 19,838 58,920 0 0 0 0
20 Debentures Quoted & Unquoted 0 0 0 0 21,353 0 0 0 0
21 Preference shares Quoted/Unquoted 0 0 0 0 0 0 0 62,017 0
22 Investment in Subsidiary 0 0 0 0 0 0 0 0 0
23 Ordinary shares Quoted/Unquoted 0 531,407 1,380,249 2,565,785 455,516 0 0 29,552 595,979
24 Secured loans (incl.loans on life policies) 833 51,189 214,142 208,290 87,820 0 0 76,060 218,802
25 Unsecured loans 0 126,499 0 0 0 0 0 0 0
26 Deposits (with banks & other institutions) 126,500 152,327 1,337,135 651,970 421,265 2,380 6,820 78,971 126,426
27 Outstanding Premiums 0 23,894 0 0 0 0 9,672 13,119 0
28 Amounts due from other insurers 0 10,154 0 37,473 79,119 24,363 0 0 20,717
29 Cash 2,165 0 79,695 284,413 72,291 0 4,854 3,066 16,212
30 Miscellaneous 2,704 7,215 66,766 186,504 136,311 415,239 33,387 45,171 65,733
31 Intangible assets 0 0 0 0 0 0 0 158 0
TOTAL ASSETS 173,802 1,614,527 16,490,476 7,964,648 5,888,311 2,277,420 293,681 1,534,903 2,009,963
Figures in Thousands Kshs.
SUMMARY OF BALANCE SHEETS OF INSURERS (long term business) AS AT 31ST DECEMBER 2007

Insurance Regulatory Authority
49 2007 Insurance Annual Report
Continued from the previous page
NO. ITEM METROPOLITAN MERCANTILE OLD MUTUAL PAN AFRICA LIFE PIONEER THE MONARCH TRINITY LIFE UAP PROVINCIAL TOTAL
1 Nominal Capital 360,000 50,000 100,000 500,000 65,000 50,000 100,000 100,000 2,398,540
2 Nominal Value of Unissued Share Capital 0 0 20,000 373,400 0 0 10,046 0 403,446
3 Isssued Capital 360,000 50,000 80,000 126,600 65,000 50,000 89,954 100,000 1,995,094
4 Paid up Capital 360,000 50,000 80,000 126,600 65,000 50,000 89,954 100,000 1,995,094
5 General Reserve 0 0 0 292,172 3,923 0 0 0 871,311
6 Investment Flctn. Reserve 0 0 278,550 0 0 0 0 0 773,044
7 Unapprtd Surplus (Net) -149,693 0 179,911 0 0 36,008 0 2,347 1,066,305
8 Other Reserves 0 0 80,000 161,229 0 0 -5,384 0 6,264,495
9 Total Paid up capital & reserves 210,307 50,000 618,461 580,001 68,923 86,008 84,570 102,347 10,970,249
10 Underwriting Provisions 1,582 213,769 5,612,155 3,665,964 395,556 0 127,800 927,944 59,449,048
11 Long term liabilities 3,218 116,248 0 63,248 1,898 31,407 0 0 796,338
12 Current liablities 221,444 6,161 216,845 409,378 41,185 79,947 5,807 22,833 3,243,065
13
TOTAL PAID-UP CAPITAL, RESERVES &
LIABILITIES 436,551 386,178 6,447,461 4,718,591 507,562 197,362 218,177 1,053,124 74,458,700
14 Land & buildings 0 45,000 0 21,993 0 97,612 124,500 0 1,674,358
15 Investment Property 0 0 0 224,000 234,700 0 0 0 9,314,908
16 Other Fixed Assets 140,867 395 110,882 46,266 9,454 0 4,655 39,569 616,559
17 Kenya Govt. Securities 81,291 82,891 1,333,668 1,699,505 67,121 0 28,750 396,529 28,459,134
18 Local Govt. Authority Securities 0 0 0 0 0 0 0 0 0
19 Other Securities 0 23,000 0 41,069 6,976 0 11,531 0 1,061,401
20 Debentures Quoted & Unquoted 0 0 0 0 0 0 0 0 21,353
21 Preference shares Quoted/Unquoted 0 0 0 0 0 0 0 293 62,310
22 Investment in subsidiary 0 0 0 0 0 0 0 0 246,830
23 Ordinary shares Quoted/Unquoted 0 0 2,478,365 837,288 1,362 0 0 300,198 16,676,362
24 Secured loans (incl.loans on life policies) 0 5,744 290,636 404,489 83,164 0 0 0 3,465,992
25 Unsecured loans 0 0 0 0 0 0 476 0 781,890
26 Deposits (with banks & other institutions) 180,614 207,691 1,169,524 891,700 22,524 6,200 9,435 185,351 6,715,343
27 Outstanding premiums 4,446 2,815 41,064 151,400 39,284 0 2,247 11,164 455,601
28 Amounts due from other insurers 0 17,438 0 57,737 0 92,402 0 42,529 534,526
29 Cash 19,756 0 268,766 40,261 12,415 435 1,709 55,504 1,237,337
30 Miscellaneous 9,577 1,204 737,075 297,594 30,562 713 12,674 21,987 2,811,455
31 Intangible assets 0 0 17,481 5,289 0 22,200 0 323,341
TOTAL ASSETS 436,551 386,178 6,447,461 4,718,591 507,562 197,362 218,177 1,053,124 74,458,700
Figures in Thousands Kshs.
SUMMARY OF BALANCE SHEETS OF INSURERS (long term business) AS AT 31ST DECEMBER 2007

Insurance Regulatory Authority
50 2007 Insurance Annual Report
No ITEM AIG (K) AMACO APA BLUE SHIELD
BRITISH
AMERICAN CANNON CFC LIFE CONCORD COOPERATIVE CORPORATE
1 Nominal Capital 249,000 160,000 400,000 200,000 200,000 100,000 100,000 120,000 258,847 100,000
2 Nominal Value of Unissued Share Capital 0 0 0 0 0 0 0 0 0 0
3 Issued Capital 249,000 160,000 400,000 200,000 200,000 100,000 100,000 120,000 258,847 100,000
4 Paid up Capital 249,000 160,000 400,000 200,000 200,000 100,000 100,000 120,000 258,847 100,000
5 General Reserve 0 0 0 0 0 0 0 38,838 0 0
6 Investment Flctn. Reserve 3,066 0 0 149,883 0 0 0 0 0 0
7 Unapprtd Surplus (Net) 71,124 65,647 1,185,467 113,708 347,397 186,573 35,821 26,371 0 37,700
8 Other Reserves 0 0 15,981 -13,980 120,000 0 0 0 79,843 -5,046
9 Total Paid up capital & reserves 323,190 225,647 1,601,448 449,611 667,397 286,573 135,821 185,209 338,690 132,654
10 Underwriting Provisions 614,871 284,916 2,680,895 1,688,702 422,985 654,585 344,077 316,172 825,893 330,190
11 Long term liabilities 0 0 0 73,281 36,519 0 0 93,440 0 0
12 Current liablities 651,941 114,493 208,469 451,045 35,349 143,433 44,625 26,634 183,803 91,881
13
TOTAL PAID-UP CAPITAL, RESERVES
& LIABILITIES 1,590,002 625,056 4,490,812 2,662,639 1,162,250 1,084,591 524,523 621,455 1,348,386 554,725
14 Land & buildings 0 212,543 82,000 750,000 0 35,560 0 0 0 102,375
15 Investment Property 0 0 486,000 20,543 0 248,200 0 89,700 0 131,700
16 Other Fixed Assets 95,571 75,869 26,879 68,562 18,412 9,215 0 5,152 52,294 5,749
17 Kenya Govt. Securities 614,311 15,500 362,340 152,639 69,000 145,303 399,830 73,844 258,715 45,429
18 Local Govt. Authority Securities 0 0 0 0 0 0 0 0 0 0
19 Other Securities 0 0 0 0 0 0 0 0 0 0
20 Debentures Quoted & Unquoted 0 0 0 0 0 0 0 0 0 0
21 Preference shares Quoted/Unquoted 0 0 0 0 0 0 0 0 0 0
22 Investments in Subsidiary 0 0 0 0 0 0 0 0 10,000 0
23 Ordinary shares Quoted/Unquoted 58,419 0 1,732,694 80,150 677,035 268,762 0 53,410 14,597 17,889
24 Secured loans (incl.loans on life policies) 0 0 53,888 0 0 0 0 0 0 0
25 Unsecured loans 0 0 13,138 0 0 0 0 0 0 0
26 Deposits (with banks & other institutions) 335,359 77,505 220,584 426,125 8,000 113,432 0 54,161 482,187 0
27 Outstanding premiums 154,735 165,029 562,037 0 157,061 153,997 82,633 245,965 193,511 194,965
28 Amounts due from other insurers 57,525 38,011 179,454 920,497 19,182 20,349 9,979 38,893 206,018 32,243
29 Cash 23,417 30,203 114,876 102,543 33,747 1,469 0 19,187 65,816 6,416
30 Miscellaneous 213,092 10,396 567,486 134,199 170,306 88,304 32,081 41,143 65,248 17,959
31 Intangible assets 37,573 89,436 7,381 9,507 0 0 0 0
TOTAL ASSETS 1,590,002 625,056 4,490,812 2,662,639 1,162,250 1,084,591 524,523 621,455 1,348,386 554,725
Figures in Thousands Kshs.
SUMMARY OF BALANCE SHEETS OF INSURERS (GENERAL BUSINESS) AS AT 31ST DECEMBER 2007
Continued next page

Insurance Regulatory Authority
51 2007 Insurance Annual Report
Continued from previous page
No. ITEM DIRECTLINE
EAST AFRICA-
RE
FIDELITY
SHIELD
FIRST
ASSURANCE GATEWAY GEMINIA
GENERAL
ACCIDENT HERITAGE AII I.C.E.A. INTRA AFRICA
1 Nominal Capital 270,000 600,000 200,000 150,000 175,000 150,000 200,000 450,000 250,000 150,000
2 Nominal Value of Unissued Share Capital 25,079 0 0 0 21,645 0 0 0 0 50,000
3 Issued Capital 244,921 600,000 200,000 150,000 153,355 150,000 200,000 450,000 250,000 100,000
4 Paid up Capital 244,921 600,000 186,648 150,000 153,355 150,000 200,000 450,000 250,000 100,000
5 General Reserve 10,153 0 0 103,725 135 0 0 0 0 0
6 Investment Flctn. Reserve 0 0 0 24,547 0 0 0 63,154 0 0
7 Unapprtd Surplus (Net) 0 272,535 0 0 75,364 46,568 234,991 719,692 760,146 49,664
8 Other Reserves 0 0 124,599 0 0 23,813 252,696 32,000 0 108,421
9 Total Paid up capital & reserves 255,074 872,535 311,247 278,272 228,854 220,381 687,687 1,264,846 1,010,146 258,085
10 Underwriting Provisions 247,227 882,999 572,493 768,872 718,079 452,911 912,451 1,464,864 1,360,562 525,076
11 Long term liabilities 0 0 0 0 48,238 0 110,743 60,956 293,831 0
12 Current liablities 227,979 549,821 90,155 231,811 62,715 134,926 52,667 116,971 50,211 72,373
13
TOTAL PAID-UP CAPITAL, RESERVES &
LIABILITIES 730,280 2,305,355 973,895 1,278,955 1,057,886 808,218 1,763,548 2,907,637 2,714,750 855,5340 0 0
14 Land & buildings 0 0 0 80,000 50,622 257,832 0 0 579,000 122,864
15 Investment Property 0 0 192,632 378,417 147,787 0 0 231,705 0 0
16 Other Fixed Assets 27,256 13,063 5,126 24,370 7,056 28,507 29,661 96,371 39,683 13,002
17 Kenya Govt. Securities 18,095 395,800 139,858 124,373 138,400 116,000 196,739 310,464 532,740 199,800
18 Local Govt. Authority Securities 0 0 0 0 0 0 0 0 0 0
19 Other Securities 0 0 0 39,609 0 0 0 0 0 7,058
20 Debentures Quoted & Unquoted 0 0 0 0 0 0 0 0 0 0
21 Preference shares Quoted/Unquoted 0 0 0 0 0 0 0 0 0 1,164
22 Investments in Subsidiary 0 0 0 0 0 0 0 88,369 0 0
23 Ordinary shares Quoted/Unquoted 144,921 54,832 152,518 69,432 72,733 66,601 222,909 449,510 282,779 62,031
24 Secured loans (incl.loans on life policies) 0 22,981 123,242 0 1,469 4,977 453,927 797,063 0 16,440
25 Unsecured loans 0 0 0 0 0 0 0 11,399 0 0
26 Deposits (with banks & other institutions) 220,552 1,021,795 148,018 220,406 129,061 120,700 606,380 58,038 169,381 141,402
27 Outstanding premiums 208,099 728,779 140,140 167,028 257,442 43,017 162,179 359,590 169,732 216,499
28 Amounts due from other insurers 7,993 0 20,598 87,666 86,289 23,871 38,266 29,698 0 24,833
29 Cash 3,542 46,458 27,821 8,750 31,626 20,288 5,667 7,015 11,649 17,002
30 Miscellaneous 94,821 17,712 23,942 78,904 134,901 126,425 41,624 464,311 929,786 33,439
31 Intangible assets 5,001 3,935 0 0 500 0 6,196 4,104 0
TOTAL ASSETS 730,280 2,305,355 973,895 1,278,955 1,057,886 808,218 1,763,548 2,907,637 2,714,750 855,534
Figures in Thousands Kshs. Continued next page
SUMMARY OF BALANCE SHEETS OF INSURERS (GENERAL BUSINESS) AS AT 31ST DECEMBER 2007

Insurance Regulatory Authority
52 2007 Insurance Annual Report
Continued from previous page
No ITEM JUBILEE KENINDIA KENYA ORIENT KENYA RE KENYA ALLIANCE LION OF KENYA MADISON MERCANTILE MAYFAIR
1 Nominal Capital 370,000 325,000 198,000 1,500,000 100,000 200,000 100,000 150,000 300,000
2 Nominal Value of Unissued Share Capital 0 14,702 0 0 0 0 0 0 98,250
3 Issued Capital 370,000 310,298 198,000 1,500,000 100,000 200,000 100,000 150,000 201,750
4 Paid up Capital 370,000 310,298 198,000 1,500,000 100,000 200,000 100,000 150,000 201,750
5 General Reserve 0 0 1,885 0 176,420 0 0 0 -22,485
6 Investment Flctn. Reserve 214,696 64,751 0 0 0 128,299 18,616 0 5,891
7 Unapprtd Surplus (Net) 574,794 171,824 16,155 3,218,299 0 574,530 162,806 80,258 0
8 Other Reserves 150,000 -50,000 0 2,315,629 41,046 36,245 0 0 0
9 Total Paid up capital & reserves 1,309,490 496,873 216,040 7,033,928 317,466 939,074 281,422 230,258 185,156
10 Underwriting Provisions 2,506,559 2,310,165 195,970 2,617,703 1,717,212 2,522,666 249,773 249,164 238,995
11 Long term liabilities 0 167,095 957 0 0 144,172 88,989 28,359 0
12 Current liablities 644,461 176,613 29,912 2,781,223 117,839 116,073 72,561 16,462 53,350
13
TOTAL PAID-UP CAPITAL, RESERVES &
LIABILITIES 4,460,510 3,150,746 442,879 12,432,854 2,152,517 3,721,985 692,745 524,243 477,501
14 Land & buildings 0 656,702 41,585 0 17,948 77,280 0 86,000 0
15 Investment Property 220,000 0 62,000 2,585,620 363,371 616,000 0 0 0
16 Other Fixed Assets 14,620 40,058 16,001 338,554 239,390 14,655 10,623 4,374 11,192
17 Kenya Govt. Securities 412,078 854,294 19,000 741,020 716,417 1,203,204 49,294 40,247 35,329
18 Local Govt. Authority Securities 0 0 0 0 0 0 0 0 0
19 Other Securities 0 0 0 0 0 50,605 0 0 0
20 Debentures Quoted & Unquoted 0 15,252 0 0 0 0 0 0 0
21 Preference shares Quoted/Unquoted 650 0 0 97 0 0 0 0 0
22 Investments in Subsidiary 0 0 0 318,680 0 50,147 0 0 0
23 Ordinary shares Quoted/Unquoted 1,474,390 384,873 9 2,737,476 0 94,083 182,561 160 41,393
24 Secured loans (incl.loans on life policies) 0 5,573 0 710,542 0 0 0 0 0
25 Unsecured loans 0 0 0 0 0 0 0 0 0
26 Deposits (with banks & other institutions) 375,000 112,104 103,841 663,001 548,799 504,791 68,813 215,171 183,737
27 Outstanding premiums 346,108 391,724 147,984 0 38,800 229,721 184,702 31,815 48,091
28 Amounts due from other insurers 462,931 583,784 6,495 3,351,426 13,564 132,008 172,065 0 0
29 Cash 40,873 82,203 11,873 139,202 129,608 43,412 6,099 26,647 16,180
30 Miscellaneous 1,113,028 24,179 34,091 842,956 84,620 706,079 18,588 119,829 141,579
31 Intangible assets 832 0 0 4,280 0 0 0 0 0
TOTAL ASSETS 4,460,510 3,150,746 442,879 12,432,854 2,152,517 3,721,985 692,745 524,243 477,501
Figures in Thousands Kshs.
SUMMARY OF BALANCE SHEETS OF INSURERS (GENERAL BUSINESS) AS AT 31ST DECEMBER 2007
Continued next page

Insurance Regulatory Authority
53 2007 Insurance Annual Report
Continued from previous page
No. ITEM OCCIDENTAL PACIS
PHOENIX OF
E.A REAL STANDARD TAUSI THE MONARCH TRIDENT UAP PROVINCIAL TOTAL
1 Nominal Capital 157,500 122,670 150,000 130,000 150,000 200,000 216,450 100,000 500,000 9,452,467
2 Nominal Value of Unissued Share Capital 0 0 0 0 27,600 20,000 0 0 0 257,276
3 Issued Capital 157,500 122,670 150,000 130,000 122,400 180,000 216,450 100,000 500,000 9,195,191
4 Paid up Capital 157,500 122,670 150,000 130,000 122,400 124,949 216,450 100,000 500,000 9,126,788
5 General Reserve 0 0 0 0 0 -13,859 0 0 0 294,812
6 Investment Flctn. Reserve 0 0 735,232 0 0 0 0 0 1,767,491 3,175,626
7 Unapprtd Surplus (Net) 38,956 0 359,883 52,269 43,502 0 -44,478 109,000 1,450,892 11,037,458
8 Other Reserves 0 12,595 0 63,987 2,239 31,734 0 402,000 3,743,802
9 Total Paid up capital & reserves 196,456 135,265 1,245,115 246,256 168,141 142,824 171,972 209,000 4,120,383 27,378,486
10 Underwriting Provisions 484,824 71,061 813,908 672,907 453,017 710,872 168,500 816,552 1,682,436 34,551,104
11 Long term liabilities 84,803 0 0 41,516 0 77,306 63,799 133,355 0 1,547,359
12 Current liablities 76,151 13,778 243,343 146,735 67,333 17,939 81,556 18,945 389,782 8,605,358
13
TOTAL PAID-UP CAPITAL, RESERVES &
LIABILITIES 842,234 220,104 2,302,366 1,107,414 688,491 948,941 485,827 1,177,852 6,192,601 72,082,307
14 Land & buildings 190,000 50,000 0 215,625 128,581 107,532 78,388 0 0 3,922,437
15 Investment Property 0 0 39,750 0 0 0 0 3,411 1,820,000 7,636,836
16 Other Fixed Assets 9,247 8,419 8,122 25,232 29,920 12,209 19,428 2,270 38,811 1,484,923
17 Kenya Govt. Securities 184,380 43,710 109,463 64,507 18,000 101,850 0 191,619 436,189 9,529,781
18 Local Govt. Authority Securities 0 0 0 0 0 0 0 0 0 0
19 Other Securities 0 0 0 11,284 0 0 0 0 0 108,556
20 Debentures Quoted & Unquoted 0 0 0 0 0 0 0 0 0 15,252
21 Preference shares Quoted/Unquoted 0 0 0 0 0 0 0 0 19,384 21,295
22 Investments in Subsidiary 0 0 117,816 117,752 0 0 89,768 0 370,404 1,162,936
23 Ordinary shares Quoted/Unquoted 11,825 11,164 1,066,621 59,072 0 74,679 1,000 50,034 2,328,272 12,998,834
24 Secured loans (incl.loans on life policies) 0 0 0 0 0 36,022 0 60,606 42,762 2,329,492
25 Unsecured loans 0 0 0 0 0 0 26,170 0 0 50,707
26 Deposits (with banks & other institutions) 79,486 36,794 46,392 37,223 51,710 351,000 10,680 392,339 0 8,333,967
27 Outstanding premiums 192,606 36,671 137,519 169,488 323,987 9,371 0 117,393 308,144 7,076,562
28 Amounts due from other insurers 117,278 0 0 20,943 0 0 74,461 163,213 86,078 7,025,611
29 Cash 108 12,231 3,975 20,236 4,191 25,765 200 29,638 4,836 1,174,769
30 Miscellaneous 51,527 17,073 772,708 311,255 132,102 230,117 185,732 167,329 716,352 8,955,223
31 Intangible assets 5,777 4,042 54,797 0 396 0 21,369 255,126
TOTAL ASSETS 842,234 220,104 2,302,366 1,107,414 688,491 948,941 485,827 1,177,852 6,192,601 72,082,307
Figures in Thousands Kshs.
SUMMARY OF BALANCE SHEETS OF INSURERS (GENERAL BUSINESS) AS AT 31ST DECEMBER 2007

Insurance Regulatory Authority
54 2007 Insurance Annual Report
No ITEM AIG (K) AMACO APA APOLLO BLUE SHIELD
BRITISH
AMERICAN CANNON CFC LIFE CONCORD COOPERATIVE CORPORATE
1 Nominal Capital 249,000 160,000 400,000 150,000 250,000 300,000 150,000 162,340 120,000 388,847 151,200
2 Nominal Value of Unissued Share Capital 0 0 0 0 0 0 0 0 0 0 0
3 Issued Capital 249,000 160,000 400,000 150,000 250,000 300,000 150,000 162,340 120,000 388,847 151,200
4 Paid up Capital 249,000 160,000 400,000 150,000 250,000 300,000 150,000 162,340 120,000 388,847 151,200
5 General Reserve 0 0 0 0 2,950 0 276,807 0 38,838 0 0
6 Investment Flctn. Reserve 3,066 0 0 19,278 149,883 0 0 214,926 0 0 0
7 Unapprtd Surplus (Net) 71,124 65,647 1,185,467 685,176 113,708 383,385 186,573 35,821 26,371 0 37,700
8 Other Reserves 0 0 15,981 0 -13,980 3,226,963 26,250 268,918 0 183,238 8,625
9 Total Paid up capital & reserves 323,190 225,647 1,601,448 854,454 502,561 3,910,348 639,630 682,005 185,209 572,085 197,525
10 Underwriting Provisions 614,871 284,916 2,680,895 298,143 1,925,315 5,891,524 1,061,487 7,894,571 316,172 1,541,231 409,908
11 Long term liabilities 0 0 0 425,300 73,281 36,519 0 1,398 93,440 0 1,843
12 Current liablities 651,941 114,493 208,469 196,446 607,812 413,363 293,956 568,915 26,634 325,353 94,804
13
TOTAL PAID-UP CAPITAL, RESERVES
& LIABILITIES 1,590,002 625,056 4,490,812 1,774,343 3,108,969 10,251,754 1,995,073 9,146,889 621,455 2,438,669 704,0800 0 0 0 0 0 0 0 0 0 0
14 Land & buildings 0 212,543 82,000 0 756,641 159,973 71,120 638,667 0 205,500 102,375
15 Investment Property 0 0 486,000 230,550 41,386 869,958 570,760 89,124 89,700 94,500 206,700
16 Other Fixed Assets 95,571 75,869 26,879 3,438 69,859 72,619 12,693 108,467 5,152 85,701 6,078
17 Kenya Govt. Securities 614,311 15,500 362,340 170,928 312,720 1,063,370 395,750 4,060,457 73,844 513,063 75,022
18 Local Govt. Authority Securities 0 0 0 0 0 0 0 0 0 0 0
19 Other Securities 0 0 0 10,071 0 369,340 0 262,393 0 0 0
20 Debentures Quoted & Unquoted 0 0 0 0 0 0 0 0 0 0 0
21 Preference shares Quoted/Unquoted 0 0 0 0 0 0 0 0 0 0 0
22 Investments in Subsidiary 0 0 0 246,830 0 0 0 0 0 10,000 0
23 Ordinary shares Quoted/Unquoted 58,419 0 1,732,694 793,010 80,150 5,078,449 428,061 2,124,237 53,410 15,176 22,102
24 Secured loans (incl.loans on life policies) 0 0 53,888 21,282 6,803 1,065,650 32,587 526,967 0 145,262 26,272
25 Unsecured loans 0 0 13,138 0 0 654,915 0 0 0 0 0
26 Deposits (with banks & other institutions) 335,359 77,505 220,584 39,516 524,297 53,513 177,254 678,046 54,161 630,794 6,911
27 Outstanding premiums 154,735 165,029 562,037 0 0 238,683 153,997 89,881 245,965 248,512 196,327
28 Amounts due from other insurers 57,525 38,011 179,454 53,197 931,499 72,518 20,349 22,422 38,893 217,836 32,243
29 Cash 23,417 30,203 114,876 28,657 134,096 143,940 14,173 165,966 19,187 84,346 9,941
30 Miscellaneous 213,092 10,396 567,486 176,864 244,137 364,923 118,329 154,044 41,143 170,380 20,109
31 Intangible assets 37,573 0 89,436 0 7,381 43,903 0 226,218 0 17,599 0
TOTAL ASSETS 1,590,002 625,056 4,490,812 1,774,343 3,108,969 10,251,754 1,995,073 9,146,889 621,455 2,438,669 704,080
Figures in Thousands Kshs.
SUMMARY OF BALANCE SHEETS OF INSURERS (COMBINED BUSINESS) AS AT 31ST DECEMBER 2007
Continued next page

Insurance Regulatory Authority
55 2007 Insurance Annual Report
Continued from previous page
No. ITEM DIRECTLINE EAST AFRICA-RE FIDELITY SHIELD
FIRST
ASSURANCE GATEWAY GEMINIA
GENERAL
ACCIDENT HERITAGE AII I.C.E.A. INTRA AFRICA JUBILEE
1 Nominal Capital 270,000 600,000 200,000 200,000 175,000 200,000 200,000 500,000 300,000 150,000 450,000
2 Nominal Value of Unissued Share Capital 25,079 0 0 0 21,645 0 0 0 0 50,000 0
3 Issued Capital 244,921 600,000 200,000 200,000 153,355 200,000 200,000 500,000 300,000 100,000 450,000
4 Paid up Capital 244,921 600,000 186,648 200,000 153,355 200,000 200,000 500,000 300,000 100,000 450,000
5 General Reserve 10,153 0 0 101,811 135 0 0 38,100 0 0 0
6 Investment Flctn. Reserve 0 0 0 24,547 0 0 0 225,811 0 0 214,696
7 Unapprtd Surplus (Net) 0 272,535 0 0 75,364 46,568 234,991 954,076 760,146 49,664 574,794
8 Other Reserves 0 0 124,599 0 0 23,813 252,696 32,000 0 108,421 150,000
9 Total Paid up capital & reserves 255,074 872,535 311,247 326,358 228,854 270,381 687,687 1,749,987 1,060,146 258,085 1,389,490
10 Underwriting Provisions 247,227 973,372 572,493 773,207 718,079 560,780 912,451 2,550,413 17,499,256 525,076 10,245,951
11 Long term liabilities 0 0 0 13,424 48,238 0 110,743 61,083 367,190 0 62,267
12 Current liablities 227,979 556,803 90,155 231,911 62,715 150,859 52,667 160,681 278,634 72,373 727,450
13
TOTAL PAID-UP CAPITAL, RESERVES
& LIABILITIES 730,280 2,402,710 973,895 1,344,900 1,057,886 982,020 1,763,548 4,522,164 19,205,226 855,534 12,425,1580 0 0 0 0 0 0 0 0
14 Land & buildings 0 0 0 80,000 50,622 257,832 0 0 579,000 122,864 0
15 Investment Property 0 0 192,632 378,417 147,787 0 0 256,705 3,639,500 0 1,162,000
16 Other Fixed Assets 27,256 13,063 5,126 27,238 7,056 28,507 29,661 98,212 39,683 13,002 30,722
17 Kenya Govt. Securities 18,095 437,309 139,858 140,386 138,400 157,600 196,739 781,798 10,261,133 199,800 3,464,351
18 Local Govt. Authority Securities 0 0 0 0 0 0 0 0 0 0 0
19 Other Securities 0 0 0 39,609 0 0 0 213,667 44,596 26,896 19,838
20 Debentures Quoted & Unquoted 0 0 0 0 0 0 0 0 0 0 0
21 Preference shares Quoted/Unquoted 0 0 0 0 0 0 0 0 0 0 650
22 Investments in Subsidiary 0 0 0 0 0 0 0 88,369 0 0 0
23 Ordinary shares Quoted/Unquoted 144,921 72,741 152,518 69,432 72,733 66,601 222,909 980,917 1,663,028 62,031 4,040,175
24 Secured loans (incl.loans on life policies) 0 22,981 123,242 0 1,469 5,810 453,927 848,252 214,142 16,440 208,290
25 Unsecured loans 0 0 0 0 0 0 0 137,898 0 0 0
26 Deposits (with banks & other institutions) 220,552 1,051,039 148,018 249,085 129,061 247,200 606,380 210,365 1,506,516 141,402 1,026,970
27 Outstanding premiums 208,099 733,964 140,140 173,106 257,442 43,017 162,179 383,484 169,732 216,499 346,108
28 Amounts due from other insurers 7,993 0 20,598 98,464 86,289 23,871 38,266 39,852 0 24,833 500,404
29 Cash 3,542 49,911 27,821 9,964 31,626 22,453 5,667 7,015 91,344 17,002 325,286
30 Miscellaneous 94,821 17,767 23,942 79,199 134,901 129,129 41,624 471,526 996,552 33,439 1,299,532
31 Intangible assets 5,001 3,935 0 0 500 0 6,196 4,104 0 0 832
TOTAL ASSETS 730,280 2,402,710 973,895 1,344,900 1,057,886 982,020 1,763,548 4,522,164 19,205,226 855,534 12,425,158
Figures in Thousands Kshs.
SUMMARY OF BALANCE SHEETS OF INSURERS (COMBINED BUSINESS) AS AT 31ST DECEMBER 2007
Continued next page

Insurance Regulatory Authority
56 2007 Insurance Annual Report
Continued from previous page
No ITEM OCCIDENTAL KENINDIA KENYA ORIENT KENYA RE
KENYA
ALLIANCE KNAC (2001) LION OF KENYA MADISON MERCANTILE MAYFAIR METROPOLITAN OLD MUTUAL
1 Nominal Capital 157,500 375,000 198,000 1,500,000 150,000 50,000 200,000 150,000 200,000 300,000 360,000 100,000
2 Nominal Value of Unissued Share Capital 0 14,702 0 0 0 0 0 0 0 98,250 0 20,000
3 Issued Capital 157,500 360,298 198,000 1,500,000 150,000 50,000 200,000 150,000 200,000 201,750 360,000 80,000
4 Paid up Capital 157,500 360,298 198,000 1,500,000 150,000 50,000 200,000 150,000 200,000 201,750 360,000 80,000
5 General Reserve 0 253,273 1,885 0 182,420 0 0 0 0 -22,485 0 0
6 Investment Flctn. Reserve 0 64,751 0 0 0 0 128,299 116,249 0 5,891 0 278,550
7 Unapprtd Surplus (Net) 38,956 171,824 16,155 3,218,299 0 15,384 574,530 189,606 80,258 0 -149,693 179,911
8 Other Reserves 0 -50,000 0 4,572,473 270,212 23,443 36,245 0 0 0 0 80,000
9 Total Paid up capital & reserves 196,456 800,146 216,040 9,290,772 602,632 88,827 939,074 455,855 280,258 185,156 210,307 618,461
10 Underwriting Provisions 484,824 7,825,330 195,970 2,617,703 1,721,715 1,349,248 2,522,666 1,963,176 462,933 238,995 1,582 5,612,155
11 Long term liabilities 84,803 167,095 957 0 2,601 0 144,172 88,989 144,607 0 3,218 0
12 Current liablities 76,151 246,486 29,912 2,801,799 119,250 96,828 116,073 194,688 22,623 53,350 221,444 216,845
13
TOTAL PAID-UP CAPITAL, RESERVES
& LIABILITIES 842,234 9,039,057 442,879 14,710,274 2,446,198 1,534,903 3,721,985 2,702,708 910,421 477,501 436,551 6,447,461#REF! 0 0 0 0 0 0 0 45,000 0 0 0
14 Land & buildings 190,000 995,614 41,585 0 17,948 0 77,280 0 131,000 0 0 0
15 Investment Property 0 0 62,000 3,335,620 363,371 1,185,668 616,000 611,505 0 0 0 0
16 Other Fixed Assets 9,247 45,797 16,001 338,554 239,437 22,628 14,655 21,246 4,769 11,192 140,867 110,882
17 Kenya Govt. Securities 184,380 5,065,359 19,000 1,826,458 955,318 18,493 1,203,204 393,260 123,138 35,329 81,291 1,333,668
18 Local Govt. Authority Securities 0 0 0 0 0 0 0 0 0 0 0 0
19 Other Securities 0 58,920 0 0 0 0 50,605 0 23,000 0 0 0
20 Debentures Quoted & Unquoted 0 36,605 0 0 0 0 0 0 0 0 0 0
21 Preference shares Quoted/Unquoted 0 0 0 97 0 62,017 0 0 0 0 0 0
22 Investments in Subsidiary 0 0 0 318,680 0 0 50,147 0 0 0 0 0
23 Ordinary shares Quoted/Unquoted 11,825 840,389 9 2,737,476 0 29,552 94,083 778,540 160 41,393 0 2,478,365
24 Secured loans (incl.loans on life policies) 0 93,393 0 710,542 0 76,060 0 218,802 5,744 0 0 290,636
25 Unsecured loans 0 0 0 0 0 0 0 0 0 0 0 0
26 Deposits (with banks & other institutions) 79,486 533,369 103,841 665,381 555,619 78,971 504,791 195,239 422,862 183,737 180,614 1,169,524
27 Outstanding premiums 192,606 391,724 147,984 0 48,472 13,119 229,721 184,702 34,630 48,091 4,446 41,064
28 Amounts due from other insurers 117,278 662,903 6,495 3,375,789 13,564 0 132,008 192,782 17,438 0 0 0
29 Cash 108 154,494 11,873 139,202 134,462 3,066 43,412 22,311 26,647 16,180 19,756 268,766
30 Miscellaneous 51,527 160,490 34,091 1,258,195 118,007 45,171 706,079 84,321 121,033 141,579 9,577 737,075
31 Intangible assets 5,777 0 0 4,280 0 158 0 0 0 0 0 17,481
TOTAL ASSETS 842,234 9,039,057 442,879 14,710,274 2,446,198 1,534,903 3,721,985 2,702,708 910,421 477,501 436,551 6,447,461
Figures in Thousands Kshs.
SUMMARY OF BALANCE SHEETS OF INSURERS (COMBINED BUSINESS) AS AT 31ST DECEMBER 2007
Continued next page

Insurance Regulatory Authority
57 2007 Insurance Annual Report
Continued from previous page
No. ITEM PACIS
PAN AFRICA
LIFE PIONEER
PHOENIX OF
E.A REAL STANDARD TAUSI THE MONARCH TRINITY LIFE TRIDENT
UAP
PROVINCIAL TOTAL
1 Nominal Capital 122,670 500,000 65,000 150,000 130,000 150,000 200,000 266,450 100,000 100,000 600,000 11,851,007
2 Nominal Value of Unissued Share Capital 0 373,400 0 0 0 27,600 20,000 0 10,046 0 0 660,722
3 Issued Capital 122,670 126,600 65,000 150,000 130,000 122,400 180,000 266,450 89,954 100,000 600,000 11,190,285
4 Paid up Capital 122,670 126,600 65,000 150,000 130,000 122,400 124,949 266,450 89,954 100,000 600,000 11,121,882
5 General Reserve 0 292,172 3,923 0 0 0 -13,859 0 0 0 0 1,166,123
6 Investment Flctn. Reserve 0 0 0 735,232 0 0 0 0 0 0 1,767,491 3,948,670
7 Unapprtd Surplus (Net) 0 0 0 359,883 52,269 43,502 0 -8,470 0 109,000 1,453,239 12,103,763
8 Other Reserves 12,595 161,229 0 0 63,987 2,239 31,734 0 -5,384 0 402,000 10,008,297
9 Total Paid up capital & reserves 135,265 580,001 68,923 1,245,115 246,256 168,141 142,824 257,980 84,570 209,000 4,222,730 38,348,735
10 Underwriting Provisions 71,061 3,665,964 395,556 813,908 672,907 453,017 710,872 168,500 127,800 816,552 2,610,380 94,000,152
11 Long term liabilities 0 63,248 1,898 0 41,516 0 77,306 95,206 0 133,355 0 2,343,697
12 Current liablities 13,778 409,378 41,185 243,343 146,735 67,333 17,939 161,503 5,807 18,945 412,615 11,848,423
13
TOTAL PAID-UP CAPITAL, RESERVES
& LIABILITIES 220,104 4,718,591 507,562 2,302,366 1,107,414 688,491 948,941 683,189 218,177 1,177,852 7,245,725 146,541,007
14 Land & buildings 50,000 21,993 0 0 215,625 128,581 107,532 176,000 124,500 0 0 5,596,795
15 Investment Property 0 224,000 234,700 39,750 0 0 0 0 0 3,411 1,820,000 16,951,744
16 Other Fixed Assets 8,419 46,266 9,454 8,122 25,232 29,920 12,209 19,428 4,655 2,270 78,380 2,101,482
17 Kenya Govt. Securities 43,710 1,699,505 67,121 109,463 64,507 18,000 101,850 0 28,750 191,619 832,718 37,988,915
18 Local Govt. Authority Securities 0 0 0 0 0 0 0 0 0 0 0 0
19 Other Securities 0 41,069 6,976 0 11,284 0 0 0 11,531 0 0 1,169,957
20 Debentures Quoted & Unquoted 0 0 0 0 0 0 0 0 0 0 0 36,605
21 Preference shares Quoted/Unquoted 0 0 0 0 0 0 0 0 0 0 19,677 83,605
22 Investments in Subsidiary 0 0 0 117,816 117,752 0 0 89,768 0 0 370,404 1,409,766
23 Ordinary shares Quoted/Unquoted 11,164 837,288 1,362 1,066,621 59,072 0 74,679 1,000 0 50,034 2,628,470 29,675,196
24 Secured loans (incl.loans on life policies) 0 404,489 83,164 0 0 0 36,022 0 0 60,606 42,762 5,795,484
25 Unsecured loans 0 0 0 0 0 0 0 26,170 476 0 0 832,597
26 Deposits (with banks & other institutions) 36,794 891,700 22,524 46,392 37,223 51,710 351,000 16,880 9,435 392,339 185,351 15,049,310
27 Outstanding premiums 36,671 151,400 39,284 137,519 169,488 323,987 9,371 0 2,247 117,393 319,308 7,532,163
28 Amounts due from other insurers 0 57,737 0 0 20,943 0 0 166,863 0 163,213 128,607 7,560,137
29 Cash 12,231 40,261 12,415 3,975 20,236 4,191 25,765 635 1,709 29,638 60,340 2,412,106
30 Miscellaneous 17,073 297,594 30,562 772,708 311,255 132,102 230,117 186,445 12,674 167,329 738,339 11,766,678
31 Intangible assets 4,042 5,289 0 0 54,797 0 396 0 22,200 0 21,369 578,467
TOTAL ASSETS 220,104 4,718,591 507,562 2,302,366 1,107,414 688,491 948,941 683,189 218,177 1,177,852 7,245,725 146,541,007
Figures in Thousands Kshs.
SUMMARY OF BALANCE SHEETS OF INSURERS (COMBINED BUSINESS) AS AT 31ST DECEMBER 2007
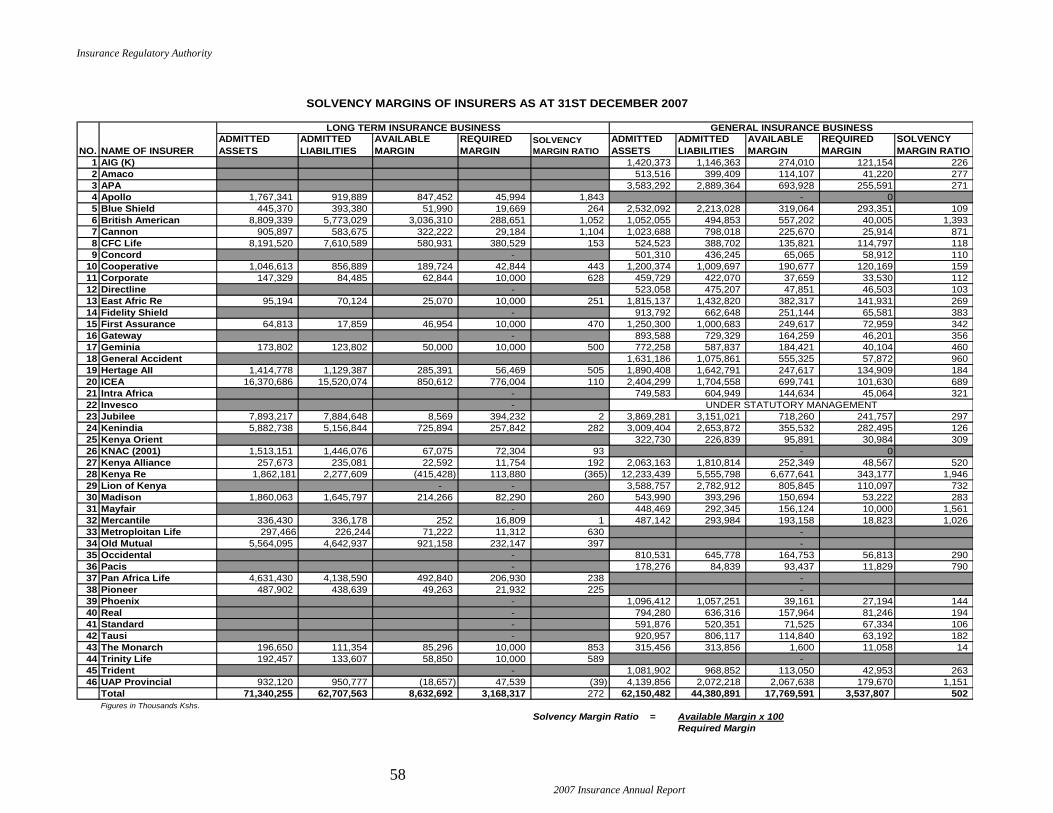
Insurance Regulatory Authority
58 2007 Insurance Annual Report
1 AIG (K) 1,420,373 1,146,363 274,010 121,154 226
2 Amaco 513,516 399,409 114,107 41,220 277
3 APA 3,583,292 2,889,364 693,928 255,591 271
4 Apollo 1,767,341 919,889 847,452 45,994 1,843 - 0
5 Blue Shield 445,370 393,380 51,990 19,669 264 2,532,092 2,213,028 319,064 293,351 109
6 British American 8,809,339 5,773,029 3,036,310 288,651 1,052 1,052,055 494,853 557,202 40,005 1,393
7 Cannon 905,897 583,675 322,222 29,184 1,104 1,023,688 798,018 225,670 25,914 871
8 CFC Life 8,191,520 7,610,589 580,931 380,529 153 524,523 388,702 135,821 114,797 118
9 Concord - 501,310 436,245 65,065 58,912 110
10 Cooperative 1,046,613 856,889 189,724 42,844 443 1,200,374 1,009,697 190,677 120,169 159
11 Corporate 147,329 84,485 62,844 10,000 628 459,729 422,070 37,659 33,530 112
12 Directline - 523,058 475,207 47,851 46,503 103
13 East Afric Re 95,194 70,124 25,070 10,000 251 1,815,137 1,432,820 382,317 141,931 269
14 Fidelity Shield - 913,792 662,648 251,144 65,581 383
15 First Assurance 64,813 17,859 46,954 10,000 470 1,250,300 1,000,683 249,617 72,959 342
16 Gateway - 893,588 729,329 164,259 46,201 356
17 Geminia 173,802 123,802 50,000 10,000 500 772,258 587,837 184,421 40,104 460
18 General Accident 1,631,186 1,075,861 555,325 57,872 960
19 Hertage AII 1,414,778 1,129,387 285,391 56,469 505 1,890,408 1,642,791 247,617 134,909 184
20 ICEA 16,370,686 15,520,074 850,612 776,004 110 2,404,299 1,704,558 699,741 101,630 689
21 Intra Africa - 749,583 604,949 144,634 45,064 321
22 Invesco -
23 Jubilee 7,893,217 7,884,648 8,569 394,232 2 3,869,281 3,151,021 718,260 241,757 297
24 Kenindia 5,882,738 5,156,844 725,894 257,842 282 3,009,404 2,653,872 355,532 282,495 126
25 Kenya Orient 322,730 226,839 95,891 30,984 309
26 KNAC (2001) 1,513,151 1,446,076 67,075 72,304 93 - 0
27 Kenya Alliance 257,673 235,081 22,592 11,754 192 2,063,163 1,810,814 252,349 48,567 520
28 Kenya Re 1,862,181 2,277,609 (415,428) 113,880 (365) 12,233,439 5,555,798 6,677,641 343,177 1,946
29 Lion of Kenya - - 3,588,757 2,782,912 805,845 110,097 732
30 Madison 1,860,063 1,645,797 214,266 82,290 260 543,990 393,296 150,694 53,222 283
31 Mayfair - 448,469 292,345 156,124 10,000 1,561
32 Mercantile 336,430 336,178 252 16,809 1 487,142 293,984 193,158 18,823 1,026
33 Metroploitan Life 297,466 226,244 71,222 11,312 630 -
34 Old Mutual 5,564,095 4,642,937 921,158 232,147 397 -
35 Occidental - 810,531 645,778 164,753 56,813 290
36 Pacis - 178,276 84,839 93,437 11,829 790
37 Pan Africa Life 4,631,430 4,138,590 492,840 206,930 238 -
38 Pioneer 487,902 438,639 49,263 21,932 225 -
39 Phoenix - 1,096,412 1,057,251 39,161 27,194 144
40 Real - 794,280 636,316 157,964 81,246 194
41 Standard - 591,876 520,351 71,525 67,334 106
42 Tausi - 920,957 806,117 114,840 63,192 182
43 The Monarch 196,650 111,354 85,296 10,000 853 315,456 313,856 1,600 11,058 14
44 Trinity Life 192,457 133,607 58,850 10,000 589 -
45 Trident - 1,081,902 968,852 113,050 42,953 263
46 UAP Provincial 932,120 950,777 (18,657) 47,539 (39) 4,139,856 2,072,218 2,067,638 179,670 1,151
Total 71,340,255 62,707,563 8,632,692 3,168,317 272 62,150,482 44,380,891 17,769,591 3,537,807 502
Figures in Thousands Kshs.
Solvency Margin Ratio = Available Margin x 100
Required Margin
UNDER STATUTORY MANAGEMENT
SOLVENCY
MARGIN RATIO
GENERAL INSURANCE BUSINESS
REQUIRED
MARGIN
SOLVENCY MARGINS OF INSURERS AS AT 31ST DECEMBER 2007
AVAILABLE
MARGIN
REQUIRED
MARGIN
ADMITTED
ASSETS
ADMITTED
LIABILITIES
AVAILABLE
MARGIN
LONG TERM INSURANCE BUSINESS
SOLVENCY
MARGIN RATIONO. NAME OF INSURER
ADMITTED
ASSETS
ADMITTED
LIABILITIES

Insurance Regulatory Authority
59 2007 Insurance Annual Report
No. Name of Insurer Bond Investiment Industrial Life Ordinary Life Superannuation Total
Market
share (%)
1 Apollo Insurance Co. Ltd. 0 0 38,552 206,073 244,625 1.4
2 Blue Shield Insurance Co. Ltd. 0 0 76,248 76,686 152,934 0.9
3 British American Ins. Co. Ltd. 0 0 1,601,386 260,333 1,861,719 10.9
4 Cannon Assurance Co. Ltd. 0 0 69,868 2,000 71,868 0.4
5 CFC Life 0 0 837,050 936,732 1,773,782 10.4
6 Co-operative Insurance Co. Ltd. 0 0 72,695 845,707 918,402 5.4
7 Corporate Insurance Co. Ltd. 0 0 64,917 984 65,901 0.4
8 First Assurance 0 0 0 27,180 27,180 0.2
9 Geminia Insurance Co. Ltd. 0 0 10,239 2,413 12,652 0.1
10 Heritage A.I.I Ins. Co. Ltd. 0 0 0 322,121 322,121 1.9
11 I.C.E.A Limited 0 0 431,255 3,947,898 4,379,153 25.712 Jubilee Insurance Co. Ltd. 0 0 281,375 1,437,213 1,718,588 10.1
13 Kenindia Insurance Co. Ltd. 0 0 242,629 729,619 972,248 5.7
14 Kenya National Ass. (2001) Co. Ltd 0 0 24,024 0 24,024 0.1
15 Kenyan Alliance Ins. Co. Ltd. 0 0 2,341 77,684 80,025 0.5
16 Madison Insurance Co. Ltd. 0 0 438,719 448,945 887,664 5.2
18 Mercantile Insurance Co. Ltd. 0 0 31,337 33,046 64,383 0.4
17 metropolitan 0 0 9,973 54,507 64,480 0.4
19 Old Mutual Insurance Co. Ltd. 0 0 386,725 91,318 478,043 2.8
20 Pan Africa Life Ins. Co. Ltd. 0 0 1,218,492 910,597 2,129,089 12.5
21 Pioneer Assurance Co. Ltd. 0 0 184,642 111,577 296,219 1.7
22 The Monarch Ins. Co. Ltd. 0 0 0 74,119 74,119 0.4
23 Trinity Life Assurance Co. Ltd. 0 0 28,178 181 28,359 0.2
24 UAP Insurance Co. Ltd. 0 0 137,510 272,455 409,965 2.4
TOTAL 0 0 6,188,155 10,869,388 17,057,543 100.0
Figures in Thousands Kshs.
No. Name of Insurer Bond Investiment Industrial Life Ordinary Life Superannuation TOTAL
1 Apollo 0 0 0 0 0
2 Blue Shield 0 0 0 0 0
3 British American 0 0 0 0 0
4 Cannon 0 0 0 0 0
5 CFC Life 0 0 0 0 0
6 Cooperative 0 0 0 0 0
7 First Assurance 0 0 0 0 0
8 Corporate 0 0 0 0 0
9 Geminia 0 0 0 0 0
10 Heritage AII 0 0 0 0 0
11 ICEA 0 0 0 0 0
12 Jubilee 0 0 109 2,042 2,151
13 Kenindia 0 0 0 0 0
14 Kenya National Ass. (2001) Co. Ltd 0 0 0 0 0
15 Kenyan Alliance Ins. Co. Ltd. 0 0 0 0 0
16 Madison Insurance Co. Ltd. 0 0 0 0 0
18 Mercantile Insurance Co. Ltd. 0 0 0 0 0
17 Metropolitan 0 0 0 0 0
19 Old Mutual Insurance Co. Ltd. 0 0 0 0 0
20 Pan Africa Life Ins. Co. Ltd. 0 0 0 0 0
21 Pioneer Assurance Co. Ltd. 0 0 0 0 0
22 The Monarch Ins. Co. Ltd. 0 0 0 0 0
23 Trinity Life Assurance Co. Ltd. 0 0 0 0 0
24 UAP Insurance Co. Ltd. 0 0 0 0 0
TOTAL 0 0 109 2,042 2,151
Figures in Thousands Kshs.
SUMMARY OF GROSS DIRECT PREMIUM INCOMES OF INSURERS UNDER LONG TERM
INSURANCE BUSINESS FOR THE YEAR ENDING 31ST DECEMBER 2007
SUMMARY OF INWARD REINSURANCE PREMIUM INCOMES OF INSURERS UNDER LONG TERM
INSURANCE BUSINESS FOR THE YEAR ENDING 31ST DECEMBER 2007

Insurance Regulatory Authority
60 2007 Insurance Annual Report
No. Name of Insurer BOND INDUSTRIAL ORDINARY SUPER- TOTAL
INVESTMENT LIFE LIFE ANNUATION
1 Apollo 0 0 0 90,868 90,868
2 Blue Shield 0 0 188 2,033 2,221
3 British American 0 0 30,476 152,389 182,865
4 Cannon 0 0 1,208 0 1,208
5 CFC Life 0 0 14,435 22,607 37,042
6 Cooperative 0 0 4,833 65,669 70,502
7 Corporate 0 0 512 857 1,369
8 First Assurance 0 0 0 23,757 23,757
9 Geminia 0 0 1,145 1,416 2,561
10 Heritage AII 0 0 0 64,132 64,132
11 ICEA 0 0 34,800 56,690 91,490
12 Jubilee 0 0 5,936 91,779 97,715
13 Kenindia 0 0 1,076 42,550 43,626
14 Kenya National Ass. (2001) Co. Ltd 0 0 0 0 0
15 Kenyan Alliance Ins. Co. Ltd. 0 0 69 39,162 39,231
16 Madison Insurance Co. Ltd. 0 0 3,709 15,014 18,723
17 Mercantile Insurance Co. Ltd. 0 0 1,544 7,748 9,292
18 Metropolitan 0 0 208 3,135 3,343
19 Old Mutual Insurance Co. Ltd. 0 0 19,655 9,998 29,653
20 Pan Africa Life Ins. Co. Ltd. 0 0 25,266 211,497 236,763
21 Pioneer Assurance Co. Ltd. 0 0 501 13,017 13,518
22 The Monarch Ins. Co. Ltd. 0 0 0 21,851 21,851
23 Trinity Life Assurance Co. Ltd. 0 0 92 0 92
24 UAP Insurance Co. Ltd. 0 0 0 62,500 62,500
TOTAL 0 0 145,653 998,669 1,144,322
Figures in Thousands Kshs.
SUMMARY OF OUTWARD REINSURANCE PREMIUMS UNDER LONG TERM INSURANCE
BUSINESS FOR THE YEAR ENDING 31ST DECEMBER 2007
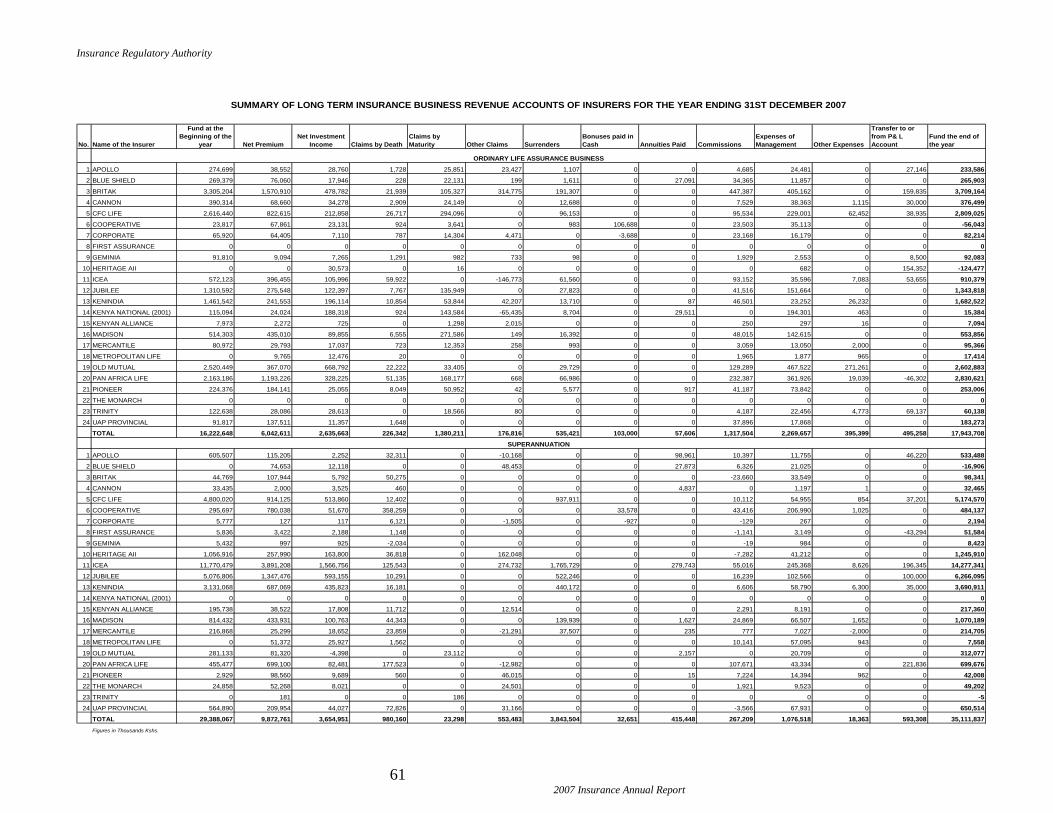
Insurance Regulatory Authority
61 2007 Insurance Annual Report
1 APOLLO 274,699 38,552 28,760 1,728 25,851 23,427 1,107 0 0 4,685 24,481 0 27,146 233,586
2 BLUE SHIELD 269,379 76,060 17,946 228 22,131 199 1,611 0 27,091 34,365 11,857 0 0 265,903
3 BRITAK 3,305,204 1,570,910 478,782 21,939 105,327 314,775 191,307 0 0 447,387 405,162 0 159,835 3,709,164
4 CANNON 390,314 68,660 34,278 2,909 24,149 0 12,688 0 0 7,529 38,363 1,115 30,000 376,499
5 CFC LIFE 2,616,440 822,615 212,858 26,717 294,096 0 96,153 0 0 95,534 229,001 62,452 38,935 2,809,025
6 COOPERATIVE 23,817 67,861 23,131 924 3,641 0 983 106,688 0 23,503 35,113 0 0 -56,043
7 CORPORATE 65,920 64,405 7,110 787 14,304 4,471 0 -3,688 0 23,168 16,179 0 0 82,214
8 FIRST ASSURANCE 0 0 0 0 0 0 0 0 0 0 0 0 0 0
9 GEMINIA 91,810 9,094 7,265 1,291 982 733 98 0 0 1,929 2,553 0 8,500 92,083
10 HERITAGE AII 0 0 30,573 0 16 0 0 0 0 0 682 0 154,352 -124,477
11 ICEA 572,123 396,455 105,996 59,922 0 -146,773 61,560 0 0 93,152 35,596 7,083 53,655 910,379
12 JUBILEE 1,310,592 275,548 122,397 7,767 135,949 0 27,823 0 0 41,516 151,664 0 0 1,343,818
13 KENINDIA 1,461,542 241,553 196,114 10,854 53,844 42,207 13,710 0 87 46,501 23,252 26,232 0 1,682,522
14 KENYA NATIONAL (2001) 115,094 24,024 188,318 924 143,584 -65,435 8,704 0 29,511 0 194,301 463 0 15,384
15 KENYAN ALLIANCE 7,973 2,272 725 0 1,298 2,015 0 0 0 250 297 16 0 7,094
16 MADISON 514,303 435,010 89,855 6,555 271,586 149 16,392 0 0 48,015 142,615 0 0 553,856
17 MERCANTILE 80,972 29,793 17,037 723 12,353 258 993 0 0 3,059 13,050 2,000 0 95,366
18 METROPOLITAN LIFE 0 9,765 12,476 20 0 0 0 0 0 1,965 1,877 965 0 17,414
19 OLD MUTUAL 2,520,449 367,070 668,792 22,222 33,405 0 29,729 0 0 129,289 467,522 271,261 0 2,602,883
20 PAN AFRICA LIFE 2,163,186 1,193,226 328,225 51,135 168,177 668 66,986 0 0 232,387 361,926 19,039 -46,302 2,830,621
21 PIONEER 224,376 184,141 25,055 8,049 50,952 42 5,577 0 917 41,187 73,842 0 0 253,006
22 THE MONARCH 0 0 0 0 0 0 0 0 0 0 0 0 0 0
23 TRINITY 122,638 28,086 28,613 0 18,566 80 0 0 0 4,187 22,456 4,773 69,137 60,138
24 UAP PROVINCIAL 91,817 137,511 11,357 1,648 0 0 0 0 0 37,896 17,868 0 0 183,273
TOTAL 16,222,648 6,042,611 2,635,663 226,342 1,380,211 176,816 535,421 103,000 57,606 1,317,504 2,269,657 395,399 495,258 17,943,708
1 APOLLO 605,507 115,205 2,252 32,311 0 -10,168 0 0 98,961 10,397 11,755 0 46,220 533,488
2 BLUE SHIELD 0 74,653 12,118 0 0 48,453 0 0 27,873 6,326 21,025 0 0 -16,906
3 BRITAK 44,769 107,944 5,792 50,275 0 0 0 0 0 -23,660 33,549 0 0 98,341
4 CANNON 33,435 2,000 3,525 460 0 0 0 0 4,837 0 1,197 1 0 32,465
5 CFC LIFE 4,800,020 914,125 513,860 12,402 0 0 937,911 0 0 10,112 54,955 854 37,201 5,174,570
6 COOPERATIVE 295,697 780,038 51,670 358,259 0 0 0 33,578 0 43,416 206,990 1,025 0 484,137
7 CORPORATE 5,777 127 117 6,121 0 -1,505 0 -927 0 -129 267 0 0 2,194
8 FIRST ASSURANCE 5,836 3,422 2,188 1,148 0 0 0 0 0 -1,141 3,149 0 -43,294 51,584
9 GEMINIA 5,432 997 925 -2,034 0 0 0 0 0 -19 984 0 0 8,423
10 HERITAGE AII 1,056,916 257,990 163,800 36,818 0 162,048 0 0 0 -7,282 41,212 0 0 1,245,910
11 ICEA 11,770,479 3,891,208 1,566,756 125,543 0 274,732 1,765,729 0 279,743 55,016 245,368 8,626 196,345 14,277,341
12 JUBILEE 5,076,806 1,347,476 593,155 10,291 0 0 522,246 0 0 16,239 102,566 0 100,000 6,266,095
13 KENINDIA 3,131,068 687,069 435,823 16,181 0 0 440,172 0 0 6,606 58,790 6,300 35,000 3,690,911
14 KENYA NATIONAL (2001) 0 0 0 0 0 0 0 0 0 0 0 0 0 0
15 KENYAN ALLIANCE 195,738 38,522 17,808 11,712 0 12,514 0 0 0 2,291 8,191 0 0 217,360
16 MADISON 814,432 433,931 100,763 44,343 0 0 139,939 0 1,627 24,869 66,507 1,652 0 1,070,189
17 MERCANTILE 216,868 25,299 18,652 23,859 0 -21,291 37,507 0 235 777 7,027 -2,000 0 214,705
18 METROPOLITAN LIFE 0 51,372 25,927 1,562 0 0 0 0 0 10,141 57,095 943 0 7,558
19 OLD MUTUAL 281,133 81,320 -4,398 0 23,112 0 0 0 2,157 0 20,709 0 0 312,077
20 PAN AFRICA LIFE 455,477 699,100 82,481 177,523 0 -12,982 0 0 0 107,671 43,334 0 221,836 699,676
21 PIONEER 2,929 98,560 9,689 560 0 46,015 0 0 15 7,224 14,394 962 0 42,008
22 THE MONARCH 24,858 52,268 8,021 0 0 24,501 0 0 0 1,921 9,523 0 0 49,202
23 TRINITY 0 181 0 0 186 0 0 0 0 0 0 0 0 -5
24 UAP PROVINCIAL 564,890 209,954 44,027 72,826 0 31,166 0 0 0 -3,566 67,931 0 0 650,514
TOTAL 29,388,067 9,872,761 3,654,951 980,160 23,298 553,483 3,843,504 32,651 415,448 267,209 1,076,518 18,363 593,308 35,111,837
Figures in Thousands Kshs.
SUPERANNUATION
ORDINARY LIFE ASSURANCE BUSINESS
No. Name of the Insurer
Fund at the
Beginning of the
year Net Premium
Net Investment
Income Claims by Death
Claims by
Maturity Other Claims
SUMMARY OF LONG TERM INSURANCE BUSINESS REVENUE ACCOUNTS OF INSURERS FOR THE YEAR ENDING 31ST DECEMBER 2007
Expenses of
Management Other Expenses
Transfer to or
from P& L
Account
Fund the end of
the yearSurrenders
Bonuses paid in
Cash Annuities Paid Commissions

Insurance Regulatory Authority
62 2007 Insurance Annual Report
NAME OF THE NUMBER OF NUMBER OF SUMS INSURED SINGLE YEARLY NUMBER OF NUMBER OF SUMS INSURED YEARLY RENEWAL INSURER POLICIES LIVES AND PREMIUM PREMIUM POLICIES LIVES WITH BONUSES PREMIUM
N0. ANNUITIES INCOME AND ANNUITIES P.A
1 APOLLO 418 418 21,025 0 8,355 3,299 3,299 353,332 38,5522 BLUE SHIELD 3,042 3,042 356,534 0 0 10,362 10,362 694,025 03 BRITAK 9,410 9,410 5,294,466 4 800 68,330 68,330 17,164,738 2,079,2724 CANNON 769 769 205,370 0 21,983 5,365 5,365 1,940,151 69,8685 CFC LIFE 8,099 8,099 4,356,990 0 184,585 48,483 48,483 13,971,437 837,0506 CO-OPERATIVE 2,292 2,178 394,621 0 32,539 4,804 4,564 851,002 72,6947 CORPORATE 1,428 0 222,914 0 19,214 3,739 3,739 407,694 64,9178 FIRST ASSURANCE 0 0 0 0 0 0 0 0 09 GEMINIA 1,090 0 172,020 0 3,817 3,173 3,173 378,455 10,238
10 HERITAGE AII 0 0 0 0 0 0 0 0 011 ICEA 4,098 0 2,945,110 0 152,826 11,366 11,366 8,764,233 443,52912 JUBILEE 2,398 2,398 1,198,022 0 0 13,105 13,105 5,836,799 409,18713 KENINDIA 2,016 0 480,244 0 0 9,756 9,756 2,852,096 147,54214 KENYA NATIONAL (2001) 0 0 0 0 0 5,902 5,902 175,349 6,42215 KENYAN ALLIANCE 98 98 3,564 0 3,564 263 263 6,795 2,34116 METROPOLITAN 2,681 0 43,346 0 93,370 2,176 2,176 90,505 78,25317 MADISON 1,542 1,542 178,251 0 161,273 43,308 43,308 3,663,055 592,21718 MERCANTILE 787 787 193,621 0 8,728 3,208 3,208 185,146 32,49319 OLD MUTUAL 5,720 5,720 6,024,345 120,711 604,148 14,932 14,932 11,049,251 1,654,35420 PAN AFRICA LIFE 27,473 33,100 454,211 29,491 181,397 98,292 125,616 4,810,331 1,412,56021 PIONEER 4,501 4,501 602,709 48,364 136,278 19,011 19,011 1,511,571 184,64222 TRINITY 1,622 1,622 166,013 0 0 2,698 2,698 111,776 20,80023 THE MONARCH 0 0 0 0 0 0 0 0 024 UAP PROVINCIAL 1,270 1,270 180,150 500 0 2,302 2,302 271,946 28,521
TOTAL 80,754 74,954 23,493,526 199,070 1,612,877 373,874 400,958 75,089,687 8,185,452
1 APOLLO 12 3,496 11,994,279 0 31,208 45 38,114 38,701,771 122,9742 BLUE SHIELD 14 7,744 6,989,798 0 0 42 4,986 27,660,053 03 BRITAK 78 21,546 12,924,225 0 198,394 247 148,904 67,186,950 374,7284 CANNON 3 3 218 0 0 1 310 6,968 765 CFC LIFE 291 2,236 605,848 0 122,589 1,437 55,967 10,041,101 1,355,1916 CO-OPERATIVE 272 297,048 27,657,134 0 99,249 1,172 806,993 88,859,500 845,7077 CORPORATE 0 0 0 0 0 5 729 3,154 1,0728 FIRST ASSURANCE 14 5,018 5,657,725 0 22,082 22 6,198 7,287,116 27,1809 GEMINIA 0 0 0 0 0 9 1,418 291,418 2,412
10 HERITAGE AII 14 3,936 7,631,584 0 46,572 133 17,866 22,825,271 151,19311 ICEA 22 2,570 2,918,801 0 125,529 652 36,660 61,584,053 1,906,03512 JUBILEE 126 12,381 20,726,948 0 0 565 22,309 36,876,682 195,33513 KENINDIA 6 1,352 844,236 0 0 192 13,908 16,398,862 729,61714 KENYA NATIONAL (2001) 0 0 0 0 0 0 0 0 015 KENYAN ALLIANCE 12 1,295 2,728,186 0 2,341 77 6,248 10,093,662 77,68416 METROPOLITAN 4 673 1,488 0 7,628 4 673 1,488 7,62817 MADISON 524 3,496 1,397,152 23,830 32,240 3,088 50,650 8,153,607 295,44818 MERCANTILE 0 0 0 0 0 29 29 181,014 16,09119 OLD MUTUAL 0 0 0 0 0 10 254 2,036,019 90,05420 PAN AFRICA LIFE 24 17,526 17,900,000 553,056 144,771 109 164,668 106,708,473 896,17621 PIONEER 2,504 2,504 609,496 2,966 2,966 2,504 2,504 609,496 2,96622 TRINITY 0 0 0 0 0 0 0 0 023 THE MONARCH 6 3,198 4,797,232 - 11,744 20 5,669 7,034,909 20,88724 UAP PROVINCIAL 45 4,671 7,817,035 0 26,405 123 34,953 34,495,747 272,161
TOTAL 3,971 390,693 133,201,385 579,852 873,718 10,486 1,420,010 547,037,314 7,390,615
1 EAST AFRICA RE 4,880 0 291,540 0 2,210 0 9,650 656,230 4,5392 KENYA RE 5,948 5,948 5,988,737 0 25,505 15,790 15,750 9,799,522 52,200
TOTAL 10,828 5,948 6,280,277 0 27,715 15,790 25,400 10,455,752 56,739
1 EAST AFRICA RE 517 74,500 14,516,142 0 78,923 517 74,560 14,516,141 78,9232 KENYA RE 3,165 518,053 350,590,645 0 552,092 3,165 518,053 350,590,645 552,092
TOTAL 3,682 592,553 365,106,787 0 631,015 3,682 592,613 365,106,786 631,015
Figures in thousands Kshs.
SUPERANNUATION BUSINESS
SUMMARY OF LONG TERM INSURANCE BUSINESS PARTICULARS OF INSURERS FOR THE YEAR ENDING 31ST DECEMBER 2007
TOTAL LIFE INSURANCE BUSINESS IN FORCE AT THE END OF THE YEARNEW LIFE INSURANCE BUSINESS IN RESPECT OF WHICH PREMIUM HAS BEEN PAID OVER THE YEAR
ORDINARY LIFE ASSURANCE BUSINESS
SUPERANNUATION BUSINESS
ORDINARY LIFE ASSURANCE BUSINESS

Insurance Regulatory Authority
63 2007 Insurance Annual Report
No. Name of Insurer Valuation Basis Life Fund Actuarial Liabilities Surplus to Policyholders Surplus to Shareholders Surplus Carried Forward Total Surplus
1 Apollo Minimun 840,439 595,887 47,994 73,365 123,192 244,551
2 Blue Shield Minimum 338,181 331,087 4,143 0 2,950 7,093
3 British American Minimum 8,167 5,266 0 175,000 2,395,000 2,570,000
4 Cannon Minimum 438,963 338,759 0 30,000 70,204 100,204
5 CFC Life Minimum 8,139,594 7,034,155 398,018 156,000 949,439 1,503,457
6 Cooperative Minimum 565,997 450,091 6,941 25,000 83,965 115,906
7 Corporate Minimum 79,270 66,384 251 0 12,634 12,885
8 Geminia Minimum 111,589 83,060 2,607 8,500 17,422 28,529
9 First assurance Other 51,583 3,497 0 0 48,086 48,086
10 Heritage AII Minimum 1,245,910 900,666 110,860 0 234,384 345,244
11 ICEA Minimum 16,231,016 14,073,825 1,105,135 250,000 802,056 2,157,191
12 Jubilee Minimum 7,709,912 7,074,933 84,977 100,000 534,979 719,956
13 Kenindia Minimun 5,451,121 5,010,394 76,893 0 314 77,207
14 KNAC (2001) Minimum 161,043 145,659 0 0 15,384 15,384
15 Kenya Alliance Minimun 234,555 206,932 20,479 0 7,142 27,621
16 Madison Minimun 1,624,211 1,499,120 80,607 0 44,485 125,092
17 Mercantile Minimum 310,072 241,558 19,061 0 49,452 68,513
18 Metropolitan life Other 23,393 21,384 0 -1,564 0 -1,564
19 Old Mutual Minimum 4,369,000 4,309,000 89,683 -240,511 59,790 -91,038
20 Pan Africa Minimun 3,711,279 3,438,196 97,550 53,684 292,172 443,406
21 Pioneer Minimum 277,911 241,527 6,608 0 29,776 36,384
22 The Monarch Other 63,378 26,639 730 0 36,008 36,738
23 Trinity Minimun 60,132 59,374 0 0 759 759
24 UAP Provincial Minimum 833,790 731,652 50,006 0 52,133 102,139
52,880,506 46,889,045 2,202,543 629,474 5,861,726 8,693,743
No. Name of Insurer Valuation Basis Life Fund Actuarial Liabilities Surplus to Policyholders Surplus to Shareholders Surplus Carried Forward Total Surplus
1 East Africa Re Other 75,347 48,116 0 0 27,230 27,230
2 Kenya Re Other 2,332,830 2,084,071 0 74,628 174,131 248,759
TOTAL 2,408,177 2,132,187 0 74,628 201,361 275,989
55,288,683 49,021,232 2,202,543 704,102 6,063,087 8,969,732
All amounts in thousands of Kshs.
Grand Total (Insurers & Reinsurers)
SUMMARY OF ACTUARIAL VALUATION REPORTS UNDER LONG TERM INSURANCE BUSINESS FOR THE YEAR ENDING 31ST DECEMBER 2007
TOTAL
REINSURERS

Insurance Regulatory Authority
64 2007 Insurance Annual Report
No. Name of Insurer Aviation Engineering Fire Domestic Fire Industrial Liability Marine & Transit Motor Private Motor Commercial
Personal
Accident Theft
Workman's
Compensation Miscellaneous TOTAL
Market Share
(%)
1 AIG (K) 0 52,240 43,455 556,981 205,866 38,923 229,159 193,875 336,823 67,164 22,681 3,965 1,751,132 5.7
2 Amaco -37 2,123 5,720 4,777 2,937 1,593 170,125 355,893 4,579 3,969 8,227 3,849 563,755 1.8
3 APA 151,770 47,473 21,227 172,127 174,766 77,506 210,912 332,607 873,917 71,312 103,381 97,081 2,334,079 7.5
4 Blue Shield 0 9,244 4,917 19,088 2,146 9,819 447,075 1,695,919 26,400 19,773 23,882 15,250 2,273,513 7.3
5 British American 0 9,752 15,489 53,348 1,481 54,125 53,911 64,743 371,817 19,122 18,404 8,285 670,477 2.2
6 Cannon 0 49,344 5,941 28,683 2,745 20,047 78,386 179,675 104,266 18,682 25,131 21,514 534,414 1.7
7 CFC Life 0 0 0 0 0 0 0 0 674,705 0 0 0 674,705 2.2
8 Concord 0 12,791 9,268 36,491 4,023 27,556 113,902 135,966 7,587 29,969 43,083 143,811 564,447 1.8
9 Cooperative 0 12,717 17,935 59,529 5,198 986 318,305 282,642 125,721 174,721 23,629 2,418 1,023,801 3.3
10 Corporate 0 5,036 5,896 23,089 1,938 2,789 108,515 143,446 13,606 19,978 11,757 3,407 339,457 1.1
11 Directline 0 0 0 0 0 0 0 320,270 0 0 0 0 320,270 1.0
12 Fidelity Shield 0 8,006 11,790 63,536 3,659 58,396 148,369 251,827 28,786 41,974 50,810 5,791 672,944 2.2
13 First Assuarance 0 76,202 25,829 136,492 12,526 50,564 182,016 285,462 89,393 62,829 67,162 22,639 1,011,114 3.3
14 Gateway 0 8,569 5,520 18,765 5,296 3,371 112,298 239,980 10,919 7,765 8,131 4,481 425,095 1.4
15 Geminia 0 7,079 15,729 45,220 4,172 49,504 86,785 115,006 13,678 44,306 61,467 4,515 447,461 1.4
16 General Accident 0 35,884 14,360 96,635 5,805 53,664 57,048 149,086 74,653 51,054 64,114 57,596 659,899 2.1
17 Heritage AII 9,562 22,138 90,432 172,184 43,104 61,269 380,511 186,722 341,279 62,715 81,246 38,472 1,489,634 4.8
18 ICEA 14,773 34,659 32,457 211,272 27,548 42,884 222,073 191,447 188,121 82,368 57,896 2,634 1,108,132 3.6
19 Intra Africa 0 21,450 11,403 28,766 1,317 26,887 87,800 127,128 14,061 26,194 43,563 14,853 403,422 1.3
20 Invesco 0.0
21 Jubilee 0 28,472 26,121 176,847 34,488 88,534 218,688 177,585 1,326,439 64,426 57,823 23,481 2,222,904 7.2
22 Kenindia 0 125,535 38,314 584,206 61,646 343,687 389,196 573,482 175,371 279,407 349,701 30,830 2,951,375 9.5
23 Kenya Orient 0 1,300 4,078 7,586 1,034 5,806 102,901 105,920 2,380 7,790 9,295 35,165 283,255 0.9
24 Kenyan Alliance 0 11,407 16,619 47,054 1,708 6,894 114,368 105,937 20,739 11,753 7,436 605 344,520 1.1
25 Lion of Kenya 7,829 37,480 35,306 169,076 16,155 80,453 187,947 364,740 95,612 62,406 57,427 22,540 1,136,971 3.7
26 Madison 0 17,000 7,188 44,450 39,927 30,708 77,026 107,831 256,664 12,199 11,511 21,624 626,128 2.0
27 Mayfair 0 22,546 10,115 30,232 2,533 21,135 49,331 26,284 11,730 24,912 31,112 16,015 245,945 0.8
28 Mercantile 0 2,325 8,188 28,210 859 6,145 28,029 23,355 44,418 13,695 5,229 191,474 351,927 1.1
29 Occidental 0 26,323 21,454 94,809 3,560 51,761 150,233 170,982 20,084 60,605 91,518 31,801 723,130 2.3
30 Pacis 0 3,194 3,760 13,218 3,280 1,219 57,370 58,254 10,345 5,616 5,202 1,036 162,494 0.5
31 Phoenix 73,149 55,190 7,259 76,253 2,568 4,985 158,998 74,274 9,209 12,570 6,447 783 481,685 1.6
32 Real 0 75,916 21,226 121,881 5,541 31,341 141,073 173,591 33,878 26,923 40,490 27,954 699,814 2.3
33 Standard 0 1,239 869 9,788 4,683 1,625 80,636 411,217 5,038 2,032 5,022 683 522,832 1.7
34 Tausi 0 17,103 18,700 63,133 4,831 85,216 75,677 66,346 12,555 61,383 63,862 25,138 493,944 1.6
35 The Monarch 0 6,898 2,504 12,572 1,636 2,132 32,713 45,397 27,397 3,607 4,396 1,274 140,526 0.5
36 Trident 0 11,592 9,711 45,102 2,129 24,601 59,121 84,197 11,182 32,964 52,255 23,589 356,443 1.2
37 UAP Provincial 0 56,359 51,413 178,546 40,777 128,622 231,557 408,157 675,433 96,331 52,488 24,117 1,943,800 6.3
TOTAL 257,046 914,586 620,193 3,429,946 731,882 1,494,747 5,162,054 8,229,243 6,038,785 1,582,514 1,565,778 928,670 30,955,444 100.0
Figures in Thousands Kshs.
SUMMARY OF GROSS DIRECT PREMIUM INCOMES OF INSURERS UNDER GENERAL INSURANCE BUSINESS FOR THE YEAR ENDING 31ST DECEMBER 2007
Under Statutory Management

Insurance Regulatory Authority
65 2007 Insurance Annual Report
No. Name of Insurer Aviation Engineering Fire Domestic Fire Industrial Liability Marine & Transit Motor Private Motor Commercial Personal Accident Theft
Workman's
Compensation Miscellaneous TOTAL
1 AIG (K) 0 0 0 18,887 8,602 5,988 0 0 14,955 2,156 0 0 50,588
2 Amaco 0 0 0 0 0 0 0 0 0 0 0 0 0
3 APA 4,411 4,736 0 4,805 696 190 0 68 1,881 104 417 4,196 21,504
4 Blue Shield 0 0 0 0 0 0 0 0 0 0 0 0 0
5 British American 0 718 0 5,450 120 1,608 0 0 787 52 471 37 9,243
6 Cannon 0 8,306 0 6,921 16 835 0 0 4,246 310 253 2,632 23,519
7 CFC Life 0 0 0 0 0 0 0 0 0 0 0 0 0
8 Concord 0 2,634 33 8,339 5 1,711 1,875 3,671 0 667 1,989 522 21,446
9 Cooperative 0 899 0 3,698 0 0 0 0 374 0 0 0 4,971
10 Corporate 0 1,330 0 8,580 68 866 719 0 0 -87 126 -13 11,589
11 Directline 0 0 0 0 0 0 0 0 0 0 0 0 0
12 Fidelity Shield 0 3,434 22 5,544 33 253 421 -415 1,224 59 19 531 11,125
13 First Assuarance 0 5,542 0 12,024 45 1,491 0 0 6,667 1,577 5 86 27,437
14 Gateway 0 5,178 -16 2,011 436 1,124 0 0 -192 950 969 867 11,327
15 Geminia 0 2,437 0 6,247 436 703 0 0 835 2,234 0 516 13,408
16 General Accident 0 5,754 132 8,601 1,860 2,405 686 254 856 868 0 930 22,346
17 Heritage AII 0 802 1 7,011 863 6,081 0 0 510 78 61 137 15,544
18 ICEA 0 4,251 132 27,656 977 5,009 1,117 101 12,369 7,702 1,217 4,505 65,036
19 Intra Africa 0 433 0 -991 0 0 0 0 0 40 0 2 -516
20 Invesco
21 Jubilee 0 2,554 0 38,745 0 23,084 40,269 0 11,335 0 0 111,365 227,352
22 Kenindia 0 15,948 15 38,724 2,332 4,534 780 1,169 8,373 4,579 0 703 77,157
23 Kenya Orient 0 0 34 -10 0 0 14 95 0 -2 0 0 131
24 Kenyan Alliance 0 105 0 7,348 12 301 0 0 331 81 698 0 8,876
25 Lion of Kenya - 18,376 0 39,620 2,999 4,969 0 0 8,610 2,347 1,241 2,522 80,684
26 Madison 0 0 0 0 0 0 0 0 0 0 0 0 0
27 Mayfair 0 3,443 19 10,542 601 1,091 288 1,137 4,592 1,959 1,109 2,371 27,152
28 Mercantile 0 2,344 102 9,183 105 225 364 492 3,729 1,201 26 160 17,931
29 Occidental 0 2,965 20 6,701 21 2,475 0 0 675 2,030 0 2,794 17,681
30 Pacis 0 0 0 0 0 0 0 0 0 0 0 0 0
31 Phoenix 0 9,301 0 25,880 -127 1,744 372 0 5,362 1,762 0 16 44,310
32 Real 0 14,492 0 21,048 1,190 2,016 264 1,316 3,910 874 -4 1,938 47,044
33 Standard 0 0 0 0 0 0 0 0 0 0 0 0 0
34 Tausi 0 999 0 3,907 40 479 477 74 229 333 0 96 6,634
35 The Monarch 0 0 0 0 0 0 0 0 0 0 0 0 0
36 Trident 0 1,425 0 2,427 5 15 124 0 0 4 404 114 4,518
37 UAP Provincial 0 7,837 132 26,546 1,883 5,636 0 0 11,956 2,169 0 96 56,255
TOTAL 4,411 126,243 626 355,444 23,218 74,833 47,770 7,962 103,614 34,047 9,001 137,123 924,292
Figures in Thousands Kshs.
SUMMARY OF INWARD REINSURANCE PREMIUM INCOMES OF INSURERS UNDER GENERAL INSURANCE BUSINESS FOR THE YEAR ENDING 31ST DECEMBER 2007
Under Statutory Management

Insurance Regulatory Authority
66 2007 Insurance Annual Report
No. Name of Insurer Aviation Engineering Fire Domestic Fire Industrial Liability
Marine &
Transit Motor Private
Motor
Commercial
Personal
Accident Theft
Workman's
Compensation Miscellaneous TOTAL
1 AIG (K) 0 51,123 -173 546,638 143,759 33,256 8,706 7,317 64,652 66,250 889 3,437 925,854
2 AMACO 0 479 4,433 3,012 1,021 707 23,026 48,660 1,987 1,463 0 1,432 86,220
3 APA 151,355 33,289 3,885 121,574 54,818 31,055 4,757 7,230 17,172 10,485 2,256 8,456 446,332
4 Blue Shield 0 5,111 456 6,351 0 3,205 8,357 33,769 3,740 4,619 0 845 66,453
5 British American 0 9,019 5,597 51,136 58 14,644 1,600 7,516 208,343 13,367 914 6,253 318,447
6 Cannon 0 48,203 2,857 29,050 1,067 15,348 3,939 14,410 60,373 8,904 0 10,361 194,512
7 CFC Life 0 0 0 0 0 0 0 0 28,137 0 0 0 28,137
8 Concord 0 11,950 1,674 29,180 1,843 11,211 7,482 5,416 5,794 22,392 2,961 88,548 188,451
9 Cooperative 0 7,566 2,910 39,530 680 782 13,954 12,391 38,580 10,486 1,036 1,134 129,049
10 Corporate 0 4,843 2,289 28,433 224 1,093 3,662 4,941 6,420 6,153 197 -1,661 56,594
11 Directline 0 0 0 0 0 0 0 17,560 0 0 0 0 17,560
12 Fidelity Shield 0 8,677 3,570 52,512 370 46,188 10,451 22,172 20,214 26,425 3,493 4,907 198,979
13 First Assuarance 0 68,470 9,396 124,148 3,554 26,277 7,190 14,585 55,290 20,363 2,653 17,708 349,634
14 Gateway 0 11,387 2,781 15,074 1 3,086 3,625 8,967 6,726 6,251 0 4,588 62,486
15 Geminia 0 8,695 8,473 43,560 494 31,328 9,313 12,835 10,926 26,436 6,596 2,918 161,574
16 General Accident 0 36,760 2,427 61,796 758 19,364 7,494 33,037 54,080 7,441 6,269 6,743 236,169
17 Heritage AII 9,261 9,319 15,134 110,074 24,276 36,381 11,286 4,878 21,173 3,287 1,202 7,497 253,768
18 ICEA 13,306 32,335 10,655 203,220 21,143 30,043 15,719 14,690 59,727 35,087 4,919 5,767 446,611
19 Intra Africa 0 12,452 5,164 19,063 73 5,364 4,616 5,919 5,097 8,322 1,966 5,155 73,191
20 Invesco
21 Jubilee 0 21,166 2,996 183,223 3,766 35,064 8,927 0 16,188 26,313 498 18,636 316,777
22 Kenindia 0 100,549 11,831 477,048 39,433 156,618 8,882 16,150 117,663 156,123 7,305 20,066 1,111,668
23 Kenya Orient 0 339 660 2,141 56 1,465 2,102 2,021 120 747 198 5,182 15,031
24 Kenyan Alliance 0 9,610 3,219 42,331 267 1,690 17,177 9,548 732 1,899 999 51 87,523
25 Lion of Kenya 7,542 42,571 6,767 168,275 8,400 50,955 6,272 23,160 48,616 11,088 6,046 21,799 401,491
26 Madison 0 14,805 984 32,446 1,771 23,771 2,893 3,319 13,535 7,806 0 8,907 110,237
27 Mayfair 0 24,470 6,783 36,905 1,233 17,048 1,772 989 10,971 20,014 1,167 9,457 130,809
28 Mercantile 0 3,358 2,908 27,900 472 4,398 3,550 3,032 43,438 11,503 -3 153,008 253,564
29 Occidental 0 24,781 6,314 75,787 2,900 27,380 0 3,400 11,100 45,173 3,400 21,281 221,516
30 Pacis 0 2,316 1,506 8,432 147 725 2,686 2,608 417 211 210 793 20,051
31 Phoenix 69,931 58,311 1,928 89,091 520 4,773 19,819 10,659 3,363 1,439 756 54 260,644
32 Real 0 65,079 5,767 111,404 229 20,704 6,032 5,911 21,263 1,014 3,085 6,762 247,250
33 Standard 0 590 324 4,529 0 1,105 0 5,144 2,261 988 0 130 15,071
34 Tausi 0 18,660 10,875 57,551 1,338 31,751 3,310 3,561 9,772 41,128 2,701 10,046 190,693
35 The Monarch 0 2,733 439 9,071 559 1,523 1,011 1,488 9,232 2,470 146 410 29,082
36 Trident 0 10,559 3,902 37,382 135 5,113 1,016 11,426 4,804 13,770 1,636 6,024 95,767
37 UAP Provincial 0 35,285 12,368 163,481 25,214 61,938 12,595 22,225 57,184 5,952 2,793 20,398 419,433
TOTAL 251,395 794,860 161,099 3,011,348 340,579 755,353 243,221 400,934 1,039,090 625,369 66,288 477,092 8,166,628
Figures in Thousands Kshs.
SUMMARY OF OUTWARD REINSURANCE PREMIUMS OF INSURERS UNDER GENERAL INSURANCE BUSINESS FOR THE YEAR ENDING 31ST DECEMBER 2007
Under Statutory Management
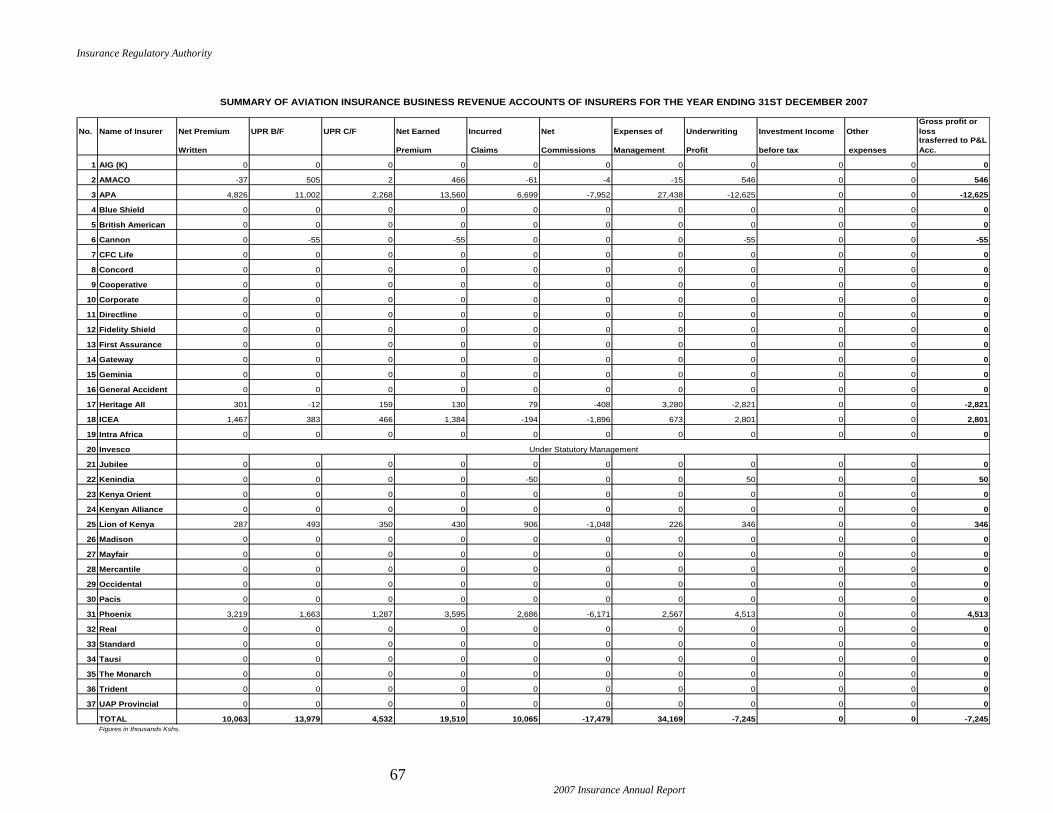
Insurance Regulatory Authority
67 2007 Insurance Annual Report
No. Name of Insurer Net Premium UPR B/F UPR C/F Net Earned Incurred Net Expenses of Underwriting Investment Income Other
Gross profit or
loss
Written Premium Claims Commissions Management Profit before tax expenses
trasferred to P&L
Acc.
1 AIG (K) 0 0 0 0 0 0 0 0 0 0 0
2 AMACO -37 505 2 466 -61 -4 -15 546 0 0 546
3 APA 4,826 11,002 2,268 13,560 6,699 -7,952 27,438 -12,625 0 0 -12,625
4 Blue Shield 0 0 0 0 0 0 0 0 0 0 0
5 British American 0 0 0 0 0 0 0 0 0 0 0
6 Cannon 0 -55 0 -55 0 0 0 -55 0 0 -55
7 CFC Life 0 0 0 0 0 0 0 0 0 0 0
8 Concord 0 0 0 0 0 0 0 0 0 0 0
9 Cooperative 0 0 0 0 0 0 0 0 0 0 0
10 Corporate 0 0 0 0 0 0 0 0 0 0 0
11 Directline 0 0 0 0 0 0 0 0 0 0 0
12 Fidelity Shield 0 0 0 0 0 0 0 0 0 0 0
13 First Assurance 0 0 0 0 0 0 0 0 0 0 0
14 Gateway 0 0 0 0 0 0 0 0 0 0 0
15 Geminia 0 0 0 0 0 0 0 0 0 0 0
16 General Accident 0 0 0 0 0 0 0 0 0 0 0
17 Heritage AII 301 -12 159 130 79 -408 3,280 -2,821 0 0 -2,821
18 ICEA 1,467 383 466 1,384 -194 -1,896 673 2,801 0 0 2,801
19 Intra Africa 0 0 0 0 0 0 0 0 0 0 0
20 Invesco
21 Jubilee 0 0 0 0 0 0 0 0 0 0 0
22 Kenindia 0 0 0 0 -50 0 0 50 0 0 50
23 Kenya Orient 0 0 0 0 0 0 0 0 0 0 0
24 Kenyan Alliance 0 0 0 0 0 0 0 0 0 0 0
25 Lion of Kenya 287 493 350 430 906 -1,048 226 346 0 0 346
26 Madison 0 0 0 0 0 0 0 0 0 0 0
27 Mayfair 0 0 0 0 0 0 0 0 0 0 0
28 Mercantile 0 0 0 0 0 0 0 0 0 0 0
29 Occidental 0 0 0 0 0 0 0 0 0 0 0
30 Pacis 0 0 0 0 0 0 0 0 0 0 0
31 Phoenix 3,219 1,663 1,287 3,595 2,686 -6,171 2,567 4,513 0 0 4,513
32 Real 0 0 0 0 0 0 0 0 0 0 0
33 Standard 0 0 0 0 0 0 0 0 0 0 0
34 Tausi 0 0 0 0 0 0 0 0 0 0 0
35 The Monarch 0 0 0 0 0 0 0 0 0 0 0
36 Trident 0 0 0 0 0 0 0 0 0 0 0
37 UAP Provincial 0 0 0 0 0 0 0 0 0 0 0
TOTAL 10,063 13,979 4,532 19,510 10,065 -17,479 34,169 -7,245 0 0 -7,245
Figures in thousands Kshs.
SUMMARY OF AVIATION INSURANCE BUSINESS REVENUE ACCOUNTS OF INSURERS FOR THE YEAR ENDING 31ST DECEMBER 2007
Under Statutory Management

Insurance Regulatory Authority
68 2007 Insurance Annual Report
No. Name of Insurer Net Premium UPR B/F UPR C/F Net Earned Incurred Net Expenses of Underwriting Investment Other Gross profit or
Written Premium Claims Commissions Management Profit Income before expenses loss transferred
tax to P & L A/C
1 AIG (K) 1,118 318 179 1,257 3,804 -6,649 345 3,757 0 0 3,757
2 AMACO 1,645 56 69 1,632 963 285 638 -254 0 0 -254
3 APA 18,920 24,316 5,997 37,239 9,895 6,403 9,539 11,402 0 0 11,402
4 Blue Shield 4,133 4,060 1,222 6,971 -632 1,076 3,169 3,358 0 0 3,358
5 British American 1,451 823 343 1,931 254 -1,449 633 2,493 2,151 0 4,644
6 Cannon 9,447 2,795 4,664 7,578 -4,702 -5,076 8,209 9,147 0 0 9,147
7 CFC Life 0 0 0 0 0 0 0 0 0 0 0
8 Concord 3,475 1,750 1,300 3,925 1,239 -1,479 911 3,254 0 0 3,254
9 Cooperative 6,050 1,181 2,082 5,149 2,978 828 3,087 -1,744 0 0 -1,744
10 Corporate 1,523 675 899 1,299 214 -350 529 906 906
11 Directline 0 0 0 0 0 0 0 0 0 0 0
12 Fidelity Shield 2,763 628 1,233 2,158 -204 -76 2,131 307 0 0 307
13 First Assurance 13,275 5,394 5,374 13,295 5,914 -7,441 2,816 12,006 0 0 12,006
14 Gateway 2,360 5,546 2,920 4,986 249 -2,205 5,491 1,451 0 0 1,451
15 Geminia 821 359 334 846 328 -1,396 1,958 -44 0 0 -44
16 General Accident 4,879 1,992 2,362 4,509 277 -7,276 1,731 9,777 0 0 9,777
17 Heritage AII 13,621 5,678 5,192 14,107 2,518 2,341 8,672 576 0 0 576
18 ICEA 6,575 2,297 2,236 6,636 3,275 -3,999 2,581 4,779 0 0 4,779
19 Intra Africa 9,431 5,055 3,868 10,618 -1,393 -4,362 3,250 13,123 370 178 13,315
20 Invesco
21 Jubilee 9,859 5,457 3,900 11,416 12,922 7,755 9,221 -18,482 0 0 -18,482
22 Kenindia 40,933 15,602 16,274 40,261 14,477 -8,616 18,409 15,991 0 2,168 13,823
23 Kenya Orient 962 308 416 854 1,066 97 236 -545 0 0 -545
24 Kenyan Alliance 1,902 338 607 1,633 918 -597 3,659 -2,347 0 0 -2,347
25 Lion of Kenya 13,286 4,395 7,498 10,183 1,387 -3,300 1,581 10,515 0 0 10,515
26 Madison 2,195 1,158 729 2,624 1,064 -1,024 3,216 -632 0 0 -632
27 Mayfair 1,520 513 887 1,146 670 -2,168 3,731 -1,087 0 735 -1,822
28 Mercantile 1,311 1,563 1,446 1,428 272 -264 595 825 825
29 Occidental 4,506 3,087 1,815 5,778 -546 -1,229 1,452 6,101 0 0 6,101
30 Pacis 879 62 293 648 82 -114 542 138 432 48 522
31 Phoenix 6,180 3,988 2,967 7,201 4,138 -7,286 1,561 8,788 0 0 8,788
32 Real 25,330 19,247 14,993 29,584 17,463 -4,488 11,745 4,864 0 851 4,013
33 Standard 648 2,629 259 3,018 -296 19 277 3,018 0 0 3,018
34 Tausi -558 3,124 2,390 176 679 -1,610 3,870 -2,763 0 0 -2,763
35 The Monarch 4,165 631 2,143 2,653 807 270 2,397 -821 0 0 -821
36 Trident 2,457 985 1,043 2,399 589 -1,117 1,858 1,069 0 0 1,069
37 UAP Provincial 28,910 6,933 5,558 30,285 671 -2,359 7,721 24,252 0 0 24,252
TOTAL 245,972 132,943 103,492 275,423 81,340 -56,856 127,761 123,178 2,953 3,980 122,151
Figures in thousands Kshs.
SUMMARY OF ENGINEERING INSURANCE BUSINESS REVENUE ACCOUNTS OF INSURERS FOR THE YEAR ENDING 31ST DECEMBER 2007
Under Statutory Management
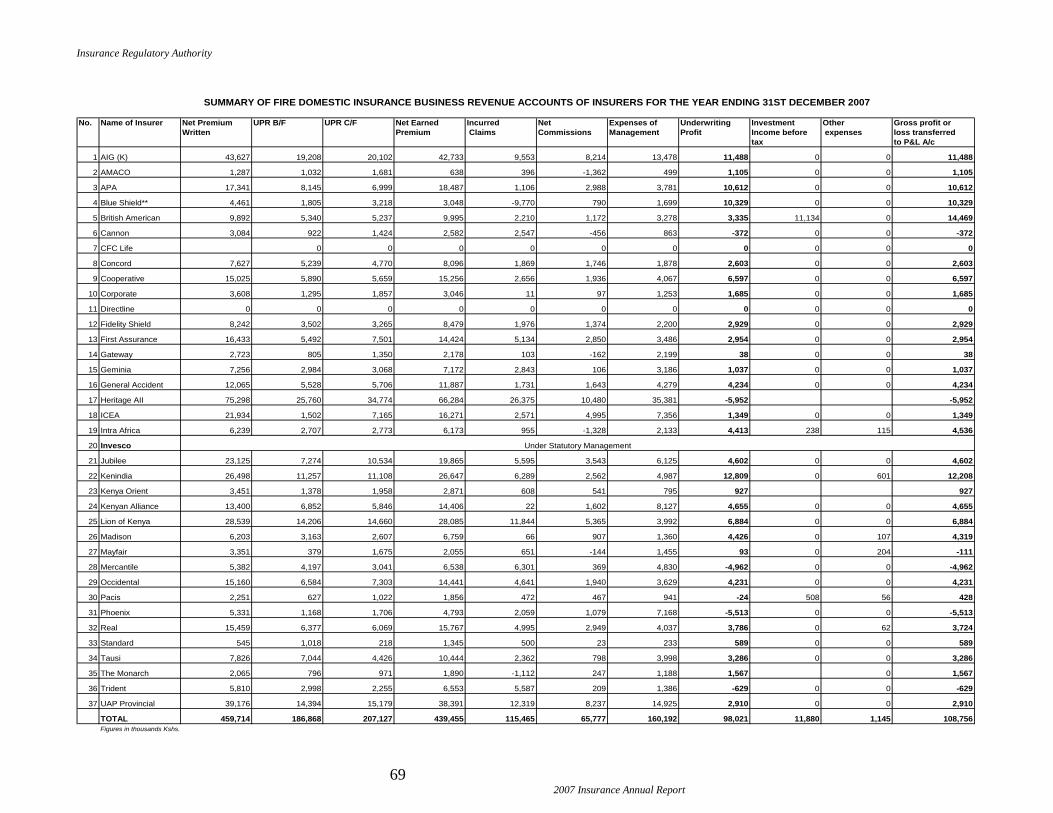
Insurance Regulatory Authority
69 2007 Insurance Annual Report
No. Name of Insurer Net Premium UPR B/F UPR C/F Net Earned Incurred Net Expenses of Underwriting Investment Other Gross profit or
Written Premium Claims Commissions Management Profit Income before expenses loss transferred
tax to P&L A/c
1 AIG (K) 43,627 19,208 20,102 42,733 9,553 8,214 13,478 11,488 0 0 11,488
2 AMACO 1,287 1,032 1,681 638 396 -1,362 499 1,105 0 0 1,105
3 APA 17,341 8,145 6,999 18,487 1,106 2,988 3,781 10,612 0 0 10,612
4 Blue Shield** 4,461 1,805 3,218 3,048 -9,770 790 1,699 10,329 0 0 10,329
5 British American 9,892 5,340 5,237 9,995 2,210 1,172 3,278 3,335 11,134 0 14,469
6 Cannon 3,084 922 1,424 2,582 2,547 -456 863 -372 0 0 -372
7 CFC Life 0 0 0 0 0 0 0 0 0 0
8 Concord 7,627 5,239 4,770 8,096 1,869 1,746 1,878 2,603 0 0 2,603
9 Cooperative 15,025 5,890 5,659 15,256 2,656 1,936 4,067 6,597 0 0 6,597
10 Corporate 3,608 1,295 1,857 3,046 11 97 1,253 1,685 0 0 1,685
11 Directline 0 0 0 0 0 0 0 0 0 0 0
12 Fidelity Shield 8,242 3,502 3,265 8,479 1,976 1,374 2,200 2,929 0 0 2,929
13 First Assurance 16,433 5,492 7,501 14,424 5,134 2,850 3,486 2,954 0 0 2,954
14 Gateway 2,723 805 1,350 2,178 103 -162 2,199 38 0 0 38
15 Geminia 7,256 2,984 3,068 7,172 2,843 106 3,186 1,037 0 0 1,037
16 General Accident 12,065 5,528 5,706 11,887 1,731 1,643 4,279 4,234 0 0 4,234
17 Heritage AII 75,298 25,760 34,774 66,284 26,375 10,480 35,381 -5,952 -5,952
18 ICEA 21,934 1,502 7,165 16,271 2,571 4,995 7,356 1,349 0 0 1,349
19 Intra Africa 6,239 2,707 2,773 6,173 955 -1,328 2,133 4,413 238 115 4,536
20 Invesco
21 Jubilee 23,125 7,274 10,534 19,865 5,595 3,543 6,125 4,602 0 0 4,602
22 Kenindia 26,498 11,257 11,108 26,647 6,289 2,562 4,987 12,809 0 601 12,208
23 Kenya Orient 3,451 1,378 1,958 2,871 608 541 795 927 927
24 Kenyan Alliance 13,400 6,852 5,846 14,406 22 1,602 8,127 4,655 0 0 4,655
25 Lion of Kenya 28,539 14,206 14,660 28,085 11,844 5,365 3,992 6,884 0 0 6,884
26 Madison 6,203 3,163 2,607 6,759 66 907 1,360 4,426 0 107 4,319
27 Mayfair 3,351 379 1,675 2,055 651 -144 1,455 93 0 204 -111
28 Mercantile 5,382 4,197 3,041 6,538 6,301 369 4,830 -4,962 0 0 -4,962
29 Occidental 15,160 6,584 7,303 14,441 4,641 1,940 3,629 4,231 0 0 4,231
30 Pacis 2,251 627 1,022 1,856 472 467 941 -24 508 56 428
31 Phoenix 5,331 1,168 1,706 4,793 2,059 1,079 7,168 -5,513 0 0 -5,513
32 Real 15,459 6,377 6,069 15,767 4,995 2,949 4,037 3,786 0 62 3,724
33 Standard 545 1,018 218 1,345 500 23 233 589 0 0 589
34 Tausi 7,826 7,044 4,426 10,444 2,362 798 3,998 3,286 0 0 3,286
35 The Monarch 2,065 796 971 1,890 -1,112 247 1,188 1,567 0 1,567
36 Trident 5,810 2,998 2,255 6,553 5,587 209 1,386 -629 0 0 -629
37 UAP Provincial 39,176 14,394 15,179 38,391 12,319 8,237 14,925 2,910 0 0 2,910
TOTAL 459,714 186,868 207,127 439,455 115,465 65,777 160,192 98,021 11,880 1,145 108,756
Figures in thousands Kshs.
SUMMARY OF FIRE DOMESTIC INSURANCE BUSINESS REVENUE ACCOUNTS OF INSURERS FOR THE YEAR ENDING 31ST DECEMBER 2007
Under Statutory Management

Insurance Regulatory Authority
70 2007 Insurance Annual Report
No. Name of Insurer Net Premium UPR B/F UPR C/F Net Earned Incurred Net Commissions Expenses of Underwriting Investment Other Gross profit or
Written Premium Claims Commissions Management Profit Income before expenses loss transferred
tax to P&L A/C
1 AIG(K) 29230 11,834 14,023 27,041 11,465 -68,195 9,030 74,741 0 0 74,741
2 AMACO 1,765 1,057 1,465 1,357 1,192 -763 685 243 0 0 243
3 APA 55,358 42,555 17,679 80,234 23,890 -14,785 31,348 39,781 0 0 39,781
4 Blue Shield 12,737 7,044 3,179 16,602 -556 2,237 6,552 8,369 0 0 8,369
5 British American 7,663 4,461 3,440 8,684 194 -6,988 2,848 12,630 9,673 0 22,303
6 Cannon 6,554 -561 1,955 4,038 -4,686 -3,349 4,875 7,198 0 0 7,198
7 CFC Life 0 0 0 0 0 0 0 0 0 0 0
8 Concord 15,649 4,762 3,742 16,669 3,785 -136 3,868 9,152 0 0 9,152
9 Cooperative 23,696 8,189 8,888 22,997 20,143 -6,511 14,336 -4,971 0 0 -4,971
10 Corporate 3,237 631 1,627 2,241 -76 -4,337 1,124 5,530 5,530
11 Directline 0 0 0 0 0 0 0 0 0 0 0
12 Fidelity Shield 16,569 5,522 5,800 16,291 13,515 -1,180 12,866 -8,910 0 0 -8,910
13 First Assurance 24,367 8,090 10,442 22,015 11,232 -11,193 5,169 16,807 0 0 16,807
14 Gateway 5,702 6,736 4,112 8,326 1,503 -5,440 8,299 3,964 0 0 3,964
15 Geminia 7,907 3,024 3,193 7,738 23,751 -4,301 10,612 -22,324 0 0 -22,324
16 General Accident* 43,440 13,888 16,311 41,017 7,677 -1,169 15,406 19,103 0 0 19,103
17 Heritage AII 69,121 20,639 29,633 60,127 35,964 -708 49,713 -24,842 0 0 -24,842
18 ICEA 35,708 14,653 9,982 40,379 3,000 488 14,396 22,495 0 0 22,495
19 Intra Africa 8,712 5,106 4,351 9,467 4,452 -4,963 2,997 6,981 334 161 7,154
20 Invesco
21 Jubilee 32,370 25,529 33,742 24,157 47,999 -9,771 45,297 -59,368 0 0 -59,368
22 Kenindia 145,882 39,737 47,518 138,101 98,847 -36,069 81,053 -5,730 0 12,050 -17,780
23 Kenya Orient 5,436 1,822 3,433 3,825 -2,176 1,216 1,059 3,726 3,726
24 Kenyan Alliance 12,071 -619 579 10,873 26,427 -3,012 9,399 -21,941 0 0 -21,941
25 Lion of Kenya 40,421 21,013 17,907 43,527 27,770 -18,642 23,168 11,231 0 0 11,231
26 Madison 12,004 2,802 3,034 11,772 3,915 -3,004 8,410 2,451 0 660 1,791
27 Mayfair 3,869 402 1,578 2,693 1,325 -1,884 5,853 -2,601 0 1,109 -3,710
28 Mercantile 9,493 15,911 17,113 8,291 1,270 -186 9,601 -2,394 0 0 -2,394
29 Occidental 25,723 13,141 18,036 20,828 10,701 -3,561 5,233 8,455 0 0 8,455
30 Pacis 4,786 1,306 2,145 3,947 282 597 2,275 793 1,786 198 2,381
31 Phoenix 13,042 3,782 4,172 12,652 4,312 -7,921 8,268 7,993 0 0 7,993
32 Real 31,526 16,600 12,961 35,165 47,577 -7,651 36,733 -41,494 0 728 -42,222
33 Standard 5,259 6,579 2,104 9,734 507 1,326 2,247 5,654 0 0 5,654
34 Tausi 9,489 10,091 3,899 15,681 -3,282 2,659 14,333 1,971 0 0 1,971
35 The Monarch 3,501 1,055 1,676 2,880 392 275 2,015 198 0 0 198
36 Trident 10,146 4,016 3,938 10,224 4,890 -8,515 6,784 7,064 0 0 7,064
37 UAP Provincial 41,611 24,387 13,735 52,263 19,240 2,591 35,318 -4,886 0 0 -4,886
TOTAL 774,044 345,184 327,392 791,836 446,441 -222,845 491,170 77,069 11,793 14,906 73,956
Figures in thousands Kshs.
SUMMARY OF FIRE INDUSTRIAL INSURANCE BUSINESS REVENUE ACCOUNTS OF INSURERS FOR THE YEAR ENDING 31ST DECEMBER 2007
Under Statutory Management

Insurance Regulatory Authority
71 2007 Insurance Annual Report
No. Name of Insurer Net Premium UPR B/F UPR C/F Net Earned Incurred Net Expenses of Underwriting Investment Other Gross profit or
Written Premium Claims Commissions Management Profit Income before expenses loss transferred
tax to P&L A/C
1 AIG (K) 70,708 26,208 23,790 73,126 23,436 -342 21,845 28,187 0 0 28,187
2 AMACO 1,916 477 854 1,539 1,841 67 743 -1,112 0 0 -1,112
3 APA 120,644 25,074 97,023 48,695 8,757 12,302 32,074 -4,438 0 0 -4,438
4 Blue Shield 2,146 1,148 1,092 2,202 261 588 748 605 0 0 605
5 British American 1,543 473 427 1,589 206 330 521 532 1,770 0 2,302
6 Cannon 1,694 234 939 989 -461 52 396 1,002 0 0 1,002
7 CFC Life 0 0 0 0 0 0 0 0 0 0 0
8 Concord 2,184 1,406 1,055 2,535 826 -8 588 1,129 0 0 1,129
9 Cooperative 4,518 40,904 1,965 43,457 38,978 901 1,179 2,399 0 0 2,399
10 Corporate 1,782 21 918 885 1,121 344 619 -1,199 0 0 -1,199
11 Directline 0 0 0 0 0 0 0 0 0 0 0
12 Fidelity Shield 3,322 1,032 1,073 3,281 -2,007 677 687 3,924 0 0 3,924
13 First Assurance 9,018 6,901 3,269 12,650 7,181 1,424 1,913 2,132 2,132
14 Gateway 5,729 1,212 2,276 4,665 1,745 1,113 2,290 -483 0 0 -483
15 Geminia 4,114 1,195 1,613 3,696 91 886 913 1,806 0 0 1,806
16 General Accident 6,907 3,869 3,771 7,005 6,450 1,324 2,450 -3,219 0 0 -3,219
17 Heritage AII 19,690 5,478 9,048 16,120 -3,733 206 8,427 11,220 0 0 11,220
18 ICEA 7,382 2,609 2,664 7,327 3,487 686 2,725 429 0 0 429
19 Intra Africa 1,244 568 527 1,285 -660 114 435 1,396 48 23 1,421
20 Invesco
21 Jubilee 30,721 2,149 5,960 26,910 8,558 4,005 10,863 3,484 0 0 3,484
22 Kenindia 24,545 6,813 17,178 14,180 3,401 -3,867 8,324 6,322 0 1,132 5,190
23 Kenya Orient 978 279 525 732 482 156 203 -109 -109
24 Kenyan Alliance 1,453 595 460 1,588 1,153 191 898 -654 0 0 -654
25 Lion of Kenya 10,753 5,288 4,423 11,618 5,959 1,032 1,387 3,240 0 0 3,240
26 Madison 38,155 26,641 14,287 50,509 2,189 5,967 7,555 34,798 0 593 34,205
27 Mayfair 1,901 -56 1,093 752 2,210 331 450 -2,239 0 37 -2,276
28 Mercantile 492 571 280 783 391 87 415 -110 0 0 -110
29 Occidental 682 721 377 1,026 1,313 -100 258 -445 0 0 -445
30 Pacis 3,133 810 1,612 2,331 143 515 811 862 443 49 1,256
31 Phoenix 1,920 698 882 1,736 -6,458 360 2,283 5,551 0 0 5,551
32 Real 6,501 21,879 4,164 24,216 6,693 3,115 3,460 10,948 0 3,543 7,405
33 Standard 4,683 1,898 1,873 4,708 256 50 2,001 2,401 0 0 2,401
34 Tausi 3,533 1,464 1,729 3,268 3,624 652 1,042 -2,050 0 0 -2,050
35 The Monarch 1,077 573 498 1,152 -29 289 620 272 0 0 272
36 Trident 2,000 1,160 849 2,311 5,217 328 305 -3,539 0 0 -3,539
37 UAP Provincial 17,447 6,639 5,124 18,962 -13,221 -802 198 32,787 0 0 32,787
TOTAL 414,515 196,931 213,618 397,828 109,400 32,973 119,626 135,829 2,261 5,377 132,713
Figures in thousands Kshs.
SUMMARY OF LIABILITY INSURANCE BUSINESS REVENUE ACCOUNTS OF INSURERS FOR THE YEAR ENDING 31ST DECEMBER 2007
Under Statutory Management
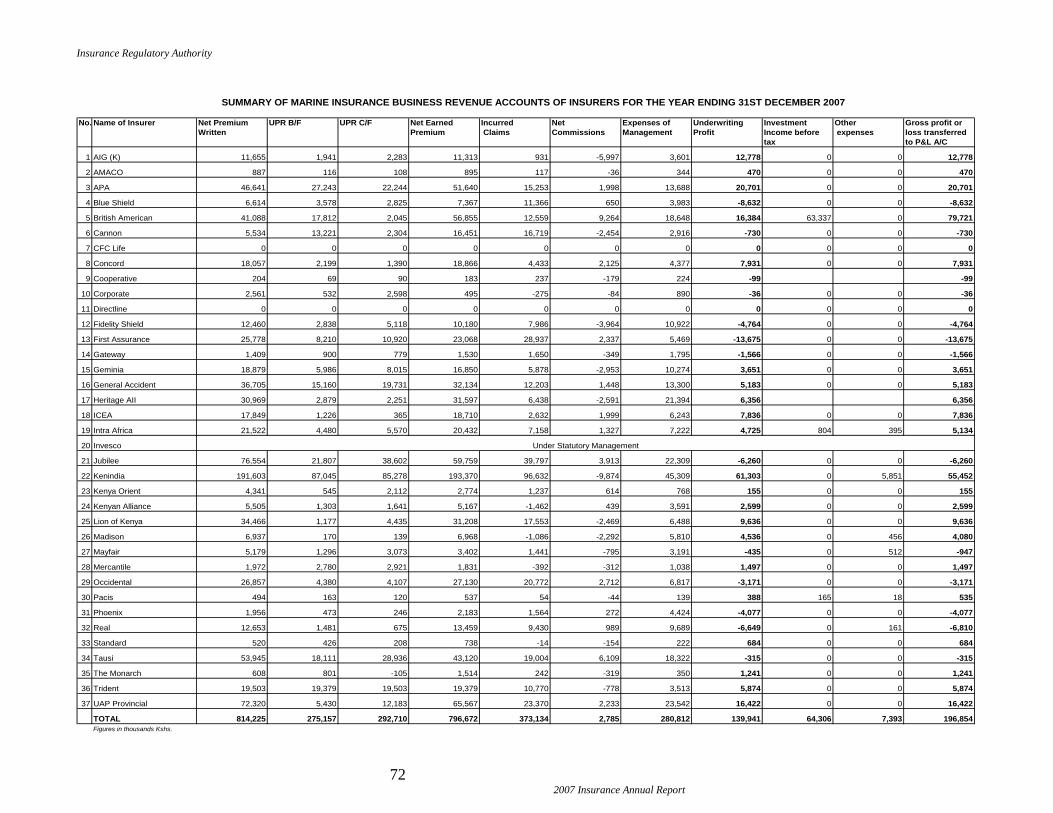
Insurance Regulatory Authority
72 2007 Insurance Annual Report
No. Name of Insurer Net Premium UPR B/F UPR C/F Net Earned Incurred Net Expenses of Underwriting Investment Other Gross profit or
Written Premium Claims Commissions Management Profit Income before expenses loss transferred
tax to P&L A/C
1 AIG (K) 11,655 1,941 2,283 11,313 931 -5,997 3,601 12,778 0 0 12,778
2 AMACO 887 116 108 895 117 -36 344 470 0 0 470
3 APA 46,641 27,243 22,244 51,640 15,253 1,998 13,688 20,701 0 0 20,701
4 Blue Shield 6,614 3,578 2,825 7,367 11,366 650 3,983 -8,632 0 0 -8,632
5 British American 41,088 17,812 2,045 56,855 12,559 9,264 18,648 16,384 63,337 0 79,721
6 Cannon 5,534 13,221 2,304 16,451 16,719 -2,454 2,916 -730 0 0 -730
7 CFC Life 0 0 0 0 0 0 0 0 0 0 0
8 Concord 18,057 2,199 1,390 18,866 4,433 2,125 4,377 7,931 0 0 7,931
9 Cooperative 204 69 90 183 237 -179 224 -99 -99
10 Corporate 2,561 532 2,598 495 -275 -84 890 -36 0 0 -36
11 Directline 0 0 0 0 0 0 0 0 0 0 0
12 Fidelity Shield 12,460 2,838 5,118 10,180 7,986 -3,964 10,922 -4,764 0 0 -4,764
13 First Assurance 25,778 8,210 10,920 23,068 28,937 2,337 5,469 -13,675 0 0 -13,675
14 Gateway 1,409 900 779 1,530 1,650 -349 1,795 -1,566 0 0 -1,566
15 Geminia 18,879 5,986 8,015 16,850 5,878 -2,953 10,274 3,651 0 0 3,651
16 General Accident 36,705 15,160 19,731 32,134 12,203 1,448 13,300 5,183 0 0 5,183
17 Heritage AII 30,969 2,879 2,251 31,597 6,438 -2,591 21,394 6,356 6,356
18 ICEA 17,849 1,226 365 18,710 2,632 1,999 6,243 7,836 0 0 7,836
19 Intra Africa 21,522 4,480 5,570 20,432 7,158 1,327 7,222 4,725 804 395 5,134
20 Invesco
21 Jubilee 76,554 21,807 38,602 59,759 39,797 3,913 22,309 -6,260 0 0 -6,260
22 Kenindia 191,603 87,045 85,278 193,370 96,632 -9,874 45,309 61,303 0 5,851 55,452
23 Kenya Orient 4,341 545 2,112 2,774 1,237 614 768 155 0 0 155
24 Kenyan Alliance 5,505 1,303 1,641 5,167 -1,462 439 3,591 2,599 0 0 2,599
25 Lion of Kenya 34,466 1,177 4,435 31,208 17,553 -2,469 6,488 9,636 0 0 9,636
26 Madison 6,937 170 139 6,968 -1,086 -2,292 5,810 4,536 0 456 4,080
27 Mayfair 5,179 1,296 3,073 3,402 1,441 -795 3,191 -435 0 512 -947
28 Mercantile 1,972 2,780 2,921 1,831 -392 -312 1,038 1,497 0 0 1,497
29 Occidental 26,857 4,380 4,107 27,130 20,772 2,712 6,817 -3,171 0 0 -3,171
30 Pacis 494 163 120 537 54 -44 139 388 165 18 535
31 Phoenix 1,956 473 246 2,183 1,564 272 4,424 -4,077 0 0 -4,077
32 Real 12,653 1,481 675 13,459 9,430 989 9,689 -6,649 0 161 -6,810
33 Standard 520 426 208 738 -14 -154 222 684 0 0 684
34 Tausi 53,945 18,111 28,936 43,120 19,004 6,109 18,322 -315 0 0 -315
35 The Monarch 608 801 -105 1,514 242 -319 350 1,241 0 0 1,241
36 Trident 19,503 19,379 19,503 19,379 10,770 -778 3,513 5,874 0 0 5,874
37 UAP Provincial 72,320 5,430 12,183 65,567 23,370 2,233 23,542 16,422 0 0 16,422
TOTAL 814,225 275,157 292,710 796,672 373,134 2,785 280,812 139,941 64,306 7,393 196,854
Figures in thousands Kshs.
SUMMARY OF MARINE INSURANCE BUSINESS REVENUE ACCOUNTS OF INSURERS FOR THE YEAR ENDING 31ST DECEMBER 2007
Under Statutory Management

Insurance Regulatory Authority
73 2007 Insurance Annual Report
SUMMARY OF MOTOR PRIVATE INSURANCE BUSINESS REVENUE ACCOUNTS OF INSURERS FOR THE YEAR ENDING 31ST DECEMBER 2007
No. Name of Insurer Net Premium UPR B/F UPR C/F Net Earned Incurred Net Expenses of Underwriting Investment Other Gross profit or
Written Premium Claims Commissions Management Profit Income before expenses loss transferred
tax to P&L A/C
1 AIG (K) 220,454 96,492 97,732 219,214 157,396 21,509 68,107 -27,798 0 0 -27,798
2 AMACO 147,099 24,307 44,529 126,877 76,626 8,219 57,084 -15,052 0 0 -15,052
3 APA 206,155 73,952 100,448 179,659 181,200 16,358 37,090 -54,989 0 0 -54,989
4 Blue Shield 438,719 79,477 124,174 394,022 296,956 37,737 153,398 -94,069 0 0 -94,069
5 British American 52,311 18,095 25,610 44,796 32,641 4,395 14,693 -6,933 49,903 0 42,970
6 Cannon 74,447 7,705 43,060 39,092 49,621 7,053 11,052 -28,634 0 0 -28,634
7 CFC Life 0 0 0 0 0 0 0 0 0 0 0
8 Concord 108,295 58,386 58,650 108,031 67,283 10,416 25,065 5,267 0 0 5,267
9 Cooperative 304,351 127,225 119,049 312,527 298,085 28,729 72,173 -86,460 0 0 -86,460
10 Corporate 105,571 44,056 53,715 95,912 69,400 9,081 36,669 -19,238 -19,238
11 Directline 0 0 0 0 0 0 0 0 0 0 0
12 Fidelity Shield 138,338 45,799 53,497 130,640 126,026 13,446 27,710 -36,542 0 1 -36,543
13 First Assurance 174,827 47,975 68,284 154,518 112,172 16,063 37,088 -10,805 -10,805
14 Gateway 108,673 44,671 44,238 109,106 30,952 8,956 44,858 24,340 0 0 24,340
15 Geminia 77,473 34,596 35,532 76,537 58,345 8,355 17,196 -7,359 0 0 -7,359
16 General Accident 50,241 21,534 24,184 47,591 4,182 2,822 17,818 22,769 0 0 22,769
17 Heritage AII 369,225 148,026 177,388 339,863 261,974 30,790 94,110 -47,011 0 0 -47,011
18 ICEA 207,472 71,620 76,103 202,989 187,785 21,201 68,331 -74,328 0 0 -74,328
19 Intra Africa 83,184 35,260 35,120 83,324 51,877 3,095 28,188 164 3,144 1,536 1,772
20 Invesco
21 Jubilee 250,030 89,344 125,141 214,233 58,447 19,689 59,232 76,865 0 0 76,865
22 Kenindia 381,093 168,200 171,288 378,005 317,388 37,062 50,742 -27,187 0 5,976 -33,163
23 Kenya Orient 100,813 31,214 45,244 86,783 54,422 9,937 24,021 -1,597 0 0 -1,597
24 Kenyan Alliance 97,191 76,324 40,578 132,937 107,204 9,936 19,590 -3,793 0 0 -3,793
25 Lion of Kenya 181,675 80,824 93,346 169,153 222,384 17,238 20,284 -90,753 0 0 -90,753
26 Madison 74,135 35,200 30,365 78,970 66,269 6,831 14,548 -8,678 0 1,142 -9,820
27 Mayfair 47,847 10,614 26,632 31,829 23,286 4,853 7,123 -3,433 0 53 -3,486
28 Mercantile 24,843 12,862 11,925 25,780 15,662 2,163 18,564 -10,609 -10,609
29 Occidental 150,233 52,344 63,051 139,526 89,358 15,011 35,059 98 0 0 98
30 Pacis 54,686 16,466 27,284 43,868 24,659 5,248 16,421 -2,460 7,755 860 4,435
31 Phoenix 139,551 32,967 59,484 113,034 93,951 13,462 67,113 -61,492 0 0 -61,492
32 Real 135,304 64,190 64,529 134,965 101,882 10,719 34,911 -12,547 0 -68 -12,479
33 Standard 80,636 37,969 32,255 86,350 60,881 5,936 34,459 -14,926 0 0 -14,926
34 Tausi 72,843 47,574 32,070 88,347 42,590 7,358 16,282 22,117 0 0 22,117
35 The Monarch 31,702 14,493 14,536 31,659 16,706 2,534 18,245 -5,826 0 0 -5,826
36 Trident 58,229 36,213 27,978 66,464 64,576 4,682 8,456 -11,250 0 0 -11,250
37 UAP Provincial 218,963 82,053 83,538 217,478 144,067 17,731 89,320 -33,640 0 0 -33,640
TOTAL 4,966,609 1,868,027 2,130,557 4,704,079 3,566,253 438,615 1,345,000 -645,789 60,802 9,500 -594,487
Figures in thousands Kshs.
Under Statutory Management

Insurance Regulatory Authority
74 2007 Insurance Annual Report
No. Name of Insurer Net Premium UPR B/F UPR C/F Net Earned Incurred Net Expenses of Underwriting Investment Other Gross profit or
Written Premium Claims Commissions Management Profit Income before expenses Loss transferred
tax to P&L A/C
1 AIG (K) 186,559 50,604 72,944 164,219 96,810 19,030 57,636 -9,257 0 0 -9,257
2 AMACO 307,233 32,449 63,375 276,307 68,565 16,900 119,226 71,616 0 0 71,616
3 APA 325,445 145,895 150,782 320,558 266,687 46,286 58,611 -51,026 0 0 -51,026
4 Blue Shield 1,662,150 439,880 364,424 1,737,606 632,948 173,985 583,641 347,032 0 0 347,032
5 British American 57,227 23,123 31,047 49,303 25,569 5,514 16,171 2,049 54,923 0 56,972
6 Cannon 165,266 33,430 89,386 109,310 88,604 13,830 25,299 -18,423 0 0 -18,423
7 CFC Life 0 0 0 0 0 0 0 0 0 0 0
8 Concord 134,221 60,738 62,449 132,510 98,204 15,967 30,744 -12,405 0 0 -12,405
9 Cooperative 270,251 116,241 112,398 274,094 157,808 24,639 83,451 8,196 0 0 8,196
10 Corporate 138,504 64,192 68,869 133,827 58,900 13,184 48,108 13,635 0 0 13,635
11 Directline 302,710 18,993 79,925 241,778 77,277 34,521 115,311 14,669 3,535 7,246 10,958
12 Fidelity Shield 229,240 79,607 87,974 220,873 89,927 25,157 46,822 58,967 58,967
13 First Assurance 270,876 97,521 107,699 260,698 161,744 26,161 57,463 15,330 0 0 15,330
14 Gateway 231,013 55,087 67,219 218,881 123,160 21,946 95,861 -22,086 0 0 -22,086
15 Geminia 102,171 41,161 40,283 103,049 63,717 11,404 22,787 5,141 0 0 5,141
16 General Accident 116,302 55,568 64,786 107,084 86,116 6,505 41,247 -26,784 0 0 -26,784
17 Heritage AII 181,844 64,505 96,560 149,789 71,026 14,085 31,774 32,904 0 0 32,904
18 ICEA 176,857 63,765 71,299 169,323 98,818 20,128 58,275 -7,898 0 0 -7,898
19 Intra Africa 121,209 43,161 50,851 113,519 66,491 4,024 39,888 3,116 4,402 2,206 5,312
20 Invesco
21 Jubilee 177,585 51,885 86,516 142,954 149,873 16,797 40,620 -64,336 0 0 -64,336
22 Kenindia 558,501 246,589 235,700 569,390 592,027 54,507 74,771 -151,915 0 8,806 -160,721
23 Kenya Orient 103,994 26,187 39,906 90,275 53,801 9,668 24,988 1,818 0 0 1,818
24 Kenyan Alliance 96,389 49,763 33,222 112,930 45,716 9,965 19,028 38,221 0 0 38,221
25 Lion of Kenya 341,580 144,000 176,495 309,085 199,906 39,527 46,263 23,389 0 0 23,389
26 Madison 104,512 36,366 35,888 104,990 69,762 10,472 20,402 4,354 0 1,602 2,752
27 Mayfair 26,432 6,256 16,292 16,396 10,711 2,761 3,936 -1,012 0 29 -1,041
28 Mercantile 20,815 10,604 9,569 21,850 9,792 1,992 15,592 -5,526 0 0 -5,526
29 Occidental 167,582 53,039 72,724 147,897 63,530 17,084 37,163 30,120 0 0 30,120
30 Pacis 55,645 11,524 22,187 44,982 19,697 5,413 15,017 4,855 7,875 874 11,856
31 Phoenix 63,615 20,859 24,038 60,436 19,757 6,043 20,013 14,623 0 0 14,623
32 Real 168,996 72,551 83,780 157,767 57,930 15,628 28,757 55,452 0 -2,246 57,698
33 Standard 406,072 116,655 162,429 360,298 138,651 40,313 173,528 7,806 0 0 7,806
34 Tausi 62,859 36,470 25,158 74,171 73,327 6,582 14,201 -19,939 0 0 -19,939
35 The Monarch 43,910 19,200 20,665 42,445 16,285 3,875 25,271 -2,986 0 0 -2,986
36 Trident 72,771 41,366 34,965 79,172 32,646 5,081 12,017 29,428 0 0 29,428
37 UAP Provincial 385,932 111,033 140,681 356,284 146,614 33,728 115,602 60,340 0 0 60,340
TOTAL 7,836,268 2,540,267 2,902,485 7,474,050 4,032,396 772,702 2,219,484 449,468 70,735 18,517 501,686
Figures in thousands Kshs.
SUMMARY OF MOTOR COMMERCIAL INSURANCE BUSINESS REVENUE ACCOUNTS OF INSURERS FOR THE YEAR ENDING 31ST DECEMBER 2007
Under Statutory Management

Insurance Regulatory Authority
75 2007 Insurance Annual Report
No. Name of Insurer Net Premium UPR B/F UPR C/F Net Earned Incurred Net Expenses of Underwriting Investment Other Gross profit or
Written Premium Claims Commissions Management Profit Income expenses Loss transferred
before tax to P&L A/C
1 AIG (K) 287,126 62,501 63,487 286,140 87,722 42,730 88,705 66,983 0 0 66,983
2 AMACO 2,592 662 1,068 2,186 10,940 1 1,006 -9,761 0 0 -9,761
3 APA 858,626 376,801 384,379 851,048 728,111 83,743 76,731 -37,537 0 0 -37,537
4 Blue Shield 22,659 4,556 3,132 24,083 -2,936 1,451 9,096 16,472 0 0 16,472
5 British American 164,261 24,642 57,314 131,589 70,865 -25,006 30,867 54,863 39,180 0 94,043
6 Cannon 48,139 0 23,832 24,307 417 -3,263 15,707 11,446 0 0 11,446
7 CFC Life 646,568 0 -45,521 692,089 355,298 62,891 143,800 130,100 12,797 0 142,897
8 Concord 1,793 1,436 900 2,329 -82 -891 540 2,762 0 0 2,762
9 Cooperative 87,516 17,524 30,828 74,212 41,411 5,465 28,591 -1,255 -1,255
10 Corporate 7,186 1,463 2,852 5,797 2,057 1,926 2,496 -682 0 0 -682
11 Directline 0 0 0 0 0 0 0 0 0 0 0
12 Fidelity Shield 9,796 2,265 2,638 9,423 3,162 103 5,589 569 0 0 569
13 First Assurance 40,771 7,725 12,260 36,236 12,019 4,194 10,648 9,375 0 0 9,375
14 Gateway 4,001 4,077 2,458 5,620 28,235 -279 4,285 -26,621 0 0 -26,621
15 Geminia 3,586 1,355 1,519 3,422 387 -1,655 2,979 1,711 0 0 1,711
16 General Accident 21,430 4,448 9,158 16,720 4,456 -8,677 7,600 13,341 0 0 13,341
17 Heritage AII 320,615 73,516 131,466 262,665 141,812 26,367 76,312 18,174 0 0 18,174
18 ICEA 140,763 41,353 40,649 141,467 60,161 17,580 46,850 16,876 0 0 16,876
19 Intra Africa 8,964 3,801 5,422 7,343 9,387 993 2,755 -5,792 300 159 -5,651
20 Invesco
21 Jubilee 1,321,585 319,750 479,279 1,162,056 905,146 105,561 106,282 45,067 0 0 45,067
22 Kenindia 66,081 26,227 26,299 66,009 141,709 -21,494 23,908 -78,114 0 3,612 -81,726
23 Kenya Orient 2,261 967 1,078 2,150 -548 315 595 1,788 0 0 1,788
24 Kenyan Alliance 20,338 10,069 4,493 25,914 11,799 3,823 15,568 -5,276 0 0 -5,276
25 Lion of Kenya 55,606 20,538 19,673 56,471 24,128 6,269 9,787 16,287 0 0 16,287
26 Madison 243,128 16,048 39,026 220,150 169,565 8,330 48,063 -5,808 0 3,812 -9,620
27 Mayfair 5,351 1,743 1,995 5,099 1,445 -19 2,343 1,330 0 330 1,000
28 Mercantile 4,710 22,646 18,661 8,695 3,838 -7,999 5,786 7,070 0 0 7,070
29 Occidental 9,659 3,488 4,098 9,049 4,784 557 2,274 1,434 0 0 1,434
30 Pacis 9,928 2,321 4,516 7,733 1,668 1,932 2,003 2,130 1,398 155 3,373
31 Phoenix 11,208 2,565 3,491 10,282 9,429 2,495 2,531 -4,173 0 0 -4,173
32 Real 16,524 4,655 4,749 16,430 7,100 1,983 8,597 -1,250 0 -19 -1,231
33 Standard 2,778 5,048 1,111 6,715 2,146 20 1,187 3,362 0 0 3,362
34 Tausi 3,012 2,611 1,470 4,153 50 -115 2,733 1,485 0 0 1,485
35 The Monarch 18,164 856 5,307 13,713 3,056 1,069 10,454 -866 0 0 -866
36 Trident 6,378 3,986 2,708 7,656 10,339 712 1,596 -4,991 0 0 -4,991
37 UAP Provincial 630,206 163,310 240,967 552,549 383,126 84,484 103,710 -18,771 0 0 -18,771
TOTAL 5,103,309 1,234,953 1,586,762 4,751,500 3,232,202 395,596 901,974 221,729 53,675 8,049 267,355
Figures in Thousands Kshs.
SUMMARY OF PERSONAL ACCIDENT INSURANCE BUSINESS REVENUE ACCOUNTS OF INSURERS FOR THE YEAR ENDING 31ST DECEMBER 2007
Under Statutory Management

Insurance Regulatory Authority
76 2007 Insurance Annual Report
No. Name of Insurer Net Premium UPR B/F UPR C/F Net Earned Incurred Net Expenses of Underwriting Investment Other Gross profit or
Written Premium Claims Commissions Management Profit Income expenses Loss transferred
before tax to P&L A/C
1 AIG (K) 3,069 2,291 830 4,530 727 -15,344 948 18,199 0 0 18,199
2 AMACO 2,505 1,040 976 2,569 1,248 -1 972 350 0 0 350
3 APA 60,932 41,648 21,841 80,739 32,594 8,618 12,655 26,872 0 0 26,872
4 Blue Shield 15,154 7,363 3,577 18,940 771 452 6,815 10,902 0 0 10,902
5 British American 5,807 2,520 2,450 5,877 5,321 -1,853 1,928 481 6,547 0 7,028
6 Cannon 10,086 896 5,159 5,823 -8,405 -2,034 2,735 13,527 0 0 13,527
7 CFC Life 0 0 0 0 0 0 0 0 0 0 0
8 Concord 8,245 3,975 3,448 8,772 11,433 -4,759 2,035 63 0 0 63
9 Cooperative 164,235 23,046 44,878 142,403 37,887 16,097 39,616 48,803 0 0 48,803
10 Corporate 13,738 2,830 4,601 11,967 4,787 2,462 4,772 -54 0 0 -54
11 Directline 0 0 0 0 0 0 0 0 0 0 0
12 Fidelity Shield 15,607 4,299 4,914 14,992 7,666 -2,858 7,828 2,356 0 0 2,356
13 First Assurance 44,042 10,418 15,131 39,329 33,798 2,181 9,343 -5,993 0 0 -5,993
14 Gateway 2,464 1,536 1,418 2,582 4,765 -1,004 3,481 -4,660 0 0 -4,660
15 Geminia 20,103 8,443 8,558 19,988 11,449 -6,107 9,472 5,174 0 0 5,174
16 General Accident 44,482 15,369 16,856 42,995 9,367 2,623 15,775 15,230 0 0 15,230
17 Heritage AII 59,506 14,016 24,358 49,164 18,923 4,829 18,136 7,276 0 0 7,276
18 ICEA 54,983 14,744 18,174 51,553 34,418 454 18,454 -1,773 0 0 -1,773
19 Intra Africa 17,912 7,505 7,274 18,143 10,437 -1,349 5,992 3,063 670 330 3,403
20 Invesco
21 Jubilee 38,113 12,247 14,632 35,728 22,861 -1,658 20,293 -5,768 0 0 -5,768
22 Kenindia 127,863 46,722 50,870 123,715 123,471 -26,254 36,951 -10,453 0 5,166 -15,619
23 Kenya Orient 7,041 2,798 3,718 6,121 1,431 397 1,694 2,599 0 0 2,599
24 Kenyan Alliance** 9,935 6,844 3,646 13,133 7,971 843 6,280 -1,961 0 0 -1,961
25 Lion of Kenya 53,665 27,845 22,140 59,370 5,582 5,047 8,864 39,877 0 0 39,877
26 Madison 4,394 1,318 1,820 3,892 1,181 -864 2,308 1,267 0 181 1,086
27 Mayfair 6,856 1,958 3,295 5,519 4,568 -553 3,857 -2,353 0 601 -2,954
28 Mercantile 3,393 9,289 5,436 7,246 3,210 -970 4,274 732 0 0 732
29 Occidental 17,463 14,038 11,048 20,453 18,663 -3,317 5,139 -32 0 0 -32
30 Pacis 5,405 1,786 2,422 4,769 2,549 535 1,972 -287 759 84 388
31 Phoenix 12,895 4,188 3,120 13,963 19,368 1,127 7,180 -13,712 0 0 -13,712
32 Real 26,784 6,565 5,851 27,498 5,744 4,927 4,598 12,229 0 143 12,086
33 Standard 1,044 945 418 1,571 -51 -83 446 1,259 0 0 1,259
34 Tausi 20,588 19,146 9,717 30,017 16,526 1,889 13,195 -1,593 0 0 -1,593
35 The Monarch 1,136 670 453 1,353 353 -1,355 654 1,701 0 0 1,701
36 Trident 19,198 7,928 8,152 18,974 15,681 -1,870 4,705 458 0 0 458
37 UAP Provincial 92,549 33,769 30,359 95,959 46,544 14,653 31,892 2,870 0 0 2,870
TOTAL 991,192 359,995 361,540 989,647 512,838 -5,099 315,259 166,649 7,976 6,505 168,120
Figures in thousands Kshs.
SUMMARY OF THEFT INSURANCE BUSINESS REVENUE ACCOUNTS OF INSURERS FOR THE YEAR ENDING 31ST DECEMBER 2007
Under Statutory Management

Insurance Regulatory Authority
77 2007 Insurance Annual Report
No. Name of Insurer Net Premium UPR B/F UPR C/F Net Earned Incurred Net Expenses of Underwriting Investment Other Gross profit or
Written Premium Claims Commissions Management Profit Income expenses Loss transferred
before tax to P&L A/C
1 AIG K) 21,792 10,226 7,165 24,853 6,435 4,511 6,732 7,175 0 0 7,175
2 AMACO 8,228 3,599 3,735 8,092 1,189 1,009 3,193 2,701 0 0 2,701
3 APA 101,542 30,190 49,608 82,124 65,224 16,297 18,266 -17,663 0 0 -17,663
4 Blue Shield 23,882 2,027 10,242 15,667 2,796 4,415 8,227 229 0 0 229
5 British American 17,961 8,566 8,664 17,863 16,903 3,119 5,859 -8,018 19,899 0 11,881
6 Cannon 25,385 1,122 4,863 21,644 34,741 3,341 3,558 -19,996 0 0 -19,996
7 CFC Life 0 0 0 0 0 0 0 0 0 0 0
8 Concord 42,111 25,315 23,205 44,221 35,982 8,865 10,260 -10,886 0 0 -10,886
9 Cooperative 22,593 11,086 9,166 24,513 12,606 4,420 5,358 2,129 0 0 2,129
10 Corporate 11,686 2,664 6,080 8,270 3,754 1,971 4,059 -1,514 0 0 -1,514
11 Directline 0 0 0 0 0 0 0 0 0 0
12 Fidelity Shield 47,337 15,009 17,265 45,081 42,900 9,991 9,466 -17,276 0 0 -17,276
13 First Assurance 64,514 19,777 26,386 57,905 54,427 12,248 13,686 -22,456 -22,456
14 Gateway 9,100 3,884 4,360 8,624 -4,258 1,698 3,635 7,549 0 0 7,549
15 Geminia 54,871 18,399 24,883 48,387 32,246 11,967 12,179 -8,005 0 0 -8,005
16 General Accident 57,846 19,928 23,022 54,752 70,141 7,880 20,515 -43,784 0 0 -43,784
17 Heritage AII 80,106 28,130 35,187 73,049 14,050 13,381 22,785 22,833 0 0 22,833
18 ICEA 54,194 10,005 11,263 52,936 68,999 11,506 17,839 -45,408 0 0 -45,408
19 Intra Africa 41,596 14,151 17,425 38,322 21,446 4,111 14,252 -1,487 1,595 770 -662
20 Invesco
21 Jubilee 57,325 18,914 27,833 48,406 57,651 5,505 18,213 -32,963 0 0 -32,963
22 Kenindia 342,397 131,511 133,621 340,287 603,465 66,757 45,502 -375,437 0 5,359 -380,796
23 Kenya Orient 9,097 3,313 4,564 7,846 20,451 1,680 2,172 -16,457 0 0 -16,457
24 Kenyan Alliance 7,135 3,899 1,738 9,296 8,093 1,396 5,343 -5,536 0 0 -5,536
25 Lion of Kenya 52,623 20,963 22,246 51,340 82,371 6,938 8,543 -46,512 0 0 -46,512
26 Madison 11,511 4,376 4,982 10,905 12,925 2,175 2,180 -6,375 0 171 -6,546
27 Mayfair 31,054 7,396 19,102 19,348 6,823 6,500 4,625 1,400 0 35 1,365
28 Mercantile 5,259 3,457 2,070 6,646 1,839 613 3,436 758 0 0 758
29 Occidental 88,118 16,442 19,564 84,996 64,039 18,291 21,357 -18,691 0 0 -18,691
30 Pacis 4,992 1,713 2,099 4,606 1,286 880 1,653 787 703 78 1,412
31 Phoenix 5,691 1,765 1,310 6,146 592 836 4,400 318 0 0 318
32 Real 37,402 19,586 18,485 38,503 18,052 6,895 8,974 4,582 0 220 4,362
33 Standard 5,022 6,350 2,009 9,363 661 728 2,146 5,828 0 0 5,828
34 Tausi 61,162 42,412 28,374 75,200 93,891 11,957 13,654 -44,302 0 0 -44,302
35 The Monarch 4,250 1,622 1,439 4,433 1,037 806 2,446 144 0 0 144
36 Trident 51,023 24,446 21,666 53,803 72,233 4,437 7,516 -30,383 0 0 -30,383
37 UAP Provincial 49,694 22,008 16,644 55,058 17,537 10,011 17,302 10,208 0 0 10,208
TOTAL 1,508,499 554,251 610,265 1,452,485 1,542,527 267,135 349,331 -706,508 22,197 6,633 -690,944
Figures in thousands Kshs.
SUMMARY OF WORKMENS' COMPENSATION INSURANCE BUSINESS REVENUE ACCOUNTS OF INSURERS FOR THE YEAR ENDING 31ST DECEMBER 2007
Under Statutory Management
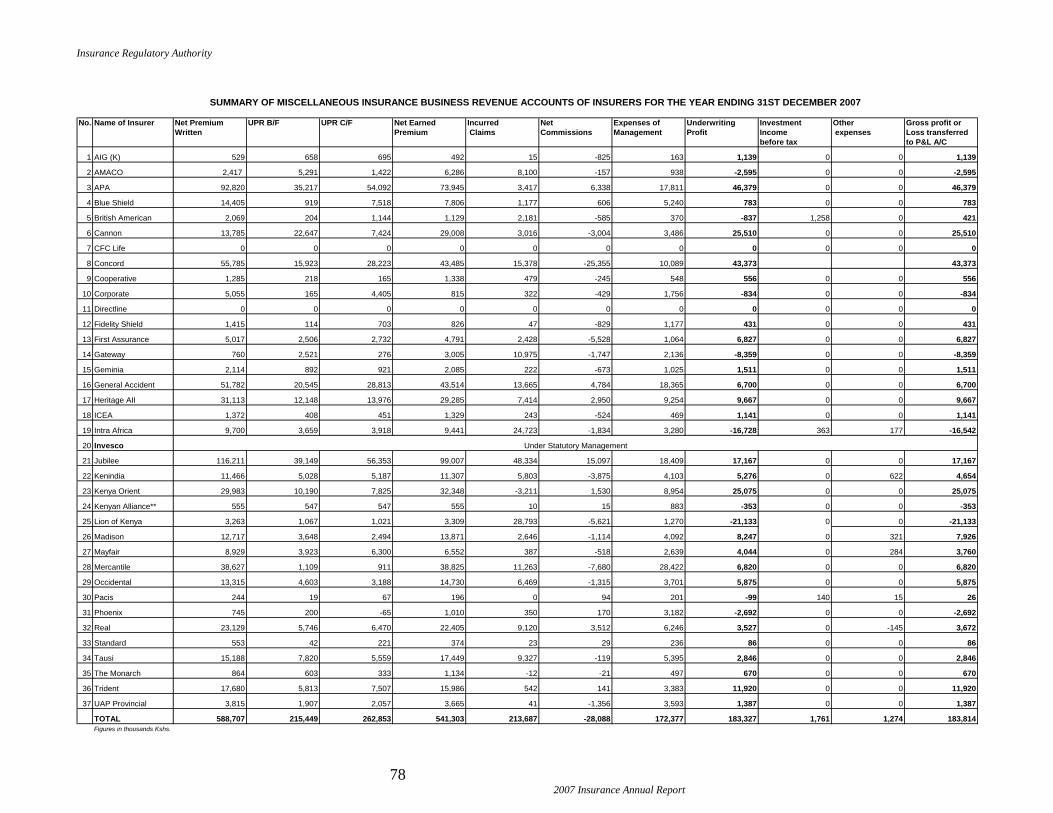
Insurance Regulatory Authority
78 2007 Insurance Annual Report
No. Name of Insurer Net Premium UPR B/F UPR C/F Net Earned Incurred Net Expenses of Underwriting Investment Other Gross profit or
Written Premium Claims Commissions Management Profit Income expenses Loss transferred
before tax to P&L A/C
1 AIG (K) 529 658 695 492 15 -825 163 1,139 0 0 1,139
2 AMACO 2,417 5,291 1,422 6,286 8,100 -157 938 -2,595 0 0 -2,595
3 APA 92,820 35,217 54,092 73,945 3,417 6,338 17,811 46,379 0 0 46,379
4 Blue Shield 14,405 919 7,518 7,806 1,177 606 5,240 783 0 0 783
5 British American 2,069 204 1,144 1,129 2,181 -585 370 -837 1,258 0 421
6 Cannon 13,785 22,647 7,424 29,008 3,016 -3,004 3,486 25,510 0 0 25,510
7 CFC Life 0 0 0 0 0 0 0 0 0 0 0
8 Concord 55,785 15,923 28,223 43,485 15,378 -25,355 10,089 43,373 43,373
9 Cooperative 1,285 218 165 1,338 479 -245 548 556 0 0 556
10 Corporate 5,055 165 4,405 815 322 -429 1,756 -834 0 0 -834
11 Directline 0 0 0 0 0 0 0 0 0 0 0
12 Fidelity Shield 1,415 114 703 826 47 -829 1,177 431 0 0 431
13 First Assurance 5,017 2,506 2,732 4,791 2,428 -5,528 1,064 6,827 0 0 6,827
14 Gateway 760 2,521 276 3,005 10,975 -1,747 2,136 -8,359 0 0 -8,359
15 Geminia 2,114 892 921 2,085 222 -673 1,025 1,511 0 0 1,511
16 General Accident 51,782 20,545 28,813 43,514 13,665 4,784 18,365 6,700 0 0 6,700
17 Heritage AII 31,113 12,148 13,976 29,285 7,414 2,950 9,254 9,667 0 0 9,667
18 ICEA 1,372 408 451 1,329 243 -524 469 1,141 0 0 1,141
19 Intra Africa 9,700 3,659 3,918 9,441 24,723 -1,834 3,280 -16,728 363 177 -16,542
20 Invesco
21 Jubilee 116,211 39,149 56,353 99,007 48,334 15,097 18,409 17,167 0 0 17,167
22 Kenindia 11,466 5,028 5,187 11,307 5,803 -3,875 4,103 5,276 0 622 4,654
23 Kenya Orient 29,983 10,190 7,825 32,348 -3,211 1,530 8,954 25,075 0 0 25,075
24 Kenyan Alliance** 555 547 547 555 10 15 883 -353 0 0 -353
25 Lion of Kenya 3,263 1,067 1,021 3,309 28,793 -5,621 1,270 -21,133 0 0 -21,133
26 Madison 12,717 3,648 2,494 13,871 2,646 -1,114 4,092 8,247 0 321 7,926
27 Mayfair 8,929 3,923 6,300 6,552 387 -518 2,639 4,044 0 284 3,760
28 Mercantile 38,627 1,109 911 38,825 11,263 -7,680 28,422 6,820 0 0 6,820
29 Occidental 13,315 4,603 3,188 14,730 6,469 -1,315 3,701 5,875 0 0 5,875
30 Pacis 244 19 67 196 0 94 201 -99 140 15 26
31 Phoenix 745 200 -65 1,010 350 170 3,182 -2,692 0 0 -2,692
32 Real 23,129 5,746 6,470 22,405 9,120 3,512 6,246 3,527 0 -145 3,672
33 Standard 553 42 221 374 23 29 236 86 0 0 86
34 Tausi 15,188 7,820 5,559 17,449 9,327 -119 5,395 2,846 0 0 2,846
35 The Monarch 864 603 333 1,134 -12 -21 497 670 0 0 670
36 Trident 17,680 5,813 7,507 15,986 542 141 3,383 11,920 0 0 11,920
37 UAP Provincial 3,815 1,907 2,057 3,665 41 -1,356 3,593 1,387 0 0 1,387
TOTAL 588,707 215,449 262,853 541,303 213,687 -28,088 172,377 183,327 1,761 1,274 183,814
Figures in thousands Kshs.
SUMMARY OF MISCELLANEOUS INSURANCE BUSINESS REVENUE ACCOUNTS OF INSURERS FOR THE YEAR ENDING 31ST DECEMBER 2007
Under Statutory Management

Insurance Regulatory Authority
79 2007 Insurance Annual Report
No. Name of Insurer Aviation Engineering Fire Domestic Fire Industrial Liabiliity Marine & Transit Motor Private Motor Commercial Personal Accident Theft Workman's Miscellaneous TOTAL
Compensation
1 AIG (K) 0 1,257 42,733 27,041 73,126 11,313 219,214 164,219 286,140 4,530 24,853 492 854,918
2 AMACO 466 1,632 638 1,357 1,539 895 126,877 276,307 2,186 2,569 8,092 6,286 428,844
3 APA 13,560 37,239 18,487 80,234 48,695 51,640 179,659 320,558 851,048 80,739 82,124 73,945 1,837,928
4 Blue Shield 0 6,971 3,048 16,602 2,202 7,367 394,022 1,737,606 24,083 18,940 15,667 7,806 2,234,314
5 British American 0 1,931 9,995 8,684 1,589 56,855 44,796 49,303 131,589 5,877 17,863 1,129 329,611
6 Cannon -55 7,578 2,582 4,038 989 16,451 39,092 109,310 24,307 5,823 21,644 29,008 260,767
7 CFC (PA only) 0 0 0 0 0 0 0 0 692,089 0 0 0 692,089
8 Concord 0 3,925 8,096 16,669 2,535 18,866 108,031 132,510 2,329 8,772 44,221 43,485 389,439
9 Cooperative 0 5,149 15,256 22,997 43,457 183 312,527 274,094 74,212 142,403 24,513 1,338 916,129
10 Corporate 0 1,299 3,046 2,241 885 495 95,912 133,827 5,797 11,967 8,270 815 264,554
11 Directline 0 0 0 0 0 0 0 241,778 0 0 0 0 241,778
12 Fidelity Shield 0 2,158 8,479 16,291 3,281 10,180 130,640 220,873 9,423 14,992 45,081 826 462,224
13 First Assurance 0 13,295 14,424 22,015 12,650 23,068 154,518 260,698 36,236 39,329 57,905 4,791 638,929
14 Gateway 0 4,986 2,178 8,326 4,665 1,530 109,106 218,881 5,620 2,582 8,624 3,005 369,503
15 Geminia 0 846 7,172 7,738 3,696 16,850 76,537 103,049 3,422 19,988 48,387 2,085 289,770
16 General Accident 0 4,509 11,887 41,017 7,005 32,134 47,591 107,084 16,720 42,995 54,752 43,514 409,208
17 Heritage AII 130 14,107 66,284 60,127 16,120 31,597 339,863 149,789 262,665 49,164 73,049 29,285 1,092,180
18 ICEA 1,384 6,636 16,271 40,379 7,327 18,710 202,989 169,323 141,467 51,553 52,936 1,329 710,304
19 Intra Africa 0 10,618 6,173 9,467 1,285 20,432 83,324 113,519 7,343 18,143 38,322 9,441 318,067
20 Invesco
21 Jubilee 0 11,416 19,865 24,157 26,910 59,759 214,233 142,954 1,162,056 35,728 48,406 99,007 1,844,491
22 Kenindia 0 40,261 26,647 138,101 14,180 193,370 378,005 569,390 66,009 123,715 340,287 11,307 1,901,272
23 Kenya Orient 0 854 2,871 3,825 732 2,774 86,783 90,275 2,150 6,121 7,846 32,348 236,579
24 Kenyan Alliance 0 1,633 14,406 10,873 1,588 5,167 132,937 112,930 25,914 13,133 9,296 555 328,432
25 Lion of Kenya 430 10,183 28,085 43,527 11,618 31,208 169,153 309,085 56,471 59,370 51,340 3,309 773,779
26 Madison 0 2,624 6,759 11,772 50,509 6,968 78,970 104,990 220,150 3,892 10,905 13,871 511,410
27 Mayfair 0 1,146 2,055 2,693 752 3,402 31,829 16,396 5,099 5,519 19,348 6,552 94,791
28 Mercantile 0 1,428 6,538 8,291 783 1,831 25,780 21,850 8,695 7,246 6,646 38,825 127,913
29 Occidental 0 5,778 14,441 20,828 1,026 27,130 139,526 147,897 9,049 20,453 84,996 14,730 485,854
30 Pacis 0 648 1,856 3,947 2,331 537 43,868 44,982 7,733 4,769 4,606 196 115,473
31 Phoenix 3,595 7,201 4,793 12,652 1,736 2,183 113,034 60,436 10,282 13,963 6,146 1,010 237,031
32 Pioneer (Run off) 0 0 0 0 0 0 0 0 0 0 0 0 0
33 Real 0 29,584 15,767 35,165 24,216 13,459 134,965 157,767 16,430 27,498 38,503 22,405 515,759
34 Standard 0 3,018 1,345 9,734 4,708 738 86,350 360,298 6,715 1,571 9,363 374 484,214
35 Tausi 0 176 10,444 15,681 3,268 43,120 88,347 74,171 4,153 30,017 75,200 17,449 362,026
36 The Monarch 0 2,653 1,890 2,880 1,152 1,514 31,659 42,445 13,713 1,353 4,433 1,134 104,826
37 Trident 0 2,399 6,553 10,224 2,311 19,379 66,464 79,172 7,656 18,974 53,803 15,986 282,921
38 UAP Provincial 0 30,285 38,391 52,263 18,962 65,567 217,478 356,284 552,549 95,959 55,058 3,665 1,486,461
TOTAL 19,510 275,423 439,455 791,836 397,828 796,672 4,704,079 7,474,050 4,751,500 989,647 1,452,485 541,303 22,633,788
Figures in thousands Kshs.
NET EARNED PREMIUM OF INSURERS UNDER GENERAL INSURANCE BUSINESS - CLASSWISE FOR THE YEAR ENDING 31ST DECEMBER 2007
Under Statutory Management

Insurance Regulatory Authority
80 2007 Insurance Annual Report
No. Name of Insurer Aviation Engineering Fire Domestic Fire Industrial Liabiliity Marine & Transit Motor Private Motor Personal Theft Workman's Miscellaneous TOTAL
Commercial Accident Compensation
1 AIG (K) 0 3,804 9,553 11,465 23,436 931 157,396 96,810 87,722 727 6,435 15 398,294
2 AMACO -61 963 396 1,192 1,841 117 76,626 68,565 10,940 1,248 1,189 8,100 171,116
3 APA 6,699 9,895 1,106 23,890 8,757 15,253 181,200 266,687 728,111 32,594 65,224 3,417 1,342,833
4 Blue Shield 0 -632 -9,770 -556 261 11,366 296,956 632,948 -2,936 771 2,796 1,177 932,381
5 British American 0 254 2,210 194 206 12,559 32,641 25,569 70,865 5,321 16,903 2,181 168,903
6 Cannon 0 -4,702 2,547 -4,686 -461 16,719 49,621 88,604 417 -8,405 34,741 3,016 177,411
7 CFC (PA only) 0 0 0 0 0 0 0 0 355,298 0 0 0 355,298
8 Concord 0 1,239 1,869 3,785 826 4,433 67,283 98,204 -82 11,433 35,982 15,378 240,350
9 Cooperative 0 2,978 2,656 20,143 38,978 237 298,085 157,808 41,411 37,887 12,606 479 613,268
10 Corporate 0 214 11 -76 1,121 -275 69,400 58,900 2,057 4,787 3,754 322 140,215
11 Directline 0 0 0 0 0 0 0 77,277 0 0 0 0 77,277
12 Fidelity Shield 0 -204 1,976 13,515 -2,007 7,986 126,026 89,927 3,162 7,666 42,900 47 290,994
13 First Assurance 0 5,914 5,134 11,232 7,181 28,937 112,172 161,744 12,019 33,798 54,427 2,428 434,986
14 Gateway 0 249 103 1,503 1,745 1,650 30,952 123,160 28,235 4,765 -4,258 10,975 199,079
15 Geminia 0 328 2,843 23,751 91 5,878 58,345 63,717 387 11,449 32,246 222 199,257
16 General Accident 0 277 1,731 7,677 6,450 12,203 4,182 86,116 4,456 9,367 70,141 13,665 216,265
17 Heritage AII 79 2,518 26,375 35,964 -3,733 6,438 261,974 71,026 141,812 18,923 14,050 7,414 582,840
18 ICEA -194 3,275 2,571 3,000 3,487 2,632 187,785 98,818 60,161 34,418 68,999 243 465,195
19 Intra Africa 0 -1,393 955 4,452 -660 7,158 51,877 66,491 9,387 10,437 21,446 24,723 194,873
20 Invesco
21 Jubilee 0 12,922 5,595 47,999 8,558 39,797 58,447 149,873 905,146 22,861 57,651 48,334 1,357,183
22 Kenindia -50 14,477 6,289 98,847 3,401 96,632 317,388 592,027 141,709 123,471 603,465 5,803 2,003,459
23 Kenya Orient 0 1,066 608 -2,176 482 1,237 54,422 53,801 -548 1,431 20,451 -3,211 127,563
24 Kenyan Alliance 0 918 22 26,427 1,153 -1,462 107,204 45,716 11,799 7,971 8,093 10 207,851
25 Lion of Kenya 906 1,387 11,844 27,770 5,959 17,553 222,384 199,906 24,128 5,582 82,371 28,793 628,583
26 Madison 0 1,064 66 3,915 2,189 -1,086 66,269 69,762 169,565 1,181 12,925 2,646 328,496
27 Mayfair 0 670 651 1,325 2,210 1,441 23,286 10,711 1,445 4,568 6,823 387 53,517
28 Mercantile 0 272 6,301 1,270 391 -392 15,662 9,792 3,838 3,210 1,839 11,263 53,446
29 Occidental 0 -546 4,641 10,701 1,313 20,772 89,358 63,530 4,784 18,663 64,039 6,469 283,724
30 Pacis 0 82 472 282 143 54 24,659 19,697 1,668 2,549 1,286 0 50,892
31 Phoenix of E.A 2,686 4,138 2,059 4,312 -6,458 1,564 93,951 19,757 9,429 19,368 592 350 151,748
32 Pioneer (Run off) 0 0 0 -75 0 0 -338 359 0 -60 -150 -79 -343
33 Real 0 17,463 4,995 47,577 6,693 9,430 101,882 57,930 7,100 5,744 18,052 9,120 285,986
34 Standard 0 -296 500 507 256 -14 60,881 138,651 2,146 -51 661 23 203,264
35 Tausi 0 679 2,362 -3,282 3,624 19,004 42,590 73,327 50 16,526 93,891 9,327 258,098
36 The Monarch 0 807 -1,112 392 -29 242 16,706 16,285 3,056 353 1,037 -12 37,725
37 Trident 0 589 5,587 4,890 5,217 10,770 64,576 32,646 10,339 15,681 72,233 542 223,070
38 UAP Provincial 0 671 12,319 19,240 -13,221 23,370 144,067 146,614 383,126 46,544 17,537 41 780,308
TOTAL 10,065 81,340 115,465 446,366 109,400 373,134 3,565,915 4,032,755 3,232,202 512,778 1,542,377 213,608 14,235,405
Figures thousands Kshs.
INCURRED CLAIMS BY INSURERS UNDER GENERAL INSURANCE BUSINESS - CLASSWISE FOR THE YEAR ENDING 31ST DECEMBER 2007
Under Statutory Management

Insurance Regulatory Authority
81 2007 Insurance Annual Report
No. Name of Insurer Aviation Engineering Fire Domestic Fire Industrial Liabiliity Marine & Transit Motor Private Motor Commercial Personal Accident Theft Workman's Miscellaneous TOTAL
Commercial Accident Compensation
1 AIG (K) 0 3,757 11,488 74,741 28,187 12,778 -27,798 -9,257 66,983 18,199 7,175 1,139 187,392
2 AMACO 546 -254 1,105 243 -1,112 470 -15,052 71,616 -9,761 350 2,701 -2,595 48,258
3 APA -12,625 11,402 10,612 39,781 -4,438 20,701 -54,989 -51,026 -37,537 26,872 -17,663 46,379 -22,531
4 Blue Shield 0 3,358 10,329 8,369 605 -8,632 -94,069 347,032 16,472 10,902 229 783 295,378
5 British American 0 2,493 3,335 12,630 532 16,384 -6,933 2,049 54,863 481 -8,018 -837 76,979
6 Cannon -55 9,147 -372 7,198 1,002 -730 -28,634 -18,423 11,446 13,527 -19,996 25,510 -380
7 CFC (PA only) 0 0 0 0 0 0 0 0 130,100 0 0 0 130,100
8 Concord 0 3,254 2,603 9,152 1,129 7,931 5,267 -12,405 2,762 63 -10,886 43,373 52,243
9 Cooperative 0 -1,744 6,597 -4,971 2,399 -99 -86,460 8,196 -1,255 48,803 2,129 556 -25,849
10 Corporate 0 906 1,685 5,530 -1,199 -36 -19,238 13,635 -682 -54 -1,514 -834 -1,801
11 Directline 0 0 0 0 0 0 0 14,669 0 0 0 0 14,669
12 Fidelity Shield 0 307 2,929 -8,910 3,924 -4,764 -36,542 58,967 569 2,356 -17,276 431 1,991
13 First Assurance 0 12,006 2,954 16,807 2,132 -13,675 -10,805 15,330 9,375 -5,993 -22,456 6,827 12,502
14 Gateway 0 1,451 38 3,964 -483 -1,566 24,340 -22,086 -26,621 -4,660 7,549 -8,359 -26,433
15 Geminia 0 -44 1,037 -22,324 1,806 3,651 -7,359 5,141 1,711 5,174 -8,005 1,511 -17,701
16 General Accident 0 9,777 4,234 19,103 -3,219 5,183 22,769 -26,784 13,341 15,230 -43,784 6,700 22,550
17 Heritage AII -2,821 576 -5,952 -24,842 11,220 6,356 -47,011 32,904 18,174 7,276 22,833 9,667 28,380
18 ICEA 2,801 4,779 1,349 22,495 429 7,836 -74,328 -7,898 16,876 -1,773 -45,408 1,141 -71,701
19 Intra Africa 0 13,123 4,413 6,981 1,396 4,725 164 3,116 -5,792 3,063 -1,487 -16,728 12,974
20 Invesco
21 Jubilee 0 -18,482 4,602 -59,368 3,484 -6,260 76,865 -64,336 45,067 -5,768 -32,963 17,167 -39,992
22 Kenindia 50 15,991 12,809 -5,730 6,322 61,303 -27,187 -151,915 -78,114 -10,453 -375,437 5,276 -547,085
23 Kenya Orient 0 -545 927 3,726 -109 155 -1,597 1,818 1,788 2,599 -16,457 25,075 17,380
24 Kenyan Alliance 0 -2,347 4,655 -21,941 -654 2,599 -3,793 38,221 -5,276 -1,961 -5,536 -353 3,614
25 Lion of Kenya 346 10,515 6,884 11,231 3,240 9,636 -90,753 23,389 16,287 39,877 -46,512 -21,133 -36,993
26 Mayfair 0 -632 4,426 2,451 34,798 4,536 -8,678 4,354 -5,808 1,267 -6,375 8,247 38,586
27 Madison 0 -1,087 93 -2,601 -2,239 -435 -3,433 -1,012 1,330 -2,353 1,400 4,044 -6,293
28 Mercantile 0 825 -4,962 -2,394 -110 1,497 -10,609 -5,526 7,070 732 758 6,820 -5,899
29 Occidental 0 6,101 4,231 8,455 -445 -3,171 98 30,120 1,434 -32 -18,691 5,875 33,975
30 Pacis 0 138 -24 793 862 388 -2,460 4,855 2,130 -287 787 -99 7,083
31 Phoenix 4,513 8,788 -5,513 7,993 5,551 -4,077 -61,492 14,623 -4,173 -13,712 318 -2,692 -49,873
32 Pioneer(Run off) 0 0 0 75 0 0 338 -359 0 60 150 79 343
33 Real 0 4,864 3,786 -41,494 10,948 -6,649 -12,547 55,452 -1,250 12,229 4,582 3,527 33,448
34 Standard 0 3,018 589 5,654 2,401 684 -14,926 7,806 3,362 1,259 5,828 86 15,761
35 Tausi 0 -2,763 3,286 1,971 -2,050 -315 22,117 -19,939 1,485 -1,593 -44,302 2,846 -39,257
36 The Monarch 0 -821 1,567 198 272 1,241 -5,826 -2,986 -866 1,701 144 670 -4,706
37 Trident 0 1,069 -629 7,064 -3,539 5,874 -11,250 29,428 -4,991 458 -30,383 11,920 5,021
38 UAP Provincial 0 24,252 2,910 -4,886 32,787 16,422 -33,640 60,340 -18,771 2,870 10,208 1,387 93,879
TOTAL -7,245 123,178 98,021 77,144 135,829 139,941 -645,789 449,109 221,729 166,709 -706,358 183,406 236,012
Figures in thousands Kshs.
UNDERWRITING PROFITS OF INSURERS UNDER GENERAL INSURANCE BUSINESS - CLASSWISE FOR THE YEAR ENDING 31ST DECEMBER 2007
Under Statutory Management

Insurance Regulatory Authority
82 2007 Insurance Annual Report
No. Name of Insurer Aviation Engineering Fire Domestic Fire Industrial Liabiliity Marine & Transit Motor Private Motor Personal Theft Workman's Miscellaneous Industry
Commercial Accident Compensation Average
1 AIG (K) 0 302.6 22.4 42.4 32.0 8.2 71.8 59.0 30.7 16.0 25.9 3.0 46.6
2 AMACO -13.1 59.0 62.1 87.8 119.6 13.1 60.4 24.8 500.5 48.6 14.7 128.9 39.9
3 APA 49.4 26.6 6.0 29.8 18.0 29.5 100.9 83.2 85.6 40.4 79.4 4.6 73.1
4 Blue Shield 0 -9.1 -320.5 -3.3 11.9 154.3 75.4 36.4 -12.2 4.1 17.8 15.1 41.7
5 British American 0 13.2 22.1 2.2 13.0 22.1 72.9 51.9 53.9 90.5 94.6 193.2 51.2
6 Cannon 0 -62.0 98.6 -116.0 -46.6 101.6 126.9 81.1 1.7 -144.3 160.5 10.4 68.0
7 CFC (PA only) 0 0 0 0 0 0 0 0 51.3 0 0 0 51.3
8 Concord 0 31.6 23.1 22.7 32.6 23.5 62.3 74.1 -3.5 130.3 81.4 35.4 61.7
9 Cooperative 0 57.8 17.4 87.6 89.7 129.5 95.4 57.6 55.8 26.6 51.4 35.8 66.9
10 Corporate 0 16.5 0.4 -3.4 126.7 -55.6 72.4 44.0 35.5 40.0 45.4 39.5 53.0
11 Directline 0 0 0 0 0 0 0 32.0 0 0 0 0 32.0
12 Fidelity Shield 0 -9.5 23.3 83.0 -61.2 78.4 96.5 40.7 33.6 51.1 95.2 5.7 63.0
13 First Assurance 0 44.5 35.6 51.0 56.8 125.4 72.6 62.0 33.2 85.9 94.0 50.7 68.1
14 Gateway 0 5.0 4.7 18.1 37.4 107.8 28.4 56.3 502.4 184.5 -49.4 365.2 53.9
15 Geminia 0 38.8 39.6 306.9 2.5 34.9 76.2 61.8 11.3 57.3 66.6 10.6 68.8
16 General Accident 0 6.1 14.6 18.7 92.1 38.0 8.8 80.4 26.7 21.8 128.1 31.4 52.8
17 Heritage AII 60.8 17.8 39.8 59.8 -23.2 20.4 77.1 47.4 54.0 38.5 19.2 25.3 53.4
18 ICEA -14.0 49.4 15.8 7.4 47.6 14.1 92.5 58.4 42.5 66.8 130.3 18.3 65.5
19 Intra Africa 0 -13.1 15.5 47.0 -51.4 35.0 62.3 58.6 127.8 57.5 56.0 261.9 61.3
20 Invesco
21 Jubilee 0 113.2 28.2 198.7 31.8 66.6 27.3 104.8 77.9 64.0 119.1 48.8 73.6
22 Kenindia 0 36.0 23.6 71.6 24.0 50.0 84.0 104.0 214.7 99.8 177.3 51.3 105.4
23 Kenyan Alliance 0 124.8 21.2 -56.9 65.8 44.6 62.7 59.6 -25.5 23.4 260.7 -9.9 53.9
24 KenyaOrient 0 56.2 0.2 243.1 72.6 -28.3 80.6 40.5 45.5 60.7 87.1 1.8 63.3
25 Lion of Kenya 210.7 13.6 42.2 63.8 51.3 56.2 131.5 64.7 42.7 9.4 160.4 870.1 81.2
26 Madison 0 40.5 1.0 33.3 4.3 -15.6 83.9 66.4 77.0 30.3 118.5 19.1 64.2
27 Mayfair 0 58.5 31.7 49.2 293.9 42.4 73.2 65.3 28.3 82.8 35.3 5.9 56.5
28 Mercantile 0 19.0 96.4 15.3 49.9 -21.4 60.8 44.8 44.1 44.3 27.7 29.0 41.8
29 Occidental 0 -9.4 32.1 51.4 128.0 76.6 64.0 43.0 52.9 91.2 75.3 43.9 58.4
30 Pacis 0 12.7 25.4 7.1 6.1 10.1 56.2 43.8 21.6 53.4 27.9 0.0 44.1
31 Phoenix 74.7 57.5 43.0 34.1 -372.0 71.6 83.1 32.7 91.7 138.7 9.6 34.7 64.0
32 Pioneer (Run off) 0 0 0 Infinite 0 0 Infinite Infinite 0 Infinite Infinite Infinite Infinite
33 Real 0 59.0 31.7 135.3 27.6 70.1 75.5 36.7 43.2 20.9 46.9 40.7 55.4
34 Standard 0 -9.8 37.2 5.2 5.4 -1.9 70.5 38.5 32.0 -3.2 7.1 6.1 42.0
35 Tausi 0 385.8 22.6 -20.9 110.9 44.1 48.2 98.9 1.2 55.1 124.9 53.5 71.3
36 The Monarch 0 30.4 -58.8 13.6 -2.5 16.0 52.8 38.4 22.3 26.1 23.4 -1.1 36.0
37 Trident 0 24.6 85.3 47.8 225.7 55.6 97.2 41.2 135.0 82.6 134.3 3.4 78.8
38 UAP Provincial 0 2.2 32.1 36.8 -69.7 35.6 66.2 41.2 69.3 48.5 31.9 1.1 52.5
Industry Average 51.6 29.5 26.3 56.4 27.5 46.8 75.8 54.0 68.0 51.8 106.2 39.5 62.9
Incurred claims ratio = incurred claim x 100
Net earned premium
INCURRED CLAIMS RATIOS OF INSURERS UNDER GENERAL INSURANCE BUSINESS - CLASSWISE FOR THE YEAR ENDING 31ST DECEMBER 2007
Under Statutory Management
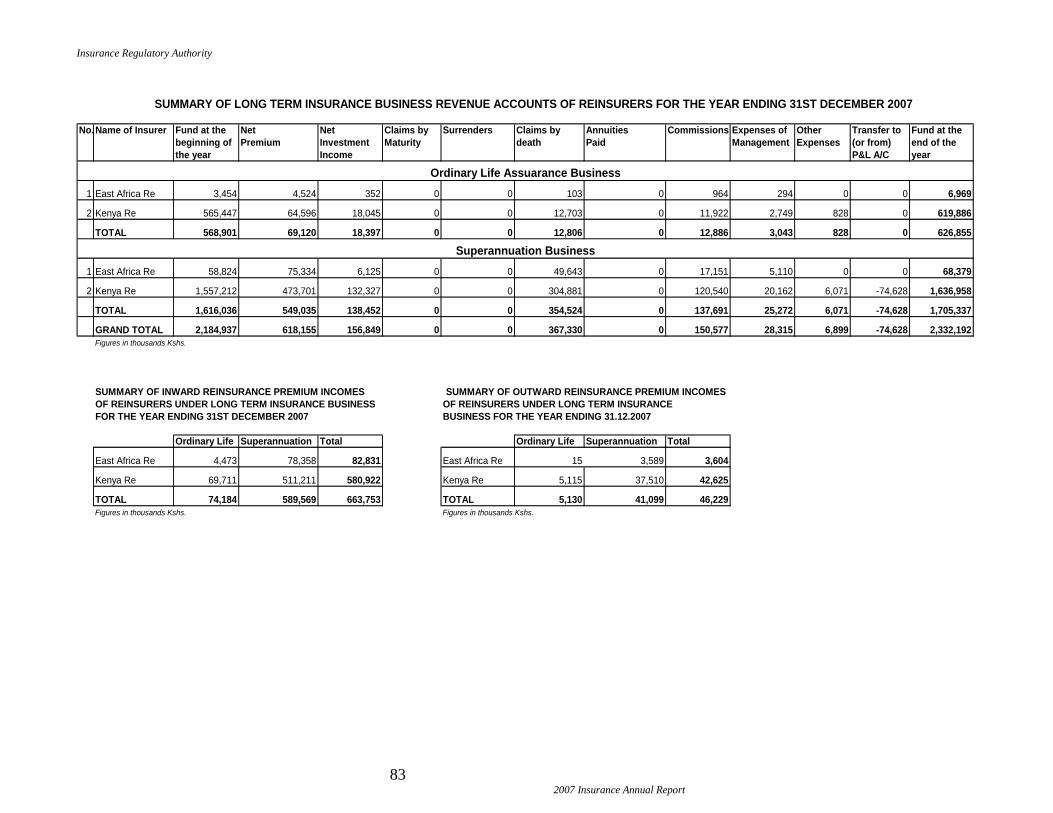
Insurance Regulatory Authority
83 2007 Insurance Annual Report
No.Name of Insurer Fund at the Net Net Claims by Surrenders Claims by Annuities Commissions Expenses of Other Transfer to Fund at the
beginning of Premium Investment Maturity death Paid Management Expenses (or from) end of the
the year Income P&L A/C year
1 East Africa Re 3,454 4,524 352 0 0 103 0 964 294 0 0 6,969
2 Kenya Re 565,447 64,596 18,045 0 0 12,703 0 11,922 2,749 828 0 619,886
TOTAL 568,901 69,120 18,397 0 0 12,806 0 12,886 3,043 828 0 626,855
1 East Africa Re 58,824 75,334 6,125 0 0 49,643 0 17,151 5,110 0 0 68,379
2 Kenya Re 1,557,212 473,701 132,327 0 0 304,881 0 120,540 20,162 6,071 -74,628 1,636,958
TOTAL 1,616,036 549,035 138,452 0 0 354,524 0 137,691 25,272 6,071 -74,628 1,705,337
GRAND TOTAL 2,184,937 618,155 156,849 0 0 367,330 0 150,577 28,315 6,899 -74,628 2,332,192
Figures in thousands Kshs.
Ordinary Life Superannuation Total Ordinary Life Superannuation Total
East Africa Re 4,473 78,358 82,831 East Africa Re 15 3,589 3,604
Kenya Re 69,711 511,211 580,922 Kenya Re 5,115 37,510 42,625
TOTAL 74,184 589,569 663,753 TOTAL 5,130 41,099 46,229
Figures in thousands Kshs. Figures in thousands Kshs.
SUMMARY OF LONG TERM INSURANCE BUSINESS REVENUE ACCOUNTS OF REINSURERS FOR THE YEAR ENDING 31ST DECEMBER 2007
BUSINESS FOR THE YEAR ENDING 31.12.2007
SUMMARY OF INWARD REINSURANCE PREMIUM INCOMES
OF REINSURERS UNDER LONG TERM INSURANCE BUSINESS
FOR THE YEAR ENDING 31ST DECEMBER 2007
Ordinary Life Assuarance Business
Superannuation Business
SUMMARY OF OUTWARD REINSURANCE PREMIUM INCOMES
OF REINSURERS UNDER LONG TERM INSURANCE

Insurance Regulatory Authority
84 2007 Insurance Annual Report
Aviation Engineering
Fire
Domestic Fire Industrial Liabiliity Marine Motor Private
Motor
Commercial
Personal
Accident Theft
Workman's
Compensation Miscellaneous TOTAL
Net Premium Written 14 40,214 0 229,059 2,227 39,896 0 113,654 11,538 5,299 -4 134,231 576,128
UPR B/F 27 15,094 0 138,693 3,837 17,647 0 8,950 6,142 1 20 50,868 241,279
UPR C/F 8 16,253 0 94,261 596 6,347 0 4,841 2,281 697 12 45,819 171,115
Incurred Claims 48 6,124 0 180,746 -6,743 28,275 0 101,912 4,746 -1,783 -78 62,797 376,044
Commissions -5 13,923 0 91,536 300 14,228 0 7,647 2,861 793 6 41,311 172,600
Expenses of Management 1 3,945 0 27,949 233 5,599 0 10,707 1,023 441 0 22,014 71,912
Underwriting Profit -11 15,063 0 -26,740 11,678 3,094 0 -2,503 6,769 5,152 76 13,158 25,736
Investment Income before tax 0 0 0 0 0 0 0 0 0 0 0 0 0
Other expenses 0 536 0 4,040 0 558 0 570 54 0 0 1,994 7,752
Gross profit or loss
transferred to P&L A/C -11 14,527 0 -30,780 11,678 2,536 0 -3,073 6,715 5,152 76 11,164 17,984
Figures in Thousands Kshs.
Aviation Engineering
Fire
Domestic Fire Industrial Liabiliity Marine Motor Private
Motor
Commercial
Personal
Accident Theft
Workman's
Compensation Miscellaneous TOTAL
Net Premium Written 10,069 175,888 12,902 1,044,619 44,232 245,636 895 262,412 150,702 391,116 937 277,882 2,617,290
UPR B/F 2,074 66,556 203 116,547 13,773 17,556 1,620 53,162 23,670 85,865 80 71,488 452,594
UPR C/F 824 56,669 2,188 177,154 14,251 38,716 270 79,173 48,555 126,014 302 89,531 633,647
Incurred Claims 6,601 -9,944 3,864 442,319 -20,126 135,360 31,810 100,921 181,225 71,159 35,837 168,824 1,147,850
Commissions 1,737 62,320 6,049 375,906 7,561 82,435 27 11,453 43,668 120,660 186 89,085 801,087
Expenses of Management 1,115 19,791 1,644 133,091 4,977 30,299 99 29,045 16,957 44,008 105 31,267 312,398
Underwriting Profit 1,866 113,608 -640 32,696 51,342 -23,618 -29,691 94,982 -116,033 115,140 -35,413 -29,337 174,902
Investment Income before tax 0 0 0 0 0 0 0 0 0 0 0 0 0
Other expenses 556 9,874 820 66,401 2,483 15,117 49 14,491 8,460 21,956 53 15,600 155,860
Gross profit or loss
transferred to P&L A/C 1,310 103,734 -1,460 -33,705 48,859 -38,735 -29,740 80,491 -124,493 93,184 -35,466 -44,937 19,042
Figures in Thousands Kshs.
Aviation Engineering
Fire
Domestic Fire Industrial Liabiliity Marine Motor Private
Motor
Commercial P/Accident Theft W/Compensation Miscellaneous TOTAL
Net Premium Written 10,083 216,102 12,902 1,273,678 46,459 285,532 895 376,066 162,240 396,415 933 412,113 3,193,418
UPR B/F 2,101 81,650 203 255,240 17,610 35,203 1,620 62,112 29,812 85,866 100 122,356 693,873
UPR C/F 832 72,922 2,188 271,415 14,847 45,063 270 84,014 50,836 126,711 314 135,350 804,762
Incurred Claims 6,649 -3,820 3,864 623,065 -26,869 163,635 31,810 202,833 185,971 69,376 35,759 231,621 1,523,894
Commissions 1,732 76,243 6,049 467,442 7,861 96,663 27 19,100 46,529 121,453 192 130,396 973,687
Expenses of Management 1,116 23,736 1,644 161,040 5,210 35,898 99 39,752 17,980 44,449 105 53,281 384,310
Underwriting Profit 1,855 128,671 -640 5,956 63,020 -20,524 -29,691 92,479 -109,264 120,292 -35,337 -16,179 200,638
Investment Income before tax 0 0 0 0 0 0 0 0 0 0 0 0 0
Other expenses 556 10,410 820 70,441 2,483 15,675 49 15,061 8,514 21,956 53 17,594 163,612
Gross profit or loss
transferred to P&L A/C 1,299 118,261 -1,460 -64,485 60,537 -36,199 -29,740 77,418 -117,778 98,336 -35,390 -33,773 37,026
Figures in Thousands Kshs.
SUMMARY OF GENERAL INSURANCE BUSINESS REVENUE ACCOUNTS OF EAST AFRICA REINSURANCE COMPANY FOR THE YEAR ENDING 31ST DECEMBER 2007
SUMMARY OF GENERAL INSURANCE BUSINESS REVENUE ACCOUNTS OF KENYA REINSURANCE COMPANY LIMITED FOR THE YEAR ENDING 31ST DECEMBER 2007
SUMMARY OF COMBINED GENERAL INSURANCE BUSINESS REVENUE ACCOUNTS FOR THE REINSURERS FOR THE YEAR ENDING 31ST DECEMBER 2007

Insurance Regulatory Authority
85 2007 Insurance Annual Report
Aviation Engineering F/Domestic F/Industrial Liabiliity Marine M/Private M/Commercial P/Accident Theft W/Compensation Miscellaneous TOTAL
East Africa Re 21 61,776 0 439,029 3,620 86,997 0 171,391 15,902 6,848 6 351,879 1,137,469
Kenya Re 10,069 178,803 14,851 1,202,440 44,965 273,745 895 262,412 153,200 397,598 953 282,488 2,822,419
TOTAL 10,090 240,579 14,851 1,641,469 48,585 360,742 895 433,803 169,102 404,446 959 634,367 3,959,888
Figures Thousands Kshs.
Aviation Engineering F/Domestic F/Industrial Liabiliity Marine M/Private M/Commercial P/Accident Theft W/Compensation Miscellaneous TOTAL
East Africa Re 7 21,562 0 209,970 1,393 47,102 0 57,737 4,363 1,549 10 217,647 561,340
Kenya Re 0 2,915 1,949 157,821 733 28,109 0 0 2,498 6,482 16 4,606 205,129
TOTAL 7 24,477 1,949 367,791 2,126 75,211 0 57,737 6,861 8,031 26 222,253 766,469
Figures Thousands Kshs.
Aviation Engineering F/Domestic F/Industrial Liabiliity Marine M/Private M/Commercial P/Accident Theft W/Compensation Miscellaneous TOTAL
East Africa Re 33 39,055 0 273,491 5,468 51,196 0 117,763 15,399 4,603 4 139,280 646,292
Kenya Re 11,319 185,775 10,917 984,012 43,754 224,476 2,245 236,401 125,817 350,967 715 259,839 2,436,237
TOTAL 11,352 224,830 10,917 1,257,503 49,222 275,672 2,245 354,164 141,216 355,570 719 399,119 3,082,529
Figures Thousands Kshs.
Aviation Engineering F/Domestic F/Industrial Liability Marine M/Private M/Commercial P/Accident Theft W/Compensation Miscellaneous TOTAL
East Africa Re 48 6,124 0 180,746 -6,743 28,275 0 101,912 4,746 -1,783 -78 62,797 376,044
Kenya Re 6,601 -9,944 3,864 442,319 -20,126 135,360 31,810 100,921 181,225 71,159 35,837 168,824 1,147,850
TOTAL 6,649 -3,820 3,864 623,065 -26,869 163,635 31,810 202,833 185,971 69,376 35,759 231,621 1,523,894
Figures Thousands Kshs.
Aviation Engineering F/Domestic F/Industrial Liabiliity Marine M/Private M/Commercial P/Accident Theft W/Compensation Miscellaneous Average
East Africa Re 145.45 15.68 - 66.09 -123.32 55.23 - 86.54 30.82 -38.74 -1,950.00 45.09 58.18
Kenya Re 58.32 -5.35 35.39 44.95 -46.00 60.30 1,416.93 42.69 144.04 20.28 - 64.97 47.12
Average 58.57 -1.70 35.39 49.55 -54.59 59.36 1,416.93 57.27 131.69 19.51 4,973.44 58.03 49.44
Figures Thousands Kshs.
INCURRED CLAIMS RATIO OF REINSURERS UNDER GENERAL INSURANCE BUSINESS FOR THE YEAR ENDING 31ST DECEMBER 2007
SUMMARY OF INWARD REINSURANCE PREMIUM INCOMES OF REINSURERS UNDER GENERAL INSURANCE BUSINESS FOR THE YEAR ENDING 31ST DECEMBER 2007
SUMMARY OF OUTWARD REINSURANCE PREMIUM INCOMES OF REINSURERS UNDER GENERAL INSURANCE BUSINESS FOR THE YEAR ENDING 31ST DECEMBER 2007
NET EARNED PREMIUM INCOMES OF REINSURERS UNDER GENERAL INSURANCE BUSINESS FOR THE YEAR ENDING 31ST DECEMBER 2007
INCURRED CLAIMS BY REINSURERS UNDER GENERAL INSURANCE BUSINESS FOR THE YEAR ENDING 31ST DECEMBER 2007

Insurance Regulatory Authority
86 2007 Insurance Annual Report
1.5% INSURANCE PREMIUM LEVY FOR THE YEARS 2005 - 2007
No. Name of Insurer 2005 2006 2007 2005-2006 2006-2007
1 AIG(K) Ins. Co. 22,938 24,402 26,270 6.4 7.7
2 AMACO 3,656 5,027 8,246 37.5 64.0
3 APA 21,725 29,195 35,016 34.4 19.9
4 APOLLO 523 527 580 0.8 10.0
5 Blue shield 30,021 27,895 41,030 -7.1 47.1
6 British American 23,384 24,344 40,895 4.1 68.0
7 Cannon 4,470 5,055 9,466 13.1 87.2
8 CFC Life 19,787 23,910 22,141 20.8 -7.4
9 Concord 8,822 7,903 8,488 -10.4 7.4
10 Co-operative Ins. Co. 12,680 18,527 16,127 46.1 -13.0
11 Corporate 3,749 4,803 6,002 28.1 25.0
12 Directline Ass. Co. 132 4,688 4,810 3451.5 2.6
13 Fidelity Shield 7,970 8,948 10,094 12.3 12.8
14 First Assurance 9,860 12,505 15,167 26.8 21.3
15 Gateway 5,113 5,425 6,315 6.1 16.4
16 Geminia 5,638 6,302 6,903 11.8 9.5
17 General Accident 6,666 7,815 9,898 17.2 26.7
18 Heritage AII 16,558 19,459 22,344 17.5 14.8
19 I.C.E.A 18,110 21,344 23,187 17.9 8.6
20 Intra Africa 5,466 5,600 6,051 2.5 8.1
21 Invesco 9,724 9,017 9,168 -7.3 1.7
22 Jubilee 26,437 29,517 36,729 11.7 24.4
23 Kenindia 42,691 45,324 48,030 6.2 6.0
24 Kenya National (2001) Exempted - - -
25 Kenya Orient 2,084 3,244 4,249 55.6 31.0
26 Kenyan Alliance 6,795 6,069 5,187 -10.7 -14.5
27 Lion of Kenya 15,386 16,996 17,464 10.5 2.8
28 Madison 18,129 14,039 13,973 -22.6 -0.5
29 Mayfair Ins. - 1,904 3,689 - 93.7
30 Mercantile 4,920 5,030 5,750 2.2 14.3
31 Metropolitan Life - 233 832 - 256.4
32 Occidental 6,531 8,893 10,872 36.2 22.3
33 Old Mutual 9,875 18,134 24,833 83.6 36.9
34 Pacis Ins. 145 1,372 2,439 846.1 77.8
35 Pan Africa Life 16,921 14,421 17,756 -14.8 23.1
36 Phoenix 5,002 5,400 7,192 8.0 33.2
37 Pioneer 2,153 2,909 3,048 35.1 4.8
38 Real 8,946 10,757 10,619 20.2 -1.3
39 Standard 9,774 7,149 7,785 -26.9 8.9
40 Tausi 9,954 10,432 7,416 4.8 -28.9
41 The Monarch 897 1,683 2,048 87.7 21.7
42 Trident 4,828 5,881 5,349 21.8 -9.0
43 Trinity Life Ass. 537 475 405 -11.5 -14.8
44 UAP Provincial 22,927 25,865 29,233 12.8 13.0
TOTAL 451,924 508,422 593,096 12.5 16.7
Figures in Thousands Kshs.
No Name of MIPs 2006 2007 Growth (%)
1 Executive Healthcare Solution Ltd 1,769 3,087 74.5
2 J. W. Seagon & Co Ltd 7,829 8,229 5.1
3 AAR Health Services Ltd 0 5,317 -
4 AON Minet Ltd 0 327 -
5 Healthline Solutions Ltd 195 2,755 1,312.7
6 Goldstar Healthcare Ltd 542 1,277 135.7
7 Acropolis Insurance Brokers Ltd 0 193 -
8 Planned Healthcare Ltd 299 196 -34.3
9 Lifecare International Ltd 0 3,732 -
10 Optimum Global 21 0 -100.0
11 JLT Risk Solutions 7,516 2,709 -64.0
TOTAL 18,171 27,822 53.1
Figures in Thousands Kshs.
Growth (%)
1.5% PREMIUM LEVY PAID BY MEDICAL INSURANCE PROVIDER (MIPs) DURING THE YEAR 2007

Insurance Regulatory Authority
87 2007 Insurance Annual Report
5% REINSURANCE PREMIUM TAX FOR THE YEARS 2005 AND 2007
No. Name of Insurer 2005 2006 2007 2005-2006 2006-2007
1 AIG(K) Ins. Co. 8389 8452 10336 0.8 22.3
2 AMACO 0 0 0 0.0 0.0
3 APA 1280 878 2708 -31.4 208.4
4 APOLLO 0 0 0 0.0 0.0
5 Blue shield 494 111 304 -77.5 173.9
6 British American 2973 3157 3520 6.2 11.5
7 Cannon 622 357 1206 -42.6 237.8
8 CFC Life 1580 1923 1505 21.7 -21.7
9 Concord 2294 1964 2648 -14.4 34.8
10 Co-operative Ins. Co. 3843 3090 668 -19.6 -78.4
11 Corporate 403 353 326 -12.4 -7.6
12 Directline Ass. Co. 0 94 0 0.0 -100.0
13 East Africa Re 1260 1341 3344 6.4 149.4
14 Fidelity Shield 2264 2534 2786 11.9 9.9
15 First Assurance 2982 4034 4182 35.3 3.7
16 Gateway 206 309 209 50.0 -32.4
17 Geminia 1238 1794 1833 44.9 2.2
18 General Accident 761 76 206 -90.0 171.1
19 Heritage AII 1979 2408 2061 21.7 -14.4
20 I.C.E.A 7097 6954 5884 -2.0 -15.4
21 Intra Africa 408 0 0 -100.0 0.0
22 Invesco 110 384 54 249.1 -85.9
23 Jubilee 2155 2038 2559 -5.4 25.6
24 Kenindia 11451 10571 10147 -7.7 -4.0
25 Kenya National (2001) 0 0 0 0.0 0.0
26 Kenya Orient 51 32 234 -37.3 631.3
27 Kenyan Alliance 827 1070 999 29.4 -6.6
28 Kenya Re 3684 1299 1583 -64.7 21.9
29 Lion of Kenya 1000 1268 1270 26.8 0.2
30 Madison 3050 2054 1710 -32.7 -16.7
31 Mayfair Ins. 0 428 718 0.0 67.8
32 Mercantile 5054 5349 7466 5.8 39.6
33 Metropolitan Life 0 17 6 0.0 -64.7
34 Occidental 1718 0 0 -100.0 0.0
35 Old Mutual 158 43 245 -72.8 469.8
36 Pacis Ins. 0 0 0 0.0 0.0
37 Pan Africa Life 0 0 0 0.0 0.0
38 Phoenix 1839 1416 1356 -23.0 -4.2
39 Pioneer 0 0 0 0.0 0.0
40 Real 2418 3482 3007 44.0 -13.6
41 Standard 73 190 163 160.3 -14.2
42 Tausi 2884 2371 2114 -17.8 -10.8
43 The Monarch 443 935 -2735 111.1 -392.5
44 Trident 585 413 307 -29.4 -25.7
45 Trinity Life Ass. 0 0 0 0.0 0.0
46 UAP Provincial 2824 3027 3411 7.2 12.7
47 United 122 0 0 -100.0 0.0
TOTAL 80519 76216 78340 -5.3 2.8
Figures in thousands Kshs.
Growth (%)

Insurance Regulatory Authority
88 2007 Insurance Annual Report
No. Name of Insurer 2005 2006 2007 2005-2006 2006-2007
1 AIG(K) Ins. Co. 3,058 3,254 3,503 6.4 7.7
2 AMACO 487 665 1,100 36.6 65.3
3 APA 2,897 3,893 4,669 34.4 19.9
4 Blue shield 3,759 3,502 4,753 -6.8 35.7
5 British American 831 592 1,359 -28.8 129.6
6 Cannon 237 518 1,069 118.5 106.4
7 CFC Life 449 1,094 1,222 143.5 11.7
8 Concord 1,176 1,054 1,132 -10.4 7.4
9 Co-operative Ins. Co. 1,638 2,358 2,046 44.0 -13.2
10 Corporate 424 543 679 28.1 25.0
11 Directline Ass. Co. 17 625 643 3576.8 2.9
12 Fidelity Shield 1,063 1,193 1,346 12.2 12.8
13 First Assurance 1,282 1,664 2,022 29.8 21.5
14 Gateway 682 723 842 6.1 16.4
15 Geminia 730 816 895 11.8 9.7
16 General Accident 889 1,042 1,320 17.2 26.7
17 Heritage AII 2,208 2,595 2,979 17.5 14.8
18 I.C.E.A 1,923 2,205 2,227 14.7 1.0
19 Intra Africa 731 730 812 -0.2 11.3
20 Invesco 1,328 1,286 200 -3.2 -84.4
21 Jubilee 3,030 3,446 4,334 13.7 25.8
22 Kenindia 5,367 5,619 5,435 4.7 -3.3
23 Kenya National (2001) - - - -
24 Kenya Orient 280 432 566 54.5 30.9
25 Kenyan Alliance 903 807 690 -10.7 -14.5
26 Lion of Kenya 2,051 2,183 2,328 6.4 6.7
27 Madison 1,579 1,034 1,229 -34.5 18.9
28 Mayfair Ins. - 254 492 - 93.8
29 Mercantile 598 604 678 1.0 12.3
30 Occidental 871 1,186 1,450 36.1 22.3
31 Pacis Ins. 22 183 325 731.5 77.7
32 Phoenix 667 720 959 7.9 33.2
33 Pioneer Ass. - 12 - -100.0
34 Real 3,057 1,434 1,416 -53.1 -1.3
35 Standard 1,193 932 1,038 -21.9 11.3
36 Tausi 1,303 1,391 989 6.7 -28.9
37 The Monarch 120 223 273 86.1 22.2
38 Trident 1,327 784 713 -40.9 -9.1
39 UAP Provincial 644 3,167 3,898 391.7 23.1
TOTAL 48,821 54,760 61,631 12.2 12.5
Figures in thousands Kshs.
No Name of MIPs 2006 2007 Growth (%)
1 Executive Healthcare Solutions Ltd. 236 404 71.2
2 J. W. Seagon & Co. Ltd. 1,029 1,127 9.5
3 AAR Health Services Ltd. 0 1,041 -
4 AON Minet Ltd. 15 48 220.0
5 Healthline Solutions Ltd. 26 486 1769.2
6 Goldstar Healthcare Ltd. 71 240 238.0
7 Acropolis Ins. Brokers Ltd. 0 41 -
8 Planned Healthcare Ltd. 40 51 27.5
9 Lifecare International Brokers Ltd. 0 498 -
10 Optimum Global 2 0 -100.0
11 JLT Risk Solutions 1,002 0 -100.0
TOTAL 2,421 3,936 62.6
Figures in thousands Kshs.
0.2% INSURANCE TRAINING LEVY FOR THE YEARS 2005 AND 2007 Growth (%)
0.2% INSURANCE TRAINING LEVY PAID BY MEDICAL INSURANCE PROVIDER (MIPs) DURING THE YEAR 2007

Insurance Regulatory Authority
89 2007 Insurance Annual Report
Growth (%)
2005 2006 2007 2006-2007
1 AIG 7,646 8,134 8,757 7.7
2 Amaco 980 1,743 2,749 57.7
3 APA 7,166 9,678 11,812 22.1
4 Apollo 19 31 49 57.8
5 Blue Shield 7,588 9,060 12,155 34.2
6 British American 2,590 5,180 7,584 46.4
7 Cannon 1,193 1,392 2,928 110.4
8 CFC Life 3,836 6,033 5,778 -4.2
9 Concord 2,731 2,599 2,752 5.9
10 Co-operative 4,255 6,088 5,308 -12.8
11 Corporate 1,105 1,487 1,915 28.7
12 Directline Ass 42 1,602 1,656 3.4
13 Fidelity Shield 2,421 2,983 3,365 12.8
14 First Assurance 2,935 4,159 5,056 21.6
15 Gateway 1,597 1,767 2,057 16.4
16 Geminia 1,794 2,077 2,283 9.9
17 General Accident 1,767 2,605 3,300 26.7
18 Heritage AII 4,681 6,260 7,447 19.0
19 I.C.E.A 3,725 5,513 7,194 30.5
20 Intra Africa 1,772 1,809 2,023 11.8
21 Invesco 1,833 3,909 3,275 -16.2
22 Jubilee 6,397 10,493 13,205 25.8
23 Kenindia 12,747 14,219 14,982 5.4
24 Kenya Orient 700 1,081 1,416 31.0
25 Kenya Alliance 2,259 2,019 1,725 -14.5
26 Lion of Kenya 4,397 5,700 5,843 2.5
27 Madison 3,487 3,100 3,521 13.6
28 Mayfair - 635 1,230 93.8
29 Mercantile 1,505 1,806 1,982 9.7
30 Metropolitan Life - 91 299 229.7
31 Occidental 2,106 2,964 3,624 22.2
32 Old Mutual 444 1,046 815 -22.1
33 Pacis 54 457 813 77.8
34 Pan Africa Life 640 1,612 2,746 70.4
35 Phoenix 1,674 1,801 2,343 30.1
36 Pioneer 139 240 268 11.7
37 Royal 2,694 3,549 3,540 -0.3
38 Standard 3,258 2,331 2,595 11.3
39 Tausi 2,896 3,490 2,474 -29.1
40 The Monarch 283 558 683 22.3
41 Trident 1,627 1,967 1,785 -9.3
42 Trinity 10 47 84 78.0
43 UAP Provincial 7,321 8,571 9,744 13.7
44 United 419 0 0 0.0
TOTAL 116,731 151,886 175,160 15.3
Figures in thousands Kshs.
POLICY HOLDERS' COMPENSATION FUND LEVY FOR THE YEARS 2005 TO 2007
No. Name of Insurer
Years

Insurance Regulatory Authority
90 2007 Insurance Annual Report
PART 9 - CURRENT INSURANCE INDUSTRY DIRECTORY ORGANIZATION CONTACT PRINCIPAL OFFICER
1. Africa Merchant Assurance Company Ltd. P. O. Box 61599 - 00200 K. Abincha
Tel: 312121
Transnational Plaza,
Mama Ngina Street,
Nairobi.
E-mail: [email protected]
2. A.I.G Kenya Insurance Co. Ltd. P.O Box 49460 J. Olende
Tel: 3676000/3751800,
AIG House,
Chiromo Road,
Nairobi.
E-mail: [email protected]
3 APA Insurance Company Ltd P. O. Box 30065-00100, Ashok Shah
Tel: 2862000
Hughes Building,
Kenyatta Ave,
Nairobi.
Email: [email protected]
4. Apollo Insurance Company Limited P. O. Box 30389 -00100, S. M. Shah
Tel: 343585/311782,
Hughes Building,
Kenyatta Ave,
Nairobi.
E-mail: [email protected]
5. Blue Shield Insurance Company Limited P. O. Box 49610 - 00100, P.K. Wanjala
Tel: 2712600/2765000,
Blue Shield Towers,
Hospital Road off Mara Road,
Upper Hill, Nairobi.
E-mail: [email protected]
6. British American Insurance Co. (K) Limited P. O. Box 30375, S. Wandera
Tel: 2710927/38
British American Centre,
Mara & Ragati Roads,
Nairobi.
E-mail: [email protected]
7. Cannon Assurance (K) Limited P. O. Box 30216-00100, J. M. Mukoma
Tel: 3966000,
Gateway Business Park,
Mombasa Road,
Nairobi
E-mail: [email protected]

Insurance Regulatory Authority
91 2007 Insurance Annual Report
8. Concord Insurance Company Limited P. O. Box 30634 -00100, F. S. Irungu
Tel: 2720166/7/8
Yaya Centre,
Argwings Kodhek Road,
Nairobi.
E-mail: [email protected]
9. CFC Life Assurance Company (K) Ltd. P. O. Box 30364 - 00100 S. Maina
Tel: 2866000
CFC House,
Mamlaka Road,
Nairobi.
E-mail: [email protected]
10. Co-operative Insurance Company Limited P. O. Box 59485 - 00200, Nelson Kuria
Tel: 2823000,
CIC Plaza,
Mara Road,
Nairobi.
E-mail: [email protected]
11. Corporate Insurance Company Limited P. O. Box 34172 - 00100, S. J. Njoroge
Tel: 2717617
Corporate Place,
Kiambere Road,
Nairobi.
E-mail: [email protected]
12. Directline Assurance Company Limited P. O. Box 40863-00100, Terry Wijenje
Tel: 242405,
Hazina Towers,
Monrovia Street,
Nairobi.
E-mail: [email protected]
13. East Africa Reinsurance Company Limited P. O. Box 20196, H. Motara
Tel: 2223588/2214964,
Ambank House,
Univesity Way,
Nairobi.
E-mail: [email protected]
14. Fidelity Shield Insurance Company Limited P. O. Box 47435 - 00100, S. N .Surmar (Mrs)
Tel: 4443063-9/4449440
Amec Arcade,
Parklands Road, Westlands,
Nairobi.
E-mail: [email protected]
15. First Assurance Company Limited P.O. Box 30064 - 00100, S.Githiga
Tel: 567374/6/9
First Assurance House,
Gitanga Road, Lavington,
Nairobi.
E-mail: [email protected]

Insurance Regulatory Authority
92 2007 Insurance Annual Report
16. Gateway Insurance Company Limited P. O. Box 60656 - 00200, G. W. Karuri
Tel: 2713131-7
Gateway Place,
Milimani Road,
Nairobi.
E-mail: [email protected]
17. Geminia Insurance Company Ltd. P. O. Box 61316 - 00200, Ag. Sembi
Tel:2782000,
Geminia Insurance Plaza,
Kilimanjaro Avenue,
Nairobi.
E-mail: [email protected]
18. General Accident Insurance Company Ltd. P. O. Box 42166 - 00100, S. R. Shah
Tel: 2711633,
General Accident House,
Ralph Bunche Road,
Nairobi.
E-mail: [email protected]
19. Heritage A.I.I. Insurance Company Ltd. P. O. Box 30390 - 00100, J. H. D. Milne
Tel: 2783000/2726439,
C.F.C. House,
Mamlaka Road,
Nairobi.
E-mail: [email protected]
20. Insurance Company of East Africa Ltd P. O. Box 46143, J. K Ndungu
Tel: 340365, 224766,
ICEA Building,
Kenyatta Avenue,
Nairobi.
E-mail: [email protected]
21. Intra Africa Assurance Company Limited P. O. Box 43241 - 00100, S.M. Kimani
Tel: 2712610/2712607-9,
Williamson House,
4th Ngong Avenue,
Nairobi.
E-mail: [email protected]
22. Invesco Assurance Company Limited P.O. Box 52964 - 00200, (Under statutory)
Tel: 2734890/2 G. Njenga
CVS Plaza,
Lenana Road,
Nairobi.
E-mail: [email protected]
23. Jubilee Insurance Company Limited P. O. Box 30376 - 00100, Simon Clayton
Tel: 3281000,
Jubilee Insurance House,
Wabera Street,
Nairobi.
E-mail: [email protected]
Insurance Regulatory Authority
93 2007 Insurance Annual Report
24. Kenindia Assurance Company Limited P. O. Box 44372-00100, S. Mishra
Tel: 214439,316099,
Kenindia House,
Loita Street.
Nairobi.
E-mail: [email protected]
25. Kenya National Assurance (2001) Limited P. O. Box 20425-00100, A. T. Kaminchia
Tel: 215802/216063/340671,
Corner House,
Kimathi Street,
Nairobi.
26. Kenya Orient Insurance Company Limited P. O. Box 34530 - 00100, J. Karoki
Tel:2728603/4,
Capital Hill Towers,
Cathedral Road,
Nairobi.
E-mail: [email protected]
27. Kenya Reinsurance Corporation Limited. P. O. Box 30271, Eunice Mbogo
Tel: 240188,
Reinsurance Plaza,
Taifa Road,
Nairobi.
E-mail: [email protected]
28. Kenyan Alliance Insurance Co. Ltd. P. O. Box 30170 - 00100, W. Mbugua
Tel: 253900/241626,
Chester House,
Koinange Street,
Nairobi.
E-mail: [email protected]
29. Lion of Kenya Insurance Company Ltd. P. O. Box 30190 - 00100, J.K Kimeu
Tel: 2710400,
Williamson House,
4th Ngong Road Avenue
Nairobi.
E-mail: [email protected]
30. Madison Insurance Company Kenya Limited P. O. Box 47382 - 00100, F. Muchiri
Tel: 2864000,
Madison Insurance House,
Off Upper Hill Road,
Nairobi.
E-mail: [email protected]
31. Mayfair Insurance Limited P. O. Box 45161-00100, Tushar Shah
Tel: 315703,315716,
Barclays Plaza,
Loita Street.
Nairobi.
E-mail: [email protected]

Insurance Regulatory Authority
94 2007 Insurance Annual Report
32. Mercantile Insurance Co. Ltd P. O. Box 20680-00200, S. Sen
Tel: 243681,
Fedha Towers,
Muindi Mbingu Street.
Nairobi.
E-mail: [email protected]
33. Metropolitan Life Insurance (K) Co. Ltd P. O. Box 46783-00100, Linus Makhulo
Tel: 243126/42/58,
International life House,
Mama Ngina Street.
Nairobi.
34. Occidental Insurance Company Limited P. O. Box 41684/39459- 00623, G. Ray
Tel: 3750012/22/37/57/83,
Corner Plaza,
Parklands Road, Westlands,
Nairobi.
E-mail: [email protected]
35. Old Mutual Insurance Company Limited P. O. Box 30059 - 00100, T. Madzinga
Tel: 2728881/221187,
Old Mutual Building,
Corner of Mara/Hospital Roads,
Nairobi.
E-mail: [email protected]
36. Pacis Insurance Company Limited P. O. Box 1870-00200, Peter Makhanu
Tel: 4452560,
Centenary House,
Off Ring Road, Westlands,
Nairobi.
E-mail: [email protected]
37. Pan Africa Life Assurance Limited P. O. Box 44041 - 00100, Tom Gitogo
Tel:2247600, 2225050,
Pan African House,
Kenyatta Avenue,
Nairobi.
E-mail: [email protected]
38. Phoenix of East Africa Insurance Co. Limited P. O. Box 30129 - 00100, Kashaul Kumar
Tel: 251350,
Ambank House,
University Way,
Nairobi.
E-mail: [email protected]
39. Pioneer Assurance Company Limited P. O. Box 20333-00200, M. Kimani
Tel: 2220814/5,
Pioneer House,
Moi Avenue,
Nairobi.
E-mail: [email protected]
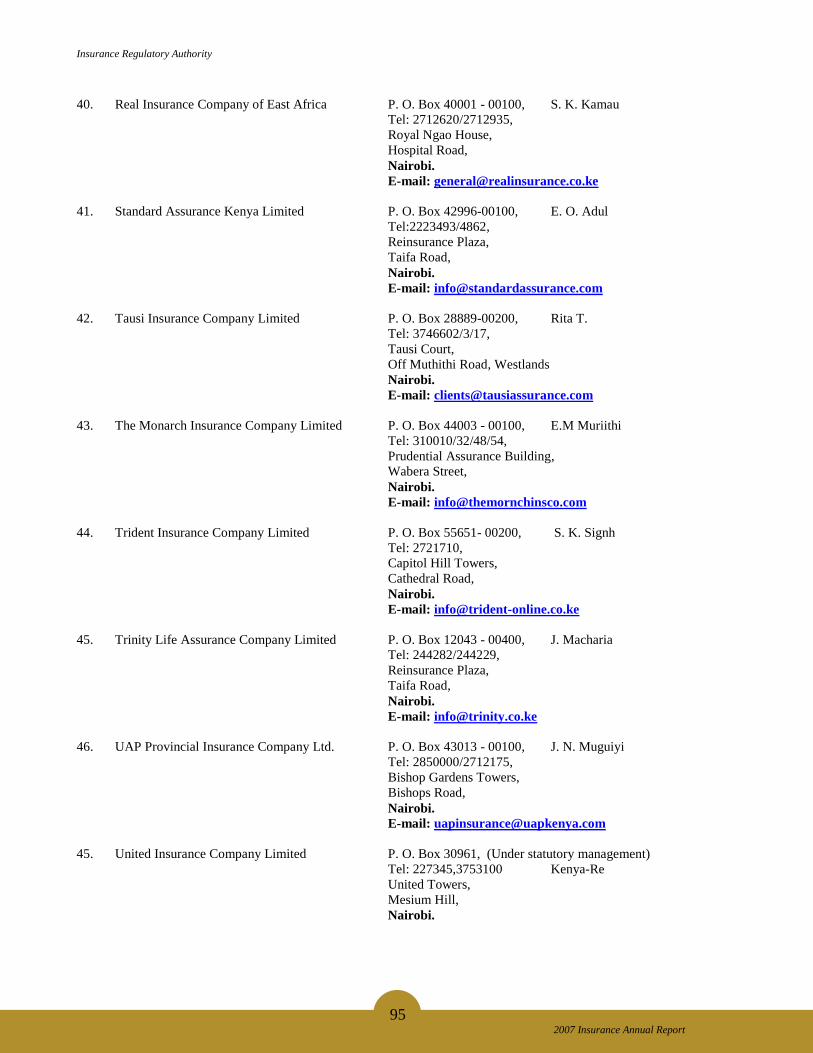
Insurance Regulatory Authority
95 2007 Insurance Annual Report
40. Real Insurance Company of East Africa P. O. Box 40001 - 00100, S. K. Kamau
Tel: 2712620/2712935,
Royal Ngao House,
Hospital Road,
Nairobi.
E-mail: [email protected]
41. Standard Assurance Kenya Limited P. O. Box 42996-00100, E. O. Adul
Tel:2223493/4862,
Reinsurance Plaza,
Taifa Road,
Nairobi.
E-mail: [email protected]
42. Tausi Insurance Company Limited P. O. Box 28889-00200, Rita T.
Tel: 3746602/3/17,
Tausi Court,
Off Muthithi Road, Westlands
Nairobi.
E-mail: [email protected]
43. The Monarch Insurance Company Limited P. O. Box 44003 - 00100, E.M Muriithi
Tel: 310010/32/48/54,
Prudential Assurance Building,
Wabera Street,
Nairobi.
E-mail: [email protected]
44. Trident Insurance Company Limited P. O. Box 55651- 00200, S. K. Signh
Tel: 2721710,
Capitol Hill Towers,
Cathedral Road,
Nairobi.
E-mail: [email protected]
45. Trinity Life Assurance Company Limited P. O. Box 12043 - 00400, J. Macharia
Tel: 244282/244229,
Reinsurance Plaza,
Taifa Road,
Nairobi.
E-mail: [email protected]
46. UAP Provincial Insurance Company Ltd. P. O. Box 43013 - 00100, J. N. Muguiyi
Tel: 2850000/2712175,
Bishop Gardens Towers,
Bishops Road,
Nairobi.
E-mail: [email protected]
45. United Insurance Company Limited P. O. Box 30961, (Under statutory management)
Tel: 227345,3753100 Kenya-Re
United Towers,
Mesium Hill,
Nairobi.

Insurance Regulatory Authority
96 2007 Insurance Annual Report
46. Zep-Re (PTA) Reinsurance Company Limited P. O. Box 42769, S. M. Lubasi
Tel: 212792
Zep Re Place,
Upperhill,
Nairobi.
E-mail: [email protected]
47. Africa Reinsurance Corporation Tel: 2724896,2730661/2/3 G. Otieno
Africa Re Towers,
Hospital road-Upper Hill,
Nairobi.
E-mail: [email protected]
MEDICAL INSURANCE PROVIDERS 1 Executive Healthcare Solutions Box 51343-00200 Nairobi
2 J.W.Seagon & Company Ltd Box 63420-00619 Nairobi
3 Discovery Health E.A Limited Box 30446-00100 Nairobi
4 Kenbright Healthcare Andministrators Ltd Box 28281-00200 Nairobi
5 H.S.Jutley Insurance Brokers Ltd Box 59915-00200 Nairobi
6 Mutual Trust Insurance Agencies Ltd Box 13875-00800 Nairobi
7 Healthline Solutions Ltd Box 903-00606 Nairobi
8 Starlit Insurance Brokers Ltd Box 10778-00100 Nairobi
9 Alexander Forbes Insurance Brokers Ltd Box 30076-00100 Nairobi
10 Aon Minet Insurance Brokers Ltd Box 45817-00100 Nairobi
11 Goldstar Healthcare Ltd Box 14077-00800 Nairobi
12 Lifecare International Insurance Brokers Ltd Box 59789-00200 Nairobi
13 Liaison Group Insurance Brokers Ltd Box 58013-00200 Nairobi
14 Clarkson Notcutt Insurance Brokers Ltd Box 30279-00100 Nairobi
15 Healthfirst International Ltd Box 48350-00100 Nairobi
16 BTB Insurance Brokers Limited Box 40127-00100 Nairobi
17 Prosperity Health (Kenya) Ltd Box 63907-00619 Nairobi
18 Resolution Health E.A Limited Box 4469-00100 Nairobi
19 AAR Health Services Limited Box 41766-00100 Nairobi
20 Bhanji & Associates Limited Box 46857-00100 Nairobi
21 Pacific Insurance Brokers (E.A) Ltd Box 50565-00200 Nairobi
22 Sobhag Insurance Brokers Ltd Box 148-30100 Eldoret
23 Planned Healthcare Limited Box 48445-00100 Nairobi
24 Indemnity Insurance Brokers Box 41026 Nairobi
25 Acropolis Insurance Brokers Box 1157-00606 Nairobi

Insurance Regulatory Authority
97 2007 Insurance Annual Report
INSURANCE BROKERS 1 Starlit Insurance Brokers Ltd Box 10778-00100 Nairobi
2 Interstate Insurance Brokers Ltd Box 41760-00100 Nairobi
3 Sobhag Insurance Brokers Ltd Box 148-30100 Eldoret
4 Meeson Insurance Brokers Ltd Box 48984-00100 Nairobi
5 Palsha Insurance Brokers Ltd Box 922 Kisumu
6 Composite Insurance Brokers Ltd Box 90573 Mombasa
7 Formax Insurance Brokers Ltd Box 1769-80100 Mombasa
8 Shashi Insurance Brokers Ltd Box 43527-00100 Nairobi
9 Mima Insurance Brokers Ltd Box 12000 Nakuru
10 Universal Insurance Brokers Ltd Box 11930 Nairobi
11 Pistis Insurance Brokers Ltd Box 89948 Mombasa
12 Vefis Insurance Brokers (K) Ltd Box 5978-00100 Nairobi
13 Getrio Insurance Brokers Ltd Box 53172-00200 Nairobi
14 Crownscope Insurance Brokers Ltd Box 46280-00100 Nairobi
15 Precious Insurace Brokers Ltd Box 3969-00506 Nairobi
16 Youjays Insurance Brokers Ltd Box 46707 Nairobi
17 Al-Fawzein Insurance Brokers Ltd Box 86570-80100 Nairobi
18 Baltex Insurance Brokers Ltd Box 27664-00506 Nairobi
19 Nomura Insurance Brokers Ltd Box 86752-80100 Mombasa
20 M.A Khan Insurance Brokers Ltd Box 46424-00100 Nairobi
21 Risk Care Insurance Brokers Ltd Box 55298-00200 Nairobi
22 Ams Insurance Brokers Ltd Box 82336 Mombasa
23 Secom Insurance Brokers Ltd Box 70358-00400 Nairobi
24 Rift Insurance Brokers Ltd Box 2727-20100 Nakuru
25 Executive Insurance Brokers Ltd Box 80142-80100 Mombasa
26 Online Insurance Brokers Ltd Box 10000-00100 Nairobi
27 Harmony Insurance Brokers Ltd Box 1661-40100 Kisumu
28 Lema Insurance Brokers Ltd Box 12926-00400 Nairobi
29 Prime Mover Insurance Brokers Ltd Box 79460-00200 Nairobi
30 Acacia Insurance Brokers Ltd Box 1929-00100 Nairobi
31 Bottomry Insurance Brokers Ltd Box 70489-00400 Nairobi
32 Al'amin Insurance Brokers Ltd Box 85098 Mombasa
33 Speedsure Insurance Brokeres Ltd Box 4327-00200 Nairobi
34 Assured Insurance Brokers Ltd Box 67511-00200 Nairobi
35 Njama Insurance Brokers Ltd Box 160-00517 Nairobi
36 Way Ahead Insurance Brokers Ltd Box 24774-00502 Nairobi
37 Pasan Insurance Brokers Ltd Box 16227-00100 Nairobi
38 Gachichio Insurance Brokers Ltd Box 43002-00100 Nairobi
39 Mic Global Risk Insurance Brokers Ltd Box 51343-00200 Nairobi
40 Vike Insurance Brokers Ltd Box 2790-00100 Nairobi
41 Chester Insurance Brokers Ltd Box 66795-00800 Nairobi
42 Fotress Insurance Brokers Ltd Box 14115-20100 Nakuru
43 Majani Insurance Brokers Ltd Box 10150-00100 Nairobi
44 Jewar Insurance Brokers Ltd Box 8901-00300 Nairobi
45 Miran Insurance Brokers Ltd Box 43441-00100 Nairobi
46 Speedserve Insurance Brokers Ltd Box 7850-00100 Nairobi
47 Idime Insurance Brokers Ltd Box 621-80100 Nairobi
48 Plan & Place Insurance Brokers Ltd Box 4431-00100 Nairobi
49 Pacific Insurance Brokers (E.A) Ltd Box 50565-00200 Nairobi
50 BTB Insurance Brokers Ltd Box 40127-00100 Nairobi
51 Bid Insurance Brokers Ltd Box 40127-00100 Nairobi
52 Economic Insurance Brokers Ltd Box 46454-00100 Nairobi
53 Trisons Insurance Brokers Ltd Box 555-00606 Nairobi
54 Kenfident Insurance Brokers Ltd Box 44812-00100 Nairobi
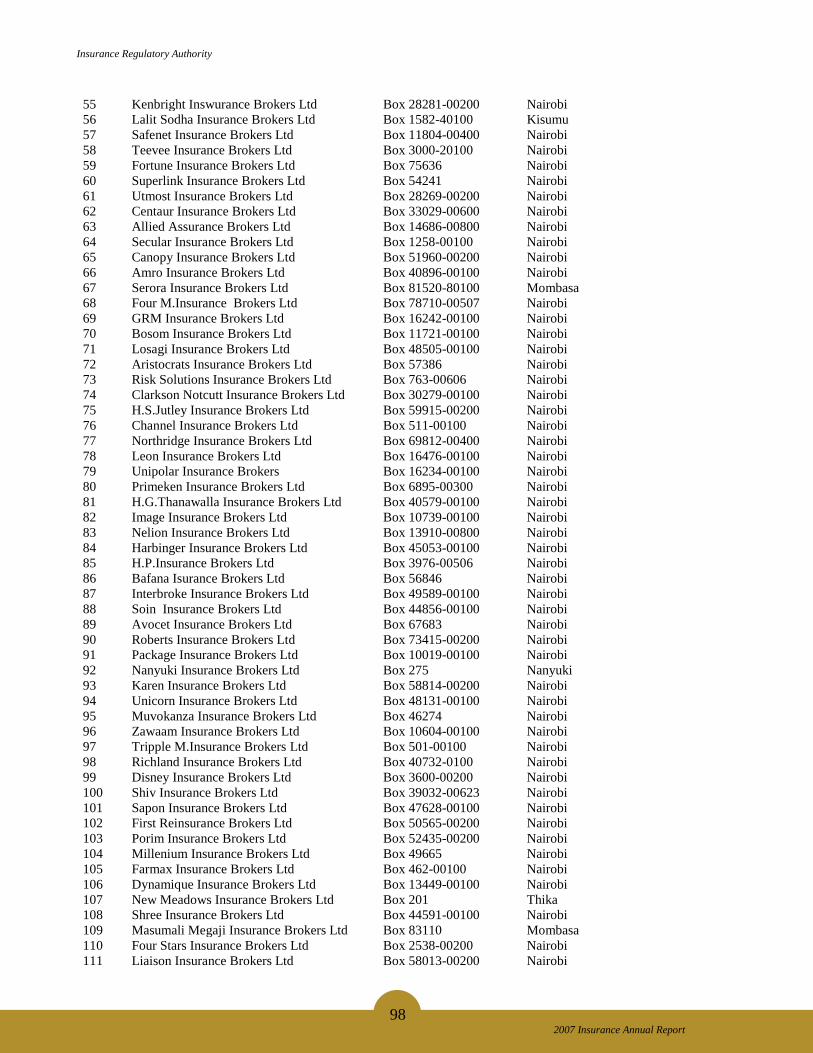
Insurance Regulatory Authority
98 2007 Insurance Annual Report
55 Kenbright Inswurance Brokers Ltd Box 28281-00200 Nairobi
56 Lalit Sodha Insurance Brokers Ltd Box 1582-40100 Kisumu
57 Safenet Insurance Brokers Ltd Box 11804-00400 Nairobi
58 Teevee Insurance Brokers Ltd Box 3000-20100 Nairobi
59 Fortune Insurance Brokers Ltd Box 75636 Nairobi
60 Superlink Insurance Brokers Ltd Box 54241 Nairobi
61 Utmost Insurance Brokers Ltd Box 28269-00200 Nairobi
62 Centaur Insurance Brokers Ltd Box 33029-00600 Nairobi
63 Allied Assurance Brokers Ltd Box 14686-00800 Nairobi
64 Secular Insurance Brokers Ltd Box 1258-00100 Nairobi
65 Canopy Insurance Brokers Ltd Box 51960-00200 Nairobi
66 Amro Insurance Brokers Ltd Box 40896-00100 Nairobi
67 Serora Insurance Brokers Ltd Box 81520-80100 Mombasa
68 Four M.Insurance Brokers Ltd Box 78710-00507 Nairobi
69 GRM Insurance Brokers Ltd Box 16242-00100 Nairobi
70 Bosom Insurance Brokers Ltd Box 11721-00100 Nairobi
71 Losagi Insurance Brokers Ltd Box 48505-00100 Nairobi
72 Aristocrats Insurance Brokers Ltd Box 57386 Nairobi
73 Risk Solutions Insurance Brokers Ltd Box 763-00606 Nairobi
74 Clarkson Notcutt Insurance Brokers Ltd Box 30279-00100 Nairobi
75 H.S.Jutley Insurance Brokers Ltd Box 59915-00200 Nairobi
76 Channel Insurance Brokers Ltd Box 511-00100 Nairobi
77 Northridge Insurance Brokers Ltd Box 69812-00400 Nairobi
78 Leon Insurance Brokers Ltd Box 16476-00100 Nairobi
79 Unipolar Insurance Brokers Box 16234-00100 Nairobi
80 Primeken Insurance Brokers Ltd Box 6895-00300 Nairobi
81 H.G.Thanawalla Insurance Brokers Ltd Box 40579-00100 Nairobi
82 Image Insurance Brokers Ltd Box 10739-00100 Nairobi
83 Nelion Insurance Brokers Ltd Box 13910-00800 Nairobi
84 Harbinger Insurance Brokers Ltd Box 45053-00100 Nairobi
85 H.P.Insurance Brokers Ltd Box 3976-00506 Nairobi
86 Bafana Isurance Brokers Ltd Box 56846 Nairobi
87 Interbroke Insurance Brokers Ltd Box 49589-00100 Nairobi
88 Soin Insurance Brokers Ltd Box 44856-00100 Nairobi
89 Avocet Insurance Brokers Ltd Box 67683 Nairobi
90 Roberts Insurance Brokers Ltd Box 73415-00200 Nairobi
91 Package Insurance Brokers Ltd Box 10019-00100 Nairobi
92 Nanyuki Insurance Brokers Ltd Box 275 Nanyuki
93 Karen Insurance Brokers Ltd Box 58814-00200 Nairobi
94 Unicorn Insurance Brokers Ltd Box 48131-00100 Nairobi
95 Muvokanza Insurance Brokers Ltd Box 46274 Nairobi
96 Zawaam Insurance Brokers Ltd Box 10604-00100 Nairobi
97 Tripple M.Insurance Brokers Ltd Box 501-00100 Nairobi
98 Richland Insurance Brokers Ltd Box 40732-0100 Nairobi
99 Disney Insurance Brokers Ltd Box 3600-00200 Nairobi
100 Shiv Insurance Brokers Ltd Box 39032-00623 Nairobi
101 Sapon Insurance Brokers Ltd Box 47628-00100 Nairobi
102 First Reinsurance Brokers Ltd Box 50565-00200 Nairobi
103 Porim Insurance Brokers Ltd Box 52435-00200 Nairobi
104 Millenium Insurance Brokers Ltd Box 49665 Nairobi
105 Farmax Insurance Brokers Ltd Box 462-00100 Nairobi
106 Dynamique Insurance Brokers Ltd Box 13449-00100 Nairobi
107 New Meadows Insurance Brokers Ltd Box 201 Thika
108 Shree Insurance Brokers Ltd Box 44591-00100 Nairobi
109 Masumali Megaji Insurance Brokers Ltd Box 83110 Mombasa
110 Four Stars Insurance Brokers Ltd Box 2538-00200 Nairobi
111 Liaison Insurance Brokers Ltd Box 58013-00200 Nairobi

Insurance Regulatory Authority
99 2007 Insurance Annual Report
112 Waumini Insurance Brokers Ltd Box 13475-00800 Nairobi
113 Vinmox Insurance Brokers Ltd Box 9547-00100 Nairobi
114 Community Insurance Brokers Ltd Box 25330-00603 Nairobi
115 Chancery Wright Insurance Brokers Ltd Box 55537-00200 Nairobi
116 Aboo Insurance Brokers Ltd Box 83313 Mombasa
117 Options Insurance Brokers Ltd Box 14678-00100 Nairobi
118 Risk Management Insurance Brokers Ltd Box 41030-00100 Nairobi
119 Macly Insurance Brokers Ltd Box 61492-00200 Nairobi
120 Associated Insurance Brokerts Ltd Box 14523-00606 Nairobi
121 Timex Insurance Brokers Ltd Box 12430 Nakuru
122 Minlet Insurance Brokers Ltd Box 73157-00200 Nairobi
123 Paelina Insurance Brokers Ltd Box 28073-00200 Nairobi
124 The Exchange Insurance Brokers Ltd Box 69692-00400 Nairobi
125 Widescope Insurance Brokers Ltd Box 50661-00200 Nairobi
126 Acropolis Insurance Brokers Ltd Box 1157-00606 Nairobi
127 Aum Insurance Brokers Ltd Box 90087 Mombasa
128 Consolidated Insurance Brokers Ltd Box 72773-00200 Nairobi
129 Pelican Insurance Brokers Ltd Box 52801 Nairobi
130 Bimasure Insurance Brokers Ltd Box 34555 Nairobi
131 First Rescue Insurance Brokers Ltd Box 34451 Nairobi
132 Adept Insurance Brokers Ltd Box 1717-00200 Nairobi
133 M.D.Kampf Insurance Brokers Ltd Box 40206-00100 Nairobi
134 Above All Insurance Brokers Ltd Box 53269-00200 Nairobi
135 Flagship Insurance Brokers Ltd Box 13889-00800 Nairobi
136 Peace Of Mind Insurance Brokers Box 6742-00100 Nairobi
137 Maj Insurance Brokers Ltd Box 61701-00200 Nairobi
138 Sedgwick Kenya Insurance Brokers Ltd Box 40709-00100 Nairobi
139 Skylark Africa Insurance Brokers Ltd Box 10437-00100 Nairobi
140 Fairsure Insurance Brokers Ltd Box 59112-00200 Nairobi
141 Scanner Insurance Brokers Ltd Box 67718-00200 Nairobi
142 Arkchoice Insurance Brokers Ltd Box 2964-00100 Nairobi
143 Sunland Insurance Brokers Ltd Box 11553-00100 Nairobi
144 Risk Shield Insurance Brokers Ltd Box 42617 Nairobi
145 Sifa Insurance Brokers Ltd Box 20341-00200 Nairobi
146 Boma Insurance Brokers Ltd Box 43945-00100 Nairobi
147 Afrishield Insurance Brokers Ltd Box 10305 Nairobi
148 Capital Insurance Brokers Ltd Box 45133-00100 Nairobi
149 Buffer Insurance Brokers Ltd Box 54670-00200 Nairobi
150 Rumaku Insurance Brokers Ltd Box 69443-00400 Nairobi
151 Mombasa Insurance Brokers Ltd Box 1810 Mombasa
152 Aon Minet Insurance Brokers Ltd Box 48279-00100 Nairobi
153 Eagle Africa Insurance Brokers Ltd Box 30076-00100 Nairobi
154 Great Five Insurance Brokers Ltd Box 10683-00100 Nairobi
155 First Lane Insurance Brokers Ltd Box 68161 Nairobi
156 Kenfirm Insurance Brokers Ltd Box 56724 Nairobi
157 Masionda Insurance Brokers Ltd Box 6378-00200 Nairobi
158 Sakaka Insurance Brokers Ltd Box 685 Nakuru
159 Yess Insurance Brokers Ltd Box 225-40100 Nairobi
160 Sailor Insurance Brokers Ltd Box 12245-00400 Nairobi
161 Fled Black Insurance Brokers Ltd Box 76140-00508 Nairobi
162 Safe N' Sound Insurance Brokers Ltd Box 162-30100 Nairobi
163 Unicover Insurance Brokers Ltd Box 76021 Nairobi
164 Berke Insurance Brokers Limited Box 14563-00100 Nairobi
165 Eden Rock Insurance Brokers Ltd Box 2187 Kitale
166 Kan Insurance Brokerds Ltd Box 6843 Nairobi
167 Hillstone Insurance Brokers Box 46869-00100 Nairobi
168 Insco Insurance Brokers Limited Box 1417-00606 Nairobi

Insurance Regulatory Authority
100 2007 Insurance Annual Report
169 African Continent Insurance Brokers Ltd Box 82777 Mombasa
170 Bahari Insurance Brokers Limited Box 62337-00200 Nairobi
171 Advent Insurance Brokers Ltd Box 22543-00400 Nairobi
172 Habari Insurance Brokers Ltd Box 80604-80100 Nairobi
173 Trust Mark Insurance Brokers Ltd Box 19936-00202 Nairobi
174 Mik Insurance Brokers Ltd Box 257-60200 Nairobi
175 Clear Insurance Brokers Limited Box 6521 Nairobi
176 Finesse Insurance Brokers Ltd Box 34886-00100 Nairobi
177 Select & Protect Insurance Brokers Ltd Box 45251-00100 Nairobi
178 Multi Bonus Insurance Brokers Ltd Box 73068 Nairobi
179 Aa Insurance Brokers Limited Box 40087-00100 Nairobi
180 Quantum Insurance Brokers Ltd Box 52439 Nairobi
181 Methodist Insurance Brokers Box 47633-00100 Nairobi
182 Jemisam Insurance Brokers Ltd Box 16923-00100 Nairobi
183 Finchley Insurance Brokers Ltd Box 34832-00100 Nairobi
184 Family Insurance Brokers Ltd Box 74145-00200 Nairobi
185 F.C.N Insurance Brokers Ltd Box 76108-00508 Nairobi
186 Yugeri Insurance Brokers Ltd Box 1429 Kisumu
187 Pentagon Insurance Brokers Ltd Box 21498-00505 Nairobi
188 Platinum Insurance Brokers Ltd Box 758500-00200 Nairobi
189 Plivileged Pure Insurance Brokers Box 43756 Nairobi
190 Zorin Insurance Brokers Box 60360-00200 Nairobi
Other members of the insurance industry 1. College of Insurance
P.O. Box 56926
Telephone: 504227, 605601-4, Fax: 605605
Nairobi.
C.E.O.: Mr. Ken Osinde
2. Association of Kenya Insurers
P.O. Box 45338
Telephone: 220212/3,
Nairobi.
C.E.O.: T. M. Gichuhi
3. Association of Insurance Brokers of Kenya
P.O. Box 56928
Telephone: 600541,
Nairobi.
C.E.O: Mr.G. Mng’ongo
4. Insurance Institute of Kenya
Tel: 220212/3
P.O. Box 49897.
Nairobi.
Director: Mr. J. Muiruri
5. Institute of Loss Adjusters & Risk Surveyors (IARS)
P.O Box 27671
0056 - Nairobi
Chairman: Mr. K. Chege
6. Automobile Engineer Assessors Association
P.O Box 78156
0507 - Nairobi
Chairman: Miricho Nderitu