Report No Waters Proficiency Testing Round No. 182 Total ...
57
SD 9.17. - To PTA wis Dr M Bu go to G the supp .09 W otal S shes to gra uckley-Smit Global Profic ply and dist P R Waters R Solids Total atefully ackn th and Mrs ciency Ltd ( tribution of t © Copyrig PO Box 750 Repo s Pro Roun s, To l Diss Aug Ack nowledge th R Ryan, Gl (New Zeala the samples ght Profici 07 SILVER ort No oficien nd No otal Su solve gust 2 knowledgm he technica lobal Profici and) and to s. iency Tes RWATER N o. 925 ncy T o. 182 uspe ed So 2015 ments al assistance iency Ltd (N Global Pro sting Austr NSW 212 5 Testin 2 nded olids - e provided New Zealan oficiency Pty ralia, 2015 28, Austral ng d Soli - for this pro nd). Also ou y Ltd (Austr 5 alia ids, ogram by ur thanks ralia) for
Transcript of Report No Waters Proficiency Testing Round No. 182 Total ...

SD 9.17.09
- Total Solids, Total Suspended Solids,
PTA wishes to gratefully acknowledge the technical assistance provided for this program by Dr M Buckleygo to Global Proficiency Ltd (New Zealand) and to Global Proficiency Pty Ltd (Australia) for the supply and distribution of the samples.
SD 9.17.09
Waters Proficiency Testing
Total Solids, Total Suspended Solids,
PTA wishes to gratefully acknowledge the technical assistance provided for this program by Dr M Buckley-Smithgo to Global Proficiency Ltd (New Zealand) and to Global Proficiency Pty Ltd (Australia) for the supply and distribution of the samples.
PO B
Report No
Waters Proficiency Testing
Round
Total Solids, Total Suspended Solids, Total Dissolved Solids
PTA wishes to gratefully acknowledge the technical assistance provided for this program by Smith and Mrs R Ryan
go to Global Proficiency Ltd (New Zealand) and to Global Proficiency Pty Ltd (Australia) for the supply and distribution of the samples.
© Copyright
PO Box 7507
Report No
Waters Proficiency Testing
Round
Total Solids, Total Suspended Solids, Total Dissolved Solids
August 2015
Acknowledgments
PTA wishes to gratefully acknowledge the technical assistance provided for this program by and Mrs R Ryan, Global Proficiency Ltd (New
go to Global Proficiency Ltd (New Zealand) and to Global Proficiency Pty Ltd (Australia) for the supply and distribution of the samples.
© Copyright Proficiency Testing Australia
ox 7507 SILVERWATER
Report No
Waters Proficiency Testing
Round No.
Total Solids, Total Suspended Solids, Total Dissolved Solids
August 2015
Acknowledgments
PTA wishes to gratefully acknowledge the technical assistance provided for this program by , Global Proficiency Ltd (New
go to Global Proficiency Ltd (New Zealand) and to Global Proficiency Pty Ltd (Australia) for the supply and distribution of the samples.
Proficiency Testing Australia
SILVERWATER NSW
Report No . 925
Waters Proficiency Testing
o. 182
Total Solids, Total Suspended Solids, Total Dissolved Solids
August 2015
Acknowledgments
PTA wishes to gratefully acknowledge the technical assistance provided for this program by , Global Proficiency Ltd (New
go to Global Proficiency Ltd (New Zealand) and to Global Proficiency Pty Ltd (Australia) for
Proficiency Testing Australia
NSW 2128
925
Waters Proficiency Testing
182
Total Solids, Total Suspended Solids, Total Dissolved Solids -
PTA wishes to gratefully acknowledge the technical assistance provided for this program by , Global Proficiency Ltd (New Zealand). Also our thanks
go to Global Proficiency Ltd (New Zealand) and to Global Proficiency Pty Ltd (Australia) for
Proficiency Testing Australia , 2015
2128, Australia
Waters Proficiency Testing
Total Solids, Total Suspended Solids, -
PTA wishes to gratefully acknowledge the technical assistance provided for this program by Zealand). Also our thanks
go to Global Proficiency Ltd (New Zealand) and to Global Proficiency Pty Ltd (Australia) for
2015
, Australia
Total Solids, Total Suspended Solids,
PTA wishes to gratefully acknowledge the technical assistance provided for this program by Zealand). Also our thanks
go to Global Proficiency Ltd (New Zealand) and to Global Proficiency Pty Ltd (Australia) for

SD 9.17.09
CONTENTS
1. Foreword ............................................................................................................................ 1
2. Program Features and Design ........................................................................................... 1
3. Statistical Format ............................................................................................................... 2
4. PTA and Technical Advisers' Comments ........................................................................... 4
5. Outlier Results ................................................................................................................. 25
6. References ...................................................................................................................... 25
APPENDIX A – Results and Data Analysis
Total Solids ............................................................................................................................ A1
Total Suspended Solids ........................................................................................................ A7
Total Dissolved Solids ......................................................................................................... A13
APPENDIX B – Sample Homogeneity and Stability
Homogeneity and Stability Testing ........................................................................................ B1
APPENDIX C – Documentation
Instructions to Participants .................................................................................................... C1
Method Codes ....................................................................................................................... C3
Results Sheet ........................................................................................................................ C4

1
SD 9.17.09
1. Foreword
This report summarises the results of a proficiency testing program on the determination of Total Solids, Total Suspended Solids and Total Dissolved Solids in waters. This is round 182 in a planned series of programs involving the analysis of chemical and physical parameters of waters. The exercise was conducted in June 2015 by Proficiency Testing Australia (PTA). The main aim of the program was to assess laboratories’ abilities to competently perform the prescribed analyses. The Program Coordinator was Mrs D Mihaila and the Technical Advisers were Dr M Buckley-Smith and Mrs R Ryan, Global Proficiency Ltd (New Zealand). This report was authorised by Mrs F Watton, PTA Quality – Business Development Manager.
2. Program Features and Design 2.1 Each laboratory was randomly allocated a unique code number for the program to
ensure confidentiality of results. Reference to each laboratory in this report is by code number only. Please note that a number of laboratories reported more than one set of results and, therefore, their code numbers (with letter) could appear several times in the same data set.
2.2 Laboratories were provided with the "Instructions to Participants" and "Results Sheet"
(see Appendix C). Laboratories were requested to perform the tests according to their routine methods.
2.3 Participants were provided with two plastic bottles (labelled PTA 1 and PTA 2)
containing water samples for the analysis of Total Solids, Total Suspended Solids and Total Dissolved Solids.
2.4 A total of 46 laboratories received samples, comprising:
- 35 Australian participants; and
- 11 overseas participants, including:
- Brunei Darussalam (2), Indonesia (2), Malaysia (1), New Zealand (1), Papua New Guinea (1), Peru (1), Russia (1), Tanzania (1), Thailand (1).
Of these 46 laboratories, one was unable to submit results by the due date. 2.5 Results (as reported by participants) with corresponding summary statistics (i.e.
number of results, median, normalised interquartile range, uncertainty of the median, robust coefficient of variation, minimum, maximum and range) are presented in Appendix A (for each sample and for each of the analyses performed).
2.6 A robust statistical approach, using z-scores, was utilised to assess laboratories’
testing performance (see Section 3). Robust z-scores and ordered z-score charts relevant to each test are presented in Appendix A.

2
SD 9.17.09
The document entitled Guide to Proficiency Testing Australia, 2014 (reference [1]) defines the statistical terms and details the statistical procedures referred to in this report.
2.7 A tabulated listing of laboratories (by code number) identified as having outlier results
can be found on page 25. 2.8 Prior to sample distribution, a number of randomly selected samples were analysed
for homogeneity and stability. Based on the results of this testing (see Appendix B) it was considered that the samples utilised for this program were homogeneous and stable. As such, any results later identified as outliers could not be attributed to any notable sample variability.
3. Statistical Format
For each test, where appropriate, the following information is given:
- a table of results and calculated z-scores;
- a list of summary statistics; and
- ordered z-score charts.
3.1 Outlier Results and Z-scores In order to assess laboratories’ testing performance, a robust statistical approach,
using z-scores, was utilised. Z-scores give a measure of how far a result is from the consensus value (i.e. the median), and gives a "score" to each result relative to the other results in the group.
A z-score with an absolute value less than or equal to 2.0 is considered to be satisfactory, whereas, a z-score with an absolute value greater than or equal to 3.0 is considered to be an outlier and is marked by the symbol “§”. Laboratories are also encouraged to review results which have an absolute z-score value between 2.0 and 3.0 (i.e. 2.0 < |z-score| < 3.0). These results are considered to be questionable results.
Each determination was examined for outliers with all methods pooled. The table on
page 25 summarises the outlier results detected. 3.2 Results Tables and Summary Statistics The tables in Appendix A contain the results returned by each laboratory, including
the code number for the method used and the robust z-score calculated for each result.
Results have been entered exactly as reported by participants. That is, laboratories
which did not report results to the precision (i.e. number of significant figures) requested on the Results Sheet have not been rounded to the requested precision before being included in the statistical analysis.

3
SD 9.17.09
A list of summary statistics appears at the bottom of each of the results tables and consists of:
- No. of Results: the total number of results for that test/sample;
- Median: the middle value of the results;
- Normalised IQR: the normalised interquartile range of the results;
- Uncertainty of the Median: a robust estimate of the standard deviation of the Median;
- Robust CV: the robust coefficient of variation expressed as a percentage, i.e. 100 x Normalised IQR / Median;
- Minimum: the lowest laboratory result;
- Maximum: the highest laboratory result; and
- Range: the difference between the Maximum and Minimum.
The median is a measure of the centre of the data. The normalised IQR is a measure of the spread of the results. It is calculated by multiplying the interquartile range (IQR) by a correction factor, which converts the IQR to an estimate of the standard deviation. The IQR is the difference between the upper and lower quartiles (i.e. the values above and below which a quarter of the results lie, respectively). For normally distributed data, the uncertainty of the median is approximated by:
��2 ������
√�
� = number of results. Please see reference [1] for further details on these robust summary statistics.
3.3 Ordered Z-score Charts The charts in Appendix A indicate each laboratory's robust z-score, in order of
magnitude, marked with its laboratory code number. From these charts, each laboratory can readily compare its performance relative to the other laboratories.
These charts contain solid lines at +3.0 and -3.0, so that outliers are clearly
identifiable as those laboratories whose "bar" extends beyond these "cut-off" lines. The y-axis of these charts has been limited, so very large z-scores appear to extend beyond the chart boundary.

4
SD 9.17.09
4. PTA and Technical Advisers’ Comments 4.1 Metrological Traceability and Measurement Uncertainty of Assigned Values
Consensus values (median) derived from participants’ results are used in this program. These values are not metrologically traceable to an external reference. Sample preparation was undertaken according to Global Proficiency Ltd’s Standard Operating Procedures to ensure samples were fit-for-purpose, homogeneous and stable. Solutions were stable and homogeneous, and medians obtained from this proficiency round were in consistent agreement with the expected levels (dope concentration), as shown in Table 1. As the assigned value for each analyte in this program is the median of the results submitted by the participants, the uncertainty of the median for each analyte has been calculated and is presented in Table 1 below. Table 1. Comparison of expected levels (dope concentration) and proficiency medians. The values of the calculated uncertainty of the median are also presented.
Analyte Sample Dope
Concentration (mg/L)
Median (mg/L)
Uncertainty of the Median
(mg/L)
Total Solids (TS)
PTA 1 550 541.0 3.1
PTA 2 350 358.0 3.2
Total Suspended Solids (TSS)
PTA 1 50 45.50 0.83
PTA 2 100 97.60 1.11
Total Dissolved Solids (TDS)
PTA 1 500 498.0 4.6
PTA 2 250 260.0 4.1
Overall, the performance of participants in this round was good, with robust CVs below 10% for all analytes.
5
SD 9.17.09
4.2 Analysis of Round 182 Results 4.2.1 Total Solids (TS) Table 2 compares the Total Solids medians and robust CVs from this round to those obtained in previous PTA rounds. The CVs for Total Solids were similar or better than seen in previous rounds. Table 2. Comparison of current round variability and proficiency medians of Total Solids testing with the results of the previous two rounds.
Round Sample Median (mg/L) Robust CV (%) Participants
This study PTA 1 541.0 2.6 33
PTA 2 358.0 4.1 33
Report 892 PTA 1 275.0 6.2 41
PTA 2 435.0 4.0 42
Report 830 PTA 1 371.0 6.2 49
PTA 2 266.0 8.1 49 Bias / Accuracy The Total Solids testing was successfully performed, with satisfactory results (|z-score| ≤ 2.0) ranging between 513 – 569 mg/L for sample PTA 1 and 329 – 387 mg/L for sample PTA 2. Out of 33 participants, three questionable results (2.0 < |z-score| < 3.0) were reported for sample PTA 1 (laboratories 286, 551 and 633) and two questionable results were reported for sample PTA 2 (laboratories 551 and 634). Four outlier results (|z-score| ≥ 3.0) were obtained for sample PTA 1, requiring follow-up action by laboratories 272, 464, 499 and 568. Five outlier results were obtained for sample PTA 2, requiring follow-up action by laboratories 272, 303, 464, 499 and 568. The most likely source of error, causing low bias when testing these proficiency samples, is incomplete transfer of the entire contents of the bottle into the volumetric flask, with rinsing as per the instructions to participants. It is important to rinse the sides of the bottle, the cap, the funnel and the stem of the funnel. Once the entire sample has been transferred, the vessel should be brought to volume and mixed thoroughly. Vigorous shaking for at least thirty seconds will mix the sample, but a magnetic stir bar for 5-10 min will ensure a more homogeneous sample. The Total Solids data set formed an approximately normal distribution with no substantial bias attributable to any one method (Figures 1 and 2). The method most frequently used for Total Solids analysis was APHA 2540 B (Total Solids Dried at 103-105ºC - method code 1), which was used by approximately 64% of participants.

6
SD 9.17.09
Figure 1. Spread of results for Total Solids testing of sample PTA 1, with a median of 541.0 mg/L.
Figure 2. Spread of results for Total Solids testing of sample PTA 2, with a median of 358.0 mg/L.
0
4
8
12
16
20
24
350 375 400 425 450 475 500 525 550 575 600 625 650 675
Fre
quen
cy
Results (mg/L)
Total Solids - Sample PTA 1
APHA 2540 B
US EPA 0160.3
Calculation
Other
Not specified
0
4
8
12
16
20
24
160 190 220 250 280 310 340 370 400 430 460 490 520 550
Fre
quen
cy
Results (mg/L)
Total Solids - Sample PTA 2
APHA 2540 B
US EPA 0160.3
Calculation
Other
Not specified

7
SD 9.17.09
Measurement Uncertainty (MU) The MU reported by participants can be seen in Figures 3 and 4. Out of 33 participants, 23 (70%) submitted MU information. A small number of the stated MUs did not accurately reflect the difference between the median and the participant’s result for these proficiency samples.
Figure 3. MU for Total Solids testing of sample PTA 1, as reported by participants, compared with 95% confidence interval for overall reproducibility, ± 29.5 mg/L in this round, shown as a dashed line. The range of MU for Total Solids was expected to be between 6.1 – 42.3 mg/L (1.1% - 7.8%) for sample PTA 1 and between 6.5 – 44.5 mg/L (1.8% - 12.4%) for sample PTA 2, based on minimum / maximum uncertainty criteria (umin and umax) described in ISO 13528:2015 [2]. Laboratories 323a, 382 and 551 may wish to re-examine their measurement uncertainty for Total Solids testing, as their MU was smaller than the uncertainty of the assigned value (95% CI) for one or more of the samples tested. It is possible that these laboratories have underestimated their MU, particularly in light of the variability expected in natural water samples. It should be noted, however, that the umin and umax are informative indicators only and can not be solely used to validate or invalidate the MUs reported. Of slightly less concern were the laboratories who reported MU that were larger than three times the normalised interquartile range, 3NIQR (Umax), however this can be explained by the unusually tight homogeneity of these artificial solids samples compared to a natural sample which would be expected to have more variability.
0
1
2
3
4
0 7.5 15 22.5 30 37.5 45 52.5 60 67.5 75 82.5 90 97.5
Fre
quen
cy
Measurement Uncertainty (mg/L)
Total Solids ± MU - Sample PTA 1
APHA 2540 B
Calculation
Other
Not Specified
8
SD 9.17.09
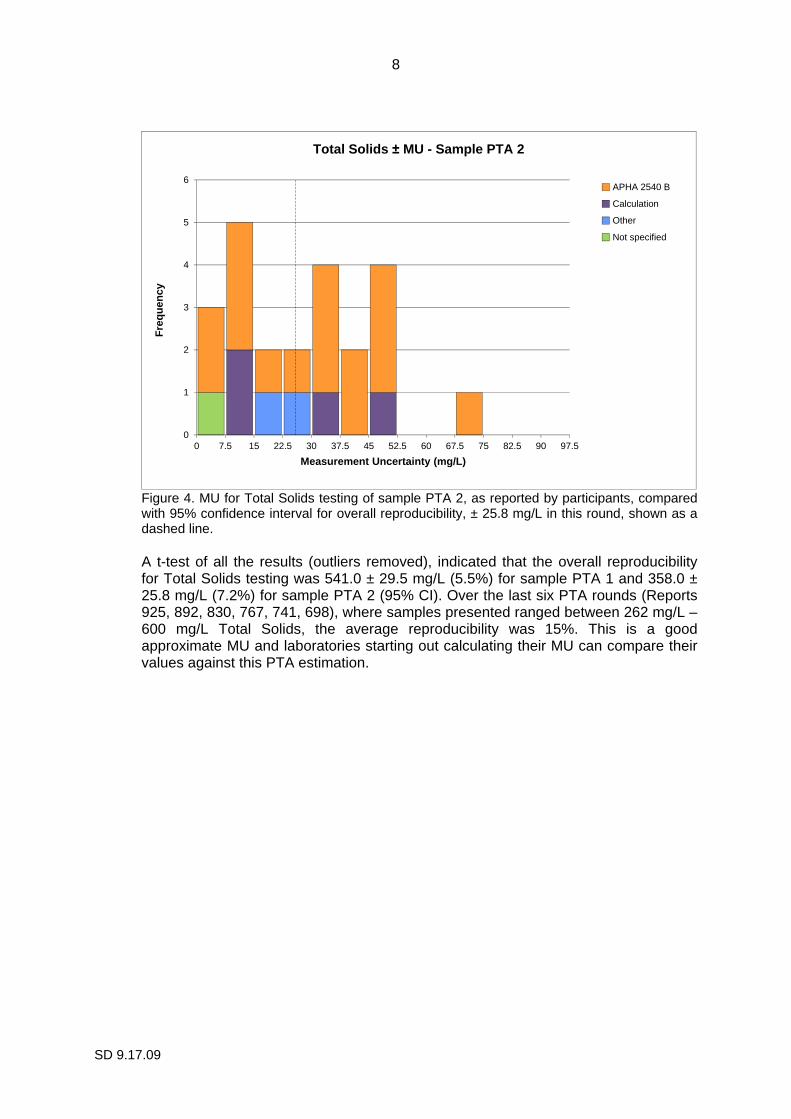
Figure 4. MU for Total Solids testing of sample PTA 2, as reported by participants, compared with 95% confidence interval for overall reproducibility, ± 25.8 mg/L in this round, shown as a dashed line. A t-test of all the results (outliers removed), indicated that the overall reproducibility for Total Solids testing was 541.0 ± 29.5 mg/L (5.5%) for sample PTA 1 and 358.0 ± 25.8 mg/L (7.2%) for sample PTA 2 (95% CI). Over the last six PTA rounds (Reports 925, 892, 830, 767, 741, 698), where samples presented ranged between 262 mg/L – 600 mg/L Total Solids, the average reproducibility was 15%. This is a good approximate MU and laboratories starting out calculating their MU can compare their values against this PTA estimation.
0
1
2
3
4
5
6
0 7.5 15 22.5 30 37.5 45 52.5 60 67.5 75 82.5 90 97.5
Fre
quen
cy
Measurement Uncertainty (mg/L)
Total Solids ± MU - Sample PTA 2
APHA 2540 B
Calculation
Other
Not specified
9
SD
9.17.09
Results of sam
ple PT
A 1, including M
U, com
pared to the m
edian
Total S
olids - Sam
ple PT
A 1
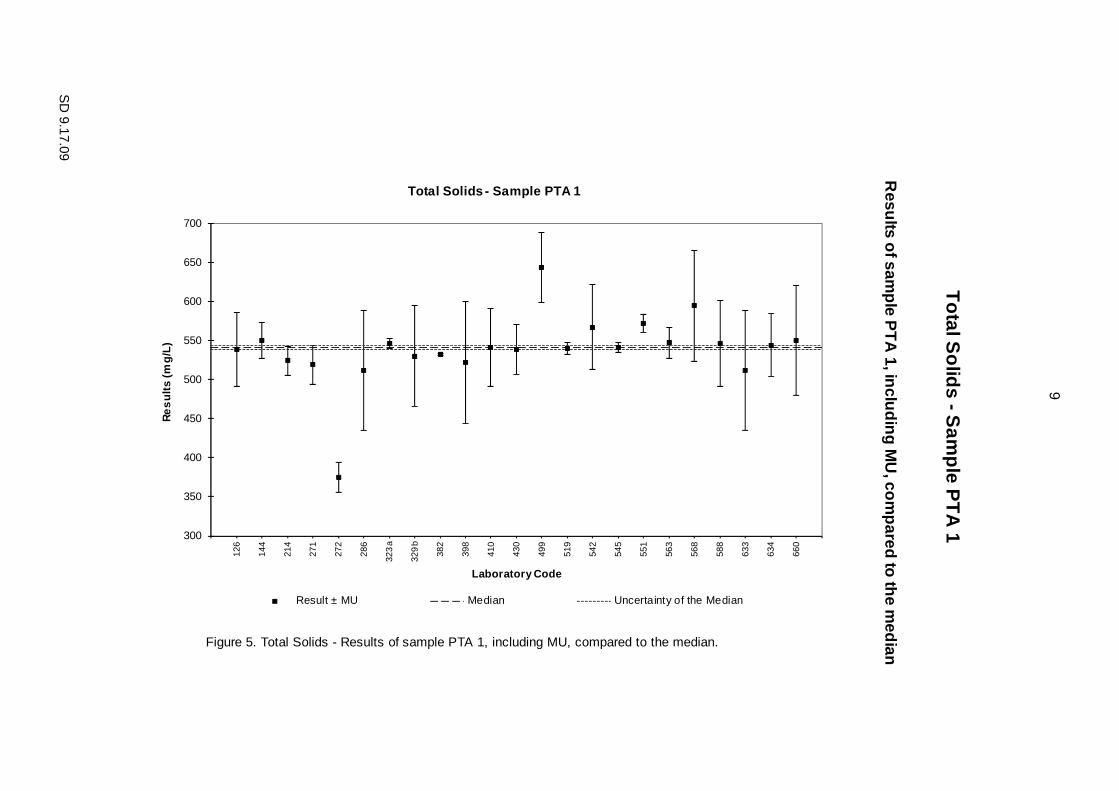
Figure 5. Total Solids - Results of sample PTA 1, including MU, compared to the median.
300
350
400
450
500
550
600
650
70012
6
144
214
271
272
286
323
a
329
b
382
398
410
430
499
519
542
545
551
563
568
588
633
634
660
Re
sults
(mg/
L)
Laboratory Code
Total Solids - Sample PTA 1
Result ± MU Median Uncertainty of the Median

10
SD
9.17.09
Results of sam
ple PT
A 2, including M
U, com
pared to the m
edian
Total S
olids - Sam
ple PT
A 2
Figure 6. Total Solids - Results of sample PTA 2, including MU, compared to the median.
200
250
300
350
400
450
500
55012
6
144
214
271
272
286
323
a
329
b
382
398
410
430
499
519
542
545
551
563
568
588
633
634
660
Re
sults
(mg/
L)
Laboratory Code
Total Solids - Sample PTA 2
Result ± MU Median Uncertainty of the Median

11
SD 9.17.09
4.2.2 Total Suspended Solids (TSS) Table 3 compares the Total Suspended Solids medians and robust CVs from this round to those obtained in previous PTA rounds. The variability of results in this round was similar to those seen in previous rounds. Table 3. Comparison of current round variability and proficiency median of Total Suspended Solids testing with the results of the previous two rounds.
Round Sample Median (mg/L) Robust CV (%) Participants
This study PTA 1 45.50 9.8 45
PTA 2 97.60 6.1 45
Report 892 PTA 1 66.00 6.1 54
PTA 2 82.00 6.3 55
Report 830 PTA 1 70.00 9.3 68
PTA 2 48.00 9.3 68 Bias / Accuracy The Total Suspended Solids testing was successfully performed, with satisfactory results (|z-score| ≤ 2.0) ranging between 36.7 – 54.3 mg/L for sample PTA 1 and 85.8 – 109.4 mg/L for sample PTA 2. Out of 45 participants, two questionable results (2.0 < |z-score| < 3.0) were reported for sample PTA 1 (laboratories 688 and 699) and two questionable results were reported for sample PTA 2 (laboratories 329b and 590). Six outlier results (|z-score| ≥ 3.0) were obtained for sample PTA 1, requiring follow-up action by laboratories 329b, 410, 475, 545, 551 and 572. Two outlier results were obtained for sample PTA 2, requiring follow-up action by laboratories 475 and 634. For those laboratories having difficulties with their Total Suspended Solids testing, APHA [3] recommends method blanks using the dilution water and duplicate analyses to be carried out. Duplicate determinations should agree within 5% of their average weight. If the technique used by laboratories involves pipetting a measured volume onto the seated glass-fibre filter, APHA [3] recommends pipetting from the approximate midpoint of the container but not in the vortex created by the magnetic stirrer, to get a more homogeneous sample. Subsampling is a major source of error in this testing. Laboratories whose results biased low on the suspended solids test and high on the dissolved solids test may have used a filter with pores that were larger than those used by other laboratories, allowing a greater proportion of the finer solids particles to pass through the filter. Filter pore sizes used by laboratories ranged between 0.45 – 2.0 µm and the median was 1.2 µm. Nearly half of laboratories who stated their filter brand were using Whatman. Others included Advantec, Merck Millipore, MicroScience, Pall and Sartorius filters. The Total Suspended Solids data set formed an approximately normal distribution with no substantial bias attributable to any one method (Figures 7 and 8). The method

12
SD 9.17.09
most frequently used for Total Suspended Solids analysis was APHA 2540 D (Total Suspended Solids Dried at 103-105ºC - method code 5), which was used by approximately 80% of participants.
Figure 7. Spread of results for Total Suspended Solids testing of sample PTA 1, with a median of 45.50 mg/L.
Figure 8. Spread of results for Total Suspended Solids testing of sample PTA 2, with a median of 97.60 mg/L.
0
4
8
12
16
20
24
3 8 13 18 23 28 33 38 43 48 53 58 63 68
Fre
quen
cy
Results (mg/L)
Total Suspended Solids - Sample PTA 1
APHA 2540 D
US EPA 0160.2
Other
Not specified
0
4
8
12
16
20
24
40 47.5 55 62.5 70 77.5 85 92.5 100 107.5 115 122.5 130 137.5
Fre
quen
cy
Results (mg/L)
Total Suspended Solids - Sample PTA 2
APHA 2540 D
US EPA 0160.2
Other
Not specified

13
SD 9.17.09
Measurement Uncertainty (MU) The MU reported by participants can be seen in Figures 9 and 10. Out of 45 participants, 34 (76%) submitted MU information. Half of participants’ stated MUs did not accurately reflect the difference between the median and the participant’s result for these proficiency samples.
Figure 9. MU for Total Suspended Solids testing of sample PTA 1, as reported by participants, compared with 95% confidence interval for overall reproducibility, ± 8.43 mg/L in this round, shown as a dashed line. The range of MU for Total Suspended Solids was expected to be between 1.7 – 13.3 mg/L (3.6% - 29.3%) for sample PTA 1 and between 2.2 – 17.8 mg/L (2.3% - 18.2%) for sample PTA 2, based on minimum / maximum uncertainty criteria (umin and umax) described in ISO 13528:2015 [2]. Laboratories 274, 382, 412, 498, 499, 519, 551 and 674 may wish to re-examine their measurement uncertainty for Total Suspended Solids testing, as their MU was smaller than the uncertainty of the assigned value (95% CI) for one or more of the samples tested. It is possible that these laboratories have underestimated their MU. An MU of less than 3.6% for sample PTA 1 and less than 2.3% for sample PTA 2 is unlikely to be appropriate for natural waters samples and may have been calculated from repeatability standard deviations (SDr) rather than reproducibility (SDR). The SDR accounts for much more of the variability inherent in this test. It should be noted, however, that the umin and umax are informative indicators only and can not be solely used to validate or invalidate the MUs reported. Laboratory 310 reported an MU of ±70 mg/L, which was much greater than three times the normalised interquartile range, 3NIQR (the recommended Umax) and requires investigation by this laboratory, although it may have simply been a transcription error.
0
1
2
3
4
5
6
7
0 1 2 3 4 5 6 7 8 9 10 11 12 13
Fre
quen
cy
Measurement Uncertainty (mg/L)
Total Suspended Solids ± MU - Sample PTA 1
APHA 2540 D
Other
Not specified

14
SD 9.17.09
Figure 10. MU for Total Suspended Solids testing of sample PTA 2, as reported by participants, compared with 95% confidence interval for overall reproducibility, ± 11.83 mg/L in this round, shown as a dashed line. A t-test of all the results (outliers removed), indicated that the overall reproducibility for Total Suspended Solids testing was 45.50 ± 8.43 mg/L (18.5%) for sample PTA 1 and 97.60 ± 11.83 mg/L (12.1%) for sample PTA 2 (95% CI). Over the last six PTA rounds (Reports 925, 892, 830, 767, 698, 621), where samples presented ranged between 42 mg/L – 251 mg/L Total Suspended Solids, the average reproducibility was 22%. This is a good approximate MU and laboratories starting out calculating their MU can compare their values against this PTA estimation.
0
1
2
3
4
5
6
7
8
9
0 2 4 6 8 10 12 14 16 18 20 22 24 26
Fre
quen
cy
Measurement Uncertainty (mg/L)
Total Suspended Solids ± MU - Sample PTA 2
APHA 2540 D
Other
Not specified
<
15
SD
9.17.09
Results of sam
ple PT
A 1, including M
U, com
pared to the m
edian
Total S
uspended Solids - S
ample P
TA
1
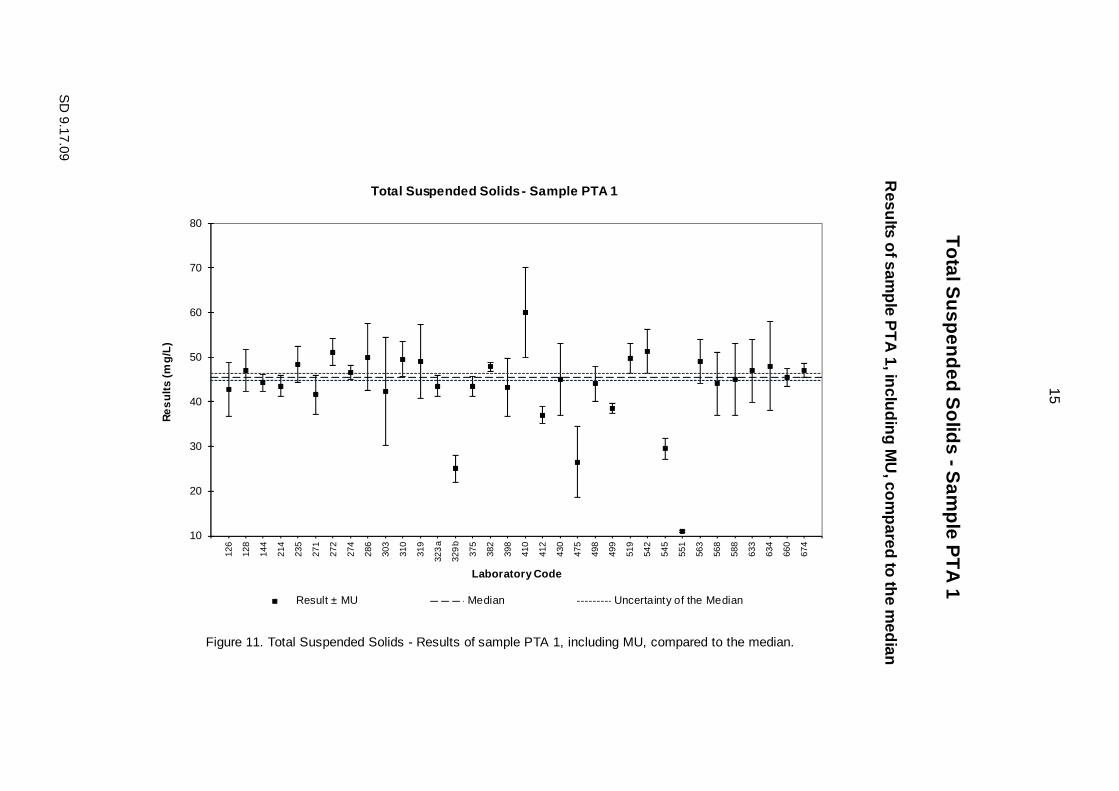
Figure 11. Total Suspended Solids - Results of sample PTA 1, including MU, compared to the median.
10
20
30
40
50
60
70
8012
6
128
144
214
235
271
272
274
286
303
310
319
323
a
329
b
375
382
398
410
412
430
475
498
499
519
542
545
551
563
568
588
633
634
660
674
Re
sults
(mg/
L)
Laboratory Code
Total Suspended Solids - Sample PTA 1
Result ± MU Median Uncertainty of the Median

16
SD
9.17.09
Results of sam
ple PT
A 2, including M
U, com
pared to the m
edian
Total S
uspended Solids - S
ample P
TA
2
Figure 12. Total Suspended Solids - Results of sample PTA 2, including MU, compared to the median.
30
40
50
60
70
80
90
100
110
120
130
140
150
160
170
18012
6
128
144
214
235
271
272
274
286
303
310
319
323
a
329
b
375
382
398
410
412
430
475
498
499
519
542
545
551
563
568
588
633
634
660
674
Re
sults
(mg/
L)
Laboratory Code
Total Suspended Solids - Sample PTA 2
Result ± MU Median Uncertainty of the Median

17
SD 9.17.09
4.2.3 Total Dissolved Solids (TDS) Table 4 compares the Total Dissolved Solids medians and robust CVs from this round to those obtained in previous PTA rounds. The variability of results this round was comparable to those seen in previous rounds. Table 4. Comparison of current round variability and proficiency median of Total Dissolved Solids testing with the results of the previous two rounds.
Round Sample Median (mg/L) Robust CV (%) Participants
This study PTA 1 498.0 4.5 37
PTA 2 260.0 7.7 37
Report 892 PTA 1 208.0 6.3 48
PTA 2 356.0 6.3 48
Report 830 PTA 1 304.0 7.2 55
PTA 2 220.0 8.4 55 Bias / Accuracy The Total Dissolved Solids testing was successfully performed, with satisfactory results (|z-score| ≤ 2.0) ranging between 454 – 542 mg/L for sample PTA 1 and 220 – 300 mg/L for sample PTA 2. Out of 37 participants, five questionable results (2.0 < |z-score| < 3.0) were reported for sample PTA 1 (laboratories 128, 464, 551, 568 and 572) and one questionable result was reported for sample PTA 2 (laboratory 412). Two outlier results (|z-score| ≥ 3.0) were obtained for sample PTA 1, requiring follow-up action by laboratories 272 and 499. Four outlier results (|z-score| ≥ 3.0) were obtained for sample PTA 2, requiring follow-up action by laboratories 272, 464, 499 and 568. For laboratories having difficulties with their Total Dissolved Solids testing, it is important to recognise that the drying time required in the method is sensitive to the composition of the sample. Samples with a high mineral concentration can absorb moisture and will require an extended drying time, and must be weighed quickly to ensure that moisture from the air does not affect the result (i.e. storing in a desiccator until the sample reaches room temperature prior to weighing). Adding successive aliquots of the sample until a final yield of between 2.5 – 200mg of dried residue is achieved and repeating the cycle of drying, cooling, desiccating and weighing until a constant weight is obtained or until the weight change is less than 4% of the previous weight; will help to improve the accuracy and precision of test results. The Total Dissolved Solids data set formed an approximately normal distribution with no substantial bias attributable to any one method (Figures 13 and 14). The method most frequently used for Total Dissolved Solids analysis was APHA 2540 C (Total Dissolved Solids Dried at 180ºC - method code 8), which was used by approximately 73% of participants.

18
SD 9.17.09
Figure 13. Spread of results for Total Dissolved Solids testing of sample PTA 1, with a median of 498.0 mg/L.
Figure 14. Spread of results for Total Dissolved Solids testing of sample PTA 2, with a median of 260.0 mg/L.
0
2
4
6
8
10
12
14
16
305 330 355 380 405 430 455 480 505 530 555 580 605 630
Fre
quen
cy
Results (mg/L)
Total Dissolved Solids - Sample PTA 1
APHA 2540 C
US EPA 0160.1
Calculation
Conductivity
Other
Not specified
0
4
8
12
16
20
75 100 125 150 175 200 225 250 275 300 325 350 375 400
Fre
quen
cy
Results (mg/L)
Total Dissolved Solids - Sample PTA 2
APHA 2540 C
US EPA 0160.1
Calculation
Conductivity
Other
Not specified

19
SD 9.17.09
Measurement Uncertainty (MU) The MU reported by participants can be seen in Figures 15 and 16. Out of 37 participants, 27 (73%) submitted MU information. Many of the stated MUs (48%) did not accurately reflect the difference between the median and the participant’s result for these proficiency samples.
Figure 15. MU for Total Dissolved Solids testing of sample PTA 1, as reported by participants, compared with 95% confidence interval for overall reproducibility, ± 53.8 mg/L in this round, shown as a dashed line. The range of MU for Total Dissolved Solids was expected to be between 9.1 – 66.7 mg/L (1.8% - 13.4%) for sample PTA 1 and between 8.2 – 60.0 mg/L (3.2% - 23.1%) for sample PTA 2, based on minimum / maximum uncertainty criteria (umin and umax) described in ISO 13528:2015 [2]. Laboratories 272, 310, 323a, 382, 412, 519, 545 and 551 may wish to re-examine their measurement uncertainty for Total Dissolved Solids testing, as their MU was smaller than the uncertainty of the assigned value (95% CI) for one or more of the samples tested. It is possible that these laboratories have underestimated their MU, particularly in light of the variability expected in natural water samples. It should be noted, however, that the umin and umax are informative indicators only and can not be solely used to validate or invalidate the MUs reported. Of slightly less concern were the laboratories who reported MU larger than three times the normalised interquartile range, 3NIQR (Umax), (Laboratories 286, 398, 633, 660), however this can be explained by the unusually tight homogeneity of these artificial solids samples compared to a natural sample, which would be expected to have more variability. Only laboratory 660 reported an unusually high fixed MU (90.0 mg/L) and may wish to re-examine their measurement uncertainty calculations (Figure 16). Most laboratories used MU values proportional to their results.
0
1
2
3
4
5
0 7.5 15 22.5 30 37.5 45 52.5 60 67.5 75 82.5 90 97.5
Fre
quen
cy
Measurement Uncertainty (mg/L)
Total Dissolved Solids ± MU - Sample PTA 1
APHA 2540 C
Calculation
Conductivity
Other
Not specified

20
SD 9.17.09
Figure 16. MU for Total Dissolved Solids testing of sample PTA 2, as reported by participants, compared with 95% confidence interval for overall reproducibility, ± 34.3 mg/L in this round, shown as a dashed line. A t-test of all the results (outliers removed), indicated that the overall reproducibility for Total Dissolved Solids testing was 498.0 ± 53.8 mg/L (10.8%) for sample PTA 1 and 260.0 ± 34.3 mg/L (13.2%) for sample PTA 2 (95% CI). Over the last six PTA rounds (Reports 925, 892, 830, 767, 741, 698), where samples presented ranged between 199 mg/L – 498 mg/L Total Dissolved Solids, the average reproducibility was 19%. This is a good approximate MU and laboratories starting out calculating their MU can compare their values against this PTA estimation.
0
1
2
3
4
5
6
7
8
9
10
0 7.5 15 22.5 30 37.5 45 52.5 60 67.5 75 82.5 90 97.5
Fre
quen
cy
Measurement Uncertainty (mg/L)
Total Dissolved Solids ± MU - Sample PTA 2
APHA 2540 C
Calculation
Conductivity
Other
Not specified

21
SD
9.17.09
Results of sam
ple PT
A 1, including M
U, com
pared to the m
edian
Total D
issolved Solids - S
ample P
TA
1
Figure 17. Total Dissolved Solids - Results of sample PTA 1, including MU, compared to the median.
300
350
400
450
500
550
600
65012
6
128
144
214
271
272
274
286
310
323
a
329
b
375
382
398
410
412
430
499
519
542
545
551
563
568
588
633
660
Re
sults
(mg/
L)
Laboratory Code
Total Dissolved Solids - Sample PTA 1
Result ± MU Median Uncertainty of the Median

22
SD
9.17.09
Results of sam
ple PT
A 2, including M
U, com
pared to the m
edian
Total D
issolved Solids - S
ample P
TA
2
Figure 18. Total Dissolved Solids - Results of sample PTA 2, including MU, compared to the median.
100
150
200
250
300
350
40012
6
128
144
214
271
272
274
286
310
323
a
329
b
375
382
398
410
412
430
499
519
542
545
551
563
568
588
633
660
Re
sults
(mg/
L)
Laboratory Code
Total Dissolved Solids - Sample PTA 2
Result ± MU Median Uncertainty of the Median
23
SD 9.17.09
4.3 Analysis of Results by Method Groups
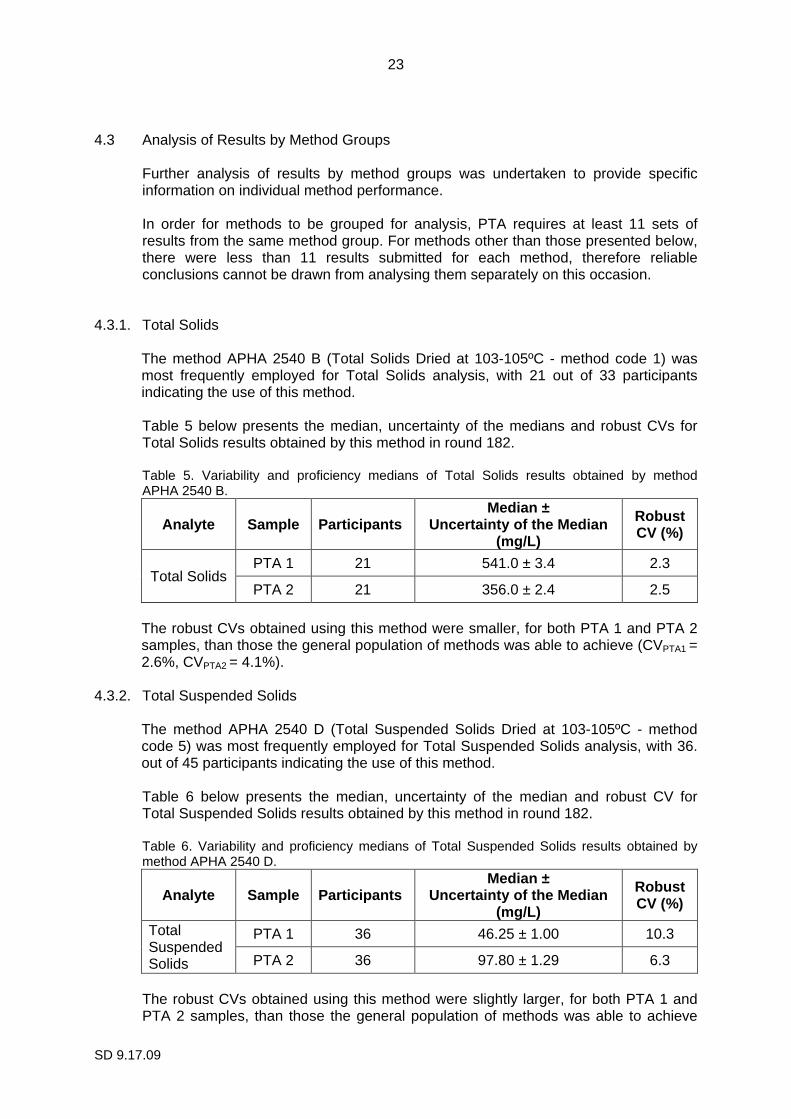
Further analysis of results by method groups was undertaken to provide specific information on individual method performance. In order for methods to be grouped for analysis, PTA requires at least 11 sets of results from the same method group. For methods other than those presented below, there were less than 11 results submitted for each method, therefore reliable conclusions cannot be drawn from analysing them separately on this occasion.
4.3.1. Total Solids
The method APHA 2540 B (Total Solids Dried at 103-105ºC - method code 1) was most frequently employed for Total Solids analysis, with 21 out of 33 participants indicating the use of this method. Table 5 below presents the median, uncertainty of the medians and robust CVs for Total Solids results obtained by this method in round 182. Table 5. Variability and proficiency medians of Total Solids results obtained by method APHA 2540 B.
Analyte Sample Participants Median ±
Uncertainty of the Median (mg/L)
Robust CV (%)
Total Solids PTA 1 21 541.0 ± 3.4 2.3
PTA 2 21 356.0 ± 2.4 2.5
The robust CVs obtained using this method were smaller, for both PTA 1 and PTA 2 samples, than those the general population of methods was able to achieve (CVPTA1 = 2.6%, CVPTA2 = 4.1%).
4.3.2. Total Suspended Solids
The method APHA 2540 D (Total Suspended Solids Dried at 103-105ºC - method code 5) was most frequently employed for Total Suspended Solids analysis, with 36. out of 45 participants indicating the use of this method. Table 6 below presents the median, uncertainty of the median and robust CV for Total Suspended Solids results obtained by this method in round 182. Table 6. Variability and proficiency medians of Total Suspended Solids results obtained by method APHA 2540 D.
Analyte Sample Participants Median ±
Uncertainty of the Median (mg/L)
Robust CV (%)
Total Suspended Solids
PTA 1 36 46.25 ± 1.00 10.3
PTA 2 36 97.80 ± 1.29 6.3
The robust CVs obtained using this method were slightly larger, for both PTA 1 and PTA 2 samples, than those the general population of methods was able to achieve

24
SD 9.17.09
(CVPTA1 = 9.8%, CVPTA2 = 6.1%), however, these CVs were better than those published in APHA (242 mg/L, CV=10%; and 15 mg/L, CV=33%).
4.3.3. Total Dissolved Solids
The method APHA 2540 C (Total Dissolved Solids Dried at 180ºC - method code 8) was most frequently employed for Total Dissolved Solids analysis, with 27 out of 37 participants indicating the use of this method. Table 7 below presents the median, uncertainty of the median and robust CV for Total Suspended Solids results obtained by this method in round 182. The robust CVs obtained using this method were equal to or better than those the general population of methods was able to achieve (CVPTA1 = 4.5%, CVPTA2 = 7.7%). Table 7. Variability and proficiency medians of Total Dissolved Solids results obtained by method APHA 2540 C.
Analyte Sample Participants Median ±
Uncertainty of the Median (mg/L)
Robust CV (%)
Total Suspended Solids
PTA 1 27 489.0 ± 5.3 4.5
PTA 2 27 260.0 ± 4.0 6.4

25
SD 9.17.09
5. Outlier Results
Laboratories reporting results that have been identified as outliers are listed in Table 8 below. Table 8. Laboratory results identified as outliers for each analysis performed.
Lab Code
Analysis
Total Solids Total Suspended Solids
Total Dissolved Solids
PTA 1 PTA 2 PTA 1 PTA 2 PTA 1 PTA 2
272 § § § §
303 §
329b §
410 §
464 § § §
475 § §
499 § § § §
545 §
551 §
568 § § §
572 §
634 §
Note: 1. A “§” indicates the occurrence of a z-score outlier result (i.e. those results for which
|z-score| ≥ 3.0).
6. References
[1] Guide to Proficiency Testing Australia, 2014 (This document can be found on the PTA website, www.pta.asn.au).
[2] ISO 13528:2015 Statistical methods for use in proficiency testing by
interlaboratory comparisons. [3] Standard Methods For the Examination of Water and Wastewater, 2012.
Published by APHA, AWWA, WEF (22nd Edition).
SD 9.17.09
APPENDIX A
Results and Data Analysis Total Solids ............................................................................................................................ A1
Total Suspended Solids ........................................................................................................ A7
Total Dissolved Solids ......................................................................................................... A13

SD 9.17.09
Total Solids Results
Samples PTA 1 and PTA 2

A1
SD 9.17.09
Total Solids
Results by Laboratory Code
Lab Code
Sample PTA 1
Result ± MU1 (mg/L)
Robust z-score2
Method Code3
117 550 # 0.64 1
126 538 ± 47 -0.21 1
144 550 ± 23 0.64 1
196 562 # 1.49 2
214 524 ± 18.3 -1.21 1
271 519 ± 25 -1.56 4
272 375 ± 19 -11.79 § 3
274 529 # -0.85 3
286 512 ± 76.8 -2.06 1
303 543.0 # 0.14 4
323a 546 ± 6.17 0.35 #
329b 530 ± 64 -0.78 1
362 531 # -0.71 3
382 532 ± 1 -0.64 1
398 522 ± 78.3 -1.35 1
410 541 ± 50 0.00 1
430 538 ± 32 -0.21 4
464 481 # -4.26 § 1
475 547 # 0.43 1
499 643 ± 45 7.24 § 3
519 540 ± 7.629 -0.07 1
542 567 ± 54 1.85 1
545 541 ± 6 0.00 1
551 572 ± 2% 2.20 3
563 547 ± 20 0.43 1
568 594 ± 71 3.76 § 3
588 546 ± 55 0.35 1 1 Where reported, results are shown with their corresponding
measurement uncertainty (MU). 2 "§" denotes an outlier (i.e. those results for which |z-score| ≥ 3.0).
Robust z-scores are calculated as: z = (A - median) ÷ normalised IQR, where A is the participant laboratory's result.
3 Please refer to Appendix C (page C3) for method code descriptions.

A2
SD 9.17.09
Total Solids - cont.
Results by Laboratory Code
Lab Code
Sample PTA 1
Result ± MU1 (mg/L)
Robust z-score2
Method Code3
590 549 # 0.57 1
633 512 ± 76.8 -2.06 1
634 544 ± 40 0.21 1
660 550 ± 70.0 0.64 1
688 540 # -0.07 1
699 535 # -0.43 4
No of Results: 33
Median: 541.0
Normalised IQR:
14.1
Uncertainty of the Median:
3.1
Robust CV: 2.6%
Minimum: 375
Maximum: 643
Range: 268
1 Where reported, results are shown with their corresponding
measurement uncertainty (MU).
2 "§" denotes an outlier (i.e. those results for which |z-score| ≥ 3.0). Robust z-scores are calculated as: z = (A - median) ÷ normalised IQR, where A is the participant laboratory's result.
3 Please refer to Appendix C (page C3) for method code descriptions.

SD 9.17.09
Total Solids - Sample PTA 1 - Robust Z-Scores
Ordered R
obust Z-S
core Charts
Total S
olids - Sam
ple PT
A 1
A3
Robust Z-Scores
272 46
4
286
633 27
1
398
214 27
4
329b 36
2
382
699
126
430
519
688
-5
-4
-3
-2
-1
0
1
2
3
4
5z-
scor
e
lab code
-5
-4
-3
-2
-1
0
1
2
3
4
5
z-sc
ore
lab code

A4
SD 9.17.09
Total Solids
Results by Laboratory Code
Lab Code
Sample PTA 2
Result ± MU1 (mg/L)
Robust z-score2
Method Code3
117 370 # 0.81 1
126 356 ± 31 -0.13 1
144 368 ± 15 0.67 1
196 381 # 1.55 2
214 357 ± 12.3 -0.07 1
271 343 ± 25 -1.01 4
272 251 ± 13 -7.22 § 3
274 361 # 0.20 3
286 347 ± 52.1 -0.74 1
303 451.0 # 6.27 § 4
323a 361 ± 4.08 0.20 #
329b 349 ± 42 -0.61 1
362 365 # 0.47 3
382 353 ± 1 -0.34 1
398 340 ± 51.0 -1.21 1
410 346 ± 30 -0.81 1
430 354 ± 21 -0.27 4
464 176 # -12.28 § 1
475 356 # -0.13 1
499 503 ± 35 9.78 § 3
519 363 ± 7.897 0.34 1
542 360 ± 34 0.13 1
545 357 ± 6 -0.07 1
551 390 ± 2% 2.16 3
563 361 ± 20 0.20 1
568 426 ± 51 4.59 § 3
588 358 ± 36 0.00 1 1 Where reported, results are shown with their corresponding
measurement uncertainty (MU). 2 "§" denotes an outlier (i.e. those results for which |z-score| ≥ 3.0).
Robust z-scores are calculated as: z = (A - median) ÷ normalised IQR, where A is the participant laboratory's result.
3 Please refer to Appendix C (page C3) for method code descriptions.

A5
SD 9.17.09
Total Solids - cont.
Results by Laboratory Code
Lab Code
Sample PTA 2
Result ± MU1 (mg/L)
Robust z-score2
Method Code3
590 369 # 0.74 1
633 349 ± 52.4 -0.61 1
634 328 ± 40 -2.02 1
660 354 ± 70.0 -0.27 1
688 371 # 0.88 1
699 370 # 0.81 4
No of Results: 33
Median: 358.0
Normalised IQR:
14.8
Uncertainty of the Median:
3.2
Robust CV: 4.1%
Minimum: 176
Maximum: 503
Range: 327
1 Where reported, results are shown with their corresponding
measurement uncertainty (MU).
2 "§" denotes an outlier (i.e. those results for which |z-score| ≥ 3.0). Robust z-scores are calculated as: z = (A - median) ÷ normalised IQR, where A is the participant laboratory's result.
3 Please refer to Appendix C (page C3) for method code descriptions.

SD 9.17.09
Total Solids - Sample PTA 2 - Robust Z-Scores
Ordered R
obust Z-S
core Charts
Total S
olids - Sam
ple PT
A 2
A6
Robust Z-Scores
464
272
634 39
8
271
410
286
329b 63
3
382
430
660
126
475
214
545
-5
-4
-3
-2
-1
0
1
2
3
4
5
z-sc
ore
lab code
-5
-4
-3
-2
-1
0
1
2
3
4
5
z-sc
ore
lab code

SD 9.17.09
Total Suspended Solids Results
Samples PTA 1 and PTA 2

A7
SD 9.17.09
Total Suspended Solids
Results by Laboratory Code
Lab Code
Sample PTA 1
Result ± MU1 (mg/L)
Robust z-score2
Method Code3
117 50 # 1.01 5
126 42.8 ± 6 -0.61 5
128 47 ± 4.70 0.34 5
144 44.3 ± 1.9 -0.27 5
196 43 # -0.56 6
214 43.5 ± 2.4 -0.45 5
235 48.3 ± 4 0.63 5
243 48 # 0.56 #
271 41.6 ± 4.4 -0.88 7
272 51.1 ± 3 1.26 5
274 46.5 ± 1.54 0.22 5
286 50.0 ± 7.50 1.01 5
303 42.3 ± 12.00 -0.72 5
310 49.5 ± 3.91 0.90 5
319 49.0 ± 8.2 0.79 7
323a 43.5 ± 2.34 -0.45 #
329b 25 ± 3 -4.61 § 5
362 52.0 # 1.46 5
375 43.5 ± 2.2 -0.45 5
382 47.8 ± 1 0.52 5
398 43.3 ± 6.50 -0.49 5
410 60 ± 10 3.26 § 5
412 37 ± 5.0% -1.91 5
430 45 ± 8 -0.11 7
464 47 # 0.34 5
474 44.7 # -0.18 7
475 26.5 ± 8.0 -4.27 § 5 1 Where reported, results are shown with their corresponding
measurement uncertainty (MU). 2 "§" denotes an outlier (i.e. those results for which |z-score| ≥ 3.0).
Robust z-scores are calculated as: z = (A - median) ÷ normalised IQR, where A is the participant laboratory's result.
3 Please refer to Appendix C (page C3) for method code descriptions.

A8
SD 9.17.09
Total Suspended Solids - cont.
Results by Laboratory Code
Lab Code
Sample PTA 1
Result ± MU1 (mg/L)
Robust z-score2
Method Code3
498 44 ± 4 -0.34 #
499 38.5 ± 1.2 -1.57 5
517 50.3 # 1.08 5
519 49.7 ± 3.42 0.94 5
542 51.2 ± 4.9 1.28 5
545 29.5 ± 2.4 -3.60 § 5
551 11.0 ± 2% -7.76 § 5
563 49 ± 5 0.79 5
568 44.0 ± 7 -0.34 5
572 31.8 # -3.08 § 5
588 45 ± 8 -0.11 5
590 46.0 # 0.11 5
633 47.0 ± 7.05 0.34 5
634 48.0 ± 10 0.56 5
660 45.5 ± 2.00 0.00 5
674 47.0 ± 1.5 0.34 5
688 34.0 # -2.59 5
699 55 # 2.14 7
No of Results: 45
Median: 45.50
Normalised IQR:
4.45
Uncertainty of the Median:
0.83
Robust CV: 9.8%
Minimum: 11.0
Maximum: 60
Range: 49.0
1 Where reported, results are shown with their corresponding
measurement uncertainty (MU).
2 "§" denotes an outlier (i.e. those results for which |z-score| ≥ 3.0). Robust z-scores are calculated as: z = (A - median) ÷ normalised IQR, where A is the participant laboratory's result.
3 Please refer to Appendix C (page C3) for method code descriptions.

SD 9.17.09
Total Suspended Solids - Sample PTA 1 - Robust Z-Sc ores
Ordered R
obust Z-S
core Charts
Total S
uspended Solids - S
ample P
TA
1
A9
Robust Z-Scores
551
329b 47
5 545 57
2 688 41
2 499 27
1
303
126
196
398
214
323a 37
5
498
568
144
474
430
588
-5
-4
-3
-2
-1
0
1
2
3
4
5z-
scor
e
lab code
-5
-4
-3
-2
-1
0
1
2
3
4
5
z-sc
ore
lab code

A10
SD 9.17.09
Total Suspended Solids
Results by Laboratory Code
Lab Code
Sample PTA 2
Result ± MU1 (mg/L)
Robust z-score2
Method Code3
117 105 # 1.25 5
126 95.5 ± 9 -0.35 5
128 100 ± 10.0 0.40 5
144 97.6 ± 4.1 0.00 5
196 93 # -0.78 6
214 94.0 ± 5.2 -0.61 5
235 96.5 ± 7 -0.19 5
243 98 # 0.07 #
271 95.5 ± 4.4 -0.35 7
272 105 ± 5 1.25 5
274 101 ± 3.32 0.57 5
286 103 ± 15.5 0.91 5
303 91.3 ± 12 -1.06 5
310 105 ± 70 1.25 5
319 104 ± 17.3 1.08 7
323a 92.4 ± 4.60 -0.88 #
329b 80 ± 9 -2.97 5
362 98.0 # 0.07 5
375 102 ± 5.1 0.74 5
382 99.5 ± 1 0.32 5
398 92.7 ± 13.9 -0.83 5
410 104 ± 10 1.08 5
412 95 ± 5.0% -0.44 5
430 95 ± 17 -0.44 7
464 98 # 0.07 5
474 100 # 0.40 7
475 42.0 ± 8.0 -9.38 § 5 1 Where reported, results are shown with their corresponding
measurement uncertainty (MU). 2 "§" denotes an outlier (i.e. those results for which |z-score| ≥ 3.0).
Robust z-scores are calculated as: z = (A - median) ÷ normalised IQR, where A is the participant laboratory's result.
3 Please refer to Appendix C (page C3) for method code descriptions.

A11
SD 9.17.09
Total Suspended Solids - cont.
Results by Laboratory Code
Lab Code
Sample PTA 2
Result ± MU1 (mg/L)
Robust z-score2
Method Code3
498 99 ± 1 0.24 #
499 91 ± 3 -1.11 5
517 94.9 # -0.46 5
519 102 ± 1.20 0.74 5
542 107 ± 10 1.59 5
545 86.5 ± 2.4 -1.87 5
551 93.0 ± 2% -0.78 5
563 101 ± 5 0.57 5
568 98.0 ± 15 0.07 5
572 94.2 # -0.57 5
588 96 ± 17 -0.27 5
590 110 # 2.09 5
633 91.0 ± 13.6 -1.11 5
634 73.2 ± 10 -4.11 § 5
660 100 ± 10.0 0.40 5
674 101 ± 3 0.57 5
688 87.0 # -1.79 5
699 95 # -0.44 7
No of Results: 45
Median: 97.60
Normalised IQR:
5.93
Uncertainty of the Median:
1.11
Robust CV: 6.1%
Minimum: 42.0
Maximum: 110
Range: 68.0
1 Where reported, results are shown with their corresponding
measurement uncertainty (MU).
2 "§" denotes an outlier (i.e. those results for which |z-score| ≥ 3.0). Robust z-scores are calculated as: z = (A - median) ÷ normalised IQR, where A is the participant laboratory's result.
3 Please refer to Appendix C (page C3) for method code descriptions.

SD 9.17.09
Total Suspended Solids - Sample PTA 2 - Robust Z-Sc ores
Ordered R
obust Z-S
core Charts
Total S
uspended Solids - S
ample P
TA
2
A12
Robust Z-Scores
475 63
4 329b
545
688 49
9
633
303
323a 39
8
196
551
214
572
517
412
430
699
126
271
588
235
-5
-4
-3
-2
-1
0
1
2
3
4
5
z-sc
ore
lab code
-5
-4
-3
-2
-1
0
1
2
3
4
5
z-sc
ore
lab code

SD 9.17.09
Total Dissolved Solids Results
Samples PTA 1 and PTA 2
A13
SD 9.17.09
Total Dissolved Solids
Results by Laboratory Code
Lab Code
Sample PTA 1
Result ± MU1 (mg/L)
Robust z-score2
Method Code3
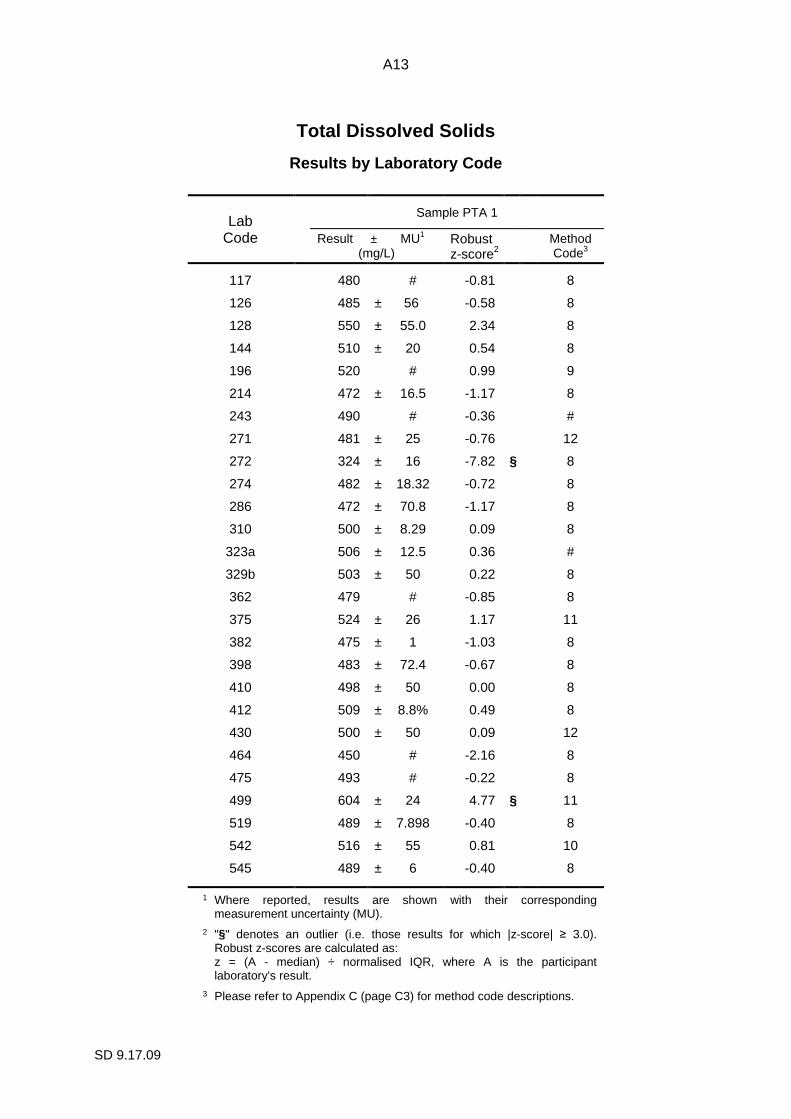
117 480 # -0.81 8
126 485 ± 56 -0.58 8
128 550 ± 55.0 2.34 8
144 510 ± 20 0.54 8
196 520 # 0.99 9
214 472 ± 16.5 -1.17 8
243 490 # -0.36 #
271 481 ± 25 -0.76 12
272 324 ± 16 -7.82 § 8
274 482 ± 18.32 -0.72 8
286 472 ± 70.8 -1.17 8
310 500 ± 8.29 0.09 8
323a 506 ± 12.5 0.36 #
329b 503 ± 50 0.22 8
362 479 # -0.85 8
375 524 ± 26 1.17 11
382 475 ± 1 -1.03 8
398 483 ± 72.4 -0.67 8
410 498 ± 50 0.00 8
412 509 ± 8.8% 0.49 8
430 500 ± 50 0.09 12
464 450 # -2.16 8
475 493 # -0.22 8
499 604 ± 24 4.77 § 11
519 489 ± 7.898 -0.40 8
542 516 ± 55 0.81 10
545 489 ± 6 -0.40 8 1 Where reported, results are shown with their corresponding
measurement uncertainty (MU). 2 "§" denotes an outlier (i.e. those results for which |z-score| ≥ 3.0).
Robust z-scores are calculated as: z = (A - median) ÷ normalised IQR, where A is the participant laboratory's result.
3 Please refer to Appendix C (page C3) for method code descriptions.

A14
SD 9.17.09
Total Dissolved Solids - cont.
Results by Laboratory Code
Lab Code
Sample PTA 1
Result ± MU1 (mg/L)
Robust z-score2
Method Code3
551 561 ± 2% 2.83 8
563 511 ± 25 0.58 8
568 550 ± 66 2.34 8
572 440 # -2.61 8
588 467 ± 47 -1.39 11
590 504 # 0.27 8
633 460 ± 69.0 -1.71 8
660 510 ± 90.0 0.54 8
688 502 # 0.18 8
699 520 # 0.99 12
No of Results: 37
Median: 498.0
Normalised IQR:
22.2
Uncertainty of the Median:
4.6
Robust CV: 4.5%
Minimum: 324
Maximum: 604
Range: 280
1 Where reported, results are shown with their corresponding
measurement uncertainty (MU).
2 "§" denotes an outlier (i.e. those results for which |z-score| ≥ 3.0). Robust z-scores are calculated as: z = (A - median) ÷ normalised IQR, where A is the participant laboratory's result.
3 Please refer to Appendix C (page C3) for method code descriptions.

SD 9.17.09
Total Dissolved Solids - Sample PTA 1 - Robust Z-Sc ores
Ordered R
obust Z-S
core Charts
Total D
issolved Solids - S
ample P
TA
1
A15
Robust Z-Scores
272
572 46
4 633 58
8
214
286
382
362
117
271
274
398
126
519
545
243
475
-5
-4
-3
-2
-1
0
1
2
3
4
5z-
scor
e
lab code
-5
-4
-3
-2
-1
0
1
2
3
4
5
z-sc
ore
lab code

A16
SD 9.17.09
Total Dissolved Solids
Results by Laboratory Code
Lab Code
Sample PTA 2
Result ± MU1 (mg/L)
Robust z-score2
Method Code3
117 260 # 0.00 8
126 254 ± 23 -0.30 8
128 295 ± 30.0 1.75 8
144 280 ± 11 1.00 8
196 262 # 0.10 9
214 242 ± 8.5 -0.90 8
243 260 # 0.00 #
271 249 ± 25 -0.55 12
272 146 ± 7 -5.70 § 8
274 260 ± 9.90 0.00 8
286 246 ± 36.9 -0.70 8
310 255 ± 35.7 -0.25 8
323a 279 ± 6.37 0.95 #
329b 267 ± 27 0.35 8
362 267 # 0.35 8
375 281 ± 14 1.05 11
382 248 ± 1 -0.60 8
398 260 ± 39.0 0.00 8
410 250 ± 30 -0.50 8
412 315 ± 8.8% 2.75 8
430 265 ± 27 0.25 12
464 78 # -9.09 § 8
475 255 # -0.25 8
499 321 ± 13 3.05 § 11
519 259 ± 9.626 -0.05 8
542 252 ± 36 -0.40 10
545 288 ± 6 1.40 8 1 Where reported, results are shown with their corresponding
measurement uncertainty (MU). 2 "§" denotes an outlier (i.e. those results for which |z-score| ≥ 3.0).
Robust z-scores are calculated as: z = (A - median) ÷ normalised IQR, where A is the participant laboratory's result.
3 Please refer to Appendix C (page C3) for method code descriptions.
A17
SD 9.17.09
Total Dissolved Solids - cont.
Results by Laboratory Code
Lab Code
Sample PTA 2
Result ± MU1 (mg/L)
Robust z-score2
Method Code3
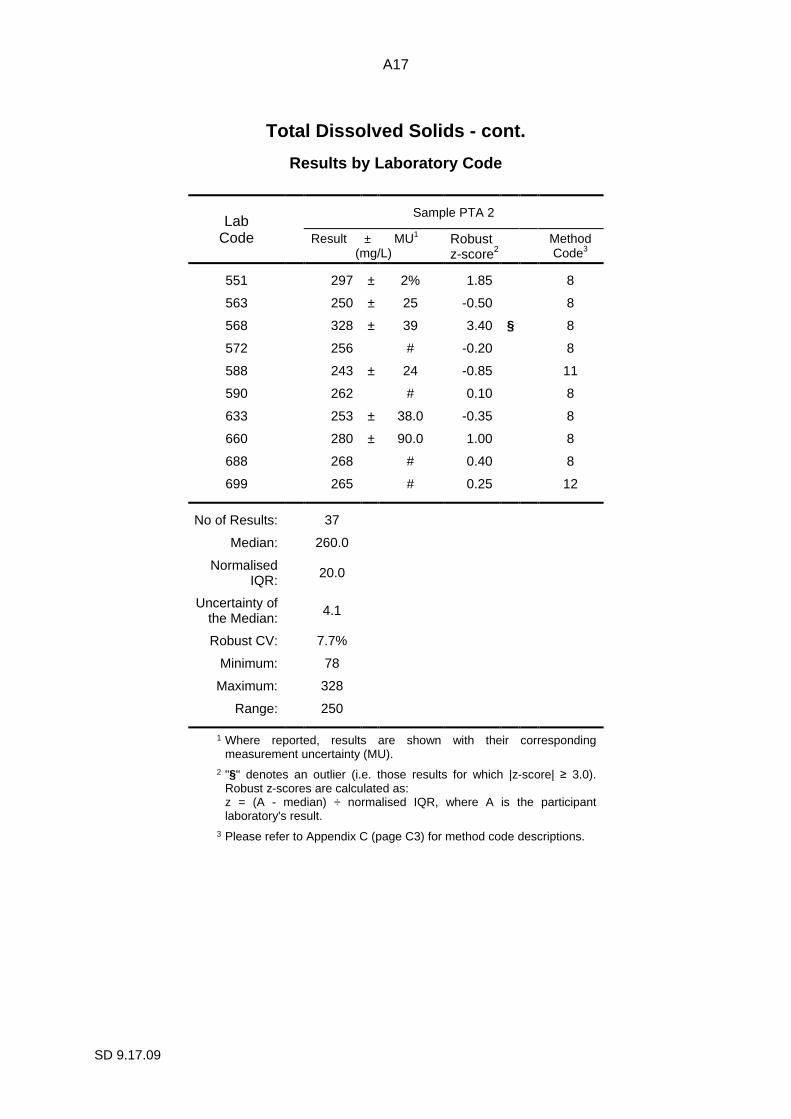
551 297 ± 2% 1.85 8
563 250 ± 25 -0.50 8
568 328 ± 39 3.40 § 8
572 256 # -0.20 8
588 243 ± 24 -0.85 11
590 262 # 0.10 8
633 253 ± 38.0 -0.35 8
660 280 ± 90.0 1.00 8
688 268 # 0.40 8
699 265 # 0.25 12
No of Results: 37
Median: 260.0
Normalised IQR:
20.0
Uncertainty of the Median:
4.1
Robust CV: 7.7%
Minimum: 78
Maximum: 328
Range: 250
1 Where reported, results are shown with their corresponding
measurement uncertainty (MU).
2 "§" denotes an outlier (i.e. those results for which |z-score| ≥ 3.0). Robust z-scores are calculated as: z = (A - median) ÷ normalised IQR, where A is the participant laboratory's result.
3 Please refer to Appendix C (page C3) for method code descriptions.

SD 9.17.09
Total Dissolved Solids - Sample PTA 2 - Robust Z-Sc ores
Ordered R
obust Z-S
core Charts
Total D
issolved Solids - S
ample P
TA
2
A18
Robust Z-Scores
464
272
214
588
286
382
271
410
563
542
633
126
310
475
572
519
117
243
-5
-4
-3
-2
-1
0
1
2
3
4
5
z-sc
ore
lab code
-5
-4
-3
-2
-1
0
1
2
3
4
5
z-sc
ore
lab code

SD 9.17.09
APPENDIX B
Sample Homogeneity and Stability
Homogeneity and Stability Testing ........................................................................................ B1

B1
SD 9.17.09
Homogeneity and Stability Testing Samples for this program were obtained from Global Proficiency Ltd, New Zealand. As such, all samples are subjected to rigorous quality control and homogeneity / stability testing. Samples were manufactured from two solutions which formed a precipitate in the bottle. These were dispensed with an accuracy of 0.75% for PTA 1 and 0.70% for PTA 2 (99% CI). A random selection of ten samples was chosen from samples PTA 1 for homogeneity and stability testing. Seven of these were stored chilled and the remaining three were subjected to 35ºC for three days for an accelerated ageing stability trial. The samples were then analysed by Hill Laboratories, New Zealand. The testing of Total Suspended Solids was performed using: filtration through Whatman 934 AH, Advantec GC-50 or equivalent filters (nominal pore size 1.2 - 1.5µm) and gravimetric determination (APHA 2540 D 22nd ed. 2012). The testing of Total Dissolved Solids was performed using filtration through GF/C filters (1.2 µm) and gravimetric determination (APHA 2540 C 22nd ed. 2012 modified: drying temperature of 103 - 105°C was used rather than180 ± 2°C). The Total Solids content was determined by calculation from the Total Suspended Solids and Total Dissolved Solids measurements. All stability samples showed no increased variability when compared to the chilled samples. Samples PTA 2 were also tested to confirm the levels were within the expected range. Homogeneity and stability samples were treated in the same manner as for the PTA 1 samples. Based on identical manufacturing procedure and sample handling, homogeneity and stability characteristics were assumed to be similar to samples PTA 1. From statistical analyses based on the results of this testing and rigorous quality control, it was considered that all samples were sufficiently homogeneous and stable, so that any results later identified as outliers should not be attributed to any notable sample variability. The results of homogeneity and stability testing are presented in Table B1 below. Please note that the mean results for these tests are not intended to be used as reference values. Table B1. Homogeneity and stability testing of Round 182 samples.
Round PTA 182
Samples PTA 1 (g/m 3) Samples PTA 2 (g/m 3) TSS TDS TS TSS TDS TS
H1 39.9 591.9 631.8 97.9 271.2 369.1
H2 37.3 578.1 615.3 95.6 268.8 364.4
H3 38.4 575.1 613.5
H4 37.6 575.5 613.1
H5 40.3 563.5 603.8
H6 40.3 566.1 606.4
H7 40.3 566.5 606.8
S1 42.5 568.0 610.5 99.1 267.5 366.6
S2 42.9 551.2 594.1
S3 43.7 568.8 612.4
RSD 5.4% 1.9% 1.6% 1.8% 0.7% 0.6%

SD 9.17.09
APPENDIX C
Documentation
Instructions to Participants .................................................................................................... C1
Method Codes ....................................................................................................................... C3
Results Sheet ........................................................................................................................ C4

SD 9.17.09
CHEMICAL ANALYSIS ROUND 182 Total Solids (TS), Total Suspended Solids (TSS), Total Dissolved Solids (TDS)
**Please record (on the Results
Please note the following before commencing the analysis of the samples. 1. Samples
i)
ii)
iii)
Please Note:laboratory sample.
2. Sample Preparation
Note:
Caution:
i)
ii)
iii)
iv)
v)
vi)
vii)
viii)
Please report results for the diluted sample.
SD 9.17.09
CHEMICAL ANALYSIS ROUND 182
Total Solids (TS), Total Suspended Solids (TSS), Total Dissolved Solids (TDS)
**Please record (on the Results
Please note the following before commencing the analysis of the samples.
Samples
Two plastic bottles labelled PTA 1 and PTA 2, supplied by Global Proficiency Ltd. The bottles contain 20 suspended solids and total dissolved solids.
Each bottle will require dilution in reagent grade water. Please follow the Sample Preparation section below.
The bottles must be tho
Please Note: laboratory sample.
Sample Preparation
Note: The Residue sample colour is white.
Caution: Analysis must begin immediately after bottle
A separate sample must be prepared from each bottle.
Adjust bottle temperature to 20ºC.
Add approximately 800 mL of reagent grade water to a one
Record bottle ID number and mix thoroughly.
Quantitatively transfer the bottle with reagent grade water and include this in the flask.
Bring to volume with reagent grade water.
Close the flask with a stopper and mix by inversion.
viii) Repeat steps ii)
Please report results for the diluted sample.
PROFICIENCY TESTING AUSTRALIA
WATERS PROFICIENCY TESTING PROGRAM
CHEMICAL ANALYSIS ROUND 182
Total Solids (TS), Total Suspended Solids (TSS), Total Dissolved Solids (TDS)
INSTRUCTIONS TO PARTICIPANTS
**Please record (on the Results
Please note the following before commencing the analysis of the samples.
Two plastic bottles labelled PTA 1 and PTA 2, supplied by Global Proficiency Ltd. The bottles contain 20 mL of artificial waste water concentrates for analysis of total solids, total suspended solids and total dissolved solids.
Each bottle will require dilution in reagent grade water. Please follow the Sample Preparation section below.
The bottles must be tho
Where possible, proficiency testing samples should be treated as a routine laboratory sample.
Sample Preparation
The Residue sample colour is white.
Analysis must begin immediately after bottle
A separate sample must be prepared from each bottle.
Adjust bottle temperature to 20ºC.
Add approximately 800 mL of reagent grade water to a one
Record bottle ID number and mix thoroughly.
Quantitatively transfer the bottle with reagent grade water and include this in the flask.
Bring to volume with reagent grade water.
Close the flask with a stopper and mix by inversion.
Repeat steps ii) – vii) for
Please report results for the diluted sample.
PROFICIENCY TESTING AUSTRALIA
WATERS PROFICIENCY TESTING PROGRAM
CHEMICAL ANALYSIS ROUND 182
Total Solids (TS), Total Suspended Solids (TSS), Total Dissolved Solids (TDS)
INSTRUCTIONS TO PARTICIPANTS
**Please record (on the Results Sheet) the approximate temperature of the samples upon
Please note the following before commencing the analysis of the samples.
Two plastic bottles labelled PTA 1 and PTA 2, supplied by Global Proficiency Ltd. The mL of artificial waste water concentrates for analysis of total solids, total
suspended solids and total dissolved solids.
Each bottle will require dilution in reagent grade water. Please follow the Sample Preparation
The bottles must be thoroughly mixed prior to analysis
Where possible, proficiency testing samples should be treated as a routine
The Residue sample colour is white.
Analysis must begin immediately after bottle
A separate sample must be prepared from each bottle.
Adjust bottle temperature to 20ºC.
Add approximately 800 mL of reagent grade water to a one
Record bottle ID number and mix thoroughly.
Quantitatively transfer the entire contents from the bottle into the flask, rinse the sides of the bottle with reagent grade water and include this in the flask.
Bring to volume with reagent grade water.
Close the flask with a stopper and mix by inversion.
vii) for second sample.
Please report results for the diluted sample.
C1
PROFICIENCY TESTING AUSTRALIA
WATERS PROFICIENCY TESTING PROGRAM
Total Solids (TS), Total Suspended Solids (TSS), Total Dissolved Solids (TDS)
INSTRUCTIONS TO PARTICIPANTS
Sheet) the approximate temperature of the samples upon receipt**
Please note the following before commencing the analysis of the samples.
Two plastic bottles labelled PTA 1 and PTA 2, supplied by Global Proficiency Ltd. The mL of artificial waste water concentrates for analysis of total solids, total
suspended solids and total dissolved solids.
Each bottle will require dilution in reagent grade water. Please follow the Sample Preparation
roughly mixed prior to analysis
Where possible, proficiency testing samples should be treated as a routine
The Residue sample colour is white.
Analysis must begin immediately after bottle
A separate sample must be prepared from each bottle.
Add approximately 800 mL of reagent grade water to a one
Record bottle ID number and mix thoroughly.
entire contents from the bottle into the flask, rinse the sides of the bottle with reagent grade water and include this in the flask.
Bring to volume with reagent grade water.
Close the flask with a stopper and mix by inversion.
second sample.
Please report results for the diluted sample.
PROFICIENCY TESTING AUSTRALIA
WATERS PROFICIENCY TESTING PROGRAM
Total Solids (TS), Total Suspended Solids (TSS), Total Dissolved Solids (TDS)
INSTRUCTIONS TO PARTICIPANTS
Sheet) the approximate temperature of the samples upon
Please note the following before commencing the analysis of the samples.
Two plastic bottles labelled PTA 1 and PTA 2, supplied by Global Proficiency Ltd. The mL of artificial waste water concentrates for analysis of total solids, total
Each bottle will require dilution in reagent grade water. Please follow the Sample Preparation
roughly mixed prior to analysis
Where possible, proficiency testing samples should be treated as a routine
Analysis must begin immediately after bottle is opened.
A separate sample must be prepared from each bottle.
Add approximately 800 mL of reagent grade water to a one-
entire contents from the bottle into the flask, rinse the sides of the bottle with reagent grade water and include this in the flask.
Close the flask with a stopper and mix by inversion.
PROFICIENCY TESTING AUSTRALIA
WATERS PROFICIENCY TESTING PROGRAM
Total Solids (TS), Total Suspended Solids (TSS), Total Dissolved Solids (TDS)
INSTRUCTIONS TO PARTICIPANTS
Sheet) the approximate temperature of the samples upon
Please note the following before commencing the analysis of the samples.
Two plastic bottles labelled PTA 1 and PTA 2, supplied by Global Proficiency Ltd. The mL of artificial waste water concentrates for analysis of total solids, total
Each bottle will require dilution in reagent grade water. Please follow the Sample Preparation
Where possible, proficiency testing samples should be treated as a routine
is opened.
-litre volumetric flask.
entire contents from the bottle into the flask, rinse the sides of the
JUNE, 2015
Total Solids (TS), Total Suspended Solids (TSS), Total Dissolved Solids (TDS)
Sheet) the approximate temperature of the samples upon
Two plastic bottles labelled PTA 1 and PTA 2, supplied by Global Proficiency Ltd. The mL of artificial waste water concentrates for analysis of total solids, total
Each bottle will require dilution in reagent grade water. Please follow the Sample Preparation
Where possible, proficiency testing samples should be treated as a routine
litre volumetric flask.
entire contents from the bottle into the flask, rinse the sides of the
JUNE, 2015
Sheet) the approximate temperature of the samples upon
Two plastic bottles labelled PTA 1 and PTA 2, supplied by Global Proficiency Ltd. The mL of artificial waste water concentrates for analysis of total solids, total
Each bottle will require dilution in reagent grade water. Please follow the Sample Preparation
Where possible, proficiency testing samples should be treated as a routine
entire contents from the bottle into the flask, rinse the sides of the

C2
SD 9.17.09
3. Tests Requested
For the samples prepared from the two bottles PTA 1 and PTA 2: i) Total Solids (TS).
ii) Total Suspended Solids (TSS).
iii) Total Dissolved Solids (TDS).
(It is recommended that a reagent water blank is analysed by the same method used to analyse the samples.) If unable to perform the above please note this on your Results Sheet.
4. Safety
i) Samples are for laboratory use only.
ii) Participants should have sufficient experience and training to take the necessary precautions when handling the samples and reagent chemicals and during disposal.
iii) Use of safety glasses, gloves, and fume hoods, where appropriate during the determinations, is recommended.
5. Reporting
i) Report results using three significant figures.
ii) Report results in milligrams per litre (mg/L).
iii) Do not correct results for recovery.
iv) Select the appropriate method code for each test from the Method Code Table and record it on the Results Sheet.
v) Calculate the measurement uncertainty (MU) for each reported result. All estimates of MU must be given as a 95% confidence interval (coverage factor k ≈ 2) and reported in mg/L. Report MU using the same number of decimal places as for the result.
6. Testing should commence as soon as possible after receiving the samples and results reported
NO LATER THAN 10 JULY 2015 to:
Delfina Mihaila Proficiency Testing Australia PO Box 7507 SILVERWATER NSW 2128 AUSTRALIA Phone: +612 9736 8397 Fax: +612 9743 6664 Email: [email protected]
7. For this program your laboratory has been allocated the code number shown on the attached
Results Sheet. All reference to your laboratory in reports associated with the program will be through this code number, thus ensuring the confidentiality of your results.
8. As a guide, ranges for the samples can be expected to be (in mg/L):
Analyte Range Total Solids 300 – 600 mg/L Total Suspended Solids 20 – 150 mg/L Total Dissolved Solids 200 – 600 mg/L

C3
SD 9.17.09
Method Codes to be used for the Results Sheet
ANALYSIS METHOD REFERENCE METHOD DESCRIPTION CODE
Total Solids
APHA SM
2540 B. Total Solids Dried at 103–105°C 1
US EPA 0160.3 Residue, Total. Dried at 103–105°C 2
Other
Calculation: Suspended + Dissolved 3
Other (please specify) 4
Total Suspended Solids
APHA SM
2540 D. Total Suspended Solids Dried at 103–105°C 5
US EPA 0160.2 Residue, Non-Filterable & Total Suspended Solids Dried at 103–105°C
6
Other
Other (please specify) 7
Total Dissolved Solids
APHA SM
2540 C. Total Dissolved Solids Dried at 180°C 8
US EPA 0160.1 Residue, Filterable. Dried at 180°C 9
Other
Calculation: Total – Suspended 10
Conductivity 11
Other (please specify) 12
Method Reference Key i) APHA SM APHA “Standard Methods for the Examination of Water and Wastewater” (18,
19, 20, 21 and 22 Edition).
ii) USEPA U.S Environmental Protection Agency, http://www.epa.gov/osa/fem/methcollectns.htm.

SD 9.17.09
*Approximate temperature of samples upon receipt:
Total Solids
Dried at 103Total Suspended Solids
Dried at 103Total Dissolved Solids
Dried at 180°C
Please state: Please note:
i) For
ii) Report results using three significant figures.
iii) Report results in iv) Do not correct results for recovery.
v) MU* Laboratories Measurement Uncertainty (MU) if known for the result. Please report in mg/L
DATE:
INSTRUCT WATERS PROF TEST PROG 182
SD 9.17.09
Total Solids (TS), Total Suspended Solids (TSS), Total Dissolved Solids (TDS)
*Approximate temperature of samples upon receipt:
ANALYSIS
Total Solids
Dried at 103 –105°CTotal Suspended Solids
Dried at 103 –105°CTotal Dissolved Solids
Dried at 180°C
Please state: Brand of filter used
Nominal filter pore size
Please note: Where possible, proficiency testing samples should be treated as a sample.
For each sample only a single result is requested.
Report results using three significant figures.
Report results in Do not correct results for recovery.
MU* Laboratories Measurement Uncertainty (MU) if known for the result. Please report in mg/L, using the same number of decimal places as for the result.
DATE: ______________________
Return results Delfina MihailaProficiency Testing AustraliaPO Box 7507 SILVERWATER NSW 2128 AUSTRALIA
INSTRUCT WATERS PROF TEST PROG 182
PROFICIENCY TESTING AUSTRALIA
WATERS PROFICIENCY TESTING PROGRAM
Total Solids (TS), Total Suspended Solids (TSS), Total Dissolved Solids (TDS)
*Approximate temperature of samples upon receipt:
ANALYSIS
105°C
Total Suspended Solids
105°C
Total Dissolved Solids
Brand of filter used
Nominal filter pore size
Where possible, proficiency testing samples should be treated as a sample.
sample only a single result is requested.
Report results using three significant figures.
Report results in milligrams per litre (mg/L).Do not correct results for recovery.
MU* Laboratories Measurement Uncertainty (MU) if known for the result. Please report in , using the same number of decimal places as for the result.
______________________
Return results NO LATER THAN 10 JULY 2015 Delfina Mihaila Proficiency Testing AustraliaPO Box 7507 SILVERWATER NSW 2128 AUSTRALIA
INSTRUCT WATERS PROF TEST PROG 182
PROFICIENCY TESTING AUSTRALIA
WATERS PROFICIENCY TESTING PROGRAM
CHEMICAL ANALYSIS ROUND 182
Total Solids (TS), Total Suspended Solids (TSS), Total Dissolved Solids (TDS)
RESULTS
*Approximate temperature of samples upon receipt:
SAMPLE PTA 1
Result (mg/L)
Brand of filter used
Nominal filter pore size
Where possible, proficiency testing samples should be treated as a
sample only a single result is requested.
Report results using three significant figures.
milligrams per litre (mg/L).Do not correct results for recovery.
MU* Laboratories Measurement Uncertainty (MU) if known for the result. Please report in , using the same number of decimal places as for the result.
______________________
NO LATER THAN 10 JULY 2015
Proficiency Testing Australia PO Box 7507 SILVERWATER NSW 2128
INSTRUCT WATERS PROF TEST PROG 182
C4
PROFICIENCY TESTING AUSTRALIA
WATERS PROFICIENCY TESTING PROGRAM
CHEMICAL ANALYSIS ROUND 182
Total Solids (TS), Total Suspended Solids (TSS), Total Dissolved Solids (TDS)JUNE, 2015
RESULTS SHEET(mg/L)
*Approximate temperature of samples upon receipt:
SAMPLE PTA 1
±MU (mg/L)
Where possible, proficiency testing samples should be treated as a
sample only a single result is requested.
Report results using three significant figures.
milligrams per litre (mg/L).
MU* Laboratories Measurement Uncertainty (MU) if known for the result. Please report in , using the same number of decimal places as for the result.
SIGNATURE:
NO LATER THAN 10 JULY 2015
PO Box 7507 Phone:SILVERWATER NSW 2128 Fax:
Email:
PROFICIENCY TESTING AUSTRALIA
WATERS PROFICIENCY TESTING PROGRAM
CHEMICAL ANALYSIS ROUND 182
Total Solids (TS), Total Suspended Solids (TSS), Total Dissolved Solids (TDS)JUNE, 2015
SHEET
SAMPLE PTA 2
Result (mg/L)
Where possible, proficiency testing samples should be treated as a
sample only a single result is requested.
MU* Laboratories Measurement Uncertainty (MU) if known for the result. Please report in , using the same number of decimal places as for the result.
SIGNATURE: _______________________________
NO LATER THAN 10 JULY 2015 to:
Phone: +61 2 9736 8397 +61 2 9743 6664
Email: [email protected]
PROFICIENCY TESTING AUSTRALIA
WATERS PROFICIENCY TESTING PROGRAM
CHEMICAL ANALYSIS ROUND 182
Total Solids (TS), Total Suspended Solids (TSS), Total Dissolved Solids (TDS)
Laboratory Code
SAMPLE PTA 2
Result
±MU(mg/L)
Where possible, proficiency testing samples should be treated as a
MU* Laboratories Measurement Uncertainty (MU) if known for the result. Please report in , using the same number of decimal places as for the result.
_______________________________
+61 2 9736 8397 +61 2 9743 6664 [email protected]
Total Solids (TS), Total Suspended Solids (TSS), Total Dissolved Solids (TDS)
Laboratory Code «Code»
METHOD
CODE±MU (mg/L)
Where possible, proficiency testing samples should be treated as a routine laboratory
MU* Laboratories Measurement Uncertainty (MU) if known for the result. Please report in
_______________________________
«Code»
METHOD CODE
routine laboratory
MU* Laboratories Measurement Uncertainty (MU) if known for the result. Please report in
_______________________________
SD 9.17.09
- End of Report -