Report No - ASL Airlines Belgium · analysis for the ELT Antenna installation on Boeing 737‐400...
131
This document contains information which is property of Kamala Meader. This document may not, in whole or in part, be duplicated, disclosed, or used for design or manufacturing purposes without the written permission of Kamala Meader Report No: R2654‐001 Damage Tolerance Analysis of an ELT Antenna Installation Aircraft: Boeing 737‐400 Serial Numbers: 25110 and 25111 Tail Numbers: N778AS and N779AS Prepared for: RT Aerospace 17705 SW 158th Street Miami, Florida 33187 Prepared By: Brett A. Varney Approved By: Kamala J. Meader Date: September 12, 2016
Transcript of Report No - ASL Airlines Belgium · analysis for the ELT Antenna installation on Boeing 737‐400...

This document contains information which is property of Kamala Meader. This document may not, in whole or in part, be duplicated, disclosed, or used for design or manufacturing purposes without the written permission of Kamala Meader
Report No: R2654‐001
Damage Tolerance Analysis of an ELT Antenna Installation
Aircraft: Boeing 737‐400
Serial Numbers: 25110 and 25111 Tail Numbers: N778AS and N779AS
Prepared for: RT Aerospace
17705 SW 158th Street Miami, Florida 33187
Prepared By: Brett A. Varney
Approved By: Kamala J. Meader
Date: September 12, 2016
Report: R2654‐001 Revision: IR Page: i By: BAV
Revision Log
Revision Level Description Date Approved
IR Initial Release 09/12/2016 KM

Report: R2654‐001 Revision: IR Page: ii By: BAV
Table of Contents
Item Page
Revision Log .................................................................................................................................................. i Table of Contents .......................................................................................................................................... ii References .................................................................................................................................................... iii 1.0 Introduction 1.1 Discussion .................................................................................................................................. 1.1.1 1.2 Reference Data List .................................................................................................................... 1.2.1 2.0 (Fuselage Skin DT) ELT Antenna Installation (Drawing: GA373‐ELT‐01) 2.1 Description ................................................................................................................................ 2.1.1 2.2 Installation Dimensions ............................................................................................................. 2.2.1 2.3 Load Analysis ............................................................................................................................. 2.3.1 2.4 Fatigue Analysis ......................................................................................................................... 2.4.1 2.5 Damage Tolerance Analysis ....................................................................................................... 2.5.1 2.6 Inspection Interval Calculations ................................................................................................ 2.6.1 2.7 Summary and Conclusions ........................................................................................................ 2.7.1 3.0 (Fuselage Frame DT) ELT Antenna Installation (Drawing: GA373‐ELT‐01) 2.1 Description ................................................................................................................................ 2.1.1 2.2 Installation Dimensions ............................................................................................................. 2.2.1 2.3 Load Analysis ............................................................................................................................. 2.3.1 2.4 Fatigue Analysis ......................................................................................................................... 2.4.1 2.5 Damage Tolerance Analysis ....................................................................................................... 2.5.1 2.6 Inspection Interval Calculations ................................................................................................ 2.6.1 2.7 Summary and Conclusions ........................................................................................................ 2.7.1 A.0 Appendix A ...................................................................................................................................... A.0
Report: R2654‐001 Revision: IR Page: iii By: BAV
References
[1] 14 Code of Federal Aviation Regulations, Part 25, effective February 1, 1965 as amended by Amendments 25‐1 thru 25‐ 51.
[2] Type Certificate Data Sheet No. A16WE Revision 56 dated July 03, 2016, by the Federal Aviation
Administration. [3] Broek, David, Manual for the Damage Tolerance Analysis of Repairs and Modifications of Aircraft
Structures, June 1995, FractuREsearch, Galena, Ohio. [4] McGarvey, Joseph, Damage Tolerance Analysis for Antenna Installation of Pressurized Transport
Airplanes, June 2000, FAA Chicago, Aircraft Certification Office. [5] Metallic Materials Properties Development and Standardization, DOT/FAA/AR‐MMPDS‐06, Office of
Aviation Research. [6] Roark, Raymond J., and Young, Warren C., Formulas for Stress and Strain, Fifth Edition, McGraw‐Hill
Book Company, New York, 1982. [7] Peterson, R. E., Stress Concentration Factors, 1974, John Wiley & Sons, Inc., New York.
[8] Safarian, Patrick. “Fatigue and Damage Tolerance Analysis Advanced Concepts Course.” Kirkland,
Washington. 20‐23 May 2013. Lecture. [9] AFGROW Software, Version 4.12.15.0, dated 10/07/2008, Copyright 1996‐2007 AFRL/VASM.
[10] Document Number ADA370431, AFGROW Users Guide and Technical Manual, February 1999, Air Force
Research Laboratory, Wright‐Patterson Air Force Base, Ohio Air Vehicles Directorate, U.S. Department of Commerce, National Technical Information Service.
[11] Huth, Heimo, “Zum Einflub der Nietnachgiebigkeit mehrreihiger Nietverbindungen auf die
Lastübertragungs‐ und Lebensdauervorhersage,” LBF Report No. FB‐172, dissertation, Technische Universität München, Munich, Germany, 1984.
[12] Swift, Tom, Repairs to Damage Tolerant Aircraft, March 19, 1990, Federal Aviation Administration,
presented to International Symposium on Structural Integrity of Aging Airplanes, Atlanta, Georgia. [13] Volpe, John A., Damage Tolerance Assessment Handbook, Vol. 2: Airframe Damage Tolerance
Evaluation, 1999, National Technical Information Service, Springfield, Virginia.

Report: R2654‐001 Revision: IR Page: 1.1.1 By: BAV
1.0 Introduction
1.1 Discussion This report provides inspection intervals that are calculated using fatigue and damage tolerance analysis for the modifications that are part of the ELT antenna installations on the Boeing 737‐400 aircraft.
Reviewing the Table of Contents, this report analyzes the Installation as follows: Chapter 2: (Fuselage Skin DT) |ELT Antenna Installation Chapter 3: (Fuselage Frame DT) |ELT Antenna Installation Appendix A: |Additional Aircraft Reference Data

Report: R2654‐001 Revision: IR Page: 1.2.1 By: BAV
1.0 Introduction
1.2 Reference Data List Document Type Document No Title Revision
Applicable Installation Drawing: *Drawing GA373‐ELT‐01 B737
INSTALLATION ELT ANTENNA DOUBLER AND TRANSMITTERA
Fabrication Drawing: *Drawing 040615 ELT ANTENNA DOUBLER AND TRANSMITTER
SUPPORT MANUFACTURING I/R
*As shown on the following pages:
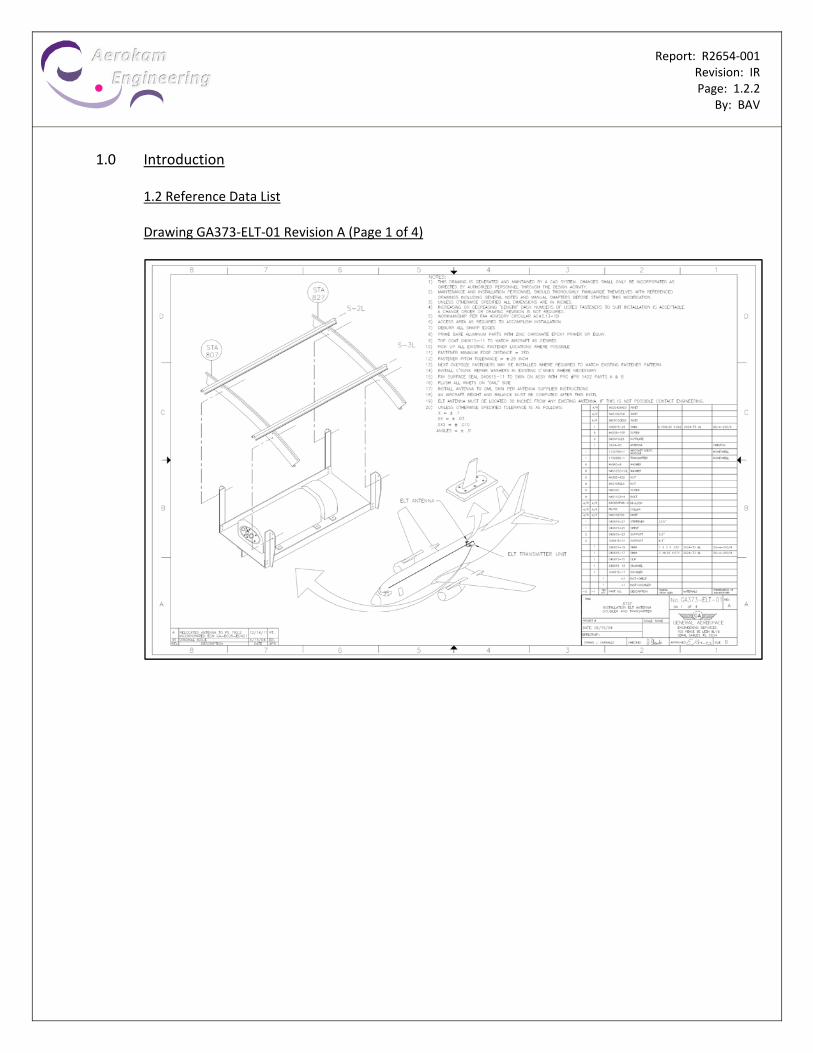
Report: R2654‐001 Revision: IR Page: 1.2.2 By: BAV
1.0 Introduction
1.2 Reference Data List Drawing GA373‐ELT‐01 Revision A (Page 1 of 4)

Report: R2654‐001 Revision: IR Page: 1.2.3 By: BAV
1.0 Introduction
1.2 Reference Data List Drawing GA373‐ELT‐01 Revision A (Page 2 of 4)

Report: R2654‐001 Revision: IR Page: 1.2.4 By: BAV
1.0 Introduction
1.2 Reference Data List Drawing GA373‐ELT‐01 Revision A (Page 3 of 4)

Report: R2654‐001 Revision: IR Page: 1.2.5 By: BAV
1.0 Introduction
1.2 Reference Data List Drawing GA373‐ELT‐01 Revision A (Page 4 of 4)
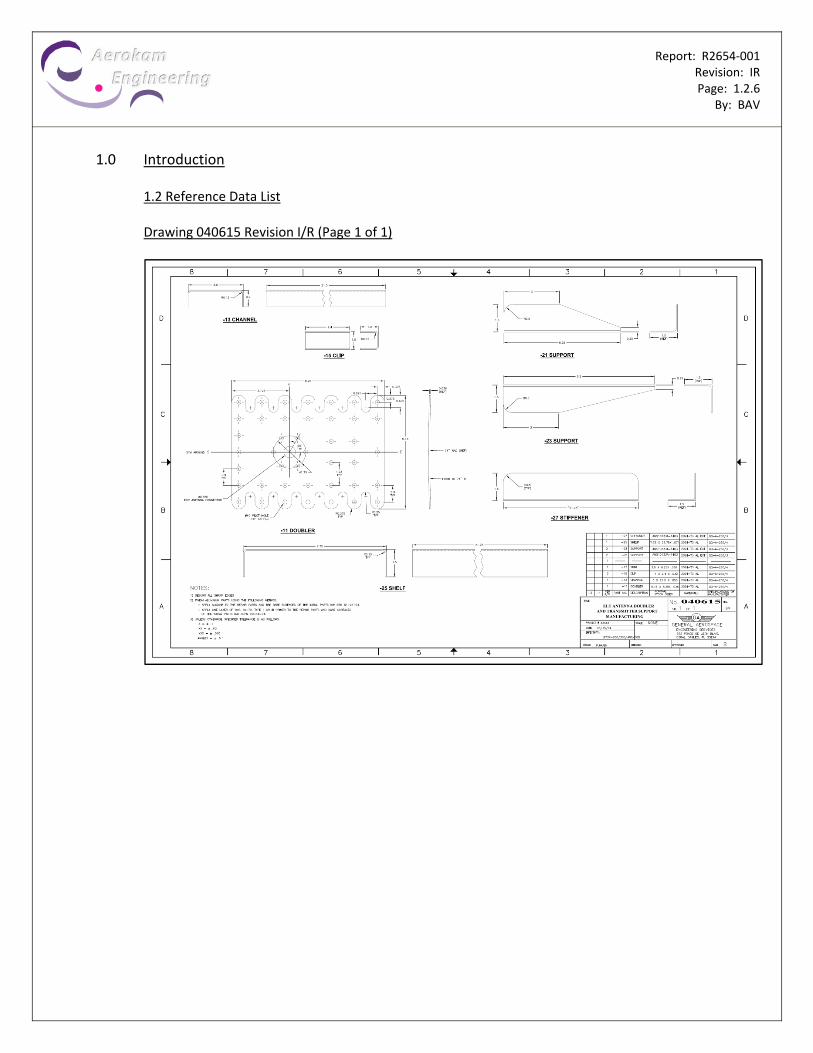
Report: R2654‐001 Revision: IR Page: 1.2.6 By: BAV
1.0 Introduction
1.2 Reference Data List Drawing 040615 Revision I/R (Page 1 of 1)

Report: R2654‐001 Revision: IR Page: 2.1.1 By: BAV
2.0 (Fuselage Skin DT) ELT Antenna Installation Drawing: GA373‐ELT‐01
2.1 Description This chapter provides inspection intervals that are calculated using fatigue and damage tolerance analysis for the ELT Antenna installation on Boeing 737‐400 aircraft. The installation is designed per the General Aerospace installation drawing GA373‐ELT‐01 and fabrication drawing 040615. The ELT Antenna is located at FS 791 near centerline on the upper skin of the fuselage. The fuselage skin assembly, in this region, is fabricated from 0.036” thick 2024‐T3 aluminum per AMS‐QQ‐A‐250/5 with a bonded waffle doubler fabricated from 0.036” thick 2024‐T3 aluminum per AMS‐QQ‐A‐250/5. The doubler is approximately sized to 8.25” L x 6.15” W and fabricated from 0.036” thick 2024‐T3 aluminum per AMS‐QQ‐A‐250/4. The doubler is mounted internally to the fuselage skin assembly with (42) NAS1097D4 field rivets. The ELT Antenna itself mounts to the fuselage with (6) AN509‐10R screws that each attach to BACN10JZ3 nutplates. Each BACN10JZ3 nutplate subsequently attaches to the internal doubler using MS20426AD3 rivets. As shown on the following pages, per installation drawing GA373‐ELT‐01, inspection intervals are calculated using fatigue and damage tolerance analysis for the ELT Antenna attachments.

Report: R2654‐001 Revision: IR Page: 2.2.1 By: BAV
2.0 (Fuselage Skin DT) ELT Antenna Installation Drawing: GA373‐ELT‐01
2.2 Installation Dimensions ELT Antenna Doubler

Report: R2654‐001 Revision: IR Page: 2.2.2 By: BAV
2.0 (Fuselage Skin DT) ELT Antenna Installation Drawing: GA373‐ELT‐01
2.2 Installation Dimensions ELT Antenna Channel

Report: R2654‐001 Revision: IR Page: 2.3.1 By: BAV
2.0 (Fuselage Skin DT) ELT Antenna Installation Drawing: GA373‐ELT‐01
2.3 Load Analysis General Aircraft Data
Supplemental Cabin Pressurization Data: COA = Aircraft Standard Cabin Altitude = 8,000 ft 1 MOA = Aircraft Maximum Operating Altitude = 37,000 ft 2 PCOA = Standard Air Pressure at Cabin Operating Altitude 3 = 1,572.1 lb / ft2 PMOA = Standard Air Pressure at Maximum Operating Altitude 3 = 453.86 lb / ft2 Pop = Maximum Operational Differential Cabin Pressure Loading = (PSCA – PMOA) (1 ft² / 144 in²) = (1,572.1 lb / ft² – 453.86 lb / ft²) (1 ft² / 144 in²) = 7.77 psi Pop = Maximum Operational Differential Cabin Outflow Pressure Valve Setting 4 = 7.80 psi Supplemental Fuselage Bending Data: For Boeing 737‐400 Aircraft: 5
Forward Pressure Bulkhead Location = FS 178.00 ELT Antenna Location = FS 1091.00 (FS 791 +300” Extension) Rearward Pressure Bulkhead Location = FS 1342.00 (FS 1042 +300” Extension)
Wt = ½ of Aircraft Maximum Take‐Off Weight 6 = ½ (150,000 lbs) = 75,000 lbs
1 Reference Number 1, FAR Part 25.841(a) 2 Reference FAA Type Certificate Data Sheet: A16WE Revision 56, (Page 16) 3 Reference Appendix A, Standard Atmospheric Tables, (Pages A.1 – A.3) 4 Reference Appendix A, Boeing 737‐400 Maintenance Manual, (Pages A.4 – A.7) 5 Reference Appendix A, Boeing 737‐400 Aircraft Structural Repair Manual, (Pages A.8 – A.10) 6 Reference Boeing 737‐400 Airplane Characteristics for Airport Planning

Report: R2654‐001 Revision: IR Page: 2.3.2 By: BAV
2.0 (Fuselage Skin DT) ELT Antenna Installation Drawing: GA373‐ELT‐01
2.3 Load Analysis
Operational Loading Compute Operational Pressurization Skin Stresses: 1 As the cabin is pressurized, the skin expands outward, carrying the stringers with it. The majority of the pressure load is carried in hoop tension in the skin with the remainder being beamed to the frames by the stringers and skin. The distribution of pressure loads to the skin, stringers, and frame depends on the relative stiffness of these elements. The analysis that follows conservatively ignores the stiffening effects of the stringers and frames. Assuming the aircraft to act as a thin‐walled cylindrical pressure vessel with uniform internal pressure with the ends capped, the operational skin stresses are as follows:
cop = operational circumferential skin stress = Pop R / ts = (7.80 psi) (74.00 in) / (0.036 in) = 16,033 psi
lop = operational longitudinal skin stress = Pop R / 2 ts = (7.80 psi) (74.00 in) / [2 (0.036 in)] = 8,017 psi
1 Reference Number 3, Broek, (Pages 15 ‐ 19) & Reference Number 6, Roark, (Page 448)

Report: R2654‐001 Revision: IR Page: 2.3.3 By: BAV
2.0 (Fuselage Skin DT) ELT Antenna Installation Drawing: GA373‐ELT‐01
2.3 Load Analysis
Operational Loading Compute Fuselage Bending Stresses The cyclic bending stresses are due to inertia as a consequence of vertical loads on the wing. Only the fuselage weight is of importance for fuselage bending; it is assumed evenly distributed. Moments due to down loads, or aircraft weight, place the fuselage top in tension and bottom in compression.
To calculate the maximum stress on the skin of the fuselage, cantilever beam theory is used where the bending moment is at a maximum near the aircraft center and zero at its ends. The effect of longitudinal stringers on bending stress is accounted for using a typical stiffening ratio of 0.4. The resulting stress due to bending is added to the cabin pressurization tensile stress calculated using pressure vessel theory. 1
1 Reference Number 3, Broek, (Pages 15 ‐ 19)

Report: R2654‐001 Revision: IR Page: 2.3.4 By: BAV
2.0 (Fuselage Skin DT) ELT Antenna Installation Drawing: GA373‐ELT‐01
2.3 Load Analysis
Operational Loading Compute Fuselage Bending Stresses
Bending Calculations 1 X = length from forward pressure bulkhead to installation
= 1091.00 in – 178.00 in = 913.00 in
L = length from forward pressure bulkhead to rearward pressure bulkhead = 1342.00 in – 178.00 in = 1,164.00 in
Mb = fuselage bending moment at the installation location = [Wt (L – X)2] / 2L = [(75,000 lb) (1,164 in – 913 in)2] / [2 (1,164 in)] = 2,029,671 in‐lbs
b = fuselage bending stress at the installation location
= [(Mb sin θ) / ( R2 ts)] / (1 + 0.8)
= {[(2,029,671 in‐lb) sin (90˚)] / [ (74 in) 2 (0.036 in)]} / [1 + 0.8] = 1,822 psi
1 Reference Number 3, Broek, (Pages 15 ‐ 19)

Report: R2654‐001 Revision: IR Page: 2.3.5 By: BAV
2.0 (Fuselage Skin DT) ELT Antenna Installation Drawing: GA373‐ELT‐01
2.3 Load Analysis
Operational Loading Summary of Stresses The 1.0g fuselage bending condition shown in the preceding calculations is not sufficient to cover normal operating flight conditions. An additional 1.3g factor is therefore used in this analysis to conservatively account for operational loading conditions. 1 For the total tensile longitudinal far‐field stresses used throughout this report, the far‐field bending stresses are superposed to the far‐field pressurization stress for a total far‐field stress of 8,017 psi + 1.3 x (1,822) psi = 10,386 psi. Longitudinal Loading Longitudinal Far‐Field Stress: 10,386 psi Circumferential Loading Circumferential Far‐Field Stress: 16,033 psi
1 Reference Number 3, Broek, (Pages 15 ‐ 19)

Report: R2654‐001 Revision: IR Page: 2.3.6 By: BAV
2.0 (Fuselage Skin DT) ELT Antenna Installation Drawing: GA373‐ELT‐01
2.3 Load Analysis
Operational Loading Fastener Load Distribution (Circumferential) Using displacement compatibility analysis of the doubler‐to‐skin joint, it is possible to calculate the fastener loads in the fastener rows. The compatible displacement criterion is based upon the condition that the skin and doubler must undergo equal displacements. A typical strip is idealized based upon the fastener spacing and pitch as shown below.
Each fastener is simulated as an elastic spring under shear load. Each portion of the skin and doubler strip is idealized as a bar. Note: The analysis that follows assumes that the fastener joint involves the skin and doubler. The
displacements in the fastener holes are non‐linear, so a linear approximation is made. Multiple locations were considered on the doubler in the circumferential loading direction; only the most critical fastener location / geometry is analyzed on the following pages.

Report: R2654‐001 Revision: IR Page: 2.3.7 By: BAV
2.0 (Fuselage Skin DT) ELT Antenna Installation Drawing: GA373‐ELT‐01
2.3 Load Analysis
Operational Loading Fastener Load Distribution (Circumferential)
From the definition of flexibility C = 1/Stiffness = riv/F f = deflection of fastener under load 1 = R (1.06463 E‐05 in/lb) [at all fastener rows] ts1 = thickness of skin = 0.036 in ts2 = thickness of skin = 0.036 in td1 = thickness of doubler = 0.036 in td2 = thickness of doubler = 0.036 in w1 = fastener pitch = 1.25 in s1 = fastener spacing = 0.90 in
w2 = fastener pitch = 1.25 in s2 = fastener spacing = 1.80 in
df1 = fastener diameter = 0.125 in df2 = fastener diameter = 0.125 in a = empirical constant; = 2/5 for riveted metallic joints b = empirical constant; = 2.2 for riveted metallic joints Es = Young’s Modulus for Aluminum Skin = 10,500,000 psi Ed = Young’s Modulus for Aluminum Doubler = 10,500,000 psi Ef = Young’s Modulus for Aluminum Fasteners = 10,400,000 psi N = circumferential load in strip
= cl (cross‐sectional area) = (16,033 psi) (1.25 in) (0.036 in) = 721.5 lb
1 Reference Number 11, Huth, (Page 28)

Report: R2654‐001 Revision: IR Page: 2.3.8 By: BAV
2.0 (Fuselage Skin DT) ELT Antenna Installation Drawing: GA373‐ELT‐01
2.3 Load Analysis
Operational Loading Fastener Load Distribution (Circumferential) The solution to the displacement compatibility equations gives the following fastener loads:
P1 = 157.50 lb P2 = 84.78 lb
Pfastener = maximum fastener load at first fastener row = P1 = 157.50 lb Abr = bearing area Astrip = cross‐sectional strip area = d ts = w ts = (0.125 in) (0.036 in) = (1.25 in) (0.036 in) = 0.0045 in2 = 0.045 in2
br = bearing stress fastener = stress in idealized strip = Pfastener / Abr = Pfastener / Astrip = (157.50 lb) / (0.0045 in2) = (157.50 lb) / (0.045 in2) = 35,000 psi = 3,500 psi
bypass = bypass stress
= ref – fastener = 16,033 psi – 3,500 psi = 12,533 psi
tension ratio = bypass / ref bearing ratio = br / ref = (12,533 psi) / (16,033 psi) = (35,000 psi) / (16,033 psi) = 0.782 = 2.183

Report: R2654‐001 Revision: IR Page: 2.3.9 By: BAV
2.0 (Fuselage Skin DT) ELT Antenna Installation Drawing: GA373‐ELT‐01
2.3 Load Analysis
Operational Loading Fastener Load Distribution (Circumferential) The solution to the displacement compatibility equations gives the following fastener loads:
P2 = 84.78 lb
Pfastener = maximum fastener load at second fastener row = P2 = 84.78 lb Abr = bearing area Astrip = cross‐sectional strip area = d ts = w ts = (0.125 in) (0.036 in) = (1.25 in) (0.036 in) = 0.0045 in2 = 0.045 in2
br = bearing stress fastener = stress in idealized strip = Pfastener / Abr = Pfastener / Astrip = (84.78 lb) / (0.0045 in2) = (84.78 lb) / (0.045 in2) = 18,840 psi = 1,884 psi
bypass = bypass stress
= ref – fastener = 12,533 psi – 1,884 psi = 10,649 psi
tension ratio = bypass / ref bearing ratio = br / ref = (10,649 psi) / (12,533 psi) = (18,840 psi) / (12,533 psi) = 0.850 = 1.503
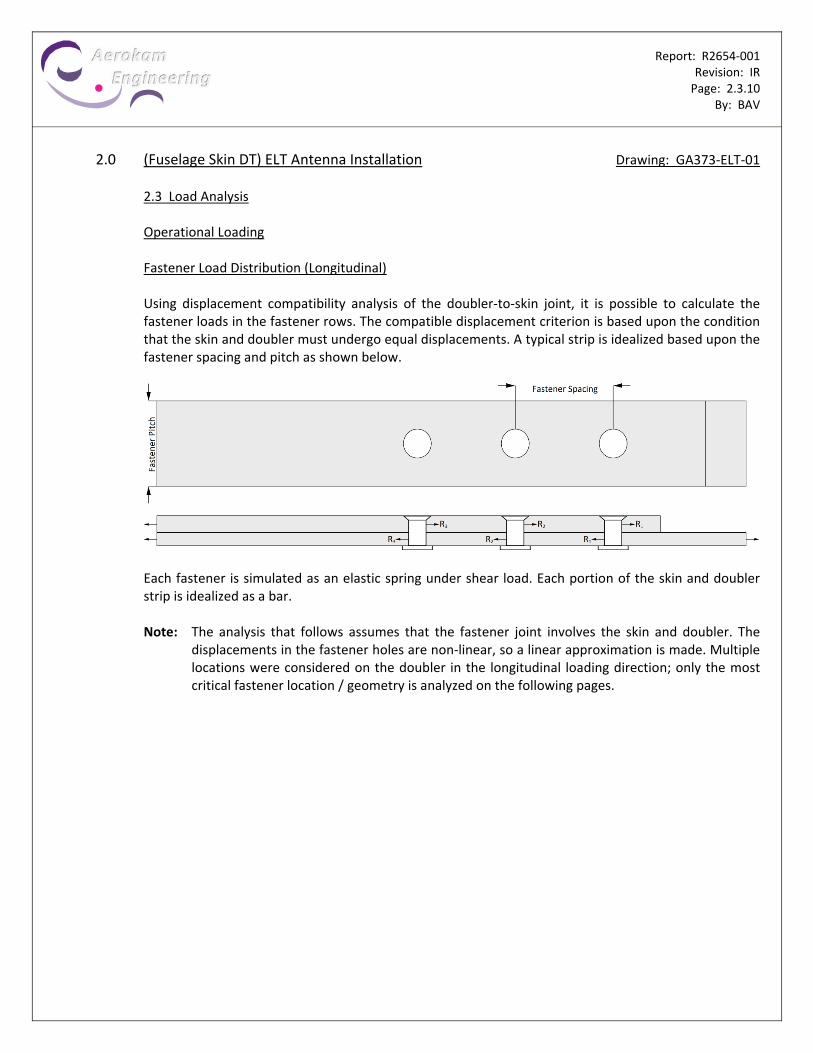
Report: R2654‐001 Revision: IR Page: 2.3.10 By: BAV
2.0 (Fuselage Skin DT) ELT Antenna Installation Drawing: GA373‐ELT‐01
2.3 Load Analysis
Operational Loading Fastener Load Distribution (Longitudinal) Using displacement compatibility analysis of the doubler‐to‐skin joint, it is possible to calculate the fastener loads in the fastener rows. The compatible displacement criterion is based upon the condition that the skin and doubler must undergo equal displacements. A typical strip is idealized based upon the fastener spacing and pitch as shown below.
Each fastener is simulated as an elastic spring under shear load. Each portion of the skin and doubler strip is idealized as a bar. Note: The analysis that follows assumes that the fastener joint involves the skin and doubler. The
displacements in the fastener holes are non‐linear, so a linear approximation is made. Multiple locations were considered on the doubler in the longitudinal loading direction; only the most critical fastener location / geometry is analyzed on the following pages.

Report: R2654‐001 Revision: IR Page: 2.3.11 By: BAV
2.0 (Fuselage Skin DT) ELT Antenna Installation Drawing: GA373‐ELT‐01
2.3 Load Analysis
Operational Loading Fastener Load Distribution (Longitudinal)
From the definition of flexibility C = 1/Stiffness = riv/F f = deflection of fastener under load 1 = R (1.06463 E‐05 in/lb) [at all fastener rows] ts1 = thickness of skin = 0.036 in ts2 = thickness of skin = 0.036 in ts3 = thickness of skin = 0.036 in td1 = thickness of doubler = 0.036 in td2 = thickness of doubler = 0.036 in td3 = thickness of doubler = 0.036 in w1 = fastener pitch = 1.80 in s1 = fastener spacing = 1.25 in w2 = fastener pitch = 1.23 in s2 = fastener spacing = 1.25 in
w3 = fastener pitch = 1.23 in s3 = fastener spacing = 1.25 in
df1 = fastener diameter = 0.125 in df2 = fastener diameter = 0.125 in df3 = fastener diameter = 0.125 in a = empirical constant; = 2/5 for riveted metallic joints b = empirical constant; = 2.2 for riveted metallic joints Es = Young’s Modulus for Aluminum Skin = 10,500,000 psi Ed = Young’s Modulus for Aluminum Doubler = 10,500,000 psi Ef = Young’s Modulus for Aluminum Fasteners = 10,400,000 psi N = longitudinal load in strip
= l (cross‐sectional area) = (10,386 psi) (1.80 in) (0.036 in) = 673.0 lb
1 Reference Number 11, Huth, (Page 28)

Report: R2654‐001 Revision: IR Page: 2.3.12 By: BAV
2.0 (Fuselage Skin DT) ELT Antenna Installation Drawing: GA373‐ELT‐01
2.3 Load Analysis
Operational Loading Fastener Load Distribution (Longitudinal) The solution to the displacement compatibility equations gives the following fastener loads:
P1 = 157.80 lb P2 = 65.69 lb P3 = 23.98 lb
Pfastener = maximum fastener load at first fastener row = P1 = 157.80 lb Abr = bearing area Astrip = cross‐sectional strip area = d ts = w ts = (0.125 in) (0.036 in) = (1.80 in) (0.036 in) = 0.0045 in2 = 0.065 in2
br = bearing stress fastener = stress in idealized strip = Pfastener / Abr = Pfastener / Astrip = (157.80 lb) / (0.0045 in2) = (157.80 lb) / (0.065 in2) = 35,067 psi = 2,428 psi
bypass = bypass stress
= ref – fastener = 10,386 psi – 2,428 psi = 7,958 psi
tension ratio = bypass / ref bearing ratio = br / ref = (7,958 psi) / (10,386 psi) = (35,067 psi) / (10,386 psi) = 0.766 = 3.376
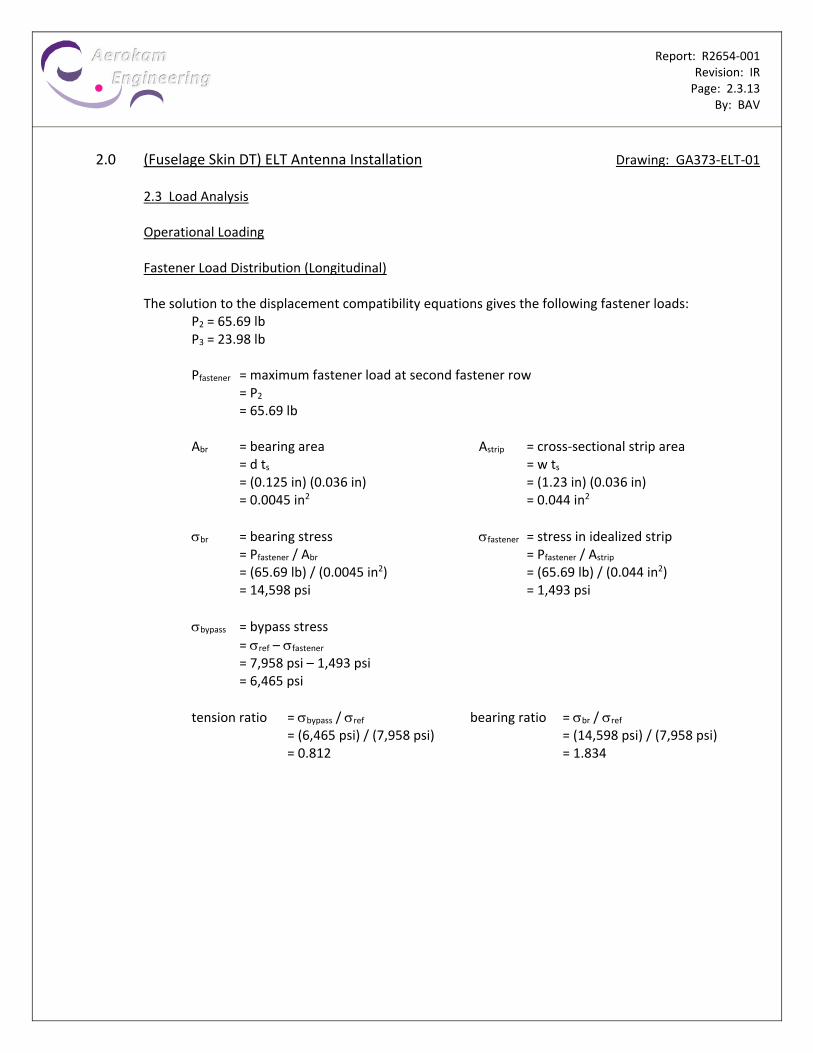
Report: R2654‐001 Revision: IR Page: 2.3.13 By: BAV
2.0 (Fuselage Skin DT) ELT Antenna Installation Drawing: GA373‐ELT‐01
2.3 Load Analysis
Operational Loading Fastener Load Distribution (Longitudinal) The solution to the displacement compatibility equations gives the following fastener loads:
P2 = 65.69 lb P3 = 23.98 lb
Pfastener = maximum fastener load at second fastener row = P2 = 65.69 lb Abr = bearing area Astrip = cross‐sectional strip area = d ts = w ts = (0.125 in) (0.036 in) = (1.23 in) (0.036 in) = 0.0045 in2 = 0.044 in2
br = bearing stress fastener = stress in idealized strip = Pfastener / Abr = Pfastener / Astrip = (65.69 lb) / (0.0045 in2) = (65.69 lb) / (0.044 in2) = 14,598 psi = 1,493 psi
bypass = bypass stress
= ref – fastener = 7,958 psi – 1,493 psi = 6,465 psi
tension ratio = bypass / ref bearing ratio = br / ref = (6,465 psi) / (7,958 psi) = (14,598 psi) / (7,958 psi) = 0.812 = 1.834

Report: R2654‐001 Revision: IR Page: 2.3.14 By: BAV
2.0 (Fuselage Skin DT) ELT Antenna Installation Drawing: GA373‐ELT‐01
2.3 Load Analysis
Operational Loading Fastener Load Distribution (Longitudinal) The solution to the displacement compatibility equations gives the following fastener loads:
P3 = 23.98 lb
Pfastener = maximum fastener load at third fastener row = P3 = 23.98 lb Abr = bearing area Astrip = cross‐sectional strip area = d ts = w ts = (0.125 in) (0.036 in) = (1.23 in) (0.036 in) = 0.0045 in2 = 0.044 in2
br = bearing stress fastener = stress in idealized strip = Pfastener / Abr = Pfastener / Astrip = (23.98 lb) / (0.0045 in2) = (23.98 lb) / (0.044 in2) = 5,329 psi = 545 psi
bypass = bypass stress
= ref – fastener = 6,465 psi – 545 psi = 5,920 psi
tension ratio = bypass / ref bearing ratio = br / ref = (5,920 psi) / (6,465 psi) = (5,329 psi) / (6,465 psi) = 0.916 = 0.824

Report: R2654‐001 Revision: IR Page: 2.3.15 By: BAV
2.0 (Fuselage Skin DT) ELT Antenna Installation Drawing: GA373‐ELT‐01
2.3 Load Analysis
Limit Loading Residual Strength Analysis Residual strength calculations done in this report generate the critical crack length on the basis of linear elastic fracture mechanics and the stress intensity factor, K. FAR 25.571(b)(5) [i & ii] gives the requirements necessary for the residual strength calculations. Two separate conditions must be considered for 51 of FAR 25.571… Condition (i): Normal Pressure Combined with Limit Flight Loads Condition (ii): Factored Pressure Loading

Report: R2654‐001 Revision: IR Page: 2.3.16 By: BAV
2.0 (Fuselage Skin DT) ELT Antenna Installation Drawing: GA373‐ELT‐01
2.3 Load Analysis
Limit Loading Residual Strength Analysis i. Normal Pressure Combined with Limit (Maneuvering / Gust / Roll / Yaw) Load 1
W = maximum take‐off weight = 150,000 lbs Nz = maximum positive limit maneuvering load (between 2.5 & 3.8)
= 2.1 + 24,000 / (W+10,000) = 2.5
rs = longitudinal residual strength allowable for skin = [(Pop +0.5 psi 2) R] / [2 ts] + Nz σb
= [(7.80 psi + 0.5 psi) (74.00 in)] / [2 (0.036 in)] + (2.5) (1,822 psi) = 12,572 psi
ii. Factored Pressure Loading 3
rs = circumferential residual strength allowable for skin = [1.10 Pop +0.5 psi 4] R / ts = [((1.10) 7.80 psi + 0.5 psi) (74.00 in)] / [0.036 in] = 18,664 psi
1 Reference Number 1, FAR Part 25.571(b)(5)(i) 2 Aerodynamic pressure conservatively assumed to be 0.5 psi 3 Reference Number 1, FAR Part 25.571(b)(5)(ii) 4 Aerodynamic pressure conservatively assumed to be 0.5 psi
Report: R2654‐001 Revision: IR Page: 2.4.1 By: BAV
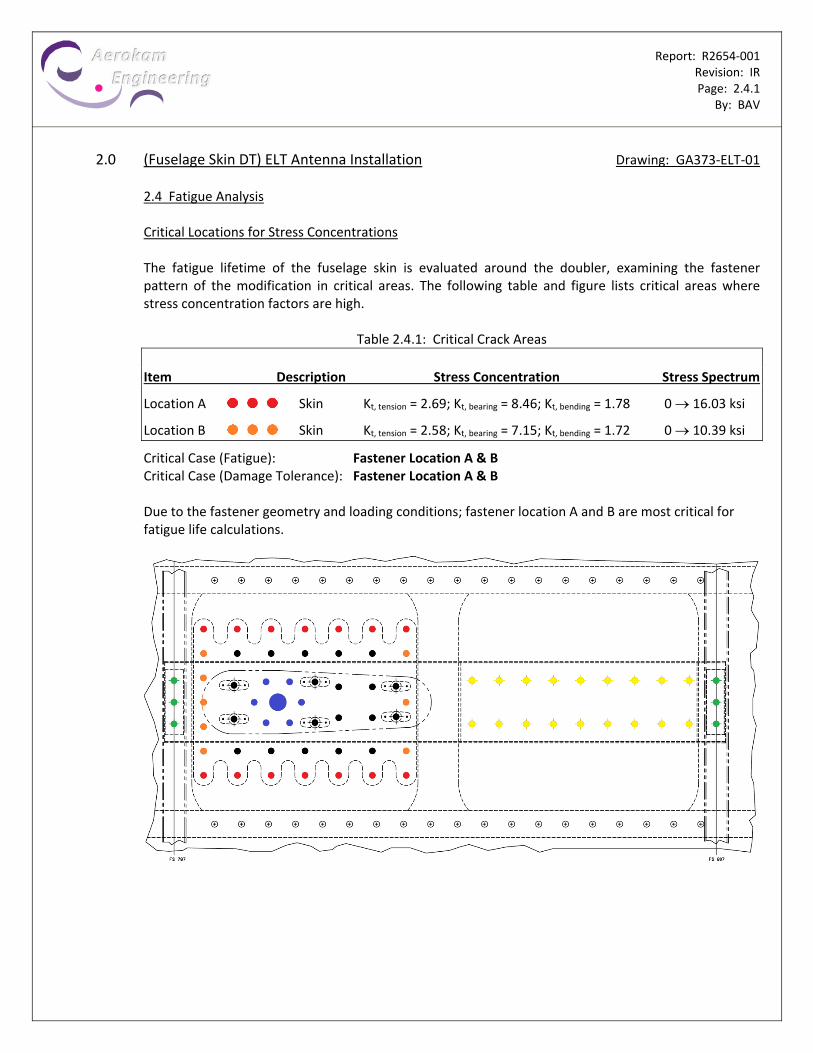
2.0 (Fuselage Skin DT) ELT Antenna Installation Drawing: GA373‐ELT‐01
2.4 Fatigue Analysis Critical Locations for Stress Concentrations The fatigue lifetime of the fuselage skin is evaluated around the doubler, examining the fastener pattern of the modification in critical areas. The following table and figure lists critical areas where stress concentration factors are high.
Table 2.4.1: Critical Crack Areas
Item Description Stress Concentration Stress Spectrum
Location A Skin Kt, tension = 2.69; Kt, bearing = 8.46; Kt, bending = 1.78 0 16.03 ksi
Location B Skin Kt, tension = 2.58; Kt, bearing = 7.15; Kt, bending = 1.72 0 10.39 ksi
Critical Case (Fatigue): Fastener Location A & B Critical Case (Damage Tolerance): Fastener Location A & B Due to the fastener geometry and loading conditions; fastener location A and B are most critical for fatigue life calculations.

Report: R2654‐001 Revision: IR Page: 2.4.2 By: BAV
2.0 (Fuselage Skin DT) ELT Antenna Installation Drawing: GA373‐ELT‐01
2.4 Fatigue Analysis Stress Concentration Factors (Tension) Fastener Location A Stress concentration factors are shown for the uniaxial tension of an infinite row of circular holes in an infinite thin element.
Ktn = 2.69

Report: R2654‐001 Revision: IR Page: 2.4.3 By: BAV
2.0 (Fuselage Skin DT) ELT Antenna Installation Drawing: GA373‐ELT‐01
2.4 Fatigue Analysis Stress Concentration Factors (Bearing) Fastener Location A Stress concentration factors are shown for bearing of a pin join with a closely fitting pin.
Ktn = 8.46

Report: R2654‐001 Revision: IR Page: 2.4.4 By: BAV
2.0 (Fuselage Skin DT) ELT Antenna Installation Drawing: GA373‐ELT‐01
2.4 Fatigue Analysis Stress Concentration Factors (Bending) Fastener Location A Stress concentration factors are shown for bending of a finite width plate with a circular hole.
Ktn = 1.78
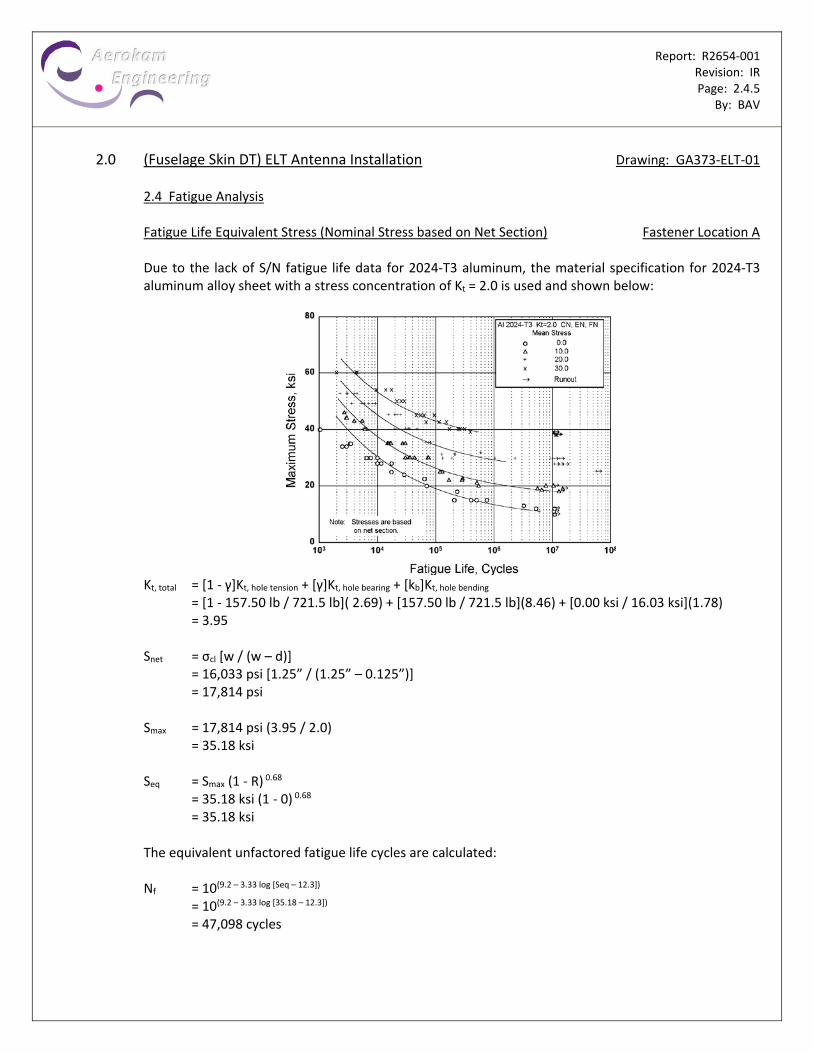
Report: R2654‐001 Revision: IR Page: 2.4.5 By: BAV
2.0 (Fuselage Skin DT) ELT Antenna Installation Drawing: GA373‐ELT‐01
2.4 Fatigue Analysis Fatigue Life Equivalent Stress (Nominal Stress based on Net Section) Fastener Location A Due to the lack of S/N fatigue life data for 2024‐T3 aluminum, the material specification for 2024‐T3 aluminum alloy sheet with a stress concentration of Kt = 2.0 is used and shown below:
Kt, total = [1 ‐ γ]Kt, hole tension + [γ]Kt, hole bearing + [kb]Kt, hole bending
= [1 ‐ 157.50 lb / 721.5 lb]( 2.69) + [157.50 lb / 721.5 lb](8.46) + [0.00 ksi / 16.03 ksi](1.78) = 3.95
Snet = σcl [w / (w – d)] = 16,033 psi [1.25” / (1.25” – 0.125”)] = 17,814 psi
Smax = 17,814 psi (3.95 / 2.0) = 35.18 ksi
Seq = Smax (1 ‐ R) 0.68
= 35.18 ksi (1 ‐ 0) 0.68
= 35.18 ksi
The equivalent unfactored fatigue life cycles are calculated: Nf = 10(9.2 – 3.33 log [Seq – 12.3])
= 10(9.2 – 3.33 log [35.18 – 12.3]) = 47,098 cycles

Report: R2654‐001 Revision: IR Page: 2.4.6 By: BAV
2.0 (Fuselage Skin DT) ELT Antenna Installation Drawing: GA373‐ELT‐01
2.4 Fatigue Analysis Fatigue Life Equivalent Stress Fastener Location A Scale Factor 1 Account for differences in scale and fidelity of the test data. Load Factor 1 Account for differences in loading type and fidelity of the test data. Reliability Factor 1 Account for differences in reliable life value from mean of characteristic life data. Scale Factor 2.0 Used to approximate a fastened joint Load Factor 1.5 Used for constant amplitude loading Reliability Factor 2.75 Used for aluminum material The factored fatigue life is calculated: N95%95% = 47,098 cycles / [(2.0) (1.5) (2.75)] = 5,709 cycles
1 Reference Number 8, Safarian, (Fatigue and Scatter Page 23)
Report: R2654‐001 Revision: IR Page: 2.4.7 By: BAV
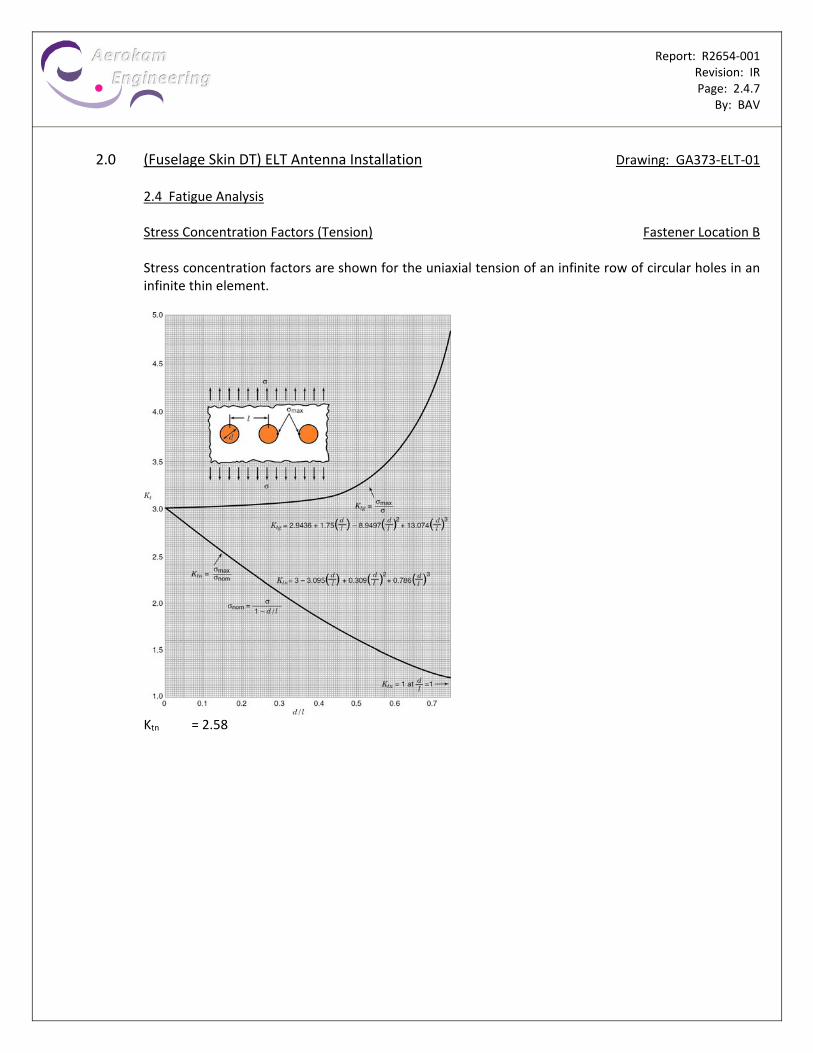
2.0 (Fuselage Skin DT) ELT Antenna Installation Drawing: GA373‐ELT‐01
2.4 Fatigue Analysis Stress Concentration Factors (Tension) Fastener Location B Stress concentration factors are shown for the uniaxial tension of an infinite row of circular holes in an infinite thin element.
Ktn = 2.58
Report: R2654‐001 Revision: IR Page: 2.4.8 By: BAV
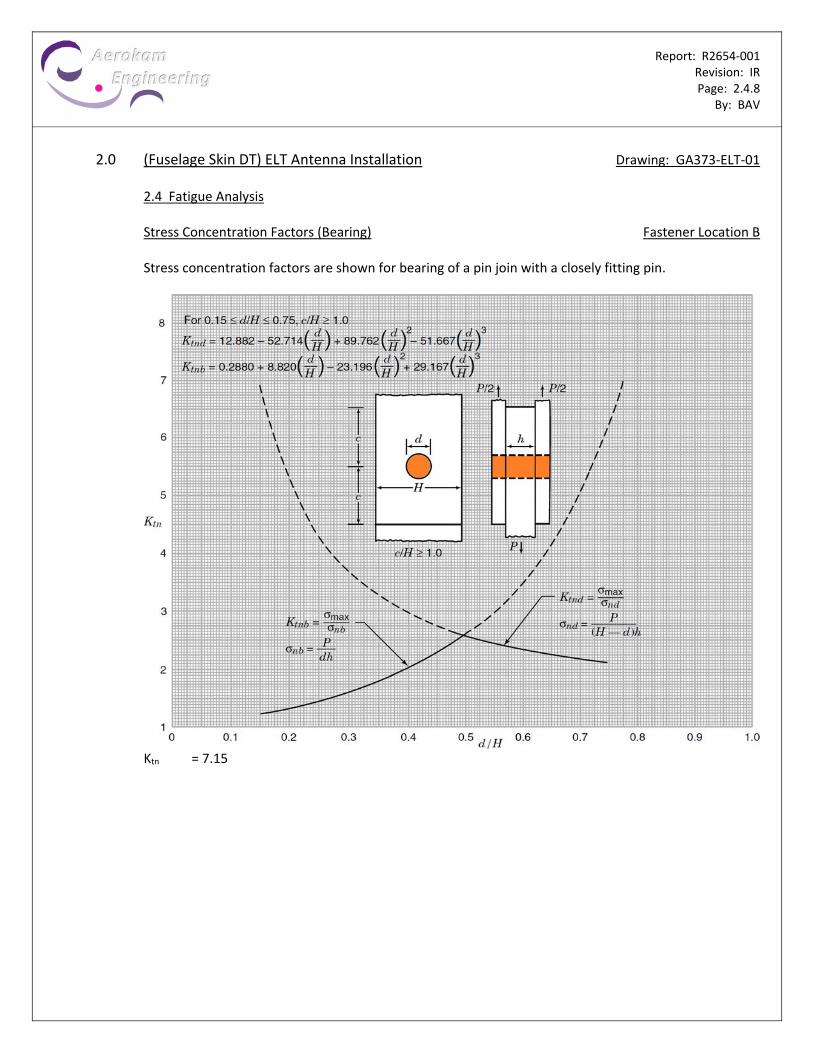
2.0 (Fuselage Skin DT) ELT Antenna Installation Drawing: GA373‐ELT‐01
2.4 Fatigue Analysis Stress Concentration Factors (Bearing) Fastener Location B Stress concentration factors are shown for bearing of a pin join with a closely fitting pin.
Ktn = 7.15

Report: R2654‐001 Revision: IR Page: 2.4.9 By: BAV
2.0 (Fuselage Skin DT) ELT Antenna Installation Drawing: GA373‐ELT‐01
2.4 Fatigue Analysis Stress Concentration Factors (Bending) Fastener Location B Stress concentration factors are shown for bending of a finite width plate with a circular hole.
Ktn = 1.72
Report: R2654‐001 Revision: IR Page: 2.4.10 By: BAV
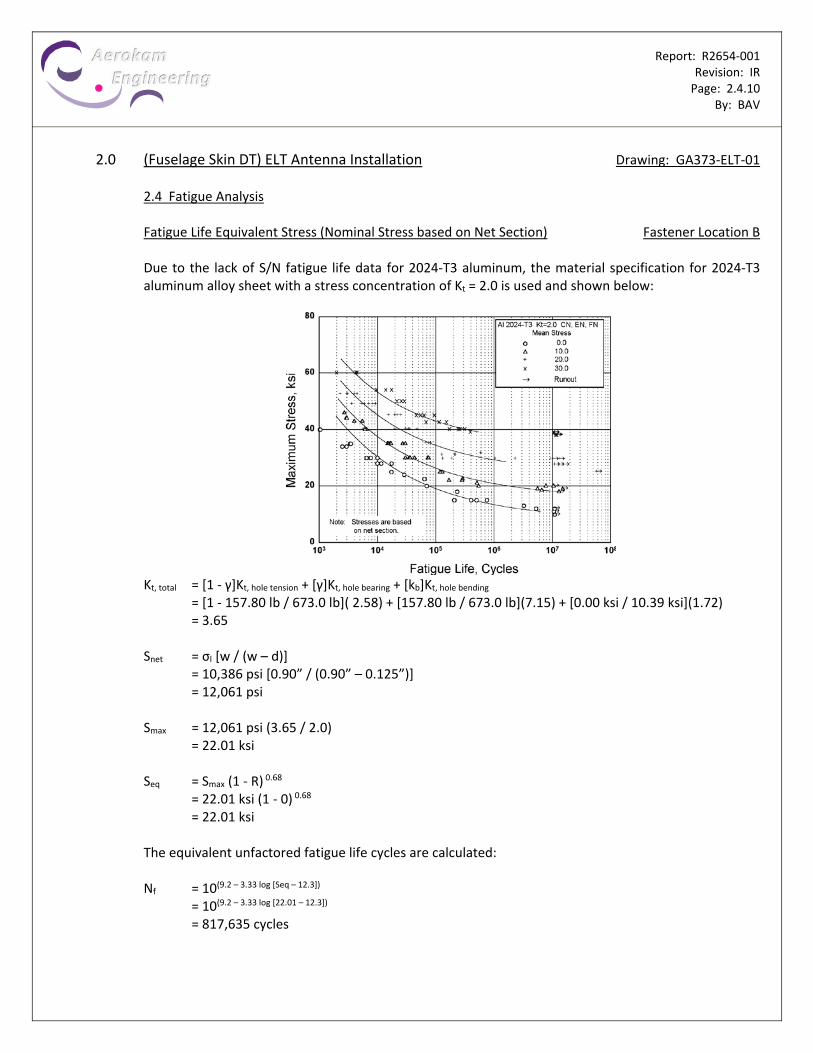
2.0 (Fuselage Skin DT) ELT Antenna Installation Drawing: GA373‐ELT‐01
2.4 Fatigue Analysis Fatigue Life Equivalent Stress (Nominal Stress based on Net Section) Fastener Location B Due to the lack of S/N fatigue life data for 2024‐T3 aluminum, the material specification for 2024‐T3 aluminum alloy sheet with a stress concentration of Kt = 2.0 is used and shown below:
Kt, total = [1 ‐ γ]Kt, hole tension + [γ]Kt, hole bearing + [kb]Kt, hole bending
= [1 ‐ 157.80 lb / 673.0 lb]( 2.58) + [157.80 lb / 673.0 lb](7.15) + [0.00 ksi / 10.39 ksi](1.72) = 3.65
Snet = σl [w / (w – d)] = 10,386 psi [0.90” / (0.90” – 0.125”)] = 12,061 psi
Smax = 12,061 psi (3.65 / 2.0) = 22.01 ksi
Seq = Smax (1 ‐ R) 0.68
= 22.01 ksi (1 ‐ 0) 0.68
= 22.01 ksi
The equivalent unfactored fatigue life cycles are calculated: Nf = 10(9.2 – 3.33 log [Seq – 12.3])
= 10(9.2 – 3.33 log [22.01 – 12.3]) = 817,635 cycles

Report: R2654‐001 Revision: IR Page: 2.4.11 By: BAV
2.0 (Fuselage Skin DT) ELT Antenna Installation Drawing: GA373‐ELT‐01
2.4 Fatigue Analysis Fatigue Life Equivalent Stress Fastener Location B Scale Factor 1 Account for differences in scale and fidelity of the test data. Load Factor 1 Account for differences in loading type and fidelity of the test data. Reliability Factor 1 Account for differences in reliable life value from mean of characteristic life data. Scale Factor 2.0 Used to approximate a fastened joint Load Factor 1.5 Used for constant amplitude loading Reliability Factor 2.75 Used for aluminum material The factored fatigue life is calculated: N95%95% = 817,635 cycles / [(2.0) (1.5) (2.75)] = 99,107 cycles
1 Reference Number 8, Safarian, (Fatigue and Scatter Page 23)
Report: R2654‐001 Revision: IR Page: 2.5.1 By: BAV
2.0 (Fuselage Skin DT) ELT Antenna Installation Drawing: GA373‐ELT‐01
2.5 Damage Tolerance Analysis Damage Tolerance Analysis (DTA) is an analytical way to establish inspection intervals for a highly fatigue loaded or geometrically critical area. Rogue Flaw and Normal Flaw A Rogue Flaw is considered to be a non‐visible defect or blemish in the structure caused by manufacturing, damage, or corrosion. This report uses a 0.05” length to define a Rogue Flaw. DTA assumes that one Rogue Flaw exists in the Principal Structural Element (PSE) or Fatigue Critical Structure (FCS) being reviewed. This Rogue Flaw is chosen to exist at either the highest fatigue loaded or geometrically critical area. The DTA then grows a crack from that location. A Normal Flaw is considered to be a microscopic defect in the structure. All metallic materials develop fatigue cracking from these Normal Flaws when subjected to cyclic tensile loading over extended periods of time. This report uses a 0.01” length to define a Normal Flaw. Critical Locations for Rogue Flaws During everyday flight, the stresses in the doubler and skin area around the fasteners are low and the deformations are basically elastic, causing the first row of fasteners to carry a higher load. As a consequence, cracks are most likely to occur at end‐row fasteners. For a detailed study of critical crack locations, see the Fatigue Analysis Section of this report.

Report: R2654‐001 Revision: IR Page: 2.5.2 By: BAV
2.0 (Fuselage Skin DT) ELT Antenna Installation Drawing: GA373‐ELT‐01
2.5 Damage Tolerance Analysis
AFGROW calculates the critical crack length for both fracture and net section yield. These are generated in a spreadsheet using the AFGROW output and the following relations:
Net Section Yield Criteria: Fracture If: σlimit ≥ σys [(net section width) / (full section width)] Note: The yield zone size, crack length, and any cutouts or fastener holes are subtracted from
the full section width to obtain the net section width. Fracture Criteria: Fracture If: σlimit ≥ Kcrit / [(πc)½ β] Where: Kcrit is the fracture toughness value of the given state of stress Kcrit = Kc (plane stress) Kcrit = K1c (plane strain) For intermediate states of stress, Kcrit is linearly interpolated between Kc & K1c

Report: R2654‐001 Revision: IR Page: 2.5.3 By: BAV
2.0 (Fuselage Skin DT) ELT Antenna Installation Drawing: GA373‐ELT‐01
2.5 Damage Tolerance Analysis
NASGRO da/dN curve for 2024‐T3 Aluminum
Report: R2654‐001 Revision: IR Page: 2.5.4 By: BAV
2.0 (Fuselage Skin DT) ELT Antenna Installation Drawing: GA373‐ELT‐01
2.5 Damage Tolerance Analysis
AFGROW – Input Fastener Location A Geometry Single Through Crack @ Hole (Phase Ia) Internal Through Crack (Phase II) Single Corner Crack @ Hole (Phase Ib) Dimensions width = 1.250 in width = 3.750 in thickness = 0.036 in thickness = 0.036 in hole diameter = 0.125 in crack length = 1.880 in crack length = 0.05 in (Phase Ia) half crack length = 0.940 in = 0.01 in (Phase Ib) Load tension stress ratio = 0.782 tension stress ratio = 1.000 bearing stress ratio = 2.183 bearing stress ratio = 0.000 da/dN Data (Phases I and II): Spectrum (Phases I and II): NASGRO Equation Stress Multiplication Factor = 16.03 ksi Material = 2024‐T3 Al (clad; plt & sht; T‐L) Residual Stress Requirement = 18.66 ksi Constant Amplitude Loading R = Stress Min / Stress Max = 0
Report: R2654‐001 Revision: IR Page: 2.5.5 By: BAV
2.0 (Fuselage Skin DT) ELT Antenna Installation Drawing: GA373‐ELT‐01
2.5 Damage Tolerance Analysis
Describe Crack Growth – Phase Ia Fastener Location A The critical geometric location for a Rogue Flaw is evaluated from Table 2.4.1 and the sketch on page 2.4.1 to be in the Fastener Location A. w = fastener pitch = 1.25 in
c = initial crack length = 0.05 in Before
After

Report: R2654‐001 Revision: IR Page: 2.5.6 By: BAV
2.0 (Fuselage Skin DT) ELT Antenna Installation Drawing: GA373‐ELT‐01
2.5 Damage Tolerance Analysis
Describe Crack Growth – Phase Ib Fastener Location A The critical geometric location for a Rogue Flaw is evaluated from Table 2.4.1 and the sketch on page 2.4.1 to be in the Fastener Location A. w = fastener pitch = 1.25 in
c = initial crack length = 0.01 in Before
After

Report: R2654‐001 Revision: IR Page: 2.5.7 By: BAV
2.0 (Fuselage Skin DT) ELT Antenna Installation Drawing: GA373‐ELT‐01
2.5 Damage Tolerance Analysis
Describe Crack Growth – Phase 2 Fastener Location A The critical geometric location for a Rogue Flaw is evaluated from Table 2.4.1 and the sketch on page 2.4.1 to be in the Fastener Location A. w = 3 x fastener pitch = 3.75 in
c = initial crack length = fastener pitch + fastener diameter + 2 x Phase 1b crack length = 1.25 in + 0.125 in + 2(0.252353 in) = 1.879706 in Before
After
Report: R2654‐001 Revision: IR Page: 2.5.8 By: BAV
2.0 (Fuselage Skin DT) ELT Antenna Installation Drawing: GA373‐ELT‐01
2.5 Damage Tolerance Analysis
AFGROW – Output Fastener Location A
Location A: Phase 1a
Constant amplitude loading
Single Through Crack at Hole ‐ Standard Solution
Cycles C Length Beta C Sub SpectruPath Life
0 0.05 1.847238 1 1 0
1800 0.060061 1.698577 19 19 1800
3700 0.070492 1.563099 38 38 3700
5600 0.080849 1.439527 57 57 5600
7500 0.091137 1.368748 76 76 7500
9400 0.10161 1.306734 95 95 9400
11200 0.111773 1.251927 113 113 11200
13000 0.122324 1.206249 131 131 13000
14700 0.132715 1.183383 148 148 14700
16300 0.142922 1.141624 164 164 16300
17900 0.15352 1.122684 180 180 17900
19400 0.163952 1.103325 195 195 19400
20800 0.174126 1.070016 209 209 20800
22200 0.184714 1.05551 223 223 22200
23500 0.195058 1.042538 236 236 23500
24700 0.205102 1.030548 248 248 24700
25900 0.215669 1.020029 260 260 25900
27000 0.225896 1.010548 271 271 27000
28100 0.236697 1.002577 282 282 28100
29100 0.247081 1.002577 292 292 29100
30100 0.258106 0.996613 302 302 30100
31000 0.268679 0.991934 311 311 31000
31800 0.278685 0.990462 319 319 31800
32600 0.289364 0.991503 327 327 32600
33300 0.299384 0.991503 334 334 33300
34000 0.310133 0.994345 341 341 34000
34700 0.3217 0.998762 348 348 34700
35300 0.332422 0.998762 354 354 35300
35900 0.344014 1.005125 360 360 35900
36400 0.354345 1.015769 365 365 36400
36900 0.365718 1.015769 370 370 36900
37400 0.378173 1.036087 375 375 37400
37800 0.389206 1.036087 379 379 37800
38200 0.402335 1.078885 383 383 38200
38500 0.413131 1.132126 386 386 38500
38800 0.426825 1.132126 389 389 38800
39100 0.442713 1.2026 392 392 39100
39300 0.455786 1.2026 394 394 39300
39500 0.473268 1.337069 396 396 39500
39600 0.484427 1.337069 397 397 39600
39700 0.49612 1.608808 398 398 39700
39794 0.520952 1.944652 398 398 39794
39837 0.551438 3.311682 399 399 39837

Report: R2654‐001 Revision: IR Page: 2.5.9 By: BAV
2.0 (Fuselage Skin DT) ELT Antenna Installation Drawing: GA373‐ELT‐01
2.5 Damage Tolerance Analysis
AFGROW – Output Fastener Location A Phase Ib
Location A: Phase 1b
Constant amplitude loading
Single Corner Crack at Hole ‐ Standard Solution
Cycles C Length A Length Beta C Beta A Sub SpectruPath Life
0 0.01 0.01 2.583718 3.027912 1 1 0
3700 0.016588 0.020295 2.616241 2.604876 38 38 3700
4800 0.020118 0.025257 2.55915 2.47733 49 49 4800
5800 0.024351 0.030875 2.507078 2.376063 59 59 5800
6400 0.027519 0.034823 2.467784 2.302912 65 65 6400
6400 0.027519 0.036 2.514749 2.302912 65 65 6400
6900 0.03044 0.036 2.439457 2.302912 70 70 6900
8600 0.040446 0.036 2.118866 2.302912 87 87 8600
10400 0.050841 0.036 1.830293 2.302912 105 105 10400
12200 0.060906 0.036 1.676684 2.302912 123 123 12200
14100 0.071343 0.036 1.540168 2.302912 142 142 14100
16000 0.08167 0.036 1.461692 2.302912 161 161 16000
17900 0.091973 0.036 1.355976 2.302912 180 180 17900
19800 0.102451 0.036 1.295676 2.302912 199 199 19800
21600 0.112671 0.036 1.241112 2.302912 217 217 21600
23400 0.123241 0.036 1.218218 2.302912 235 235 23400
25100 0.13364 0.036 1.174448 2.302912 252 252 25100
26700 0.143909 0.036 1.15342 2.302912 268 268 26700
28300 0.154536 0.036 1.115291 2.302912 284 284 28300
29800 0.164979 0.036 1.096439 2.302912 299 299 29800
31200 0.175179 0.036 1.079813 2.302912 313 313 31200
32600 0.185878 0.036 1.064386 2.302912 327 327 32600
33900 0.19631 0.036 1.037948 2.302912 340 340 33900
35100 0.206413 0.036 1.026478 2.302912 352 352 35100
36300 0.21705 0.036 1.016371 2.302912 364 364 36300
37400 0.227323 0.036 1.016371 2.302912 375 375 37400
38500 0.238182 0.036 1.007275 2.302912 386 386 38500
39500 0.24865 0.036 1.000214 2.302912 396 396 39500
39837 0.252353 0.036 0.994963 2.302912 399 399 39837

Report: R2654‐001 Revision: IR Page: 2.5.10 By: BAV
2.0 (Fuselage Skin DT) ELT Antenna Installation Drawing: GA373‐ELT‐01
2.5 Damage Tolerance Analysis
AFGROW – Output Fastener Location A Phase II
Location A: Phase 2
Constant amplitude loading
Internal Through Crack ‐ Standard Solution
Cycles C Length Beta C Sub SpectruPath Life
0 0.94 1.187488 1 1 0
100 0.968284 1.187488 2 2 100
200 0.998442 1.218837 3 3 200
300 1.034608 1.218837 4 4 300
400 1.073757 1.265781 5 5 400
500 1.124343 1.265781 6 6 500

Report: R2654‐001 Revision: IR Page: 2.5.11 By: BAV
2.0 (Fuselage Skin DT) ELT Antenna Installation Drawing: GA373‐ELT‐01
2.5 Damage Tolerance Analysis
AFGROW – Output Fastener Location A Flight Cycle Graph

Report: R2654‐001 Revision: IR Page: 2.5.12 By: BAV
2.0 (Fuselage Skin DT) ELT Antenna Installation Drawing: GA373‐ELT‐01
2.5 Damage Tolerance Analysis
AFGROW – Input Fastener Location B Geometry Single Through Crack @ Hole (Phase Ia) Dimensions width = 0.900 in thickness = 0.036 in hole diameter = 0.125 in crack length = 0.05 in (Phase Ia) Load tension stress ratio = 0.766 bearing stress ratio = 3.376 da/dN Data (Phases I and II): NASGRO Equation Stress Multiplication Factor = 10.39 ksi Material = 2024‐T3 Al (clad; plt & sht; T‐L) Residual Stress Requirement = 12.57 ksi Constant Amplitude Loading R = Stress Min / Stress Max = 0 Note: After further analysis, it has been determined that location B is not as critical as location A. The
Phase 1a AFGROW output has been provided on the following page for reference. In addition, to ensure conservatism, the minimum pitch combined with the maximum bearing ratio was used for this analysis.

Report: R2654‐001 Revision: IR Page: 2.5.13 By: BAV
2.0 (Fuselage Skin DT) ELT Antenna Installation Drawing: GA373‐ELT‐01
2.5 Damage Tolerance Analysis
AFGROW – Output Fastener Location B Phase Ia
Location B: Phase 1a
Constant amplitude loading
Single Through Crack at Hole ‐ Standard Solution
Cycles C Length Beta C Sub SpectruPath Life
0 0.05 2.354919 1 1 0
3600 0.060032 2.171349 37 37 3600
7300 0.070211 2.004388 74 74 7300
11000 0.080316 1.854587 111 111 11000
14700 0.090499 1.771974 148 148 14700
18300 0.100674 1.697934 184 184 18300
21700 0.110689 1.638126 218 218 21700
25000 0.120903 1.581761 251 251 25000
28100 0.131004 1.530327 282 282 28100
31100 0.14121 1.505783 312 312 31100
33900 0.151323 1.465997 340 340 33900
36600 0.1616 1.449463 367 367 36600
39100 0.171789 1.435699 392 392 39100
41400 0.181859 1.424875 415 415 41400
43600 0.192257 1.416607 437 437 43600
45600 0.202518 1.411497 457 457 45600
47400 0.212615 1.411427 475 475 47400
49100 0.22308 1.413586 492 492 49100
50600 0.233352 1.424266 507 507 50600
52000 0.244081 1.438093 521 521 52000
53200 0.254412 1.457403 533 533 53200
54300 0.265081 1.484941 544 544 54300
55300 0.276066 1.521517 554 554 55300
56100 0.286386 1.521517 562 562 56100
56800 0.297323 1.609135 569 569 56800
57400 0.30887 1.741058 575 575 57400
57800 0.3193 1.741058 579 579 57800
58100 0.329619 1.890786 582 582 58100
58400 0.34169 2.23571 585 585 58400
58600 0.358166 2.23571 587 587 58600
58756 0.385366 6.908799 588 588 58756
Report: R2654‐001 Revision: IR Page: 2.6.1 By: BAV
2.0 (Fuselage Skin DT) ELT Antenna Installation Drawing: GA373‐ELT‐01
2.6 Inspection Interval Calculations Definitions of Results Notation ainit = the initial rogue flaw crack length (assumed value) = 0.05” adet = the smallest crack size a given inspection method is assumed to be able to find acrit = the critical crack size at which the structure is assumed to fail Ndet = the number of cycles associated with adet Ncrit = the number of cycles associated with acrit Nfatigue = the number of cycles associated with the factored fatigue life

Report: R2654‐001 Revision: IR Page: 2.6.2 By: BAV
2.0 (Fuselage Skin DT) ELT Antenna Installation Drawing: GA373‐ELT‐01
2.6 Inspection Interval Calculations
Definitions of Results Notation Nthres = First Threshold Inspection Nsubs = Subsequent Inspections Threshold Inspection The guidelines for the initial threshold inspection occur based on the lesser of the following determining factors:
Ndet : The time taken for the initial rogue crack to propagate to the detectable length.
½Ncrit : One half the time taken for an initial rogue crack to propagate to the critical length.
Nfatigue : Factored fatigue life.
¾ LOV : Three quarters of the Limit of Validity of the aircraft. 1
Threshold of Supplemental Inspection Document (SSID) or Aircraft Limitation Inspection (ALI) Subsequent Inspection The guidelines for the repeat (subsequent) inspections occur based on the lesser of the following determining factors:
Nthres : The time taken for the threshold inspection to occur.
(Ncrit – Ndet) / N1 : The time taken for a detectable size crack to grow to the critical crack length. : N1 = analysis uncertainty factor = 4.0
1 Reference FAR Part 121.1115

Report: R2654‐001 Revision: IR Page: 2.6.3 By: BAV
2.0 (Fuselage Skin DT) ELT Antenna Installation Drawing: GA373‐ELT‐01
2.6 Inspection Interval Calculations
Inspection Cycles for Detectable Crack Lengths of 0.0625 in adet = Detectable Crack Length = 0.0625 in Ndet = 2,244 cycles 1 (at crack size = 0.0625 in) Nthres = Threshold Inspection
= Ndet or ½ Ncrit or Nfatigue or ¾ LOV use lowest value = 2,244 or ½ (60,737) or 5,709 or ¾ (75,000) = 2,244 or 30,369 or 5,709 or 56,250 = 2,244 cycles
Nsubs = Subsequent Inspections
= (Ncrit – Ndet) / N1 or Nthres use lowest value = (60,737 – 2,244) / 4.0 or 2,244 = 14,623 or 2,244 = 2,244 cycles
1 Reference Section 2.5 – Output

Report: R2654‐001 Revision: IR Page: 2.6.4 By: BAV
2.0 (Fuselage Skin DT) ELT Antenna Installation Drawing: GA373‐ELT‐01
2.6 Inspection Interval Calculations
Inspection Cycles for Detectable Crack Lengths of 0.125 in adet = Detectable Crack Length = 0.125 in Ndet = 13,437 cycles 1 (at crack size = 0.125 in) Nthres = Threshold Inspection
= Ndet or ½ Ncrit or Nfatigue or ¾ LOV use lowest value = 13,437 or ½ (60,737) or 5,709 or ¾ (75,000) = 13,437 or 30,369 or 5,709 or 56,250 = 5,709 cycles
Nsubs = Subsequent Inspections
= (Ncrit – Ndet) / N1 or Nthres use lowest value = (60,737 – 13,437) / 4.0 or 5,709 = 11,825 or 5,709 = 5,709 cycles
1 Reference Section 2.5 – Output

Report: R2654‐001 Revision: IR Page: 2.6.5 By: BAV
2.0 (Fuselage Skin DT) ELT Antenna Installation Drawing: GA373‐ELT‐01
2.6 Inspection Interval Calculations
Inspection Cycles for Detectable Crack Lengths of 0.250 in adet = Detectable Crack Length = 0.250 in Ndet = 29,364 cycles 1 (at crack size = 0.250 in) Nthres = Threshold Inspection
= Ndet or ½ Ncrit or Nfatigue or ¾ LOV use lowest value = 29,364 or ½ (60,737) or 5,709 or ¾ (75,000) = 29,364 or 30,369 or 5,709 or 56,250 = 5,709 cycles
Nsubs = Subsequent Inspections
= (Ncrit – Ndet) / N1 or Nthres use lowest value = (60,737 – 29,364) / 4.0 or 5,709 = 7,843 or 5,709 = 5,709 cycles
1 Reference Section 2.5 – Output

Report: R2654‐001 Revision: IR Page: 2.6.6 By: BAV
2.0 (Fuselage Skin DT) ELT Antenna Installation Drawing: GA373‐ELT‐01
2.6 Inspection Interval Calculations
Inspection Cycles for Detectable Crack Lengths of 0.750 in adet = Detectable Crack Length = 0.750 in Ndet = 39,837 cycles 1 (at crack size = 0.750 in) Nthres = Threshold Inspection
= Ndet or ½ Ncrit or Nfatigue or ¾ LOV use lowest value = 39,837 or ½ (60,737) or 5,709 or ¾ (75,000) = 39,837 or 30,369 or 5,709 or 56,250 = 5,709 cycles
Nsubs = Subsequent Inspections
= (Ncrit – Ndet) / N1 or Nthres use lowest value = (60,737 – 39,837) / 4.0 or 5,709 = 5,225 or 5,709 = 5,225 cycles
1 Reference Section 2.5 – Output

Report: R2654‐001 Revision: IR Page: 2.6.7 By: BAV
2.0 (Fuselage Skin DT) ELT Antenna Installation Drawing: GA373‐ELT‐01
2.6 Inspection Interval Calculations
Inspection Cycles for Detectable Crack Lengths of 1.00 in adet = Detectable Crack Length = 1.00 in Ndet = 39,837 cycles 1 (at crack size = 1.00 in) Nthres = Threshold Inspection
= Ndet or ½ Ncrit or Nfatigue or ¾ LOV use lowest value = 39,837 or ½ (60,737) or 5,709 or ¾ (75,000) = 39,837 or 30,369 or 5,709 or 56,250 = 5,709 cycles
Nsubs = Subsequent Inspections
= (Ncrit – Ndet) / N1 or Nthres use lowest value = (60,737 – 39,837) / 4.0 or 5,709 = 5,225 or 5,709 = 5,225 cycles
1 Reference Section 2.5 – Output

Report: R2654‐001 Revision: IR Page: 2.6.8 By: BAV
2.0 (Fuselage Skin DT) ELT Antenna Installation Drawing: GA373‐ELT‐01
2.6 Inspection Interval Calculations
Inspection Cycles for HFEC Detectable Crack Lengths For the inspection methods described in this report, specifically High Frequency Eddy Current, due to the protruding nature of the fastener head for the countersunk fasteners, the minimum detectable crack lengths for these inspection techniques are adjusted to be measured as the length extending beyond the fastener head.
The difference between the fastener head diameter and the fastener shank diameter must be added to the minimum detectable crack length of 0.0625” for High Frequency Eddy Current. High Frequency Eddy Current: adet = 0.0625” + (0.1742” – 0.125”) / 2 = 0.0871” adet = Detectable Crack Length = 0.0871 in Ndet = 6,754 cycles 1 (at crack size = 0.0871 in) Nthres = Threshold Inspection
= Ndet or ½ Ncrit or Nfatigue or ¾ LOV use lowest value = 6,754 or ½ (60,737) or 5,709 or ¾ (75,000) = 6,754 or 30,369 or 5,709 or 56,250 = 5,709 cycles
Nsubs = Subsequent Inspections
= (Ncrit – Ndet) / N1 or Nthres use lowest value = (60,737 – 6,754) / 4.0 or 5,709 = 13,496 or 5,709 = 5,709 cycles
1 Reference Section 2.5 – Output

Report: R2654‐001 Revision: IR Page: 2.6.9 By: BAV
2.0 (Fuselage Skin DT) ELT Antenna Installation Drawing: GA373‐ELT‐01
2.6 Inspection Interval Calculations
Inspection Cycles for LFEC Detectable Crack Lengths For the inspection methods described in this report, specifically Low Frequency Eddy Current, due to the protruding nature of the fastener head for the countersunk fasteners, the minimum detectable crack lengths for these inspection techniques are adjusted to be measured as the length extending beyond the fastener head.
The difference between the fastener head diameter and the fastener shank diameter must be added to the minimum detectable crack length of 0.125” for Low Frequency Eddy Current. Low Frequency Eddy Current: adet = 0.125” + (0.1742” – 0.125”) / 2 = 0.1496” adet = Detectable Crack Length = 0.1496 in Ndet = 17,308 cycles 1 (at crack size = 0.1496 in) Nthres = Threshold Inspection
= Ndet or ½ Ncrit or Nfatigue or ¾ LOV use lowest value = 17,308 or ½ (60,737) or 5,709 or ¾ (75,000) = 17,308 or 30,369 or 5,709 or 56,250 = 5,709 cycles
Nsubs = Subsequent Inspections
= (Ncrit – Ndet) / N1 or Nthres use lowest value = (60,737 – 17,308) / 4.0 or 5,709 = 10,857 or 5,709 = 5,709 cycles
1 Reference Section 2.5 – Output

Report: R2654‐001 Revision: IR Page: 2.6.10 By: BAV
2.0 (Fuselage Skin DT) ELT Antenna Installation Drawing: GA373‐ELT‐01
2.6 Inspection Interval Calculations
Summary of Inspection Intervals The following table lists inspection cycles for various minimum detectable flaw sizes. Only ONE inspection technique should be chosen, reference Section 7 for a summary of the suggested inspection method. The chart below cannot be directly incorporated into an ICA inspection program.
Table 2.6.1: Summary of Inspection Intervals
Minimum Detectable Flaw Size (in)
Threshold Inspection (cycles)
Repeat Inspections (cycles)
0.0625 2,244 cycles 2,244 cycles
0.125 5,709 cycles 5,709 cycles
0.25 5,709 cycles 5,709 cycles
0.75 5,709 cycles 5,225 cycles
1.00 5,709 cycles 5,225 cycles
HFEC (0.0625) 1 5,709 cycles 5,709 cycles
LFEC (0.125) 1 5,709 cycles 5,709 cycles
NOTE: The inspections described above are developed based on fatigue damage only; inspections
based on environmental or accidental damage are provided by the aircraft manufacturer.
1 Detectable length as measured beyond the fastener head.

Report: R2654‐001 Revision: IR Page: 2.7.1 By: BAV
2.0 (Fuselage Skin DT) ELT Antenna Installation Drawing: GA373‐ELT‐01
2.7 Summary and Conclusions It is recommended that a HFEC (High Frequency Eddy Current) inspection method be chosen to inspect the fuselage skin. Inspection Method (based on min. flaw size)
Minimum Detectable Flaw Size (in)
Threshold Inspection (cycles)
Repeat Inspections (cycles)
Limitations
HFEC – Surface Probe 0.0871
5,709
5,709 Surface flaws only.
Notes: 1. Follow Boeing 737‐400 OEM NDT manual for inspection process. 2. Gain access to the ELT Antenna, remove the antenna and inspect the fuselage skin from the
exterior of the fuselage, at each fastener location and coaxial feedthrough location as shown on the following pages. In Addition: Perform a general visual inspection along the perimeter of the doubler.
(View Looking Down at Doubler from Exterior)

Report: R2654‐001 Revision: IR Page: 2.7.2 By: BAV
2.0 (Fuselage Skin DT) ELT Antenna Installation Drawing: GA373‐ELT‐01
2.7 Summary and Conclusions High Frequency Eddy Current Inspection Method The principles of electromagnetic induction are used in high frequency eddy current inspection methods to detect surface and near‐surface cracks in the fuselage skin. The High Frequency NDI method can be used for the detection of cracks in the first layer of metal around fastener holes. Additional Inspection Notes: 1. Inspect the fuselage skin at each location shown in RED below.
(View Looking Down at Doubler from Exterior)

Report: R2654‐001 Revision: IR Page: 3.1.1 By: BAV
3.0 (Fuselage Frame DT) ELT Antenna Installation Drawing: GA373‐ELT‐01
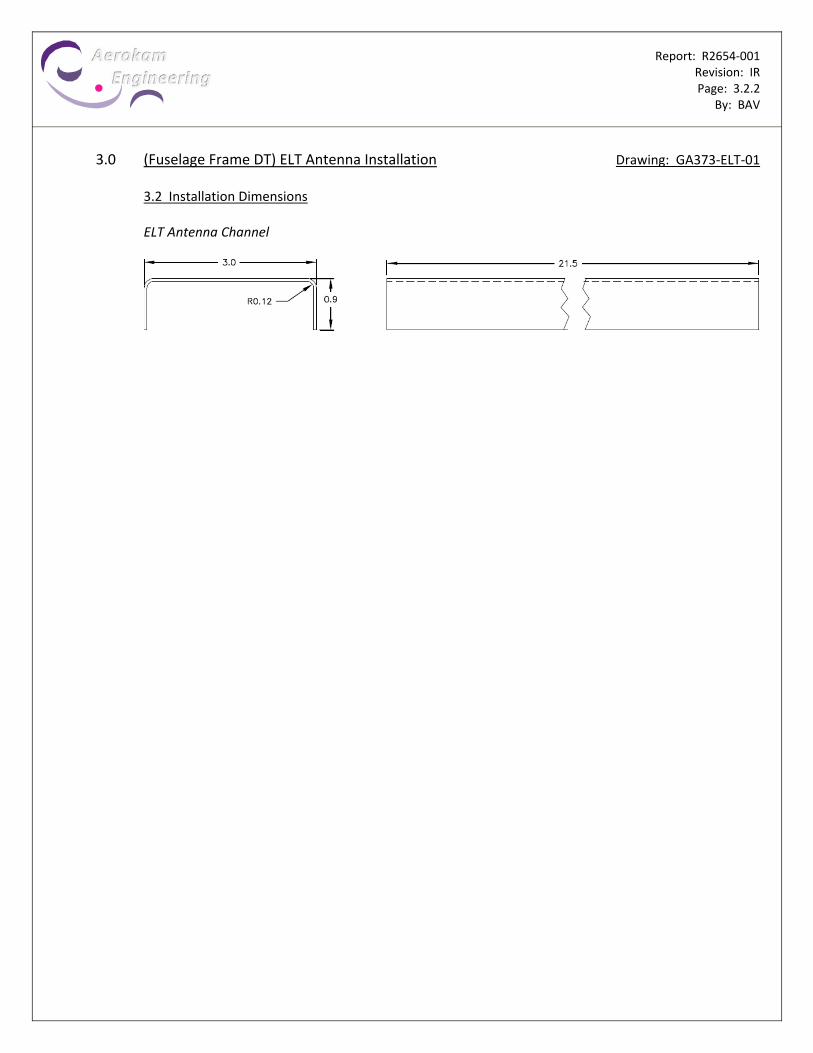
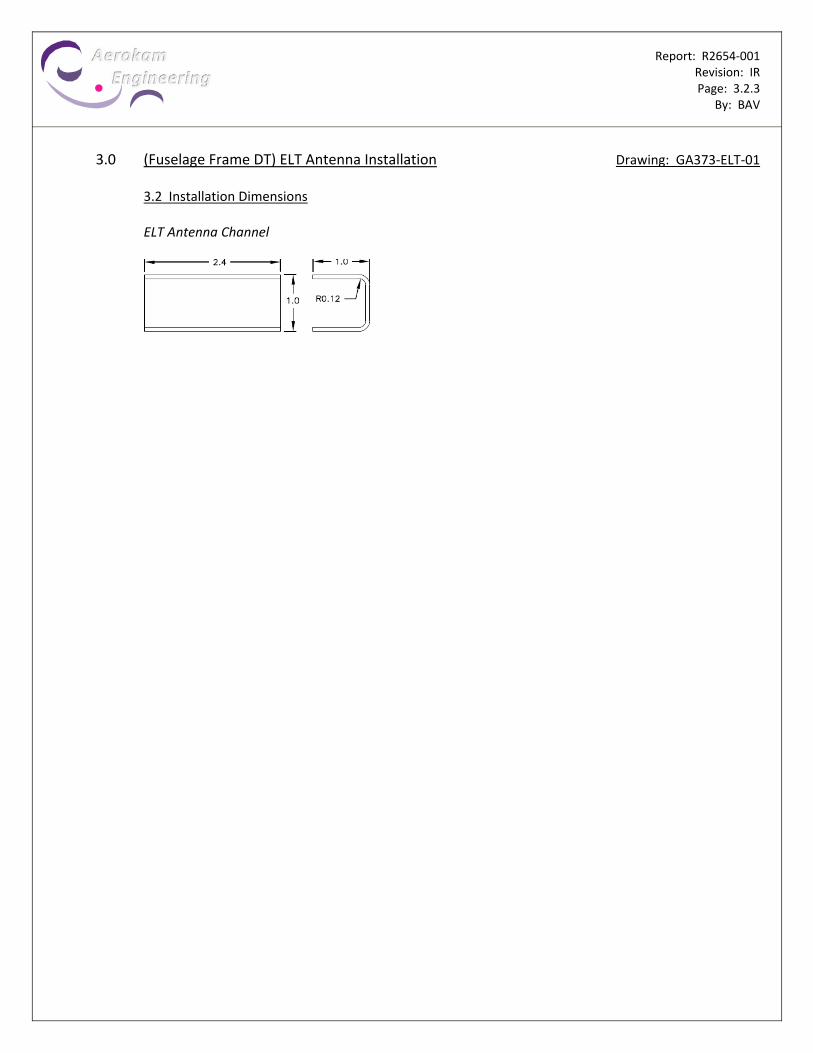
3.1 Description This chapter provides inspection intervals that are calculated using fatigue and damage tolerance analysis for the ELT Antenna installation on Boeing 737‐400 aircraft. The installation is designed per the General Aerospace installation drawing GA373‐ELT‐01 and fabrication drawing 040615. The ELT Antenna is located at FS 791 near centerline on the upper skin of the fuselage. The fuselage skin assembly, in this region, is fabricated from 0.036” thick 2024‐T3 aluminum per AMS‐QQ‐A‐250/5 with a bonded waffle doubler fabricated from 0.036” thick 2024‐T3 aluminum per AMS‐QQ‐A‐250/5. The frames in this region, frames 787 and 807, are fabricated from 0.40” thick 7075‐T6 aluminum per AMS‐QQ‐A‐287 per BAC1517‐1470. The doubler is approximately sized to 8.25” L x 6.15” W and fabricated from 0.036” thick 2024‐T3 aluminum per AMS‐QQ‐A‐250/4. The doubler is mounted internally to the fuselage skin assembly with (42) MS20470D5 field rivets. The ELT Antenna itself mounts to the fuselage with (6) AN509‐10R screws that each attach to BACN10JZ3 nutplates. Each BACN10JZ3 nutplate subsequently attaches to the internal doubler using MS20426AD3 rivets. A channel spans between frames 787 and 807 attaching to the lower flange of the frames using (3) MS20470D5 rivets. As shown on the following pages, per installation drawing GA373‐ELT‐01, inspection intervals are calculated using fatigue and damage tolerance analysis for the ELT Antenna attachments.
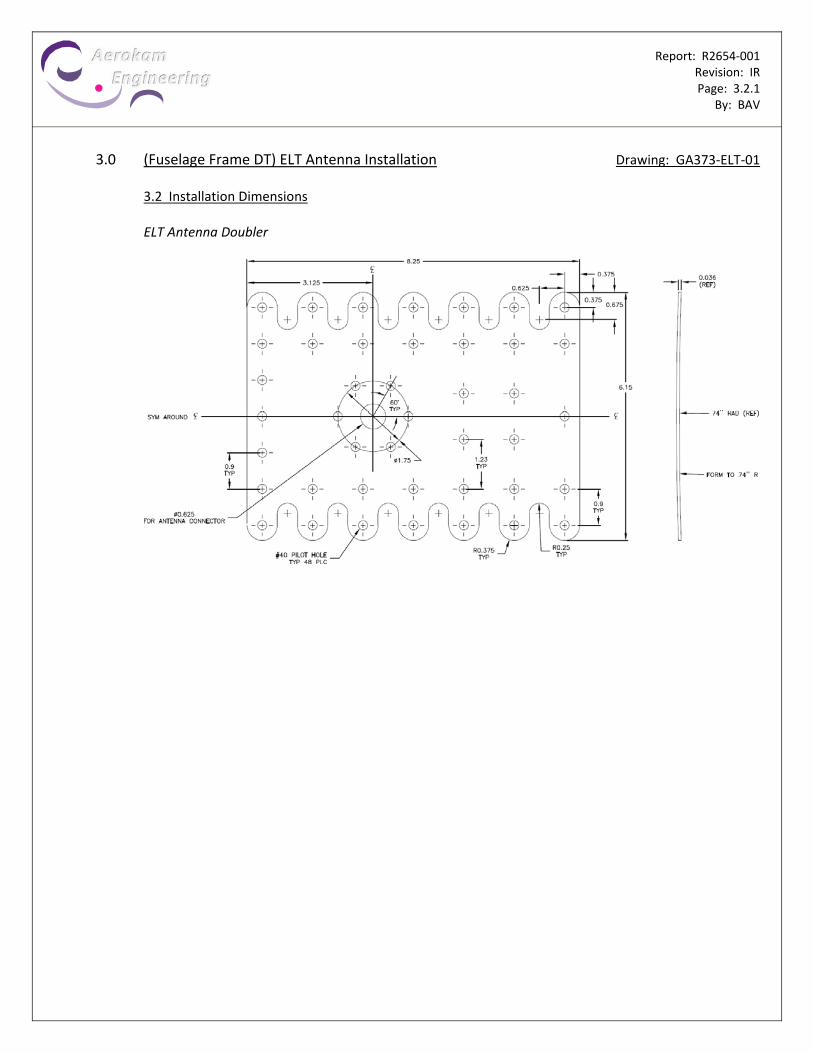
Report: R2654‐001 Revision: IR Page: 3.2.1 By: BAV
3.0 (Fuselage Frame DT) ELT Antenna Installation Drawing: GA373‐ELT‐01
3.2 Installation Dimensions ELT Antenna Doubler
Report: R2654‐001 Revision: IR Page: 3.2.2 By: BAV
3.0 (Fuselage Frame DT) ELT Antenna Installation Drawing: GA373‐ELT‐01
3.2 Installation Dimensions ELT Antenna Channel
Report: R2654‐001 Revision: IR Page: 3.2.3 By: BAV
3.0 (Fuselage Frame DT) ELT Antenna Installation Drawing: GA373‐ELT‐01
3.2 Installation Dimensions ELT Antenna Channel
Report: R2654‐001 Revision: IR Page: 3.3.1 By: BAV
3.0 (Fuselage Frame DT) ELT Antenna Installation Drawing: GA373‐ELT‐01
3.3 Load Analysis General Aircraft Data
Supplemental Cabin Pressurization Data: COA = Aircraft Standard Cabin Altitude = 8,000 ft 1 MOA = Aircraft Maximum Operating Altitude = 37,000 ft 2 PCOA = Standard Air Pressure at Cabin Operating Altitude 3 = 1,572.1 lb / ft2 PMOA = Standard Air Pressure at Maximum Operating Altitude 3 = 453.86 lb / ft2 Pop = Maximum Operational Differential Cabin Pressure Loading = (PSCA – PMOA) (1 ft² / 144 in²) = (1,572.1 lb / ft² – 453.86 lb / ft²) (1 ft² / 144 in²) = 7.77 psi Pop = Maximum Operational Differential Cabin Outflow Pressure Valve Setting 4 = 7.80 psi Supplemental Fuselage Bending Data: For Boeing 737‐400 Aircraft: 5
Forward Pressure Bulkhead Location = FS 178.00 ELT Antenna Location = FS 1091.00 (FS 791 +300” Extension) Rearward Pressure Bulkhead Location = FS 1342.00 (FS 1042 +300” Extension)
Wt = ½ of Aircraft Maximum Take‐Off Weight 6 = ½ (150,000 lbs) = 75,000 lbs
1 Reference Number 1, FAR Part 25.841(a) 2 Reference FAA Type Certificate Data Sheet: A16WE Revision 56, (Page 16) 3 Reference Appendix A, Standard Atmospheric Tables, (Pages A.1 – A.3) 4 Reference Appendix A, Boeing 737‐400 Maintenance Manual, (Pages A.4 – A.7) 5 Reference Appendix A, Boeing 737‐400 Aircraft Structural Repair Manual, (Pages A.8 – A.10) 6 Reference Boeing 737‐400 Airplane Characteristics for Airport Planning

Report: R2654‐001 Revision: IR Page: 3.3.2 By: BAV
3.0 (Fuselage Frame DT) ELT Antenna Installation Drawing: GA373‐ELT‐01
3.3 Load Analysis
Operational Loading Compute Operational Pressurization Skin Stresses: 1 As the cabin is pressurized, the skin expands outward, carrying the stringers with it. The majority of the pressure load is carried in hoop tension in the skin with the remainder being beamed to the frames by the stringers and skin. The distribution of pressure loads to the skin, stringers, and frame depends on the relative stiffness of these elements. The analysis that follows conservatively ignores the stiffening effects of the stringers and frames. Assuming the aircraft to act as a thin‐walled cylindrical pressure vessel with uniform internal pressure with the ends capped, the operational skin stresses are as follows:
cop = operational circumferential skin stress = Pop R / ts = (7.80 psi) (74.00 in) / (0.036 in) = 16,033 psi
lop = operational longitudinal skin stress = Pop R / 2 ts = (7.80 psi) (74.00 in) / [2 (0.036 in)] = 8,017 psi
1 Reference Number 3, Broek, (Pages 15 ‐ 19) & Reference Number 6, Roark, (Page 448)

Report: R2654‐001 Revision: IR Page: 3.3.3 By: BAV
3.0 (Fuselage Frame DT) ELT Antenna Installation Drawing: GA373‐ELT‐01
3.3 Load Analysis
Operational Loading Compute Fuselage Bending Stresses The cyclic bending stresses are due to inertia as a consequence of vertical loads on the wing. Only the fuselage weight is of importance for fuselage bending; it is assumed evenly distributed. Moments due to down loads, or aircraft weight, place the fuselage top in tension and bottom in compression.
To calculate the maximum stress on the skin of the fuselage, cantilever beam theory is used where the bending moment is at a maximum near the aircraft center and zero at its ends. The effect of longitudinal stringers on bending stress is accounted for using a typical stiffening ratio of 0.4. The resulting stress due to bending is added to the cabin pressurization tensile stress calculated using pressure vessel theory. 1
1 Reference Number 3, Broek, (Pages 15 ‐ 19)

Report: R2654‐001 Revision: IR Page: 3.3.4 By: BAV
3.0 (Fuselage Frame DT) ELT Antenna Installation Drawing: GA373‐ELT‐01
3.3 Load Analysis
Operational Loading Compute Fuselage Bending Stresses
Bending Calculations 1 X = length from forward pressure bulkhead to installation
= 1091.00 in – 178.00 in = 913.00 in
L = length from forward pressure bulkhead to rearward pressure bulkhead = 1342.00 in – 178.00 in = 1,164.00 in
Mb = fuselage bending moment at the installation location = [Wt (L – X)2] / 2L = [(75,000 lb) (1,164 in – 913 in)2] / [2 (1,164 in)] = 2,029,671 in‐lbs
b = fuselage bending stress at the installation location
= [(Mb sin θ) / ( R2 ts)] / (1 + 0.8)
= {[(2,029,671 in‐lb) sin (90˚)] / [ (74 in) 2 (0.036 in)]} / [1 + 0.8] = 1,822 psi
The 1.0g fuselage bending condition shown in the preceding calculations is not sufficient to cover normal operating flight conditions. An additional 1.3g factor is therefore used in this analysis to conservatively account for operational loading conditions. For the total tensile longitudinal far‐field stresses used throughout this report, the far‐field bending stresses are superposed to the far‐field pressurization stress for a total far‐field stress of 8,017 psi + 1.3 x (1,822) psi = 10,386 psi.
1 Reference Number 3, Broek, (Pages 15 ‐ 19)

Report: R2654‐001 Revision: IR Page: 3.3.5 By: BAV
3.0 (Fuselage Frame DT) ELT Antenna Installation Drawing: GA373‐ELT‐01
3.3 Load Analysis
Operational Loading Compute Operational Stresses due to Cabin Pressurization (Skin‐Frame Strain Compatibility): As the cabin is pressurized, the skin expands outward, carrying the stringers with it. The majority of the pressure load is carried in hoop tension in the skin with the remainder being beamed to the frames by the stringers and skin.
lop + b = operational longitudinal skin membrane stress + fuselage bending stress = 10,386 psi
The stresses in the circumferential direction can be calculated from the circumferential load equilibrium and the strain equilibrium between the skin and the frames. Circumferential Load Equilibrium:
sk_cop L ts + f_cop Aframe = Pop R L Strain Equilibrium:
Eε = f_cop = sk_cop – ν lop + b
RADIUS
THICKNESS Pop
FRAME AREA
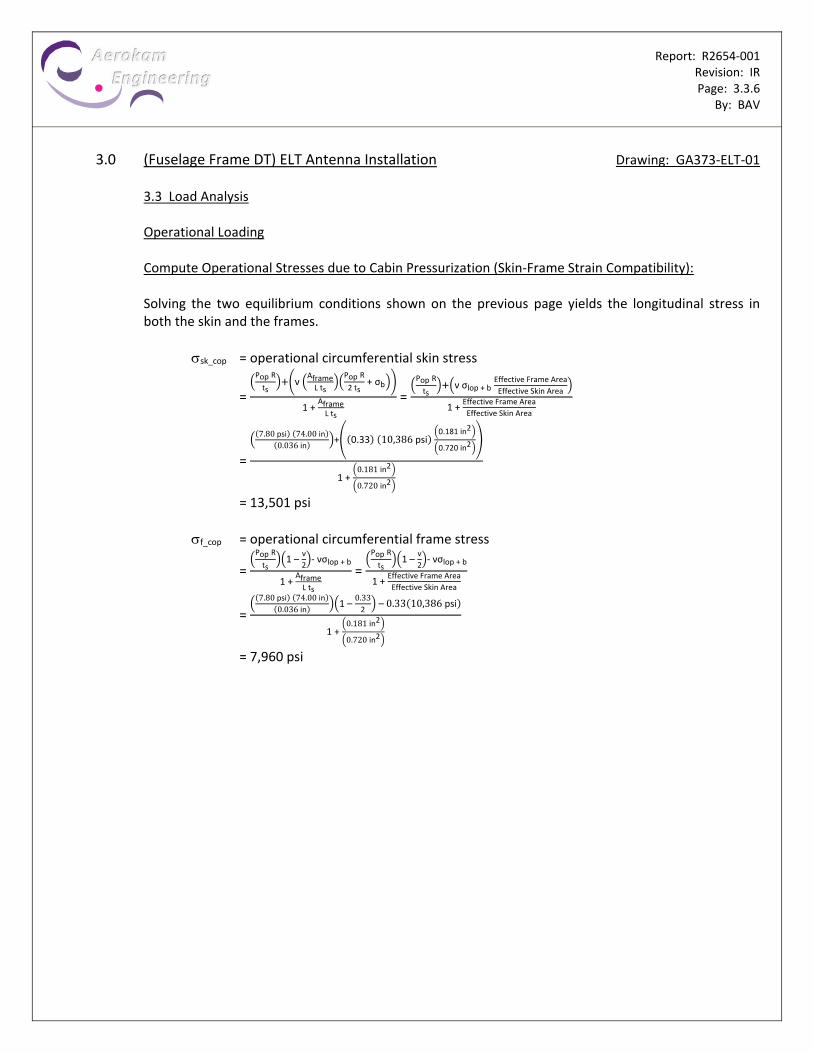
Report: R2654‐001 Revision: IR Page: 3.3.6 By: BAV
3.0 (Fuselage Frame DT) ELT Antenna Installation Drawing: GA373‐ELT‐01
3.3 Load Analysis
Operational Loading Compute Operational Stresses due to Cabin Pressurization (Skin‐Frame Strain Compatibility): Solving the two equilibrium conditions shown on the previous page yields the longitudinal stress in both the skin and the frames.
sk_cop = operational circumferential skin stress
=
Pop R
tsν
AframeL ts
Pop R
2 ts + σb
1 + AframeL ts
=
Pop R
tsν σlop + b
Effective Frame Area
Effective Skin Area
1 + Effective Frame Area
Effective Skin Area
=
7.80 psi 74.00 in0.036 in
+ 0.33 10,386 psi 0.181 in2
0.720 in2
1 + 0.181 in2
0.720 in2
= 13,501 psi
f_cop = operational circumferential frame stress
=
Pop R
ts1 –
ν
2‐ νσlop + b
1 + AframeL ts
=
Pop R
ts1 –
ν
2‐ νσlop + b
1 + Effective Frame Area
Effective Skin Area
=
7.80 psi 74.00 in0.036 in
1 – 0.332
– 0.33 10,386 psi
1 + 0.181 in2
0.720 in2
= 7,960 psi

Report: R2654‐001 Revision: IR Page: 3.3.7 By: BAV
3.0 (Fuselage Frame DT) ELT Antenna Installation Drawing: GA373‐ELT‐01
3.3 Load Analysis
Operational Loading Summary of Stresses Frame Circumferential Loading Circumferential Far‐Field Stress: 7,960 psi

Report: R2654‐001 Revision: IR Page: 3.3.8 By: BAV
3.0 (Fuselage Frame DT) ELT Antenna Installation Drawing: GA373‐ELT‐01
3.3 Load Analysis
Operational Loading Fastener Load Distribution (Circumferential) Using displacement compatibility analysis of the clip‐to‐frame joint, it is possible to calculate the fastener loads in the fastener rows. The compatible displacement criterion is based upon the condition that the clip and frame must undergo equal displacements. A typical strip is idealized based upon the fastener spacing and pitch as shown below.
Each fastener is simulated as an elastic spring under shear load. Each portion of the frame and clip strip is idealized as a bar. Note: The analysis that follows assumes that the fastener joint involves the frame and clip. The
displacements in the fastener holes are non‐linear, so a linear approximation is made. Multiple locations were considered on the clip in the circumferential loading direction; only the most critical fastener location / geometry is analyzed on the following pages.

Report: R2654‐001 Revision: IR Page: 3.3.9 By: BAV
3.0 (Fuselage Frame DT) ELT Antenna Installation Drawing: GA373‐ELT‐01
3.3 Load Analysis
Operational Loading Fastener Load Distribution (Circumferential)
From the definition of flexibility C = 1/Stiffness = riv/F f = deflection of fastener under load 1 = R (8.65714 E‐06 in/lb) [at all fastener rows] ts1 = thickness of frame = 0.040 in td1 = thickness of clip = 0.032 in w1 = fastener pitch = 0.624 in s1 = fastener spacing = 0.80 in
df1 = fastener diameter = 0.156 in a = empirical constant; = 2/5 for riveted metallic joints b = empirical constant; = 2.2 for riveted metallic joints Es = Young’s Modulus for Aluminum Skin = 10,500,000 psi Ed = Young’s Modulus for Aluminum Doubler = 10,500,000 psi Ef = Young’s Modulus for Aluminum Fasteners = 10,400,000 psi N = circumferential load in strip
= ref (cross‐sectional area) = (7,960 psi) (0.624 in) (0.040 in) = 198.7 lb
1 Reference Number 11, Huth, (Page 28)
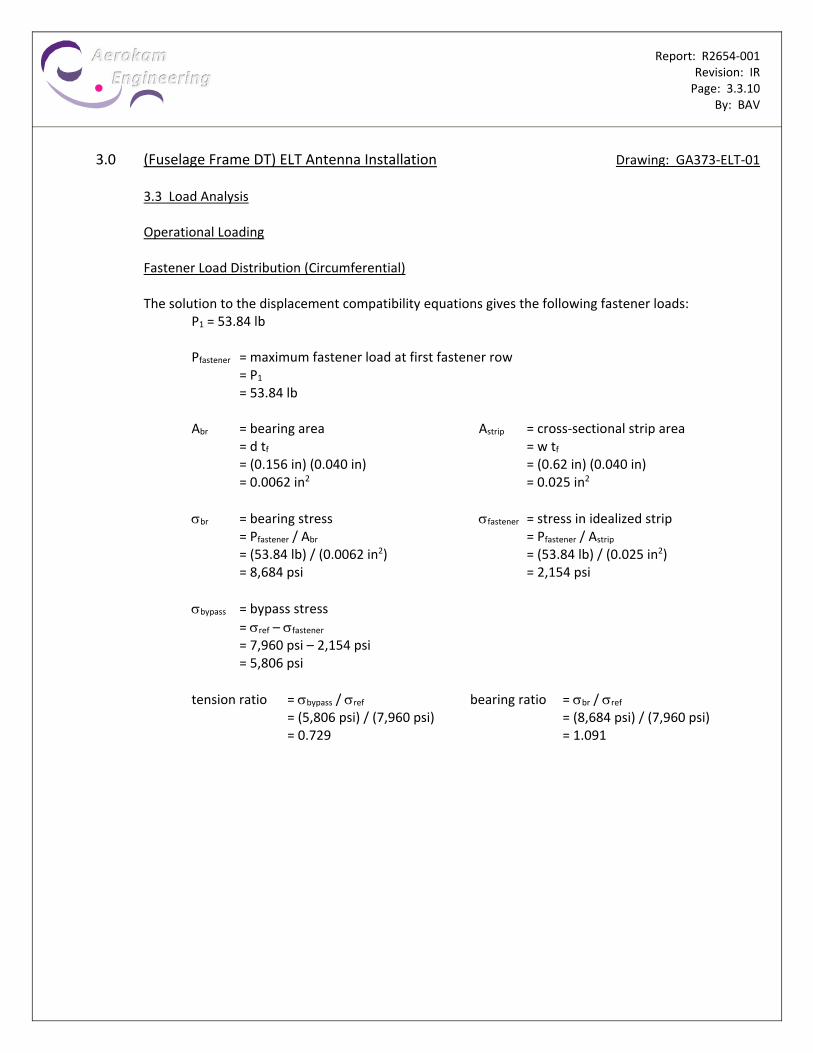
Report: R2654‐001 Revision: IR Page: 3.3.10 By: BAV
3.0 (Fuselage Frame DT) ELT Antenna Installation Drawing: GA373‐ELT‐01
3.3 Load Analysis
Operational Loading Fastener Load Distribution (Circumferential) The solution to the displacement compatibility equations gives the following fastener loads:
P1 = 53.84 lb
Pfastener = maximum fastener load at first fastener row = P1 = 53.84 lb Abr = bearing area Astrip = cross‐sectional strip area = d tf = w tf = (0.156 in) (0.040 in) = (0.62 in) (0.040 in) = 0.0062 in2 = 0.025 in2
br = bearing stress fastener = stress in idealized strip = Pfastener / Abr = Pfastener / Astrip = (53.84 lb) / (0.0062 in2) = (53.84 lb) / (0.025 in2) = 8,684 psi = 2,154 psi
bypass = bypass stress
= ref – fastener = 7,960 psi – 2,154 psi = 5,806 psi
tension ratio = bypass / ref bearing ratio = br / ref = (5,806 psi) / (7,960 psi) = (8,684 psi) / (7,960 psi) = 0.729 = 1.091
Report: R2654‐001 Revision: IR Page: 3.3.11 By: BAV
3.0 (Fuselage Frame DT) ELT Antenna Installation Drawing: GA373‐ELT‐01
3.3 Load Analysis
Limit Loading Residual Strength Analysis Residual strength calculations done in this report generate the critical crack length on the basis of linear elastic fracture mechanics and the stress intensity factor, K. FAR 25.571(b)(5) [i & ii] gives the requirements necessary for the residual strength calculations. Two separate conditions must be considered for 51 of FAR 25.571… Condition (i): Normal Pressure Combined with Limit Flight Loads Condition (ii): Factored Pressure Loading

Report: R2654‐001 Revision: IR Page: 3.3.12 By: BAV
3.0 (Fuselage Frame DT) ELT Antenna Installation Drawing: GA373‐ELT‐01
3.3 Load Analysis
Limit Loading Residual Strength Analysis i. Normal Pressure Combined with Limit (Maneuvering / Gust / Roll / Yaw) Load 1
W = maximum take‐off weight = 150,000 lbs Nz = maximum positive limit maneuvering load (between 2.5 & 3.8)
= 2.1 + 24,000 / (W+10,000) = 2.5
rs = longitudinal residual strength allowable for skin = [(Pop +0.5 psi 2) R] / [2 ts] + Nz σb
= [(7.80 psi + 0.5 psi) (74.00 in)] / [2 (0.036 in)] + (2.5) (1,822 psi) = 12,572 psi
ii. Factored Pressure Loading 3
rs = circumferential residual strength allowable for skin = [1.10 Pop +0.5 psi 4] R / ts = [((1.10) 7.80 psi + 0.5 psi) (74.00 in)] / [0.036 in] = 18,664 psi
Using the same methods employed in the operational loading section of this chapter, the resultant limit frame stress is 9,993 psi.
1 Reference Number 1, FAR Part 25.571(b)(5)(i) 2 Aerodynamic pressure conservatively assumed to be 0.5 psi 3 Reference Number 1, FAR Part 25.571(b)(5)(ii) 4 Aerodynamic pressure conservatively assumed to be 0.5 psi

Report: R2654‐001 Revision: IR Page: 3.4.1 By: BAV
3.0 (Fuselage Frame DT) ELT Antenna Installation Drawing: GA373‐ELT‐01
3.4 Fatigue Analysis Critical Locations for Stress Concentrations The fatigue lifetime of the fuselage frame is evaluated around the clip, examining the fastener pattern of the modification in critical areas. The following table and figure lists critical areas where stress concentration factors are high.
Table 3.4.1: Critical Crack Areas
Item Description Stress Concentration Stress Spectrum
Location A Frame Kt, tension = 2.26; Kt, bearing = 4.51; Kt, bending = 1.58 0 7.96 ksi
Critical Case (Fatigue): Fastener Location A Critical Case (Damage Tolerance): Fastener Location A
Report: R2654‐001 Revision: IR Page: 3.4.2 By: BAV
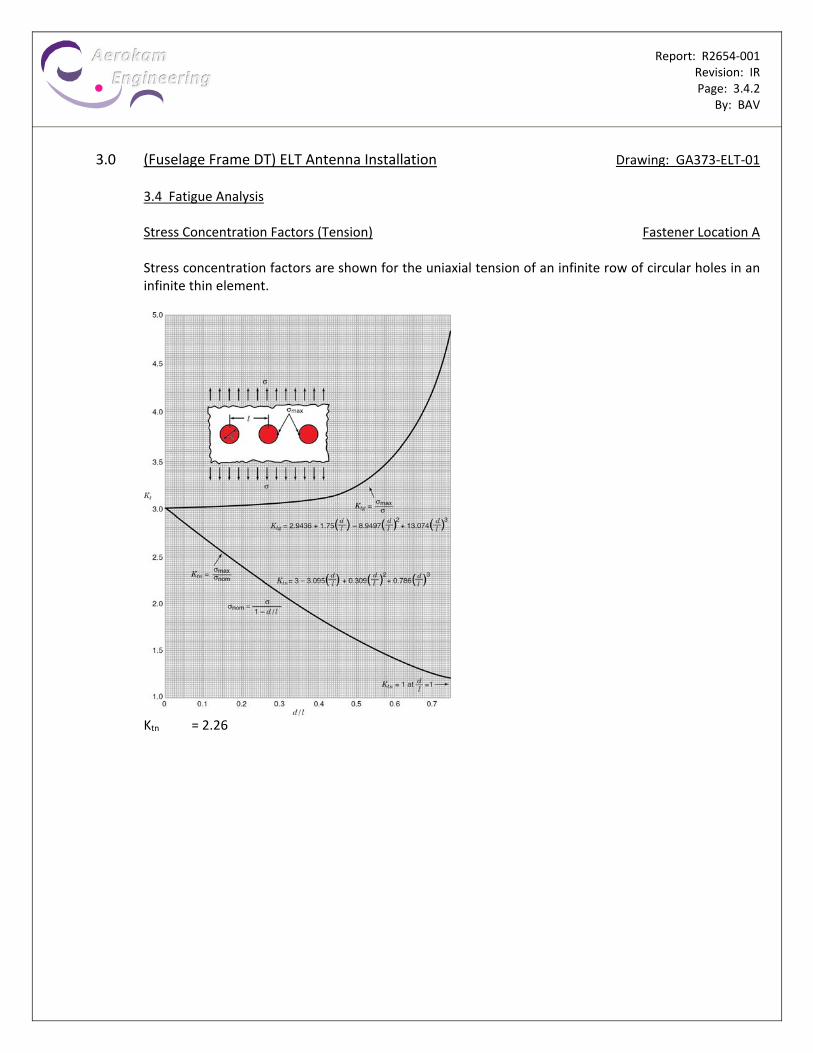
3.0 (Fuselage Frame DT) ELT Antenna Installation Drawing: GA373‐ELT‐01
3.4 Fatigue Analysis Stress Concentration Factors (Tension) Fastener Location A Stress concentration factors are shown for the uniaxial tension of an infinite row of circular holes in an infinite thin element.
Ktn = 2.26

Report: R2654‐001 Revision: IR Page: 3.4.3 By: BAV
3.0 (Fuselage Frame DT) ELT Antenna Installation Drawing: GA373‐ELT‐01
3.4 Fatigue Analysis Stress Concentration Factors (Bearing) Fastener Location A Stress concentration factors are shown for bearing of a pin join with a closely fitting pin.
Ktn = 4.51

Report: R2654‐001 Revision: IR Page: 3.4.4 By: BAV
3.0 (Fuselage Frame DT) ELT Antenna Installation Drawing: GA373‐ELT‐01
3.4 Fatigue Analysis Stress Concentration Factors (Bending) Fastener Location A Stress concentration factors are shown for bending of a finite width plate with a circular hole.
Ktn = 1.58

Report: R2654‐001 Revision: IR Page: 3.4.5 By: BAV
3.0 (Fuselage Frame DT) ELT Antenna Installation Drawing: GA373‐ELT‐01
3.4 Fatigue Analysis Fatigue Life Equivalent Stress (Nominal Stress based on Net Section) Fastener Location A The material specification for 7075‐T6 aluminum alloy sheet with a stress concentration of Kt = 2.0 is used and shown below:
Kt, total = [1 ‐ γ]Kt, hole tension + [γ]Kt, hole bearing + [kb]Kt, hole bending
= [1 ‐ 53.84 lb / 198.7 lb]( 2.26) + [53.84 lb / 198.7 lb](4.51) + [0.00 ksi / 16.03 ksi](1.58) = 2.87
Snet = σref [w / (w – d)] = 7,960 psi [0.62” / (0.62” – 0.156”)] = 10,636 psi
Smax = 10,636 psi (2.87 / 1.0) = 30.53 ksi
Seq = Smax (1 ‐ R) 0.49
= 30.53 ksi (1 ‐ 0) 0.49
= 30.53 ksi
The equivalent unfactored fatigue life cycles are calculated: Nf = 10(14.86 – 5.80 log [Seq])
= 10(14.86 – 5.80 log [30.53]) = 1,772,493 cycles

Report: R2654‐001 Revision: IR Page: 3.4.6 By: BAV
3.0 (Fuselage Frame DT) ELT Antenna Installation Drawing: GA373‐ELT‐01
3.4 Fatigue Analysis Fatigue Life Equivalent Stress Fastener Location A Scale Factor 1 Account for differences in scale and fidelity of the test data. Load Factor 1 Account for differences in loading type and fidelity of the test data. Reliability Factor 1 Account for differences in reliable life value from mean of characteristic life data. Scale Factor 2.0 Used to approximate a fastened joint Load Factor 1.5 Used for constant amplitude loading Reliability Factor 2.75 Used for aluminum material The factored fatigue life is calculated: N95%95% = 1,772,493 cycles / [(2.0) (1.5) (2.75)] = 214,848 cycles
1 Reference Number 8, Safarian, (Fatigue and Scatter Page 23)

Report: R2654‐001 Revision: IR Page: 3.5.1 By: BAV
3.0 (Fuselage Frame DT) ELT Antenna Installation Drawing: GA373‐ELT‐01
3.5 Damage Tolerance Analysis Damage Tolerance Analysis (DTA) is an analytical way to establish inspection intervals for a highly fatigue loaded or geometrically critical area. Rogue Flaw and Normal Flaw A Rogue Flaw is considered to be a non‐visible defect or blemish in the structure caused by manufacturing, damage, or corrosion. This report uses a 0.05” length to define a Rogue Flaw. DTA assumes that one Rogue Flaw exists in the Principal Structural Element (PSE) or Fatigue Critical Structure (FCS) being reviewed. This Rogue Flaw is chosen to exist at either the highest fatigue loaded or geometrically critical area. The DTA then grows a crack from that location. A Normal Flaw is considered to be a microscopic defect in the structure. All metallic materials develop fatigue cracking from these Normal Flaws when subjected to cyclic tensile loading over extended periods of time. This report uses a 0.01” length to define a Normal Flaw. Critical Locations for Rogue Flaws During everyday flight, the stresses in the clip and frame area around the fasteners are low and the deformations are basically elastic, causing the first row of fasteners to carry a higher load. As a consequence, cracks are most likely to occur at end‐row fasteners. For a detailed study of critical crack locations, see the Fatigue Analysis Section of this report.

Report: R2654‐001 Revision: IR Page: 3.5.2 By: BAV
3.0 (Fuselage Frame DT) ELT Antenna Installation Drawing: GA373‐ELT‐01
3.5 Damage Tolerance Analysis
AFGROW calculates the critical crack length for both fracture and net section yield. These are generated in a spreadsheet using the AFGROW output and the following relations:
Net Section Yield Criteria: Fracture If: σlimit ≥ σys [(net section width) / (full section width)] Note: The yield zone size, crack length, and any cutouts or fastener holes are subtracted from
the full section width to obtain the net section width. Fracture Criteria: Fracture If: σlimit ≥ Kcrit / [(πc)½ β] Where: Kcrit is the fracture toughness value of the given state of stress Kcrit = Kc (plane stress) Kcrit = K1c (plane strain) For intermediate states of stress, Kcrit is linearly interpolated between Kc & K1c

Report: R2654‐001 Revision: IR Page: 3.5.3 By: BAV
3.0 (Fuselage Frame DT) ELT Antenna Installation Drawing: GA373‐ELT‐01
3.5 Damage Tolerance Analysis
NASGRO da/dN curve for 7075‐T6 Aluminum

Report: R2654‐001 Revision: IR Page: 3.5.4 By: BAV
3.0 (Fuselage Frame DT) ELT Antenna Installation Drawing: GA373‐ELT‐01
3.5 Damage Tolerance Analysis
AFGROW – Input Fastener Location A Geometry Single Through Crack @ Hole (Phase Ia) Internal Through Crack (Phase II) Single Corner Crack @ Hole (Phase Ib) Dimensions width = 0.624 in width = 1.872 in thickness = 0.040 in thickness = 0.036 in hole diameter = 0.156 in crack length = 0.859 in crack length = 0.05 in (Phase Ia) half crack length = 0.430 in = 0.01 in (Phase Ib) Load tension stress ratio = 0.729 tension stress ratio = 1.000 bearing stress ratio = 1.091 bearing stress ratio = 0.000 da/dN Data (Phases I and II): Spectrum (Phases I and II): NASGRO Equation Stress Multiplication Factor = 7.96 ksi Material = 7075‐T6 Al (clad; plt & sht; T‐L) Residual Stress Requirement = 9.99 ksi Constant Amplitude Loading R = Stress Min / Stress Max = 0
Report: R2654‐001 Revision: IR Page: 3.5.5 By: BAV
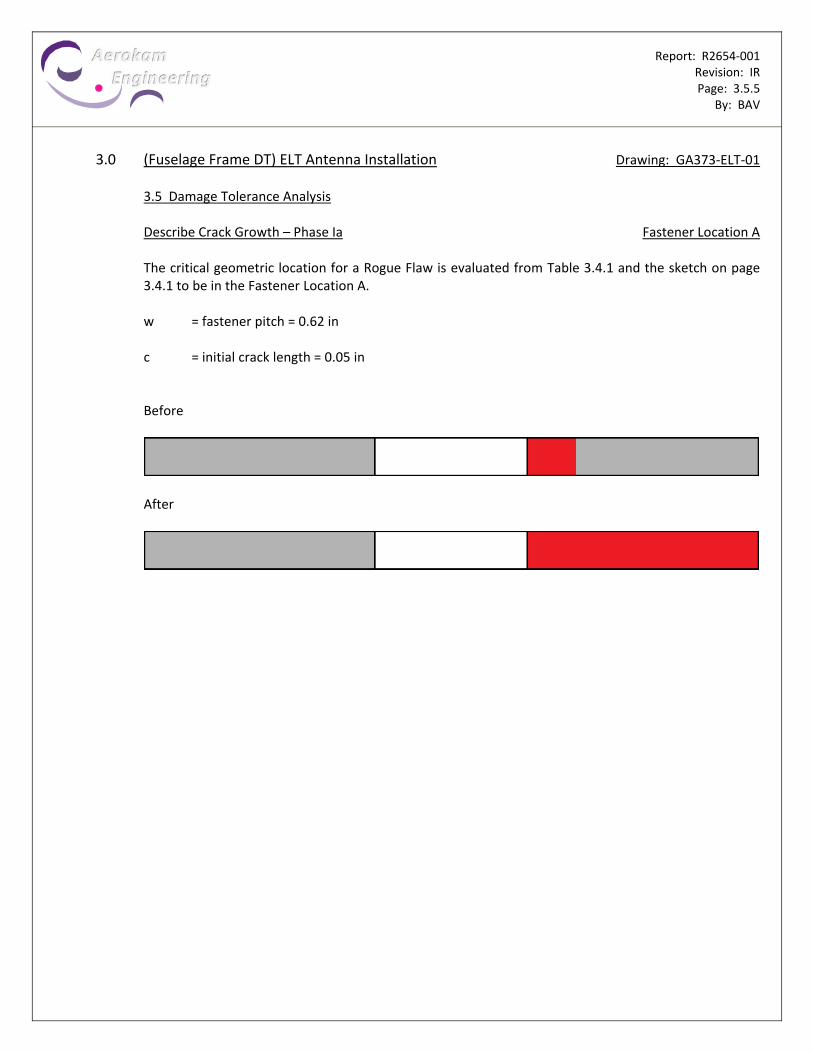
3.0 (Fuselage Frame DT) ELT Antenna Installation Drawing: GA373‐ELT‐01
3.5 Damage Tolerance Analysis
Describe Crack Growth – Phase Ia Fastener Location A The critical geometric location for a Rogue Flaw is evaluated from Table 3.4.1 and the sketch on page 3.4.1 to be in the Fastener Location A. w = fastener pitch = 0.62 in
c = initial crack length = 0.05 in Before
After
Report: R2654‐001 Revision: IR Page: 3.5.6 By: BAV
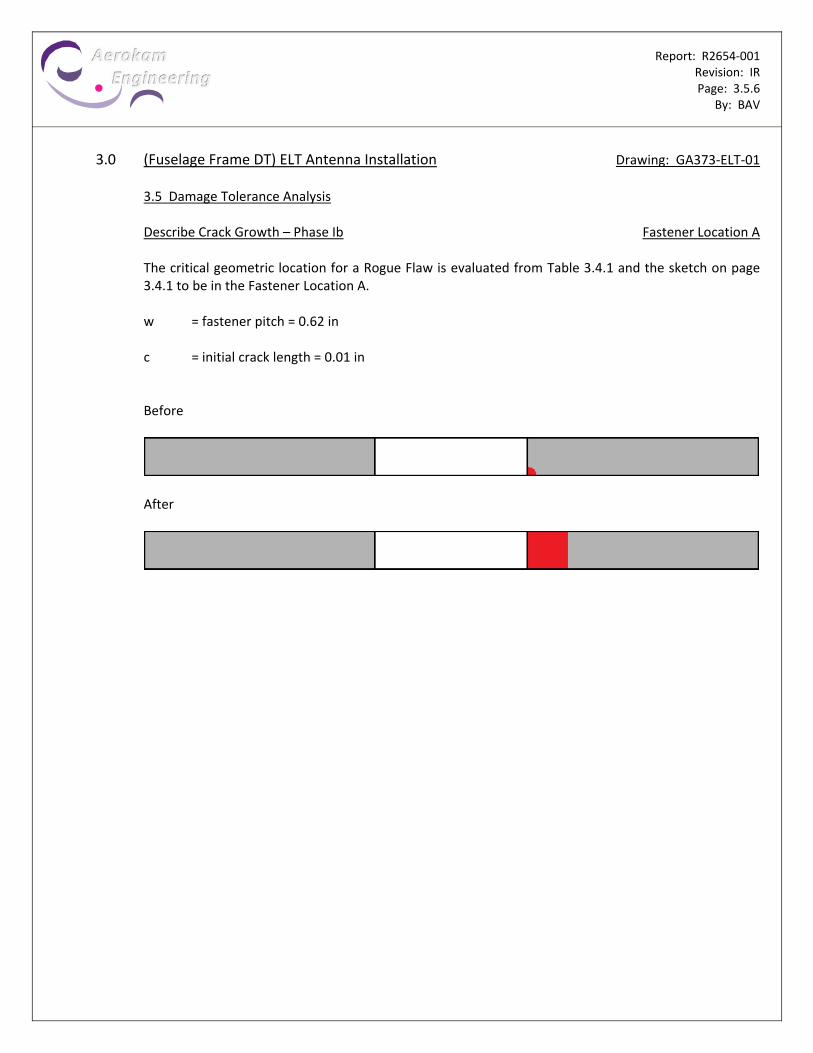
3.0 (Fuselage Frame DT) ELT Antenna Installation Drawing: GA373‐ELT‐01
3.5 Damage Tolerance Analysis
Describe Crack Growth – Phase Ib Fastener Location A The critical geometric location for a Rogue Flaw is evaluated from Table 3.4.1 and the sketch on page 3.4.1 to be in the Fastener Location A. w = fastener pitch = 0.62 in
c = initial crack length = 0.01 in Before
After

Report: R2654‐001 Revision: IR Page: 3.5.7 By: BAV
3.0 (Fuselage Frame DT) ELT Antenna Installation Drawing: GA373‐ELT‐01
3.5 Damage Tolerance Analysis
Describe Crack Growth – Phase 2 Fastener Location A The critical geometric location for a Rogue Flaw is evaluated from Table 3.4.1 and the sketch on page 3.4.1 to be in the Fastener Location A. w = 3 x fastener pitch = 1.87 in
c = initial crack length = fastener pitch + fastener diameter + 2 x Phase 1b crack length = 0.62 in + 0.156 in + 2(0.041534 in) = 0.859068 in Before
After

Report: R2654‐001 Revision: IR Page: 3.5.8 By: BAV
3.0 (Fuselage Frame DT) ELT Antenna Installation Drawing: GA373‐ELT‐01
3.5 Damage Tolerance Analysis
AFGROW – Output Fastener Location A
Location A: Phase 1a
Constant amplitude loading
Single Through Crack at Hole ‐ Standard Solution
Cycles C Length Beta C Sub SpectruPath Life
0 0.05 1.845432 1 1 0
10700 0.060026 1.74209 108 108 10700
20600 0.070052 1.650618 207 207 20600
29800 0.080055 1.569544 299 299 29800
38300 0.090138 1.525604 384 384 38300
46000 0.100199 1.476123 461 461 46000
53000 0.110349 1.463365 531 531 53000
59200 0.120384 1.443839 593 593 59200
64700 0.130457 1.439407 648 648 64700
69500 0.140561 1.445175 696 696 69500
73600 0.150748 1.477139 737 737 73600
77000 0.160906 1.506566 771 771 77000
79800 0.171141 1.545686 799 799 79800
82000 0.181188 1.597269 821 821 82000
83700 0.191325 1.792559 838 838 83700
85000 0.202524 2.015207 851 851 85000
85800 0.214427 2.374742 859 859 85800
86200 0.224855 3.387612 863 863 86200
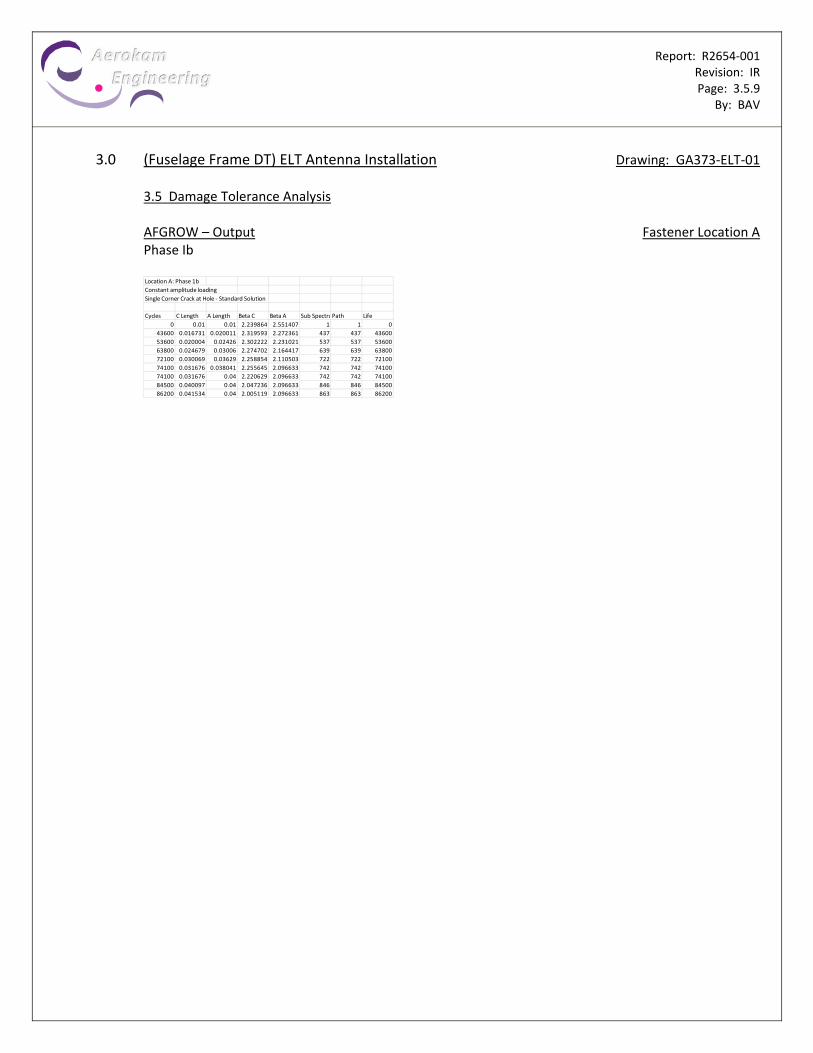
Report: R2654‐001 Revision: IR Page: 3.5.9 By: BAV
3.0 (Fuselage Frame DT) ELT Antenna Installation Drawing: GA373‐ELT‐01
3.5 Damage Tolerance Analysis
AFGROW – Output Fastener Location A Phase Ib
Location A: Phase 1b
Constant amplitude loading
Single Corner Crack at Hole ‐ Standard Solution
Cycles C Length A Length Beta C Beta A Sub SpectruPath Life
0 0.01 0.01 2.239864 2.551407 1 1 0
43600 0.016731 0.020011 2.319593 2.272361 437 437 43600
53600 0.020004 0.02426 2.302222 2.231021 537 537 53600
63800 0.024679 0.03006 2.274702 2.164417 639 639 63800
72100 0.030069 0.03629 2.258854 2.110503 722 722 72100
74100 0.031676 0.038041 2.255645 2.096633 742 742 74100
74100 0.031676 0.04 2.220629 2.096633 742 742 74100
84500 0.040097 0.04 2.047236 2.096633 846 846 84500
86200 0.041534 0.04 2.005119 2.096633 863 863 86200
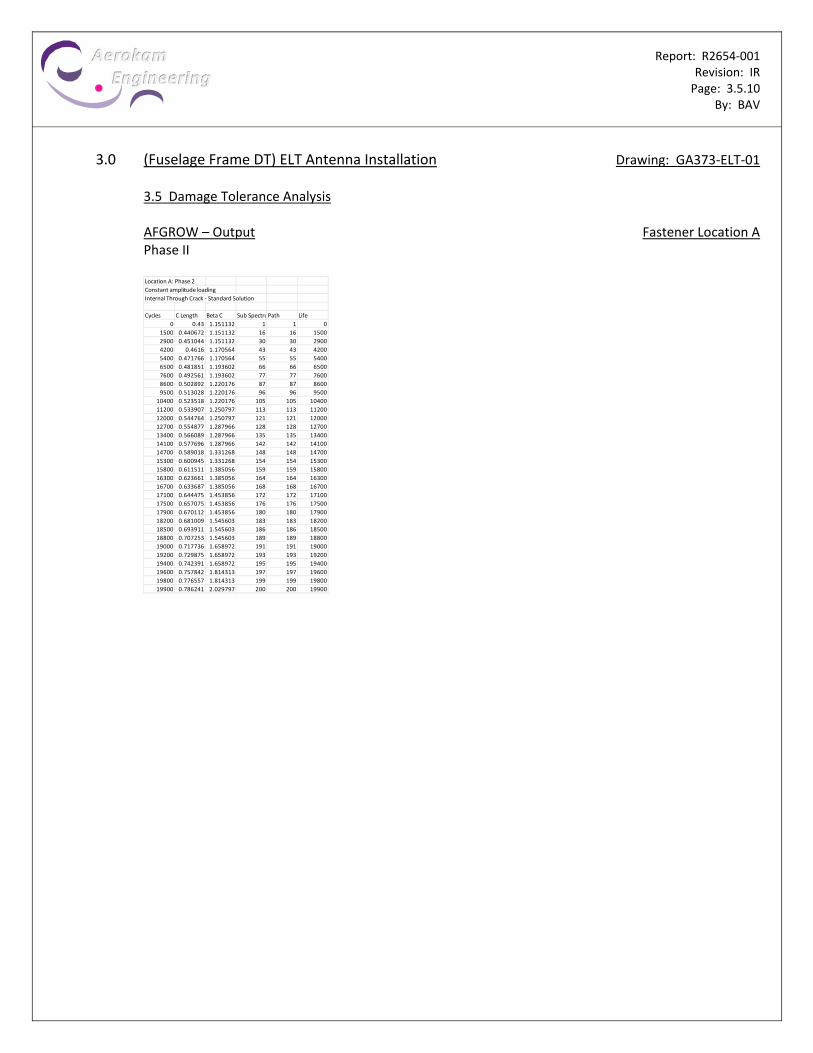
Report: R2654‐001 Revision: IR Page: 3.5.10 By: BAV
3.0 (Fuselage Frame DT) ELT Antenna Installation Drawing: GA373‐ELT‐01
3.5 Damage Tolerance Analysis
AFGROW – Output Fastener Location A Phase II
Location A: Phase 2
Constant amplitude loading
Internal Through Crack ‐ Standard Solution
Cycles C Length Beta C Sub SpectruPath Life
0 0.43 1.151132 1 1 0
1500 0.440672 1.151132 16 16 1500
2900 0.451044 1.151132 30 30 2900
4200 0.4616 1.170564 43 43 4200
5400 0.471766 1.170564 55 55 5400
6500 0.481851 1.193602 66 66 6500
7600 0.492561 1.193602 77 77 7600
8600 0.502892 1.220176 87 87 8600
9500 0.513028 1.220176 96 96 9500
10400 0.523518 1.220176 105 105 10400
11200 0.533907 1.250797 113 113 11200
12000 0.544764 1.250797 121 121 12000
12700 0.554877 1.287966 128 128 12700
13400 0.566089 1.287966 135 135 13400
14100 0.577696 1.287966 142 142 14100
14700 0.589018 1.331268 148 148 14700
15300 0.600945 1.331268 154 154 15300
15800 0.611511 1.385056 159 159 15800
16300 0.623661 1.385056 164 164 16300
16700 0.633687 1.385056 168 168 16700
17100 0.644475 1.453856 172 172 17100
17500 0.657075 1.453856 176 176 17500
17900 0.670112 1.453856 180 180 17900
18200 0.681009 1.545603 183 183 18200
18500 0.693911 1.545603 186 186 18500
18800 0.707253 1.545603 189 189 18800
19000 0.717736 1.658972 191 191 19000
19200 0.729875 1.658972 193 193 19200
19400 0.742391 1.658972 195 195 19400
19600 0.757842 1.814313 197 197 19600
19800 0.776557 1.814313 199 199 19800
19900 0.786241 2.029797 200 200 19900

Report: R2654‐001 Revision: IR Page: 3.5.11 By: BAV
3.0 (Fuselage Frame DT) ELT Antenna Installation Drawing: GA373‐ELT‐01
3.5 Damage Tolerance Analysis
AFGROW – Output Fastener Location A Flight Cycle Graph

Report: R2654‐001 Revision: IR Page: 3.6.1 By: BAV
3.0 (Fuselage Frame DT) ELT Antenna Installation Drawing: GA373‐ELT‐01
3.6 Inspection Interval Calculations Definitions of Results Notation ainit = the initial rogue flaw crack length (assumed value) = 0.05” adet = the smallest crack size a given inspection method is assumed to be able to find acrit = the critical crack size at which the structure is assumed to fail Ndet = the number of cycles associated with adet Ncrit = the number of cycles associated with acrit Nfatigue = the number of cycles associated with the factored fatigue life
Report: R2654‐001 Revision: IR Page: 3.6.2 By: BAV
3.0 (Fuselage Frame DT) ELT Antenna Installation Drawing: GA373‐ELT‐01
3.6 Inspection Interval Calculations
Definitions of Results Notation Nthres = First Threshold Inspection Nsubs = Subsequent Inspections Threshold Inspection The guidelines for the initial threshold inspection occur based on the lesser of the following determining factors:
Ndet : The time taken for the initial rogue crack to propagate to the detectable length.
½Ncrit : One half the time taken for an initial rogue crack to propagate to the critical length.
Nfatigue : Factored fatigue life.
¾ LOV : Three quarters of the Limit of Validity of the aircraft. 1
Threshold of Supplemental Inspection Document (SSID) or Aircraft Limitation Inspection (ALI) Subsequent Inspection The guidelines for the repeat (subsequent) inspections occur based on the lesser of the following determining factors:
Nthres : The time taken for the threshold inspection to occur.
(Ncrit – Ndet) / N1 : The time taken for a detectable size crack to grow to the critical crack length. : N1 = analysis uncertainty factor = 4.0
1 Reference FAR Part 121.1115
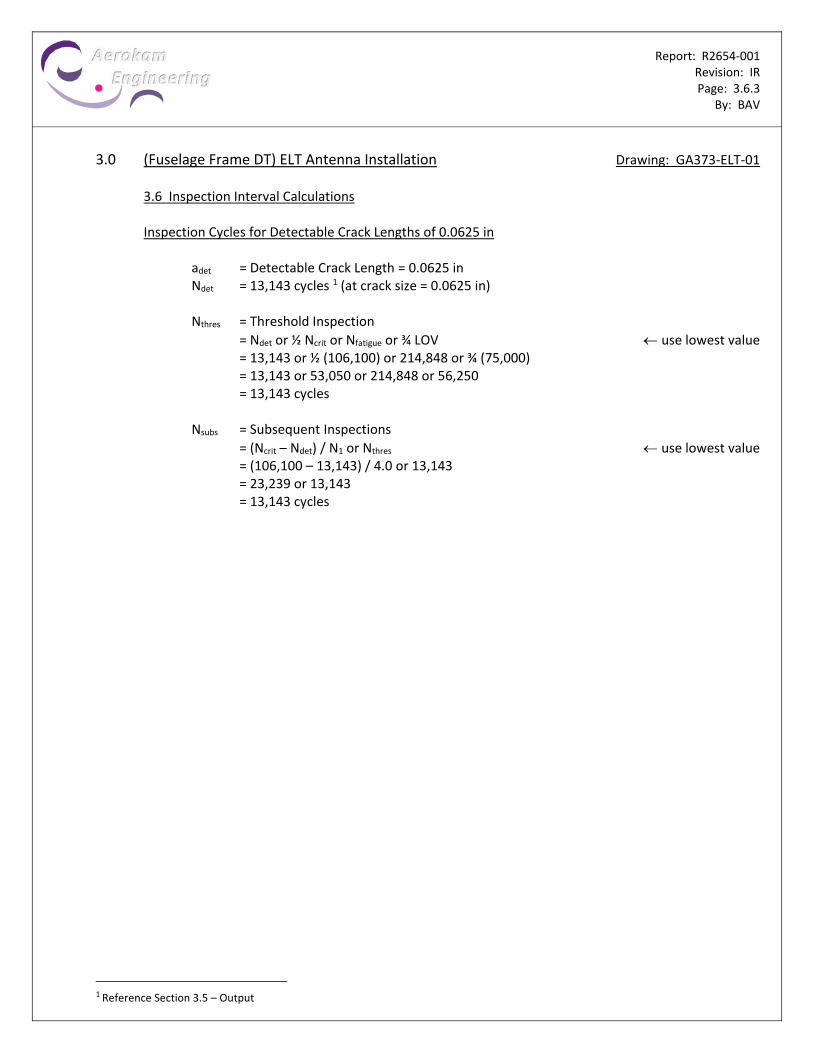
Report: R2654‐001 Revision: IR Page: 3.6.3 By: BAV
3.0 (Fuselage Frame DT) ELT Antenna Installation Drawing: GA373‐ELT‐01
3.6 Inspection Interval Calculations
Inspection Cycles for Detectable Crack Lengths of 0.0625 in adet = Detectable Crack Length = 0.0625 in Ndet = 13,143 cycles 1 (at crack size = 0.0625 in) Nthres = Threshold Inspection
= Ndet or ½ Ncrit or Nfatigue or ¾ LOV use lowest value = 13,143 or ½ (106,100) or 214,848 or ¾ (75,000) = 13,143 or 53,050 or 214,848 or 56,250 = 13,143 cycles
Nsubs = Subsequent Inspections
= (Ncrit – Ndet) / N1 or Nthres use lowest value = (106,100 – 13,143) / 4.0 or 13,143 = 23,239 or 13,143 = 13,143 cycles
1 Reference Section 3.5 – Output

Report: R2654‐001 Revision: IR Page: 3.6.4 By: BAV
3.0 (Fuselage Frame DT) ELT Antenna Installation Drawing: GA373‐ELT‐01
3.6 Inspection Interval Calculations
Inspection Cycles for Detectable Crack Lengths of 0.125 in adet = Detectable Crack Length = 0.125 in Ndet = 61,720 cycles 1 (at crack size = 0.125 in) Nthres = Threshold Inspection
= Ndet or ½ Ncrit or Nfatigue or ¾ LOV use lowest value = 61,720 or ½ (106,100) or 214,848 or ¾ (75,000) = 61,720 or 53,050 or 214,848 or 56,250 = 53,050 cycles
Nsubs = Subsequent Inspections
= (Ncrit – Ndet) / N1 or Nthres use lowest value = (106,100 – 61,720) / 4.0 or 53,050 = 11,095 or 53,050 = 11,095 cycles
1 Reference Section 3.5 – Output

Report: R2654‐001 Revision: IR Page: 3.6.5 By: BAV
3.0 (Fuselage Frame DT) ELT Antenna Installation Drawing: GA373‐ELT‐01
3.6 Inspection Interval Calculations
Inspection Cycles for Detectable Crack Lengths of 0.250 in adet = Detectable Crack Length = 0.250 in Ndet = 86,200 cycles 1 (at crack size = 0.250 in) Nthres = Threshold Inspection
= Ndet or ½ Ncrit or Nfatigue or ¾ LOV use lowest value = 86,200 or ½ (106,100) or 214,848 or ¾ (75,000) = 86,200 or 53,050 or 214,848 or 56,250 = 53,050 cycles
Nsubs = Subsequent Inspections
= (Ncrit – Ndet) / N1 or Nthres use lowest value = (106,100 – 86,200) / 4.0 or 53,050 = 4,975 or 53,050 = 4,975 cycles
1 Reference Section 3.5 – Output

Report: R2654‐001 Revision: IR Page: 3.6.6 By: BAV
3.0 (Fuselage Frame DT) ELT Antenna Installation Drawing: GA373‐ELT‐01
3.6 Inspection Interval Calculations
Inspection Cycles for Detectable Crack Lengths of 0.750 in adet = Detectable Crack Length = 0.750 in Ndet = 86,200 cycles 1 (at crack size = 0.750 in) Nthres = Threshold Inspection
= Ndet or ½ Ncrit or Nfatigue or ¾ LOV use lowest value = 86,200 or ½ (106,100) or 214,848 or ¾ (75,000) = 86,200 or 53,050 or 214,848 or 56,250 = 53,050 cycles
Nsubs = Subsequent Inspections
= (Ncrit – Ndet) / N1 or Nthres use lowest value = (106,100 – 86,200) / 4.0 or 53,050 = 4,975 or 53,050 = 4,975 cycles
1 Reference Section 3.5 – Output

Report: R2654‐001 Revision: IR Page: 3.6.7 By: BAV
3.0 (Fuselage Frame DT) ELT Antenna Installation Drawing: GA373‐ELT‐01
3.6 Inspection Interval Calculations
Inspection Cycles for Detectable Crack Lengths of 1.00 in adet = Detectable Crack Length = 1.00 in Ndet = 86,200 cycles 1 (at crack size = 1.00 in) Nthres = Threshold Inspection
= Ndet or ½ Ncrit or Nfatigue or ¾ LOV use lowest value = 86,200 or ½ (106,100) or 214,848 or ¾ (75,000) = 86,200 or 53,050 or 214,848 or 56,250 = 53,050 cycles
Nsubs = Subsequent Inspections
= (Ncrit – Ndet) / N1 or Nthres use lowest value = (106,100 – 86,200) / 4.0 or 53,050 = 4,975 or 53,050 = 4,975 cycles
1 Reference Section 3.5 – Output

Report: R2654‐001 Revision: IR Page: 3.6.8 By: BAV
3.0 (Fuselage Frame DT) ELT Antenna Installation Drawing: GA373‐ELT‐01
3.6 Inspection Interval Calculations
Inspection Cycles for HFEC Detectable Crack Lengths For the inspection methods described in this report, specifically High Frequency Eddy Current, due to the protruding nature of the fastener head for the countersunk fasteners, the minimum detectable crack lengths for these inspection techniques are adjusted to be measured as the length extending beyond the fastener head.
The difference between the fastener head diameter and the fastener shank diameter must be added to the minimum detectable crack length of 0.0625” for High Frequency Eddy Current. High Frequency Eddy Current: adet = 0.0625” + (0.312” – 0.156”) / 2 = 0.1405” adet = Detectable Crack Length = 0.1405 in Ndet = 69,475 cycles 1 (at crack size = 0.1405 in) Nthres = Threshold Inspection
= Ndet or ½ Ncrit or Nfatigue or ¾ LOV use lowest value = 69,475 or ½ (106,100) or 214,848 or ¾ (75,000) = 69,475 or 53,050 or 214,848 or 56,250 = 53,050 cycles
Nsubs = Subsequent Inspections
= (Ncrit – Ndet) / N1 or Nthres use lowest value = (106,100 – 69,475) / 4.0 or 53,050 = 9,156 or 53,050 = 9,156 cycles
1 Reference Section 3.5 – Output

Report: R2654‐001 Revision: IR Page: 3.6.9 By: BAV
3.0 (Fuselage Frame DT) ELT Antenna Installation Drawing: GA373‐ELT‐01
3.6 Inspection Interval Calculations
Inspection Cycles for LFEC Detectable Crack Lengths For the inspection methods described in this report, specifically Low Frequency Eddy Current, due to the protruding nature of the fastener head for the countersunk fasteners, the minimum detectable crack lengths for these inspection techniques are adjusted to be measured as the length extending beyond the fastener head.
The difference between the fastener head diameter and the fastener shank diameter must be added to the minimum detectable crack length of 0.125” for Low Frequency Eddy Current. Low Frequency Eddy Current: adet = 0.125” + (0.312” – 0.156”) / 2 = 0.2030” adet = Detectable Crack Length = 0.2030 in Ndet = 85,032 cycles 1 (at crack size = 0.2030 in) Nthres = Threshold Inspection
= Ndet or ½ Ncrit or Nfatigue or ¾ LOV use lowest value = 85,032 or ½ (106,100) or 214,848 or ¾ (75,000) = 85,032 or 53,050 or 214,848 or 56,250 = 53,050 cycles
Nsubs = Subsequent Inspections
= (Ncrit – Ndet) / N1 or Nthres use lowest value = (106,100 – 85,032) / 4.0 or 53,050 = 5,267 or 53,050 = 5,267 cycles
1 Reference Section 3.5 – Output

Report: R2654‐001 Revision: IR Page: 3.6.10 By: BAV
3.0 (Fuselage Frame DT) ELT Antenna Installation Drawing: GA373‐ELT‐01
3.6 Inspection Interval Calculations
Summary of Inspection Intervals The following table lists inspection cycles for various minimum detectable flaw sizes. Only ONE inspection technique should be chosen, reference Section 7 for a summary of the suggested inspection method. The chart below cannot be directly incorporated into an ICA inspection program.
Table 3.6.1: Summary of Inspection Intervals
Minimum Detectable Flaw Size (in)
Threshold Inspection (cycles)
Repeat Inspections (cycles)
0.0625 13,143 cycles 13,143 cycles
0.125 53,050 cycles 11,095 cycles
0.25 53,050 cycles 4,975 cycles
0.75 53,050 cycles 4,975 cycles
1.00 53,050 cycles 4,975 cycles
HFEC (0.0625) 1 53,050 cycles 9,156 cycles
LFEC (0.125) 1 53,050 cycles 5,267 cycles
NOTE: The inspections described above are developed based on fatigue damage only; inspections
based on environmental or accidental damage are provided by the aircraft manufacturer.
1 Detectable length as measured beyond the fastener head.

Report: R2654‐001 Revision: IR Page: 3.7.1 By: BAV
3.0 (Fuselage Frame DT) ELT Antenna Installation Drawing: GA373‐ELT‐01
3.7 Summary and Conclusions It is recommended that a HFEC (High Frequency Eddy Current) inspection method be chosen to inspect the fuselage frame. Inspection Method (based on min. flaw size)
Minimum Detectable Flaw Size (in)
Threshold Inspection (cycles)
Repeat Inspections (cycles)
Limitations
HFEC – Surface Probe 0.1405
53,050
9,156 Surface flaws only.
Notes: 1. Follow Boeing 737‐400 OEM NDT manual for inspection process. 2. Gain access to the ELT Antenna, remove the antenna and inspect the fuselage frame from the
exterior of the fuselage, at each fastener location as shown on the following pages. In Addition: Perform a general visual inspection along the perimeter of the clips.
(View Looking Rearward FS 807, FS 787 Similar)

Report: R2654‐001 Revision: IR Page: 3.7.2 By: BAV
3.0 (Fuselage Frame DT) ELT Antenna Installation Drawing: GA373‐ELT‐01
3.7 Summary and Conclusions High Frequency Eddy Current Inspection Method The principles of electromagnetic induction are used in high frequency eddy current inspection methods to detect surface and near‐surface cracks in the fuselage skin. The High Frequency NDI method can be used for the detection of cracks in the first layer of metal around fastener holes. Additional Inspection Notes: 1. Inspect the fuselage skin at each location shown in RED below.
(View Looking Rearward FS 807, FS 787 Similar)

Report: R2654‐001 Revision: IR Page: A.0 By: BAV
Appendix A
A.1 – A.3 ............................................. Standard Atmospheric Table A.4 – A.7 ............................................. Pressurization Control System A.8 – A.10 ........................................... Aircraft Station Diagram A.11 – A.19 ......................................... Fuselage Skin Structural Identifications Note: Only the main fuselage structure is shown in this Appendix. For a more detailed structural identification,
reference the Aircraft Maintenance Manual and Aircraft Structural Repair Manual.

Report: R2654‐001 Revision: IR Page: A.1 By: BAV
Standard Atmospheric Table

Report: R2654‐001 Revision: IR Page: A.2 By: BAV
Standard Atmospheric Table

Report: R2654‐001 Revision: IR Page: A.3 By: BAV
Standard Atmospheric Table

Report: R2654‐001 Revision: IR Page: A.4 By: BAV
Boeing Aircraft Company: Model 737‐400 Maintenance Manual (Pressurization Control System)

Report: R2654‐001 Revision: IR Page: A.5 By: BAV
Boeing Aircraft Company: Model 737‐400 Maintenance Manual (Pressurization Control System) [Page 1 of 3]

Report: R2654‐001 Revision: IR Page: A.6 By: BAV
Boeing Aircraft Company: Model 737‐400 Maintenance Manual (Pressurization Control System) [Page 2 of 3]
Report: R2654‐001 Revision: IR Page: A.7 By: BAV
Boeing Aircraft Company: Model 737‐400 Maintenance Manual (Pressurization Control System) [Page 3 of 3]

Report: R2654‐001 Revision: IR Page: A.8 By: BAV
Boeing Aircraft Company: Model 737‐400 Structural Repair Manual (Aircraft Station Diagram)
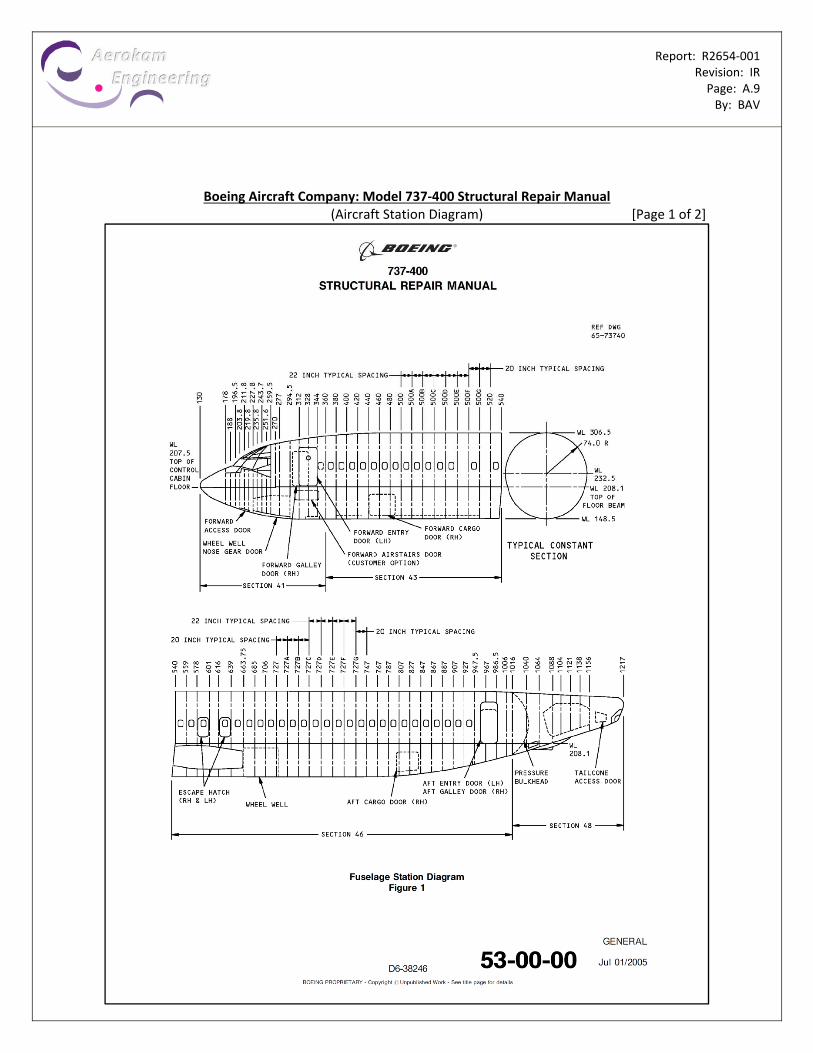
Report: R2654‐001 Revision: IR Page: A.9 By: BAV
Boeing Aircraft Company: Model 737‐400 Structural Repair Manual (Aircraft Station Diagram) [Page 1 of 2]

Report: R2654‐001 Revision: IR Page: A.10 By: BAV
Boeing Aircraft Company: Model 737‐400 Structural Repair Manual (Aircraft Station Diagram) [Page 2 of 2]

Report: R2654‐001 Revision: IR Page: A.11 By: BAV
Boeing Aircraft Company: Model 737‐400 Structural Repair Manual (Fuselage Skin Structural Identification)

Report: R2654‐001 Revision: IR Page: A.12 By: BAV
Boeing Aircraft Company: Model 737‐400 Structural Repair Manual (Fuselage Skin Structural Identification) [Page 1 of 8]
Report: R2654‐001 Revision: IR Page: A.13 By: BAV
Boeing Aircraft Company: Model 737‐400 Structural Repair Manual (Fuselage Skin Structural Identification) [Page 2 of 8]

Report: R2654‐001 Revision: IR Page: A.14 By: BAV
Boeing Aircraft Company: Model 737‐400 Structural Repair Manual (Fuselage Skin Structural Identification) [Page 3 of 8]

Report: R2654‐001 Revision: IR Page: A.15 By: BAV
Boeing Aircraft Company: Model 737‐400 Structural Repair Manual (Fuselage Skin Structural Identification) [Page 4 of 8]

Report: R2654‐001 Revision: IR Page: A.16 By: BAV
Boeing Aircraft Company: Model 737‐400 Structural Repair Manual (Fuselage Skin Structural Identification) [Page 5 of 8]

Report: R2654‐001 Revision: IR Page: A.17 By: BAV
Boeing Aircraft Company: Model 737‐400 Structural Repair Manual (Fuselage Skin Structural Identification) [Page 6 of 8]

Report: R2654‐001 Revision: IR Page: A.18 By: BAV
Boeing Aircraft Company: Model 737‐400 Structural Repair Manual (Fuselage Skin Structural Identification) [Page 7 of 8]

Report: R2654‐001 Revision: IR Page: A.19 By: BAV
Boeing Aircraft Company: Model 737‐400 Structural Repair Manual (Fuselage Skin Structural Identification) [Page 8 of 8]