Report No. 8962CE Lanka - Transport Sector Memorandumdocuments.worldbank.org/curated/en/... · Sri...
136
Report No.8962CE Sri Lanka - - Transport Sector Memorandum June 28, 1991 Infrastructure Operations Division Country Department I AsiaRegional Office FOR OFFICIAL USEONLY Documern of the WM Bank This document has a restricted distribution andmaybe used by recipients only in the performance of theirofficial duties. itscontents may not otherwise be iisclosed withoutWorld Bank authorization. Public Disclosure Authorized Public Disclosure Authorized Public Disclosure Authorized Public Disclosure Authorized Public Disclosure Authorized Public Disclosure Authorized Public Disclosure Authorized Public Disclosure Authorized
Transcript of Report No. 8962CE Lanka - Transport Sector Memorandumdocuments.worldbank.org/curated/en/... · Sri...

Report No. 8962CE
Sri Lanka - -
Transport Sector MemorandumJune 28, 1991
Infrastructure Operations DivisionCountry Department IAsia Regional Office
FOR OFFICIAL USE ONLY
Documern of the WM Bank
This document has a restricted distribution and may be used by recipientsonly in the performance of their official duties. its contents may not otherwisebe iisclosed without World Bank authorization.
Pub
lic D
iscl
osur
e A
utho
rized
Pub
lic D
iscl
osur
e A
utho
rized
Pub
lic D
iscl
osur
e A
utho
rized
Pub
lic D
iscl
osur
e A
utho
rized
Pub
lic D
iscl
osur
e A
utho
rized
Pub
lic D
iscl
osur
e A
utho
rized
Pub
lic D
iscl
osur
e A
utho
rized
Pub
lic D
iscl
osur
e A
utho
rized

CURRENCY AND EQUIVALENT UNITS(As of June 1991)
Currency Unit = Sri Lanka Rupee (SL Rs)Rs 40.0 US$1.00Rs 1,000 = US$25.00
WEIGHTS AND MEASURES
1 meter (m) = 3.28 feet (ft)1 kilometer (km) = 0.62 mil (mi)1 hectare (ha) 2 2.48 acres (ac)1 ton = 2,208 pounds1 ton-km 0.62 ton-mile1 passenger-km = 0.62 passenger-mile
ACRONYMS
ADB - Asian Development BankCMC - Colombo Municipal CouncilCPC - Ceylon Petroleum CorporationCSC - Ceylon Shipping CorporationDPOT - Department of Private Omnibus Transportdwt - dead weight tonEDCF - Economic Development Cooperation Fund (Republic of Korea)ERC - Economic Restructuring Credit (2128-CE, May 1990)IMC-CPT - Inter-Ministerial Committee for Coordination
and Planning of Transportkgs - kilogramsJICA - Japan International Cooperation AdministrationMTH - Ministry of Transport and HighwaysOECF - Overseas Economic Cooperation FundPC - Provincial CouncilsPIP - Public Investment ProgramRDA - Road Development AuthorityRTB - Regional Transport BoardsSLCTB - Sri Lanka Central Transport BoardSLPA - Sri Lanka Ports AuthoritySLR - Sri Lanka RailwaysTEU - Twenty-foot equivalent unitTSPC - Transport Studies and Planning CenterTSPS - Transport Sector Planning Study (January 1988)VOC - vehicle operating costs
FISCAL YEAR
January 1 - December 31

FOR OMCIAL USE ONLYSRI LAM
TRANSPORT S1CTOR MIWRAJNWI
Table of Contents
Page No.
PR OB ................................................... ........ i
EXECUTIVE SUMNKYY ......... .. ii
1. ROLE OF TRANSPORT IN THE SRI LANKAN ECONOMY . .. 1A. Country Background ...................................... 1B. Transport and the Economy .......C. Transport Modes ..................... ......... ... 3
- Modal Split ....... 3- Road Transport .4...... ............... 4- Railways. ..................... 9
- Colombo Urban Transport .......... 10- Ports and Shipping . . ... ............ . 11- Air Transport ... ...... 12- Intermodal Linkages .1.......... ... ............ 13
D. Transport Regulation in Sri Lanka ....... 14E. Environmental Considerations............. 15
II. DEVELMRQENT STRATEGY BY MODEIssues and Recomiutded Strateies . .16
A. Highway Development .......... .. .. .17
B. Road Passenger Transport ...... 20C. Railway Transport Development .. 22D. Urban Transport Development Strategies. 26E. Ports and Shipping Development Strategies . . 28F. Airport and Air Transport Development Strategy. 29G. Intermodal Development Strategies . . 29H. Benefits of Key Refomes. ............... .. ..... .31
III. RBVIEW OF THE TRANSPORT SECTOR PUBLIC INVESTMENT PROGRAM ...... 37A. Overall Public Investment Program Allocations to Transport 37B. Policy Statements in the Public Investment Programs ....... 37
General Observations .................................... 40Modal Allocation ........................................ 41
C. Transport Investment Plan, 1990-94 ........................ 41D. Approach to Developing a Core Investment Program .......... 47E. Summary ...... ............................................. 50
This report is based on the findings of the transport sector mission whlichvisited Sri Lanka in February and June 1990. Mission members included Mrs. InaiBradfield (Sr. Economist, Task Manager, AS1IN) Messrs. Sigfus Sigfusson (Pr.Highway Engineer, ASTIN); Richard Scurfield (Sr. Urban Transport Specialist,INUTD); and Jan Johnson (Urban Transport Specialist, Consultant). The report hasbeen revised based on discussions with Government officials during a mission inMarch 1991.
This document has a restricted distribution and may be used by recipients only In the performanceof their offlcial duties. Its contents may not otherwise be disclosed without World bank authorization.

Page No.
nV. DONOR INIOLVMD6 IN TEU TIANSPORT SECTOR 0................... .SA. Past IDA/Bank Operations 50B. Donor Involvement .52C. Need for Donor Coordination .52
TEXT TABLES
1.1 Modal Split ............................................ 31.2 Inter-Zonal Freight Transport Demand by Comodity. 51.3 Summary Estimates of Revenue and Expenses from Private Buses 82.1 Estimated Annual Financial Benefits of Refoms .313.1 Allocations for Public Investment Programs - 1981-1994 .383.2 Public Expenditures in the Transport Sector .393.3 Public Investment Program .423.4 Road Development Authority - Proposed Five Year Expenditures 443.5 Recommended Sri Lanka Railway Investment Program .49
TABLES
Table 1 Road Network by Province, Class, Jurisdiction andSurface Type, 198911990 ................................ 53
Table 2 Summary of Provisions/Expenditures on Roads ............. 54Table 3 Vehicle Registrations by Class of Vehicle ............... 55Table 4 Road Accidents Reported by Police Division .............. 56Table 5 Private Bus Costs and Revenue Estimates ................. 57Table 6 Costs of Road Transport ................................. 59Table 7 Rail Traffic, 1975 - 1988 ............................... 60Table 8 Costs of Rail Transport ................................ 61Table 9 Revenue and Expenditure Account of Sri Lanka Railways ... 62Table 10 Port and Airport Utilization (1988) ..................... 63Table 11 Performance of Ceylon Shipping Corporation .............. 64Table 12 Financial Performance of Air Lanka ...................... 65Table 13 Comparative Land Transport Performance .................. 66
FIGURES
Figure 1 Passenger Demand and Household Income .................. 67Figure 2 Freight Demand and GDP .................................. 68
AMXES
Annex 1 Summary of Recommended Actions .. 69Annex 2 Basic Data on Road User Charges .. 77Annex 3 Strategies to Increase Effectiveness of
Road Maintenance .. 90Annex 4 Bus Costs and Tariffs ................................ 101Annex 5 Quanitfiable Benefits of Reforms . ............. 105Annex 6 Private Bus Fleet Estimates ................. 113Annex 7 Major Donor Funding Activities
in the Transport Sector .................. 119
REFE,RENCES ...................... 124
MAP IBRD No. 17938

SRI LAZIA
TRANSPORT SECTOR MEMORANDUM
Preface
An Inter-Ministerial Committee for Coordination and Planning ofTransport (IMC-CPT) was established in June 1984 with a view towards recommendingorganizational, administrative, fiscal and legal measures required forimprovement of planning, implementing, monitoring and evaluating transportinvestment programs and operations. The IMC-CPT is supported by a transportTechnical Secretariat, with the primary objective of providing transport data andtechnical analysis. The Technical Secretariat was intended to become the centralanalytical agency where plans and programs of the various transport modalagencies would be evaluated and brought together to form coherent nationaltransport plans and programs for consideration by the decision-makers. It is nowknown as the Transport Studies and Planning Center (TSPC).
The initial work undertaken by the IMC-CPT was preparation of aTransport Sector Planning Study (TSPS)--designed to be the first step in theestablishment of a continuing transport planning system. (Funding was providedunder the Second Roads Project, Loan 2517-CE, May 1985, with the assistance oflocal and expatriate consultants.) The TSPS was published in January 1988 using1984-1986 data, and has become an important document for understanding of thetransport sector. The study documented that the sector was not able to respondto increasing and diversified transport demand effectively and that service wasprovided at high cost to the economy. Vehicle and rail operating costs in realterms were rising faster than output and were higher than they should be becauseof the deteriorating road and rail infrastructure. Regulated fares and tariffskept revenues below costs, and the Government subsidized inefficient publicsector operations rather than make funds available for needed networkmaintenance. Expansion of bus service was also inhibited by the high cost ofpurchasing and financing buses and spare parts.
This Transport Sector Memorandum analyzes institutional, operational,investment and policy issues by updating the data developed for the TSPS, andtranslates that analysis into a policy framework. The focus is on surface modes(road and rail), including urban transport problems; cursory treatment is givento the ports and air transport subsectors which have been functioning relativelywell. Coastal shipping, which has only a minor role to play in the provision oftransport services, is not addressed in this report.
Coinciding with the preparation of this report, two IDA projects werebeing prepared, designed to rectify some of the weaknesses identified in theanalysis of the transport sector. Both projects have now been approved, i.e.,the Economic Restructuring Credit (2128-CE, May 1990); and the Third RoadsProject (2183-CE, November 1990).
-ii-
SRI LANMA
TRANSPORT SECTOR KEKORANDUM
Executive Summary
Background
1. The transport sector plays an important part in the Sri Lankaneconomy, not only as a catalyst for production and efficiency in other sectors,but also as an employer of 1OZ of the six million work force and generator of 122of the national income. In addition, it provides people with access to socialservices and employment opportunities. In spite of its importance to theeconomy, transport accounted for only 22 of Government expenditures prior to1979--a low share by international standards. In recent years. however, therehas been a shift of emphasis to rehabilitate deteriorating transportinfrastructure and replace worn equipment with an increased share of the PublicInvestment Program. For example, the Public Investment Program allocation fortransport increased to an average 62 in the 1981/85 perioJ, 92 for 1986/90, 182for 1989-93, and 132 for 1990-94.
2. In its policy dialogue with the Government, IDA is emphasizingstabilization aimed at overcoming major obstacles to economic growth, including:(a) a large and inefficient public sector; (b) over-ambitious and unproductivepublic investments; (c) an overvalued Sri Lankan Rupee; and (d) heavy Governmentdeficits which have been amplified by the campaign to quell civil conflicts.Ptogress is being made in these areas and, with the exception of the exchangerate, the transport dialogue mirrors the macroeconomic issues. The principalproblems in the transport sector affecting the economy have been the high costof public bus and rail transport stemming from poorly maintained road and railinfrastructure and inefficient public bus and rail operations. Paradoxically,the Government has not provided sufficient funds to bring transport networks toappropriate maintainable standards (which would help reduce operating costs), buthas provided large subsidies to public transport enterprises which shouldnormally recover their costs from operations. These distortions result from weakinstitutions, lack of a rational policy framework, poor investment planning andthe burealtcratic nature of much of the decision making.
3. The Government is aware of these weaknesses and is taking steps toaddress them. In transport, it is attempting to rationalize investment andrecurrent expenditures--with emphasis on eliminating unproductive projects andsubsidies, while providing funds for priority activities such as roadmaintenance. It has adopted a policy of privatizing inefficient public agencies.Where privatization is not feasible, the Government intends to restructureagencies to operate along commercial lines. An important aspect of theGovernment's policy reformulation is progressive deregulation of selected pricesand tariffs, gradually leaving them to market forces. These policies aresupported by IDA in its transport strategy recommendations.
4. Kodal Split. Surface transport in Sri Lanka is dominated by highwaysthat account for about 852 of passenger traffic (mostly by bus) and 802 offreight. The railway carries the balance. Both modes, however, are important

-iii-
in different markets and are active in both urban and intercity transportation.Ports, shipping and air transport are also important, especially in promotingtrade and tourism and as earners of foreign exchange. The Sri Lanka PortsAuthority and Air Lanka provide examples of efficiently run public transportorganizations in stark contrast to the rail and bus operations. A detaileddiscussion of major issues affecting each transport mode is contained in ChapterII of this report and strategies to resolve them are proposed. The strategiesgenerally fall under five categories: (a) overall policy reform; (b)institutional reform; (c) improved management of operations and maintenance; (d)selection criteria to determine investment priorities within resourceconstraints; and (e) resource mobilization potential.
5. Highways. Sri Lanka has a network of some 10,400 km of national(paved) roads and 15,300 km of provincial and local roads. While the networkcovers the country adequately, it was built many years ago and is not designedto carry today's high level of traffic and heavy axle loads. Many roads andbridges are narrow and of inadequate structural strength. Poor maintenance hascompounded ths problem. The main causes of poor maintenance are outdatedpractices, the absence of a pavement management system and of rigorous analysisto establish priorities. Road surfaces have deteriorated significantly in thepast five years, which in turn have contributed to increasing vehicle operatingcosts. Revenues from road user charges appear to be adequate globally, but mayrequire recalibration to discourage heavy axle loads. A road user charge studyhas commenced to determine the extent of distortions and the reforms needed tocorrect them (para 7.) Funding for highway maintenance, especially for routinemaintenance, has not been at the levels necessary to ensure appropriatestandards.
6. Responsibility for highway administration currently rests with theMinistry of Transport and Highways, however, ten reorganizations have taken placein the last twenty years.l/ In 1981, the Road Development Authority (RDA) wasset up under the control of the then Ministry of Highways (MOH) to act primarilyas its contractor; the Department of Highways (also under MOH) was retained withresponsibilities for planning, investment programming and engineering designs.However, continued problems of retaining key staff, and the difficulties ofoperating within a highly structured bureaucracy led the Government to dissolvethe Department of Highways in 1986, consolidating all its functions under RDA.Since this major change, the national roads have been under the RDA which hadstabilized after some years of turbulence. However, RDA recently underwentanother reorganization: responsibility for care and maintenance of about 15,300km of roads and over 2,000 bridges was transferred to the Provincial Councils.At the same time, selected staff were transferred to the provinces to aid inmaintaining the provincial roads. The role of the provinces has not yet beenclearly defined within the Government's policy of decentralization. The frequentreorganizations and transfers of staff have been demoralizing and have impededthe efficient management of the road network.
7. Donors are helping to strengthen highway administration; for example,technical assistance for maintenance management financed by the Asian VevelopmentBank; and a spare parts and equipment loan from Japan's Overseas EconomicCooperation Fund (OECF). IDA's Third Road Project (Credit 2183-CE, November
11 In 1989, the Ministry of Highways and the Ministry of Transport became theMinistry of Transport and Highways.
- iv-
1990) emphasizes road rehabilitation and institutional strengthening, and willassis1; the Government to: (a) strengthen the capacity of RDA and provincialoffices to plan investments and maintenance through better data collection andanalysis (e.g., traffic counts, road condition data, and vehicle operatingcosts): (b) reorganize the ways in which RDA employs consultants and contractorsto provide greater transparency; (c) establish priorities among road sections inneed of rehabilitation or upgrading using economic, financial, and technicalconsiderations; (d) modernize maintenance operations to use more cost-effectivemeans and materials; and (e) technical assistance for three studies including theone on road user charges which may result in the restructuring of road usercharges to discourage use of two-axle trucks that are more damaging to thepavement.
8. Motorization in Sri Lanka is low by international standards. In 1988,there were about 226,000 motorcycles, close to 80,000 trucks, 37,000 buses andsome 150,000 automobiles registered, of which half were owned by individuals andhalf by Government, its agencies, and private firms. At 8.8 cars per 1,000people, the rate is low (although it compares to 2.3 in India). The accidentrate is very high at about 33 per 10,000 vehicles (about 10 times higher than inindustrialized countries).
9. Buses. About 80Z of motorized passenger trips in Sri Lanka are by busbut the level of service is inadequate. About half of bus service is providedby the publicly-owned and operated Sri Lanka Central Transport Board (SLCTB) andits nine Regional Transport Boards (RTB) and half by private operators. Thereare some 6,400 large buses in the public sector, and about 9,500 buses, mostlyminibuses, in the private sector. There are also buses owned by Governmentagencies, public corporations, schools and tour operators amounting to about20,000. (Buses have been the target of much terrorist bombing in the past fewyears.) Overall, the public bus boards are inefficient in terms of productivityper employee in comparison to those in India and other South Asian countries.Within Sri Lanka, privately-owned buses achieve higher availability (80% vs. 66%)and higher load factors (89? vs. 81X) than publicly-owned buses. Private sectorbuses are more efficiently managed, costs of operation per passenger-km forpublic buses in urban service being about 252 higher than for private buses.Public buses have required revenue support ranging from US$5 million to US$30million in the past few years.
10. The Government is aware of the problems in bus transport and isworking to resolve them. It has taken steps to privatize all bus serviceprovided by SLCTB and the RTBs (hpeoplization'), following a set of principlessupported by the Economic Restructuring Credit (Credit 2128-CE, May 1990), asfollows: (a) SLCTB and RTBs will become new, private bus companies kept small topermit popular ownership; (b) a small agency should be created to oversee thatbus service is satisfactory and safe (i.e., for training and testing of drivers,inspection of buses, and contracting for service on unprofitable routes); (c)management of bus stations and terminals should be transferred to localauthorities; (d) workshops, driving schools, and other activities should beprivatized; and (e) the transition to privatization should be made as smooth aspossible by making a special effort to have direct communications with allparties involved and implementing an effective public relations campaign. Inparallel, control of bus tariffs and regulations on importation of equipment andspare parts 's to be relaxed. To facilitate purchase of new buses and spareparts. the Government has offere4 financial incentives, such as exemption fromimport duties and tax holidays for a period of two years beginning in early 1990,

-1v-
and a line of credit on favorable terms, supported by IDA's Fourth Small andMedium Scale Industries Project (Credit 2250-CE, May 1991.)
11. Road Frvi&ht. Road transport is dominant in Sri Lanka, hauling about802 of all goods, with the trucking business largely in private hands. There issome evidence that truckers' associations act, to a limited degree, as cartelsfor the purpose of agreein& on somie tariffs, but by and large the industry iscompetitive. There is no apparent need for change in policies for this industryexcept for a possible restructuring of road user charges (para 5).
12. Railays. Sri Lanka Railways is a Government department under theMinistry of Transport and Highways. With some 20.000 employees, it has 1,450 kmof track and over 1,000 steel bridges, mostly built 50 to 100 years age. Thetrack ts broad gauge and single line, except for 102 km of double track in theCe'lombo area. The fleet comprises about 200 diesel electric and diesel. hydrauliclocomotives in service, 4,000 wagons, 1,300 coaches, and 46 power sets usedexclusively for commuter traffic within the Greater Colombo area. The principalcommodities hauled are building materials (including cement), petroleum products,fertilizer, limestone, rice, and flour. Since 1985, the volume of freight hasstabilized at about 200 million ton-km, down from about 270 million ton-km in thelate 1970s. Rail passenger traffic reached a peak of 4.1 billion passenger-kmin 1979 but had steadily fallen to 1.9 billion passenger-km by 1988. Therailway's deterioration is due to competition from road transport and consequentdecreases in revenue, increasing costs, and disruption of service by civildisturbances. These factors resulted in increasing operating deficits, butGovernment subsidies have not kept pace with the escalating operating costs ofthe railways. Management has deferred track and building maintenance, andamassed an extensive fleet of out-of-service locomotives and rolling stock whileawaiting imported spare parts. Despite the seriousness of the railway'sproblems, it could be restructured to serve an economic purpose in selectedmarkets. With the 4ssistance of the OECF, amounting to US$80 million equivalent,the railway is remanufacturing ten diesel hydraulic locomotives on a trial basis,and undertaking related workshop improvements and track rehabilitation.
13. This report recommends the following: (a) more autonomy for therailway to insulate it from political intervention, and make it a more business-like organization (like, for example, the Sri Lanka Ports Authority); (b)adoption of a clear strategy with operating goals and policies for achievingthem: (c) downsizing through closure of uneconomic lines, reductions in staff andstrict cost control of operations; (d) an aggressive marketing approach,promoting services for which the railway has a comparative advantage (such asbulk and long-haul traffic), and those for which there are complementaryrelations with other modes or entities (commuter traffic in Colombo); (e)improvement in the level of service, prioritization of investment needs; and (f)introduction of economic fares and rates.
14. Urban Transport. The Greater Colombo area has four millioninhabitants and is growing rapidly. The municipalities making up Greater Colomboand the Urban Development Authority do not always act in concert and areinadequately staffed to handle urban transport problems. Commuters from outsidethe city are served by both Duses and the railway, but neither offers adequateservice or capacity. The number of automobiles and motorcycles is growing fast.Traffic congestion in Colom,o has become noticeable and by the year 2000, islikely to be a severe problem. In the Fort and Pettha sections of Colombo,congestion--which slows tra"tel speeds--is exacerbated by undisciplined driving

-vi-
misuse of road space, poor traffic control and a few streets blocked as a resultof civil disturbances. Traffic lanes are blocked by double-parked cars, curbsideshops and pushcarts. Colombo has a high accident rate blamed on a combinationof poor driving habits, pedestrians walking on the carriageway, and roadconditions including poor shoulders, irregular pavement, lack of sidewalks, andthe absence of median strips. Yet traffic police are neither adequately equippedwith patrol cars nor trained to control traffic and enforce laws effectively.
15. Recommen0ations for urban transport include: (a) strengthening theUrban Development Authority, olombo Municipal Council and Transport StudiesPlanning Center for effective planning and policy analysis, and ultimately todevelop a multimodal urban transportation plan coordinated with overallinvestment planning for Colombo; (b) improvement and coordination of bus and railservices for commuters as alternatives to private car travel; (c) establishingeconomic road user charges, including the possibility of charging fees foroperating in congested areas and during peak hours; (d) application of trafficmanagement measures, such as signalization, parking restrictions and meters,auto-free zones; (e) rehabilitation of streets and improved maintenatnce; and (f)enforcement of safety-related regulations and establishment of safety educationprograms.
16. Ports. The port of Colombo handles 902 of Sri Lanka's marine tonnage,702 of which is container transshipment. There are dry-docks for ships up to30,000 tons. Two lesser ports can take ocean-going ships, and other ports handlesome coastal shipping and fishing vessels. The Sri Lanka Ports Authority managesand operates Colombo Port efficiently. Space for container storage is severelyconstrained within the port and facilities are needed for moving containers awayfrom the port srea without adding to the already congested road traffic throughunit train operations to Inland Container Depots. The feasibility of developingone of the minor ports at Galle for container handling is under investigation,with Japanese financing, but it is difficult to envisage an economicjustification for this in the near term. During the 1980s, OECF financed theconstruction of the two container terminals and the third one (US$90 million) isunder construction.
17. Shipping. The Government-owned Ceylon Shipping Corporation operatesan assortment of ships which it owns or charters. Its revenues cover operatingcosts, but are not enough to service foreign debts incurred for the purchase ofships at an unfavorable time. Its problems are largely financial andparticularly due to the purchase of unsuitable vessels which have been soldrecently. Other possible remedial measures include curtailing services on routeswhere operating revenues cannot cover operating costs and restructuring of itsbureaucratic decision making process to be more responsive to market demands.In January 1990, the shipping routes under the control of the Central FreightBureau were deregulated except for the Colombo-Northern Europe routes.
18. Airports and Air Transport. Colombo's international airport and AirLanka, the international airline, are modern, well-equipped, and well-managed.Besides international passenger traffic, they handle a variety of export goods.With a loan from OECF in 1986, funding was provided for an additional runway, aterminal building, and other improvements.

-vii-
19. Public Investment Program. As a development strategy the Governmenthas adopted the concept of rolling five year investment programs. The ensuingPublic Investment Programs (PIPs) therefore permit a redefinition of prioritiesannually. The allocation for transport peaked in the 1989-93 PIP at nearly 182,compared to 6? in the 1981-85 PIP, and a 1990-94 allocation of 13?. In realterms, however, the transport share in the 1990-94 PIP represented about a 73?increase over the 1981-85 program. As a percentage distribution in currentprices, the share for highways has increased from almost 202 in 1981-85 to 512in 1990-94. Railways increased from 31? to 37.5% over the same period, peakingat 42.52 in 1986-90. The shares in SLCTBlpublic bus, ports and shipping, and airtransport all declined over this period. The major emphasis of the 1989-93 and1990-94 PIPs is on the completion of ongoing projects and the maintenance andrehabilitation of existing assets. The bulk of expenditures for highways is forthe rehabilitation and maintenance of the national and provincial road networks,and the repair of bridges. About 762 of the total railway investment is also formaintenance and rehabilitation, including track renewal, rehabilitation of 101locomotives and workshop improvements. There is a proposal to modernize andexpand Galle Port, but more analysis is needed before this investment should beundertaken. In the face of its budgetary stringency, the Government needs toprepare a core investment program that includes only those projects which can beexpected to give high returns, coupled with a rationalization of its PIPs. forinstance, current allocations for the railway subsector appear high in relationto its economic role, while the large increase for highways have not been matchedby improvements in management and implementation capability. Specific capitalinvestment proposals must, therefore, be subjected to detailed feasibilitystudies to determine its economic viability and priorities before investmentdecisions and implementation.
20. Donor Financing. Several donor agencies are supporting the sector.Commencing in 1979, the World Bank Group has supported four projects--three ro&dprojects and one road passenger transport project--totalling US$133.0 million.The Asian Development Bank has been assisting RDA in the road subsector--lendinga total of US$73.6 million to date for two road improvement projects. OECP hasfinanced road maintenance (US$99.4 million), railway rehabilitation andmaintenance (US$69.0 million), Colombo Port Development (US$199.8 million) andCo2ombo Airport development (US$73.6 million). The Overseas DevelopmentAdministration (United Kingdom) has funded US$22.0 million for repair andrebuilding of two major trunk roads in Colombo. IDA, ADB, OECF, ODA, Canada andGermany are also participating in the financing of an Emergency Reconstructionand Rehabilitation Program which includes, inter alia, repair and rehabilitationof roads and railways, and also purchase of buses. Other donors in the transportsector include France, India, Republic of Korea and Romania.
21. IDA has taken the lead in arranging donor coordination. The resultantmeetings have contributed to substantial success in reaching consensus onapproaches and overall sector priorities.
SRI LANKA
TRANSPORT SECTOR MEMORANDUM
I. ROLE OF TRANSPORT IN THE SRI LANRAN ECONOMY
A. Country Background
1.1 Sri Lanka is an island with an area of 66,000 km2 measuring about 400km from north to south and 240 km from east to west. The country is generallyflat in the coastal area and mountainous toward the center rising to peaks of2,300-2,600 m. Rivers flow in a radial pattern from the mountains but have nonavigational significance. Economic activity is influenced by the monsoon rains;the Southwest monsoon brings rain mainly from May through July and the Northeastmonsoon during December and January. With an estimated per capita income ofabout US$410 (1990), total population is about 17 million (1990), whichregistered a moderate growth of 1.2Z per annum between 1980 and 1990. About halfof the country's population lives within the south-west quadrant of the island,with densities of over 400 per km2 . The size and topography of the country andthe location of the population generate large and frequent short-distancemovements of goods and passengers.
B. Transport and the Econoy
1.2 Almost 302 of Sri Lanka's gross domestic product (GDP) is generatedin the agricultural sector and close to 202 in the manufacturing sector. As aresult, much of inland freight transport consists of agricultural commoditiessuch as food grains (rice and wheat) and tree crops (tea, rubber, and coconut),as well as other bulk goods such as cement, building materials and oil products.Due to the import-export orientation of the Sri Lankan economy, and theconcentration of most manufacturing industries in and around Colombo where thecountry's principal port is locsted, 502 of total freight is moved into and outof the Colombo area. Consequently, freight and passenger traffic in this urbanarea compete strongly with each other for the utilization of street space.
1.3 The importance of the transport sector in the Sri Lankan economy canbe measured in part by its share of GDP (122 in 1989), the share of Governmentfunds allocated to the sector in recent years, amounting to 142-18% of the totalPublic Investment Programs of 1988-1992 and 1989-1993, which have been increasingfaster than GDP in the recent past. The close relationship between economicactivity and transport can be seen by the upsurge in transport following theliberalization of the economy since 1977. Between 1981 and 1985, transportautput increased at an average annual rate of 7.72, compared to GDP growth of5.5% or per capita of 4.32. The large increase in passenger-kms in that periodcoincided with the beginning of private bus operations as a result of importliberalization; bus passenger-km increased in parallel with the growth inhousehold income (Figure 1). The increase in the number of licensed trucks wasalso pronounced between 1977 and 1985, at an average of 262 while GDP registered62 annual growth (Figure 2). Interruptions in transport can also affect theeconomy negatively. A one month strike by public bus operators in June 1989 andthe curtailment of service by private bus and railway operators brought theeconomy to a standstill. Many workers were unable to get to work, and lostproduction translated into lower growth during the subsequent few months. Soundtransport policies and practices are a catalyst for growth for farmers, workers,
-2-
and investors throughout the economy. Moreover, lower transport costs and be terreliability of services can improve the competitiveness of the country'simportant export sectors.
1.4 With a rich natural resource base, a long tradition of relativelywell-distributed incomes and extensive social services, as well as one of thebest educated populations in the developing world, Sri Lanka has the potentialfor achieving excellent economic performance. However, since independence in1948, it has been plagued by ethnic conflict as well as by inconsistent economicpolicies which have impeded its performance to the point where per capita GDP isonly US$410, and its past social achievements are being eroded. The period ofrapid expansion following the adoption of the economic liberalization program in1977 was not sustained, and this program brought about structural imbalances.With the sharp increase in both investment and consumption spending, coupled withlow national savings and a deterioration in the terms of trade, severe balanceof payments and budgetary difficulties ensued. The main obstacles to sustainedgrowth have been domination of the economy by a large and inefficient publicsectorl/, ambitious and unproductive public expenditure programs2/, and theovervalued Sri Lankan Rupee (Rs). By 1989, escalating public expendituresassociated with the civil conflict had raised the budget deficit to 12.52 of GDP.GDP itself grew only 2.32 in 1989. Inflation rose from 8? in 1987 to 12? in1989, unemployment grew to 18?, the external deficit was over 1O0 of GDP, debtservice was nearly 232 of goods and service exports, and foreign reserves wereat their lowest level in over a decade.3/
1.5 In response to this critical situation, the Government has undertakento stabilize the economy and promote its growth by reducing and restructuringpublic expenditures, eliminating unproductive and low-return investment projects,reforming the civil service and public enterprises, increasing the role of theprivate sector, and restructuring or removing inefficient subsidies andtransfers. In this context, the Government has adopted a time-bound action plan,including prioritizing investment projects with high economic returns, allocatingsufficient funds for maintenance, decreasing the Public Investment Program from16-172 of GDP in the early 19809 to 9-102 during the 1989-92 period, and reducingthe fiscal deficit from 12.52 of GDP in 1989 to 10.42 of GDP in 1992. For thepublic bus operations, the Government is in the process of (a) deregulatingprivate bus fares and privatizing their operations to enable private busoperators to achieve financial viability and to eliminate large Governmentsubsidies; and (b) establishing a responsive regulatory and incentive frameworkto facilitate private sector development (para 2.21).
1.6 The macroeconomic policies and reforms outlined above open the doorto further policy reforms in the transport sector. Budgetary (subsidy) supportto Government operations in the transport sector has ranged from 2 to 3? of GDP,and the challenge now is to reduce such Government subsidies by: (a) increasingefficiency and productivity; (b) adopting appropriate policies (e.g., pricing and
1/ Which employs about 21? of the 6 million member labor force and spendsabout 33Z of GDP.
2/ Supported by foreign aid programs and heavy overseas commercial bankborrowing.
3/ Sri Lanka Country Strategy Paper (February 1990).
-3.
regulation); (c) rationalization of instltutions (privatization or restructuringof public undertakings); and (d) prioritization of capital and recurrentexpenditure. The disruption due to civil strife has been somewhat reduced givingthe Government's stabilization and structural reform initiatives a chance to takeeffect. Thus, the need for fundamental changes in the transport sector occurssimultaneously with the political opportunity to effect such changes.
C. Transport Modes
1.7 Catering to the needs of an export-import orient4d economy, SriLanka's transport system includes road and rail networks (built in the last 50to 100 years) that penetrate almost every part of the island. There are also onemain port and two minor ones, and seven airports, of which only one handlesinternational traffic. Other modes of transport, such as domestic air andcoastal shipping, are of minor importance. A short pipeline carries crude oilfrom Colombo Port to the refinery of Ceylon Petroleum Corporation in Colombo. Busservice is provided both by public and private concerns. Road freight is hauledby private operators; the railways are operated by a Government department.
Modal Split
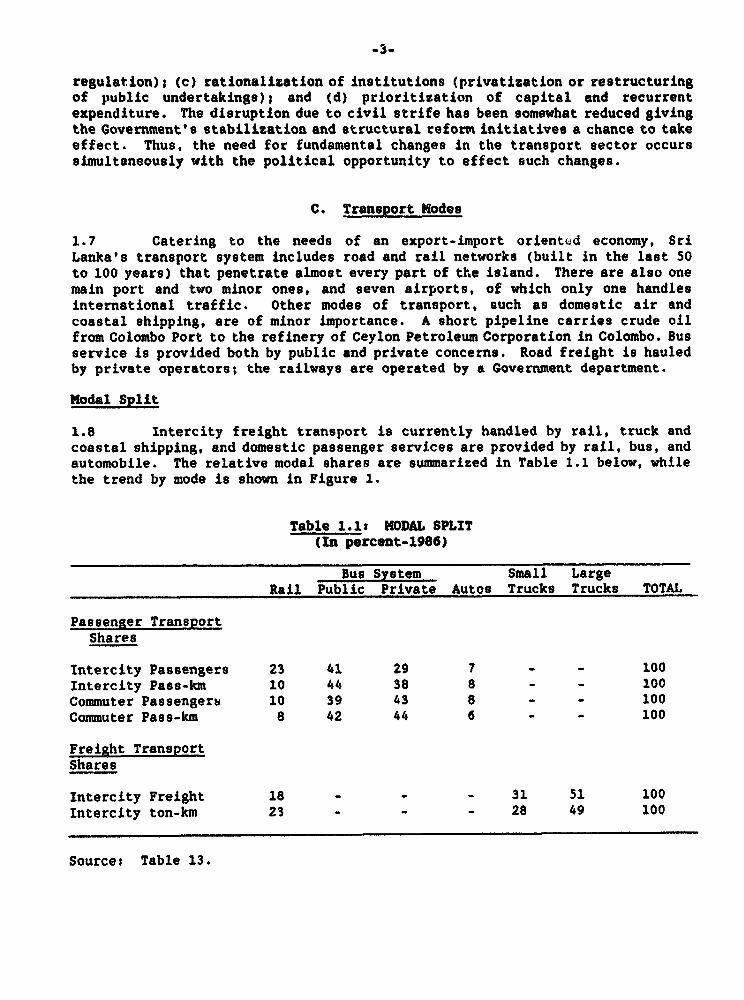
1.8 Intercity freight transport is currently handled by rail, truck andcoastal shipping, and domestic passenger services are provided by rail, bus, andautomobile. The relative modal shares are summarized in Table 1.1 below, whilethe trend by mode is shown in Figure 1.
Table 1.1: MODAL SPLIT(In percent-1986)
Bus System Small LargeRail Public Private Autos Trucks Trucks TOTAL
Passenger TransportShares
Intercity Passengers 23 41 29 7 - - 100Intercity Pass-km 10 44 38 8 - - 100Commuter Passengers 10 39 43 8 - - 100Commuter Pass-km 8 42 44 6 - - 100
Freight TransportShares
Intercity Freight 18 - - - 31 51 100Intercity ton-km 23 - - - 28 49 100
Sources Table 13.

-4-
1.9 In 1986 intercity passengers made 702 of their trips by bus (publicand private) and only 232 by rail, the proportions of passenger-km were 822 bybus and 102 by rail. This indicates that they tended to make longer trips by busand shorter ones by rail. Commuters made 82X of trips and traveled 79Z ofpassenger-km by bus--not indicating a significant difference in trip length.Surprisingly small percentages (72 to 92) were accounted for by automobile trips.Road transport was also dominant for freight, hauling 822 of intercity tonnageand accounting for 772 of ton-km. The remaining freight is handled by rail.
1.10 Coastal shipping currently hauls some commodities previouslytransported by rail: cement and fertilizer f rtm Jaffna to Colombo, and flour fromTrincomalee to Colombo. The amounts are too small to register in Table 1.1, andthese flows may shift back to rail once island security is back to normal.
1.11 Future freight transport demand, derived from estimated growth ratesbetween 1986 and 1996 in the ptoducing and consuming areas, is projected atannual growth rates ranging from 22 (pessimistic) to 82 (optimistic), with a basecase of 4.72. Inter-zonal freight flows are expected to grow from about 10million tons to 15 million tons under the base case, with a possible + 252variation for the other scenarios (Table 1.2 below). Major increases wereexpected in non-traditional agricultural products, building materials, petroleumproducts, forest products, processed foods and industrial inputs. Traditionalagricultural products (rice, rubber, etc.) and mining output are not expected togrow as fast. Passenger transport forecasts based on population distribution,income growth and passenger trips by origin and destination projected that totalintercity passenger trips would grow from 121 million in 1986 to 272 million by1996 under the base case scenario, and a low of 194 million or a high of 340million under the pessimistic and optimistic scenarios. The annual rate oftraffic growth over the 1986-1996 period is estimated in the range of 4-62 forpassenger travel and about 42 for goods.
Road Transport
1.12 Highway Network and Traffic. Sri Lanka's extensive and dense highwaysystem evolved primarily to serve the inland plantations and convey theirproducts to the ports. The network (Table 1) includes al,out 10,440 kilometersof national, 15,300 km of provincial, and over 52,000 km of local roads. Allnational roads are paved, as are about 712 of provincial roads and 13? of localroads, with about 28,000 km of paved roads. The total length has not increasedover the last few years apart from the statistical addition of unclassified roadsto the local roads category. With 65,525 km2 of land area, the network densityis 1,200 km per 1,000 kWm or 4.6 km per 1,000 people, among the highest densitiesin Asia. The number of four-wheeled vehicles per kilometer of road, 3.4, is verylow.
1.13 Some 902 of national roads had traffic of less than 4,000 vehicles perday (vpd) in 1987, while a similar proportion of provincial roads had less than400 vpd. About 430 km of national roads in the vicinity of Colombo had trafficvolumes over 4,000 vpd and about 60 km of these, mostly in and near Colombo, hadvolumes over 10,000 vpd. Traffic volumes on other roads were as low or lowerthan on provincial roads.

-5-
Table 1.2: INTER-ZONAL MREIGHT TRANSPORT DEMAD BY COMMODITY(1986 and 1996)
(1 000 Tons)1986 1996
Base Optimistic Pessimistic
Agricultural Products 382.5 703.4 1,200.4 578.0Building Material 1,037.2 1,775.6 2,415.7 1,394.9Cement 1,450.9 1,649.6 2,124.1 1,288.8Coconut 648.8 957.8 1,161.6 646.8Durable Consumer Goods 51.9 169.6 305.0 97.1Fish 139.2 216.1 251.8 187.1Flour 427.3 465.3 441.0 489.3Food Products 74'1.4 1,126.5 1,166.4 962.9Forestry Products 6i j.6 1,156.6 1,213.3 817.4Fertilizer 729.4 1,160.5 1,368., 1,098.0Industrial Products 599.4 1,185.8 1,723.5 806.2Minerals 30.6 50.7 101.2 30.6Non-durable Goods 261.5 541.9 737.1 400.8Petroleum Products 1,153.3 2,090.9 2,746.9 1,644.3Rice 1,048.8 1,163.4 1,191.2 967.9Rubber 139.9 169.2 169.2 139.9Tea 270.9 310.7 330.9 272.1
Total 9,788.5 14,893.6 18,648.0 11,822.1
Average annualgrowth 1986-1996 - 4.72 82 22
Sourcez TSPS, Vol. 1, 1988, Appendix A7.1.
1.14 Economic growth since 1977 has resulted in heavy traffic on somesections and in the use of vehicles with heavier chassis and axle loads than thepavements were designed to carry. At the same time, shortages of funds haveprevented improvement of roads and bridges, and inefficient maintenancemanagement and practices have led to inadequate drainage and pavement failure.The resulting high vehicle operating costs are up to 502 higher than underreasonable conditions of maintenance. The Government's stated policy is to givepriority to maintaining and upgrading the existing road networks rather than newconstruction, but the authorities have been able to deal with only a fraction ofthe required work load to date.
1.15 Institutions. Responsibility for highway administration currentlyrests with the Ministry of Transport and Highways. However, ten reorganizationshave taken place in the last twenty years. In 1981, the Road DevelopmentAuthority (RDA) was established, and its functions expanded in 1986. As ofJanuary 1990, RDA's responsibilities were reduced to include only the nationalroad network. All other public roads are under the jurisdiction of theProvincial Councils and municipal governments. Whereas RDA has a separate budget(Table 2), other roads must compete for funding with other provincial/localgovernments. Other donors are helping to strengthen highway administration. For
-6-
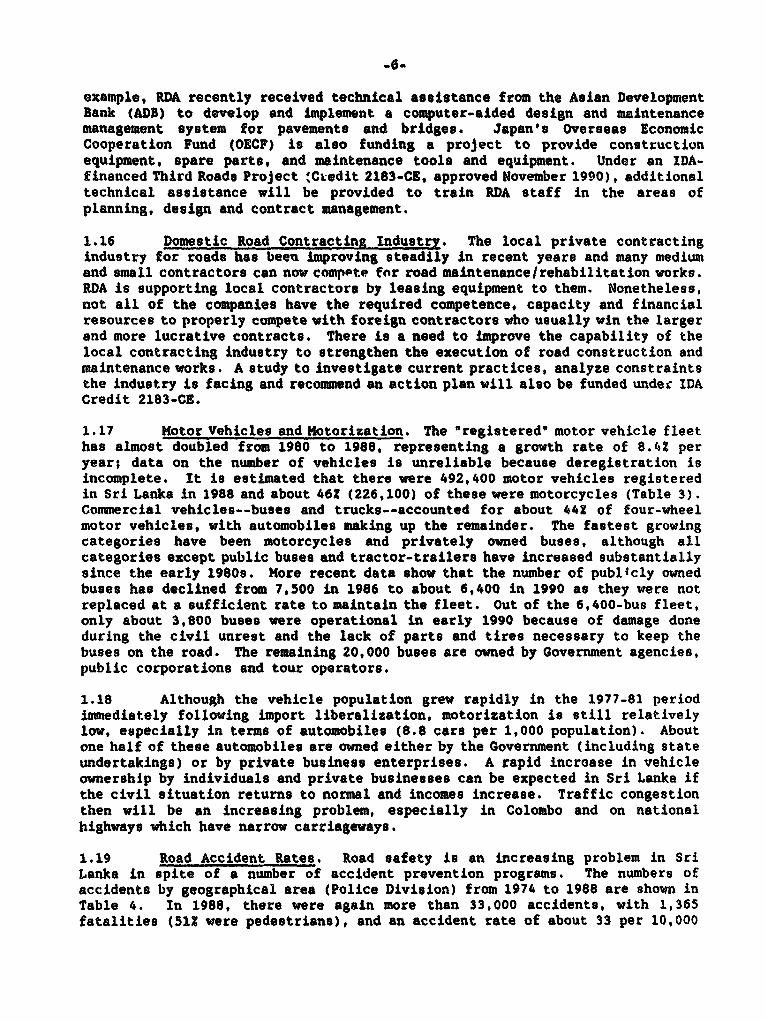
example, RDA recently received technical assistance from the Asian DevelopmentBank (ADB) to develop and Implement a computer-aided design and maintenancemanagement system for pavements and bridges. Japan's Overseas EconomicCooperation Fund (OECP) is also funding a project to provide constructionequipment, spare parts, and maintenance tools and equipment. Under an IDA-financed Third Roads Project 'Ci.edit 2183-CE, approved November 1990), additionaltechnical assistance will be provided to train RDA staff in the areas ofplanning, design and contract management.
1.16 Domestic Road Contracting Industry. The local private contractingindustry for roads has been improving steadily in recent years and many mediumand small contractors can now comppete for road maintenanceirehabilitation works.RDA is supporting local contractors by leasing equipment to them. Nonetheless,not all of the companies have the required competence, capacity and financialresources to properly compete with foreign contractors who usually win the largerand more lucrative contracts. There is a need to improve the capability of thelocal contracting industry to strengthen the execution of road construction andmaintenance works. A study to investigate current practices, analyze constraintsthe industry is facing and recommend an action plan will also be funded under IDACredit 2183-CE.
1.17 Motor Vehicles and Motorization. The "registered" motor vehicle fleethas almost doubled from 1980 to 1988, representing a growth rate of 8.42 peryear; data on the number of vehicles is unreliable because deregistration isincomplete. It is estimated that there were 492,400 motor vehicles registeredin Sri Lanka in 1988 and about 462 (226,100) of these were motorcycles (Table 3).Commercial vehicles--buses and trucks--accounted for about 442 of four-wheelmotor vehicles, with automobiles making up the remainder. The fastest growingcategories have been motorcycles and privately owned buses, although allcategories except public buses and tractor-trailers have increased substantiallysince the early 1980s. More recent data show that the number of publicly ownedbuses has declined from 7,500 in 1986 to about 6,400 in 1990 as they were notreplaced at a sufficient rate to maintain the fleet. Out of the 6,400-bus fleet,only about 3,800 buses were operational in early 1990 because of damage doneduring the civil unrest and the lack of parts and tires necessary to keep thebuses on the road. The remaining 20,000 buses are owned by Government agencies,public corporations and tour operators.
1.18 Although the vehicle population grew rapidly in the 1977-81 periodimmediately following import liberalization, motorization is still relativelylow, especially in terms of automobiles (8.8 cars per 1,000 population). Aboutone half of these automobiles are owned either by the Government (including stateundertakings) or by private business enterprises. A rapid increase in vehicleownership by individuals and private businesses can be expected in Sri Lanka ifthe civil situation returns to normal and incomes increase. Traffic congestionthen will be an increasing problem, especially in Colombo and on nationalhighways which have narrow carriageways.
1.19 Road Accident Rates. Road safety is an increasing problem in SriLanka in spite of a number of accident prevention programs. The numbers ofaccidents by geographical area (Police Division) from 1974 to 1988 are shown inTable 4. In 1988, there were again more than 33,000 accidents, with 1,365fatalities (512 were pedestrians), and an accident rate of about 33 per 10,000

-7-
vehiclesl about 10 times higher than in the industrialized countries.4/ Thelack of driver discipline is clearly a major factor in the high accident rate.compounded by the mix of traffic and road users (motorized vehicles, pedestrians,animal and human-drawn carts, bicycles, three-wheelers, loose livestock); narrowand uneven road and street surfaces; poorly-maintained vehicles; and a lack ofpedestrian facilities. Contributing to the lack of discipline are poor drivereducation, lack of strict licensing procedures, and a very low level ofenforcement of even basic traffic regulations. The undisciplined use of theroads greatly reduces effective road capacity and contributes to unnecessarilyhigh road transport costs.
1.20 Road User Charges. Road user charges include taxes, license andregistration fees and duties. Total revenues from road user charges in 1988 wereestimated to be Rs 4.2 billion, more than enough to cover the Rs 1.3 billionexpenditures in road rehabilitation and maintenance in the same year or to coverthe required, higher budget. As is typical in many economies, road user chargesare used partly to fund sector expenditure and partly for general expenditures.A comprehensive study on road user charges is being undertaken to determine theappropriate structure and level of road user taxation that would minimizepavement damage, encourage proper axle configurations and reduce relative pricedistortions (para 2.16).S/
1.21 Road Passenger Transport. For the majority of people in Sri Lanka,bus transport is the main form of motorized transport. It is estimated thatpresently over 801 of passenger travel is on buses. Until 1979, passengertransport was the monopoly of Sri Lanka Central Transport Board and nine RegionalTransport Boards. Since 1979, however, private operations have been allowed tocompete with public services. Private bus operations have grown rapidly, nowrepresenting about 601 of total buses, about 402 of total bus capacity, andapproximately 501 of total passenger-km. As discussed in paras 2.19-'.21, theGovernment is in the process of privatizing all bus services.
1.22 The bus transport network within Sri Lanka is extensive, and mostagglomerations from the smallest to the largest towns, including Greater Colombo,are served. Frequencies are generally tailored to demand, except during peakperiods in the Colombo Metropolitan area, and range from very short headways formost urban and some inter-urban services, to two buses per day in the thinlypopulated areas. Private buses are concentrated in highly trafficked urban andintercity services and operated under the same range of fares as public busesuntil January 1990 when a fare increase was granted to private operators by theGovernment, the first since 1983.
1.23 However, the present bus transport service in Sri Lanka is inadequateto meet the travel needs of the public, as is clearly demonstrated by the highvehicle loads and long waiting lines observed in many parts of the country,particularly during commuting hours. This inadequacy results from a shortage ofbuses and unavailability of many of those in the fleet. Replacement of agingbuses by both private and public operators has been seriously impeded by
4/ Japan has a rate of three per 10,000 vehicles.
Sl Funding provided under IDA Credit 2183-CE, November 1990.

-8.
Government controls on passenger fares combined with the high cost of financingnew buses. This situation is expected to improve if the Government implementsthe planned bus fare deregulation.
1.24 Detailed estimates of revenue and expenses of private buses are givenin Table 5 and summarized in Table 1.3 below.
Table 1.3s SUMNARY ESTIMATES OF REVENUE AND EXPENSESFROM PRIVATE BUSES, JANUARY 1990
Large Bus Medium Bus Small Bus(In Rupees)
Revenue 0.194 0.256 0.333Costs 0.185 0.253 0.379Profit 0.009 0.003 -0.047
These data must be qualified in two ways: (a) revenues based on seat-km areprobably underestimates as recent higher load factors have not been included; and(b) interest is not included in costs. From the data, it appears that busservice is barely profitable. The 1990 fare increase of 242 is considerablylower than the increased operating costs ranging from Rs 0.19 to Rs 0.38 perseat-km which are 562 to 642 higher than those in 1986.
1.25 Road Freight Transport. The composition of the fleet (vans: two-axletraditional; multi-axle) is not known but it is estimated that less than 10? ofthe fleet is multi-axle. About two-thirds of the trucking fleet is privatelyowned, predominantly by small operators. The remainder is owned by Governmentagencies, public corporations and cooperatives. A shippers' choice surveyconducted in 1986 indicated that importers/exporters, manufacturers, and tradersfound trucking services to be satisfactory in terms of reliability, even if theirfreight rates were generally considered to be high. The origin-destinationsurvey conducted in the same year showed that about 202 of the total traffic onthe main highway network was trucks, of which 902 were two-axle trucks; less than5? were three-axle trucks or tractor trailers. Apart from annual vehicleinspections and gross vehicle weight limitations, road freight transport isunregulated with no officially set tariffs,6/ and entry to the industry isfree.
1.26 The financial cost of freight transport per ton-km varies from Rs 1.37to Rs 2.6 plus loading and unloading. These freight transport costs appear tobe adequately covered by the average tariff level in January 1989, as shown inTable 6 (Rs 3.63 - Rs 3.98), and the tariffs have since been increased by 30t (inAugust 1989), apparently providing a comfortable margin to the truckers to coveroverhead and profit. There are indications that some truckers' associations areable to negotiate tariffs somewhat higher than those charaed by non-members whencarrying Government freight (e.g., tea estates). Nevertheless, truckers appear
6/ Although there is no formal regulation of tariffs, it is customary fortruckers' associations to seek Government agreement on tariff increases.

-9-
to be supplying the freight services that are needed gnd competing effectivelywith the railway.
Railways
1.27 Sri Lanka Railways (SLR) is a Government department under the Ministryof Transport and Highways (MTH) and employs about 20,000 people. Most of the1,450 km of track and over 1,000 steel bridges were built up to 100 years ago.The track is broad gauge with the exception of the 59 km on the Kelani ValleyLine, which is narrow gauge. Most of it is single line, except for 102 km ofdouble track in the Colombo area. It has about 200 71 diesel electric anddiesel hydraulic locomotives in service, 4,000 wagons, 1,300 coaches, and 46power sets used exclusively for commuter traffic within the Greater Colombo area.The principal commodities hauled are building materials (including cement),petroleum products, fertilizer, limestone, rice, and flour.
1.28 The railway system has deteriorated because of competition by roadtransport and consequent decrease in revenue, increased costs, and disruption ofservice by civil disturbances. These factors require increasing subsidies whichhave not kept up with costs. Management has therefore deferred track andbuilding maintenance, and amassed an extensive fleet of out-of-servicelocomotives and rolling stock while awaiting imported spare parts. Consequentdecreases in productivity for workshop staff and maintenance personnel havecreated a morale problem that has discouraged the more qualified and capablestaff.
1.29 The civil unrest in the north and east of the island starting in 1983,resulted in suspension of the profitable long-distance operations to Jaffna,Kankesanthurai and Trincomalee until March 1990. Curtailment of these servicesand competition from buses and trucks has contributed to the reduction of totaltrain kilometers to 70? of their 1980 level in 1988 (Table 7). Total ton-kmaveraged 268 million between 1975 and 1979, but declined by 19X in the 1980s toan average of 217 million, despite a brief rise in 1984 back to the 1970s level.Since 1985, the volume has been fairly steady at around 200 million ton-km,despite the loss of north-south, long-distance traffic. Rail passenger trafficreached a peak of 4.1 billion-passenger kilometers in 1979. Since then, it hassteadily declined to 1.9 billion in 1988.
1.30 The SLR has experienced high unit operating costs stemming from up-country operations in hilly terrain, redundant staff, and an uneconomic mix ofshort-haul bulk cargo and local or mixed passenger trains requiring frequentstops. The estimated operating costs per train-km, converted to cost per ton-kmand passenger-km, show that average unit costs have increased from 1985 to 1988by 63Z, 202 of which was due to a drop in the train-km run by the SLR in 1988,202 to increased interest charges, and most of the rest due to labor costincreases. This increase is above the inflation rate and represents an increaseof 14X in real operating costs.
1.31 The increased costs have not been offset by increased revenues: on thecontrary, fares are highly subsidized. For example, there are subsidies up to90g for season ticket holders, civil servants and school children. To a lesser
7/ Of which about 110 are for mainline freight service, with the remainderproviding intercity passenger and shunting services.

-10-
extent, freight tariffs are also subsidized and averaged 782 of full costs or 6S5of operating costs in 1988 (Table 8). In 1988 the SLR's operating lossesamounted to Rs 1,500 million. About one-half of this deficit is accounted forby installment payments for assets procured abroad. The financial situation ofSLR is becoming even more unhealthy with operating expenditures growing fasterthan revenue, as shown in Table 9. Although the Government continues to makebudget appropriations for operating subsidies, the SLR remains a financialquagmire.
Colombo Urban Transport
1.32 The Greater Colombo area comprises the municipality of Colombo andeight other contiguous municipalities. Greater Colombo corresponds roughly tothe Western Province. There is little coordlnation between the communities andthe Urban Development Authority, created to promote such coordination, has inpractice carried little clout.
1.33 Greater Colombo has a population of over four million inhabitants,approximately 262 of total population and 602 of urban population. Between 1980and 1985, population grew at about 82 per annum. Although data are lacking,there is little reason to believe that growth rates have declined in the pastfive years. Colombo is the primary industrial, commercial and transport link ofthe country, as well as its seat of Government; over 40? of the gross nationalproduct (GNP) results from activities in the region, and transportation is oneof the key elements needed to make it more efficient.
1.34 Greater Colombo has a network of 2,453 km of paved roads and 2,586 kmof unpaved roads, managed by Colombo Municipal Council and RDA (50 km of truckroads). Traffic volume of major roads has been growing at 4X per annum for thepast several years, but is likely to result in major congestion in the absenceof mitigating measures. The region is served by 2,800 public buses and about6,400 private buses which provide service every six to ten minutes on majorroutes. The rail network service for Colombo includes four lines with a totalof 164.4 km of track. Service to the 80 stations and other stopping places isreliable but less frequent and direct than buses. In addition to road and raillinks, the St. Sebastian Canal and the Kelani River present opportunities forbypassing the congested roads leading to the port and central city, although thewaterways are used much less than in the past.
1.35 The recent growth in motorization and railway services has not keptpace with rising urban travel demand. Public transport passenger trips compriseapproximately 902 of all urban travel, and there exists a chronic shortage of busand train services. The inadequacy of the present bus fleet and rail system isevidenced by severe overloading on most vehicles during peak travel periodsthroughout the region, and the worsening quality of public transport serviceoffered in many travel corridors. Nearly all goods movement is serviced by vans,pick-ups and heavy trucks over a highly congested urban road network. Lighthauls over shorter distances are still handled by slow-moving push-carts andother small vehicles, worsening already difficult traffic flow conditions.
1.36 Travel delays, increases in vehicle operating costs, a greater numberof traffic accidents, and other factors have begun to pose a threat to the long-term health of Colombo's urban economy. According to the TSPS forecast, trafficgrowth in Colombo will lead to a significant increase in travel delay on six keyurban travel corridors. Traffic volumes are expected to exceed the design

-11-
capacit:' of these roads by 1996. The present average increase in vehicleoperating costs p.a. due to congestion in the Galle Road corridor, for instance,is estimated at 5-102. This is forecast to accelerate to 35-SO by 1996,representing a major economic cost. To head off this traffic crisis, acomprehensive urban transport strategy and an investment program with appropriatefunding are needed for the Greater Colombo area.
Ports and Shippin
1.37 Ports. There are three ports for deep sea vessels. Colombo Port, thelargest, is located on the southwest coast; Trincomalee, the second largest, islocated on the northeast coast; and Gnlle is located about 120 kilometers southof Colombo. Until 1979, all the ports were under the Ministry of Trade andShipping as a department and were operated through a tripartite administrativestructure of agencies involving the Colombo Port Commission, the Port (Cargo)Corporation and the Port Tally and Protective Services Corporation, sharing amongthem the funding of port management, port planning, engineering and operations.Inevitably, there was duplication of work, lack of coordination, policydisagreements and long delays in day-to-day operations and projectimplementation. To integrate the port management, engineering, planning andoperational functions, the ports were removed from control by a Governmentdepartment, and the Sri Lanka Ports Authority (SLPA) was established in August1979 as a statutory body to take over the functions previously performed by thethree organizations.
1.38 Since the major restructuring, the SLPA has been able to streamlineport operations, speed up development activity, put in place a planning mechanismand remit substantial income tax revenues to the Government. Colombo Port is themost active of Sri Lankan ports as shown in Table 10, and it has become a majortransshipment point in South Asia. Container traffic through Colombo hasincreased from 7,500 twenty-foot equivalent unit (TEU) (the standard containerunit length) in 1978, to 621,000 TEUs in 1988, of which about 70, weretransshipments. More recently (1990), the share of transshipment is estimatedto have increased to 772 of total TEUs handled by Colombo Port. Financialrecords indicate that Port Authority has earned after-tax surpluses of Rs 40million in 1979, growing to Rs 313 million in 1988. The performance and growthof the port have been impressive, but since the utilization of the port dependslargely on the transshipment traffic, it could be vulnerable to competing portsand other developments in the region. The possibility of such developments hasto be carefully assessed in planning additions to the capacity of the port. Thetwo container terminals at Colombo Port were financed by OECF; the third one isalso being constructed with financing from OECF for about US$80 million.
1.39 Shipping. The Government-owned Ceylon Shipping Corporation (CSC) wasestablished in 1971 by a Parliamentary Act to operate services for the transportof goods, mail and paseengers by sea and to carry on business as ship owners,charterers of ships, ship brokers, and shipping agents, as well as to undertakeconstruction, maintenance and repair of ships. With an initial capitalcontribution of Rs 100 million by the Government, CSC has developed a number ofsubsidiary companies: Ceylon Shipping Lines (1002 owned), Ceylon Port Services(100?), Colombo Dockyards (75?), Amalgamated Lines (51?), and Lanka Tankers(50Z). Throughout the seventies, CSC provided conventional liner services on theSouth Asia-Europe, South Asia-Far East, Sri Lanka-Red Sea/Mediterranean and SriLanka-Arabian Gulf routes as well as tramp shipping services along the west coastof India.

-12-
1.40 The CSC operates eight container vessels, with a total capacity of86,800 dwt. From time to time, the CSC also charters cellular container shipsto serve the UK/Europe, the! Middle East and Hong Kong/Japan routes. In addition,it owns a 30,000 dwt tankcer which is used to import about a quarter of thecountry's crude oil requirements.
1.41 In 1986, the CS- carried out about 132 of total marine freight butincreasingly, it has had to rely on budgetary support to service its debtpayments. Table 11 shows CSC's financial and operational performance in 1986.The main causes of CSC's problems can be summarized ast (a) its overly optimisticexpectations to capture a large share of the container traffic market at a timewhen the world economy was heading for a recession; (b) its decision to doubleits fleet capacity all at once rather than in stages; and (c) its purchase ofsmall cellular ships, ran&ing from 175 TEUs to 537 TEUs, when other shippinglines were purchasing large container ships (1,500 TEUs - 2,000 TEUs) for longhauls to take advantage of economies of scale. (CSC's long-haul SouthAsialEurope container services were similarly showing excellent profits withchartered 1,074 TEU vessels.) The vessels purchased by CSC were suitable forfeeder services, but they accounted for only one-third of the total CSC netfreight earnings in the early eighties.
Air Transport
1.42 Airports. The only significant airport operating at the present timeis Colombo International, located in Katunayake, 32 km north of Colombo, andoperated by the Airport and Aviation Services Company, Ltd., 9s an agency of theGovernment. Other airports at Jaffna, Trincomalee and Batticaloa formerly servedscheduled domestic air routes, but these are no longer in operation (except forair taxis and general aviation). The former international airport at Ratmalanais now used for military and general aviation. The Colombo airport presentlyhandles 2.5 m'llion passengers per year, and is expected to handle five millionby the year 2000. Air freight volumes are currently about 30,000 tons/year andexpected to increase to 70,000 tons/year by 2000.
1.43 The airport is well equipped to handle all types of aircraft. Thereare now two runways opened to traffic in 1989, two taxiways, (one with a highspeed turnoff), an ample terminal apron, and modern radio navigational aids. Morerecently (1989-90), a new passenger terminal was completed, and a 42,000 toncapacity cargo building became operational, with a 5,000 m2 maintenance complex.
1.44 The airport is served by a spur access road from the Colombo-Negomboroad. A rail spur from the Colombo-Puttalam line also serves the airport. Itis located close to the heart of the Free Trade Zone, which contains a largeconcentration of industries producing garments and other light manufactured goodssuitable for airfreighting. Although high airfreight tariffs cause nearly 90?of garment exports to be moved by ship in containers, those exported by air(mainly to the U.S. and Europe) make up 30? of outbound air cargo.
1.45 Nearly 15 tons of fruits and vegetables move daily as air cargo to theM4aldives, West Asia, and the Gulf region, and about 7.5 tons per day of crabs,lobsters, and live fish are flown to Japan, Germany, and the U.S. Other airexports include cut flowers, foliage plants, and betel leaves.
1.46 Air Lanka. Air Lanka was established in 1979 as a state-ownedairline. Enthusiasm following liberalization in 1977, easy access to

-13-
international capital markets, and the rapid growth in tourism, led theGovernment to support its creation in spite of the previous unsuccessfulexperience with Air Ceylon. Air Lanka began operations with one aircraft (B-707); an early association with Singapore International Airlines provided keypersonnel and technical assistance in all aspects of the new company'soperations. Air Lanka expanded rapidly in the early 1980s and built up a goodreputation for in-flight service.
1.47 However, throughout most of the 1980s, Air Lanka suffered from a longperiod of losing performance. It had required about US$250 million from theTreasury to cover its losses in servicing its debts. The poor financialperformance was the result of; (a) expanding rapidly without an equity base, withannual interest charges exceeding 20? of re;enues; (b) flying too many routeswith low traffic volumes; and (c) purchasing a fleet of aircraft incompatiblewith the routes and the demand mix for passengers and cargo. The airlinecontinued large losses and its constant need for budgetary support led thePresident to appoint a Committee of Inquiry which highlighted the airline's poormanagement practices and costly errors.
1.48 A major restructuring took place in 1988 under a new board ofdirectors. A number of measures were undertaken: (a) high level management wasstrengthened; (b) two B-747s were sold to reduce excess capacity; (c)unprofitable routes were eliminated; and (d) operating costs were lowered throughstaff reduction, improved scheduling and aircraft utilization, and budgetarystringencies. By FY89, an operating profit of Rs 430 million was projected(Table 12). with a further increase in revenue for the first three quarters ofFY90. With prospects of increased tourist traffic in the future, furtherimprovement is expected.
Intermodal Linkages
1.49 The TSPS analyzed in detail the intermodal aspects of the transportsystem from the viewpoint of the most economic allocations of traffic, transportcapac ty, and capital investments among the various modes, with particularattention to road and rail transport comparisons. There are significantdistortions in actual allocations resulting in unnecessarily high transportationcosts, primarily attributable to: (a) costs of some modes which are excessivebecause of inefficient operation; and (b) tariffs which are not based on, orreasonably related to, the costs of providing services. These problems, bothmodal and intermodal, are in part attributable to the lack of vigor in applyinga consistent transportation policy. In the development and implementation ofsuch a policy, the Government requires considerable technical and analyticalsupport through the IMC-CPT. Below are some observations on intermodal linkages.These are also discussed in Chapter II--Development Strategy by Model Issues andRecommended Strategies.
1.50 Intercity Passengers. Rail and road traasport compete for urban aswell as intercity traffic. The estimated shares of each for passengers andfreight in 1986 (shown in Table 13, and discussed in paras 1.8 and 1.9) seem tohave changed by 1988. Available data indicate that the railway share estimatedat 1.9 billion passenger-km, had further declined to 5.6? of total passengertransport, down significantly from 10-152 in the decade of 1975-86. Bus travel,estimated at 33 billion passenger-km in 1988, was about 12? greater than in 1984.If the security situation were normal, rail traffic would increase, but theoverall balance of passenger traffic would be biased in favor of rail due to the

-14-
very low subsdized fares. Although surveys show that users favor rail forcomfort, the advantage of train service over bus service in terms of reliabilityand speed is less under present conditions than in the past.
1.51 Freight. The overall balance of freight between rail and road formedium to long distance (intercity) shipments appears to be more closely relatedto the economic costa of the services than is the case for the other railservices. If SLR concentrates its efforts on improving the services mostappropriate for the railway, it is possible that this balance could be achievedwith a rational cost-related tariff structure and commercialized railwayoperations.
1.52 Ports and Land Transport. Container transfer between the pert andland transport modes is biased in favor of road transport, leading to unnecessarytraffic congestion. Road haulage of containers is cost-effective for many shorthauls, but rail transport is better able to accommodate high density movementsof containers and longer hauls. The present lack of an effective port-rail linkin Colombo is a major factor contributing to this problem which reduces thetransport sector performance.
D. Transport Regulation in Sri Lanka
1.53 Legislation described below regulates the operations of motorvehicles, buses, railways, and shipping. In general, motor vehicles must beregistered, and vehicles carrying passengers for hire must have permits to do so.Driving licenses are required, and there is provision for licensing drivinginstructors and schools. Third party insurance is required, and certainrestrictions on the use of highways are spelled out. The Government isauthorized to regulate the types and construction of vehicles permitted tooperate on public roads, and the Commissioner of Motor Vehicles (Ministry ofTransport and Highways), is authorized to inspect all motor vehicles and toestablish other regulations. Limits are specified on gross vehicle weights (GVW)for certain types of vehicles--but not specifically on axle loads--and the limitsare somewhat inconsistent. For instance, the maximum GVW for a standard two axletruck is 15,275 kgs which, in terms of axle loads, would indicate a rear axle of10-11 tons and a front axle of some 4-5 tons. A single axle load of 10-11 tonswould normally indicate a tandem axle of 16-18 tons. However, the maximum GVWfor a semi-trailer with two tandem axles is only 30,500 kgs which would indicatea maximum load on each tandem axle of 13-14 tons, while at least 16 tons wouldbe consistent with the 10 ton single axle. The semi-trailer would thus beunderutilized by about 6-8 tons. The regulations therefore favor the use of two-axle trucks rather than the multi-axle truck that may be more economical and lessdamaging to the roads. This aspect of the regulations needs to be reviewed toprovide a consistent approach to vehicle weights and axle loads and axleconfigurations.
1.54 In addition, there are laws regulating the operation of buses, eitherpublicly or privately owned. The Sri Lanka Central Transport Board and itssubsidiaries, the Regional Transport Boards, were established in 1959 (afternationalizing all privately owned buses) and were authorized to operate busservices as well as set fares subject to the approval of the Minister ofTransport and Highways. Private bus services are also authorized, subject topermission by the Director of Private Omnibus Transportation (DPOT) to operateon designated routes at fares specified by the Minister. The Minister is also

-1S5
required to constitute District Private Omnibus Operators' Associations to whichoperators must belong and which have power to set and enforce schecl'd -es, ensureadequate service with comfort and safety of passengers, and to collec-. fiembershipand user fees. While these associations, to which most private operators belong,may have a useful role, there is the danger that they could act as cartels andprevent competition from performing its role of economic pricing.
1.55 The Railways Ordinance No. 9 of 1902 is the only legislation governingoperation of the railways. It gives the State Hinister of Transport (Ministryof Transport and Highways) authority to make rules, set fares and charges, andgives the General Manager the right to reduce rates, but not increase them.Otherw.se, it is concerned mainly with passenger behavior and ensuring thatrights-of-way are not obstructed. It is generally not concerned with how therailway itself is operated.
1.56 There are laws that would permit very restrictive regulation ofshipping by the Director of Merchant Shipping, Ministry of Trade and Shipping,but these have not been used. The Central Freight Bureau used to allocate cargoto shipping lines (favoring Ceylon Shipping Corporation) and controlled rates,but in January 1990, these functions were deregulated. Traders are now allowedto choose any shipping company to carry their cargo except for a limited numberof routes, primarily to Northern Europe. Other laws established the Sri LankaPorts Authority and the Ceylon Shipping Corporation as autonomous Governmententerprises.
S. Environmental Considerations
1.57 The National Environmental Act, as amended in 1988, requires allexecuting agencies, including those of transport to thoroughly assessenvironmental impacts of projects they execute. The Central Environmental Agencywas established to oversee and monitor their compliance. To strengthen itsoversight capability, a USAID-financed consultant has prepared a financial,training and technical assistance program which addresses a number of areas,including those related to transport.
1.58 Since most of transport works involve rehabilitation and maintenanceof existing facilities which have served the same purpose for many decades, noadverse long-term impacts on the environment are expected. For instance, roadand bridge works under the Third Roads Protct -equire no major earthworks or cutand fill work, realignments or changes in r.atral drainage, and therefore, therewill be no adverse intrusion into the enviroswment. The need for resettlementsometimes arises if the road bed is widened as houses and other structures oftenencroach on right-of-ways. Similarly, the railway rehabilitation works involvereconstruction of existing workshops, replacement of sleepers and track renewal,and rehabilitation of old rolling stock. Traffic management measures in urbanareas should result in greater comfort and reduced travel times. Some noise anddust created during implementation temporarily affect adjoining areas and theremay be high levels of pollution from vehicle exhaust fumes. In the long run,rehabilitation works will be beneficial as they will reduce user discomfort,allow a smoother flow of traffic and improve drainage with a consequent loweringof current levels of traffic noise, dust and air pollution and a reduction in thepresent susceptibility to flooding of the roadside dwellers.

-16-
1.59 The Government should continue its policy of incorporating provisionsin contract documents to safeguard the environment in respect of: (a) regradingand landscaping borrow areas, quarries and spoil tips; (b) storage areas,especially those for diesel fuel and bitumen; (c) sanitary arrangements inoffices, yards and onsite; (d) avoiding pollution of water courses andgroundwater; and (e) disposal of discarded materials in an environmentallyacceptable manner.
1I. DEVELOPMENT STRATEGY BY MODE:
Issues and Recozuwnded Strategies
2.1 In this Chapter, the major issues affecting each mode are presented,along with proposed strategies to resolve them. The strategies generally fallunder five categories: (a) policy reform; (b) institutional reform; (c) improvedoperations and maintenance; (d) rational selection criteria to determineinvestment priorities within resource constraints; and (e) resource mobilizationpotential. The main emphasis is on institutional reforms needed to improvesector performance and achieve progressive reduction and rationalization ofpublic expenditures. All strategy actions are summarized in Annex 1--a matrixwhich prioritizes activities over the coming years. Estimates of net benefitsof many of the recommendations are summarized in Table 2.1 below (see para 2.57).
2.2 The performance of all transport modes has deteriorated since 1983except the Sri Lanka Port Authority and Air Lanka after restructuring in 1988.To reverse this trend, a coherent transport strategy is needed to increaseoperational efficiency, overcome financial problems, and prioritize investmentdecisions to improve the sector's overall performance. While the challengesfacing the sector are great, the success achieved by the reorganized Sri LankaPort Authority and Air Lanka have demonstrated the effectiveness of major reformscarried out in the areas of management, operation, pricing and marketing. Thelessons to be learned are cleart (a) privatization is appropriate for manytransport modes, but when not practicable, efficiency in publicly-ownedenterprises can be achieved with management structures patterned on privateenterprise; and (b) political will and commitment are needed at the highestlevel. Dedicated and qualified people must be recruited who will provideleadership, carry out key reforms, establish incentives for good performance, andprovide needed staff training, with the goal of improving economic efficiency.The potential also exists for other transport modes to undertake reforms toimprove their efficiency.
2.3 Both users and operators make many thousands of decisions each day inthe marketplace based on the cost and convenience of transport services, and theperceived profitability of operations and investments. In this environment, itis important for the Government to recognize its role and increase itseffectiveness by providing and maintaining, (a) appropriate transportationinfrastructure; (b) a competitive atmosphere where transport operators and userscan make their own decisions within a policy framework and guidelines establishedand monitored by the Government; and (c) adequate and efficient transportservices on a commercial basis except for the public service obligations to beclearly defined by the Government.

-17-
A. Highway Developient
Issues
2.4 In addition to the Government's sound objective of providing increasedfunds for roati maintenance and rehabilitation, the key question is how toaccomplish such tasks at least possible cost. This requires overcoming majorweaknesses in the subsector; a summary of those weaknesses are discussed below.
2.5 Institutional. With another highway administration reorganizationcurrently underway--decentralization of responsibility for provincial roads, some1,100 staff members (including 60 professionals) out of a total of 2,700 (320professionals) are being transferred to the Provincial Councils (PCs) to handlethe administration of Class C and D roads. Although well-intended, thesefrequent changes and reorganizations--without a clear policy framework,operational targets and strategies--have brought confusion, low staff morale anda loss of qualified staff to the private sector.
2.6 Outdated Maintenance Practices. RDA's routine and periodicmaintenance operations involve sand seals, semi-grouted macadam and patching astney rely heavily on the use of handbroken stone and naturally availablematerials such as sand. These maintenance and repair processes are inefficient,costly and are of poor durability. Consequently, road surfaces deterioraterapidly with attendant high vehicle operating costs. The continued use of thesemaintenance practices on highly trafficked roads means that scarce funds arebeing wasted as they lead to short-lived improvements in the condition of theroads.
2.7 Lack of Rigorous Analysis to Determine Priorities. Although wellintended and planned, RDA has not been systematically collecting the necessaryinformation nor developing the required tools for planning and evaluatingdifferent investment options and determining priorities. Traffic counts, roadcondition surveys, axle-load surveys and cost-benefit analysis are undertakenonly in connection with foreign assisted financing of particular road stretches.Domestically-financed road rehabilitation/improvement works amount to about halfof the funds expended in the road sector, but receive only cursory evaluation.The absence of rigorous analysis to determine priority investments among locallyfinanced projects results in suboptimal use of scarce funds. Thus far, onlyabout 1,500 km of roads have been subjected to feasibility studies. This makesup only about 6? of the road network formerly under the RDA jurisdiction. On thevast majority of national and prcvincial (trunk) roads, little information isavailable on road surface roughness, strength, traffic and axle loadings.Without these fundamental data, it is difficult to estimate accurately the needsof the road network for periodic maintenance, rehabilitation, or upgrading, letalone prioritize them to fit the works within the limited budget.
2.8 Inadequate Funds for Road Maintenance. Due to the country's generalresource constraints, the level of funding for roads has been inadequate to meetthe backlog of maintenance and rehabilitation. Estimates of "ideal' requirementsto bring the entire road network to fully maintainable stardard are as high asRs 7 billion per year, compared to the estimated expenditures of Rs 1.0 billionin 1987 and Rs 1.3 billion in 1989 (Table 2). Clearly, rigorous prioritizationis in order. Routine maintenance and pavement repair works have been especiallyneglected, while rehabilitation works have fared a little better due to thewillingness of donors to finance such works. The accelerating rate of road
-18-
deterioration has resulted in high vehicle operating costs which add substantialcosts to the economy. Economic returns for periodic maintenance works onselected roads range upwards from 302, indicating that required maintenance hasbeen long overdue.81 Delay in implementation of road maintenance meanssubstantial economic benefits foregone for each year of postponement; therefore,increased budgets are needed urgently for maintenance and rehabilitation. Abrief review of road user charges (Annex 2) seems to indicate that most vehiclesare paying their share for using highways through high import duties on fuel.
2.9 Local Construction Industry. The road construction industry isheavily taxed and generally, credits to contractors must be covered by mortgagesof real estate property. Having limited access to credit, private contractorsare forced to hire the required equipment from the Government equipment pool ona daily or weekly basis. Other barriers to sound development of the constructionindustry includet (a) lack of managerial capabilities to organize and executephysical works; (b) inability to accurately estimate the cost of road works; and(c) little assurance for sustained road maintenance/rehabilitation works.
2.10 Vehicle Overloading. The problems of vehicle overloading do notappear to be as severe as in some other countries in the region according to thetwo-axle load surveys conducted by RDA in 1989 on limited stretches of majortrunk roads. Although the surveys indicated that about 102 of 16-ton two-axletrucks (the vehicles causing most damage to pavement) were about 20? above legallimits, the percentage seems too low. These surveys are not comprehensive; axleload surveys planned as part of the study on road user charges may reveal a morewidespread practice of overloading in view of the trucks frequently observed inthe traffic stream with modified body structures and suspension systems designedto carry heavier loads. Load limits are not enforced and facilities forenforcement are not available in the country.
Strategies
2.11 Several measures should be introduced immediately to increase theeffectiveness of the highway subsector within the context of ongoing activitiesinc'luding donor-funded projects of IDA, ADB and OECF.
2.12 Strngthen Institutional Capability. RDA is taking steps to enhanceIts policy analysis within which its corporate objectives are defined,operational targets set, and performance evaluation criteria spelled out toprovide direction to the activities of the organization and accountability withregard to the performance of its staff. The establishment of an incentive schemeof rewarding good performance is part of this strategy. To achieve theseobjectives, the frequent reorganizations experienced in the past as well as stafftransfers should be minimized (para 1.15).
2.13 Modernize Road Maintenance Operations. RDA's routine and periodicmaintenance operations involving sand seals and semi-grouted macadam should bediscontinued, especially on heavily travelled roads, to avoid wasting scarcefunds, and be replaced by proper surface treatment, i.e., chip seals, slurryseals, double bituminous surface treatment, or the macadam method, together withmetalling asphaltic concrete overlays of appropriate thickness. Initial costsmay be higher than current practice, but over the long run, economic returns from
8I Based on the economic analysis for the Third Roads Project, Credit 2128-CE.

-19-
this strategy will be substantial. It is common to see potholes appearingquickly in areas where insufficient bitumen is applied, and more effectivesurface treatments can be adopted. The most obvious is a proper surface dressingusing stone chippings instead of sand. A double surface dressing is aparticularly effective way of arresting surface disintegration and sealing thesurface to prevent water from entering and weakening the pavement. This strategyshould help to reduce the immense amount of pothole repair that RDA struggles toaccomplish every year with the semi-grout method.
2.14 Strengthen Local Construction Industry. Because the bulk of thedemand in the construction industry is created in the public sector bydevelopment projects, the Government can play a critical role in strengtheningthis industry. In order to enhance the competence of local contractors and tocreate a competitive environment, a study on the local contracting industry isplanned under the Third Roads Project. The purpose of the study is toinvestigate current practices, identify constraints in detail and recommendmeasures and actions required to encourage wider involvement of local contractorsin the execution of road maintenance/rehabilitation works.
2.15 Increase Pla=nn Caability and Optimize Available Resources.Adoption of a pavement management system as a planning tool is essential.Comprehensive data on road conditions, traffic, and pavement distress can providethe basis for evaluating different options for surface treatment to determine themost appropriate category of maintenance work. A conceptual framework expressedin a diagram in Annex 3 demonstrates various options for the surface treatmentwhich would be appropriate for different levels of pavement stress, surfaceroughness and traffic volume. The surface treatment option selected can beadopted to different levels of funding; for example, in times of budgetconstraint, more of the least expensive treatments could be undertaken ratherthan the more expensive options available (betterment). These options could befurther refined to determine alternatives within each treatment class to preventas much deterioration as possible while keeping vehicle operating costs to aminimum level (for instance, undertake less costly patching works and surfacetreatments for periodic maintenance, instead of costly overlays). When fundsbecome available, more substantive treatment could be accomplished. To determinedifferent types of maintenance and road improvement required, a road networksstrix could be developed based on traffic and road condition data. Feasibilitystudies and economic analysis, currently done only for donor-financed projectswith expatriate assistance, are also needed to prioritize locally-funded projectswithin budget constraints. To achieve this objective, the planning section inthe Division of Engineering Services should be upgraded and given a higherstatus.
2.16 Ratioalize Regulations on Vehicle Loads. Medium payload (12.5 to 16tons) and larger trucks (30.5 tons) may be causing more damage to roads thantheir overall contributions to taxes would cover, particularly the 16-ton two-axle truck. To determine the extent of distortions and the refoxrms needed tocorrect them, a study on road user charges has commenced, and is scheduled forcompletion in October 1991 (para 1.20) . If the study confirms, inter alia, thattaxes paid by large trucks do not fully cover the cost of road damage that theycause, an appropriate tax structure would be recommended so that they would atleast pay for the damage to the road network, and to discourage their import infavor of other vehicle types, which cause less damage due to their lower axleloads and proper axle configuration. Legislation on vehicle loads should defineaxle limits in addition to gross vehicle weight. The maximum laden weight of the

-20-
vehicle must not be more than the sum of the maximum axle weights. Amendmentsto the Motor Vehicle Act may be necessary to control excessive loads. At thetime of vehicle registration and issuance of certificate of road worthiness, theauthorities could refuse to register or issue certificates for vehicles whichhave been modified to carry excessive loads.
2.17 Improve Contract Administration. To improve its contractadministration, RDA should adopt a clear framework between itself as client, andits consultants and contractors. This would streamline and reduce the workloadof contract administration. RDA's reluctance to clarify this situation waslargely responsible for the inordinate delays and cost overruns experienced onthe Second Roads Haintenance Project (Loan 2715-CE), and other donor-financedprojects. Technical assistance included ander the Third Roads Project wouldassist RDA in improving contract administration.
2.18 Build Up Planning and Naintenance Capabillty at the Provincial Level.Road planning and maintenance responsibility of Class C and D and local roads nowrest with the Provincial Councils and their respective local governments. UrbanLocal Authorities will continue to exercise responsibility for their roads underthe Provincial Councils. Provincial Council staffing has been provided throughthe transfer of some 1.100 RDA staff (district engineer level and below), butexpertise in the Provinces is weak, and therefore, technical assistance andtraining are needed to improve overall staff operational efficiency. Therequired technical assistance may be included in a future IDA project.
B. Road Passenger Transport
Issues
2.19 Public bus operations of the Sri Lanka Central Transport Board (SLCTB)were decentralized under an Act in 1979 to let each Regional Transport Board(RTB) compete with private operators who had just been allowed to enter the buspassenger transport market under attractive fiscal incentives.91 Since then,private buses have made significant inroads into the SLCTBIRTB passenger trafficmarket, as shown in Figure 1. The noticeable decline in SLCTB/RTB passengerservice from 1981 was a clear signal that the private buses were rapidlyexpanding their services; they captured about half the market by the mid-1980s.Public buses suffered from service difficulties, political interference, frequentchanges in management (almost every year), and poor financial performance.Annual revenue support ranging from US$5 million to US$30 million was needed forSLCTB/RTB to maintain 50Z of the market. Staff levels of SLCTB/RTB increasedwith each election, managers tended to be political appointees, fares were keptlow, and foreign exchange needed to purchase spare parts and renew old buses wasscarce. In the face of increasing operational losses, IDA and the Governmentdiscussed various proposals to improve management and operation of SLCTB/RTBs.
Strategies
2.20 To overcome the problems, the Government resorted to drastic measures.Beginning in December 1990, the SLCTB and RTBs began privatizing through a
9/ The incentives were the reduction of import duty on private coaches from25Z to 7.5Z c.i.f., and lump-sum depreciation.

-21-
process of "peoplization,I a major transformation involving a comprehensive setof reforms. This process is scheduled for completion by December 1992. It isexpected to improve operational efficiency, provide better service, increase costrecovery, and eliminate the drain on the Government budget. An analysis of bustariffs and costs is given in Annex 4. Consequences of the Cabinet decision torestructure SLCTB/RTBs includet (a) retrenchment of about 20,000 surplus staff;(b) SLCTB's assets will be owned by a number of newly created companies, theshares of which will be divided between the workers--former SLCTB/RTB employees--and a Trust; (c) fares will be deregulated; and (d) funds at reasonable lendingterms will be made available for purchase of new buses.
2.21 The following seven principles for restructuring the public busindustry have been adopted for implementation:l0/
(a) the new companies are to be organized around single depots and berelatively small so that they are not difficult to manage and will beable to provide efficient services. It is expected that each newcompany will have less than 100 buses and cases will be reviewed wherethe companies would have more than 150;
(b) the new units should be set up with as simple organization structuresas possible;
(c) the Trust Fund will not have managerial responsibilities but be anAsset Disposition Trust (or Asset Peoplization Trust). The Fund wouldhave only one function: liquidate the assets that will not betransferred to the new companies. This Trust should thus be seen asa transitory body to be dissolved in a few years when all the loansare repaid and all remaining SLCTB assets are liquidated;
(d) any technical assistance to be extended to the newly created companiesshould be extended from a unit within the Ministry of Transport andHighways;
Ce) a new regulatory agency should be created to oversee the satisfactoryand safe provision of bus services in Sri Lanka. The authority shouldhave only limited powers, such as to control the number of busesoperating in busy corridors and at busy bus stops in case serioustraffic management problems arise. These powers should be used verysparingly and operators should presume they have the right to operateuntil informed otherwise by the authority. Where services must beoperated which are socially desirable but which are expected to beunprofitable, procedures should be developed for the regulatoryauthority to award contracts by competitive tender. The currentarrangements for concessionary fares should be discontinued, and bemade for the current beneficiaries to be reimbursed directly. The newbody should also monitor the safety of public bus services. It shouldbe responsible for the design and implementation of improved vehicletesting, driver training and testing procedures. New legislation willbe prepared as necessary;
10, Financed under ;he Economic Restructuring Credit, 2128-CE.

-22-
(f) the assets to be transferred to the new companies will probablyexclude surplus land and property and may exclude certain facilities,such as the specialized workshops, driving schools and city center busterminals. The management of bus terminals or bus stations will betransferred to the local authorities. The ownership and operation ofthe specialist workshops and other self-contained operations, such asthe driving schools, will be privatized. Opportunities should bepursued to maximize returns from the sale of assets such as land andscrap buses; and
(g) every effort should be made to ensure that such a major exercise isaccomplished as smoothly as possible. There are many parties who willbe affected by the restiucturing, including the travelling public,management, the staff and their unions, and Government agencies suchas the Department of Private Omnibus Transport. Each group will needto be fully informed of the program, and a major public relationscampaign will be required if the confidence of all groups is to bemaintained.
C. Railway Transport Developuent
Issues
2.22 The major issues in the railway subsector are as discussed below.
2.23 Organizatioasl Structure. As a Government department staffed by civilservants, the Sri Lanka Railways (SLR) is excessively bureaucratic, highlycentralized and too cumbersome for effective decision making. Management cannotconcentrate on managing the railway in a competitive, commercial way due topolitical interference, overstaffing, low tariffs, and an inability todiscontinue services on uneconomic lines (where the alternative of bus transportexists). In addition, it is extremely difficult to obtain budgetary support forspare parts to repair immobilized locomotives. Loss of capable staff furthercomplicates an already diffictult situation.
2.24 Lack of a Coherent Policy Framework. The railway does not have anappropriate policy framework to encourage efficiency and its operations areregarded as social services. At the same time, SLR is expected to operate as acomercial undertaking and recover its costs. These inconsistencies produceconfusion and inhibit initiatives and innovation which are required to respondto market changes and competition from private bus and truck operators.
2.25 Financial Problems. The Government's tight control over railwaypricing prevents SLR from increasing its fares to generate the revenues neededto cover its costs. Operating losses lead to reduced services and deferringmaintenance of locomotives, wagons, track, signalization and other items.Essential scheduled maintenance and unscheduled repairs are sacrificed to firstcover salaries and wages which alone amounted to 1382 of SLR's total revenue in1989. Since financial targets are not set and fiscal discipline andaccountability are lacking, there are no incentives to effect cost reductionmeasures and rationalize expenditures as long as the Government continues tosubsidize SLR deficits, which in 1989 amounted to over Rs 800 million (US$20million). A critical need is an accounting and management information systemgeared to assist in the management of finances and operations.
423-
2.26 OVerational Ineffic&pcZ. Unreliable and inefficient services are thecombined effect of the current organizational structure, and ineffectivemanagement and information systems referred to above. Since operationalperformance targets are not set, and the manual information system is cumbersomeand produces reports with delays of several months, timely evaluation ofperformance cannot be undertaken. At present, neither objective evaluationcriteria nor procedures are in place with which to evaluate performance and takeappropriate action.
2.27 Wasteful Use of Iovestment Funds. Investment decisions for variousrailway components are not carefully scrutinized to select least-cost options ineconomic and technical terms, aimed at serving the market for which SLR has acomparative advantage. The tendency is to make investment decisions based oncredit availability and other non-economic and technical considerations ratherthan on suitability, minimum requirements for recurrent expenditures, andpriority needs.
2.28 The problems of SLR are similar in many respects to those of railwaysin other countries, and arise largely from a tradition of Government regulationand control of what were originally monopolistic organizations. With growth inthe population and expanded economy, transport demands have also increased. Ina relatively competitive environment, privately operated trucks and buses areable to respond to market demands effectively to capture additional freight andpassenger business, while the cumbersome, bureaucratic SLR management structureis unable to do likewise.
Strategies
2.29 For a basic strategy to address SLR's problems, several options wereconsidereds
(a) close down the entire operation;(b) close down some parts of the operation;(c) put operations under a private management contract;(d) privatize some aspects of the operation (e.g., locomotive mair.tenance
workshops); and(e) restructure SLR.
Option (a) was ruled out as politically infeasible. Moreover, the TSPS indicatesthat there is an economic role for the railway to play (see paras 3.16-3.17 forthe five alternatives evaluated.) Option (c) was judged undesirable underpresent conditions, because any management firm would have little chance ofsucceeding without fundamental changes in SLR's organizational structure andconstraints. Options (b) and (d) were judged to have merit, but to be bestincluded under option (e), restructuring of SLR, which is the recommendation mostsuitable and acceptable to the Government. There are significant risks in anyscheme to restructure SLR; the task is enormous and implementation may be delayedor only partially undertaken because of institutional inertia, weakeningpolitical will and the difficulties of effecting fundamental changes in operatingphilosophy. Recommended reforms and their potential benefits can take effectonly over a period of years.
2.30 Reorganization of SLR. Recognizing the impediments to change, theneed is to transform SLR from a Government bureaucracy into a competitivebusiness enterprise, insulated from political interference. A first step would

-24-
include discussion among the Government and SLR to reach agreement on corporateobjectives and a policy framework. Legal and administrative measures would haveto be adopted to remove Government controls over pricing, service levels,staffing, and so on, and to establish the new corporation with its own board andmanagement. A clear functional, organizational, and management structure wouldhave to be established, as well as a business plan setting goals, strategy, andpolicies regarding operating, financial, marketing, and other activities.Management should be allowed to set tariffs, hire and fire staff and set theirsalaries, determine the priorities for maintenance operations, make its ownprocurement decisions, and all the other decisions required of a market-orientedbusiness corporation. A good model to consider in designing the organization maywell be the Sri Lanka Ports Authority, adapted, of course, to the particularcharacteristics of a railway. Under an IDA Project Preparation Facility (PPF No.P-471-CE)ll/, consultants are assisting the Government in preparing animplementation plan for SLR restructuring.
2.31 Improved Efficiency. One of the purposes of restructuring SLR is toimprove its efficiency so that operational deficits and the need for Governmentsubsidy can be eliminated. Measures include:
(a) A phased retrenchment of redundant staff, estimated at 5,000 of atotal 20,000 staff. This would be accomplished gradually with dueregard for the social well-being of the staff. Phasing would includeattrition, retirement incentive, retraining, and ultimately anegotiated separation package. One possibility is transferring excesssecurity staffl21 to fill vacancies in the police departments ofcities where they are assigned.
(b) Curtail short-distance, intercity rail passenger service, shiftingpassengers (other than commuters) to buses for short trips except incongested urban areas; discontinue service on unprofitable lines,except in selected cases where the Government is willing to contractfor a cost-covering public service subsidy; and operate longerpassenger trains to Badulla, the north, and the northeast, and forexpress service between Colombo and Kandy to improve the throughputtime for the trip.
(c) Consolidate freight stations from 84 to about 40, rehabilitate theselected stations to handle freight efficiently, and contract fortrucks to handle local delivery from stations. Similarly, consolidatepassenger stations from 128 to about 80, equipped with automaticticket vending machines, data processing terminals and efficientconnecting bus and/or taxi service.
(d) Establish a rolling stock maintenance program in conjunction with therehabilitation of workshops to increase f1wet utilization.
Ill/ PPF No. P-471-CE approved in February 1988; amended in June 1989 and April1991.
12/ About 2,000.
-25-
2.32 Increased Reveue. Fares and tariffs should be set so that eachrailway service covers its economic costs. The tariff for a service should coverthe long-run marginal costs (See Table 8).131 Large fare increases should bephased in over a three-to five-year period. Freight tariffs can be increasedmore quickly, especially if operational improvements are introduced at the sametime. The freight tariff structure should be designed to secure those types oftraffic where rail has a clear cost advantage over road (e.g., haulage of clinkerfrom the port of Colombo to the factories at Palavi and Galle and limestonemovement through unit train operations for the Cement Corporation). SLR shouldalso promote multimodal contract haulage services (e.g., flour from Trincomaleeto Colombo) by subcontracting road transport operators for pick-up at the originsand delivery at the destinations. Season ticket rates (90? of subsidy) shouldbe increased faster than those for single trips; short-distance fares shouldprobably be raised more than long-distance ones. Third-class intercity faresshould be increased, initially by 25?, which would still leave them lower thanbus fares, and the 502 discount on second-class intercity service should bediscontinued.
2.33 Pricing and Subsidy Policy. Pricing below cost, a common practice forrail service in Sri Lanka, is particularly uneconomic where there is competitionbetween rail and road transport. Although public bus fares are somewhatunderpriced, average rail passenger fares are 70-91? below average total economiccost, drawing passengers away from buses in cases where the latter iseconomically superior. The same situation exists with regard to freight.14/The distortions could be reduced by eithert
(a) Eliminating rail subsidies. With this strategy, transport operatorsmust be free to set fares and tariffs to cover costs; in this way, themost economical and efficient mode would get the traffic. There wouldbe a strong incentive for railway management to control costs andoperate with enough margin to be able to improve maintenance oflocomotives, rolling stock, and track. Or
(b) Targeting subsidies. If Government policy dictates subsidization ofpassenger fares, a way should be found to direct the subsidies tospecific target groups (school children, elderly, and/or poor) or tospecific geographical areas (e.g., isolated rural communities). Inthe former case, subsidies might be granted to users, giving them achoice of mode and operator or even the option of moving to a betterlocation. As compared with subsidies to the transport operators, thisapproach would encourage the operators to focus attention on economicefficiency and would avoid giving the benefits of the subsidy to allusers regardless of need.
13/ Long run marginal costs include variable train operating costs plus rollingstock depreciation, calculated at replacement costs. These amount to 77-80? of the average long run economic costs shown in Table 8, which includethe fixed costs of the railway operations (20-23X).
14/ Average freight tariffs were about 22Z of long rur marginal costs in 1989.Table 8 shows average rail tariffs and long run marginal costs for upcountry and low country.
-26-
2.34 Iproved Service. Service improvements, aggressively marketed, canexpand the volume of the railway's business in operations where it has thepotential to make profits. The profitable market opportunities must bedistinguished from those where buses or trucks have a competitive advantage.Passenger, freight, and real estate business should have separate cost centersso that their costs can be closely monitored and opportunities recognized forincreasing revenues and reducing costs in each category. By way of illustration,the following operations would seem to be worth marketing:
(a) Long-distance intercity travel, with good feeder bus service vhereneeded; special tourist express trains operating between Colombo andKandy, Anuradhapura, and GallelMatara with a minimum of intermediatestops; commuter service in urban areas, where bus service is impededby traffic congestion. The new power coaches, due to arrive in 1991,provide an opportunity to expand this market, introducing first classservice with high reliability at premium fares.
(b) Improved long-distance freight service. Since the railway'scomparative advantage lies in intercity bulk freight transport, SLRshould focus on ways to improve its services for the four maincommodity groups (building materials and cement, fertilizer,limestone, rice and flour.) For some commodities, unit train servicemay be found particularly suitable; for others, conventional trainswith fast turnaround times might be organized. Scheduled freightservices (instead of waiting for full wagon loads before dispatching)may appeal to some customers. An important element of the strategyis to extend the recent (1990-91) SLR practices of contract pricingat tariffs equal to or greater than long-run marginal costs to about70Z-802 of SLR freight traffic.
Cc) Better maintenance procedures can improve service. A majorreballasting program, implemented on a progressive and orderly basis,could eliminate temporary speed restrictions, allowing the railway torealize its potential advantage of higher speeds than road transport.Other service improvements include reducing waiting times forinformation or other customer services, and improving punctualitythrough coordinated train scheduling.
2.35 Rail Investment Strategy. SLR needs to prepare a development budgetand prioritized investment program, formulated on strategies for the future roleof the railway, a range of credible traffic forecasts, and evaluation of options,given resource constraints. Under PPF-471-CE, consultants are assisting SLR inthese areas. Investments for the railway are discussed in Chapter III as partof the review of the transport sector Public Investment Program.
D. Urban Transport Development Strategies
Issues
2.36 The following issues apply primarily to Colombo, although there maybe some aspects that should be considered to a lesser extent in other urban areasas wells

-27.
(a) Organization. Responsibility for policy making, comprehensiveplanning, and management of urban transportation, including trafficmanagement and public transportation, is divided and unclear, so thatinvestments are piecemeal and management of different components isuncoordinated.
(b) Access to the City for Commuters. Colombo's commuters areexperiencing increasing difficulty in getting to work. This can onlyget worse as the city continues its growth unless measures are takento facilitate their travel. Other urban areas may soon be subject tosimilar problem.
(c) Traffic Congestion. Congestion not only affect commuters, but hampersdelivery of goods and personal travel for non-work purposes.
(d) Safety. The accident rate in Sri Lanka is alarmingly high. Themajority of accidents occur in urban areas, especially In Colombo, andhalf the victims are pedestrians. There is no concerted plan tocorrect this situation.
(e) Road Network and Pavement Conditions. There are bottlenecks in theroad network of Colombo; some arteries and intersections needimprovement. Maintenance of existing streets has been inadequate,leaving many of them in bad condition.
Strategies
2.37 Urban transport problems must be addressed in the framework of a fiveto ten year plan. Some of the elements below can be accomplished rapidly, butothers will require time.
2.38 Policy Planning Organizational Framework. Responsibility for policymaking, comprehensive planning, and management of urban transportation, includingtraffic management and public transportation, is divided among the UrbanDevelopment Authority, Colombo Municipal Council and the Ministry of Transportand Highways. There is need for an agency with the capability to make technicalstudies of the effects of different proposed policies, and to help managers andpolicy-makers make rational decisions. Such an agency should be able to analyzethe effects of pricing policies, traffic control measures, and public transportservice, and to develop overall multimodal transportation plans. Thestrengthening of the Urban Development Authority, the Transport Studies PlanningCenter and the Colombo Municipal Council should be considered and the respectiveroles defined. The immediate objective should be to develop plans for regulationand control of traffic in Colombo, together with plans for improved commutertransportation. A further goal should be to develop a long-run investmentprogram for improving the street network and public transport loading facilities.Both activities should be coordinated with investment planning for all sectorsin Colombo. Preparation of a coordinated, multimodal investment program forurban transport is a major effort. Such a program should be prepared to serveas a catalyst for the strengthening of indigenous transport planning skills inColombo and elsewhere in Sri Lanka.
2.39 Pricing Commuter Services. Rail passenger service and fares shouldbe coordinated with those of bus service, especially in the approaches to andfrom the cities to facilitate travel by commuters. Commuter rail service should

-28-
be emphasized in the urban areas as it can reduce road congestion. Fares forboth services should be based on economic costs, with congestion costs includedfor buses. Both rail and bus service should be expanded, made more reliable, andshould be promoted as alternatives to automobile travel downtown.
2.40 Traffic System Management (TSM) Measures. TSM measures, coordinatedwith other transport modes, should be designed to facilitate traffic flow andreduce congestion. They include traffic signals, turning lanes, fringe parking,parking restrictions and meters in the central business district, auto-freezones, reserved lanes for buses and other high-occupancy vehicles and pedestrianoverpasses. One cumponent that could be considered is the charging of sF*ecialfees for operating autos in congested areas at critical times. This approach notonly reduces congestion, but also generates revenue to help pay for costs ofother aspects of the system. This scheme would require diligence to implement,but it has been successfully used in Singapore for some 15 years.
2.41 Road Network and Pavement Conditions. Rehabilitating roads andimproving maintenance in the future will require allocating adequate funds forthe purpose. It also should imply establishing responsibility for settingmaintenance standards and schedules and for seeing that the work gets properlydone.
2.42 Traffic Regulations and Safety Education Program. Enforcement oftraffic regulations comes under the aegis of the Traffic Police, under theMinistry of the Interior. The Police would need additional staff and resources,such as patrol vehicles. to increase its ability to enforce traffic rules. Theeducation of drivers and pedestrians (as well as some of the police) mightappropriately be handled by the Colombo Municipal Council which is responsiblefor traffic management in the Colombo Municipality and by the regulatory agencyto be established within the Ministry of Transport and Highways, with theresponsibility of promoting safety regulations of all transport modes.
E. Ports and Shipping Development Strategies
Issues
2.43 Colombo. The management of the Port of Colombo has been excellent.The only issues concerning this Port have to do with the handling and storage ofcontainers. The quantity of containers exceeds the storage capacity of the Port,and moving them by truck is adding to the congestion on the narrow roads in thevicinity of the Port and in the city.
2.44 Other Ports. The question of developing the Ports in Trincomaleeand/or Galle to relieve some of the pressure on Colombo has been raised. Suchproposals need to be carefully reviewed. Continued use of Kankesanthurai forcoastal shipping of cement deserves attention.
2.45 Shipping. The Government-owned Ceylon Shipping Corporation hasserious financial problems, evidently as a result of strategic errors inexpansion of its fleet, compounded by the devaluation of the Sri Lankan Rupee.Possible solutions to these problems need study.

-29-
strategies
2.46 Develog Rail Link for Containers. The feasibility of establishingtrain service to carry containers from the port should be explored (see para2.55).
2.47 Develog Secondary Ports. If container transshipment traffic continuesto grow at Colombo Port, it may make sense to develop Trincomalee and/or Gaileas a modern container port sometime in the future (10-20 years). However, beforemaking a decision, the proposal to expand the Galle Port needs a careful analysis(Chapter III) and the storage area at Galle Port and its linkages to landtransport need to be investigated. Consideration should be given to the questionof whether it is prudent to Invest in expanding port facilities for suchoperations as transshipment which could easily shift to another country.
2.48 Shipping. Possible solutions to rectify the problems of the CeylonShipping Corporation include: (a) concentrating its operations on the SouthAsia/Europe Container Service and the Sri Lanka/Far East routes, with theobjective of tapping an increasing share of cross trade cargo between ports inJapan and Singapore; (b) curtailing its services on the routes where operatingrevenues cannot cover operating costs; (c) disposing of additional smallercontainer vessels which are inappropriate in meeting the demand to realize someliquid cash and achieve economy by reducing staff; and (d) obtaining technicalassistance from external sources to help in marketing container deployment andcontrol and in the review of administrative systems and procedures to improve itsoverall efficiency through restructuring.
F. Airport and Air Transport Development Strategy
2.49 There are no major issues relating to air transport as the Colombo(Katnayake) International Airport is modern and well-equipned. Also, there areno issues to be addressed regarding its facilities or oper'.cions. The same maybe said of the international airline, Air La-*a. However, better methods ofpackaging fruits and vegetables where they are harvested is suggested toeliminate damage from excessive handling, which now affects 20 to 252 of thecrop. There is a good export market for these products, shipped by air becauseof perishability.
G. Intermodal DevelovmeEt Strategies
Issues
2.50 Uneconomic Pricing of Services. The major distortions stemming fromtariff structures that do not reflect the economics of the mode are: (a) over-reliance on rail transport for short-distance intercity travel and smallconsignments for which it has no comparative advantage; and (b) road transportcarrying long-distance bulk traffic for which rail has potentialadvantages.15/ These distortions occur primarily due to pricing policies whichare unrelated to the cost of providing particular services.
15/ Present rail traffic is limited by wagon shortages. A greater availabilityof wagons would allow SLR to obtain higher contract rates for long-dtstancebulk commodities which are still lower than truck rates.

-so-
2.51 Lack of Intermodal Coordination. The present syatem lackscoordination for passengers between bus and rail service and for freight betweenport and rail service. The complementarity of each mode is not exploited, andmodal interfaces are not well-developed. Little cargo moves intermodally underone arrangement from origin to final destination. Consequently, transport costsare higher than necessary in two wayst (a) cargo and passengers are moved byuneconomic modes at higher costs to the economy under the distorted modal split;and (b) costs are higher because of additional handling and storage at each linkin the chain of cargo flow and the need for additional middlemen and brokers todeal with paperwork and documentation.
Strategies
2.52 Deregulation of Fares and Tariffs/Increased Competition Among Mcdes.To provide an economically efficient transport system free of price distortions,fares and tariffs should be deregulatedl6/ along with free market entry. Thiswill ensure competition among transport operators which is the most effectivemeans of reducing costs and enhancing services.
2.53 Multimodal Planning and Policy. To promote total transport systemefficiency and coordination, multimodal planning capabilities need to bestrengthened, and sector-wide policies on pricing, subsidies, cost recovery andmodal competition should be clearly articulated, particularly with respect torail transport. Such work cannot be effectively undertaken without the stronginstitutional framework and financial assistance. To this end, the TSPC must beexpanded and put on a firm footing in order to have the ability to undertakemultimodal planning and policy analysis and to guide the decision makers in thetransport sector. Both the analytic capability and the database aspects must bebuilt up to further define Government actions in the transport sector, and refinethe strategies outlined in this report in collaboration with the modal agencies.
2.54 Coordination of Bus and Rail Services. The coordination of bus withrail services will lead to a better mix of services for the passengers and alower cost to the economy. TSPC should identify possibilities of providingcoordinated services, based on passenger msrket surveys, and disseminate suchinformation.
2.55 Container Services and Port Decongestion. Congestion due to emptycontainers occupying space in the container terminals and container truck trafficon the limited street system can be partly solved with the completion of the newport access road. A possibility of unit train services to an inland containerdepot should be explored to reduce congestion at the port area and to realisepotential economic benefits.
2.56 Link Bus and/or Rail Passenger Service to Airport. Air freight ishandled by both highway and rail transport. Ground service for passengers shouldbe studied to see whether there is a need for improving present arrangements byproviding convenient service to Colombo and to tourist destinations either byrail cars or buses.
161 Except for targeted subsidies which should be made explicit and subject toperiodic assessment.

-51-
H. Benefits of Key Refoms
2.57 The transport development strategies proposed include key reforms infive major categories: policy, management, staffing, pricing and investment.These reforms should be considered as a package in the case of each transportmode as the objectives of the reforms are to encourage: (a) a situation vNI,reeach transport mode and operation is as efficient as possible in terms ofproviding service with the least use of economic resources; (b) the most economicallocation of traffic to each mode and route; (c) the most economic level ofcapacity and investment in each mode and facility; and (d) investment andoperational decisions that reflect the choices of the users of the services asfar as possible. Quantification of benefits resulting from Institutional andpolicy refonms is problematic as many of their effects are not readily amenableto measurement. However, Table 2.1 below provides an attempt to quantifypotential benefits of the proposed key reformss the paragraphs following Table2.1 discusses how the benefits were quantified in those cases where a reasonableapproach to measurement was available.
Table 2.1: ESTIMATED ANUSAL FIHANCIAL BBUEFITS OF REFORMS(In current 1990 prices)
Estimated Annual Benefits Total---- Rs Million----
gi8hnay8 To Users To Agencies(a) Improved maintenance techniques + 2,100 a/)Cb) Increased maintenance and rehab. + 2,820 bl} - 1,000 cl*c) Improved management + 200 d/(d) Benefits of using trucks with
proper axle configuration + 400Road Passenger Transport
(a) Reduced operating costs frompeoplizationlprivatization + 300
Cb) Reduced costs from staff reduction + 600(c) Rationalization of bus size + 60
Railway Transport(a) Improved marketing + 40(b) Staff reduction _ + 120 et
TOTAL: + 4,980 + 360 +5,340
o/ Estimated benefit In 10th year of program.j/ Assumlng an incremental expenditure of Rs 6 billion during the 1959-1983 planning period and
a benefit/cost ratio of close to 4:1, the present value of the benefits resulting from reduedvehicle opersting costs over 20 years would be Re 20 billion. The verageo annual boneflto togivo a present value of Re 20 billion (at 109) is ± re 2.81 billion. In finanoial terms, thisnumber Is tronslated to Re 2.32 billIon.
C/ The actual annual expenditure hue bean about Rs 1 billion in the past two years, compard wlththe annual allocation of Re 2 billIon In the 1989-1998 PubiIc Investoont Program which i therecowmnded lovel of expenditure.Estimate booed on soaving of 10% of the proposed road investment pro ram
g/ Assumes staff reduction of 6,000 employees at an averge wago cost of Re 20,000 per year.

-32-
2.58 Improved Maintenance Techniaues. Except for donor-fundedrehabilitation projects, the most commonly used method of surface treatment issemi-grout and the surface treatment most used for periodic maintenance is sandseall7/. Better techniques, such as double bituminous surface treatment(DBST),181 would contribute significantly to the economic net present valueof the road rehabilitation and maintenance program. To establish the scale ofsavings in road maintenance expenditures and in vehicle operating costs (VOC)that could be obtained from good maintenance and rehabilitation methods, thepresent semi-grout and sand seal method was compared with the alternativestrategy of using DBST on an asphaltic concrete (AC) pavement. To estimate theroad maintenance expenditures and VOCs incurred on a kilometer of road undereither alternative, the following assumptions were made:
(a) Strategy A (representing the present approach) starts withconstruction of a new semi-grout surface, including widening of thepresent roadway. In the fourth year and again in the sixth year,periodic maintenance is done using sand seal. Roughness of the roadstarts at 3,800 mm/km and deteriorates at an increasing rate until itreaches 6,500 in year seven. In year eight, a new semi-grout surfaceis constructed, restoring roughness to its original level. The cyclerepeats every eight years.
(b) The alternative, Strategy B, (representing improved maintenanceprocedures) starts with construction of a more expensive AC pavement,including widening in limited areas. Periodic maintenance is notrequired until year seven, when DBST is applied. Roughness isinitially lower than Strategy A--2,500 mm/km--and deteriorates moreslowly, continuing until it reaches 5,500 in year 14. In year 15, anoverlay of AC or other bituminous premix is applied, restoring theroad to its original roughness level, and the cycle starts over.
2.59 The routine and periodic maintenance expenditures and VOCs for eachyear over a span of 19 years was calculated for each Strategy. The average dailytraffic volume is assumed to start at 1,000 vehicles per day (vpd) and toincrease at a rate of 6S per year. The difference in total costs (maintenanceplus VOC) is Rs 1,976,891 with the net present value (discounted at 102 p.a.) andan internal rate of return of 55?, both of which indicate large benefits to begained by changing from current practices (Strategy A) to improved maintenanceprocedures (Strategy B). The benefits consist of savings in vehicle operatingcosts.
2.60 Complete evaluation of the change from Strategy A to Strategy B wouldrequire working out a time schedule of maintenance for different road segmentsin the network and assigning traffic volumes to each, then performing cost-benefit analysis for each segment. As a briefer approach to indicating thenetwork-wide effects, assumptions were made about the length of roads and traffic
17/ A thin layer of hot bitumen spread over the road and then covered with alayer of sand to absorb excess bitumen.
1l/ A layer of bitumen sprayed on the prepared road surface and drippings of20 mu are spread and rolled, and the process is repeated.

-33-
volumes affected in a particular year, and the corresponding VOCs were calculatedfor each strategy in that year (ten years in the future). It is assumed that theimproved method is applied only to roads that have been rehabilitated with a newAC surface, after which they follow a life cycle of roughness as that forStrategy 8. Priority for rehabilitation is given to the more heavily travelledroads, and the number of kilometers given AC surfacing is limited by the supplyof well-graded crushed stone.19/ This limits the rate of conversion to ACunder Strategy A, but for Strategy B it is assumed that the supply isexpanded2Ol sufficiently not to impose a limit. Savings in VOCs in the tenthyear would, for the entire 8,822 km network, be on the order of Rs 1,772 millionin economic costs or Rs 2,100 million in financial costs as a result of adoptingStrategy B (See Annex 5, Table A5.1).
2.61 Increased Maintenance and Rehabilitation. The state of the roads isprobably the greatest contributing factor to the unnecessarily high costs oftransport in Sri Lanka. and there is little question that maintenance is one ofthe most productive aspects of transportation to which Government could allocateresources. It is all the more important considering that the savings in VOCconsist primarily of fuel, lubricants, parts, tires and the cost of the vehicles--all requiring large amounts of scarce foreign exchange. Analysis undertaken forthe Third Roads Project showed that the improvement of road surface from periodicmaintenance would yield an average benefit cost ratio of over 4:1 (variationswill depend on traffic volumes and road surface roughness levels). This wouldsuggest that, on average, the additional return on road maintenance funds is morethan Rs 4 for each Rupee invested over a 20 year period at 102 discount.
2.62 The Third Roads Project consists primarily of rehabilitation of roadsurfaces totaling 417 kilometers for which benefit-cost ratios ranged from 1.9:1to 17.8:1. The road links in the project have above-average rates of return asthey have been selected from a greater number of road links through a screeningprocess using economic criteria. The rehabilitation costs estimated in theproject are considerably higher than the future routine and periodic maintenancecosts will be. The benefits of future routine and periodic maintenance costs maybe close to the beaefits of the rehabilitation under the Third Roads Project.
2.63 Improved Management. The Road Development Authority (RDA) hasrecently encountered large cost overruns in their donor-aided road rehabilitationprojects. RDA could have avoided some of these cost overruns had it managedproject implementation better through: formai and effective financial controls;delegation of on-site responsibilities to supervising consultants; streamlineddecision making in day-to-day operations; and professional contractadministration. In one project, the cost overrun amounted to Rs 623 million.At least a third of this overrun could probably have been avoided through bettermanagement at no additional costs, thus saving Rs 200 million for the Government.Countrywide, such savings could be enormous in view of RDA's expandingresponsibilities to manage an increasing number of donor-assisted roadrehabilitation and improvement projects. Assuming that improved management could
19/ At present, RDA relies on aggregate which is laboriously and ineffectivelybroken by hand, and therefore the availability of good quality crushedstones is limited.
201 This strategy includes a prograr if opening quarries and acquiring crushersto supply good quality aggregates.

-34-
save a minimum of 102 of the proposed investment budget of Rs 2 billion per year,an annual saving of Rs 200 million is possible.
2.64 Benefits of Using Trucks with Proper Axle Configuration. The briefanalysis shown in Annex 2--Road User Charges--indicated that certain heavy trucksmay be causing more damage to roads than their contribution to taxes would cover.Most vehicles appear to be paying their way at present, due primarily to the hightaxes on fuel. However, one vehicle type, the 16-ton two-axle truck, may becosting more in terms of road damage than is covered by taxes and duties. Ifthis were the case, raising taxes on this vehicle, particularly import duties,would discourage the import of this vehicle in favor of other vehicles whichcause much less damage due to their better axle configurations. The benefits ofthis strategy are in the form of avoided road damage because alternative vehiclesare used, and the resulting reduced VOCs for all traffic.
2.65 The economic benefits of this policy may be estimated by either of twoapproaches. One way evaluates the difference in the cost for maintaining theroads in equally good condition either with these trucks or with a less damagingtype (e.g., 21-ton three-axle trucks). The other approach evaluates thedifference in operating costs for all vehicles in the traffic stream, assumingthe same amount of road maintenance and therefore different degrees ofdeterioration with the two types of trucks (16-ton two-axle vs 21-ton threeaxle). By the former method, savings due to eliminating the large two-axletrucks were estimated at Rs 400 million per year.2ll
2.66 The effect of the larger two-axle trucks (e.g., 16 ton) on roaddeterioration and roughness and the resulting VOCs of all vehicles in the trafficstream were calculated and compared with VOCs that would result from replacingthe 16-ton two-axle trucks with more suitable three-axle trucks (using the datadeveloped from the Third Roads Project feasibility study). From this study, theweighted average traffic, road roughness, road strength and widths of the 26 roadlinks, totalling about 500 km, were derived (See Annex 5, Tables A5.2 - A5.5).By this method (and pending more rigorous analysis) the savings would amount toRs 350 million per year in terms of economic costs and Rs 420 million infinancial costs.
Road Passenger Transport
2.67 Reduced Operating Costs from Peoplization/Privatization. The benefitsof peoplization of the public bus system will be in the form of increasedoperating efficiency associated with increased availability and utilization ofthe bus fleets, and with reduction in the total number of staff involved. Forlarger buses in urban service, the economic cost per bus-kilometer of publicly-owned buses was estimated to be 212 higher than that of privately-owned buses(Annex 5, Table A5.7). The TSPS found that the privately owned buses wereconsiderably more productive, achieving higher availability (80? vs 668) andhigher load factors (892 vs 812), than publicly-owned buses. The operating costof privately-owned large buses in 1990, using a simple average of all types ofroutes, is estimated at Rs 0.185 per seat-km, or about Rs 0.21 per passenger-kin,with a load factor of 892, compared with Rs 0.211 per seat-km and Rs 0.26 per
21/ Using data developed in the TSPS, which shows savings of Rs 2.944 pervehicle-km. This was multiplied by 45,000 km per year average use and3,000 vehicles.

-35-
passenger-km for the public bus. Total annual road traffic level is estimatedat 35 billion passenger-km assuming the security situation is restored tonormalcy. Further, assuming that traffic of 17.5 billion passenger-km (half ofthe projected total), is carried at the hi8her unit cost without privatization,but is carried at the lower cost as a result of privatization, the annual savingwould be on the order of Rs 900 million.22/
2.68 Reduced Costs from Staff Reduction. Of the total possible costsavings under privatization, estimated at Rs 900 million per year, about Rs 600million could be considered as the benefits resulting from staff reduction. Thestaff of about 51,000 people in 1989 and operational fleet of about 3,800 busesrepresent an average of about 13 employees per operational bus. This isunusually high, partly because a large proportion of the fleet is out of servicedue to lack of parts and tires, but mostly because of simple overstaffing. Theratio was close to 10 persons per bus in 1986 when parts problems were lesssevere. The publicly-owned system averaged about 255,000 passenger-kilometersper employee in 1989, compared with an estimate of over twice that for theprivately-owned buses. With peoplization, it should be possible to reducestaffing to six or seven persons per operational bus. With wage costs of aboutRs 1.32 billion in 1989, this could result in a saving of over Rs 600 million.
2.69 Rational Choice of Bus Size. Many of the present 'uneconomic" routesoperated by the nine RTBs are served by large buses even though the level ofpassenger traffic is lower than average, resulting in unduly high operating costsper passenger-km. With the restructuring of the industry, it is anticipated thata shift to smaller buses would occur on low volume routes, resulting in asignificant cost saving. The cost per km of a large bus in 1985 was estimatedat Rs 7.5, and it is estimated that at least 20t of this cost could be saved byusing the small size bus. Assuming that about 102 of the 1985 oublic bus-km isoperated on uneconomic routes (i.e., 390,000 km), a total annual saving of Rs58.5 million could be realized at the same level of service.
Railway Transport
2.70 Improved Marketing. Expanded services to market transport of goodswhich need warehouse space at key locations, or high-volume shipments of importedmaterials should bring about more profits because they draw on the SLRcomparative advantages. The potential net gain in tonnage from the marketingeffort was roughly estimated in the TSPS at about 200,000 tons, assuming no majorinvestment in the rehabilitation of SLR. In terms of the economic allocation oftraffic between different modes, the net benefit to the economy of improvedmarketing was estimated at Rs 21 million per year, including reduced congestioncosts on the roads. The financial gain in revenue for the SLR would beapproximately Rs 40 million for this additional traffic and the net financialgain after variable costs for SLR is estimated at 302 of revenues assuming theapplication of cost-based tariffs, or about Rs 12 million per year. Thispotential gain would be considerably larger (i.e., Rs 40 million) for a morecompetitive SLR, made possible with a low-cost investment program.
22/ Rs 0.260 - Rs 0.208 - Rs 0.052 x 17.5 billion passenger-km - Rs 910million. The total cost on private buses would be Rs 7.3 billion and onpublicly-owned buses, about Re 9.1 billion.

-36-
2.71 Staff Reduction. The SLR currently has an average of about 19employees per route kilometer of line. The railway carried about 7,300 ton-kilometers of freight per year per employee. This compares with 28 employees perroute-kilometer in India, and 97,000 ton-kilometers per year per employee. Thesesimple comparisons indicate that there is scope for considerable improvement inemployee productivity on the SLR. Concentration on economically-viable servicesshould permit a reduction of about 1,500 to 2,000 staff.
2.72 The release of already redundant employees would further reduce thestaff by about 4,500. The average staff cost (salaries plus benefits) wasapproximately Rs 22,000 per year in 1988, but the redundant staff would tend tobe in the lower-paid categories. If it is assumed that the average cost of theredundant staff is Rs 20,000 per year and that about 6,000 staff members couldbe released, the saving to the SLR in staff costs would be approximately Rs 120million per year.231 It is also probable that staff rationalization, in acommercially oriented environment, would increase the effectiveness and moraleof the remaining staff for a further increase in productivity.
23/ The obligation to pay severance pay and other benefits to staff who arelaid off would reduce the short-term amount of the benefit.

-37-
II. REVIE OF TEE TRANSPORT SECTOR PUBLIC INVESTMENT PROGRAM
A. Overall Public Investment Program Allocations to Transport
3.1 As the cornerstone of its development strategy, the Government hasadopted the concept of rolling five-year investment programs. This encouragesflexibility in the Public Investment Program (PIP) by permitting redefinition ofpriorities annually. The PIP contains a review of the economic performance inthe preceding five year period, macroeconomic and sector objectives for thecurrent plan period, and a list of ongoing and new projects to be implemented.
3.2 The growth of public allocations for transport infrastructure is shownin Table 3.1 below. The transport share steadily increased from 62 in the 1981-85 PIP to nearly 182 in the 1989-93 PIP, but declined to 13? in the 1990-94 PIP.In real terms, the PIP allocations for transport increased by about 73? betweenthe program for 1981-85 and that for 1990-94, while the total PIP allocationsdeclined by 20? in real terms during the same period. The increased level ofplanned expenditure for transport is an expression of the Government's intentionto acc rd priority to transport infrastructure development in determininginters ctoral resource allocation.
3.3 In order to obtain a more meaningful basis for comparison and analysisof the past and planned PIPs, a major effort was made to obtain the actualexpenditures incurred by the transport sector, estimates of which are shown inTable 3.2 below. Despite much time taken to assemble these data, the numbersobtained from the executing agencies and the concerned transport ministries donot match with those obtained from the Central Bank. There is yet another setof numbers given by the Ministry of Planning, Policy and Implementation. It isclear that a more concerted effort must be made in systematically compiling theactual expenditures incurred every year by the concerned transport agencies andministries. This undertaking will be a part of the Government's action plan,outlined in the policy matrix (Annex 1'.
B. Policy Statements in the Public Investment Programs
3.4 The latest PIPs emphasize the need for financial discipline and foradhering strictly to the parameters of the Policy Framework Papers for 1988-1989and 1989-1990. The budgetary targets of both PFPs are set at reducing overalldeficits from 12? of GDP in 1989 to 8Z by 1993, domestic borrowing to declinefrom 2.8? of GDP to 2.6? while maintaining the revenue level of 20? during thesame period. The documents state that "...the Government has initiated majorreforms to reduce public expenditures and increase their efficiency ... throughstrict expenditure controls.' The structural adjustment program thus includes:(a) public enterprise reforms to improve their efficiency through privatization,joint ventures with foreign participation and management improvements; (b)restructuring of public expenditures on transfers to households and subsidieswhich cannot be justified on economic grounds, and improving the efficiency ofthose that remain in the budget; (c) industrial and trade reforms, with a viewto generating growth, exports and employment by stimulating private investmentboth local and fcreign; and (d) streamlining of bureaucratic procedures whichaffect private sector economic activity, particularly with regard to theavailability of credit, monopolies on the allocation of shipping space,

-38-
Tablo 8.11 ALLOCATION P PELC VNeSTUENT PRAWS, RNCU o TRANPT, 181-104,4
(e) tt Curent as Mlilioan
U Chompv.\ awr te-o lostsi o 1984-09 196-9 1ou*-90 9e- 190-08 106494 1030/08 -
Trsn.~~~~~~~~ 1000~~~~I/04M.d. \ (1() (2) (8) (4) (a) (8) (7) (6) (9)
Nlgwoye 1,060 8,8198 2,741 4,066 4,204 0,208 10,140 18,870 81.0
ROa'lwaye 1,6 1,201 2,702 5,101 6,820 9,676 6,07 0.627 0.6
SLCIS/Publi c Mm 1,402 1,180 0 S 4 7 o0n 1,00 10 -09.6
Porte a Shipping 006 so? 1,170 1,070 712 7 8,044 2,260 -80.8
Ale Trenearft 620 1,276 8,750 4,004 2,207 2,680 1,25 760 -89.1
TOTAL 5,69 7,036 t0,428 15,200 12,149 22,912 25,911 26,280 /b 1.2
t.l PrP 60,579 116,206 100,80? 135,204 184,416 160,024 146,010 200,0/c 87.6
Tranoport 0SoTotal PrP 6.0 6.? 0.0 0.0 0.8 18.9 17.7 18.1 -26.4
(b) Perentag Oistrlobtift
\ t"e 1901-0 19- t9140 196-1 ISWO IO-e2 190- 1OW
11ighways 19.0 44.1 26.8 52.5 84.2 40.2 80.1 S1.0
[ta lboys 81.8 18.8 2.6 88.0 42.6 42.2 84.0 87.5
SLCIB/Public Bus 26.1 14.0 0.0 0.4 0.1 2.0 7.8 0.0
Porets Shippain 12.9 8.0 11.2 7.0 5.7 8.8 14.1 0.6
AIr Transport 0.? 16.0 80.0 26.2 17.0 11.7 4.0 2.0
TOTAL £00.0 100.0 100.0 100.0 100.0 100.0 100.0 100.0
/j Al loceti ons do not correpond to actual oxpedlture./1 Re 0,801 mIllon in 100 prles by applying the invet_mt peIce delator of 2.82.
n,o 71,287.0 million In 100 priae.
Souem: Public Invstuent (1001-086 102-8; 1004-06; 1965-00; 9110-9-018-021 less,411; 1000-404), Notlonal Planning DivIsion, ilanistryof Flnaeeo and Planning, Colembo, Sri Loks.

-39-
Table 3.2: Public 8zpenditures in the Transport Sector (1980e91)I(In 1980 million Rupees)
SEMTBRoZa Ports and Airport ERdYear Highwayeb Railways Transport Shlpping Air Tranep. TOTAL
a Can nni---- ninf --- W --- ------- -------- e~ ftee ---
1980 530.8 1,007.9 27.0 602.2 213.6 2,381.51981 299.6 908.3 142.7 680.7 523.8 2,555.11982 317.0 861.0 316.4 1,670.4 101.0 3,265.81983 182.3 803.4 182.7 1,532.2 3,372.8 6,073.41984 450.6 745.6 170.7 746.8 1,073.5 3,187.21985 458.1 901.5 88.8 1,670.5 1,562.3 4,681.21986 690.7 1,149.7 237.8 1,284.1 3,802.3 7,164.61987 574.9 1,042.2 8.6 1,141.3 1,112.6 3,879.61988 412.6 788.9 8.0 1,160.1 939.3 3,308.91989 549.5 997.5 1,191.6 1,090.8 515.9 4,345.3
1990 (est.) 1,432.7 1,172.3 7.7 1,057.1 208.9 3,878.71991 (est.) 1,293.3 1,164.4 - 1,759.0 223.2 4,439.9
Percent Distribution
SLCTS/Road Ports and Airport andYear Highways/b Railways Transport Shipping Air Transpor TOTAL
1980 22.3% 42.3% 1.1% 25.3% 9.0% 100.0%1981 11.7% 35.5% s.6% 26.6% 20.5% 100.0%1982 9.7% 26.4% 9.7% 51.1% 3.1% 100.0O1983 3.0% 13.2% 3.0% 25.2% 55.5% 100.0%1984 14.1% 23.4% 5.4% 23.4% 33.7% 100.0%1985 9.8% 19.3% 1.9% 35.7% 33.4% 100.0%1986 9.6% 16.0% 3.3% 17.9% 53.1% 100.0%1987 14.8% 26.9% 0.2% 29.4% 28.7% 100.0%1988 12.5% 23.6% 0.2% 35.1% 28.4% 100.0%1989 12.6% 23.0% 27.4% 25.1% 11.9% 100.0%
1990 (est.) 36.90 30.2% 0.2% 27.3% 5.4% 100.0%1991 (get.) 29.1% 26.2% 0.0% 39.6% 5.0% 100.0%
/a 1990 and 1991 fLgures are estimates.1980-89 numbers are based on Table 2, converted to 1980 prices.1990-91 data were obtained from the Road Development Authority andthe Ministry of Transport and Highways, converted to 1980 prices.
Sources Sri Lanka Railways, Ministry of Transport and Highways, Sri LankaCentral Translport Board, Department of Private Omnibuses, Sri LankaPort Authority, Ministry of Shipping and Trade, Ceylon ShJlppingCozporation, Road Development Authority, inistry of Planning, Pollcyand Implementatlon, Sri Lanka Central Bank, Air Lanka and Airportand Aviation Services (Sri Lanka), Limited.

-40-
etc.241 Within this stabilization framework, the main thrust of publicinvestment in the medium term is the provision of economic infrastructurefacilities such as transport, energy and telecommunications since "... these areessential facilities for the development of productive activities and services.'
General Observations
3.5 The PIP eloquently articulates the macroeconomic objectives, definespublic capital expenditure requirements and allocates budgetary funds to enableimplementation of the proposed projects. However, there are several anomaliesin the PIPe: (a) the expenditures classified as "capital" include many recurrentexpenditurest administrative overhead25l; outright operating subsidies topublicly-owned operations (e.g., SLCTB, SLR); routine and periodic maintenanceexpenditures of RDA; and maintenance of Mahaweli irrigation schemes; (b) interestpayments to creditors on Government guaranteed foreign loans, which a publiccorporation is unable to service (e.g., Air Lanka until 1988), are also includedin the PIP as capital expenditures; and (c) while recurrent expenditures areincluded in the rolling five-year PIPs, it does not include investment projectsundertaken through non-budgetary funds (e.g., earmarked taxes for tea and rubber)or the portion of investment financed out of self-generated revenues (e.g.,upgrading of Queen Elizabeth Quay financed by Sri Lanka Port Authority). Theexpenditures fully financed by revenue earning entities (e.g., SLCTB purchase ofbus chassis) do not even appear in the PIP, while on-lent loans from state-ownedfinancial institutions to the private sector are sometimes included (e.g., loansto the industrial sector, including financing of buses).26/
3.6 Similarly, the road expenditure program appears confusing andinconsistent. Under the category classified as recurrent expenditures, there isa subcategory for "repair and maintenance," but routine maintenance and repairsto flood damages are treated as capital expenditures. By contrast, the costs ofundertaking double bituminous surface treatment (DBST), sand sealing, metallingand bitumen surfacing (periodic maintenance) which are normally classified asrecurrent expenditures are listed under capital expenditures, and lumped togetherunder the subcategory of rehabilitation and improvements. There is also acategory referring to an IDA loan and another called simply the World Bank IIProgram. On the other hand, the ADB and OECF loans are not listed. There isclearly a need to rationalize the classification of public sector expendituresas well as RDA's program to make them consistent and correctly assess the needsand actual expenditures incurred.
241 The Public Investment Program, 1989-1993 and 1990-1994.
25/ For the 1989-1993 period, expenditures of Rs 24,638 million were allocatedto the Ministries of Defense, Foreign Affairs, Home Affairs, Finance,Justice and Public Administration, Department of Pensions, etc. There areother expenditures incurred by the Ministry of Transport and Highways undera separate heading.
26/ "Sri Lanka, A break with the Pastt The 1987-90 Program of Economic Reformsand Adjustment," May 1988.

-41-
lodal Allocation
3.7 The PIP allocation to highways over the last decade has been receivinga greater share as shown in Table 3.1 above, although this is not apparent inTable 3.2 showing estimated actual expenditures in the transport sector. Theshare of highways was only 19.92 in the 1981-85 PIP but increased to 51.0? by1990-94 while the railway's share fluctuated from 15.62 to 42.52 depending on theavailability of foreign financing in a given PIP period. The percentage shareof ports and shipping also fluctuated widely from 3.3Z to 14.12, excluding theSri Lanka Port Authority's self-financed investment items. The increasedallocation for ports and shipping in 1989-94 is largely for construction of theOECF-financed Third Container Terminal at Colombo Port. The allocations to airtransport peaked during the 1984-88 and 1985-89 planning periods while theKatanayake International Airport (Colombo) was being expanded and modernized.
3.8 Comparison of the most recent PIPs (Table 3.1) by transport mode forthe 1989-93 and 1990-94 plan periods shows wide variations: in the current PIP,there was a 32? increase in the allocation to the highway subsector and nearlya 10? increase to the railways, while the allocations to ports and shipping, airtransport and SLCTB (public buses) were reduced substantially by 382, 39? and 992respectively from the levels of the previous plan period. The drastic reductionin the amount allocated to public buses is due to the privatization(peoplization) of the SLCTB assets. The reduced amount for ports and shippingis accounted for by the large expenditures incurred for the completion of theSecond Container Terminal at Colombo Port in 1989, which is not included in the1990-94 PIP. The establishment of a private corporate structure for Air Lankawith improved management also contributed to the reduction in Governmentsubsidies which were included in the previous PIPs. On the other hand, theincreased allocations to the highways subsector and the railway reflect theavailability of foreign financing.
3.9 Both PIPs rightly emphasize completion of ongoing projects andmaintenance and rehabilitation of existing assets, with new projects limited toa small number and subject to critical review. The funds were thus allocatedprimarily for: (a) replacement, rehabilitation and maintenance of the assets ofthe railways and of the existing road network; (b) completion of the ongoing portaccess road and the terminal building complex; and (c) runway and utilities atthe Colombo International Airport. The major new works in the transport sectorinclude the construction of a Third Container Terminal at Colombo Port, mentionedin para 3.7, and the construction of the railway workshop, both financed by theJapanese Government.
C. Transport Investment Plan, 1990-94
3.10 A detailed breakdown of the 1990-94 PIP by transport mode is shown inTable 3.3 below. Major planned or ongoing investments include the following.
Ei8hrs
3.11 The bulk of the highway expenditures is for rehabilitation andmaintenance of the national and provincial road networks (Class A-D roads) andrepair of bridges. Of Rs 13,376 million allocated to roads, about 332 isaccounted for by IDA and ADB-financed -road maintenance and rehabilitationprojects, 29t for equipment financed by OECF, 192 for preventive maintenance andrehabilitation, 5? for the replacement of the old Victoria and Kelani bridges in

-42-
teblo 11.s PUi.C i T81QU P99081 (1000.08 eci 1000-4)
1900 . 1008 -A-- _-------100 -
111 TtoXl T tttel 13 oloOlib. aCoat Olotelb. Coot by OK" l ib.
Ongoino Peojoco
Tconep.t-(a) Railacy1. R obot. a dolvbo. 8944.0 18.7 4280.0 48.2 10.82. AquI. 91qu*1. It.0 0.1 29.0 0.2 0.18. bo. Polo. 890.0 1.6 978.0 L.0 1.04. Tcoh, Tlninlftg 00.8 0.8 60.4 0.7 0.88. RNbob. Vow. 80.0 0.1 48.0 0.0 0.9S. RhoAb. Troebe 1048.0 7. 1471.0 (8aCtP) 15.0 5.07. Otd Line I-orR/ 60.0 0.9 04.0 (podo) 0.0 0.88. Caan. Syotoo 16.0 0.1 78.0 0.7 0.89. Con. s8iorepo 11.6 0.0 66.8 0.0 0.2
to. 9ev. Orldp Yaurd 68.0 0.2 62.0 (0oftmy) 0.0 0.2II. Coot. Fla" 16.0 0.1 20.0 0.2 0.1U2. Sub. Pouor So" 160.0 0.0 409.0 0y oaely) 4.8 1.018. Roleb. 101 loc. pro 950.0 8.7 0W0.C 0.0 8.714. Reno. Rail I ldom 100.0 0.0 104.0 1.1 0.6I6. Roafnion Cooej,o 006.0 8.6 1ou.0 10.8 8.010. Pooob.StbW (Ut.of Roil.) 20.0 0.1 42.0 0.4 0.2
a 17. CII 54,ahop 681.0 2.6 701.0 7.7 2.0
aS TOTAL 0o07.8 44.0 92.4 100.0 87.6
(b) W.T
1. Tra" Ortbo.rd - 0 - 0.0 0.02. Coalwebutions t. ICL 19.1 0.1 - 0.0 0.0S. RPIaeont of Snoco 104.0 7.1 10.0 100.0 0.0
M1 TOTAL 1060.1 7.2 10.0 100.0 0.0
(a) N l.u~1. i4)gho.ye 1.6 0.0 4.0 0.0 0.02. Pak. a tapeo. (us 2 a 8) S1t.8 8.7 1708.0 20.2 10.8
1. Rebehb. W Pihea) Iqelpmt 804.0 1.2 8878.6 20.0 14.8b) Ploea Cee. 1tO.0 0.7 880.0 2.0 1.4a) Prov. maia. 1060.0 4.2 140U.0 10.8 6.4d) tw. Ovift. 760.0 8.0 090.0 7.0 8.5a) aood i7hebbilltalion 1060.0 4.1 1160.0 6.7 4.4f) AU Proj. £ a 2 1714.7 6.6 1780.0 12.0 0.0
Vi. Vie. Bridge 8t0.0 1.2 460.0 8.6 1.0111. Kelenl Urifdg i2.0 0.2 12.* 0.0 0.6
8. 6.1Idias 0.0 0.0 10.2 0.1 0.04. AeON Road. to odern
Vlliega o aRa - - l070. 4*.8 2.2
Wl TOTAL 10140.4 80.1 18670.2 NO-.0 61.0
Alo n*? SW 1a. AirnorO 083.0 8.8 7660.0 8.4 a.O2. POr AO. ROWd 18.0 1.0 970.0 0.0 1.08. mina" of Trade a Shlio. 140.3 0.0 * 0.0 0.04. C t. toIS 18.0 0.1 * 0.0 0.0
. Air Lado 406.0 1.6 0.0 0.0o 0Third OOmIer Temisal 6U.0 12.0 1S00.0 68.6 7.6
so tTAL 4001.3 10.0 8031.0 100.0 11.5
TA 3091.7 100.0 3692i.0 100.0
mm. pPO)OJ.boormlls Pot lailo IVwom 1,e-IS * 10S, Nleonal Plhm Sleislee,
nalatry of PIlam end Planiong, Coelao, Bri LWAno, 8e$tew IOW.

-43-
Colombo, and the remainder distributed among different subcategories of "FloodDamage, Improvement of Bridges, Access Roads to Modern Villages, research anddevelopment and buildings." The PIP includes only a part of the IDA's ThirdRoads Project. Its total estimated cost of Re 2,820 million is planned to beexpended over the 1991-97 period.
3.12 These PIP numbers vary considerably from the five-year expendituresproposed by RDA for the 1990-1994 period (Table 3.4 below). The total amountproposed by RDA for the forthcoming plan period is higher at Ro 16,467, ascompared with the PIP total of Re 13,376 million, mostly accounted for by alarger allocation of Re 6,664 million (compared with Re 5.594 million in the PIP,including the IDA and ADB projects) to the "Road Rehabilitation and Improvement,subcategory and about Re 1,670 million proposed by RDA for the conetruction ofthe Katunayake Expressway which has not been approved by the Cabinet, andtherefore not included in the PIP (nor is the proposed Trincomalee-Colombofreeway in the PIP). The ecunomic feasibility of this project should be re-examined by updating the 1983 study carried out by Japan InternationalCooperation Administration (JICA) and its results compared with other priorityprojects. Both the PIP and the RDA program allocate insufficient funds (Re 1,408million in the PIP and Re 1,438 million in the RDA program) to "preventivemaintenance" which is intended for routine maintenance of Class A-D roads,including pavement repair works; they amount to Re 56,320 per km (PIP)27/, orRe 11,264 p.a. and Re 57,500 per km (RDA)28/, or Re 11,500 p.a. respectivelywhich at the current exchange rate of US$1.0 o Re 40, amount to US$282 p.a.(PIP) and US$288 p.a. (RDA).
3.13 About 702 of required funds are to be contributed by external donors.Based on the estimated unit costs for maintenance developed as part of the ThirdRoads Project Feasibility Study, order of magnitude funding requirements wereestimated for the Class A - D road system in Annex 2. By adopting an assumptionthat 602 of the A network and 302 of the B network will have been rehabilitatedby 1996 and another 42 and 2% in the process of rehabilitation, the totalmaintenance and rehabilitation requirements per year would amount to Re 4.5billion for the A and B Class network, and Re 7 billion if the C and D Classnetwork is included. Thus the PIP allocation of about Rs 2.6 billion per year(Rs 13,375 for 1990-94) to maintain and rehabilitate the entire road network isa great deal less than the ideal level. Howevez, considering the limitedimplementation capabilidies of RDA and Provincial Councils, this amount may bethe upper limit. A better balance must be sought, however, between "preventivemaintenance" and "toad rehabilitation and improvement" by allocating at least 202of the total maintenance and rehabilitation to the "preventive maintenance"category.29/
271 Rs 1,408 million o. 25,000 km of Class A-D road network - Rs 56,320 per km4 5 - Rs 11,264.
281 Rs 1,438 million + 25,000 km of Class A-D road network = Re 57,500 per km+- 5 - Rs 11, 500.
29/ See Annex 2 which shows estimated funding requirements to arrest roaddeterioration in Sri Lanka. The routine maintenance category is about 192of the total maintenance and rehabilitation requirements.
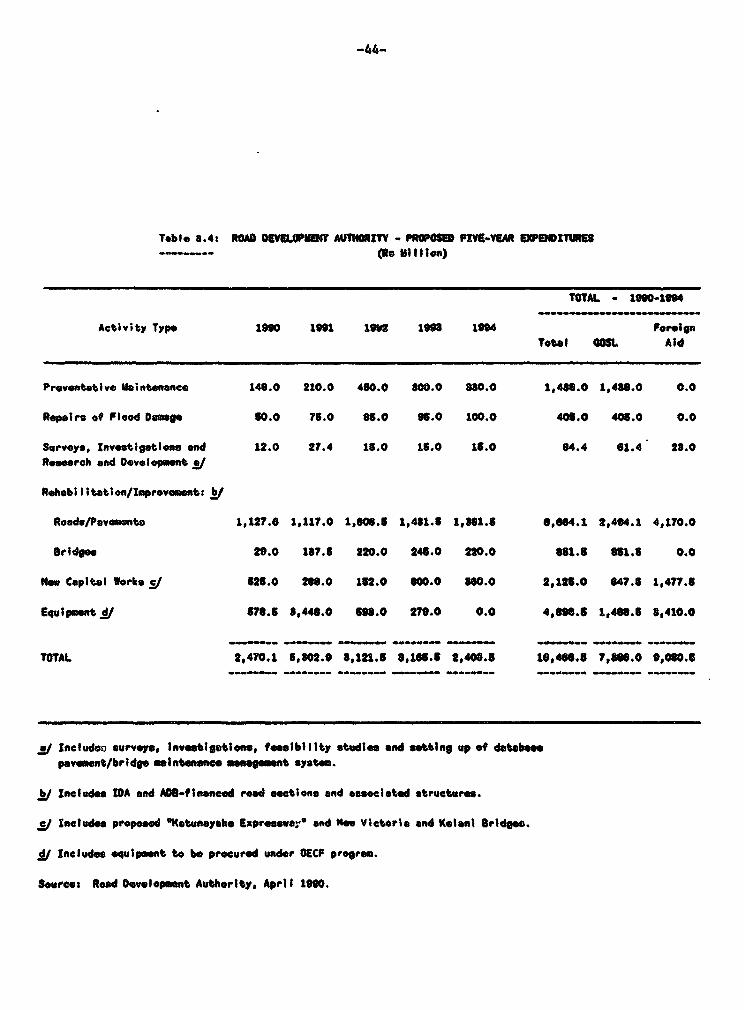
-44-
Table a.4: ROAD OEVMEUPUEIT AUTHORITY - PROPOSED FIYU-YEAR W ENDITURU(Re Millon)
TOTAL - 1090-1194
Activity Typ 19S0 1991 182t 1s8" 1964 ForeignTotal a0mL Aid
Preventative Maintenance 146.0 210.0 450.0 800.0 880.0 1,480.0 1,486.0 0.0
Repair of Flood Dme"e 50.0 75.0 63.0 95.0 100.0 406.0 405.0 0.0
Surveys, Investigations and 12.0 27.4 11.0 15.0 15.0 64.4 61.4 28.0Research and Development .!
Rehobti tation/Ioprovem_t
Roads/Pavements 1,127.0 1,117.0 1,60.5 1,481.5 1,861.5 0,604.1 2,484.1 4,170.0
Beidge 29.0 187.5 220.0 245.0 210.0 081.5 651.5 0.0
NoW Capital Works s/ 525.0 218.0 152.0 600.0 860.0 2,126.0 647.5 1,477.5
Equipment M 78. 80,448.0 168.0 279.0 0.0 4,960.6 1,466.5 8,410.0
TOTAL 2,470.1 5,802.0 8,121.5 8,165.5 2,406.5 10,401.5 T7,86.0 9,060.6
!!/ ncludoo survoy, y nvestigation., feaibl ilty studtie and setting up of dtbasepavement/britdge mintensnee aengement system.
Includes IDA and ADO-flonaeed road sections and assoclated structures.
4/j Includes proposed Kstunayake Expresswa 9enad te. Victoria and Kelanl Brldeo.
41 Include equipment to be procured under OECF proer.
Sourcs Road Developmet Authority, Apel I 1980.

-45-
Ralilwae
3.14 The major portion (Rs 7,458 million, or 762) of the total railwayinvestments is for "maintenance and rehabilitation," track renewal,rehabilitation of 101 locomotives, and workshop improvements for which OECFfinancing of about Rs 3 billion is being provided. Other expenditures includethe purchase of Romanian coaches (102), installment payments on equipmentprocured abroad (3Z), acquisition of commuter power cars (42), and reconstructionof railway bridges (22). The remainder is distributed among suburban railwayimprovement, rehabilitation of wagons, procurement of concrete sleepers andcontainer flat cars. The cost of the feasibility study of the railway extensionfrom Hambantota to Pottuvil in the south (undertaken in 1989-90 under Japanesefinancing) is also included in the PIP, but the cost of the ongoing commuterrailway electrification feasibility study financed by the French Government isnot.
3.15 The proposed railway extension was found to be economically feasibleby the study team but many assumptions adopted in the study are not realistic(e.g., all road traffic would be diverted to rail and rail traffic will grow at17-18S p.a.). This proposal should be held in abeyance for the time being untilother railway priority items are financed. The railway commuter electrificationstudy merits careful consideration in the context of a transport system analysisof the Colombo urban area. A preliminary analysis of the Galle Road corridorindicated that the improvements, with a capital cost estimated at about Rs 3,226million, would have a benefit/cost ratio of 1.97 using 102 opportunity cost ofcapital.
3.16 To assess the economic role of the railway, the TSPS evaluated fiverailway investment options (TSPS, Volume 2, page 8-1). The economic feasibilityof each option was analyzed after defining a set of performance characteristicsfor each option, calculated using traffic modal split model:30/
Option 1 - Base Case. Maintenance of road service and generalperformance characteristics regarding average speed and trainproductivity would remain at the existing level.
Option 2 - Deletion of Rail Service. Closure of the railways over aten-year period and the discontinuation of service would be carefullyphased to permit the necessary adaptation of transport services to thehighway system and to allow sufficient time for necessary highwayimprovements to be made.
Option 3 - Low Cost Improvements designed to improve operating andmaintenance efficiency by the optimum use of SLR resources (e.g.,restructuring of SLR management, increased productivity). It wasassumed that operational improvements would be made only gradually(i.e., slow in the initial period but picking up momentum after thefifth year).
30/ An investment associated with each option, i.e., improvements to track androlling stock would produce varying degrees of improvements in operatingspeeds, train productivity, etc.

-46-
Option 4 - Intermediate Cost Improvements. Track would be robuiltthrough reballasting and use of concrete sleepers and sharp curveswould be realigned to increase speeds and loads. Corrugated railwould be reprofiled and managerial/operational/organiuationalimprovements would be achieved.
Option S - Major Rehabilitation of the railway involving theprocurement of high performance rolling stock, signalizationfacilities, and track maintenance equipment, in addition to theinvestments and assumptions made under Option 4.
3.17 These options were evaluated based on traffic projections derived froma multimodal analysis83/ of the comparative marginal cost of transporting eachcommodity type between each pair of origin and destination zones in the country,and a parallel analysis for passenger trips. The results of the economicanalysis carried out for Options 2 - 4, compared with Option 1, indicatedinternal rates of return ranging from 52 for Option 5 to 162 for Option 3.
3.18 An indicative ten-year investment program based on this alternativeincluded track work, rolling stock maintenance facilities (workshops),procurement of rolling stock, track maintenance equipment, freight handlingequipment and computers at a total cost of Rl 10,435 million in 1990 prices.This would be equivalent to an average annual investment of Re 1,044 million andRs 5,220 million over a five year period. The 1990-94 PIP allocation of Rs 9,827million is 88% greater than the recommendation of the TSPS (see also para 3.28),and should be scaled down.
Ports and Shipping
3.19 The port investment is dominated by the construction of the ThirdContainer Terminal at Colombo Port (882 of total port expenditures) underJapanese financing. The remaining allocations are for the construction of theport access road (122), also Japanese financing. The Colombo Port was alreadyfully equipped with two modernized container terminals to handle nearly 700,000TEUs in 1988, about 702 of which was transshipment traffic. The projections madeby the Port Authority include further growth in the demand for transshipmentoperations by 1995, and the Third Container Terminal is in response to thisexpectation. The work which has already started must be completed. Aftercompletion of the Third Container Terminal, however, there should be no furthercapacity expansion at Colombo Port in view of the space limitation in the portand the effect the port traffic has on congestion in the city.
3.20 To supplement the capacity in Colombo and stimulate the developmentof the southern part of the country, the Government plans to modernize and expandGalle Port. The Galle Port Development Feasibility Study was completed in 1989for the planning horizon of 1995 and 2001 (its cost was not included in the PIP).This feasibility study does not make detailed traffic forecasts which suggeststhat a more exhaustive economic analysis is necessary. More careful analysis
311 This analysis examined the competitive position of intercity rail versushighway service and identified those commodities and passenger serviceswhich would be attracted to rail, if both road and rail services werepriced in terms of their economic costs.

-47.
needs to be undertaken to determine investment timing and the least costtechnical solution before any investment is made in this port.
Air Transport
3.21 No major investment is planned for the Katanayake (Colombo)International Airport during the 1990-94 period. Of a total Re 766 million inthe PIP, more than 50S was expended in 1989190 to complete the expansion of theColombo airport complex (under Japanese financing). The investments includedconstruction of a second runway, expansion of the airport and the constructionof fully equipped passenger and cargo terminals which have the capacity to handleover one million passengers per year. The remaining funds are for servicingdebts obtained to finance the airport investment program.
Bus Transport (SLCTBIRTB)
3.22 The current PIP allocates only Rs 10 million to support SLCTBoperations during the transitional period of peoplisation. The PIP, whichincludes many recurrent expenditure items, does not include the cost ofpeoplising SLCTI/RTB, estimated in the order of US$70-80 million. Althoughprivate sector investment is not usually included in the PIP32/, the estimatedannual capital requirements for bus replacement and need for capacity increaseswere made (Annex 6). to assess the effect they would have on foreign exchangerequirements. The three scenarios of low, medium, high demand indicate annualfunding requirements of US$34 million to US$50 million for the acquisition of busfleets.
3.23 In July 1990, the Government made a proposal to purchase 2,500 busesfor the Bank of Ceylon to lease to private bus operators to meet the shortage inthe supply of bus services. This proposal has now been abandoned for thefollowing reasons. (a) the state-owned Bank of Ceylon has had no experience inleasing bus operations, and the risks of sustaining substantial losses are veryhigh; (b) a publicly-owned agency reentering the bus market after deciding onprivatization at high cost is inconsistent with the Government's stated objectiveof increasing private sector involvement; (c) there are other more cost efficientalternatives for meeting bus transport needs through: (i) provision of reasonablefinancing terms for private sector buyers (i.e., 17-18S interest with a five yearrepayment period vs. the currently high costs of 40-45Z interest with two-threeyear repayment period); and (ii) removal of controls on fares. Both of thesefactors--high financing cost and low fares--have constrained private sectorinvestment in buses; and (d) purchase of 2,000 buses would require a minimum ofUS$70 million in foreign exchange which would have a serious negative fiscalimpact, and increase the budget deficit which the Government is trying to reduce.In sum, private bus purchases accompanied by some financing assistance and farederegulation will attract private investment, obviating the need for Governmentinvolvement.
D. Approach to Developing a Core Investment Program
3.24 In the face of the budgetary stringency in the near to medium terms,the Government should prepare a core investment program that includes only the
32/ Except for the case of state-owned bank loans to the private sector.
-48-
projects which can be expected to give high economic returns. It should avoidlarge investments which have a high degree of uncertainty due to the securitysituation in the country, doubtful economic criteria or uncertain prospects fordonor financing. The following principles may guide the formulation of the coreprogram:
(a) support the Government's objective of rationalizing and reducingpublic expenditures;
(b) maximize private investment by providing incentives to the privatesector;
(c) consider economic roles of each transport mode in achieving balancedinvestment among modes;
(d) calculate economic returns obtainable from each investment alternativeto determine priorities; and
(e) modify investment amounts in the light of implementation capacity ofexecuting agencies.
3.25 The following observations and recommendations may assist theGovernment in formulating a core investment program.
Hismys
3.26 There have been quantum jumps in the estimated actual expenditures,accounted for by the road subsector, increasing from Rs 0.5 billion in 1980 toabout Rs 1.4 billion in 1990 in 1980 prices (Table 3.2), without correspondingincreases and improvements in management and implementation capabilities. Inview of this, the current allocation of Rs 13,210 million to be spent in the nextfive years appears to be very ambitious. Data on actual expenditures in the lastfew years (Table 2) show that RDA's average annual spending amounted to a littleover Rs 1 billion. The allocation of Rs 2.6 billion p.a. would, therefore,represent a doubling over recent experience. RDA needs to establish expenditurepriorities based on economic criteria and carry out its physical works inaccordance with its implementation capabilities. However, about 202 of thesefunds should be spent on preventive maintenance (para 3.13).
3.27 The PIPs do not include funds transferred to local authorities for themaintenance of local roads. Prior to the establishment of Provincial Councils,funds were transferred to District Development Councils (now abolished) and localurban councils for maintenance of local roads. The annual transfers,administered by the Ministry of Local Government, amounted to Rs 32 million inthe recent past which meant only about Rs 2,133 per km (US$53 equivalent) wasprovided for maintenance and rehabilitation of local roads. This amount appearslow, but insufficient information is available to make a proper assessment of theshortfall in funding needs. Nevertheless, it is safe to assume that trafficvolumes are considerably lower on local roads than on major trunk roads, withcorrespondingly lower potential economic returns.33/ The priority is for therehabilitation of national and provincial roads except in the cases where
33/ Reference the Third Roads Project Feasibility Study.

-49-
improvement of local roads are an integral part of an area development scheme,a program to achieve increased production of particular commodities or the like.
Railways
3.28 The PIP allocation of Rs 9,807 million for railways appears to behigh, compared with its economic role and the economically justifiable investmentprogram (about Rs 5,500 million) prepared by aggregating the individual railwaycomponents after evaluating different alternatives. This railway investmentprogram is being analyzed further for a proposed project (funded by an IDAProject Preparation Facility). It makes sense to invest in railways only if SLRand the Government undertake a comprehensive restructuring program to make therailway efficient (Chapter II). The difference of Rs 4,302 million between thePIP allocation and the feasibility study recommendation is accounted for by alarge sum of Rs 4,250 million allocated under the rehabilitation and maintenancecategory without specifying what these expenditures are for. All other items(e.g., track, rolling stock, workshops, commuters signalization, etc.) are listedseparately in Table 3.3 above. It would seem that the total railway PIP shouldbe decreased, and the difference reallocated in line with the proposedinvestment program, shown in Table 3.5 below.
Table 3.5s RUCOMEKDED SRI LAMRA RAILWAY INVESTMENT PROGRAM(1990-1994)
CostItems (million Rs)
1. Locomotive Rehabilitation 2,593.22. (a) Freight Wagons 319.5
(b) Handling Equipment 45.03. Track 1,576.04. (a) Signalling 450.0
(b) Internal Communications 50.05. Management Information Systems 126.06. Ratmalana Locomotive Workshops 145.67. Shipping Costs 200.0
TOTAL 5,505.3
Ports, Shipping, Air Transport and Public Buses
3.29 There is little room to adjust the PIP allocations for thesesubsectors, as explained above. The allocation for public buses would no longerbe necessary after peoplization. In line with the Government's statedobjectives, fiscal incentives and financing of buses may be offered to attractprivate sector investments, accompanied by fare deregulation.

OBO.
3.30 The core investment program prepared following the principlessuggested in para 3.24, is the first step towards rationalizing PIPs. But sucha program should be considered as indicative only, showing the general directionof development of the transport system in the next five years. Specific capitalinvestment proposals must be subjected to detailed feasibility studies todetermine economic viability and priorities before investment decisions andimplementation. It should also be noted that the success of capital investmentswould depend heavily on improved and effective management, strengthenedimplementation capabilities, and tariff structures designed to cover appropriatecosts. Increasing the efficiency of public expenditures requires far-reachinginstitutional changes and policy reforms. Therefore, the transport strategiesand reforms recommended in Chapter It must be carried out in tandem withimplementation of physical works and replacement of aged equipment in order toobtain tangible results in terms of improved productivity and financial health.
IV. DONOR INVOLVEMENT IN THE TRANSPORT SECTOR
A. Past IDA/Bank Operations
4.1 The Bank's involvement in the Sri Lankan transport sector has beenrather limited--four projects since 1979 with total lending of US$133.0 million,mainly due to the low priority given to the transport sector by the Governmentuntil recently and the weak institutional structure for managing the sector. Thefour transport projects weres the First Road Maintenance Project in 1979 (Credit900-CE, US$14.9 million, PCR No. 8000 dated August 1989); the Road PassengerTransport Project in 1980 (Credit 994-CE, US$51.6, PCR No. 8011, dated August1989); the virtually completed Second Road Maintenance Project (Loan 2517-CE) of1985 amounting to US$24.0 million; and the Third Roads Project (Credit 2183-CE,approved in November 1990, effective as of February 21, 1991), amounting toUS$42.5 million. Components have included upgrading and rehabilitation of roadsand road passenger transport facilities, provision of critical spare parts andinstitutional strengthening. The projects have also supported training inmanagement and engineering. The Emergency Reconstruction and RehabilitationProject (Credit 1883-CE, approved in March 1988) also includes funding forreconstruction in the north and northeast of roads which had been damaged duringthe country's civil unrest, but little progress has been made in implementationdue to security problems (Annex 7).
4.2 The results of the three completed projects were mixed. The positiveelements in the roads projects were: the shift in emphasis in the first projectto rehabilitation of roads instead of new construction, which permitted IDA (andother donors, notably ADB) to begin a policy dialogue on highway issues; thesuccessful rehabilitation of major roads (e.g., the Colombo/Kandy road) andbridges (those on the Colombo/Galle Road, especially the Kalutera Bridge);attitudinal changes in RDA and improved technical capacity; and improvedperformance of some local consultants and contractors who have gained experienceunder these projects. Under Loan 2517-CE, IDA also assisted the Government toestablish an Inter-Ministerial Committee for the Coordination and Planning ofTransport (IMC-CPT) and its Technical Secretariat (Transport Studies and PlanningCenter) as a focal point for discussion of multimodal issues.

-51-
4.3 On the other hand, there have been cost overruns on a number ofcomponents reflecting weak project management. Nonetheless, successiveGoverrments have reiterated the policy of rehabilitation and it is now anintegral part of RDA's thinking. The Road Passenger Transport Project (Credit994-CE) underscored the complexity and inefficiency of the public sector'soperation of buses despite its attempts to improve the situation. Nevertheless,it contributed to policy reforms which helped to remove some restrictions thathad constrained private sector operation of buses by allowing higher tariffs, anddirect importation of buses with incentives and free entry. The EconomicRestructuring Credit (Credit 2128-CE, June 1990), which built on this earlyexperience of reopening bus transport to the private sector, is supporting a fullretuzn to private operation. Transport projects in Sri Lanka, although a few innumber and relatively modest in size, are sustainable, and their impact has beenpositive.
4.4 IMC-CPT/TSPC, established under Loan 2517-CE, provides a forum for thefirst time for discussion of intermodal issues relating to the railway and bustransport, Colombo urban transport and mobilization of resources (e.g., throughuser charges) to finance increasing road maintenance requirements. Its transportdata bank is available for use by other organizations, and is designed to meetthe needs of planners, researchers, operators and managers in the areas of: (a)transport demand; (b) transport supply; (c) operating costs; (d) investmentcosts; and (e) regulation. This new focus on coordinated planning is much neededand has already served a useful purpose by supervising execution of the TransportSector Planning Study which it produced in January 1988.
4.5 IDA's future strategy must build on its past experience and emphasizeonly priority areas for which it has a comparative advantage over other donors.It should be based on the following criteria:
(a) rationalization of investment programming and agreement on capital andrecurrent expenditure priorities;
(b) appropriate pricing policies and resource mobilization;
(c) support for strengthening of institutional capacity to managefinancial resources and maintain and operate facilities and services;and
(d) assist in the introduction of cost effective services (includingprivatization and suspension of non-economic services for whichsubsidies are not justified).
The strategy must be reflected not only in lending work but also in economic andsector work, supervision and in relations with other donors. Highways and roadtransport (including buses) are likely to remain the key areas of involvement butthere is also a case for rail if the Government actually undertakes the proposedrestructuring. For now, financing needs of ports and shipping, and airports andaviation have been met through OECF and suppliers' credits, and there is no needfor IDA involvement in financing physical works in the near to medium term.

-52-
B. Donor Involvement
4.6 In addition to the Bank's assistance, the Government of Sri Lanka hasenjoyed the financial support of various donor agencies in all subsectorst roads,railways, ports. airports and urban transport. Annex 7 provides a summary of themajor donor-funded projects in the sector. In particular, ADB, OECF and ODA areactive in assisting RDA in the road subsector. ADB's two road improvementprojects involve rehabilitation of 705 km of roads at a total cost of US$73.6million. An OECF loan of US$99.4 million, implementation of which has juststarted, is primarily for the purchase of road maintenance equipment, tools andconsultancy services. The Japanese Government is considering financing theKatunayake expressway and a new road between Trincomalee and Colombo; however,its economic viability is yet to be established. ODA financing of US$22.0million was provided for repair and rebuilding of 12 km on two major trunk roadsin Colombo--Galle Road and Prince of Whales Avenue. Also assisting in the roadssector is the Economic Development Cooperation Fund (EDCF), Republic of Korea,with the rehabilitation of about 101 km of roads between oolombo and Galle(US$14.5 million.)
4.7 Port development has been undertaken principally with Japanese aid.The railways have benefitted from a number of donor projects, including financingfrom the Overseas Development Administration (U.K.) of a project for trackrehabilitation, French aid in the modernization of maintenance facilities,Romanian power cars, Indian aid in the rehabilitation of the railwaycommunication system, and Germany (GTZ) for improved maintenance and operationsmanagement. An OECF loan of US$69.0 million equivalent is intended for assistingSLR in rehabilitating locomotives and maintenance workshops. Under a FrenchGovernment grant, feasibility of suburban railway electrification is beinginvestigated. UNDP is also financing a US$1.2 million grant to strengthen thebus sector and especially to help make a smooth transition of the public industryto private ownership and operation. Donor financing from IDA (para 4.1), ADB,Japan, U.K., Canada and Germany for an Emergency Reconstruction andRehabilitation Program includes funding for repair and rehabilitation to roads,bridges and railways, and purchase of buses to restore transport capacity.
C. Need for Donor Coordination
4.8 IDA has taken the lead in arranging donor coordination for transport;meetings in Colombo have been productive, with wide participation of transportagencies, the Ministry of Transport and Highways, the Ministry of Planning andPolicy Implementation, the Ministry of Finance and IDA. Through such meetings,the Government keeps donors abreast of each other's activities and discussessignificant sectoral issues. To date, there has been substantial success inreaching consensus on approaches and overall sector priorities. These effortsmust continue, since donors may differ significantly as to objectives, sectoraland subsectoral priorities, institutional improvements, and the nature of supportthey are willing to provide. Such meetings are providing a good forum for theGovernment to discuss and reconsider its policies and to become aware of the needto formulate its own strategy to deal with specific donor agencies. It mustadopt a strategy of capitalizing on the comparative advantages each donor agencyoffers.

LLL ALL&TUANSPAtU SECTDR aHNDRAMOUM
obt3e.l Read Pr,ncial R Lal ReedR.V.A. Provincial Cei a Loal oeraeato Special ita Agowi. at Grand TOtl Total Pbvd _mber oP ;revicm Paved Utved Total Paved tWavd TOal PaWvd Upaved Totl Paved Ureved Total ha D km s or.deaVeetra 1464.45 - 1484.45 162.04 695.15 186. 19 2626.98 5862.64 1.82 76.54 16.29 14.77 10.67 l.2 a A A 51.01 1e 1026control 1412.08 - 1412.18 1921.59 57.74 2601.83 66.34 26.81 86.95 007.67 4054.71 494.66 278.74 12.5 49w8.6 1u S:ysm_ter 114.6 - 1148.6 1163.87 60.06 1786.4S 7961.66i 4s67.60 864.If 5.47 419.0S 424.60 6748.74 9.0 3234.13 *0 U5THor*th/Eteu. 27.80 - 8287.60 1626.58 784.67 2611.20 7.64 941.60 10o69.4 63.86 218.25 2196.60 1769S.04 16.2 5735.52 19 W5tbrthAijg."r 1266.38 - i6.8 1864.64 6l.70 2056.24 267.85 115.9s 11448.25 54.90 804.05 86.95 15124.00 15.5 2973.67 1o 445brthr-C.etal 872.40 - 872.40 M0.29 665.67 174S.9 71.06 6a6.79 s707.62 117.91 4S2.01 549.92 11876.10 12.2 2278 G3 7 SS7WA 927.91 - 927.91 3102.77 49.66 1502.48 2s7.78 194.60 182.86 925.19 2186.80 813.99 7876.66 7.6 3153.60 1o 841Sabaragmisa 1041.97 - 1041.97 s64.64 277.06 1141.70 748.81 22S4.20 299.01 8s5.01 2760.82 8114.48 8296.11 6.5 3004 33 10 MOProvincial Sp#itlk"a"
N.A. N.A. 6S02.67 8S2.67 8.1totala 10442.42 - 10442.42 19.n77 4506.7s 161.05 7010.24 46M.92 O4M.76 2606.14 13,66.60 21986.61 97375.29 100.0 80752.57 10 GM6Wiatribqgtian ofhrrisdictien 6 10.7 15.7 5s.7 19.9 200.0 IA
I3/ Spotai.ad heiece - J1eetha Eta Devolepeatt 8eard
-Sri Lan t Plantatiee Corporation- Irr;Ostion Departeat- Forst Deprtant_ Ib1o; Autbority- Ld Colisoi0r Dooart.at
Seor": FM, traffi;e _d Plming Division. February 190.
I S.

SRI LAWA
ANWPRT SECTO
Table 2: S WRY OF PR0IWSIONS/EXPI01TURES ON ROADS- (t Mil I on)
Year 1 9 I 1980 1981 1982 1083 1985 1988 1987 198 1
N1rf 24,767 25,150 25,150 25,160 25,150 25,48 25,457 2,476 25,5 25,68 25,679 25,679Km.
_s1sal BgdI_ 8.1 5.4 6.9 0.6 0.9 1.6 1.8 2.8 8.0 18.8 6.7 8.8
Actual 8.6 6.1 0.7 0.8 1.1 1.7 1.2 2.8 2.9 9.7 s.9 N/A
Uaibeoeae Of Budgeted 6B.0 81.6 95.2 140.0 154.1 172.6 1I.5 418.0 850.5 260.0 280.0 260.0redl, bridgsNW culverts Actual 70.0 97.8 122.0 184.8 158.8 178.2 870.4 116.1 219.1 246.7 224.8 26.0
lhbObiiitstio. .o Budgeted 58.0 142.5 867.2 259.0 255.S 225.0 221.0 611.0 O68.1 940.0 695.0 2,S92.9_iaprevust of
capital eas Actual 102.0 265.8 407.4 21S.4 285.0 202.4 $02.6 678.6 678.2 704.1 65.2 1,014.8
TUTAL Budgeted 112.1 226.6 469.2 899.8 410.6 299.4 401.6 1,069.8 1,016.6 1,200.0 1,161.7 2,861.7
Actua1 175.6 85.2 580.6 850.5 888.9 260.7 674.1 797.0 1,098.2 1,040.6 878.9 1,274.6 of
of v- eitem is due to delay is precf oqmn1t financed by OECP.
NMTES: - weel Adeistration: include provision for RDA and Ministry and xoWmdlturs.- lmietemamas: includ recurrent provisions and enpenituros for roade, bridoe, culverto, causeways, etc.- RSubabi litttof Capital Assets: Includes foreoip-fundd projects, I.e., construction, additions
to nd i of o , brid, structures, buildins and acquisition of plant and oqu;ient.
Source: Road B .omIt Authority, Apr) i 1900.
Ig
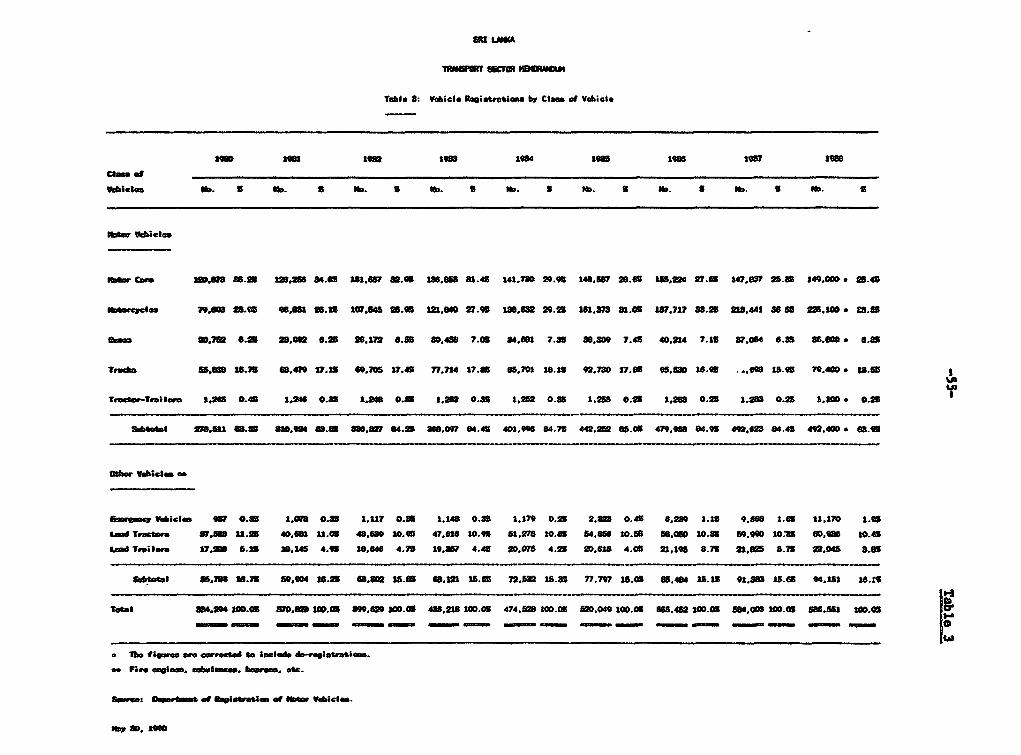
fRl LAW
TaMs, S. Vskitc ftb§;tr tcie_ by Clu of VAWec
l¢Im llB teBt 1ell 2914 lsas t1# 1
ftbCt o. S tD b . "t.5 lb MD. MD *. * . . S
RMNI 1D,#IS UDn858 SW=|1i 84.01 MAP s 82.0 UB,t# SAS1.4S . 20.9t UM., 59.65 )WS,524 27.0S lat,GP7 25.S J49,Ol * Sb.410
_9mcge ".eG3 89.95 9,Ot Z$.U 107S4|5 fi5.1 M21, 27.W1 1811, :#9.2i IB1,87 81.01i IW.77 33.2 210.441 MlS$ 22.,Do- I!S.5I
_go 8t,W2 8.2s 28,002 S.8s 56,172 .0.6 8b,<lB 7.01 34t,9 7.aS 308,aW 7.4S 40.214 7.1s S7.05 6.35 StS.eA e tSJ
TrUAN Won ,16St.7s 63,470 VA19 60,70 17.42 71174 17.811 865701 .#A 92,?S0 17.0S 95.,8D 10.S -. MS 15-9 sr n. a la's
T _mkwTriie SAMl 0.411 I.=M 0.8 1,Dt8 o.as 1,26 O.Ml 1,22 0.as 1,258 0.2S 1,8S3 0.8s 1,:lS 0.:iS 110D e 0.X11
Sol _ 27UW 08.tl 3to,e0 G8.M lI:.8,27 04. Se ,60.0 84.411 401,ef 84.75 442.252 81g.4l 479,e 84.950 492,623 8A 4 02.000 * WIS.
Gowes Ve;claF o7 O.SS 1IIV8s o.as S,U? 0.95 1,14B .9 1,1?9 0.2S 2S. .a 0. , 6281 1.3S 9,tW1B 1.65 tl.l?0 1.2%Lan Taar, BY7, U1.9S 40ft1 II.a 49,0a4 tO.I15 4?,0tO tO. 61,278 lOJS 54,8610 I.6 611,05f0 lOllS 509,S2 so.- ,oo t0.4
x Teo wo 17,alD 5.t t ,l45 4.95 l8,046 4.7S 19,81S 4.41 2D,073 4.2S 2t0,610 4.05 2l,lS S.7S 21,M2 a.75 22.04S 3.85
5 SlOM 7 1sM 1#.711 69,964 16.25 Zl8.=8 SS15.0 8,Ul Iti.4 72,M 1S.35 7.7,77 15f.0 854Bt t6 3S 41.S13 3IS65 ff.t63 Us.;t
Tlw =.a$M C.0IS J7D,E lO.= 8M.,9 200.Q 4#,2518 100.09 474,62 l00.0DS _.4 100 W5.6 _ .09 S U4,00S ttlO0 1 06.351 tOD.0
deFirm em_,d* uto_ ,as blle,s aft.

SRI LANKA
RASPWORt SECTOR MEMARM4M
Table 4: Road Accidents Reported by Police Division
Police 1974 1975 1978 i97 1970 1919 1980 161 n 1968 1984 1986 1996 1i? If88*lwIsloe
COLUO3 8,8S4 8,s9s 5,266 8,514 4,742 6,804 5,991 5,720 5,740 5,9S 6,112 6,807 8,972 12,946 9,66AWAMH C18 540 68 670 570 566 ?96 940 1,082 1,004 1,184 1,182 1,8 1,700 1,20KELAMIYA 1,829 1,278 1,447 1,481 1,219 1,098 1,468 1, 56 1,617 1,662 1,488 1,484 2,316 8,661 2,69?KALUTARA 747 780 909 986 1,025 999 1,204 1,266 1,108 1,064 1,188 1,066 1,620 1,979 726NUGECIA 967 868 999 1,069 1,106 1,296 1,661 1,497 1,023 1,470 1,543 1,870 2,799 4,212 S,109MT.LAVMIA 789 705 747 727 017 969 1,262 1,568 1,884 1,790 1,606 I,58 1,697 2,627 2,276KNDY 1,271 1,269 1,828 1,858 1,129 1,107 1,618 1,789 1,758 1,880 1,837 1,822 2,027 2,769 2,020WAIU ELIYA 268 247 80w s 191 216 859 218 887 8a8 4" 362 422 s67 461OALLE 499 524 626 847 721 "1 1,158 1,061 488 1,014 1,049 1,062 1,221 1,616 1,102ATARA 650 506 529 0 82n 416. 657 601 476 460 474 4656 744 885 677RATNAPUMA 831 961 868 767 1,009 1,004 606 668 62? 849 667 780 1,121 1,708 1,810KEIULLE 888 840 284 80a 822 278 716 82 755 66 1,007 964 1,103 1,468 1,294KlUWEA 88 8o98 419 512 798 796 1,076 1,18 1,220 1,161 1,270 1,156 1,540 1,809 1,88CHILAW S6T 628 607 658 496 622 728 7 786 725 6 00 768 1,068 mJAFFNA 84 604 462 429 479 414 584 607 G6M 874 176 as 28 28 119VAVWIVA 152 181 196 206 241 249 196 206 204 194 150 19 10 25 44ANRADHAPURA 200 272 808 418 465 464 628 598 674 601 670 487 600 7o0 461IRINCO FALEE 258 249 8os 266 869 879 420 546 408 458 398 813 sa8 las I1OOAmCALOA 221 S02 807 804 844 896 499 619 478 484 899 200 O6 71 80BADULLA 815 887 874 471 686 626 721 827 771 829 " 6" 897 1,067 mNEOcM - - - - 457 484 b96 709 791 680 608 640 1,002 1,220 908MATATE - - - - 872 410 482 450 446 474 s56 588 627 627 520HATTON - - - - 110 108 117 107 - - - - - 725 -TANGULLE - - - - 280 818 865 828 a48 892 ao8 8a8 484 216 876APARAI - - - - - - - - - - - - 123 276 170POLOARA - - - - - 168PANAM - _ _ - - -- _ _ -_- 66
TOTAL 14,407 14,069 18,860 15,297 18,297 19,896 24,271 24,a65 23,48 24,187 24,684 24,080 81,933 44,8 33a,
Note : In 1978 new d1visons were formed at b o, le, Hatton Tontal -.In 1974-77 Vi" areas were Included 1n Iblaniya, Kandy, Nwra Eliya and Motora respectively.
Source s Police Dop.rnt fg

j, I ----------- --|i------------t ! |~ ~ ~ ~ ~ ~ ~~~~~N o j. ! o8g t t |||osss8! ir "g
§~~~~~~~ ~ ~ ~ ~ -----|i---- @8§F . ;o §eoo ,f{
-- - - - - -- - - - - - -_ -.__ __ __--___ __ __-__.._-.-__ __ ___ _--___ ,-
!~~~~~~~~ 1 li P Poi PPI[ 3 Zo!ti tj ---18 - -----------°o18 Ti ---------- ---- T-ll ii s S ;Se°t 8igg l&
istt i M MW| X 4t si "
-E§ --------- .---------- - -- -8 --------ge {----------
i~~~~~~ ~ ~ p p P!8iDpppatFt|seu |t! ]|8.WoYs2 g t_tt '@i)
!;~~~~ ~ ~ ! I :gli@&l"1518£ i lli ow| m | }~~~~ - - - - - - -8 -

Me a aOCmmM AID rn. faZrw= 03,50M. 331w 1990 93116 on DACIV1STlCS AND CUll. 6420017 *Ow15. 1I8
lemma WAaIBWN ~ BML an "mam VA LA= an IWBOSA 00CK%W S131 ouW as I fst41U as I K as Ipa,ob g etsm s 9 - 90 9 -- lmaabor ofSe"o, 15 I I, 62 93ftas OL. (0a)m 7 9 so 95 9 =0 fetdsiam L.4ts JAWu3 us. (080) 971 I & I 95 oft of.b 96 a 7.6 8 5. *I evlbe flos.9Litof.Ofb a 9 . .8 9cufeUin 9*. 4M5 S 0 9 lWUfoem Km. 9 3 C 1
cost 9 I"i1 1cot
I 9 ~~~~~~~. bet~~~~% Peir Pen Pet P.tI P4 Ptr for Por S Per Pat9 I ~~~~~~~~Pbam'b SsoS Vbe be am&t PeM am. $a, 99 per be bell P.' beo Soat Par De eSo"(3a'.C=Oh) I 1aW 5.L NO. TOWas Me. U.. I 1Qw Kg. lb. I *WPAThU CSTS Ole.) I Vas ge. goe 91at he Koe Tow SD. Ka.
I I ---------S------I--------- I 9----------------*-9---------* -~~~~~--- --- --- - -ibel a AabA'Imtl 9 Ism 3.77 caw I mm 9.a6 0.09 a 41334 4.8? 0.06 I 1.88 1.219 1.21 ffeeI A Lagbr.ee.6 I SOW4 1.14 0.076 5186800 1 71 0 063 2640M R.AM 0.W66Mlras Isun0 0.51 0.0I865 imil 0.50 *.0 I 9W59 1.66 0.00 0 I1.33 1.76 1.665 ITiree I 92101 0.81 0.021 9 40000 0.10 0 0199 BMW0 0.02 0.0195Ioblubm" Ig508 0.43 0.151 I -08 0.a6 0.0 I mm 0.97 0.01 I s.100 3.70 2.790 IMeIatemocse I 18630 0. 15 0.010 I 25600 0.83 0 012 S 860 0.36 0.00I
tUrin I 6605 0.86~- 0.046O 5 I15150.590 .0 I MU1 0.65 0.0110 I 1.6111 1.1101 1.569 ICr. 9 4600 0.48 0.0421 46000 0.6so00an1 49 0.02 0.010 I4=0 0.8 0.063 I 860.86 0.085 I am8 0.07 0.001 I 1.M0 1.500 1.00 tlnerase I a7600.66 0.606 5840o 0.07 0.083 I9moo 0.06 0.001 IlLcama..a S1 Pea. 10 .0 0.0003 S 0.15 0.00I GM60.0y 0.003 I 1.000 1.000 1.000 ILiceecee A Peas 4970 0.07 o.00s I 860 0.07 0 005 I065 0.07 0.00 I
CDaenasieIln 9 9367m a.2 0.40 I mm 1.1 0.00 I 13 1.36 0.06 I Ibirceie944310.48 0.04391 62595 0 7 0 069 I001 0.66 0.018I
I Tool GM" 5Q5 4.77 0.83 1 4068 6.15,O0M I8706 029 0.15, I 1 7.1. Ceee 12153 2.15 0.199 9 12359 4.02 0 149 14563 6.10 0.609 a
38 4.41 0.200 I 4M8I80 6.13 0.21M6 98686 6.40 0.M8 11.250 9831345 I 2606505.10.285 19591200 4.89 0 ses I 64608 6.70 0.31 II I I- --- I --------------------- 1--- *- II(0617 I ~~~-mm-0.A -0.08 I -an5 -0.65 -4.00 I two 0.90 4.0406. 190591 I 1S97 0.55 0.08?lI 665 0.81 0032 9 369605 1.60 0.0 I
aO S soXUM IS O. 8asts AVW .O ML 3MM. A16.00 1080 93t141M a5 ODWRCIO4ISK AND COST. Sflm. 4VM%M OF ALL AMU1. 400
flocnE OVAWAXW40=1 M" mm onn an I La= an I860.8 0*IAWC06TICS9 ShIL as I OMAN as I LANEs as I9 I 9 9 ~ ~~~~~~~~~~~~~~~~~~~ I ----------omb asm 8 1 3 21 49 93h1.e 0.395612h6er of beet& to5 27 S 49
shma ltm. (am St8 I so as6 93..'. 0.8118IAae.eIKe. (00) 988 600 65 t2 feb am 6S 9 7 9 Iletercil. 0.83S9 Lf.eofb IM 6 57 a (Iashmifea. 9 10 9 449 us3 I ILifteasiMe. I 89 449 9 8
P*Pfs o% I MDI I ans ci 9 cot 2 du
9 9 be~~~~~~~~~o ObnI be Pe, Par Pan 9 P., Per Per vor For PerII 9 ~~~~~~~~Per BeD Sash Pevr be0 So"t Per be seat1 I Pat be bell Per be Usee Per Sm Be" Iwmuu e.~~~~~~ 1ow Mm. Me.6 Tear us. Mm. I las WA. VA. I 5074T11 COTS (U.) Y eer Ke. VA. love. Me. We. Tear Ka. ge.
0%0 A u2mricmae IUOIIIS 1.15 0.115 9 147156.45 0.009035.0 .I 299..I *MOA Lir&csete 9 862 1.11 0.074 gem9985vs 1.606936=06 2.69 0.066I971r.. gi 2100. 0.405 I 018 0.67 0.40 3 7010 1.07 0.= ITi.tee SON66 0.3 0.021 1 S0OW 0.62 0.019 I94 0.85 0.03 It1bieSammaso mm 0.48 0.00 I 606 1.15 0.0893 0007 1.29 0.05 I 91h.eleeaece I 304 0.25 0.018 I 2575 0.40 0.01.5 I 29065 0.45 0.0999
3Cr,. 9~~~~~4p *A86.3 0.089I 9065 0.15 0.008 = 0.00 0.017 9 Cr.. 46000 0.556 0.087 463850.75 0*.M I 4120 0.72 0.018*~~~asge 9 ~~436 0.0.0.09 0.6I O0.100.001 86O50.10 0.00 1 leermrwe 9 8440 0. 07 0.0" 9 466 0.05 0.0089 616 0.0 a .s(laas rawe. 49700.00 0.06 9 080.0 0-.085a am8 0o O.m g Liceetee A Pew. 497 0.09 0.006 I no o.o. 0.000 I 666 0-.10 00 U~~rec.eUm ~~~~3 91 1.74 0.136I3 0110I 3.46 0.6651 I 1210161M1.66 0.0118 M Oee.ta 71 0.12 0.008 9 5433 0.91 0*085 I 500 0.15 0.016 I l a
O 9 ~ ~ ~ ~ ~~ ~ ~~~~~~I I -9 I--------------------I--…---~~~ff 3~~j-M 40 04.= 4OA0 9 49460.08 0.00 I 500 0."4 0.009 I 9938F77 9 904 0.46 0.00 I 601 0.99 0.08 I 111611 -a 118.06
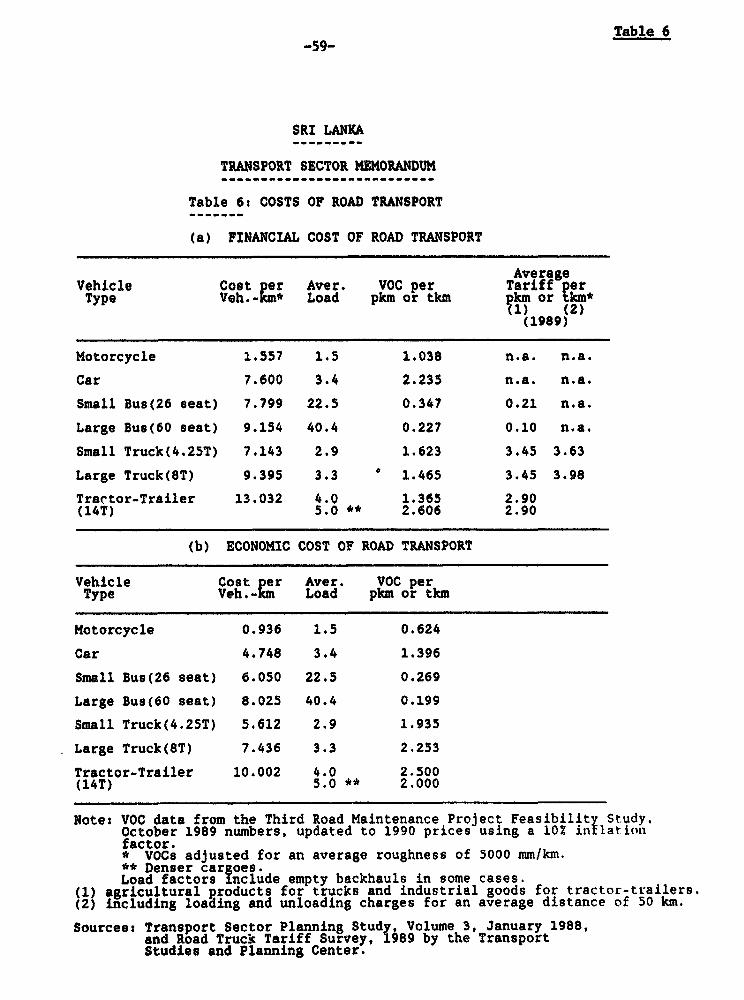
Table 6-59-
SRI LANKA
TRANSPORT SECTOR MEMORANDUM___________________________
Table 6: COSTS OF ROAD TRANSPORT
(a) FINANCIAL COST OF ROAD TRANSPORT
AverageVehicle Cost per Aver. VOC per Tariff Per
Type Veh.-km* Load pkm or tkm pkm or tkm*(1) (2)
(1989)
Motorcycle 1.557 1.5 1.038 n.a. n.a.
Car 7.600 3.4 2.235 n.a. n.a.
Small Bus(26 seat) 7.799 22.5 0.347 0.21 n.a.
Large Bus(60 seat) 9.154 40.4 0.227 0.10 n.a.
Small Truck(4.25T) 7.143 2.9 1.623 3.45 3.63
Large Truck(8T) 9.395 3.3 1.465 3.45 3.98
Trartor-Trailer 13.032 4.0 1.365 2.90(14T) 5.0 *f 2.606 2.90
(b) ECONOMIC COST OF ROAD TRANSPORT
Vehicle Cost per Aver. Voc perType Veh.-km Load pkm or tkm
Motorcycle 0.936 1.5 0.624
Car 4.748 3.4 1.396
Small Bus(26 seat) 6.050 22.5 0.269
Large Bus(60 seat) 8.025 40.4 0.199
Small Truck(4.25T) 5.612 2.9 1.935
Large Truck(8T) 7.436 3.3 2.253
Tractor-Trailer 10.002 4.0 2.500(14T) 5.0 ** 2.000
Notet VOC data from the Third Road Maintenance Project Feasibility Study.October 1989 numbers, updated to 1990 prices using a 102 in lationfactor.* VOCs adjusted for an average roughness of 5000 mm/km.** Denser cargoes.Load factors include empty backhauls in some cases.
(1) agricultural products for trucks and industrial goods for tractor-trailers.(2) including loading and unloading charges for an average distance of 50 km.
Sources: Transport Sector Planning Study, Volume 3, January 1988,and Road Truck Tariff Survey, 1989 by the TransportStudies and Planning Center.

SRI LAMKA
TRANSPORT SECTOR MEMORANDUM___________________________
Table 7: RAIL TRAFFIC,1975 - 1988-------- (In millions)
Traffic Type 1975 1976 1977 1978 1979 1980 1981* 1982 1983 1984 1985 1986 1987 1988
Freight Tons 1.7 1.5 1.4 1.8 1.9 1.6 1.7 1.5 1.6 1.6 1.6 1.6 1.5 1.5
Freight ton-km 301 278 226 280 256 202 223 217 224 263 232 204 195 197Passenger Trips 69.1 41.7 65.8 79.5 90.0 85.0 70.7 70.5 61.4 59.6 60.3 59.7 n.a. 54.9
Passenger-km 2,864 3,005 2,793 3,709 4,072 3,872 2,985 3,121 2,447 2,280 2,101 1,972 2,058 1,859
Train-km (000) 11.3 10.9 9.1 11.0 11.0 11.9 10.7 10.4 8.4 8.5 8.5 8.1 8.2 8.0 t
* 1981 freight figures were estimated from partial stacistics.
Source: Sri Lanka Railways, as reported by the Transport Studies and Planning Center.

-61- Table 8
SRI LANKA
TRANSPORT SECTOR MEMORANDUM
Table 8s COSTS OF RAIL TRANSPORT (1989)
(a) FINANCIAL COST OF RAIL TRANSPORT
…---------------------------------------.---------------------__-------------__---_------_-_Cost per Average 2
Service Cost per Av. Load pkm or tkm Tariff per SubsidyType Train-km per train oper. Total pkm or tkm Operating Total
cost. Cost/_ Cost Cost(1) (2) (3) (4) (5) (6) (7) (8)
Low CountryIntercity Pass. 287.5 378 0.76 1.20 0.37 n.a. 51 69
Intercity Freight 373.5 232 1.61 2.54 n.a. 0.55/c. 65 78
Commuter 326.0 480 0.68 1.07 0.09 n.a. 87 92
Local/Mixed Pass. 280.7 180 1.56 2.46 0.37/. 0.55
UP CountryIntercity Pass. 319.2 180 1.77 2.61 0.37/b n.a. 79 86
Intercity Freight 400.7 111 3.61 5.31 n.a. 0.68/Q 81 87
------------------------------------------------------------ _----------__----__-------
(b)s ECONOMIC COST OF RAIL TRANSPORT
-------------------------------------------------------------- __-------------__-
Cost per Long runService Cost per Av. Load pkm or tkm Marginal CostType Train-km per train oper. Total per pkm (5) as 2
cost. Cost or tCm of (4)(1) (2) (3) (4) (5) (6)
Low CountryIntercity Pass. 237.7 378 0.63 1.07 0.84 79Z
Intercity Freight 314.6 232 1.36 2.29 1.82 79!
Commuter 273.9 480 0.57 0.96 0.75 78l
Local/Mixed Pass. 233.2 180 1.30 2.20 1.74 792
Up CountryIntercity Pass. 264.8 180 1.47 2.30 1.83 79Z
Intercity Freight 339.5 111 3.06 4.76 3.66 77S…________________________________________________________________.______________
/a Including replacement cost of rolling stock and locomotives calculated toto be 582 of 1988 operating costs for properly sized low country trainsand 47Z for upcountry trains.
/b Second class coach used as the average (Rs 0.37/pkm) with same in upcountry/| Average for non-petroleum products is Rs 0.55 per ton-km and 0.68 in
upcountry.
Sources: Transport Sector Planning Study Volume 2. January 1988updated from SLR operating results for 1988, and rail tariffsfrom the Road Tariff Survey, 1989 by the Transport Studies andPlanning Center.

SRI LAUXA
TRANWSPT SECTOR MEMORANM
Table 9: REVENE AN0 EXPENDrIWE ACCOUNT OF SRI LAUU RAILYS'------- (In current RB)
__ ____--- - ---- _----------- ------ Re million ------- -------- ------------------------------…-
1970 1976 1978 1977 1978 1979 1990 1981 1992 1993 1984 19E6 1988 1997 1988
REVESPassenger 109.5 116.S 119.S 118.3 148.9 170.0 222.8 255.2 278.a 278.1 208.8 269.0 2S1.0 258.8 227.8Goods and Livestock 83.1 61.6 6B.6 50.3 68.5 107.5 97.6 89.2 88.0 127.4 162.0 164.1 189.8 185.? 188.2Parcels, maile and othor coaching 6.6 9.7 9.7 12.9 11.4 17'. 22.2 21.8 2.0 27.8 81.0 29.8 19.9 80.6 21.1Miameilnaeus 6.9 8.4 12.8 11.8 16.7 17.3 16.2 42.9 41.1 15.1 21.7 20.7 84.8 81.1 8.0
TOtal : 188.1 196.2 198.1 188.4 289.6 812.1 866.7 409.0 486.4 447.9 528.0 483.1 600.6 606.4 488.6
General Adsinistratioo 41.1 44.1 49.2 58.0 67.5 70.2 78.6 94.7 124.2 181.2 202.0 69.6 80.9 91.6 101.8Transportation Services 95.7 98.8 98.8 92.1 102.9 12.0 227.2 8o9.8 820.1 866.6 420.1 418.9 486.1 487.6 447.4Rollino Stock 48.1 69.9 62.6 69.9 79.8 116.4 116.4 106.7 199.2 212.4 859.8 847.9 847.4 896.9 447.0 /aPerweaent way, elgnalIing and a4.9 89.8 40.0 44.4 61.5 86.2 74.7 78.8 92.7 118.0 127.9 165.8 163.8 190.0 191.9bui ldingWorking of the Kelanl Valley line 8.4 7.9 8.8 8.2 8.9 10.0 9.1 18.1 15.0 16.0 15.2 17.0 17.6 18.2 24.6 1Annuities and interest pgyable on 46.1 60.7 71.7 89.8 106.8 144.6 192.9 246.4 810.1 849.1 885.2 444.4 678.4 648.8 762.2 gpreious leans for fixed assetsFunds from Troaswry to eost cost of - - - - 22.6 26.6 29.8 66.8 - - - 13.6 - - -Incroaod allowances for staff
TOtal 274.8 298.2 828.6 864.6 429.0 564.6 727.9 905.8 1,061.8 1,238.8 1,510.2 1,467.7 1,619.1 1,782.0 1,974.9
Prof it/Loss (88.2) (100.0) (180.6) (I16.1) (189.6) (252.8) (869.1) (498.8) (625.9) (768.4) (987.2) (984.6)(1,118.5)(1,276.6)(1,6.8).
/a Inclusive of the aeount capitalized and spent to miateal.
Source : Sri Lanka Railsays
Ii

-63-
Table 10
SRI LANKA
TRANSPORT SECTOR MEMORANDUM
Table 10 PORT AND AIMPORT UTIUIZATION_e_____- ~~(108)
Performance Colosbo Gallo .Trrcomloe Jaffna KetunayekeMeasure Unit Port Port Port Port Alrport
Utilization Moosurp
i Ship Cells/Alecraft Lending 1000 2,858 * 88 o 29B o n.e.2 Dry Froight Loaded (Local) 1000 tons 1, 0o6 *o 2g8 Dry Freight Unloaded (Loeal) 1000 tons 8,151 174 s674 Wet Frelght Loadd 1000 tons 240 0 0 03 Wot Freight Unloadod 1000 tone 1,611 0 0 06 Containers Loaded (Local) 1000 TEU'o 80 0 0 07 Contoiners Unloaded (Local) 1000 TEU's 814 0 0 0* Contelnere Loaded (Trans.) 1000 tono 2,65 0 0 0o Containers Unloaded (Trons.) 1000 tone 2,018 0 0 010 Poeenogero In 1000 SOS11 Paosenge r Out 1000 650
Financial Performence
12 Port/Airport Fees Re million 1705 6s 406 - 5918 Operating Cost. Re million 1602 67 842 - 20414 Operating Proflt/Loee Re mililon 208 11 so - 88
* 1SO figure.o0 Amount o ssallor then 500.

-64-
Table 11
SRI LANKA
TRANSPORT SECTOR MEMORANDUM___________________________
Table 11 PERFORMANCE OF CEYLON-------- SHIPPING CORPORATION
CeylonPerformance ShippingMeasure Unit Corp.,
1986
Size of Company
1 Domestic Ports Served number 42 Intern'l Ports Served number 513 Freighter Fleet number -4 Container Fleet nunmer 85 Passenger Fleet number -6 Employees number 1,611
Freight Transport Productivity
7 Domestic Freight tons/yr 51,9128 Intern'l Freight tons/yr 28,5559 Containers Handled TEU/yr 102,91010 Ship Productivity tkm/ship -11 Employee Product. tkmlempl. -
Passenger Transport Productivity
12 Domestic Passengers i/yr _13 Intern'l Passengers #/yr _14 Passenger Product. pkm/ship -
Financial Performance
15 Passenger Revenues 1988 US$ -16 Freight Revenues 1988 Rs. (mil) 3,78517 Unit Pass. Revenue US$/pkm -18 Unit Freight Revenue US$/tkm -19 Operating Costs 1988 Rs. (mil) 4,17520 Operating Profit/Loss 1988 Rs. (mil) -390

-65-
Table 12
SRI LANKA
TRANSPORT SECTOR MEMORANDUM
Table 12: FINANCIAL PERFORMANCE OF AIR LANKA-------- (1988-1989)
1988 1989 December '89(Projected in 1988)
Financial (Rs million)______________________
Gross revenue 4,190.3 5,144.3 4,800.0Expenditure 4,139.4 4,713.9Operating Profit 50.9 430.4Net Profit (Loss) (374.6) (128.4) 2.0
Operations:Tristars operated 4.0 4.0 5.0
(fr.Sept.'89)
Capacity offered 2,930.1 3,401.2Avail. seat kms (million) 366.7 466.2 390.0Avail. ton kms (million) 591.0 720.0 562.0
Passengers carried (thousand) 1,974.0 2,510.0Rev. pass kms (millions) 11,462.0 14,995.0 12,254.0Cargo carried (tons) 228.8 294.6 240.0Rev. tonne-kms (million) 62.4 661 622Overall load factor
Sources of Revenue__________________
Airline operations 3,563.1 4,836.2passenger rev. 3,037.8 4,089.6excess baggage 132.2 146.9cargo 344.7 511.3mail 26.2 38.6
nonscheduled svc 22.2 49.8
Ground handling 216.0 253.0Aircraft leasing 368.5 ---Duty free sales 42.8 55.2
Operating Profit (Loss) (50.9) 430.4_______________________
Airline operations (209.4) 268.9Ground handling 129.2 142.3Aircraft leasing 115.0 ---Duty free 16.1 19.2
Source: Air Lanka Ltd.

SRI LANKA
TRANSPORT SECTOR MEMORANDUM
Table 13: COMPARATIVE LAND TRANSPORT PERFORMANCE________ (1986)
Performance Bus System Small Large
Measure Unit Railways Public Private Autos Trucks Trucks
si-ze o0 bystem
1 Rail Network track-km 1454 - - - - -
2 Road Network km - 29,576 15,000 82,002 29,576 23661
3 Passenger Capacity seatslday 163,000 378,000 312,000 294,518 - -4 Freight Capacity tonslday 33,474 - - - 56,422 96,070
5 Employees number 26,000 50,806 25,000 - - -
Passenger Transport Shares
6 Commuter Passengers #Iyr('000) 59,495 232,030 255,828 53,545 - -7 Share of Commuters ? . 10? 39Z 432 9? - -8 Commuter pass-km nkm(million 1859.1 9260 9830 1413.2 - -9 Share of comm. pkm 8? 42Z 44Z 6? - -10 Intercity Passengers #/yr('000) 26,108 46,540 32,919 7,946 - -
11 Share of Intercity Z 23Z 42? 292 7? - -12 Intercity pass-km pkm(million 747 5200 4200 672 - -13 Share of inter. pkm 2 62 482 39? 62 - -
Freight Transport Shares
14 Intercity Freight tons/yr('00 413 - - - 714.9 1166.4
15 Share of Freight z 18Z - - - 31? 51?
16 Intercity ton-km tkm(million 75.36 - - - 95.26 155.6
17 Share of Intercity tkm Z 23? - - - 28? 49Z
Cost-Effectiveness Measures
18 Passenger Unit Revenues Rsjpkm .12 cts 0.16 0.20 - - -19 Freight Unit Revenues Rsltkm .94 cts - - - 3.63 3.59
20 Pass. Empl. Product.* pkmlempl. 109,000 - - - - -
21 Freight Empl. Product. tkm1empl. 22,787 - - -
22 Cost per Pass-km Rs .74 cts 0.381 0.249 2.459 - -23 Cost per ton-km Rs 1.94 cts - - - 1.623 1.465
* Rail employees were allocated between passenger and freight services usinga ratio of twice the employees per passenger than per ton of freight.
Source: Based on the data supplied by SLR and SLCTB, and the road survey 1986 (TSPC) andand OD survey of 1986 (TSPC).

SRI LANKA
PASSE 6EI OEMAND AND HOUSEHOLD INCOEta!(1974- 1905)
_4 7000
_7.~~~~ - - i
30 _~ -- -- 60,00 . , o- .. .. sus ~~~~~~~~~~~~~~~~ooo .00~~~~~~~~~~~~~~
sz Fo_ _Id__ _. -_ _ 2 .. _ e_ _ .............. . _ 754000_ _ _ _ _ __Pr _ ___
XI~~~~~~~~~~~~~~~~~~~~~~~~~~~~~~~~~~~~~~~~~~~~~~~~~~~~~I
*r .. eav i
4_ ,__ 5 . 0 _-- _ _C:- __ __ -. . _._ _ _ _
.r"" c .2 .4 __ _ _ 3 0
697e 6075 656 07?t 6oe0 070 90 9t" 0 10 m2 1eto am6 66.tCAI~~~~~~Source: TSPS, volume 1, p. 6-2.aI Il 1970 prices.
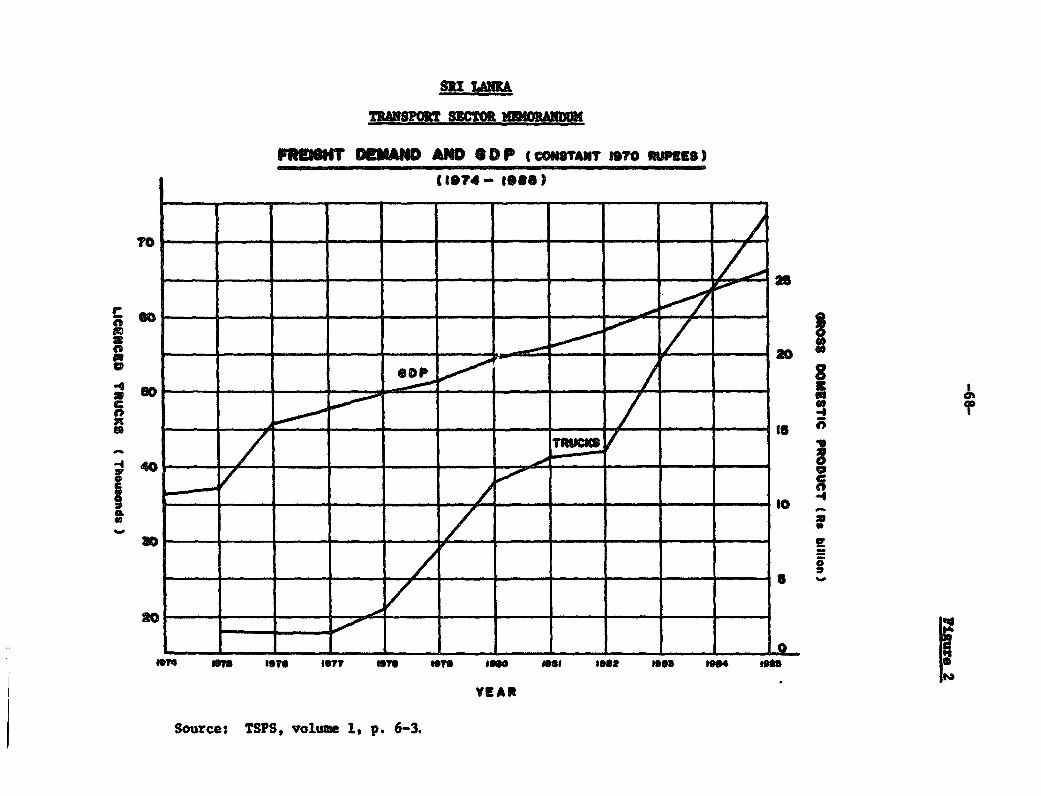
DEmA AND SDOP (cOOSANT T*7o mPEs)(174- 1006)
-- -- l-----r- -X11rS
- - -. ---- - a s
r
so ~ ~ ~ ~ ~ ~ ~-s
20 DP
400
o4 0o lew t
-4~~~~~~~~~~~~~~~~-0
0
YE AR
Source: TSPS, volume 1, p. 6-3.
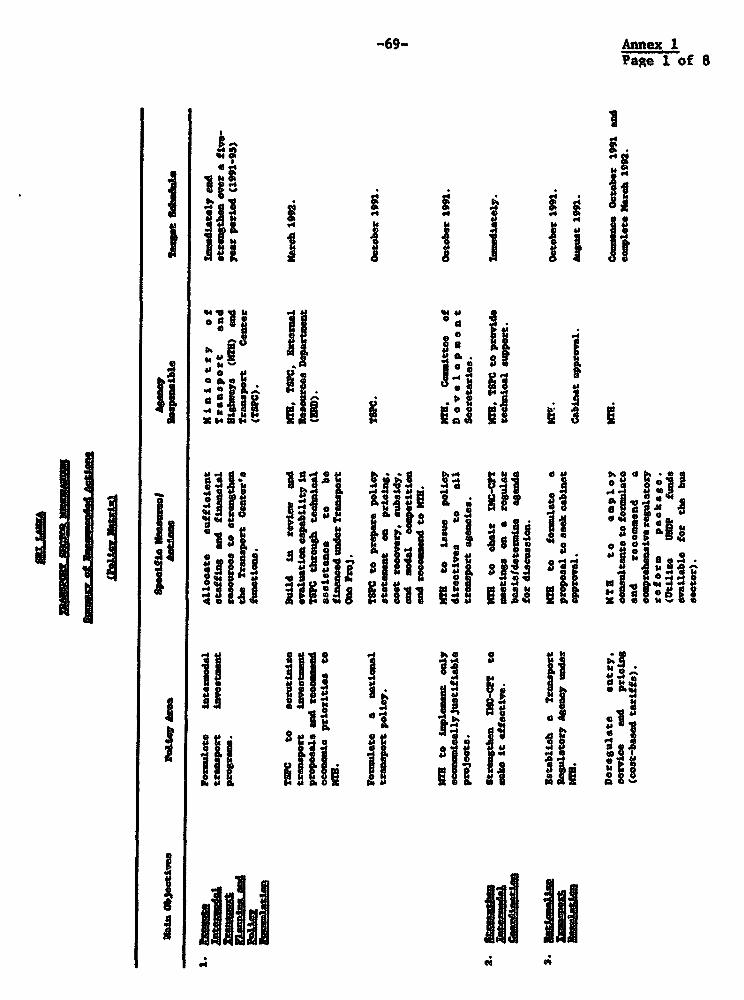
-69- Annex 1Page 1 of 8
o~~~~~~~~~~~~~
lIi I 1X ii liii]1
10.4 ~04~ a
at ~~~~~~~~~~t

- - --- --ubs.Ik. vae.af -,m'a - Atw ho tim - Tat -I
8_trm _ ie.Troses (e.g. ha 1ico, m. Ja 19.of safety and p*trol rotile) to do
onu.llyi seurd Traffica floll. curosulitiou (e.G.,0 adequate laapetioaamnu .) 1t..
sntLmamZSe prSAes3.3 1 .-Aes lows boU
4. --- omsltmoy of aryec UctabLiab cxit""i for 31*. PZaaiAag MAn Jauar 19o2.date. ca_ital, _ecurrent P . a_ 1 L a
_ Pesct. Lo.
sn*ai_ atu" Paula Csopil. aetual mua. l1mimg am& Bn t iA y im2._selt_aa £unad by w mit,uS an an P 0 1 1 0 7
ert mis aummi bees. .
_avoat Pror
5.n
(a) Sties gtho a Pzqiezs balgoto fer lastitoto a as tas of 3M (Clas A * I T9ate. e-plasa l I n g _peri ai.. I ooapile traffic moeds). piooe").cqabllitlca. - rlth. _ s_ts , rod ocmltion
based -a easoma Ar, dat cos estImats and PCs (eta"s C. 3 med Ccomm to Juas 19perinitle. dioel operatin costs 3 sed1). (eatlmm pe_e.).
(Cs) to be niatodmauy.
AlU e aduatf_ is &a. O 3, laoerpotte 1udLagmi btsff roPC_. rquZmtO In deo 1992nludin training to budgt.arzyout thds mak.
Engross cat eccmmtig Coia accurate data ca 3a. Flusms, ID, egsa In Jmry 1M99.an actal eammditur... actual e.peudlbtu sC.
mu aomul basis.
(b) 3md S . Pre Ve a re Identify sapoelty am. Cinema. adawispatI ccnatzanto mi read by Decmr 1992.9
U.1 *e F¢@. a n e~ by:199. 19asiutatocm stratagy. sectian. With hubh WoOsSad preae a cor*I am= t l.bwl

_aalfia l_ma. I isy~~In ~~Je.tives ftU~~~ Am ~ActSin Responsibe SMD cb
RDA to celleot and 33. Commas, imediatelywdao all essnial (CetIMs pvO&.s- 1.data needed to car oteconomie ua lyiseto th in theTrspot DOt Banh.
xa I * e t e Adpt a pavemet 3M Cuith ADS, nDA). Aetims hae b_ ta_e to_1qw0hawive blabow donessmoft sysam- prquarati of thesoater ependituse paen n s"tom
p _ovemSz_ bsd oneeonomic returns T t of the(Inoerporating a sIn ino systempavemt eeat 199).
Adept a ap_om to Stremlin buftsta1 RD, ia. FLme. PreIare plaw by Sarwy8 apprv5l b_e £aa0, procdures. 1992. ?qploMMStatic toon the eonomic be in am-192.
priorities.
PIkor&ty attentio to Aflmat adequate fan" Ki. Plm.. Policy 1_oorpo in therehabilitation over to fiance the hth PlansLu$g Bad 1992-195 DIP.itQr,,q,mnt or prlorty progre. Imple-mntsceustruaim. ties.
Monitor eupAItUr and l3M. pare suiA"2=8 bystregthe the sytem of ji9y 19;2.a wl_mnt Snaacoultability. duly 192.
(o) } rSpied oslo eMM A. a rationa Rie rleulatiown for mliCO. Prpar draft 1ei1u8ticonfigurat ion r use poliosf traflfc vehcl Weights, asle by Jam 1991.ef trCD. lmdVehicleregulatisn. loads and aslecefluati.
Enfore load limits. R D A I T r a £51te al_ Ji y 192.Policto:.
Conduct periodi axle RITwSPC. C a natimwieload surv to "aes survey pragrImIen 3M roaesroad danage and by d-1991 and oI-establish pavement auch smny rgulaLY. r49aW peane s. f i
sestracta wand Ur -1bplog eouulten" 8TPCIR". Come. by JSnry 1991,cmxselu bood an eatud3 to e mmm, road (ondor goas" IX). Wuser chre study. 0'I_
-C0loo study TCI3MAW. Oeambr 1991. Ce
recocmatios.

-~~ ~ ~ - A nI -,MM& 4bjeseiwoa reilor ARMa MUiiMS RSSPmS*M* leasf Imahi
-Discuss finig ZDAIMlN&t. Juasy 1£92.With IA. llamas.
-pl_t I iA. inaaeflt. J _me *9y 1S3.ro-tlomai".
() 1N_I ode=Uw go" Mopt cost-effeceiwe Abandon $and-oel AMOWS. lmmdatoly.malate aese mainenece Operations methods on high trafficmetbods. ed pactices. lum roed..
Establish cents to iDA. COMm In 199.produce ageregtes for M. ComAe to 19M.reed Ws.
(.) D_uslop loal Proneote condus en1 1 Complete 100c. RDA/i. Chopiete stud in JeconetIucttiO cempotitive bustnes centrctin indusry 1 992 . Prepare-nd stry. renvizomt. study and implement Iolemunal plea byr _esmndatioa. Jaua 199l .
(f) Formlate a Raw" controls an Esotablsh resulatovy Ni U. Cab Inet Prepaer lsislatio by sid-regulatory pricing, with Maa euthotity. approl 1991. 1stabllh amrltyr * 6 I m e regulation of service by ad-IfS.contuoLie to entry.effictenc. Derlate faes an Cabinet approval. eber 991 or bu.
tarliff. Decmbet 1992 fr ran.
Revise reg"latios to iTS. Cabinetaccord the Covem -ppr.oly the reserve per.en entry.
Strengthen safety provide patrol whieles, Traffie Pollcc n. Implemet by Janur 1992.regulation suffelent staff. Internal Security.
tS) 6taatb_n ro&A Ser.rthre mangral Contract administatn MDA. Com_ma stad to JAMaryed intretica. and lplementt ion study to begin under 1992.capacity of RDA. Roads II with formula-
tion of action pla.
Modify RDA poliey on Agre on frameork end RD. ImSeiately.construotionsupervision procedures to bearrangements. followed.
Strengthen maintenance Provide technical RD/PC.. CineMa.O In January 1992.capabillty of PCs and "ssitanc to Cs (by muniipalities. MA and consultants).
Assess !IA nee of I n. L o c a l Prepare a training prephmOuelpalities. G o ve r a a * a et by ed-i991.
Provincial Counciland MA.
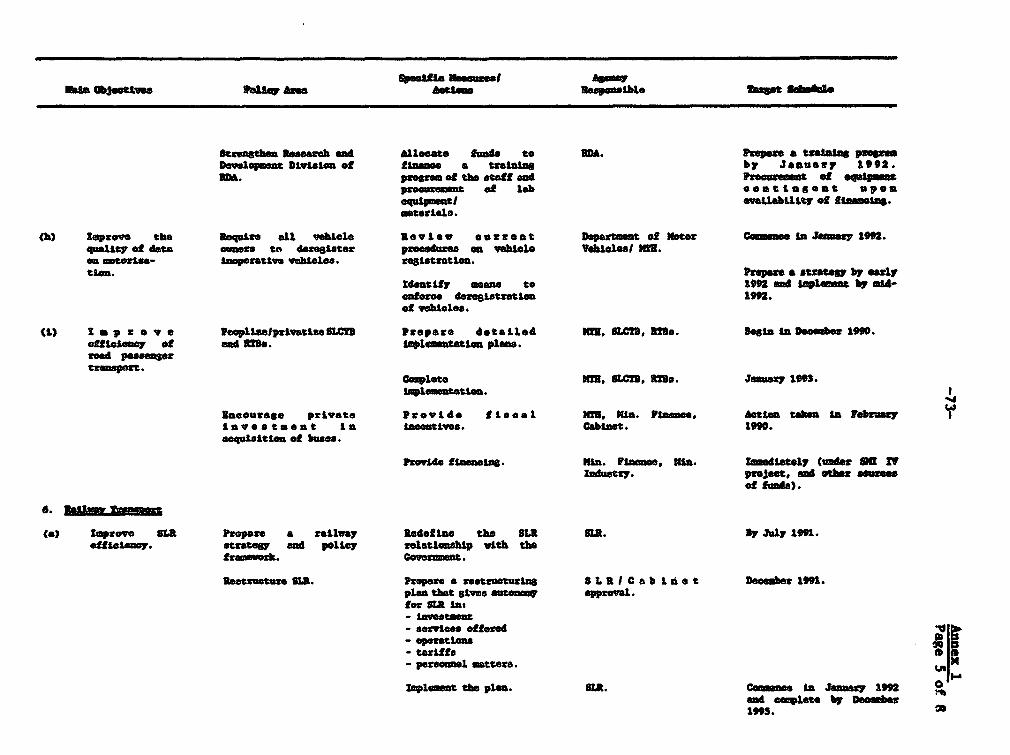
-~~ u ggkla Obj.etvwe hiw ARM Autim Responalble Inset ad1d
Strosthn Reseearzh end Alleafte fusd to RD. pesa a traln aDewle t DUlb. of Lamas. a training by January 1992.FMA. prosrus of the stafg and Ae,urmut of .qul_es
proelmint of lab en tIaaeat upeoequimtl e vaLabLIty of LlSas.materials.
(hb) pIprove the Reqi all. while Review eurrent Deart of motor Cam_ne ft Jaary 1S92.qality ef data mers to daeiseter oeodae M vahiele Vdaoleul iM.en notorisa- inperative vehicles. geistratles.t'-. strategy by "arly
Idantify mea to 19 e lePlmnt by mid-enforce deetrati 1992.of vehles.
Ci) I a p r o v e PeopliuelpalvatiseSUM Prepore detailed R, SLC, ass. .. Segls In e embar 1990.oUffIieCY Of 1ad 8228. leMmttlevn plan.rto pas.spstrnport.
Comte"llK, ELCUS, RUS. Ja as 199t.lplientati.I
Eneourage private Provide tls-al MR, mm. Plasm, Act_ take In rabmaInvestmsent In IAetiv. Cabnet. 1990.acqusitiai of buses.
Provide flneni. mlin. Finlnc, 11a. Imdiately (_r an IvIndustry. poecat, a ethe sees
ef fus).
6.
(a) Iprove LI Prepare a railway Redefine the SLR SIR. y Ju1y 1991.e£fficency. strategy and polcy relatLonshp vith the
fra mawek. CovegMnt.
estmnutue SU. prepr a restrueturins SLaICabirtee Deeber 191.plan that gtivs sutenow appaval.for S&R Ins
-service offere- opferatin
- tarlffspe"ecm al tters. 0
zop1ot tbe pl". MR. ¢e_ma la Jam 1 92 ° ad eoepeta by Daamer1995. a

X ~- -_ Sa ejsstL~s ~ k~ fOtle , , ,, .1 .__
Ra6_Me As s upo Kim. vies. Commee prosressive
to sWa. redvsUm of ubsidies toSMR l 1991 otteast
letreoehmaon of SBi. C e in 1991 and
rodmisat staff. maplate by 1995.
Psr then DLUSt 5L . Octob 1991.
Plea to be agroe withLthe Goveramaet Cabi.t sppze. 1991.
(objottiws, tarets,strasGy to schiAuetosos., md uportimmtpla to support thBusiness Puna, linsudiagdo investumat prosmo).
improve eceutLn * C0moin acom SL-. J-nmry 1992 - Do_aer
£ same and oSting. .ycm. 1995.
- establsh ot amaxy 192 (coutln=
octers for prom).
diff_rat maaetlwitS sa
mter
- elwa up b0ln. cete by .in 1"92.
shet (e.g., writeoff Iresaobdulsdebt, oapitalieLnterest asequity),
- b recoJm 1992.
reselyablo up todetoe
- ompul atual Usgin Xmms 19.
expenditu an fiaamnml heas.
~~sd ii!.S*if folLay. Dai ofi a" M. ftU easo by ol -
eliminte or redieat topartloilr target Cabinet opproe. be 1991. SM
8.oups, Oerviam andPapt-
Xm

Obufio assmet a I-,Pown objeatvea Tatte Arm0 actSan 5apobl - _
(b) P ro a e t a Ceate conditlns la a 1992.Intermodal _1b8 te ww to W .eratie. to eqlott its C eautiVereams total dvantae so thattr*anspott traffic La carried bysystem coStB. Owld thicb is owt
appropriate in noactedcorridors.
Padertakoa maket study SUL Jainy 1992 to betoeapLove tha potenti" upaed mmilly. eg asand to aesean _o.capetili pesition ofsKa.
Coot-based prci prepare a pricl* m .w _ polecr. strtg witin a lb be d b
raNSIMI*C of 10tommdal I1. mR beginningettl in - y iin
7.~ ~ ~ ~ ~ ~ ~ ~ ~ ~~~~~~~~~~~~M7. ,em ;9nmn
((a) imprin. urban Prepare a poltey lUsialte establh wbe rty an s p o r t fruuork. effective cfo_r.itien Ur - te 1.nplaning. amngs responsible ed-1991.
aginole to carr ctpiing _ imst (_stem Pinmialmpregraning. cmil)
Prepare planning Data eoliectima adMd euiIs. 0 ns.guidels. lysis.
Improve accountlas l eco r d actua 1 =m IJ. otm in Nri 1992.syste£. _wedtuae it erred by
oNC.(b) Uth=e traffle give pdiority to low- 0 Preare A corpreaivC and c_lat
eangastim in cost -an of reducie traffic mnagement by Oo I33.metzo Coe, cnestie. cheon for Intre
d iprve CelUo, taking u 2transport - s P-5|;efficiency, Into mide_ation. X
Ineorporate metre seek stanning to ow4.mls. Timing depeads O transport plng i _ a pd _altf _B-udline with the o.un- de plas
of urban leoalauthorities.

qpoein nwm A- '.Oi. OJeatives Poli Area cio Reponsible Taxget d3.
(e) Toprove road Revise legislative Undertahe a %lack mpot COIIRDA. Cma Jany 1992and traffic fransuot and strengthen removal presr. (cntiuos proisce).safety. enforcement.
Conduct driver ?"ffl Pol". "M. cGom_no Jury 1992education, ponalLse (cnti,ues proce).violat@rs.
S. Ret ini
(a) po. pert- Aehievo intemodl Use SM-CPT &a a vehicle SDAIDCO-CPTU lMS. Continuos process.rail e port- coordination on to achieve modaliced Interface 1 watmet planning and coordination.to reduce costs opetelon. SLPAItISMPC.to the eooem. Plan to trasport ety Prepaxe a pla by December
containser" I d cut of 1991.pert by unit trais.
IpleM*ntatiAn(ieluded SLII.in Transport I Project). Cmsmoe In 1993.
(b) D e t e r mi n e Detezmlne In_stmts In Conduct ldependent SLPAISPC. Co a a soon asratiml port ports based on feaibiity stude o faninani Of the studies ISInvestnts. feasibility studies Callol Port and available.
(rat then credit ?rin)mleo Port.aalability).
mprove cost eccmtuig Compile actual SL?AITSPC. Begin n Janua 1992.system. expavAiturs by mier
category an an nmlba.
(o) l i I a I a a t e Improve effLicency of Revew the need to CSC. O_mace .remu support C6C. retruture CSC.to CSC.
Preae an sotio pla Cabint approval. Comple by arly 199.to non CIC fei ullyviable.
Implemnt the plan. Kid-1992.
9. D t
Printo donr Continu. donor Intitutonalise donor I"i D. Action alredy taken incoordinatio. coordiatin coordintion e r etine on 1969. Contne 1990 i
activiLtie. an oml b"is to onward.dlscuss investment 0priorities and need forinstitutional coleprovamate.

-77-
Annex 2Page 1 of 13
SRI LANKA
TRANSPORT SECTOR MHMORANDUM
Basic Data on Road User Charges
1. Motor Vehicle Imports. In Attachment 1, the c.i.f. value and numberof items imported for the motor vehicle sector are summarized for 1987 and 1988.The number for vehicles imported and recorded new registrations differs. Forexample, in 1987 and 1988, 17,300 import passenger cars were recorded by Customs,but 15,700 were newly registered for these two years. On the other hand, 16,600lorries, road tractors and other commercial and dual purpose vehicles wererecorded in 1987 and 1988 import statistics, but 25,200 units were newlyregistered in these two years. In the case of motorcycles, 61,800 imported unitswere reported in 1987-88; 56,800 were newly registered. Part of the differencemay be explained by lag time between import and sale, or the non-registration ofvehicles. The excess of commercial vehicle registrations over the recordednumber of imports may be partly accounted in import chassis and components, butthis may not explain all of the discrepancy.
2. Import Tariffs and Taxes. Rates for 1989-90 import duties, businessturnover taxes (BTT) and cess by category of item are summarized in Attachment 2.In January 1990, buses with seating capacity exceeding 25 persons were exemptedfrom the 102 import duty. In the case ot passenger cars, numerous changes havebeen made since 1986. The latest revisions shown in Attachment 2 were effectiveJuly 1989. In 1987, the first level tariff was reduced from 502 to 202 forpassenger cars of motor size less than 1,500cc, these being considered utilityvehicles. In 1988 this first level rate was again reduced to 102; however, inJuly 1989, the rate was increased back to 502. Passenger cars over 1,500cc areconsidered luxury cars and incur twice the duty rate on smaller c.i.f. valueincrements. As a further curb on the private car 'fleet, passenger car importsare also subject to non-tariff constraints. Imports and new purchases arerestricted through a system of means tests and import permits.
3. Annual License Fees. Annual license fees by vehicle and fuel type areshown in Attachment 3. Although fees for diesel-powered vehicles are twice thosefor petrol, this cost differential loses significance when apportioned overestimated annual vehicle kilometers. For example, in the case of cars andsmaller dual purpose vehicles, fuel cost differences between petrol and dieselcan amount to the order of 1 rupee/kilometer, but the registration feedifferentials between fuel types are in the order of one tenth of this. Annualcosts per thousand vehicle kilometers, both for Transport Sector Planning Centerand fuel-adjusted estimates of annual usage are shown in Attachment 4.
4. For the period 1984-87, motor traffic revenues increased at all atntnalrate of 8.62, but then declined by 282 from 1987 to 1988. This patterncorresponds with the growth and decline in new vehicle registrations, shtlwu forthe same periods in Table 3. While the decline was the steepest in NorthernProvince, all provinces experienced a decline in license fee revenue, includingColombo District, which accounts for a major share of registration revenue asshown in Attachment 5. Comparing Colombo District registrations against thenational estimate for 1988, Colombo accounted for 206,300

-78-
Anex 2Page 2 of 13
registrations or 42? of the total fleet estimate. This could imply that the 1988fleet total is overestimated and/or many vehicles outside Colombo avoid annuallicensing.
5. HI1y Sector Fuel Conomtionand Revenue. Fuel consumption for1984-19809 and the estimated chares consumed by road motor vehicles are shown inAttachment 6. The road use portion for auto diecsl li estimated to beapproximately 91? of total consumption, baeod on CPC and other (SLCTB Planning)estimates of off-highway diesel. A more detailed examination of bulk and retailsales of diesel is required, however, as this estimate may not exclude alloff-road use. Growth in the consumption of fuel hao been restrained in recentyeare, reflecting economic and domestic problems. Petrol consumption inereacedat an annual average rate of 7.31 between 1984 and 19880 diesel increased atelightly less than 18 annually. Consumption during the first half of the 19909is forecast by CPC to increase moderately at annual ratee of 6.1X for petrol and3.72 for auto diesel.
6. Crude oil and refined motor fuels incur a 452 import duty; inaddition, turnover taxes are levied at rates of 202 for petrol and St for diesel.A withholding tax of 1 is also levied with the dealers' turnover tax. Withf.o.b. crude prices in the order of $18/bbl and March 1990 posted prices of Rs20/litre for petrol and Rs !.61 litre for auto diesel, tax payments to theGovernment would be in the order of Rs 4 and 2.6/litre. Taking Government taxremittances and CPC net profit (loss) per litre, in March 1990 combined 1988transfer and tax paymernt by consumers, would be in the order of Re 12.4 (petrol)and 2.1/liter (diesel). Total and per litre yields based on 1988 import costsare shown in Attachment 7.
7. In the calculation of financial vs economic cost of fuel on a vehiclekilometer basis shown in Attachment 8, the difference between the Third Roadproject estimates of economic cost and posted sales price has been taken as thetotal yield. This approach treats CPC profits and Government tax revenuestogether as transfer payments from road users.
Revenues from Road Users vs Road Maintenance Expenditures
S. Estimated 1988 tax receipts from motor vehicles, including importduties, BTT and CPC transfers to the Government on fuel taxes amounted to aboutRe 4.2 billion. Comparing this estimate of tax receipts shown in Attachments 9and 10 with the theoretical yield on a vehicle-kilometer basis shown inAttachment 8 reveals a significant difference, even taking into account 1989/90increases in fuel prices anc import taxes on cars. This could mean thatestimates cf annual vehicle utilization are too high, consumption of items suchas spare parts and tires are over-estimated, or some vehicles or components arenot paying a full share.
9. The estimated 1988 vehicle tax receipts exceeded the 1986/89 RDA roadmaintenance budget (averaged for 1988/89 at Rs 1.2 billion),but would approachthe hypothetical, idealized maintenance and rehabilitation expenditures for the1996 A and B network. This sum of Rs 4.5 billion is comparable to themaintenance requirement (4.3 billion in 1990 Re) derived in the TSPS as part ofthe proposed TYMP. Since the TSPS, the gap between actual maintenance budgetallocations and the requirements to sustain the network has widened.

-.79-
Annez 2Page 3 of 13
Nsthodoloi, for Ketiutina Road Use Costs by Vehicle TS
10. The total estimated cost of road maintenance and rehabilitation hasbeen allocated to different vehicle types and comparod with their estimatedcontribution through taxee related to vehicle ownership and use. Roadexpenditures have been divided lnto categories of cost according to theirrelationship or variability with regard to traffic. The distribution of the TYMPcosat lemento by category is shown in Table A2.1 below.
A2.1 UWTITI C-AL 1996 TS ROADS NORM( AND COST CATZGORY ASIGIWIT(R0o00, 1990)
Routine Perlodic capacityItem Maintena.ce Maintenance imrovement Total
Share is 000 1 Share Rs 000 Share Rs 000 Rs 000
AC Upgrade 0.0X 0.0 74.6X 1,072.7 25.42 364.4 1,437.1AC Maintenance 6.11 39.8 93.91 616.7 0.01 0.0 656.5Semi grout A/B a/ 21.61 116.6 78.2X 424.4 0.01 0.0 543.0Paved/CDE b/ 19.01 170.4 81.02 725.1 0.01 0.0 895.5Earth/CDE b/ 45.91 27.8 54.11 32.7 0.01 0.0 60.5Bridges 100.01 30.6 0.02 0.0 0.01 0.0 30.6Emergency 100.01 90.5 0.01 0.0 0.01 0.0 90.5CapacityImprovement 0.01 0.0 0.01 0.0 100.01 3,043.3 3,043.3
TOTAL 7.1. 477.7 42.51 2,871.7 50.41 3,407.6 6,757.0
OI Road network class A/B roads./b Road network class C, D, and E roads.
Source: TSPS, Volume 4, Table 9-15, (inflated from 1987 to 1990 Rs by 1.645).
11. These categories consist of routine maintenance, periodicrepaving/pavement, rehabilitation, and capacity costs. Routine maintenance costswere considered to be independent of traffic volume and allocated equally amongusers on the basis of vehicle-kiLometers. Pavement costs were allocatedaccording to axle loadings of the vehicles and apportioned according to theequivalent standard axles (ESA) for heavier vehicles. Capacity costs wereallocated based on the equivalent passenger car units (PCU) represented by eachvehicle. Equivalencies in terms of axle loadings as contributing units ofpavement wear and damage and passenger car units as occupiers of roadway spacewere taken from the TSPS (Volume 4, Table 9-17), with ESAs for trucks adjustedto reflect axle load data developed for the Third Roads Project. In loth theTYMP and the hypothetical mid-90s maintenance program, no allowance is given forcosts of administration, police and safety or investment and capital value of thenetwork. Costs of congestion relief on more heavily trafficked portions of thenetwork are not included in the hypothetical program. The TYMP cost estimateexcludes capacity costs in 1991 but includes an element in 1996.

-80-Annex 2
SRI .A" Page 4 of 13Attachment 1
TRANSPORT SECTOR MEMORANDUM
MOTOR VEHICLE SECTOR IMPORTS - 1987-60
1087 1960Number CIf value Number CIF value
Code Item Re mliIon Re milIon
87.01.20 Road Tractors for semi trailers 1692 259.6 2202 267.6------------------------------------------------------------------ __---------__----------------------
87.02.00 Public Service type passenger vehicles 624 145 786 816
87.03.21822 Passenger cars: up to 1500ce 4019 974.1 8690 1827.9over 1500cc 828 67.8 848 164.4
------------------------------------------------------------------- __--------__---------------------
Sub-total passenger cars 4842 1081.4 9088 1492.8
87.04.21 Commercial vehicles (lorries A vans) 1126 144 1106 179.6
6704.22/28 GYW >6 tonnes67.04.80 Commercial vehicles 4U12 904.8 8877 777.987 .04.82.08
87.04.82.01 Tankers with stainless steel tanks 1 0.8 a 8.887.05.00 Special purpose motor vehicles 778 222 1647 489.9
crane lorries, fire trucks, mobile workshopsconcrete mix trucks, etc.
---------------------------------------------------------------- ___-----------__--------------------
Sub-total lorries 6716 1271.1 6038 1400.9
87.06.00 Chassis for 870287.07.00 Bodies incl cabs for 6708 8407 207.4 8286 208.167.07.40.01 Bus body kits for SLTB87.08.99.01 Chassis not fitted with engines for vehicloo GVW>1760 kgs.--------------------------------------------------------------- __------------__----------------------
Sub-totsl chessiw/bodies 6407 207.4 8286 208.1
87.08.00 Parts A accessories for 8701-8706 2497876 282.6 2.9E.09 808.1--------------------------------------------------------------- __------------__----------------------
87.11.20 Motorcycles 80846 262.6 80997 268.167.01.0487.00.0887.00.08----------------------------------------------------------- __----------------__----------------------
Sub-total motor vehicles 52528 8196.9 57286 8972
40.11 A&M Tyres for motor cars, buses, lorries 496047 170.8 662222 179.640.11.01 Tyres for motorcycles, scooters, etc. 71605 12.2 95492 16.6------------------------------------------------------------------ __---------__----------------------
Sub-total tyres 567652 188 677714 196.1
TOTAL 8662.7 4471.2
Source: Extroordinary Gazette of OSR of Sri Lanka, No. 6C4/7, June 80, 1989,and Sri Lnnks Customs Import Tariff Ouide, 1906; PresidentialTariff Commission, 190.

-81- 13ex 2F&Pe 5 of 13
SaI IAKA Attachment 2
TRANSPORT SECTOR I0RANDU
DMTY, CESS TRNVER UK RATES ON VEHICLIS, HACM 1990
Outy on 'rue" ever 058Code it.. CSP Voluv tax
87.01.20 Read Tractor fer seal tai ler 3 .06 12.5r07.02.00 Pibtl Service tbP D _eeenor vebicle
*"titt capacity 10-1 mIal driver 35.06 1.85i1-24 tacl driver iS.016 12.8)44 10.05 12.35
Noteo As of January. 10, now pibile orvice bus. with satingcapaeity e. eedwia 25 paa.eonera can be iqa@rted duty fret (with p1 Abioer-lce certifleaSe created by the Ministry of Tramaort)
07.0ti21 IPa ear care: up to 1D00ee (disal/Peptrol)CIP Vlve up to Re i 0.000 80.81 20.06 10.0lNext R. 100.00 (150,000-280.000) 78.06 20.01 10.0INeot Re 100,000 (28000-0040000) 100.06 20.0X 10.06Sacee. over Re 380,000O0,000 200.06 0.06 10.06
00 10.06 20.06t7.03.22 Piaeener Care: 1000-I800cc
CIP VIVO up to Re 180,000 80.86 2D.0O 10.0OMest Re 100.00 (180,000-2M0.000) 78.06 20.06i 10.06Next Re 100,000 (2,000-880.00O0) 100.06 20.06 10.0OEbce. over Re 50,000)810,.000 200.06t 20.06 10.06
Om 10.0 20.0607.06.28 Pseoenger Care: 1800-3000 at
CIP vivoe up to Re 00,000 100.06 20.061 10.06Nlext Re 40.00 (00.000-120.000) 180.06 20.061 10.06bnces. over Rs 12.000)120.000 200.061 20.06 10.061
OD 8.006 0.06 10.0687.06.24 Peoseener Cars: over 3t O cc
CIF vita up to Re e0,000 100.06 20.06 10.06Neat Re 40.00 (0,.000-120,000) 18O.061 20.06 10.06
Esceap over Re 120.000)120,000 200.06 20.061 10.0600 80.06 20.06 to.O6
87.04.21 C4 mecial vehicle. (lorries a VeD") (diecl)
oW 170-2800 kgu e W80 IO.112.OW U280 boo. 12.06 12.86it
0704.22/25 OW 15 tne.r 15.05 12.5i87.04.J0 Ceercial vehicles (petrol)
2800 ika 35.06 12.86)am00 ikg. 18.06 12.56
07.04.62.0 0W> S te. 1.06 1.55107.04.62.01 Tankrer with etelale.* eatel teak. 8.O6 12.8107.05.00 specil Pureeas mtor vehiclee
(erene torrne., fire trucks, embliewerkdce. concrete six tracks, ete) 28.0 12.55i
07.06.00 Clhasis for M702 1.06 11.311(7.5 for Owagkck Are_eset countries)
07.07.00 BOdile. mrct cob, for 703 8.6Oi 12U.65 10.0607.07.40.01 Ban body kite for ST9 8.06 M.2S.
07.00.00 Parta * eceeorltee 07014705 45.06 12.85t67.00.09.01 Cheie not fited wit*h eaoinee for vaehicle 0 5.06i 12.6507.09.00 Weak1 truak,. forklift o4 pert. 8.06 12.tti07.11.20 Nietorcyclo07.01/.0 )>200 cc fre. fre87.00.06 )>200)2S0 cc Ca00 0.o0 t2.5507.00.00 )200,280 cc 20.06 12.55e7.U.20 Other 00 10.06 12.65t
Other 20.06 12.6507.14.00 ttetorcyclo Perte 5.0t S.Oi07.u.00 Tr & ceal-traller, for tr"aneort f goeecd
OW(10.000 kgo 80.06 8.0osOther 8.0 5.061
40.11 AS Tyre, for aewr care. bvre. lorries SO.0i 10.0 10.0640.11.01 Tyr" for atorcyele, cotere. etc. e0.0o 10.06 10.06
Petroieua £ peeroleum product.
27.10.00.02 refined erodeta, eMtr apineta 45.06 20.06
Swr..: litreordtlary Got%et of OR of Sri Leanka, No.804/7. ao e 1909, A Sri Lak.Cuat.. lPert Taiff Guide. 1907; end Pre.ldentlal Tariff Caisale"o. 1o0.

-82-
Annex 2SRI LANA Page 6 of 13
Attachbent 3TRANSPORT SECTOR MEMORANDUM
ANNUAL LICENSE FEU POF MWOT ENCL, 1"?
V *hlel Type Unloudr/@rose vehicle welght Fee (Re) by type of fuel.......... .......... sa a on a....c
Petrol Diesel
Car, ambulance heareo, orjeep, ether private pese veh <0 kg t230 800
)?OIkg(1016 kg. 1000>soa hs(W kg 1000 2000>1270 kg. 100 8000
Lorry, Incl. troller (2000 kg 800 S00)20kg <3000 kgo S00 12080000 0 OCO@ 1 kg 1000 000
318000 kg (20000 kg 2000 4000210000 kg (2s00 hge a3m0 g300
320000 <80000 kg 8000 G000380000 kg. 8500 7000
Duel purpose veh. (1000 kg ag0 0(goods and passengers, >1000 kgo (130 kg. g0 730not oxcoeding 0 passengers) >130 kg (2000 khg 1000 1800
32000 kgo (2500 kg 1500 2250>2600 kg. (8000 kgo 2000 8000>8000 kg. (8500 kg a20 8750>3500 kgp (4000 kg 8000 4500)4000 kg 8500 5250
Public Poo.nger Vahicle Foe/"ssn r ostSLCTS/RTB reBuses other then SLCTS/RT9 60 (mInimum feo of Re 1200)
Motor cycles, motor trlcycle", 200
Sources: overnment Notice Department of Motor Traffic; Annual Licence Fesfor Motor Vehicles (Section 81) (1067)

-83-
Annex 2a g7 jTof 13
Attachment 4
SRI LANK
TRASPORT- SECTORIEOAU
AINUAL LICENSE FEE COST/1000 VEH-KM
.h.bk/yt ""U*lf F-0/.00 veh.kg 6v11.1,1 Ammata F,,/000 v.h-hl
Vd.cle tpg. Ihalsden/Ormvehicle Do;pt (@0adj) 1/ (mdi. *o syr bo ie) (°) 2/ 'LI 2/Potfol Diese_ Pltrol D
Cor. amulance.. Imree. orJo". other privet0 P0 web (62 kg 9.25 27.0 8d.1 t2 20.8 41 7
742 he <06 kg 9.25 54.1 106l. 12 41.7 8 3
>IO016 k1*m kg. 9.25 106.1 216.2 12 83.3 166.7317 kg.s 0.25 162.2 624.8 12 12.0 250
Loery. inol. ;lior (2000 15 is 20.0 40.0 25 12.0 24 01AXID loffu& Ikg. 15 40.0 80.0 25 24.0 480)SO OkS(lwOOO hg 21.1 47 4 94.0 40 25.0 500 3,10000 koa8cm has 21.1 71.1 142.2 40 87.6 75.0).I:N 119000M hks 26.8 76.0 112.1 so 40.0 80 0
80000 h 00kfaim k. 26.80 9 5.1 190.1 s0 80.0 100.0>25000 lk4O800 1kg 81.4 94.9 18.9 so 50.0 1000 :806 kg. 81.6 110.8 221.5 s0 50.3 116 7
&*I purge" web. (100 k. 15 16.7 98.8 25 10.0 20 0(goad NDW 904agore. _ ,1000 k908<110 kgs 1s 83.3 80.0 26 20.0 30 0got e.d;re 9 Pbeo.r.M ) 1001 ki0001U 68.7 66.7 25 40.0 52 0
)2000 kg.4*W kog 19 t7.9 118.4 25 60.0 90.0qU00 lo(d00 kig 19 106.8 1n.9 25 60.0 120.0
m000 kh<(S00 kg. 19 l8.6 197.4 25 100.0 1S0 0MM kg"4000 kg 19 157.9 28360 30 100.0 150.0
eg. 19 184.2 276.s 40 07.5 131.3
Public Puamenr Vehici@ILThIWT
age" other wtan 61717 42 71.4 80 87.5
IbOeryel... "*or, tuicycles we"n I o 6 9 22.2 0.0
Source: Government Notice, Department of Mcotr Traffic
1/ Annual veh-km's adjusted downwards from TSPC detimate to correspond withfuel consumption estimate.
2/ Estimates made under the Third Roads. Project, Feasibillty Study

-84-
Am"x Pose 8 of 13Attachment 5
SRI IANKA
TRANSPORT SECTOR MEMORANDUM
DEPARTMENT OF MOTOR TRAFFIC REVENUES, 1984-88(Rs Millions)
Annual Turnover Other Total TotalYear Licence Fees Tax Revenue Revenue Revenue
(Current Rs) a199O is)
1984.0 140.2 8.6 83.3 232.1 390.81985.0 149.3 9.8 95.7 254.8 356.41986.0 231.1 11.5 98.0 340.6 473.51987.0 279.2 11.6 90.9 381.7 500.61988.0 217.9 14.3 96.8 329.0 399.5
Percent chglyrt 1984-87 18.0x 8.6?Percent chglyr: 1984-88 9.1? 0.61
Source: Department of Motor Traffic, Colombo, 1990

-85-
Annex 2Page 9 of 13
SRI Attachment 6
TRANSPORT SECTOR MEMORANPW
CPC Annual Sales, 1984 -1980
Petrol Auto Diesel Olesel-Rd Use (2)
YEAR (OOOn.Tons) (Mill Litre.) (OOOU.Tons) (MlII Litres) (MlI Litres)
1984 119.0 168.4 481.0 568.5 516.71o8s 122.0 160.8 488.0 676.8 523.21986 180.0 170.8 487.0 676.6 622.11987 140.0 184.0 498.0 586.8 581.71988 158.0 207.6 499.0 689.8 586.01989 172.0 228.0 479.0 66.2 513.5
Source: Cey lwon Petroleum Corporation1) Actual & projected sales, CPC Corporeot Plan, 1990; 1990-94
pre,. :routh applied 1995,98.2) Roa use portion based on CPC and SLCTB Planning Department
estimates (90.71 of total consumption).

SRI
TRANSPORT SECTOR NODUII
EZEMNTED 1988 VEHICLE FLEET ESTATE 1/
vab am A4. Nasa. %am ho A& Roko 60 sd 6Wm lea cm.Iuia aw ma MC am musm 30 Ral AinWmsV §~I-momol -IWtO_ tt-s
m 1_ letmANmmie Slam fi,l lb i@ goo0iotalR1e1"o6m- logS R1006kwt loSeS SlsIoOOlau lega arOOk lFotal AaIOOb lowe m "hho lowisUmaw Cy 60 13.* Me*0 50164 196. St6 466 46.6 n 122 6 660 222 346 16655 Onae 051Cu 9.5 1428 suit 05A MCI1. 1405 154 5640 463.0 14606 a 049 401 SI 2966 * 56120 361FMIsu-id so-& 6.2 6s1. 5290 as'.s 2 15.0 6600 391 #9N60 6304 6500 90 '555 216 30opiclp-po 60.5 t4y 20.5 6420 161.0 flat Got 161.0 s561 U5S0 a S1I 240 60 1621 568 5ta #P.Sapdos 132 #se 2224 3066 60o 2126 472 56s0 122t5 550 a 230 400 lOt 1612t 5120 35%lobso.-po s2.0 9 2.1 655 "we 151 4 $621 135 US* 432 4640n 30 0o0 42 2646 2510 *a WIlalmbo 21.1 5. 10 16e 61.1 662.1 12.1 S6e.0 40.4 4640 56.2 2000 t1o 262 ti660s 0d0t. $1.6 u.5 465 4635 352"2 4300 229.5 456.0 2M6 a 0 530 460 251 1641 M00 6 amLgbo 42 t 15.1 Ss6 654S 460.5 4540 2560 4410 2432 go6 1120 24 4 13 10311 son 95% -1u44.41 2at1 69 55O0 450 154.1 326.0 1661 4140 1413 3300 120S 300 toI 1450 59o so0% fhUg11 IO ti 15. 5 264.32 So *so5a 4200 119.4 4460 1213 3510 0s5 9 00o 14a low 5123 463%o 125 263 10.6 2169 6660 246.a 4032 162.5 4215 6lot1 a100 0 600 681 20291 56o2 511%]M* 6I SI 54 t0y4 9s51 1629 611.6 66" 16.O s6t 5452 56 a 150 of 250 21s a * 2Gluw* DI 216 5.4 1014 l0660 116.1 94t0 OtO l0600 110.0 1412 802 500 S4 3992 4M06 SI Sam -$.6 1.1 #4.1 1291.2 451 106 3 20s9 122.4 424 a06a 311 120 25 4*49 s a ato *4ftlOSe 495.4 560.46 4140.2 1409.9 2041.5 Ss2".? 221.5 19648.4 100.63%
love: ooad wor tax ratoes bood o difoteraco b _t... 19900 fi;c;il sod cco_ic vob .cle operoting coot doerved froe tsb Third Road Project.AmamI vehicle Sue edjusted downward from 1br4 Road Project estimate to corrooped with (PC tvol conaaoptioo.1/ Estimated based on the tax rates in effect as of March 1990.
:0
01.'
etCD.

Annex 2Page 12 of 13Attachment 9
SRI LANKA
TRANSPORT SECTOR MEMORANDUM
ESTIMATED REVENUES FROM MOTOR VEHICLE SECTOR, 1988
Revenues X(Re mill) share
Vehicles & components (tariff code #87) 1017.2of which motor veh. est. (1) 901.1 21.42Tyres (Code 140.11) (2) 89.9 2.12
Subtotal s Import duty rev. 991.0 23.52
Turnover tax, veh & comp. (BTT) 688.2 16.32Licence Taxes, vehicles (3) 217.9 5.22Tax on saleltransfer of veh. (3) 14.3 0.32Fees - Motor Traffic Act (3) 96.8 2.32
o.O0Fuel Tax Remittance to Gen'l Rev. (4) 2205.2 52.32
Total Revenues 4213.4 100.OZ
Notes: (1) Customs value and quantity of imports, 1988, Tariff code 87;(approx 872 of category)
(2) Tariff code 40.11(3) Actual receipts for 198e, "Estimates, 1990, Receipts
of DSR of SL, Abstract All(4) CPC contributions to Exchequer, 1988; alloc. by refinery
cost share and yield;CPC total tax, duty + BTT + Rs 4947 million with Rs 2205 millionattributable to road sector for diesel, 598 million litres consumedin transport of which 90.72 in hwy portion as estimated by CPC, alsocomparison with estimate by Planning Department, SLCTB.
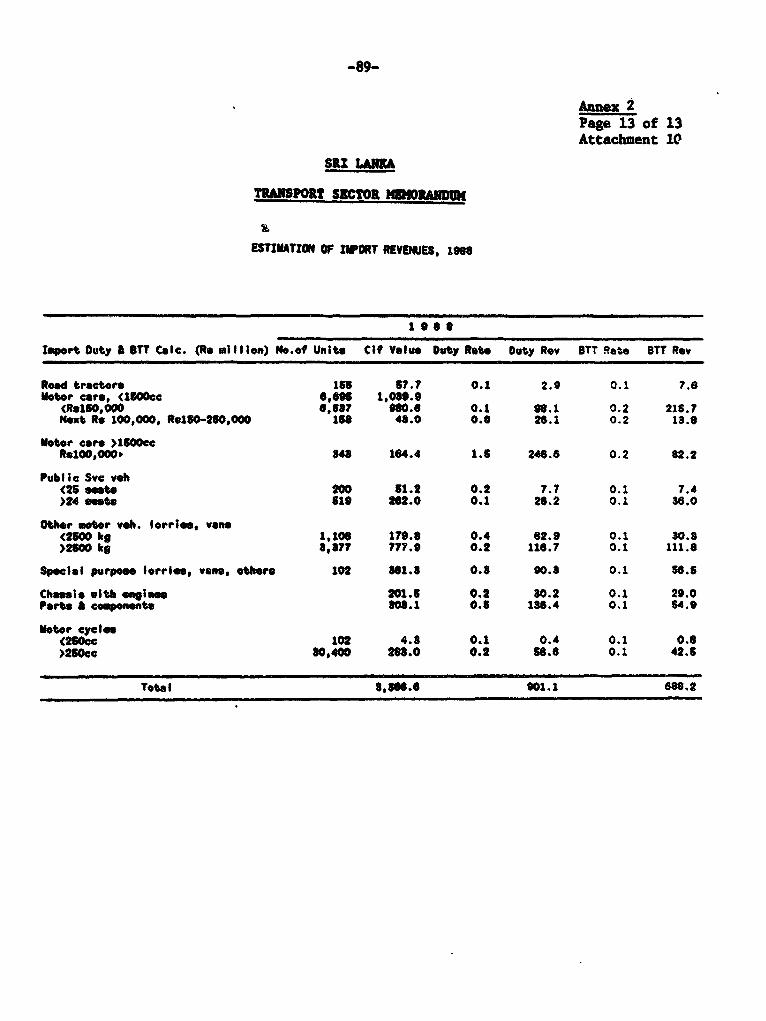
-89-
Annex 2Page 13 of 13Attachment 10
SRI LANA
TRANSPORT SiCHTOR HDO
ESTIMATION O WORt REVEIIES, 1918
I 96s0
Import Douty A Sy CalO. (RS e llion) HO.Of UnIto Cif Value Duty Rate Duty Rev OTT Rate BTT Rev
Road tractors log 67.7 0.1 2.9 0.1 7.6Motor cars, (1500< c 0,60 1,080.0
(RsS160000 0,587 900.0 0.1 96.1 0.2 21S.7Next Rn 100,000, Rs15250,000 150 48.0 0.0 26.1 0.2 13.0
Motor care >1600ccR1lO0,000. 848 164.4 1.6 246.6 0.2 82.2
Publ ic Svc veh(25 sete 200 51.2 0.2 7.7 0.1 7.4)24 ote s1i 22.0 0.1 20.2 0.1 36.0
Other motor v.h. lorries, van*(250 kg 1,106 170.0 0.4 82.9 0.1 30.S>2500 kg 8,877 7T.0 0.2 116.7 0.1 111.8
Special purpose lorrlee, vane, othero 102 8O1.8 0.8 90.3 0.1 56.6
Chas with engine 201.6 0.2 30.2 0.1 29.0Partes components 808.1 0.5 138.4 0.1 U4.9
moter cycles<250cc 102 4.8 0.1 0.4 0.1 0.6>250cc 80,400 28M.0 0.2 56.6 0.1 42.6
Totel J ,0.0 901.1 686.2

-90-
AJSe 3Page 1 of 11
SRI LAIKA
TRANSPORT SECTOR MDRADM
Strategies to Increase Effectiveness of Road Maintenance
1. Management of road maintenance planning and execution of works has notbeen effective for three main reasons. First, no planning criteri.i (such as up-to-date information on road inventory, condition, traffic volumes and axleloadings) are applied to define types of periodic and routine maintenance worksneeded on particular sections of road and to determine annual priorities. RDA'smaintenance program is a list of types of maintenance work proposed to beundertaken and their estimated costs without any supporting data. Second,maintenance practices are outdated and ineffective. Third, funds for maintenancework are inadequate.
Optimization of Available Resources
2. The first order of priority is the adoption of a pavement managementsystem as a planning tool. To accomplish this, the planning sector must annuallyassemble data on road conditions, traffic, and pavement distress and evaluatedifferent options for surface treatment to determine the most appropriatecategory of maintenance work. A conceptual framework expressed in the followingdiagrams
- - =tIRI, SDI
7 M - minimum routine maintenance (no/ R / / surface patching)
R - full routine maintenanceP - periodic maintenanceB - betterment
/ / B SDI - surface distress indexIRI - international roughness indexADT - average daily traffic,
ADT vehicles per day
The above diagram indicates different levels of surface treatment that would beappropriate for different combinations of pavement distress, surface roughness,and traffic volume. In times of budget constraints, the dividing lines would beshifted to the right, i.e., undertake less of the most expensive treatments(betterment) and more of the least expensive. These options could be furtherrefined to determine alternatives within each treatment class to prevent as much

-91-Amex 3Page 2 of 11
deterioration as possible while keeping vehicle operating costs to a minimumlevel (for instance, undertake less costly patching works and surface treatmentsfor periodic maintenance, instead of costly overlays). When funds becomeavailable, more substantive treatment could be accomplished. To determinedifferent types of maintenance and road improvement required, a road networkmatrix could be developed based on traffic and road condition data. Attachment 1shows the matrix development in Indonesia which could be adapted to Sri Lankaconditions.
Modernization of Maintenance TechniQues
3. Patching work is performed in the following ways:
(a) The pothole is roughly cleaned and its surface covered with a liberalapplication of bitumen. Hand broken stones of approximately 100-75mm are then packed into the hole and the surface voids are filled withsand. A second coat of bitumen is then applied. Such repairs seldomlast more than one year, and yet about 60? or more of funds allocatedto routine maintenance are spent on patching using this method. Amore effective method would be to properly clean and trim the potholebefore priming, apply patching material from asphalt mixing plants andcompact the surface with a ro'ller. Repairs made using this methodwould last at least until the next overall surface treatment iscarried out.
(b) The most commonly used form of surface treatment in periodicmaintenance is the application of sand seals. Tnis method producesvariable results; on some roads sand seals produce a sea of bitumenon the surface which is extremely slippery when wet, and on others theold surface is exposed as a result of an irregular application ofbitumen through labor-intensive methods. It is common to see potholesappearing quickly in areas where insufficient bitumen is applied.There are more effective surface treatments which can be adopted inSri Lanka. The most obvious is a proper surface dressing using stonechippings instead of sand. A double surface dressing is aparticularly effective way of arresting surface disintegration andsealing the surface to prevent water from entering and weakening thepavement.
(c) A thin surface treatment is applied to a pavement which is evidentlytoo weak to carry the current volume of traffic. In such doubtfulcases, it is best to arrange for a deflection survey to find out howweak the pavement is and what thickness of overlay is required. Inthe event that funds for such an overlay are not innwliatelyavailable, a single surface dressing may be applied to preventpavement disintegration until funds can be found for the requiredoverlay.
Restructure MDA's Road Program
4. There is a need to rationalize the classification of RDA's programwhich is rather confusing. For instance, under recurrent expenditurea there is

-92-Annex 3Page 3 of 11
a category called *repair and maintenance," while routine maintenance and repairto flood damages are listed under capital expenditures. Also, capitalexpenditures include items such as DBST (double bitumen surface treatment), sandsealing, and metalling and bitumen surfacing, all of which would be classifiedas periodic maintenance rather than under rehabilitation and improvements. A newclassification should be developed along the lines outlined in Attacbment 2 tobring clarity and consistency into the terminology, particularly into the variouscategories of maintenance and rehabilitation activities which are frequentlycombined in current projects. The definitions for various road activities havebeen developed to be compatible with various distinctions between capital andnon-capital expenditures, and to encourage a more flexible interpretation offinancing criteria.
5. In the Bank's terminology, routine maintenance is financed throughannual expenditures and resurfacing categories through a planned program.Resurfacing and rehabilitation works are an integral part of maintaining thephysical serviceability of a road network to meet current needs, and ofpreserving the infrastructural investment. Betterment, and reconstruction, likenew construction, enhance the functional and physical standards of the existingnetwork and thus clearly add to the capital stock; these works are typically partof long-range development programs.
6. Attachment 3-7 show the estimated hypothetical, idealized maintenanceand rehabilitation expenditure requirements.
Attachments:1. Network Matrix Used in Indonesia2. Classification of Road Haintenance
and Improvement Works for Paved Roads3. Highway Maintenance Expenditures-RDA Centralized Budget4. 1989 Road Maintenance Budget Estimates, Ministry of Transport & Highways5. Hyphotetical/Idealized Unit Costs and Quantities for Road Maintenance6. Network Maintenance Budget, 1996 (Hypothetical/Idealized Program)7. (a) Allocation of 1996 Hypothetical A & B Network Maintenance Costs by
Category(b) Allocation of 1996 Hypothetical A, B, C & D Network Maintenance
Costs by Category.

Wi-
"AWW* Ob,.ix ine t. lidn~I
(For posible adaptation to Sri Lankaa', Road)
tRAFFIC RAHOE tAALD/a
Esicmated SO0000 1,000 £ 0D 200R _wghnm DRI r >i0,000 - 10,000 - 3.000 - 1.000 - 500 <200
2,00Dm <4 Routine Mu ntenance Routine Maintenance Routine Maintenance Routine Maintenwnc Routine Mu intenance Routin- Maintenance
8,6o0 _ 4-6 mm waw _mm Is R lrnME-A IL 4-OM) (Aa L * MM) (AIIL * MRS) Routine Shintnance Routine nMIntenance Routine Ma ntenantce MA1NTDWEACE
5.000 . 6-8 U EM dm ao mI
(ATUL ATO + NS) (AtL ATO HR6) MO (ATOL WS) (ATM. + MO (ATE. ) Routine HRSntennce
10,000 - 6-12 (ATBL ATS + HRS) (ATiL + AT. + MS) (ATRL + AH1 * S3 ) (ATEL + AMS * B) (AXTL * NSM) Routine Maintenance
10.000 - over otruct n (Recenruction (t_cotrnct;on (RecCeIon (Reconstruction Reconstruction IEr17i4122 tote=a) with MotatWm) wibth oil,) *itb Mitx) VIth Dom) with DEST)
Averae annuaI daily tWfic.A1 Inteunetionl r_oughne ;index.AT9 leelling layer end HRS urace (80 uATB levelling * 40 a ATB. in Sur faci ng.Pavemnt reconetructien using cruhd rockbae and other eurfrce dreeing or MO surfacing/paving of gravel raeds.
I X

-94-
Annex 3Pap 5 of 11Attachment 2Page 1 of 2
SRI LAKA
TRANSPORT SECTOR MDORANDUJ
Classification of Road Maintenance andImProvement Works for Paved Road8
1. Routine Maintenance. Localized repairs (typically less than 150 m incontinuous length) of pavement and shoulder defects, and regular maintenance ofroad drainage, side slopes, verges and furniture. (Examplest pothole patching,reshaping side drains, repairing and cleaning culverts and drains, vegetationcontrol, dust control, erosion control, snow and sand removal from travelled way,repainting pavement stripes and markings, repairing or replacing traffic signs,guardrails, signals, lighting standards, etc., roadside cleaning, and taaintenanceof rest areas).
2. ResurfaciD4. Full-width resurfacing or treatment of the existingpavement or roadway (including of minor shape correction, surface patching orrestoration of skid resistance) to maintain surface characteristics andstructural integrity for continued serviceability. (Examplest slurry seals, fogseals, or enrichment treatments; surface treatments (chip seal); frictioncourses; thin asphalt surfacings typically 25 mm or less in thickness. The terms"preventive maintenance" and "periodic maintenance" had approximately synonymousmeaning in previous usage.
3. Rehabilitation. Full-width, full-length surfacing with selectivestrengthening and shape correction of existing pavement or roadway (includingrepair of ainor drainage structures) to restore the structural strength andintegrity required for continued serviceability. (Examples: asphalt concreteoverlays, selective deep patching and overlays, granular overlay and surfacing,surface treatment with major shape corrections, recycling of one or more pavementlayers. The term "strengthening" is sometimes used for a particular category ofrehabilitation works.
4. Bettenient (or Improvement). Geometric improvements related to width,curvature or gradient of roadway, pavement, shoulders, or structures, to enhancetraffic capacity, speed, or safety; and including associated 'rehabilitation' or'resurfacing' of the pavement.
5. Reconstruction. Full-width, full-length reconstruction of roadwaypavement and shoulders, mostly on existing alignment, including rehabilitationof all drainage structures generally to higher roadway, pavement, and geometricstandards.
6. New Construction. Full-width, full-length construction of a road on anew alignment, upgrading of a gravel or earth road to paved standard, andaddition of new lanes or carriageways to an existing road.
Sources Infrastructure Department, World Bank

-95- hMLPage 6 of I1
Attachment 2Maintenance Cateaories and Activities for Unpaved Roads Page 2 of 2
Mode Activity Effect
Routine Spot regravelling Fill potholes and sall depressions;Maintenance reduce roughness, exclude surface water.
Drainage and verge Control runoff of surface water, reducemaintenance erosion and material loss, improve
surfacing and subgrade strengths bylowering moisture contents.
Dragging Redistribute surface gravel, fill minordepressions, improve safety.
Shallow blading Redistribute surface material, fill minordepressions, reduce roughness.
Dust control Controls depth of loose fine material anddust loss.
Resurfacing Full regravelling Restore required thickness of surfacing.
Deep blading with Reshape road profile, reduce roughness,reprofiling and/or and rate of deterioration, improve crownrecompaction and drainage.
Rehabilitation Major regravelling Improve strength shape, drainage andafter ripping, recom- performance.paction and drainagerehabilitation
Betterment Rehabilitation and Improve the geometric and structuralgeometric improvement, standards.drainage rehabilitation
Upgrading earth road Improve structural standards,to gravel road performance and all-weather passibility.
Sources Infrastructure Department, World Bank

SRI LAMK
TRANSPORT SECTOR -0-M-1A6D0"
IIGUVAY MAINTENANCE EXPENDITURES-RDA CENTRALIZED BUDGET (Rs. Mill,)(Average of 1988 Actual and 1989 Provisional RDA Allocations)
Total 1988 Allocated Expenditure by Cost CategoryExpenditure Routine Periodic Capacity(AVg. 1988&§89) (veh-km) (ESAL) (Pcu-km)
Routine Maint 276.3 276.3Surfacing 184.6 184.6Surney & invest. 0.2 0.2Re. flood dam. 12.0 12.0Br. Imp. 0.0 0.0Rebab. A&B Rds 125.9 125.9Imprints, rds & brs. 127.7 63.9 63.9IBID II Prog. 274.1 137.1 137.1
Subtotal 1000.8 288.3 511.5 201.2Emergency/rehab 104.7 104.7Subtotal with emer. rebab 1105.5 393.0 511.5 201.2--------------------------------------------- _-------------------__----------__--------------_____
Recurrent Exp. 102.9 102.9Total with recurrent expenditure 1208.4 495.9 511.5 201.2
Source: Road Development Authority, Highway Maintenance Expenditures, Centralized Budget.
ItP d
I.';
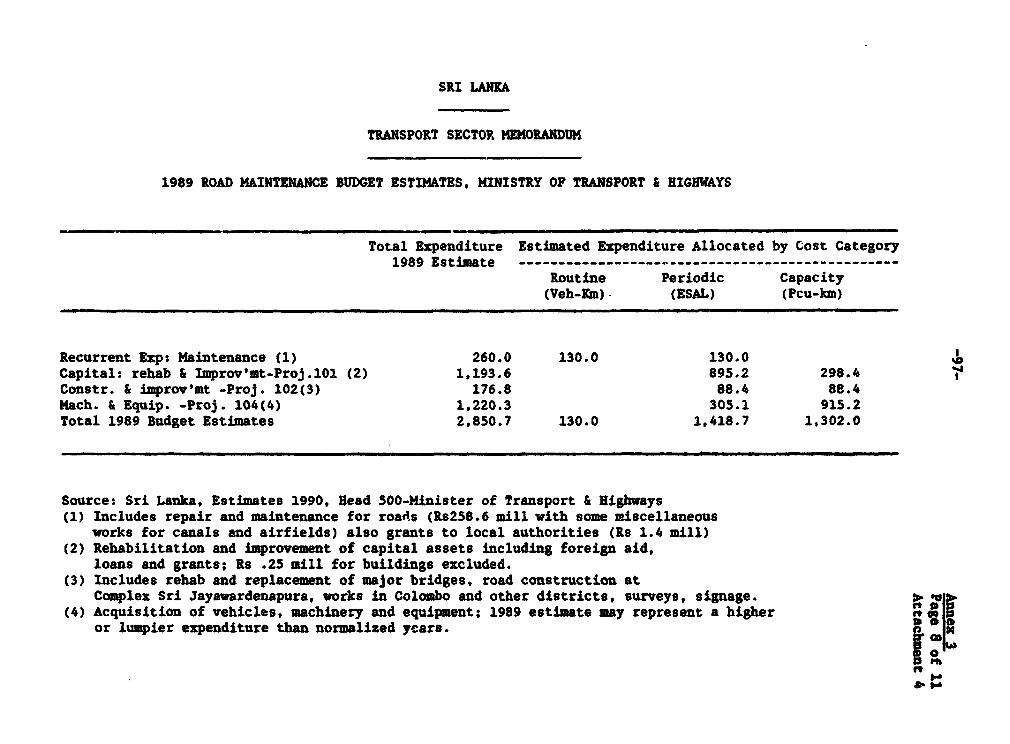
SRI LANKA
TRANSPORT SECTOR MEMORANDUM
1989 ROAD MAINTENANCE BUDGET ESTIMATES, MINISTRY OF TRANSPORT & HIGHWAYS
Total Expenditure Estimated Expenditure Allocated by Cost Category1989 Estimate --------------------------
Routine Periodic Capacity(Veh-Km) (ESAL) (Pcu-km)
Recurrent Exp: Maintenance (1) 260.0 130.0 130.0Capital: rehab & Improv'mt-Proj.101 (2) 1,193.6 895.2 298.4Constr. & improv'mt -Proj. 102(3) 176.8 88.4 88.4Mach. & Equip. -Proj. 104(4) 1,220.3 305.1 915.2Total 1989 Budget Estimates 2,850.7 130.0 1,418.7 1,302.0
Source: Sri Lanka, Estimates 1990, Read 500-Minister of Transport & Highways(1) Includes repair and maintenance for roads (Rs258.6 mill with some miscellaneous
works for canals and airfields) also grants to local authorities (Rs 1.4 mill)(2) Rehabilitation and improvement of capital assets including foreign aid,
loans and grants; Rs .25 mill for buildings excluded.(3) Includes rehab and replacement of major bridges, road construction at
Complex Sri Jayawardenapura, works in Colombo and other districts, surveys, signage.(4) Acquisition of vehicles, machinery and equipment; 1989 estimate may represent a higher
or lumpier expenditure than normalized years. co
'9

-98-
Annex 3Page 9 of 11Attachment 5
SRI LAM
TRANSPO SECTOR MEMORANM
WPOThTICAVI/DEJAUZE UNIT COSTS MO qAWITIES FOR RMO MAI ACE,PROJECTED 19 (1990 RS MILL1O04)
Total Network l IRDA Estimte) A B C 0 E
(Km.) 4110.4 6826.1 9161.2 0140.8 25744
Program Assumptieons
By 1996, Km rehab. complete (0) 0.6 0.8 0.1 0.1Length (kms) 2409.0 1097.6 910.1 014.0 6097.8
Amount under rehab. (3) 0.0 0.0Longh (km.) 164.7 126.5 0.0 0.0 0.0
Amount remaining for rehab (kom) 1401.9 4801.7 6245.1 6526.8 19646.2
Assumed Maintenance Unit Co.st by Category (000'R,/km) (1)
After Rohab: Routine (2) 70.0 70.0 85.0 85.0Recurrent (8) 40.0 80.0 20.0 10.0Periodic (8) 162.9 114.8 71.4 42.9
Unit Coots Without Rehabilltation:
Routine - let yr booster 210.0 160.0 160.0 100.0Routine - yr. 2 onwards 70.0 70.0 85.0 86.0Roecurrent-let yr. booster 210.0 180.0 150.0 100.0Recurrent-yr. 2 onwards 165.0 100.0 80.0 60.0
Rehabilltation costa (So width) 6000.0 5200.0 4000.0 8M00.0
Notes: (1) Unit cost. us d for the Third Road Project for 'AO class networt portionof hlghway system;'B-os network unlt cost, scaled down relative to setimated traffic load.
t2) Routine maint. *xcludes pavemet costs8) Recurrent and periodic costs sasume regulating + AC wearing course.

- 99 -
Axnex 3Page 10 of 11
I.nLLh Attachment 6
NEITWR MAINTENANCE BJOGET, 1986 (NYPOIIETICAL/IOEALIZED PROORAM(1090 RS MILLON)
-Nework(Unit costs and quantities from Tabl- 10--------------------- ---------
A B C D totol
(Kee. 19S9 RDA Etitato) 4116.4 6326.1 9101.2 0O1.8 25744
Maintenance Expen_ (R MlII)
Routine Moint.nanc.
-Afte r eblb 172.9 182.6 82.1 21.6 859.f-without rehab 07.6 277.7 274.1 188.7 828.1-let 3w. booster (6K of remainder) 16.6 88.7 61.6 27.6 148.7Subtotal 270.0 449.2 869.1 282.9 1820.2
Rwurrent Maentennc
-After rehab 98.8 568.9 16.8 0.1 160.2-without rehab 206.6 808.6 620.6 815.0 1544.7-let yr booster 18.8 87.6 61.0 27.6 140.9Subtotal 819.1 491.2 706.8 846.8 1866.8
Periodic Maintenance
-After rohabiIltation 461.6 216.9 66.4 26.8 7t0.8-without rehabiltatlon 220.6 458.8 659.6 225.0 1466.8Subtotal 080.5 670.2 624.9 251.8 2226.9
Rehabilitation ongoing 987.9 657.9 0.0 0.0 1645.9
Total : Roead Maint. A Rehabilitation 2268.6 2268.5 1699.8 688.0 7064.7

-100-
Annex 3Page 11 of 11Attachmnt 7
SRI LANA
TRANSPORT SECTOR . RAM
(.) ALLOCATION OF 10W HYPOTNETICAL A A B NETWORK MAINTENANCECOSTS BY CATEOR (1000 RS MILLION)
Routlno Periodic Capacity
Typ of Maintenance Totel (Re mlII) (weh-ku) (ESAL) (Pcu-km)
Routine 76. 725.8Recrnt (75 ESAL/US POJ) 010.8 007.7 202.6Periodic 1,850.7 1,8I0.7Robabilltatlon on-oing (901 1,045.0 10,1.8 104.0
Toftl s Maintenanc & RebabiIlt. 4,682.0 726. 8,489.0 387.2
(b) ALLOCATION OF 106 HYPOTHETICAL 4 S C & 0 NETWORK MAINTENANCECOSTS Sy CAERt
Routino Perlodic CaPacityTyp of Mbintseance Total (Re ell) (veh-be) (ESAL) (Peg-km)
Routino 1,810.2 1,8.2Rbecurent (753 ESAL/K26 POD) 1,365.6 1,M00.4 408.6Periodic 2,226 9 2,222.9Rehabilitation on-goig (901 1,646.9 1,401.8 104.0
Toltal Mbintenance & Robahlt. 7,064.7 1,820.2 5,107.5 081.0

-101-Annex 4Page 1 of 4
SRI LANKA
TRANSPORT SECTOR EMORANWDW
Bus Costs and Tariffs
Bus Costs
1. A brief review of bus operating costs was undertaken to determine byhow much the existing tariff levels fall short of estimated costs. It wasassumed that following privatization of the public bus operating industry, allbuses would have cost characteristics similar to those of the existing privately-operated buses. Estimates of these costs were derived from the TSPS1/ whichshows the bus characteristics and estimated costs in 1986 !or small, medium andlarge privately-owned buses operating on urban, rural and intercity routes.These costs were updated to January 1990 levels on -he basis of vehicle operatingcost estimates prepared for the economic evaluation of the Third Roads Project.Table 5 shows factors used to update the 1986 costs and the resulting 1990 costsfor urban, rural, and intercity routes. Average costs for all routes are alsoshown--see suimnary in Table A4.1 below:
A4.1s INCREASES IN BUS OPERATING COSTS(1986 - 1990)
Type of Small Medium LargeRoute Bus Bus Bus
Urban 74.0? 60.12 62.3ZRural 69.92 57.52 68.4tIntercity 60.1? 53.1? 62.52Average 67.2? 56.5? 64.2?Source: Table 5.
2. As there are no reliable data on the percentages of total bus orpassenger-kilometers accounted for by each route type, it was assumed that eachroute type accounted for one-third of the total. Cost increases from 1986 to1990, taken from Table 5, are summarized in Attachment 1--Bus Fare Increase,1990. Since 1986, bus operating costs have increased considerably, with anaverage increase of 672 for small buses, 56? for medium buses and 642 for largebuses. Interest expenses are not included in these costs. The purpose is tocalculate the profitability of bus operations independently of the bus financingarrangements, and then to show the effects of the high finance rates on the cashflow positions of the operators.
Bus Tariffs
3. Bus tariffs were increased in January 1990 in recognition ot increasedbus operating costs, but increases were applied to privately-owned buses only.The increases ranged from Rs 0.5 to Rs 4.0, and the percentage of increase from20 to 502, depending primarily on the length of trip. The simple averageincrease, based on an analysis of over 160 routes or route segments is about 24?.
1/ TSPS, Volume 3, Section 4.3.

-102-Anext 4Page Z of 4
The greatest percentage increases are for the short route segments--primarily theurban routes, and consist in effect of an increase of Re 0.5 in the initialloading charge. It has been estimated that because of multiple boarding andalighting and therefore multiple payments of the initi charge, the actualrevenue on urban routes is about 412 higher than a sbimple calculation ofpassenger-kilometers and fares per passenger-kilometer would suggest. Thecorresponding estimates are 142 on rural routes and 62 on intercity. For thisreason, the average increase of 242 is assumed to translate into an increase of352 on urban routes, 30X on rural and 252 on intercity routes. These increaseshave been applied to the revenue estimates for 1986 to derive the estimated 1990revenue (Table 5).
4. The estimated revenue is in part a function of load factors prevailingduring the surveys on which the 1986 estimates were based. This would clearlybe an understatement of current revenues of individual private buses, sincecurrent load factors are very high because of the significantly-reduced publicly-owned operating fleet and the somewhat-reduced privately-owned fleet. For thefuture, it was assumed that load factors would return to "normal" (which is stillhigh) over the next few years.
Bus Profitability
5. The profitability of bus ownership and operation has greatlydiminished since 1986. Even with the fare increase of January 1990, estimatesindicate that the small buses are unprofitable on all routes. The profitabilityof the medium and large buses is marginal at best, even without consideringinterest expense. It is possible that the high load factors associated with thereduced fleets are at least partly compensating for the increased costs in theshort run. There are also indications that at least some of the privateoperators are "short-running' their routes, forcing passengers to pay the initialboarding cost more than once, and further supplementing their revenue in thisway. Neither provides a satisfactory basis for operation in the longer run.
glasticity of Demand
6. A concern has been expressed that bus ridership will be reducedsignificantly if tariffs are increased further. In general, there is nopracticable substitute for bus transport for the majority of the people of SriLanka, so that the price elasticity of demand can be expected to be relativelylow. The price elasticity of demand for road transport has been estimated usingtwo approachest an estimate of the price elasticity of demand for bus transport,and an estimate of the price elasticity of demand for petroleum fuels for roaduse. The elasticity of demand for bus transport was estimated in 1988 as partof the economic reevaluation in the Project Completion Report for the RoadPassenger Transport Project (Cr. 994-CE). The estimated price elasticity ofdemand in 1984 (the year after the latest bus fare increase) was 0.35: arelatively low elasticity but not unreasonable considering the lack of substitutetransport for about 802 of the population who rely on bus transport.
7. The price elasticity of demand for road transport fuels was estimatedon the basis of price and consumption data for gasoline and automotive diesel

-103-Annex 4Pagp I of 4
fuel shown In a local publication.2/ The prices and quantities consumed eachyear in which there was a significant price change were compared with thepreceding years. In each case, a demand trend was calculated on the basis ofrecent past growth rates in consumption to indicate what the consumption mighthave been without the price change in order to approximate the effect of theprice changes on consumption. The results of this approach indicated a fairlywide range of elasticities for the individual price changes, primarily becauseother factors could not be held constant in the analysis. However, the averageelasticities of .58 for gasoline and .45 for automotive diesel are within areasonable range, and are fairly consistent with the bus transport example. Anelasticity of 0.5 was thus adopted as an approximization for road transport.
8. The recent tariff increase for private operators averaged about 25 to302. Assuming a price elasticity of demand of 0.5, this would normally resultin a reduction of about 152 in ridership, with other factors held equal.However, if significant improvement in the quality of service is provided in thefuture as intended, the reduction in ridership would probably not be this large.in addition, incomes have been depressed over the past four or five years becauseof the civil disturbances and are likely to increase in the near future if thedisturbances diminish considerably, especially in the more populous southwesternpart of the country. Increased incomes should help offset any reduction inridership.
coclusions
9. The TSPS concluded that private bus operators were covering theircosts in 1986, although with narrow profit margins. Since that time, the costshave increased by an average of about 652. Tariffs remained relatively unchangeduntil January 1990, when an effective increase of about 302 was allowed. Somecost reductions are possible through reduced interest rates on bus financing, useof larger buses where appropriate, and increased bus productivity. The plannedimprovements to the road system will also result in some increases inproductivity and reductions in operating costs. However, it is unlikely thatcosts can be reduced to the level of present tariffs, and a further tariffincrease in the next year or two seems inevitable. It would be best if such anincrease could be coupled with an increaoe in the quality of service.
Attachments Bus Fare Increase, January 1990
21 Ceylon Petroleum Corporation, "Oil and Sri Lanka, a Statistical Review,"1986.

-104-
Annex 4Page 4 of 4Attachmenc 1.
SU LANK
TRANSPRT SECTOR N MD
BUS FARE INCREASE, JANUARY 1990
PREVIOUS INCREASEFARE -------(Rs) (Rs) 2
1.0 0.5 50.O01.5 0.5 33.322.0 0.5 25.aZ2.5 0.5 20.023.0 0.5 16.723.5 i.0 28.624.0 1.0 25.0O4.5 1.0 22.225.0 1.0 20.025.5 2.0 36.4Z6.0 2.0 33.326.5 2.0 30.827.0 2.0 28.627.5 2.0 26.728.0 2.0 25.028.5 2.0 23.529.0 2.0 22.229.5 2.0 21.12
10.0 2.0 20.0210.5 3.0 28.6211.0 3.0 27.3211.5 3.0 26.1212.0 3.0 25.0212.5 3.0 24.0213.0 3.0 23.1213.5 3.0 22.2214.0 3.0 21.4214.5 3.0 20.7215.0 4.0 26.7215.5 4.0 25.8Z16.0 4.0 25.0216.5 4.0 24.2217.0 4.0 23.5217.5 4.0 22.9218.0 4.0 22.2218.5 4.0 21.6219.0 4.0 21.1219.5 4.0 20.52
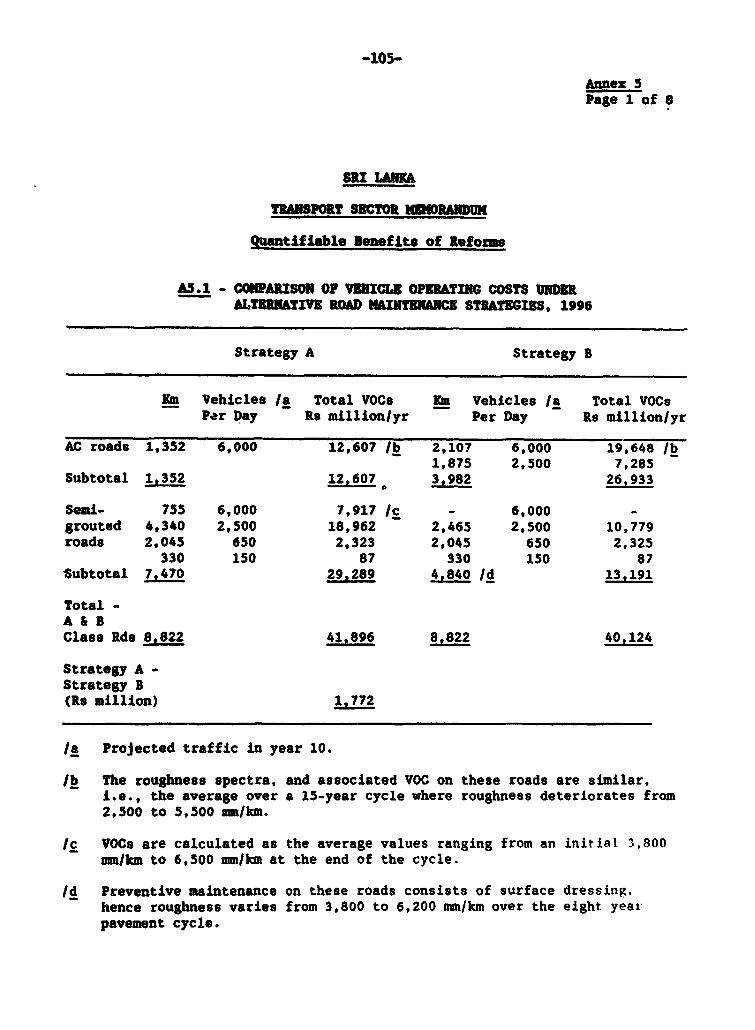
-105-
Annex 5Page 1 of 8
SRI LAMR
TRANSPORT SECTR I~RNU
Qantifl able BeDefits of Reforms
A5.1 - COMPABISON OF VEHICLE OPERATING COSTS UNERALTERMA?J.VB ROAD MAINTENANCE STRATEGIES, 1996
Strategy A Strategy B
Km Vehicles /a Total VOCs Km Vehicles /a Total VOCsPFr Day Re millionlyr Per Day Rs million/yr
AC roads 1,352 6,000 12,607 lb 2,107 6,000 19,648 lb1,875 2,500 7,285
Subtotal 1,352 12,607 3,982 26,933
Semi- 755 6,000 7,917 /c - 6,000 -grouted 4,340 2,500 18,962 2,465 2,500 10,779roads 2,045 650 2,323 2,045 650 2,325
330 150 87 330 150 87Subtotal 7,470 29,289 4,840 /d 13,191
Total -A & BClass Rds 8,822 41.896 8,822 40,124
Strategy A -
Strategy B(Re million) 1.772
la Projected traffic in year 10.
/b The roughness spectra, and associated VOC on these roads are similar,i.e., the average over a 15-year cycle where roughness deteriorates from2,500 to 5,500 mm/km.
/c VOCs are calculated as the average values ranging from an initial 3,800mmikm to 6,500 mm/km at the end of the cycle.
Id Preventive maintenance on these roads consists of surface dressing.hence roughness varies from 3,800 to 6,200 mm/km over the eight yeaipavement cycle.
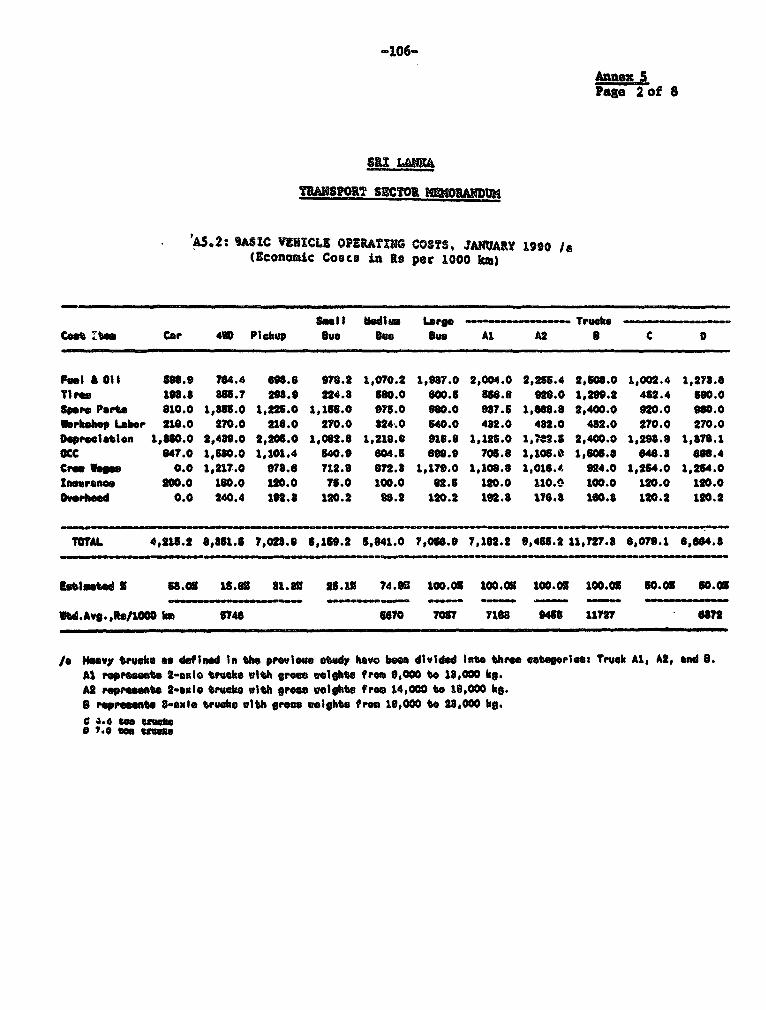
-106-
nnes 5Page 2 of 8
SRI LA=K
TURNSPOR7 SECTOR 1IDR
'AS.2: OSIC VEICLE OPEATXNG CcaTS, JANMARY 1990 /a(Econmic Co lC in Ra per 1000 kmn)
Sll Medium Large - TrucksCst -.t Ca * 4I Pieiwp Bev use eve Al A2 B C 0
Fpol &a o 509.9 704.4 69.6 97.2 2,070.2 1,987.0 2,004.0 2,265.4 2,60.0 1,002.4 1,273.6Ties 198.8 8.7 208.9 224.3 50.0 600.5 56.8 926.0 1,20.2 452.4 560.0Spore Putt 810.0 1,865.0 1,225.0 1,156.0 975.0 980.0 937.5 1,666.8 2,400.0 920.0 960.0Worhksop Lbore 216.0 270.0 216.0 270.0 N24;0 540.0 432.0 482.0 482.0 270.0 270.0
yp.scl.tion 1,850.o 2,489.0 2,206.0 1,062.8 1,218.0 918.8 1,125.0 1,70.5 2,400.0 1,298.8 1,876.16CC 847.0 1,580.0 1,101.4 540.9 604.5 698.9 706.8 1,108.0 1,600.6 848.8 688.4Crw WeeS 0.0 1,217.0 078.6 1 2.8 87.3 1,179.0 1,108.8 1,o06.4, 994.0 1,254.0 1,264.0leeunsece 200.0 180.0 120.0 76.0 100.0 82.5 120.0 110.0 100.0 120.0 120.0Overhead 0.0 240.4 192.8 120.2 98.2 120.2 192.3 176.5 160.5 120.2 120.2
TOTAL 4,215.2 6,851.5 7,028.8 5,159.2 5,841.0 7,056.9 7,182.2 9,456.2 11,7n7.5 6,079.1 6,664.8
abtlsted 5 58.05 15.65 81.3a 26.13 74.91 100.061 100.06 100.05 100.05 $0.05 60.05
Utd.Avg.,Ra/lO km 6740 6610 7057 7188 946 1172 an
/a HNvs trwke as delnW In the previous stdsy have bsoo divided into thbe catoorles Truck Al, A, Oad S.Al represento 2-Oslo trucks with grs wevights fre 0,000 to 18,000 kg.At represet. 2-ale trucks with gross weighte froe 14,000 to 18,000 kg.E represents 3-sale trocks wlth gross weights trwu 19,000 to 23,000 kg.¢ 4.4 Is Uusl
0 Tae U_se

SRI LAMA
TRANSOT SECTOR MEM ERMU
A5.3: VDt RELATED TO RI ROIWOS
Road Rogba.en/Vebicio Operating Cost dices- --- --------- "10 VOC, 2000-7000 /- - -Car sIl Car smallRo_phe-- 419 & Mmdis Large Liht rk Truck Track Rough_es 410 A Medium Large Light Iruck True& Truck(rn/ha) Pickup us Su Truck Al A2 B (ca/0) Pickup Bus BSa Trck Al A2 B
2000 1.000 1.000 1.000 1.000 1.000 1.000 1.000 2000 6112 6178 eas8 S866 O72 s11 10632240 1.024 1.016 1.020 1.010 1.018 1.020 1.022 2400 3 56 03 S5 0m 973 108a30 0 1.0110 1.W 1.040 1.045 1.060 1.055 30 5418 5O 6700 61 SO6 9042 1I218299 1.070 1.054 1.064 1.062 .057 1.062 1.067 a29 50 54 6879 0181 60 9145 11838o0 1.124 1.066 1.106 1.08 1.096 1.098 1.103 3800 5746 6S0o 7057 072 7183 9455 11727 a-4000 1.140 1.110 1.120 1.100 1.105 1.110 1.115 4000 5827 5742 7140 0442 7202 58 115 490D 1.220 1.174 1.200 1.156 1.105 1.174 1.188 4800 62m6 007a 7 6770 7660 10110 1256 1SO50 1.240 1.190 1.220 1.170 1.180 1.180 1.200 5000 03 05 4 682 775 1024? 127596400 1.288 1.226 1.264 1.202 1.212 1.222 1.282 400 04 0842 8014 7089 7966 10623 13069000 1.360 1.280 1.810 1.250 1.260 1.270 1.280 600 6o2 622 g83 7320 828 10986 19S6M7000 1.50 1.3560 1.8990 1.0 1.340 1.350 1.30 7000 7872 8984 39 7789 886 11625 1446
Source: R /VOC indices *pplied to the wvbicle operating
Source: Third Roads Project, Feaibility StudyBWA, 1990
HO.
00t

SRI LA
TRANSPORT SECTO I0EORANUXD
Ai4. ESTIMATES OF A2X LOADS AND ESAS, VARIOUS VEHICLES
Estimated Averep LoadDistrlibuton /a ESA
Axle 1 Axle 2 AxIl 8 AverageCVI Axle 1 Axle 2 AxleS a --- Total Vehicle
(kg) () (1) () (Ikg) ESA (kg) ESA (kg) ESA EA /b
Aukobile, Pickup, 4WD 1400 5so 461 770 0.000 630 0.000 0 0.000 0.000 0.00Loaded linibus 1600 621 48S o8 0.000 664 0.000 0 0.000 0.000Loed Medium Bus 4160 401 60X 1664 0.001 2496 0.006 0 0.000 0.006 0.02Load Larp But 11000 401 6o 4400 0.080 6O6 0.861 0 0.000 0.441 0.40Leaded Truck A 12600 32X 681 4000 0.039 6500 1.204 0 0.000 1.248Loaded Truck B 21400 231 871 405 4f22 0.100 7s16 0.872 656o 1.243 2.216 2.60Loaded Truck C 4400 47X S8u 2088 0.002 282 0.003 0 0.000 0.00oLoeded Truck D 7000 s2o as1 2240 0.003 4780 0.060 0 0.000 0.089 0.40E6pty Truck A 4500 63x 471 2365 0.004 2115 0.002 0 0.000 0.008Trock, 13-ton load 16000 801 701 5400 0.168 12600 7.219 0 0.000 7.872Truck, 10-ton load 14600 no0 7ox 4350 0.067 10150 2.699 0 0.000 2.76MTruck, 6.S-ton load 10000 s5 6s1 3S00 0.021 6500 o.5ss 0 0.000 0.878
EBA a[( axle load to kg/8160)4.GQ5
/a Based on limited RA axlo load surveys. I|/b iverage ESA value use for the S vobicle types In tbo feasibility study for the Third Roads Project.
Source: Feasibility Study, Third Roads Project

SRI LANKA
TRtASPORT SECTOR MEMORANDUW
AS5.5: ESTIMATES OF AXLE LOADS AND ESAs, HEAVY TRUCKS
Eatimated Average LoadDistribution
-- ------------------------- -- Axle 1 Axle 2 Axle 8 Weightedlof OVW Axle I Axl 2 Axle8 -- ------------------ Total Average
Trucks /a (kg) (1) (5) (1) (kg) ESA (kg) ESA (kg) ISA ESA ESA
Truck Al, Empty 201 4600 68S 471 2588 0.004 211S 0.008 0 0.000 0.00oTrack Al, Loaded 851 12500 821 68% 4000 0.0oa 8S00 1.204 0 0.000 1.248 1.132Truck Al, 20X avorloaded 1S1 14100 821 68s 4612 0.067 9588 2.083 0 0.000 2.1S0
Truck A2, Empty 201 5500 681 47% 2915 0.009 2585 0.005 0 0.000 0.014Truck A2, Loaded 6So 16000 856 6S% s6o0 0.180 10400 5.015 0 0.000 3.196 3.064Truck A2, 201 Overloaded 151 18100 821 68z 5846 0.219 12218 8.276 0 0.000 6.494
Truk B, Empty 201 7400 401 a6x 255 2960 0.010 2590 0.006 1865 0.001 0.016Truck B, Loaded 665 21400 23% 57% 401 4922 0.100 7918 0.972 860 1.243 2.215 2.048Truck B, 20% Overloaded 165 24200 22X 891 8O 6324 0.145 9488 1.939 9488 1.939 4.021
/a TSPS, Vol. 4, pp. 9-24.
Source: Feasibility Study, Third Roads ProjectSee Note ISee Note 1

OnI LANKA
;A.: VUICLE OPZRTm: COST SANS
Trdit el eV rote. yes 1-7 Cs Per scr) 5.8 CAW Bseabaffic .rath rat*. yarw 8-14 (5 p.t rar) 4.40S e & *hd. Let4 Lid" Trw& Ireclt Irl 7vimTraffic aruth rate, years 1152, ( pow pa1) 3.w 01; Piku be 8.. Tr-MA As 12 0opm;e Tear 19 - - ---------- :- ----bethese in am. ; & 1ithes p_ojeot 484
_.smsa ;la 1f, Gol., with proj"t, d4a < b. 399S Tratfic WO 1,217 767 SW7 650 172 63 aS D.620L-AW6 (ha) SO.0Width Om) 7.1 WCVat, 1995 ut poject b/O0 ) .6.09 B,"* 7.468 6,47 7,69 990 12.3Icssc rehaiIatc tet (6.alIle) Ve I erh
Yaw 2 D/a WC, 1395 wIh prnoj ob(l/m h) s/a 0/D 0a/ aim o/C a/. a/*YearS a/DI
Tear 4 Dh%
VeMcle Operatiag Ct. aithies VAiclo lis Veicl- Oertia Cast. .wiacd Vehiclo His0 ; S-ion) 03 DIllik)
car smal .. beaSD0 a me. Large uist Tnni Tnme Trut 4 a md. Larg l;eht Truth Trac Trt h
Your Pithg be gas Trm* Al a2 8 TOVDL Tear Pi;e be be Trc At A I 2 a TRS 1;.
1 12 *a 84 4S 1,379.43 847.21 50.41 1,047.01 0.6 1.8a 144.30 4.6.55 5 a.,W.43 .2sz i.42 1,047.01 69.65 0.00 251.60 4,.17.226 1,462.42 07.a7 80910. 1.319.25 28.36 12.06 154.47 4.637.76 3,462.42 9A7.?7 60.66 1,119.25 256.86 0.00 0.71 4.,28.947 1,SD0.99 95.44 60.84 1,176.67 259.92 0.46 16.6 4.481.1 7 1660.9 91.46 12.36 1.17.5' 269.92 0.D 284.01 4,674.20a 1,0.49 1,D02.14 SI.MO 1,202.24 69.96 189.07 174.28 5,264.58 1,66.49 1.0.14 670.42 1,60.20 269.04 0.00 a88.ft 8.102479 1,614.59 1,099.852 718.94 1,851.46 80.44 149.72 166.65 5.00.05 9 1,614.59 1,099.62 716.94 1,861.46 89.44 0.00 2.540 5,649.37
10 1.954.86 1,178.91 77051 1.446.42 81. S6 2.22 19.41 6.41.71 10 1,910.76 1,117.60 71.05 1.42a.10 M.84 0.00 342.65 5,97t.2011 2,104.90 1,265.62 M.62 1,546.05 354.85 2.41 228.80 6,481.16 U 2,06.47 1,26.29 al1.84 1,A.29 346.76 0.00 386.62 6.849.9612 2,2.46 1,160.80 86.2? 1,0.10 8178.14 10.49 Z.6 6,024.? 12 2,215.46 2aO.61 89.21 1.03.10 878.14 0.0O 362.16 68.7513 2,360.65 1,406.1 9021.39 1.729.051 895.78 M9.40 26.16 7.,74.42 1S 2,390.15 ,410.0 921.39 1,729.06 s86.78 0.0 425.84 7.60.6924 2,5s.67 1,46.90 916.41 1,02I.s7 419.89 62.92 262.46 7,180.62 14 2,17s.17 1,489.90 976.41 1.03.57 419.s9 0.00 490.61 7.185.915 2,660.96 1.50.40 1.019X, 1,914.25 41.05 2, 1.06 26.57 6,091.54 16 2.s0.9 105.f4 1,4029.67 1.914.25 4s0.05 0.00 460.21 0,078.161S 2,637.81 1.605 11,054.20 1.916.41 417.03 2n.? 275.17 8,447.59 162,290.8 1.6SA 1,064.6.21 1,98.46 47.86 0.00 460.46 8.432.7117 2,980.01 1,696.35 1,111.65 2,C08.41 477.45 220.90 2P.25 0,192.27 17 2,980.63 1,85.55 1,111.05 2,015.41 477.45 0.00 80.60 8.892,69 8 16 3a,c0.79 I.M69. 1.20.94 2,170.21 498.46 242.05 299.92 0.207.s3 18 S,059.79 1,769.95 1,2V9.94 2,178.21 49.46 0.00 52a.67 9,190.021U 3,199*42 2".04e2 1,21A).47 SAY4.01 50.80 2 .S a 31.11 9,el2.4s 19 s,194.42 1.84t.s2 1.210.97 2,2n4.es 141QD S.0 o0.oo1 9."s,D4X
20 ,306.22 1,912.80 1,258.36 2.35,6.4 5.60 260.48 aZ4.07 9,946.0 28 5,80s.62 1,92.0 2,258.60 2,35b.64 588.60 0.00 565.64 9,980.1022 8,421.94 2,97.44 1,297.28 2.43.02 357.46 289.80 36.42 20,297.11 21 8,421.94 1,979.44 3,297.65 2,486.02 57.48 0.00 085.65 10,27.14 t22 8,541.71 2,09.72 1,842.60 2,621.211 76.97 279.02 847.16 10,.67.60 22 8.04171 2.046.72 2.842.89 2.521.26 076.97 0.00 606.14 10.687.45 2 3,46S.67 2,10.42 1,a0.62 2.,09.35 ffr.1s 288.80 8.51 11,0110.51 20 3,665.67 2,122.42 1,6891.62 2,69.SS 597.16 0.0 627.3 11,00.7624 8,9.97 2. 19464 1.40.20 2.7*0,6 61.0 295.91 1l.ft 1,42.15 214 3.7.91 2,194.64 1,430.2 2,.7100.66 613.0 0.00o 64.88 115.8u11
PW of dAbcle 6.ertiae Cosat lal0 66,963.21) P0 of VeMcle berati Co et u4s 3.700.,9
SoC Note 2

-111-.
AnneX SPage 7 of 0
SRI LANKA
TRANSPORT SECTOR NEMORANDUM
AS.7s COST ADVANTAGES OF PRIVATELY-OVNED LARGE BUSES
Publicly Privately-Ow.ed -Owned
1. Bus availability, 1985 (2) 66 802. Average Load Factor 1985 (C) 6l 893. Cost per Bus Kn. 1i85 (Rs.) 7.53 6.254. Average Seating tapacity 1983 55 525. Cost per Seat KL. 90S (is.) 0.137 0.120
Cost Index per Seat Seat Km. (Pvt. - 1) 0.139 16. Cost per Passenger Km., 1965 0.169 0.135
Cost Index per Pass. Km. (Pvt. - 1) 1.250 1
7. Cost per Seat Km., 1990 0.211 0.1856. Cost per Passenger Km. 1990 0.260 0.2089. Est. Traffic, 1990 (Mil. Pass. Km.) 17500 17500
Total Cost (Rs. million) 4550.0 3640
Cost Differences (Rs. million) 910.0
Sources
Publicly-owned Privately-owned
1. TSPS, Vol.3, pp. 5-10 TSPS, Vol.3, pp. 5-112. TSPS, Vol.3, p. 4-26 TSPS, Vol.3, p. 4-263. TSPS, Vol.3 Table 4-2 TSPS, Vol.3, Table 4-24. Der. from T8PS Vol.3, Table 2-1 TSPS, Vol.3, Table 4-5S. Line 3/ I.ine 4 Line 31 Line 46. Line 5/ Line 2 Line 5/ Line 27. Pvt. cost x cost index per Ch. 2, Table 2-5, average
seat km. all ruts8. Line 7/ Line 2 Line 7 Line 29. Total traffic, 1985 with 52 per year growth to 1990, rounded
to 35 billion passenger km. Assume publicly and privately-owned buses each carry half of the traffic. See TSPS,Vol.3, p. 5-4

-112-Annex 5Page 8 of 8
Explanations
Note 1
The heavier two-axle trucks make up about 212 of the "heavy truck*category. Table A5.5 shows that these trucks have an average ESA of 3.05,allowing for an estimated 202 of empty trucks and 15? of the trucks beingoverloaded by 20X. The balance of the "heavy truck" category is representedby the 12.5-ton two-axle truck with an estimated value of 1.13 ESA and thethree-axle Truck B with an average ESA of 2.05, using the same assumptionsregarding empty and overloaded vehicles. Among the heavy trucks, the Truck Alis forecast at an annual average daily traffic (AADT) of 172 vehicles per day;A2 at 63, and Truck B at 63. These traffic volumes, and the correspondingaxle-loads and VOCs, were used in the first run of the analysis assuming nochange in the vehicle mix.
Note 2
In the second run of the analysis, it was assumed that there wouldbe no A2 Trucks, and the cargo previously carried in A2 Trucks would becarried in B Trucks. The capacity of Truck B is 1.33 times that of Truck A;therefore, the 63 A2 Truck vehicles could be replaced by 47 B Trucks, and theheavy trucks would then consist of 172 Al, and 110 B Trucks. The second runwas carried out using axle loads and VOCs corresponding to this vehicle mix.Both runs covered a forecast period of 20 years. The results are shown inTable A5.6.

-113-
Annex 6Pa8 1 of 6
SRI LAMA
TRANSPORT SECTOR REPORT
Private Bus Fleet Estimtes
1. The Government plans to implement a scheme to convert public bustransport operations to private ownership and management. This is taking placein the midst of a period of improved civil stability in Sri Lanka which has givenrise to an increase in passenger travel demand. Approximately 902 of passenger-km of travel is presently accommodated by a mixed public and private bustransport system, but a significant portion of the present travel demand is unmetdue to a shortage of buses resulting from the destruction of public buses duringthe civil strife and the inability to maintain and expand either the public orprivate bus fleet because of financial constraints. To address this problem, theGovernment plans to offer fiscal incentives and reasonable terms of financing tothe 'peoplized" companies and private operators to assist them with a busacquisition program. In order to support the Government's effort to mobilizefinancing for the program, updated forecasts of bus fleet requirements wereundertaken based on alternative forecasts of future public transport demand.
Background
2. The high vehicle loads observed in many areas of the country,particularly during peak commuting hours, clearly demonstrate the shortage ofpublic transport capacity. The 1988 Sri Lanka Transport Sector Planning Study(TSPS) identified an average annual bus acquisition requirement between 1987 and1996 of 2,112 buses, assuming scheduled replacement of the existing fleet andmaintenance of bus transport's existing share of the passenger travel market.This estimate was based on the assumption that the present mixed public andprivate operation of the bus system would continue. Estimates prepared by theSri Lanka Transport Studies and Planning Center in December 1989, also assumingmixed public and private operations, identified an average annual bus requirementbetween 1990 and 1996 of 2,429 buses.
Forecasting Parameters
3. The annual number of buses required to meet the forecast demand forpassenger services, given a fully privatized bus transport sector, will vary byarea of the country, growth in travel demand and several other factors. A rangeof future bus requirements was projected on the basis of three scenarios: low,moderate and high growth in bus transport demand. The three scenarios representa probable range of growth in demand and the effects of supplying this demandwithin a more competitive public transport sector. In each of the projections,it is assumed that the present shortage of bus fleet capacity will be graduallyeliminated as more vehicles are acquired, and that no significant shite to therailway or any other mode will occur. The three scenarios tested are as follows:
(a) Scenario 1: Low (Present Trend). Demand continues to grow at itspresent rate, which is low compared to previous years due to civildisturbances and slower growth in the economy. Buses are retired atthe present rate and bus capacity and productivity remain the same.Load factors on the large buses are assumed to rise somewhat after

-114-
Page of 6
being taken over by private operators seeking to improveprofitability.
(b) Scenario 2: Moderate (Moderate Growth). The rate of growth in bustransport demand increases in line with a modest improvement ineconomic conditions. Buses are retired at the present rate;however, private operators begin buying larger and more profitablebuses in the small bus category, and due to increased competition,bus utilization rates increase and average load factors decreaseslightly.
(c) Scenario 3: High (Significant Growth). Bus transport demandincreases at a higher rate as economic conditions improvesignificantly. Due to greater competition, a higher proportion ofprivate operators buy larger buses (small bus category only), higherthan expected bus utilization rates occur and average load factorsfall to a slightly lower level.
4. The variables considered in the above scenarios weret growth in bustransport demand; vehicle passenger capacity; vehicle life; vehicle utilizationrate; and passenger load factor. Modifications made to these variables in thethree scenarios are described below.
Bus Transport Demand
5. The TSPS established a general relationship between passengertransport demand and the growth rate of GNP. Bus transport demand growth wasestimated at a factor of 1.1 of annual GNP growth. Using this factor, previousstudies have estimated average annual rates of growth in bus transport demand atbetween 3.7S and 7.12. The past civil unrest in Sri Lanka has had a negativeeffect on economic growth, and in 1°89 GNP growth was only 2.72. The recenttrend toward civil stability has given cause to expect an increase in thisrelativeXy low rate of growth. The present forecasts assume GNP growth rates of2.71; 4.51 and 6.42 for the twelve -'esr period between 1990-2001. Theseassumptions resulted in bus transport citzqnd growth rates of 3.01, 5.02 and 7.0t.
Vehicle Capacity
6. The present fleet consists of a number of different vehicle types andsizes. The public bus system generally utilizes standard city buses with anominal capacity of 54 passengers. After the public fleet has been privatized,these buses will continue to operate under private management. Thus, a "largebus" category representing primarily the existing public bus fleet wasestablished for analysis purposes. In the same manner, the typical existingprivate bus vehicle with a passenger capacity of 24 passengers was selected asrepresentative of the "small bus" category.
7. Since the large bus category represents a standard-sized bus and itis unlikely that a larger bus will be introduced as a standard vehicle in thenear future, the passenger capacity rating of 54 was held constant under each ofthe three tests. The small bus capacity, however, was increased in Scenarios 2and 3 to reflect the private operator's preference for larger buses.Government's decision to offer a financing scheme through local banks and toprovide temporary tax exemptions for the purchase of larger buses by the private

-115-
Annex 6Page 3 of 6
sector has lowered the cost of vehicle acquisition. It is expected that thecombination of lower capital costs and the privatization of the public bus fleetwill encourage the trend toward larger buses. In Scenario 2, the small buscapacity was Increased to 26 and in Scenario 3 to 30 passengers, accordingly.
8. Existing fleet information was obtained from the Sri Lanka TransportBoard (SLCTB) for the public bus system and from the Department of PrivateOmnibus Transport (DPOT) for the private system. In the case of the SLCTB, atotal fleet of 7,086 vehicles was reported for 1989. This total was adjusted to6,330 to account for the loss of 219 buses which were beyond repair or retiredduring the year. A 1990 estimate of 6,425 buses for the public fleet and 10,627for the private fleet was used in the analysis. A relative distribution of largeand small buses by region was obtained from field survey data (collected byTSPC). After privatization, it is assumed that an average of 80 of the entirefleet would be available and assigned to revenue service.
Vehicle Life
9. The present revenue service life of a bus in Sri Lanka is 12 yearsfor the large vehicle category and eight years for small buses, after which theyare normally retired. In order to assess the bus fleet replacement requirementsassociated with these life spans, a separate age analysis of the present vehiclefleet was conducted for each of the nine regions of the country. The 12- andeight-year values were used in Scenarios 1 and 2. Life spans of 11 years andseven years in Scenario 3, to reflect the higher annual utilization rate assumed.
Vehicle Utilization
10. The present utilization rate for the public bus fleet is estimatedat an average of 68,000 revenue bus-km per annum. The private bus fleet, usingsmaller vehicles over the more economic routes, averages 65,000 bus-km per annum.These values were held constant in Scenario 1, but increased in Scenario 2 to71,000 and 68,000 and in Scenario 3, to 75,000 and 70,000 to reflect two probableeffects of shifting from mixed public and private operations to solely a privatesystem. First, it is anticipated that the resulting increase in competition willencourage private operators to make additional trips to retain and improve theirrevenue base. Concurrently, it is expected that a suitable contractualarrangement will be made with private operators to provide an adequate level ofservice on uneconomic routes. The second factor is the likely improvement inprivate management. Presently, under public management, an average of only 66?of the fleet is available for revenue service, whereas for the private fleet itis 80X.
Load Factor
11. The present passenger load for large buses is 831, while for smallbuses it is considerably higher at 901. Load factors are calculated against apassenger capacity factor of 120S of the number of seats. For large buses, theload factor was increased to 87? to reflect a likely immediate reduction in thenumber of unproductive bus-kilometers operated under private management. Sincethe present 90S load factor for small buses is recognized as near the practicalcapacity limit, it was not changed. In Scenario 2 the load factors weredecreased to 85S and 87?, and in Scenario 3 further to 82S and 83?, respectively.These reductions are likely to occur, despite favorable passenger demand, as a

-116-
Anne: 6Page 4 of 6
result of increased competition on the more productive routes. Under highlycongested conditions, competition often results in uneven and less effectiveservice delivery, which lowers average load factors.
Vehicle Requirements
12. The above parameters were tested within the framework of the threebus passenger growth scenarios of 3.02, 5.02 and 7.02 (para 5). The presentshortage of buses would be gradually overcome as more buses are acquired. Thus,servicing of the existing unmet or latent demand for bus transport services willnot occur immediately, but gradually as the capacity of the fleet increases. Theresult of this analysis is shown in the Attachment.
Cost Estimates
13. A recent survey of vehicle costs prepared by the TSPC was used toestablish the capital costs of the public (large) and private (small) buses. Asshown in Table A6.1 below, these estimated costs are compared with the actualprices paid by the SLCTB for large (54-seat) and small (30-seat) TATA busesimported from India and assembled in Sri Lanka. Given the different bus makesavailable to the private sector, the TSPC estimate was taken as the mostrepresentative on a fleet basis and was used in the present analysis.
A6.1s 1990 BUS CAPITAL COSTS(Rupees, Financial)
Vehicle TSPC Estimate* SLCTB Actual
Large 1,018,000 1,034,300Small 670,000 669,400
* Estimates exclude import duties since all privateoperators are exempt; 1989 estimates adjusted to 1990using a price escalation factor of 1.152.
Sourcet Sri Lanka Transport Studies and Planning Center andSLCTB, May 1990.
14. Over the past several years, two cost factors have affected thegrowth of the private bus fleet. The first factor is the capital cost of thevehicles. Private bus operators have been very sensitive to the initially highcapital outlay required to enter the public transport service market. This hasled to a proliferation of smaller and less expensive buses island-wide. Thesecond factor relates to the first; it is the high financing charges for busvehicle loans. Due to unfavorable conditions in the local financial market,private operators have had to pay very high interest rates on their new vehiileloans, normally amounting to 402 p.a. repayable within two to three years. Itis anticipated that the combination of lower vehicle costs, better financingterms (made possible by the Government's financial and tax incentive programs),and the move toward privatization will encourage growth in bus service.

-117-
Amex 6Page S of 6
15. The capital costs provided in Table A6.1 above were applied to thevehicle requirement forecasts in the Attacbment to arrive at a rfnge of year-by-year cost estimates for future fleet acquisition. The resulting annual costestimates are summarized in the Table A6.2 belows
A6.2 e ANIIAL PLEET ACQUISITION COSTS(1990 Rupees, Millions - Financial)
Scenario 1 Scenario 2 Scenario 3Low Moderate High
Year Demand Demand Demand
1990 908 1,072 2,1481991 1,864 2,042 2,3371992 2,023 2,215 2,3001993 1,954 2,159 2,322
Average 1,687 1,872 2,277
1994 1,941 2,163 1,3191995 901 1,139 1,1471996 687 943 1,4201997 917 1,191 1,480
Average 1,112 1,359 1,342
1998 929 1,224 2,2891999 880 1,195 2,2702000 1,614 1,951 2,3442001 1,629 1,990 2,313
Average 1,263 1,590 2,304
AverageAnnual 1,354 1,607 1,974
Notes The analysis period is 12-years which correspondswith the life of a large bus.
16. In 1989, a total of 212 buses were purchased by the Government forSLCTB operations at a cost of approzimately Rs 232 million. Reliable informationon the number of buses purchased by the private sector during the same period wasnot available. At the end of July, applications were on file for about 500buses.
Attachments Bus Vehicle Acquisition Requirements

Paie8l of 6
Attachment
BUS VEHICLE ACQUISITIOX REQUIRBMENTS
Transport Demand Growth Scenario
Test It Test 2s Test 3sYear LOW Moderate Aig-*
1990 1,122 1,328 2,8331991 2,475 2,698 3,0291992 2,633 2,874 3,0031993 2,566 2,825 3,037
Average 2,199 2,431 2,976
1994 2,556 2,835 1,5851995 1,057 1,357 1,4301996 850 1,172 1,7131997 1,078 1,423 1,788
Average 1,385 1,697 1,629
1998 1,093 1,463 3,0791999 1,114 1,511 3,0782000 2,250 2,674 3,1692001 2,268 2,722 3,160
Average 1,681 2,093 3,122
AverageAnnual 1,755 2,059 2,575
Notes Estimates include requirements for both replacementof existing fleet, based on the existing age of thefleet, and now buses to meet forecast growth indemand.
* Test 3 assumed a shorter vehicle life(11 years for the large bus and 7 for the small buscategory).

-119- Annex 7SRI Page 1 of 5
TlAU SPCTI MUN
Jajor Goner Fggd_ne ActivItiles It the Treansert Sector
Road Finencing PlonFunding Project Length (US$ equivalent)Ageny Na" and Oescription KM Locol Forein Total Commnts
A. ROADS
1. IOA Road Possenger Transport Project -- 1.5 60.1 51.6 Project closed 11/85Credit 994-CE
First Read Maintenence Project 422 2.8 12.1 14.9 Project closed 9/85Crecdt 900-CE
Socond Roads Project 570 3.9 20.1 24.0 1986-1992Loan 2517-CE
Third Roads Project 819 12.4 80.1 42.6 1991-1996Credit 2188-CEE
SUSTOTAL 1,811 20.6 112.4 188.0
Emergency ReconstructionA Rehabilitation Project 825 11.0 12.0 28.0 Ongoing 1996-1991Credit 1688-CE --- - - ----
TOTAL 2,180 81.8 124.4 168.0
2. ADO Trunk Road Improvement Project 805 9.9 17.6 27.5 Ongoing765-SRI (SF)
Second Road Improva_nt Project 400 15.6 80.6 46.1 Ongoing864-SRI (SF) ----
SUBTOTAL 705 25.5 46.1 78.6 Ongoing
Emorgency Reconstruction 1,040 6.0 16.0 20.0 Ongoingand Rehabilitation Project865-SRI (SF) ----- ---- ---- _-
TOTAL 1,745 80.5 88.1 98.6-- -- - -- --- - -- - ------------- … -- -…-- -- -------------------
a. OECF Road Maintenance Project -- 14.4 66.0 99.4 1909-1996(SLP 16)
Road Maintenance Program -- 0.0 29.5 29.6 Ongolng (meorgency reconstruction)
TOTAL -- 14.4 114.5 128.9
4. ODA Rehabilitation of Gal.l Road 12 0.0 22.0 22.0 1987-1990and Prince of Wales Avenue
Road Reconstruction -- 0.0 18.8 18.8 Ongolng (emergency reconstruction)
TOTAL 12 0.0 85.8 S6.8

-120- ~~~~~Annex 7-120- Page 2 of 5
Road Financing PlanFunding Project Length (US8 equivalent)Agency Nam and Oe.crtption Km Local Forelgn Total Comments
6. OECF Rehabilitation of Colombo-Galle 101 4.8 10.2 14.5 Part of Credit 2188-CE above.Rood(Republic of Korea)
B. RAILWAYS
6. OECF Railway Rehabilltetion and 0.0 60.8 60.08 Ongoing, 1990-1093maintenance (tracks, workshops,locomotives)Procuroment of power sets 0.0 8.4 6.4
SUBTOTAL 0.0 69.0 69.0
7. ODA Railway treck and fittings 0.0 2.0 2.0 Ongoing (emergency reconstruction)
S. Romania Coache. 0.0 22.6 22.6 Ongoing, 1969-1998
9. Canada Railwoy spere. and acce..orieu 0.0 8.4 8.4 Ongoing (emergency reconstruction)Railway rehabilitation 0.0 1.7 1.7 Ongoing (emergency reconstruction)
10. Oermany Railway program assictonce 0.0 6.8 6.8 Ongoing (emergency reconstruction)
C. PORTS
11. OECF Colombo Port Oevelopment 0.0 61.0 51.0 1981-19865Stage I 0.0 48.0 48.0 1985-1967Stage II 0.0 24.0 24.0 1967-1990Stag, III 0.0 80.4 0.4 l990-1991Port Access Road 0.0 51.4 51.4 1969-1981
TOTAL 0.0 199.8 199.8
D. AIRPORTS
12. OECF Airport Development at Colomo: 1986-1980Runway 4.7 4.0 8.7Terminal buIlding 0.0 80.9 80.9Utilities 0.4 20.7 21.1Other civil works 12.9 0.0 12.9
TOTAL 19.0 55.6 78.8
E. URBAN TRANSPORT
18. ODA 40 Double-decker buses 0.0 0.8 0.8 Ongoing (emergency reconatruction)Oermany Bus chases 0.0 5.8 5.6 Ongoing (emergency reconstruetion)OECF Procurement of buses 0.0 8.0 8.0 Ongoing (emrgency reconstruction)

-121-
Annex 7Page 3 of 5
F. TECHNICAL ASSISTANCE TO RDA
14. ADB is providing the following: (a) a contract management specialistassigned to the Contract Management and Construction Division (CM&C), with inlineduties. The emphasis is not on the transfer of knowledge but on handling andsolving day-to-day problems; (b) a road maintenance specialist was assigned tothe Maintenance Division; the incumbent recently left Sri Lanka, without leavingany report; (c) a plant maintenance specialist. This expert also leaving minimalaccomplishments; (d) a training specialist is assisting the Training Departmentto provide classroom and on-the-job training. His performance is appreciated byRDA.
15. ADD Under TA 1110-SRI (SF): A teaw of experts (32 man-months offoreign and 18 man-months of local consultancy services) to design, install andtrain RDA staff to operate: (a) a pavement management system; (b) a bridgemanagement system; (c) traffic statistics databank (for traffic volume andcomposition, axle load data and traffic accident data); and (d) equipment(computers, instruments for road inventory and condition surveys, office andtraining equipment). This work was expected to start in July 1990 and to lastfor only ten months. Longer term assistance is required to achieve sustainableimprovements. The TOR for these experts are on file.
16. OSCF is providing the following (under SLP 16): A team of experts(138 man-months of Japanese and 148 man-months of local experts from ResourcesDevelopment Consultants Limited, whose objectives are to: (a) study the existingroad maintenance and rehabilitation system and program, and recommend changes inlight of the proposed introduction of mechanized maintenance practices; (b)recommend improvements to the existing equipment management and control system;(c) assist in procurement of equipment, vehicles, spares and workshop facilities,mostly from Japan under OECF financing (which will assist implementation of afive-year program of annual routine maintenance of all national and provincialroads--25,000 and annual periodic maintenance/ rehabilitation of 1,700 km); (d)assist in implementation of other components of the project; and (e) carry outa 'feasibility study on future upgraded and integrated road maintenance andrehabilitation works. b The services began in 1988 and will last through September1992. The Inception Report was issued in November 1989 but no substantialprogress has been reported. The proposed five-year program is expected to beissued in 1990.
G. OTE0 R ACTIVITIES IN THE TRANSPORT SECTOR
17. Under the 120 million commitment for relief and reconstructionarising out of the 1987 Sri Lanka Aid Group meeting in December 1987, some 14million was agreed in grant form from ODA to supplement the IDA reconstructionprogram. This has included so far supply of railway track and fittings,provision of 40 doubledecker buses, as well as trucks and other vehicles. Alsounder consideration is the supply of spare parts for the 40 buses. Under exportpromotion, concessionary financing programs (352 grant/with the remainder oncommercial terms), consideration is being given to supply of 600 bus bodies andchassis kits. Discussions are also being carried out with SLCTB on therehabilitation of 875 units. Outside Colombo, a feasibility study financed underan ODA grant is being undertaken on the Monaragalla road by consultants.
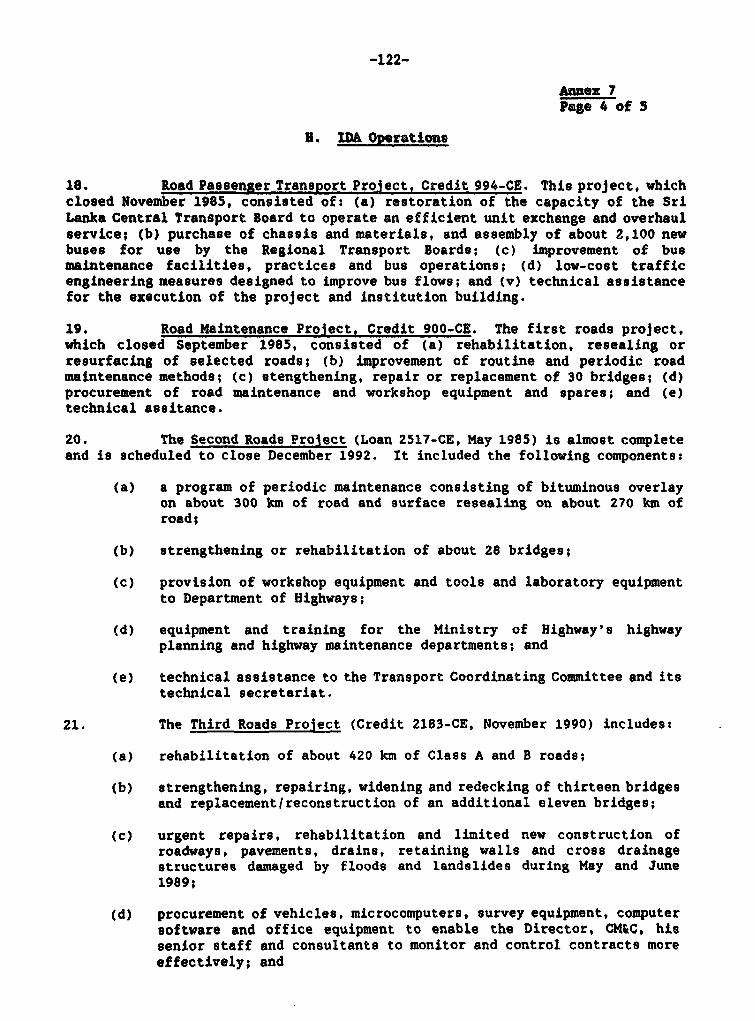
-122-
Annex 7Page 4 of 5
B. IDA Operations
18. Road Passenier TransPort Project, Credit 994-CE. This project, whichclosed November 1985, consisted of: (a) restoration of the capacity of the SriLanka Central Transport Board to operate an efficient unit exchange and overhaulservice; (b) purchase of chassis and materials, and assembly of about 2,100 newbuses for use by the Regional Transport Boards; (c) improvement of busmaintenance facilities, practices and bus operations; (d) low-cost trafficengineering measures designed to improve bus flows; and (v) technical assistancefor the execution of the project and institution building.
19. Road Maintenance Project, Credit 900-CE. The first roads project,which closed September 1985, consisted of (a) rehabilitation, resealing orresurfacing of selected roads; (b) improvement of routine and periodic roadmaintenance methods; (c) stengthening, repair or replacement of 30 bridges; (d)procurement of road maintenance and workshop equipment and spares; and (e)technical assitance.
20. The Second Roads Project (Loan 2517-CE, May 1985) is almost completearnd is scheduled to close December 1992. It included the following components:
(a) a program of periodic maintenance consisting of bituminous overlayon about 300 km of road and surface resealing on about 270 km ofroad;
Cb) strengthening or rehabilitation of about 28 bridges;
tC) provision of workshop equipment and tools and laboratory equipmentto Department of Highways;
(d) equipment and training for the Ministry of Highway's highwayplanning and highway maintenance departments; and
(e) technical assistance to the Transport Coordinating Committee and itstechnical secretariat.
21. The Third Roads Project (Credit 2183-CE, November 1990) includes:
(a) rehabilitation of about 420 km of Class A and B roads;
(b) strengthening, repairing, widening and redecking of thirteen bridgesand replacement/reconstruction of an additional eleven bridges;
(c) urgent repairs, rehabilitation and limited new construction ofroadways, pavements, drains, retaining walls and cross drainagestructures damaged by floods and landslides during May and June1989;
(d) procurement of vehicles, microcomputers, survey equipment, computersoftware and office equipment to enable the Director, CM&C, hissenior staff and consultants to monitor and control contracts moreeffectively; and

-123-
Annex 7Page g of 5
(e) consultancy services for design and supervision and technicalassistance including three studies on the road contracting industry,on construction materials and design standards, and road usercharges.
22. The Emergency Reconstruction and Rehabilitation Project (Credit 1883-CE, March 1988) provided US$23.0 million for the rehabilitation of roads in thenorth and northeast of the country which had been damaged during ethnicconflicts.
23. Bus Privatization is being undertaken under the EconomicRestructuring Project, (Credit 2128-CE, May 1990). Implementation ofpeoplization is expected to be completed by January 1993. UNDP is also financinga US$1.2 million grant to strengthen the bus sector and especially to help makea smooth transition of the public industry to private ownership and c?eration.
-124-
RZFERUNCES
1. Sri Lanka TransDort Sector Planning Studr (6 Volumes and Appendices),January 1988, IMC-CPT,.
2. Public Investment Programs, 1981 - 1993, 1988 - 1992, and 1989 -1993,National Planning Division, Ministry of Finance and Planning.
3. Budget Speech, Ron. Minister of Finance and Planning, 1987
4. Sri Lanka Transport Sector Memorandum (A Brief Review), 1984, World Bank
5. Sri Lanka: A Break with the Pasts The 1987-90 Program of EconomicReforms and Adjustment, Vols. I and II, 1988
6. Traffic Flows and Intermodal Distribution in the Countries of the SouthAsian Association for Regional Cooperation (SAARC), Sri Lanka CountryStudy, 1985
7. Central Bank of Sri Lankas Annual Report - 1987
8. Report of the International Advisory Team on the Supervision, Controland Evaluation of Public Enterprises, 1982
9. Private Bus Transport in Sri Lanka - Dr. P.C.H. Ranasinghe,Friedrich-Ebert-Stiftung, 1988
10. Corporate Plans 1989-1992, Ceylon Shipping Corporation, 1988
11. Sri Lanka Policy Framework Paper, 1988-1991, World Bank
12. Sri Lanka Transport Sectors Issues and Strategies (Discussion Paper atthe Donor Coordination Meeting in June 1989), AS1II

MAP SECTION

IBRD 179384-r - FEBRUA4Y 1984
Point Pedro
SRI LANKA
TRANSPORTQ 2p 4
KILOMITIRS
MAIN ROADS/RAIlROAD$
aMulbaittvu NATIONAL CAPITALO SELEClTID TOWNS
PROVINCtAL BOUNDARIES
GvI/ of Alana,- /7 /
Anraho | -zOaday
Kolpifiyo
a.~~~~~~~~~~~~~~~~~~~rw\ &^ 9 ti.:\f tf -sKcalltudo~~~~~~~~~kudh
Botticloa
{SsE3'~~~~~ tV T f-i A I
71
8ancjadaniya~~ ~ ~ ~ 1 N I f A 10 l~~~~~ ii} I r'f\Ef/Ts,S_
*we*~~~~~~0
r-Jgte g \ tla } } / ) nff < \ L ( gS { \~~s