EWB in Burkina Faso Noémie Paradis African Program Staff Burkina Faso

June 12, 2013
Document of the World Bank
Report No.: 69116-BF
Burkina FasoPerceived Shocks, Vulnerability, Food Insecurity and Poverty A Policy Note 2
Poverty Reduction and Economic Management 4Country Department AFCF2Africa Region
Pub
lic D
iscl
osur
e A
utho
rized
Pub
lic D
iscl
osur
e A
utho
rized
Pub
lic D
iscl
osur
e A
utho
rized
Pub
lic D
iscl
osur
e A
utho
rized
Pub
lic D
iscl
osur
e A
utho
rized
Pub
lic D
iscl
osur
e A
utho
rized
Pub
lic D
iscl
osur
e A
utho
rized
Pub
lic D
iscl
osur
e A
utho
rized
ii
CURRENCY EQUIVALENTS
(Exchange Rate Effective May 8, 2013)Currency Unit = CFA franc (CFAF)
1 US$ = CFAF 500
FISCAL YEAR
January 1 – December 31
ABBREVIATIONS AND ACRONYMS
CFA Communauté Financière d'AfriqueCWIQ Core Welfare Indicator QuestionnaireEBCVM Enquête Base sur la Condition des Vie des MénagesEICVM Enquête Intégrale sur les Condition de Vie des MénagesEP Enquête PrioritaireFCFA Franc CFAGDP Gross Domestic ProductHCPI Harmonized Consumer Price IndexHDI Human Development IndexHDRO Human Development Report OfficeINSD Institut National de la Statistique et de la DemographieLDC Less Developed CountriesMDG Millennium Development GoalsOLS Ordinary Least SquaresSCADD Stratégie pour une Croissance Accélérée et une Développement DurableSSA Sub-Saharan AfricaUNDP United Nations Development Programme
Vice President: Makhtar DiopCountry Director: Madani M. Tall
Country Manager : Mercy M. TembonSector Director /Sector Manager : Marcelo Giugale
Task Team Leader: Andrew Dabalen
iii
Table of Contents
1. PERCEIVED SHOCKS, VULNERABILITY, FOOD INSECURITY AND POVERTY IN BURKINA FASO........................................................................................................................................ 1
A. BACKGROUND: BURKINA FASO, A COUNTRY OF SHOCKS?....................................................................... 1B. POVERTY AND VULNERABILITY ............................................................................................................... 4C. FOOD INSECURITY................................................................................................................................... 14D. IS FOOD INSECURITY A POVERTY ISSUE? ............................................................................................... 19
List of Tables:
Table 1.1: The main shocks faced by households in Burkina Faso in 2009 ................................................. 2Table 1.2: The typology of vulnerability in 2009 ......................................................................................... 7Table 1.3: Food insecurity in 2009 and change from 2003......................................................................... 16
List of Figures:
Figure 1.1: Main shocks faced by household by the place of residence ....................................................... 2Figure 1.2: Distribution of shocks according to regions............................................................................... 3Figure 1.3: Main shocks faced by poor and non-poor .................................................................................. 4Figure 1.4: Regional distribution of vulnerability......................................................................................... 8Figure 1.5: Distribution of vulnerability according to the education level of household head..................... 9Figure 1.6: Distribution of vulnerability according to household size..........................................................9Figure 1.7: Distribution of vulnerability according to employment sector................................................. 10Figure 1.8: Differences between vulnerability and poverty incidences by regions .................................... 11Figure 1.9: Differences between vulnerability and poverty incidences over the poverty line.................... 12Figure 1.10: Vulnerability curves in function of household socioeconomic characteristics....................... 13Figure 1.11: Spearman correlation coefficient between regions over the poverty line............................... 14Figure 1.12: Food insecurity by regions in 2009 ........................................................................................ 16Figure 1.13: Differences in regional food insecurity between 2003 and 2009 ........................................... 17Figure 1.14: Food insecurity by education level of household head........................................................... 18Figure 1.15: Food insecurity by household size ......................................................................................... 18Figure 1.16: Food insecurity by employment sector of household head .................................................... 19Figure 1.17: Poverty and food insecurity by place of residence .................................................................20Figure 1.18: Poverty and food insecurity by education level of household head ....................................... 21Figure 1.19: Poverty and food insecurity by employment sector of household head ................................. 21
List of Boxes:
Box 1.1: Vulnerability analysis methodology............................................................................................... 5Box 1.2: Typology of vulnerability............................................................................................................... 6


iv
ACKNOWLEDGMENTS
This policy note was prepared by a core team consisting of Andrew Dabalen and Yele Batana (World Bank).Judite Fernandes provided excellent assistance with document preparation and finalization. The report was prepared under the guidance of Marcelo Giugale (Sector Director) and Miria Pigato (Sector Manager, AFTP4).
We are grateful to the following for very helpful suggestions: Ali Zafar, Mariam Diop, and the two peer Reviewers: Lire Ersado and Nobuo Yoshida. The Team would also like to thank INSD household survey unit for generously sharing the data sets used for the analysis in this note.


- 1 -
1. Perceived Shocks, Vulnerability, Food Insecurityand Poverty in Burkina Faso
A. BACKGROUND: BURKINA FASO, A COUNTRY OF SHOCKS?
1.1 Burkina Faso is a very poor and vulnerable economy facing a number of external and internal shocks. Actually, the recurring climate uncertainties and exogenous shocks result in an erratic economic growth with however a 2% average annual increase in GDP per capita over the period between 2000 and 20091. The Burkinabe economy is dominated by the tertiary (services) and primary (agriculture) sectors. Poverty remains the main concern with a national poverty incidence of 46.7 % in 2009/10 including 52.8% in rural areas and 25.2% in urban areas. The independent agricultural sector remains the most affected sector with a 53.8% poverty incidence as compared with only 7.6% of poor in the public sector. The fact that the economic activity is strongly dependent on exogenous factors raises the vulnerability issue in particular in agricultural areas.
1.2 The main shocks having affected the Burkina Faso economy include external shocks and internal shocks. Among the key external shocks are the fluctuating international prices of agricultural products (World Bank, 2009), the 2008/2009 worldwide financial crisis (Balma and al., 2010) and the regional instability such as the Côte d’Ivoire crisis which has marked the last decade (Sakurai and Savadogo, 2009). The internal risks involve inter alia climate uncertainties (rainfall variability and series of droughts that result in famine and food insecurity), health-related risks as well as social risks2.
1.3 The following approach uses EICVM household survey to understand the main shocks the households faced in 2009. This approach, while subjective and qualitative, seems adequate to better grasp the issues which affect the households’ vulnerability insofar as shocks have different effects on households due to the heterogeneous nature of households. The two main issues which negatively affect the wellbeing of households are the rise in consumer prices and the health issues of household members. Indeed, approximately 20% of the households admit price increases as the major issue while a similar percentage rather points to household member health issues (See Table 1.1). These two main issues are followed by famine and food shortage issues and next by drought and insufficient rainfall which are each acknowledged as major shocks by a proportion of approximately 14% of the households. These four issues always follow this mostly indicated order when households are invited to identify the second major issue they are confronted with.
1 Burkina Faso SCADD, Strategy for Accelerated Growth and Sustainable Development 2011-2015.2 See World Bank (2009) for a typology of the main shocks having affected Burkina Faso.
- 2 -
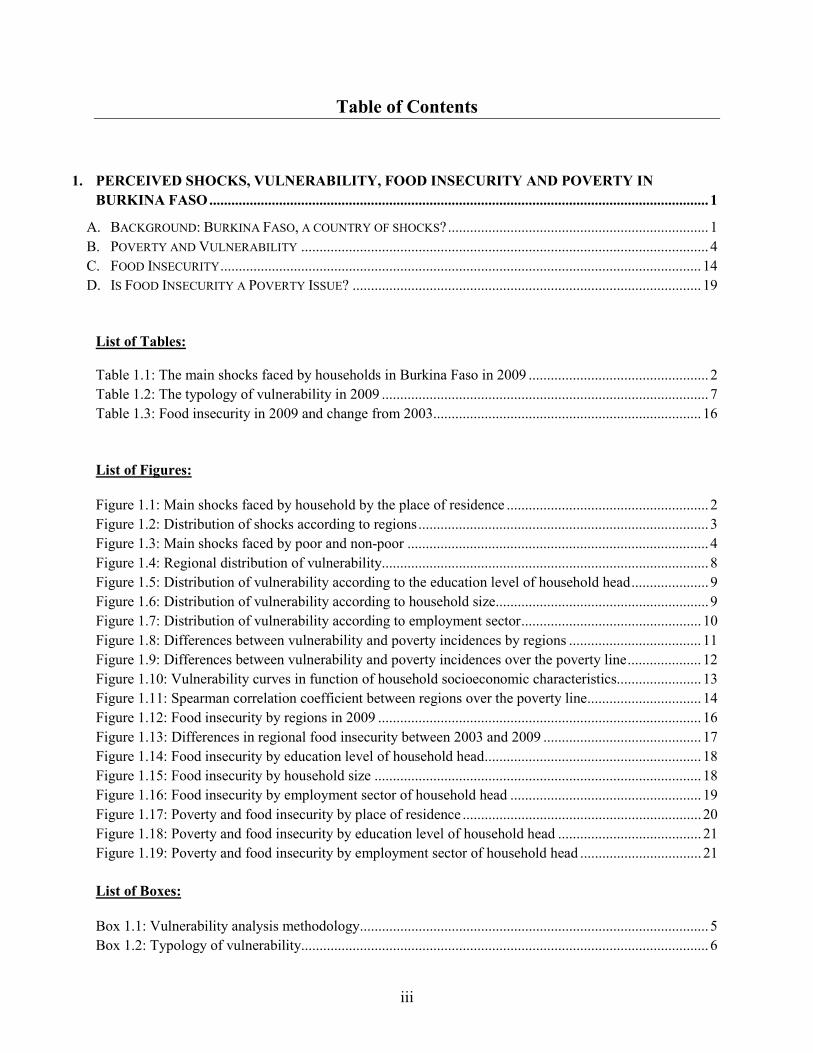
Table 1.1: The main shocks faced by households in Burkina Faso in 2009Nature of shocks First issue Second issue Third issueConsumer prices increase 20.1% 23.0% 26.1%Health problem of household members 19.9% 16.6% 12.4%Famine and food shortage 14.2% 12.7% 6.3%Drought and insufficient rainfall 14.1% 10.5% 9.2%
1.4 But these shocks are not homogeneously distributed across the country. For example, the drought issue is likely to affect more directly and more seriously households living in agricultural areas than households living in urban areas. Similarly, rural households which mostly rely on on-farm consumption might be less affected by the effects of food product price increases than urban households. It might then be interesting to examine how the shocks are distributed across the geographical areas of the country. These differences are shown particularly in Figures 1.1 and 1.2.
1.5 Figure 1.1 shows that the impact of shocks on the households varies according to the area of residence. Thus, for urban households the rise in consumer prices is identified as the main shock by 40% of the households whereas on the other hand drought and rain deficiency seem to affect very few of these households (less than 3%). The health issue of household members remains important in urban areas (21%) as well as in rural areas (19%). Risks linked to household members’ health, when affecting active members of the household, are likely to reduce their productivity and their contribution to the income. On the other hand, the health problem of any member of the household can entail medical care expenses, which may reduce the budget shares devoted to other dimensions of welfare like education, food and material wellbeing. Unlike the situation in urban zones, drought and rain deficiency stand as a critical issue for 18% of rural households. While the rise in prices also remains a problem in rural areas because it affects 13% of the households, it is not as serious as in cities. Famine and food shortage issue remains relatively important mainly in rural areas where it affects nearly 16% of the households as compared to 9% in urban zones.
Figure 1.1: Main shocks faced by household by the place of residence
0
10
20
30
40
Prop
ortio
n of
hou
seho
lds
(%)
Consumer pricesincrease
Health problem ofhousehold members
Famine and foodshortage
Drought and insufficient rainfall
Nature of shock
Urban Rural
- 3 -
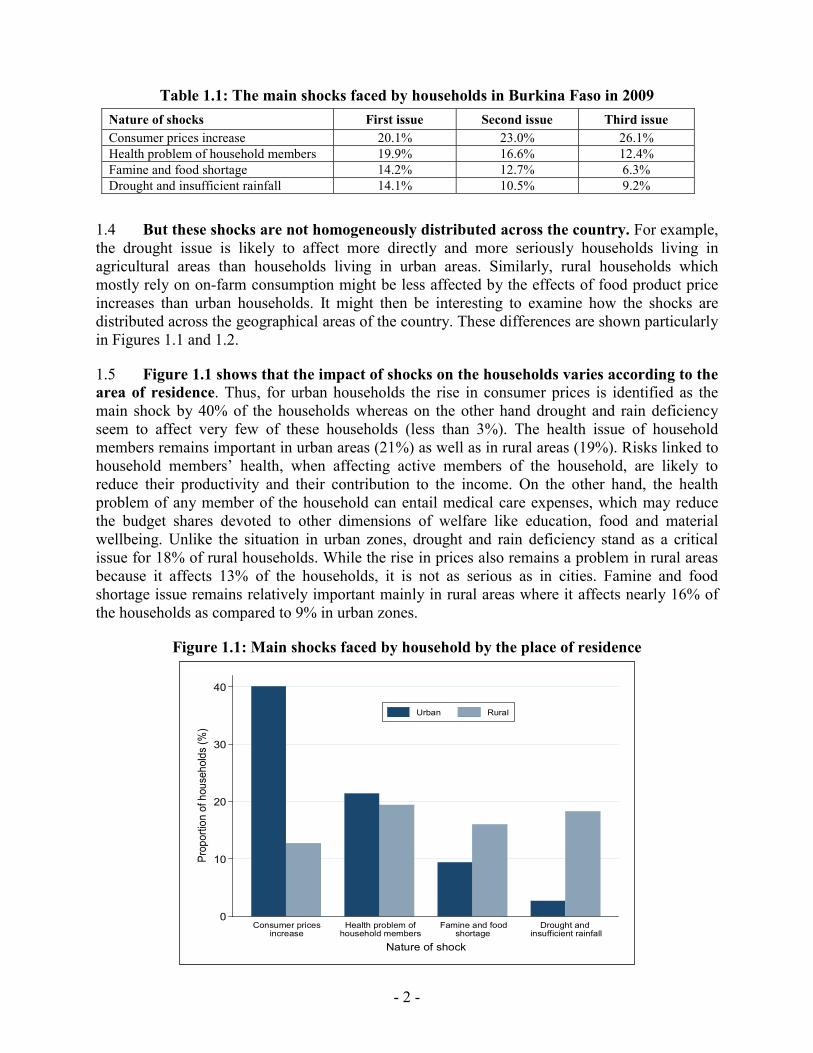
1.6 Figure 1.2 shows the regional differences in the shocks experienced by households.Regarding price increases, the Centre which is predominantly an urban area with the capital city Ouagadougou seems to be the most affected. It is followed by the Haut-Bassins region which is also a predominantly urban area, while the Plateau Central, Centre-Sud, Centre-Nord and Centre-Est regions remain the least affected by price increases. The percentage of households which have identified this issue as a critical issue ranges from 6.7% for the Centre-Nord to nearly 36% for the Centre region. While concerning the household member health issue, importantdifferences are still reported, the variance seems less significant than for price increases. In fact, the Cascades region appears to be the most affected with a proportion of 31% of the households while the Est region turns out to be the least concerned with only 13% of the households. For most of the regions, this percentage is around 20% and higher, which suggests that risks linked to health stand as a major concern for all the regions of the country. With regard to the drought and rain deficiency issue, the Sahel region appears unsurprisingly to be the most affected with a proportion of around 28% of the households. It is followed by the Nord (20%), Centre-Nord(22%) and Est (21%) regions which are the 3 regions of the country bordering the Sahel region.By contrast, the Centre region is less confronted with this issue as it affects less than 3% of the households. Finally, with regard to the famine and food shortage issue, the Haut-Bassins and Cascades regions seem to be the least affected since this shock, regarded as a major issue, affects only less than 5% of the households. Three regions namely the Centre-Ouest, the Nod and the Sahel are those regions mostly affected by famine and food shortage, with a proportion of households slightly higher than 20%. The Boucle du Mouhoun region seems to be relatively less affected with 8% of the households, while the other regions of the country show proportions of households ranging between 10% and 20%.
Figure 1.2: Distribution of shocks according to regions
Boucle du Mo
Cascades
Centre
Centre-Est
Centre-Nord
Centre-OuestCentre-Sud
Est
Hauts-Bassin
Nord
Plateau Cent
Sahel
Sud-Ouest
Proportion of households (%)(35,40](30,35](25,30](20,25](15,20](10,15](5,10][0,5]
A - Consumer prices increase
Boucle du Mo
Cascades
Centre
Centre-Est
Centre-Nord
Centre-OuestCentre-Sud
Est
Hauts-Bassin
Nord
Plateau Cent
Sahel
Sud-Ouest
B - Health problem of household members
Boucle du Mo
Cascades
Centre
Centre-Est
Centre-Nord
Centre-OuestCentre-Sud
Est
Hauts-Bassin
Nord
Plateau Cent
Sahel
Sud-Ouest
C - Drought and insufficient rainfall
Boucle du Mo
Cascades
Centre
Centre-Est
Centre-Nord
Centre-OuestCentre-Sud
Est
Hauts-Bassin
Nord
Plateau Cent
Sahel
Sud-Ouest
D - Famine and food shortage
- 4 -
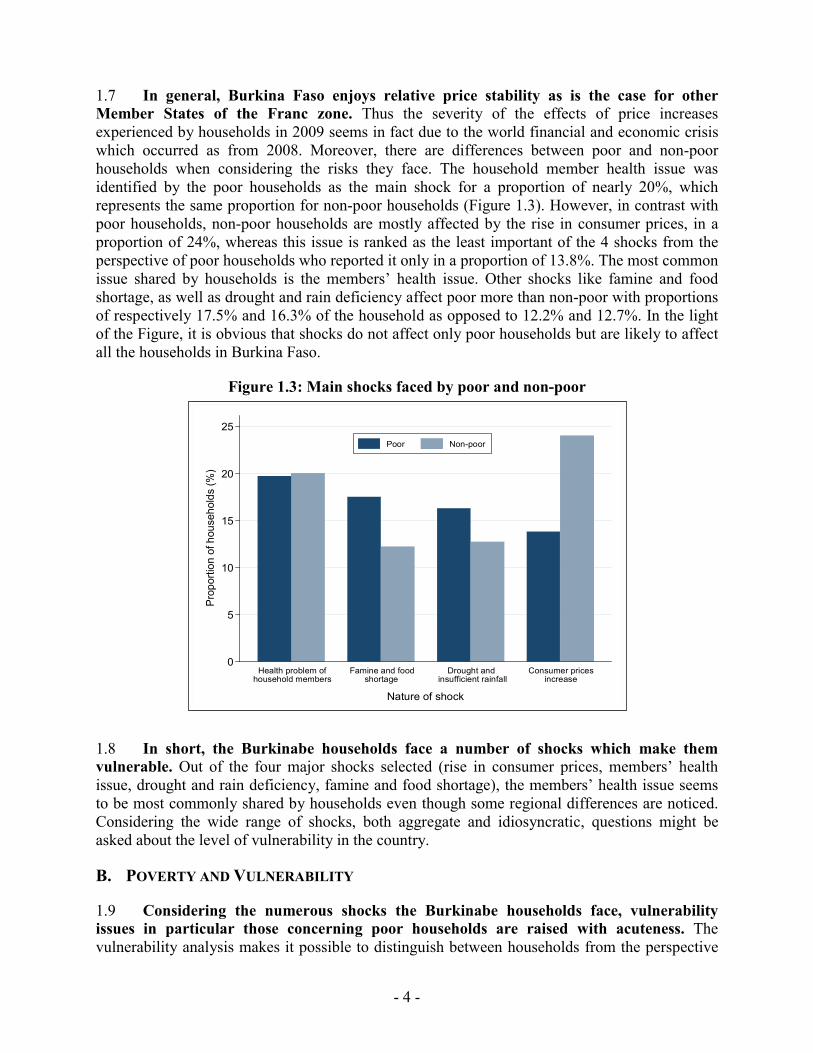
1.7 In general, Burkina Faso enjoys relative price stability as is the case for other Member States of the Franc zone. Thus the severity of the effects of price increases experienced by households in 2009 seems in fact due to the world financial and economic crisis which occurred as from 2008. Moreover, there are differences between poor and non-poor households when considering the risks they face. The household member health issue was identified by the poor households as the main shock for a proportion of nearly 20%, which represents the same proportion for non-poor households (Figure 1.3). However, in contrast with poor households, non-poor households are mostly affected by the rise in consumer prices, in a proportion of 24%, whereas this issue is ranked as the least important of the 4 shocks from the perspective of poor households who reported it only in a proportion of 13.8%. The most common issue shared by households is the members’ health issue. Other shocks like famine and food shortage, as well as drought and rain deficiency affect poor more than non-poor with proportions of respectively 17.5% and 16.3% of the household as opposed to 12.2% and 12.7%. In the light of the Figure, it is obvious that shocks do not affect only poor households but are likely to affect all the households in Burkina Faso.
Figure 1.3: Main shocks faced by poor and non-poor
1.8 In short, the Burkinabe households face a number of shocks which make them vulnerable. Out of the four major shocks selected (rise in consumer prices, members’ health issue, drought and rain deficiency, famine and food shortage), the members’ health issue seems to be most commonly shared by households even though some regional differences are noticed. Considering the wide range of shocks, both aggregate and idiosyncratic, questions might be asked about the level of vulnerability in the country.
B. POVERTY AND VULNERABILITY
1.9 Considering the numerous shocks the Burkinabe households face, vulnerability issues in particular those concerning poor households are raised with acuteness. The vulnerability analysis makes it possible to distinguish between households from the perspective
0
5
10
15
20
25
Prop
ortio
n of
hou
seho
lds
(%)
Health problem ofhousehold members
Famine and foodshortage
Drought and insufficient rainfall
Consumer pricesincrease
Nature of shock
Poor Non-poor

- 5 -
of risks to fall into poverty or to remain in it. But it also concerns non-poor households since the latter are also confronted with risks they are not well equipped to combat. To conduct an adequate analysis, Panel data are usually required. These data make it possible to monitor the flows of entry in and exit from the state of poverty and to possibly identify the determinants of this dynamics. In the absence of such data, as this is often the case in poor countries like Burkina Faso, some approaches based on cross-sectional surveys enable to complete a vulnerability analysis based on probabilities of entry into and exit from poverty rather than on actual flows of entry and exit. The most commonly used approach is the approach of Chaudhuri (2003) and Chaudhuri et al. (2002). This methodology, which is described in Box 1.1, will be used in this case drawing upon the 2009 EICVM data.
Box 1.1: Vulnerability analysis methodology
1.10 Box 1.2 draws the typology of four groups defined in the vulnerability analysis: the chronic poor, the transient poor, the vulnerable non-poor and the non vulnerable non-poor. In this nomenclature, really vulnerable individuals are those coming from households of the first and third groups, as those of the fourth group (non-vulnerable non-poor) are less likely to fall into poverty whereas the second group comprises poor people with high probabilities to exit this state.
The Chaudhuri (2003) and Chaudhuri et al. (2002) approach consists in estimating a household per capita consumption model using the three-step generalized least squared. This approach is extended as suggested by Sarris and Karfakis (2010) to integrate the shocks in regression. Let’s assume the following model: ln h h h hC X S u . (1)
hC is the per capita consumption of the household h , hX a set of observable household characteristics, hS a
vector of identifiable shocks (both idiosyncratic and covariate), and hu the error term. In the present model,
the error term might be correlated with hX as follows:
2h h hu X . (2)
From these two specifications, parameters and are estimated using the generalized least squares feasible in three steps. The first step consists in estimating model (1) using the ordinary least squares. The error term ˆhu obtained is then used to estimate the ˆ always by using the ordinary least squares on the model (2). The second step consists, first, in modifying the model (2) as follows:
2
ˆ ˆ ˆh h h
h h h
u XX X X
. (3)
Model (3) is then estimated using the ordinary least squares, which makes it possible to obtain an asymptotically efficient estimator of which is noted as ˆ
MCGR .The third step consists then in modifying model (1) in the following way:
lnˆ ˆ ˆ ˆ
h h h h
h MCGR h MCGR h MCGR h MCGR
C X S u
X X X X, (4)
And next to finally estimate model (4) obtained through using the ordinary least squares in order to have an asymptotically efficient estimator of and . Les estimators ˆ
MCGR and ˆMCO are then used to
determine predicted household consumptions and identify the vulnerable groups.
- 6 -
Box 1.2: Typology of vulnerability
1.11 The vulnerability analysis results at the national level, based on the area of residence and according to the gender of the household head are presented in Table 1.2.Thus, out of the 46.7% of poor recorded in 2009 in Burkina, nearly the two-thirds of them, or 30.6% of the population, are have high probabilities to live in chronic poverty, while the remainder, that is to say 16.1% of the population, thanks to their assets endowment and to their social and demographic characteristics have chances to escape short-term poverty. Similarly, a certain proportion among the 53.3% of non-poor, that is to say 14.2% of the population, lives in a precarious situation as they may at any time fall into poverty. As for 39% of the population, they are regarded as non-poor with little probability to experience poverty.
1.12 The breakdown analysis by place of residence shows that the percentage of chronic poor is four times higher in rural areas than in urban areas, with respective rates of 36.7% and 9%. However, the proportion of the transient poor is almost the same (approximately 16%) in the two areas. It however highlighted that rural areas remain by far more vulnerable than urban areas. In fact, when considering the current non-poor, they account for 16.3% of the rural population likely to turn poor while they account for only 7% of the urban population. There are also quite substantial differences in the analysis when considering the gender of the household head. Chronic poor thus appear more numerous in terms of percentage in male-headed households (31.6%) than in female-headed households (19%). Moreover, these households have fewer opportunities to exit poverty since the proportion of transient poor within them is 16% as compared with 18.6% for female-headed households. This result as well as the one obtained by the poverty analysis can be simply explained by differences in the household size3. Indeed, households headed by women are on average of smaller size than those headed by men while the
3 A more mixed result is obtained by McCulloch and Calandrino (2003) who find that, if male-headed households are more vulnerable than female-headed households, they however suffer from chronic poverty less than the latter.
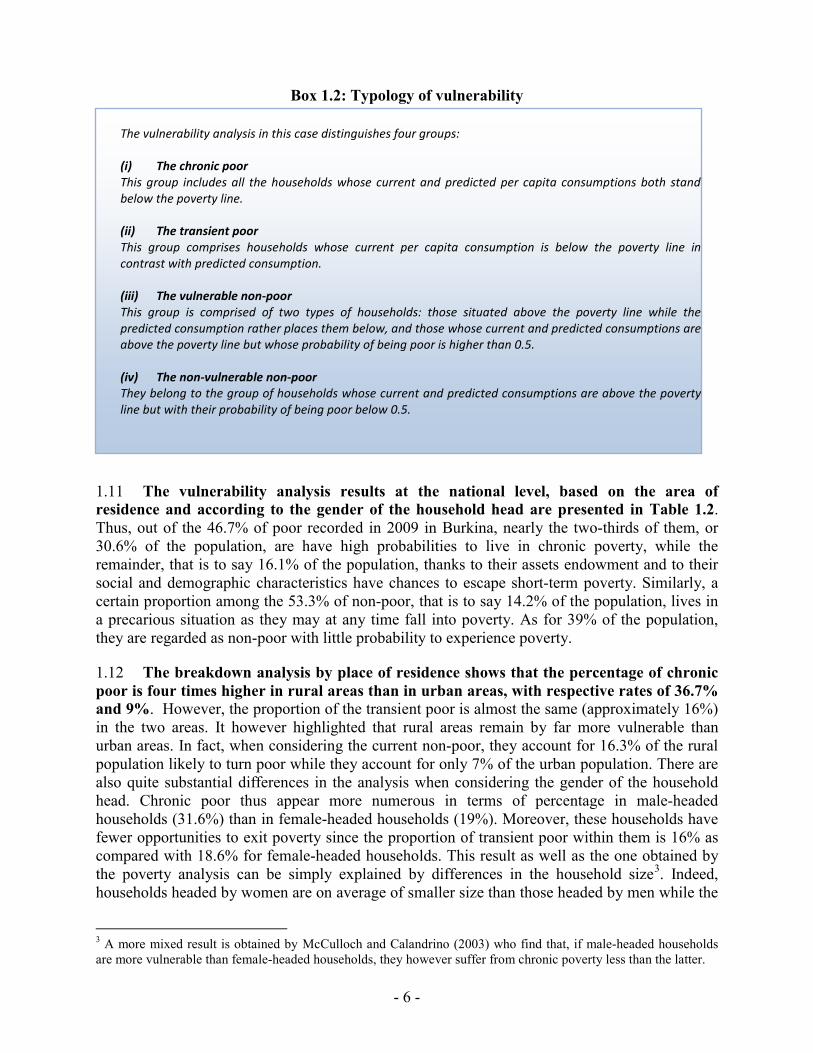
The vulnerability analysis in this case distinguishes four groups: (i) The chronic poor This group includes all the households whose current and predicted per capita consumptions both stand below the poverty line. (ii) The transient poor This group comprises households whose current per capita consumption is below the poverty line in contrast with predicted consumption. (iii) The vulnerable non-poor This group is comprised of two types of households: those situated above the poverty line while thepredicted consumption rather places them below, and those whose current and predicted consumptions are above the poverty line but whose probability of being poor is higher than 0.5. (iv) The non-vulnerable non-poor They belong to the group of households whose current and predicted consumptions are above the poverty line but with their probability of being poor below 0.5.
- 7 -
level of poverty based on the per capita approach is strongly correlated to the size of the household. In this case the average size of the households is 4.3 for female-headed household against 7.2 for the others. When considering non-poor individuals likely to fall into poverty, they account for 14.4% of the total population of these households while they are estimated to be 11.3% in the female-headed households.
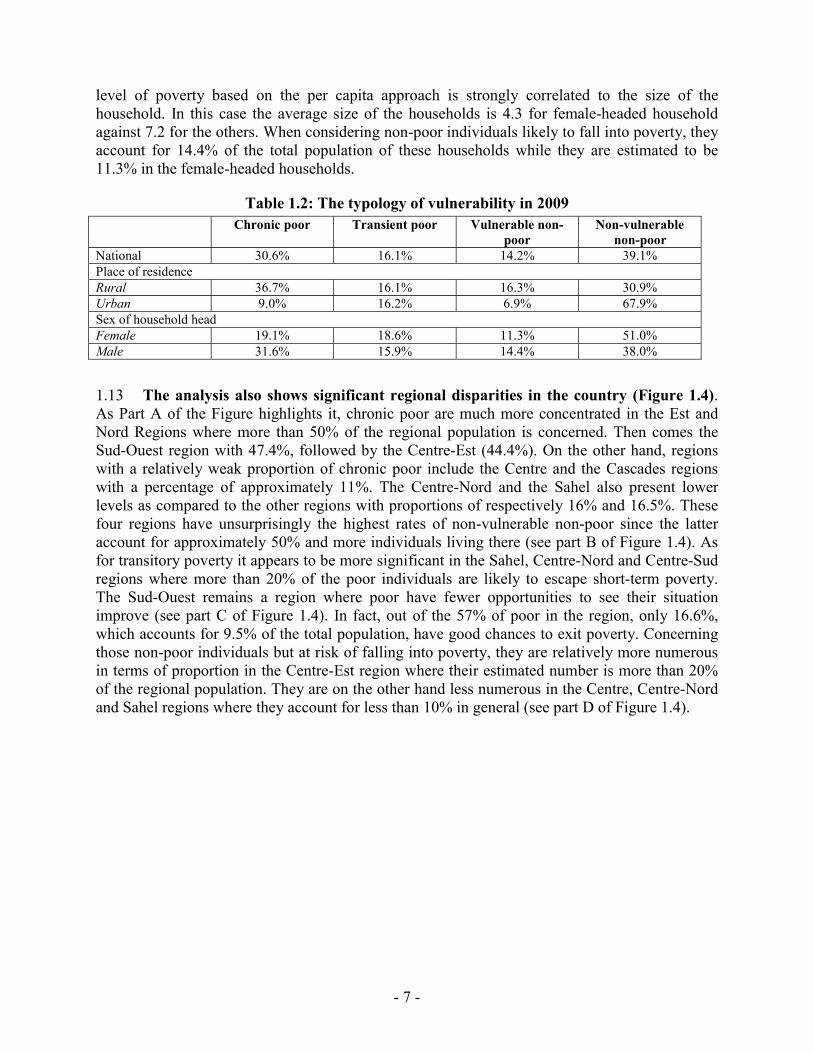
Table 1.2: The typology of vulnerability in 2009Chronic poor Transient poor Vulnerable non-
poorNon-vulnerable
non-poorNational 30.6% 16.1% 14.2% 39.1%Place of residenceRural 36.7% 16.1% 16.3% 30.9%Urban 9.0% 16.2% 6.9% 67.9%Sex of household headFemale 19.1% 18.6% 11.3% 51.0%Male 31.6% 15.9% 14.4% 38.0%
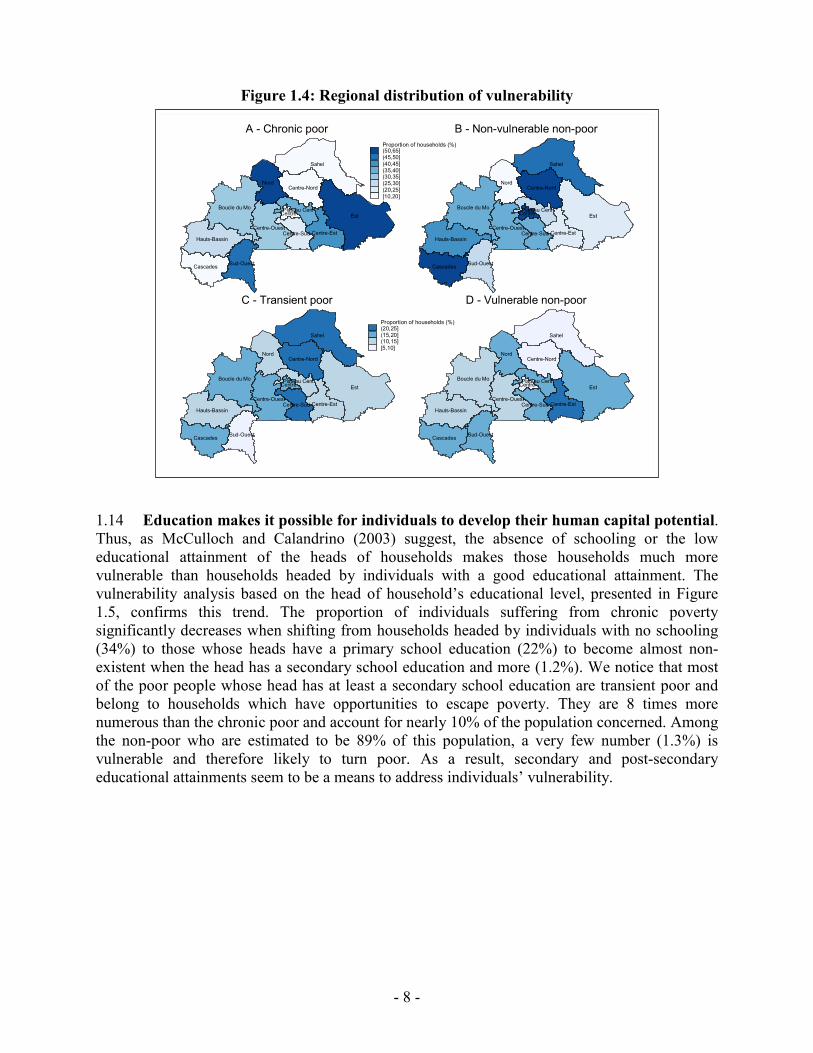
1.13 The analysis also shows significant regional disparities in the country (Figure 1.4).As Part A of the Figure highlights it, chronic poor are much more concentrated in the Est and Nord Regions where more than 50% of the regional population is concerned. Then comes the Sud-Ouest region with 47.4%, followed by the Centre-Est (44.4%). On the other hand, regions with a relatively weak proportion of chronic poor include the Centre and the Cascades regions with a percentage of approximately 11%. The Centre-Nord and the Sahel also present lower levels as compared to the other regions with proportions of respectively 16% and 16.5%. These four regions have unsurprisingly the highest rates of non-vulnerable non-poor since the latter account for approximately 50% and more individuals living there (see part B of Figure 1.4). As for transitory poverty it appears to be more significant in the Sahel, Centre-Nord and Centre-Sudregions where more than 20% of the poor individuals are likely to escape short-term poverty. The Sud-Ouest remains a region where poor have fewer opportunities to see their situation improve (see part C of Figure 1.4). In fact, out of the 57% of poor in the region, only 16.6%, which accounts for 9.5% of the total population, have good chances to exit poverty. Concerning those non-poor individuals but at risk of falling into poverty, they are relatively more numerous in terms of proportion in the Centre-Est region where their estimated number is more than 20% of the regional population. They are on the other hand less numerous in the Centre, Centre-Nordand Sahel regions where they account for less than 10% in general (see part D of Figure 1.4).
- 8 -
Figure 1.4: Regional distribution of vulnerability
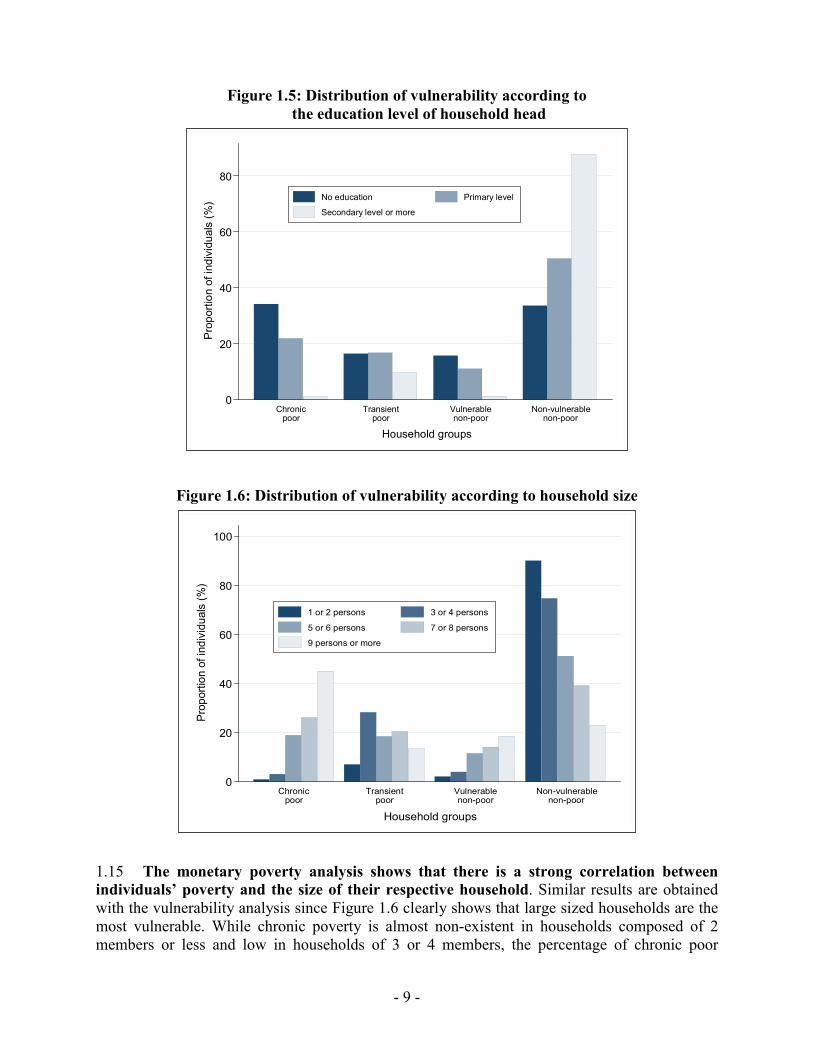
1.14 Education makes it possible for individuals to develop their human capital potential.Thus, as McCulloch and Calandrino (2003) suggest, the absence of schooling or the low educational attainment of the heads of households makes those households much more vulnerable than households headed by individuals with a good educational attainment. The vulnerability analysis based on the head of household’s educational level, presented in Figure 1.5, confirms this trend. The proportion of individuals suffering from chronic poverty significantly decreases when shifting from households headed by individuals with no schooling (34%) to those whose heads have a primary school education (22%) to become almost non-existent when the head has a secondary school education and more (1.2%). We notice that most of the poor people whose head has at least a secondary school education are transient poor and belong to households which have opportunities to escape poverty. They are 8 times more numerous than the chronic poor and account for nearly 10% of the population concerned. Among the non-poor who are estimated to be 89% of this population, a very few number (1.3%) is vulnerable and therefore likely to turn poor. As a result, secondary and post-secondary educational attainments seem to be a means to address individuals’ vulnerability.
Boucle du Mo
Cascades
Centre
Centre-Est
Centre-Nord
Centre-OuestCentre-Sud
Est
Hauts-Bassin
Nord
Plateau Cent
Sahel
Sud-Ouest
A - Chronic poor
Boucle du Mo
Cascades
Centre
Centre-Est
Centre-Nord
Centre-OuestCentre-Sud
Est
Hauts-Bassin
Nord
Plateau Cent
Sahel
Sud-Ouest
Proportion of households (%)(50,65](45,50](40,45](35,40](30,35](25,30](20,25][10,20]
B - Non-vulnerable non-poor
Boucle du Mo
Cascades
Centre
Centre-Est
Centre-Nord
Centre-OuestCentre-Sud
Est
Hauts-Bassin
Nord
Plateau Cent
Sahel
Sud-Ouest
C - Transient poor
Boucle du Mo
Cascades
Centre
Centre-Est
Centre-Nord
Centre-OuestCentre-Sud
Est
Hauts-Bassin
Nord
Plateau Cent
Sahel
Sud-Ouest
Proportion of households (%)(20,25](15,20](10,15][5,10]
D - Vulnerable non-poor
- 9 -
Figure 1.5: Distribution of vulnerability according tothe education level of household head
Figure 1.6: Distribution of vulnerability according to household size
1.15 The monetary poverty analysis shows that there is a strong correlation between individuals’ poverty and the size of their respective household. Similar results are obtained with the vulnerability analysis since Figure 1.6 clearly shows that large sized households are the most vulnerable. While chronic poverty is almost non-existent in households composed of 2 members or less and low in households of 3 or 4 members, the percentage of chronic poor
0
20
40
60
80
Pro
porti
on o
f ind
ivid
uals
(%)
Chronicpoor
Transientpoor
Vulnerablenon-poor
Non-vulnerablenon-poor
Household groups
No education Primary level
Secondary level or more
0
20
40
60
80
100
Prop
ortio
n of
indi
vidu
als
(%)
Chronicpoor
Transientpoor
Vulnerablenon-poor
Non-vulnerablenon-poor
Household groups
1 or 2 persons 3 or 4 persons
5 or 6 persons 7 or 8 persons
9 persons or more

- 10 -
quickly increases with the sample size to be specifically 19%, 26% and 45% for households comprised respectively of 5 to 6 members, 7 to 8 members and 9 members or more. Poor belonging to households of less than 5 members are rather in a transitory situation with higher probabilities of seeing their economic situation improve. Even with regard to the non-poor, their vulnerability increases according to the number of household members. Households in rural areas are generally of larger size than households in urban areas with an average size of 7.4 against 5.6. For large sized households, there is a higher probability to see a shock occur in the area of health. Actually, larger a family is more increased is the risk for one or several of its members to experience health problems, which is likely to make these families vulnerable. However the effect of the shock felt with the illness of a member should be more important in small sized households than in large sized households, especially when the sick member usually brings a share in the household’s income.
1.16 In general it is noted that vulnerability strongly depends on the employment sector of the household head. The observation of Figure 1.7 shows that there are no chronic poor in households headed by individuals working in the public sector. The 7.6% poverty rate recorded in this sector includes only transient poor. On the other hand, chronic poor are found in more considerable proportions in the agricultural sector (37.3%), among households headed by people out of the labor force and by unemployed (25.5%) and in independent sectors other than the agricultural sector. Regarding the private sector, there are relatively fewer chronic poor with a proportion of around 5%, which is 3 times less than the number of the sector’s transient poor who are estimated to be 15.6%. Except for public sector households, the transient poor account for around 15% of the respective populations in each sector. Concerning the non-poor, which account for 92.5% in the public sector, very few among them are likely to fall into poverty, that is to say 1.7% of the population of households whose head works in the sector. They are also relatively few in the private sector with nearly 6%.
Figure 1.7: Distribution of vulnerability according to employment sector
0
20
40
60
80
100
Pro
porti
on o
f ind
ivid
uals
(%)
Chronicpoor
Transientpoor
Vulnerablenon-poor
Non-vulnerablenon-poor
Household groups
Public sector
Private sector
Independent agricultural
Other independent
Inactive and unemployed
- 11 -
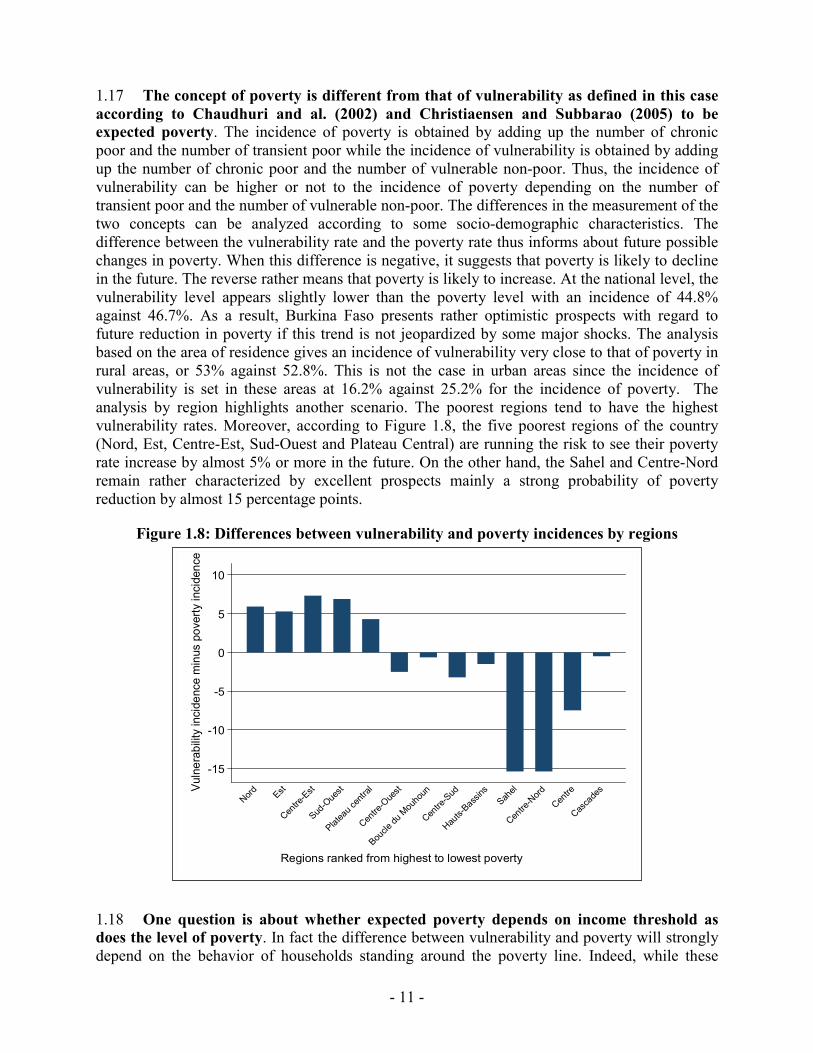
1.17 The concept of poverty is different from that of vulnerability as defined in this caseaccording to Chaudhuri and al. (2002) and Christiaensen and Subbarao (2005) to be expected poverty. The incidence of poverty is obtained by adding up the number of chronic poor and the number of transient poor while the incidence of vulnerability is obtained by adding up the number of chronic poor and the number of vulnerable non-poor. Thus, the incidence of vulnerability can be higher or not to the incidence of poverty depending on the number of transient poor and the number of vulnerable non-poor. The differences in the measurement of the two concepts can be analyzed according to some socio-demographic characteristics. The difference between the vulnerability rate and the poverty rate thus informs about future possible changes in poverty. When this difference is negative, it suggests that poverty is likely to decline in the future. The reverse rather means that poverty is likely to increase. At the national level, the vulnerability level appears slightly lower than the poverty level with an incidence of 44.8% against 46.7%. As a result, Burkina Faso presents rather optimistic prospects with regard to future reduction in poverty if this trend is not jeopardized by some major shocks. The analysis based on the area of residence gives an incidence of vulnerability very close to that of poverty in rural areas, or 53% against 52.8%. This is not the case in urban areas since the incidence of vulnerability is set in these areas at 16.2% against 25.2% for the incidence of poverty. The analysis by region highlights another scenario. The poorest regions tend to have the highest vulnerability rates. Moreover, according to Figure 1.8, the five poorest regions of the country (Nord, Est, Centre-Est, Sud-Ouest and Plateau Central) are running the risk to see their poverty rate increase by almost 5% or more in the future. On the other hand, the Sahel and Centre-Nordremain rather characterized by excellent prospects mainly a strong probability of poverty reduction by almost 15 percentage points.
Figure 1.8: Differences between vulnerability and poverty incidences by regions
1.18 One question is about whether expected poverty depends on income threshold as does the level of poverty. In fact the difference between vulnerability and poverty will strongly depend on the behavior of households standing around the poverty line. Indeed, while these
-15
-10
-5
0
5
10
Vuln
erab
ility
inci
denc
e m
inus
pov
erty
inci
denc
e
Nord Est
Centre
-Est
Sud-O
uest
Platea
u cen
tral
Centre
-Oue
st
Boucle
du M
ouho
un
Centre
-Sud
Hauts-
Bassin
sSah
el
Centre
-Nord
Centre
Casca
des
Regions ranked from highest to lowest poverty

- 12 -
households have opportunities to increase their incomes, households which are slightly below the poverty line might be able to exit this state, and the poverty level will tend to be higher than the vulnerability level. If on the other hand these households rather face constraints that are likely to make their incomes decline, households which are slightly above the poverty line are at risk of falling into poverty and in this case the vulnerability rate is usually higher than the poverty rate. Thus, making the poverty line vary will result in a more complete diagram of the vulnerability trend in the different classes of income. This exercise for the burkinabè case is shown in Figure 1.9. Generally, when studying low income households, the difference between the vulnerability level and the poverty level is negative, which means that households have, through their socioeconomic and demographic characteristics, resources to increase their incomes and improve their economic situation. For all the households as well as for the rural households, the effect in terms of future poverty reduction, which is thus negative, increases in absolute value when the threshold varies from CFAF 50 000 to CFAF 90 000. Then this effect begins to decrease while remaining negative before being null around CFAF 130 000 for rural areas and CFAF 140 000 at national level. Starting from these levels upwards, the effect becomes positive, which means that households with incomes above are more likely to see their incomes decrease than increase. The situation in urban areas follows the same trend but with some differences in scope of effects. For them the vulnerability level still remains lower than the poverty level, which justifies the negative differences observed for thresholds below CFAF 250 000. For thresholds above this level, even if the differences turn positive, their scope is rather weak since a difference of no more than 2 percentage points is obtained. Relatively rich urban households seem to be less vulnerable compared to their rural counterparts.
Figure 1.9: Differences between vulnerability and povertyincidences over the poverty line
1.19 It is also possible to define the stochastic dominance based on expected poverty.Actually, a few authors (Chaudhuri, 2003; Christiaensen and Subbarao, 2005) show that there exists a kind of equivalence between the definition given to vulnerability based upon expected
-15
-10
-5
0
5
10
Vul
nera
bilit
y ra
te (%
) min
us p
over
ty ra
te (%
)
50000 100000 150000 200000 250000 300000 350000 400000 450000 500000
Actual
line
Poverty line
National Rural
Urban
- 13 -
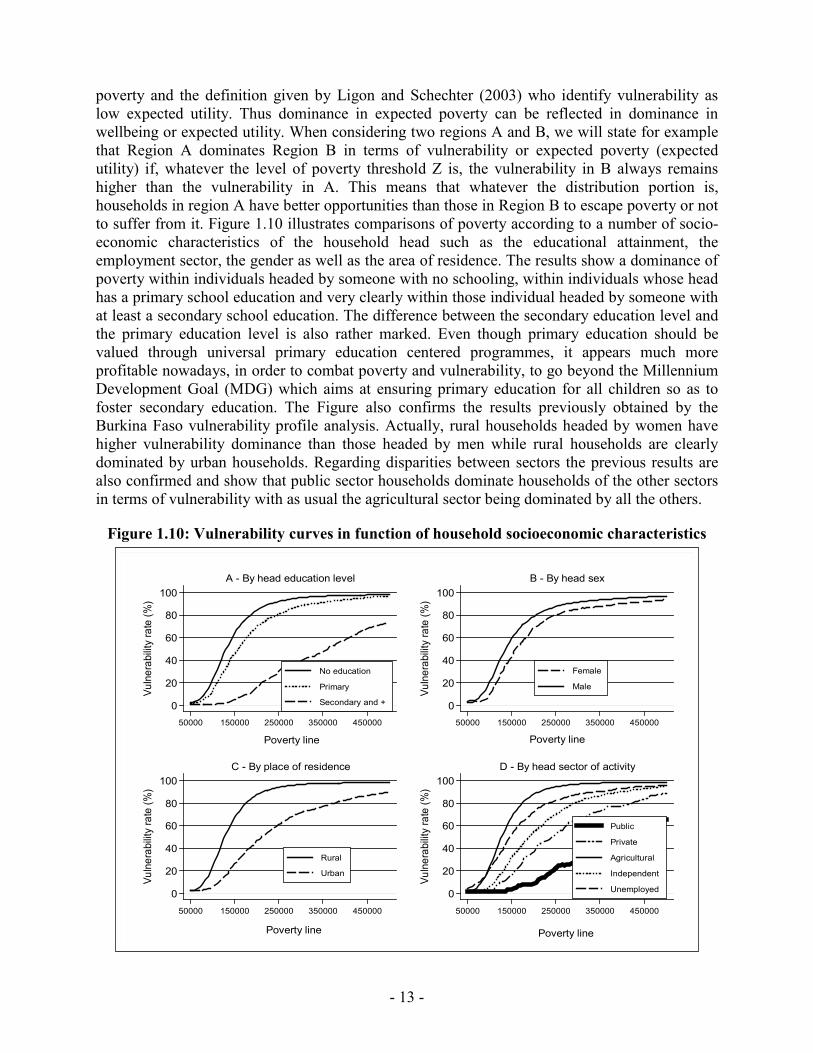
poverty and the definition given by Ligon and Schechter (2003) who identify vulnerability as low expected utility. Thus dominance in expected poverty can be reflected in dominance in wellbeing or expected utility. When considering two regions A and B, we will state for example that Region A dominates Region B in terms of vulnerability or expected poverty (expected utility) if, whatever the level of poverty threshold Z is, the vulnerability in B always remains higher than the vulnerability in A. This means that whatever the distribution portion is, households in region A have better opportunities than those in Region B to escape poverty or not to suffer from it. Figure 1.10 illustrates comparisons of poverty according to a number of socio-economic characteristics of the household head such as the educational attainment, the employment sector, the gender as well as the area of residence. The results show a dominance of poverty within individuals headed by someone with no schooling, within individuals whose head has a primary school education and very clearly within those individual headed by someone with at least a secondary school education. The difference between the secondary education level and the primary education level is also rather marked. Even though primary education should be valued through universal primary education centered programmes, it appears much more profitable nowadays, in order to combat poverty and vulnerability, to go beyond the Millennium Development Goal (MDG) which aims at ensuring primary education for all children so as to foster secondary education. The Figure also confirms the results previously obtained by the Burkina Faso vulnerability profile analysis. Actually, rural households headed by women have higher vulnerability dominance than those headed by men while rural households are clearly dominated by urban households. Regarding disparities between sectors the previous results are also confirmed and show that public sector households dominate households of the other sectors in terms of vulnerability with as usual the agricultural sector being dominated by all the others.
Figure 1.10: Vulnerability curves in function of household socioeconomic characteristics
0
20
40
60
80
100
Vuln
erab
ility
rate
(%)
50000 150000 250000 350000 450000
Poverty line
No education
Primary
Secondary and +
A - By head education level
0
20
40
60
80
100
Vuln
erab
ility
rate
(%)
50000 150000 250000 350000 450000
Poverty line
Female
Male
B - By head sex
0
20
40
60
80
100
Vuln
erab
ility
rate
(%)
50000 150000 250000 350000 450000
Poverty line
Rural
Urban
C - By place of residence
0
20
40
60
80
100
Vuln
erab
ility
rate
(%)
50000 150000 250000 350000 450000
Poverty line
Public
Private
Agricultural
Independent
Unemployed
D - By head sector of activity

- 14 -
1.20 Similarly it is admitted that the regional vulnerability trend may depend on the poverty line used. The change in classification generated by a poverty line different from the initial threshold can be captured with Spearman’s coefficient. We start with an initial situation in which the poverty line is the CFAF 130 735 line estimated for 2009. In comparison with the classification between regions in terms of vulnerability, changes can be observed in the classification when different poverty lines are applied. When the Spearman's rank correlation coefficient is equal to 1 it means that the change in threshold, even though affecting the average vulnerability level, does not question the initial classification. On the other hand, a -1 coefficient reflects a full inversion in the ranking of the regions, while a 0 coefficient means that the classification is independent from the initial one. When there is a complete stochastic dominance between all the regions, it means that none of the 13 vulnerability curves crosses the other and these curves still remain overlapped whatever the poverty line is. In this case the initial classification is not modified and the Spearman’s coefficient remains equal to 1. As illustrated by Figure 1.11, the Spearman’s coefficient varies from -0.3 to 1 when the CFAF 50 000 poverty line is changed into a CFAF 500 000 poverty line. This suggests that the ranking of the regions based on the vulnerability level significantly changes depending on the population considered. The re-ranking shows a very high level when considering rather low incomes as being the poverty line, specifically Spearman’s coefficients below 0.5 when the threshold ranges between CFAF 50 000 and CFAF 70 000. Re-rankings between regions are also observed when using amounts that are higher to the initial threshold. The Spearman’s coefficient however goes below 0.5 only when the amount is over CFAF 300000.
Figure 1.11: Spearman correlation coefficient betweenregions over the poverty line
C. FOOD INSECURITY
1.21 While there is no trivial definition of the concept of food security (or food insecurity), this concept commonly rests, according to Barrett (2010) on three pillars:
-.5
0
.5
1
Spea
rman
coe
ffici
ent
50000 100000 150000 200000 250000 300000 350000 400000 450000 500000
Actual
line
Poverty line

- 15 -
availability, access, and utilization. Indeed food products first need to be available. Then it is necessary for individuals to be able to accede to them either as part of on-farm consumption, or through the market or other mechanisms. Finally, the food products need to be consumed as efficiently as possible to ensure that individuals meet their nutritional needs. Some shocks noted in Burkina Faso (drought, rain shortage and diseases) are likely to affect food availability by reducing food production in particular. Other shocks such as price increases are likely to limit access to them.
1.22 Given that food insecurity is thus a rather complex concept, several measures are often proposed, each reflecting a given aspect of the issue. The two most commonly used measures are the FAO measure based on under-nutrition and anthropometric measures of children under 5 years (Broca, 2002). The FAO approach is based on the caloric approach of households’ food consumption. Food insecurity then is established in cases where the household’s caloric intake is below the minimum intake recommended for this household according to its size and composition. The weakness of this measure lies in the fact that it does not take into account the actual intra-household caloric allocation. Moreover, this measure considers only availability of and access to food products and ignores the third pillar of food security which is utilization. Anthropometric measures on the other hand integrate this third pillar and are able to provide quite differentiated food insecurity results for children of the same household. However, as Young and Jaspers (2006) noted, these indicators can also reflect other aspects such as children’s health, water quality and other nutrition determinants rather than specifically measuring the level of food insecurity.
1.23 Alternative measures of food insecurity are based on subjective approaches. In these cases, it is the surveyed head of household who states if he deems that the household has experienced or not difficulties to meet its food requirements. This type of measure is applied in this report with the view to try to understand the food insecurity issue in Burkina Faso. The following question was put as part of both EBCVM and EICVM surveys: “have you ever had during the last 12 months difficulties to meet the household’s food requirements?” Answers to this question are primarily of 4 categories: “never”, “rarely”, “sometimes”, “often or always”. Nouve et al. (2009) accept the two last categories as characterizing household food precariousness. This report makes a distinction according to the level of insecurity experienced by households. Therefore, minor, moderate and severe food insecurities, correspond respectively to the three last categories. However, Nouve et al. (2009) raise the heterogeneity issue which is generally inherent in subjective assessments of the wellbeing.
1.24 Table 1.3 shows the food insecurity situation in 2009 and its trend as compared to 2003. Minor food insecurity increased by 1.3 percentage point in 2009 compared with 2003 when it concerned 17% of the individuals in the country. Severe food insecurity increased by 3.2 percentage points to stand at 21.4% in 2009. Moderate food insecurity, which is at a 24% rate in 2009 rather dropped in comparison to 2003 with 6.8 percentage points. In general, the increase in severe food insecurity is especially due to the situation in urban areas where it rose by 14 percentage points against 0.4 for rural areas. This increase in food precariousness occurs at a time when the country experiences a financial and economic crisis which resulted inter alia in a rise in food product prices. Moreover a rather marked difference is noted between female headed households and male headed households. For example, concerning severe food insecurity the proportion of individuals affected in 2009 is 28.6% for households headed by women and 20.7% for households headed by men. But as previously noted, this difference might simply be due to
- 16 -
heterogeneity between sexes. Indeed, there is no ruling out that women are more likely to report higher insecurity than men.
Table 1.3: Food insecurity in 2009 and change from 2003Minor food insecurity Moderate food
insecuritySevere food insecurity
2009 Diff % 2003
2009 Diff % 2003
2009 Diff % 2003
National 18.2% 1.3% 24.0% -6.8% 21.4% 3.2%Place of residenceRural 18.6% 1.9% 24.3% -7.5% 19.9% 0.4%Urban 16.7% -1.2% 23.0% -6.0% 26.4% 13.9%Sex of household headFemale 14.2% -0.6% 26.1% -3.6% 28.6% -1.6%Male 18.5% 1.5% 23.8% -7.1% 20.7% 3.2%
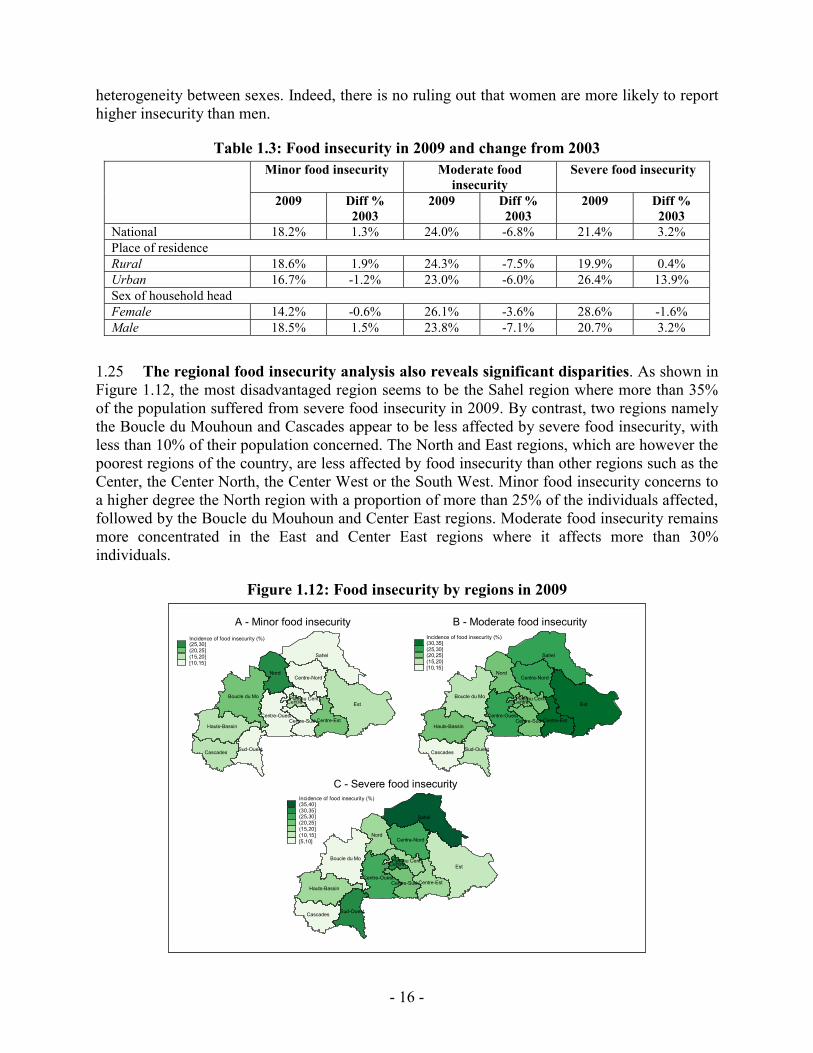
1.25 The regional food insecurity analysis also reveals significant disparities. As shown in Figure 1.12, the most disadvantaged region seems to be the Sahel region where more than 35% of the population suffered from severe food insecurity in 2009. By contrast, two regions namely the Boucle du Mouhoun and Cascades appear to be less affected by severe food insecurity, with less than 10% of their population concerned. The North and East regions, which are however the poorest regions of the country, are less affected by food insecurity than other regions such as the Center, the Center North, the Center West or the South West. Minor food insecurity concerns to a higher degree the North region with a proportion of more than 25% of the individuals affected, followed by the Boucle du Mouhoun and Center East regions. Moderate food insecurity remains more concentrated in the East and Center East regions where it affects more than 30% individuals.
Figure 1.12: Food insecurity by regions in 2009
Boucle du Mo
Cascades
Centre
Centre-Est
Centre-Nord
Centre-OuestCentre-Sud
Est
Hauts-Bassin
Nord
Plateau Cent
Sahel
Sud-Ouest
Incidence of food insecurity (%)(25,30](20,25](15,20][10,15]
A - Minor food insecurity
Boucle du Mo
Cascades
Centre
Centre-Est
Centre-Nord
Centre-OuestCentre-Sud
Est
Hauts-Bassin
Nord
Plateau Cent
Sahel
Sud-Ouest
Incidence of food insecurity (%)(30,35](25,30](20,25](15,20][10,15]
B - Moderate food insecurity
Boucle du Mo
Cascades
Centre
Centre-Est
Centre-Nord
Centre-OuestCentre-Sud
Est
Hauts-Bassin
Nord
Plateau Cent
Sahel
Sud-Ouest
Incidence of food insecurity (%)(35,40](30,35](25,30](20,25](15,20](10,15][5,10]
C - Severe food insecurity
- 17 -
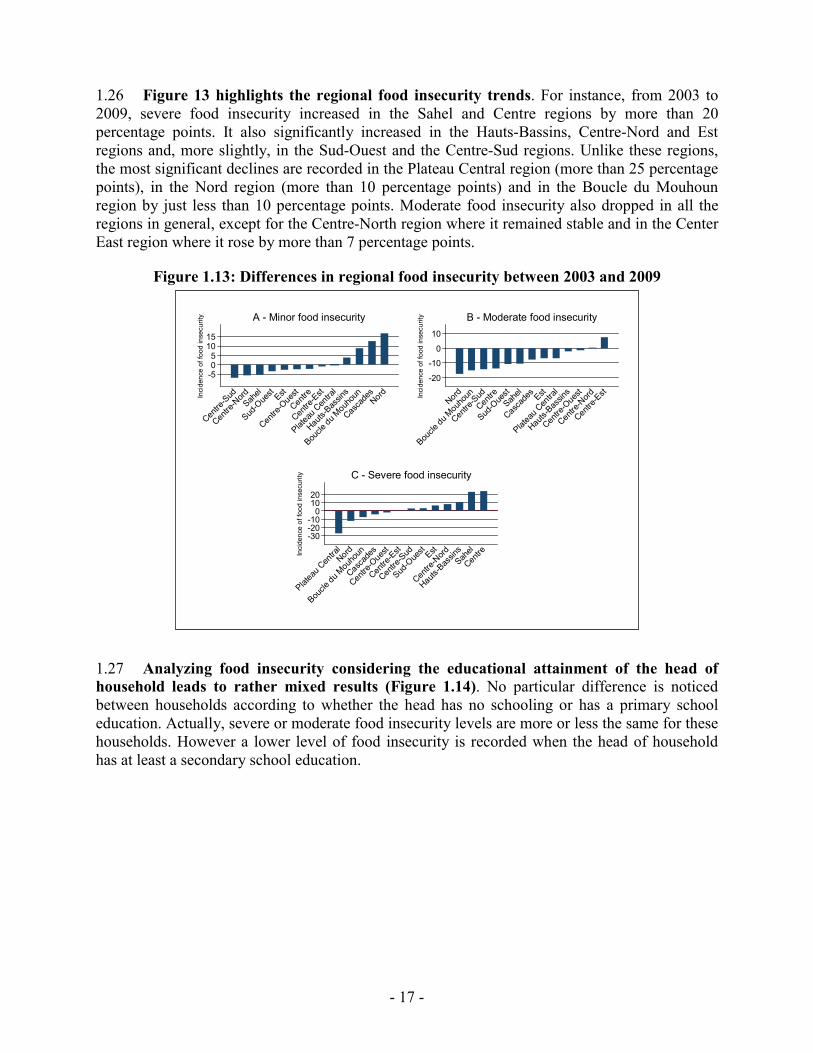
1.26 Figure 13 highlights the regional food insecurity trends. For instance, from 2003 to 2009, severe food insecurity increased in the Sahel and Centre regions by more than 20 percentage points. It also significantly increased in the Hauts-Bassins, Centre-Nord and Estregions and, more slightly, in the Sud-Ouest and the Centre-Sud regions. Unlike these regions, the most significant declines are recorded in the Plateau Central region (more than 25 percentage points), in the Nord region (more than 10 percentage points) and in the Boucle du Mouhoun region by just less than 10 percentage points. Moderate food insecurity also dropped in all the regions in general, except for the Centre-North region where it remained stable and in the Center East region where it rose by more than 7 percentage points.
Figure 1.13: Differences in regional food insecurity between 2003 and 2009
1.27 Analyzing food insecurity considering the educational attainment of the head of household leads to rather mixed results (Figure 1.14). No particular difference is noticed between households according to whether the head has no schooling or has a primary school education. Actually, severe or moderate food insecurity levels are more or less the same for these households. However a lower level of food insecurity is recorded when the head of household has at least a secondary school education.
-505
1015
Inci
denc
e of
food
inse
curit
y
Centre
-Sud
Centre
-Nord
Sahel
Sud-O
uest Est
Centre
-Oue
st
Centre
Centre
-Est
Platea
u Cen
tral
Hauts-
Bassin
s
Boucle
du M
ouho
un
Casca
desNord
A - Minor food insecurity
-20
-10
0
10
Inci
denc
e of
food
inse
curit
y
Nord
Boucle
du M
ouho
un
Centre
-Sud
Centre
Sud-O
uestSah
el
Casca
des Est
Platea
u Cen
tral
Hauts-
Bassin
s
Centre
-Oue
st
Centre
-Nord
Centre
-Est
B - Moderate food insecurity
-30-20-10
01020
Inci
denc
e of
food
inse
curit
y
Platea
u Cen
tralNord
Boucle
du M
ouho
un
Casca
des
Centre
-Oue
st
Centre
-Est
Centre
-Sud
Sud-O
uest Est
Centre
-Nord
Hauts-
Bassin
sSah
el
Centre
C - Severe food insecurity

- 18 -
Figure 1.14: Food insecurity by education level of household head
1.28 Unlike what is usually observed in poverty analysis, particularly with the positive correlation between the size of households and the poverty rate, observing Figure 1.15 shows that differences in terms of food insecurity between different sized households are not only small, but also don’t seem to follow a particular trend. The proportion of households both for severe or moderate food insecurity ranges in general between 20% and 25%.
Figure 1.15: Food insecurity by household size
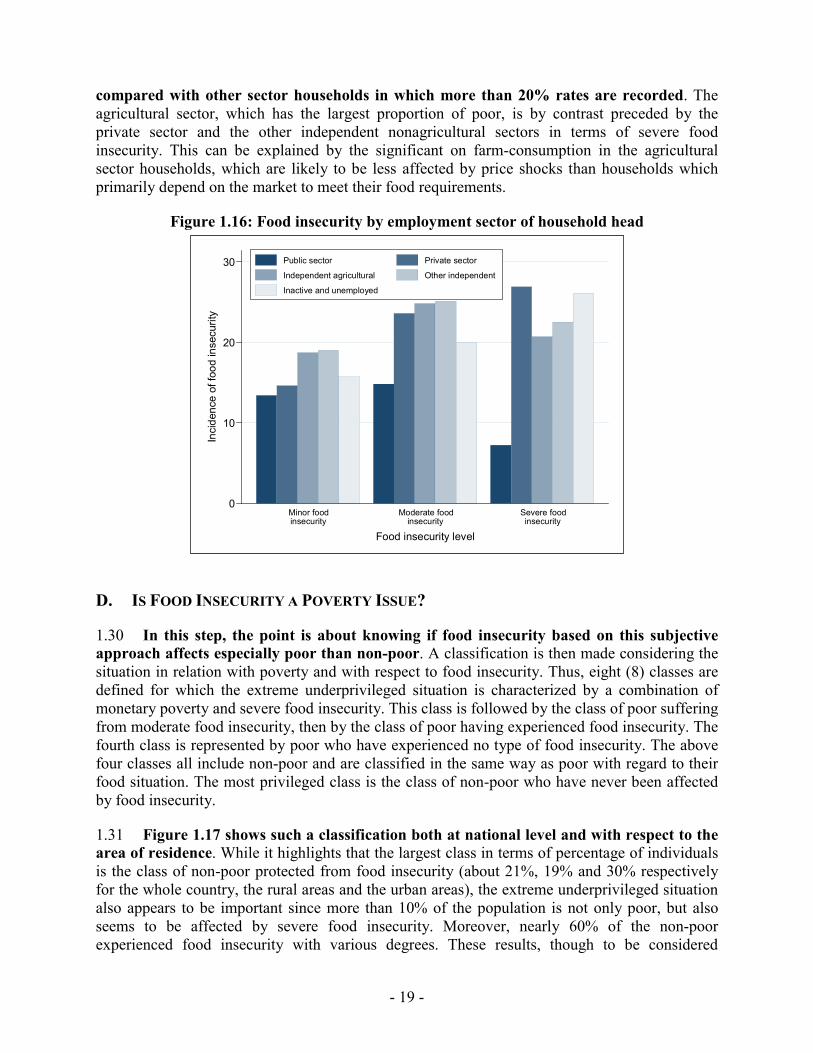
1.29 According to Figure 1.16, households headed by an individual working in the public sector relatively experience severe food insecurity at a lesser extent (less than 10%),
0
5
10
15
20
25
Inci
denc
e of
food
inse
curit
y
Minor foodinsecurity
Moderate foodinsecurity
Severe foodinsecurity
Food insecurity level
No education
Primary level
Secondary level or more
0
5
10
15
20
25
Inci
denc
e of
food
inse
curit
y
Minor foodinsecurity
Moderate foodinsecurity
Severe foodinsecurity
Food insecurity level
1 or 2 persons 3 or 4 persons
5 or 6 persons 7 or 8 persons
9 persons or more
- 19 -
compared with other sector households in which more than 20% rates are recorded. The agricultural sector, which has the largest proportion of poor, is by contrast preceded by the private sector and the other independent nonagricultural sectors in terms of severe food insecurity. This can be explained by the significant on farm-consumption in the agricultural sector households, which are likely to be less affected by price shocks than households which primarily depend on the market to meet their food requirements.
Figure 1.16: Food insecurity by employment sector of household head
D. IS FOOD INSECURITY A POVERTY ISSUE?
1.30 In this step, the point is about knowing if food insecurity based on this subjective approach affects especially poor than non-poor. A classification is then made considering the situation in relation with poverty and with respect to food insecurity. Thus, eight (8) classes are defined for which the extreme underprivileged situation is characterized by a combination of monetary poverty and severe food insecurity. This class is followed by the class of poor suffering from moderate food insecurity, then by the class of poor having experienced food insecurity. The fourth class is represented by poor who have experienced no type of food insecurity. The above four classes all include non-poor and are classified in the same way as poor with regard to their food situation. The most privileged class is the class of non-poor who have never been affected by food insecurity.
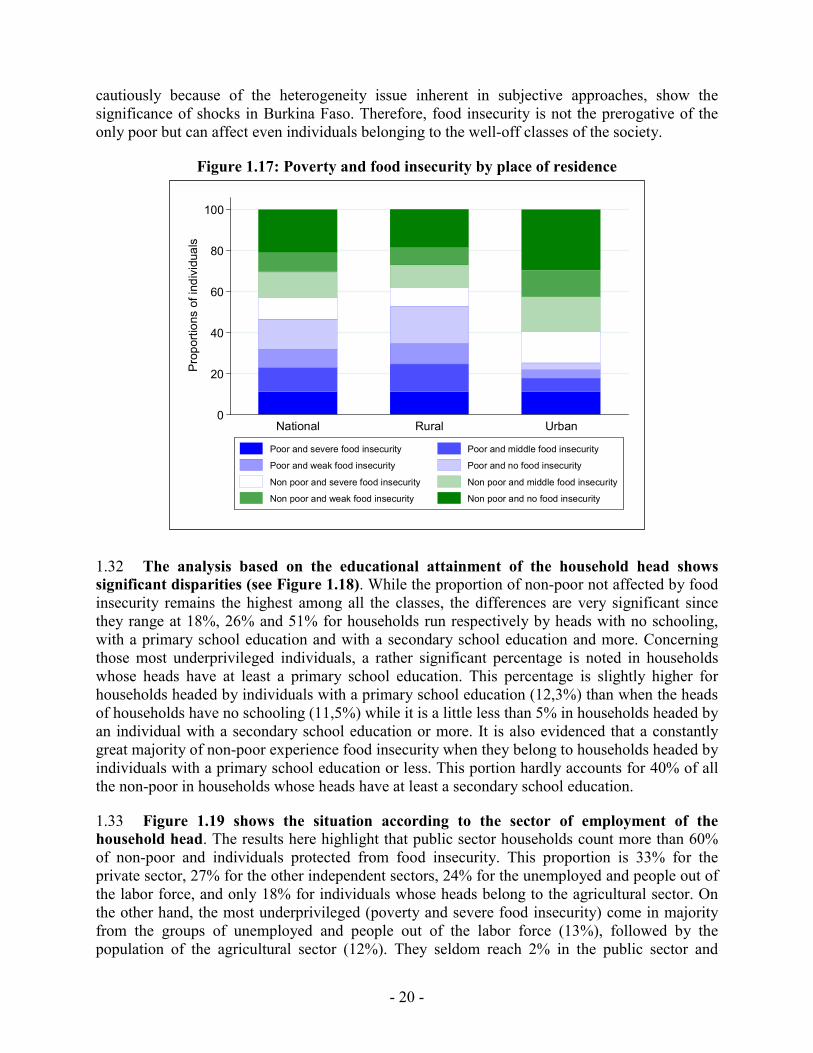
1.31 Figure 1.17 shows such a classification both at national level and with respect to the area of residence. While it highlights that the largest class in terms of percentage of individuals is the class of non-poor protected from food insecurity (about 21%, 19% and 30% respectively for the whole country, the rural areas and the urban areas), the extreme underprivileged situation also appears to be important since more than 10% of the population is not only poor, but also seems to be affected by severe food insecurity. Moreover, nearly 60% of the non-poor experienced food insecurity with various degrees. These results, though to be considered
0
10
20
30
Inci
denc
e of
food
inse
curit
y
Minor foodinsecurity
Moderate foodinsecurity
Severe foodinsecurity
Food insecurity level
Public sector Private sector
Independent agricultural Other independent
Inactive and unemployed
- 20 -
cautiously because of the heterogeneity issue inherent in subjective approaches, show the significance of shocks in Burkina Faso. Therefore, food insecurity is not the prerogative of the only poor but can affect even individuals belonging to the well-off classes of the society.
Figure 1.17: Poverty and food insecurity by place of residence
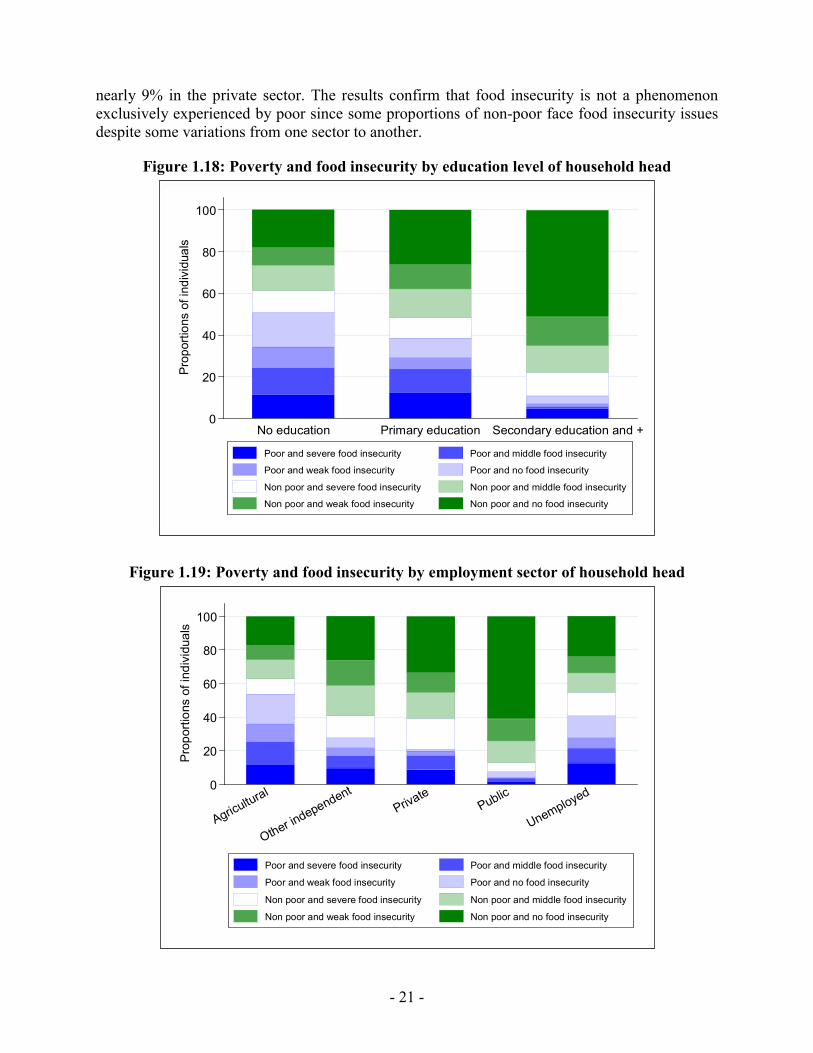
1.32 The analysis based on the educational attainment of the household head shows significant disparities (see Figure 1.18). While the proportion of non-poor not affected by food insecurity remains the highest among all the classes, the differences are very significant since they range at 18%, 26% and 51% for households run respectively by heads with no schooling, with a primary school education and with a secondary school education and more. Concerning those most underprivileged individuals, a rather significant percentage is noted in households whose heads have at least a primary school education. This percentage is slightly higher for households headed by individuals with a primary school education (12,3%) than when the heads of households have no schooling (11,5%) while it is a little less than 5% in households headed by an individual with a secondary school education or more. It is also evidenced that a constantly great majority of non-poor experience food insecurity when they belong to households headed by individuals with a primary school education or less. This portion hardly accounts for 40% of all the non-poor in households whose heads have at least a secondary school education.
1.33 Figure 1.19 shows the situation according to the sector of employment of the household head. The results here highlight that public sector households count more than 60% of non-poor and individuals protected from food insecurity. This proportion is 33% for the private sector, 27% for the other independent sectors, 24% for the unemployed and people out of the labor force, and only 18% for individuals whose heads belong to the agricultural sector. Onthe other hand, the most underprivileged (poverty and severe food insecurity) come in majority from the groups of unemployed and people out of the labor force (13%), followed by the population of the agricultural sector (12%). They seldom reach 2% in the public sector and
0
20
40
60
80
100P
ropo
rtion
s of
indi
vidu
als
National Rural Urban
Poor and severe food insecurity Poor and middle food insecurity
Poor and weak food insecurity Poor and no food insecurity
Non poor and severe food insecurity Non poor and middle food insecurity
Non poor and weak food insecurity Non poor and no food insecurity
- 21 -
nearly 9% in the private sector. The results confirm that food insecurity is not a phenomenon exclusively experienced by poor since some proportions of non-poor face food insecurity issues despite some variations from one sector to another.
Figure 1.18: Poverty and food insecurity by education level of household head
Figure 1.19: Poverty and food insecurity by employment sector of household head
0
20
40
60
80
100
Prop
ortio
ns o
f ind
ivid
uals
No education Primary education Secondary education and +
Poor and severe food insecurity Poor and middle food insecurity
Poor and weak food insecurity Poor and no food insecurity
Non poor and severe food insecurity Non poor and middle food insecurity
Non poor and weak food insecurity Non poor and no food insecurity
0
20
40
60
80
100
Pro
porti
ons
of in
divi
dual
s
Agricultural
Other independentPrivate
Public
Unemployed
Poor and severe food insecurity Poor and middle food insecurity
Poor and weak food insecurity Poor and no food insecurity
Non poor and severe food insecurity Non poor and middle food insecurity
Non poor and weak food insecurity Non poor and no food insecurity

- 22 -
REFERENCES
Balma, L., Cockburn, J., Fofana, I., Kaboré, S. and L. Tiberti (2010), "Simulation of the effects of the economic crisis and response policies on children in West and Central Africa: The case of Burkina Faso," MPIA Working Paper 2010-14.
Barrett, C. B. (2010), "Measuring Food Insecurity," Science, 327: 825-828.
Broca, S. S. (2002), "Food Insecurity, Poverty and Agriculture: A Concept Paper," ESA Working paper No 02-15.
Chaudhuri, S., Jalan, J. and A. Suryahadi (2002), "Assessing Household Vulnerability to Poverty from Cross-sectional Data: A Methodology and Estimates from Indonesia," Discussion Paper No 0102-52, Columbia University.
Chaudhuri, S. (2003), "Assessing vulnerability to poverty: Concepts, empirical methods and illustrative examples," Mimeo, Columbia University.
Christiaensen, L. J. and K. Subbarao (2005), "Towards an Understanding of Household Vulnerability in Rural Kenya," Journal of African Economies, 14: 520-558.
Ligon, E. and L. Schechter (2003), "Measuring Vulnerability," The Economic Journal, 113: C95-C102.
McCulloch, N. and M. Calandrino (2003), "Vulnerability and Chronic Poverty in Rural Sichuan," World Development, 31: 611-628.
Nouve, K., Kafando, J., Savadogo, A., Sebre, D., Tsimpo, C. and Q. Wodon (2009), "Dynamique de la pauvreté sur base des actifs et des perceptions des ménages au Burkina Faso de 2003 à 2007," Perspective Afrique, Vol 4, No 1-3.
Sakurai, T. and K. Savadogo (2009), "Covariate Shocks and Rural Poverty in Burkina Faso," Contributed paper prepared for presentation at the International Association of Agricultural Economists Conference, Beijing, China, August 16-22, 2009.
Sarris, A. and P. Karfakis (2010), "Vulnerability to Covariate and Idiosyncratic Shocks and Safety Net Targeting of Rural Household with an Application to Rural Tanzania," Paper presented at the European Report on Development workshop on Experiences and Lessons from social protection programmes across the developing world: what role for EU?, Paris, June 17-18, 2010.
World Bank (2009), "Burkina Faso: Promoting Growth, Competitiveness and Diversification," Country Economic Memorandum, Report No 51815-BF.
Young, H. and S. Jaspars (2006), "The meaning and measurement of acute malnutrition in emergencies: A primer for decision-makers," Network paper No 56.