Report No. 6420-COB Congo: IssueS and Options in the Energy Sector · Report No. 6420-COB Congo:...
105
Report No. 6420-COB Congo: IssueS andOptions in the Energy Sector J January 1988 L ' ',1 '' 3 < '' - , N 'o e ,t, ~ ~~v 0 , 61~~~~~~~~~~~~~~~~~~~~~~~~~~~~~~~1 ti. A.L. .h .. ~ALJ .'- -- ~ Report ofu dieiu W nrvws LNVbd Bank inergy efr Assesme wor This document ias~a restriced distrbution -Its conterttsmay not be dsdosed, without authorization fo~m-the Govmrn4nt~, tbe 0 UNDP ortibe Wrld8Bank. , T . 1 , . o .~~~~~~~~ t) \ s .. , v . O~~~~~~~~4 ~ Public Disclosure Authorized Public Disclosure Authorized Public Disclosure Authorized Public Disclosure Authorized
-
Upload
phungxuyen -
Category
Documents
-
view
217 -
download
3
Transcript of Report No. 6420-COB Congo: IssueS and Options in the Energy Sector · Report No. 6420-COB Congo:...

Report No. 6420-COB
Congo: IssueS and Optionsin the Energy Sector
J
January 1988
L '
',1 '' 3 < '' - , N 'o
e ,t, ~ ~~v 0 ,
61~~~~~~~~~~~~~~~~~~~~~~~~~~~~~~~1
ti. A.L. .h ..~ALJ .'- -- ~
Report ofu dieiu W nrvws LNVbd Bank inergy efr Assesme worThis document ias~a restriced distrbution -Its conterttsmay not be dsdosed,without authorization fo~m-the Govmrn4nt~, tbe0UNDP or tibe Wrld8Bank.
, T . 1
, . o .~~~~~~~~~it) \ s .. , v . O~~~~~~~~4 ~
Pub
lic D
iscl
osur
e A
utho
rized
Pub
lic D
iscl
osur
e A
utho
rized
Pub
lic D
iscl
osur
e A
utho
rized
Pub
lic D
iscl
osur
e A
utho
rized

, ~ ~ ~ ~ ~ ~ ~ ~ ~ ~ ~ ~ ~ ~ ,
J§INT UNUPIVORLD BANK ENERG SECTOR ASSESSMNT PROCRAI4
Reports Already Issued
Country Date Number
Indonesia November 1981 3543-INDMauritius December 1981 3510-MASKenya May 1982 3800-KESri Lanka May 1982 3792-CEZimbabwe June 1982 3765-ZIMHaiti June 1982 3672-HAPapua New Guinea June 1982 3882-PNGBurundi June 1982 3778-BURwanda June 1982 3779-RWMalawi August 1982 3903-MALBangladesh October 1982 3873-BDZambia January 1983 4110-ZATurkey March 1983 3877-TUBolivia April 1983 4213-BOFiji June 1983 4462-FIJSolomon Islands June 1983 4404-SOLSenegal July 1983 4182-SESudan July 1983 4511-SUUganda July 1983 4453-UGNigeria August 1983 4440-UNINepal August 1983 4474-NEPThe Gambia November 1983 4743-GMPeru January 1984 4677-PECosta Rica Jlnuary 1984 4655-CRLesotho January 1984 4676-LSOSeychelles January 1984 4693-SEYMorocco March 1984 4157-MORPortugal April 1984 4824-PONiger May 1984 4642-NIREthiopia July 1984 4141-ETCape Verde August 1984 5073-CVGuinea Bissau August 1984 5083-CUBBotswana September 1984 4998-BTSt. Vincent andthe Grenadines September 1984 5103-STV
St. Lucia September 1984 5111-SLUParaguay October 1984 5145-PATanzania November 1984 4969-TAYemen Arab Republic December 1984 4892-YARLiberia December 1984 5279-LBRIslamic Republic ofMauritania April 1985 5224-MAU
Jamaica April 1985 5466-JMIvory Coast April 1985 5250-IVCBenin June 1985 5222-BEN
Continued on inside back cover

Fm OMCUL U OLY
Report No. 6420-COB
Isom and Option in the bets Sector
JANRY 1988
Ebis is one of a seies of reports of the Joint IUOI World Bonk ambector Assesamut rorm. Finnce for this work has been provided, in
p-rt, by the Mr Verg &sxcowt, and the work has been carrie out bythe bWrld 1a1k. is report has a restricted distribution-. Its contentsmay not be discload without authorisation frm the o t the mDpor the Wrld Bank.

ABSTRACT
Despite a substantial resource base consisting of biomass,hydropower, and hydrocarbons, energy consumption per capita remains lowas compared to countries with similar revenues. The development ofCongo's energy sector has been severely hampered these last years as aresult of factcs: inappropriate pricing policy with petroleum pricelevels below international prices, investment program planned on lightcil exports revenues which did not materialiie, etc.
This has been aggravated since 1986 by declining internationilprices of petroleum, the country's principal expoit comdodity, which hasbeen depressed by fiscal and foreign exchange earnings from the country'scrude oil exports. Confronted with this situation, the government hasstarted a series of policy reforms including the rehabilitation of energysector enterprises, as part of his public enterprise rehabilitationprogram.
The report analyzes the basic energy supply and demand trendsover the past years and assesses the main policy issues and optionsrelated to energy pricing, subsector investments, and institutionaldevelopment at both the sectoral and enterprise levels. The reportoutlines a strategy aimed at strengthening energy sector management andhighlights the core program for energy investment. It identifiestechnical assistance needs for priority investigations, and institutionbuilding including planning and training in areas pertaining tohydrocarbon production and distribution, electricity rehabilitation, andcharcoal development and its promotion.

aY
ATC Agence Transcongolaise de Communications
CCC8 Caisse Centrale de Coop6ration Economique
CORAW Compagnie Congolaise de Raffinage
DRP Exploration and Production Directorate
EDP Electricit6 de France
HydroCongo Sociit6 Nationale Hydro-Congo
IBRD International Bank for Reconstruction and Development
1W International Monetary Fund
MP Ministry of Finance
MrF Ministry of Forest Economy
we! Ministry of Mines and Energy
SHE Soci6t6 Nationale d'Rlectricit4
UAIC Unite d'Afforestation Industrielle du Congo
WNDP United Nations Development Program

ABRIVIATICS
bbl barrelb/d barrel(s) per dayb/y barrel(s) per yearCIF costs insurance, freightCNO compressed natural gasfob freight on boardft feetCDP gross domestic product00 gas/oil r*tioGih gigawatt-hourha hectareRV high voltagekcal kilocaloriekg kilogramkgoe kilograms of oil equivalentkm kilometerkm2 square kilometerkV kilovoltkV . kilowattkVh kilowatt-hourLPG. liquefied petroleum gasLI low voltagea cubic meterNCF thousand cubic feetMV medium voltageMm megawattNW8 Northwest EuropeOOIP original. oil in placeOGIP original gas in placescf standard cubic feetSTB stock tank barreltoe tons of oil equivalentton metric tont/y tons per yearT.D. total depthT8CP trillion standard cubic feetyr year
seRGAND FM
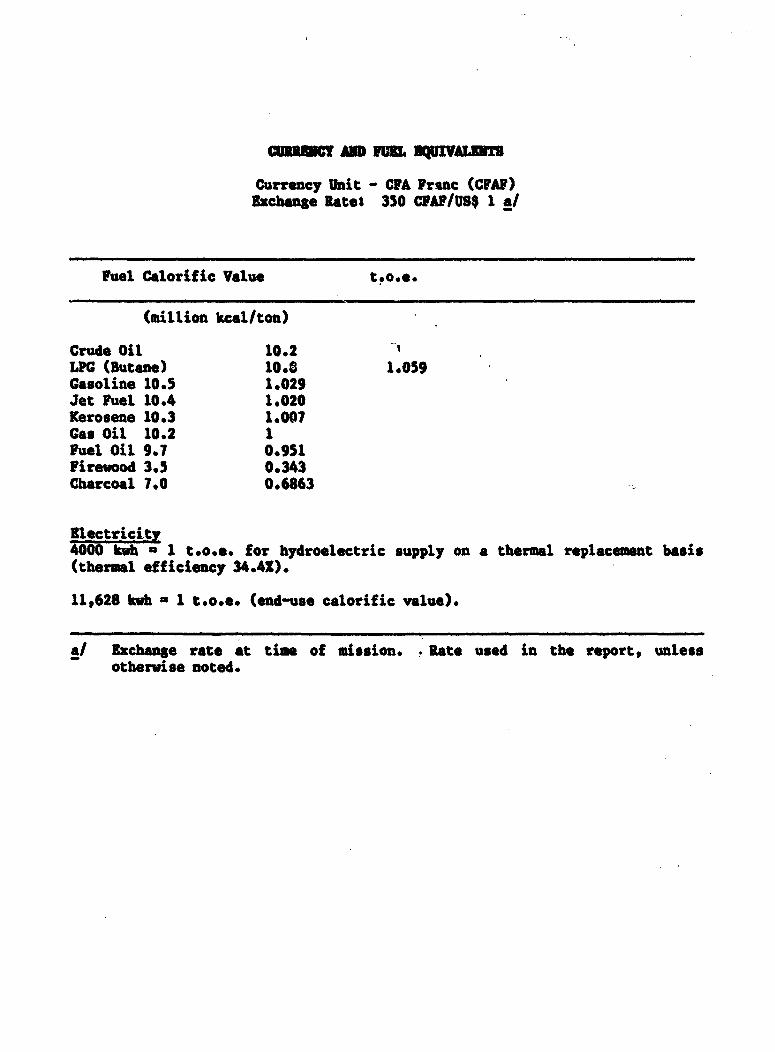
Currency Unit - CFA Franc (CPA?)exchange Rates 350 CFAF/USB 1 a/
Fuel Calorific Value t.o.e.
(million kcal/ton)
Crude Oil 10.2LPG (Butane) 10.8 1.059Gasoline 10.5 1.029Jet Fuel 10.4 1.020Kerosene 10.3 1.007Gas Oil 10.2 1Fuel Oil 9.7 0.951Firewood 3.5 0.343Charcoal 7.0 0.6863
Electricity4000 kwh = 1 t.o.e. for hydroelectric supply on a thermal replacement basis(thermal efficiency 34.41).
11,628 kwh a1 t.o.e. (end-use calorific value).
a/ Exchange rate at time of mission. Rate used in the report, unlessotherwise noted.

TABLE OP COaTNm
PACE
SUMMARY AND PLAN OFACTION. .......................... i
I. ENERGY IN THE ECONOYM ........... 1................... 1Country Backgroundt................ .t ..........,... 1The I 1Energy Consumption Growth Patterns terns............. 2
Commercial Ene r g y 2Traditional Eng... . 2
Present Demand Structure .......e.................... 2
II. PETROLEUM EXPLORATION AND DEVELOPMMNT......... ....... 5Tssues ~~~.... -. -... 0 0 .... 5
Petroleum Reserves and Productionductio.,*********** 5Impact of Oil Price Deel i n e 7Petroleum Development Str yt e g y 10
Monitoring Petroleum Operations.................. 10Improving the Legal and Fiscal Frameworkwr....... 11Feasibility Study for Developing Reserves...0 0 11
Petroleum Exploration Promotion.........e............ 11Coastal Basin ..... .... 0* . 12Central Basin (Onshore).......................... 13
Recommendationsome ntation**.*.**.*............... 13
III. PETROLEUM PRODUCT SUPPLY AND DISTRIBUTION........... 15Tssues....... .................................. ,..... 15
Orgaizton.......... 00000 ........ 15Competitivity of Local Refining withProduct I m p o r t s 17Factors Contributing to High Refining Costs*..... 18
C o n c l u s i o n s ~~~~~~~~20Petroleum Product Distribution....................... 20Petroleum Products Price Structure................... 22Recommendationsm.m..entati............ o ns... ee....... 26
Refining/Product Supply ......................... 26Product Distribution......................e...... 28Product Pr i c e s 28
IV. POWER SUBSECTOR STRATEYE................. 29Issuessues........................................... 29Electricity Demand and Su p p l y 29Organization and Financ n.o........................... 30
Differentiating Commercial and AdministrativeP u n c t i o n s ~~~~~~~~~31
Strengthening SNE 31Resource Mobilization.ilization.................. 32

Rehabilitation/Reliability of Supply................. 34Urban Distribution Bottleneckstlen......ecks..... 35Transmission/Backup at Pointe Noire ire........... 35System Operations Strategy*...................... 36Rehabilitation of existing Hydro plantn.......... 37Autogenerator Backup for SNE 37
Rural Electrification............e......ee........... 38Rural Energy Suppliesoooooo l ieos.......oo...o.o.o 39Technical Options.o t... i o..n.s............ .0..... 39
Natural Gas for Power Generation............oo....o.o 40Recotmendationss............oe.o.................e..o 42
Organization..o.....oooo..o.o..... o......... eo... 42Resource Mobilizationo..o...ee..e.....o.........o 42Priority Investmentso..o..... ..... osee..... .. o. 43Investigationsoosoeeooo*eoooo*oo 43
V. WOOD FUELS AND HOUSEHOLD ENERGY............ o...... .. o. 45Isseoooooo suoes**ooooooooooooo 45Deforestation in Brazzaville. .... o...o...ooo..o..oo. 45
Wood Fuel Demand and Area Deforestation.o....o... 45Impact on Wood Fuel Prices....................... 46
Household Energy Strategyr atoe gy.o..oo..oo.oo.ooo.o.. 49Characteristics of Energy Utilization.o..o..o-.o." 49Interfuel Substitution..o..o.o..oo..o..o..o.....o 49Energy Efficiency Improvementoo.........oo.oo..o 50
Utilization of Existing Plantations,............... 51Potential Charcoal Marketsoroo k e ts..o........o..o 52Charcoal Production Potentia1.....o......oalooo.. 53Production Costs. e.o.o......e.o......o.......... 53Further Considerations.oe rati..e.o oc..ooe.*ooo . 53
Utilization of Wood Residueso i d u es..oooooooooo..oo.. 55Resourceso ooo* oosoooooo............o...........o4 55Utilization Op.... s.i o ns................e.e.c.... 55
Recommendations...o......o... o. oooo.oooonso...... . e 56
TABLES
Table 1.1: Commercial Energy Consumption andComparative Indicators 1978 - 1985....... o 3
Table 1.2: Congo Energy Balance, 1985 ('000 TOE))... o... 4Table 2.1: List of Production Permits.r..ce..ec.c.ecscc. 7Table 2.2: Total Oil Production and Oil Revenueoo.o.o.o.. 8Table 2.3: Government Petroleum Income, 1986-1990
(billion C.FAF)....F...eP )e..e..... o..... 10Table 3.1: CORAr Refinery Characteristics............... 16Table 3.2: Costs of Local Refining Versus Imports
(Thousand US$)..0......... 0..0............ 17Table 3.3: Petroleum Product Prices and Costs by
Geographic Location, April 1986o.......ooo.. 23Table 3.4: Petroleum Products Price Structure: Mid 1986.. 24Table 3.5: Product Prices - Ex CORAF Versus Imports
(Average 1985).o.o.... ............. 0.....0. 25

Tables (Continued)
Table 4.1: Possible Gas Consumption for PowerGeneration, 1995 .................. .......... 42
Table 5.1: Components of Wood Fuel Prices (CFAF/kg)...... 47Table 5.2: Household Energy Consumption of Primary
Cooking Fuels............................... 48Table 5.3: Cooking Fuels in Brazzaville -
Final Energy Prices/Costs................... 50Table 5.4: Household Energy Costs by Income Level*......0 51Table 5.5: Estimated UAIC Charcoal Production Costs,
April 1986 ....... .................... * ... 54
ANNEXES
Annex 1 Congo - Commercial Energy Consumption('000 TE)........................*......... 58
Commercial Energy Consumption andComparative Indicators, 1978-1985........... 59
Annex 2 CORAF Production: 1982-1985 ('000 tons)....... 60Annex 3 Computation of Ex-Refinery Prices
('000 CFF ....,...........61Annex 4 Comparison of Refining and Import Economics... 62Annex 5 Electricity Demand and Supply.................. 72Annex 6 Petroleum Product Transport Differentials
(from Pointe Noire)...... ... ; 79Petroleum Product Price Structure -Early 1986 (CFAF/ton)....................... 80
Annex 7 Comparison of Cooking Fuel Costs.............. 81
MAPS
IBRD 2005 Petroleum Subsector ReviewIBRD 18242 Generating Facilities and Transmission Systems

MWY MD PLAN OF ACTION
Introduction
1. This Energy Assessment Report summarizes the firdings of amission fielded in April 1986. 1/ It draws upon the diagnosticevaluations of several recent energy sector studies. 2/ Rather thanduplicate these analyses, the mission chose to validate their findingsand to use these as the framework for examining the most pressing energysector issues in the aftermath of the 1985 oil price decline (para. 6-9). The resulting report defines a coherent action plan of priorityrecomendations for policy, operations, investment, and institutionalreform.
Overview of Energy and the Economy
2. This report reflects written comments made by the Government inMarch 1987, as well as comments made during discussions with the Ministerof Mines and Energy in August 1987. It should be noted, however, thatthe Government has taken numerous steps since these dates leading toimplementation of the Energy Assessment's recommendations. The missionhas attempted to make -note of this fact wherever possible in the text,and regrets if any of these notations have been ommitted.
3. The People's Republic of the Congo possesses significantpetroleum, hydroelectric, and forestry resources. Its petroleumreserves, estimated conservatively to lie between 1,065 and 2,050 millionstandard barrels, are the lifeblood of the economy. An extensive networkof tributaries of the Congo river provides a large hydroelectric poten-tial, which has yet to be totally assessed. Forested regions, which
1/ Members of the assessment team were: Abderrezzak Ferroukhi (MissionLeader, Senior Energy Economist), David Craig (Deputy MissionLeader, Economist), Lori A. Perine (Researcher), C. A. Chamot(Consultant, Petroleum Exploration and Production', P. Parriad(Consultant, Petroleum Refining and Distribution), J. Hatfiei1(Consultant, Electric Power), and Jean-Roger Mercier (Consultant,Biomass and Household Energy). Principal authors of the report wereL. Perine and D. Craig.
2/ Two extensive analytic studies of the sector were consulted by themission: The People's Republic of the Congos Power SectorMemorandum, IBRD Report No. 5272-COB, September 28, 1984 (Update:June 1985) and Etude de rationalisation des choix energ6tiques,TransEnerg, December 1984.

- ii -
include dense tropical forests in the north, cover two-thirds of the landarea of the country.
4. Per capita energy consumption, 290 kilograms of oil equivalent(kgoe) in 1985, is low relative to countries of similar income. Woodfuels and other biomass account for 461 of net domestic consumption,petroleum products another 45%, and electricity and crude oil (the latterconsumed by the petroleum industry) account equally for the remainder.Households and transport are the major consuming sectors, representing501 and 231 respectively of final demand, which was about 575,000 tons ofoil equivalent (t.o.e.) in 1985. The petroleum industry ranks third with14X of demand. A steady decline in the energy intensity of the economysince 1978, despite rapid growth of total energy consumption during theeconomic boom from 1979 to 1982, reflects the low energy consumption byenergy-intensive productive sectors not related to petroleum.
S. The energy sector plays a crucial role in the development ofthe Congo because the national economy is overwhelmingly dependent on thepetroleum subsector. The revenues from oil production, and the publicinvestments which they finance, have dominated the economy since 1979.By 1985, oil accounted for 401 of CDP, 90% of exports, and two-thirds ofbudgetary receipts. At the same time, accelerated government spendinghad culminated in an acute liquidity crisis and an unsustainableaccumulation of foreign debt. The oil price collapse in late 1985further exacerbated the deterioration of economic stability, promptingthe Government to seek International Monetary Fund (IMF) assistance torestructure its economic and financial policies. Regardless of thesuccess of the IMP-supported adjustment program, the influence ofpetroleum on economic development will continue into medium term.
Priority Energy Sector Issues
6. The Government notes that, even though the petroleum sector hasan important impact on the entire national economy, the contribution ofpetroleum to the national energy balance is relatively small, if woodfuels are taken into account. Petroleum resources are consideredprimarly a "stategic material", as opposed to an energy source for localuse. Consequently, the objectives of national energy policy givepreference to the use of hydroelectric power, and an imported crudebetter adapted to the needs of the Congolese market is be'ng sought toreplace the local Dj6no crude which the Compagnie Congolaise de Raffinage(CORAl) processes in its facilities. CORAP currently is testing importedcrudes to determine their product patterv. Still, the level of crude oilproduction is a key factor in energy sector development. w The relativecosts of supplying petroleum products are influenced by use of locallyproduced crude (Chapter III), although the amount used to meet localneeds is small relative to total production, it affects the costs ofsupplying petroleum products. Exports of crude oil are of even greaterimportance for the sectors this determines in large part the financial

- iii -
resources available for priority energy investments, as well as for thetotal economy.
Impect of the Oil Price Decline
7. The weight of the oil sector in the economy will remain suchthat, during the next five years, any changes in oii prices or productionwill have a much greater impact on economic stabilization than the ef-fects of policy reforms or supply responses in other sectors of theeconomy. Even under the most optimistic oil price scenarios (para.2.10), oil production is unlikely to generate sufUicient revenues tobring total government revenues back to 1985 levels by 1990 (Table 2.3).
8. Future oil production, and consequently government revenuesfrom that production, are highly sensitive to the price of crude oil.The mission estimated the 1990 government oil revenues using twoalternative price paths and corresponding estimates of productionprofiles for major fields (para. 2.11-2.13). In nominal terms, thegovernment take in 1990 varies between 18X and 711 of the 1985 total(225 billion CFAF). These results illustrate the enormous multipliereffect of relatively small increases in oil prices-by stimulatingincreased output, and by taking the larger fields back above thebreakeven point for petroleum income tax liability.
9. The level at which oil revenues can be maintained will becrucial to the timing and financing of future public sector investment.The Government is now obliged to review, modify and possibly deferportions of its investment program: (a) to take into account the suddenscarcity of resources; and (b) to support structural adjustments. Itspetroleum strategy must be redefined to optimize revenue generation forsustained economic recovery. This objective can be achieved in the shortterm through strategies to reduce costs and improve revenue generationfrom current fields and to enhance the medium-term potential for furtherdevelopment as prices recover.
10. The recommendatiocs delineated by the mission to address thisissue (para. 2.29) have been accepted by the Government. Majorcomponents/strategies include technical assistance to: (a) improve themonitoring of petroleum operations (para. 2.14-2.15); and (b) review thelegal and fiscal framework (para. 2.16-2.17); and feasibility studies forrapid development of low-cost reserves (para. 2.18-2.20). The mission'srecommendations for exploration promotion are given high priority in theenergy sector action plan below (para. 31). These items were incor-porated in a Second Technical Assistance Project, which was slated forimplementation in 1987-88 and financed by the World Bank.

- iv -
Refining/Product Supply
11. Under the technical configuration and economic conditions ofearly 1986, local refining was not compatitive with product imports(para. 3.7-3.9). It cost the economy between US$8 and US$12.5 million torefine products rather than to import. Various factors contributed tohigh ex-refinery costs: Technical factors such as the low volume ofrefinery throughput, unsuitability of the local crude, and poor energyefficiency increase the unit cost per ton of processed crude (para. 3.10-3.12). Uneconomic export of surplus fuel oil and stagnating local demandwere the major marketing difficulties encountered (para. 3.10, 3.13).Stagnating local demand was a constraint to increasing refinerythroughput. Excess fuel oil was marketed under terms which under-estimated its potential market value. Finally, economic and financialdifficulties arose from high operating costs, attributable primarily toexcess expatriate technical assistance, and financial charges on creditextended for crude oil purchases and unsecured sales to HydroCongo(para. 3.14).
12. The mission recommended that, in order to reduce the cost tothe economy of supplying finished products, the Government adopt a leastcost solution for product supply, based on sound economic criteria.Products should be purchased at or near import parity, whether they arerefined locally or imported (para. 3.15). As an initial step, theGovernment should establish its ex-refinery prices based on the cost ofimporting products (para. 3.25). Then, the Government should considerthe following supply options: (a) CORAW delivers products to HydroCongoat the new ex-refinery price; (b) alternately, or if the first option isnot viable, the refining facilities are sold or leased to an independantoperator, the supply of refined products is open to competitive bidding(in which the refinery is free to participate) and CORAW is abolished;(c) alternately, or if neither (a) nor (b) is viable, import all finishedproducts for as long as the cost of importing is more competitive thanrefining costs (para. 3.25). A new procurement system and mecbanisms formonitoring the efficiency of refining and/or procurement would have to beestablished in all cases (para. 3.26).
13. Many of the measures recommended by the Energy Assessment andby subsequent World Bank missions have been implemented since 1986 toimprove the management of CORAW and to reduce its operating costs. TheGovernment is testing a lighter crude, Palanca from Angola, to replacethe local Djeno crude. In addition, CORAW had reduced the number ofexpatriates in its staff by 14 as of August 1987. As CORAW is one of thepublic enterprises which has been targeted by the Bank's PublicEnterprise Sector Adjustment Operation, the Government has committeditself to taking action beyond the recommendations of the EnergyAssessment to reform CORAW management and the resolve associated problemof excessive refining costs.

Product Distribution
14. Petroleum product distribution, handled by HydroCongo, isplagued by excess distribution costs. These are largely the result ofthe disproportionate increases in HydroCongo perbonnel and financialcosts since 1974, when HydroCongo took over the assets of the oilcompanies active in product marketing. The incentives for HydroCongo tostreamline its operations are limited. Efforts to reduce costs have beenhampered by the lack of a cost accounting system for each product, withseparate identification of each cost item from purchase through to finalsale (para. 3.16-3.17).
15. HydroCongo has received a large amount of specialized technicalassistance in recent years and the actions required for financial rehabi-litation of the enterprise are well defined. In addition to recommendingthe immediate implementation of recommendations arising from previoustechnical assistance, the mission suggests that: (a) HydroCongo's legalmonopoly on distribution be eliminated; (b) as many of HydroCongo'sfunctions as possible be sold or sub-contracted; and (c) HydroCongo'srole be restricted to that of a wholesaler (para. 3.18). In addition, acost accounting system must be introduced to aid in the development of aproduct price structure reflecting actual economic costs (para. 3.23).These recommendations have been incorporated variously in the WorldBank's Second Technical Assistance Project for petroleum and its PublicEnterprise Sector Adjustment Operation.
Product Prices
16. The recommendations for both refining/product supply andproduct distribution should facilitate the correction of distortionsfound in the current price structure (para. 3.21-3.22). Based on thesechanges, the mission is recommending that the Government build up newproduct price structures for each major point of delivery, and define amatrix of taxes and government subsidies to account for differentials(para. 3.23). The Government must clearly define its subsidizationpolicies to strike a balance between revenue requirements of productdistribution and desired price levels for retail prices (para. 3.23). Atthe same time, the Government should make constructive use of its fiscalpolicy to serve as a revenue generation mechnanism and to recover therent arising from fluctuations in the major cost components (para. 3.22-3.23).
Power Subsector Strategy
17. The clarification of commercial and adminstrative functions isa priority for facilitating subsector planning and assuring coherentsubsector management. SNE is legally responsible for all aspects ofpublic electricity supply. However in recent years, the planning,financing and execution of all new major generation and transmissionprojects has been taken over by the MM4. Under these circumstances, the"de facto" role of SNE has been reduced to maintaining and operating the

- vi -
generation and transmission facilities handed over to it by the MNE,although it still has full authority over distribution systeminvestments. As there is no integrated planning of operations andinvestments, system development has been haphazard and costly, makingcomplete recovery of generation, transmission and distribution costsimpossible. Both parties regard the present arrangements as transitionaland recognize that SNE must be strengthened before resuming fullresponsibility for public sector electricity supply.
18. The next step is for the Government and SNE to agree as soon aspossible on the scope and financing of a program to restructure SNE and atimetable for its execution. A policy framework must also be developedso that sector investments reflect the least cost means of meetingdemand.
19. Electricity tariffs have not changed since 1976 in most of thecot'ntry, and since 1982 in the area served by the Moukoukoulou hydroplant (pira. 4.13). They were reviewed by glectricit6 de France (EDP) in1982, wich the aim of simplifying the structure and increasing rates tobring them more in line with marginal costs. SNE is reluctant toincrease rates without first improving its reliability of service.However, in light of SNE's financial and budgetary difficulties, themission recommends that the tariffs be progressively raised by 30-50X assoon as possible. Other required actions are: (a) the EDF study shouldbe updated on the basis of a least cost development plan and (b) aninstitutional mechanism should be introduced to ensure regular tariffrevisions (para. 4.14)..
20. There is significant potential to mobilize additional resources(para. 4.15) in the medium term through improved revenue collection(para. 4.11), reduction of technical losses in the distribution systems(para. 4.21), and increased sales. Timely completion of the Moukoukoulouinterconnection (para. 18) and the distribution rehabilitation programwill contribute to increasing sales, which are essential to SEE'sfinancial recovery.
21. The power supply system operated by SNE consists of twoindependent networks centered on the country's two population centers(Brazzaville and Pointe Noire). The distribution systems for the twonetworks are in very poor condition due to saturation and insufficientmaintenance. This is the major factor in the low reliablity of supplyfrom SNE, which otherwise has few problems with either generation ortransmission failures. These networks are being linked by a 225 kVtransmission line, which should be operational by late 1988 (para.4.5). Surplus capacity at the Moukoukoulou hydro plant (located nearLoudima) then will be absorbed ivto the system, significantly reducingcurrent need for imports from neighboring Zaire (para. 4.18).
22. In the short term, while the subsector is being restructuredand strengthened, SUE should concentrate its efforts on: (a) obtainingthe greatest economic benefit from existing productive assets; and

- vii -
(b) achieving acceptable levels of reliability. A project torehabilitate the saturated distribution systems in Brazzaville and PointeNoire is underway (para. 4.21-4.22). Disbursements have slowed as theCongo adjusts to the fall in oil prices, and work is now scheduled forcompletion in 1990. Problems still remain, however, in regard to:(a) the deteriorating condition of existing hydro plant; (b) the lack ofbackup capacity at Pointe Noire; and (c) the absence of an op-ratingstrategy for the interconnected network.
23. The full power output from both of the major hydro plants,Moukoukoulou and Djoue (located in Brazzaville) will be utilized once theinterconnection is finished. Rehabilitation work required for Djou6 hasbeen budgeted into SNe's work program over the period 1986-1989(para. 4.28). At Moukoukoulou, extensive work is needed on ancillaryequipment and on other problems which must be corrected to improve outputand increase/maintain the reliability of generating capacity(para. 4.28).
24. The need for backup at Pointe Noire cannot be eliminated. Inthe meantime, SNE should investigate ways to increase the reliability ofthe single 225 kW/11O kV line which links the city to Moukoukoulou. Thepr, ram of preventive maintenance must be reviewed to ensure futuresystem reliability (para. 4.23). Reliability standards for the systemmust be developed and implemented through a least cost combination ofinvestments in transmission reinforcement, private thermal backupcapacity from major autogenerators (para. 4.29-4.39). SNE shouldcomplete all necessary studies and subsequent investments no later than1990.
25. A system operations strategy will be needed to realize the fullbenefits of the interconnected system upon completion and ensure thatthere are adequate arrangements for system operations (para. 4.25). Inaddition, a central system control center (para. 4.16) should be definedand implemented which would be compatible with the local control centersplanned for the Brazzaville and Pointe Noire distribution networks.
26. The mission has recommended as a high investment priority thetimely completion of the interconnection, based on its review of thecosts associated with delaying completion (para. 4.19). Other than this,no large investments in generation or trar mission will be required inthe power subsector in the short- to medium-term. Therefore, SNE shoulddefer all investment plans pending the rehabilitation of existinginfrastructure and the restructuring of subsector organization. Thisincludes deferring investment plans for rural electrification until acomprehensive review of rural energy needs and supply options isundertaken. (para. 4.33-4.39). The requirement for investment in backupcapacity at Pointe Noire should be examined as recommended above(para. 24).

- viii -
Demand Management and Wood Energy Strategy
27. Autbarities are concerned by the relatively high supply costsfor wood fuels: (a) because they are perceived as a measure of theextent of area deforestation (para. 5.7); and (b) because of their impacton household budgets (para. 5.9; Table 5.4). Two strategies are availa-ble to the Government to reduce these costss finding new sources ofsupply closer to the market or improving end-use efficiencies.
28. Justification for the first strategy is predicated on theassumption that wood fuel demand is a principal factor in areadeforestation. According to the mission's estimates, however, theconnection between wood fuel demand and deforestation is not yetsignificant (para. 5.4). In addition, this option does not reduce supplycosts (para. 5.8). The mission recoomends that no further outlays bemade for peri-urban plantations until the necessity of these projects isconfirmed within the context of a global analysis of wood fuel supply anddemand (para. 5.29-5.30).
29. On the other hand, there appears to be considerable potentialfor using wood residues from existing plantations for charcoal production(para. 5.15-5.23). Utilization of "free" residues from plantationoperations offer a substantial reduction in charcoal production costs.Any charcoal production projects developed in the short term would haveto be export-oriented. However, an increased supply of low-cost charcoalis likely to stimulate local demand in the medium term. A nationalcharcoal production and marketing strategy stould be investigated anddeveloped (para. 5.29).
30. The most promising strategy for reducing wood fuel supply costsin the short term is found in improving end-use efficiencies, primarilythrough improved stove technology. With adequate training, consumersusing improved stoves can reduce the amount of wood consumed by 402 to55X (para. 5.12), while incurring limited additional investment costs.The drawdown on wood resources also is reduced proportionately. 4program of demand management centered on utilization of improved stovesshould be initiated (para. 5.12-5.14; para. 5.29).
Priority Action Plan
31. These key elements of the mission's recommendations for theenergy sector have been selected for priority implementation for theperiod to 1990.
Core Program for Public Investment
32. The following projects, all in the power subsector, shouldreceive absolute priority in the investment budget until 19902

- ix -
(a) completion of the Loudima-Brazzaville transmission link;
(b) completion of rehabilitation and conversion to 20 kV of theBrassaville and Pointe Noire distribution networks; and
(c) Projects defined by the priority investigations listed below(para. 34).
33. Projects that should be deferred and reviewed subsequent toother recommended actions include:
(a) Major hydro and transmission projects for rural electrification(Chapter IV);
(b) Peri-urban fuelwood plantations - pending the completion of acomprehensive analysis of household energy demand and its rolein wood consumption/deforestation (Chapter V).
Priority Investigations and Promotions
34. The following investigations and promotions should be launchedduring 1987/88: 3/
(a) A review of petroleum development strategy, including possibleimprovements to the fiscal framework (US$140,000);
(b) Exploration promotion of onshore acreage (the Kayes permit ofthe Coastal Basin, and the Central Basin) and 1987 offshorerelinquishments (US$0.7-1.3 million);
(c) Design of a network operating strategy for the new Brazzaville-Pointe Noire interconnected system (US$60,000);
(d) Definition of the least cost arrangement for ensuring adequatesecurity of supply for electricity consumers in Pointe Noire(US$60,000);
(e) Feasibility studies of Mi) rapid development of low cost,onshore oil fields (US$40,000), and (ii) recycling of theoffshore Litchendjili gas-condensate field (US$5O,OOO);
3/ Since the Energy Assessment mission, two donors have expressedinterest in financing the highest priority investigations in thepower subsector: (a) tht World Bank, through its proposed SecondTechnical Assistance Project; and (b) the UNDP/World Bank EnergySector Management Assistance Program (ESMAP), using funds to beprovided by the French Government.

(f) Detailed design of a rehabilitation program for the Djoue andMoukoukoulou hydro stations (US$120,000);
(g) Preparation of a program to promote private production andmarketing of high efficiency woodstoves for household cooking(US$450,000); and
(h) Economic and financial evaluation of charcoal production,initially for export, from existing plantations at Pointe Noire(Us$150,000).
Institutional Reform
35. The Government should take advantage of the current period ofadjustment to remove the main organizational constraints to efficientoperations in the energy sector:
(a) New es-refinery pricing and/or procurement arrangements shouldbe introduced to ensure that petroleum products are supplied tothe country at the lowest possible cost.
(b) HydroCongo should sell or subcontract as many non-corefunctions as possible.
(c) The Government and SYE should agree as soon as possible on thescope, financing and timing of a program to strengthen SNE; themedium term objective is for SNE to take completeresponsibility for public sector commercial electricity supply.
(d) The Government should assess ways to promote private generationby entrepreneurs or consumer cooperatives.
Manpower Planning and Training
36. In parallel with the program of institutional reform, thefollowing manpower planning and training activities should be launched assoon as possible:
(a) technical assistance and training to develop MZ's capacity tomonitor petroleum operations and HydroCongo's capacity to auditthe accounts of joint ventures;
(b) training of a small group of senior Congolese staff in theprinciples and operating methods of international oil markets;and
(c) continued technical assistance to SYE to improve customer andfinancial management, and additional inputs for: (i) design ofa technical assistance and training program for the SNE staffwho will operate the new interconnected network;(ii) eLtablishment of a manpower planning system and overallstaff training plan; and (iii) establishment and training of a
. i .

I. 1ID.CY IN ?a SCONOKY
Country Background
1.1 The People's Republic of the Congo covers a roughly "J"-shapedarea of 342,000 km in equitorial Africa. An extensive network oftributaries of the Congo River, which forms the border with Zaire to thewest, provides the primary transportation link between the populous southand the densely forested Central Basin in the north.
1.2 Since before independence in 1960, the Congo has been distin-guished by its high degree of urbanization. Nearly 55% of the totalpopulation of 1.91 xillion is found in urban areas, primarily in thecapital, Brazzaville (595,000 inhabitants) and in the port-industrialcity of PcAnte Noire (297,000 inhabitants). Over 802 of the totalpopulation lives in the axis delimi;ed by these two cities.
The Economy
1.3. The Congolese economy is dominated by oil. In 1985, oilaccounted for 40X of CDP (944 billion CFAF in total), 90Z of exports andtwo-thirds of budgetary receipts. Trade, transport and services accountfor the second largest portion (29X) of GDP; oil revenues spawned rapidgrowth of activity in 'rhese sectors after 1979. By contrast, non-oilproductive sectors such as agriculture and forestry contribute only 7X ofGDP. Agricultural output has fallen in real terms since 1979, whileforestry, once the principal source of export earnings, has remainedstable.
1.4 The GDP grew at an annual rate of 14.2X in real terms from 1979to 1983, only to slow in 1984 and 1985 as oil output declined. Publicinvestments, which had quadrupled from 1979 to 1984, were scaled down.As a result, the Government experienced an acute liquidity crisis andincurred substantial arrears in foreign debt in 1984 and 1985. TheGovernment attempted to stabilise the economy with a "structuraladjustment program" developed on its own and adopted in mid-1985.However, the oil price collapse in late 1985 caused the situation todeteriorate rapidly. Projected oil revenues for 1986 and 1987 tumbledrespectively to one-thiro and one-fifth of 1985 levels (223 millionCPA?). In mid-1986, the Government requested IMF assistance torestructure its economic and financial policies in order to wean theeconomy from its overwhelming dependence on petroleum revenues.Petroleum's medium term influence will continue to be great, however.

-2-
Energy Consumption Growth Patterns
Commercial Energy
1.5 TablA 1.1 summarizes the evolution of total commercial energy(electricity and petroleum products) from 1978-1985. Consumption grew atan average annual rate of 6.15% during the economic boom, then droppedsharply in 1984-85. Per capita consumption displayed similar growth, asthe growth rate of energy consumption outstripped that of the population.By contrast, the energy intensity of the economy marked a consistentdecline. This reflects the general low growth of the (non-oil) energyintensive sectors of the economy. A breakdown of commercial energyconsumption by fuel and product is presented in Annex 1.
Traditional Energy
1.6 There is no documentation of the evolution of consumption oftraditional fuels, primarily wood fuels (firewood and charcoal). In mostsub-Saharan African countries, the consumption growth rate is at leastequivalent to the population growth rate. Recent growth rates may beslightly less, as commercial fuels gradually are being substituted fortraditional fuels. Based on the mission's observations of per capitaconsumption (para. 5.9), current consumption of wood fuels is estimatedat 770,000 tons/yr (wood equivalent), 97X of which is consumed byhouseholds. Interestingly enough, household consumption of wood fuels isprimarily in the form of firewood; estimates indicate that only11,000 tons of charcoal are consumed annually.
Present Demand Structure
1.7 The 1985 energy balance for the Congo (Table 1.2) gives thestructure of demand. Wood fuels and other biomass represent 462 of netdomestic consumption, petroleum products another 452, and electricity andcrude oil (the latter consumed by the petroleum industry) account equallyfor the remainder. By sector, households are the largest consumers,accounting for 502 of the final demand; over 85Z of household demand issatisfied by wood fuels. Transport, the major consumer of petroleumproducts, contributes to 232 of demand. The other major energy consumingsectors are the petroleum industry and other industry, which contribute142 and 102, respectively, to final demand. It is interesting to notethat the petroleum industry itself is the second largest consumer ofpetroleum products (222 of net consumption).

Table 1.1: COMMERCIAL ENERGY CONSUMPTION ANDCOMPARATIVE INDICATORS 1978 - 1985
1978 1979 1980 1981 1982 1983 1984 1985
Commercial EnergyConsumption ('000 toe) 250.10 245.40 261.56 270.61 304.45 335.18 291.35 300.00
Growth Rate (S/yr) -1.88 6.58 3.46 12.50 10.10 -13.08 2.97
Per CapitaConsumption (kgoe) 163 154 159 158 171 182 152 lSI
Energy Intensity(kgwoe per CFAF) 8/ 0.90 0.80 0.73 0.61 0.60 0.64 0.51 0.54
Energy Coefficient b/ -0.19 0.37 0.14 0.96 2.80 -1.52 -0.96
a/ Energy consumed per CFf of GOP. GOP In 1980 CFAF.;/ Ratio of growth of commercial energy consumption to GDP growth.
Source: Annex 1.

Table 1.2t OM n ULIII, 1964#00o TM)t
Prtwy b y Petle m Pi te
Agrle Orutb To. Pot.FeevtWed ResIduSI lf&*o Ott Ct eOl F1otl AvgUs LPG 01 Obl e rodWtt TOTAL
oft" supplProductl-m .00oo 6.12 70.96 3,007.00 0.00 6,201.06luposts 7.23 22.U 9.40 0.86 0.56 33.46 40.69Prlry fiports (5,226e00) 0.00. * (226.00)Stock Ckegs (4.16) (0.66) (2.10) (.9 (06.03) 1.6) (15.06)
Tat. AvaIl. Suply 27.0o 6.12 70.96 621.00 0.00 7.25 (4.161 21.96 7.30 (8.09) 0.66 0.53 17.t0 1,000.12
RftflIng (598.72) 9.16 34.29 126.30 339.77 4.19 .33 M.O (26.67)Charoa Prod. (25.3) 7.60 (17.73)Ttanl Sam. 0.13 (0.65) (0.5) (0.52)lY&O GM. (70.96) 24.41 (46.53)
uorodutln 0.00 0.00 0.00Tres. ed OIet.
Losses (4.76) (4.761Stk Cha_ges (0.76) (O.13) 1.2S (1.761 (0.030 (0.5) (2.00) (2.001
Ret SupPly 251.67 6.12 0.00 22.26 7.60 27.01 54.22 56.t3 134.19 329.32 0.84 4.tt 80.33 7.21 901.68
-ee E ort (286.74) (266.74) t266.74)Bme Sels (0.201) 24.04) t12.10 (3.07 (0.00) (39.41) (39.41)
Not Onstic Coms. 251.67 6.12 0.00 22.2 7.60 27.01 54.02 21.22 10.66 122.10 37.51 0.80 4.17 8.33 29.06 573.73Haesahold/OuM 245.67 7.60 9.90 21.22 L2.9 337 27.29 288.45Tranort 53.79 10.86 66.6 0.80 132.19 1319Petoleum I"d 22.26 28.96 21.06 6.3 3.40 60.66
Itbr Indsr $.00 6.12 14.01 12.72 16.43 0.E0 29.95 "3.06Agrleolftr 7.21 7.21 7.21PubflNOlvil Works 3.10 0.25 M.D 4.035 7.1

II. PETROLIKM ZZPWRATIOI AND DEYUTOIIhhMT
Issues
2.1 Petroleum has provided the stimulus behind economic growth andhas dominated the economy since 1979 (para. 1.3-1.4), to the extent thatall plans for public sector investment now are contingent upon thecontinued ability to generate oil reserves. The Government notes that,even though the petroleum sector has an important impact on the entirenational economy, the contribution of petroleum to the national energybalance is relatively small, if traditional fuels (e.g. fuelwood) aretaken into account. The State's objectives include the gradual reductionof petroleum consumption relative to national energy consumption and thepromotion of hydroelectricity, as well as use of a crude oil betteradapted to the local refinery's configuration. In this context, theauthorities responsible fot the sector consider crude oil, produced forexportation, to be primarily a "strategic r;aterial" for generatingresources for investments. The weight of the oil sector in the economyduring the next five years, will remain such that any changes in oilprices or production will have a much greater impact on economicstabilization than the effects of policy reforms or supply responses inother sectors of the economy. The present chapter therefore outlines anaction program to ensure that oil revenues make the maximum possiblecontribution to the resources available during the adjustment period andfor national development in the medium term.
2.2 As background to the action program, the chapter (a) brieflysummarizes the results of a recent review of the Congo's petroleumresources, and (b) examines the impact of alternative future oil pricepaths on oil production and oil-related government revenues. On thebasis of this analysis, the misiion proposess
(a) an action program to develop petroleum production and revenuesin the short and medium term; and
(b) suggestions for exploration promotion to ensure continuation ofpetroleum development in the longer term.
Petroleum Reserves and Production
2.3 The Congo has two sedimentary basins (Map IBRD 20005), theCoastal Basip (28,000 km') and the interior Central Basin or Cuvette(100,000 ki'). The Coastal Basin consists-- of an onshore segment(7000 ki2) with little oil priduction to date, an offshore shelf area(0-200 m) of about 7,800 km with abundant production, and a deepoffshore section (200-300 m) with no discoveries or production. TheCoastal Basin geological section is divided by an evaporite layer (salt)

-6-
into a pro-salt lower section and a post-salt upper section. The bulk ofthe present reserves lies in the post-salt section where exploratorydrilling is easier and cheaper. As it is remote and difficult to access,the only study of the Central Basin has been a reconnaissanceairimagnetometric survey.
2.4 In total, about 540 weils have been drilled in the Congo, andmore than 60,000 line-km of airmag and 50,000 line-km of seismic havebeen acquired and interpreted. A small gas and oil discovery at PointeIndienne in 1958 was followed by major oil discoveries by Elf Congo in1969 (Emeraude) and by Agip Resources Congo (ARC) in 1971 (Loango). Inall, there have been 40 wildcat wells over structural leads with oilandior gas shows; of these possible discoveries only 12 have been deline-ated and nine put into production. Despite the considerable explorationeffort already undertaken, in 1986 there was still significant potentialfor adding new reserves:
(a) There are 22 discoveries yet to be delineated - seven to tencould eventually be commercial, with potential reserves ofabout 250 to 500 million barrels.
(b) Approximately 26 known structures still have not been drilled.
(c) There is a high probability of discovering additionalstructures below the salt layer in the Coastal Basin, includinga possible major field.
2.5 Known hydrocarbon reserves are located entirely in the CoastalBasin; about 91Z are offshore. The estimates of remaining produciblereserves of oil (including condensates) and non-associated gas fromdeveloped, delineated and non-delineated discoverie;t (36 oil bearing and17 free-gas-bearing structures) vary according to the rate of recovery 1/and the reserves-to-production ratio. They range from 1065 million stocktank barrels (STB) at low recovery rates to more than 2000 million STB.For non-associated gas, the estimates are around 800 million STB and 1634million STB respectively, as of January 1, 1986. These estimates areconservative, since no allowance is made for promising indication ofadditional reserves.
X 2.6 Exploration permits as of January 1, 1986 are listed inTable 2.1. Exploration blocks (and production permits) are shown on MapIBRD 20005. The two main exploration permits are Madlngo with AgipResources Congo as the titleholder, and Pointe Noire Grands Fonds (PNGF)with Elf Congo as the titleholder. These two companies have a cross-
I/ In effect, the recovery rates of Congolese crudes are variable and/or lowfor some fields (4Z at Emeraude, without injection). The rates for otherfields vary from 15 to 27Z, depending on the recovery technique.

-7-
interest (65135) agreement for all their operations. Both permitsexpired in November 1987. Amoco and Conoco also have active explorationpermits offshore.
2.7 Oil production in the Congo began on a small scale at PointeIndienne in 1960; the large, offshore Emeraude field started productionin 1972. The nine fields in production in February 1986 produced at arate of 115,000 b/d. All producing fields are in the -wastal Basin.
Table 2.1: LIST OF PRODUCTION PERMITS, 1986
Coapany No. of ProductionName (with % Interest) Area fields (Feb. 1986)
(km') (b/d)
Pfinte Indienne Elf Congo (100) 10.7 1 1a4Emeraude Elf (65), Agip (35) 331.0 1 22,06SLoango E AgIp (65), Elf (35) 50.6 1/2
21,351Loango V Elf (65), AgIp (35) 65.1 1/2Llikouala Elf (65), AgIp (35) 63.4 1 18,965SendjI-Yenga Elf (65), Agip (35) 170.0 2 52,718Mango 1/ Elf (85), HC b/ (15) 24.0 1 228KundjI a/ Elf (85), HC (15) 98.7 1 179Cindi a/ Elf (85), HC (t5) 100.0 1 45Tchlbouela Elf (65), AgIp (35) 135.0 1 -Zatchl Agip (65), Elf (35) n.a. 1
a/ Production from these fields is not subject to royalty calculationsince their balance sheet Is highly negative.
bl HC a HydroCongo
Sour--e: MNE and HC
Impact of Oil Price Decline
2.8 The growth of oil production and total government oil revenuessince 1980 is presented in Table 2.2.

- 8 -
Table 2.2 TOTAL OIL PR9IUCTION AND OIL REVENUE
1980 1981 1982 1983 1984 1985
Production (million bbl) 18.6 23.1 33.2 36.9 33.5 41.3Revenue (billion CFAF) 72.6 133.2 150.7 160.6 213.3 224.5
Source: WM, NME, IW mission.
2.9 Government oil venues comprise royalties, petroleum incometax and, in some c4 after-tax profit on government equityparticipation. Each fit. is governed by an Exploration Agreement("Convtation") that establishes the royalty (14.5-17.5X), the income taxrate (55-75X), and the Government's participation (at least 501), eitherdirectly or through HydroCongo. Profits and the royalty are computed onthe basis of a fiscal reference price that is defined by the legal textslinking the companies to the Government. Approximately 80X of the taxdue each year is paid within that year.
2.10 The mission retained two scenarios to illustrate thesensitivity of future oil production and government .oil revenues to theprice of crude. In terms of the Congo's fiscal reference price, thescenarios are (in current US$/bbl):
1986 1987 1988 1989 1990
LOW 14 14 15 16 16HIGH 15 17 19 22 25
On the basis of these alternative price paths, the mission estimatedproduction/development expenditures and corresponding production profilesfor each of the major fields. The main assumption underlying the lowscenario is a slippage in the implementation of the two-stage Tchiboueladevelopment (76,300 b/d in 1990). The high scenario takes intcaccount: (a) additional field maintenance resulting in improved yields;(b) full development of Tchibouela; (c) staged development of Zatchi; and(d) initial production in 1989 of Tchendo - a field for which delinea-tion is almost complete (130,600 b/d in 1990).
2.11 This information was taken as the basis for estimatinggovernment oil revenues from all sources, field by field. Theconsolidated results are presented in Table 2.S. In nominal terms thetotal government take in 1990 varies between 1US and 711 of the 1985 cashtotal (225 billion CFA&). These results illustrate the enormous

multiplier effect of relatively small increases in oil prices-bystimulating increased output, and by taking the larger fields back abovethe breakeven point for petroleum income tax in particular.
Table 2.3: GOVERNMENT PETRLEUt INOME, 1986 - 1990 a/ b/
1986 1987 198B 1989 1990
Low Price Path(billion CAF) 33.9 32.1 44.5 53.8 40.1(mIIIIon USS) 96.9 91.8 127.3 153.7 116.4
(15I) (14S) (20%) (24%) (18%)
High Price Path(bIIIon CFAF) 37.7 44.3 72,6 95.1 160.0(million USs) 107.8 126.4 207.5 265.9 457.2
(17%) (20%) (32%) (41%) (71%)
a/ Figures In parentheses IndIcate nominal total as a percontageof total government take In 1985 (225 bIlIIon CFAF, cashbasis).
b/ Totals may not add due to rounding.
Source: Mission estimates.
2.12 Oil revenues accounted for 671 of total government revenues in1985. Under most plausible oil price scenarios for 1986, total govern-ment revenues will be less than half the 1985 total. Even under themission's more optimistic price scenario, the rate of recovery of govern-ment revenues will be slow and will be only partially complete by 1990.In such difficult circumstances, the Government should take all possiblesteps to:
(a) reduce production costs and improve revenue generation fromexisting fields;
(b) increase revenues by promoting rapid development of small, low-cost reserves, where viable; and
(c) promote continued exploration so that delineated fields and newdiscoveries are available for development as soon as pricesrecover.

- 10 -
Petroleum Development Strategy
2.13 The mission recommends the following action program to optimizegovernment oil revenues in the short and medium term:
(a) improved monitoring of petroleum operations on existing fields;
(b) review of the legal and fiscal framework including suggestedaccommodation of current agreements; and
(c) feasibility studies for accelerated development of low-costreserves.
Monitoring Petroleum Operations
2.14 The Government's most immediate concern should be to improveits understanding of operating and financial costs on existing fields.The object is to explore whether these costs could be reduced in the nearfuture and the Government's return thereby increased. Improved moni-toring of petroleum operations by the Government would also increase itsability to verify costs declared for future tax assessments and toevaluate the costs and benefits of direct equity participation in futuredevelopments.
2.15 The Ministry of Mines and Energy (MME) is responsible forsupervising the petroleum sector in the Congo. In some functions itcalls on the assistance of the Exploration and Production Directorate(DRP) of HydroCongo. Despite the large numbers of professional staffavailable, particularly in HydroCongo DRP, there is a shortage of staffwith the necessary skills to monitor oil company operations and to auditthe accounts of HydroCongo's joint ventures. The mission recommends thatthe Government call in external expertise to assist with the followingtasks:
(a) advise MME on the best arrangements to systematically monitorpetroleum operations;
(b) provide on-the-job training for the senior professional NMMstaff selected for this function;
(c) advise MME, as the need arises, on specific monitoring issuesrequiring inputs from technical specialists;
(d) train HydroCongo DRP staff to audit the accounts of jointventures.

- 11 -
Improving the Legal and Fiscal Framework
2.16 In the medium term, it may be possible to improve the profileof government oil revenues without reducing the incentives forexploration and development. At the time of the Energy AssessmentMission (April 1986), the Government already had prepared terms ofreference for a study to review the development strategy for the Congo'spetroleum reser\es. The technical analysis is to be based on the recentstudy of reserves; the financial and economic analysis is expected tolead to proposals for improvements in the present contractual and fiscalframework. The options to be considered should include a change fromconcession to production sharing agreements on any other valid scheme forfuture developments.
2.17 In the short term, it may also be possible to negotiateadjustments of existing contracts with current operators. The studyshould examine various tradeoffs between royalty rates, amortizationschedules, and treatment of financial charges.
Feasibility Study for Developing Reserves
2.18 The Government should investigate the feasibility of developingone or more of the oil fields located onshore near Pointe Noire, in theLoeme permit area of the Coastal Basin., The Kundji and Bindi fields, forexample, have sizeable accumulations of light oil at depths of around4000 ft. If further development of these small fields is shown to beviable, they could be brought into production in a very short time andthereby make a small (in the order of 10% of current production) butrapid contribution to the Congo's petroleum production and governmentrevenues.
2.19 A second possibility to be investigated is liquids extractionfrom the Litchendjili gas field. This field is about 15 km offshore andmay be suitable for condensate stripping using gas reinjection forpressure maintenance. If these conditious are confirmed, close to50 million bbl of cor;densate could be recovered over a 10-12 yearperiod. Limited use of the dry gas for power generation could also -heconsidered (Q.ra 4.42-4.45).
2.20 The mission recommends that the feasibility of these options beassessed as soon as possible. The necessary studies could be undertakenby HydroCongo's current engineering advisers.
Petroleum Exploration Promotion
2.21 Recent exploration history indicates that the Congo hassignificant potential (relative to exploration and development areas inthe northern hemisphere) for discovering and proving-up additionalrelatively low-cost reserves in existing producing areas (para. 2.5).

- 12 -
The Congo's immediate concern should be to exploit this comparativeadvantage to enhance exploration for additional reserves during theperiod of depressed prices. This level of exploration is essential toensure that delineated fields and new discoveries are available fordevelopment as prices recover over the medium to longer term.
2.22 The mission assembled the following envelope of projections fortotal exploration expenditure over the period 1986-90 (in million US$)S2/
1986 1987 1988 1989 1990
BASE CASE 65 70 70 80 100IMPROVED PROMOTION 65 90 110 120 120
The difference between the two projections depends partly on the outcomeof current work programs; the balance will be determined by theeffectiveness of the Government's exploration promotion efforts betweennow and late 1988. In half the increment over the three years 1988-90 isattributed to successful promotion, the benefits amount to about US$100million of additional exploration. The cost of strengthening andaccelerating the Government's present promotion program is in the orderof US$1 million. Until recently, the Congo's strategy for promoting freeacreage has not been very active for the onshore Coastal Basin. In thedifficult and unexplored Central Basin (Cuvette) it has beenunsuccessful.
Coastal Basin
2.23 Offshore Relinquishments. Elf and Agip resumed exploratorydrilling in early 1987, four to six wells (estimated at US$40 million),to drill a few untested structures before their initial PNGF and Madingopermits run out in November 1987. At that time, the companies had torelinquish all acreage other than their declared production permits. Thefreed acreage would be available to any interested oil company, includingElf Congo and/or Agip.
2/ These projections are not directly linked to the mission's 1986-1990oil price scenarios, since exploration decisions are governed by alonger term view of oil reserves than decisions about oildevelopment and production.

- 13 -
2.24 MME has started work on a promotion report dealing with off-shore acreage and, in particular the Elf and Agip relinquishments inNovember 1987. A promotion meeting is planned for the fall of 1988.
2.25 Other Offshore Exploration. Amoco has made a farm-in agreementreplacing Citgo and Braspetro in the Marine 1 permit. According to its1986 work program, Amoco will conduct a joint offshore airmag withHydroCongo and Conoco, after which it will drill two wells (one with pre-salt objectives) in order to qualify for another exploration extension.Conoco is the other company active only in exploration, and has the onlypermit issued so far under the new petroleum law (Marine 2). After itparticipated in the joint offshore airmag in late 1986, Conoco then wascommitted to drill one or two wells into the pre-salt section.
2.26 If a discovery is made by either Amoco or Conoco, this will befollowed by delineation drilling (perhaps four wells). If, however, bothAmoco's wellu and Conoco' s well are dry, these companies probably willnot seek to renew their rights when they expire. The free acreage thenwould become part of MME's overall promotion of the Coastal Basin in1988. Ideally, the preparation of the promotion should include seismicreprocessing of significant Coastal Basin lines. However, thisexpenditure (approximately US$650,000) may have to be deferred untilbudget conditions improve.
2.27 Onshore -- Kayes Permit. MME currently is completing a promo-tion report for the onshore Kayes area and has plans to organize apromotion meeting. This effort should be coordinated with the otherpromotion activities, if at all possible.
Central Basin (Onshore)
2.28 MME's promotion in the Central Basin has been sporadic, indivi-dually targeted, based on a rather weak airmag interpretation, andlacking well-defined legal and fiscal terms. The mission recommends (a)reinterpretation of the 1980 airmag survey, and (b) external assistancefor the preparation of a promotion report and organization of a promotionmeeting.
Recommendations 3/
2.29 The mission recommends the following action program for petro-leum exploration and development:
3/ These have been accepted by the Government and the principalrecommendations have been incorporated in a Second TechnicalAssistance Project financed by the World Bank. The project will beimplemented during 1987 and 1988.

- 14 -
(a) technical assistance and training to develop MME's ability tomonitor petroleum operations and HydroCongo DRP's ability toaudit. the accounts of joint ventures (US$150,000);
(b) technical assistance to review petroleum development strategy,including possible improvements to the legal and fiscal frame-work (US4140,000);
(c) feasibility studies for development of onshore oil fields(US$40,000) and recycling of the offshore Litchendjili gas-condensate field (US$50,000)
(d) exploration promotion in the Coastal Basin -- free offshoreacreage (US$0.6-1.2 million) 4/ and the Kayes onshore permit(US$100,000) - including finalization of reports and organiza-tion of a promotion meeting;
(e) exploration promotion in the Central Basin (Cuvette), inclutingreinterpretation of the 1980 airmag survey (US$135,000),finalization of the promotion report and organization of apromotion meeting (US$100,000).
4/ Upper estimate includes seismic reprocessing.

- 15 -
III. PETROiEUM PRODUCT SUPPLY AND DISTUBUTION
-Lssues
3.1 The supply and distribution of petroleum products are theresponsibility of two parastatal monopolies--CORA? and HydroCongo. Underthe present institutional arrangements, there are no incentives fcrsupplying petroleum products efficiently and at least cost. This chapterpresents options for improving these arrangements and for redefining theproduct price structure to better reflect the economic costs of supply.The broad issues addressed are:
(a) The short-term marginal cost of supply from the refinery cannotcompete with the cost of imported products, due to a number oftechnical, marketing, and economic/financial factors.
(b) HydroCongo's inland distribution of petroleum product. ischaracterized by excessively high costs, attributable to theparastatal's poor financial discipline and overstaffing.
(c) This results in a number of distortions in the pricingstructure, which are exacerbated by ill-defined orunderutilized criteria for the application of subsidization andfiscal policies.
Organization
3.2 The supply and distribution of petroleum products is overseenby the Ministry of Mines and Energy (MNE), which supervises the twoparastatals operating in the sector, HydroCongo and CORAW. The Soci6teNationale de Recherches et d'Exploitation Petroli&res (HydroCongo) wascreated in 1974. It is an almost fully integrated national oil companyand holds the monopoly for petroleum product distribution throughout theCongo. Specifically, HydroCongo has been entrusted with the tasks of(a) meeting the domestic demand for petroleum products and ensuringsupply, and (b) managing efficient distribution operations. HydroCongooperates as a commercial concern, subject to public interest constraintsrelated to national policy imposed by the MME.
3.3 The Compagnie Congolaise de Raffinage (CORAF) is a subsidiaryof HydroCongo (60X) and the Societe Nationale Elf-Aquitaine (40%).CORA?'s statutes define its vocation as a refining company and monopolysupplier of finished products to HydroCongo. The MME's operatingagreement with CORAl permits the import of products for meeting the localdemand to make up for shortfalls in the refinery's production. Therefining facilities operated by COLA? (para. 3.4) are entirely owned bythe Government.
- l1i -
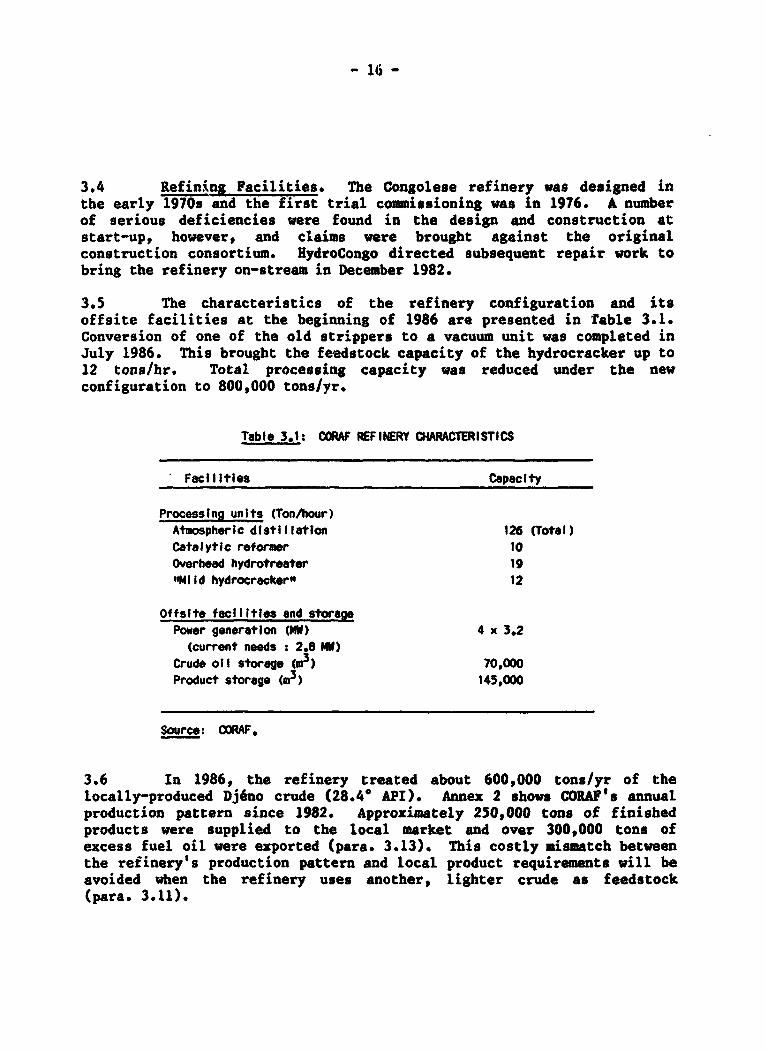
3.4 Refining Pacilities. The Congolese refinery was designed inthe early 1970s and the first trial commissioning was in 1976. A numberof serious deficiencies were found in the design and construction atstart-up, however, and claims were brought against the originalconstruction consortium. HydroCongo directed subsequent repair work tobring the refinery on-stream in December 1982.
3.5 The characteristics of the refinery configuration and itsoffsite facilities at the beginning of 1986 are presented in Table 3.1.Conversion of one of the old strippers to a vacuum unit was completed inJuly 1986. This brought the feedstock capacity of the hydrocracker up to12 tons/hr. Total processing capacity was reduced under the newconfiguration to 800,000 tons/yr.
Table 3.1: COWAF iEFINERY OIARACTERISTICS
Facilities Capacity
Processing units (Ton/hour)Atmospheric distillation 126 (Total)Catalytic reformer 10Overhead hydrotreater 19"Mild hydrocracker" 12
Offslte facilities and storagePower generation (MY) 4 x 3.2(current needs : 2.8 MW)
Crude oil storage (a') 70,000Product storage (a ) 145,000
Source: OO,F.
3.6 In 1986, the refinery treated about 600,000 tons/yr of thelocally-produced Djeno crude (28.4' API). Annex 2 shows CORAF's annualproduction pattern since 1982. Approximately 250,000 tons of finishedproducts were supplied to the local market and over 300,000 tons ofexcess fuel oil were exported (para. 3.13). This costly mismatch betweenthe refinery's production pattern and local product requirements will beavoided when the refinery uses another, lighter crude as feedstock(para. 3.11).

- 17 -
Competitivity of Local Refining with Product Imports
3.7 The mission compared the total annual costs associated withrefining versus those of importing under fourth quarter 1985 and thirdquarter 1986 economic conditions. The refining costs for processingindigenous Dj6no crude and imported Nigerian Bonny Light were consideredfor these two periods. The mission also estimated refining costs for thetwo crudes under a scenario of improved refinery management andoperations, the details of which are discussed in Annex 4.
Table 3.2: COSTS OF LOCAL REFINING VERSUS IMPORTS a/(thousand USS)
Present iNanagement/ Improved OperationsOperating Conditions and Reduced Costs
Crude Type b/ DJeno i3onny Light c/ Ol6no Bonny Light c/
Fourth Quarter 1985
Refining Costs 90,223 84,815 80,133 74,72!import Costs 75,371 75,371 75,371 75,371
Gainf(loss) In refining (14,852) (9,444) (4,762) 646
Third Quartur 1986
Refining Costs d/ 47,884 52,389 35,711 40,216loport Costs 39,898 39,898 39,898 39,898
Gain/(loss) in refining ( 7,986) (12,491) 4,187 (318)
a/ All assumptions and detailed calculations presented in Annex 4.b/ Crude used on local refIning option. The reference price for DJeno is as
quoted to tho mission during its visit.c/ Bonny Light crude Is used In the calculations for Indicative purposes, in
order to estimate the relative costs of processing a crude which Is betteradapted to the local demand profile.
d/ OperatIon of the new distillation tower was not considered in thecalculations of the relative refining costs of processing Bonny Light In1986; It would reduce costs, without altering the conclusions of theanalysis.
e! The Government revised the calculations for 1986 on the basis of modifiedhypotheses for the prices of crude and Imported products, In each case,larger losses resulted. The revised figures are presented In Annex 4.
Sourceo Mission estimates.

- 18 -
3.8 The analysis shows that:
(a) Under the technical configuration and economic conditions forthe period under consideration, local refining is notcompetitive with product imports. It costs the economy as muchas US$10.3 million more to refine the products locally ratherthan to import them.
(b) No matter the economic conditions, CORAW's refining operationscould only be marginally economic if large reductions are takenin operating costs (including financial charges).
3.9 In interpreting the mission's analysis, it is important to makethe distinction between the profitability of CORAF's operations and theeconomic losses to the Congolese economy due to its product supplyarrangements. Because ex-refinery prices are determined on a cost-plusbasis (para. 3.21-3.22), CORW does indeed make a profit on itsoperations. However, there are certain economic losses borne by theGovernment due to the fact that the CORAW refinery is its only supplysource, and it purchases products from this source at a cost considerablyhigher than that at which it could import products: according to thedetailed analysis in Annex 4, that cost is currently at leastUS$8 million annually ($10.3 million according to the Government's owncalculations), assuming third quarter 1986 economic conditions. Giventhe many steps which could be taken to reduce refining costs and makeCORAF's operations more efficient (para. 3.10-3.14; Annex 4), a nationalsubsidy at such levels cannot be justified, even by social objectives.Furthermore, the current system for setting ex-refinery prices offers noincentive to CORAP for reducing its costs. A more appropriate formulafor setting ex-refinery prices is one of the mission's recommendations(para. 3.25).
Factoro Contributing to High Refining Costs
3.10 Low Capacity Utilization. The domestic Congolese market is theonly market supplied by the refinery. Due to limited demand in thismarket, the refinery is run at only 60% of its optimal processingcapacity (800,000 tons/yr) when processing Dj6no crude. If a lightercrude was processed, throughput would be even lower (320,000 tons). Thepossibilities for substantially increasing throughput in the short- tomedium-term are limited: local demand is expected to stagnate, and thereis little potential for increased sales to external markets. Inaddition, the mission's analysis indicate that even with an increase inthroughput, the competitivity of local refining relative to productimports will not necessarily be enhanced due to CORAF's high fixedoperating costs.
3.11 Unsuitability of Local Djeno Crude. The locally-produced Djenocrude is relatively heavy, with a high fuel oil content. Even with therecent addition of conversion facilities, fuel oil yield represents morethan 50X of the crude throughput. The local market for fuel oil being
19 -
very limited, well over 300,000 tons are exported annually toindustrialised countries under unfavorable financial terms(pars. 3.13). According to the mission's analyses in Annex 4,320,000 tons of a crude similtr to Bonny Light processed to meet thelocal product demand would yield 71,000 tons of fuel oil, of which only48,000 tons would have to be exported. The refinery intends to importPalanca crude starting in 1988; the fuel oil yield should thus bereduced.
3.12 High Energy Consumption. Although major technical deficiencieswere corrected before the refinery was brought on stream (para. 3.3), therefinery design still does not provide for sufficient energy recovery.Energy efficiency (fuel consumption and hydrocarbon losses) is relativelypoor, reaching 5.82 of crude processed in 1985, as compared with astandard of 4.0X in similar facilities. The low efficiency is causedmainly by poor heater design and inadequate process heat recovery. Thenewly rehabilitated heat exchange system of the crude distillation unit(para. 3.5) will only reduce energy consumption by 0.42 of crudeprocessed. In late 1985, CORAF was also considering a project of heatrecovery from furnace flues. The economic viability of such a project isless certain due to lower crude prices.
3.13 Uneconomic Export of Surplus Fuel Oil. Under current marketingterms, the surplus fuel oil is sold for considerably less than theinternational market value. Fuel oil is marketed through a long termcontract with a trader. The export price is based on USE FOB (Rotterdam)prices with a premium for its low sulphur content (0.3Z), but alsoincludes a penalty for its high viscosity (630 CS 500 C). These termscould be improved by instituting a system of periodic tendering for theexport contract. The mission estimates that between $5 and $10 more perton could be obtained by opening fuel oil exports to competitive biddingunder modified marketing terms. This credit for improved marketing ofexcess fuel oil is included in the mission's detailed analysis (Annex 4).
3.14 Economic and Financial Factors. Under current institutionaland operational conditions, there are no incentives for reducing costs.The refinery is under no obligation to supply products at least cost andhas no competition for supplying the local market. Apart from the costof crude, which is supplied at the FOB export price, the refineryoperating costs (at US$24.3 million) are unusually high, even incomparison with operating costs of similar hydroskimming refineries inAfrica (US$6-10 million). These charges include: (a) variable costs forutilities, chemicals, and catalysts; (b) fixed costs for personnel,maintenance, overhead, and technical assistance expenses; and(c) financial charges on credit to HydroCongo and interest charges onworking capital. All of these charges amounted to about US$40.5/ton ofprocessed crude in 1985/86; 252 of this amount is attributable totechnical assistance. The Government has already begun to implementmeasures which will lead to a substantial reduction in the refineryoperating costs, as indicated in Annex 4. Many of these actions,including reductions in personnel costs, are being monitored under a

- 20 -
Public Rnterprise Sector Adjustment Operation financed by the WorldBank. Refinery operations may prove economically viable, once other costcutting measures such as processing more suitable light crude, improvedproduct pattern, energy conservation, etc. are implemented.
Conclusions
3.15 There is no question that action must be taken to modify thesystem for supplying finished products, given the high cost to theeconomy of the present system (para. 3.9). The Government should adopt aleast cost supply solution to bring the economic costs of product supplyin line with the opportunity costs of supplying products from alternatesources. This solution should be based on sound economic criteria:products should be supplied to the country at or near import parity,whether they are refined locally or imported. The mission identified aseries of options which are based on the establishment of an appropriateex-refinery price that reflects this economic criteria, and which willallow the Covernment to achieve the objective of least cost productsupply. These options and a suitable formula for ex-refinery prices arepresented in the action plan in para. 3.25-3.26.
Petroleum Product Distribution
-^>-.16 The costs of inland distribution operations managed byHydroCongo are very high and account for a significant proportion of thetotal economie cost of supplying petroleum products (Table 3.3;Annex 6). In April 1986, for example, gas oil transport and otherdistribution costs as a proportion of the import parity price ranged from711 on the coast (Pointe Noire), to 861 after 520 km of rail transport toBrazzaville, to 1971 after river transport to Ouesso, a remote inlandlocation 1475 km from the coast. Even allowing for the logisticaldifficulties of transport in the Congo, these costs appear high relativeto neighboring countries.
3.17 The main causes of the excess distribution costs are thedisproportionate increases in HydroCongo personnel and financial costssince 1974, when HydroCongo took over the assets of the oil companiesactive in product marketint. Similar problems are found throughout thepublic enterprise sector in the Congo and reflect the ambiguity ofparastatal objectives and the lack of financial discipline associatedwith soaring government revenues during the early 1980s. These problemshave been targeted under the Pulbic Enterprise Sector OperationAdjustment.
3.18 HydroCongo has received a large amount of specialized technicalassistance in recent years, and the actions required for financialrehabilitation of the enterprise are well defined. In principle,HydroCongo has been implementing a rehabilitation plan since 1982; inpractice many of the mai. objectives have not yet been achieved. Themission therefore recommends that:

- 21 -
(a) the main recommendations arising from earlier technical assis-tance be implemented as soon as possible; the major itemsinclude: (i) separate the Direction of Research and Production(DRP) from HydroCongo's marketing functions, granting itautonomy in its budget, cost accounting, and operations;(ii) reduce HydroCongo's manpower to a level more adapted toits work requirements; (iii) provide technical assistance tothe Direction of Finance to develop mechanisms for increasingthe creditworthiness of both HydroCongo's marketing operationsand the DRP; and (iv) provide technical assistance to developHydroCongo's abilities to make full audits (technical andaccounting) of joint venture expenditures; and
(b) reduce the cost of petroleum product distribution by:(i) restricting HydroCongo's role to that of a wholesaler andreducing its manpower to suit this new role; and (ii) sellingor subcontracting HydroCongo's functions in product trans-portation and its retail outlets.
3.19 At the time of the energy assessment mission, HydroCongo:
(a) owned and operated all major depots;
(b) entrusted its rail tank wagons to the Agence Transcongolaise deCommunications (ATC)-the transport parastatal--for producttransport from Pointe Noire to Brazzaville;
(c) owned and operated two of the six 200 m3 barges used forproduct transport upstream of Brazzaville;
(d) owned and operated a 500 m3 fleet of road tankers for dryseason bulk transport and for final dispatching to largeconsumers and filling stations; and
(e) owned and operated a number of filling stations.
3.20 The main scope for moving some of these functions outside thepublic enterprise sector lies in:
(a) subcontracting bulk transport and final delivery by road toprivate companies, preferably with competitive bidding on aregular basis;
(b) selling HydroCongo's remaining interest in retail outlets;
(c) selling HydroCongo's two barges or renting them to ATC.
All of these measures are being considered by HydroCongo. The missionrecommends that they be evaluated and implemented as soon as possible.

- 22 -
Petroleum Products Price Structure
3.21 Petroleum product prices are set by the Government on the basisof a cost structure prepared by HydroCongo. The prices are characterizedby uniform national prices and cross-subsidization among products to thebenefit of kerosene and bunker sales. Ex-refinery prices are computed ona cost basis to take into account the cost of crude oil and all actualrefining expenses. A theoretical selling price is established based onex-refinery prices, with the addition of taxes, distribution costs(including HydroCorgo's operating expenses, financial charges andwholesale margin), and the retail margin. The final retail price is thenadjusted according to the requirements for subsidization. Table 3.3compares the official retail price with the estimates of the economiccosts of delivering products to various locations throughout the Congo; abreakdown of the elements of the retail price is presented in Table 3.4.
3.22 The mission found in its analysis of the current pricingstructure that:
(a) Ex-refinery prices are quite distorted and very high incomparison to import parity (para. 3.7-3.9; Table 3.5) and donot accurately reflect the actual costs of refining individualproducts.
(b) Distribution costs are very high relative to neighboringcountries (para. 3.16) and account for a significant proportionof the retail price. Although these costs are not itemizedunder the current pricing system, it appears that they can beattributed largely to poor financial discipline andoverstaffing at HydroCongo (para. 3.17).
(c) Product transport costs vary widely by location and product,and it is the Government's policy to subsidize productdistribution to remote locations through use of a uniformretail price. However, since HydroCongo does not itemize itsexpenses, there is no systematic methodology for allocatingthese costs in the calculation of the collective distributioncosts for each product.
(d) The Government makes little use of fiscal policy to generaterevenues from petroleum product sales: taxes range from only1.51 of the price of gasoline to less than 0.21 for gas oil.
(e) The combination of poor cost accounting by HydroCongo andunderutilization of fiscal policy means that any rent arisingfrom fluctuations in the major items which comprise theeconomic costs of supply (crude prices, transport anddistribution costs) is absorbed entirely by HydroCongo and/orCORAP.

Table 3.3: PETROLEUM PRODUCT PRICES AND COSTS BY GEOGRAPHIC LOCATIONApril 1986(CFAF/llter)
Pointe Noire Brazzaville Ovo OuessoOfficial Transport Transport TransportRetail Economic Differen- Economic Differen- Economic Differen- Economic
Product Price Cost a/ tial bl Cost a/ tial bl Cost a/ tial bl Cost a/
Butane c/ 320 347 23 411 74 514 107 552Gasollne 295 87.5 12 102.5 29 147.5 40 157.5Kerosene 170 94.3 13 104.3 31 154.3 42 164.36as Qil 195 95.9 13 103.9 32 155.9 44 165.9Fuel Oil 115 d1 80.9 15 96.9 - - - -
a. CIF Import prices, plus estimated distrlbution costs relevant to Hydro Congo operations, Including transport costs.b/ From Polnte Noire, excluding turnover taxes.S/ CFAFAig.d/ Wholesale price.
Source: HydroCongo, Mission estimates.
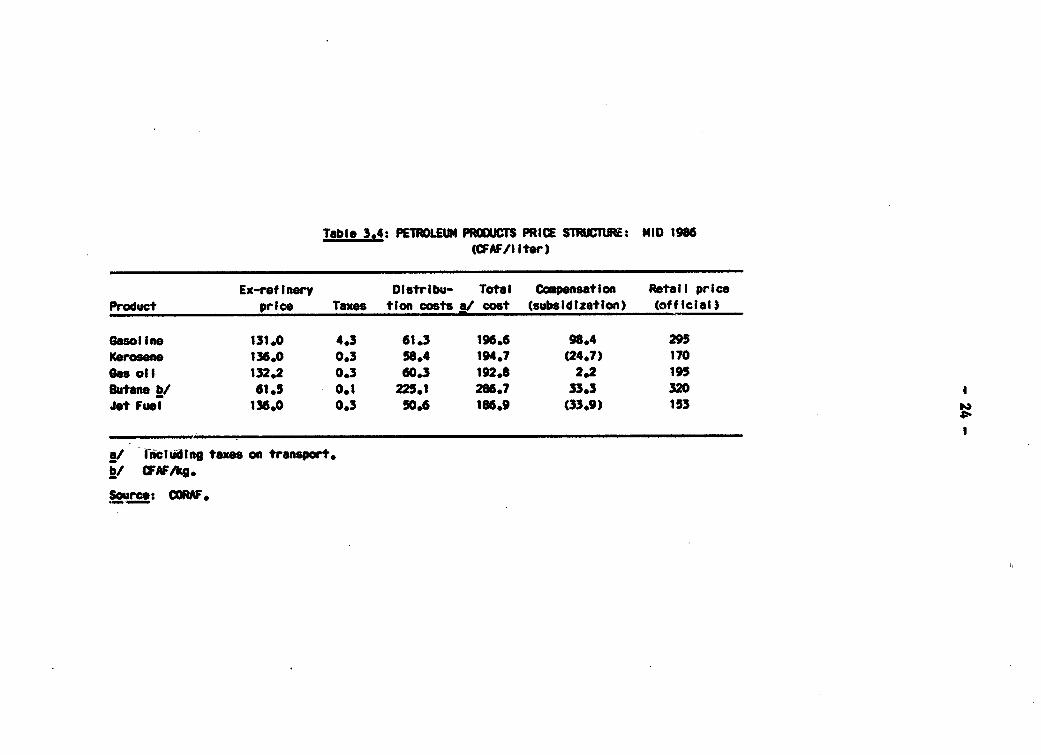
Table 3.4: PETROLEUM PRODUCTS PRICE STRUCTURE: MID 1986(CFAF/lIter)
Ex-refInery Dlstrlbu- Total COmpensation Retail priceProduct price Taxes tion costs a/ cost (subsidization) (official)
Gasoline 131.0 4.3 61.3 196.6 98.4 295Kerosene 136.0 0.3 58.4 194.7 (24.7) 170Gbs oil 132.2 0.3 60.3 192.8 2.2 19SButane b/ 61.5 0.1 225.1 266.7 33.3 320
Jet Fuel 136.0 0.3 50.6 186.9 (33.9) 153
a/ -Inctiding taxes on transport.;/ CFAFAtk.
Source: CORW.
_~ ~~~~~~~~~~~~~~~~~~~~~~~~~~~~~~~~~~~~~~~~~~~~~~~~~~~~~~~~~~~~~~~~~~~~~~~~~~~~~~~~~~~~~~~~~~~~~~~~~~~~~~~~~~~~~~~~~~~~~~~~~~~~~~~~~~~~~~~~~~~~~~~~~~F

- 25 -
Table 3.5: PRODUCT PRICES - EX CORAF VERSUS IMPWRTS(Average 1985)
Gasoline Kero/Jet Gas Oil Fuel Oil Butane
Ex CORAF a/CFAF/ton 185,708 180,723 166,390 86,523 86,523S/ton bl 413 402 370 192 192
Imports (S/ton)Ex Rotterdam 293 289 266 193 625Ex Italy 291 286 259 186 625
Ratlo CORAF/import 1.40 1.40 1.40 1.0 0.29
I/ DJ6no crude price a USS26.04/bbl.b/ 1985 (average) USSI - 450 CFAF.
Source: Mission estimates.
3.23 The mission's recommendations for the supply and distributionsystem, including ex-refinery prices based on import parity(para. 3.15-3.25) and elimination of HydroCongo's distribution andmarketing monopoly, should help ease the distortions in the pricingstructure. In addition to these changes, it is imperative thatHydroCongo take immediate action to set up an analytical cost accountingsystem for each product, with separate identification of each cost itemfrom purchase through to final demand. This. is a prerequisite forgreater transparency in the actual costs of product supply. Thisinformation then should be used to:
(a) build up new product price structures for each major point ofdelivery with provisions for periodic adjustments; and
(b) define a matrix of taxes and government subsidies to accountfor differentials between costs and consumer prices at eachlocation.
The latter point is especially important: the Government must clearlydefine its subsidization policies to strike a balance between the revenuerequirements of product distribution and desired price levels for retailprices. At the same time, the Governnent should make constructive use offiscal policy to serve as both a revenue generation mechanism and anincentive to lower cost product supply and distribution.

- 26 -
3.24 A specific problem arises in the case of LPG. Totalconsumption in 1985 was about 4000 tons, well below the 6000 tons/yeartOat could be produced when processing Djeno crude. For this reason,CORAF has been selling LPG at the same price per ton as fuel oil. Theimport parity cost of LPG in small volumes (less than 10,000 tons/year)has been in the order of three to four times the CORAF selling pricesince the refinery came on stream in December 1982. Despite recurringshortages of LPG cylinders, the LPG market grew at around 9% annuallyover the same period. If this growth rate is maintained, LPG consumptionwill reach the 6000 tons/year limit in four to five years. Incrementalconsumption would then have to be supplied by imports at an extremelyhigh cost. The mission recommends that import parity pricing of LPG bephased in as soon as possible to restrain demand growth and ensure thatLPG in only consumed by those who are able to pay the full marginal costof supply. This strategy is compatible with the Government's otherdevelopment objectives, since (a) LPG consumption is concentrated amonghigher income households (para. 5.9), and (b) slower growth of LPGconsumption will have practically no impact on deforestation(para. 5.2-5.5).
Recommendations
Refining/Product Supply
3.25 The mission recommends the following action program forpetroleum supply and distribution. As a first step to reduce the costsof supplying refined products, ex-refinery prices should be set toreflect the costs of importing products. A suitable formula could be:
(a) Average of mid-Platts Oilgram quotations for cargos CIF NWE foreach product during the period;
(b) Plus a freight and insurance factor of US$10-15/ton (thisbrings the price to import parity for the countries of WestAfrica from Dakar to Luanda);
(c) Plus US$8/ton terminalling and maintenance cost and operatorprofit;
(d) Plus US$1.50/ton port cost;
(e) Plus a capital recovery factor for any investments required toallow efficient handling of products.
The Government then should consider three options for its product supplyarrangements:
- 27 -
(a) GORAP would be required to deliver products to MydroCongo atthis price. This implies that CORAF will have to implementmeasures to reduce substantially its operating costs, if itsoperations are to remain financially profitable. The operatingagreement would have to be modified accordingly. TheGovernment has taken steps to promote this solution throughimproving CORW 's management and operations.
(b) Alternately, or in the case that CORA0 cannot or is not willingto meet this requirement, the Government should lease or sellits refining facilities to an independent operator.HydroCongo, or another appropriately defined unit(para. 3.26 (a)), would be required to supply refined productsthrough periodic international tenders. CORW could parti-cipate in the bidding and conceivably could constitute all orpart of the period supply contract, if it could deliverproducts at the stipulated ex-refinery price. Contractualarrangements with the refiner should be made according tostandard industry practices and should also reflect conditionsspecific to the Congolese product supply system, including arequirement for handling and storage of imports at Pointe Noirefor an agreed throughput charge on occasions when othersuppliers win the period supply contract.
(c) Alternately, or if none of the conditions of options (a) and(b) can be met, it would be more economic for the Government toimport petroleum products as long as local refining remainsuncompetitive due to international market conditions andrefining costs. In this case, the Government should review andrevise its storage requirements, and adapt the existingcapacity accordingly.
3.26 In all cases, a procurement system will have to be establishedfor imports of crude or products. The mission recommends that:
(a) appropriate institutional arrangements for petroleumprocurement be developed for inviting competitive quotations;
(b) the MME's ability to monitor the efficien-y of refining and/orprocurement, distribution and marketing be strengthened throughreinforcement of existing units or, if more appropriate, thecreation of a new unit within the MME. This unit shouldcoordinate its activities with the Ministry of Finance and theCentral Bank for budgeting;
(c) Under supervision of the unit, HydroCongo be responsible fornegotiating and implementating cot.tractual arrangements forproduct supply.

- 28 -
Appropriate technical assistance and training in commercial viegotiations,procurement activities and petroleum intelligence for both MHME andHydroCongo will be needed.
Product Distribution
3.27 The main recommendations arising from earlier technicalassistance to HydroCongo for financial rehabilitation should beimplemented as soon as possible. In addition,
(a) HydroCongo should sell or subcontract as many functions aspossible (para. 3.18-3.20), and its role should be restrictedto a product wholesaler. Regional depots and holding stockswill continue to be owned and operated by HydroCongo.HydroCongo will monitor retail distribution and implementgovernment marketing policies.
(b) HydroCongo should set up an analytical cost accounting systemand proper management information systems; cost informationshould be used to set up new petroleum price structures.
Product Prices
3.28 On the basis of the ex-refinery prices and PydroCongo's costaccounting system, the Government should define a new price structure foreach major point of delivery adjusted periodically, --hich reflects theeconomic costs of supply. The Government should make constructive use offiscal policy to generate revenues and avoid windfall profits to supplyand distribution companies. Clearly articulated subsidization and fiscalpolicy should be used to define a matrix of taxes and subsidies, to beapplied to the pricing structure and to account for differentials betweencosts and consumer prices at each location. In the case of LPG, themission recommends that import parity pricing be phased in as soon aspossible. This type of measure corresponds to the Government's ownobJective of using pricing policies to stimulate and develop the use oflocal energy resources other than oil.

- 29 -
IV. POUlE SUB SKEC1M STRUATIY
Issues
4.1 The present chapter outlines an action program to address thethree main areas of immediate concern in the electric power subsector:
(a) the need to strengthen the national power utility (SNE) as partof a program to give the power subsector an unambiguous andcommercially efficient organizational structure;
(b) the need to mobilize additional financial resources fromconsumers and private investors to avoid cuts in essentialexpenditure on maintenance, rehabilitation and increasedcapacity reserves; and
gc) the need to concentrate all power investment expenditure until1990 on plant rehabilitation and other measures to refrtorereliable electricity supply to consumers in the main urban loadcenters.
4.2 At the Covernment's request, the mission also briefly reviewedtwo issues of medium to long term strategy:
(a) the need to develop a rural energy strategy and to define therole of rural electrification in that strategy; and
(b) the need to evaluate the possibility of using natural gas forbaseload electricity generation in the longer term.
Electricity Demand and Supply
4.3 The following sections briefly summarize electricity demand andsupply patterns in the Congo. Annex S contains additional backgroundinformation on: (a) SNt and private autogenerator plant; (b) load growthscenarios to 1995 with corresponding energy and capacity balances on theSNE interconnected system; and (c) an estimate of the marginal cost ofgeneration.
4.4 Consumption of electricity is concentrated in the two mainurban centers. Total estimated electricity sales in 1985 were 315 GWh,of which Brazzaville accounted for 151 GWh (48 X), and Pointe Noire133 GWh (42 P). Business, government and parastatals, and households arethe three main groups of consumers. About half of total sales are at lowvoltage. The statistics available on electricity sales and generationare incomplete, unreliable and distorted by restrictions in power supply.

30 -
They are of limited value for forecasting future demand or foridentifying unbilled sales and losses in the transmission anddistribution systems. 6/
4.5 The SNE operates a public supply system consisting of twoindependent networks - Brazzaville and Pointe Noire-Loudima-Bouenza-N'Kayi - and 15 small isolated load centers (Map IBRD 18242). TheBrassaville load (38 MW in 1985) is served by a small run-of-river hydroplant (Djoue, 12-15 MW), and a 225 kV interconnection with the Inga hydroplant in Zaire; approximately 2 MW of the thermal capacity is availableas reserve. The main components of the Pointe Noire/southwest system(40 MW total load in 1985) are the Houkoukoulou hydro plant (74 MWinstalled, abcut 23 MW firm), 110 kV transmission to Loudima and nearbytowns, and nearly 150 km of 225 kV tranmission from Loudima to PointeNoire. The Brazzaville and Pointe Noire/southwest systems are in theprocess of being linked by a 225 kV transmission line, and the resultinginterconnected system is expected to be operational by late 1988.
4.6 The distribution systems in Brazzaville and Pointe Noireoperate at 30 kV and 6.6 kV. Both distribution systems are in very poorcondition due to saturation and insufficient maintenance. Distributionoutages are a more frequent cause of nonsupply to consumers than failureof either generation or transmission. Poor reliability of supply hascompelled many consumers to maintain their own private capacity, eitherfor baseload generation or as backup during outages in the public supplysystem. In 1983 estimated total instdlled autogeneration capacity was12 MW in Brazzaville, 35 MU in Pointe Noire and 5-10 MW in the rest ofthe country.
Organization and Finance
4.7 While rehabilitation of the physical assets of the power systemis urgently required, it is equally important to reform the organiza-tional and financial structure of the subsector to ensure its futureoperations. The operating agency in the subsector (SNE) needs to controlsufficient financial and human resources to sustain adequate maintenance,adopt sound operating procedures, and possess sufficient capacitymargins. This can only be achieved by (a) rebuilding SEE into a com-mercially viable enterprise with some degree of financial and managerialautonomy, and (b) mobilizing additional financial resources fromconsumers (through tariff increases) and private investors--throughdirect participation in electricity supply.
6/ SHE projections for 1985 were based on distribution losses equal to20-252 of sales, of which approximately one third was believed to beunbilled sales.

- 31 -
Differentiating Commercial and Administrative Functions
4.8 According to the 1967 legislation under which it was estab-lished, SNE is responsible for all aspects of public electricity supply,subject only to the usual reqairements of shareholder control, i.e. the"tutelle" (supervision) of the Government. In practice, in recent yearsthe Ministry of Mines and Energy (MM8) has taken over the planning,financing and execution of all new major generation and transmissionprojects. Under these circumstances, the present 'de facto' role of SNEis: (a) to maintain and operate the generation and transmissionfacilities handed over to it by MME, and (b) to plan, finance, executeand operate its own electricity distribution systems.
4.9 The organization of the electric power subsector in the Congoshould be improved in the following areas:
(a) A mechanism should be developed to ensure that the totalinvestment program for public electricity supply--MME's programfor generation and transmission, plus SNE's program fordistribution is the least cost means of meeting publicdemand. This requires integrated planning of operations andinvestments, preferably by an autonomous commercialorganization with clear financial objectives.
(b) There is a need for a financial mechanism to ensure that thefull cost of generation, transmission and distribution isreflected in the final cost of electricity to the consumer.The simplest way to achieve this would be: (i) to make SN!responsible for all future debt contracted for investments inelectricity supply; (ii) to remove all Government budgetsupport to SN! other than equity injections negotiated as partof the financing of the least cost investment plan; and(iii) to require SNE to operate commercially, i.e., to payduties, taxes and dividends at the same rates as the Congoleseprivate sector.
(c) The "contrat de programme" between the Government and SNEshould be finalized for 1988 and renegotiated annuallythereafter. If necessary, the Government would directlyfinance the non-commercial activities imposed on SNE withinthis framework, such as electrification of secondary centers.
Strengthening SNE
4.10 The present arrangements are regarded as transitional by bothMM! and SNE. Both parties recognize the need for SNE to be strengthenedto take complete responsibility for public sector commercial electricitysupply. The next step is for the Government and SNE to agree as soon aspossible on the scope and financing of &n action program to restructureSN! and a timetable for its execution. IExternal financial support willbe required.

- 32 -
4.11 The main components of the program would be:
(a) A review to straighten out the relationship between SNE and theGovernment; and preparation of relevant legal texts.
(b) A review to clarify the relationship between SNE and itscustomers, and between SNE and other electricity producers; andpreparation of standard texts and contractual conditionsregulating SNE's electricity sales and purchases.
(c) Continued technical assistance to improve customer managementand related aspects of financial management.
(d) Progressive implementation of the recommendations of the 1983organizational review; establishment of a manpower planningsystem -- definition of skill requirements, inventory ofexisting personnel, development of a staff training plan withspecial emphasis on technical training of skilled operators.
(e) Establishment of an integrated system planning group forgeneration, transmission and distribution; establishment of aplanning database covering sales (including major customers),generation (including autogeneration), and supply costs;followed by substantial on-the-job training as part of thepreparation of a 15-20 year system development plan.
Resource Mobilisation
4.12 Even before the decline in oil prices in late 1985, recurrentexpenditure and investment in the power subsector were limited by theavailability of finance, namely SNE's net cash generation and thecovernment's investment resources. As a result, SNE was able to financeonly a part of essential expenditures needed for periodic maintenance,equipment rehabilitation and installation of standby capacity. In thepresent economic environment, there is a severe risk that these essentialfunctions will decline to a dangerously low level unless additionalfinancial resources are mobilized from some source other than theGovernment. While some of the measures needed to promote improved mediumterm cash generation are already planned or being implemented, theseshould be complemented: (a) by an immediate tariff increase, and (b) bymodifying SME's monopoly powers so that autogenerators can supplyelectricity to SNE.
4.13 Electricity Tariffs. Electricity tariffs have not changedsince 1976 in most of the country, and since 1982 in the area served bythe Noukoukoulou hydro plant. In mid 1985 it was estimated that a rateincrease of 25-301 was required to balance the operating budget. Alarger increase would have been required for SN! to contribute to itsinvestment program. The tariff structure is quite complex and composedof a series of declining blocks within each voltage category, adjustedaccording to regional differentials. The basis for these differentials

- 33 -
presumably is tied to the status of the generating and distributionsystems in 1976. Furthermore, the structure requires the use of twometers per customer. Tariffs bear little relation to the marginal costsof supply associated with the present and planned regional allocation ofgenerating capacity, transmission and distribution infrastructure.
4.14 SNE's tariffs were reviewed by EDF in 1982 with the aim ofsimplifying the tariff structure and increasing rates to bring them moreinto line with marginal costs. However, SNE has been reluctant toincrease any rates without first improving the reliability of itsdelivery systems. This position is untenable in the present crisis. Thefollowing measures are required: (a) electricity rates should be raised'Fy 30-501 as soon as possible; (b) the EDF study should be updated on thebasis of a least cost system development plan once SNE's financialobjectives have been defined (para. 4.9(b) and 4.11) and (c) an institu-tional mechanism should be introduced to ensure regular review and updateof electricity tariffs in line with changes in economic and financialcosts.
4.15 Medium Term Cash Generation. In the medium term there issignificant potential to mobilize additional resources through improvedrevenue collection (para. 4.11), reduction of technical losses in thedistribution systems (para. 4.21), and increased sales. From the momentthe Moukoukoulou hydro plant is connected to Brazzaville (probably inlate 1988), SNE's variable operating costs will fall to a very lowproportion of total costs. A high proportion of revenue from additionalelectricity sales will therefore flow through into net cash generation.Timely completion of two investments is essential if increased sales areto contribute to SUE's financial recovery--first the Moukoukoulou-Brazza-ville interconnection, and second the distribution rehabilitationprogram. Unsatisfactory quality of supply appears to be the mainconstraint on increased sales.
4.16 Private Suppliers of Electricity. At present SNE has amonopoly on public electricity supply; private electricity supply isconfined to autogeneration, either as a baseload alternative to SNEsupply or as backup. No particular role is envisaged for private salesof electricity in the expansion of the electricity system. There areseveral possibilities for increasing the contribution of private energysuppliers and SNE's monopoly powers should be modified to allow theseoptions to considered. The objective is to retain the economies of scaleassociated with a strong integrated national power utility, but at thesame time to take advantage of capacity or energy contributions fromprivate suppliers in the specific circumstances where they have acomparative advantage. Examples are given in the following sections;these includes
(a) autogenerator backup for SNE, as part of an interim package toimprove security of electricity supply in Pointe Noire(para. 4.29); and

- 34 -
(b) in the longer term, private baseload supply to 81E if suppliesof natural gas become available (para. 4.40) at a low enoughcost to undercut the "base case" expansion plan--electricalenergy imports plus 1OOZ capacity backup (Annex 5).
Rehabilitation/Reliability of Supply
4.17 Additional baseload energy plant is not immediately requiredfor the SUR interconnected network (Annex 5). In the period until 1990,electricity expenditure (investment, investigations and training) shouldbe entirely devoted to (a) obtaining the greatest economic benefit fromexisting productive assets, and (b) achieving acceptable reliability atall levels of the existing supply system.
4.18 SNE's most important single asset is the Moukoukoulou hydroplant (4 x 18.5 MM installed). In 1985 only about half its maximumenergy output (400 GWh/yr) was absorbed by the SNE system. At a cost ofabout US$13 million (April 1986), completion and commissioning of theLoudima-Brazzaville transmission link therefore will bring two mainbenefits:
(a) Noukoukoulou's low cost surplus energy and power will betransferred to Brazzaville, thereby reducing the cost ofelectricity imports from Zaire.
(b) In the event of difficulties with SNE generation facilities,imported energy and power will be available not only toBrazzaville but also to Pointe Noire and other load centers inthe southwest.
4.19 Delaying completion of the Loudima-Brazzaville line had beenconsidered as a response to the recent economic crisis. The mission madea simplified comparison of the costs and benefits of allowing thecompletion of the line to slip by two years. The main costs of the delaywould be the additional payments for imported electricity. The mainbenefits would be deferment of capital expenditure, net of contractsuspension costs. Under most plausible assumptions the costs of thedelay would exceed the benefits by at least US$5 million. 7/ The missiontherefore recommends that timely completion of the transmission line,installation of telecommunication equipment end creation of a centralsystem control center (para. 4.26) rec6ive the highest possible priorityin the power subsector investment budget.
7/ Present value in 1986, assuming 1986 selling price from Zaire and101 discount rate.

- 35 -
4.20 In the absence of a more complete planning database, otherexpenditure priorities should be set in accordance with the potentialimpact on improved reliability. In order of severity the most immediatebottlenecks ares
(a) the condition of distribution networks in Brazzaville andPointe Noire;
(b) the vulnerability of Pointe Noire to outages on the transmis-sion line linking it to the Moukoukoulou hydro plant;
(c) the absence of an operating strategy for the new Pointe Noire-Loudima-Brazzaville interconnected system; and
(d) the deteriorating condition of the Moukoukoulou hydro plant.
These problems are briefly described below, along with the mission'srecommendations.
Urban Distribution Bottlenecks
4.21 The distribution networks in Brazzaville and Pointe Noire areboth saturated and worn out. Operations, maintenance and repairs arealso handicapped by a variety of voltages installed at differentperiods. For these reasons $NE has embarked on a program of rehabili-tation and conversion to a standard voltage of 20 kV. Aside fromimproved reliability, the adoption of 20 kV will increase the networks'transit capacity by a factor of three to five, thereby allowing them toabsorb between 10 and 20 years of load growth. SNE load forecasts alsoinclude a reduction of distribution losses to 13X by 1990. In PointeNoire the rehabilitation includes a short extension of the incoming220 kV transmission line to a substation on the other side of the 20 kVnetwork. This second point of injection will improve the reliability ofsupply in the event of minor distribution incidents.
4.22 The total cost of the program is about US$15 million. Imple-mentation began in 1985 with financing from the Caisse Centrale (CCCE).Disbursement has been slowed down as part of the Congo's adjustment tothe fall in oil prices and work is now expected to be completed in about1990. The mission recommends that the rehabilitation program remain inthe core program for public sector investment and to be executedaccording to an accelerated schedule.
Transmission/Backup at Points Noire
4.23 SM! currently cannot provide firm backup to Pointe Noire durir.&outages on the single 225 kV transmission line (300 km long) linking itto the rest of the interconnected system. There will continue to be aneed for back-up as long as there is only a single line (Annex 5). Thefollowing investigations and follow-up are urgently required:

- 36 -
(a) Steps to improve the reliability of the Loudima-Pointe Noireline; and adoption of the preventive maintenance program.
(b) A detailed inventory of private autogenerators in the PointeNoire area; analysis of their reliability requirements and thescope for integrating their plant into SNE's backup capacity(para. 4.29-4.32); negotiation of special contracts governingelectricity supply to and from major autoproducers.
(c) Definition of reliability criteria for SNE supply in PointeNoire; analysis to determine the least cost combination ofinvestments in transmission reinforcement, thermal backupcapacity ane from major autoproducers.
(d) In the event that additional thermal capacity is required forPointe Noire, analysis of the option of baseloading the thermalplant using natural gas.
(e) A study of the option to link Inga and Pointe Noii-e via a220 kV line (using the material available for Brazzaville-N'gotif necessary).
4.24 SNE should aim to complete the necessary investigations as soonas possible. Ideally the investigations should be part of morecomprehensive study to develop a 10-15 year system expansion plan.However, certain feasibility studies of hydro sites, such as the Bouenzacontrol dam, should be undertaken first.
System Operations Strategy
4.25 Once the Loudima-Brazzaville 225 kV link begins operating inmid-1988, SNE will have responsibility for an interconnected networkwhich is more complex than the present two separate grids. The fullbenefits of this system will not be realized unless there are adequatearrangements for system operations, installation of requiredtelecommunication equipment, and development of a central system controlcenter. Additional work is required to ensure the existence or adequacyoft (a) protection systems; (b) a load shedding plan to cope with dropsin frequency; (c) arrangements to maintain stable links with Zaire; and(d) a voltage control plan for different situations.
4.26 The recommendations arising from this investigation should beembodied in a proposal for the creation of a central system controlcenter. The center would have to be compatible with the local controlcenters that are planned for the Brazzaville and Pointe Noire distribu-tion networks; it would also have to be able to meet the system's controlneeds up to 1995 by means of relatively simple extensions. An essentialpart of the proposal would be to define:
(a) the systems, methods, procedures and operating instructions forthe central control center;

- 37 -
(b) technical assistance needed to help SNE build, commission andoperate the center; and
(c) a medium term training plan for the SNE staff involved insystem operations and maintenance.
Rehabilitation of Existing Hydro Plant
4.27 The full output of the Djou4 hydro plant is absorbed by theBrazzaville network. After completion of transmission from Loudima toBrazzaville, the bulk of the energy and power capability of theMoukoukoulou hydro plant will be absorbed by the interconnected system.Under these conditions it is important that the full power output of bothhydro plants be available. The rehabilitation required at Djou6 isreasonably well defined and SNE has budgeted about US$3.2 million tocomplete the work program over the period 1986-89. Serious problems havebeen identified at Moukoukoulou and shoudl be remedied immediately.
4_ 28 Moukoukoulou's effective capacity is at present reduced by theneed for repairs on one of its 4 x 18.5 MS sets. Extensive work isneeded on ancillary equipment and on preventing leaks developing aroundthe outlet valves. In addition the station is suffering from the effectsof cavitation at low loads. Much of the station's recording,communications and voltage regulation equipment is also obsolete. At thetime of the mission, consultants had been hired to make a preliminaryreport on these problems and SNE had tentatively budgeted aboutUS$ 3 million for rehabilitation work in 1986 and 1987. Completion ofthe recommended rehabilitation work and regular maintena-ace thereaftershould be given the highest possible priority in SNE's budget.
Autogenerator Backup for SNE
4.29 The pow-z subsector strategy recommended by the missionincludes installation of thermal backup capacity in Pointe Noire as soonas possible (para. 4.23-4.24). The need for backup capacity willcontinue after the completion of the Pointe Noire-Brazzaville inter-connected system in mid-1987, since the Pointe Noire network will remainvulnerable to outages on the single 225 kV line linking it via Loudima tothe main sources of generation. Given the present difficulties offinancing new SNE capacity at Pointe Noire, the possible contribution ofautogenerators in Pointe Noire should be evaluated as a means of reducing(a) the extent of total blackouts during the period until SNE installsadequate thermal backup at Pointe Noire, and (b) the total amount ofbackup capacity to be installed by SNE.
4.30 The two main groups of captive plant in the Pointe Noire areaare at the Elf Congo crude oil export terminal at Djeno and at the CORAFrefinery. In both cases there appears to be excess capacity potentiallyavailable as backup to the SN8 system. In 1985, Elf Congo purchased15 GWh from SNE and operated a 5 MW gas turbine fueled by natural gas asbaseload to generate about 36 Clh; 2 x 3.6 MW diesels (running on crude

- 38 -
oil) and 4 x 1 MS diesels (running on gas oil) were available to supplythe remaining requirements (about 21 GWh) and as backup for periods ofnonsupply from SHE. Under some circumstances Elf Congo's diesel capacitywould be sufficient to cover an SNE outage and at the same time supplypower to other consumers in the Point. Noire area. CORAl maintains4 x 3.2 MS of diesel capacity; this plant runs on heavy fuel oil andsupplies a baseload of about 2.8 NW.
4.31 Evaluation of autogenerator backup should proceed by thefollowing steps:
(a) assess more precisely the available surplus capacity;
(b) evaluate the additional investments and operating proceduresrequired to allow the two autogenerators to inject theirsurplus power into the SEY grid;
(c) compare the marginal cost of operating the autogenerator'splant d;iring a power outage with the variable costs to SNE ofoperating a gas turbine or other backup; and
(d) discuss with Elf Congo and CORAW suitable legal and contractualframeworks for supply to SNE before the commissioning of SNE'snew thermal backup.
4.32 Preliminary indications are that the SYS may be able to offerUS$50-75/kW/yr for the right to call on autogenerator capacity duringtransmission outages. If such an offer were attractive to both parties,this stopgap measure would allow SNE to defer the installation of some ofthe capacity that is immediately required at Pointe Noire.
Rural Electrification
4.33 The term "rural electrification" is used here to mean smallload centers in the same size range as SNE's existing secondarycenters. The Government's stated objective is to improve the quality andquantity of electricity supplied in existing secondary centers and toextend electricity supply to other, generally smaller, centers. Theseobjectives should be re-examined in the context of the Covernment'snational development strategy and the role of rural energy supplies inthat strategy. Two of the relevant national development objectives are,first, to integrate isolated communities into the mainstream of theCongolese economy, and second, to promote a better balance of economicactivity between rural and urban areas.

- 39 -
Rural Energy Supplies
4.34 Possible rural energy problems in the Congo include:
(a) frequent disruptions of the supply of transport fuels;
(b) need for pumping energy for water supplies;
(c) need for hot water and small-scale refrigeration units inhealth centers;
(d) need for electricity in key economic activities; and
(e) the high cost of household fuels-fuelwood, charcoal, kerosene,LPG--and the poor reliability of supplies of kerosene and LPGin particular.
4.35 Only some of the energy problems cited above can be solved byelectrification of rural areas. The mission suggests the followingguidelines for developing a rural electrification program:
(a) The Government agency responsible for energy policy (MME)should pay as much attention to improving rural supplies ofpetroleum products and biomass as to rural electrification.
(b) MM should re-examine the institutional options for promotingrural electrification and, in particular, the role assigned toS-E for investments and taking charge of financing deficits.
(c) Where direct government investment is required, the level ofexpenditure should reflect its low priority relative to basicinfrastructure and social services.
Technical Options
4.36 Most of the technical solutions for meeting rural electricityneeds have been tested in the Congo. Choices have to be made on a caseby case basis between:
(a) transmission links from existing distribution centers to themain interconnected system;
(b) a central generation unit (diesel, micro/minihydro, or wood-fired) and distribution system; and
(c) decentralized systems such as photovoltaics, either (i) withoutbattery backup, for low head, low volume water pumping, or(ii) with full battery backup, for small refrigerators inisolated health centers.

- 40 -
4.37 The centerpiece of the Government's present rural electrifica-tion strategy is the extension of the main interconnected network to thesecondary centers north of Brazzaville-f rom Djambala to Makoua. Thedistances involved are such that a transmission system of approximatelythe same size as the Pointe Noire-Loudima-Brazzaville network would berequired. The limited amount of information available on potential loadgrowth (i.e., population densities, incomes, etc.) and costs suggeststhat this strategy would not be justified by the level of demand forseveral decades.
4.38 During the period until 1990, the Government should develop amore detailed strategy for the next decade. MME should compile acomprehensive database and at the same time analyze:
(a) load characteristics in existing secondary centers;
(b) population density and potential demand for electricity in allrural locations;
(c) micro/mini-hydro resources--streamflow data, development costs,distance from load centers, transmission costs, need for dieselbackup;
(d) availability of wood and wood waste (sawmill or loggingresidues-Chapter V) for power generation--(i) vegetationdensity, (ii) wood location and ownership, (iii) cutting,delivery and handling costs, (iv) moisture content and combus-tion characteristics, and (v) capital and operating costs ofavailable wood-fired generating plant; and
(e) results of photovoltaic demonstration projects in the Congo.
4.39 The rural electrification strategy that emerges from thisanalysis should result in:
(a) short 110/35 kV extensions of the existing system to thesecondary centers within economic connecting distance from thePointe Noire-Brazzaville interconnected system; and
(b) interconnecting links between secondary centers to establishsmall isolated networks, where economically justified.
Natsral Gas for Power Generation
4.40 It is likely that the least cost expansion plan for the inter-connected system will include backup gas turbine capacity in PointeNoire. It will not be economic to operate this plant, other than duringcapacity shortfalls or emergencies unless the variable operating cost(principally fuel) is lower than the cost of electrical energy imports

- 41 -
from Zaire. This costs approximately 10 CFAF/kWh 8/--9 CFAF/kWh plustransmission losses. This ceiling translates to approximately US$83/tonfor gas-oil or US$2.0/MSCF for natural gas.
4.41 In April 1986 (with crude at approximately US$13.5/bbl) theeconomic cost of gas-oil was estimated at US$190/ton (imported) orUS$450/ton (ex-CORAF). The economic cost of natural gas delivered to apower plant near Pointe Noire is not known. Given the limited reservesremaining in the small onshore gas field at Pointe Indienne, this costwould be heavily dependent on the cost of replacement gas. The gasavailable in the untreated crude oil arriving at the Djeno terminal isalready committed to meeting oil industry requirements for generatingpower and to supplement the crude used as fuel in the water removalprocess. Replacement gas would therefore have to come from developmentof new fields such as the nearby offshore gas fields.
4.42 Condensate production and power generation are the only two gasuses that are likely to justify a new field development. Table 4.1summarizes the possible gas consumption for power generation in 1995. Atthe maximum demand price of US$2.0/MSCF, the gas sales revenues would bein the range US$3-15 million/yr. Condensate sales would therefore haveto provide the bulk of the revenues required for development of a newfield. 9/ A preliminary investigation of the role of power generation ingas development should be undertaken as soon as possible, preferably asan integral part of the strategy for improved power supply reliability atPointe Noire (para. 4.23-4.24).
4.43 The development of gas-fired power generation would create anopportunity for a major institutional innovation in the power subsector,that is, private baseload supply to SNE. If supplies of natural gasbecome available for power generation at a sufficiently low cost, achoice could then be made between two options:
(a) gas-fired power generation by SNE on the basis of a take-or-paygas contract between SNE and the gas producer; or
(b) gas-fired power generation by a private company on the basis ofa take-or-pay power contract between the company and SNE.
8/ The marginal cost may be lower than 10 CPAF/kWh since Zaire isoffering power at a lower price to uses; this may includeincremental supplies to existing users.
9/ Mission estimates indicate that the Litchendjili field could producecondensate revenues of $50 - 60 million/yr at $15/bbl. If theseestimates were confirmed, joint condensate and gas sales (to SNY)could justify a field development of up to $250-300 million.

- 42 -
The second option should be examined as early as possible in the processof evaluating natural gas as a baseload option for the SNE interconnectedsystem.
Table 4.1: POSSIBLE GAS CONSUMPTION FOR POWER GENERATION, 1995 a/
Demand Energy Hydro Energy Natural GasScenario Demand Generation b/ Deficit Equivalent c/
(GWh) (GVh) (GWh) (billIon SCF)
Low 634 520 114 1.6High 1,071 520 551 7.7
a/ Summarized from Annex 7.i/ Full output from Moukoukoulou.Cl Assuming natural gas with celorif Ic value of 1000 BTU/SCF is used in gas turbines with
heat rate of 350O kca I/iWh.
Source: Mission estimates.
Recommendations
4.44 The mission recommends the following strategy and actionprogram for the power subsector. 10/
Organization
4.45 The Government and SNE should agree as soon as possible on thescope, financing and timing of an action program to strengthen SNE anddifferentiate its role; the medium term objective is for SNE to takecomplete responsibility for public sector commercial electricity supply.
Resource Mobilization
4.46 The present measures to improve SNE's net cash generation inthe medium term should be complemented by:
10/ Since the Energy Assessment mission, two donors have expressedinterest in financing the highest priority items: (a) the WorldBank, through its proposed Second Technical Assistance Project, and(b) the UNDP/World Bank Energy Sector Management Assistance Program(ESMAP), using funds to be provided by the French Government.

- 43 -
(a) in the short term, an immediate tariff increase of at least30%; and
(b) in the longer term, an increased role for private electricitysupply in those parts of the market where it is shown to have acomparative advantage.
Priority Investments
4.47 Two projects should receive absolute priority in the powersubsector investment budget:
(a) completion and commissioning of the Loudima-Brazzaville trans-mission link and a central control center; and
(b) completion of rehabilitation and conversion to 20 kV of theBrazzaville and Pointe Noire distribution networks.
4.48 Other priority investments will be defined by the investiga-tions listed below.
Investigations
4.49 Immediate. Investigations and detailed design should belaunched ant/or completed as soon as possible in three key areas:
(a) definition of the least cost arrangements for ensuring adequatesecurity of supply in Pointe Noire;
(b) design of (i) a network operating strategy for the newBrazzaville-Pointe Noire interconnected system, (ii) a centralsystem control center for the interconnected system, and(iii) a technical assistance program and training plan for SNEstaff involved in system operations; and
(c) detailed design of a rehabilitation program for the Djoue andMoukoukoulou hydro stations.
4.50 Medium-Term. Additional investigations are required to definepolicy and investment strategy in two key areas:
(a) A medium-term (1990-2000) strategy is required for ruralelectrification. Major investment projects (hydro and trans-mission) should be deferred indefinitely, and public sectorparticipation should be redefined (i) after consideration ofother rural energy objectives--reliable supply of petroleumproducts, more efficient use of biomass, etc., and (ii) as anappropriately small part of the overall rural developmentbudget.

- 44 -
(b) The prospects for using natural gas from a future gas-conden-sate development should be evaluated as a possible alternativeto (i) increased electricity imports from Zaire, and(ii) future hydro development such as Imboulou.
(c) The feasibility of a 220 kV link between Inga and Pointe Noireshould be studied.

- 45 -
V. VOOD FULS AND BHUSUOL EnE
Issues
5.1 The mission identified the following major issues concerningthe rational exploitation and consumption of wood as an energyresource. They include:
(a) deforestation around Brassaville, its relation to wood fueldemand and impact on wood fuel prices;
(b) household energy strategies for managing wood fuel demand;
(c) use of existing wood plantations for energy (charcoal) produc-tion; and
(d) efficient use of surplus wood residues from commercial andindustrial forestry operations.
Deforestation in Brazzaville
Wood Fuel Demand and Area Deforestation
5.2 Although there is no official documentation of the phenomenon,the forests around Brazzaville have become less dense, and in some cases-have disappeared entirely. A striking example of this pattern is thePatte d'Oie forest, which originally covered 300 ha between the city andthe airport. Now, only 51 ha of lightly forested area remain. Thedepletion of other forests in the region is less dramatic, but has beennoted both in official and informal circles.
5.3 A 1975 survey of household energy (para. 5.9), based on theassumption that wood fuel demand was the major cause of local deforesta-tion, recommended the development of peri-urban plantations to supplywood fuels to Brassville. The technical feasibility of a 15,000 haplantation was studied and confirmed in 1982. The CCCE, main potentialdonor for the project, recently has commissioned a second study, withemphasis on project design to integrate the plantation into the rural/agricultural systems. The final project originally was to be implementedby the "Projet Bois de Chauffe", an ad hoc team of 24 set up within theCongolese Forestry Office (CFO) specifically for this project. The CCCIindicated at the time of the mission, however, that the Unit6d'Afforestation Industrielle du Congo (UAIC), which to date has hadextensive and successful experience with large plantations (para. 5.17),would be responsible for both the feasibility study and project implemen-tation.

- 46 -
5.4 No evidence has been gathered in the interim to determine theactual contribution of Brazzaville's wood fuel demand to deforestation.The mission's own estimates would indicate that the direct contribution,for the moment, is minimal: current annual consumption is well below thesustainable production of natural forests. Rather, prevailing agricul-tural land use patterns, especially the slash-and-burn technique widelyused to prepare land for planting, appear to represent a greater threatto natural forests. As more and more of the forest area is cleared foragricultural uses, however, projected wood fuel demand may eventuallyexceed sustainable production of remaining forests, thus accelerating thedeforestation caused by agriculture.
5.5 The mission believes that a large-scale peri-urban plantationproject would be premature at this point, when the extent and causes ofdeforestation, especially as they relate to wood fuel demand, have notbeen established. If, as the mission's initial estimates suggest,deforestation can more directly be attributed to agricultural practices,a large-scale plantation project will not relieve the pressure on thenatural forests, and thus its impact deforestation is likely to bemarginal. No further outlays should be made for peri-urban plantationsuntil the necessity of these and other projects directly linking woodfuel strategy to deforestation is determined within the context of aglobal analysis of: (a) competing uses for land and wood resources;(b) supply and distribution systems for wood fuels; (c) wood fuel demand;and (d) current and projected resource availability.
Impact on Wood Fuel Prices
5.6 The retail prices of commercial wood fuels, found almostexclusively in urban areas, are set by the market. Retail pricesobserved in Brazzaville are high relative to other West Africancountries. Charcoal prices are exceptionally high, which may account forits limited consumption (para. 1.6). As little is known about thecharcoal industry, it is not certain what special considerations may be,reflected by this price.
5.7 Retail prices tend to underestimate economic costs, as the costof the resource itself is rarely included in the trice. Authorities areconcerned by the relatively high supply costs for wood fuels because theyare perceived as a measure of the extent of area deforestation, which inturn is reflected in the burden of energy costs to consumers(Table 5.4). The costs of transport and distribution alone account forup to 80 x of both the retail price and the economic costs of wood fuels(Table 5.1). The perceived impact of deforestation may be overstated,however, as poor road conditions are also a major factor in transport anddistribution costs.

- 47 -
Table 5.1: COMPONENTS OF WOOD FUEL PRICES(CFAF/Kg)
Firewood CharcoalCcmponent Price , Econ. Cost Price Econ. Cost a/
Resource b/ -- 3 -- 20Production ct 6 6 28 28
Transport 9 9 15 15 d/
Distributlon 15 15 117 37 e/TOTAL 30 33 160 100
a/ Costs of production at Pointe Noire used as a proxy value.b/ Resource costs normally are not accounted for In retail prices.cl For firewood, refers to the observed retail price at the roadside,
whlch comprises primarily cutting costs, For economic costs ofcharcoal, represents estimated carbonization costs.
d/ Transport to Brazzaville from Points Noire.t sBased on experience In neighboring countries,
Source: Mission estimates.
5.8 There is little scope for sucessfully reorganizing the existingtransport and distribution system to effect a reduction in these costs.The alternatives are either to reduce supply costs by producing wood atlocations closer to the market, or to reduce the costs paid by consumersby improving the utilization efficiency. The schemes under considerationto achieve the former, notably peri-urban energy plantations forBrazzaville (para. 5.3), do not reduce significantly costs: transportcosts would decrease by, at best, one-third; and the addition of resourcecosts would bring the total supply cost to at least 30 CFAF/kg,equivalent to current retail prices. The related cost of useful energyto the consumer remains the same. Increased efficiency of wood fuelconsumption, on the other hand, translates into a lower overall demand inhouseholds. With adequate training, consumers using improved stovetechnologies could decrease the quantity of wood fuels consumed, whileincurring limited additional investment costs. The relevant cost perunit of useful energy would be reduced proportionately. Thus, thisoption would appear to be the most effective solution. It is discussedas part of the household energy strategy pvesented below.

Table 5.2: HOUSEHOLD ENERGY CONSLi3PTIONOF PRIMARY COOKING FUELS
Electricity a/ Firewood Charcool Kerosene LPGAverage
Household Percent Percent Annual Percent Annual Percent Annual Percent AnnualIncome Size Number b/ using using Consumption using Consumption using Consumption using Consumption
(kCFAF/month) (persons) (N) (N) (kg/cap/yr) (W) (kg/cap/yr) (0) (kg/cap/yr) (W) (kg/cap/yr)
less then 40 6.6 16 25 55 334 0 0 25 45.8 30 4.2
40 to 60 8.2 20 40 60 325 20 60.8 1S 67.3 55 10.2
60 to 80 6.2 17 47 53 278 24 18.5 47 36.3 59 11.4
so to 100 6.6 13 8S 38 137 69 21.4 85 31.1 77 20.6
100 to 120 7.2 16 88 44 97 75 18.9 69 15 94 19.4
more than 120 8.6 23 78 35 146 70 15,2 78 25.6 87 35
a/ Per capita consumption could not be estimated on the basis of Information collected in the survey.b/ Number of households in survey failing into the inecme category.
Source: Mission Household Survey.

- 49 -
Household Energy Strategy
Characteristics of Energy Utilization
5.9 Partial surveys conducted in 1975 in Brazzaville, and in 1983at Pointe Noire, give a tough description of household energy use. Themission completed a preliminary survey of 125 households in Brazzavilleto reconfirm and/or update observations of energy consumption patternsand found that:
(a) Households generally use more than one fuel to satisfy energydemnd.
(b) Demand and the pattern of consumption are directly related toincome, as shown in Table 5.2: Upper income households arethree times more likely to have access to electricity and touse LPG and/or charcoal. However, the per capita consumptionof charcoal is up to three times greater in lower incomehouseholds which consume that fuel. Per capita consumption offirewood and kerosene is also quite high in the lower incomehouseholds which consume tnem, supporting previous observationsthat these are the principal household fuels.
(c) In lower income households, the relative demand for fuels doesnot corresoond directly with their ranking according to eitherthe retaiL price or the economic cost per unit of useful energy(Table 5.3). This would indicate that other factors, such asequipment costs and ease of purchase, are more influential inthe choice of fuel.
(d) Lower income households tend to use fuels which can bepurchased in small quantities (firewood, kerosene sold in smallbottles), with a relatively small outlay of cash at the time ofpurchase. However, because these purchases are more frequent,the total energy costs of these households are notsignificantly different from those with higher incomes. Thus,the proportion of the household budget spent on energy can beup to three times greater in the lower income households.
(e) The equipment (stoves, utensils) for fuels used by lower incomehouseholds are less expensive, but have lower conversionefficiencies.
Interfuel Substitution
5.10 The rankings in Table 5.3 indicate the scope for substitutionamong cooking fuels. The mission's survey showed that in terms of thetotal consumption of useful energy in householtds, the ranking is almostidentical to the ranking by price, except that the order of firewood(with traditional stoves) and LPC is reversed. This is probably a

- 50 -
reflection of the income bias in the survey, which had proportionatelymore upper income households than the actual population. Nevertheless,total consumption appears to follow price signals, which encourageutilization of kerosene in low-income groups and LPC (a much cleanerburning fuel) for higher incomes. In terms of economic costs, however,charcoal, if supplied from new sources (para. 5.15-5.23), would actuallybe favored over both firewood and LPC.
Table 5.3: COOKING FUELS IN BRAZZAVILLE - FINAL ENERGY PRICES/COSTS a/ c/
Retail Price Economic CostsRank Fuel CFAF/kgoe Fuel CFAF/kgoe
1 Firewood (improved stove) 312 Firewood (improved stove) 3442 Kerosene 482 Kerosene 4093 Firewod (existing stove) 583 Charcoal (improved stove) 4864 LPG 671 Charcoal (existing stove) 6075 Charcoal 777 Firewood (existing stove) 6416 Electricity 928 Electricity b/7 Charcoal (existing stove) 971 LPG 1,0058 Firewood (open fire) 1,093 Firewood (open fire) 1,203
a/ Extracted from Annex 9, which contains all relevant calculations and notes.b/ See note &1 of Annex 9.g/ Implementation of Import parity pr!cing for petrolaum products will reduce the price
of kerosene (but not change its ranking in the retall price list) and will make LPGmore expensive than charcoal and electricity at their present prices.
Source: Mission estimates.
Energy Efficiency Improvement
5.11 Firewood is the most widely consumed fuel in Brazzaville. Itis the primary energy source for low-income households, despite its highcost: when used in a "three-stone" stove (open fire), as is commonly thepractice, it is one of the most expensive fuels in terms of both priceand economic cost per unit of useful energy. The total energy costs ofhouseholds with large per capita firewood consumption are much higher inproportion to household income (Table 5.4).
5.12 The use of improved stoves can drastically reduce the price andcost for firewood, and thus reduce the burden of energy costs on thehousehold budget. The quantities of wood fuels consumed can be reducedby 40% to 55%. The mission's estimates indicate that both retail priceand economic costs of firewood used in improved stoves are more competi-tive than those of kerosene. Charcoal is ranked third in terms ofeconomic costs when burned in an improved stove (Table 5.2).

- 51 -
Table 5.4: HOUSEHOLD ENERGY COSTSBY INCOME LEVEL
Cooking Costs Energy CostsCooking Costs
As Percent As Percent As Percent ofIncome Total of Income Total of Income Energy Costs
(kWFAF/month) (kWFAF/yr) (kCFAF/yr
less than 40 79.5 18.7% 96.0 21.8% 82,8%40 to 60 103.7 16.1% 136.9 21.4% 75.7%60 to 80 74.4 8.5% 102.0 11.5% 72.9%80 to too 90.3 8.0% 114.7 10.2% 78.7%100 to 120 78.1 5.8% 110.3 8.3% 70,8%more than 120 108.8 5.4% 174.4 7.4% 62.4%
Source: Mlssion Household Survey.
5.13 Improved stoves have the additional advantage of decreasing thedemand for firewood, since less primary energy is needed to produce thesame amount of useful energy. Thus promotion of improved stoves wouldrepresent a promising strategy in Brazzaville, where there is concernabout the link of wood fuel demand to area deforestation.
5.14 Considerations. Improvements to cookstove technology must beaccompanied by an evaluation of local cooking habits to aid the design ofequipment, including appropriate utensils. It is also necessary toassess the requirements for distributing the equipment and training womenin its use.
Utilization of Existing Plantations
5.15 The Congo has between 40,000 and 50,000 ha of replanted forestarea, both in the savannah and in the natural forests. Two plantationslocated in southern Congo are of interest for energy production: thePointe Noire plantations and the Loudima plantations. Both were origi-nally planted as feedstock for paper pulp projects which are no longereconomically viable. Alternative uses for the wood, including energy

- 52 -
production, have been sought at both plantations. Given thetransportation distances involved, charcoal production and distributionto urban/industrial centers appears to be the most viable energyutilization option. II/
5.16 The UAIC manages a large, technically advanced eucalyptusplantation of over 23,000 ha adjacent to the city of Pointe Noire.Planting operations began in 1978 using a cloning technique perfectedafter 20 years of on-site experimentation by the CTFT. The cloningtechnique has yielded impressive results in terms of iomogeneity ofproduct quality and high produciivity yields: nearly 30 mJ/ha/yr on mostplots, with an average of 25 m /ha/yr for the entire plantation. Thesefigures will be confirmed when the first industrial cuttings for electricpoles are made in late 1986. Detailed production costs established byUAIC in 1983 showed total costs of 244,500 CFAP/ha. The missionestimated that 1986 production costs, taking into account hectaresplanted since 1983, have risen to 325,500 CFAF/ha (US$930/ha).
5.17 The mixed plantation at Loudima, comprised of 6000 ha of pineand eucalyptus, was established by the predecessor to the MFE, theMinistere des Eaux et ForAts and currently is maintained bI the CFO.Productivity of the standing stock varies anging from 8.5 m /ha/yr forsome of the older stands (18 yrs) to 21 m /ha/yr for the five-year agegroup. A feasibility study conducted by SODETEG (France) for charcoalproduction estimated the annual sustainable supply at between 84,000 and109,000 m /yr. Production costs were not estimated, but should be higherthan the Pointe Noire plantation due to poorer management and lowresource inputs. Currently, no viable project for using this wood isunder consideratione
Potential Charcoal-Markets
5.18 Domestic Markets. Charcoal consumption in the Congo is limitedand is unlikely to increase significantly in the short term. Utilizationof charcoal in households is not widespread; demand in 1985 was onlyabout 11,000 tons. Estimates of potential charcoal consumption inindustry range between 25,000 and 34,000 tons. Given the competitivenessof petroleum products and the low investment capacity of most industriesunder current market conditions, the maximum total domestic demand forcharcoal is expected to stay between 30,000 and 40,000 tons/yr in theshort- to medium term. Export markets should represent more promisingoutlets for large-scale production.
I1/ Although in the case of Pointe Noire, the plantation is close enoughto the city that the by-products of cuttings are already collectedfree-of-charge for use as firewood by local residents.

- 53 -
5.19 Export Markets. The Kinshasa (Zaire) market, by its size(220,000 tons[yr) and location across the river from Brazzaville, is aprime target market. The Zaire Energy Assessment 12/ reports that up to401 of Kinshasa's demand will have to be supplied from otner-than-traditional sources in the near future. The Congolese charcoal could bedelivered to Kinshasa at a cost competitive with current wholesale prices(Table 5.5).
5.20 SODETEG (para. 5.17) analyzed the potential for exportingcharcoal to other markets, including Senegal and Europe. Unlesssubsidized, transport costs would limit the competitiveness of Congolesecharcoal exported to both markets.
Charcoal Production Potential
5.21 Large scale charcoal production appears feasible at bothplantations. SODETEM estimates that 14,000-to 18,000 tons/yr could beproduced at Loudima. In the case of Pointe Noire, annual productionpotential could range anywhere from 5,000 tons/yr, if only the wastesfrom electric pole production are used, to 126,000 tons/yr. The latterfigure assumes that half the sustainable annual supply is recovered forcharcoai production. In the long term, production from the wastes alonecould top 60,000 tons/yr as electric pole production increases. Intotal, charcoal production from these two sources could start from aninitial level of approximately 20,000 tons/yr and eventually top200,000 tons/yr in the medium term.
Production Costs
5.22 The mission estimated the financial costs of charcoal produc-tion at Pointe Noire using Brazilian beehive kiln technology. Totalestimated costs are presented in Table 5.5. As noted previously, trans-port costs to other markets (with the exception of Zaire) probably wouldhave to be subsidized in order for Congolese charcoal to be competitivein those markets.
Further Considerations
5.23 Preliminary estimates would indicate that the plantationsrepresent a considerable resource potential which could economically betapped for charcoal production, primarily for export. The availabilityof lower cost charcoal supplies could also induce greater demand in localmarkets. Uncertainty remains, however, as to the extent of markets,transport options and optimal project design for economic production.
12/ "Zaire: Issues and Options in the Energy Sector", UNDP/World Bank,IBRD Report No. 5837-ZR.

- 54 -
Table 5.5: ESTIMATED UAIC CHARCOAL PROCUCTION COSTSApril 1986
Component Unit cost Per Ton Equlv.
(CFAFAkg) (USS/ton)
Vood (including drying) 17.3 49.4Cutting and Transport 7.7 22.0Carbonization 2.9 8.3Kiln Depreciation 2.2 6.3Begging and Loading 1.3 3.7
Overhead and Transport 4.9 14.0TOTAL a/ 36.3 (19.0) 103.7 (54.3)
Delivered Cost b/ Prices c/
($FAF/kg) (CFAFAkg)
Destination:Brazzaville 63.3 (45S.8) 160Ki nshasa 68.3 (S0.8) 85
a/ Figure In parentheses represent resource-free cost, that Iscosts under the assumption that residues are freely obtainedas by products of main plantation activities, In this case,electric pole production; hence all production costs arecharged off to the product. Otherwise, resource costs arecalculated on the basis of average production costs(325,000 CFAF/ha) and average productivity (25 m3 /ha/yr).
b/ Flgure In parentheses Indicates resource-free delivery cost.cl Retail prices, equivalent to approximately 10 Z/kg for Zaire.
Wholesale prices estimated to be 60% to 75% of these figures.
Source: Zaire Energy Arsessment, UAIC, mission estimates.
Other important points to be addressed when considering the design oflarge-scale charcoal production projects at either the Pointe Noire orthe Loudima plantation are: (a) the place of charcoal production in thefuture management and utilization options of the plantations, which haveyet to be decided; and (b) measures to overcome the lack of experiencewith charcoal production and carbonization techniques, so that decisionmakers can choose the most cost-effective technologies suitable for theirrespective exploitation and production conditions.
- S5 -
Utilization of Wood Residues
Resources
5.24 Wood residues are generated from three types of activities:industrial logging operations, timber cutting, and wood processing. Only5X to 101 of the wood cut for industrial logging operations is actuallyof commercial value; the remainder is left on-site. This quantity rarelycan be recovered economically. Of the wood cut for timber, unutilizedwastes represent 1-1.4 times the volume of wood sent on for furtherprocessing. Just under 500,000 tons of residues are generated annuallyfrom these activities. An estimated 42,000 tons of residues aregenerated each year by wood industries, which include sawmills, furnituremaking and carpentry. Only residues generated from the latter twosources are of interest for energy utilization, however.
Utilization Options
5.25 Timber Cutting. Timber cutting operations are located inremote areas with negligible energy demand, so residues would have to becarbonized and transported to cities. A portable kiln technology, suchas the Ghana kiln, would be most suited to the nomadic nature of theseactivities. Production may be viable if sales are limited to the localmarket; the already high transport costs would prohibit other options.
5.26 Wood Industries. Residues generated by sawmills have thegreatest potential for recycling, either through carbonization or powergeneration. The carbonization activities would be similar to those fortimber cutting, although shorter distances are involved and fixed kilntechnology would be used. Using the residues for power generation couldoffset the fuel costs for diesel sets typically used by these industries,as most are not connected to the grid. A feasibility study of powergeneration conducted in the early 1980s for the sawmill SCIRIMA, nearPointe Noire, showed that a proposed power project could pay for itselfin annual fuel savings in just over five years. The payback period nowshould be re-evaluated to account for decreased fuel prices.
5.27 Considerations. As the domestic market will be very limited inthe short term, charcoal produced from wood residues may have to competewith overflow from the larger, export-oriented projects (para. 5.19-5.21). Consequently, the projects' viability will depend on the overallstrategy adopted for charcoal production and export.

- 56 -
Recommendations
5.28 The mission recommends the following action program foraddressing the issues in the wood fuel subsector.
5.29 For short-term, high priority action:
(a) A national charcoal production and marketing strategy should beinvestigated and developed, aimed primarily at export marketsand based on the utilization of (i) existing plantations and,possibly, (ii) wood residues. An initial feasibility should beconducted at the Pointe Noire plantations in two phases:Phase I ( US$75,000) will (i) determine resource availabilityand logistics of charcoal production under various plantationutilization scenarios, (ii) identify and quantify potentialexport markets, transport options and organization, and(iii) select appropriate technology. Phase II (US$75,000) willconsist of training, logistical testing and engineering designfor development of a longer term project strategy. If resultsare favorable, especially in Phase I, the methodology should bereapplied to encompass all production options.
(b) A program of demand management centered on utilization ofimproved stoves and energy substitution should be inititated,jointly with a wood supply/demand survey in Brazzaville(US$450,000, including wood supply/demand component). Theproject should include: (i) the selection, testing and designof improved stove models; (ii) the identification of cost-efficient production strategies; and (iii) the design of aprogram of marketing, education and training.
(c) All plans for peri-urban energy plantations should be abandoneduntil the systems of wood supply and utilization in Brazzavilleare examined fully. See the complementary recommended actionbelow.
5.30 For short-term, medium priority action:
(a) A thorough survey of wood resources, wood supply anddistribution Oor competing uses, and wood fuel demand isneeded. The primary objectives of the inventory are toascertain: (i) which resources are used to satisfy demand forenergy and non-energy uses and their current availability;(ii) the delivery system and costs of wood supply; (iii) themagnitude of wood fuel demand; (iv) the nature of therelationship between wood fuel demand, competing uses for landand wood resources, and depletion of area forests; and (v) theeconomic viability and cost-effectiveness of plantationprojects versus the alternatives offered through better land-use management and demand management (US$150,000).

- 57 -
(b) Strategies for improved management of the natural forest shouldbe developed which incorporate the findings in the surveyrecommended above.
5.31 The following strategies should be considered for developmentin the medium term:
(a) investigate the feasibility of expanding domestic charcoalmarkets in conjuction with (i) introducing improved stoves and(ii) developing the production potential of wood residues; and
(b) re-evaluate the feasibility of power generation using woodresidues at sawmills; study the feasibility of charcoal produc-tion and transport to local markets.

- 58 -
Annex IPage 1 of 2
.........;.............................................. ....... . .. ...
come COinoaLMM st M OE) UN
1974 1975 1976 1977 19= 199 1 1981 192 16 134 15
mimUM maci (00Uts.)LP 2.30 1.76 2.12 2.00 1.73 2.33 2.32 2.4 3.04 3.12 3.4 3.94
NE eqialest 2.43 1.07 2.24 2.12 1.84 2.U 2.45 2.62 3.22 3.31 3.63 4.47rtb rate (2) a/ -23.31 20.19 -5.43 -13.52 34.56 -0.6 6.62 22.96 2.66 9.70 14.06
1.36 1.41 1.02 1.28 2.23 14.6 1.13 0.92 1.09 1.00 0.95 .02104 equvaF it 1.41 1.46 1.69 1.32 2.31 1.20 1.17 0.95 1.13 1.03 0.98 0.85rtS rate (2) j L.A 26.99 -29.78 74.33 -48.03 -2.16 -18.8 10.39 -4.18 -5.31 -13.11
J.t Al 21.92 20.35 19.34 24.22 26.32 32.87 34.01 33.01 36.9 39.56 34.84 34.22NE eivaent 22.36 20.76 193. 24.70 26.4 33.53 34.69 33.67 39.72 40.36 35.53 34.91WAt rate (2) 41 -7.15 -4.96 25.21 8.66 24.91 3.47 -2.93 17.95 1.61 -11.95 -I.7
semItie 22.05 25.62 24.6 38.36 38.62 37.25 36.50 41.5 40.56 53.76 53.95 52.70TO1 equivalent 22.6 26.57 25.39 39.47 39.94 38.33 39.61 42.96 49.6 55.32 55.51 54.23rt rate (1) a/ 17.09 -4.43 55.47 1.20 -4.04 3.34 8.45 16.31 10.72 0.35 -2.32
brue 11.42 12.23 1.20 17.94 1.8 15.58 15.70 15.18 16.96 19.92 21.08 21.07NE eqlivalt 11.50 12.3 17.40 10.16 17.69 15.76 -15.8 IS.36 17.16 20.16 21.33 21.336rth ratle (1) 7.11 40.64 4.31 -2.55 -10.90 0.80 -3.31 11.68 1.48 5.80 -0.01
n 0il O3.5D 91.12 136.60 101.16 1*7.68 121.25 138.62 144.75 17.32 142.10 120.34 132.68TE eivalt 33.59 91.12 136.60 101.16 127.68 121.25 138.62 144.75 157.32 142.10 128.34 132.68Grath rate (2) a/ 9.01 49.91 -25.94 26.22 -5.04 14.33 4.42 0.69 -9.6 -9.66 3.54
Foel i1 36.66 32.4 33.37 36.13 22.63 20.36 15.73 15.55 17.44 9.6 17.92 20.51T10 equialet 35.53 31.43 32.34 35.01 21.93 20.21 15.24 15.07 16.89 48.15 17.36 19.87frot rate (1) V -11.5 2.90 8.27 37.37 7.85 14.58 -1.14 12.12 184.99 13.93 14.43
tOTAL 179.30 185.13 235.13 221.09 236.89 231.29 246.08 253.63 283.34 389.15 260.50 266.14TOE "iv nlat 179.50 18.8 235.59 221.95 238.23 232.75 247.68 255.38 285.41 310.42 262.69 268.23Bret rate (2) l 3.25 27.01 -5.97 7.14 -2.36 6.36 3.10 11.n1 9.11 -15.74 2.16
Eaunci (Ul)tal to Iten Systa 124.38 18.00 147.10 161.t 117.10 221.48 207.9 333.22 369.47NE quoivat 0.00 0.08 0.00 1049 11.87 12.65 13.18 1.23 19.04 24N.76 X26 31.reatb rate (2) bI 11.02 6.59 9.72 9.73 25.01 30.04 15.74 10.68
tOrA en cm (U000 ToE u9.50 185.58 235.59 232.64 250.10 245.40 261.56 270.61 304.45 335.18 291.35 380.08wert cmp 3.38 26.95 -1.25 7.51 -1.80 6.58 3.46 12.50 10.10 -13.08 2.97
Aerage Ana Greath
75-78 78-81 79-02 803 81-84 82O5 7685 7903 -
Electritity 9.27 12.76 18.62 20.13 20.42 14.64 16.22Potrelew Prodtts 7.96 3.56 4.70 7.57 2.05 1.81 2.69 5.58total Curcial Cosption 3.92 5.17 8.16 3.25 3.12 3.52 6.15

-59- Annex IPage 2 of 2
COICIAL NERGY CONSIIPTIONAND OWPARATVE INDICATORS
1978-1985
1978 1979 1980 1901 1902 1983 1984 1995
Cori. Energy Consuption 250.10 245.40 261.56 270;61 304.45 335.18 291.35 300.00(' 000 TOE)
Com. Energy Growth -1.9B 6.58 3.46 12.50 10.10 -13.08 2.97
Per capita Consumption 0.16 0.15 0.16 0.16 0.17 0.18 0.15 0.15(koos)
Electricity Consumption 11.87 12.65 13.88 15.23 19.04 24.76 28.66 31.77('000 TOE)Per Capit 0.01 0.01 0.01 0.01 0.01 0.01 0.01 0.02
Petroleum Consumption 238.23 232.75 247.68 255.38 205.41 310.42 262.69 268.23('QOO TOE)Per Capita 0.16 0.15 0.15 0.15 0.16 0.17 0.14 0.14
Enery Intensity 0.90 0.80 0.73 0.61 0.60 0.64 0.51 0.54(kgoe per CFAF) bI
Energy Coefficient c/ -0.19 0.37 0.14 0.9% 2.80 -1.52 -0.9%
GOP (billion 1980 CFAF) 278.51 306.12 360.40 446.95 504.97 523.17 568.18 550.60
Real GOP growth Rate 9.91 17.73 24.01 12.98 3.60 8.60 -3.09(i/yr)
Population d/ 1530.96 1598.83 1648.88 1711.21 1775.90 1843.02 1912.50 1984.79('000 pele)
a/ Prelidinary estimates.bl GOP in 1980 CFAF.c/ Ratio of GDP growth to growth of commercial energy.d/ Growth 3.782/yr, base 1974:1319.8 ending 1984 census:1912.5

- 60 -
Annex 2
CORAO PRODUCTION: 1982-1985('000 tons)
Percent1982/83 1984 1985 (1985)
Crude oil processed 661.61 545.82 598.72 100.0
Production
LPC 3.29 2.82 3.95 0.7Gasoline 57.30 52.49 57.51 9.6Kero/Jet fuel 17.74 26.64 33.62 5.6White spirit - - 0.26 -Gas oil 140.18 113.24 125.05 20.9Fuel oil 1500 RI 19.19 14.68 21.95 3.7Fuel oil 630 Co 388.22 303.15 313.16 52.3
Intermediate products 5.11 2.86 8.24 1.4Fuel consumption and losses 40.80 29.94 34.98 5.8
Source: Mission estimates.

- 61 -
Annex 3
COMPUTATION OF EX-REFINERY PNICES a/ b/('000 CPAF)
('000 CFAF)
Crude Cost 43,161,681Manufacturing Expenses 8,770,438Investment Expenses 625,000Capital Charges 2,756,230Stock Changes 246,304
Total Charges 55,519,653
Export Fuel Oil -16,094,000Financial Receipts -825,000Local Sales Receipts 38,600,613
ComputedEx-refinery
Imoort price Price{CPAP/ton) ($/ton) (CFAF/ton)
Butane 250,000 (625) 61,516Gasoline 120,800 (302) 174,632Kero/Jet Fuel 117t600 (294) 170,006Gas-Oil 107,600 (269) 155,550Fuel Oil 72,800 (182) 61,516Average 111,010 152,031
a/ January 1, 1986.b/ Ex-refinery prices are computed as follows:
- Gasoline, kero/jet fuel and gas-oil prices are proportionalto corresponding import prices (FOB Rotterdam plus $25 perton).
- Price of fuel oil (local market 1,500 RI) is computed fromprice of fuel oil 1% S (93.21) and price of kerosene (6.8X).
- Price of butane is equal to price of fuel oil.
- Exchange rate on January 1, 1986: US$1 - 400 CFAF.
Source CORAF.

-62- Annex 4Page 1 of 10
COWPARISON OF REFININS AND IWPORT ECONOMICS
Table 1: CROE REFINING VERSUS I~RT OF FINISHED PRODUCT: 4th QUARTER 1985
(Thousand USS)
Base Case Rase Case Improved Case a/ Improved Case a/DJ6no Bonny DJ6ito Bonny
Refining Option
Crude lmport, minus Fuelexport, plud Port charges 68,933 64,421 68,933 64,421
Refining expenses 21,290 20,394 11,200 10,304
Sub-Total 90,223 84,815 80,133 74,725
lwport Option
Cost of product b/ 75,371 75,371 75,371 75,371
Gain/CLoss) In refining (14,852) (9,444) (4,762) 646
a/ Reduced operating costs, as specifled on Table 4.bM NUE FOB prices, plus freight, Insurance and ocean losses.

-63 - Annex 4Page 2 of 10
Table 2: CRUDE IRFININB VERSUS IWPORT OF FINISHED PRODUCT: 3rd quarter 1986
(Thousand USS)
Base Case Ebse Cae Improved Case n/ Improved Case o/DJ6no Bonny BJ6no Bonny
Refining Option
Crude lmort, minus Fuelexport, plus Port charges 23,553 28,833 23,553 28,833
Refining expenses 24,331 23,536 12,158 11,383
Sub-Total 47,864 52,389 35,711 40,216
Iport Option
Cost of product bl 39,898 39,696 39,898 39,69
Baln/(Loss) In refining S/ ( 7,986) (12,491) 4,187 (318)
a/ Reduced operating costs, as specifled on Table 4.y/ NME FOB prices, plus freight, Insurance and ocean losses.sX Taking into account the modifications to tho hypothesis for crude and product prices
as suggested by the Gowernment (footnote 3, Table 3), even greater losses vi I resultIn each case:
Base Cae - DJ6no: (10,266)Base Case - Bonny: (12,590)Improved Cse - J)no: ( 1,907)Improved Case - Bonny: ( 2,600)

-64 - Annea 4
Page 3 of 10
HYPOTHESIS FOR CALCULATIONS: TABLE 1 AND 2
i. Product demand assumed for 1986 is as follows:
Butane 3,800 tonsGasoline 51,300 tonsKero/Jet 44,800 tonsGas oil 131,000 tonsFuel oil 23,000 tons
Li. Refinery production from DJENO and Nigeria BOWNY/LIGHT is estimatedas follows:
Type of CrudeProduct DJENO (28.4 API) mONNY (36- API)
(% wt) (tons) (S wt) (tons)
Butane 0.7 3,800 1.2 3,800Gasoline 9.0 51,300 16.0 51,300Kero/Jet 7.9 44,800 14.0 44,800Gas oil 23.0 131,000 40.9 131,000Fuel oll (local) 3.9 23,000 7.2 23,000Fuel oil (export) 50.1 285,500 14.6 48,800
Refinery fuelplus losses 5.4 30,600 5.4 17,300
TOTAL 100.0 570,000 100.0 320,000
(These estimates do not Include output while the distillatlon tower, whichhas been In service since July 1986, Is operfl1ng.)
iii. CRUDE PRICES
Average prices for DJMUO in fourth quarter 1985 and third quarterof 1986 are as follows:
4th Q 1985 $ 26.15 per bbl3rd Q 1986 $ 9.85 per bbl
Average spot prices as per PIF sources for BONNY LIGHT during thesane period are as follows:
4th Q 1985 $ 28.9 per bbl3ti 0 lGRA C 19 X - U1h

- 65 -Annex 4Page 4 of 10
No freight is considered for DJENO crude.In the mission's calculations, freight cost for BONNY LIGHT isestimated on the basis of VS 110 for 30,000 DWT vessels plusinsurance and ocean losses at the rate of 0.71 of FOB plusfreight. The calculations made by the Government (footnote c,Table 2) are estimated on the basis of $0.50/bbl for freight andinsurance and $1.616/ton for port taxes.
iv. PRODUCT PRICES
Product prices as per NW Europe FOB prices plus freight in20,000 DVT vessels at WS 160 plus insurance and ocean losses at therate of 0.71 on FOB plus freight.
The estimated product prices are as per Table 3.
v. OPERATING COST OF THE REFINERY (Table 4)
They include:Variable costs (purchased utilities, catalysts and chemicals).Fixed costs (salaries, maintenance, technical assistance,
administrative overheads).Financing costs (cost of credit to XC, amount payable to ELF for
advancing WC in 1983 and credit expenses on crudeoil).
Exchange rate 1985: US$1 - 400 CPAP1986: US$1 - 350 CFAF
vi. OPERATING EXPENSES FOR PRODUCT IMPORT
They include salaries, maintenance, administrative overhead lossesand cost of providing additional facilities (see Table 3).
vii. COST OF PROVIDING SOME ADDITIONAL FACILITIES
For importing BONNY LIGHT crude additional investments ofapproximately US$200,000 will be required. Corresponding expensesare included in the costs of BONNY LIGHT cases.
viii. REDUCTION IN OPERATING COSTS
While processing BONNY LIGHT vis-a-vis DJENO crude, a reduction inoperating costs of between US$506,000/yr and US$1,031,000 is alsotaken into account.

- 66- Annex 4
Page 5 of 10
ix. In the improved cases, the various operating costs are assumed tobe reduced as shown in Table 4. The main reductions are fortechnical assistance, social benefit costs, maintenance andfinancial expenses.

Annex 4
Page 6 of 10
Table 3s PRODUCT PRICES
NVW EOPE FOB (/It)
4th Q 85 3rd Q 86
Casoline 277.6 156.S
Jet/Kerosene 286.4 128.7
Gas oil 258.6 112.5
1X Fuel oil c/ 149.6 71.2
3.5Z Fuel oil c/ 141.1 60.2
0.31 Fuel oil 152.0 74.3
Local Fuel oil a/ 158.9 75.1
Export Fuel oil b/ c/ 144.9 71.4
a/ 93.21 Fuel oil 1S 8 plus 6.81 Jet Fuelb/ 951 Export Fuel plus 5X Jet Fuel = 1001 Fuel 0.31-X-c/ The Government recalculated the costs of refining versus
imports for 3rd quarter 1986 on the -basis of the followingcorrected figures: 1Z Fuel - $69.9/ton
3.51 Fuel - $61.3/tonExport Fuel - $50.9/ton
The resulting estimates are presented in footnote c ofTable 1.

- 68 -Annex 4Page 7 of 10
Table 4: R£FINERY OPERATING COSTS (1986)
Thousand USS/year q/
Current Improved maneoumnot c/
VARIABLE COSTS 1.031 1.031
Power (external supply) 363Catalyst 127Chemicals 148T.E.L. + Additives 393
OPERATINP FIXED COSTS 17,939 9A367
Salaries (local personnel) 2,894 2,894Housing expenses 1,480SocalI expenses 1,993 1,473
Technical assistance 6,394 2,000
Maintenance (materlal) 920Maintenance (external servIces) 2,613 1,500
Overheed 1,645 1,500
FINANCIAL EXPENSES 5.361 1.760
Cost of credit to H.C. 2,700 -Interest on korking capital 1,260 b/ 1,260 b/others 1,401 S0o
TOTAL OPERATING COST 24,331 12,158
a/ USSi a 365 CFAF.b sAmount payable to Elf until end 1988 for advancIng working capital In 1983.cl Thes figures Indicate target levels. They re based on operating costs observed In
similar refining facilities In Africa end should be possible to achieve with efficientmanagement and operations.
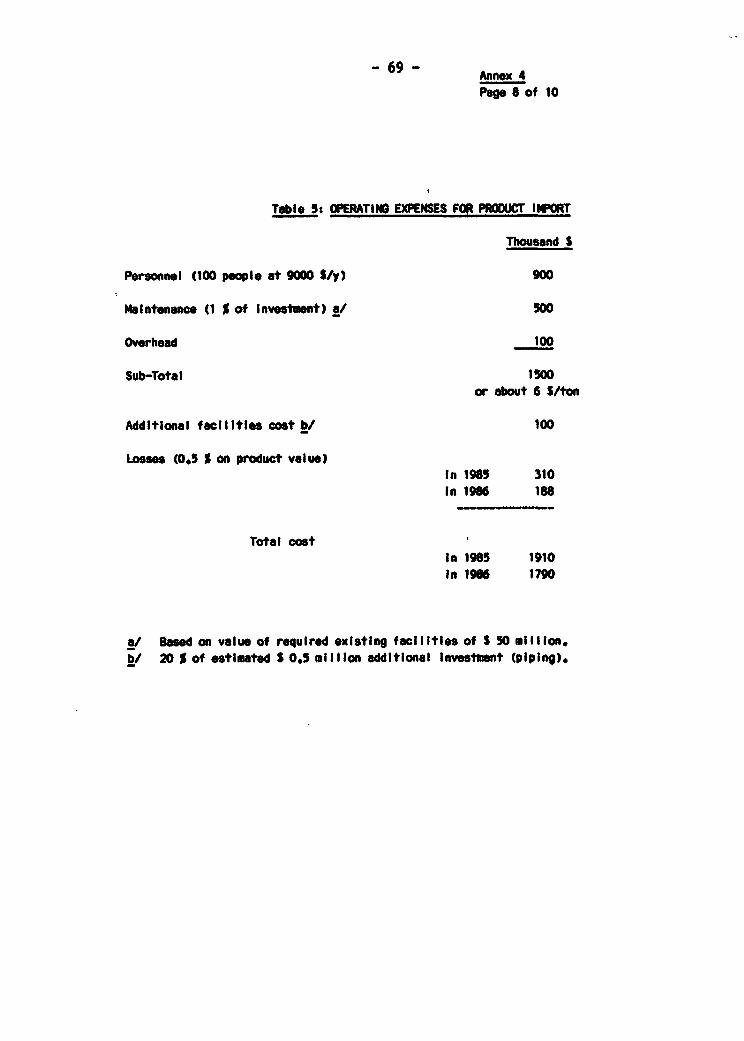
- 69 Annex 4
Page 8 of 10
Table 5: OPERATING EXPENSES FOR PROOUCT IMPORT
Thousand S
Personnel (100 peopl, at 9000 S/y) 900
Maintenanc (1 S of investment) 1 SW00
Overhled 100
Sub-Total 1500or about 6 S/ton
Additional facIlities coot b/ 100
Losses (0.5 % on product value)In 1985 310In 1966 18I
Total costIn 1985 1910In 1986 1790
a/ Ebsed on value of required existing facilitles of S 50 millIon./ 20 S Of estimated S 0.5 mIIion additional investment (piping).

- 70 - Annex 4
Page 9 of 10
SUGGESTED MEASURES FOR REDUCING OPERATING COSTS I/
Technical Measures
The implementation of the first two suggested technicalmeasures have been achieved or are already underway:
(a) The addition of the vacuum tower unit to increase feedstock tothe hydrocracker (para. 3.2) will reduce fuel oil productionfrom 312,000 tons/yr to 285,000 tons/yr. The continuedeconomic benefits of the addition will depend largely on crudeoil and fuel oil prices.
(b) The rehabilitation of the heat exchange unit (para. 3.11)should save about 2500 tons of fuel oil annually.
(c) Import of a lighter African crude to replace the Djeno crude isplanned for late 1987/early 1988. The economic benefits couldbe substantial,? as fuel oil production would be reduced. Thecosts of additional minor investments to facilitate transportof the imported crude from Pointe Noire are not considered inthe mission's preliminary calculations.
Operational Nesures
(a) The primary reduction should occur on foreign technicalassistance expenses. Based on observations of similar refiningoperations in other African countries, the mission estimatesthat expatriate personnel could be reduced to about 10, withoutaffecting current operations. The Government had alreadyreduced the number of expatriate staff by 14 in mid-1987.
(b) Social benefits for local personnel, particularly housing,medicine and transport, amounts to about US$ 3.4 millionannually. Steps have been taken which should substantiallyreduce these costs. They affect lodging costs (a preventivemaintenance policy, which requires workers recruited locally topay their own rent) and transport costs (re-arranging workinghours and ending transportation subsidies for workersfamilies). Still, the Government should continue to identifymeasures which will reduce these costs to acceptable levels.
1/ Some initial areas identified by the mission which could help reducecosts to the target levels on Table 4.

- 71 - Annex 4
Page 10 of 10
(c) Financial expenses. Interest charges on working chapitalborrowed in 1983 will end after 1988. Cost of credit toHydroCongo should be eliminated by avoiding credit facilities.
(d) The total maintenance cost of this simple refinery could bereduced to about US$1.5 million per year.

- 72 -
Annex 5Page 1 of 7
Electricity Demand and Supply
Load Growth
1. Recent trends in economic growth and energy consumption havebeen briefly presented in Chapter I. In addition to the underlyinglinkage with expanding incomes, the growth of electricity consumption hasbeen accelerated by a promotional (declining block) tariff structure andthe freezing of rates since 1976 for about half the total load and since1982 for the rest.
2. Consumption of electricity is concentrated in the two mainurban centers; in 1985 Brazzaville and Pointe Noire accounted for 90X oftotal sales (Table l)s
Table 1: CONGO - PATTERN OF ELECTRICITY CONSUMPTION, 1985
Brazzaville PolnteNolre ombenzal Secondary TotalLoubomo/NfKayl Centers
Eneray (OWh)
LV 90 57 7.8 1.2 156WY 61 76 22.3 - 159
Total 151 133 30.1 1.2 315
Average ConsumptionPer LV Customer(kWhbAonth) a/ 363 587 333 122 259
a/ Estliated on assumption that the number of low voltage supply contracts IsapproxImately 1.6 times the number of customers.
3. The structure of electricity sales by economic sector is notknown in any detail. Table 2 presents the estimated structure of salesby voltage level and tariff category in Brassaville and Pointe Noire:

- 73 -
Annex 5Page 2 of 7
Table 2: CONGO - SRTUlE OF SNE SALES IN ERAZZAVILLEAND POINTE NOIRE a/
Brazzaville Pointe Noire
Low Voltage 61 42Households 19 16Government 7 2Public Lighting 2Private Business 23 21Parastetals 10 4
Hilgh Voltae 39 58PrlIvto BusIness 19 47Government 2Parastatals 21 8
Tota 100 100
a I In percent of totaI sales; Brazzavi le estimates are for1981-82(average); Pointe Noire estimates are for 1965.
b/ Totals may not add up due to rounding.
4. The statistics available on past and present electricityconsumption are unreliable and are distorted by restrictions in powersupply; they are of limited value for forecasting future demand. Themission has used a wide envelope of load growth scenorios (Table 3) asthe basis for projecting future energy and capacity balances for theinterconnected system out to 1995.
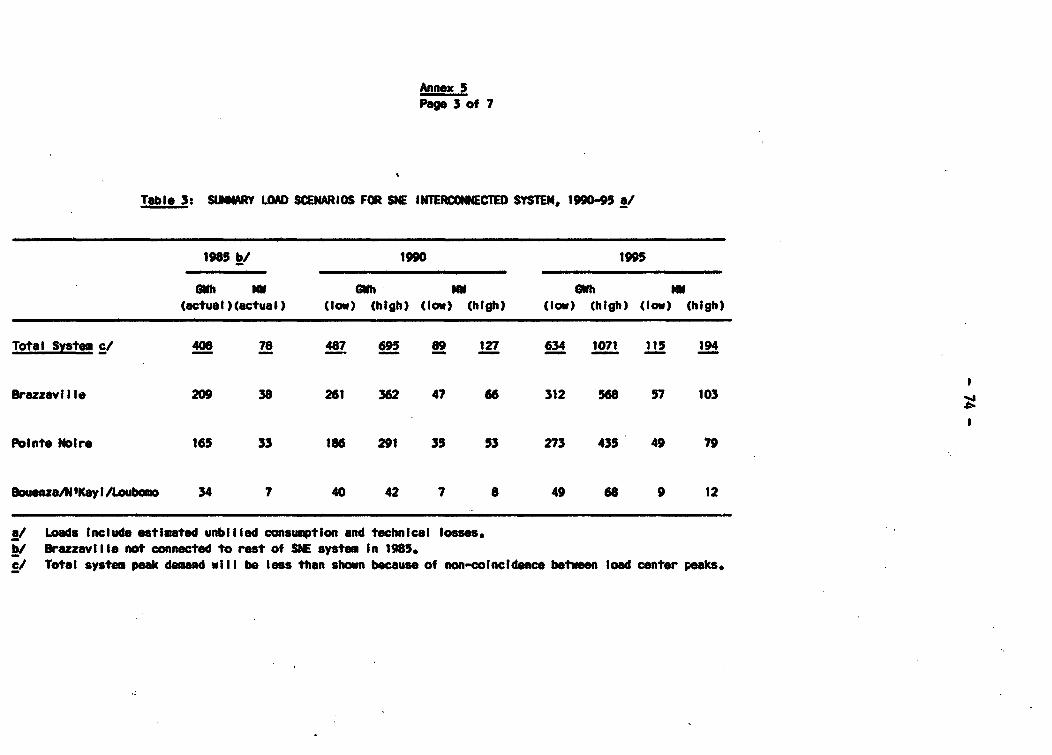
Annex 5Page 3 Of 7
Table 3: SUMMARY LOAD SCENARIOS FOR SNE INnERCOHNECTED SYSTEM, 1990-95 a/
1965 bl 1990 1995
OWh NO GWh NW Ghh MW(actual)(actual) (low) (high) (low) (high) (low) (high) (low) (high)
Total Syntem cl 408 78 487 695 89 127 634 1071 115 194
BrazzaviIle 209 38 261 362 47 66 312 S68 57 103
Pointe Noire 165 33 18S 291 35 53 273 435 49 79
BouenzAa Kayl/Loubomo 34 7 40 42 7 8 49 68 9 12
a/ Loads Include estimated unbilled consumption and technical losses.b/ Brazzaville not connected to rest of SNE system In 1985.cl Total system peak demand will be less then shown because of non-coincidence between load center peaks.

-75 Annex 5Page 4 of 7
5. A vigorous program of new connections is built into theforecasts until 1990. If SNE succeeds in improving the reliability ofsupply, load growth will tend to move into the upper part of the forecastrange. The impact will be significant if the present autogenerators inPointe Noire switch to the public supply system. However, this effectcould be reduced or eliminated if SNE raises electricity tariffs tolevels that ensure full recovery of economic and financial costs.
Generation and Transmission.
6. The public power supply system consists of two independentnetworks-Brassaville and P)inte Noire-Loudima-Bouenza-N'Kayi--and 15small isolated load centers (Map IBRD 18242). Total installed capacityin the isolated centers in 1985 was about 5.4 NVA; most centers have aninstalled capacity of between 0.2 and 0.4 MVA. Estimated generation inthe isolated centers in 1985 was 1.5 GWh, or 0.4X of total energysupplied to SUE networks.
7. The Brazzaville system consists of:
(a) the Djoue run-of-river hydro plant adjacent to Brazzaville--15 NW installed capacity, 12.4 Mw firm;
(b) a 225 kV interconnection with the Inga hydro plant in Zaire;
(c) a diesel plant in the center of Brazzaville-in early 1986approximately 2 MV was available for standby duty.
8. The Pointe Noire/southwest system consists of:
(a) the Noukoukoulou hydro plant, located about half way betweenPointe Noire and Brazzaville--74 MW (4 x 18.5 MW) installed,about 23 NW firm;
(b) 110 kV transmission from Moukoukoulou to Bouenza, N'Kayi andLoudima, with 35 kV lines to three other smaller towns;
(c) nearly 150 km of 225 kV transmission from Loudima to PointeMoire;
(d) a diesel plant in Pointe Noire--for system planning purposesthis capacity should be treated as unavailable.
9. The Brazzaville and Pointe Noire systems are in the process ofbeing linked by a 225 kV transmission line from Loudima to Brazzaville.The resulting interconnected system is expected to be operational by late1987. The main benefits of interconnection are:
(a) The Moukoukoulou hydro plant's low cost surplus energy andpower can be transferred to Brazzaville, thereby reducingimports from Zaire.

- 76 -
Annex 5Page 5 of 7
(b) In the event of difficulties with SNE generation facilitiestimported energy and power can be made available not only toBrazzaville but also to Pointe Noire and other load centers inthe southwest.
10. The mission has used its two load growth scenarios (para 4) toproject energy and capacity balances for the interconnected system out to1995 (Tables 4 and 5). The projections represent a hypothetical "basecase" in which:
(a) additional electrical energy requirements are met by imports;
(b) gas turbine capacity (or other low capital cost thermal plant)is installed in Pointe Noire to match total peak demand inPointe Noire-as protection against a tempora.y outage on thetransmission line from Loudima to Pointe Noire (a 22 houroutage occurred'in late 1985);
(c) additional thermal capacity is installed in BrAzzaville so thattotal firm capacity on the interconnected system matches totalsystem peak demand-as protection against supply interruptionfrom Zaire (only about 8 hours in 1985).
Table 4: SUMMARY ENERGY BALANCEFOR SNE INTERCONNECTED SYSTEM, 1985 - 1995 (GWh)
1985 1990 1995actual a/ (low) (high) (low) (high)
Energy Demand 408 487 695 634 1071
Hydro Generation b/ 287 463 520 520
Deficit/Imports 121 24 175 114 551
a/ Estimated; Brazzaville not connected to rest of SNE system In 1985.b/ Assuming maximum energy output from Moukoukoulou Is 240 GWh (wet season)
plus 160 OWh (dry season) and f rom DJoue Is 88 GWh/yr rising to 120 Mt /yrIn 1990 after rehabilitation.

- 77 -
Annex 5Page 6 of 7
Table 5: SUWMMRY CAPACITY BALANCEFOR SNE INTERCONNECTED SYSTEM, 1990 - 95
tM)
1990 1995(low) (high) (low) (high)
System Peak Demand 89 127 115 194
Firm Hydro Capacity 38 38
Pointe Noire Capacity 35 35 49 79
BrazzavilIe Reservo c/ 16 36 28 77
a/ Moukoukoulou 23 MW plus Djoue 15 MW (after reh_. ilitation).b/ Reserve capacity needed In Pointe Noire, equivalent to projected peak
demand In Pointe Noire.cl Additional reserve capacity needed In Brazzaville If system Is to have
100% protection against Interruptions of supply from Zaire.
11. The marginal cost of generation associated with the base caseexpansion plan is approximately (a) the cost of imports from Zaire at9 CFAF/kWh, plus (b) US$500/kW--the cost of installing gas turbines,including a small allowance for fixed O&M costs. No allowance is madefor transmission and distribution costs and losses. This simple analysisindicates that new generation options should only be considered if theycan provide the required level of reliability for less than about4.0 USC/'Ah at system load factor.
Distribution.
12. The distribution cystems in Brazzaville and Pointe Noireoperate at 30 kV and 6.6 kV. Both distribution systems are in very poorcondition due to saturation and inadequate maintenance. Distributionoutages are a more frequent cause of nonsupply to consumers than failureat either the generation or transmission level. A program ofrehabilitation and conversion to 20 kV is underway and this should resultin a progressive improvc¶ent in reliability of supply over the next fewyears.
- 78 -
Anne, 5Page 7 of 7
Private Capacity
13. Poor reliability of srpply has compelled many consumers tomaintain their own private capacity, either for baseload generation or asbackup during SHE outages. In 1983 there was an estimated totalinstalled autogeneration capacity of 12 MS in Brazzaville, 35 MW inPointe Noire and 5-10 MU in the rest of the country. Private backupcapacity will remain a necessity until the distribution systems areressored to a reasonable level of reliability (1989/90). In PointeNoire, an additional requirement is the installation of sufficient SNEthermal capacity to cope with a Moukoukoulou-Pointe Noire transmissionoutage. In the interii1 there may be some scope for using the excessinstalled capacity of some autoproducers in Pointe Noire to supply otherSUE customers during outages.

-79-
Annex 6Page 1 of 2
PUTROLNUZE PRODUCTTRANSPORT DIF2RRUTIALS(from Pointe Noire)
Relative Durationof Journey Compared
Transport with Rail toCFAP/kg a/ in system Brazaville c/
(Rail - 1)
Louboso 5.8 180 RailNkayi 8.3 260 RailLoutete 10.5 330 RailNossendjo 13.0 410 Rail'Biada 17.7 550 RailBrazzaville 16.6 520 Rail 1Mosa'aka 35.4 985 Rail + riverOYo 38.7 1 090 tail + river 3.5 b/Imptondo 50.0 1 382 Rail + river S b/Ouesso 53.2 1 475 Rail + river 10 lo
a/ Excluding turnover ta.-osb/ From Brazzavillec/ Outward journey
Source: ATC.

Annex 6Page 2 of 2
PETROLEUM PRDfU PRICE STRUCTJE - EARLY 1986(CFAF/tan)
Gasoline Kerosene Gas-Oil Gas-Oil Fuel OfI Fuel Oil Jet Al Butane(internal) (Marina) (internal) (MarIne)
EX CORAF PRICE 174,632 170,006 155,550 155,550 61,516 61,516 170,006 61,516
TAXES 5,682 340 311 311 123 123 340 123
DISTRIBUTION COSTS .
Operation Expenses 56,978 50,298 49,119 39,295 39,295 31,436 47,154 157,180 1
Financial Charges 9,927 9,927 11,628 11,626 11,628 9,927 11,534 13,236
Hy4ro-Congo Margin 4,831 4,605 4,326 4,129 2,250 2,059 4,574 4,640
Retail Marr*n 10,000 8,125 5,882 - - - - 50,000
Total Cost
CFAF/ton 262,050 243,301 226,816 210,913 114,812 105,061 233,606 286,695
CFAF/I 197 195 193 179 115 a/ 105 a/ 187 287 a/
Retail Price
CFAF/l 295 170 195 - - - 153 320 a/
a/ CFAF/kg.
Source: CORF.

-~~~~~~~-8
Annex 7
COMkMISON OF COOKIN6 FUEL COSTS
Economic CostEnergy RatuII PrIco per unit Economic per unit useful
Unit content Yield Price useful energy Cost energy
(kgoe/unit) (M) (F/unit)a/ (F/kgoe)a/ (F/unit)a/ (F/kgoe)a/
TRADITIONAL FUELS(Brazzaville Only)
Firewoodopen fire kg 0.343 8 30.0 1093 33.00 12Q3existing stoves kg 0.343 15 30.0 583 33.00 641Improved stoves kg 0.343 28 30.0 312 33.00 344
Charoalexisting stoves kg 0.6863 24 160.0 971 100.0ok/ 607improved stoves kg 0.6863 30 160.0 777 100.0o/ 486
In Polnte Noiretexisting stoves kg 0.6863 24 n.e. n.a. 50.OOc/ 34Improved stoves kg 0.6863 30 n.e n.o. 5O.OCO/ 243
CCMMF)IAL FUELS(fiy Location)
KeroseneBrazzaville liter 1.007 35 170.0 482 144.10 409Pointe Noire i;rer 1.007 35 170.0 482 134.10 380Oubiso liter 1.007 35 170.0 482 204.10 579
LPBBrazzav I IIo kg 1.Q5Y 45 320.0 671 479.00 1005Pointe Noire kg 1.059 45 320.0 671 415.00 87'Ohesso kg 1.059 45 320.0 671 620.00 1301
ElectricityBrazzaville kWh 0.0877 65 52.9d/ 928 52.9e/ 928e/Polate Noire kWh 0.0877 63 59.6d/ 1046 59.6e/ 1046_/Ouesso kWh 0.0877 65 59.9d/ - 1051 59.90/ 1051_/
a/ F a CFAFb -Economic cost of charcoal produced at UAIC plantations in Pointe Noire and delivered to Brazzaville,
plus estimated distribution costs. Used as proxy value for current costs of production in Brazzaville,which are not known.
cl Economic cost of chorooal produced at UAIC plantations In Pointe Woire and delivered to the city, plusestimated distrlbutlon costs. Used as proxy value for current costs of productlon In Points Noire,which are not known.
d/ Low voltage toriff for lighting and domestic uses, 0 to 25 hours monthly utilizatlon, before taxes.!/ Thg mission's Initial findings Indicate that marginal costs of supply (economic costs of power supply)
art higher than current tariffs. These costs could not be estimated at the time of the mission due tomissing and incomplete data. Current tariffs are taken as a minimu proxy value for the marginal cost.

~~~~~.r tMAR (ii. ~~~~~~~~~~~~~~~~~~~~~~~~~~~~~~~~~~~~~~iD20005-
PEOPLE'S REPUBLIC OF THE CONGOA OIPUPTBNA4.-. OIL PIPELINES
* ~~~~~~~~~ENERGY ASSESSMENT - NSUJRFACED ROADS
/ ~ ~ ~ ~ ~ ~ . \ ~~~~~ PETROLEUM SUBSECTOR REVIEW USRAE OD-i -I RAILROADS
GARON > , - ~~~~~~~~~~~~~~~~~~~~~~~~~~~~~~~~~~~~~~~~~~~~~~ISOBATHS IN AMETRS
THE MAJOR SEA PORT
COAS'AL 0 3 I? D
BASIN EDGE OF ~~~~~~~~~~~~~~~~~~~~~~~~~~~~~~~~~~~~~~D~4 EXPLORATION PERMITS:
o Rnnsovlh. ~~Z A IR 40 Icc10 D ( NAME HOLDER
o ,-J~~~~~~~~~~?rP NAWE MRS NYDRO CONGO (15%)~~~~~~~~~~~~~~~~~~~~~~~~~~~HUE ERJYOO OGOJ1%ELF CONGO (0511)
OLAI ~~~~~~~~ ~ ~~~~~~~~~~~~~~~~~~~~~~~~~~~~~~~~LA LOEME IIYDRO CONGO (IN%ELF CONGO (05111
MADINGO MARIMME AGIP RECHERCHES CONGO (65%)Al, A2Z A3. S ELF CONGO (3%)MARINE I AMOCO (50%)
HYDROCONGO 150%)POINTE-NOIRE ELF CONGO (65A1)GRANDS PONDS AGIP RECNERCNPS CONGO (35%)
MARINE II CONOCO (50%)NYDRO0 CONDO (50%)
L~~~~~~~~~~~~~~~ ~~~~~~~PRODUCTION PORMTO
EMAERAGORE ELF CONGO (65%)
AGIP RECNERCNES CONGO PS5%)
TOANGO AGIP RRCHERRCNES CONGO (50%)ELF CONGO (50%)
POINTR INDIENNE ELF CONGO
YANGA-SRNDJI ELF CONGO 165RIAGOP RECHERC14ES (35%)
TCERROUELA ELF CONGO A5%)S.- ~~~~~~~~AGIP ROCHEECHES (35%
ZATCHI AGIP RECHERCHES (150%?)'ELF CONGQ 1)
MENGO ELF CONGO (0511HTDRO CONGO (15%)
ELUNUJI ELF CONGO (05%)HTORO CONGO (15%)
Z A I R E 04DBlES ELF CONGO (115%)N4YDRLO CONGO (15%)
CUVftTE
MARINE niI IV, V
MAR PROFONDE
* OIL
INTERNATIONAL BOUNDARIES
SEPTEAMER 1906

/laEmA >SJ C'\. i / '\ CENTRAL AFRICAN REPUBLIC
ZAIRE '/ . -KENYA I
7 C )i , 0 ,7 \..*8
SO'JThI NTA NZAN
OQArrrN ) - 9 s V v p CAMEROON i ) qOQi.;A ;ANGOLA ; S \;-Z 4 >>{ \ \ >/ SW
{ X SOUANKE )'MO 1.0 :
PEOPLES REPUBUC OF tHE CONGO G
-- GENERAMNG FACIULlES ADTRANSMISSION SYSTEMS
INSTALLED CAPACITY
SilsENg PWeW eted
; _ _ H^a "_lt d _ - ETOUMBi o
TRANSMISStON LINES
-E -P4 225 kV
- 110~ukV
_ Pd_wl Mt m ae d
is Nlie Ca_Eow. ZAIRE
-2'~~~~~I
N>^ XiABON
. bE. ,? X . t)~~~~~~~~~~~~~~~~~~~~~~~~~~0 ,1 io50 200,O
LI\~~~~~~~~~~~~~~~~~~~~~~~~~~~~~~~~~~~~~~~~~~~~~~~~~~~~~~~~~~~~O
,/ ~ _______________/1
4.-
f6m I N<V rr o7 s e en b The . tAI eecRuNI Eu Eu cen _ Wuue or mt 1" -s^A.&NGOLAM / y e ud adE nu>Sel 1E fIDd
* -, 'ZAIRE on e edsbe alefeFhne Of psumsd Xsnz ATANTC . ' nd a | ,,. o u batf Lrj

Reports Already Issued
Togo June 1985 - 5221-TOVanuatu, June 1985 5517-VA*Tonga June 1985 5498-TONWestern Samoa June 1985 5497-WSOBurma June 1985 54lb-BAThailand September 1985 5793-THSao Tome and Principe October 1985 58f'.,STPEcuador December 1985 5865-ECSomalia December 1985 5796-SOBurkina January 1986 5730-BURZaire May 1986 5837-ZRSyria May 1986 5822-SYRGhana November 1986.- 6234-GHGuinea November 1986 6137-GUIMadagascar January 1987 5700-MAGMozambique January 1987 6128-MOZSwaziland February 1987 6262-SWHonduras August 1987 6476-HOSierra Leone October 1987 6597-kLComoros January 1988 7104-COM
Energy Assessment Status Reports
Papu: New Guinea - July, 1983Hauritius October, 1983Sri Lanka January, 1984-Malawi January, 1984Burtsndi February, 1964Bangladesh April, 1984Kenya May, 1984Rwanda Mayt 1984Zimbabwe August, 1984Uganda August, 1984Indonesia September, 1984Senegal October, 1984Sudan November, 1984Nepal January, 1985Zambia August, 1985Peru August, 1985Hait-i August, 1985Paraguay September, 1985Morocco January, 1986Niger February, 1986

rio~~~~~~~~~~~~~~~~~~~~~~~~~~~,----
v JbeR :; / ; Fl?-. e - -- eB
,,,C ,. .. - .-
C7 ~~~~3. . .'s n 0--
o -.- - 3? 4 ''' ,
=-,. ~~~~~~~~~~~~~~~~~~~~~~~~~~~~~~,"
s_~~~~~~~~~~~~~~~~~~~~~~~~~~~~- ,.30
7~~,= .
k~~~~~~~~~~~~~~~~~~~~~~~~~~~~~~~~~~~~~~~~~~~~~~~~~~~~~~~~~~~~,