Report No. 18562-PH Philippines Social Expenditure Priorities · PDF fileReport No. 18562-PH...
62
ReportNo. 18562-PH Philippines Social Expenditure Priorities November13, 1998 Managing Unit: Philippines Country Management Unit East Asia and Pacific Region Document of the World Bank Public Disclosure Authorized Public Disclosure Authorized Public Disclosure Authorized Public Disclosure Authorized
Transcript of Report No. 18562-PH Philippines Social Expenditure Priorities · PDF fileReport No. 18562-PH...

Report No. 18562-PH
PhilippinesSocial Expenditure PrioritiesNovember 13, 1998
Managing Unit: Philippines Country Management UnitEast Asia and Pacific Region
Document of the World Bank
Pub
lic D
iscl
osur
e A
utho
rized
Pub
lic D
iscl
osur
e A
utho
rized
Pub
lic D
iscl
osur
e A
utho
rized
Pub
lic D
iscl
osur
e A
utho
rized

CURRENCY EQUIVALENT(as of November 10, 1998)
Currency Unit = Peso (PhP)US$1.00 = P40.49
FISCAL YEARJanuary 1 - December 31
ABBREVIATIONS & ACRONYMSCHED Commission on Higher EducationCIDSS Comprehensive and Integrated Delivery of Social ServicesCO Capital OutlayCOA Commission on AuditDBM Department of Budget and ManagementDECS Department of Education, Culture and SportsDOH Department of HealthDSWD Department of Social Welfare and DevelopmentDPWH Department of Public Works and HighwaysFAPs Foreign-Assisted ProjectsGAA General Appropriations ActGASTPE Govermment Assistance for Students and Teachers in Private EducationGDP Gross Domestic ProductGOCCs Government Owned and Controlled CorporationEDCOM Education CommitteeIRA Internal Revenue AllotmentIRRs Implementing Rules and RegulationsJICA Japan Intemational Cooperation AgencyLGC Local Government CodeLGUs Local Government UnitsMBN Minimum Basic NeedsMFIs Microfmance InstitutionsMOOE Maintenance and Other Operating ExpensesNAPC National Anti-Poverty CommissionNCA Notice of Cash AllocationNCC National Credit CouncilNEDA National Economic and Development AuthorityNGOs Non-Government OrganizationsNLSF National Livelihood Support FundO&M Operations and MaintenancePAGCOR Philippine Amusement and Gaming CorporationPAF Poverty Alleviation FundPCFC People's Credit and Financial CorporationPCFP Presidential Commission to Fight PovertyPDTF Peoples Development Trust FundPhP Philippine PesoPOs Peoples OrganizationsR.A. Republic ActSARO Special Allotment Release OrderSRA Social Reform AgendaSRC Social Reform CouncilSUCs State Universities and CollegesTA Technical AssistanceTESDA Technical Education and Skills Development Administration
Vice President Mr. Jean-Michel Severino, EAPVPCountry Director Mr. Vinay K. Bhargava, EACPFSector Manager n.a.Task Team Leader Mr. Bernard Funck, EACPF

PHILIPPINES: SOCIAL EXPENDITURE PRIORITIES
TABLE OF CONTENTS
Page No.
FOREWORD
EXECUT'IVE SUMMARY ................... i
1. O'VERVIEW .I
Revisiting the FY 1997 Government Budget .1
The FY 1998 Expenditure Program .2
Austerity Measures in the FY 1998 Expenditure Program . 2
Impact of Fiscal Austerity on Expenditure Priorities .4
Proposed Policies for 1999 .6
Overall Fiscal Stance .6
Allocation and Spending Priorities .7
Overall Assessment and Recommendations .9
2. EDUCATION .1
Execution of the 1998 Budget .14
Proposed 1999 Budget for Education .16
Primary and Secondary Education .16
Tertiary Education .18
Vocational Training .18
Recommendations .19
3. HEALTH .20
Health Expenditures Before the Financial Crisis .20
The Budget for 1998 and Its Execution in the Wake of the Financial Crisis. 24
Impact of the Crisis .24
Impact of Fiscal Austerity .25
The Proposed 1999 DOH Budget .26
Recommendations .29
Page No.
4. TARGETED SOCIAL INTERVENTIONS ................................................... 30
Department of Social Welfare and Development .................................................. 30
Mission and Activities ................................................... 30
Impact of Fiscal Austerity ................................................... 34
1999 Proposed Budget ................................................... 35
National Anti-Poverty Commission ................................................... 35
Microfinance .................................................... 36
Recommendations .................................................... 37
TABLES
1.0 Summary Fiscal Impact of Selected Recommendations ..........................................v
1.1 Unliquidated Obligations of Selected Department .................................................. 2
1.2 Shortfalls in Revenue Collections ..................................................... 2
1.3 Expenditure Program of National Government Departments, FY 1998 ..................3
1.4 Indicators of Cash Rationing, January-June 1998 ...................................................4
1.5 Sectoral Allocation of National Government Department Expenditures .................4
1.6 Allocation of National Government Department Expenditures by Object ..............5
1.7 Notice of Cash Allocation by Sector and Object .................................................... 5
1.8 Fiscal Surplus (Deficit) .................................................... 6
1.9 Major Increases in the Proposed 1999 Budget .................................................... 7
1.10 Increase in Proposed 1999 Budget on Account of Foreign-Assisted
Projects ............................................ 8
1.11 Distribution of National Government Expenditures by Sector ................................9
2.1 Education Expenditure in Selected East Asian Countries ..................................... 11
2.2 Trends in Maintenance and Other Operating Expenditures ................................... 12
2.3 Education Budget by Level of Education ........................................... 13
2.4 DECS Budget by Category of Expenditure ........................................... 14
2.5 Budget of SUCs by Category of Expenditure ........................................... 18
3.1 Evolution of Public Health Expenditures, 1980-1997 ........................................... 21
3.2 National Government Health Expenditures, 1990-1998 ........................................ 21
3.3 Distribution of National Government Health Expenditures by Budget
Components, 1996-1998 ............................................. 22
3.4 Functional Distribution of DOH Budgetary Expenditures, 1998 .......................... 22
Page No.
3.5 Distribution of DOH Budget by Object, 1996-1998 .............................................. 23
3.6 Distribution of LGU Actual Expenditures by Level and by Function,
1996-197 .................................................... 24
3.7 Selected Health Indicators, 1993-1998 .................................................... 24
3.8 Allocation of Mandatory Reserves on Public Health Programs ............................ 25
3.9 Allotment Releases, Cash Releases and Obligations ............................................. 26
3.10 National Government Health Expenditures and DOH Budget, 1998-1999 ........... 26
3.11 Funclional Distribution of DOH Budgetary Expenditures, 1998-1999 ................. 27
3.12 Appropriations for Selected Public Health Programs, 1998-1999 ......................... 28
4.1 Main Activities of DSWD .................................................... 31
4.2 DSWD 1998 and 1999 Budgets .................................................... 32
4.3 1998 LGU Allocations for Social Welfare Programs/Services ............................. 33
4.4 DSWD Special Financing .................................................... 34
ANNEXESAnnex I Report of a Mission to the Philippines on "The Socioeconomic
Impact of the Financial Crisis in the Philippines" - Foreword and SummaryAnnex 2A Textbooks Elementary -- Cost Estimates for 1999Annex 2B Textbooks Secondary -- Cost Estimates for 1999
MAP
FOREWORD
This report follows up on a Social Impact Assessment of the Crisis which the Bankcarried out in the Philippines in February 1998. One of the main recommendations emergingfrom that assessment was for the Government to "protect health, education, and other socialsectors from budget cuts relative to other sectors. Across these sectors, (to) identify and protectthe most effective programs and those that the poor use disproportionately (for example, lowerlevels of services, such as basic education, rather than higher ones; basic public health facilities,rather than urban-based hospital care). Within any sector, (to) protect key inputs such astextbooks, sonne important drugs that are used more by the poor than by others (in particularrestore funding for immunization programs to 100 percent), rural infrastructure, irrigation, andlivelihood and employment generation programs" (see summary and recommendations of thesocial impact assessment in Annex 1).
Following this initial assessment, the purpose of the present report is to take this analysisone step further, assess in more detail how social expenditure priorities are being met in thepresent context of fiscal austerity, and develop specific recommendations in this respect. Thereport summarizes the findings and recommendations of a World Bank Social ExpenditureReview, carried out from August 24 to September 4, 1998. The review focused particularly onthe budgets of the Department of Education, Culture and Sports; the Commission of HigherEducation; the Technical Education and Skills Developments Authority; the Department ofHealth; the Department of Social Welfare and Development; the National Anti-PovertyCommission; as well as other expenditures covered by the Social Reform Agenda, related specialpurpose funds (including, for instance, the Poverty Alleviation Fund), and, to some extent also,local government expenditures on similar or related items.
The World Bank team comprised Bernard Funck (mission leader), Jayshree Balachander,Malaika Stoll, Joven Balbosa, Arben Bakllamaja and Louis Charles Viossat. Ms. Araceli Triaassisted in document processing. The team wishes to express its gratitude to the departments andagencies mentioned above, as well as to the Department of Budget and Management, theNational Economic Development Authority, the Commission on Audit, the National CreditCouncil, the Philippines Institute of Development Studies, and the Congressional Planning andBudget Office for their warm cooperation.
EXECUTIVE SUMMARY
Overview
i. The execution of the 1997 and 1998 General Appropriation Acts (GAA) have been marked by agrowing discrepancy between expected and actual revenues, and therefore between authorizedexpenditures and resources to fund them. In a bid to contain the fiscal deficit, the authorities had to cut asmuch as 15 percent of the 1998 appropriation for national government departments, an amount equivalentto 38 percent of their non-personnel appropriations.
ii. Even that did not prove enough, and the authorities had to resort to cash rationing to balance thegovernment books on a day to day basis. As a result, cash allocation to spending agencies has beenrationed to levels below their spending authority, leading first to a build up of arrears to suppliers, then togrowing execution difficulties as suppliers responded to government impecuniosity by tightening theirpayment terms. In 1998 in particular, cash releases to many agencies were often barely sufficient to payfor personnel serviices, and those suppliers' bills, which for one reason or the other, have proven mostpressing. In the circumstances, a department such as the Department of Education, Culture and Sports(DECS) has so far been incapable of placing the 1997 textbook purchase orders (not to mention the 1998ones).
iii. The social sectors have been comparatively protected. In part as a reflection of governmentpolicy commitments (one of the first decisions of the new administration was to restore funding for themost essential social programs), in part as a result of the absolute priority given to wages and salaries(which account for a comparatively larger share of expenditures in the social sectors), the share of socialservices in national government expenditure is expected to rise to 44 percent in 1998 from 39 percent lastyear, and 32 percent earlier in the decade.
iv. Even if lighter than in other sectors, the fiscal difficulties have exacerbated long-standingstructural problems in the social sectors, and made it all the more urgent to address them once and for all.Some of the sorer ones are: inefficient procurement, poor deployment of teachers, severe underfunding oftextbooks and school maintenance, public health programs, and welfare institutions, creeping re-nationalization of devolved hospitals, proliferation of low quality universities and colleges. In thesesectors, lack of money is only half of the problem.
v. The proposed 1999 budget essentially reflects the continuation of the same policies, with twonotable improvements: (i) the non-indexation of wages (for the second year in a row) should create roomfor Operations and Maintenance or O&M expenditures; and (ii) the proposed budget seeks to acceleratethe implementation of foreign-assisted projects (FAPs). The creation of a Poverty Alleviation Fund(PAF-4) is also welcome, and should back up the departments (and supplement their meager resources) intheir efforts to address the needs of the poorest and most vulnerable groups. By contrast, the proposed 33percent increase in Internal Revenue Allotment (IRA) transfers to local government units or LGUs seemsperhaps overly generous in the present context, especially if it would precede the overdue review of thelocal government code.
vi. The current episode has also graphically illustrated the needfor better instruments to control theexecution of the budget. Until the government is able to better calibrate the release of allotments tomacroeconomic and revenue developments, it would not be prudent to renounce the use of reserves, asgovernment has, perhaps prematurely, announced. When all is said and done, the latter instrument iscertainly preferable to the cruder methods of cash rationing.
- ii -
Recommendations:
vii. At the overall level, the best course of actionfor the rest of the year would appear to be:
* not to seek further lifting of reserves (to a few exceptions, see below) beyond those alreadyapproved on July 10, 1998 which already cover most essential social expenditures (e.g.,public health, retained hospitals, textbooks, school desks, Comprehensive and IntegratedDelivery of Social Services or CIDSS);
* but rather, to actually implement the said decision, by notifying agencies of correspordingallotment releases; and
* most importantly, to release the notice of cash allocation (NCA) necessary to settle all duepayments on 1997 and 1998 expenditure obligations -- perhaps even through specialtargeted cash releases. To mark government commitment to social development, health,education, and social welfare expenditures might be settled as a matter of priority.
The Government is now proceeding to implement the said allotment releases and has announcedits intention to include DECS, DOH, and DSWD in its priority program of arrears settlement.
viii. To ensure that resources are indeed available for social expenditure priorities in 1999, overallpriorities should be to:
* hold the line, as planned, on salary and payroll increases;* set aside part of the proposed 33 percent increase in IRA allocation until completion of the
mandatory review of the Local Government Code (e.g., revision of the grant formula, andintroduction of mechanism to force LGUs to assume responsibilities devolved to themwhenever they fail to do on their own);
* actively use the timing of the Special Allotment Release Orders (SARO) to adjustdepartments' spending authority to expected cash availability and arrange for an earlyrelease of counterpart funds for FAPs, so foreign funds can be mobilized in a timely manner;
* do not preclude the use of reserves, but exempt again (this time, ex ante) the priorityprograms identified in the presidential decision of July 10, 1998;
* direct agencies to establish a rational and transparent payment queuing system; and,* improve budget monitoring by introducing monthly report on obligation and outlays by
agency and by program, and expedite the ongoing budget execution computerization.
ix. In the education sector, the report proposes the following combination of budget and structuralmeasures for immediate action in 1998:
* as soon as NCAs are released, place the still pending 1997 textbook purchase orders;* release NCA to the Department of Public Works and Highways or DPWH to settle payment
arrears on the 1997 school construction contracts. Whenever contractors have alreadydemobilized their teams, fund local communities to complete unfinished works; and,
* proceed with the planned procurement reform in time for the 1998 textbook purchase.
x. This initial effort should amplify in 1999, along the following lines:
* increase textbook appropriation to PhPI.35 billion;* direct DECS to first exhaust all possibilities for teacher redeployment before proceeding to
any new hiring;
- iii -
* review Government Assistance for Students and Teachers in Private Education with a viewto improving targeting and/or reallocation (GASTPE) to public secondary education;
* veto lunding for the 4 new State Universities and Colleges (SUCs) included for the firsttime, in the proposed budget, as well as the creation of any new ones;
* urge Commission on Higher Education (CHED) to undertake without delay its plannedreview of government policy on SUCs with a view towards rationalization in the sector; and,
* compel LGUs to assume financial responsibility for school buildings devolved to themunder the local government code; and encourage them to mobilize foreign funding for bothprimary and secondary classrooms in target provinces.
xi. In the health sector, immediate prioritiesfor 1998 involve:
* as soon as NCAs are released, speed up the pace of expenditure commitment, particularlyfor public health programs; and
* release "frozen" appropriations for hospital equipment. The government has now expressedthe intention to do so.
xii. On this basis, structural reforms should proceed in 1999 to:
* cancel the re-nationalization (and funding by the national budget) of 2 devolved hospitalsand upgrading of 5 others;
* reallocate the resources budgeted for them to maintain funding for vaccines andmicronutrients programs to at least the level of 1998 GAA in real terms;
* reformri drugs procurement, including by introducing international competition;* give fiscal and management autonomy to retained hospitals (pari-passu for devolved ones);
and* introduce socialized pricing in public hospitals.
xiii. With the intensification of the crisis, the programs of targeted social intervention, under theDepartment of Social Welfare and Development (DSWD) and the National Anti-Poverty Commission(NAPC) face are on the front-line to shield some of the most vulnerable groups from social hardship.Unfortunately, if NAPC is holding out the promise the next year's budget would provide for a fourthPoverty Alleviation Fund (PAF-4), DSWD can only, on present plans, expect its resources to shrinkfurther. The latter situation should be reversed.
xiv. For DSWD, the recommendation would be to:
* lift remaining reserves affecting the department in 1998, particularly those on welfareinstitutions (e.g., orphanage, rape centers), children and youth, as well as nutrition programs.The governmnent has now expressed the intention to release reserves affecting the operationof welfare institutions; and
* raise DSWD fundingfor 1999 to at least the 1998 GAA level and allocate the additionalresources to DSWD centers and for an expansion of CIDSS coverage.
xv. As to NAPC, the priorities would appear to be to:

- iv -
* actually set up the NAPC council before the end of 1998, so that the latter can adopt theinstitution's implementation and regulation as well as guidelines for the utilization ofPAF-4; and
* provide funding for NAPC initial setup as well as its operational requirements to assume themonitoring and coordination roles assigned to it by law.
xvi. This would allow the 1999 PAF- 4 to become a critical instrument to dispatch supplementalfunding on a need basis for department interventions in favor of vulnerable groups, following the highlyconsultative program/project identification process inaugurated under the Social Reform Agenda (SRA).
xvii. Implementation of the recommendations would allow the country to reap significant socialbenefits. They would allow, for instance, to:
* ensure that at least one textbook is available for every two pupil in the core subjects, ascompared to one for every eight at present;
* get the school construction program back on track;* reverse the decrease in the coverage of public health programs (targeted coverage: malaria
control, schistosomiasis: +33 percent, TB control: +59 percent);- restore the coverage of the immunization program (targeted coverage: basic (OPV/DPT)
immunization, +43 percent; Hepatitis B: + 100 percent) and the micronutrient program(targeted coverage: iron and iodine supplementation +33 percent, vitamin A: +66 percent);
- offset the impact of the currency depreciation on the cost of drugs;- keep the national hospitals functional, pending a broader reform of the sector;- put welfare institutions in a better position respond to the needs of vulnerable groups (e.g.,
orphans, handicapped people);* offer an effective buffer to a larger number of poor communities affected by the crisis by
expanding the reach of the Comprehensive and Integrated Delivery of Social Services; andmore generally; and
v provide that supplemental resources can be dispatched from the Poverty Alleviation Fund toaddress priority minimum basic needs identified through broad social consultation.
xviii. Best of all, these sizable benefits would come at a reasonable fiscal cost. As Table I indicates,the largest cost would arise from cleaning up the books, i.e., from the need first to make social sectoragencies current again on their payment obligations for past expenditure if their current programs are toget back on track. Beyond that, efficiency measures could substantially if not entirely offset the cost ofthe proposed program expansions.

Table 1.0: Summary Fiscal Impact of Selected Recommendations(in PhP million)
Backlog 1M Budget 1f99 BudgetMeasure Amount Measure Amount Measure Amount
EDUCATION Settle overdue +1,800 Implement + 808 Increase + 870payables for lifting of reserve textbookO&Ma already appropriation
approvedSettle overdue +? Fill teachers' - 500payables for vacancies partlyschool constr. through
redeploymentRelease cash +516 Release 1998 + 900 Veto funding for - 178for 1997 allotment for new SUCstextbook schoolpurchase construction
HEALTH Settle overdue 3,500 Implement + 551 Veto hospital - 1201997 payablesa lifting of reserve nationalization
already and upgradingapproved
Lift reserve on + 144 Cancel subsidies - 70hospital to LGUs forequipment Magna Carta
Restore funding + 200for public health
SOCIAL Settle overdue 325 Implement + 110 Raise funding to + 420WELFARE 1997 lifting of reserve 1998 GAA level
payablesa/ already in real termsapproved
Lift remaining + 175reserve,particularly oncenters andinstitutions
ANTI-POVERTY Provide + 10COMMISSION additional
operating budgetTOTAL +6,141 +3,214 + 622a________________ - (excl. school constr.)a Estimates as of June 30, 1998
I
1. OVERVIEW
Revisiting the ]FY 1997 Government Budget
1. The origin of current fiscal difficulties can be traced back to the execution of the 1997budget, and the abrupt change in economic environment under which it took place. Previouslybuoyant, revenues all of a sudden turned scarce. But expenditure commitments carried on for along while on their own momentum, before hitting liquidity constraints.
2. Before the start of the financial crisis in July of 1997, the Philippines was on its sixthyear of accelerating growth. The outlook then, looked very optimistic for the country. Theoptimism was evident in the preparation of the 1997 budget, where the underlyingmacroeconomic assumptions called for a GNP growth forecast of 7 percent year on year, and astable exchange rate of ground PhP26 to the US dollar, among others. President Ramos' 1997proposed budget to Congress was consistent with this highly optimistic scenario. Congress, onthe other hand, increased further the budget allocation to reflect their own priorities and projects.Confident abouit fiscal prospects, the Department of Budget and Management (DBM) releasedexpenditure allotments early in the fiscal year.
3. Sufficient cash resources did not materialize to back these ambitious expenditurecommitments. As the financial crisis unfolded in the second half of 1997, tax and duty collectionof the government began to deviate from target. As it turned out, actual revenue tax collectionsfell PhP37 billion short of target for the whole year (the overall revenue performance wouldactually have been worse, had the government not extracted early dividends from governmentcorporations). Thus, the accounts payable of government began to pile-up. Although no precisefigure is currently available, it is likely that the national government would have accumulated atleast PhP40 billion of arrears (on a net basis) during fiscal year of 1997. As a result, the officialpresentation of the fiscal outcome (on a cash basis) dissimulated the true financial situation of thenational government (measured, as it should be, on a commitment basis): rather than a smallsurplus, the national government had actually incurred a deficit of, perhaps, 1.5 percent of GrossDomestic Product (GDP).
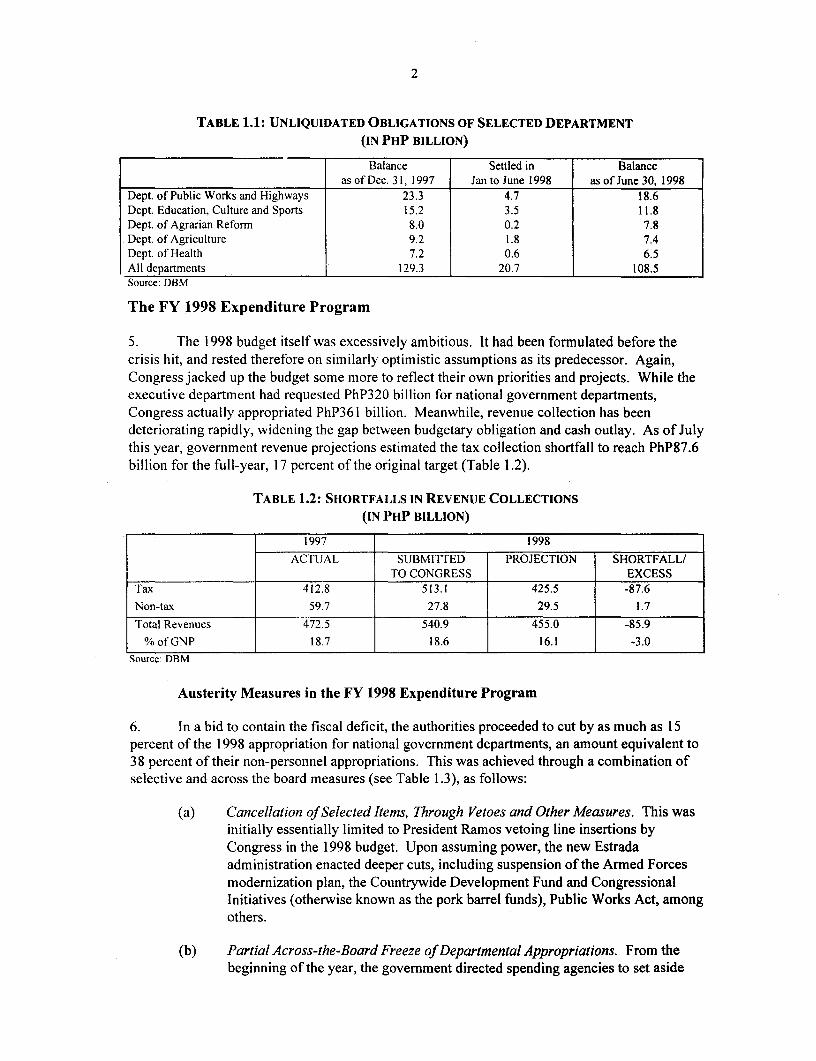
4. Such delaying tactics may have been understandable at a time when the crisis wasexpected to be of short duration. In practice, they only served to delay the moment of reckoning.The amounts unpaid in 1997 had to be settled in 1998 when cash was even tighter. Settling themtogether with other 1997 obligations becoming due and demandable, spilled over to 1998, andcrowded out the 1998 expenditure program. As of June 30, 1998, the unliquidated obligationscarried over from previous years by all departments (all of which, let it be noted, may not beimmediately payable) still amounted to PhPI08.5 billion (see Table 1.1).
2
TABLE 1.1: UNLIQUIDATED OBLIGATIONS OF SELECTED DEPARTMENT(IN PHP BILLION)
Balance Settled in Balanceas of Dec. 31, 1997 Jan to June 1998 as of June 30, 1998
Dept. of Public Works and Highways 23.3 4.7 18.6Dept. Education, Culture and Sports 15.2 3.5 11.8Dept. of Agrarian Refonn 8.0 0.2 7.8Dept. of Agriculture 9.2 1.8 7.4Dept. of Health 7.2 0.6 6.5All departments 129.3 20.7 108.5Source: DBM
The FY 1998 Expenditure Program
5. The 1998 budget itself was excessively ambitious. It had been formulated before thecrisis hit, and rested therefore on similarly optimistic assumptions as its predecessor. Again,Congress jacked up the budget some more to reflect their own priorities and projects. While theexecutive department had requested PhP320 billion for national government departments,Congress actually appropriated PhP361 billion. Meanwhile, revenue collection has beendeteriorating rapidly, widening the gap between budgetary obligation and cash outlay. As of Julythis year, government revenue projections estimated the tax collection shortfall to reach PhP87.6billion for the full-year, 17 percent of the original target (Table 1.2).
TABLE 1.2: SHORTFALLS IN REVENUE COLLECTIONS(IN PHP BILLION)
1997 1998ACTUAL SUBMITTED PROJECTION SHORTFALL/
TO CONGRESS EXCESSTax 412.8 513.1 425.5 -87.6Non-tax 59.7 27.8 29.5 1.7Total Revenues 472.5 540.9 455.0 -85.9
% of GNP 18.7 18.6 16.1 -3.0Source: DBM
Austerity Measures in the FY 1998 Expenditure Program
6. In a bid to contain the fiscal deficit, the authorities proceeded to cut by as much as 15percent of the 1998 appropriation for national government departments, an amount equivalent to3 8 percent of their non-personnel appropriations. This was achieved through a combination ofselective and across the board measures (see Table 1.3), as follows:
(a) Cancellation of Selected Items, Through Vetoes and Other Measures. This wasinitially essentially limited to President Ramos vetoing line insertions byCongress in the 1998 budget. Upon assuming power, the new Estradaadministration enacted deeper cuts, including suspension of the Armed Forcesmodernization plan, the Countrywide Development Fund and CongressionalInitiatives (otherwise known as the pork barrel funds), Public Works Act, amongothers.
(b) Partial Across-the-Board Freeze of Departmental Appropriations. From thebeginning of the year, the government directed spending agencies to set aside

3
(i.e., freeze, or "reserve") an amount equivalent to 25 percent of theirappropriations for maintenance and other operating expenditures (MOOEs) andcapital outlays (COs), leaving it to the discretion of the spending agencies whichexpenditure item could await better times (as contained in Administrative OrderNo. 372). A 10 percent reserves was also imposed on IRA transfers to localgovernment units (LGUs).
(c) Although the revenue outlook actually turned worse than anticipated at the timethese reserves were imposed, the outgoing administration proceeded to a partialLinfreezing of hospital maintenance expenditure; however, the newadministration decided on July 10, 1998 to selectively lift reserves on othercritical social programs, as a show of commitment to its pro-poor agenda. Thelatter decision concerns essentially the operation and maintenance of publichealth programs, national hospitals, and schools, the purchase of textbooks andc[esks, and the Comprehensive and Integrated Delivery of Social Services(CIDSS).
(d) This round of reserve lifting has not yet been operationalized. Concerneddepartments still need to be notified of the release of their allotments.
TABLE 1.3: EXPENDITURE PROGRAM OF NATIONAL GOVERNMENT DEPARTMENTS, FY1998
(IN PHP BILLION)
SEMESTER I SEMESTER 2MEASURES MEASURES
Conigress Impositio Suispensioni of Carry- Operating Removal of Other Meas. Other Adjustedapproved n of 25% Congressional Over Program Congressional Approved by Adjustmlents Program
(i) Reserves Insertions froin (5)=( 1 )-(2)- Insertions the Pres. (8) (9)=(S)-(6)-(2) (3) 1997 (3)+(4) (6) (7) (7)+(8)
(4)_ _:= = =___ _
All Depts 361.398 34,502 10,240 581 317,237 7,802 11,679 10,631 308,387olW:
DECS 83,826 2,412 121 0 81,293 934 0 2,492 82,851
SUCs 15,260 1,156 364 0 13,740 283 0 117 13,574
DOH 13,374 1,834 797 0 10,743 83 0 848 11,508
DSWD 1 ,858 _ 285 238 0 1 ,335 0 0 137 1 ,472Source: DBM
7. In many cases, however, these limits put on the spending authority of governmentdepartments have not constituted the most binding constraint on expenditure. The real constraintoften came from cash rationing, arising from a slow down in the release of Notice of CashAllocation (NCA), which after a while actually constrained departmental expenditure programbelow the commitment authority given to them. Since NCAs are provided as a lump sumamount, the departments have the prerogative to liquidate the NCAs according to their priorities.Given the absolute priority given to paying wages and salaries, the squeeze actually fell onoperations and maintenance (O&M) and investment expenditures.
8. Cash rationing, after causing first a build-up of arrears to suppliers, led to growingexecution difficulties as suppliers responded to government impecuniosity by tightening their
4
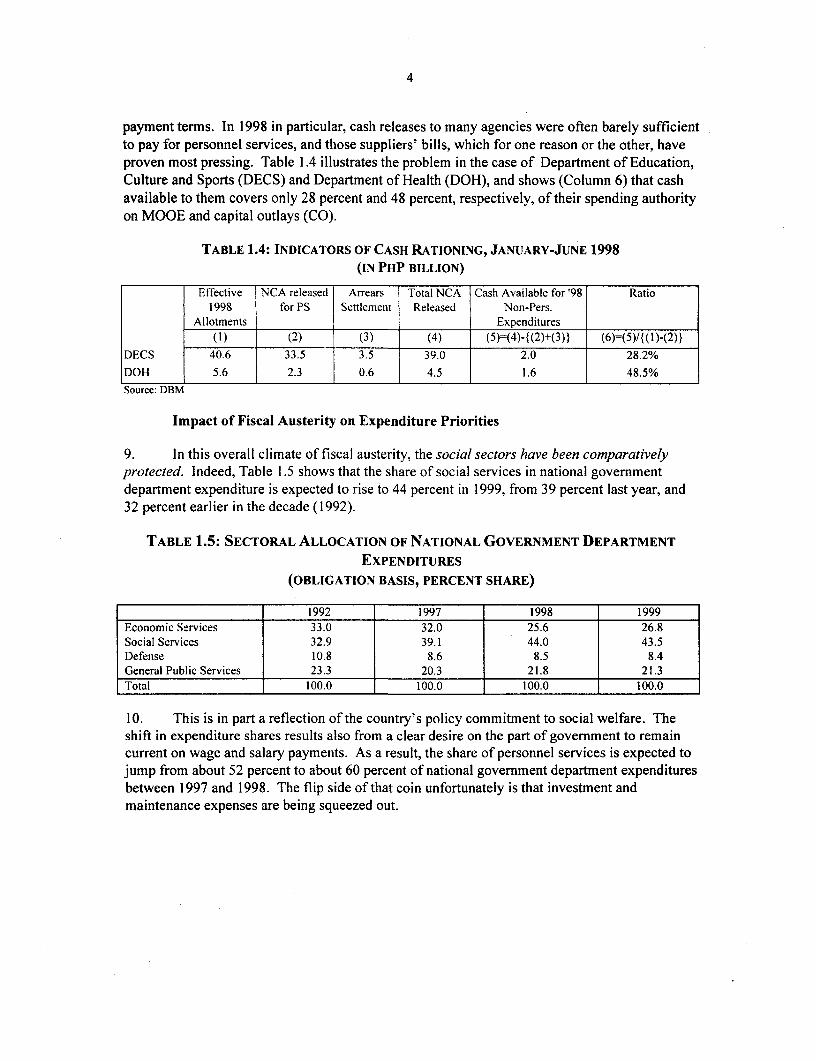
payment terms. In 1998 in particular, cash releases to many agencies were often barely sufficientto pay for personnel services, and those suppliers' bills, which for one reason or the other, haveproven most pressing. Table 1.4 illustrates the problem in the case of Department of Education,Culture and Sports (DECS) and Department of Health (DOH), and shows (Column 6) that cashavailable to them covers only 28 percent and 48 percent, respectively, of their spending authorityon MOOE and capital outlays (CO).
TABLE 1.4: INDICATORS OF CASH RATIONING, JANUARY-JUNE 1998(IN PHP BILLION)
Effective NCA released Arrears Total NCA Cash Available for'98 Ratio1998 for PS Settlement Released Non-Pers.
Allotments Expenditures(1) (2) (3) (4) (5)=(4)-{(2)+(3)} (6)=(5)/{(l)-(2)}
DECS 40.6 33.5 3.5 39.0 2.0 28.2%
DOH 5.6 2.3 0.6 4.5 1.6 48.5%
Source: DBM
Impact of Fiscal Austerity on Expenditure Priorities
9. In this overall climate of fiscal austerity, the social sectors have been comparativelyprotected. Indeed, Table 1.5 shows that the share of social services in national governmentdepartment expenditure is expected to rise to 44 percent in 1999, from 39 percent last year, and32 percent earlier in the decade (1992).
TABLE 1.5: SECTORAL ALLOCATION OF NATIONAL GOVERNMENT DEPARTMENTEXPENDITURES
(OBLIGATION BASIS, PERCENT SHARE)
1992 1997 1998 1999Economic Services 33.0 32.0 25.6 26.8Social Services 32.9 39.1 44.0 43.5Defense 10.8 8.6 8.5 8.4General Public Services 23.3 20.3 21.8 21.3Total 100.0 100.0 100.0 100.0
10. This is in part a reflection of the country's policy commitment to social welfare. Theshift in expenditure shares results also from a clear desire on the part of government to remaincurrent on wage and salary payments. As a result, the share of personnel services is expected tojump from about 52 percent to about 60 percent of national government department expendituresbetween 1997 and 1998. The flip side of that coin unfortunately is that investment andmaintenance expenses are being squeezed out.
5
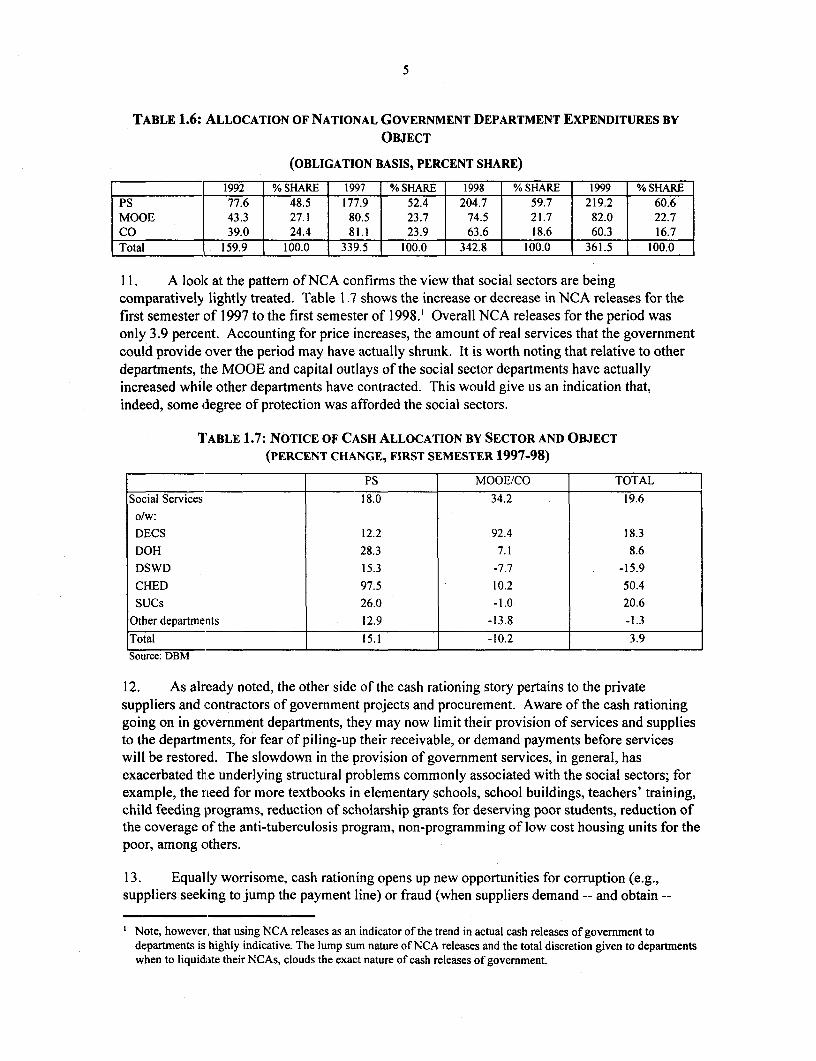
TABLE 1.6: ALLOCATION OF NATIONAL GOVERNMENT DEPARTMENT EXPENDITURES BYOBJECT
(OBLIGATION BASIS, PERCENT SHARE)
_11111 1992 % SHARE 1997 % SHARE 1998 % SHARE 1999 % SHAREPS 77.6 48.5 177.9 52.4 204.7 59.7 219.2 60.6MOOE 43.3 27.1 80.5 23.7 74.5 21.7 82.0 22.7CO 39.0 24.4 81.1 23.9 63.6 18.6 60.3 16.7Total 159.9 100.0 339.5 100.0 342.8 100.0 361.5 100.0
II. A look at the pattern of NCA confirms the view that social sectors are beingcomparatively lightly treated. Table 1.7 shows the increase or decrease in NCA releases for thefirst semester of 1997 to the first semester of 1998.' Overall NCA releases for the period wasonly 3.9 percent. Accounting for price increases, the amount of real services that the governmentcould provide over the period may have actually shrunk. It is worth noting that relative to otherdepartments, the MOOE and capital outlays of the social sector departments have actuallyincreased whil[e other departments have contracted. This would give us an indication that,indeed, some degree of protection was afforded the social sectors.
T'ABLE 1.7: NOTICE OF CASH ALLOCATION BY SECTOR AND OBJECT(PERCENT CHANGE, FIRST SEMESTER 1997-98)
PS MOOE/CO TOTALSocial Services 18.0 34.2 19.6olw:
DECS 12.2 92.4 18.3DOH 28.3 7.1 8.6DSWD 15.3 -7.7 -15.9CHED 97.5 10.2 50.4SUCs 26.0 -1.0 20.6
Other departments 12.9 -13.8 -1.3Total 15.1 -10.2 3.9Source: DBM
12. As already noted, the other side of the cash rationing story pertains to the privatesuppliers and contractors of government projects and procurement. Aware of the cash rationinggoing on in government departments, they may now limit their provision of services and suppliesto the departments, for fear of piling-up their receivable, or demand payments before serviceswill be restored. The slowdown in the provision of government services, in general, hasexacerbated thie underlying structural problems commonly associated with the social sectors; forexample, the need for more textbooks in elementary schools, school buildings, teachers' training,child feeding programs, reduction of scholarship grants for deserving poor students, reduction ofthe coverage of the anti-tuberculosis program, non-programming of low cost housing units for thepoor, among others.
13. Equally worrisome, cash rationing opens up new opportunities for corruption (e.g.,suppliers seeking to jump the payment line) or fraud (when suppliers demand -- and obtain --
Note, however, that using NCA releases as an indicator of the trend in actual cash releases of government todepartments is highly indicative. The lump sum nature of NCA releases and the total discretion given to departmentswhen to liquidate their NCAs, clouds the exact nature of cash releases of government.
6
advance payment, it is notoriously difficult to control whether services are actually rendered infull).
Proposed Policies for 1999
Overall Fiscal Stance
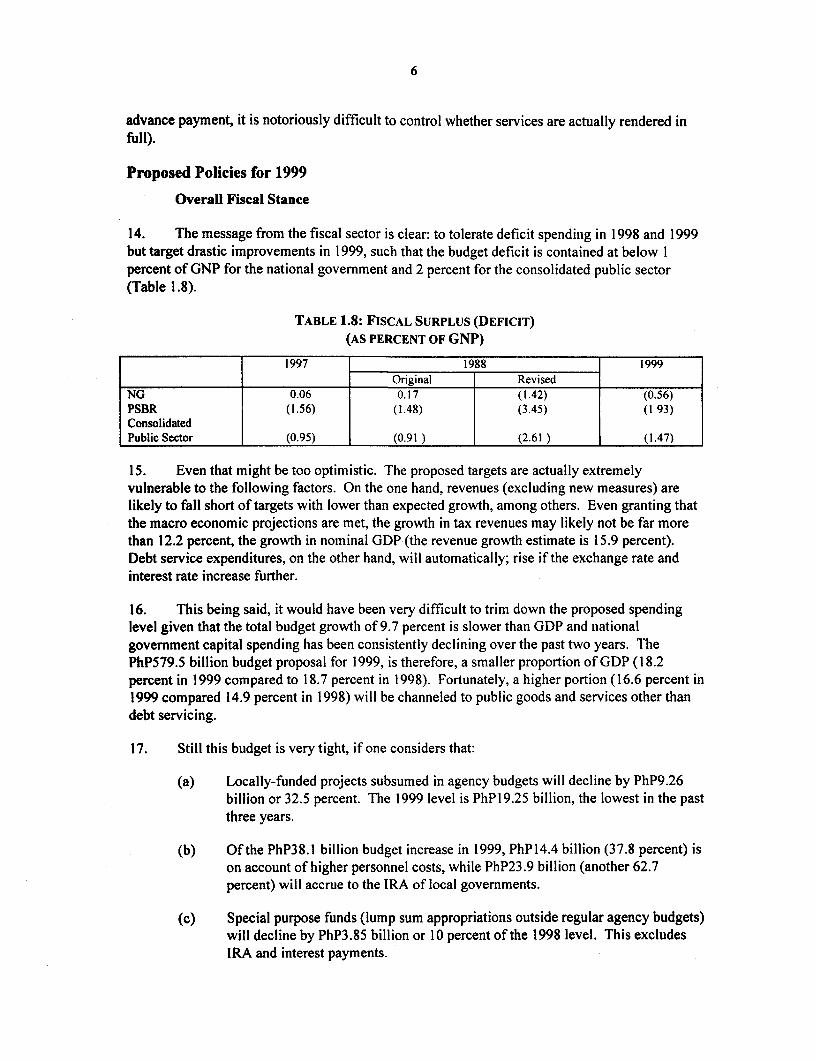
14. The message from the fiscal sector is clear: to tolerate deficit spending in 1998 and 1999but target drastic improvements in 1999, such that the budget deficit is contained at below Ipercent of GNP for the national government and 2 percent for the consolidated public sector(Table 1.8).
TABLE 1.8: FISCAL SURPLUS (DEFICIT)(AS PERCENT OF GNP)
1997 1988 1999Original Revised
NG 0.06 0.17 (1.42) (0.56)PSBR (1.56) (1.48) (3.45) (I 93)ConsolidatedPublic Sector (0.95) (0.91 ? (2.61 ) (1.47)
15. Even that might be too optimistic. The proposed targets are actually extremelyvulnerable to the following factors. On the one hand, revenues (excluding new measures) arelikely to fall short of targets with lower than expected growth, among others. Even granting thatthe macro economic projections are met, the growth in tax revenues may likely not be far morethan 12.2 percent, the growth in nominal GDP (the revenue growth estimate is 15.9 percent).Debt service expenditures, on the other hand, will automatically; rise if the exchange rate andinterest rate increase further.
16. This being said, it would have been very difficult to trim down the proposed spendinglevel given that the total budget growth of 9.7 percent is slower than GDP and nationalgovernment capital spending has been consistently declining over the past two years. ThePhP579.5 billion budget proposal for 1999, is therefore, a smaller proportion of GDP (18.2percent in 1999 compared to 18.7 percent in 1998). Fortunately, a higher portion (16.6 percent in1999 compared 14.9 percent in 1998) will be channeled to public goods and services other thandebt servicing.
17. Still this budget is very tight, if one considers that:
(a) Locally-funded projects subsumed in agency budgets will decline by PhP9.26billion or 32.5 percent. The 1999 level is PhP19.25 billion, the lowest in the pastthree years.
(b) Of the PhP38.1 billion budget increase in 1999, PhP14.4 billion (37.8 percent) ison account of higher personnel costs, while PhP23.9 billion (another 62.7percent) will accrue to the IRA of local governments.
(c) Special purpose funds (lump sum appropriations outside regular agency budgets)will decline by PhP3.85 billion or 10 percent of the 1998 level. This excludesIRA and interest payments.
7
(d) Total capital expenditures of the national government, excluding IRA transfers,will likewise decline by PhP8.7 billion or 12.9 percent. Compared to 1997, thereduction is 37.6 percent.
(e) Except for a handful, most agencies will be operating at budget levels lower thantheir 1997 or 1998 operating levels in nominal terms.
(f) The proposed 1999 budget does not provide for any overall wage adjustment inthe light of present inflation over the statutory merit increases. The salarystandardization program done in the past years may have softened the need tohike wages for next year.
18. This certainly demonstrates that further spending cutbacks can be absorbed only withgreat difficulty, in case revenue fall again short of expectations. The alternative, to be sure, is toaccommodate a higher budget deficit, or at least a part thereof. Depending on what measures aretaken, the implication could be any or a combination of the following: (i) further cuts in capitalspending, eating a large portion of capital investments that could further hurt the economy'slonger term development prospects; or (ii) negation of earlier statements to spare theappropriation from future reserves.
19. This promise of "no reserves" in 1999, while undoubtedly popular to agencies, is illadvised and irnpractical under existing circumstances. Given the nature of budget controlinstruments available to the authorities, reserves constitute one of the only mechanism availableto modulate the pace of expenditure commitments in the face of macroeconomic and fiscalfluctuations. Even in the face of further expenditure cutbacks or reserves, however, the programsof key agencies in the social services sector should be protected, consistent with the thrust of theadministration in the sector.
Allocation and Spending Priorities
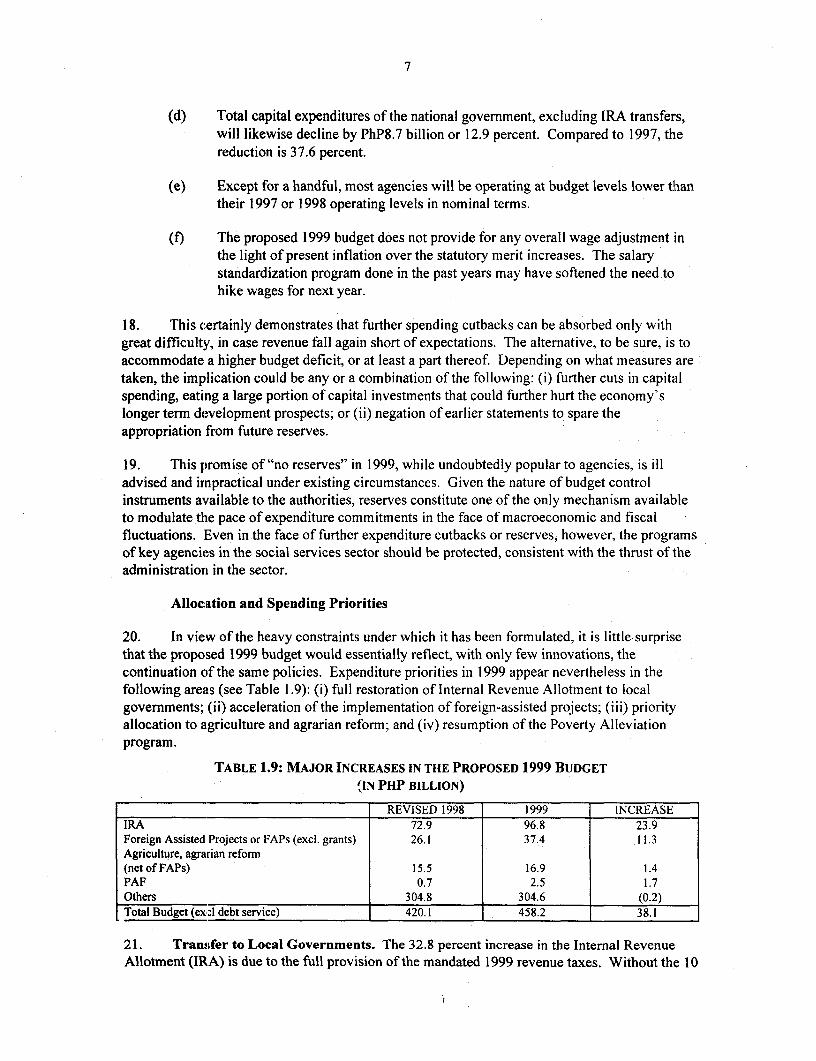
20. In view of the heavy constraints under which it has been formulated, it is little surprisethat the proposed 1999 budget would essentially reflect, with only few innovations, thecontinuation of the same policies. Expenditure priorities in 1999 appear nevertheless in thefollowing areas (see Table 1.9): (i) full restoration of Internal Revenue Allotment to localgovernments; (ii) acceleration of the implementation of foreign-assisted projects; (iii) priorityallocation to agriculture and agrarian reform; and (iv) resumption of the Poverty Alleviationprogram.
TABLE 1.9: MAJOR INCREASES IN THE PROPOSED 1999 BUDGET{IN PHP BILLION)
REVISED 1998 1999 INCREASEIRA 72.9 96.8 23.9Foreign Assisted Projects or FAPs (excl. grants) 26.1 37.4 11.3Agriculture, agrarian reform(net of FAPs) 15.5 16.9 1.4PAF 0.7 2.5 1.7Others 304.8 304.6 (0.2)Total Budget (excl debt service) 420.1 458.2 38.1
21. Transfer to Local Governments. The 32.8 percent increase in the Internal RevenueAllotment (IRA) is due to the full provision of the mandated 1999 revenue taxes. Without the 10
8
percent reserves imposed in the 1998 IRA, the growth would have been a lower 19.5 percent. Ifanything, the proposed 33 percent increase in IRA transfers to LGUs seems perhaps overlygenerous, in the present context, especially if it would precede the overdue review of the localgovernment code. It might be safer to wait for the outcome of that review, and insist that itshould result in a more sustainable and equitable transfer formula.
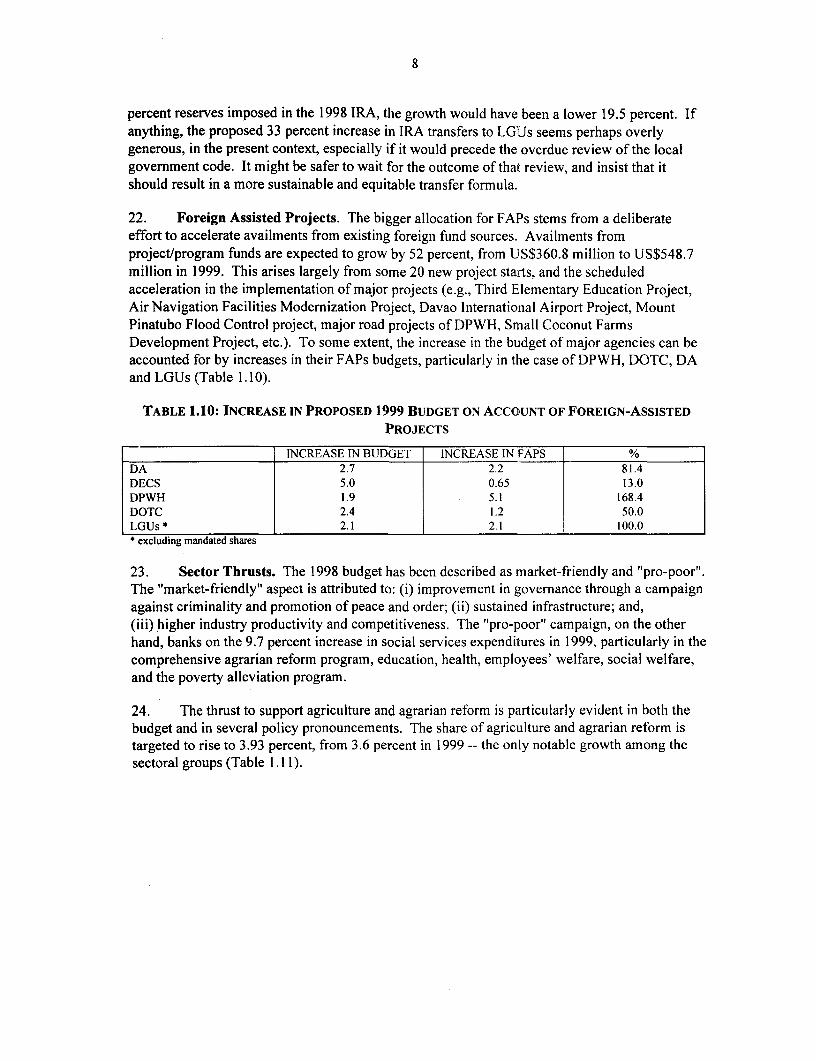
22. Foreign Assisted Projects. The bigger allocation for FAPs stems from a deliberateeffort to accelerate availments from existing foreign fund sources. Availments fromproject/program funds are expected to grow by 52 percent, from US$360.8 million to US$548.7million in 1999. This arises largely from some 20 new project starts, and the scheduledacceleration in the implementation of major projects (e.g., Third Elementary Education Project,Air Navigation Facilities Modernization Project, Davao International Airport Project, MountPinatubo Flood Control project, major road projects of DPWH, Small Coconut FarmsDevelopment Project, etc.). To some extent, the increase in the budget of major agencies can beaccounted for by increases in their FAPs budgets, particularly in the case of DPWH, DOTC, DAand LGUs (Table 1. 10).
TABLE 1.10: INCREASE IN PROPOSED 1999 BUDGET ON ACCOUNT OF FOREIGN-ASSISTEDPROJECTS
__________________ INCREASE IN BUDGET INCREASE IN FAPS _
DA 2.7 2.2 81.4DECS 5.0 0.65 13.0DPWH 1.9 5.1 168.4DOTC 2.4 1.2 50.0LGUs* 2.1 2.1 100.0* excluding mandated shares
23. Sector Thrusts. The 1998 budget has been described as market-friendly and "pro-poor".The "market-friendly" aspect is attributed to: (i) improvement in governance through a campaignagainst criminality and promotion of peace and order; (ii) sustained infrastructure; and,(iii) higher industry productivity and competitiveness. The "pro-poor" campaign, on the otherhand, banks on the 9.7 percent increase in social services expenditures in 1999, particularly in thecomprehensive agrarian reform program, education, health, employees' welfare, social welfare,and the poverty alleviation program.
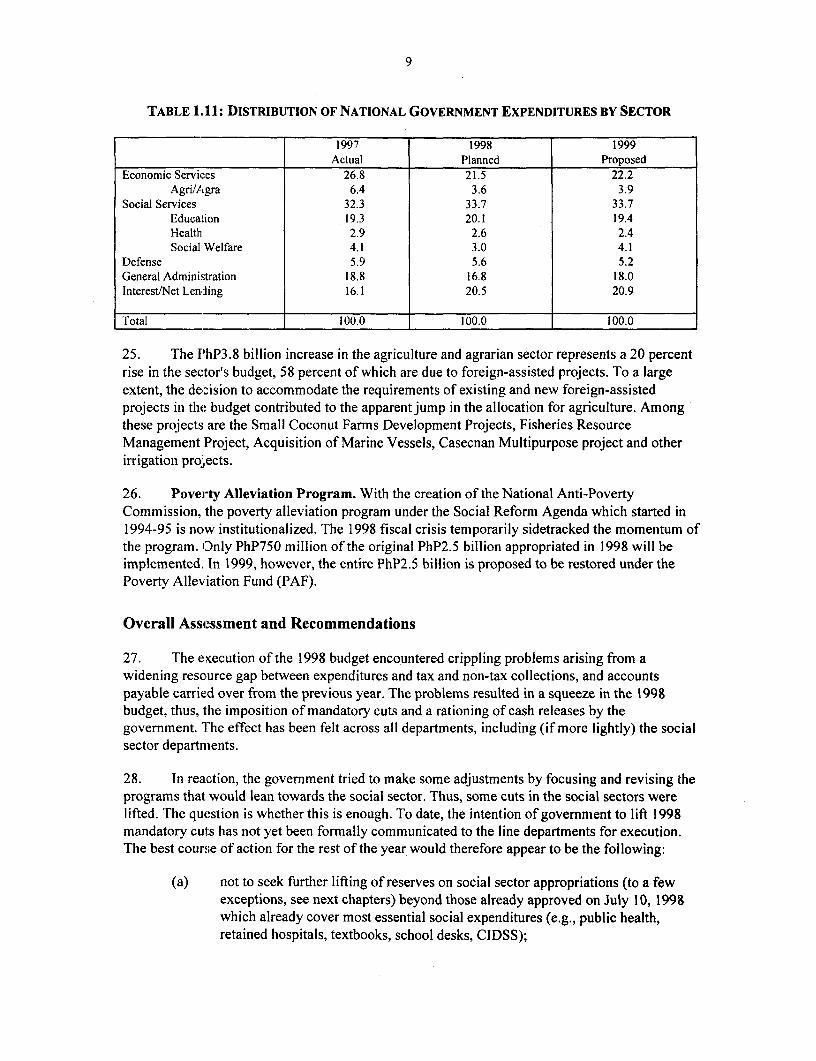
24. The thrust to support agriculture and agrarian reform is particularly evident in both thebudget and in several policy pronouncements. The share of agriculture and agrarian reform istargeted to rise to 3.93 percent, from 3.6 percent in 1999 -- the only notable growth among thesectoral groups (Table 1.1 1).
9
TABLE 1.11: DISTRIBUTION OF NATIONAL GOVERNMENT EXPENDITURES BY SECTOR
1997 1998 1999Actual Planned Proposed
Economic Services 26.8 21.5 22.2Agri/Agra 6.4 3.6 3.9
Social Services 32.3 33.7 33.7Education 19.3 20.1 19.4Health 2.9 2.6 2.4Social Welfare 4.1 3.0 4.1
Defense 5.9 5.6 5.2General Administration 18.8 16.8 18.0Interest/Net Lending 16.1 20.5 20.9
Total 100.0 100.0 100.0
25. The PhP3.8 billion increase in the agriculture and agrarian sector represents a 20 percentrise in the sector's budget, 58 percent of which are due to foreign-assisted projects. To a largeextent, the decision to accommodate the requirements of existing and new foreign-assistedprojects in the budget contributed to the apparent jump in the allocation for agriculture. Amongthese projects are the Small Coconut Farms Development Projects, Fisheries ResourceManagement Project, Acquisition of Marine Vessels, Casecnan Multipurpose project and otherirrigation projects.
26. Poverty Alleviation Program. With the creation of the National Anti-PovertyCommission, the poverty alleviation program under the Social Reform Agenda which started in1994-95 is now institutionalized. The 1998 fiscal crisis temporarily sidetracked the momentum ofthe program. ODnly PhP750 million of the original PhP2.5 billion appropriated in 1998 will beimplemented. In 1999, however, the entire PhP2.5 billion is proposed to be restored under thePoverty Alleviation Fund (PAF).
Overall Assessment and Recommendations
27. The execution of the 1998 budget encountered crippling problems arising from awidening resource gap between expenditures and tax and non-tax collections, and accountspayable carried over from the previous year. The problems resulted in a squeeze in the 1998budget, thus, the imposition of mandatory cuts and a rationing of cash releases by thegovernment. The effect has been felt across all departments, including (if more lightly) the socialsector departments.
28. In reaction, the government tried to make some adjustments by focusing and revising theprograms that would lean towards the social sector. Thus, some cuts in the social sectors werelifted. The question is whether this is enough. To date, the intention of government to lift 1998mandatory cuts has not yet been formally communicated to the line departments for execution.The best course of action for the rest of the year would therefore appear to be the following:
(a) not to seek further lifting of reserves on social sector appropriations (to a fewexceptions, see next chapters) beyond those already approved on July 10, 1998which already cover most essential social expenditures (e.g., public health,retained hospitals, textbooks, school desks, CIDSS);

10
(b) to actually implement the said decision by notifying agencies of correspondingallotment releases; and
(c) most importantly, to release the NCA necessary to settle all due payments on1997 and 1998 expenditure obligations -- perhaps even through special targetedcash releases. To mark government commitment to social development, health,education, and social welfare expenditures might be settled as a matter ofpriority.
The Government is now proceeding to implement the said allotment releases and hasannounced its intention to include DECS, DOH, and DSWD in its priority program ofarrears settlement.
29. For 1999, there is a strong intention in government to protect social expenditures overotl.er program expenditures. Hopefully, good intentions will be supported by concrete action, inthe form of increased availability of cash outlays and improvement in enforcement efficiencies.To ensure that resource is indeed available for social expenditure priorities in 1999, overallpriorities should be the following:
(a) hold the line, as planned, on salary and payroll increases;
(b) set aside part of the proposed 33 percent increase in IRA allocation untilcompletion of the mandatory review of the Local Government Code (e.g.,revision of the grant formula, and introduction of mechanism to force LGUs toassume responsibilities devolved to them whenever they fail to do on their own);
(c) actively use the timing of the Special Allotment Release Orders (SARO) toadjust departments' spending authority to expected cash availability and arrangefor an early release of counterpart funds for FAPs, so foreign funds can bemobilized in a timely manner;
(d) do not preclude the use of reserves, but exempt again (this time, ex-ante) thepriority programs identified in the presidential decision of July 10, 1998;
(e) direct agencies to establish a rational and transparent payment queuing system;
(f) improve budget monitoring by introducing monthly report on obligationand outlays by agency and by program, and expedite the ongoing budgetexecution computerization.

11
2. EDUCATION
1. More than overall funding, the main issues facing education in the Philippines hastraditionally concerned quality and equity in the use of available resources. These include theintra-sectoral allocation of resources, regional distribution, and the composition and efficiency ofgovernment expenditures. The current fiscal difficulties are now compounding these long-standing problems. They have resulted in only partial provision of key educational inputs(textbooks, school buildings, desks and teacher training) budgeted in 1997, and little or noprovision to date of inputs planned for 1998. If the financial constraints continue in 1999, thebacklog would extend to three years. This cannot but have serious consequences for the qualityof service and educational outcomes.
2. Overview of Public Financing of Education. Constitutionally, education is guaranteedthe highest priority in the inter-sectoral allocation of the Government budget. And indeed, thenational budget for education takes up the lion's share (about 28 percent in 1998) of that of allnational government departments, and absorbs about 60 percent of resources allocated to socialservices. However, once the burden of debt service and IRA is taken into account, the share ofthe national budget going to education ranges between 13-14 percent (1997-1999), and as low as2.7 percent as a percentage of Gross Domestic Product (GDP). This suggests that education in thePhilippines is underfunded relative to other countries in the region (see Table 2.1).
TABLE 2.1: EDUCATION EXPENDITURE IN SELECTED EAST ASIAN COUNTRIES(IN PERCENT)
SELECTED %of %ofEAST ASIAN COUNTRIES GOVERNMENT EXPENDITURE GDP
Philippines 13.0 2.7Indonesia 9.8 1.6Malaysia 22.1 5.4Thailand 21.4 4.2Source: IMF
3. At the, same time, the expansion of the public education system and a number ofcongressional initiatives have increased the total financing needs of the sector. These needs havebeen met in two ways detrimental to quality and equity in education financing: (a) a gradualerosion in the per capita funds available for non-personnel expenditures or Maintenance andOther Operating Expenses. (Table 2.2); and, (b) increased cost-sharing by households for publiceducation, particularly at the primary level. Households now meet 30 percent of total cost ofpublic education at the elementary level and 42 percent of the costs of public secondaryeducation.

12
TABLE 2.2: TRENDS IN MAINTENANCE AND OTHER OPERATING EXPENDITURES (MOOE)(PER STUDENT, AT CONSTANT PRICES OF 1993)
YEAR BASIC TERTIARY1990 510 N.A.
1991 491 5,4371992 378 4,1511993 363 4,8371994 184 3,7661995 212 3,387
Source: Philippines: Education Financing and Social Equity, World Bank, 1996
4. Although budgetary allocations to basic education have increased, most of the increasehas been absorbed by a rapid increase in personnel costs. Between 1985 and 1995, teachers'compensation increased four-fold, bringing the share of Personnel Services (PS) in the DECSbudget up from 80 percent in 1990 to 88 percent in 1998. In the process, budget allocations forMOOE have shrunk to 8 percent of the budget and are at levels incompatible with the delivery ofquality education. Accumulated problems include (a) dilapidation of school buildings; (b) severeshortage of teaching materials, particularly textbooks; (c) shortage of school desks; and (d)serious backlog in teacher training.
5. In addition to national authorities, local governments have traditionally played a role inthe financing of public education in the Philippines. Although this role declined afternationalization of village high-schools in 1988, it resumed officially again after 1991 with theenactment of the Local Government Code (LGC). According to the LGC 1991, the centralgovernment should devolve to Local Government Units or LGUs, school building constructionand maintenance Although rising (from 6 percent of DECS' budget in 1992 to 9.6 percent in1997), the LGU contribution to total financing of education is still far from commensurate withthe responsibilities assigned to the local levels, particularly as concerns school buildingmaintenance. This situation has forced national authorities to maintain funding flows for itemsbeyond their own responsibilities.
6. Equity. There are significant differences in the regional distribution of available publicresources and consequently, in educational outcomes. For example, while the National CapitalRegion has around 10 percent of the country's enrollment in all public educational institutions, itreceived 34 percent of the education budget in 1997. The poorest regions have the highestproportion of inexperienced teachers, schools without principal and school districts withoutsupervisor. Correspondingly, completion rates are near universal in the most affluent areas, butless than 30 percent in the poorest provinces, e.g., ARMM in Mindanao. These differences arelikely to be exacerbated as education financing is de facto being devolved to local governments inthe face of resource constraints, as richer LGUs are more likely to be able to support publicschools. At present, there is no coherent strategy for actively targeting resources to the mostdisadvantaged areas. The only significant efforts in this area come from large donor fundedprojects (e.g., Non-Formal Education Project, Third Elementary Education Project, or SecondaryEducation Improvement Project) targeted at the poorest provinces.
7. Efficiency. Similarly, while intra-sectoral allocation favors basic education, (see Table2.3) and in particular, elementary education (which accounts for the largest share of publicspending), this share has declined sharply in recent years (from 81.4 percent in 1987 to 59percent in 1997). Tertiary education has been the main beneficiary of that shift. This is mainly asa result of the rapid conversion, at the initiative of Congress, of higher education institutions
13
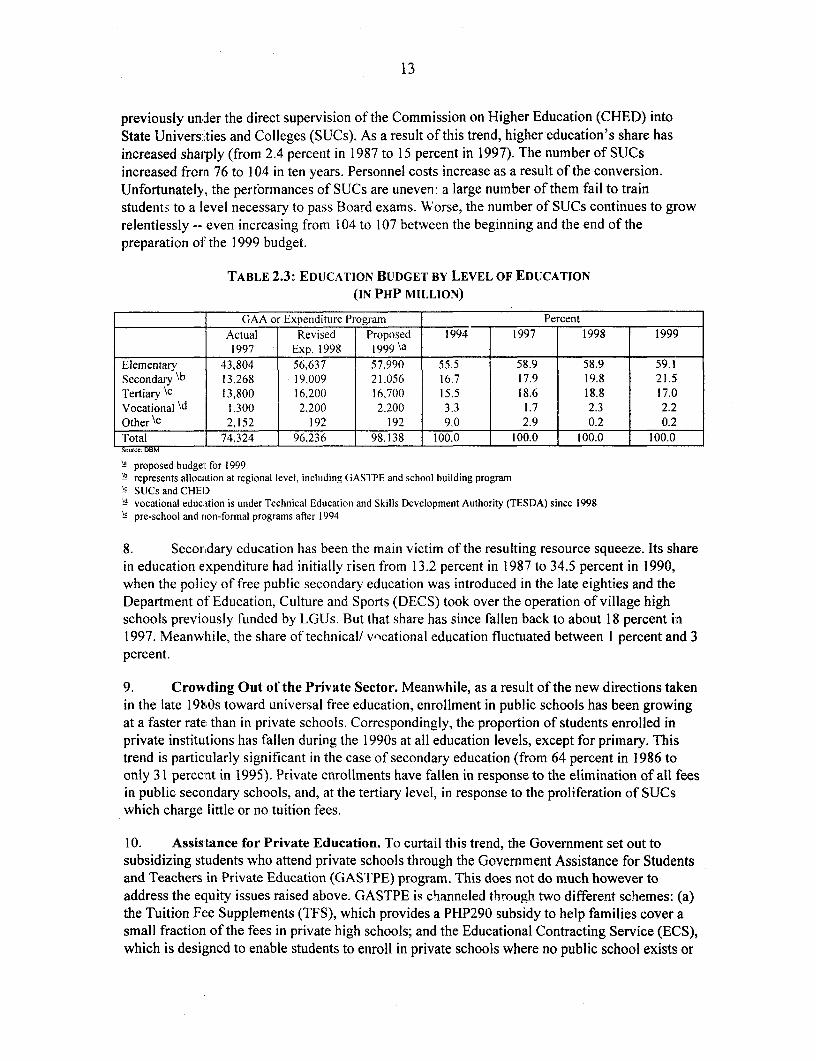
previously under the direct supervision of the Commission on Higher Education (CHED) intoState Universities and Colleges (SUCs). As a result of this trend, higher education's share hasincreased sharply (from 2.4 percent in 1987 to 15 percent in 1997). The number of SUCsincreased frorm 76 to 104 in ten years. Personnel costs increase as a result of the conversion.Unfortunately, the performances of SUCs are uneven: a large number of them fail to trainstudents to a level necessary to pass Board exams. Worse, the number of SUCs continues to growrelentlessly -- even increasing from 104 to 107 between the beginning and the end of thepreparation of the 1999 budget.
TABLE 2.3: EDUCATION BUDGET BY LEVEL OF EDUCATION(IN PHP MILLION)
GAA or Expenditure Program PercentActual Revised Proposed 1994 1997 1998 19991997 Exp. 1998 1999\a l
Elementary 43,804 56,637 57,990 55.5 58.9 58.9 59.1Secondary \b 13,268 19.009 21,056 16.7 17.9 19.8 21.5Tertiary \C 13,800 16,200 16,700 15.5 18.6 18.8 17.0Vocational \d 1.300 2,200 2.200 3.3 1.7 2.3 2.2Other\e 2,152 192 192 9.0 2.9 0.2 0.2Total 74,324 96,236 98,138 100.0 100.0 100.0 100.0So.rcc: DBM
b proposed budget for 1999\b represents allocation at regional level, including GAS1'PE and school building program\c SUCs and CHED\d vocational education is under Technical Education and Skills Development Authority (TESDA) since 1998\C pre-school and non-formal programs after 1994
8. Secondary education has been the main victim of the resulting resource squeeze. Its sharein education expenditure had initially risen from 13.2 percent in 1987 to 34.5 percent in 1990,when the policy of free public secondary education was introduced in the late eighties and theDepartment of Education, Culture and Sports (DECS) took over the operation of village highschools previously funded by LGUs. But that share has since fallen back to about 18 percent in1997. Meanwhile, the share of technical/ vocational education fluctuated between I percent and 3percent.
9. Crowding Out of the Private Sector. Meanwhile, as a result of the new directions takenin the late 19bOs toward universal free education, enrollment in public schools has been growingat a faster rate than in private schools. Correspondingly, the proportion of students enrolled inprivate institutions has fallen during the 1990s at all education levels, except for primary. Thistrend is particularly significant in the case of secondary education (from 64 percent in 1986 toonly 31 percent in 1995). Private enrollments have fallen in response to the elimination of all feesin public secondary schools, and, at the tertiary level, in response to the proliferation of SUCswhich charge little or no tuition fees.
10. Assistance for Private Education. To curtail this trend, the Government set out tosubsidizing students who attend private schools through the Government Assistance for Studentsand Teachers in Private Education (GASTPE) program. This does not do much however toaddress the equity issues raised above. GASTPE is channeled through two different schemes: (a)the Tuition Fee Supplements (TFS), which provides a PHP290 subsidy to help families cover asmall fraction of the fees in private high schools; and the Educational Contracting Service (ECS),which is designed to enable students to enroll in private schools where no public school exists or
14
where there is excess enrollment in the public school.
11. An evaluation by DECS of the two programs has shown them to be of little help for poorfamilies. The annual subsidy granted under ESC is PhPI,700, or only about 68 percent of the feeceiling of private secondary schools participating in the program. Poor students are thereforeunlikely to benefit much from the program. Similarly, the TFS covers only 5 percent of costs.This is too low to lure additional students from poor families to private schools. Worse, there is abacklog in the release of funds payable under ESC since 1996. Meanwhile the Congress hasexpanded GASTPE to include the provision of subsidy for teachers' salaries and a textbookallowance. A detailed review of the GASTPE program to better target children from poorfamilies or to reallocate GASTPE to provide funding to public secondary education needs to beconducted.
12. Budget Management. Weaknesses in budget execution exacerbate the structuralproblems just discussed. A particular concern is the extent to which budget appropriations areeventually used for the intended purpose. For example, the Commission on Audit (COA) reportpoints out that, in 1997, no portion of the budget for teaching materials was spent on textbooks,despite a severe shortage of textbooks in schools. In another example, funds available in 1998 forabout 7,000 new teachers were reallocated towards payment of a centennial bonus for DECSemployees, equivalent to the total budget for textbooks for 1996, 1997 and 1998.
13. Furthermore, monitoring of budget releases expenditures to the regional offices (morethan 90 percent of the budget) is weak, as is monitoring of education expenditures by otherdepartments, e.g., implementation of the school building program by the Department of PublicWorks and Highways (DPWH). Finally, there is an apparent lack of prioritization of expendituresagainst available cash releases. For instance, politically sensitive Congressional Initiativesreceived priority in the allocation of cash releases in the first half of 1998, over such importantitems, as textbooks.
Execution of the 1998 Budget
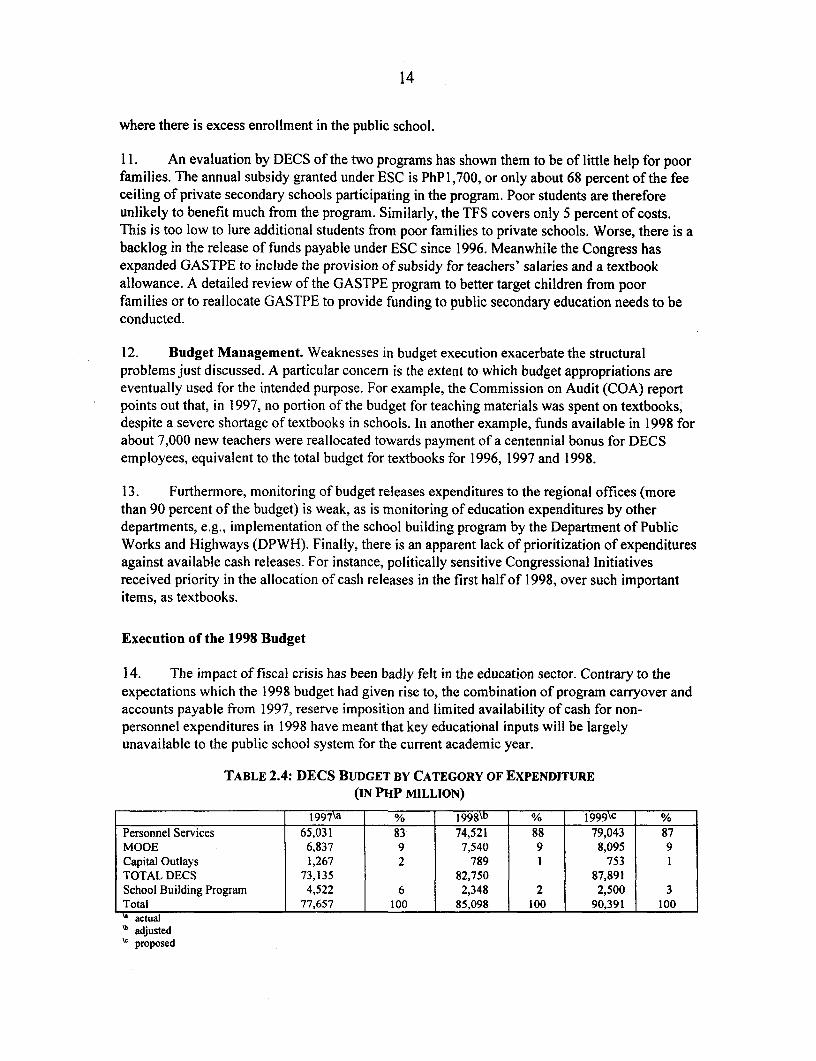
14. The impact of fiscal crisis has been badly felt in the education sector. Contrary to theexpectations which the 1998 budget had given rise to, the combination of program carryover andaccounts payable from 1997, reserve imposition and limited availability of cash for non-personnel expenditures in 1998 have meant that key educational inputs will be largelyunavailable to the public school system for the current academic year.
TABLE 2.4: DECS BUDGET BY CATEGORY OF EXPENDITURE(IN PHP MILLION)
1997\a _ _ 1998\b _ 1999\c %Personnel Services 65,031 83 74,521 88 79,043 87MOOE 6,837 9 7,540 9 8,095 9Capital Outlays 1,267 2 789 1 753TOTAL DECS 73,135 82,750 87,891School Building Programn 4,522 6 2,348 2 2,500 3Total 77,657 100 85,098 100 90,391 100
actuala adjusted
proposed
15
15. The budget appropriated for DECS in 1998 was PhP82.8 billion, or 13 percent higherthan the 1997 budget in nominal terms. By category of expenditure, the increase in the 1998budget went mainly for personnel services which increased by 14.7 percent. MODE rose by amodest 7.3 percent, while capital outlay (including the DECS School Building Program) is 50percent lower than in 1997 (Table 2.4).
16. However even the modest increase in MOOE did not materialize as a result of the 25percent reserve declared by the Government on non-personiel expenditure approved for 1998, inthe aftermath of the financial crisis. In July, the reserve was ordered (by the President) to be liftedfor a number of social sector expenditure items including for elementary and secondaryeducation. However, the Department of Budget and Management (DBM) has not so far issued thecorresponding operating rules and regulations to the departments, rendering the releaseineffectual in practice as far as this school year is concerned. Even if such authority were to begranted immecliately, the earliest delivery of items such as desks and textbooks, for instance, cannow be made only in 1999. Since the reserve applies only to noni-personnel expenditures, theshare of the DElCS budget for financing important educational inputs will effectively furtherreduce from an already small share of 9 percent in 1998 to 7 percent in 1999.
17. The real constraint, however, has come not from the limits on allotments, but from therationiing of cash releases. The amount of cash available to DECS for non-personnelexpenditures, and after meeting pressing obligations for accounts payable, has been a mere PhP2billion, or 28 percent of the allotments for 1998 MOOE and Capital Outlays. This does notinclude an additional bill for obligations as yet unpaid of about PhP 15.2 billion.
18. These financial constraints have had serious repercussions for three key educationalinputs: the schiool building program, textbooks, and school desks.
(a) School Building Program. The whole school construction program is currentlyjammed. To start with, as a result of inadequate cash releases in 1997, largeaccount payables remain outstanding, and a number of works are incomplete.This has had a ripple effect in 1998. Although a Special Allotment Release Order(SARO) was issued in April 1998 for PhPI.4 billion covering Batch I of the 1998School Building Program, little work has taken place. Another million under theBatch ll program has only now been released. Up to September, however, onlyabout 60 percent of the 1998-Batch I allotment had been obligated and actualsigning of contracts was on hold as contractors are awaiting adequate cashpayments. But DPWH has not allocated any cash for the program, in the absenceof supporting Notice of Cash Allocations (NCAs). It now looks like the wholeprogram will slip into 1999.
(b) Textbooks. Even before fiscal austerity, a crisis had been developing in thetextbook situation in the Philippines as a result of the delays and difficulties inimplementing the privatization program mandated by Congress. One of the mostserious problems being faced was that the price of privately produced textbooksis often more than double the estimated costs of the former governmentpublished texts, not including distribution and management overheads.
To make things worse, as a result of the financial crisis, DECS has so far beenunable to execLte the textbook program for 1997, not to mention 1998. The funds
16
appropriated in 1997 for textbooks amount to PhP516 million, but DECS did notallot any cash from its NCA releases for the item in 1997, nor so far in 1998.Conversely, publishers are reluctant to fulfill orders, given the limitedavailability of cash. If unobligated, the allocation will lapse at the end of 1998.For 1998, a tender is only expected to be launched in October 1998. On thatschedule, the 1998 books will not be delivered to schools before the next schoolyear, at best.
(c) School Desks. The allocation for the school desks for 1998 is around PhP285million, but procurement has similarly been delayed. At this stage, even if cashwas available quickly, the new school desks would not be available to schools forthe academic year 1997-98, given the time frame required for procurement,production and delivery of the desks to schools (at least six months).
Proposed 1999 Budget for Education
Primary and Secondary Education
19. The proposed DECS budget allocation for 1999 offers only limited hopes forimprovement. It is 8 percent higher than the expenditure program of 1998 in nominal terms, butthe increase in the budget is largely due to higher personnel costs (PhP4.7 billion or 81 percent ofthe increase). The net additional provision for non personnel costs is a marginal PhPI billion. Thebudget reflects some efforts in favor of secondary education for which a nominal increase of 11percent (as compared to 4 percent for primary education). With this budget, DECS hopes to: (a)improve student-textbooks ratio on average from 8:1 to possibly 4: 1; (b) construct new classroom(about 29,000); (c) hire about new 7,000 teachers; and (d) provide in-service training to about100,000 teachers. These targets will be impossible to achieve within the proposed budget for1999.
20. Given the financial constraints it faces, it would be necessary for DECS to prioritize itsobjectives more carefully, and seek first to improve efficiency in the use of available resources,wherever possible. Some of the top most priorities in this respect would be as follows:
(a) Optimizing Teacher Deployment. According to DECS, the growth in the costs ofpersonnel services will slow down during the next three years as there will be nosalary increases. This is a positive trend. Of the additional cost of PhP4 billionbudgeted for personnel services, PhPI billion would go towards filling newpositions (about 7,000 new teachers) vacant since 1996. Before proceeding torecruit, however, there is considerable scope for improving the currentdeployment of teachers. The latter is both inefficient and inequitable. Theregional distribution of teaching staff, the numbers of teaching versus non-teaching staff, and the diversion of teaching staff for clerical and other duties areall sources of inefficiency. Barriers exist to the redeployment of teachers whichmust be addressed. This could entail additional costs as incentives are needed forteachers to move, but it could generate cost-savings in the long run.
(b) Prioritizing Operating Expenses. The reduction in the rate of growth ofpersonnel services should increase the availability of funds for MOOE. This inturn could have a real positive impact on the quality of education. Another way

17
to get more out of the limited MOOE resources is to prioritize expenditures. Fouritems identified as key educational inputs include textbooks, school desks,teacher training and school repairs. A breakdown of the MOOE budget for 1999by components shows that these four items together account for only about P2.5billion or 30 percent of MOOE. On the other hand, the payment of retirement ofgratuity of P2.3 billion is almost equal to the allocation for the four priorityinputs. Grants, Subsidies and Contributions is another item in the MOOE for: (i)scholarship programs for pupils to go to private education (primary) under theeducation service contracting (about PhP450 million); (ii) support to NationalSocial Action to implement programs in education (about PhP350 million); and(iii) other programs/projects (PhPI70 million). The relevance of some of theseitems in the MOOE is arguable, and their share is very high compared to the fourcore items that contribute directly to quality.
(c) Improving TextbookAvailability. DECS' target is to reach the textbook-pupilratio 1:1 against the current average ratio of 8:1. At a ratio of one textbook perchild, DECS/(IMB) has estimated its total requirement of textbooks for 1999 atabout 120 million textbooks or about PhP7.2 billion (at an average cost of PhP60per book), for all subjects. A realistic approach might be to first target the fourcore subjects of Filipino, English, Math and Science for elementary school andincluding Social Studies at the secondary level, using a ratio of one book forevery two students, the requirement for textbooks in 1999 is estimated to beabout PhP I billion for elementary education and PhP350 million for secondaryeducation. (See Annex 2A & 2B).
(d) Protecting Priority Programs and Most Disadvantaged Areas and Groups. In theevent reserves would again be imposed in 1999, programs of DECS targeted atpoor or vulnerable groups -- such as (i) the Third Elementary Education Project;(ii) the Secondary Education Improvement Project; (iii) the Non-formalEducation Project; (iv) Easy and Affordable Secondary Education; (v) Drop-outIntervention Program; and (vi) Multigrade Program -- should be exempt.
(e) Better Targeting the School Building Program. Gaps undoubtedly exist in theavailability of schools: the number of barangays without schools currently standsat 4,231. But DECS' strategy of having one elementary school in every barangayand one high school in every municipality may be both unaffordable andinefficient, if one takes into consideration that a number of barangays ormunicipalities that do not have the requisite number of pupils.. DECS intends toundertake a school location planning exercise to determine which areas actuallyrequire new schools and to explore altemative means of construction includingbuild-operate-transfer arrangements. Given the limited availability of funds forthe school building program, the following measures should also be pursued:
(i) enforcing the existing legislative mandate charging LGUs with theimplementation of the school construction program (LGU cost ofconstruction per classroom is around PhP180,000, while DPWH cost isaround PhP305,000);
(ii) giving priority to the construction of unfinished schools;

18
(iii) speeding up the mobilization of donor funding for school construction;and
(iv) examining the possibility of subsidizing or capitalizing financing aschool bus program for barangays remote from existing schools, as analternative to adding new schools.
Tertiary Education
21. The proposed budget for SUCs and CHED may be signaling the beginning of an overdueeffort on the part of the government to hold spending in tertiary education. Table 2.5 indicates asharp slow down in the rate of increase to about 3 percent from 1998, compared to 17 percentfrom 1997 to 1998. However, four new state colleges have been approved in 1999 at a cost ofPhPI77.6 million. The full financial implication of the conversions is usually felt only in thesucceeding years as institutions begin to revise staff pay scales. There is agreement amongCHED, Education Commission (EDCOM), National Economic and Development Authority(NEDA), and DBM that the policy of rapidly expanding the number of colleges and universitieshas been detrimental to the quality of higher education. A strategy for the rationalization of SUCsis urgently required and will be formulated under an upcoming study jointly funded by the WorldBank and the Asian Development Bank. Meanwhile, the creation of new SUCs should be vetoedand cost-recovery measures must be pursued urgently to limit the current high subsidies tostudents at the tertiary level.
TABLE 2.5: BUDGET OF SUCS BY CATEGORY OF EXPENDITURE(IN PHP MILLION)
I ___________ 1997\a jIWPersonnel 8,981 75 10,251 76 10,988 77ServicesMOOE 2,040 17 2,048 15 2,462 17Capital 937 8 1,274 9 890 6Outlays I l
Total 11,958 100 13,573 100 14,340 100\ actual
\b adjusted"proposed
Vocational Training
22. One of the problems that the Technical Education and Skills DevelopmentAdministration (TESDA) is facing is the transfer of a large number of vocational schools fromDECS, most of which offer regular secondary education programs. Against that, TESDA hasreceived a modest budget of about PhP2 billion for last three years. There is no increase proposedeither in the 1999 budget of TESDA. In this situation, TESDA would need to pursue alternativesto running vocational schools, such as sourcing out some training activities to the private sectorand other government agencies including local governments. Rationalization of responsibilitiesbetween SUCs, DECS and TESDA would also need to be pursued.
19
Recommendations
23. The present fiscal difficulties have brought forward the moment of truth for education.Given prevailing resources const.aints, the sector can not any longer postpone the day whenstructural weaknesses must be addressed. As discussed above, some of the key priorities in thisrespect for the next two years are as follows.
24. For immediate action in 1998, this report recommends the following measures:
(a) as soon as NCAs are released, place the still pending 1997 textbook purchaseorders (before their allotment lapses at the end of the year);
(b) release NCA to DPWH to pay DECS 1997 school construction contracts.Whenever contractors have already demobilized their teams, fund localcommunities to complete unfinished works; and
(c) proceed with the planned procurement reform in time for the 1998 textbookpurchase.
25. For the 1999 budget, this report recommends the following:
(a) increase textbook appropriation to PhPI .35 billion;
(b) reallocate MOOE to priority inputs;
(c) review GASTPE;
(d) compel LGUs to assume responsibility for the supposedly devolved SchoolBuilding Program;
(e) rationalize teacher deployment, teaching and non-teaching staff and reviewreassignment of teachers in non-teaching positions;
(f) veto four new SUCs and institute cost-recovery measures in existing SUCs; andundertake the planned rationalization of SUCs; and
(g) improve financial management and particularly the monitoring of the budget,including prioritization of expenditures in DECS.
20
3. HEALTH
1. The execution of the 1998 budget has severe consequences for the budget of theDepartment of Health (DOH). It is increasing the structural lack of resources of public healthprograms and hospital facilities and exacerbating the structural weaknesses of the DOH budget,in particular a bias towards personal health c. re. The 1999 budget is a budget of austerity, incontinuity with the execution of the 1998 budget. If approved as is, similar consequences can beexpected. Besides, some discretionary choices of DOH have made the situation worse forimportant public health programs.
Health Expenditures Before the Financial Crisis
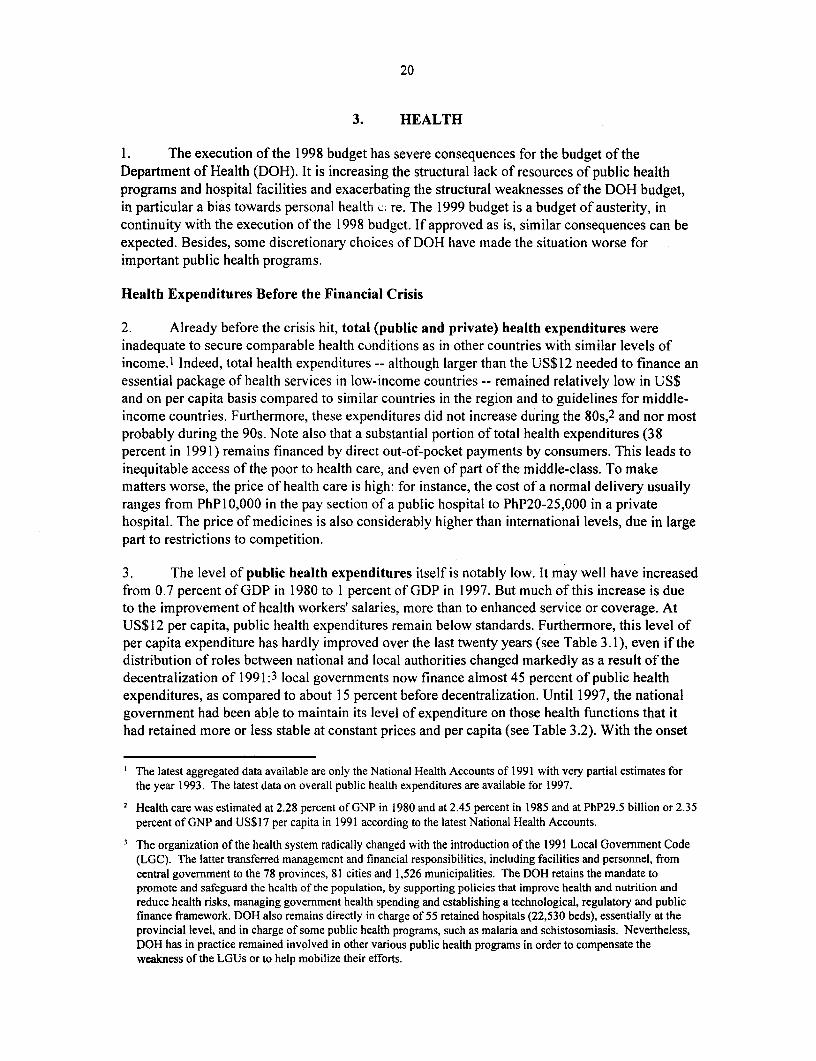
2. Already before the crisis hit, total (public and private) health expenditures wereinadequate to secure comparable health conditions as in other countries with similar levels ofincome.I Indeed, total health expenditures -- although larger than the US$12 needed to finance anessential package of health services in low-income countries -- remained relatively low in US$and on per capita basis compared to similar countries in the region and to guidelines for middle-income countries. Furthermore, these expenditures did not increase during the 80s,2 and nor mostprobably during the 90s. Note also that a substantial portion of total health expenditures (38percent in 1991) remains financed by direct out-of-pocket payments by consumers. This leads toinequitable access of the poor to health care, and even of part of the middle-class. To makematters worse, the price of health care is high: for instance, the cost of a normal delivery usuallyranges from PhP 10,000 in the pay section of a public hospital to PhP20-25,000 in a privatehospital. The price of medicines is also considerably higher than international levels, due in largepart to restrictions to competition.
3. The level of public health expenditures itself is notably low. It may well have increasedfrom 0.7 percent of GDP in 1980 to I percent of GDP in 1997. But much of this increase is dueto the improvement of health workers' salaries, more than to enhanced service or coverage. AtUS$12 per capita, public health expenditures remain below standards. Furthermore, this level ofper capita expenditure has hardly improved over the last twenty years (see Table 3. 1), even if thedistribution of roles between national and local authorities changed markedly as a result of thedecentralization of 1991:3 local governments now finance almost 45 percent of public healthexpenditures, as compared to about 15 percent before decentralization. Until 1997, the nationalgovernment had been able to maintain its level of expenditure on those health functions that ithad retained more or less stable at constant prices and per capita (see Table 3.2). With the onset
The latest aggregated data available are only the National Health Accounts of 1991 with very partial estimates forthe year 1993. The latest data on overall public health expenditures are available for 1997.
2 Health care was estimated at 2.28 percent of GNP in 1980 and at 2.45 percent in 1985 and at PhP29.5 billion or 2.35percent of GNP and US$17 per capita in 1991 according to the latest National Health Accounts.
The organization of the health system radically changed with the introduction of the 1991 Local Government Code(LGC). The latter transferred management and financial responsibilities, including facilities and personnel, fromcentral government to the 78 provinces, 81 cities and 1,526 municipalities. The DOH retains the mandate topromote and safeguard the health of the population, by supporting policies that improve health and nutrition andreduce health risks, managing government health spending and establishing a technological, regulatory and publicfinance framework. DOH also remains directly in charge of 55 retained hospitals (22,530 beds), essentially at theprovincial level, and in charge of some public health programs, such as malaria and schistosomiasis. Nevertheless,DOH has in practice remained involved in other various public health programs in order to compensate theweakness of the LGUs or to help mobilize their efforts.
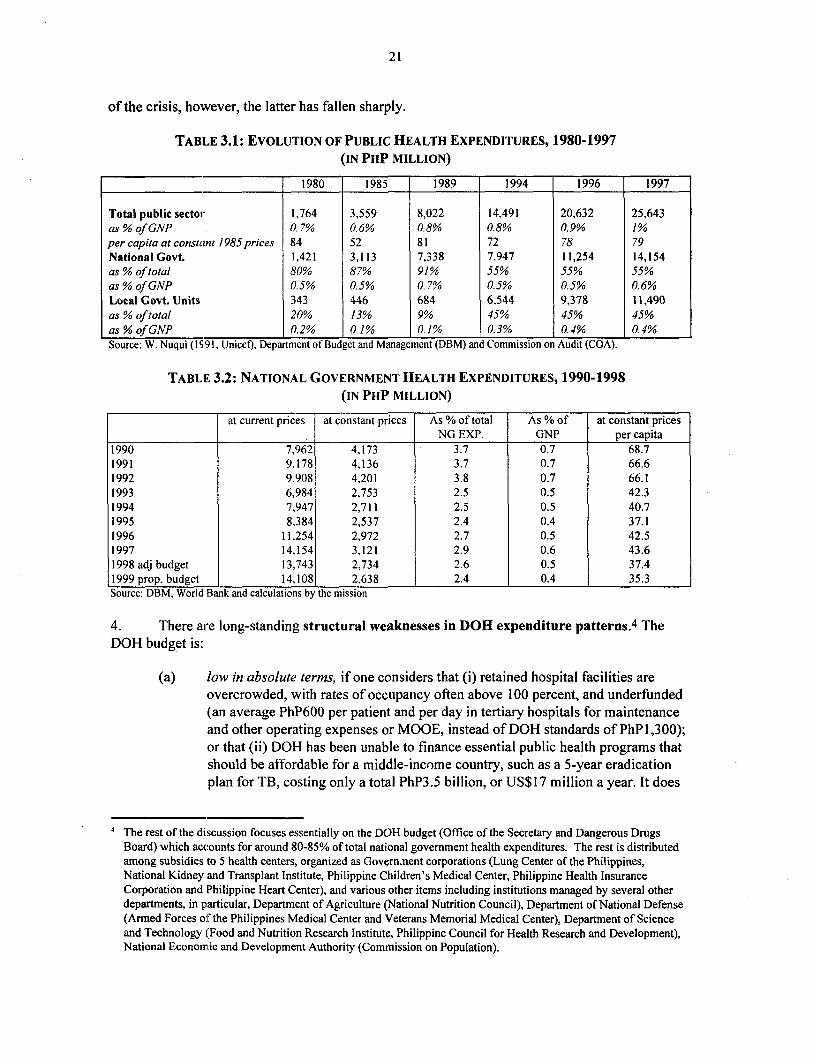
21
of the crisis, however, the latter has fallen sharply.
TABLE 3.1: EVOLUTION OF PUBLIC HEALTH EXPENDITURES, 1980-1997(IN PHP MILLION)
1980 1985 1989 1994 1996 1997
Total public sector 1,764 3,559 8,022 14,491 20,632 25,643as % of GNP 0.7% 0.6% 0.8% 0.8% 0.9% 1%per capita at constant 1985 prices 84 52 81 72 78 79National Govt. 1,421 3,113 7,338 7,947 11,254 14,154as % of total 80% 87% 91% 55% 55% 55%as % ofGNP 0.5% 0.5% 0.7% 0.5% 0.5% 0.6%Local Govt. Units 343 446 684 6,544 9,378 11,490as % of total 20% 13% 9% 45% 45% 45%as% of GNP 0.2% 0.1% 0.1% 0.3% 0.4% 0.4%Source: W. Nuqui (I 991, Unicef), Department of Budget and Management (DBM) and Commission on Audit (COA).
TABLE 3.2: NATIONAL GOVERNMENT HEALTH EXPENDITURES, 1990-1998(IN PHP MILLION)
at current prices at constant prices As % of total As % of at constant pricesNG EXP. GNP per capita
1990 7,962 4,173 3.7 0.7 68.71991 9,178 4,136 3.7 0.7 66.61992 9,908 4,201 3.8 0.7 66.11993 6,984 2,753 2.5 0.5 42.31994 7,947 2,711 2.5 0.5 40.71995 8,384 2,537 2.4 0.4 37.11996 11,254 2,972 2.7 0.5 42.51997 14,154 3,121 2.9 0.6 43.61998 adj budget 13,743 2,734 2.6 0.5 37.41999 prop. budget 14,108 2,638 2.4 0.4 35.3Source: DBM, World Bank and calculations by the mission
4. There aire long-standing structural weaknesses in DOH expenditure patterns. 4 TheDOH budget is:
(a) low in absolute terms, if one considers that (i) retained hospital facilities areovercrowded, with rates of occupancy often above 100 percent, and underfunded(an average PhP600 per patient and per day in tertiary hospitals for maintenanceand other operating expenses or MOOE, instead of DOH standards of PhP 1,300);or that (ii) DOH has been unable to finance essential public health programs thatshould be affordable for a middle-income country, such as a 5-year eradicationplan for TB, costing only a total PhP3.5 billion, or US$17 million a year. It does
The rest of the discussion focuses essentially on the DOH budget (Office of the Secretary and Dangerous DrugsBoard) which accounts for around 80-85% of total national government health expenditures. The rest is distributedamong subsidies to 5 health centers, organized as Govern.nent corporations (Lung Center of the Philippines,National Kidney and Transplant Institute, Philippine Children's Medical Center, Philippine Health InsuranceCorporation and Philippine Heart Center), and various other items including institutions managed by several otherdepartments, in particular, Department of Agriculture (National Nutrition Council), Department of National Defense(Armed Forces of the Philippines Medical Center and Veterans Memorial Medical Center), Department of Scienceand Technology (Food and Nutrition Research Institute, Philippine Council for Health Research and Development),National Economic and Development Authority (Commission on Population).

22
not help that DOH appear unable to utilize much more than its present allocation,as its high rate of unobligated allotments (22 percent in 1996 and 10.6 percent in1997 for MOOE) seems to indicate. The problem of "absorption" at DOH hasseveral causes: (i) the relatively large amount of centrally managed items in itsbudget; (iii the inherent difficulty of implementing centralized programs throughindependent local governments units; as well as (iii) difficulties and delays in theprocurement process. In 1998, a lack of cash exacerbated the situation (seebelow).
TABLE 3.3: DISTRIBUTION OF NATIONAL GOVERNMENT HEALTH EXPENDITURES
BY BUDGET COMPONENTS, 1996-1998(IN PHP MILLION)
| 1996 ACTUAL 1997 ACTUAL 1998 GAA
DOH budget 9,357 12,121 13,060Subsidies to GOCCs 637 667 764Other items 1.260 1,365 2,072inc. hospitals 810 1,028 1,272Total 11,254 14,153 15,896DOH/Total 83% 86% 82%DOH/NG expenditures 2% 2.1% 2.2%
Source: GAA 1998
(b) biased towards personal health care, especially hospital. Even though it is wellestablished that preventive care interventions should have the first claim onpublic resources, because of the substantial externalities they involve for society,as much as 50 percent of the DOH budget in 1998 General Appropriations Act(GAA) is spent in "health facility maintenance and operations" (Table 3.4) andonly 12.2 percent in "public health services, "primary health care programs" and"regional funds to assist primary health care." Specialty hospitals (GovernmentOwned and Controlled Corporations or GOCCs) and Army and Veteranshospitals included, the share of hospitals amounts to 51.4 percent of overallnational government health expenditures.5
TABLE 3.4: FUNCTIONAL DISTRIBUTION OF DOH BUDGETARY EXPENDITURES, 1998 (GAA)
PhP million _
General administration and support to operations 1,757 13.6%Hospitals (health facility maintenance and operations) 6,469 50.0%Public health 1,587 12.2%Other operations 624 4.8%Locally funded and foreign assisted projects 2,506 19.3%Total 12,943 100%Source: GAA 1998
(c) underinvesting, compared to the estimated value of the infrastructure assets ofthe ministry, which include high value items such as large hospital facilities(Table 3.5). Less than 20 percent of the DOH budget is allocated to capital
There is no uniquely correct way of allocating the various budget items to summary categories and other studies,notably by Dr. Orville Solon, indicate a much higher share for hospitals in the total DOH budget.

23
outlays (CO), including supply of medical equipment and investment ininfrastructure. Preventing deterioration of infrastructure and medical equipmentshould be a major concern for the future quality of health care provided by publichospitals.
TABLE 3.5: DISTRIBUTION OF DOH BUDGET BY OBJECT, 1996-1998(IN PHP MILLION)
1996 ACTUAL 1997 ACTUAL 1998 GAA
Personal Services 3,459 4,488 4,968As % of total 37% 37% 38.3%MOOE 3,837 5,372 5,436As % of total 41% 44.3% 42%Capita' outlays 2,061 2,261 2,539As % of total 22% 18.7% 7 19.6%
Total 9,357 12,121 12,943Source: GAA 1999 and GAA 1998
(d) inefficient in its inter-regional allocation of resources. The provinciald,istribution appears to be both inefficient and detrimental to the poorest part ofthe population.
5. It is unclear whether the situation of LGUs health expenditures is any better. Accordingto a study covering 1993 and 1994,6 "LGUs have underspent on health and social welfare relativeto levels prevailing before devolution." It is difficult to confirm this judgment for the years 1995to 1998. According to the latest Commission on Audit data, local government health expenditurehad risen to 0.45 percent of the GNP by 1997.7 Of this, only slightly over a third was devoted tothe devolved hoslpitals and as much as 60 percent was going to public health services (see Table3.6).8 This may, lhowever, also reflect the fact that (i) according to a recent study, MOOEallocations of devolved hospitals were severely cut, by 50 percent after devolution; or that (ii)LGUs have registered some success in pressing for a renationalization of devolved hospitals.
6. Given the above, it is hardly surprising that, if the health status of the population hasimproved since thie 1970s (see Table 3.7), it remains unsatisfactory compared to other middle-income countries in the region. In particular, there are large provincial differences in healthstatus, a continuing threat of morbidity from infectious and communicable diseases and aresurgence of some unattended diseases, notably tuberculosis (195,867 cases reported in 1997and 183,586 in 1993).9 Besides, uncontrolled urbanization and industrialization and relatedenvironmental and occupational health hazards add a significant load of non-communicablediseases.
6 1997 Philippine Huiman Development Report, Social and Human Priorities and Budget Allocation Patterns:Yardsticks for Governance.
In 1996, provinces accounted for slightly less than half of LGUs health expenditures (46 percent), municipalities foraround the third (30 percent) and cities for about the quarter (24 percent).
8 Provinces financed 75 percent of hospitals expenditures and municipalities 50 percent of health services.
A serious outbreak of Dengue Fever (more than 300 cases), with a series of deaths, was reported by the DOH duringthe period of the mission. In the Conception district hospital (province of Tarlac) visited by the mission, 10 out of50 inpatients were suffering from Dengue Fever.
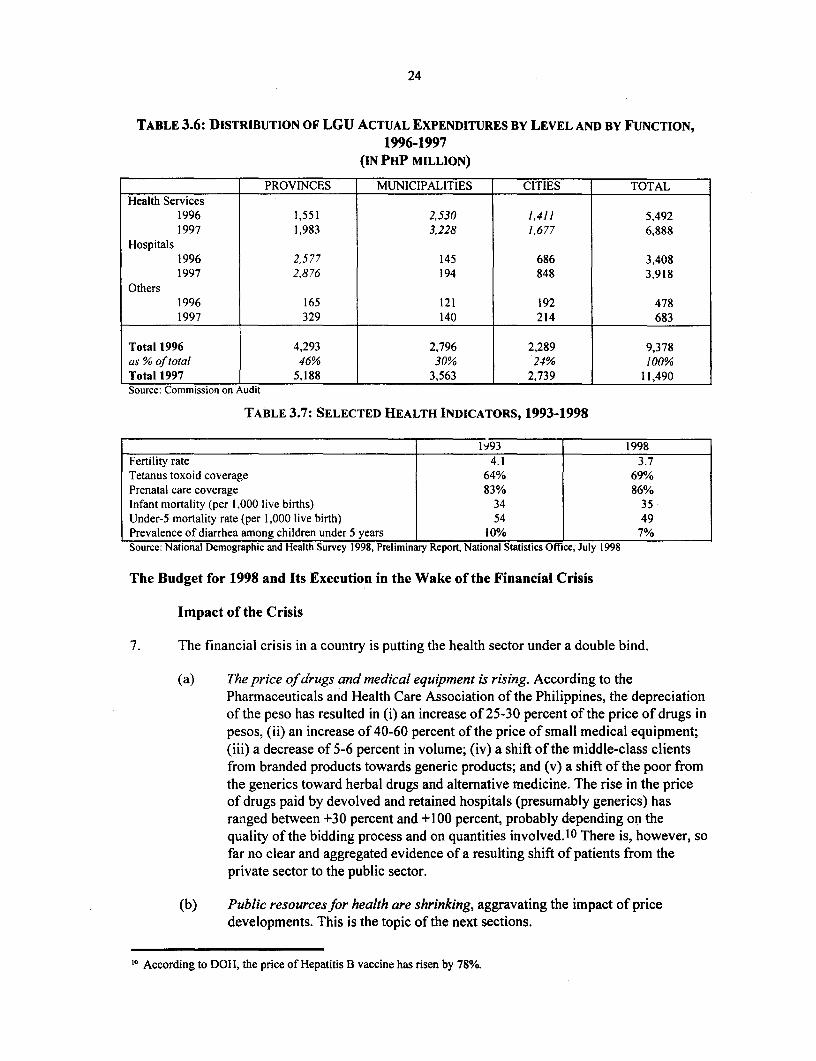
24
TABLE 3.6: DISTRIBUTION OF LGU ACTUAL EXPENDITURES BY LEVEL AND BY FUNCTION,1996-1997
(IN PHP MILLION)
PROVINCES MUNICIPALITIES CITIES TOTALHealth Services
1996 1,551 2,530 1,411 5,4921997 1,983 3,228 1,677 6,888
Hospitals1996 2,577 145 686 3,4081997 2,876 194 848 3,918
Others1996 165 121 192 4781997 329 140 214 683
Total 1996 4,293 2,796 2,289 9,378as % of total 46% 30% 24% 100%Total 1997 5,188 3,563 2,739 11,490Source: Commission on Audit
TABLE 3.7: SELECTED HEALTH INDICATORS, 1993-1998
1993 1998Fertility rate 4.1 3.7Tetanus toxoid coverage 64% 69%Prenatal care coverage 83% 86%Infant mortality (per 1,000 live births) 34 35Under-5 mortality rate (per 1,000 live birth) 54 49Prevalence of diarrhea among children under 5 years 10% 7%Source: National Demographic and Health Survey 1998, Preliminary Report, National Statistics Office, July 1998
The Budget for 1998 and Its Execution in the Wake of the Financial Crisis
Impact of the Crisis
7. The financial crisis in a country is putting the health sector under a double bind.
(a) The price of drugs and medical equipment is rising. According to thePharmaceuticals and Health Care Association of the Philippines, the depreciationof the peso has resulted in (i) an increase of 25-30 percent of the price of drugs inpesos, (ii) an increase of 40-60 percent of the price of small medical equipment;(iii) a decrease of 5-6 percent in volume; (iv) a shift of the middle-class clientsfrom branded products towards generic products; and (v) a shift of the poor fromthe generics toward herbal drugs and altemative medicine. The rise in the priceof drugs paid by devolved and retained hospitals (presumably generics) hasranged between +30 percent and +100 percent, probably depending on thequality of the bidding process and on quantities involved.10 There is, however, sofar no clear and aggregated evidence of a resulting shift of patients from theprivate sector to the public sector.
(b) Public resources for health are shrinking, aggravating the impact of pricedevelopments. This is the topic of the next sections.
'° According to DOH, the price of Hepatitis B vaccine has risen by 78%.

25
Impact cf Fiscal Austerity
8. As for the rest of the government, the 1997 budget of DOH had been generous, becauseconstructed in a period of high growth of the economy. Allotments had also been released early.Faced with the onset of fiscal difficulties, however, the government began to curb expendituresduring the fourth quarter of 1997, by dramatically cutting the amount of cash released to DOH.As allotments had been already released in January 1997 for the whole year and had alreadytranslated in a steady stream of expenditure obligations, the decision of the government led to alarge build up of accounts payable. The 1998 GAA budget was also based on similarly optimisticassumptions as thie 1997 budget. It included an increase of 12 percent in current pesos and 3percent in real pesos in resources compared to actual 1997 expenditures. Reality proved different.
9. The impact of the reserves imposed in the first semester of 1998 was felt particularlyacutely at DOH. As a consequence of them, DOH, like other departments, has been left in a stateof great uncertainty since the beginning of the year and unable to efficiently manage and financethe various programs. Besides, they have increased the bias of the budget of DOH towardspersonnel services as this category of expenditures has been exempted from reserves. But beyondthat, and confronted with the pressing demands of curative care, it had little option but to requirethe various public health programs to scale down their service targets, sometimes dramaticallyand with serious consequences for public health outcomes. For instance, the malaria controlprogram modified its target for case findings from 162,000 smears to 117,000 smears, theschistosomiasis control program revised its target from 400,000 patients to 296,000 patients andthe TB control program assumed that around 90,000 patients could not be treated. Indeed, Table3.8 indicates that some very important public health programs, in particular EPI and TBprograms, were imposed disproportionately high level of reserves.
TABLE 3.8: ALLOCATION OF MANDATORY RESERVES ON PUBLIC HEALTH PROGRAMS
PUBLIC HEALTH PROGRAMS APPARENT RATE OF RESERVESSchistosomniasis 45 percentTuberculosis 38 percentEPI 31 percent
10. The situation quickly proved untenable, and the mandatory reserves imposed on MOOEhad to be gradually lifted: (a) to 12.5 percent in May 1998 for retained hospital facilities andservices; and, (b) on the basis of a presidential decision issued on July 10, to 0 percent forhospital facilities and services, by PhP337.8 million on public health services, and by PhP23.9million for Non-Communicable Disease Control Program. In practice, however, the liftingdecided in July has not yet been notified to the DBM regional offices and to DOH and,consequently, is not implemented. Moreover, capital outlays are apparently, to a certain extent,always affected by high mandatory reserves (50 percent) as well as some other specific classes ofexpenditures (for instance, traveling and training).
11. In fact, the lack of cash availability remains, as it was at the end of 1997, the majorconstraint for DOH in 1998. Close to half of total allotments have generally been covered by cashreleases but with an apparent priority to regional offices which finance hospital facilities (seeTable 3.9). After deducting the settlement of unliquidated obligations carried over from 1997(PhP646 million, or 9 percent of total unliquidated obligations as of the end of 1997), the ratio isonly 38 percent. Given the importance of personnel services, actual cash releases were only
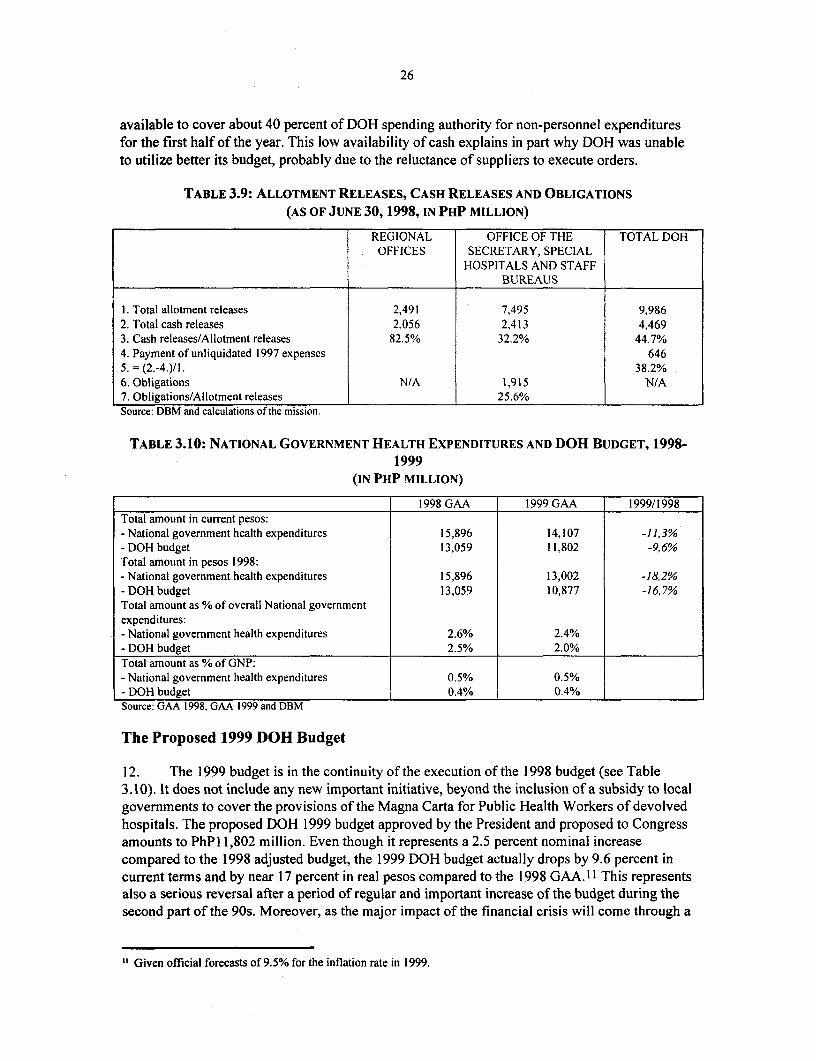
26
available to cover about 40 percent of DOH spending authority for non-personnel expendituresfor the first half of the year. This low availability of cash explains in part why DOH was unableto utilize better its budget, probably due to the reluctance of suppliers to execute orders.
TABLE 3.9: ALLOTMENT RELEASES, CASH RELEASES AND OBLIGATIONS(AS OF JUNE 30, 1998, IN PHP MILLION)
REGIONAL OFFICE OF THE TOTAL DOHOFFICES SECRETARY, SPECIAL
HOSPITALS AND STAFFBUREAUS
1. Total allotment releases 2,491 7,495 9,9862. Total cash releases 2,056 2,413 4,4693. Cash releases/Allotment releases 82.5% 32.2% 44.7%4. Payment of unliquidated 1997 expenses 6465. = (2.-4.)/1. 38.2%6. Obligations N/A 1,915 N/A7. Obligations/Allotment releases 25.6%Source: DBM and calculations of the mission.
TABLE 3.10: NATIONAL GOVERNMENT HEALTH EXPENDITURES AND DOH BUDGET, 1998-1999
(IN PHP MILLION)
1998 GAA 1999 GAA 1999/1998Total amount in current pesos:- National government health expenditures 15,896 14,107 -11,3%- DOH budget 13,059 11,802 -9,6%Total amount in pesos 1998:- National government health expenditures 15,896 13,002 -18,2%- DOH budget 13,059 10,877 -16,7%Total amount as % of overall National governmentexpenditures:- National government health expenditures 2.6% 2.4%- DOH budget 2.5% 2.0%Total arnount as % of GNP:- National government health expenditures 0.5% 0.5%- DOH budget 0.4% 0.4%Source: GAA 1998. GAA 1999 and DBM
The Proposed 1999 DOH Budget
12. The 1999 budget is in the continuity of the execution of the 1998 budget (see Table3.10). It does not include any new important initiative, beyond the inclusion of a subsidy to localgovernments to cover the provisions of the Magna Carta for Public Health Workers of devolvedhospitals. The proposed DOH 1999 budget approved by the President and proposed to Congressamounts to PhP1 1,802 million. Even though it represents a 2.5 percent nominal increasecompared to the 1998 adjusted budget, the 1999 DOH budget actually drops by 9.6 percent incurrent terms and by near 17 percent in real pesos compared to the 1998 GAA. I I This representsalso a serious reversal after a period of regular and important increase of the budget during thesecond part of the 90s. Moreover, as the major impact of the financial crisis will come through a
" Given official forecasts of 9.5% for the inflation rate in 1999.
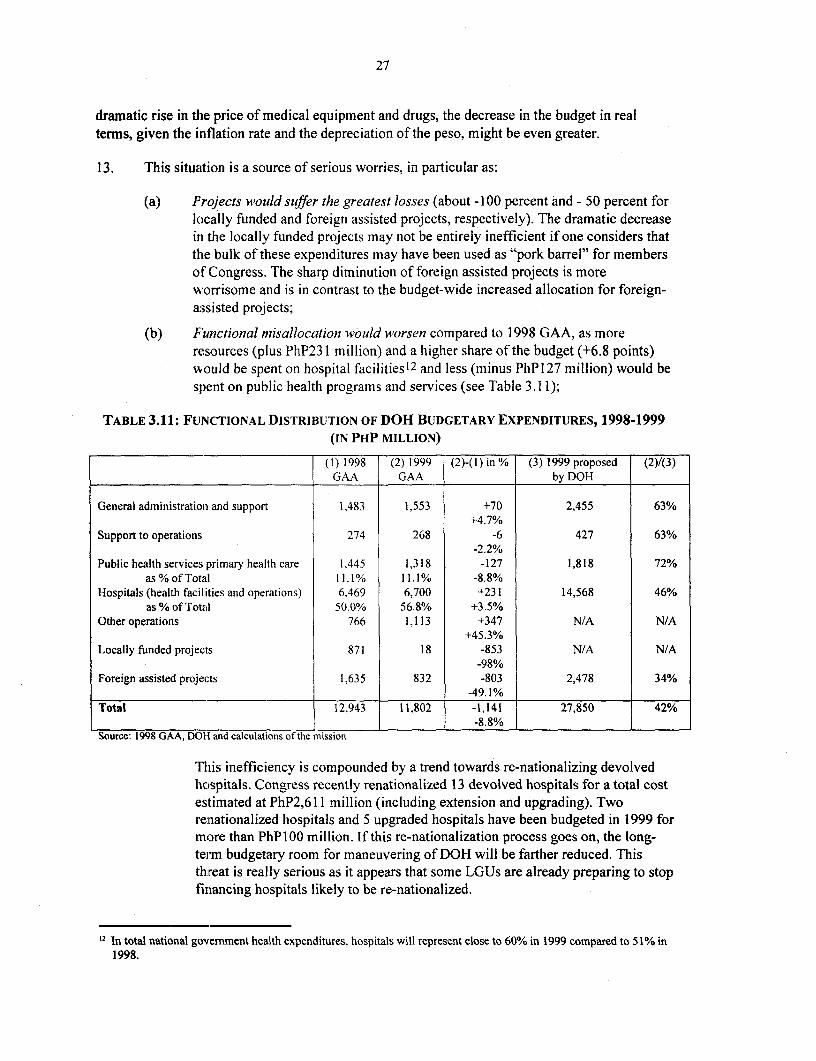
27
dramatic rise in the price of medical equipment and drugs, the decrease in the budget in realterms, given the inflation rate and the depreciation of the peso, might be even greater.
13. This situation is a source of serious worries, in particular as:
(a) Projects would suffer the greatest losses (about -100 percent and - 50 percent forlocally funded and foreign assisted projects, respectively). The dramatic decreasein the locally funded projects may not be entirely inefficient if one considers thatthe bulk of these expenditures may have been used as "pork barrel" for membersof Congress. The sharp diminution of foreign assisted projects is moreworrisome and is in contrast to the budget-wide increased allocation for foreign-assisted projects;
(b) Functional misallocation would worsen compared to 1998 GAA, as moreresources (plus PhP23 1 million) and a higher share of the budget (+6.8 points)would be spent on hospital facilities12 and less (minus PhP127 million) would bespent on public health programs and services (see Table 3.11);
TABLE 3.11: FUNICTIONAL DISTRIBUTION OF DOH BUDGETARY EXPENDITURES, 1998-1999(IN PHP MILLION)
(1) 1998 (2) 1999 (2)-(I) in % (3) 1999 proposed (2)/(3)GAA GAA by DOH
General administration and support 1,483 1,553 +70 2,455 63%+4.7%
Support to operations 274 268 -6 427 63%
Public health services primary health care 1,445 1,318 -127 1,818 72%as % of Total 11.1% 11.1% -8.8%
Hospitals (health facilities and operations) 6,469 6,700 +231 14,568 46%as % of Total 50.0% 56.8% +3.5%
Other operations 766 1,113 +347 N/A N/A+45.3%
Locally funded projects 871 18 -853 N/A N/A-98%
Foreign assisted projects 1,635 832 -803 2,478 34%1 ~~-49.1% _ _ _ _ _ _ _ _ _ _ _ _ _
Total 12,943 11,802 -1,141 27,850 42%______________________________________ ________ -8.8% ____
Source: 1998 GAA, DOH and calculations of the mission
This inefficiency is compounded by a trend towards re-nationalizing devolvedhospitals. Congress recently renationalized 13 devolved hospitals for a total costestimated at PhP2,611 million (including extension and upgrading). Tworenationalized hospitals and 5 upgraded hospitals have been budgeted in 1999 formore than PhP 100 million. If this re-nationalization process goes on, the long-term budgetary room for maneuvering of DOH will be farther reduced. Thisthreat is really serious as it appears that some LGUs are already preparing to stopfinancing hospitals likely to be re-nationalized.
12 In total national government health expenditures, hospitals will represent close to 60% in 1999 compared to 51% in1998.
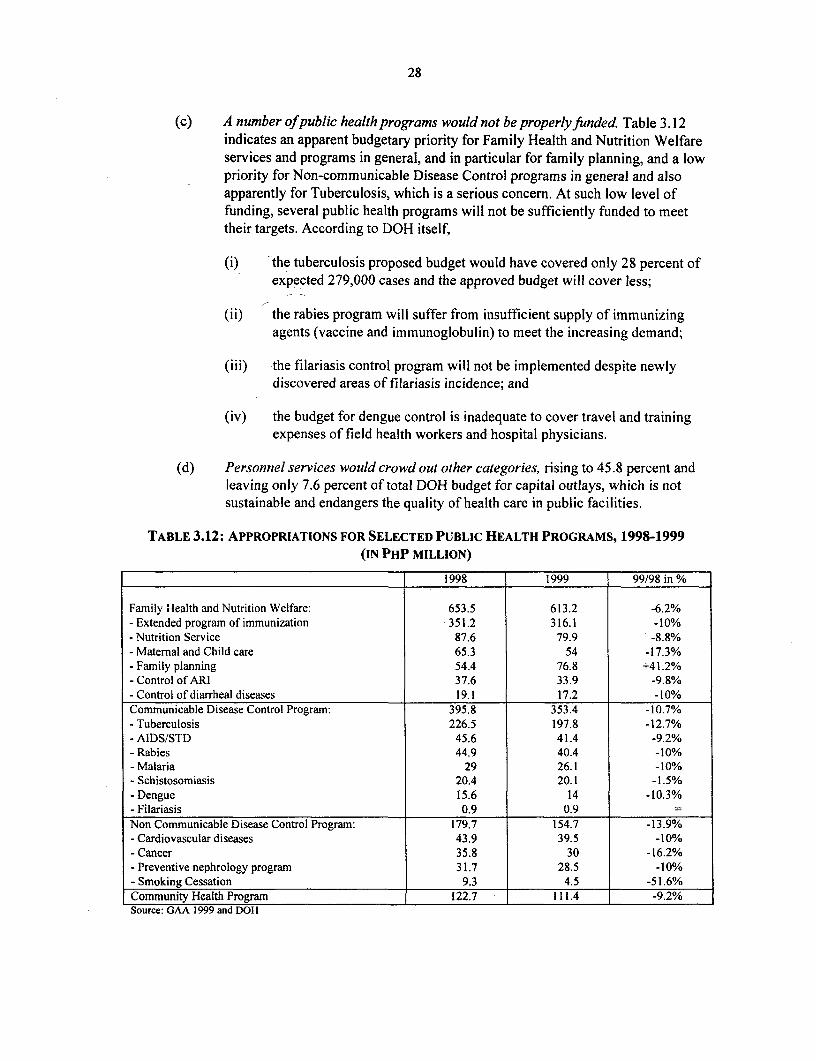
28
(c) A number ofpublic health programs would not be properlyfunded Table 3.12indicates an apparent budgetary priority for Family Health and Nutrition Welfareservices and programs in general, and in particular for family planning, and a lowpriority for Non-communicable Disease Control programs in general and alsoapparently for Tuberculosis, which is a serious concern. At such low level offunding, several public health programs will not be sufficiently funded to meettheir targets. According to DOH itself,
(i) the tuberculosis proposed budget would have covered only 28 percent ofexpected 279,000 cases and the approved budget will cover less;
(ii) the rabies program will suffer from insufficient supply of immunizingagents (vaccine and immunoglobulin) to meet the increasing demand;
(iii) the filariasis control program will not be implemented despite newlydiscovered areas of filariasis incidence; and
(iv) the budget for dengue control is inadequate to cover travel and trainingexpenses of field health workers and hospital physicians.
(d) Personnel services would crowd out other categories, rising to 45.8 percent andleaving only 7.6 percent of total DOH budget for capital outlays, which is notsustainable and endangers the quality of health care in public facilities.
TABLE 3.12: APPROPRIATIONS FOR SELECTED PUBLIC HEALTH PROGRAMS, 1998-1999(IN PHP MILLION)
_________ _ . 1998 1999 99/98 in %
Family Hlealth and Nutrition Welfare: 653.5 613.2 -6.2%- Extended program of immunization 351.2 316.1 -10%- Nutrition Service 87.6 79.9 -8.8%- Maternal and Child care 65.3 54 -17.3%- Family planning 54.4 76.8 +41.2%- Control of ARI 37.6 33.9 -9.8%- Control of diarrheal diseases 19.1 17.2 -10%Communicable Disease Control Program: 395.8 353.4 -10.7%- Tuberculosis 226.5 197.8 -12.7%- AIDS/STD 45.6 41.4 -9.2%- Rabies 44.9 40.4 -10%- Malaria 29 26.1 -10%- Schistosomiasis 20.4 20.1 -1.5%- Dengue 15.6 14 -10.3%- Filariasis 0.9 0.9Non Communicable Disease Control Program: 179.7 154.7 -13.9%- Cardiovascular diseases 43.9 39.5 -10%- Cancer 35.8 30 -16.2%- Preventive nephrology program 31.7 28.5 -10%- Smoking Cessation 9.3 4.5 -51.6%Community Health Program 122.7 111.4 -9.2%Source: GAA 1999 and DOH

29
Recommendations
14. For the remainder of 1998 and for the health sector specifically, this report recommends(i) lifting of any remaining mandatory reserves on appropriations for hospital equipment [Thegovernment has now expressed the intention to do so]; and (ii) as allotments and National CashAllotments (NCAks) are effectively released, to speed up the pace of expenditure obligation, inparticular for pul)lic health programs. If this is not done, the vicious circle described above wouldworsen.
15. The major recommendations of this report concern the year 1999. Regarding the 1999budget itself, it would be advisable to realign the proposed budget with a view to maintainingfunding for public health programs, in particular for vaccines and micronutrients, at the level of1998 GAA level at least for MOOE and in real terms (around plus PhP200 million). Thisreallocation could be partly financed -- within the ceiling of the proposed 1999 budget -- bycanceling the renationalization and the upgrading of the hospitals already included in the 1999budget (PhP120 million). Considering that full IRA is expected to be provided to LGUs in 1999,the rest could be financed by the cancellation of a part of PhP128 million of subsidies to LGUsand local hospitals (Magna Carta for devolved health personnel: PhP69.5 million, and Drugs andMedicines: PhP58.6 million). Although the use of reserves may be needed for the 1999 budget, itis highly recommiended there be no mandatory reserves on public health programs next year.
16. The financial crisis and the strict constraints imposed on DOH budget and the healthsector offer a rare opportunity to accelerate the implementation of health sector reforms in thePhilippines. As far as public health expenditures are concerned, it is particularly recommended tospeed up actual operationalization of National Health Insurance, including the indigent program,and to introduce socialized pricing in public hospitals in order to improve their financial positionand recovering costs from those who can afford to pay.
17. The progressive crowding out of the DOH budget by the retained hospitals should be alsocontained and even reversed. This would be more feasible if a clear distinction was establishedbetween the DOl-I budget, entirely devoted to public health and support to operations, and thebudgets of the retained hospitals. Therefore, it is recommended to give a form of budgetautonomy to retained hospitals. DOH could examine the different legal and technical solutionsavailable to give ithem an autonomy similar to the state universities or to create a new category ofinstitutions. This may perhaps involve transforming the retained hospitals into GOCCs. Thebudgetary autonomy would be also a strong incentive for the acceleration of the pace of hospitalreforms. At the local government level, it is also highly recommended that LGUs give financialand management autonomy to devolved hospitals and, in particular, to allow them to keep animportant percentage (at least 50 percent) of their revenues.
18. Within DOH, the reform of drugs procurement, with a clear emphasis on internationalcompetition, stricter controls of the quality of the products, is a priority.
30
4. TARGETED SOCIAL INTERVENTIONS
1. With the intensification of the crisis, the programs of targeted social intervention underthe Department of Social Welfare and Development (DSWD) and the National Anti-PovertyCommission (NAPC) are on the front-line to shield some of the most vulnerable groups fromsocial hardship. Unfortunately, if NAPC is holding out the promise, the next year's budget wouldprovide for a Fourth Poverty Aileviation Fund (PAF-4), DSWD can only, on present plans,expect its resources to shrink further. The latter situation should be reversed, including bychanneling some of the PAF-4 resources to support critical DSWD programs.
Department of Social Welfare and Development
2. DSWD has a particularly important role to play at the present juncture. DSWD is taskedwith assisting the most economically disadvantaged populations, such as poor women, seniorcitizens without income or private support networks, abandoned children and adults who areunable to work because of severe disabilities. These people, who struggle even in prosperoustimes, are most vulnerable during periods of economic crisis. DSWD also targets people whoface difficult circumstances that may not be solely related to income, such as rape and childabuse victims. As a result of the crisis, DSWD must be able to contend with and serve a largerdisadvantaged population. El Nifio has also taken its toll, further increasing the number of peoplewho are struggling simply to make ends meet. Even with some of its funding reinstated (lifting ofreserves on CIDSS, see below), DSWD will suffer a 13 percent reduction in overall resources asa result of fiscal austerity. The combination of greater demand for services and less availableresources would adversely affect not only the coverage of DSWD programs, but their quality aswell. Thus, in the interest of equity, efficiency, and those segments of the population with thegreatest need, this is one of the only budget items for which this report recommended that theremaining reserve requirement be lifted for 1998.
Mission and Activities
3. Social welfare and development activities are quite varied and are classified into sevenbroad categories, as seen in Table 4.1. Priority areas for DSWD expenditure (see Table 4.2) are:(a) the assistance to distressed populations which includes coordination of disaster and reliefmechanisms; (b) the operation of welfare centers and institutions (e.g., orphanage, centers for thehandicapped); (c) support to victims of rape and child abuse and the flagship program of theSocial Reform Agenda (SRA); and (d) the Comprehensive and Integrated Delivery of SocialServices (CIDSS) for which DSWD is the lead agency.
4. The goal of CIDSS is, "empowerment of disadvantaged families, communities andsectors so that they can access basic services and manage their resources." While the objectivesof the CIDSS project mirror those of DSWD at large, the project utilizes resources from anumber of government agencies and departments. Some of the accomplishments and strengths ofthe CIDSS program include widespread implementation of the Minimum Basic Needs (MBN)framework, targeting of poor areas whereby complete focus is given to 5th and 6th levelmunicipalities, a community/demand driven approach to designing activities and a system formonitoring the effectiveness of interventions using the MBN and other tools. In effect, CIDSSserves to mobilize government and community resources and direct them to the most needy.Some specific examples of activities carried out under the CIDSS project are:

31
* Supplemental feeding for infants and children* Recorlstruction of day care centers as public work programs* Potable water system rehabilitation* Toilet construction* Construction of bridges and roads as public works programs* Emergency shelter assistance* Seed capital for self-employment* Specialized projects in schools* Capability training of LGU/NGO workers.
TABLE 4.1: MAIN ACTIVITIES OF DSWD
CATEGORY BENEFICIARIES ACTIVITIESLivelihood Targets largely ultra poor women.' Actually Self Employment Activities, Practical Skills Devt.,
reaches both the ultra poor, but mainly the Business Mgnt. Services, Skills Enhancement Devt.near poor. Program (Kabuhayan 2000), Capital Assistance for
Income Generation.Family and Disadvantaged families and communities. General activities in support of community mobilization.Community Welfare ___ Outreach to disadvantaged families.Child and Youth Poor infants and children, orphans, Operation of day care centers, honorarium for volunteerWelfare malnourished and abused children. day care workers, support for childhood supplemental
.______________________________________ feeding.Women Welfare Rape and abuse victims, poor women, other Economic/job counseling and assistance and personalProgram disadvantaged women support/counseling.Disabled and Elderly Disabled and elderly without support Social Reform Program for Senior Citizens, Social
networks. Security for the Elderly.Emergency Assistance Victims of crisis, calamities and natural Cash and in kind assistance to individuals in crisis
disasters situation, Emergency Shelter Assistance, Core ShelterAssistance, Food for Work.
Others Various disadvantaged populations Includes Special Social Services program for squatters,implementation of general social welfare anddevelopment activities, human resources developmentwithin the Local Govemment Units or LGUs, Training,Universal Children Festival, Youth and Physical Fitnessand Sports Devilment, Aid to Provincial NutritionProgram, Monitoring services, Capability Building,Minimum Basic Needs training and activities.
Source: DSWD internal documents
Some studies have found DSWD's livelihood programs to be the best among government credit programs in termsof targeting poor populations. However, the cost benefit ratio of these programs remains high. See references infootnotes (2) and (4).

32
TABLE 4.2: DSWD 1998 AND 1999 BUDGETS
1998 REVISED 1998 1999 % CHANGE 1998 % CHANGEAPPROPRIATIONS BUDGET APPROPRIATIONS ORIGINAL VS 1999 VS
(25% Non PS REVISED ORIGINALReserves) 1998
Office of the Secretary 1,776,156,000 1,550,243,750 1,512,234,000 -13% -25%
A. Programs
1. GAA 437,916,000 401,993,500 481,015,000 -8% 3%
II. Support to Operations 83,868,000 70,166,000 61,123,000 -16% -46%
1. Family and Comm. 12,441,000Welfare
2. Child and Youth Welfare 14,104,000
3. Women's Welfare 14,288,000
4. Disabled Person's Welfare 10,018,000
5. Emergency Assistance 10,272.000
111. Operations 489,855,000 388,756,500 413,401,000 -21% -26%
a. Assist. Distressed Pop. 118,388,000 88,791.000 73,757,000 -25% -71%
1. to Victims of disasters 36,767,000
2. to Disabled/Seniors 11,861,000
3. Women, Child in Diff 25,129,000Circumst.b. TA to LGUs, POs, NGOs 8,224,000 6,168,000 7,524,000 -25% -16%
c. MO of Centers/Institutions 363,243,000 293,797,500 332,120,000 -19% -l16%
Subtotal Programs 1,011,639,000 860,916,000 955,539,000 -15% -13%
B. Projects
1. Locally Funded 702,517,000 636,887.750 530,000,000 -9% -41%
a. CIDSS 439,295,000 439,471,250 500,000,000 0% 7%
b. Domestic Adoption 14,471,000 10,853,250 0 -25%
c. Families First 3,251,000 2,438,250 0 -25%
d. Pov. Mapping 5,000,000 3,750,000 0 -25%
e. Self Employment SEA 10,000,000 7,500,000 10,000,000 -25% -6%
f. Family Welfare Fund 3,000,000 2,250,000 0 -25%
g. Rape Victims Assistance 157,500,000 118,125,000 0 -25%
h. Mt. Pinatubo Assistance 70,000,000 52,500,000 20,000,000 -25% -272%
11. Foreign Assisted 62,000,000 52,440,000 26,695,000 -15% -147%
a. Women/JICA grant/ 62,000,000 52,440,000 26,695,000 -15% -147%counterpart fundsSubtotal Projects 764,517,000 689,327,750 556,695,000 -10% -46%
TOTAL 1,776,156,000 1,550,243,750 1,512,234,000 -13% -25%
Sources: 1999 Expenditure Program, 1998 Appropriations, DBM.
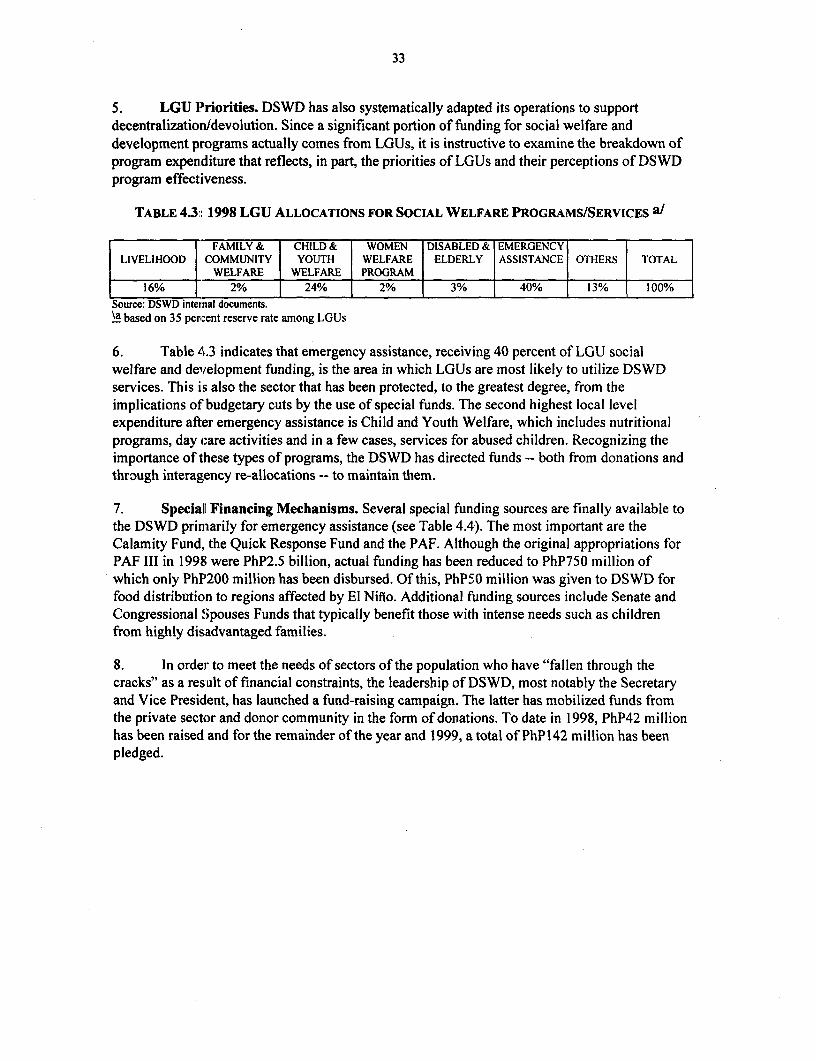
33
5. LGU P?riorities. DSWD has also systematically adapted its operations to supportdecentralization/devolution. Since a significant portion of funding for social welfare anddevelopment programs actually comes from LGUs, it is instructive to examine the breakdown ofprogram expenditure that reflects, in part, the priorities of LGUs and their perceptions of DSWDprogram effectiveness.
TABLE 4.3: 1998 LGU ALLOCATIONS FOR SOCIAL WELFARE PROGRAMS/SERVICFS a/
FAMILY & CHILD & WOMEN DISABLED & EMERGENCYLIVELIHOOD COMMUNITY YOUTH WELFARE ELDERLY ASSISTANCE OTHERS TOTAL
WELFARE WELFARE PROGRAM16% 2% 24% 2% 3% 40% 13% 100%
Source: DSWD internal documents.\a based on 35 percent reserve rate among LGUs
6. Table 4.3 indicates that emergency assistance, receiving 40 percent of LGU socialwelfare and development funding, is the area in which LGUs are most likely to utilize DSWDservices. This is also the sector that has been protected, to the greatest degree, from theimplications of budgetary cuts by the use of special funds. The second highest local levelexpenditure after emergency assistance is Child and Youth Welfare, which includes nutritionalprograms, day care activities and in a few cases, services for abused children. Recognizing theimportance of these types of programs, the DSWD has directed funds -- both from donations andthrough interagency re-allocations -- to maintain them.
7. Speciall Financing Mechanisms. Several special funding sources are finally available tothe DSWD primarily for emergency assistance (see Table 4.4). The most important are theCalamity Fund, the Quick Response Fund and the PAF. Although the original appropriations forPAF III in 1998 were PhP2.5 billion, actual funding has been reduced to PhP750 million ofwhich only PhP'200 million has been disbursed. Of this, PhP50 million was given to DSWD forfood distribution to regions affected by El Niflo. Additional funding sources include Senate andCongressional Spouses Funds that typically benefit those with intense needs such as childrenfrom highly disadvantaged families.
8. In order- to meet the needs of sectors of the population who have "fallen through thecracks" as a result of financial constraints, the leadership of DSWD, most notably the Secretaryand Vice President, has launched a fund-raising campaign. The latter has mobilized funds fromthe private sector and donor community in the form of donations. To date in 1998, PhP42 millionhas been raised and for the remainder of the year and 1999, a total of PhP 142 million has beenpledged.

34
TABLE 4.4: DSWD SPECIAL FINANCING
SOURCE OF PURPOSE BENEFICIARIES TOTAL AMOUNT DSWD: 1998 PROPOSEDFUNDS (DSWD RELEASED/ RELEASED TO/ DISBURSED 1999
PORTION) PROGRAMMED PROGRAMMED AS OF 8/981998
Quick Response Support for El Affected Regions 15/15 15/15 15 0Fund Niilo
Emergency Field Offices 6,7Operations
Calamity Fund Support for El Affected Regions 750/1500 .6/25 0.4 1000Niflo
Calamity Fund Food Field OfficesDistribution 7,10,11,12
PAF III Food El Niho affected 200/750 50/50 50 2500distribution regions I
Donations Cash/In Kind Various-primarily total amount programmed= ? pledged=aid for Disaster centers and received =42 42 142Assistance institutions
Sources: 1998 and 1999 National Appropriations; intemal DSWD documents
Impact of Fiscal Austerity
9. DSWD has been hit particularly severely by fiscal austerity. On current plans, its level ofspending in 1998 would actually be 13 percent lower than in 1997. In 1998, expenditures onpersonal services will increase by 13.4 percent, while maintenance and other operating expenses(MOOE) and capital outlays and net lending would contract by 17.5 percent and 47 percent,respectively. On the face of it, it has however been better protected than other departments fromthe impact of cash rationing (with Notice of Cash Allocations or NCAs totaling of PhP737million were issued to DSWD as of July 1998 with personnel services accounting for PhP245million). Most of this however was for emergency assistance and other urgent programs forvictims of El Nifio, rather than for the mainstream operations of the department.
10. To its credit, the DSWD has responded to the constraints placed on it by taking a freshlook at its activities and prioritizing programs and departments rather than cutting funding acrossthe board. Intradepartmental priorities are set based on the perceived urgency of programrecipients. Generally, activities with long-term benefits such as technical assistance to LGUs,NGOs and so forth are being sacrificed for programs that address urgent needs, such as care,relief and support centers for disadvantaged populations. Certain program areas and projects arehit particularly hard, with budget cuts translating to a full 25 percent funding reduction.
11. In terms of expenditures related to programs, inajor budgetary cuts are being made withinthe Human Resources Bureau of DSWD. Some examples of services that are affected arecapacity building of LGUs to support devolution, technical training/assistance for profession.lssuch as medical and court social workers, and networking with NGOs that deal with children andthe disabled. To an extent, LGUs have made up for the lack of national government funding andare contributing more for certain services. However, the inequality of IRA allotments and thedisparity between the resources of localities suggests that the areas in the greatest need ofassistance are the ones that will be unable to afford service. The DSWD attempts to mitigate thisresult by reallocating resources across municipalities so that poorer areas receive more nationalsupport.
35
12. Projects are heavily affected by the 25 percent reserve requirement because fundingwithin project budgets is primarily for MOOE. Of particular concern is the Rape VictimsAssistance because this type of intervention is unique to DSWD. If JICA does not reduce thecounterpart funding requirement for its grant (which primarily targets women), funds should bereinstated in order to leverage this outside assistance.
1999 Proposed Budget
13. In the absence of a radical economic turn around, vulnerable populations will continue tobe seriously impacted by the crisis next year. The proposed budget allocation for DSWD isinadequate for the department to meet this challenge. In real terms, it is 25 percent less than theoriginal 1998 appropriation, and is also less than the 1998 budget with reserves. Furthermore,some important items such as Rape Victims Assistance and Domestic Adoption, have beencompletely eliminated from the budget. While it is advisable to evaluate and selectivelydiscontinue inefficient programs2 , DSWD needs a larger budget in 1999 in order to fulfill itsbasic functions.
14. The recommendation is that 1999 DSWD appropriations equal those originally set out for1998, in real tetms. Elevating the level of funding for CIDSS in 1999 is one of the measures to beconsidered. It is a particularly strong program with the capacity to absorb increased funds.Similarly, additional funding is critical for the centers and institutions operated by theDepartment.
National Anti-Poverty Commission
15. NAPC lhas the potential to make a tremendous contribution towards poverty reduction ifit delivers on its mandate of agency coordination, policy oversight and advocacy for the poor.NAPC was created to support policies outlined in the National Poverty Alleviation Act (RepublicAct or R.A. 8425). The Presidential Commission to Fight Poverty (PCFP), the Social ReformCouncil (SRC) and the Presidential Council for Countryside Development (PCCD) wereabolished as separate organizations and subsumed under NAPC which is given the powers andfunctions of all three former entities.
16. Among other responsibilities, NAPC is tasked with implementing the Social ReformAgenda, coordinating the social reform and poverty alleviation programs of all nationalgovernment agencies, exercising policy oversight in social reform and poverty alleviation, andensuring efficient and prompt delivery of basic services to the poor.
17. One of NAPC's key assets is its membership. As outlined in the legislation, NAPC givesa voice and a vote to members of disadvantaged and poor populations including the landless ruralpoor, farmers, fisherfolk, indigenous communities, informal sector workers, youth, disabled, theurban poor, victims of disasters and senior citizens. In this spirit, representatives from 18government agencies and at least 12 basic sectors are identified for NAPC membership. It willbenefit from their depth and breadth of perspective to promote sound and coherent anti-povertypolicies. Input from these groups would be extremely valuable during the current period ofbudget evaluation and realignment. Were it more fully operational today, NAPC could serve as
2 See footnote (3). The SEA might be a candidate for phase out.
36
an extremely valuable input to decisions being made about present and future social sectorexpenditures.
18. It is critical that NAPC be given the support it needs to get up and running. The PovertyAlleviation Act states that PhP 100 million "is hereby appropriated as the initial operating fund inaddition to the un-utilized funds of the rationalized commission and councils." NAPC'srequirements should be modest, being a "coordinating and monitoring body" and not animplementing agency. They are quite real nonetheless. As of now, unfortunately, NAPC isoperating on the remnants of the budgets of its predecessors, the SRC, PCFP and the PCCD,totaling just PhP25 million. The funds currently available are inadequate for the costs associatedwith supporting and merging three entities, formulating Implementing Rules and Regulations(IRRs), and organizing the new governing council. NAPC should have access to some operatingfunds so that it can tackle its current administrative challenges and move on to addressingpoverty.
19. One of the first substantive tasks of the Council will be to formulate specifications for theusage of PAF funds. The role of PAF is clear. The Presidential address to Congress clarifies thatit is a "funding supplement for department and agencies' programs intended to meet the minimur-basic needs of our poorest communities." PAF funds should be channeled directly to sectoragencies and sectors, based on the consensus of NAPC's proposed interagency /intersectoralleadership, and used to "fill in the gaps" that exist within existing programs and operations. TheFund also benefit from the rich experience with participatory mechanism (including the MBNapproach), accumulated during the PAFI and 2, which should be brought to bear whenformulating new utilization guidelines.
Microfinance
20. Public resources being scarce as they are, other instruments will also need to be reliedupon and developed to reach out to the poor in those times of crisis. Microfinance is one of them.With sound technical assistance, existing MFIs and rural/cooperatives banks can better meet thefinancial needs of poor segments of the population. The Philippines Coalition for MicrofinanceStandards and others have examined MFIs at the institutional level, focusing on effectivestrategies for outreach, targeting, appropriate lending instruments and policies, financialmanagement, cost-containment, institutional development and so forth. Addressing theseimportant issues is outside the scope of a Social Expenditure Review, and this discussion makesrecommendations only about the role that government should consider taking on.
21. Microfinance programs that have the greatest outreach and that reach the poorestsegments of the population tend to be those that are neither administered by, capitalized by norotherwise controlled by governments. However, the government should provide an appropriateregulatory framework for MFIs, as it does for all financial institutions, and should support thecosts of training that will allow MFIs to become efficient lenders and eventually arrive atfinancial self-sufficiency.3
22. Both the National Credit Council (NCC), through an Executive Order, and NAPC,through legislation, are tasked with leadership roles in promoting national policies and programsthat affect microfinance. With donor assistance and as a result of expertise within the
1 See Llanto, G Garcia, E and GlIanta R (1996)

37
organization, the NCC has conceived and developed an appropriate regulatory framework andcontributed to important legislation for rationalizing the numerous inefficient credit programs thatcurrently exist within the government. This framework, if implemented, will allow MFIs toprosper and reach their potential. The NCC should be given authority, either as its own entity orvia a legitimate linkage to NAPC, to further refine and implement the framework that it hasdeveloped.
23. With augmented funds, the People's Credit and Financial Corporation (PCFC) is in aposition to promote microfinance on a widespread and sustainable basis. To achieve this, it willneed to resist pressure to give away funds or lend at below-market rates. PCFC has been designedas a wholesale lender to MFIs and should not deviate from this role. The PCFC is currentlycapitalized with PhPlOO million from the National Livelihood Support Fund (NLSF), and islikely to receive an additional PhP900 million from the NLSF.
24. Lending these funds at market interest rates is the first step towards ensuring that MFIsare on the path to efficiency and self sufficiency, be they NGOs, rural banks, cooperative banksor other institutions. Current limitations on government funds are another reason that the PCFCshould lend at market, rather than subsidized, rates. The same logic applies to the over 100 creditprograms within the government, and there are compelling arguments based on concepts oftargeting and efficiency that these programs should be rationalized. Resources saved could be re-directed to expenditures on social services for the ultra-poor or could be mobilized for technicalassistance to viable microfinance institutions (MFIs).
25. Training and capacity building programs that are particularly important to allowmicrofinance institutions, rural banks and cooperative banks to serve as effective financialinstitutions for the poor are needed. The Peoples Development Trust Fund (PDTF) was createdunder R.A. 8425 as a funding mechanism for such training. The PDTF, as designated, is to besupported by appiropriations from the Philippine Amusement and Gaming Corporation orPAGCOR. The P DTF does not appear in the 1999 budget, nor does PAGCOR indicate that theywill be supporting the fund. Whatever the source, the government should mobilize public fundsfor technical for M0FIs assistance, possibly from foreign donors. On their part, NAPC and theNCC should workc in partnership, to ensure that Technical Assistance (TA) delivered to MFIs isbased on sound principles and best practices.
Recommendations
26. For DSWD, the recommendations would be to:
* Lift remaining reserves affecting the department in 1998, particularly those onwelfare institutions (e.g., orphanage, rape centers), children and youth, as well asnutrition programs. The government has recently expressed the intention to releasereserves affecting the operation of welfare institutions.
* Raise DSWD fundingfor 1999 to at least the 1998 General Appropriations Act(GA.A) level and allocate the additional resources to DSWD centers and expansionof CIDSS coverage.
38
27. As to NAPC, the priorities would appear to be as follows:
* Actually set up the NAPC council before the end of 1998, so that the latter can adoptthe institution's implementation and regulation as well as guidelines for theutilization of PAF-4.
* Provide resources to fund NAPC initial setup as well as its operational requirementsto assume the monitoring and coordination roles assigned to it by law.
28. This would allow the 1999 PAF-4 to become a critical instrument to dispatchsupplemental funding on a need basis for department interventions in favor of vulnerablegroups, following the highly consultative program/project identification processinaugurated under the Social Reform Agenda (SRA).
Annex IPage 1 of7
The World Bank
THE SOCIOECONOMIC IMPACT OF THEFINANCIAL CRISIS IN THE PHILIPPINES
Report of a Mission to the Philippines,February 1998
Annex IPage 2 of 7
FOREWORD
The information presented here represents the results of a two-week mission to thePhilippines, undertaken in February 1998. The mission consisted of an anthropologist, asociologist, an NGO (non-governmental organization) specialist, and two economists.The primary purpose was to carry out a preliminary assessment of the socioeconomicimpact of the economic crisis on different groups, particularly the poor, and to outline thebroad options for addressing the impacts.
Annex 1Page 3 of 7
SUMMARY
1. Unlike Thailand, Korea or Indonesia, the impacts of the financial crisis in the Philippineshave not been sudden and dramatic. A combination of policies and circumstances has protectedthe Philippines relative to other countries in the region. However, this picture is complicated byseveral factors: First, for various reasons the social impacts have been delayed, though they arebecoming more apparent as time passes. Second, the country is being affected by droughtconditions caused by the El Nifio weather phenomenon. Third, the country is still carrying theburden of the debt crisis of the 1980s, which is contributing to internal vulnerability Fourth,policy decisions were influenced for much of the last six months by the imminence of electionswhich have only recently been completed.
2. The team's, general findings are:
* Though the social impacts have not been immediate or dramatic, they are more pronouncedin areas outside the National Capital Region (NCR), largely because of the compoundingfactor of the drought.
* It is likely that a number of factors are delaying and reducing the impact of the crisis, thoughthey will not pi-event the impacts over the medium to long term. These factors include:
* The fact that sellers are still drawing down inventories in order to protect theirmarkel; share from competitive imports (as well as government encouragement tokeep prices down as long as inventories are being run down)
* A delay in the possible impacts of a reduction in overseas contract workers (OCWs)workirig in other East Asian countries affected by the crisis
* Govemnment price supports for basic commodities which may last only for the shortor medium term (although this is minimal);
* A delay in the impact of lower than normal levels of planting of rice and other cropsin January and February.
* Even if the currency crisis is short-lived, the Philippines continues to be challenged bymedium- to long-term issues in reducing poverty substantially.
* The impact of the currency crisis has been compounded by a significant El Ninio effect,particularly in rice-growing areas and fishing communities.
BACKGROUND AND METHODOLOGY
3. The information presented here represents the results of a two-week mission to thePhilippines, underitaken in February 1998. The mission consisted of an anthropologist, asociologist, an NGO (nongovernmental organization) specialist, and two economists. Theprimary purpose was to carry out a preliminary assessment of the socioeconomic impact of theeconomic crisis on different groups, particularly the poor, and to outline the broad options foraddressing the impacts. The methodology employed by the mission included a review of recentand anticipated economic changes.i In addition, to determine the effects of the crisis and drought,focus groups and in-depth discussions were undertaken with a range of Philippine social groups,including inhabitants of urban slums, urban working class neighborhoods, rural agricultural
Annex IPage 4 of 7
communities, and NGOs and others. The team met with groups both within Manila and inoutlying areas, including Mindanao and Camarines Sur.
4. This approach generated rich material. The methods used were not intended to providestatistically rigorous information. Indeed, the team found that there is an urgent need forgovernment to do a comprehensive household expenditure survey and establish a poverty-monitoring system. The last comprehensive statistical information dates back to 1994 andurgently requires updating.
5. This report aims to provide a framework for dialogue between the government of thePhilippines (GOP) and the World Bank to address the effects of the crisis. It is intended as aworking document to be widely distributed and discussed in order to contribute to, and draw on,the debate within the Philippines about the social impacts of the economic crisis. Once agreementhas been reached on the nature of the problems and on the broad options for addressing them, thenext step will be to design and fund specific programs of action. If the government wishes, theBank is willing to assist in the preparation of a detailed program of action.
MAJOR IMPACTS
6. The team identified five major trends affecting poor people as a result of the combinationof the economic crisis and the drought. These trends need to be carefully monitored to minimizetheir negative social and economic impact, particularly among the poorest populations:
* Lower real incomes because of price increases: While increased prices are only recentlyshowing up in aggregate statistics, in certain localities (particularly those in outlying areas)even relatively small price increases were already beginning to be felt by very poorhouseholds as early as the last half of 1997. Producers will benefit from increased prices, butthe households most at risk are net consumers, most likely poor, landless rural dwellers.Inflation will particularly hit hard the population in the bottom 5-40% of the incomedistribution. It is unclear how much of these price increases are attributable to the financialcrisis or the drought in key areas. In addition, planting levels of rice and other staples werelower than normal in January and February. In either case, very poor households should bethe target of any immediate attempts to strengthen the safety net. In terms of poverty andinequality, the poverty rate may increase if growth slumps to zero in 1998. The importanceof the effects of the crisis on income distribution are illustrated by the Gini coefficient(measure of distribution of wealth across various income levels). If it were to rise by 5% thepoverty rate by the year 2000 would be 29% - higher than the poverty rate in 1990. Thecountry would loose ten years of poverty reduction effort.
* Unemployment and lower wages: Income changes are resulting from retrenchment, areduction in wages, and a replacement of regular workers by lower paid and less securecontract workers. The January 1998 round of the Labor Force Survey shows a decline inoverall rate of employment growth from 3% in 1997 to 1.3% in 1998. Unemployment ratewas highest in the NCR region (15%) which accounted for more than half the totalunemployed in the country. Urban jobless also rose to 11% as compared to 9.6% a yearearlier. While these changes may enable businesses to respond better to changing marketopportunities, their net effect should be monitored to ensure that the mitigating effects ofgreater labor market flexibility do not come at the cost of basic worker rights and safety.Informal sector earnings have also dropped, largely because of increased competition in the
Annex IPage S of 7
face of reduced demand. Reduced earnings may also have spill over effects on poor andvulnerable groups as remittances decline. In January 1998, it is estimated that the nationalunemployment rate rose from 7.7% to 8.4%
* Reduced services: Devaluation-related inflation has already eroded the national budgets forhealth, education, and other social sectors (though we are not aware of any actual interruptionof services so far). Government has announced budget freezes of up to 25 percent of non-personnel expenditure. This has already further eroded service coverage. A 10 percent holdon the Internal Revenue Allocation (IRA), which is the main source of central governmenttransfers to local government units (LGUs) was announced. These cuts budget adjustmentsbeen implemented by most departments largely across-the-board, without adequateconsideration of which programs and services are especially important to the poor and to thecountry's long-term human capital development.
* Availability and access to credit: High interest rates are forcing low- and middle-incomeborrowers away from banks and to other sources of capital, such as salary advances and salesof assets. Anolher response to high interest rates is to scale back on productive activity. Forexample, farmers may reduce the areas they plant to save on input costs. Lower wages andhigher unemployment have also resulted in increased demand for microcredit forconsumption and to supplement income. A more immediate concern is that the poor peoplewho cannot qualify for loans have been turning increasingly to traditional moneylenders andpawnshops to rneet their needs for credit.
- Impact on social capital: Preliminary discussions both within and outside Manila indicatethat the impacit of the crisis on social capital is mixed. In some cases, community andhousehold cohesiveness may be increasing in response to increased economic pressures. Atthe same time, there are reports of changes in the nature and structure of social relations asthe struggle for survival intensifies. It is imperative that these conflicting trends be closelymonitored to avert rifts in the social fabric that could have long-lasting effects on socialdevelopment. Preliminary information suggests that there may be increases in crime in urbanand rural areas, increases in prostitution (including child prostitution) and domestic violence,labor mobility (especially of children and youth), and growing numbers of street children.For those families at risk, health indicators may be deteriorating as a result of poor nutrition,increased stress, and reduced funds available at the household level to pay for preventivecare. The situation of women is of particular concern, as women appear to be entering thelabor market to generate additional income and often place themselves at nutritional risk toprovide for the rest of their family.
RECOMMENDATIONS
7. The report recommends the following short- and long-term strategies:
Short-term strategies:
* Target intervention toward asset-less poor in rural areas, who are unlikely to benefit from anyproduction impetus caused by higher agricultural prices and are hurt by higher consumerprices. Areas where the effects of the crisis are compounded by weather-related problemscaused by El N'ifno should also be given special attention.
* Protect health, education, and other social sectors from budget cuts relative to other sectors.Across these sectors, identify and protect the most effective programs and those that the poor

Annex IPage 6 of 7
use disproportionately (for example, lower levels of services, such as basic education, ratherthan higher ones; basic public health facilities, rather than urban-based hospital care). Withinany sector, protect key inputs such as textbooks, some important drugs that are used more bythe poor than by others (in particular restore funding for immunization programs to 100percent), rural infrastructure, irrigation, and livelihood and employment generation programs.
* Ensure the mobility of labor across activities. Programs for training and retraining should bemuch more closely aligned with emerging labor market needs. For this purpose, thegovernment may, with the assistance of civil society, identify those programs of theTechnical Education and Skills Development Authority (TESDA) that could be expanded orintensified. Programs should be monitored carefully to ensure effectiveness.
* Evaluate the variety of ongoing income and employment generation programs now operatingin the Philippines to identify those that are most effective. A team consisting ofrepresentatives from civil society, government, and the private sector could be formed. Itwould examine income generation programs and other social protection programs andrecommend programs suitable for rapid scaling up to alleviate the impacts of the crisis.
* Review coping mechanisms developed in response to the crisis and design programs with theaim of supporting the coping mechanisms identified as effective among the poor. Improvemonitoring, combining quantitative with qualitative techniques to help develop quick-response capability.
Medium- to long-term strategies:
* A key to long-term reduction of poverty and equity for the poorest in rural areas isstreamlining and improvement of the land reform program. This hinges crucially on arealistic assessment of land values and effective and enforceable collection of property tax assteps toward the creation of a genuine market for land.
* A long-term commitment to quality improvement in the agricultural sector, includingextension services and rural infrastructure.
* A consolidation of the large variety of government programs to alleviate poverty andimprovement in the targeting of such programs.
* Steady increases in the budgetary allocations for health and education, with an emphasis onreaching people in rural areas. In education technical/vocational and higher education shouldbe more closely linked with industry. In addition, in order to gear human resources forentrepreneurial and self-employment, some aspects of the curriculum in basic,technical/vocational and higher education could be developed. This should be coordinatedwith livelihood and microcredit programs.
* An expansion of the best microcredit schemes to substitute for the traditional usurious credit.Potential existing programs for expansion could include the Department of Social Welfare(Self-Employment Assistance Program) and those of NGOs.
* The creation of a system, building on existing statistical and community-level researchprograms, to regularly monitor poverty alleviation programs and give a clearer picture ofpoverty trends.

Annex IPage 7 of 7
Table I illustrates the categories of interventions that might possibly be used to address theimpacts of the financial crisis on the Philippines. Discussion of the advantages and disadvantagesof these approaches and of the purposes for which they are most appropriate is contained in thebody of the report.
TABLE 1: POSSIBLE INTERVENTIONS
_ , I~~~~~~~~~~~~~~~~~~~~~~~~~~~~~~~~~~~~~~~~~~~~~~~~Likely Time Frame for Intervention
Category/lntervention Short-term Medium-term Long-term_ ~~~~~~~~~~(next 6 months) (next I to 3 years)
Direct transfers to vulnerable groupsCash (welfare payments, public works) x xIn-kind (commodity subsidies) x x
Income and employment generationLivelihood and microcredit programs xRetraining programs x xSupport for cooperatives x xSupport for SMEs (small- and medium- x x
scale enterprises)Payments for displaced workers x xLabor market regulations x x
Public services to preserve humanresource investments
Ed acation x xHealth x x xWater and sanitation x x x
Strengthening local institutions andsocial capital
Transfers to LGUs x x xVillage- and community-level x x x
interventions

IA: Textbooks Elementary -- Cost Estimates for 1999
Projected Estimated Current T.Books Net T.book Cost Cost
Enrollment servicable Pupil-T.book required required Estimate Estimatefor 1999 T.books ratio 1:2 ratio 1:2 ratio Pesos US$
ElementaryGrade IFilipino 2,807,522 1,834,100 1.5English 2,807,522 1,834,100 1.5Science 2,807,522 NIL 1,403,761 84,225,660 1,958,736Math 2,807,522 1,834,100 1.5
Grade IIFilipino 2,393,812 848,610 2.8 1,196,906 348,296 20,897,760 485,994English 2,393,812 2,396,700 1.0Science 2,393,812 NIL 1,196,906 71,814,360 1,670,101Math 2,393,812 2,396,700 1.0
Grade IIIFilipino-Wika 2,220,407 159,690 13.9 1,110,204 950,514 57,030,810 1,326,298Filipino-Paghasa 2,220,407 44,820 49.5 1,110,204 1,065,384 63,923,010 1,486,582
English-book 1 2,220,407 272,339 8.2 1,110,204 837,865 50,271,870 1,169,113English-book 2 2,220,407 255,380 8.7 1,110,204 854,824 51,289,410 1,192,777
Science 2,220,407 65,010 34.2 1,110,204 1,045,194 62,711,610 1,458,410Math 2,220,407 63,480 35.0 1,110,204 1,046,724 62,803,410 1,460,544
>>
OQ O(D f
XM-

Projected Estimated Current T.Books Net T.book Cost CostEnrollment servicable Pupil-T.book required required Estimate Estimatefor 1999 T.books ratio 1:2 ratio 1:2 ratio Pesos US$
Grade IVFilipino-Wika 2,095,375 81,000 25.9 1,047,688 966,688 58,001,250 1,348,866
Filipino-Pagbasa 2,095,375 81,000 25.9 1,047,688 966,688 58,001,250 1,348,866
English-book 1 2,095,375 281,000 7.5 1,047,688 766,688 46,001,250 1,069,797
English-book 2 2,095,375 284,333 7.4 1,047,688 763,355 45,801,270 1,065,146
Science 2,095,375 274,333 7.6 1,047,688 773,355 46,401,270 1,079,099
Math 2,095,375
Grade VFilipino-Wika 1,696,762 372,300 4.6 848,381 476,081 28,564,860 664,299
Filipino-Pagbasa 1,696,762 371,420 4.6 848,381 476,961 28,617,660 665,527
English-book 1 1,696,762 496,673 3.4 848,381 351,708 21,102,480 490,755
English-book 2 1,696,762 477,141 3.6 848,381 371,240 22,274,400 518,009
Science 1,696,762 399,060 4.3 848,381 449,321 26,959,260 626,960
Grade VIFilipino-Wika 1,584,891 468,360 3.4 792,446 324,086 19,445,130 452,212
Filipino-Pagbasa 1,584,891 464,310 3.4 792,446 328,136 19,688,130 457,863
English-book 1 1,584,891 772,988 2.1
English-book 2 1,584,891 786,909 2.0
Science 1,584,891 717,146 2.1
Math 1,584,891 1,322,633 1.2
TOTAL 22,372,409 13,575,114 970,546,830 22,570,857
oq ;Jm
M D
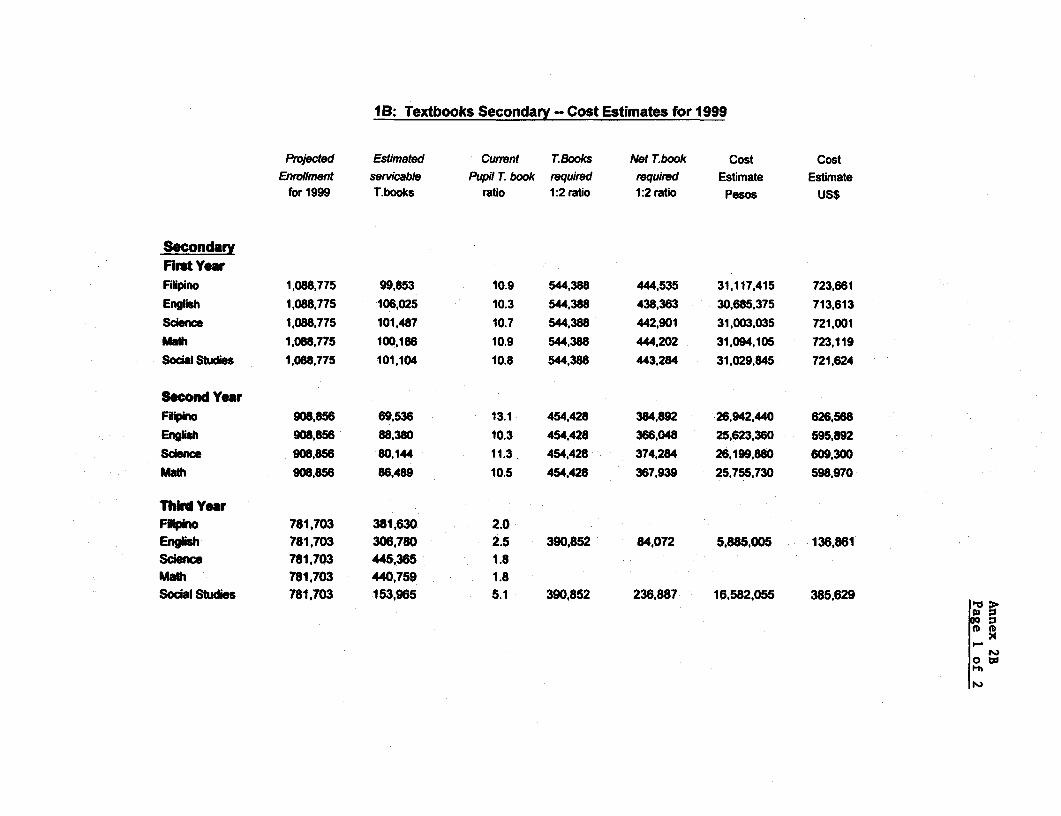
18: Textbooks Secondary -- Cost Estimates for 1999
Projected Estimated Current T.Books Net T.book Cost Cost
Enrollment servicable Pupil T. book required required Estimate Estimatefor 1999 T.books ratio 1:2 ratio 1:2 ratio Pesos US$
SecondaryFlirt YearFilipino 1,088,775 99,853 10.9 544,388 444,535 31,117,415 723,661
English 1,088,775 106,025 10.3 544,388 438,363 30,685,375 713,613
Science 1,088,775 101,487 10.7 544,388 442,901 31,003.035 721,001
Math 1,088,775 100,186 10.9 544,388 444,202 31,094,105 723,119
Social Studies 1,088,775 101.104 10.8 544,388 443,284 31,029,845 721,624
Second YearFilipino 908,856 69,536 13.1 454,428 384,892 26,942,440 626,568
Engih 908,856 88,380 10.3 454,428 366,048 25,623,360 595,892
Science 908,856 80,144 11.3 454,428 374,284 26,199,880 609,300
Math 908,856 86,489 10.5 454,428 367,939 25,755,730 598,970
Thkd YearFlipino 781,703 381,630 2.0
English 781,703 306,780 2.5 390,852 84,072 5,885,005 136,861
Sdence 781,703 445,365 1.8
Math 781,703 440,759 1.8
Social Studies 781,703 153,965 5.1 390,852 236,887 16,582,055 385,629
10 g
ID
owP

Projected Estimated Current T.Books Net T.book Cost CostEnrollment servicable Pupil-T.book required required Estimate Estimatefor i999 T.books ratio 1:2 ratio 1:2 ratio Pesos US$
Fourth YearFilipino 652,718 159,330 4.1 326,359 167,029 11,692,030 271,908
English 652,718 197,471 3.3 326,359 128,888 9,022,160 209,818
Science 652,718 201,847 3.2 326,359 124,512 8,715,840 202,694
Math 652,718 192,839 3.4 326,359 133,520 9,346,400 217,358
Social Studies 652,718 NIL 326,359 22,845,130 531,282
TOTAL 7,407,576 4,970,009 370,745,726 8,621,994
e >o
P0 w

MAP SECTION
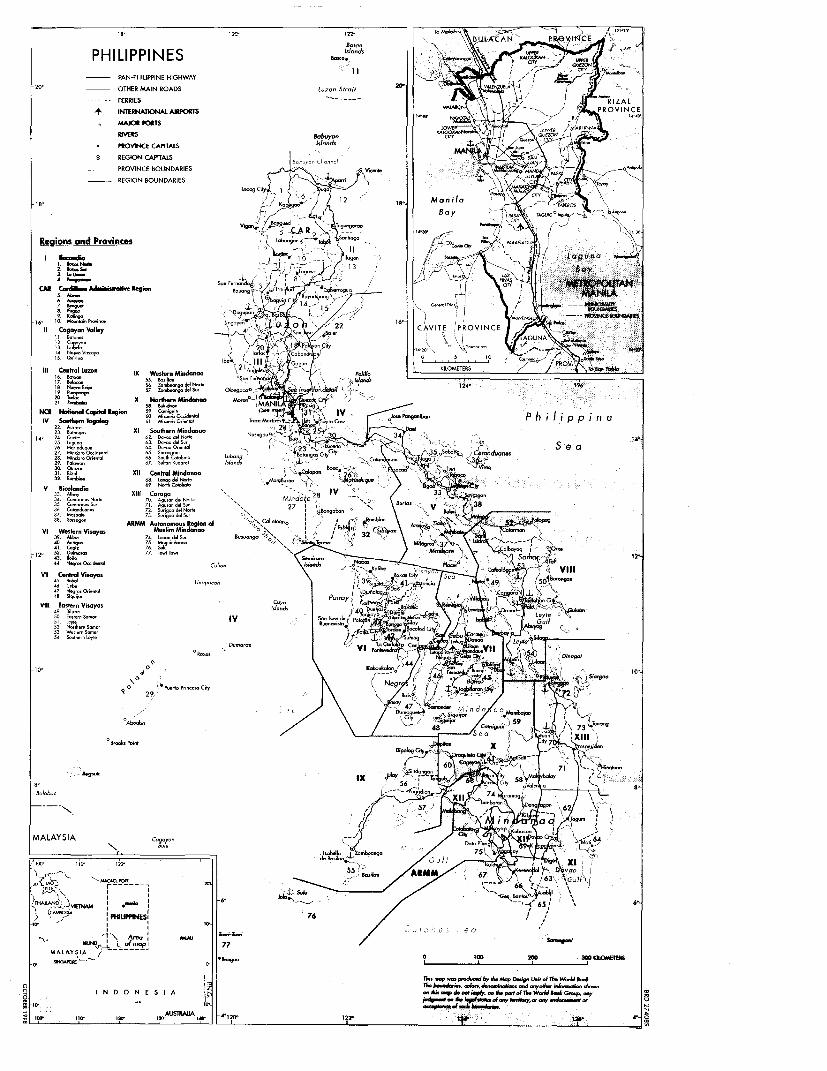
PHILIPPINESPAN-PHILIPPINE HIGHWAY
-20 OTHER MAIN ROADS W- St-it 20'
-- FERRIES RIZAL
4 INTERNAI1ONAL ARPORTS ROVINCE
* PROVV4CE CAPREAI.S Iln
S REGION CAPITALS c-
PROVINCE BOUNDARIES £ ViclM
_ REGION BOUNDARIES tp,nni
-18- K. ~~~~~~~~~~~~~~~~~~~Manila- 2"
&e~~~~~~~~~~~~~~~~~~~ L ._L I A.a ^
Rngions and Provinces IntLngo<~ 0 ~ PC42.492A a
zf _ ; 1 '3,
CAR Kgien. 3 c
IC .ay. ,V. 4 0 y 22 CAVITE bPROVINCE
13 ,nn. II
14 9.~ ,4' Il .~Gnyn
Ill CenItal Lele l7 Wnsro Mnoonon- I
631- "5-ne 5F. dsndl51 tasLm9 \=ra >| M
39 5nr.n 7 Z ~ , O992'3'6 '"
2V W r x Mustli M o AN i > Xc N h Md _
121 52 mvn 71MAN 7ixn \ ;8 )s d 2
NCR Notld Capital Regina I Cn..gn
IV 5-ejsn Tinapaca 61 |ni T- MCP i p/i 9i ' :9 c s
23 A.i- Xi Sothern Mi-doeoo N-gb
34' ~ ~ 24 Cnn 92m ug e Dnn,nd /,°MdNnfln t
23~~~~~~~~~~~~~~~~~~~~~~323 nu_n 63 2',d.1S.,
26 Mn,n4nW 2: 2nn, O,.,,nr., rST. . a bly +
0,,,id,,ln 63 3nn2n U -f3Sbo C I0doo
26. M;n,oin9 66~ S.' nnnn Lin nng6 ~ Cn nw '
29. PNI- 675 Wh K.d-n Illa i 9/31. Rie931 XtI Cental Miodene32. to.,. _ 68 d,n1n N-
V Ricol6dlo'3 CnMst
37 p 6I. 73 S dnI Sd 738. ~ ~ ~ AMIM Aotonon- Region oF K
Vt Weser Vi-as Musim Mindana o 439. 162., 74 122434 dos291
49. 426qo. 75. trimd&,o
43. 012 76. 567
52 T~~~ Th-is n db 4pL4Lv fXWr
o 3 IIId n_o
44 nr 90 O0I9h Nnn DIsNEoIAoolsd q r fr
Vr Coetr V'.oye lt.<6 7,3II r 41L 22 0 '
EMe,n Ii,y.pn,cfS
VItI Rsena ino49. MiIin,sltS
31 I29932 Nndh-tS2oo,33 W.4s- Sn.',
34S-lb,, Ley.
310' 0K6-1 A-93~~~~~~~~~~~~~~~~~~~~~~~~~~~~~~~~~~~~~~0
29 "
MALAYSIA
N Cg3
n P,5
~ :
) .>" ~~~~~PHIILIP?INESi 7
MALAYSIA /? 0 KO
TiNs -o.n. prn&od by d.o Ag Design U.1 dT TM W"odd ,n.
I N D 0 N E S I A -T M ,a .Mkw n* ~. h.wQBn ,p~ - ~ .b rds an d.iI d ".P. of an, t -Fhwod8a, arnW .lo 9
O iedo..en Aolgetn OF. oros' Aed,TRAvorA
-'AU!o, 120oed.Aeado o 606 1660 Or 183' t' ~~~~~~~~~~~~~~~~~~~~~~~~~~~~~~~~~~~~~~~l2R' 1239 t~~~~~~~~~~~~~~~~~~~~- 49~~~~~~