Market Harborough Methodist Circuit Prayer Spaces in Schools.

www.brookfieldlogisticsproperties.com
MAGNA PARK ExtensionReport
HYBRID APPLICATION:Economic Case for Magna Park
October 2015


Final Report
IDI Gazeley UK Ltd
MAGNA PARK EXTENSION: HYBRID PLANNING APPLICATION The Economic Case for Magna Park


CONTENTS
PREFACE: CREDENTIALS OF THE AUTHORS 1 INTRODUCTION ................................................................................................................. 5
Introduction.......................................................................................................................... 5 Report Coverage ................................................................................................................. 5
2 OVERVIEW OF MAGNA PARK ........................................................................................... 7 Introduction.......................................................................................................................... 7 Current Occupiers ............................................................................................................... 7 Contribution to the HDC Economy ....................................................................................... 8
3 OVERVIEW OF THE LOGISTICS SECTOR ...................................................................... 11 Introduction........................................................................................................................ 11 Industry Structure .............................................................................................................. 11 Warehousing – Distribution Centres .................................................................................. 12 The Value of Logistics to the Economy .............................................................................. 14 Logistics as an Employer ................................................................................................... 14 Location Requirements ...................................................................................................... 18 Key Issues ......................................................................................................................... 20 Trends in Warehouse Supply ............................................................................................ 23
4 DEMAND FOR LOGISTICS .............................................................................................. 25 Forecast Growth ................................................................................................................ 25 Leicester and Leicestershire Strategic Distribution Study (SDS) ........................................ 25 Sensitivity Tests ................................................................................................................ 28 Comparison of Forecasts ................................................................................................... 30 Sensitivity Testing on SDS Assumptions ........................................................................... 31 Conclusion ........................................................................................................................ 33
5 ANALYSIS OF COMPETING SUPPLY .............................................................................. 34 Introduction........................................................................................................................ 34 Gerald Eve Analysis of Competing Supply ........................................................................ 34 The Role of Magna Park Lutterworth in Meeting Demand .................................................. 37
6 THE NATIONAL ECONOMIC BENEFITS .......................................................................... 38 Value of Forecast Growth .................................................................................................. 38 Economic Efficiency of Logistics Cluster ............................................................................ 38 Conclusions ....................................................................................................................... 41
7 THE LOCAL ECONOMIC BENEFITS ................................................................................ 42 Introduction........................................................................................................................ 42 Harborough Economic Profile ............................................................................................ 42 The Labour Market ............................................................................................................ 44 Development Proposal ...................................................................................................... 45 Operational Effects ............................................................................................................ 46 Local Rates Income ........................................................................................................... 48
8 THE POLICY FIT ............................................................................................................... 55 National Policy ................................................................................................................... 55

The LEP Context ............................................................................................................... 56 Local Policy ....................................................................................................................... 58
9 CONCLUSIONS ................................................................................................................ 61 Summary ........................................................................................................................... 61 Local Economic Benefits ................................................................................................... 62 Why Magna Park ............................................................................................................... 62
Appendix 1 Magna Park Lutterworth Distribution Property Market Assessment Gerald Eve Appendix 2 Magna Park Lutterworth Demographic Projections John Hollis Demographic Consultant
Appendix 3 Baseline Data (NOMIS)

PREFACE This report has been prepared by Dave Lawrence, Sally Bruer and Julian Worth, each an acknowledged expert in their field:
Dave Lawrence is an economist with over 30 years’ professional experience. His work covers economic analysis, forecasting and spatial planning. He has been responsible for the economic input to major growth area strategies such as Milton Keynes South Midlands and regularly undertakes forecasting work to inform the Mayor’s London Plan and TfL’s transport models. He has undertaken a number of studies on the logistics sector to inform planning policy.
Sally Bruer is a partner and the head of industrial research at Gerald Eve and a specialist in industrial and logistics property. Sally is responsible for the production of Gerald Eve’s suite of award-winning Prime Logistics research reports. These are the definitive guide to the UK’s distribution property market, and include analysis and commentary on the market dynamics for the UK’s key logistics property markets.
Julian Worth has spent 36 years in railfreight and has held posts including Marketing Director of English Welsh & Scottish Railway and Managing Director of Transrail Freight Ltd, the largest UK rail freight company prior to privatisation. He now advises companies and lectures on rail-based logistics in the UK and abroad. He is chair of the Chartered Institute of Logistics and Transport's Rail Freight Forum.


The Economic case for Magna Park
Final Report | October 2015 5
1 INTRODUCTION Introduction
1.1 This report sets out the economic case for IDI Gazeley’s hybrid planning application for the extension of Magna Park, Lutterworth.
1.2 Magna Park is a focus of economic activity in the south west of Leicestershire and is a major employer with over 9,000 jobs supported by the existing park. It is a facility that has proven appeal to the logistics sector with many leading firms in the sector operating out of the park.
1.3 Most of the businesses in MPL operate a national distribution centre from the site, meaning that the single Magna Park premises serves the whole of each business’s UK operation.
Report Coverage 1.4 The report structure and coverage is set out below.
1.5 Chapter 2 of the report provides an overview of the existing logistics facility at Magna Park Lutterworth. This looks at current occupiers, the contribution of the Park to the local economy of Harborough and how this fits with the profile of the local area.
1.6 Chapter 3 sets out an overview of the logistics sector. This describes the contribution of the sector to the National Economy. It explains the locational requirements of the sector. It sets out some of the key issues the industry will face and looks at role of the logistics sector as an employer.
1.7 Chapter 4 assesses future demand for logistics covering forecast growth in land and floorspace and the locational requirements of this demand. This analysis focuses in particular on demand for floorspace within the Golden Triangle in general and Leicestershire in particular This section draws on and comments on the recent Leicestershire Strategic Distribution Study but also sets out some of the uncertainties and assumptions around the forecasts presented in that report.
1.8 Chapter 5 provides an analysis of competing supply to Magna Park detailing the existing planning pipeline and providing a comparative assessment of the competing supply drawing on analysis undertaken by Gerald Eve.
1.9 Chapter 6 provides an analysis of the benefits to the UK economy from expansion at Magna Park. This looks at the value of the forecast growth and the economic efficiency gains from the benefits of a logistics cluster.
1.10 Chapter 7 details the local economic benefits from the proposed expansion. This covers the employment impact, the value added to the local economy, and the impact on the local labour market. It also assesses the benefits of a proposed Logistics Institute of Technology (LIT) dedicated to the logistics sector.

The Economic case for Magna Park
Final Report | October 2015 6
1.11 Chapter 8 describes how the proposals accord with existing policy covering national policy, local policy and the objectives of the Local Enterprise Partnerships for economic development in their area.
1.12 Chapter 9 concludes by summarising the principal points, highlighting the key economic benefits and concluding why Magna Park is the right location for further expansion of the logistics sector.
1.13 The report is supported by three appendices:
Appendix 1: Magna Park Lutterworth Distribution Property Market Assessment undertaken by Gerald Eve
Appendix 2: Magna Park Lutterworth Labour Force Projections undertaken by John Hollis Demographic Consultant
Appendix 3: Baseline Data (NOMIS).
.

The Economic case for Magna Park
Final Report | October 2015 7
2 OVERVIEW OF MAGNA PARK Introduction
2.1 Magna Park Lutterworth (MPL) has been under development since 1987. It was established in 1988 as a dedicated logistics park, and was largely built out by 2007. There is at present about 771,155 sq m of strategic distribution floorspace in the form of 31 separate distribution units together with the further 8,185 sq m Asda George Headquarters.
2.2 Businesses at MPL receive and distribute goods from across the UK and abroad. Some businesses are purely providing the logistics for their own operations while others are undertaking logistics for third party organisations. It forms part of the “Golden Triangle”, a sub region of the Midlands, bounded by the area formed by the M1, M6 and M69 motorways that services strategic distribution for a large part of the country.
2.3 As at August 2013, there were 25 firms at MPL operating a total of comprising of 17 National Distribution Centres (NDCs); 14 Regional Distribution Centres (RDCs); and two other national operations that are not engaged distribution activities – one of which is the design and manufacturing Head Quarters for George, the fashion line for the Asda business.
Current Occupiers NDCs and RDCs
2.4 MPL remains one of the largest dedicated distribution parks in Europe. The premises are occupied by such well-known businesses as Asda, Argos, Toyota, Costo, Nissan, Kenwood and Lidl. Unit sizes of buildings range from about 10,000 sq m to about 65,000 sq m in the case of the Asda Integrated Distribution Centre (IDC).
2.5 The Park lies in an area generally referred to as the Golden Triangle, an area that is home to most NDC and many RDC operators.
Figure 2.1 Logistics Golden Triangle

The Economic case for Magna Park
Final Report | October 2015 8
Contribution to the HDC Economy GVA and Employment
2.6 Based on ONS super output level data and a survey of occupiers in the summer of 2013, total employment at MPL is estimated at 9,300, with 70% in logistics occupations and others in related professional, management, sales, IT, administration and related occupations. The 9,300 jobs at Magna Park account for about 24% of total employment in Harborough District. The logistics share is more than twice the Leicestershire average for the sector.
2.7 Assuming GVA per head equivalent to the average for the logistics sector, these 9,300 workers generate an estimated £381.3m GVA for Harborough per annum.
2.8 Based on post code data provided by occupiers in the summer of 2013 (for about 20% of the 9,300 employees), just under 20% live in a post code that wholly or partly is covered by a Harborough ward. Some 26% live in post codes in the administrative area of Leicester; 2.5% in Rugby and 7.5% in Coventry.
2.9 According to BRES1, the MPL locality contained between 23% (OA definition) and 25% (LSOA definition) of all the people in employment in Harborough district in 2011. This shows the scale and magnitude of the importance of Magna Park as an employment hub, reflecting the strength of the sector compared to others in Harborough and the success of MPL.
2.10 However as shown in the Figure 2.2 below, Magna Park is not only an important local employer. The map below shows that in the wider sub area, Magna Park is one of the largest employment locations.
1 Business Register Employment Survey – the national annual survey of employment numbers

The Economic case for Magna Park
Final Report | October 2015 9
Figure 2.2 Local Employment Clusters
Source: Census, 2011
Labour Market and Training
2.11 The skills requirements of the sector are rising particularly in sales, IT, customer service and engineering. In line with the sector as a whole, Magna Park businesses invest in a range of training for their workforce, on-the-job and in partnership with further and higher education institutions.
2.12 Creating a pool of skilled employees in and around Magna Park is fundamental to the long term growth of Magna Park and its existing customers, also for the ability of IDI Gazeley to attract new customers to Magna Park in the future.
2.13 IDI Gazeley are currently working up detailed proposals with Aston University and the South Leicestershire and North Warwickshire & Hinckley Colleges for the Logistics Institute of Technology which will be located within the extension site promoted by the hybrid planning application. We expand on this further in Chapter 7 below and a full report is provided in Appendix 2 to the Planning Statement.
2.14 IDI Gazeley, as well as the Park’s occupiers, invest in a wide range of measures to promote the image of the sector. IDI Gazeley has invested heavily in the Park’s acknowledged environmental credentials (see the Design & Access Statement and the Planning Statement for a full account) and has, for the last two years, engaged in an extensive programme of community engagement, backed by a fund for community projects.

The Economic case for Magna Park
Final Report | October 2015 10
Occupiers are keen to endorse environmentally friendly practices and each promotes a Corporate Social Responsibility charter with undertakings aimed, amongst other things, at ensuring that site and its immediate surrounds are respected and contributing to a healthy and attractive working environment.

The Economic case for Magna Park
Final Report | October 2015 11
3 OVERVIEW OF THE LOGISTICS SECTOR Introduction
3.1 “The logistics sector is critical to the success of UK plc. It supports national competitiveness and productivity and attracts inward investment whilst globalisation is resulting in increased world trade and supply chain links which span the world.” The point was noted by IDI Gazeley in their submission to the consultation on the National Planning Framework. This chapter examines the value of the logistics sector to the national and local economy. It sets out how the sector operates and what its needs are in terms of property and labour. It looks at the profile of the workforce and the type of jobs that will be generated locally.
Industry Structure 3.2 The logistics and distribution market essentially consists of four different types of
organisation. These are:
Manufacturers/producers – these organisations manufacture or produce semi-finished goods for input into another production process (component manufacturers), and finished goods for sale to either a retailer or supplier. Over time manufacturing has shifted eastwards, to either Eastern Europe or the Far East, particularly China, where labour and other costs are significantly lower. Cost competitive transport/logistics is therefore vital if the lower cost benefits of the Eastern Europe/Far East location are to be maintained through the supply chain.
Suppliers/distributors – these organisations essentially purchase finished goods from the manufacturers/producers before selling them on to the retailers. These intermediary companies are of declining importance as increasingly retailers are dealing directly with manufacturers, thereby removing the intermediary from the supply chain. Given this position, British based suppliers/distributors today can often be the UK distribution arm of an overseas manufacturer/producer. This is particularly the case in the consumer goods sectors, especially in electronics and 'designer' label goods.
Retailers – organisations that sell goods to the general public either purchased direct from a manufacturer/producer or from a supplier. Over the past 10-15 years, the major retail chain stores have seen high growth rates, often at the expense of small locally based outlets. These high growth rates have been driven, among other factors, by their ability to source cheaply from overseas markets, and provide lower priced goods to their customers.
Logistics operators – the organisations who manage and undertake the movement and handling of goods on behalf of the above three organisations. Given the nature of the supply chain, the strategies of the logistics operators have to follow those of the major manufacturers and retailers.
3.3 Whilst the first three types of organisation own the goods they transport, logistics operators just look after the goods while they are being moved and handled on behalf of the other three organisations.

The Economic case for Magna Park
Final Report | October 2015 12
3.4 Over the past few decades, many supply chain innovations have been developed with the aim of reducing the amount of stock needed and hence diminishing the demand for warehouses. These include more agile manufacturing (e.g. small production batches), production postponement (i.e. assembling the goods at the last possible moment), cycle time compression (reducing the need for buffer stock), inventory centralisation (reducing the total amount of stock), virtual warehousing (i.e. treating the stock across a number of warehouses as one), cross-docking (i.e. moving goods directly from the goods-in bay to goods-out without placing into stock), supply chain visibility and information exchange. Despite these processes, across England the built stock of warehouse floorspace has grown, largely driven by the development of large-scale facilities of 10,000 m² and over.
3.5 At least three factors have tended to drive requirements for stockholding and hence demand for warehouse floorspace up:
Economic growth. The real growth in economic activity and particularly retail sales has meant that, in aggregate, even where manufacturers and retailers have succeeded in not growing inventory by as much as output or sales, the total amount of inventory held by manufacturers and retailers is likely to have increased.
Globalisation. The longer lead times involved in serving UK customers from locations such as the Far East result in higher stock levels being required to offer the same service levels in terms of stock availability.
Product ranges. Many companies have offered wider product ranges to customers in order to try to increase market share. These wider product ranges may be in terms of colours, sizes or flavours or more subtle changes such as pack sizes and promotional packs with each distinction giving rise to a ‘Stock Keeping Unit’ (SKU). Again, widening product ranges result in higher stock levels being necessary to provide the same customer service levels.
3.6 More recently the rise and continued growth in e-commerce is acting as a further driver of growth. From a warehouse perspective, e-commerce is normally served from National Fulfilment Centres, ideally near the centre of UK within reach of the main parcel hubs so as to enable late cut-off times to be offered to customers.
Warehousing – Distribution Centres 3.7 Distribution operators organise their supply chain strategies around distribution centre
'hubs'. Different types of warehouse hub have different property requirements and different employment densities.
3.8 There are broadly two types of ‘hub’ organised on either a national level (serving the UK from the one location) or a regional level.
National Distribution Centres
3.9 National Distribution Centres (NDC) act as inventory holding points. This is especially the case with imported goods. Goods are then re-distributed to other stages in the supply chain. They are normally associated with suppliers to the retail industry, particularly importers of electrical goods, beers/wines/spirits and clothing, who require facilities to consolidate goods from a number of origins. Goods can dwell in these locations for

The Economic case for Magna Park
Final Report | October 2015 13
considerable periods of time – especially where they handle seasonal products, or products whose demand is highly seasonal. These goods are imported over a period of time but only distributed for a limited number of days or weeks.
3.10 These warehouses tend to be the large ‘big shed’ type of units commonly found along Motorways in the East Midlands.
3.11 Where operating a single National Distribution Centre the optimal location is normally found to be in an area of the south Midlands known as the Golden Triangle which shown earlier in Figure 2.1. The reasons for this include:
Its central location in relation to the main origins and destinations of cargo in Britain (including the main deep sea container ports). It is possible to round trip to/from most other regions in Britain within a HGV driver's daily driving time restriction (9/10 hours) i.e. from both deep sea ports and to RDCs in other regions.
Its location at the hub of the national motorway network (M1, M6) and increasingly on the West Coast Mainline;
The availability of land which allowed the development of NDCs (planning authorities released B8 land); and
Availability of labour.
Regional Distribution Centres
3.12 Regional Distribution Centres (RDC) are similar to NDCs in that they receive, hold and then re-distribute goods to other stages in the supply chain, normally multiple retail outlets. However there are a number of important differences. They have a regional hinterland e.g. the South East, South West. More importantly their primary role is to consolidate and re-distribute goods in shorter periods of time (sometimes within 24-48 hours), rather than acting as inventory holding locations. Consequently dwell times are much shorter at an RDC.
3.13 RDCs are normally associated with major retailers who are replenishing store shelves overnight. Goods are received at the RDC in 'bulk' and then split into smaller consignments for re-distribution in mixed loads i.e. with other smaller consignments. RDCs are potentially more complicated because they receive inward goods from a larger number of origins, where as a NDC will generally have fewer sources of supply.
3.14 This type of retailer is not so dependent on Motorway access because they serve regional markets – so access to main roads that reach into their service areas are more important.
3.15 Dependent on the areas they serve they can also be more flexible over the type and quality of space they occupy than an NDC. The smaller area the RDC serves the less choice the occupier has over location, and the more flexible they will be.
3.16 Generally, flows of goods along the supply chain will follow one of four patterns:
Domestic manufacturer/Port to Supplier's NDC to Retailer's RDC to retail outlet Domestic manufacturer/Port to Retailer's NDC to Retailer's RDC to retail outlet Domestic manufacturer/Port to Retailer's NDC to retail outlet Domestic manufacturer/Port to Retailer's RDC to retail outlet

The Economic case for Magna Park
Final Report | October 2015 14
3.17 Where possible, distributors transport goods in full HGV sized loads. The ability to hold, consolidate and distribute goods in HGV size loads from one location is the most efficient method of organising supply chains, and this principal will generally dictate the route goods will take along the supply chain. Consequently, flows from NDCs direct to a retail outlet will generally only occur when there is sufficient traffic to fill a full size HGV. Otherwise, goods are shipped from NDCs to RDCs in full HGV sized loads, where they split into smaller consignments for re-distribution in mixed loads of HGV size.
The Value of Logistics to the Economy Value Added
3.18 The UK logistics sector employs over 1.5 million people across some 190,000 companies. Including those who work in logistics occupations in other sectors, such as drivers, the actual size of the sector stands at just over 2.25 million people. This accounts for 8% of the UK’s workforce. The sector is estimated to have turnover of nearly £950 billion and an approximate gross value added (GVA) of £100 billion in 2013.
3.19 The sector has been growing and stable for a long run period. As can be seen from the graph it is more pro-cyclical than other sectors and hence saw a fall during the recession in 2008, but generally GVA in the East Midlands logistics sector has grown at a similar rate to the regional economy as a whole, increasing by between 60-70% over the period 1997-2012. Employment growth in logistics has been far stronger than that in manufacturing.
Figure 3.1GVA Growth in the East Midlands by Selected Sectors (Index 1997=100)
Source: ONS
Logistics as an Employer Labour Composition
3.20 The logistics sector employs people from a wide range of different occupations. Most warehouses and distribution units also accommodate other supporting functions often in attached office units. This reflected in the diverse range of skills, occupations, and
0
20
40
60
80
100
120
140
160
180
200
1997 1999 2001 2003 2005 2007 2009 2011
Manufacturing
Wholesale andretail
Transportationand storage
Total GVA
The Economic case for Magna Park
Final Report | October 2015 15
qualifications that the sector employs. Overall, the workforce is predominantly male (76%); 44% of the workforce is over 45 years old; and 9% is under 25 years old.
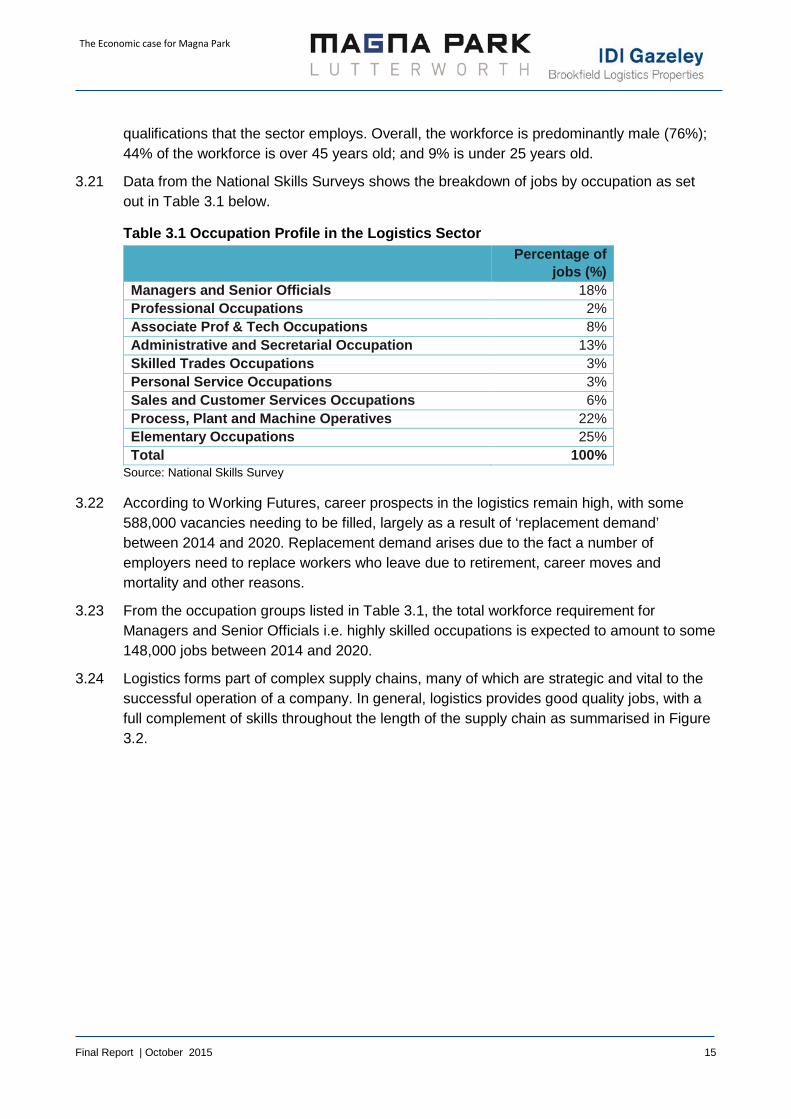
3.21 Data from the National Skills Surveys shows the breakdown of jobs by occupation as set out in Table 3.1 below.
Table 3.1 Occupation Profile in the Logistics Sector Percentage of
jobs (%) Managers and Senior Officials 18% Professional Occupations 2% Associate Prof & Tech Occupations 8% Administrative and Secretarial Occupation 13% Skilled Trades Occupations 3% Personal Service Occupations 3% Sales and Customer Services Occupations 6% Process, Plant and Machine Operatives 22% Elementary Occupations 25% Total 100%
Source: National Skills Survey
3.22 According to Working Futures, career prospects in the logistics remain high, with some 588,000 vacancies needing to be filled, largely as a result of ‘replacement demand’ between 2014 and 2020. Replacement demand arises due to the fact a number of employers need to replace workers who leave due to retirement, career moves and mortality and other reasons.
3.23 From the occupation groups listed in Table 3.1, the total workforce requirement for Managers and Senior Officials i.e. highly skilled occupations is expected to amount to some 148,000 jobs between 2014 and 2020.
3.24 Logistics forms part of complex supply chains, many of which are strategic and vital to the successful operation of a company. In general, logistics provides good quality jobs, with a full complement of skills throughout the length of the supply chain as summarised in Figure 3.2.

The Economic case for Magna Park
Final Report | October 2015 16
Figure 3.2 Careers in Logistics Sector Position Responsibility Managerial Contract manager Profit and loss, driver staff and operational
efficiency Transport manager Organising delivery routing and ensuring
maximising efficiency is achieved within budget Warehouse manager Co-ordinating operations within the warehouse Operations manager Prime responsibility for logistics operation, inc.
staff development, business performance and strategic planning
Freight manager Movement of freight across international borders
Logistics manager Overall management of the supply chain Inventory specialist Ensuring the right stock is available at the right
time Non-managerial
LGV driver (unlikely to ever have two days the same) LGV instructor Ensuring that potential LGV drivers achieve the
required proficiency level LGV technician Maintaining an organisations’ fleet of vehicles Warehouse operator Part of a team responsible for handling goods
through from receipt to dispatch Fork-lift truck operator Safe transportation of goods around warehouse Courier Ensuring expedient delivery of urgent packages Transport clerk Day to day responsibility for administration of
the transportation operation Customer services assistant Representing an organisation to its customers Removals porter Working with a small team helping people to
relocate Packers Responsible for ensuring products are
contained within suitable packaging to provide protection during transit
Source: Skills for Logistics Council
Diversity of Skills
3.25 The proportion of the workforce employed in distribution having no qualifications or who are qualified at less than NVQ level 2 standard is greater than the rest of the UK economy. However, this is balanced out in other higher skilled areas and is partly reflective of the ageing workforce in logistics. Recruitment drives and attraction of ‘new blood’ however are increasing at an accelerating rate as the image of the industry improves and its growing importance to the economy is realised.
3.26 Typically, logistics property provides better quality jobs than light industrial space. Research undertaken by Prologis in 32 warehouses employing nearly 6,000 people found only 5% were unskilled. It must be noted, that large distribution warehouses invariably incorporate a proportion of office space integral to the operations of the warehouse and thus increasing the proportion of managerial, professional and administration occupations. Many distribution locations therefore see the occupation of relatively large office space, which

The Economic case for Magna Park
Final Report | October 2015 17
would not generally be the case in the local market if the offices were not connected to the distribution function.
3.27 The value of warehousing and logistics employment is often overlooked primarily because many of the jobs offered are perceived as being in low skilled occupations. However the perception is not supported by the facts, and the skills demands of the sector continue to rise. In 2010 research of warehousing businesses showed that the occupational structure within warehouses continues to move towards more skilled occupations: there is a growing proportion of staff employed in administrative, managerial and ‘other’ occupations which primarily includes IT, customer service, sales and engineering staff. On the other hand the proportion of staff who work on the warehouse floor is declining. The industry is building stronger linkages with academies, further education colleges and universities, encouraging progression to relatively higher skilled level occupations, to meet rising skills requirements compared to traditional warehouse floor employment.
Earnings Profile
3.28 Average earnings in the logistics sectors are above the national average and are rising. Data from the Annual Survey of Hours and Earnings (ASHE) show that median average gross wages in the transport and storage sector (which largely consists of logistics industries) are £494 per week which above the national average of £415 per week2.
3.29 Improvements in profitability and a shift towards higher value occupations in the sector are resulting in an up-lift in wages.
3.30 Research undertaken by GVA Grimley in conjunction with Cranfield University in 2007 indicated that wages in distribution organisations were, on average, between 10% and 17% higher than in the manufacturing sector.
3.31 More recent evidence from ASHE (2013) suggests that the pay differential remains significant between occupations in manufacturing and distribution sectors. For instance, the average gross pay in the manufacturing sector of £510 per week is around 10% lower than the average pay in transport and logistics sectors.
3.32 According to the 2013 Skills for Logistics survey, about half of the employers in the sector are reporting an improvement in profitability, productivity and turnover compared to 2012. Optimism amongst employers is high and many employers see the industry and their organisation growing in the near future. Employers also feel they will remain competitive and attract a diverse workforce.
Employment
3.33 In addition to providing a range of employment opportunities, many of which are better paid than the average, the sector has also been a source of jobs growth. Employment in the logistics sector has run at or above growth in the economy as a whole. For some parts of
2 ASHE 2013

The Economic case for Magna Park
Final Report | October 2015 18
the country this has been an important source of replacement employment as it traditional manufacturing base has declined.
3.34 Forecasts from the East of England Forecasting Model (EEFM)3 show that, for the East Midlands in particular, as well as employment in the logistics sector growing at a faster rate than the whole economic in the past it is also predicted to grow at a faster rate in the future.
Figure 3.3 Employment Growth in the East Midlands Logistics Sector
Source EEFM 2014
Location Requirements 3.35 Location is vital to successful distribution warehouses as it is sensitive to the source and
destination of goods, i.e. access to markets. Accessibility is the most important consideration when choosing a location primarily in terms of:
Being close to motorway junctions Proximity to a large labour pool. Responding to the needs of a demanding and sophisticated client base Providing users with reliability and flexibility with their product.
The Golden Triangle is the Optimal Location
3.36 The “Golden Triangle” provides the optimal location for single NDCs given its proximity to the transport network, customers, ports, and labour supply.
3.37 The location benefits from ease of access to major road networks, M1, M40, M45 M6, A14 (A1-M1 Link), A43 and A45; five international airports within one hour’s drive; efficient and fast passenger and freight rail links (Daventry International Freight Terminal (DIRFT) and
3 East of England Forecasting Model prepared by Oxford Economics
13.8%
8.3%
18.0%
11.1%
0%
2%
4%
6%
8%
10%
12%
14%
16%
18%
20%
1991-2011 2011-2031
All Employment
Wholesale & LandTransport

The Economic case for Magna Park
Final Report | October 2015 19
Birch Coppice); major ports of Felixstowe, Harwich, Dover, Folkestone and Southampton within 3 hours drive.
3.38 In addition over 80% of the UK’s population are within 4 hours’ drive time. The HGV catchment map of the Golden Triangle is illustrated in Figure 3.4. The Golden Triangle is a location which has attracted logistics sector employers due to the ease of motorway access, which allows 45.8 million people to be reached within a 4.5 hour drive – the maximum EU permitted uninterrupted HGV drive time.
Figure 3.4 Magna Park HGV Catchment
Source: Jones Lang Lasalle, 2008, Industrial Labour Market Analysis Report, G. Park Lutterworth
3.39 The Golden Triangle also represents one of the most densely populated and fastest growing sub regions in the UK. Given the good connectivity of the Golden Triangle, there is a large labour market within the businesses’ catchment area. In total there are 295,900 economically active people residing within a 30 minute catchment area and 1.01 million within 45 minutes.
3.40 The immediate area has a higher economic activity rate than average: 74% within 20 minutes and 72% within 30 minutes. This falls to the England average of 70% within the 45 minute drive time area. A higher than average economic activity rate is a good sign of a
The Economic case for Magna Park
Final Report | October 2015 20
healthy labour market. The proportion of people who are unemployed as a percentage of the economically active population is 5% within 20 minutes’ drive of Magna Park and 6% within 30 minutes and 45 minutes’ drive.
Key Issues Land
3.41 A report by Lambert Smith Hampton (LSH) on the industrial and logistics sectors4 showed that there is continuing demand for large A grade space, despite the recent economic downturn. While, overall take-up in the UK industrial and logistics market fell by 25% in 2012 compared to the previous year, occupiers continued to target Grade A stock. Take-up of Grade A stock increased by 11% compared to the previous year. The main reason behind the reduced levels of availability has been the dwindling supply of Grade A stock and the lack of new development.
3.42 The lack of development, which stretches back to 2007/9, has exacerbated the shortage of Grade A space. Figures from LSH show that Grade A space now represents less than 10% of available supply in 2014. The quantity of new built premises across the market as a whole represents less than four months’ supply.
3.43 The majority of take-up has been focussed on the secondary market as the lack of Grade A stock has pushed occupiers to look elsewhere. These factors have led to improving conditions for landlords with standard lease terms lengthening and the gap between primary and secondary rents narrowing.
3.44 Rental growth is most apparent in the Midlands, as a result of buoyant demand and dwindling supply, which fell by a fifth in the region during the course of 2013. Within the Golden Triangle, warehouses in Harborough District had the highest rateable values per sq m in the East Midlands (£46 per sq m) compared to regional average of £35 per sq m.
3.45 The rateable values reflect the pressure on the stock and the locational attributes of the Golden Triangle: access to customer and suppliers’ ability to access the majority of England and Wales within a HGV driver’s working day with a wide area capable of being served even with late cut off times; and availability of premises.
3.46 As market confidence continues to grow LSH predicted that there is sufficient demand for 2014 take-up to exceed the record 101m sq ft posted in 2010.
Labour and Skills
3.47 The logistics sector is undergoing a lot of change driven by technological advances, consumer demand and environmental factors. As the sector continues to expand having the right skills and training in place to up-skill existing staff, as well as recruiting highly skilled staff, becomes increasingly important.
3.48 Access to workers is a vital element of the operation of any business. It is not only important that there is a large labour market within the businesses’ catchment area; it is
4 Industrial & Logistics Market 2014 – Lambert Smith Hampton

The Economic case for Magna Park
Final Report | October 2015 21
also important that the workers are suited and qualified for the jobs on offer at an appropriate cost to the firm.
3.49 According to Working Futures5, career prospects in the logistics sector remain high, with some 588,000 vacancies needing to be filled, largely as a result of “replacement demand”, between 2014 and 2020. In addition to replacement demand and the increasing need for professional and managerial workers, evidence from the LEPs’ Skills Needs Assessments found that there is a shortage of logistics planning workers with the necessary technical, practical and IT skills. A report by SEMLEP noted the sector struggles to recruit specific occupations and talent pools6.
3.50 A shortage of young people is a long-standing challenge that the sector needs to overcome to meet the replacement demand, estimated to be some 820,000 jobs, nationally by 2020. Graduates in the transport and logistics industry typically need to be analytical with good IT skills and have the ability to work in teams and deal with pressure and develop skills in management.
3.51 The 2013 Skills for Logistics Employer Survey noted 59% of employers stating that a lack of time to train staff was the main factor contributing to the need for an improvement in skills requirements and an expansion in recruitment.
3.52 The CWLEP SEP also notes that skills gaps are highest in the logistics sector amongst professionals in sales and customer services, as a whole. Therefore efforts need to be made to enhance the skills and employment base of the labour force – a key stated aim within the vision of Coventry and Warwickshire LEP.
3.53 The SEMLEP Skills Strategy outlines a number of interventions to address the skills gap and resolve discrepancies between supply and demand in the labour market. This includes the SMELEP Apprenticeship Plan to increase the volume of apprenticeships and engagement with small and medium enterprises (SMEs).
3.54 Other interventions in the SEMLEP Skills Strategy include: increased provision of training in areas with low levels of attainment; sharing a campus with University and Technical College (UTC); and providing a range of progression routes up to NVQ Level 3. These will help remove barriers to labour market participation in a number of groups for which employment rates are lower than the average for the region. These include young people, older people, ethnic minority women and people with special needs.
3.55 The issue of skills shortages is particularly relevant for locations such as MPL given the occupier profile at the site. Therefore it is a location where there is significant demand for relatively high value and skilled logistics workers compared to the average requirements in the industry.
3.56 There are some concerns within the logistics sectors about growing skills gaps, a trend that contrast with the national average7. The main skills gaps are reported to be technical or
5 Working Futures, 2014, “Working Futures”, UK Commission for Employment and Skills 6 Logistics Report 2013 – Skills for Logistics/SEMLEP 7 UKCES (2014)

The Economic case for Magna Park
Final Report | October 2015 22
practical or job specific skills, with planning and organisation skills, customer handling skills, problem solving skills and communication skills also reported to be lacking.
3.57 Some of the recruitment issues tend to be cyclical in nature but other are fairly long standing, such as a shortage of LGV drivers. There have also been long standing concerns over the ability to attract young people into the sector which has been highlighted both by the Freight Transport Association and also Skills for Logistics.
Image of the Logistics Sector
3.58 Closely linked to the availability of land and labour, the image of the logistics sector and warehousing development in general is also a key issue that needs to be overcome in order for the sector reach its growth potential.
3.59 There is a common misconception that the logistics industry only provides poorly skilled, low wage employment with few opportunities to develop a successful career path. The shortage of recruits in the logistics sector is well documented. One major reason for the shortage of labour is the poor image projected by the industry, as outlined in the Skills for Logistics publication; Right Skills, Right Place, Right Time (2006).
3.60 Yet as a recent book on the global logistics industry noted, “Logistics professions span a range of skill levels and specialities, including equipment operators and mechanics, inventory managers, supply chain managers, information systems professionals and distribution executives. To supplement workforce recruitment and on-the-job training many logistics clusters attract, develop, or partner with educational institutions for vocational, undergraduate, postgraduate and professional education.”8
3.61 Employers have stressed the need for effective engagement at a local level to reach out into schools, colleges and communities to strengthen the sector’s image and attract and develop new talent.
3.62 Skills for Logistics noted that local perspective is vitally important for the sector particularly in hotspots such as MPL. Employers need to be able to attract and recruit new talent and have access to high quality training to develop their existing workforce.
3.63 These issues are apparent in the sector internationally with more developed economies facing similar challenges. Evidence from the LEPs suggests that a lot of training and development is required to increase the attractiveness of the sector; address skills shortages; retain the experience and expertise of existing staff; and attract a relatively younger workforce into the sector to replace the older employees when they retire.
3.64 PwC’s Delphi Study9 suggested that logistics businesses should in particular look to improve their employer branding and build ‘recruiting alliances’ with peers (in the case of SMEs). It also advocated the increased use of social networking as a recruitment tool, which is supported evidence from the UK Commission for Skills and Employment (UKCES)
8 Logistics Clusters: Delivering Value and Driving Growth (page 209) – Yossi Sheffi (2012) 9 The Logistics Report 2013 – Freight Transport Association/PwC

The Economic case for Magna Park
Final Report | October 2015 23
findings that vacancies in logistics, especially in smaller firms are often filled by ‘word of mouth’.
Trends in Warehouse Supply 3.65 Published data on warehouse floorspace from the Valuation Office Agency (VOA) is not
available beyond 2008, but the pattern in the ten years preceding that date gives a very clear indication of the trends. Over the period 1998-2008 all regions of the country saw an increase in warehouse floorspace with the biggest increases being in the East Midlands where the total stock increased by 247,000 sq m or 30%.
Figure 3.5 Warehouse Floorpsace Stock by Region 1998 and 2008
Source: VOA Floorspace Statistics
3.66 Over this period the average size of warehouse changed. Again this was most marked in the Midlands, which saw the average size of warehouse units increase by more than 35% over this period.
0
200
400
600
800
1,000
1,200
1998
2008

The Economic case for Magna Park
Final Report | October 2015 24
Figure 3.6 Change in Average size of Warehouse units 1998-2008
Source: VOA Floorspace Statistics
3.67 These implications of these trends are addressed in more detail in Chapter 5 but there is a clear concentration of scale and location which in turn is leading to the development of logistics clusters.
0%
5%
10%
15%
20%
25%
30%
35%
40%
EastMidlands
WestMidlands
East ofEngland
SouthWest
SouthEast
Yorkshireand TheHumber
NorthEast
NorthWest
London
The Economic case for Magna Park
Final Report | October 2015 25
4 DEMAND FOR LOGISTICS Forecast Growth
4.1 This chapter sets out forecasts of future demand for warehouse floorspace. The geography we are concerned with is potential market demand for Magna Park Lutterworth. Hence the forecasts examine demand within this broad market area including the Midlands generally, East Midlands specifically, the area referred to as the Golden Triangle and also the more specific Leicestershire context.
4.2 We first review the results and method presented in the recently published Leicester and Leicestershire Strategic Distribution Study (SDS).
4.3 We stress (as do the authors of the SDS) that forecasting of this nature is not an exact science. Thus the results are subject to a wide degree of uncertainty both in terms of the method and also the input variables and assumptions that go in to any forecast.
4.4 We therefore next present alternative projections using different forecasting methods and also undertake some sensitivity testing around the principal assumptions of the SDS report.
Leicester and Leicestershire Strategic Distribution Study (SDS) Method
4.5 The SDS was undertaken by MDS Transmodal and Savills on behalf of the Leicester & Leicestershire Housing Planning & Infrastructure Group in 2014 and was published by HDC in early 2015. The study objectives were to provide a better understanding of the logistics sector and to objectively determine future need. It is that latter element of the study we are particularly concerned with here: the study’s projections of the future need in the county and the East Midlands region for large scale warehousing space (>9,000 sq m) and the division of that need into warehousing floorspace on rail-served and warehousing floorspace on road-connected only sites.
4.6 The forecasting method used in the SDS is relatively straightforward conceptually in that it has two components. It seeks to forecast total new warehouse demand, which the report appears to define as gross completions of new stock, by:
calculating what is required to replace existing obsolete stock (“replacement demand”); and
adding what is required to accommodate forecast growth in net additional freight traffic (“growth demand”).
4.7 We summarise briefly the approach to each of these two components.
Replacement Demand
4.8 The forecasts in the report are for large warehouses which are defined as those over 9,000 sq m. MDS calculate the existing stock of large warehouses (> 9,000 sq m) from VOA data using a database that MDS have compiled from individual records.
4.9 The SDS assumes that the existing stock of large scale warehouse floorspace is replaced over a 30 year lifecycle. The authors consider 30 years the time over which the stock
The Economic case for Magna Park
Final Report | October 2015 26
becomes obsolescent. They therefore assume that 22/30 (73%) of the stock will need replacing over the period 2014-36 and thus the implicit assumption is that the age profile of the existing stock is evenly distributed.
4.10 The replacement demand is implicitly calculated for both rail served and non-rail served sites. Whilst for non-rail served sites this process is probably picking up consolidation of activity into new and larger units, the process of replacement demand at rail served sites would seem to imply a process of in-situ redevelopment.
4.11 To produce a forecast for Leicestershire the replacement demand is calculated holding constant the county’s share of the East Midlands stock of large scale warehouse floorspace at its current level (27.9%). We look further at the spatial distribution of demand later in this chapter.
Growth Demand
4.12 The growth component comes from the MDS freight model whereby they calculate growth in the number of freight tonnes lifted of a specified group of commodities that are likely to go to national distribution centres. The forecasts are prepared for both road freight and rail freight. It is assumed that 45% of road freight to the East Midlands goes to a large warehouse (in line with current rates) and that 100% of rail freight has a large warehouse destination.
4.13 The key assumptions for the growth element of the projection in terms of land demand are the conversion from tonnes of freight to floorspace (with the land requirement derived as second step following the projection of the floorspace requirement). MDS assume:
0.8 tonnes per pallet; 1.5 pallets per sq m of floorspace; 18 stock turns per annum; 85% floor space utilisation;
4.14 Estimates of Land required are then derived from the floorspace projections by application of a 40% plot ratio.
4.15 The assumptions to derive floorspace demand imply a significant increase in the efficiency with which logistics occupiers use warehouse space since the date of the 2006 SDS study, also produced by MDS Transmodal, when the assumptions were:
0.6 tonnes of goods per 1 pallet 1 pallet per square metre of floorspace 12 stock turns per annum (i.e. mean dwell time of 4 weeks) The amount of cargo in storage at any one time will occupy 85% of the floor space
available (over-flow allowance to handle additional cargo in peak times)
4.16 Efficiency gains of this scale will result in quite substantial reductions in forecast growth in warehouse floorspace, other things being equal.

The Economic case for Magna Park
Final Report | October 2015 27
Comparison with Past Change
4.17 For the East Midlands over the period 2014-36 the SDS calculated a gross requirements for new development of large warehouses of 7,286,000 sq m consisting of 5,881,000 sq m of replacement demand and 1,405,000 sq m of ‘growth build’. The projection implies that gross new completions of large warehouses will grow at an average of 331,000 sq m p.a.
4.18 Over the period 1998-2008 the stock of warehouse floorspace in the East Midlands increased by 4,923,000 sq m an average of 492,000 sq m p.a . This figure is not directly comparable to the one produced in the SDS. 492,000 is net change in all stock. The SDS figure is for gross new completions and only for warehouses of greater than 9,000 sq m. Nevertheless it helps to place it in context. Whilst not unreasonable, the SDS forecast might appear a bit on the low side compared to historic change, if we think that most of the growth in stock is in larger units. It is, however, a higher figure than the 2006 study, despite the efficiency gains factored in compared to the earlier forecast.
4.19 The 2006 study calculated gross new build from Savills completions data of warehouses larger than 10,000 sq m and estimated an average of 244,000 sq m p.a. for the East Midlands. (In 2006 the MDS growth component of 1,044,000 sq m over twenty years was deducted from this total with the residual being replacement demand).
4.20 The table below compares the forecasts for the East Midlands from the two studies. The annual forecast rate of growth for both the Replacement and Growth components of the forecast are higher in the 2014 study than they were in the 2006 study. Despite a deep recession between the two studies and an overall economic outlook that is less optimistic, the prospects for the logistics industry in the East Midlands appear to be strengthening.
Table 4.1 Forecast Floorspace Growth from the 2006 and 2014 SDS studies 2006 2014 2006 2014 East Midlands 2007-26 2014-36 avg p.a. avg p.a. Replacement 3,844,000 5,881,000 192,200 267,318 Growth 1,044,000 1,405,000 52,200 63,864 Total 4,888,000 7,286,000 244,400 331,182
Source: Leicester and Leicestershire Strategic Distribution Study, 2006 and 2014
Rail Served v Non Rail Served
4.21 The SDS report also splits demand in to two types: demand for rail-served sites and demand for non-rail served sites.
4.22 The share of gross new demand accounted for by rail-served sites is assumed to increase very substantially from its current levels. The SDS assumes that 58% of demand in the future will be for rail-served sites. 58% is the proportion of East Midlands stock of large warehouses (i.e. of those greater than 9,000 sq m) currently in units of greater than 25,000 sq m. Although the SDS argues that there will be an increasing demand for rail-served demand, it is not clear why this particular ratio should then be used as the figure for forecasting rail-served demand.

The Economic case for Magna Park
Final Report | October 2015 28
4.23 This provides a projection for both rail served and for non-rail served warehouse floorspace and land as summarised in the table below.
4.24 The corresponding land requirement is then derived on the basis of an assumed 40% plot ratio for the floorspace (e.g., a 25,000 sq m floorspace requirement would yield a land need of 6.25 ha. 40% is a fairly standard assumption as a plot ratio but should be applied only to the developable land for warehousing.)
Table 4.2 Gross new Warehouse Floorspace Demand 2013-36 000 sq m of gross floorspace 2013-31 2013-36 Leicestershire Total 1,445 1,886 Rail Served @ existing share 94 123 Rail Served @ 58% 838 1,094 East Midlands Total 5,570 7,286 Rail Served @ existing share 362 474 Rail Served @ 58% 3,231 4,226
Source: SDS
Sensitivity Tests 4.25 The forecasts set out in the SDS report cannot be seen as a definitive answer to the future
demand for warehousing floorspace in the East Midlands and Leicestershire. There is too much uncertainty. To try and understand the forecasts in context we have undertaken some sensitivity analysis around two themes:
Alternative approaches to forecasting Sensitivity tests around some of the assumptions
Alternative Forecasts
Method I: GVA Growth
4.26 This approach is based on the relationship between floorspace demand and Gross Value Added (GVA). Generally these variables are positively correlated in the long-run.
4.27 Over the period 1998-2008 UK GVA grew by an average of 2.7% p.a. Over this period the Midlands share of total warehouse increased by an average of 0.5% p.a., indicating the Midlands as the preferred location for warehouse activity. Despite East Midlands GVA only growing by 2.1% p.a. over this period its warehouse stock grew at a rate of 3.2% p.a. The positon was similar for the West Midlands. Growth in warehouse stock relates to national GVA. Based on a long-run UK growth rate of 2.5% per annum maintaining this relationship we might expect warehouse stock in the East Midlands to grow at an average of 3.0% per

The Economic case for Magna Park
Final Report | October 2015 29
annum. On this basis we would predict growth of around 12.7m sq m of warehouse floorspace for the period 2013-31, or an average of 706,000 sq m per annum10.
4.28 Assuming Leicestershire grows at a similar rate to the East Midlands as a whole then its warehouse stock would increase by 3.2m sq m over the period to 2013 or an average of 176,000 sq m per annum.
Method II: Employment Based Forecasts
4.29 This method uses projections of employment by sector for each of the geographic area, predicting the outturn for growth in the industry sectors engaged in warehousing activities based on the latest economic forecasts up to 2031. It is similar in principle to the approach employed in the previous Harborough Employment Land studies
4.30 Using forecast prepared by Experian we calculated forecast employment growth in the Transport and Warehouse sectors to 2031. This is multiplied by the density of B8 (Warehousing) Employment Space of about 80 sq m per worker to give an indication of the warehouse space required to support the outturn for employment.
4.31 This produces an estimate of an annual average of 214,000 sq m of floorspace for the East Midlands and 37,500 sq m for Leicestershire.
Method III: VOA Total Floorspace Estimates
4.32 The third method is to look at net change in warehouse floorspace stock. An alternative would be to look at completions data but we do not have this data series.
4.33 Over the period 1998-2008 total warehouse stock for the East Midlands as a whole grew at an annual average of 492,500 sq m and for Leicestershire it grew at an annual average of 130,200 sq m.
4.34 For the districts that form the Golden Triangle Districts this period saw an increase in warehouse floorspace at an annual average of 235,000 sq m and for Harborough District alone of 53,000 sq m.
4.35 The table below summarises the implications of these projections in terms of land requirements across a range of plot ratio assumptions.
Table 4.3 Annual Average Change in Floorspace (1998-2008) Floorspace Land (ha)
(sq m) 0.35 0.4 0.45 East Midlands 492,500 141 123 109 Golden Triangle 235,000 67 59 52 Leicestershire 130,200 37 33 29 Harborough 53,000 15 13 12
Source: VOA
10 Based on 2008 stock figures

The Economic case for Magna Park
Final Report | October 2015 30
Comparison of Forecasts 4.36 We set out below a comparison of the alternative approaches with the SDS forecasts,
although the two approaches are not quite aligned as the SDS forecasts are for large warehouses of greater than 9,000 sq m and are forecasts of gross completions of floorspace rather than net additions to stock.
4.37 Using data from the 2008 VOA floorspace statistics and the MDS estimates set out in the SDS report it suggests around half of the total floorspace stock is made up of large warehouses. Even allowing for some increase in total stock over the period 2008-13, the ‘large warehouses’ can be assumed to account for between 40%-50% of total stock.
Table 4.4 Large Warehouses as proportion of Total Stock Total Stock >9000 sq m 2008 2013 Leicestershire 4,550,000 2,250,000 49.5% East Midlands 18,086,000 8,056,000 44.5%
4.38 Given the trend to increasing warehouse size this would suggest the large units will form a rising proportion of total stock over the forecast period.
4.39 If the majority of the demand is replacement demand this implies it is replacing existing stock. We assume this is sq m for sq m even if the process involves consolidation into larger stock – e.g. that a new 10,000 sq m unit would replace, say, four obsolete 2,500 sq m units. Hence only the growth element represents net additions to stock. This would imply a net addition to stock for the East Midlands of 63,900 sq m p.a. over the period 2014-36. This compares with an average net annual addition to stock for the East Midlands over the period 1998-2008 of 492,500. If only half of this stock is in units of greater than 9,000 sq m that would still imply an annual increase in stock of 246,000 sq m p.a.
4.40 For Leicestershire warehouse floorspace stock grew at an average of 130,200 sq m p.a over the period 1998-2008. Again if we assume that large warehouses account for 50% of the stock, then this implies an average of 65,000 sq m p.a. for Leicestershire.
4.41 The gap between the SDS growth forecasts and past change estimates is so great we can only assume that the replacement demand includes some element of higher efficiency in space utilisation. That is, in our example when the 10,000 sq m units replaces the 4 x 2,500 sq m units, it would imply that some of those 2,500 sq m units are not replaced but remain in use and hence “replacement demand” does entail some net addition to stock.
4.42 A comparison of the SDS forecast and our forecast on a like for like basis is set out in the Table below. The GVA method and the SDS Total produce results which are very similar for both East Midlands and Leicestershire.
The Economic case for Magna Park
Final Report | October 2015 31
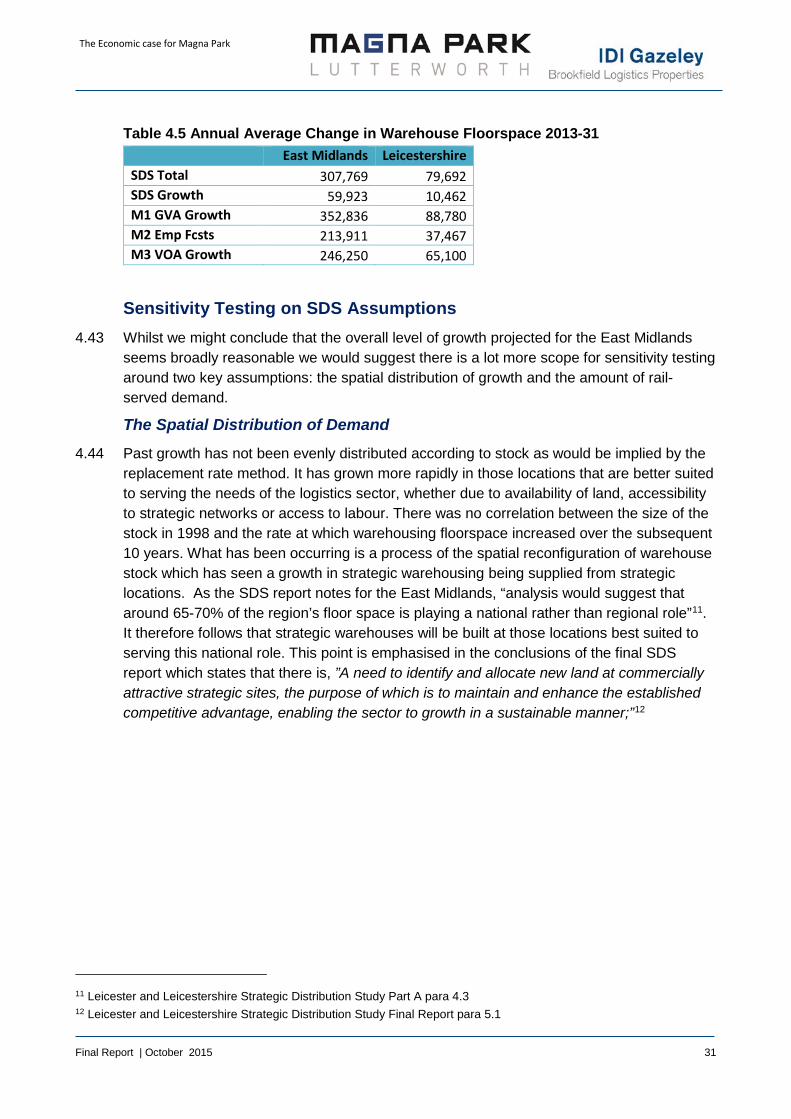
Table 4.5 Annual Average Change in Warehouse Floorspace 2013-31 East Midlands Leicestershire SDS Total 307,769 79,692 SDS Growth 59,923 10,462 M1 GVA Growth 352,836 88,780 M2 Emp Fcsts 213,911 37,467 M3 VOA Growth 246,250 65,100
Sensitivity Testing on SDS Assumptions 4.43 Whilst we might conclude that the overall level of growth projected for the East Midlands
seems broadly reasonable we would suggest there is a lot more scope for sensitivity testing around two key assumptions: the spatial distribution of growth and the amount of rail-served demand.
The Spatial Distribution of Demand
4.44 Past growth has not been evenly distributed according to stock as would be implied by the replacement rate method. It has grown more rapidly in those locations that are better suited to serving the needs of the logistics sector, whether due to availability of land, accessibility to strategic networks or access to labour. There was no correlation between the size of the stock in 1998 and the rate at which warehousing floorspace increased over the subsequent 10 years. What has been occurring is a process of the spatial reconfiguration of warehouse stock which has seen a growth in strategic warehousing being supplied from strategic locations. As the SDS report notes for the East Midlands, “analysis would suggest that around 65-70% of the region’s floor space is playing a national rather than regional role”11. It therefore follows that strategic warehouses will be built at those locations best suited to serving this national role. This point is emphasised in the conclusions of the final SDS report which states that there is, ”A need to identify and allocate new land at commercially attractive strategic sites, the purpose of which is to maintain and enhance the established competitive advantage, enabling the sector to growth in a sustainable manner;”12
11 Leicester and Leicestershire Strategic Distribution Study Part A para 4.3 12 Leicester and Leicestershire Strategic Distribution Study Final Report para 5.1

The Economic case for Magna Park
Final Report | October 2015 32
Figure 4.1 Percentage change in warehouse floorspace stock 1998—2008 (y-axis) and Warehouse floorspace stock at 1998 (x-axis)
Source: VOA Floorspace Statistics
4.45 In the period 1998-2008 Harborough saw the second largest increase in warehouse space of any Midlands district. Only Birmingham had a higher absolute increase and Birmingham started with a stock more than five times greater than that of Harborough.
Figure 4.2 Annual Average Increase in Warehouse Floorspace 1998-2008 (‘000 sq m) Midlands LAs
Source: VOA Floorspace Statistics
Rail Served and Non-Rail Served Demand
4.46 We noted above how the SDS forecast of the amount of rail served demand appeared to be based on a fairly arbitrary assumption. Whilst we would expect an increase in demand for rail served sites amongst larger warehouse users, there is no evidence supporting the figure chosen by the SDS study. It would certainly represent a substantial change from the
-50%
0%
50%
100%
150%
200%
250%
0 500 1000 1500 2000 2500 3000
0 10 20 30 40 50 60 70 80
BirminghamHarborough
North WarwickshireDaventryCoventry
NorthamptonSandwell
East StaffordshireBassetlaw
North West LeicestershireNewcastle-under-Lyme
CorbyStoke-on-Trent
KetteringLichfield
Telford and Wrekin

The Economic case for Magna Park
Final Report | October 2015 33
current share of rail-served warehousing and the factors encouraging rail-served demand have been in place for some years now.
Table 4.6 Assumed Growth in Rail Served Demand
Current Assumed Leicestershire Total 1,886 1,886 Rail Served 123 1,094 East Midlands Total 7,286 7,286 Rail Served 474 4,226
4.47 The road only demand is then a residual calculation after 58% of the total has been allocated to rail served sites.
4.48 We are not sure what proportion of new large scale warehouse demand is likely to require rail served sites but broadly there will be three categories of occupier:
those for whom it is highly desirable; those who have a proportion of their activity on rail and hence need to be able to access
rail; and those who do not use rail as part of their activity.
4.49 There may also be a category of warehouse occupiers who are seeking to future-proof their portfolio in that whilst they may not have need for rail-served warehousing at present they may have some requirement for it in the future.
4.50 There is no definitive evidence to answer this question, but we think that a rail-served proportion as high as 58% of future demand is likely to be difficult to substantiate
Conclusion 4.51 The Leicester and Leicestershire Strategic Distribution Study forecast growth of 5.6m sq m
of warehouse floorspace for the East Midlands over the period 2014-31 and 7.3m sq m for the period 2014-36.
4.52 There are relatively robust methods for calculating the total growth in new or additional warehousing demand at national and broad regional levels. Albeit these will be subject to a degree of sensitivity around the final forecast total or phasing.
4.53 What is more problematic is forecasting at lower spatial scales as this depends on the relative attractiveness of individual sites and factors which can change, or be changed, over time.
4.54 Equally there is no particularly robust method for predicting the total volume or proportion of rail-served demand.

The Economic case for Magna Park
Final Report | October 2015 34
5 ANALYSIS OF COMPETING SUPPLY Introduction
5.1 This section draws on the separate Property Market Assessment prepared by Gerald Eve that analyses potentially competing supply to MPL.
5.2 Magna Park Lutterworth is providing a particular product. As we have seen in the preceding analysis the logistics sector has developed two very strong developmental characteristics in recent years:
a move to larger units; and a geographical concentration on the Golden Triangle.
5.3 These are characteristics that enable the logistics sector to operate in the most optimal way. This efficient operation is good not only for the logistics sector itself, but also for the manufacturing and other sectors that are its customers. To the extent that it minimises trips it is also beneficial in wider public welfare terms as it reduces CO2 emissions.
5.4 The Gerald Eve report is contained in Appendix 1, from which the Executive Summary is reproduced below
Gerald Eve Analysis of Competing Supply Logistics property market conditions
5.5 Demand for logistics floorspace is currently strong and at 34% nationally over the last decade, take-up of units of 23,225 sq m or more accounts for a significant proportion of occupier demand
5.6 Units of 23,225 sq m or more are in demand in the East Midlands more so than any other region in the country, both in terms of proportion of total take-up and also by total volume. Therefore units of 23,225 sq m or more are more important to occupiers demanding space in the East Midlands than in other parts of the country
5.7 However, the development supply of distribution warehouses has fallen since 2008, both nationally and in the East Midlands, particularly that space developed speculatively. As well as for total floorspace, this is also the case for units of 23,225 sq m or more.
5.8 The East Midlands has seen one of the highest proportions of development – 59% – accounted for by units of 23,225 sq m or more and– at 1.5 million sq m – the East Midlands has seen the highest volume of floorspace as units of 23,225 sq m or more completed over the past ten years of all regions
5.9 For both the country and the East Midlands, there has been little space delivered to the market as units of 23,225 sq m or more in the past six years, particularly speculatively.
5.10 This has meant a significant constraint on available supply. For all sizes of units, there is just 1.5 years of available supply and for the East Midlands, just 1.1 years. For units of 23,225 sq m or more, there is just 1.1 years available nationally and only 0.7 years available in the East Midlands.

The Economic case for Magna Park
Final Report | October 2015 35
5.11 Therefore whilst the East Midlands has been shown to be a favoured location for occupiers for units of 23,225 sq m or more for which take-up has been strong, there has been little new development in the past six years and as a result, available supply of large units is highly constrained.
Drivers of occupier locational choice
5.12 The key drivers of locational choice for large-scale logistics operators are:
Transport accessibility Labour market conditions Clusters of large logistics units
5.13 Transport accessibility is particularly important given the cost of transport as a part of operations and therefore locations with good transport accessibility are considered superior to those with poorer accessibility
5.14 With regard to modes of transport considered, the East Midlands locations score well in terms of road accessibility (as measured by the proportion of the population of Great Britain that can be reached within a national and regional distribution drivetime) and rail accessibility (as measured by the distance to the nearest rail freight interchange and the quality of the link road to that interchange).
5.15 Labour market conditions are also an important driver of occupier locational choice as the requirements for operations within large-scale logistics warehouses are typically labour-intensive and given the size of the buildings, require large labour forces.
5.16 With regard to labour market indicators considered, a number of the East Midlands locations score below-average scores particularly with regard to the potential size of the appropriate labour pool (based on the number of resident economically-active people of working age within a 30-minute drivetime around each point), the availability of labour (based on the unemployment rate within a 30-minute drivetime around each point) and wage rates for five logistics jobs (based on the comparison of current wages to a large-sample average)
5.17 Occupiers of large-scale distribution warehouses can also be driven to locate in areas with close proximity to other large-scale logistics operators as a result of the potential efficiencies achievable by being co-located with similar businesses or with suppliers or customers.
Identification and assessment of appropriate competing sites
5.18 There are 150 sites within an appropriate distance (50-mile radius) around Magna Park Lutterworth that have standing property or have development land capable of accommodating at least one unit of 23,225 sqm or more.
5.19 Of these 150 sites, only 26 have standing units or land to accommodate potential units to create a cluster of at least four units of 23,225 sqm or more. These 26 sites are categorised as follows:

The Economic case for Magna Park
Final Report | October 2015 36
Nine are sites where no standing stock currently exists and the development land available has capacity to accommodate at least four units of 23,225 sq m or more
Two are schemes where there are currently four or more units of 23,225 sq m but there is no further development available capable of delivering any further units of 23,225 sq m or more
15 are sites where there are existing units of 23,225 sqm or more and there is development land capable of accommodating more of these units and the total of the existing and future potential stock total four or more units of 23,225 sq m or more. Of these 15 sites, there are: ▫ Six schemes where there are currently fewer than four units of 23,225 sq m or more
but there is development land available to deliver more of these units to take the sites over the four-unit threshold
▫ Nine schemes where there are currently four or more units of 23,225 sq m and development land available to accommodate further units of this size
5.20 Our assessment of these 26 sites is as follows:
The majority of sites are located in Northamptonshire. There are only four appropriate sites in Leicestershire.
All but three of the 26 schemes have road connections ranked at least Good and seven of the 26 schemes have Excellent road connections.
Six of the 26 schemes have Excellent (or potentially Excellent) rail connections but one has Poor rail connections and another eight have Average connections
All 26 schemes have above-average access to markets although this ranged from a low score of 113 (for Logistics Property Partnership Corby / Rockingham Hub) to a high score of 137 (for Midway Park)
Only eight schemes have above-average labour market conditions (of which three are in Leicestershire); all 12 Northamptonshire schemes have below-average labour market conditions, owing to relatively low unemployment rates and high wage rates.
Nine of the 26 scheme offer immediate development opportunities for units of 23,225 sq m or more. Four sites are estimated to not be able to deliver units of 23,225 sq m or more within the next three years and in the case of Arm Farm in Northamptonshire, not within at least five years.
The majority of clusters on these sites are small: 14 of the 26 schemes have a cluster – either existing or potential – of between four and seven units.
5.21 Only the two top-ranked schemes – DIRFT and Magna Park Lutterworth – have existing units and land for development to create a large cluster of more than 20 units of 23,225 sq m or more.
5.22 Therefore when considering appropriate schemes currently or in the future capable of delivering a cluster of four or more units of 23,225 sq m or more and assessing their relative attractiveness based on key drivers of occupier locational choice, Magna Park Lutterworth is the second highest ranked scheme within a 50-mile radius, with only DIRFT scoring higher.

The Economic case for Magna Park
Final Report | October 2015 37
5.23 Magna Park Lutterworth can therefore be considered a highly desirable location for occupiers seeking large-scale logistics operations within this key distribution area in the centre of the country.
The Role of Magna Park Lutterworth in Meeting Demand 5.24 As the assessment has shown, the characteristics of Magna Park Lutterworth mean that it
has a role to play in meeting the needs of the logistics industry that is not readily substitutable by other potential distribution sites.
5.25 Gerald Eve finds that there is only one other site that possess the scale and cluster benefits of Magna Park Lutterworth, which is DIRFT. DIRFT is also the only competitor site that scores higher than MPL in terms of the overall Property Market Assessment. MPL scores significantly higher than the next highest ranked Leicestershire site which is East Midlands Gateway.
5.26 Solutions other than MPL to meet the forecast need for large scale warehousing in Leicestershire would be sub-optimal in property market terms.

The Economic case for Magna Park
Final Report | October 2015 38
6 THE NATIONAL ECONOMIC BENEFITS Value of Forecast Growth
6.1 The expansion of Magna Park Lutterworth as a Logistics Hub will add to the value of the national economy directly through the activity and jobs supported on the Park. It will also add to national GVA indirectly through both multiplier impacts but also through enabling customer and supplier businesses to operate more efficiently.
6.2 An additional 427,350 sq m of warehouse floorspace is likely to support in excess of 5,300 additional jobs. At a GVA per head of £50,000 this will generate an additional £267m in GVA to the national economy. At an average Tax/GVA ratio of 35% that would be worth £93m annually to the UK Treasury.
6.3 After allowance for displacement and multiplier impacts this would generate an additional 6,000 jobs, £300m annually in GVA and £105m annually in tax for the UK economy.
6.4 Harder to quantify, though of potentially greater benefit, are the economic efficiency gains from providing logistics facilities in the most optimal locations. Growth in the UK economy creates demand for warehousing space as noted previously in Chapter 4.Where this space is provided impacts on the operational efficiency of many businesses, on the cost of providing infrastructure for the UK economy, and on factors of wider societal value such as CO2 emissions.
Economic Efficiency of Logistics Cluster 6.5 As seen in the previous section on supply there is an increasing tendency towards larger
warehousing units and larger clusters of activity. The benefits of industrial clusters are well evidenced in economic literature from neo-classical economist Alfred Marshall’s work on the positive externalities of co-location through to the more recent work of Porter about industrial clusters creating higher productivity and more innovation.
6.6 Clusters develop both vertical relationships between suppliers and horizontal relationships between companies that compete with each other yet benefit from shared infrastructure and agglomeration gains.
6.7 The logistics industry has particular features of its operation that makes it well placed to secure the economic benefits of clustering. Examples of major logistics clusters can be found all over the world that have developed as a result of the economic efficiency gains they create.
6.8 One feature of this is pure geography. There are a limited number of optimal locations with supporting infrastructure from which logistics operators can most efficiently fulfil demand.
6.9 But there are also particular operational advantages for logistics from cluster activity. Moving between large centres of freight activity rather than highly dispersed centres lowers transportation costs and almost certainly creates greater reliability as well. In any competitive cluster environment these costs savings get passed on to the logistics operator’s customers and hence lower costs across the economy as a whole.

The Economic case for Magna Park
Final Report | October 2015 39
Security of Jobs
6.10 From an economic development perspective one of the advantages of the logistics sector is the relative security of jobs it provides. As the nature of the business is getting goods to local markets these are not jobs that can be out-sourced to lower cost overseas locations, as has happened with much of the manufacturing sectors and some parts of the financial and business services sectors.
6.11 Indeed logistics has been promoted in economic development terms as a source of replacement jobs for those lost in manufacturing industries. As noted previously in Chapter 3 employment growth in the East Midlands in the logistics sector has run well ahead of the all industry average. Again as set out in Chapter 3 the logistics sector is a good source for providing jobs across a range of occupational and skills levels.
6.12 Because the logistics sector serves many different industries it is also less vulnerable to economic shocks or life-cycle declines in any single industry. It is therefore a relatively stable form of employment and in recent years it has been growing steadily as a sector in all developed economies.
The Jobs Ladder
6.13 Not only does the logistics sector create a range of job opportunities and relatively stable job prospects, it also provides for social mobility. The sector tends to value operational experience and hence has a greater propensity to offer internal promotion opportunities than is the case in many other sectors. An Accenture report from 2006 notes that, “54 per cent of UPS’s current full-time drivers were once part-time employees; 68 per cent of its full-time management employees rose from non-management positions; and 78 per cent of its vice presidents started in non-management positions”13.
6.14 In logistics clusters with larger numbers of jobs this ladder of opportunity is greater.
Value Added
6.15 Logistics clusters tend to encourage value-added activities such as product differentiation or repair and servicing. Long and complex manufacturing supply chains mean that firms often have to respond quickly to changing fashions and consumer tastes to stay relevant to the market. The closer and later this can be done to point of delivery to market, the greater the competitive edge for the selling firm. Logistics clusters provide the ideal base to perform such value added functions.
6.16 An example of this at Magna Park is the Disney NDC which distributes across Europe and also fulfils all European internet orders. A recent addition to the functions within the unit is personalized embroidery of clothing which is undertaken within the warehouse prior to distribution. Employment within the facility is also subject to very high increases during the Christmas retail period as well as following the launch of major new film releases as the associated merchandise attracts high levels of demand.
13 Inside the Value-driven Culture at UPS - Accenture Outlook Journal September 2006 quoted in Sheffi

The Economic case for Magna Park
Final Report | October 2015 40
Opportunities for SMEs
6.17 Logistics clusters create opportunities for new SMEs both within the logistics sector and also from firms serving the logistics sector.
6.18 At Magna Park for example there is a staff recruitment firm based in Lutterworth acting as part of the supply chain infrastructure.
Shared Resources
6.19 Logistics clusters provide opportunities for shared resources. An estimated 25 per cent of all freight vehicles in Europe run empty and over 50% run with only partial loads14. The potential for shared loads to reduce the number of vehicle movements could significantly reduce the carbon footprint of the logistics sector. Such collaborations are facilitated by major logistics parks where operators are moving goods from the same origin to the same destination.
Shared Infrastructure
6.20 Movement of goods requires the infrastructure to support it and as a country grows wealthier the volume of goods grows and the demands on that infrastructure become greater. Logistics hubs centralise the flows of goods and enable the supporting infrastructure to be provided more efficiently.
6.21 The common infrastructure shared by occupiers at Magna Park includes the network of tree-lined boulevards which are kept free of parking and have footpaths that employees use for running during work breaks, the shared services farm (bio-discs and reed beds), a common sprinkler system and a very significant level of landscape development, including the 1 million plus tree-Magna Wood that provides a recreational resource for employees as well as a rich ecological habitat and a visual screen. The proposed extension develops the shared infrastructure concept still further – and opens it to the community. The Logistics Institute of Technology campus facilities will be shared with employees and the wider community and the new Bittesby Country Park will also be available to employees. The shared services farm approach will also be replicated. The application proposals also provide for a common HGV park for Magna Park’s occupiers with a compressed natural gas (CNG) fuelling and vehicle wash, an HGV Training Centre and a dedicated railfreight shuttle terminal that will provide on-demand shuttle services to DIRFT and Rugby using electric or CNG-powered traction units.
6.22 The high quality of the shared infrastructure offered by Magna Park and the attractiveness of this high quality environment to occupiers is a feature of the Park being managed consistently by a single estate management team.
6.23 The Railfreight Shuttle and the Terminal will help current and future Magna Park occupiers to grow in a sustainable way. The lower carbon footprint generated by use of the Shuttle and associated rail movements could also perhaps enable occupiers to win orders they might not otherwise get by enabling them to demonstrate a green supply chain to their
14 Julie Urlaub, “Sustainable Transportation; Extracting Value form an Empty Truck” quoted in Sheffi, ‘Logistics Clusters’.

The Economic case for Magna Park
Final Report | October 2015 41
customers. From a UK plc perspective, use of the Shuttle and associated rail movements would reduce the number of HGV's on Britain's motorways and thereby help to reduce congestion and the cost of delays thus generated.
Competition
6.24 Finally competition is an important component of clusters. Competition is identified by HM Treasury as one of the five drivers of productivity. The close location of competing logistics operators on the same park ensures competition drives good prices for customers and drives innovation and efficiency in operators.
Conclusions 6.25 The expansion of Magna Park Lutterworth brings significant economic benefits in its own
right. After taking account of displacement and multiplier factors it is likely to add 6,000 jobs and £300m annually in GVA to the UK economy. The logistics sector provides a relatively stable and secure source of employment providing a range of employment opportunities and good progression opportunities.
6.26 But the greater benefits are likely to occur through the impact it has on enabling more efficient use of the UK’s distribution network. Enabling logistics clusters to develop at efficient hub locations minimises costs for customers and also in terms of environmental and infrastructure costs.
6.27 Critically the spillover benefits of a logistics cluster are much easier to co-ordinate and more likely to be realised where a Park is in single ownership or management.

The Economic case for Magna Park
Final Report | October 2015 42
7 THE LOCAL ECONOMIC BENEFITS Introduction
7.1 This section looks at the local economic impact of the proposed extension at Magna Park. By way of context it first outlines the existing socio-economic profile of Harborough District. It then focusses on the employment that would be created in terms of both the number and types of jobs. It also sets out the wider economic and financial impact for the District. It then assesses the likely labour market implications comparing the demand for labour with the labour supply in Harborough and the wider labour market catchment areas. Finally it looks at the proposed Logistics Institute of Technology for Magna Park and the local benefits this would bring.
Harborough Economic Profile Sectoral Profile of Employment
7.2 Transportation and storage is one of the largest employers and also one of the fastest growing sectors in HDC15. This is despite the overall reduction in the total number jobs in HDC from 36,865 to 35,367, across all sectors, between 2009 and 2012 – a decrease of 4%.
7.3 This growth of the transport and storage sector is largely due to the locational factors discussed in section 3, which make the Golden Triangle optimal for logistics sector activities, given its wide labour market catchment and accessibility to markets within a 4.5 hour drive time as required for a round-trip drive time on EU-regulated HGV driver hours.
7.4 Within this sector employment in warehousing and logistics and transport support activities alone grew on average by 27% per annum between 2009 and 2012 to over 8,100 jobs in the Golden Triangle area, following growth in the take-up of floor space in the area. In HDC, employment growth in these industries increased by about 39% per annum in the period, accounting for just over half of these 8,100 jobs.
7.5 Employment also grew experienced in professional, scientific and technical sectors which have increased by 2% between 2009 and 2012, employing an estimated 2,631 people in HDC. This is partly because the skills requirements of the district’s key sectors such, as logistics, are rising.
7.6 In contrast, mid to low value sectors experienced above average declines in the employment between 2009 and 2012, following the economic downturn and squeeze on disposable incomes. According to BRES, employment in retail and administrative and support services in HDC fell by 54% (or 3,468) jobs and 24% (or 834 jobs) respectively during this period. At the same time, employment in wholesale industries increased by 5% (or 184 jobs).
15 BRES

The Economic case for Magna Park
Final Report | October 2015 43
Occupational Structure of Employment
7.7 According to census workday data HDC, has a relatively high to mid value occupational profile. The top three Standard Occupation Classifications (SOC) groups i.e. managerial, professional and associate professional occupations make up 34% of employment. This is in line with the national average.
Figure 7.1 Occupational Profile of Residents
Source: APS
7.8 The occupational structure of the workforce in Harborough is reflected in average wages that are significantly above the national average. But workplace wages in Harborough are not far below the national average and are above the average for both the county and the East Midlands region. With Magna Park accounting for nearly a quarter of all employment in the District it is clearly having a positive effect on local pay.
0102030405060708090
100 Elementary
Plant & Machine Ops
Sales & Customer Svcs
Caring, Leisure,Other
Skilled Trades
Admin & Secretarial
Ass Prof & Technical
Professional
Managerial

The Economic case for Magna Park
Final Report | October 2015 44
Figure 7.2 Resident and Workplace Average Wage Levels
Source: ASHE
The Labour Market Unemployment
7.9 In HDC the unemployment rate is below the national average and indeed that of the Golden Triangle more generally. Only 0.8% of the working population in Harborough are claiming JSA which is much lower than neighbouring districts and Leicester as a whole.
7.10 Harborough District has a very healthy labour market with economic activity rates at 82.2% well above the national average and unemployment rates at 2.8% well below the national average.
Population Growth
7.11 According to 2012 sub-national population projections, the resident population in HDC is set to increase by up to 20% by 2031. Some parts of the surrounding area, such as Coventry and Charnwood, are to increase by as much as 30% over this period
7.12 In terms of age structure, one of the largest increases in the population is expected to arise from people above the usual working age (i.e. age 65 or above). These are projected to rise by some 11,800 people between 2012 and 2031 – an increase of 70%. The population of young people aged (0-15) are projected to rise by only 3% or (some 520 people), while those of the usual working age are expected to decline by 1% (a reduction of 680 people).
7.13 The current trends in the HDC resident and workplace population and the future projections result in the following implications for the district:
the HDC population is ageing. A large proportion of the workforce will be entering the age of retirement by 2020 which will create capacity for jobs and create “replacement demand” for labour; and
the HDC economy is largely dependent on the contribution of in-commuters from other parts of the Golden Triangle and the wider area. Therefore to maintain the vitality of the
£0
£100
£200
£300
£400
£500
£600
Resident
Workplace

The Economic case for Magna Park
Final Report | October 2015 45
area it will need to continue to attract key workers from neighbouring areas to work for key employers such as those at MPL.
Labour Force and Travel to Work
7.14 We have analysed labour force projections for the Magna Park Catchment area. The full projection report is contained in Appendix 3. As a sensitivity test we have used two different projections methods to project growth in the labour force for the period 2018-31. On the projection using the ten-year migration trend the labour force is projected to grow by 94,400 over the period 2018-31 from 1.184m to 1.278m an increase of 8.0%.
7.15 Using the alternative SHMA projections the growth is of 102,400 from 1.192m to 1.294m, an increase of 8.6%.
7.16 At the time of the 2011 Census there was a small excess of resident workers in employment in Harborough (44,413) over the number of people who worked in Harborough (42,180) But Harborough is a very open labour market with large proportions of the workforce both commuting out of Harborough and commuting in to Harborough. Excluding those who work mainly at or from home or those with no fixed workplace in 2011 there were 34,533 Harborough residents who worked at workplaces in the UK. Only 13,159 (38.1%) of those worked in Harborough.
7.17 There are sixteen districts that approximate a 45-minute travel to work catchment for Magna Park. There 1.39m working age people (16-64) within these catchment districts of whom 1.07m are economically active. There are just over 50,000 people who are currently unemployed with a further 69,000 who are currently economically inactive but would like a job . In other words there is surplus unused labour of approximately 120,000 within a reasonable travel distance of Magna Park.
Development Proposal 7.18 The proposed expansion at Magna Park consists of the following development.
B8 – Storage and Distribution @ 4.6m sq ft (427,351 sq m) 427,350 sq m D1 - Academy @ 40,000 sq ft (3,716 sq m – i.e., 3,700 sq m) + Estate Office @ 3,300
sq ft (300 sq m) B1 (b) – Holovis @ 75,000 sq ft (6,968 sq m) 7,000 sq m B1 (a) & (b) – Innovation Centre @ 25,000 sq ft (2,323 sq m) 2,325 sq m
7.19 This development will create additional jobs on the Park, the detail of which is summarised below. In addition there will be a construction phase which will generate further economic activity and employment for the local economy.
Construction Phase
Direct Employment
7.20 The construction costs of the proposed development can be used as a basis for estimating the level of construction employment to be generated by the scheme. Dividing the total construction costs by the average turnover per worker in the construction sector provides an estimate of the gross direct construction employment.

The Economic case for Magna Park
Final Report | October 2015 46
7.21 Data from the Office for National Statistics indicates that the average turnover per worker in the construction sector in the East Midlands is £145,124. 16
7.22 Based upon data from the Building Costs Information Service (BCIS) and industry estimates the total construction costs associated with the proposed development are projected to be £237 million over the construction period.
7.23 The construction phase could therefore result in gross direct construction employment of some 1,634 jobs over the duration of the build period.
7.24 The net impact on the number of jobs filled by residents of the study area may be less than expected, if jobs are filled by people previously employed elsewhere within the region (displacement), or jobs are created outside the region (leakage). Due to the high mobility of construction workers, we would expect a high leakage of construction jobs to other areas. But based on exiting patterns of employment at Magna Park we already have a very high level of leakage at 82% and 42% for Leicestershire so would not recommend raising this further.
7.25 We summarise in Table 7.1 the employment impact of construction jobs, which yields 287 net additional local jobs in HDC when multiplier effects are taken into account and 924 net additional local jobs in Leicestershire.
Table 7.1 Additionality of construction employment Harborough Leicestershire
Gross construction jobs 1,634 1,634 Local jobs after 82%/42% leakage 294 948 Local jobs after 25% displacement 221 711 Local Multiplier effects 1.3 1.3 Net additional local jobs Harborough 287 924
GVA
7.26 GVA per head in the construction industry in England is £39,532.17 The proposed development with therefore result in an additional workplace GVA of £64.6 million over the build period.
Operational Effects 7.27 We assess the employment impact from each component of the development proposal
separately.
16 The 2011 Annual Business Survey (ABS) Regional Results indicate that the total turnover of the construction industry in the East Midlands was £19,882 million. According to the 2011 Census Data for the East Midlands there were some 137,000 residents aged 16 to 74 in employment in the construction industry. This results in a turnover per worker of £145,124. 17 Calculations using ONS Blue Book 2012, ONS NOMIS Workforce Database

The Economic case for Magna Park
Final Report | October 2015 47
Warehouse and Distribution
7.28 The total proposed additional warehouse floorspace is 427,350 sq m. At an average employment density ratio of 80 sq m per worker this would generate an additional 5,342 jobs on site at MPL.
7.29 If we assume existing leakage rates of 82% for Harborough and 42% for Leicestershire then the number of jobs going to people from Harborough would be 962 and for Leicestershire 3,098. If we make a standard assumption about Displacement of 25%18 then the net additional jobs to residents of Harborough is 721 and for Leicestershire 2,324.
7.30 Adding a standard multiplier of 1.319 to account for additional jobs created as a result of indirect supply chain effects and induced expenditure effects than the total number of net additional jobs to residents of Harborough is 935 and for Leicestershire 3,021.
7.31 At an average GVA per head of £50,000 this would generate net additional workplace GVA of £267m per annum.
Innovation Centre
7.32 The total proposed floorspace for the Innovation Centre is 2,325 sq m. At an average employment density ratio of 16 sq m per worker this would generate an additional 145 jobs on site at MPL.
7.33 If we make a standard assumption about Leakage of 50% for Harborough and 25% for Leicestershire then the number of jobs going to people from Harborough and Leicestershire would be 73 and 109 respectively. We assume that displacement will be very low and apply a rate of 10%. The net additional jobs to residents of Harborough and Leicestershire would be 65 and 98 respectively.
7.34 Adding a standard multiplier of 1.3 to account for additional jobs created as a result of indirect supply chain effects and induced expenditure effects than the total number of net additional jobs to residents of Harborough and Leicestershire would be 85 and 128 respectively.
7.35 At an average GVA per head of £40,000 this would generate net additional workplace GVA of £5.8m per annum.
Holovis
7.36 Holovis, an innovative technology firm currently based at Magna Park, is a world leader in sensory experience design in the Entertainment, Industrial, Retail, Military and Retail Brand sectors. The proposal allows for the expansion and relocation of Holovis within Magna Park. The total proposed floorspace for Holovis is 7,000 sq m. At an average employment density ratio of 16 sq m per worker this would generate 438 jobs on site at MPL.
7.37 If we assume that 50% of this is net additional this would 219 net additional jobs.
18 Additionality Guide 2014 Low level of Displacement 19 Additionality Guide 2014 Average multiplier set mid-way between Neighbourhood and Regional multipliers to reflect sub-region

The Economic case for Magna Park
Final Report | October 2015 48
7.38 We assume Magna Park leakage rates of 82% for Harborough and 42% for Leicestershire. We apply the low displacement at 10% and a standard multiplier of 1.3. The total number of net additional jobs for residents of Harborough would be 46 and for Leicestershire 148.
7.39 At an average GVA per head of £50,000 this would generate net additional workplace GVA of £10.9m per annum.
Logistics Institute of Technology – Jobs Impact
7.40 We expand on the wider labour market impacts of the Logistics Institute of Technology below. Here we summarise the direct employment impact of the scheme.
7.41 The total proposed floorspace for the Logistics Institute of Technology Innovation Centre is 3,300 sq m. At an average employment density ratio of 40 sq m per worker this would generate an additional 83 jobs on site at MPL.
7.42 If we assume existing leakage rates of 82% for Harborough and 42% for Leicestershire then the number of jobs going to people from Harborough would be 15 and for Leicestershire 48. We assume that displacement will be very low and apply a rate of 10%. The net additional jobs to residents of Harborough 13 and for Leicestershire 43.
7.43 Adding a standard multiplier of 1.3 to account for additional jobs created as a result of indirect supply chain effects and induced expenditure effects than the total number of net additional jobs for residents of Harborough would be 17 and for Leicestershire 56.
7.44 At an average GVA per head of £50,000 this would generate net additional workplace GVA of £4.1m per annum.
Rail Freight Shuttle Terminal
7.45 The Railfreight Shuttle Terminal is likely to generate around 12 jobs, consisting of approximately 6 shuttle drivers, 4 terminal staff and 2 traffic clerks.
7.46 With assumptions about existing patterns of employment as above then 2 of these would go to Harborough residents’ and 7 to Leicestershire residents.
Local Rates Income 7.47 The existing operation at Magna Park already contributes some £20.7m annually in
business rates for the district. The extension proposals would generate, annually, an additional c £12.4m in business rates for the district (calculated conservatively by Gerald Eve using observed rateable values for proximate appropriate property types currently in the Rating List and applying this to the proposed development of different types of property and their areas and using the current UBR for 2015-2016 UBR). The Chancellor has recently announced plans to further devolve business rate income to local authorities. Whilst the precise mechanism is at present uncertain there is potential for a larger still proportion (than the present c 50%) of the c £33m total annual business rates that will be generated by the extended Magna Park to be retained directly by Harborough District Council

The Economic case for Magna Park
Final Report | October 2015 49
Overall Economic Impact
7.48 The overall economic impact from the combined elements is summarised in the Table below.
Table 7.2 Summary Economic Impacts Workplace Jobs GVA £m Logistics & Warehousing 5,342 £267.1 Innovation Centre 145 £5.8 Holovis 219 £10.9 Logistics Institute of Technology 83 £4.1 Railfreight Shuttle 12 £0.5 Total Operational 5,800 £288.4 Construction 1,634 £64.6 Total Operational and Construction 7,435 £353.1
Harborough after Additionality and Multipliers Jobs GVA £m Logistics & Warehousing 937 £46.9 Innovation Centre 85 £3.4 Holovis 46 £2.3 Logistics Institute of Technology 17 £0.9 Railfreight Shuttle 2 £0.1 Total Operational 1,088 £53.5 Construction 287 £11.3 Total Operational and Construction 2,463 £118.4
Leicestershire after Additionality and Multipliers Jobs GVA £m Logistics & Warehousing 3,021 £151.0 Innovation Centre 128 £5.1 Holovis 148 £7.4 Logistics Institute of Technology 56 £2.8 Railfreight Shuttle 7 £0.3 Total Operational 3,360 £166.6 Construction 924 £36.5 Total Operational and Construction 7,643 £369.8
7.49 The operational impacts are annual effects on completion of the development. The construction impacts are total impact for the build period.
Labour Market
7.50 The effect on the labour market can be examined by reviewing the likely occupational profile of the employment at the site in the operation phase. The National Skills Survey provides a breakdown of jobs in the logistics sectors by occupation as set out in Table 5.8.
7.51 To provide an assessment of the labour market impact we have considered the total direct employment of the Logistics and Warehousing employment which is by far the largest

The Economic case for Magna Park
Final Report | October 2015 50
component of the operational phase, with 5,342 jobs before leakage, displacement or multiplier effects.
7.52 The last column in Table 5.8 arrives at the occupation breakdown of these 5,342 jobs based on the National Skills Survey percentages. This results in:
Some 1,496 jobs in high value occupational groups (i.e. Managers; Professional Occupation; and Associate Professional Occupations)
An estimated 855 jobs in mid-level occupational groups (i.e. Administrative and Secretarial and Skilled Occupations);
Approximately 481 jobs in lower level service and sales occupations; and Some 2,511 process plant and elementary occupations.
Table 7.3 Occupation Breakdown of Operational Employment Percentage
of jobs* Approximate
no. of jobs Managers and Senior Officials 18% 962 Professional Occupations 2% 107 Associate Prof & Tech Occupations 8% 427 Administrative and Secretarial Occupations
13% 694
Skilled Trades Occupations 3% 160 Personal Service Occupations 3% 160 Sales and Customer Services Occupations
6% 321
Process, Plant and Machine O ti
22% 1,175 Elementary Occupations 25% 1,335 Total 100% 5,342
*Source: National Skills Survey
7.53 The labour market impacts can be assessed by considering the occupation profile of job opportunities created at the operational stage (as estimated in Table 5.8) against the sought occupations of Job Seekers Allowance (JSA) claimants within the labour market catchment of MPL as shown in Table 5.9. We have used JSA claimants resident within local authority districts within an approximated 45-minute catchment area of Magna Park.

The Economic case for Magna Park
Final Report | October 2015 51
Table 7.4 Occupations sought by JSA claimants vs. Operational Employment at the site
No. of JSA claimants Jan 2015
No. of JSA claimants Aug 2015
Approximate no. of jobs
Managers and Senior Officials 1,235 1,415 962 Professional Occupations 245 210 107 Associate Prof & Tech Occupations 560 340 427 Administrative and Secretarial Occupations 2,150 1,635 694
Skilled Trades Occupations 880 560 160 Personal Service Occupations 720 500 160 Sales and Customer Services Occupations 9,580 9,630 321 Process, Plant and Machine Operatives 940 620 1,175 Elementary Occupations 6,180 4,460 1,335 Unknown 1,025 920 Total 23,515 20,290 5,342
*Source: NOMIS
7.54 Table 7.4 illustrates that within the labour market catchment area there is a potential labour pool of people currently unemployed available to fill the jobs at nearly all occupational levels, with potential for training and upskilling of those normally seeking elementary occupations to higher skilled plant and machine operative level jobs.. The actual pool of labour is of course much larger than just the claimant unemployed resource of people that are seeking occupations which correspond to those arising at the operational stage at every skill level.
7.55 As noted earlier the labour force for this catchment area is projected to increase by between 94,000-102,000 over the period 2018-31.
Logistics Institute of Technology – Labour Market and Training Impact
7.56 The Logistics report (2013), produced for South East Midlands Local Enterprise Partnership and Skills for Logistics, highlighted the geographical importance of the Magna Park area and the need to attract and develop local and national talent in order to fill the skills gaps and shortages in the logistics sector
7.57 In response to this an initiative has been taken forward to develop on site at Magna Park the Logistics Institute of Technology. The founding partners of the Logistics Institute of Technology are:
IDI Gazeley – who will provide strategic leadership in terms of the project, including oversight of the building and relationships with Magna Park’s firms and local communities.
North Warwickshire & Hinckley (NWHC) and South Leicestershire Colleges (SLC) – who will provide operational leadership to the education and revenue funding of the project and be responsible for the delivery of NVQ level 1-4 (including apprenticeship frameworks) and liaison with employers.

The Economic case for Magna Park
Final Report | October 2015 52
Aston University – who will be responsible for the research function of LIT and for part time work-based degrees, postgraduate qualifications, and the work-based full and part-time progression routes at the high skills and postgraduate levels.
7.58 Education and training will be at the heart of the Institute’s work to ensure that the logistics sector is provided with high calibre staff at all levels. The focus of this work will be on: i) developing young people for careers in the sector; and ii) re-training existing staff to meet the myriad challenges that need to be faced now and into the future.
7.59 In relation to the former, the Institute will play a leading role in transforming the image of the sector to one which emphasises advanced technology, globalisation, environmental protection and relationship management. The latter is vital in addressing legacy skill and knowledge deficits in the sector, which has not traditionally had a strong focus on education and training. One result of this is the existence of a large number of people with huge experiential knowledge but without formal academic and/or professional qualifications. This has become more critical as the sector has moved rapidly towards a more global and high-tech model with the concomitant high level of knowledge intensity.
7.60 While knowledge and skills development will be central, this advanced learning activity will be integrated with, and supported by, applied research as well as other company outreach and support activity.
7.61 In line with the integrative nature of contemporary logistics and supply chain management (SCM) thinking, a key feature of the Institute is that these three activities will be undertaken in an integrated manner:
The Research dimension provides the underpinning knowledge and expertise that informs both Advanced Learning and Company Outreach and Support.
The Advanced Learning feeds learner knowledge and experience back into the Research process, thereby creating continuous iteration between these activities. It is envisaged that Advanced Learning will become a key part of Company Outreach and Support as firms recognise the need to develop advanced logistics and systems knowledge and skills throughout their supply chains; thus, these two activities are highly complementary.
Finally, the Research agenda is shaped by the ever changing strategic imperatives of firms; the Institute’s close working relationship with industry through its Company Outreach and Support activity will help to ensure that: (i) the research agenda addresses these imperatives; and, (ii) the knowledge created through research is appropriately exploited.
7.62 The essence of this model is about building partnerships between companies and HE/FE providers, as well as professional bodies. Locating the Institute in the middle of Magna Park allows a real centre of excellence to be created. This will not only produce the next generation of staff for the sector, but will also become a focal point for exploitable research that responds to industry needs. Knowledge transfer – including technology transfer – will be an important part of the model. This vision can only be operationalised by developing effective partnerships between academia and industry. This ensures that the Institute’s

The Economic case for Magna Park
Final Report | October 2015 53
work is based on state-of-the-art thinking and academic excellence, combined with real relevance to the rapidly changing needs of the industry.
7.63 The academic partners’ core vision and ethos relates to “academic excellence with relevance”. The partners want all their programmes to be known for their high academic standards and the associated value of their qualifications.
7.64 The proposed Logistics Institute of Technology will cater for up to 400 students in the 16-19 and 19-22 year age range. The student catchment is the same as that for Magna Park’s labour force (which, without any proactive effort to increase that share) attracts some 18-20% of its permanent workforce from residents who live in a post code which is wholly within or partly a Harborough District ward.
7.65 Such a facility will help meets the needs of both the local labour force and also of the logistics industry’s requirement for skilled workers. As a recent book on logistics clusters noted,
“Although warehouse work seems like a low-skill vocation, modern-day logistics companies have little use for untrained labour. Safe and effective use of the automated equipment that handles goods requires professional workers. The increasing use of technology to track and manage all movements of goods requires even more skills. ….Logistics clusters need vocational education resources to supply all these workers.” 20
7.66 The programmes and qualifications that LIT will provide will be discussed and agreed with the employers, working in a similar way to the NWHC Logistics team who, through the DHL consortium, provide programmes for 47 DHL sites nationally. It will provide skills and qualifications across a range of occupations with indicative examples being:
Existing workforce upskilling - a range of NVQ levels from 2-4 offering specific targeted programmes as agreed with employers as well as formal qualifications such as HND and Advanced Apprenticeships.
Existing workforce - Career progression – part work-based HNC, degrees, master degrees, bespoke training and professional one day programmes.
Local school and college students – From pre-employment training, through employability skills and introduction to the Logistics Industry as well as pre-apprenticeship training and a range of NVQ at Level 2-3.
School and college leavers – Apprenticeships, Traineeships or work-based foundation and degree programmes.
University students on placements – liaison with the employers and the University can open up a potential for graduate recruitment. Pre- employment training and bespoke professional programmes could be offered to ensure they understanding the career potential and global travel associated with the Logistics industry.
20 Logistics Clusters: Delivering Value and Driving Growth (page 210) – Yossi Sheffi (2012)

The Economic case for Magna Park
Final Report | October 2015 54
Graduate employees – pre–employment training, logistics centre orientation programmes and a range of professional short course, work-based Masters programmes in technical and managerial disciplines
Supervisors and Managers - Professional work-based Masters Programmes, Work-based PhDs along with bespoke and professional short courses.
7.67 In addition the Institute provides much of the rationale for the Innovation Centre. The availability on site of high quality, easy-in, easy-out, licenced business space provides a singular opportunity for the Institute, faculty, students and the industry to create and grow small businesses that will exploit commercially the applied research output of the institute and develop the early prototype innovations created in collaboration with the industry.
7.68 The co-location with the Innovation Centre gives LIT, its students and faculty the chance to create new small businesses that exploit commercially the research innovations. This opportunity is provided in the middle of the golden triangle where the consumers of the commercial application of those innovations are concentrated.
7.69 Every great and successful logistics cluster has a university at its centre. There is none such in the UK – not yet. Harborough has that opportunity – and in seizing LIT will secure for the District its first and only further and higher education institution.
Driver Trainer Centre
7.70 In addition to the Logistics Institute of Technology there are also proposals for a Driver Training Centre at Magna Park. The further adds to the skills and training infrastructure on site and will help to address any concerns about potential HGV driver shortages.

The Economic case for Magna Park
Final Report | October 2015 55
8 THE POLICY FIT National Policy
8.1 Paragraph 20 of the NPPF states that in order to help achieve economic growth, local planning authorities should plan proactively to meet the development needs of business and support an economy fit for the 21st century. Paragraph 21 sets out that in drawing up Local Plans local planning authorities should, amongst other things, support existing business sectors, taking account of whether they are expanding or contracting.
8.2 Local planning authorities should set out strategic priorities for the area, as outlined in Paragraph 156 of the NPPF, whereby strategic policies need to include the delivery of jobs, infrastructure and provision of relevant development. Paragraph 160 requires local planning authorities to have a clear understanding of business needs within the economic markets operating in and across their area and work with adjoining authorities and their Local Enterprise Partnership to prepare and maintain a robust evidence base of those needs.
8.3 In addition to the NPPF guidance, there are also wider influences in the national planning context. For example, the Government has sought to address the question of economic productivity which, it describes as “the single most important determinant of average living standards”, but which has “persistently lagged behind other major economies and although it grew in the decades before the financial crisis, it has stalled sharply in the wake of the crisis”.21 The Government’s framework for raising productivity is built around two pillars:
encouraging long-term investment in economic capital, including infrastructure, skills and knowledge, and
promoting a dynamic economy that encourages innovation and helps resources flow to their most productive use.
8.4 The relationship of these goals to the NPPF is clear. And the wish of Government to make real progress is seen in its efforts to encourage property development by reducing what it perceives to be constraints in the planning system.
8.5 There are a series of key these to deliver higher productivity and the objectives of ‘A highly skilled workforce, with employers in the driving seat’, fits well with the aims of the proposed Logistics Institute of Technology.
. National Network Policy Statement, December 2015 (NPS)
8.6 The NPS sets out Government’s policies on the delivery and development of nationally significant infrastructure projects (NSIPs). While the application proposals are not promoted under that legislation, the NPS policy provisions nonetheless are a material consideration under the 1990 Act.
8.7 The NPS makes clear that national policy strongly supports the development of further land for road based freight in order to support market demand. The following illustrate:
21 HM Treasury (2015) Fixing the Foundations: Creating a More Prosperous Nation HM Government

The Economic case for Magna Park
Final Report | October 2015 56
“2.1 The national road and rail networks that connect our cities, regions and international gateways play a significant part in supporting economic growth, as well as existing economic activity and productivity and in facilitating passenger, business and leisure journeys across the country. Well-connected and high-performing networks with sufficient capacity are vital to meet the country’s long-term needs and support a prosperous economy.”
Table 2.1 (re modal shift as an option for helping meeting the need for strategic highway capacity) “If freight carried by rail was to increase by 50% (in terms of tonne kilometres) this would only be equivalent to a reduction of around 7% in goods carried by road.”
“2.45 The logistics industry provides warehousing and distribution networks forUK manufacturers, importers and retailers - currently this is predominantly a road based industry.”
“4.13 … the road and rail networks provide access for people, business and goods between places and so the location of development will usually be determined by economic activity and population and the location of existing transport networks.”
The LEP Context LEP Strategic Economic Plans (SEPs)
8.8 The development of the logistics sector is key priority of LLEP area, the neighbouring Coventry and Warwickshire LEP (CWLEP) and the South East Midlands LEP (SEMLEP). These have produced Strategic Economic Plans (SEPs) which set out a number of priorities including working in partnership to support the development and employment and economic growth.
LLEP SEP (2015-2020)
8.9 The LLEP SEP sets out the area's economic strategy and priorities. It aims to create 45,000 new jobs, lever £2.5 billion of private investment and increase Gross Value Added by £4 billion by investing in infrastructure, business support and employment and skills initiatives as summarised in Figure 8.1 below.

The Economic case for Magna Park
Final Report | October 2015 57
Figure 8.1: LLEP Economic Strategy and Priorities
Source: LLEP
8.10 The LLEP SEP focusses on prioritising investment in the area’s economic assets such as MPL to “increase their national and global competitive advantages.” In the context of the proposed development the SEP and skills need assessment noted the following:
The logistics sector is more important to the local area’s economic performance relative to nationally. Logistics accounts for 12% of employment across the LLEP area compared to the national average of 9%.
Robust evidence demonstrates demand for 130 Ha warehousing land to support the logistics sector.
Employers are reporting a lack of skilled workers in key sectors which could constrain the economic growth in the area.
CWLEP SEP (2015-2020)
8.11 The CWLEP SEP sets out the ambitions for economic growth; proposals for realising these ambitions; the “offers and asks” of the Growth Deal with Government; and the initial calculation of Local Growth Fund investment that we will require to 2020/21.
8.12 The SEP has four key objectives: to drive economic growth; to help remove barriers to economic growth; to help create high value jobs; and; to co-ordinate local government co-operation and support.
8.13 To achieve the key objectives CWLEP’s focus is on inward investment and growing existing businesses. The CWLEP will concentrate on 5 core enablers:
Strategic infrastructure – transport networks, having suitable sites for business and simplifying planning
Further Education, Higher Education and skills – creating a workforce with the right skills for business
Inward investment – providing compelling reasons and making it easy for companies to move into the region

The Economic case for Magna Park
Final Report | October 2015 58
Funding, including access to finance – securing and distributing a fair share of available funding for Coventry and Warwickshire
Low carbon challenge – addressing opportunities to put a high efficiency, low impact ‘wrapper’ around all other activities
8.14 Enhancing productivity and economic performance in the logistics sector is also identified as a priority in the CWLEP area. The SEP for Coventry and Warwickshire recognises the sector as an opportunity for future growth given the area’s connectivity in terms of labour supply, the location of employment sites and employment for residents.
SEMLEP SEP (2015 – 2020)
8.15 SEMLEP has a strong track record of growth and employment creation and ambitious growth targets. SEMLEP aims to accommodate an increased population of 151,400 and provide 111,200 new jobs by 2020.
8.16 SEMLEP has eight strategic objectives to address structural weaknesses in the South East Midlands as outlined in Table 8.1 below. The proposed logistics development would contribute to each of these objectives which are designed to improve business productivity, market penetration, workforce skills and infrastructure investment.
Table 8.1 SEMLEP Strategic Objectives Theme Objective Business Productivity
1: Stimulating enterprise and enhancing the competitiveness of SMEs. 2: Strengthen and exploiting innovation and knowledge assets
Markets 3: Supporting new and existing businesses to export their goods and services 4: Attracting domestic and international investment
Skills 5: Developing a skilled and adaptable workforce 6: Addressing barriers to the labour market for disadvantaged groups
Infrastructure 7: Delivering infrastructure to accelerate sustainable growth in jobs and investment in town centres 8: Securing long term and ongoing funding to deliver the infrastructure plan
8.17 The logistics sector is identified as one of four key sectors with the capability, the major assets (excellent transport connectivity) and the greatest potential to grow rapidly.
8.18 The SEMLEP SEP sets out the need to encourage greater collaboration between universities in the area and local businesses to address the skills gaps within the existing workforce and improve business performance and jobs growth in the logistics sector. Meeting the future demands for the sector also rests on the provision of public and private training and greater linkages with local employers.
Local Policy HDC Core Strategy (2011)
8.19 Policy CS7 ‘Enabling Employment and Business Development’ states that economic and employment development will be enabled in support of the sub-regional economic growth of Leicester and Leicestershire. Part h) of the policy seeks to protect the “‘unique role” of the

The Economic case for Magna Park
Final Report | October 2015 59
existing Magna Park development as a strategic distribution centre of national significance and an exemplar of environmental performance. Part h) also states that no further phase of development or large scale expansion of the site, beyond the existing development footprint, will be supported.
HDC Local Plan (2001) - Saved Policies
8.20 The saved policies of the Local Plan include several policies that seek to control development at the site of the existing Magna Park. We note that Policy EM/13 seeks to safeguard Magna Park’s role as a large-scale distribution centre by resisting planning applications for new units of less than 9,300 sq. m or the creation of new floorspace for Class B1 or B2 use.
HDC ‘Open for Business’ Action Plan
8.21 The Harborough Open for Business Prospectus proposes six key intervention strategies one of which is Leveraging the opportunities of Magna Park. Under this strategy its notes that:
“Magna Park (MP) remains in many way a litmus test of HDCs approach to 'open for business'. As the district's largest strategic employment site, home of major international brands operating in the district (as well as a global development company), and with transport and logistics a LLEP priority sector, the site is likely to be subject of expansion proposals over the next 12-24 months.”22
8.22 In January 2014, HDC agreed to approve its ‘Open For Business‘ Action Plan which sets out the Council’s proposed strategy for the promotion economic prosperity. The strategy will not only aim to set out a clear vision to meet the district’s needs, it will also help inform the council’s District Growth Plan which will feed into a wider economic plan submitted to the Government by the LLEP.
8.23 One of its priorities is to encourage a vibrant and sustainable business community with focus on prosperity and employment opportunities. A key component of this is to leverage the business benefits of the activities at MPL across Harborough District, as part of a ‘Centre of Excellence’ approach. This entails key business representatives regularly engaging with HDC and the Leicester and Leicestershire LEP (LLEP) to share knowledge and expertise. In particular in order to
Develop better understanding of employment, travel to work and traffic issues relating to MPL
Research role of MPL within the context of Leicestershire’s Strategic Distribution Sector.
Encourage and enable engagement by Gazeley (MPL operators) with the local community through parish councils and community events.
Ensure any appropriate expansion proposals are processed effectively but also creatively to reach a solution determined locally with clear local benefits and returns.
22 Harborough Open for Business Prospectus – September 2013

The Economic case for Magna Park
Final Report | October 2015 60
Support MPL businesses to reduce costs and deliver sustainable growth at the Park Manage relationships with the MPL business 'community' in its widest sense to ensure
they become a more integral part of HDC economy Explore linkages to increase supply chain opportunities for local firms Development of a Centre of Excellence for training in logistics and distribution to help
ensure local residents can obtain higher value employment opportunities in the sector.

The Economic case for Magna Park
Final Report | October 2015 61
9 CONCLUSIONS Summary
9.1 Magna Park Lutterworth is a successful distribution hub that has grown steadily over the years due to its excellent strategic location and park management. As demand for logistics continues to grow with the UK’s expanding economy so the demand for additional warehouse space at Magna Park will grow in parallel.
9.2 Logistics has been a growth sector nationally and especially in a central area of the Midlands known as the Golden Triangle where operators are able to serve 80% of the UK’s population within a four hour drive time.
9.3 Logistics has been a source of relatively secure and growing employment and in Harborough District itself it accounts for around 25% of all jobs.
9.4 Forecasts prepared for the Leicestershire Strategic Distribution Study suggest the need for 5.6m sq m of additional warehouse floorspace for the East Midlands over the period 2014-31 and 7.3m sq m for the period 2014-36.
9.5 At regional and national level there are reasonably well established methods for calculating the total growth in new or additional warehousing demand. As with any forecasts there will be degrees of confidence around the precise total. But there are much lower degrees of confidence when forecasting at lower spatial scales as this depends on the relative attractiveness of individual sites and factors which can change, or be changed, over time.
9.6 Neither are there well established nor robust methods for predicting the total volume or proportion of rail-served demand. Whilst the expectation and policy ambition is for this to be increased over time the volume of total operator demand that requires rail served location must be subject to a high degree of uncertainty.
9.7 What we do know about demand for warehouse space is that it is concentrated on certain geographical locations that have unique accessibility advantages. We also know that there is a trend to requiring larger warehouse units and further there are cluster advantages of co-location of logistics activity.
9.8 The assessment of supply by Gerald Eve demonstrated that only of Magna Park Lutterworth and DIRFT possess the scale and cluster benefits that meet the needs of the logistics industry that is not readily substitutable by other potential distribution sites.
9.9 The expansion of Magna Park Lutterworth brings significant economic benefits in its own right. After taking account of displacement and multiplier factors it is likely to add 6,000 jobs and £300m annually in GVA to the UK economy. The logistics sector provides a relatively stable and secure source of employment providing a range of employment opportunities and good progression opportunities.
9.10 But the greater benefits are likely to occur through the impact it has on enabling more efficient use of the UK’s distribution network. Enabling logistics clusters to develop at efficient hub locations minimises costs for customers and also in terms of environmental and infrastructure costs. This will be further enhanced through the Railfreight Shuttle and Terminal.

The Economic case for Magna Park
Final Report | October 2015 62
9.11 Critically the spillover benefits of a logistics cluster are much easier to co-ordinate and more likely to be realised where a Park is in single ownership or management. This is nowhere better illustrated than in the ability of the Magna Park management team to bring on site the Logistics Institute of Technology and the Innovation Centre both of which will add substantially to the cluster benefits.
Local Economic Benefits 9.12 The HDC economy functions within its wider functional economic market area. It both
exports workers to jobs outside its district boundaries and draws in employees to contribute to economic output within the district.
9.13 Analysis of the Harborough District economy and labour market has identified the following needs for the area:
Meeting replacement labour demand (arising from an ageing workforce) and the additional labour requirements from the logistics sector – one of the largest employers and also one of the fastest growing sectors in HDC.
Training opportunities for young people – HDC and the wider area is expected to experience population growth in young people who will require training opportunities to meet the rising skills requirements
Greater engagement with key employers and local community, to improve the image of the sector, and encourage greater collaboration between HDC employers and residents. This will help encourage and retain highly skilled staff in the sector.
9.14 The MPL expansion contributes towards meeting these needs. The total local impact from the expansion are summarised in the Table below. In total the proposed development will create an additional 6,200 jobs and generate over £300m in local GVA. After allowing for displacement and multiplier effects this will still generate a net additional impact of 4,200 jobs and over £200m in GVA.
9.15 In addition the expanded Magana Park will generate something of the order of £33m p.a. in local business rates. Whilst the precise mechanism is at present uncertain the Chancellor has announced proposals for further devolution of business rate income which means there is potential for a large proportion of the annual business rates that will be generated on Magna Park to be retained directly by Harborough District Council.
Why Magna Park 9.16 The proposed development matches needs of the logistics sector to those of HDC and the
wider area. It contributes to sustainable development in particular in terms of economic gains.
9.17 The expansion of MPL will help promote a strong and competitive economy, capitalising on HDC’s strengths and natural assets, as part of the Golden Triangle.
9.18 The proposed Logistics Institute of Technology will provide training opportunities for young people and allow the existing logistics workforce to up-skill. This will help address the rising skills requirements of the sector and also increase the productivity and earning potential of the workforce. It also improves links with the local community.

The Economic case for Magna Park
Final Report | October 2015 63
9.19 In addition to these local benefits MPL has been proven as a successful logistics location addressing market demand. Efficient operation of the logistics sector brings benefits for the UK economy that exceed those of the sector itself. Its expansion will enable market demand to be satisfied going forward and for logistics activity to be concentrated in the most efficient locations for the UK economy generally.

The Economic case for Magna Park
Final Report | October 2015 A2
APPENDIX 1 Magna Park Lutterworth Distribution Property Market Assessment Gerald Eve
ECONOMIC CASE FOR MAGNA PARK

The Economic case for Magna Park
Final Report | October 2015 A2

72 Welbeck Street London W1G 0AY Tel. +44 (0)20 7493 3338
www.geraldeve.com
Magna Park Lutterworth
Distribution Property Market Assessment
On behalf of IDI Gazeley
September 2015
Prepared by: Sally Bruer
© copyright reserved 2015 Gerald Eve LLP

© copyright reserved 2015 Gerald Eve LLP Page 2
Contents Page
1 Introduction 3
2 Executive summary 4
3 Logistics property market conditions 8
4 Drivers of occupier locational choice 19
5 Identification and assessment of appropriate competing sites 29
6 Conclusions 40
Appendix A: Individual Site Assessments 42
Appendices
A Individual site assessments

© copyright reserved 2015 Gerald Eve LLP Page 3
1 Introduction
1.1 PURPOSE OF THIS REPORT
Gerald Eve LLP was commissioned by IDI Gazeley in February 2015 to conduct an assessment of the distribution property market to consider the competing supply of sites with large-scale logistics units in sufficient scale to be considered a cluster.
The purpose of this report is to determine the relative strength of offering at Magna Park Lutterworth by comparing it to other logistics property schemes in an appropriate area of competition for occupiers based on property market and other criteria important to occupiers when making locational choices for logistics operations
1.2 STRUCTURE
The research report is based on desk-based analysis of the logistics property market and specific scheme identified as appropriate competition for Magna Park Lutterworth based on size and location criteria.
This research report comprises the following:
• Section 1: Introduction This comprises the purpose and structure of this report
• Section 2: Executive summary This section presents the key findings of this research report.
• Section 3: Logistics property market conditions This section is an assessment of occupier demand for and supply and availability of appropriate logistics property over the past ten years with detail on the size profile and location of units demanded
• Section 4: Drivers of occupier locational choice This section examines key drivers of occupiers decision making when considering where to location a logistics operation of a significant size. These drivers are transport accessibility, labour market conditions and the location of logistics clusters
• Section 5: Identification and assessment of appropriate competing sites This section details the schemes identified as appropriate competition for Magna Park Lutterworth within proximity to the park. Schemes are identified and classified and then are assessed based on key criteria relating to property fundamentals and the drivers of occupier locational choice.
• Section 6: Conclusions This section presents the findings of the assessment of the appropriate competing sites and Magna Park Lutterworth in order to compare the relative strength of Magna Park Lutterworth and its competition for occupier demand
The individual site assessment reports are presented in Appendix A.

© copyright reserved 2015 Gerald Eve LLP Page 4
2 Executive summary
2.1 EXECUTIVE SUMMARY
Logistics property market conditions
• Demand for logistics floorspace is currently strong and at 34% nationally over the last
decade, take-up of units of 23,225 sqm or more accounts for a significant proportion of
occupier demand
• Units of 23,225 sqm or more are in demand in the East Midlands more so than any other
region in the country, both in terms of proportion of total take-up and also by total volume.
Therefore units of 23,225 sqm or more are more important to occupiers demanding space
in the East Midlands than in other parts of the country
• However, the development supply of distribution warehouses has fallen since 2008, both
nationally and in the East Midlands, particularly that space developed speculatively. As well
as for total floorspace, this is also the case for units of 23,225 sqm or more.
• The East Midlands has seen one of the highest proportions of development – 59% –
accounted for by units of 23,225 sqm or more and– at 1.5 million sqm – the East Midlands
has seen the highest volume of floorspace as units of 23,225 sqm or more completed over
the past ten years of all regions
• For both the country and the East Midlands, there has been little space delivered to the
market as units of 23,225 sqm or more in the past six years, particularly speculatively.
• This has meant a significant constraint on available supply. For all sizes of units, there is
just 1.5 years of available supply and for the East Midlands, just 1.1 years. For units of
23,225 sqm or more, there is just 1.1 years available nationally and only 0.7 years available
in the East Midlands.
• Therefore whilst the East Midlands has been shown to be a favoured location for occupiers
for units of 23,225 sqm or more for which take-up has been strong, there has been little
new development in the past six years and as a result, available supply of large units is
highly constrained.

© copyright reserved 2015 Gerald Eve LLP Page 5
Drivers of occupier locational choice
• The key drivers of locational choice for large-scale logistics operators are:
o Transport accessibility
o Labour market conditions
o Clusters of large logistics units
• Transport accessibility is particularly important given the cost of transport as a part of
operations and therefore locations with good transport accessibility are considered superior
to those with poorer accessibility
• With regard to modes of transport considered, the East Midlands locations score well in
terms of road accessibility (as measured by the proportion of the population of Great Britain
that can be reached within a national and regional distribution drivetime) and rail
accessibility (as measured by the distance to the nearest rail freight interchange and the
quality of the link road to that interchange).
• Labour market conditions are also an important driver of occupier locational choice as the
requirements for operations within large-scale logistics warehouses are typically labour-
intensive and given the size of the buildings, require large labour forces.
• With regard to labour market indicators considered, a number of the East Midlands
locations score below-average scores particularly with regard to the potential size of the
appropriate labour pool (based on the number of resident economically-active people of
working age within a 30-minute drivetime around each point), the availability of labour
(based on the unemployment rate within a 30-minute drivetime around each point) and
wage rates for five logistics jobs (based on the comparison of current wages to a large-
sample average)
• Occupiers of large-scale distribution warehouses can also be driven to locate in areas with
close proximity to other large-scale logistics operators as a result of the potential
efficiencies achievable by being co-located with similar businesses or with suppliers or
customers.

© copyright reserved 2015 Gerald Eve LLP Page 6
Identification and assessment of appropriate competing sites
• There are 150 sites within an appropriate distance (50-mile radius) around Magna Park
Lutterworth that have standing property or have development land capable of
accommodating at least one unit of 23,225 sqm or more.
• Of these 150 sites, only 26 have standing units or land to accommodate potential units to
create a cluster of at least four units of 23,225 sqm or more. These 26 sites are categorised
as follows:
o Nine are sites where no standing stock currently exists and the development land
available has capacity to accommodate at least four units of 23,225 sqm or more
o Two are schemes where there are currently four or more units of 23,225 sqm but
there is no further development available capable of delivering any further units of
23,225 sqm or more
o 15 are sites where there are existing units of 23,225 sqm or more and there is
development land capable of accommodating more of these units and the total of
the existing and future potential stock total four or more units of 23,225 sqm or
more. Of these 15 sites, there are:
• Six schemes where there are currently fewer than four units of 23,225 sqm
or more but there is development land available to deliver more of these
units to take the sites over the four-unit threshold
• Nine schemes where there are currently four or more units of 23,225 sqm
and development land available to accommodate further units of this size
• Our assessment of these 26 sites is as follows:
o The majority of sites are located in Northamptonshire. There are only four
appropriate sites in Leicestershire.
o All but three of the 26 schemes have road connections ranked at least Good and
seven of the 26 schemes have Excellent road connections.
o Six of the 26 schemes have Excellent (or potentially Excellent) rail connections but
one has Poor rail connections and another eight have Average connections
o All 26 schemes have above-average access to markets although this ranged from a
low score of 113 (for Logistics Property Partnership Corby / Rockingham Hub) to a
high score of 137 (for Midway Park)
o Only eight schemes have above-average labour market conditions (of which three
are in Leicestershire); all 12 Northamptonshire schemes have below-average labour
market conditions, owing to relatively low unemployment rates and high wage rates.

© copyright reserved 2015 Gerald Eve LLP Page 7
o Nine of the 26 scheme offer immediate development opportunities for units of
23,225 sqm or more. Four sites are estimated to not be able to deliver units of
23,225 sqm or more within the next three years and in the case of Arm Farm in
Northamptonshire, not within at least five years.
o The majority of clusters on these sites are small: 14 of the 26 schemes have a
cluster – either existing or potential – of between four and seven units.
• Only the two top-ranked schemes – DIRFT and Magna Park Lutterworth – have existing
units and land for development to create a large cluster of more than 20 units of 23,225
sqm or more.
• Therefore when considering appropriate schemes currently or in the future capable of
delivering a cluster of four or more units of 23,225 sqm or more and assessing their relative
attractiveness based on key drivers of occupier locational choice, Magna Park Lutterworth
is the second highest ranked scheme within a 50-mile radius, with only DIRFT scoring
higher.
• Magna Park Lutterworth can therefore be considered a highly desirable location for
occupiers seeking large-scale logistics operations within this key distribution area in the
centre of the country.

© copyright reserved 2015 Gerald Eve LLP Page 8
3 Logistics property market conditions
3.1 TAKE-UP
By examining the distribution warehouse property market trends from the past several years, we can better understand the dynamics relating to what type of property has been demanded as well as the current supply trend and the market availability.
Between 2005 and 2014, 34.1 million sqm of distribution warehouse space as units of 4,645 sqm or more was taken up across Great Britain, an average of 3.4 million sqm per annum. As Chart 1 below shows, 2005 marked the peak of occupier take-up at 4.0 million sqm whilst volumes fell to just 2.7 million sqm in 2009, following the onset of the economic downturn. There was a substantial uplift in activity in 2010 (albeit this was down to market conditions becoming decidedly “buyer friendly” as a result of the overhang of available space following a massive development boom between 2005 and 2008) and then a decline again in 2011. However, since then, as a result of the economic recovery taking hold, take-up has steadily increased and in 2014, 3.9 million sqm was taken up by occupiers.
Chart 1. Occupier take-up of units of 4,645 sqm or more by unit size 2005-2014
Source: Gerald Eve

© copyright reserved 2015 Gerald Eve LLP Page 9
The majority of this space was taken up as units of less than 23,225 sqm; in 2014, 72% or 2.8 million sqm of the total 3.9 million sqm was taken up as units of less than 23,225 sqm. Units of 23,225 sqm or more account for 28% of total take up in 2014. Looking across all ten years, the proportion of total take-up that these units account for is 34%.
However, when examining the trend across the country, not every region exhibits the same behaviour. Whilst the national average is 34% of total take-up, the proportions range from 15% in Scotland to 46% in the East Midlands. Chart 2 shows the proportion of space taken up in each region by sizeband and that occupiers have had a proportionally greater appetite for larger units in the East Midlands relative to other unit sizes and other regions.
Also, in terms of actual floorspace taken up, the East Midlands has not only enjoyed the greatest proportion of take-up of units of 23,225 sqm but also the greatest overall volume: 2.1 million sqm was taken up as units of 23,225 sqm or more in the East Midlands between 2005 and 2014, followed by 1.6 million sqm in Yorkshire & the Humber and 1.7 million sqm in the South East & East.
Chart 2. Total take- up by region and by size of units as % of total, 2005-2014
Source: Gerald Eve

© copyright reserved 2015 Gerald Eve LLP Page 10
Table 1. Total occupier take-up, 2005-2014 by region and by size of units
East Midlands
Yorks & Humber
South East & East
South West & Wales
North East
North West
West Midlands
London Scotland All regions
Units under 23,2250 sqm
2.4 2.7 2.7 1.9 0.9 3.5 4.1 3.0 1.2 22.5
Units of 23,225 sqm or more
2.1 1.8 1.7 1.0 0.5 1.7 1.7 0.8 0.2 11.6
Total take-up 4.5 4.5 4.4 2.9 1.5 5.2 5.8 3.8 1.4 34.1
Units of 23,225 sqm or more as % of total take-up
46% 40% 38% 36% 36% 33% 29% 21% 15% 34%
Source: Gerald Eve

© copyright reserved 2015 Gerald Eve LLP Page 11
3.2 DEVELOPMENT COMPLETIONS
In terms of development supply of new space to the market, there was a total of 15.0 million sqm of
new logistics warehouse space of units of 50,000 sqm or more completed between 2015 and
2014. The majority of this space was completed during the last development boom of 2005-2008
when 10.2 million sqm or 68% of the total was delivered, an average of 2.6 million sqm a year.
Since the beginning of 2009, however, there has been just 4.8 million sqm completed, and average
of 0.7 million sqm a year. The majority of this space was delivered as units of less than 23,225
sqm: in 2014, 7.4 million sqm or 54% of completed logistics space was as units of less than 23,225
sqm.
Chart 3. Development completions of units of 4,645 sqm or more by unit size 2005-2014
Source: Gerald Eve
Again, when examining the trend across the country, not every region exhibits the same behaviour.
Whilst the national average is 51% for completion of units of 23,225 sqm or more as a proportion of
total development supply, the proportions range from 32% in London to 75% in the North East. The
East Midlands has the second highest proportion of development completions of units of 23,225
sqm or more at 59% followed by Yorkshire & the Humber at 58%. Chart 4 shows the proportion of
space delivered in each region by sizeband that developers have completed and shows that the
East Midlands has attracted a greater proportion of development of these larger units than nearly
all other regions.

© copyright reserved 2015 Gerald Eve LLP Page 12
In terms of actual floorspace developed, the East Midlands has enjoyed the greatest overall
volume of space built as units of 23,225 sqm: of the 2.4 million sqm completed in the region
between 2005 and 2014, 1.4 million sqm was as units if 23,225 sqm or more.
Chart 4. Total development completions by region and by size of units as % of total, 2005-
2014
Source: Gerald Eve
Table 2. Total development completions, 2005-2014 by region and by size of units
North East
East Midlands
Yorks & Humber
South West & Wales
North West
South East & East
West Midlands
Scotland London All regions
Under 23,225 sqm
0.1 1.0 0.9 0.5 1.0 1.0 1.2 0.4 1.2 7.4
Over 23,225 sqm
0.4 1.5 1.3 0.5 1.1 1.0 1.1 0.2 0.6 7.8
Total development completions
0.6 2.4 2.3 1.0 2.0 1.9 2.3 0.7 1.8 15.0
Units of 23,225 sqm and more as % of total completions
75% 59% 58% 53% 52% 50% 47% 37% 32% 51%
Source: Gerald Eve
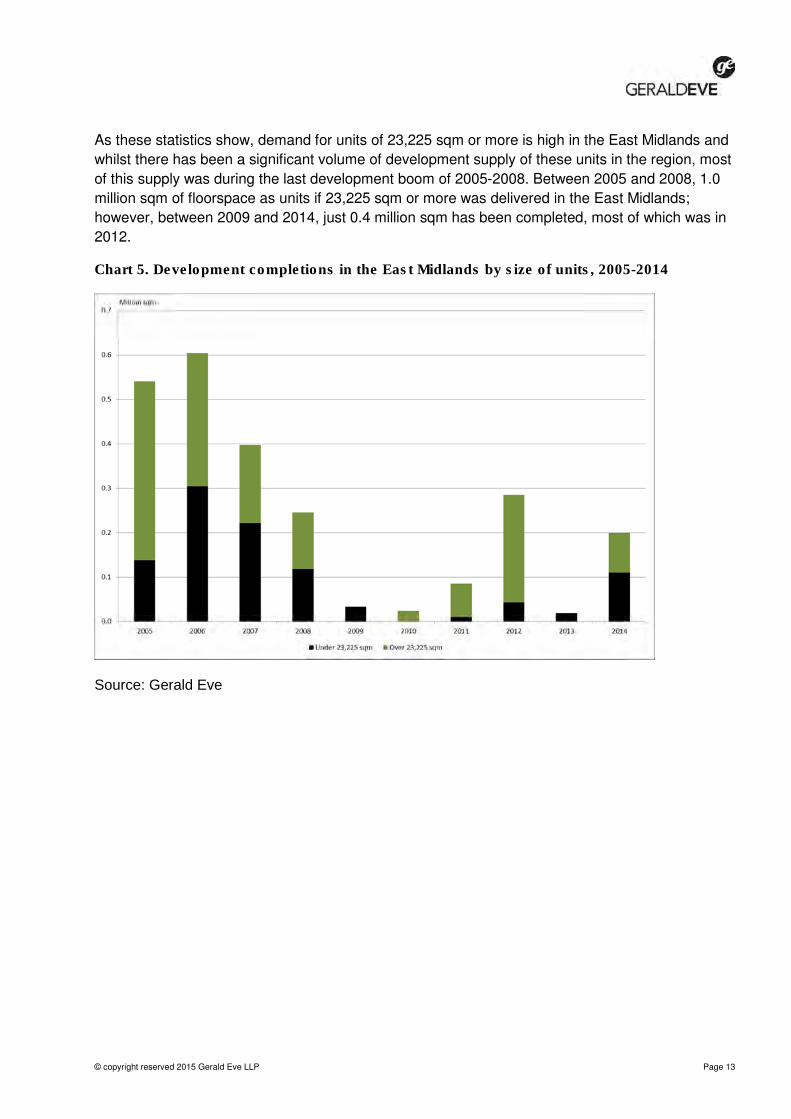
© copyright reserved 2015 Gerald Eve LLP Page 13
As these statistics show, demand for units of 23,225 sqm or more is high in the East Midlands and
whilst there has been a significant volume of development supply of these units in the region, most
of this supply was during the last development boom of 2005-2008. Between 2005 and 2008, 1.0
million sqm of floorspace as units if 23,225 sqm or more was delivered in the East Midlands;
however, between 2009 and 2014, just 0.4 million sqm has been completed, most of which was in
2012.
Chart 5. Development completions in the East Midlands by size of units, 2005-2014
Source: Gerald Eve

© copyright reserved 2015 Gerald Eve LLP Page 14
Also important to consider is not just the timing of the delivery of units of 23,225 sqm or more but
also the type of development, namely purpose-built space for committed occupiers to a bespoke
design or speculatively developed space.
The majority of logistics floorspace as units of 23,225 sqm or more completed in the past ten years
has been on a purpose-build basis: of the 7.8 million sqm completed between 2005 and 2014, 5.4
million sqm or 69% was developed on a committed build-to-suit basis. Just 2.4 million sqm or 31%
was built speculatively.
Chart 6. Development completions of units of 23,225 sqm or more by type of development,
2005-2014
Source: Gerald Eve
As the above chart shows, the majority of the space – both overall and on a speculative basis –
was completed in the 2005-2008 period. 5.1 million sqm or 66% of the total 7.8 million sqm for the
ten year period was delivered between 2005 and 2008. This is even more acute when considering
the speculative space completed: 2.3 million sqm or 97% of the total speculative supply to the
market was completed between 2005 and 2008.

© copyright reserved 2015 Gerald Eve LLP Page 15
In the East Midlands, the development completion statistics for units of 23,225 sqm or more are
similar to the country as a whole. 1.0 million sqm or 69% of the total 1.5 million sqm completed
during the decade was delivered between 2005 and 2008. Of the 0.4 million sqm of speculative
space built as units of 23,225 sqm or more in the East Midlands, 100% was completed between
2005 and 2008.
Chart 7. Development completions in the East Midlands of units of 23,225 sqm or more by
type of development, 2005-2014
Source: Gerald Eve
Therefore there has been little development of units of 23,225 sqm or more across the country and
the East Midlands and very little space developed speculatively since the beginning of 2009.
However, as we have already demonstrated, occupier demand for these types of units has
remained strong, both across the country and in the East Midlands. With a relatively low supply of
development of these units of 23,225 sqm or more but with strong demand, the availability of these
units is highly constrained, especially for good-quality space.

© copyright reserved 2015 Gerald Eve LLP Page 16
3.1 AVAILABILITY
The availability of standing stock of unit of 4,645 sqm has fallen dramatically over the past seven
years since the end of the last development boom. At the end of 2007, availability of standing stock
(that is, existing buildings being marketed as available for occupation) stood at just under 8 million
sqm, of which 3.1 million sqm was considered new/modern quality (typically newly built or
refurbished units). However, by the end of 2014, following continued and significant take-up of
space and a lack of speculative development, availability stood at just 5 million sqm, of which only
0.7 million sqm is considered new/modern.
Chart 8. availability of logistics floorspace as units of 4,645 sqm or more by quality, 2005-
2014
Source: Gerald Eve
Based on the long term average annual take-up between 2005 and 2014 (at 3.4 million sqm per
annum), this has meant that at the end of 2007, there was 2.3 years of available supply. However,
by the end of 2014, there was just 1.5 years of available supply
However, when considering the availability of units of 23,225 sqm or more, there is an even more
constrained supply. In Q4 2007, there was 2.4 million sqm of floorspace as units of 23,225 sqm or
more available across the country, of which 1.7 million sqm was considered new/modern. At the
end of 2014, there was just 1.3 million sqm of floorspace as units of 23,225 sqm or more available
across the country, of which 0.3 million sqm was considered new/modern.

© copyright reserved 2015 Gerald Eve LLP Page 17
Based on the long term average annual take-up of units of 23,225 sqm or more between 2005 and
2014 (at 1.2 million sqm per annum), this has meant that at the end of 2007, there was 2.1 years of
available supply. However, by the end of 2014, there was just 1.1 years of available supply.
In the East Midlands, the situation with regard to available supply of units of 23,225 sqm or more is
even more constrained. Based on the long term average annual take-up of units of 23,225 sqm or
more in the East Midlands between 2005 and 2014 (at 0.2 million sqm per annum), this has meant
that at the end of 2007, there was 1.3 years of available supply. However, by the end of 2014,
there was just 0.7 years of available supply.
Table 3. Availability of logistics floorspace and years of supply, Q4 2007 and Q4 2014
Q4 2007 Q4 2014
ALL UNIT SIZEBANDS
Floorspace (million sqm)
Country 7.9 5.0
East Midlands 0.7 0.5
Years of supply (years)
Country 2.3 1.5
East Midlands 1.6 1.1
UNITS OF 23,225 SQM OR MORE
Floorspace (million sqm)
Country 2.4 1.3
East Midlands 0.3 0.1
Years of supply (years)
Country 2.1 1.1
East Midlands 1.3 0.7
Source: Gerald Eve
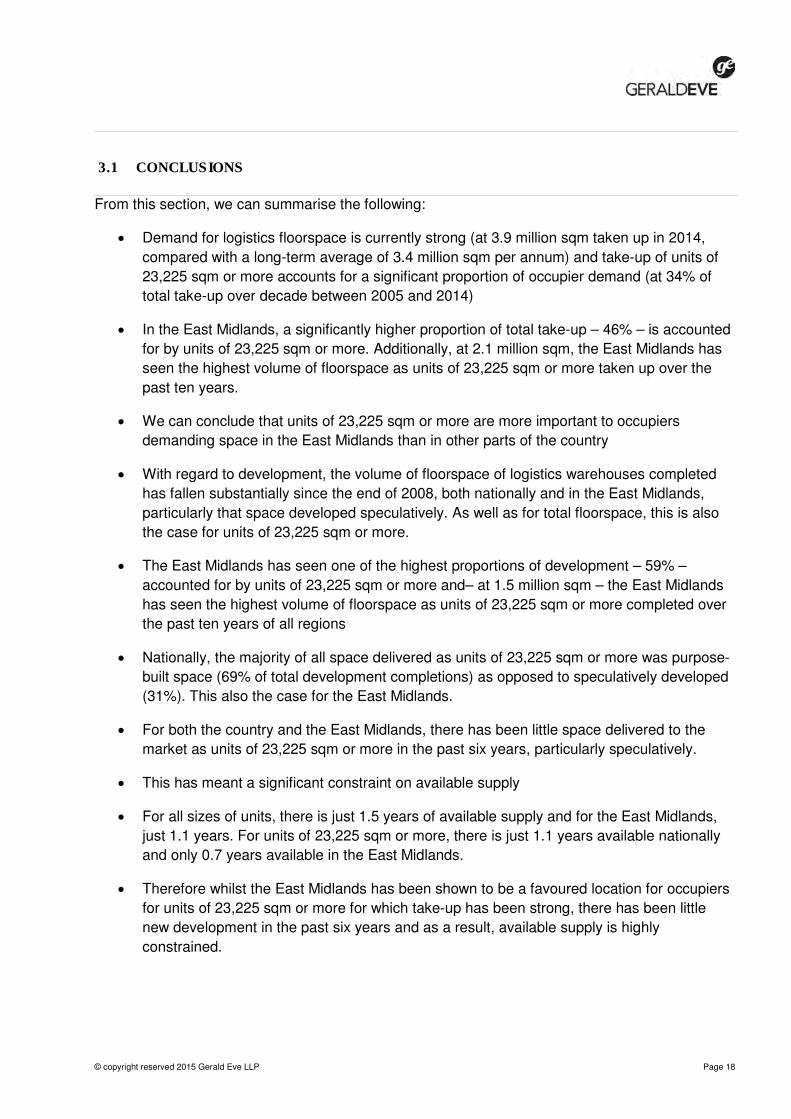
© copyright reserved 2015 Gerald Eve LLP Page 18
3.1 CONCLUSIONS
From this section, we can summarise the following:
• Demand for logistics floorspace is currently strong (at 3.9 million sqm taken up in 2014,
compared with a long-term average of 3.4 million sqm per annum) and take-up of units of
23,225 sqm or more accounts for a significant proportion of occupier demand (at 34% of
total take-up over decade between 2005 and 2014)
• In the East Midlands, a significantly higher proportion of total take-up – 46% – is accounted
for by units of 23,225 sqm or more. Additionally, at 2.1 million sqm, the East Midlands has
seen the highest volume of floorspace as units of 23,225 sqm or more taken up over the
past ten years.
• We can conclude that units of 23,225 sqm or more are more important to occupiers
demanding space in the East Midlands than in other parts of the country
• With regard to development, the volume of floorspace of logistics warehouses completed
has fallen substantially since the end of 2008, both nationally and in the East Midlands,
particularly that space developed speculatively. As well as for total floorspace, this is also
the case for units of 23,225 sqm or more.
• The East Midlands has seen one of the highest proportions of development – 59% –
accounted for by units of 23,225 sqm or more and– at 1.5 million sqm – the East Midlands
has seen the highest volume of floorspace as units of 23,225 sqm or more completed over
the past ten years of all regions
• Nationally, the majority of all space delivered as units of 23,225 sqm or more was purpose-
built space (69% of total development completions) as opposed to speculatively developed
(31%). This also the case for the East Midlands.
• For both the country and the East Midlands, there has been little space delivered to the
market as units of 23,225 sqm or more in the past six years, particularly speculatively.
• This has meant a significant constraint on available supply
• For all sizes of units, there is just 1.5 years of available supply and for the East Midlands,
just 1.1 years. For units of 23,225 sqm or more, there is just 1.1 years available nationally
and only 0.7 years available in the East Midlands.
• Therefore whilst the East Midlands has been shown to be a favoured location for occupiers
for units of 23,225 sqm or more for which take-up has been strong, there has been little
new development in the past six years and as a result, available supply is highly
constrained.

© copyright reserved 2015 Gerald Eve LLP Page 19
4 Drivers of occupier locational choice
4.1 AREAS OF CONSIDERATION
Understanding the drivers of occupier demand is important as it reveals the conditions that occupiers seek in order to make commitments to logistics property. Whilst availability of appropriate properties or land for development are important, they are often chosen as a result of narrowing locations by attractive dynamics in two key operating fundamentals: transport accessibility and labour market conditions.
Occupiers of substantial size are often also attracted to locations by the ability to be located in the same area as other larger occupiers, to enjoy business synergies being so proximate and to enjoy facilities provided specifically for larger logistics operators on appropriately logistics-specific distribution parks and sites.
The following sections of this report considers these three aspects of drivers of occupiers locational choice in turn as follows:
• Transport accessibility
• Labour market conditions
• Clusters of large logistics units

© copyright reserved 2015 Gerald Eve LLP Page 20
4.2 TRANSPORT ACCESSIBILITY
Transport accessibility is a key factor when determining location for regional and national distribution centres as the ability to transport goods to customers – that is, the access to markets – has a direct impact on cost. Indeed, research by the European Commission shows that logistics costs (including costs for transportation and warehousing) on average account for between 10% and 15% of the final cost of the finished product1. Therefore choosing the right location for distribution of goods to markets can therefore have a substantial impact on cost.
The Golden Triangle – broadly the area between Leicester, Coventry and Northampton – is considered the optimal position for national distribution as a result of its geographic location in roughly the centre of Great Britain.
The area also benefits from excellent transport links, allowing access to some of the most densely populated areas of the country. Considering the means of transport of freight, the mode still most important to the movement of goods around Great Britain is road. Roads remain the primary means of transporting goods around Great Britain; in 2010, 85% of total non-petroleum/coal-and-coke freight was moved around the country by road; just 7% was moved by rail and 7% by waterways. Therefore access to good-quality road links are an essential consideration of locational choice for occupiers. The Golden Triangle and the Midlands generally enjoy excellent access to a large number of key road links including both main north-south motorways (the M1 and M6) and key A roads including A14 which links the UK’s largest container port – the Port of Felixstowe – to major population centres and to some of the largest rail freight terminals in the country for further movement of goods throughout Great Britain.
To be able to assess relative attractiveness of locations for access to markets by road, we have considered the population that can be reached with an appropriate drivetime for different types of distribution, namely regional distribution and national distribution. The number of people who are resident within a drivetime are considered a good proxy for attractiveness for logistics operation as it is an indication of the density of consumers that will need to be served by retail outlets and businesses where the resident population work within these areas which require goods to be transported to them for replenishment of stock for consumers to buy or businesses to use as people typically tend to shop and work in locations proximate to where they live.
Using GIS software, we have determined isochrones appropriate for regional and national distribution profiles. For regional distribution, we have used a drivetime of 2.5 hours (that is, capable of two round trip deliveries per day) and for national distribution, we have used 4.5 hours (that is, one round trip delivery per day). We have run these isochrones for 230 locations across the country and then calculated the number of resident people within each area.
The average resident population within a regional distribution drivetime is 45% of total population of Great Britain (24.7 million) and 84% (49.4 million) for national distribution drivetimes. For national distribution, this ranges from 24% for poorer
1 Commission of the European Communities, Freight Transport Logistics in Europe – the key
to sustainable mobility, June 2006

© copyright reserved 2015 Gerald Eve LLP Page 21
situated locations (typically in more marginal locations to the north and east) to 91% for the best placed locations for national distribution and 7% to 65% for regional distribution.
The East Midlands ranks amongst the highest of all 396 locations across the country for both national and regional distribution. Of the 90 East Midlands locations assessed, all but three are in the top half of locations ranked for national distribution and all but 26 for regional distribution: for national distribution, the range was 88% to 91% whereas for regional distribution it was 39% to 65%.
Map 1 below shows points around which 4.5 hour drivetimes have been generated and shows the proportion of total GB population that can be reached within a national drivetime from these points. As the map shows, there is a concentration of the highest ranked locations in the East and West Midlands.

© copyright reserved 2015 Gerald Eve LLP Page 22
Map 1. Proportion of total population of Great Britain that can be reached within a national drivetime from selected locations of logistics operations
Source: Gerald Eve, Experian

© copyright reserved 2015 Gerald Eve LLP Page 23
Rail links are also important to distribution operations but as stated earlier, a significantly smaller
proportion of total freight is moved by rail. However, as road congestion has made journey times
and costs more unpredictable and as rail freight is considered more closely by local and national
government in order to affect modal switch for movement of goods, the links from each logistics
location to the nearest rail freight interchange are considered more and more important.
Rail links for each location have been considered in terms of the distance to the nearest rail freight
interchange and the quality of the link road to the nearest rail freight interchange.
From this analysis, we have determined that locations in the East Midlands score well in terms of
rail connectivity as many are located within a 20-mile distance to the nearest rail freight
interchange including six sites that have rail heads on site or proposed for development on site,
namely:
• Arm Farm, Milton Malsor, Northamptonshire
• CIRFT, Corby, Northamptonshire
• DIRFT, Daventry, Northamptonshire
• East Midlands Gateway, Castle Donington, Leicestershire
• East Midlands Intermodal Park, Etwall, Derbyshire
• EMDC, Castle Donington, Leicestershire

© copyright reserved 2015 Gerald Eve LLP Page 24
4.3 LABOUR MARKET CONDITIONS
Labour is also a major factor for occupiers to consider when choosing a distribution location. There are several key factors that occupiers consider including:
• The availability of appropriate labour
• The cost of appropriate labour
The availability of labour is important particularly for large footprint buildings due to the demand for high numbers of staff and especially as many warehouse operations are labour-intensive. Operations will be severely impaired if there is inadequate staff to run the distribution centre.
Jobs typically located in distribution warehouses for the purpose of operating the warehouse itself for the movement of goods (as opposed to clerical, technical, management and sales roles that may also be undertaken on site) are as follows:
• Operating forklift trucks to move pallets of cargo
• Picking and packing goods for dispatch and ’breaking down’ loads of goods on arrival and moving goods to the appropriate storage areas
• Management of the warehouse operations
• Driving goods vehicles (particularly Class 1/Cat C&E and Class 2/Cat C) for delivery of goods to and from the distribution centre
Factors that are key when considering the appropriateness of the labour pool in a distribution location are as follows:
• The supply of labour proximate to the distribution centre – that is, the number of economically active people who live within a reasonable distance to the warehouses
• Wage rates – given the volumes of workers required to staff distribution warehouses, particularly those of substantial scale, wage rates can make a significant impact on the operating costs to run such a facility
• Qualifications – skills in particular areas relating to logistics operations – such as forklift truck operation and HGV driving – are necessary in logistics warehouses and as a result, can be insignificant demand in areas of high concentrations of these facilities

© copyright reserved 2015 Gerald Eve LLP Page 25
We have assessed locations across the country to create a large sample of data against which to be able to compare the East Midlands locations to determine relative attractiveness from an occupier perspective. We have collected information as follows:
• The number of people of working age within a 30-minute drivetime around 389 specific locations
• The unemployment rate within these 30-minute drivetime areas
• Wage rates for five logistics warehouse-specific jobs within the vicinity of these 389 specific locations. These jobs are:
o Warehouse operatives
o Forklift truck operators
o Drivers of Class 2/Cat C vehicles
o Drivers of Class 1/Cat C&E vehicles
o Warehouse managers
Map 2 shows the overall score for each of the 389 points considered in this study based on an unweighted comparison of all three of the above categories.
Based on our assessment of labour market conditions across the country, the East Midlands can be considered relatively constrained with regard to labour market conditions, particular as a result of:
• Below-average pool of labour for 54 of 79 locations in the East Midlands (based on the number of resident economically-active people of working age within a 30-minute drivetime around each point)
• Constrained availability of labour for 69 of 79 locations in the East Midlands (based on the unemployment rate within a 30-minute drivetime around each point)
• Higher-than-average wage rates for five logistics jobs for 35 of 79 locations in the East Midlands (based on the comparison of current wages to a large-sample average)

© copyright reserved 2015 Gerald Eve LLP Page 26
Map 2. Labour market conditions score for selected locations of logistics operations
Source: Gerald Eve, Experian

© copyright reserved 2015 Gerald Eve LLP Page 27
4.4 CLUSTERS OF LARGE LOGISTICS UNITS
What is also important to certain occupiers who are interested in larger units is the colocation with other large occupiers in the immediate vicinity as well. This is because similar types of occupiers– either by the type or scale of building the occupier occupies or by the industries or disciplines in which they operate – can achieve efficiencies by being located on the same park/estate. Potential efficiencies may be achievable by being co-located with similar businesses or with suppliers providing goods to the occupier or customers being supplied by the occupier.
Clusters form in different types of property – including as office parks, research and technology properties (including laboratory space), industrial estates and distribution parks – around different business operations. What is characteristic of these business and property clusters is that there is a similarity with regard to the type of operation and therefore property type on these sites. This includes the use class of property and the size of units on site. Some industrial estates – particularly those that have evolved as the local and national economy have grown – have grown to include both distribution park and industrial estate characteristics – with a number of larger scale distribution units as well as smaller, often terraced multi-let light industrial units.
With regard to distribution parks, clusters typically form where the type of property are usually all consistently large. There are examples of distribution park clusters forming across the country, such as DIRFT, Daventry; Magna Park Lutterworth; Prologis Park Marston Gate, near Bedford; Hams Hall, Coleshill; Wakefield Europort, Wakefield; Heywood Distribution Park, Heywood, Greater Manchester; and Eurocentral, Motherwell, near Glasgow.
With regard to what is considered large, based on our knowledge of the logistics property market and understanding of occupier occupational uses, we have used the threshold of 23,225 sqm to define units as large. This is also consistent with the analysis of large scale warehouse demand in the Leicester and Leicestershire Strategic Distribution Sector Study. Also as shown earlier, units over 23,225 sqm are taken up in the East Midlands in the greatest volume and proportion of total take-up than any other part of the country.
Therefore in order to consider the appropriate supply of sites for the development of logistics clusters of the favoured large units, we have set the threshold unit size to be 23,225 sqm for consideration of availability of land/schemes with this size property in a cluster or potential cluster so as to assess the supply of appropriate future logistics clusters.
With regard to the number of units of this size within a specific scheme in order to consider it a significant cluster, we have set the threshold as no less than four units of 23,225 sqm or more. This is based on our market knowledge and understanding of the way in which businesses operate, particularly those with significant property and operational requirements such as those that are necessarily accommodated within large units of more than 23,225 sqm.
The following sections detail the identification and assessment of appropriate cluster sites within a 50 mile radius of Magna Park Lutterworth to determine the competition of relevant schemes within Leicestershire, the East Midlands and beyond.

© copyright reserved 2015 Gerald Eve LLP Page 28
4.5 CONCLUSIONS
From this section, we can summarise the following:
• The key drivers of locational choice for large-scale logistics operators are:
o Transport accessibility
o Labour market conditions
o Clusters of large logistics units
• Transport accessibility is particularly important given the cost of transport as a part of
operations and therefore locations with good transport accessibility are considered superior
to those with poorer accessibility
• With regard to modes of transport considered, the East Midlands locations score well in
terms of road accessibility (as measured by the proportion of the population of Great Britain
that can be reached within a national and regional distribution drivetime) and rail
accessibility (as measured by the distance to the nearest rail freight interchange and the
quality of the link road to that interchange).
• Labour market conditions are also an important driver of occupier locational choice as the
requirements for operations within large-scale logistics warehouses are typically labour-
intensive and given the size of the buildings, require large labour forces.
• With regard to labour market indicators considered, a number of the East Midlands
locations score below-average scores particularly with regard to the potential size of the
appropriate labour pool (based on the number of resident economically-active people of
working age within a 30-minute drivetime around each point), the availability of labour
(based on the unemployment rate within a 30-minute drivetime around each point) and
wage rates for five logistics jobs (based on the comparison of current wages to a large-
sample average)
• Occupiers of large-scale distribution warehouses can also be driven to locate in areas with
close proximity to other large-scale logistics operators as a result of the potential
efficiencies achievable by being co-located with similar businesses or with suppliers or
customers.

© copyright reserved 2015 Gerald Eve LLP Page 29
5 Identification and assessment of appropriate competing sites
5.1 INTRODUCTION
Therefore, considering that for regional and national distribution, units of over 23,225 sqm are those that are most attractive to occupiers, we must consider the availability of sites that could accommodate these types of buildings and the offer with regard to operating in a substantial cluster for mutual benefit. We must then assess their relative ‘strength’ with regard to the key operating factors when considering occupiers’ drivers of locational choice, namely transport accessibility, labour market conditions and the presence of (or the potential to create) an appropriate cluster of sufficiently large units.
This process has involved several different classification processes including:
• Determining the location of units of 23,225 sqm or more or sites capable of accommodating such units
• Classifying each unit/site into appropriate categories according to the nature of the property/scheme
• Determining the scale of clusters of units of 23,225 sqm or more, either existing or potential

© copyright reserved 2015 Gerald Eve LLP Page 30
5.2 THE AVAILABILITY OF SITES
Through careful research using a variety of sources including our take-up and development supply databases, availability searches, planning searches, directories and other sources, we have built a database of all available sites currently accommodating or capable of accommodating distribution warehouse units of 23,225 sqm or more within a 50 mile radius around Magna Park.
There are 150 sites within this area, of which the following information has been determined:
• 18 sites are standalone units, usually owner-occupied properties in unique locations with few to no neighbouring properties being used for economic purposes
• 46 sites are sites than can be considered industrial estates that have evolved, rather than having been masterplanned and developed by a discrete developer. Examples of these types of sites are Brackmills Industrial Estate in Northampton, Royal Oak Industrial Estate and Drayton Fields Industrial Estate in Daventry and Dodwells Bridge Industrial Estate in Hinckley.
• 48 sites are sites that have been masterplanned and developed by a single or several developers and have a consistency in building type, park environment and type of business operation. Examples of this include Magna Park Lutterworth, Prologis Park Ryton near Coventry, Swan Valley and Prologis Park Pineham near Northampton, Midpoint Park in Minworth and Birch Coppice Business Park near Dordon.
• 38 sites sites are development sites on which building has yet to commence. We have used information published by developers – as part of a planning application or as part of marketing or consultation exercises – that advise the volume of distribution warehouse floorspace and the configuration of buildings to determine schemes that are capable and planning to deliver units of 23,225 sqm or more. These sites include schemes such as Northampton Gateway near Northampton, East Midlands Intermodal Park near Etwall in Derbyshire and Houghton Regis Northern Extension near Dunstable.

© copyright reserved 2015 Gerald Eve LLP Page 31
Map 3. Location of sites within 50 mile radius of Magna Park Lutterworth by site category
Source: Gerald Eve

© copyright reserved 2015 Gerald Eve LLP Page 32
Of these sites with existing developed space, not all are comparable to a scheme of Magna Park’s scale, both in terms of floorspace and number of units. Given the benefits of clustering businesses of a certain scale within a specified area with the result being that there are a significant number of buildings grouped together, we must consider the current standing stock of the appropriate size arranged in such a configuration.
We have considered an appropriate cluster to be a scheme with no less than four units of 23,225 sqm or more. Note that there may additionally be further units of less than 23,225 sqm on the site but in order to qualify as an appropriate cluster, there must be at least four units of 23,225 sqm or more.
Of the 150 sites identified, only 112 have existing buildings currently standing. Of these sites, only 11 have four or more buildings of 23,225 sqm or more.
However, competing supply is not just confined to those sites that can currently be considered comparable as cluster locations of units of 23,225 sqm or more. We must also consider the appropriate future supply of these types of units and overall appropriate schemes.
Of the 150 sites identified, 64 sites have development land capable of accommodating units of 23,225 sqm or more. 38 are development sites with no current standing stock and 26 are current schemes with standing buildings already onsite that have further development land that is capable of accommodating at least one unit of 23,225 sqm or more.
However, in line with our consideration of appropriate comparable supply of current standing stock, we must also refine the number of sites with development capability to those with capacity for a total of four or more units of 23,225 sqm or more.
Of the 150 sites identified, there are 26 sites that either already have or have the development land available to accommodate a total of four or more units of 23,225 sqm or more. Of these 26 sites, we can observe the following:
• Nine are sites where no standing stock currently exists and the development land available
has capacity to accommodate at least four units of 23,225 sqm or more
• Two are schemes where there are currently four or more units of 23,225 sqm but there is
no further development available capable of delivering any further units of 23,225 sqm or
more
• 15 are sites where there are existing units of 23,225 sqm or more and there is development
land capable of accommodating more of these units and the total of the existing and future
potential stock total four or more units of 23,225 sqm or more. Of these 15 sites:
o There are six schemes where there are currently fewer than four units of 23,225
sqm or more but there is development land available to deliver more of these units
to take the sites over the four-unit threshold
o There are nine schemes where there are currently four or more units of 23,225 sqm
and development land available to accommodate further units of this size

© copyright reserved 2015 Gerald Eve LLP Page 33
Map 4. Location of sites with development land available capable of bringing total number of units of 23,225 sqm or more to more than four units
Source: Gerald Eve

© copyright reserved 2015 Gerald Eve LLP Page 34
Table 4. Schemes with existing units and development land capable of accommodating a total of four or more units of 23,225 sqm or more
Name County/UA Size (ha)
Existing floor-space (sqm)
Units of 23,225 sqm or more
Existing units
Potential units
Total units
Arm Farm Northamptonshire 57 0 0 17 17
Birch Coppice Business Park / Hall End Business Park / St Modwen Land
Warwickshire 221 343,630 5 4 9
Brackmills Northamptonshire 295 819,024 8 1 9
Centrum 100 Staffordshire 81 307,314 5 1 6
DIRFT Northamptonshire 518 555,553 11 14 25
Dove Valley Park Derbyshire 105 89,765 2 2 4
East Midlands Gateway Leicestershire 138 0 0 10 10
East Midlands Intermodal Park
Derbyshire 230 0 0 8 8
Fradley Park / Prologis Fradley Park
Staffordshire 160 331,389 3 2 5
Gateway Park - Southern Zone West Midlands 81 0 0 7 7
Hams Hall Warwickshire 174 440,492 4 0 4
Interlink/Bardon/Mountpark Leicestershire 159 437,002 5 2 7
Logistics Property Partnership Corby / Rockingham Hub
Northamptonshire 43 49,052 1 3 4
Magna Park Lutterworth Leicestershire 405 962,635 16 8 24
Magna Park Milton Keynes / Eagle Farm North
Milton Keynes UA 108 319,938 5 5 10
Midway Park Northamptonshire 129 0 0 13 13
Northampton Gateway Northamptonshire 159 0 0 4 4
Park Farm Ind Est / Prologis Park Wellingborough West
Northamptonshire 179 289,761 4 4 8
Peterborough Gateway Cambridgeshire 97 3,437 0 8 8
Prologis Park Corby Northamptonshire 61 0 0 4 4
Prologis Park Coventry West Midlands 107 211,063 5 0 5
Prologis Park Kettering Northamptonshire 49 157,855 3 1 4
Royal Oak Industrial Estate Northamptonshire 104 421,898 3 1 4
Swan Valley Industrial Estate / Prologis Park Pineham
Northamptonshire 216 670,302 11 2 13
Symmetry Park Leicestershire 88 0 0 4 4
Warth Park Northamptonshire 70 122,086 3 2 5
Source: Gerald Eve
It is these 26 sites that we must then consider in detail to assess their relative offering and attractiveness to occupiers as a means of securing occupier demand.

© copyright reserved 2015 Gerald Eve LLP Page 35
5.3 ASSESSMENT OF APPROPRIATE SITES
In order to compare each site relative to one another, we have developed a matrix of assessment criteria which fall into key areas as follows:
• Scope and scale of cluster (based on the number of large units of 23,225 sqm or more
existing and/or capable of being developed on the site)
• Planning status of each site
• Labour market dynamics, including available labour pool, unemployment rates and wage
rates for specific logistics jobs
• Transport connectivity, including access to markets (based on population within regional
and national distribution drivetimes), proximity and quality of road links (based on distance
to nearest motorway junction, quality of the roadlink to that junction and the number of
junctions within a ten-mile radius) and rail freight terminal accessibility (based on distance
to nearest rail freight terminal and quality of the roadlink to that terminal)
• Deliverability including likely timing of availability for development of large units (based on
planning status and signalled intent from developers)
In order to be able to assess each site appropriately, we have chosen measures that can be
assessed objectively and have used where possible national or large-sample averages to
assess each site in context.
Each of the 26 schemes has been assessed according to these criteria – each scheme’s report can been seen in Appendix A.

© copyright reserved 2015 Gerald Eve LLP Page 36
The results of these assessments are as follows:
Existing and potential clusters
• 9 sites have no existing standing stock and all units of 23,225 sqm are potential units yet
to be developed
• 6 sites currently have less than four standing units of more than 23,225 sqm but have
development land capable of being developed as large units of more than 23,225 sqm to
take the total of these units on these sites to four or more
• 11 sites already have four or more standing units of 23,225 sqm or more
Size of clusters
• 8 sites have standing stock or development potential for a cluster of large buildings of 10
or more units
• 18 sites have or have potential for less than 10 large units
Planning status
• 5 sites with no planning or development consent in place (although one has recently
been allocated as a strategic employment site in the Local Plan)
• 6 sites currently have planning or development consent applications that are being
considered
• 15 sites currently have planning consent already in place
Timing of delivery
• 9 sites have development plots that could be developed immediately
• 3 sites have development plots that could be developed within a year
• 6 sites have development plots that could be developed within 1-2 years
• 3 sites have development plots that could be developed within 2-5 years
• 1 site has development land that could be developed within 5-10 years
• 4 sites have no development plots remaining

© copyright reserved 2015 Gerald Eve LLP Page 37
We have then allocated numeric scoring for the key assessment characteristics discussed in
Section 4 and rebased these scores around a large-sample average or the midpoint position.
We have then summed and rebased these scored for all 26 schemes to determine an overall
assessment of attractiveness and deliverability.
The means of assessment for each of the following key criteria as follows:
• Road links: a score of 1 to 5 has been determined according to the overall road
accessibility assessment for each scheme (Excellent = 5, Very good = 4, Good = 3,
Average = 2, Poor = 1). These have then been rebased to an average of 100 for the
midpoint position (3)
• Rail links: a score of 1 to 5 has been determined according to the overall rail
accessibility assessment for each scheme (Excellent = 5, Very good = 4, Good = 3,
Average = 2, Poor = 1). These have then been rebased to an average of 100 for the
midpoint position (3)
• Access to markets: this score is the average of the two rebased scores for the
proportion of the population of Great Britain that can be reached within a national
(4.5 hour) and regional (2.5 hour) drivetime from each scheme (the proportion is
rebased around the average for all 406 locations assessed)
• Labour market: this score is the average of the three rebased scores for the size of
the pool of employment aged resident population within a 30-minute drivetime from
each scheme, the unemployment rate within a 30-minute drivetime from each
scheme and the average wage rates relative to the average for all 389 locations
assessed
• Timing: a score of 1 to 5 has been determined according to the estimated timing of
delivery of development at each scheme (Immediately = 5, Less than 1 year = 4, 1-2
years = 3, 2-5 years = 2, 5-10 years = 1, no further development = 0). These have
then been rebased to an average of 100 for the midpoint position
• Scale of cluster: a score of 1 to 5 has been determined according to the number of
units of 23,225 sqm or more that are currently or can be accommodated at each
scheme (4-7 units = 1, 8-11 units = 2, 12-15 units = 3, 16-19 units = 4, 20 units or
more = 5). These have then been rebased to an average of 100 for the midpoint
position
• Overall score and rebased score: the sum of all six scores from the categories
above which is the rebased around the average of 100
For more information about the determination of the scores detailed above, please see Appendix A explanatory notes.
The following table shows the resulting scores for each scheme:

© copyright reserved 2015 Gerald Eve LLP Page 38
Table 5: Scoring for 26 schemes of four or more units of 23,225 sqm or more within 50 mile radius of Magna Park Lutterworth Scheme name County/UA Road links Rail links Access to
market Labour market
Timing Scale of cluster
Score Rebased score
DIRFT Northamptonshire 145 167 136 94 200 167 909 151
Magna Park Lutterworth Leicestershire 145 133 133 102 120 167 801 133
Swan Valley Industrial Estate / Prologis Park Pineham
Northamptonshire 145 100 130 89 200 100 764 127
Birch Coppice Business Park / Hall End Business Park / St Modwen Land
Warwickshire 136 167 125 105 160 67 760 127
East Midlands Gateway Leicestershire 145 167 123 111 120 67 732 122
Midway Park Northamptonshire 145 117 138 86 120 100 706 118
Arm Farm Northamptonshire 136 167 127 88 40 133 692 115
Fradley Park / Prologis Fradley Park Staffordshire 109 117 123 101 200 33 682 114
Symmetry Park Leicestershire 145 133 137 102 120 33 671 112
Interlink/Bardon/Mountpark Leicestershire 136 83 124 92 200 33 670 112
East Midlands Intermodal Park Derbyshire 109 167 114 86 120 67 663 110
Magna Park Milton Keynes / Eagle Farm North
Milton Keynes UA 127 67 126 101 160 67 647 108
Prologis Park Kettering Northamptonshire 100 100 123 81 200 33 638 106
Peterborough Gateway Cambridgeshire 118 50 123 78 200 67 636 106
Centrum 100 Staffordshire 91 100 114 80 200 33 619 103
Park Farm Industrial Estate / Prologis Park Wellingborough West
Northamptonshire 91 83 122 86 160 67 609 101
Dove Valley Park Derbyshire 100 67 113 82 200 33 595 99
Hams Hall Warwickshire 145 167 127 118 - 33 591 98
Warth Park Northamptonshire 73 67 121 82 200 33 577 96
Gateway Park - Southern Zone West Midlands 127 100 131 96 80 33 567 95
Northampton Gateway Northamptonshire 127 83 129 91 80 33 543 91
Brackmills Northamptonshire 136 100 124 83 - 67 510 85
Logistics Property Partnership Corby / Rockingham Hub
Northamptonshire 73 83 113 71 120 33 493 82
Prologis Park Coventry West Midlands 109 100 129 105 - 33 476 79
Royal Oak Industrial Estate Northamptonshire 118 117 126 71 - 33 465 78
Prologis Park Corby Northamptonshire 73 67 122 76 80 33 451 75
AVERAGE 100 100 100 100 100 100 600 100
Source: Gerald Eve

© copyright reserved 2015 Gerald Eve LLP Page 39
5.4 CONCLUSIONS FROM SITE ASSESSMENT
The following conclusions can be drawn from the data:
• The majority of sites are located in Northamptonshire. There are only four appropriate sites in Leicestershire.
• All 26 schemes have road connections ranked at least Good and 15 of the 26 schemes have Excellent road connections.
• Six of the 26 schemes have Excellent (or potentially Excellent) rail connections but three have Poor rail connections and another six have Average connections
• All 26 schemes have above-average access to markets although this ranged from a low score of 113 (for Logistics Property Partnership Corby/HubRockingham) to a high score of 137 (for Midway Park)
• Only eight schemes have above-average labour market conditions (of which three are in Leicestershire); all 12 Northamptonshire schemes have below-average labour market conditions, owing to relatively low unemployment rates and high wage rates.
• Nine of the 26 scheme offer immediate development opportunities for units of 23,225 sqm or more. Four sites are estimated to not be able to deliver units of 23,225 sqm or more within the next three years and in the case of Arm Farm in Northamptonshire, not within at least five years.
• The majority of clusters on these sites are small: 14 of the 26 schemes have a cluster – either existing or potential – of between four and seven units.
• Only the two top-ranked schemes – DIRFT and Magna Park Lutterworth – have existing units and land for development to create a large cluster of more than 20 units of 23,225 sqm or more.

© copyright reserved 2015 Gerald Eve LLP Page 40
6 Conclusions
6.1 OVERALL CONCLUSIONS
Therefore we can conclude from our analysis of drivers of occupier locational choice and of the potential size and timing of logistics property clusters the following:
• Units of 23,225 sqm or more are in demand in the East Midlands, more so than any other region in the country
• However, supply of these units is relatively constrained when considering the recent development completions and available standing stock
• Occupiers are driven to select logistics locations based on key operational factors relating to:
o Transport accessibility
o Labour market conditions
o The presence of large logistics property clusters
Based on our identification and assessment of appropriate schemes within a 50 mile area of competition around Magna Park Lutterworth, we can conclude:
• There are only 26 schemes that offer a substantial cluster of appropriately sized logistics units (units of 23,225 sqm or more) within the area comprising 50 mile radius of Magna Park
• Of these 26 schemes, only four are in Leicestershire
• Comparing the overall assessment of these sites, there is only one scheme that scores higher than Magna Park Lutterworth – namely, DIRFT which is located in Northamptonshire
• Magna Park Lutterworth scores amongst the highest of the schemes assessed in terms of road connectivity
• There are only a limited number of schemes that can offer better rail links than Magna Park Lutterworth
• Labour market conditions are above-average at Magna Park Lutterworth and there are only five schemes than score higher, all of which are outside Leicestershire
• 12 sites can offer newly-developed logistics space as units of 23,225 sqm or more at earlier timing than Magna Park Lutterworth is estimated to be able to deliver. However, all but one scheme (Interlink/Bardon/Mountpark, near Coalville) are located outside Leicestershire.
• Only DIRFT offers the potential to create a larger cluster than Magna Park Lutterworth. The other three schemes located in Leicestershire offer relatively

© copyright reserved 2015 Gerald Eve LLP Page 41
small potential clusters of between four and ten units compared with the potential of 24 units at Magna Park Lutterworth.
Therefore we can conclude that Magna Park Lutterworth offers a significantly attractive opportunity to occupiers in terms of key occupational and operational factors as well as being as one of the only opportunities within Leicestershire to be able to offer the scale of logistics property cluster demanded by some logistics occupiers.

© copyright reserved 2015 Gerald Eve LLP Page 42
Appendix A: Individual Site Assessments
The following are individual site assessments considering pertinent characteristics for consideration and comparison for the purposes of this study.

© copyright reserved 2015 Gerald Eve LLP Page 43
A1. NOTES ON ASSESSMENT CLASSIFICATIONS AND CRITERIA
The following details the criteria for each assessment classification and the definitions of what indicators have been used to determine the scores/results for each park/estate.
1. Type and use of schemes Classifications are as follows:
Type • Estate (evolved): industrial estates which have grown over time rather than being
masterplanned at the outset. These estates are often in multiple ownership, sometimes with significant numbers of owners including institutions, developers, occupiers and local authorities.
• Estate (developed): industrial estates that have been developed discretely with a planned development scope and scale. These estate are mostly in single ownership or in ownership by a small number of institutions/developers developing discrete but contiguous areas to determined plans.
• Site: development land without any current standing units but being marketed/considered for commercial development
• Standalone unit: single units in unique locations with few to no neighbouring properties being used for economic purposes. These units are often owner-occupied properties.
Use • Distribution park: specifically being used for distribution operations
• Industrial estate: a broad range of industrial uses on site including manufacturing, distribution and warehousing as well as uses usually accommodated in smaller industrial units such as wholesale and trade counter operations and small-scale production
• Mixed use: abroad range of economic uses including industrial and distribution operations but also retail and office-based services
• Standalone unit: a variety of uses could be located on site including manufacturing and office uses but with an element of distribution
2. Planning status A review of the current planning status of each scheme based on data in the public domain (including planning applications, Local Plan and Local Development Plan documents, Development Consent Order applications and representations to inquiries and consultations).

© copyright reserved 2015 Gerald Eve LLP Page 44
3. Railway connections Distances to rail freight terminals (as the shortest road by miles) has been determined using Google Maps and have been considered as follows:
• Excellent: nearest rail freight terminal is adjacent or within 5 miles
• Very good: nearest rail freight terminal is 5-15 miles
• Good: nearest rail freight terminal is 15-25 miles
• Average: nearest rail freight terminal is 25-35 miles
• Poor: nearest rail freight terminal is more than 35 miles
Assessment of road links to rail freight terminals is based on the following:
• Excellent: scheme is located adjacent to rail freight terminal or one is planned to be developed on site
• Very good: scheme is directly connected by motorway or strong A road
• Good: scheme is connected by a combination of two roads which are motorways or A roads
• Average: scheme is connected by a combination of three or more A roads and motorways
• Poor: scheme is connected by a combination of a total of three or more roadlinks including unclassified/B roads as well as A roads/motorways
4. Roadway connections Distances to motorway junctions has been determined using Google Maps and have been considered as follows:
• Excellent: nearest motorway junction is adjacent or within 5 miles
• Very good: nearest motorway junction is 5-15 miles
• Good: nearest motorway junction is 15-25 miles
• Average: nearest motorway junction is 25-35 miles
• Poor: nearest motorway junction is more than 35 miles
Assessment of motorways within this area is based on the following
• Primary motorways: M1, M6, M69
• Secondary motorways: M6 Toll, M42, M40, M54, M5
• Tertiary motorways: A1(M)

© copyright reserved 2015 Gerald Eve LLP Page 45
Assessment of road links to the nearest motorway junction is based on the following:
• Excellent: scheme is located adjacent to motorway junction
• Very good: scheme is directly connected by a strong A road
• Good: scheme is connected by a combination of two or more roads, all of which are A roads
• Average: scheme is connected by a combination of A road and an unclassified/B road
• Poor: scheme is connected by a combination of more than two roadlinks or is connected via unclassified/B roads only
The number of motorway junctions within appropriate proximity to each location (as an indication of flexibility with accessing the motorway network) is assessed as follows:
• Excellent: more than 6 junctions within 10 miles
• Very good: 5-6 junctions within 10 miles
• Good: 3-4 junctions within 10 miles miles
• Average:1-2 junctions within 10 miles
• Poor: no junctions within 10 miles

© copyright reserved 2015 Gerald Eve LLP Page 46
5. Population catchment data This has been calculated using Experian Micromarketer G3 GIS software to determine the boundary for two isochrones namely 4.5 hours (as a proxy for a national distribution centre model) and 2.5 hours (as a proxy for a regional distribution centre) in peak hour driving conditions (as a most constrained distribution scenario).
As well as determining the boundary and therefore the confines for these drivetimes, Micromarketer has been used to determine the number of resident people within these boundaries as a proxy for the required distribution to these areas (on the basis that people living in these areas will require goods to be transported to retail areas where they shop and businesses where they work (both of which are likely to within reasonable proximity to their homes) and to themselves directly (particularly with the advent and growth of internet retail and the consequent home delivery requirements). This data has been drawn from 2013 population estimate calculated by Experian and uploaded into the Micromarketer system.
6. Labour market conditions Potential labour pool The number of economically active people of working age within 30-minute drivetime has been calculated using Experian Micromarketer G3 GIS software and the total for each point populated using Experian estimates for the 2013 resident population. This population has then been scored using the average for all 389 points considered across Great Britain in logistics locations and rebased (with the average set as 100).
Labour availability The unemployment rate within 30-minute drivetime of each point has been calculated also using Experian Micromarketer G3 GIS software and Experian 2013 population estimates and then rebased around the average (set at 100). (Unemployment is calculated as the economically active people of working age who are considered unemployed as a proportion of all economically active people of working age.)
Labour costs Wage rates for logistics warehouse specific jobs have been collected for areas across the country for the following job types:
• Warehouse operatives
• Forklift truck operators
• Drivers of Class 2/Cat C vehicles
• Drivers of Class 1/Cat C&E vehicles
• Warehouse managers
The average wage rate for each job has then been calculated and the rates for each location have been rebased around the average for each job (using 100 for the average). The rebased scores have then been summed and rebased around an average of 500 (sum of the average scores) and then rebased to 100.

© copyright reserved 2015 Gerald Eve LLP Page 47
Overall labour market conditions assessment Overall labour market conditions assessment is then based on the results from each of the above and a score is calculated for use in the overall scoring summing all three rebased scores and then rebasing around an average of 300 (as the sum of the average scores) and rebased to 100.
7. Deliverability This is a review of the estimated timing of development capability on each scheme based on the signalled development timescale being promoted by the developers or from our assessment of what is achievable given the planning status of each scheme and if there is any other impediment to development. Also considered is the size and flexibility of each scheme to be able to deliver a range of options, particularly with reference to the delivery of units of 23,225 sqm or more.

© copyright reserved 2015 Gerald Eve LLP Page 48

© copyright reserved 2015 Gerald Eve LLP Page 49
A2. SITE ASSESSMENTS
Scheme name Arm Farm
Developer Ashfield Land
Location Milton Malsor, Northampton, Northamptonshire, East Midlands
Type and use Site
Size (ha and sqm) 57 ha 0 sqm 0 units
Number of units over 23,225 sqm (existing)
0 units
Development land (ha and sqm potential)
57 ha 400,000 sqm
Number of units over 23,225 sqm (potential)
c. 17 units
Total number of units over 23,225 sqm (existing and potential)
c. 17 units (note: no masterplan is available so this calculation is based on the maximum number of 23,225 sqm units that could be delivered using the stated total floorspace – that is, 400,000 sqm divided by 23,225 sqm)
Achieved rents Not applicable
Planning status No planning or development consent applications have been registered although a Basic Services Agreement was entered into with Network Rail in April 2013
Railway connections Nearest rail freight interchange: a rail freight interchange is proposed for the scheme. The site is bounded by the West Coast Mainline to the south and the Northampton Loop to the east.
Roadway connections Nearest motorway junction: 3.0 miles to J15a M1 (primary motorway) Roadlink to nearest junction is very good (A43) Total of 3 motorway junctions within 10 miles
Population catchment data
% of population within national drivetime: 55.7 million (rebased around average: 112.8) % of population within regional drivetime: 35.1 million (rebased around average: 141.9)
Labour market conditions
Number of economically active people of working age within 30 min drivetime: 281,300 (rebased around average: 60.2) Unemployment rate within 30 min drivetime: 5.8% (rebased around average: 93.1) Wage rates for logistics warehouse specific jobs (average): 10% higher than national average Overall labour market is relatively constrained (relatively few people of working age, lower than average unemployment rate, higher than average wages)
Deliverability There is no planning or development consent in place on the site and whilst there is a Basic Services Agreement with Network Rail under which the feasibility of the site is being assessed, given the longer-term nature of enquiry for establishing strategic rail freight interchanges, development of this site is likely to be a long-term prospect and has been estimated that the site will not be operational until 2020-2025.

© copyright reserved 2015 Gerald Eve LLP Page 50
The site is currently unserviced and as well as distribution park infrastructure and groundworks that would be required to service the suite, there would also be significant development work require to establish the rail freight terminal. The site is large and imminently flexible given the fact that the site is seemingly unimpeded and there is nothing in the public domain which suggests that there are further physical impediments to the development of the site.
Overall assessment Very good road transport connectivity Excellent (potential) rail freight connectivity Labour market constrained Large and flexible site No existing buildings and therefore no existing cluster of large units Availability for development of large units is at least 3-5 years with potential for a cluster to develop

© copyright reserved 2015 Gerald Eve LLP Page 51
Scheme name Birch Coppice Business Park / Land South of J10 M42
Developer IM Properties / St Modwen
Location Dordon, North Warwickshire, West Midlands
Type and use Estate (developed) – distribution park / Site
Size (ha and sqm) 221 ha 343,630 sqm 18 units
Number of units over 23,225 sqm (existing)
5 units
Development land (ha and sqm potential)
59 ha 125,100 sqm
Number of units over 23,225 sqm (potential)
4 units
Total number of units over 23,225 sqm (existing and potential)
9 units
Achieved rents £48.44-£61.89 per sqm per annum
Planning status Phases 1 & 2 of the Birch Coppice Business Park scheme are now nearly fully developed. Phase 3 (known as Beanstalk (redevelopment of Hall End Business Park, adjacent to scheme on eastern border) and Beanstalk Extended (further vacant land to east) was granted planning permission in 2013 (North Warwickshire DC application PAP/2012/0347) and several reserved matters are now being considered (under applications PAP/2015/0267 and PAP/2015/0269) In addition, St Modwen submitted a planning application (PAP/2014/0648) in December 2014 for a 25 ha area to the south of J10 M42, adjacent to the Birch Coppice scheme, on which the developer is seeking permission for up to 80,000 sqm. However, permission was refused in August 2015 on the basis that ths proposal is a significant departure from the North Warwickshire Development Plan, particularly with regard to the separate identity of Dordon (as separate from Tamworth) and the undemonstrated need for the additional employment land.
Railway connections Nearest rail freight interchange: located adjacent to Birch Coppice
Roadway connections Nearest motorway junction: located adjacent to J10 M42 (secondary motorway) Total of 4 motorway junctions within 10 miles
Population catchment data
% of population within national drivetime: 56.7 million (rebased around average: 114.8) % of population within regional drivetime: 33.7 million (rebased around average: 136.1)
Labour market conditions
Number of economically active people of working age within 30 min drivetime: 526,000 (rebased around average: 112.5) Unemployment rate within 30 min drivetime: 6.8% (rebased around average: 109.2) Wage rates for logistics warehouse specific jobs (average): 7% lower than national average Overall, labour market is relatively unconstrained (relatively large number of people of working age, higher than average unemployment rate, lower than average wages)

© copyright reserved 2015 Gerald Eve LLP Page 52
Deliverability This scheme has already proven to be highly successful over the past 15 years. As well as several large-scale purpose-built units, IM Properties has developed speculatively three units totalling 45,253 sqm, all of which have been let whilst under construction. Infrastructure will need to be introduced on the Phase 3 land but part of the extension site is already partly served as it would consist of redevelopment of the existing Hall End Business Park and the remaining requirements could be readily implemented. The remaining Phase 3 development land could deliver a total of 99,695 sqm. Developer IM Properties is currently marketing two units of 26,198 sqm and 5,853 sqm on Phase 3 as available Q3 2016 and are intending to develop these units speculatively (albeit given the current lack of good quality space and the rate at which speculatively developed space has been let before completion at this scheme, it is likely that these units could be let prior to construction completion or possibly even before commencement). The site is sufficiently large to accommodate larger warehouse units and with a substantial amount of development land, there is flexibility to deliver a range of unit types and to be able to accommodate several of these units, creating a significant cluster of units over 23,225 sqm. . IM Properties is currently building 72,278 sqm purpose-built unit for Euro Car Parts and is speculatively developing a 4,390 sqm unit on the last remaining plot of Phase 1. The timeline for delivery – based on the outstanding planning decision on reserved matters and given the developer’s own expectations of availability of the sites on Phase 3 – is also sufficiently short to be able to call the development land available in the short term site rather than immediately available. The scheme is under single management and has therefore consistency with regard to estate roads, landscaping, signage and other services.
Overall assessment Very good road transport connectivity Excellent rail freight connectivity Labour market unconstrained Large and flexible site Existing established very large cluster of large units Available for development of large units in the short term (within 12 months)

© copyright reserved 2015 Gerald Eve LLP Page 53
Scheme name Brackmills
Developer Mixed
Location Northampton, Northamptonshire, East Midlands
Type and use Estate (evolved) – industrial estate
Size (ha and sqm) 295 ha 819,000 sqm 167 units
Number of units over 23,225 sqm (existing)
8 units
Development land (ha and sqm potential)
13 ha 54,600 sqm
Number of units over 23,225 sqm (potential)
1 unit
Total number of units over 23,225 sqm (existing and potential)
9 units
Achieved rents £48.44-£61.89 per sqm per annum
Planning status There is a single plot of c.13 ha still undeveloped which is owned by Coca-Cola Enterprises and is adjacent to its exiting unit. This site is held as an expansion site by Coca-Cola should the need to extend the existing facility arises. Therefore the land does not represent a market-available site.
Railway connections Nearest rail freight interchange: 21.6 miles from DIRFT Roadlink to rail freight interchange is good (A45/M1)
Roadway connections Nearest motorway junction: 3.9 miles to J15 M1(primary motorway) Roadlink to nearest junction is very good (A45) Total of 3 motorway junctions within 10 miles
Population catchment data
% of population within national drivetime: 55.5 million (rebased around average: 112.3) % of population within regional drivetime: 33.6 million (rebased around average: 136.0)
Labour market conditions
Number of economically active people of working age within 30 min drivetime: 236,000 (rebased around average: 50.5) Unemployment rate within 30 min drivetime: 5.5% (rebased around average: 87.3) Wage rates for logistics warehouse specific jobs (average): 10% higher than national average Overall labour market is relatively constrained (relatively few people of working age, lower than average unemployment rate, higher than average wages)
Deliverability Brackmills is a long established industrial estate with a range of different sized units from very small units of less than 465 sqm to single units over 46450 sqm. The estate has been developed over many years by different developers and there is no single overall management of the estate. However, in 2009, the estate became a Business Improvement District (BID) which included awarding a contract for provision of estate management services and project and contract management services. In 2014, the original five-year BID plan was extended by a further five years to March 2019.

© copyright reserved 2015 Gerald Eve LLP Page 54
However, there is no market-available land for development of further space so the potential to create further cluster effects is limited to the potential of the existing buildings, either in their current form or as redevelopment opportunities. The scheme is large of scale but the broad mix of uses on site make it less specifically focused on distribution. Also there is no development land available on the market which means it lacks flexibility and also immediately available development capability.
Overall assessment Very good road transport connectivity Good rail freight connectivity Labour market constrained Large site but no remaining available plots for development of large units Existing established cluster of large units

© copyright reserved 2015 Gerald Eve LLP Page 55
Scheme name Centrum 100
Developer Mixed
Location Burton-upon-Trent, Staffordshire, West Midlands
Type and use Estate (developed) – distribution park
Size (ha and sqm) 81 ha 307,300 sqm 127 units
Number of units over 23,225 sqm (existing)
5 units
Development land (ha and sqm potential)
10 ha 38,600 sqm
Number of units over 23,225 sqm (potential)
1 unit
Total number of units over 23,225 sqm (existing and potential)
6 units
Achieved rents £43.06-£51.13 per sqm per annum
Planning status A 10 ha plot remains at the Centrum West part of the estate and is being marketed by developer Goodman for construction of a 38,554 sqm unit called Centrum 415. Detailed planning consent was granted in December 2008 and extended in February 2013 (PA/25617/023).
Railway connections Nearest rail freight interchange: 22.8 miles to Birch Coppice Roadlink to nearest rail freight interchange is good (A38/A5)
Roadway connections Nearest motorway junction: 18.5 miles to J24a M1 (primary motorway) Roadlink to nearest junction is good (A5121/A38/A50) No motorway junctions within 10 miles
Population catchment data
% of population within national drivetime: 56.4 million (rebased around average: 114.3) % of population within regional drivetime: 28.3 million (rebased around average: 114.4)
Labour market conditions
Number of economically active people of working age within 30 min drivetime: 251,300 (rebased around average: 53.8) Unemployment rate within 30 min drivetime: 5.9% (rebased around average: 94.7) Wage rates for logistics warehouse specific jobs (average): 7% lower than national average
Deliverability The remaining 10 ha plot at Centrum West has detailed planning consent for development of a 38,554 sqm unit construction of which could begin immediately. As the overall estate is well established, all infrastructure is in place and there is no impediment to development. The overall site is large but flexibility is somewhat impeded by the fact there is just one site remaining with relatively few options with regard to the configuration of development of large units of more than 23,225 sqm.

© copyright reserved 2015 Gerald Eve LLP Page 56
Overall assessment Good road transport connectivity Good rail freight connectivity Labour market constrained in terms of supply but lower than average wages Large and flexible site Existing established very large cluster of large units Immediate availability for development of a single large unit

© copyright reserved 2015 Gerald Eve LLP Page 57
Scheme name DIRFT
Developer Prologis Properties
Location Crick, Northamptonshire, East Midlands
Type and use Estate (developed) – distribution park
Size (ha and sqm) 518 ha 555,600 sqm 16 units
Number of units over 23,225 sqm (existing)
11 units
Development land (ha and sqm potential)
344 ha 748,000 sqm
Number of units over 23,225 sqm (potential)
14 units
Total number of units over 23,225 sqm (existing and potential)
25 units
Achieved rents £50.59-£59.20 per sqm per annum
Planning status Phases 1 and 2 (DIRFT I and DIRFT II) are now almost fully built-out with a small amount of land still available including a plot to become free for redevelopment in the future as the railhead site is released. DIRFT III comprises 344 ha and is masterplanned to accommodate 730,665 sqm of space. A development consent order was granted by the Planning Inspectorate to developer Prologis working with landowners BT and Aviva Investors for the proposed development in July 2014
Railway connections Nearest rail freight interchange: located adjacent to DIRFT
Roadway connections Nearest motorway junction: located adjacent to J18 M1(primary motorway) Total of 4 motorway junctions within 10 miles
Population catchment data
% of population within national drivetime: 56.3 million (rebased around average: 114.1) % of population within regional drivetime: 39.1 million (rebased around average: 158.2)
Labour market conditions
Number of economically active people of working age within 30 min drivetime: 410,200 (rebased around average: 87.7) Unemployment rate within 30 min drivetime: 5.7% (rebased around average: 91.6) Wage rates for logistics warehouse specific jobs (average): 2% higher than national average Overall labour market is relatively constrained (relatively few people of working age, lower than average unemployment rate, higher than average wages) albeit only marginally.
Deliverability As an extension to an existing site, Phase III is imminently deliverable as confirmed by the development consent order granted. There is infrastructure to be introduced on the site but as an extension to the existing scheme, these should be capable of being readily introduced. The development of the new rail freight terminal will also increase the handling capacity of the scheme. The development of DIRFT III is expected to be completed over 15 years (to c.2029).

© copyright reserved 2015 Gerald Eve LLP Page 58
The site is sufficiently large to accommodate a range of very large units and flexible to be able to deliver different configurations. Given that the development is an extension of the existing DIRFT estate, the infrastructure that will need to be developed to serve the site will be readily implementable and construction of units could begin almost immediately. The park is also under single management and has therefore consistency with regard to estate roads, landscaping, signage and other services.
Overall assessment Excellent road transport connectivity Excellent rail freight connectivity Labour market marginally constrained Very large and flexible site Existing established very large cluster of large units Immediate availability for development of large units

© copyright reserved 2015 Gerald Eve LLP Page 59
Scheme name Dove Valley Park
Developer Clowes Developments
Location Foston, Derbyshire, West Midlands
Type and use Estate (developed) – distribution park
Size (ha and sqm) 105 ha 89,800 sqm 5 units
Number of units over 23,225 sqm (existing)
2 units
Development land (ha and sqm potential)
44 ha 76,100 sqm
Number of units over 23,225 sqm (potential)
2 units
Total number of units over 23,225 sqm (existing and potential)
4 units
Achieved rents Unknown
Planning status Detailing planning permission was granted on the site for a total of 215,000 sq m for Phase 1. Phase 2 remains available for development but does not benefit from planning consent although it is highly likely given the contiguous nature of the scheme that Phase 2 would be granted permission. In June 2015, a planning application (9/2015/0499) was made to South Derbyshire DC for detailed planning permission for a 11,083 sqm unit on Plot 3000 which is considerably smaller than the size of unit that has been consented for the plot (28,136 sqm). A decision is expected in September 2015.
Railway connections Nearest rail freight interchange: 35.2 miles to Birch Coppice Roadlink to rail freight interchange is good (A50/A38/A5)
Roadway connections Nearest motorway junction: 18.6 miles to J24a M1 (primary motorway) Roadlink to nearest junction is very good (A50) No motorway junctions within 10 miles
Population catchment data
% of population within national drivetime: 56.1 million (rebased around average: 113.7) % of population within regional drivetime: 27.7 million (rebased around average: 112.1)
Labour market conditions
Number of economically active people of working age within 30 min drivetime: 266,600 (rebased around average: 57.0) Unemployment rate within 30 min drivetime: 6.1% (rebased around average: 97.0) Wage rates for logistics warehouse specific jobs (average): 7% lower than national average Overall labour market is relatively constrained (relatively few people of working age, lower than average unemployment rate) albeit only marginally so and wages are below average
Deliverability Dove Valley Park benefits from outline planning consent, existing infrastructure onsite and single ownership of the park. Also despite little development taking place at the scheme since the mid 2000s, the fact that a planning application has been submitted could be indicative of

© copyright reserved 2015 Gerald Eve LLP Page 60
either a design-and-build commitment by an occupier or an interest in speculative development by the developer. The site is sufficiently large enough to accommodate significant requirements (Phase 2 could be combined with existing Phase 1 plots to deliver a single unit of as much as 51,100 sqm) and flexible to offer a range of different options. Given that the development land available is on the existing park with infrastructure already in place or as for Phase 2, is an extension of the existing estate, the infrastructure that does not already exist and will need to be developed to serve the site will be readily implementable and construction of units could begin on some sites almost immediately (subject to detailed planning consent). The park is also under single management and has therefore consistency with regard to estate roads, landscaping, signage and other services.
Overall assessment Good road transport connectivity Average rail freight connectivity Labour market marginally constrained Large and flexible site Existing large units onsite but development of more to create a cluster Immediate availability for development of large units

© copyright reserved 2015 Gerald Eve LLP Page 61
Scheme name East Midlands Gateway
Developer Roxhill
Location Castle Donington, Leicestershire, East Midlands
Type and use Site – distribution park
Size (ha and sqm) 138 ha 0 sqm 0 units
Number of units over 23,225 sqm (existing)
0 units
Development land (ha and sqm potential)
138 ha 557,400 sqm
Number of units over 23,225 sqm (potential)
10 units
Total number of units over 23,225 sqm (existing and potential)
10 units
Achieved rents Not applicable
Planning status An application for a development consent order was made to the Property Inspectorate in September 2014 following a public consultation in early 2014. The first DCO hearing was held in February 2015 and further hearings have been held in June 2015. A decision is expected in late 2015.
Railway connections Nearest rail freight interchange: proposed onsite although the site of the proposed rail freight terminal is located at the top of a rise in the land which may pose deliverability and functionality issues
Roadway connections Nearest motorway junction: located adjacent to J24 M1 (primary motorway) Total of 3 motorway junctions within 10 miles
Population catchment data
% of population within national drivetime: 56.4 million (rebased around average: 114.2) % of population within regional drivetime: 32.6 million (rebased around average: 131.7)
Labour market conditions
Number of economically active people of working age within 30 min drivetime: 615,840 (rebased around average: 131.7) Unemployment rate within 30 min drivetime: 6.2% (rebased around average: 98.7) Wage rates for logistics warehouse specific jobs (average): 1% higher than national average Overall labour market is relatively unconstrained (plentiful supply of working age people with unemployment rate and wage rates in line with the national average)
Deliverability Given that the scheme is currently a site only and various masterplan options are still being considered, there is flexibility with regard to what can be built. The site is also large to be able to accommodate substantial warehouses. The earliest possible development that could take place on the site would be in late 2016/early 2017 assuming that consents are granted by the Planning Inspectorate, the relevant Secretary of State and the

© copyright reserved 2015 Gerald Eve LLP Page 62
local authority. Also there would be significant infrastructure work required on the site (including laying miles of connecting track to the site of the proposed rail freight terminal) including access roads, drainage, electricity and telecommunications connection and plot surface works.
Overall assessment Excellent road transport connectivity Excellent (potential) rail freight connectivity – rail freight terminal proposed onsite but is not expected to be operational until at least 2018 Labour market relatively unconstrained Large and flexible site No existing buildings and therefore no existing cluster of large units Availability for development of large units is at least 18-24 months with potential for a cluster to develop

© copyright reserved 2015 Gerald Eve LLP Page 63
Scheme name East Midlands Intermodal Park
Developer Goodman / Shepherd Group
Location Etwall, Derbyshire, East Midlands
Type and use Site – distribution park
Size (ha and sqm) 230 ha 0 sqm 0 units
Number of units over 23,225 sqm (existing)
0 units
Development land (ha and sqm potential)
230 ha 557,400 sqm
Number of units over 23,225 sqm (potential)
8 units
Total number of units over 23,225 sqm (existing and potential)
8 units
Achieved rents Not applicable
Planning status An application for a development consent order is expected to be made in Summer 2015 following a statutory public consultation. Should the application be accepted by the Planning Inspectorate for examination, a decision is expected by mid-2016 at the earliest.
Railway connections Nearest rail freight interchange: proposed onsite
Roadway connections Nearest motorway junction: 12.5 miles to J24a M1 (primary motorway) Roadlink to nearest junction is very good (A50) No motorway junctions within 10 miles
Population catchment data
% of population within national drivetime: 56.3 million (rebased around average: 114.0) % of population within regional drivetime: 28.4 million (rebased around average: 115.0)
Labour market conditions
Number of economically active people of working age within 30 min drivetime: 284,400 (rebased around average: 60.8) Unemployment rate within 30 min drivetime: 6.0% (rebased around average: 95.0) Wage rates for logistics warehouse specific jobs (average): 1% higher than national average Overall labour market is relatively constrained although only marginally so (relatively few people of working age, lower than average unemployment rate) albeit only marginally so and wages are in line with the average
Deliverability Given that the scheme is currently a site only and various masterplan options are still being considered, there is flexibility with regard to what can be built. The site is also large to be able to accommodate substantial warehouses (the largest units proposed on the existing masterplan documents are 566,893 sqm of which there could be several on the park). There may be some remediation issues to be resolved on the site as the current uses on the site are a waste water treatment facility, a composting facility and an existing flood attenuation pond.

© copyright reserved 2015 Gerald Eve LLP Page 64
The earliest possible development that could take place on the site would be in late 2016/early 2017 assuming that consents are granted by the Planning Inspectorate, the relevant Secretary of State and the local authority. Also there would be significant infrastructure work required on the site (including laying miles of connecting track to the site of the proposed rail freight terminal) including access roads, drainage, electricity and telecommunications connection and plot surface works.
Overall assessment Good road transport connectivity Excellent (potential) rail freight connectivity – rail freight terminal proposed onsite but is not expected to be operational until at least 2018 Labour market marginally constrained Large and flexible site No existing buildings and therefore no existing cluster of large units Availability for development of large units is at least 21-27 months with potential for a cluster to develop

© copyright reserved 2015 Gerald Eve LLP Page 65
Scheme name Fradley Park / Prologis Fradley Park
Developer Evans of Leeds (original), Graftongate (subsequent) / Legal & General (current owner) / Prologis (Prologis extension site)
Location Fradley, Lichfield, Staffordshire, West Midlands
Type and use Estate (developed) – distribution park
Size (ha and sqm) 160 ha 331,400 sqm 20 units
Number of units over 23,225 sqm (existing)
3 units
Development land (ha and sqm potential)
33 ha 143,900 sqm
Number of units over 23,225 sqm (potential)
2 units
Total number of units over 23,225 sqm (existing and potential)
5 units
Achieved rents £48.44-£56.51 per sq ft per annum
Planning status Fradley Park has consent for over 400,000 sqm of industrial, officesand warehouse space on 141 ha of which approximately 93 ha is for warehousing specifically. There are two remaining plots for development of warehousing on the scheme – a 2 ha site capable of accommodating up to 7,432 sqm and a 5.3 ha site capable of accommodating up to 19,509 sqm. Adjacent to Fradley Park, Prologis was granted planning (application 07/00774/OUTM) on an 18 ha site for development of a total of 85,000 sqm of warehouse space with ancilliary offices; permission was extended in 2011 and has had reserved matters permitted.
Railway connections Nearest rail freight interchange: 14.7 miles to Birch Coppice Roadlink to rail freight interchange is very good (A38/A5)
Roadway connections Nearest motorway junction: 5.5 miles to JT5 M6 Toll (secondary motorway) Roadlink to nearest junction is good (A38/A5148) Total of 3 motorway junctions within 10 miles
Population catchment data
% of population within national drivetime: 56.7 million (rebased around average: 114.7) % of population within regional drivetime: 32.2 million (rebased around average: 130.3)
Labour market conditions
Number of economically active people of working age within 30 min drivetime: 479,000 (rebased around average: 102.5) Unemployment rate within 30 min drivetime: 6.7% (rebased around average: 107.3) Wage rates for logistics warehouse specific jobs (average): 7% lower than national average Overall labour market is relatively unconstrained (relatively large number of people of working age, higher than average unemployment rate, lower than average wages)
Deliverability Plots available for development have planning consent in place and are

© copyright reserved 2015 Gerald Eve LLP Page 66
immediately available for development with some groundworks and infrastructure required to be implemented on the Prologis plot but not extensive. The sites are sufficiently large enough to accommodate significant requirements (the Prologis plot could accommodate a single unit of as much as 82,683 sqm) and flexible to offer a range of different options. Whilst the two parts of the scheme – Fradley Park as developed by Evans of Leeds and Prologis Fradley Park – are not under single management, there is likely to be a sympathy in management between the two sites in terms of consistency with regard to estate roads, landscaping, signage and other services.
Overall assessment Good road transport connectivity Very good rail freight connectivity Labour market unconstrained Large and flexible site Existing large units onsite but development of more to create a cluster Immediate availability for development of large units

© copyright reserved 2015 Gerald Eve LLP Page 67
Scheme name Gateway Park – Southern Zone
Developer Roxhill / Rigby Group
Location Coventry, West Midlands
Type and use Site – mixed use
Size (ha and sqm) 81 ha 0 sqm 0 units
Number of units over 23,225 sqm (existing)
0 units
Development land (ha and sqm potential)
81 ha 334,400 sqm
Number of units over 23,225 sqm (potential)
7 units
Total number of units over 23,225 sqm (existing and potential)
7 units
Achieved rents Not applicable
Planning status In February 2015, the Secretary of State for Communities & Local Government rejected the planning application on the basis that the impact upon green belt land was not outweighed by the benefits of the scheme, despite the scheme being granted consent from Coventry City Council and Warwickshire District Council in June 2013 and being supported by the Coventry and Warwickshire Local Enterprise Partnership. Roxhill have indicated that it will continue to press for consent on the site despite the rejection.
Railway connections Nearest rail freight interchange: 22.8 miles to DIRFT Roadlink to rail freight interchange is good (A45/A36)
Roadway connections Nearest motorway junction: 6.2 miles to J2 M6 (primary motorway) Roadlink to nearest junction is very good (A46) Total of 3 motorway junctions within 10 miles
Population catchment data
% of population within national drivetime: 56.5 million (rebased around average: 114.4) % of population within regional drivetime: 36.3 million (rebased around average: 146.8)
Labour market conditions
Number of economically active people of working age within 30 min drivetime: 391,600 (rebased around average: 83.8) Unemployment rate within 30 min drivetime: 6.6% (rebased around average: 105.1) Wage rates for logistics warehouse specific jobs (average): 1% lower than national average Overall labour market is relatively unconstrained (below-average number of people of working age but higher than average unemployment rate and wages in line with the average)
Deliverability The delivery of logistics space on the site is hampered by the lack of planning consent. Following the rejection of planning permission on the site in February 2015, the developers have signalled that they will continue to pursue consent for the site although through what means is not currently clear. Further delaying the delivery of floorspace if or when consent is granted is the fact that the site also requires significant

© copyright reserved 2015 Gerald Eve LLP Page 68
remediation: the scheme is located on the site of a former sewage disposal works and is substantially contaminated. There are currently substantial local transport infrastructure improvements, particularly to improve the traffic congestion along the Tollbar (A46/A45) to the north of the site, underway by the Highways Agency which began work in 2013 and are expected to complete in 2016-2017. The site is sufficiently large enough to accommodate significant requirements and flexible to offer a range of different options.
Overall assessment Very good road transport connectivity once the Tollbar road improvements have been completed Good rail freight connectivity Labour market marginally unconstrained Large and flexible site No existing buildings and therefore no existing cluster of large units Availability for development of large units is at least 24 months (given the lack of planning permission and the specific rejection by the Secretary of State) but with potential for a cluster to develop

© copyright reserved 2015 Gerald Eve LLP Page 69
Scheme name Hams Hall
Developer Mixed
Location Coleshill, West Midlands
Type and use Estate (evolved) – distribution park
Size (ha and sqm) 174 ha 440,500 sqm 19 units
Number of units over 23,225 sqm (existing)
4 units
Development land (ha and sqm potential)
14 ha 13,260 sqm
Number of units over 23,225 sqm (potential)
0 units
Total number of units over 23,225 sqm (existing and potential)
4 units
Achieved rents £48.44-£61.89 per sqm per annum
Planning status There is a plot of c.10 ha adjacent to the BMW plant at the centre of the scheme which has been earmarked for expansion of the existing plant. Canmoor and Cordea Savills have completed a speculatively developed unit of 13,470 sqm known as Silver Bullet on Faraday Avenue in April 2015. There is a further site adjacent to the Silver Bullet site which is being marketed for development of a unit totalling 16,000 sqm and known as Black Velvet; the c.4 ha site is the last market-available plot with planning permission on the Hams Hall scheme and Canmoor and Cordea Savills have said that they will develop the unit speculatively.
Railway connections Nearest rail freight interchange: located adjacent to Hams Hall
Roadway connections Nearest motorway junction: 1.6 miles to J9 M42 (secondary motorway) Roadlink to nearest junction is very good (A446) Total of 8 motorway junctions within 10 miles
Population catchment data
% of population within national drivetime: 56.7 million (rebased around average: 114.9) % of population within regional drivetime: 34.5 million (rebased around average: 139.6)
Labour market conditions
Number of economically active people of working age within 30 min drivetime: 592,100 (rebased around average: 126.6) Unemployment rate within 30 min drivetime: 8.1% (rebased around average: 128.8) Wage rates for logistics warehouse specific jobs (average): 1% lower than national average Overall labour market is relatively unconstrained (large number of people of working age, higher than average unemployment rate and wages in line with the average)
Deliverability Hams Hall has no further market-available sites for development of large units to further the size or scale of the existing cluster of large units. The remaining development plots are being or are to be built as units of less than 23,225 sqm or are earmarked for specific occupier

© copyright reserved 2015 Gerald Eve LLP Page 70
use. The scheme is large in total but its flexibility is impeded by the fact that there is no market-available land for development of large units to increase the size of the existing cluster. The park is also not under single management and has therefore a lack of consistency with regard to estate roads, landscaping, signage and other services.
Overall assessment Excellent road transport connectivity Excellent rail freight connectivity Labour market unconstrained Large site but not flexible given the lack of development plots Existing cluster of large units No further availability for development of large units to grow the cluster of large units

© copyright reserved 2015 Gerald Eve LLP Page 71
Scheme name Interlink Park / Bardon 22 Business Park / Mountpark Bardon
Developer Wilson Bowden / Mountpark / Maximus
Location Coalville, Leicestershire, East Midlands
Type and use Estate (developed) – distribution park
Size (ha and sqm) 159 ha 437,000 sqm 116 units
Number of units over 23,225 sqm (existing)
5 units
Development land (ha and sqm potential)
62 ha 266,400 sqm
Number of units over 23,225 sqm (potential)
2 units
Total number of units over 23,225 sqm (existing and potential)
7 units
Achieved rents £48.44-£64.58 per sqm per annum
Planning status The 25 ha Mountpark Bardon scheme is being developed by Mountpark and USAA Real Co – Europe BV. Planning permission was granted by North West Leicestershire DC in November 2014 for 120,773 sqm (application 13/00249/OUTM). The site forms part of the South East Coalville Urban Extension which includes residential and community development and which has as part of its identified need “at least 20/25 hectares of employment land”. Given that this site is potentially the entire fulfilment of this need (albeit there is the caveat that the scale is given as “at least 20/25 Hectares of employment land mainly for B1 Business and B2 General Industrial uses) there may further scope for B8 development permission on the western side of the Interlink/Bardon industrial area. There are two smaller sites on the eastern side of the railway line in the original Interlink Park scheme. Prime Link is a 2.75 ha with planning permission for development of a total of 12,077 sqm and is being developed by Wilson Bowden. Worcestershire-developer Maximus is also developing a 5.7 ha site known as Maximus 22 on which planning permission for a 20,903 sqm unit was granted by North West Leicestershire DC in March 2015. There is a 17 ha further plot owned by Wilson Bowden to the north of the existing Interlink Park that has not been developed and appears to have been part of the original outline planning consent issued in 2001 but does not appear to have any further detailed consent granted for development.
Railway connections Nearest rail freight interchange: 20.1 miles to Birch Coppice Roadlink to rail freight interchange is average (A511/A42/M42)
Roadway connections Nearest motorway junction: 2.2 miles to J22 M1 (primary motorway) Roadlink to nearest junction is very good (A511) Total of 3 motorway junctions within 10 miles
Population catchment data
% of population within national drivetime: 56.2 million (rebased around average: 113.8) % of population within regional drivetime: 33.3 million (rebased around average: 134.7)

© copyright reserved 2015 Gerald Eve LLP Page 72
Labour market conditions
Number of economically active people of working age within 30 min drivetime: 447,000 (rebased around average: 95.6) Unemployment rate within 30 min drivetime: 5.6% (rebased around average: 89.9) Wage rates for logistics warehouse specific jobs (average): 8% lower than national average Overall labour market is relatively unconstrained (relatively large number of people of working age and lower than average wages although unemployment rate below average)
Deliverability All three development sites in the Interlink Park / Bardon area could be developed immediately. All have planning permission in place and the two smaller plots already have infrastructure and access in place. The Mountpark Bardon scheme requires some infrastructure and groundwork to be developed but the developers are marketing capability of delivery of a single unit of as much as 92,902 sqm deliverable in less than 12 months. The overall Interlink/Bardon scheme is large and with further development capacity to build more units of more than 23,225 sqm could increase the size of the cluster of large units. The Mountpark Bardon site is also flexible in the offering of larger units although the two smaller plots are more constrained in the flexibility of the offering. The area is also not under single management and has therefore a lack of consistency with regard to estate roads, landscaping, signage and other services.
Overall assessment Very good road transport connectivity Average rail freight connectivity Labour market relatively unconstrained Large and flexible site Existing cluster of large units Immediate availability for development of large units to create an even larger cluster of large unit

© copyright reserved 2015 Gerald Eve LLP Page 73
Scheme name Logistics Property Partnership Corby (previously Crackerjack) / HubRockingham
Developer Greatline Developments (original developer), Moorfield Group/Segro (current owners) / Northampton Land
Location Corby, Northamptonshire, East Midlands
Type and use Estate (developed) – distribution park
Size (ha and sqm) 43 ha 49,100 sqm 1 unit
Number of units over 23,225 sqm (existing)
1 unit
Development land (ha and sqm potential)
32 ha
Number of units over 23,225 sqm (potential)
3 units
Total number of units over 23,225 sqm (existing and potential)
4 units
Achieved rents Unknown
Planning status The 49,063 sqm Logistics Property Partnership Corby warehouse unit (previously known Crackerjack when developed by Greatline Developments) on an 11 ha site and. The unit remained vacant from completion in late 2008 until it was let to leading retailer Staples in August 2014. The 32.5 ha HubRockingham scheme is adjacent to the Logistics Property Partnership Corby site on its eastern side. Developer Rockingham Land submitted a planning application for as much as 121,702 sqm of distribution warehouse space in May 2015 to East Northamptonshire DC (application 15/00976/OUT). Whilst the site has flexibility to deliver units of a range of sizes, the masterplan submitted with the application shows a five-unit scheme with three units in excess of 23,225 sqm.
Railway connections Nearest rail freight interchange: 32.7 miles to DIRFT Roadlink to rail freight interchange is good (A6003/A14)
Roadway connections Nearest motorway junction: 19.5 miles to J17 A1(M) (tertiary motorway) Roadlink to nearest junction is good (A427/A605) No motorway junctions within 10 miles
Population catchment data
% of population within national drivetime: 55.2 million (rebased around average: 111.8) % of population within regional drivetime: 32.4 million (rebased around average: 131.2)
Labour market conditions
Number of economically active people of working age within 30 min drivetime: 116,470 (rebased around average: 24.9) Unemployment rate within 30 min drivetime: 5.1% (rebased around average: 81.3) Wage rates for logistics warehouse specific jobs (average): 7% higher than national average Overall labour market is constrained (relatively few people of working age, lower than average unemployment rate and higher than average wages)

© copyright reserved 2015 Gerald Eve LLP Page 74
Deliverability Planning permission is being sought by Rockingham Land for the HubRockingham part of the site. According to the developer, development plots are serviced and development ready. Site is sufficiently large to accommodate large units and flexible to be able to consider not only the size of units but also configuration. The area is not under single management and has therefore a lack of consistency with regard to estate roads, landscaping, signage and other services. The two different elements of the area are separately owned and managed but it is likely that given that the development is being brought to market subsequent to the development of LPP Corby that infrastructure and other physical characteristics will be sympathetic with the existing scheme.
Overall assessment Average road transport connectivity Average rail freight connectivity Labour market constrained Large and flexible site Existing established cluster of large units on the existing estate Immediate availability for development of large units on last remaining plot

© copyright reserved 2015 Gerald Eve LLP Page 75
Scheme name Magna Park Lutterworth
Developer IDI Gazeley
Location Lutterworth, Leicestershire, East Midlands
Type and use Estate (developed) – distribution park
Size (ha and sqm) 405 ha 771,155 sqm 31 units
Number of units over 23,225 sqm (existing)
16 units
Development land (ha and sqm potential)
202 ha 427,350 sqm
Number of units over 23,225 sqm (potential)
8 units
Total number of units over 23,225 sqm (existing and potential)
24 units
Achieved rents £49.51-£64.58 per sqm per annum
Planning status The last remaining plot – Plot 2110 – on the original park is currently being marketed as available for development of a 9,669 sqm unit and an application for detailed planning permission is being sought (application 15/00471/FUL). The developers are planning an extension to the north of the existing scheme. A planning application for a single unit of over 100,844 sqm for logistics provider DHL was submitted in June 2015. A further application to extend to the north of the existing boundary of the estate by 200 ha is due to be submitted later in 2015.
Railway connections Nearest rail freight interchange: 9.5 miles to DIRFT Roadlink to rail freight interchange is very good (A5)
Roadway connections Nearest motorway junction: 3.1 miles to J20 M1 (primary motorway) Roadlink to nearest junction is very good (A4303) Total of 5 motorway junctions within 10 miles
Population catchment data
% of population within national drivetime: 56.3 million (rebased around average: 114.1) % of population within regional drivetime: 37.7 million (rebased around average: 152.4)
Labour market conditions
Number of economically active people of working age within 30 min drivetime: 459,100 (rebased around average: 98.1) Unemployment rate within 30 min drivetime: 6.2% (rebased around average: 98.5) Wage rates for logistics warehouse specific jobs (average): 6% higher than national average Overall labour market is marginally constrained (higher than average wages although number of people of working age and unemployment rate in line with average)
Deliverability Development on Plot 2110 could begin immediately after a decision is made on the planning application which is expected in Summer 2015.

© copyright reserved 2015 Gerald Eve LLP Page 76
Should permission be granted on the DHL unit, infrastructure would need to be implemented to bring the site to a development-ready state but as the site is adjacent to the existing scheme this could be readily achieved and development of the units itself could begin almost immediately following ground enabling works. The larger northern extension would require substantially more infrastructure implementation which would be needed before development could commence onsite. Also given the fact that a planning application has not yet been submitted, the likelihood is that any development on the site would not begin before 2016 at the earliest. The site is large and flexible and the proposed northern extension could deliver further development capacity for more units of more than 23,225 sqm that could increase the size of the cluster of large units. The park is also under single management and has therefore consistency with regard to estate roads, landscaping, signage and other services.
Overall assessment Excellent road transport connectivity Very good rail freight connectivity Labour market marginally constrained Large and flexible site Existing cluster of large units Development of large units to create an even larger cluster of large unit is at least 12 months away given that an application for planning consent has not yet been submitted.

© copyright reserved 2015 Gerald Eve LLP Page 77
Scheme name Magna Park Milton Keynes / Eagle Farm
Developer IDI Gazeley / Gallagher
Location Milton Keynes, Buckinghamshire, South East
Type and use Estate (developed) – distribution park
Size (ha and sqm) 108 ha 320,000 sqm 5 units
Number of units over 23,225 sqm (existing)
5 units
Development land (ha and sqm potential)
63 ha 259,000 sqm
Number of units over 23,225 sqm (potential)
5 units
Total number of units over 23,225 sqm (existing and potential)
10 units
Achieved rents £59.20-£61.89 per sqm per annum
Planning status Planning was granted on the Magna Park Milton Keynes site in May 2006 and has been extended to further phases of the scheme. There are only three plots remaining and only one is capable of accommodating a unit of more than 23,225 sqm left on the original 107 ha site. In March 2015, IDI Gazeley commenced construction of a 17,256 sqm unit which is being built speculatively and in June 2015, started work on a 60,386 sqm purpose-built unit for John Lewis, the retailer’s fourth unit on the park. Outline planning permission was granted to Gallagher Estates on the 36 ha Eagle Farm site to the east of Magna Park in August 2014 (application 12/02204/MKPCO) for 126,000 sqm of employment space. The masterplan provides for three to six units and an indicative masterplan shows four units of which three are greater than 23,225 sqm.
Railway connections Nearest rail freight interchange: 33.3 miles to DIRFT Roadlink to rail freight interchange is average (A421/A4146/M1)
Roadway connections Nearest motorway junction: 2.9 miles to J13 M1 (primary motorway) Roadlink to nearest junction is very good (predominantly on A421) Total of 2 motorway junctions within 10 miles
Population catchment data
% of population within national drivetime: 55.1 million (rebased around average: 111.5) % of population within regional drivetime: 34.7 million (rebased around average: 140.3)
Labour market conditions
Number of economically active people of working age within 30 min drivetime: 455,800 (rebased around average: 97.5) Unemployment rate within 30 min drivetime: 6.4% (rebased around average: 101.5) Wage rates for logistics warehouse specific jobs (average): 3% higher than national average Overall labour market is neither constrained or unconstrained (number of people of working and unemployment rate in line with national average although wages marginally above average)

© copyright reserved 2015 Gerald Eve LLP Page 78
Deliverability Planning permission is in place on both the existing Magna Park and the Eagle Farm site to the east. Infrastructure is in place for Magna Park and development could commence immediately on the remaining plots. At Eagle Farm, groundworks and infrastructure implementation would be required to bring the site to a development-ready state but with planning permission in place, construction commencement would be in the short term (under 12 months). The overall scheme is sufficiently large and the Eagle Farm site has flexibility to accommodate a variety of different unit sizes and configurations. The remaining plots at Magna Park are broadly constrained in terms of their flexibility to deliver different sizes and configurations, with the exception of the 400 plot which has been masterplanned as four smaller units under 18,580 sqm but could accommodate a single unit of 37,903 sqm. The Magna Park element of the area is under single management and has therefore consistency with regard to estate roads, landscaping, signage and other services. Given that the Eagle Farm development is being brought to market subsequent to the development of Magna Park and will built on the success and attractiveness of the established park, it is likely that infrastructure and other physical characteristics will be sympathetic with the existing park.
Overall assessment Very good road transport connectivity Average rail freight connectivity Labour market neither constrained or unconstrained Large site with flexibility to deliver large units in different configurations on the Eagle Farm site and the 400 plot on Magna Park Existing cluster of large units Development of large units to create an even larger cluster of large unit could begin immediately.

© copyright reserved 2015 Gerald Eve LLP Page 79
Scheme name Midway Park
Developer Hampton Brook / db symmetry
Location Northampton, Northamptonshire, East Midlands
Type and use Site – distribution park
Size (ha and sqm) 129 ha 0 sqm 0 units
Number of units over 23,225 sqm (existing)
0 units
Development land (ha and sqm potential)
129 ha 319,500 sqm
Number of units over 23,225 sqm (potential)
13 units
Total number of units over 23,225 sqm (existing and potential)
c. 13 units (note: no detailed masterplan is available so this calculation is based on the maximum number of 23,225 sqm units that could be delivered using the stated total floorspace – that is, 319,500 sqm divided by 23,225 sqm)
Achieved rents Not applicable
Planning status The developers have signalled their plans for development of B1, B2 and predominantly B8 space and made various submissions to the consultation and examination of the West Northamptonshire Joint Core Strategy Local Plan in 2013/2014. In February 2014, an application for a screening opinion (application S/2014/0213/SCR) was submitted to South Northamptonshire DC which decided that an environmental impact assessment would be necessary as part of any application for planning permission on the site. In December 2014, the JSC Local Plan was adopted by the West Northamptonshire Joint Strategic Planning Committee (which includes South Northamptonshire DC). The JSC Local Plan includes a specific policy relating to the development of a strategic allocation for 42 ha of additional employment land which is the Phase 1 land on the Midway Park scheme to the south of the A4500 at J16 of the M1. The strategic allocation is subject to specific policy constraints including that B8 development will be constrained to no more than 50% of the floorspace and that no unit will exceed 40,000 sqm. The specific policy also states that 2 ha of the gross 42 ha must be developed as a lorry park delivery of which will be “expected early within the allocated phase of development”.
Railway connections Nearest rail freight interchange: 21.5 miles to DIRFT Roadlink to rail freight interchange is very good (M1)
Roadway connections Nearest motorway junction: adjacent to J16 M1 (primary motorway) Total of 3 motorway junctions within 10 miles
Population catchment data
% of population within national drivetime: 56.5 million (rebased around average: 114.3) % of population within regional drivetime: 39.8 million (rebased around average: 160.9)
Labour market conditions
Number of economically active people of working age within 30 min drivetime: 294,652 (rebased around average: 63.0) Unemployment rate within 30 min drivetime: 5.3% (rebased around

© copyright reserved 2015 Gerald Eve LLP Page 80
average: 84.1) Wage rates for logistics warehouse specific jobs (average): 10% higher than national average Overall labour market is relatively constrained (relatively few people of working age, lower than average unemployment rate, higher than average wages)
Deliverability There is currently no planning permission for B8 development on the scheme although the southern Phase 1 land has been recognised as a strategic employment land allocation in the JSC Local Plan although the developers have yet to make any application since the adoption of the plan. Therefore the timing of any development would likely be not before end 2016. The site is currently used as agricultural land and is unserviced. Therefore any development would require infrastructure to be introduced onsite. Also mitigation to the strategic and local road network has been specifically noted in the JSC Local Plan as necessary as has the fact that “the site will be expected to make a financial contribution to these mitigation measures as well as providing any land required”. The site is large in total but is bisected by a significant trunk road the A4500. In terms of flexibility, the restrictions on B8 space in total and the configuration of that space permitted will constrain the number and size of large units capable of being built on this scheme. Therefore the flexibility of the scheme is somewhat restricted.
Overall assessment Excellent road transport connectivity Very good rail freight connectivity Labour market constrained Large site in total but parts separated by A road; flexibility is constrained by policy stipulations No existing buildings and therefore no existing cluster of large units Availability for development of large units is at least 12 months (given the lack of planning permission); given the allocation of only the southern Phase 1 land, developers could face longer term process to secure permission on northern Phases 2 and 3.

© copyright reserved 2015 Gerald Eve LLP Page 81
Scheme name Northampton Gateway
Developer Roxhill
Location Northampton, Northamptonshire, East Midlands
Type and use Site – distribution park
Size (ha and sqm) 159 ha 0 sqm 0 units
Number of units over 23,225 sqm (existing)
0 units
Development land (ha and sqm potential)
159 ha 210,300 sqm
Number of units over 23,225 sqm (potential)
4 units
Total number of units over 23,225 sqm (existing and potential)
4 units
Achieved rents Not applicable
Planning status A planning application for a complex of four buildings for occupier Howdens was submitted in December 2014 (S/2014/2468/EIA) to South Northamptonshire DC following public consultation during 2014. However, in early June 2015, the planning application was withdrawn; Howdens issued a statement relating to the withdrawal and cited one of the reasons for the withdrawal as the likelihood that the plans would be rejected. Howdens has also reported that it has agreed to lease a new warehouse elsewhere which means that the company will no longer be a named occupier attached to any planning application on the Northampton Gateway scheme that Roxhill may submit in the near future which may impede the progress of the application.
Railway connections Nearest rail freight interchange: 30.0 miles to DIRFT Roadlink to rail freight interchange is good (A6003/A14)
Roadway connections Nearest motorway junction: 1.5 miles to J15 M1 (primary motorway) Roadlink to nearest junction is very good (A508) Total of 2 motorway junctions within 10 miles
Population catchment data
% of population within national drivetime: 55.8 million (rebased around average: 113.0) % of population within regional drivetime: 35.7 million (rebased around average: 144.5)
Labour market conditions
Number of economically active people of working age within 30 min drivetime: 318,300 (rebased around average: 68.1) Unemployment rate within 30 min drivetime: 5.9% (rebased around average: 93.3) Wage rates for logistics warehouse specific jobs (average): 10% higher than national average Overall labour market is relatively constrained (relatively few people of working age, lower than average unemployment rate, higher than average wages)
Deliverability The site is currently unserviced and there is no infrastructure or amenities in place. There are local roadworks that Roxhill have also advised would be part of the programme of development for the site

© copyright reserved 2015 Gerald Eve LLP Page 82
that would also need to be agreed with South Northamptonshire DC. The site is sufficiently large to accommodate some of the largest buildings achievable in the country and is also flexible given that it is a vacant site which could accommodate a variety of options. The lack of planning consent on the site and the scale of the site mean that the length of time before development could commence could be more than 12 months, especially as there is now no named occupier attached to the site.
Overall assessment Very good road transport connectivity Average rail freight connectivity Labour market constrained Large and flexible site No existing buildings and therefore no existing cluster of large units Availability for development of large units is at least 12 months (given the lack of planning permission)
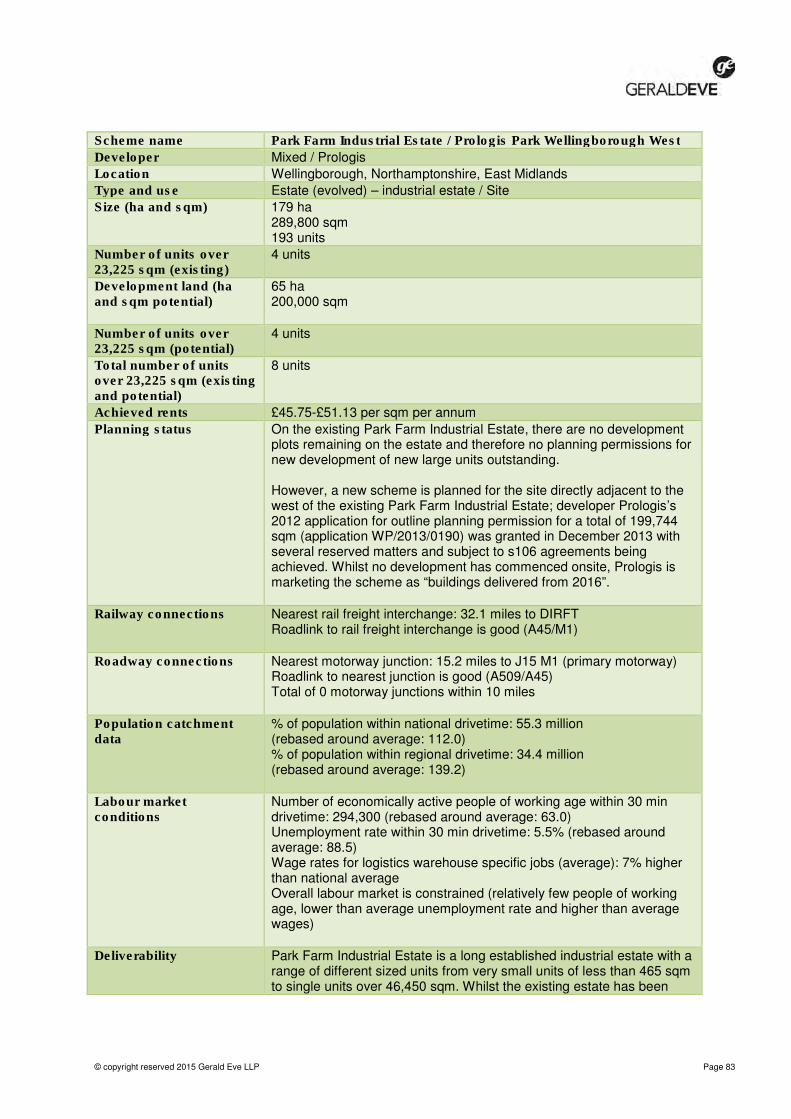
© copyright reserved 2015 Gerald Eve LLP Page 83
Scheme name Park Farm Industrial Estate / Prologis Park Wellingborough West
Developer Mixed / Prologis
Location Wellingborough, Northamptonshire, East Midlands
Type and use Estate (evolved) – industrial estate / Site
Size (ha and sqm) 179 ha 289,800 sqm 193 units
Number of units over 23,225 sqm (existing)
4 units
Development land (ha and sqm potential)
65 ha 200,000 sqm
Number of units over 23,225 sqm (potential)
4 units
Total number of units over 23,225 sqm (existing and potential)
8 units
Achieved rents £45.75-£51.13 per sqm per annum
Planning status On the existing Park Farm Industrial Estate, there are no development plots remaining on the estate and therefore no planning permissions for new development of new large units outstanding. However, a new scheme is planned for the site directly adjacent to the west of the existing Park Farm Industrial Estate; developer Prologis’s 2012 application for outline planning permission for a total of 199,744 sqm (application WP/2013/0190) was granted in December 2013 with several reserved matters and subject to s106 agreements being achieved. Whilst no development has commenced onsite, Prologis is marketing the scheme as “buildings delivered from 2016”.
Railway connections Nearest rail freight interchange: 32.1 miles to DIRFT Roadlink to rail freight interchange is good (A45/M1)
Roadway connections Nearest motorway junction: 15.2 miles to J15 M1 (primary motorway) Roadlink to nearest junction is good (A509/A45) Total of 0 motorway junctions within 10 miles
Population catchment data
% of population within national drivetime: 55.3 million (rebased around average: 112.0) % of population within regional drivetime: 34.4 million (rebased around average: 139.2)
Labour market conditions
Number of economically active people of working age within 30 min drivetime: 294,300 (rebased around average: 63.0) Unemployment rate within 30 min drivetime: 5.5% (rebased around average: 88.5) Wage rates for logistics warehouse specific jobs (average): 7% higher than national average Overall labour market is constrained (relatively few people of working age, lower than average unemployment rate and higher than average wages)
Deliverability Park Farm Industrial Estate is a long established industrial estate with a range of different sized units from very small units of less than 465 sqm to single units over 46,450 sqm. Whilst the existing estate has been

© copyright reserved 2015 Gerald Eve LLP Page 84
fully developed – including a small cluster of four units of more than 23,225 sqm – there is no further development land on the existing industrial estate. However, the proposal for Prologis Park Wellingborough West directly adjacent to the Park Farm Industrial Estate will increase the opportunities for the cluster to grow albeit the scheme will have a separate entrance off Sywell Road. With outline planning permission in place, development could begin in the short term although several reserved matters are still to be discharged and there is currently no infrastructure onsite which would need to be implemented before development of units could commence. The site is large (65 ha) and has flexibility for different sized buildings including a single unit of as much as 59,000 sqm. The industrial estate is also not under single management and has therefore a lack of consistency with regard to estate roads, landscaping, signage and other services.
Overall assessment Good road transport connectivity Average rail freight connectivity Labour market constrained Large and flexible site Existing established very large cluster of large units on the existing estate Availability for development of large units to extend the existing cluster (albeit at a site adjacent to the existing park) in the short term

© copyright reserved 2015 Gerald Eve LLP Page 85
Scheme name Peterborough Gateway
Developer Roxhill
Location Peterborough, Cambridgeshire, East of England
Type and use Estate (developed) – distribution park
Size (ha and sqm) 97 ha 3,400 sqm 1 units
Number of units over 23,225 sqm (existing)
0 units
Development land (ha and sqm potential)
80 ha 440,400 sqm
Number of units over 23,225 sqm (potential)
8 units
Total number of units over 23,225 sqm (existing and potential)
8 units
Achieved rents Not applicable
Planning status Detailed planning permission is in place for 167,200 sqm and outline planning permission for the remaining 273,200 sqm. Occupier Yearsley Group has also gained planning permission for a 35,767 sqm unit to be developed on a 8 ha site it purchased from Roxhill in February 2014 but has yet to commence construction. However, Roxhill is preparing an outline planning application which would allow a change of part of the approved scheme from employment to residential development; a c.20 ha plot to the south of the scheme would be removed from the scheme. Roxhill is currently at the pre-application consultation phase and is preparing technical studies and assessments. The planning application is likely to be finalised and submitted later during Summer 2015. Should these plans be approved and implemented, there would still be sufficient land to accommodate enough units of 23,225 sqm or more to constitute a cluster.
Railway connections Nearest rail freight interchange: 48.8 miles to DIRFT Roadlink to rail freight interchange is average (A1139/A605/A14)
Roadway connections Nearest motorway junction: located adjacent to J17 A1(M) (tertiary motorway) Total of 1 motorway junctions within 10 miles
Population catchment data
% of population within national drivetime: 54.9 million (rebased around average: 111.3) % of population within regional drivetime: 33.5 million (rebased around average: 135.3)
Labour market conditions
Number of economically active people of working age within 30 min drivetime: 213,400 (rebased around average: 45.6) Unemployment rate within 30 min drivetime: 5.6% (rebased around average: 89.2) Wage rates for logistics warehouse specific jobs (average): 1% lower than national average Overall labour market is constrained (relatively few people of working

© copyright reserved 2015 Gerald Eve LLP Page 86
age, lower than average unemployment rate and wages in line with average)
Deliverability The site has planning permission in place and infrastructure has been built in some parts of the estate with the remainder to connect plots readily implementable as construction of a warehouse unit could commence. Therefore development could commence immediately. The site is sufficiently large and flexible to be able to provide not only a range of different size units but also configuration.
Overall assessment Very good road transport connectivity Poor rail freight connectivity Labour market constrained Large and flexible site No existing cluster of large units but immediate availability for development of large units and there is scope for sufficient quantum of development to constitute a cluster

© copyright reserved 2015 Gerald Eve LLP Page 87
Scheme name Prologis Park Corby
Developer Prologis Properties
Location Corby, Northamptonshire, East Midlands
Type and use Site – distribution park
Size (ha and sqm) 61 ha 0 sqm 0 units
Number of units over 23,225 sqm (existing)
0 units
Development land (ha and sqm potential)
61 ha 228,100 sqm
Number of units over 23,225 sqm (potential)
4 units
Total number of units over 23,225 sqm (existing and potential)
4 units
Achieved rents Not applicable
Planning status Outline planning permission for development of 232,260 sqm space (application 12/00259/OUT) was granted in December 2013. The current masterplan shows development of five units of which four are over 23,225 sqm and one is shown as 85,071 sqm.
Railway connections Nearest rail freight interchange: 28.5 miles to DIRFT Roadlink to rail freight interchange is average (A603/A43/A14)
Roadway connections Nearest motorway junction: 17.4 miles to J17 A1(M) (tertiary motorway) Roadlink to nearest junction is good (A43/A47/A1) Total of 0 motorway junctions within 10 miles
Population catchment data
% of population within national drivetime: 55.5 million (rebased around average: 112.5) % of population within regional drivetime: 32.6 million (rebased around average: 131.9)
Labour market conditions
Number of economically active people of working age within 30 min drivetime: 180,220 (rebased around average: 38.5) Unemployment rate within 30 min drivetime: 5.1% (rebased around average: 81.0) Wage rates for logistics warehouse specific jobs (average): 7% higher than national average Overall labour market is constrained (relatively few people of working age, lower than average unemployment rate and higher than average wages)
Deliverability There is no infrastructure as yet on site although some site clearance work has already been undertaken. Although the existing Prologis Eurohub development is adjacent, there may not be efficient means of achieving implementation through the existing park as the two schemes would not share an entrance and the masterplan shows no road link between the two schemes. The site is large and there is flexibility not only in the size of the units that can be developed onsite but also the configuration.

© copyright reserved 2015 Gerald Eve LLP Page 88
Due to the lack of infrastructure onsite and any groundworks that would need to be completed before construction could begin, the timing of any development would not be immediate but likely within 12 months.
Overall assessment Average road transport connectivity Average rail freight connectivity Labour market constrained Large and flexible site No existing buildings and therefore no existing cluster of large units Availability for development of large units is within 12 months (given planning permission in place but with lack of infrastructure)

© copyright reserved 2015 Gerald Eve LLP Page 89
Scheme name Prologis Park Coventry
Developer Prologis Properties
Location Coventry, West Midlands
Type and use Estate (developed) – distribution park
Size (ha and sqm) 107 ha 211,100 sqm 19 units
Number of units over 23,225 sqm (existing)
5 units
Development land (ha and sqm potential)
4 ha 13,935 sqm
Number of units over 23,225 sqm (potential)
0 units
Total number of units over 23,225 sqm (existing and potential)
5 units
Achieved rents £53.82-£59.20 per sqm per annum
Planning status Just two small plots remain at Prologis Park Coventry, both of which have planning permission. Plot J2 is 1.08 ha and could accommodate 3,437 sqm and Plot J3 is 0.6 ha and could accommodate 2,554 sqm. There is also a further 3.5 ha site to the north west of the existing boundary of the park capable of delivering 13,006 sq although planning has not been consented on the site.
Railway connections Nearest rail freight interchange: 22.8 miles to DIRFT Roadlink to rail freight interchange is good (M6/M1)
Roadway connections Nearest motorway junction: 3.6 miles to J3 M6 (primary motorway) Roadlink to nearest junction is average (predominantly on A444) Total of 2 motorway junctions within 10 miles
Population catchment data
% of population within national drivetime: 56.6 million (rebased around average: 114.6) % of population within regional drivetime: 35.4 million (rebased around average: 143.1)
Labour market conditions
Number of economically active people of working age within 30 min drivetime: 456,250 (rebased around average: 97.6) Unemployment rate within 30 min drivetime: 7.4% (rebased around average: 118.6) Wage rates for logistics warehouse specific jobs (average): 1% lower than national average Overall labour market is relatively unconstrained (below-average number of people of working age but higher than average unemployment rate and wages in line with the average)
Deliverability The scheme’s remaining development plots are not sufficiently large enough to be able to accommodate any further units of 23,225 sqm or more. The area is also under single management and has therefore consistency with regard to estate roads, landscaping, signage and other services.

© copyright reserved 2015 Gerald Eve LLP Page 90
Overall assessment Good road transport connectivity Good rail freight connectivity Labour market relatively unconstrained Large site but relative lack of flexibility given the lack of development land Established cluster of large units No availability for development of large units

© copyright reserved 2015 Gerald Eve LLP Page 91
Scheme name Prologis Park Kettering
Developer Prologis Properties
Location Kettering, Northamptonshire, East Midlands
Type and use Estate (developed) – distribution park
Size (ha and sqm) 49 ha 157,900 sqm 5 units
Number of units over 23,225 sqm (existing)
3 units
Development land (ha and sqm potential)
13 ha 55,100 sqm
Number of units over 23,225 sqm (potential)
1 units
Total number of units over 23,225 sqm (existing and potential)
4 units
Achieved rents £51.13-£53.28 per sqm per annum
Planning status Outline planning permission on the scheme is already in place across the scheme and so development of any further units would be subject to receipt of detailed consent.
Railway connections Nearest rail freight interchange: 24.7 miles to DIRFT Roadlink to rail freight interchange is good (A43/A14)
Roadway connections Nearest motorway junction: 21.7 miles to J19 M1 (primary motorway) Roadlink to nearest junction is very good (A14) No motorway junctions within 10 miles
Population catchment data
% of population within national drivetime: 55.6 million (rebased around average: 112.7) % of population within regional drivetime: 33.1 million (rebased around average: 134.1)
Labour market conditions
Number of economically active people of working age within 30 min drivetime: 231,900 (rebased around average: 49.6) Unemployment rate within 30 min drivetime: 5.4% (rebased around average: 86.6) Wage rates for logistics warehouse specific jobs (average): 7% higher than national average Overall labour market is constrained (relatively few people of working age, lower than average unemployment rate and higher than average wages)
Deliverability The site has all infrastructure in place and has outline planning permission on the remaining development plots although detailed consent would be required on the specific units to be built. This could mean that development would not be achievable immediately but with a short term period . The site is large but given the remaining plot sizes and configurations there is relatively little flexibility with regard to size (there is just one plot remaining that could accommodate a unit of 23,225 sqm or more). The park is under single management and has therefore consistency

© copyright reserved 2015 Gerald Eve LLP Page 92
with regard to estate roads, landscaping, signage and other services.
Overall assessment Good road transport connectivity Good rail freight connectivity Labour market constrained Large site but relative lack of flexibility given the lack of development land Established cluster of large units Just one plot of land available for development of large units

© copyright reserved 2015 Gerald Eve LLP Page 93
Scheme name Royal Oak Industrial Estate
Developer Mixed / IDI Gazeley
Location Daventry, Northamptonshire, East Midlands
Type and use Estate (evolved) – industrial estate
Size (ha and sqm) 104 ha 421,900 sqm 302 units
Number of units over 23,225 sqm (existing)
3 units
Development land (ha and sqm potential)
7 ha 32,000 sqm
Number of units over 23,225 sqm (potential)
1 units
Total number of units over 23,225 sqm (existing and potential)
4 units
Achieved rents Unknown
Planning status IDI Gazeley are currently developing a 27,622 sqm unit on a 7.5 ha plot to the west of the estate. This is last remaining development site available on the estate and the unit is expected to be completed in August 2015.
Railway connections Nearest rail freight interchange: 7.5 miles to DIRFT Roadlink to rail freight interchange is good (A5/A361)
Roadway connections Nearest motorway junction: 8.2 miles to J18 M1 (primary motorway) Roadlink to nearest junction is good (A361/A5/A42) Total of 3 motorway junctions within 10 miles
Population catchment data
% of population within national drivetime: 56.1 million (rebased around average: 113.7) % of population within regional drivetime: 34.4 million (rebased around average: 139.2)
Labour market conditions
Number of economically active people of working age within 30 min drivetime: 146,700 (rebased around average: 31.4) Unemployment rate within 30 min drivetime: 4.9% (rebased around average: 78.5) Wage rates for logistics warehouse specific jobs (average): 2% higher than national average Overall labour market is constrained (relatively few people of working age, lower than average unemployment rate and higher than average wages)
Deliverability Royal Oak Industrial Estate is a long established industrial estate with a range of different sized units from very small units of less than 465 sqm to single units over 46450 sqm, including two substantial manufacturing facilities for Ford and Cummins. The estate has been developed over many years by different developers and there is no single overall management of the estate. With the development of the final plot on the estate, there is no remaining land for development of further space so the potential to create further cluster effects is limited to the potential of the existing

© copyright reserved 2015 Gerald Eve LLP Page 94
buildings, either in their current form or as redevelopment opportunities. The scheme is large of scale but as there is no development land available on the market, the estate lacks flexibility and also immediately available development capability. The area is also not under single management and has therefore a lack of consistency with regard to estate roads, landscaping, signage and other services.
Overall assessment Very good road transport connectivity Very good rail freight connectivity Labour market constrained Large site but only remaining development plot currently being developed Existing established very large cluster of large units on the existing estate No further availability for new development of large units to extend the existing cluster

© copyright reserved 2015 Gerald Eve LLP Page 95
Scheme name Swan Valley Industrial Estate / Prologis Park Pineham
Developer Aviva Investors / Prologis Properties
Location Northampton, Northamptonshire, East Midlands
Type and use Estate (developed) – distribution park
Size (ha and sqm) 216 ha 670,800 sqm 15 units
Number of units over 23,225 sqm (existing)
11 units
Development land (ha and sqm potential)
41 ha 212,700 sqm
Number of units over 23,225 sqm (potential)
2 units
Total number of units over 23,225 sqm (existing and potential)
13 units
Achieved rents £56.51-£59.20 per sqm per annum
Planning status At Swan Valley Industrial Estate, there are only very small plots of land available that have been earmarked for non-B8 development. Planning permission has been granted for a further phase of development of Prologis Park Pineham, An extension to the north of the site has been approved and units totalling 99,355 sqm have been masterplanned.
Railway connections Nearest rail freight interchange: 21.5 miles to DIRFT Roadlink to rail freight interchange is good (A45/M1)
Roadway connections Nearest motorway junction: located adjacent to J15a M1 (primary motorway) Total of 3 motorway junctions within 10 miles
Population catchment data
% of population within national drivetime: 55.9 million (rebased around average: 113.2) % of population within regional drivetime: 36.2 million (rebased around average: 146.5)
Labour market conditions
Number of economically active people of working age within 30 min drivetime: 310,600 (rebased around average: 66.4) Unemployment rate within 30 min drivetime: 5.6% (rebased around average: 89.2) Wage rates for logistics warehouse specific jobs (average): 10% higher than national average Overall labour market is relatively constrained (relatively few people of working age, lower than average unemployment rate, higher than average wages)
Deliverability The site has all infrastructure in place and has planning permission on the remaining development plots although detailed consent would be required on the specific units to be built. This could mean that development would not be achievable immediately but with a short term period . The site is large and there is some flexibility with regard to size and

© copyright reserved 2015 Gerald Eve LLP Page 96
configuration of large units of 23,225 sqm or more. Although the two schemes are owned and managed separately, there is a general consistency with regard to the quality of estate roads, landscaping, signage and other services between the two estates.
Overall assessment Excellent road transport connectivity Good rail freight connectivity Labour market constrained Large and flexible site capable of accommodating a range of sizes and configurations. Established cluster of large units

© copyright reserved 2015 Gerald Eve LLP Page 97
Scheme name Symmetry Park
Developer db symmetry
Location Lutterworth, Leicestershire, East Midlands
Type and use Site – distribution park
Size (ha and sqm) 88 ha 0 sqm 0 units
Number of units over 23,225 sqm (existing)
0 units
Development land (ha and sqm potential)
88 ha 250,000 sqm
Number of units over 23,225 sqm (potential)
4 units
Total number of units over 23,225 sqm (existing and potential)
4 units
Achieved rents Not applicable
Planning status A planning application (15/00865/OUT) was submitted to Harborough DC on 5 June 2015 for permission for outline planning consent for the up to 278,709 sqm. A decision is not due before Autumn 2015.
Railway connections Nearest rail freight interchange: 9.0 miles to DIRFT Roadlink to rail freight interchange is very good (A5)
Roadway connections Nearest motorway junction: 3.1 miles to J20 M1 (primary motorway) Roadlink to nearest junction is very good (A4303) Total of 5 motorway junctions within 10 miles
Population catchment data
% of population within national drivetime: 56.4 million (rebased around average: 114.2) % of population within regional drivetime: 39.4 million (rebased around average: 159.4)
Labour market conditions
Number of economically active people of working age within 30 min drivetime: 463,600 (rebased around average: 99.2) Unemployment rate within 30 min drivetime: 6.4% (rebased around average: 101.9) Wage rates for logistics warehouse specific jobs (average): 6% higher than national average Overall labour market is marginally constrained (higher than average wages although number of people of working age and unemployment rate in line with average)
Deliverability There is currently no planning permission for B8 development on the scheme and the submitted planning application is likely to take some time to determine given there are several other planning applications to also consider in the immediate area. The site is currently used as farming land and is unserviced. Therefore any development would require infrastructure to be introduced onsite. The site is large and in terms of flexibility, there are a number of different permutations of the scheme configuration. There is scope for a single unit of as much as 116,125 sqm or smaller units, the largest of

© copyright reserved 2015 Gerald Eve LLP Page 98
which could be 41,061 sqm.
Overall assessment Excellent road transport connectivity Very good rail freight connectivity Labour market marginally constrained Large and flexible site No existing buildings and therefore no existing cluster of large units Availability for development of large units is 12-18 months (given the lack of planning permission or infrastructure)

© copyright reserved 2015 Gerald Eve LLP Page 99
Scheme name Warth Park
Developer Roxhill
Location Raunds, Northamptonshire, East Midlands
Type and use Estate (developed) – mixed-use (distribution-led)
Size (ha and sqm) 70 ha 122,100 sqm 7 units
Number of units over 23,225 sqm (existing)
3 units
Development land (ha and sqm potential)
12 ha 58,500 sqm
Number of units over 23,225 sqm (potential)
2 units
Total number of units over 23,225 sqm (existing and potential)
5 units
Achieved rents £40.37-£51.13 per sqm per annum
Planning status The 32.4 ha Phase 2 of Warth Park has planning consent in place and the site infrastructure has been completed. Several facilities have already been developed – including a 39,020 sqm unit for DSV completed in May 2015 – and the last remaining land totalling c.12 ha is the final plot available for logistics development.
Railway connections Nearest rail freight interchange: 37.0 miles to DIRFT Roadlink to rail freight interchange is good (A14/A428)
Roadway connections Nearest motorway junction: 18.2 miles to J17 A1(M) (tertiary motorway) Roadlink to nearest junction is good (A45/A605) No motorway junctions within 10 miles
Population catchment data
% of population within national drivetime: 55.2 million (rebased around average: 111.8) % of population within regional drivetime: 32.4 million (rebased around average: 131.2)
Labour market conditions
Number of economically active people of working age within 30 min drivetime: 237,153 (rebased around average: 50.7) Unemployment rate within 30 min drivetime: 5.6% (rebased around average: 89.2) Wage rates for logistics warehouse specific jobs (average): 7% higher than national average Overall labour market is constrained (relatively few people of working age, lower than average unemployment rate and higher than average wages)
Deliverability Site infrastructure is in place and land has planning permission in place. Site is sufficiently large to accommodate large units and flexible to be able to consider not only the size of units but also configuration albeit within the bounds of the remaining plots parameters. The park is under single management and has therefore consistency with regard to estate roads, landscaping, signage and other services.

© copyright reserved 2015 Gerald Eve LLP Page 100
Overall assessment Average road transport connectivity Average rail freight connectivity Labour market constrained Large and flexible site Existing established cluster of large units on the existing estate Immediate availability for development of large units on last remaining plot

The Economic case for Magna Park
Final Report | October 2015 A2
APPENDIX 2 Magna Park Lutterworth Labour Force Projections John Hollis Demographic Consultant
ECONOMIC CASE FOR MAGNA PARK

The Economic case for Magna Park
Final Report | October 2015 A2

John Hollis, Demographic Consultant,
Woodlands Cottage, Odiham Road, Odiham, Hampshire RG29 1JR
Phone: 01256 702456 E-mail: [email protected]
Demographic Consultancy and Analysis
DEMOGRAPH IC PROJECTIONS:MAGNA PARK CATCHMENT

John Hollis, Demographic Consultant,
Woodlands Cottage, Odiham Road, Odiham, Hampshire RG29 1JR
Phone: 01256 702456 E-mail: [email protected]
Demographic Consultancy and Analysis
Author Credentials: John Hollis I have an M.A. in Demography from the University of California, Berkeley and I am a Fellow of the Royal Statistical Society (RSS). I was President of the British Society for Population Studies (BSPS) in 2005-07 and have also been Chair of the Local Authorities Research and Intelligence Association (LARIA). I was employed as Demographic Consultant at the Greater London Authority until retiring in 2011. At GLA I prepared demographic projections for the various incarnations of the London Plan between 2000 and 2011. I was also demographic adviser to SEERA (2007-1) and I have prepared demographic projections and analysis under contract for several local authorities while at both London Research Centre (1987-2000) and the GLA. I led the local government side of the CLIP (Central and Local Government Information Partnership) Census Advisory Group for both the 2001 and 2011 Censuses. In 2011-12 I was one of four external experts invited to assist ONS with quality assurance of the results of the 2011 Census and in 2013 I was part of the small team that, at the request of the Royal Statistical Society, wrote a methodological assessment of the ONS Beyond 2011 project. I also advised ONS on future requirements for small area data in relation to the same project. I was a member of the CLIP Population Sub-group, which discusses methodology for population and household estimates and projections with ONS and CLG. I have also been a member of the ONS Expert Panel advising on assumptions for National Population Projections and the CLG Steering Group on Household Projections, focussing on the 2010 redevelopment of the modelling process as well as the 2008 and Interim 2011 projections. I have also advised on the development of the PopGroup demographic projections software that is used by many local authorities and planning consultancies. I currently work as a demographic consultant on projects for a number of clients.

John Hollis, Demographic Consultant,
Woodlands Cottage, Odiham Road, Odiham, Hampshire RG29 1JR
Phone: 01256 702456 E-mail: [email protected]
Demographic Consultancy and Analysis
This note relates to the whole area of the sixteen local authorities that best approximate to the 45 minute travel time zone of Magna Park distribution centre near Lutterworth in Harborough district. Travel times were based on both public and private transport. The local authorities are:
Blaby Charnwood Coventry Daventry Harborough Hinckley & Bosworth Kettering Leicester UA North Warwickshire North West Leicestershire Northampton Nuneaton & Bedworth Oadby & Wigston Rugby Tamworth Warwick
Initially the results of the Office for National Statistics (ONS) and Department for Communities and Local Government (CLG) 2012 based population and household projections1 were compared with two commissioned projections that are based on the 2013 mid-year estimate using recent migration trends (2013-13 and 2008-13). Further projections converted the recommendations of the SHMAs relating tom each authority. Each of the population projections were converted to the resident labour force using consistent sets of local economic activity rates.
1. ONS 2012-based Sub National Population Projections (SNPP)
The ONS 2012-based sub national population projections (SNPP) were the first to take full advantage of the results of the 2011 Census. The bases for migration used in the 2012-based projections were the estimated annual average flows that each authority had with each other authority in the rest of England in the previous five years and with Overseas in the previous six years. Cross-border flows within the UK were also based on the previous five years but treated separately in the modelling. These migration data were consistent with the annual components of change in the updated series of mid-year estimates between 2006 and 2012. The population bases for converting the flows within England into age/gender out-migration probabilities and origin-to-destination distributions were the relevant revised mid-year population estimates for the origin authorities. In terms of age-specific fertility and survival rates ONS compares local average rates for the five years before the base to the rates for England. These age-specific (and gender-specific in the case of survival) ratios are then used in the projection to locally adjust the assumed England fertility and survival rates for years up to 2036-37. This aspect of the ONS projection methodology is standard, non-controversial and widely copied in local models. 1 All data in this report drawn from the ONS and CLG population and household estimates and projections are © Crown Copyright.

John Hollis, Demographic Consultant,
Woodlands Cottage, Odiham Road, Odiham, Hampshire RG29 1JR
Phone: 01256 702456 E-mail: [email protected]
Demographic Consultancy and Analysis
The great advantage that the ONS SNPP has over locally produced projections for a single area is that the SNPP model is multi-area. It projects all English authorities together with migration outflows from each authority (prepared by age/gender specific probabilities) distributed (by age/gender) to destination authorities. Therefore the modelling of internal migration in England is a zero-sum calculation and is dynamic, using the annually changing population size and age/gender structure of the origin authorities to generate the flows between authorities. All initial local results, in terms of population size by single years of age (0 to 90+) and gender, births by age of mother, deaths by age and gender and international and cross-border migration flows by age and gender must sum to the figures used in the 2012-based National Population Projection (NPP) for England. A controlling process ensures consistency. There is one key aspect of the ONS analyses of annual local (and national) population change between 2001 and 2011 that is not considered in the ONS SNPP. This is unattributable population change (UPC) that ‘corrects’ for any accumulated errors in either the 2001 or 2011 population estimates or the official ONS estimates of UK and international migration flows. For many authorities, several in this study, this is an important part of the population change between 2001 and 2011. It is assumed in most cases to be linked to the problems ONS had in properly estimating the international inflow to the UK and also to the internal distribution of those immigrants between local authorities. While UPC for England is positive across the decade in many local authorities it is a high negative value.
2. CLG 2012 Household Projections
The CLG 2012 household projections convert the ONS 2012 SNPP to households each year to 2037. The process first splits the SNPP populations (by five-year age groups and gender) by relationship status, that is persons living in a couple, formerly in a couple (ie widowed, divorced, separated) and single. Each of these groups is then divided between persons resident in communal establishments and persons resident in households. The final step calculates households by applying household representative rates(HRRs) to the household population aged 15+ by gender/age/relationship. This is the Stage 1 process that calculates total households. The Stage 2 process allocates the Stage 1 totals to 17 different household types using household headship rates (HHRs). Stage 2 has not yet been published by CLG. CLG uses the latest – but still 2006-based - ONS national projection of the population by marital status to forecast the proportion of each age/gender group by relationship status in each local authority. This process is guided by the actual marital status of people as recorded in the 2011 Census. In projecting the HRRs CLG was able to utilise more 2011 Census data than were available for the Interim 2011 projections, but still could not include the essential data that enables the calculation of the HRRs for 20112. The 2011 HRRs are essential to feed into the projection model that uses Census HRRs back to 1971. To overcome the lack of full data the 2011 HRRs were estimated from the HRRs for 2011 used in the CLG 2008 household projections together with 2011 data for England using the Labour Force Survey (LFS) and the 2011 Census totals of households in each authority. The required HRRs are specific to gender, age (5 years) and relationship status. The LFS data are only specific to gender and age. Therefore, while the 2011 HRRs are the best that could be used at the time, they are still not perfect and, by necessity, contain a large element of change at the national level rather than specific local data. CLG 2012 uses fuller, but not complete, data on the size of the communal establishment population and its gender/age distribution. Therefore the size and structure of the household population was better estimated than in the Interim CLG 2011 projections. 2 At the British Population Studies Society meeting on 18 May 2015 it was stated by CLG that it will not now be doing more work on the 2011 Census data to finalise the Stage 1 household representative rates due to the different definitions used in the 2011 Census.

John Hollis, Demographic Consultant,
Woodlands Cottage, Odiham Road, Odiham, Hampshire RG29 1JR
Phone: 01256 702456 E-mail: [email protected]
Demographic Consultancy and Analysis
While still not definitive, the 2011 HRRs used in the CLG 2012 projections are more complete than their predecessors in the Interim 2011 projections and have been projected according to the same rules and methods. The projection goes to 2037, rather than to 2021 in the Interim 2011 projections, and so focuses attention on a single, traditionally produced, projection of future rates rather than opening up the possibility of a range of assumptions such as have been made in the past few years for local plans by authorities and planning consultants. Such projections beyond 2021 have been prepared based on ‘trend’, ‘index’, ‘static’, ‘catch-up’, ‘partial catch-up’ and ‘blend’ methods based on linking the CLG 2008 and Interim 2011 HRRs to forecast HRRs beyond 2021. Finally, the projections are constrained by the results at regional and national levels. While there may be disagreement with the resulting numbers of projected households at local level this may invariably be put down to the (perceived) failings of the ONS SNPP. However, CLG publishes unrounded results for modelling purposes that enable its HRRs to be used with alternative district level population scenarios. Locally this is the real value of the CLG projections. The CLG 2012 projection of HRRs, despite not being definitive, should be taken as the baseline for any forecasting of future levels of households.
3. 2003-13 Trends Projection
This projection is based on the ONS mid-2013 population estimate and uses fertility and mortality assumptions consistent with the ONS 2012 SNPP. The main difference with the SNPP is that it bases migration on average change over the ten year period 2003 to 2013 and incorporates the UPC between 2003 and 2011 as part of the overall migration change. This means that the resulting level of migration and the projected population will differ from the SNPP. The age structure may also differ. By taking a period that incorporates years before the recession this projection tends, in most local authorities, to show a higher result. The projection is converted to households using exactly the same assumptions and household representative rates as does the CLG 2012 projection.
4. 2008-13 Trends Projection
This projection is based on the ONS mid-2013 population estimate and uses fertility and mortality assumptions consistent with the ONS 2012 SNPP. The main difference with the SNPP is that it bases migration on average change over the five year period 2008 to 2013 and incorporates the UPC between 2008 and 2011 as part of the overall migration change. The projection is converted to households using exactly the same assumptions and household representative rates as does the CLG 2012 projection.
5. Projections based on SHMAs
The projections were prepared using the same models as used for the 2003-13 and 2008-13 Trends projections with the addition of a base population using the ONS mid-2014 estimates that were published on 25th June. The five SHMAs (see Table 1) that cover the 16 local authorities are mainly focussed on 2011-31. However two – West Northamptonshire and South Staffordshire - have shorter durations. Most offer a range of housing need, but the two relating to Northamptonshire have a single figure. The projections converted the SHMA recommendations for additional dwellings in each district to an average annual increase between 2011 and 2031. Table 2 indicates the original recommendations on a per annum basis and how these are translated to a full 20 year period to 2031.

John Hollis, Demographic Consultant,
Woodlands Cottage, Odiham Road, Odiham, Hampshire RG29 1JR
Phone: 01256 702456 E-mail: [email protected]
Demographic Consultancy and Analysis
Table 1: SHMAs
SHMA Date Consultant
Blaby Leicester & Leicestershire Jun-14 GL Hearn
Charnwood Leicester & Leicestershire Jun-14 GL Hearn
Coventry Coventry & Warwickshire Nov-13 GL Hearn
Daventry West Northamptonshire Oct-13 Cambridge Centre
Harborough Leicester & Leicestershire Jun-14 GL Hearn
Hinckley & Bosworth Leicester & Leicestershire Jun-14 GL Hearn
Kettering North Northamptonshire Aug-12 Housing Vision
Leicester UA Leicester & Leicestershire Jun-14 GL Hearn
North Warwickshire Coventry & Warwickshire Nov-13 GL Hearn
North West Leicestershire Leicester & Leicestershire Jun-14 GL Hearn
Northampton West Northamptonshire Oct-13 Cambridge Centre
Nuneaton & Bedworth Coventry & Warwickshire Nov-13 GL Hearn
Oadby & Wigston Leicester & Leicestershire Jun-14 GL Hearn
Rugby Coventry & Warwickshire Nov-13 GL Hearn
Tamworth Southern Staffordshire May-12 Nathaniel Lichfield
Warwick Coventry & Warwickshire Nov-13 GL Hearn
Table 2: SHMA Recommendations
Period Low High Notes Low High
Blaby 2011-31 360 420 7,200 8,400
Charnwood 2011-31 810 820 16,200 16,400
Coventry 2011-31 1,040 1,180 20,800 23,600
Daventry 2011-29 389 389 Exc. NRDA*; No Range 7,778 7,778
Harborough 2011-31 415 475 8,300 9,500
Hinckley & Bosworth 2011-31 375 450 7,500 9,000
Kettering 2011-31 739 739 No Range 14,773 14,773
Leicester UA 2011-31 1,250 1,350 25,000 27,000
North Warwickshire 2011-31 150 175 3,000 3,500
North West Leicestershire 2011-31 285 350 5,700 7,000
Northampton 2011-29 1,583 1,583 Inc. NRDA; No Range 31,667 31,667
Nuneaton & Bedworth 2011-31 430 495 8,600 9,900
Oadby & Wigston 2011-31 80 100 1,600 2,000
Rugby 2011-31 575 660 11,500 13,200
Tamworth 2011-28 240 265 4,800 5,300
Warwick 2011-31 660 720 13,200 14,400
9,381 10,171 187,617 203,417
* Northampton Related Development Area that includes parts of Daventry and South Northamptonshire
SHMA Dwellings
per annum Dwellings 2011-31

John Hollis, Demographic Consultant,
Woodlands Cottage, Odiham Road, Odiham, Hampshire RG29 1JR
Phone: 01256 702456 E-mail: [email protected]
Demographic Consultancy and Analysis
The projections assume that between 2011 and 2014 the increase in households is determined by applying the household representative rates and other assumptiopns of the CLG 2012 household projections to the ONS mid-2014 population estimates by age and gender. The number of households is translated into dwellimgs/homes by assuming that the net vacancy rate (including second homes) as shown by the 2011 Census holds constant. The net increase in dwellings is then subtracted from the SHMA High or Low total for 2011-31. The difference is split evenly over the remaining 17 years to 2031 and is the assumed average net build rate for 2014-31.
6. Resident Labour Force
All projections have been converted to resident labour force aged 16 to 74. This conversion is based on economic activity rates drawn from the 2011 Census. The rates are projected to 2031 using (a) the ONS projection of national labour force to 2020 (Labour Market Trends, January 2006) and (b) the Kent County Council Technical Paper: Activity Rate Projections to 2036, published in October 2011. The Kent paper extended the ONS work and incorporated the planned changes in the state retirement age. ONS no longer has responsibility for preparing national labour force projections. The role has passed to the Office for Budget Responsibility.
7. Local Authority Results Blaby
Table 3: Projections Summary: 2018 and 2031: thousands (except change per annum)
ONS/CLG 2003-13 2008-13 SHMA SHMA SHMA
2012 Trends Trends Low High Average
Population 2018 97.5 96.5 96.9 99.6 100.2 99.9
2031 103.7 100.8 102.0 112.4 115.4 113.9
Change 6.2 4.3 5.1 12.9 15.2 14.0
Households 2018 40.7 39.8 40.0 41.0 41.3 41.2
2031 43.9 41.2 41.7 45.8 47.0 46.4
Change 3.2 1.4 1.7 4.8 5.7 5.2
Change pa 244 106 132 367 436 402
Labour 2018 60.2 59.6 59.7 61.5 61.9 61.7
Force 2031 61.2 59.6 59.9 66.5 68.3 67.4
Change 1.0 0.0 0.2 5.0 6.3 5.7

John Hollis, Demographic Consultant,
Woodlands Cottage, Odiham Road, Odiham, Hampshire RG29 1JR
Phone: 01256 702456 E-mail: [email protected]
Demographic Consultancy and Analysis
Charnwood
Table 4: Projections Summary: 2018 and 2031: thousands (except change per annum)
ONS/CLG 2003-13 2008-13 SHMA SHMA SHMA
2012 Trends Trends Low High Average
Population 2018 179.7 178.3 180.3 178.8 179.0 178.9
2031 198.7 200.3 206.3 194.3 194.8 194.6
Change 19.1 22.0 26.0 15.5 15.8 15.7
Households 2018 72.3 72.5 73.1 72.5 72.6 72.5
2031 82.3 84.4 86.6 82.0 82.2 82.1
Change 9.9 11.9 13.5 9.5 9.6 9.5
Change pa 764 917 1,041 728 739 734
Labour 2018 89.7 90.4 91.0 90.8 90.9 90.9
Force 2031 94.2 99.0 101.1 96.6 96.8 96.7
Change 4.5 8.6 10.1 5.7 5.9 5.8
Coventry
Table 5: Projections Summary: 2018 and 2031: thousands (except change per annum)
ONS/CLG 2003-13 2008-13 SHMA SHMA SHMA
2012 Trends Trends Low High Average
Population 2018 349.8 346.8 356.3 341.8 343.6 342.7
2031 398.7 397.8 436.5 359.4 366.6 363.0
Change 48.9 51.0 80.2 17.6 23.0 20.3
Households 2018 142.1 140.7 144.0 139.2 139.8 139.5
2031 166.0 162.8 178.8 148.4 151.1 149.8
Change 23.9 22.1 34.8 9.2 11.3 10.3
Change pa 1,838 1,699 2,674 711 869 790
Labour 2018 171.5 171.3 176.1 169.0 170.0 169.5
Force 2031 192.5 195.2 216.0 175.7 179.5 177.6
Change 21.0 23.8 39.8 6.7 9.6 8.1

John Hollis, Demographic Consultant,
Woodlands Cottage, Odiham Road, Odiham, Hampshire RG29 1JR
Phone: 01256 702456 E-mail: [email protected]
Demographic Consultancy and Analysis
Daventry3
Table 6: Projections Summary: 2018 and 2031: thousands (except change per annum)
ONS/CLG 2003-13 2008-13 SHMA
2012 Trends Trends
Population 2018 80.8 79.7 79.6 81.9
2031 86.5 81.9 80.9 91.6
Change 5.8 2.2 1.2 9.7
Households 2018 33.7 33.2 33.2 34.1
2031 37.4 35.3 35.0 39.3
Change 3.6 2.1 1.9 5.2
Change pa 280 160 145 402
Labour 2018 41.3 41.2 40.9 42.4
Force 2031 40.7 38.9 37.7 43.4
Change -0.5 -2.3 -3.2 1.0
Harborough
Table 7: Projections Summary: 2018 and 2031: thousands (except change per annum)
ONS/CLG 2003-13 2008-13 SHMA SHMA SHMA
2012 Trends Trends Low High Average
Population 2018 90.2 90.7 91.2 90.9 91.6 91.2
2031 98.0 99.8 101.9 100.3 103.2 101.8
Change 7.8 9.1 10.7 9.4 11.6 10.5
Households 2018 37.9 37.8 38.0 37.9 38.2 38.0
2031 42.7 43.1 43.9 43.1 44.3 43.7
Change 4.8 5.3 5.8 5.2 6.1 5.7
Change pa 368 408 447 401 469 435
Labour 2018 46.6 47.6 47.8 47.6 48.0 47.8
Force 2031 46.7 49.4 50.0 49.4 50.9 50.2
Change 0.0 1.8 2.2 1.8 2.9 2.4
3 No range

John Hollis, Demographic Consultant,
Woodlands Cottage, Odiham Road, Odiham, Hampshire RG29 1JR
Phone: 01256 702456 E-mail: [email protected]
Demographic Consultancy and Analysis
Hinckley & Bosworth
Table 8: Projections Summary: 2018 and 2031: thousands (except change per annum)
ONS/CLG 2003-13 2008-13 SHMA SHMA SHMA
2012 Trends Trends Low High Average
Population 2018 110.1 109.2 109.1 110.8 111.6 111.2
2031 118.1 115.6 114.7 120.4 123.8 122.1
Change 8.0 6.3 5.5 9.5 12.2 10.9
Households 2018 48.0 47.2 47.1 48.1 48.4 48.3
2031 52.6 50.0 49.5 52.8 54.2 53.5
Change 4.5 2.8 2.4 4.7 5.8 5.2
Change pa 349 219 186 360 445 402
Labour 2018 56.8 56.8 56.4 57.6 58.0 57.8
Force 2031 57.0 56.6 55.3 59.2 60.9 60.0
Change 0.2 -0.1 -1.1 1.6 2.9 2.2 Kettering
4
Table 9: Projections Summary: 2018 and 2031: thousands (except change per annum)
ONS/CLG 2003-13 2008-13 SHMA
2012 Trends Trends
Population 2018 100.3 101.5 100.2 103.7
2031 110.4 117.7 111.2 125.9
Change 10.1 16.2 11.0 22.2
Households 2018 43.1 43.3 42.8 44.3
2031 48.7 50.6 48.1 54.0
Change 5.6 7.3 5.3 9.7
Change pa 434 561 410 747
Labour 2018 51.9 53.1 52.0 54.1
Force 2031 54.6 59.8 55.5 63.8
Change 2.7 6.7 3.5 9.6
4 No range

John Hollis, Demographic Consultant,
Woodlands Cottage, Odiham Road, Odiham, Hampshire RG29 1JR
Phone: 01256 702456 E-mail: [email protected]
Demographic Consultancy and Analysis
Leicester Table 10: Projections Summary: 2018 and 2031: thousands (except change per annum)
ONS/CLG 2003-13 2008-13 SHMA SHMA SHMA
2012 Trends Trends Low High Average
Population 2018 343.9 357.6 351.7 347.5 348.7 348.1
2031 367.7 425.4 399.2 378.7 383.5 381.1
Change 23.8 67.8 47.5 31.2 34.8 33.0
Households 2018 130.7 135.1 133.1 131.2 131.7 131.5
2031 146.0 166.6 156.6 147.2 149.1 148.1
Change 15.3 31.5 23.6 15.9 17.4 16.7
Change pa 1,175 2,425 1,813 1,224 1,338 1,281
Labour 2018 162.2 170.4 166.1 164.4 165.1 164.7
Force 2031 169.2 202.3 185.8 177.6 180.1 178.8
Change 7.0 31.9 19.7 13.1 15.0 14.1
North Warwickshire
Table 11: Projections Summary: 2018 and 2031: thousands (except change per annum)
ONS/CLG 2003-13 2008-13 SHMA SHMA SHMA
2012 Trends Trends Low High Average
Population 2018 63.3 62.0 62.1 63.5 63.8 63.7
2031 66.3 61.0 60.9 66.7 67.9 67.3
Change 3.0 -1.0 -1.2 3.2 4.1 3.7
Households 2018 26.9 26.2 26.2 26.9 27.0 26.9
2031 29.1 26.2 26.3 28.7 29.2 29.0
Change 2.2 0.1 0.1 1.9 2.2 2.0
Change pa 167 7 8 143 171 157
Labour 2018 32.7 32.1 32.0 32.8 33.0 32.9
Force 2031 32.0 29.2 28.9 31.9 32.5 32.2
Change -0.8 -2.8 -3.1 -0.9 -0.5 -0.7
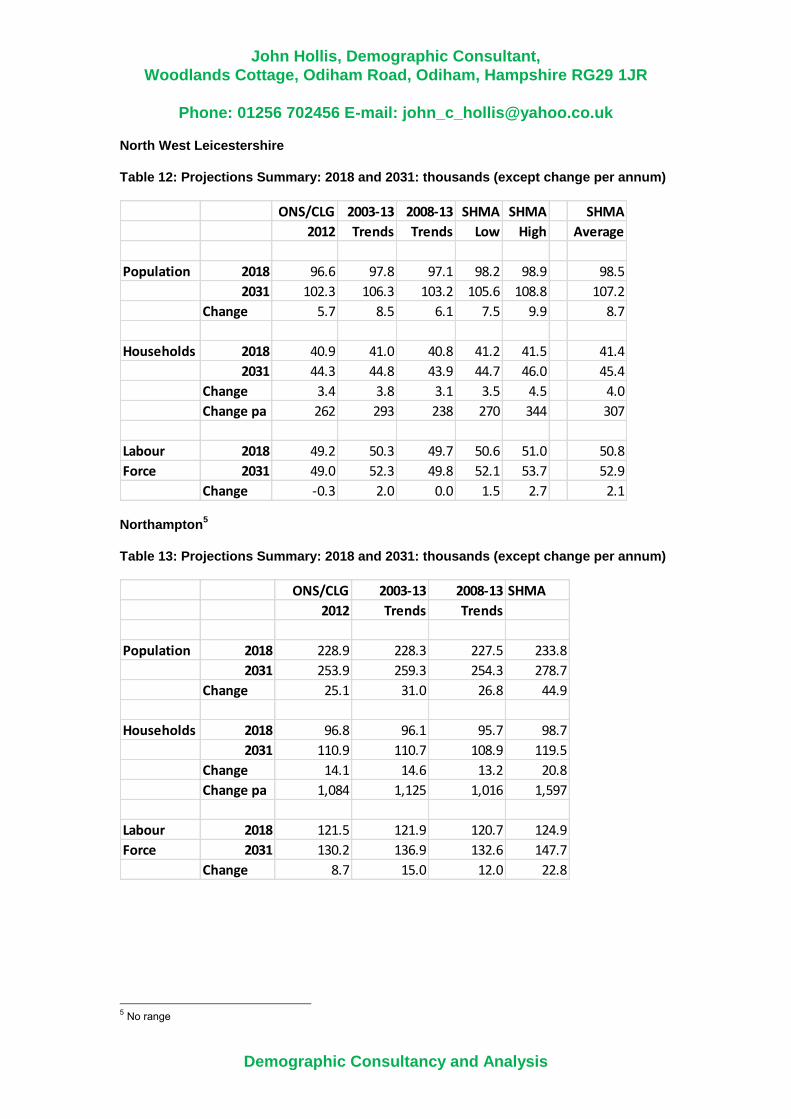
John Hollis, Demographic Consultant,
Woodlands Cottage, Odiham Road, Odiham, Hampshire RG29 1JR
Phone: 01256 702456 E-mail: [email protected]
Demographic Consultancy and Analysis
North West Leicestershire
Table 12: Projections Summary: 2018 and 2031: thousands (except change per annum)
ONS/CLG 2003-13 2008-13 SHMA SHMA SHMA
2012 Trends Trends Low High Average
Population 2018 96.6 97.8 97.1 98.2 98.9 98.5
2031 102.3 106.3 103.2 105.6 108.8 107.2
Change 5.7 8.5 6.1 7.5 9.9 8.7
Households 2018 40.9 41.0 40.8 41.2 41.5 41.4
2031 44.3 44.8 43.9 44.7 46.0 45.4
Change 3.4 3.8 3.1 3.5 4.5 4.0
Change pa 262 293 238 270 344 307
Labour 2018 49.2 50.3 49.7 50.6 51.0 50.8
Force 2031 49.0 52.3 49.8 52.1 53.7 52.9
Change -0.3 2.0 0.0 1.5 2.7 2.1
Northampton5
Table 13: Projections Summary: 2018 and 2031: thousands (except change per annum)
ONS/CLG 2003-13 2008-13 SHMA
2012 Trends Trends
Population 2018 228.9 228.3 227.5 233.8
2031 253.9 259.3 254.3 278.7
Change 25.1 31.0 26.8 44.9
Households 2018 96.8 96.1 95.7 98.7
2031 110.9 110.7 108.9 119.5
Change 14.1 14.6 13.2 20.8
Change pa 1,084 1,125 1,016 1,597
Labour 2018 121.5 121.9 120.7 124.9
Force 2031 130.2 136.9 132.6 147.7
Change 8.7 15.0 12.0 22.8
5 No range

John Hollis, Demographic Consultant,
Woodlands Cottage, Odiham Road, Odiham, Hampshire RG29 1JR
Phone: 01256 702456 E-mail: [email protected]
Demographic Consultancy and Analysis
Nuneaton & Bedworth
Table 14: Projections Summary: 2018 and 2031: thousands (except change per annum)
ONS/CLG 2003-13 2008-13 SHMA SHMA SHMA
2012 Trends Trends Low High Average
Population 2018 129.9 128.6 127.9 129.3 130.0 129.7
2031 139.0 134.4 130.8 140.2 143.1 141.7
Change 9.2 5.8 2.9 10.9 13.1 12.0
Households 2018 55.8 54.8 54.7 55.3 55.6 55.5
2031 61.5 58.0 57.1 61.2 62.4 61.8
Change 5.6 3.2 2.4 5.8 6.8 6.3
Change pa 433 247 185 447 522 484
Labour 2018 65.5 65.3 64.5 65.5 65.8 65.7
Force 2031 66.5 65.5 62.3 68.3 69.7 69.0
Change 1.0 0.2 -2.2 2.8 3.9 3.3
Oadby & Wigston
Table 18: Projections Summary: 2018 and 2031: thousands (except change per annum)
ONS/CLG 2003-13 2008-13 SHMA SHMA SHMA
2012 Trends Trends Low High Average
Population 2018 55.8 56.2 56.1 56.7 57.0 56.9
2031 58.0 57.4 56.1 59.8 61.0 60.4
Change 2.2 1.2 0.0 3.1 3.9 3.5
Households 2018 21.5 21.4 21.5 21.8 21.9 21.8
2031 22.5 21.7 21.9 22.8 23.2 23.0
Change 1.0 0.2 0.3 1.0 1.3 1.2
Change pa 78 19 27 80 103 92
Labour 2018 32.0 32.9 32.5 33.2 33.4 33.3
Force 2031 31.1 31.7 30.6 33.0 33.7 33.3
Change -1.0 -1.2 -1.9 -0.2 0.3 0.0

John Hollis, Demographic Consultant,
Woodlands Cottage, Odiham Road, Odiham, Hampshire RG29 1JR
Phone: 01256 702456 E-mail: [email protected]
Demographic Consultancy and Analysis
Rugby
Table 16: Projections Summary: 2018 and 2031: thousands (except change per annum)
ONS/CLG 2003-13 2008-13 SHMA SHMA SHMA
2012 Trends Trends Low High Average
Population 2018 105.9 108.2 106.5 108.0 109.0 108.5
2031 116.2 127.2 118.9 125.2 129.4 127.3
Change 10.3 19.0 12.4 17.2 20.4 18.8
Households 2018 45.1 45.5 44.8 45.4 45.8 45.6
2031 51.1 53.8 50.4 53.2 54.9 54.0
Change 5.9 8.3 5.6 7.8 9.1 8.4
Change pa 457 641 428 599 696 648
Labour 2018 58.9 61.3 59.6 60.8 61.4 61.1
Force 2031 61.0 69.8 63.2 68.5 70.8 69.7
Change 2.1 8.5 3.7 7.7 9.5 8.6
Tamworth
Table 17: Projections Summary: 2018 and 2031: thousands (except change per annum)
ONS/CLG 2003-13 2008-13 SHMA SHMA SHMA
2012 Trends Trends Low High Average
Population 2018 79.1 78.0 78.0 78.8 79.0 78.9
2031 82.5 78.6 78.3 84.9 86.0 85.4
Change 3.4 0.6 0.3 6.1 7.0 6.5
Households 2018 33.3 32.7 32.7 33.1 33.2 33.2
2031 35.8 33.5 33.5 36.3 36.8 36.6
Change 2.5 0.9 0.8 3.2 3.6 3.4
Change pa 192 66 60 249 278 263
Labour 2018 45.3 44.9 44.6 45.2 45.4 45.3
Force 2031 44.2 42.6 41.9 45.8 46.3 46.1
Change -1.1 -2.2 -2.7 0.5 1.0 0.7

John Hollis, Demographic Consultant,
Woodlands Cottage, Odiham Road, Odiham, Hampshire RG29 1JR
Phone: 01256 702456 E-mail: [email protected]
Demographic Consultancy and Analysis
Warwick
Table 18: Projections Summary: 2018 and 2031: thousands (except change per annum)
ONS/CLG 2003-13 2008-13 SHMA SHMA SHMA
2012 Trends Trends Low High Average
Population 2018 143.0 142.0 139.0 144.5 145.3 144.9
2031 154.7 151.6 139.8 162.4 165.4 163.9
Change 11.8 9.6 0.8 17.9 20.1 19.0
Households 2018 62.5 61.1 60.3 62.3 62.6 62.4
2031 70.2 66.8 62.6 71.5 72.6 72.1
Change 7.7 5.7 2.3 9.2 10.1 9.6
Change pa 592 439 178 707 776 741
Labour 2018 84.3 84.2 81.6 85.9 86.5 86.2
Force 2031 87.2 87.2 78.1 94.1 96.0 95.0
Change 2.9 3.0 -3.6 8.1 9.5 8.8
8. Magna Park 45 min Travel Zone Results
Table 19: Projections Summary: 2018 and 2031: thousands (except change per annum)
ONS/CLG 2003-13 2008-13 SHMA SHMA SHMA
2012 Trends Trends Low High Average
Population 2018 2,254.4 2,261.4 2,259.5 2,267.9 2,277.2 2,272.6
2031 2,454.7 2,515.0 2,495.0 2,506.7 2,545.1 2,525.9
Change 200.3 253.7 235.5 238.7 267.9 253.3
Households 2018 931.4 928.4 928.0 933.1 936.7 934.9
2031 1,044.8 1,049.7 1,044.8 1,050.5 1,065.8 1,058.2
Change 113.3 121.3 116.9 117.4 129.1 123.3
Change pa 8,716 9,332 8,989 9,034 9,932 9,483
Labour 2018 1,169.7 1,183.2 1,175.3 1,186.5 1,191.7 1,189.1
Force 2031 1,217.2 1,276.0 1,248.7 1,273.4 1,294.0 1,283.7
Change 47.5 92.9 73.5 87.0 102.4 94.7

John Hollis, Demographic Consultant,
Woodlands Cottage, Odiham Road, Odiham, Hampshire RG29 1JR
Phone: 01256 702456 E-mail: [email protected]
Demographic Consultancy and Analysis
9. Discussion
From the local authority tables it is clear that the SHMA recommendations produce the highest population, household and labour force results with the ten-year migration trends based on 2003-13 being the next highest. Overall by far the lowest projections were the ONS/CLG 2012-based. It should be expected that projecting 2003-13 trends produces higher results than the 2008-13 trends and the ONS 2012 projection as more pre-recession years are included in the base data. The SHMAs consider projected demographic change and economic requirements as well as any housing backlog so may be expected to produce the highest results in most authorities. In general economic activity rates for males in the main working ages are expected to decline slightly by 2031. The exceptions are seen in males over the age of 50. On the other hand female activity rates are expected to increase at all ages apart from the very lowest (16-17). Figure 1 shows rates for Leicester as an example. The increases at higher ages are, in part, an expected response to the gradual raising of the State Retirement Age for women to match men by 2018 and the subsequent rises to 66 and 67 for both genders. This projection does not directly account for all 16 and 17 year old expected to be in some form of education or training from 2016. Figure 1: Leicester: Economic Activity Rates; 2011 and 2031
Looking just at the 2003-13 trends projection, four authorities dominate the number of economically active residents: Coventry, Leicester, Northampton and Charnwood. By 2031 these four are projected to hold 640 thousand of the 1.276 million economically active residents, just over 50 per cent, and to have accounted for 85 thousand of the 93 thousand growth since 2018. The SHMAs tend to distribute more of the future change away from these four centres. In the High SHMA projection they account for 604 thousand of the 1.294 million economically active residents at 2031 and just 52 thousand out of the 102 thousand increase since 2018.

John Hollis, Demographic Consultant,
Woodlands Cottage, Odiham Road, Odiham, Hampshire RG29 1JR
Phone: 01256 702456 E-mail: [email protected]
Demographic Consultancy and Analysis
10. Labour Force by Age The following tables show the projected labour force in each authority by broad age groups using the 2003-13 trends and High SHMA projections. Table 20: 2003-13 Trends Labour Force Projection by Age: 2018 and 2031: thousands
16-17 18-24 25-74 Total 16-17 18-24 25-74 Total
Blaby 0.8 5.4 53.5 59.6 0.8 5.5 53.3 59.6
Charnwood 1.0 12.6 77.3 91.0 1.2 13.6 86.3 101.1
Coventry 1.9 25.1 144.3 171.3 2.5 27.5 165.2 195.2
Daventry 0.7 4.1 36.4 41.2 0.6 3.8 34.5 38.9
Harborough 0.8 4.5 42.4 47.6 0.7 4.5 44.2 49.4
Hinkley & Bosworth 0.8 5.8 50.1 56.8 1.0 6.1 49.5 56.6
Kettering 0.9 5.8 46.4 53.1 1.1 7.1 51.7 59.8
Leicester 2.0 26.7 141.7 170.4 2.6 31.1 168.5 202.3
North Warwickshire 0.5 3.5 28.1 32.1 0.5 3.3 25.4 29.2
North West Leicestershire 0.8 5.4 44.2 50.3 0.8 5.6 45.9 52.3
Northampton 1.7 15.7 104.5 121.9 2.2 19.4 115.3 136.9
Nuneaton & Bedworth 1.0 7.9 56.4 65.3 1.2 8.2 56.1 65.5
Oadby & Wigston 0.8 6.0 26.0 32.9 1.0 6.1 24.6 31.7
Rugby 1.6 7.3 52.4 61.3 2.0 8.8 59.0 69.8
Tamworth 1.2 6.1 37.7 44.9 1.2 6.1 35.4 42.6
Warwick 1.7 13.1 69.4 84.2 2.0 14.9 70.2 87.2
Magna Park - 45 minutes 18.2 154.9 1,010.7 1,183.7 21.6 171.5 1,085.1 1,278.1
2018 2031
Table 21: High SHMA Labour Force Projection by Age: 2018 and 2031: thousands
16-17 18-24 25-74 Total 16-17 18-24 25-74 Total
Blaby 0.8 5.7 55.5 61.9 0.9 6.3 61.1 68.3
Charnwood 1.0 12.9 77.1 90.9 1.0 13.6 82.2 96.8
Coventry 1.9 24.6 143.4 170.0 2.4 26.5 150.7 179.5
Daventry 0.7 4.3 37.3 42.4 0.7 4.3 38.4 43.4
Harborough 0.8 4.7 42.5 48.0 0.7 4.8 45.4 50.9
Hinkley & Bosworth 0.9 6.0 51.1 58.0 1.0 6.6 53.3 60.9
Kettering 0.9 6.1 47.1 54.1 1.1 7.8 54.9 63.8
Leicester 2.0 25.5 137.6 165.1 2.4 30.7 146.9 180.1
North Warwickshire 0.5 3.6 28.8 33.0 0.5 3.7 28.3 32.5
North West Leicestershire 0.8 5.5 44.7 51.0 0.8 5.7 47.2 53.7
Northampton 1.8 16.2 106.9 124.9 2.3 21.6 123.8 147.7
Nuneaton & Bedworth 1.0 8.0 56.8 65.8 1.2 8.7 59.8 69.7
Oadby & Wigston 0.8 6.3 26.2 33.4 1.0 6.7 26.0 33.7
Rugby 1.6 7.3 52.4 61.4 2.1 9.3 59.5 70.8
Tamworth 1.2 6.2 38.0 45.4 1.3 6.7 38.4 46.3
Warwick 1.8 13.6 71.1 86.5 2.1 17.0 76.9 96.0
Magna Park - 45 minutes 18.3 156.7 1,016.7 1,191.7 21.5 179.9 1,092.7 1,294.0
2018 2031

John Hollis, Demographic Consultant,
Woodlands Cottage, Odiham Road, Odiham, Hampshire RG29 1JR
Phone: 01256 702456 E-mail: [email protected]
Demographic Consultancy and Analysis
In the SHMA projection only North Warwickshire is projected to have a decline between 2018 and 2031 compared to five authorities using 2003-13 trends. Although numbers are small the greatest proportional growth is seen in the 16-17 year olds. Next highest growth is in the 18-24s. These increases reflect the annual increases in the number of births seen throughout England since 2000. Considering the 2003-13 trends seven authorities are projected to have declines in the resident labour force at ages 25-74, despite rising economic activity rates. These authorities: Blaby, Daventry, Hinckley & Bosworth, North Warwickshire, Nuneaton & Bedworth, Oadby & Wigston and Tamworth show more rapid aging profiles of their populations. In the SHMA projection only North Warwickshire and Oadby & Wigston exhibit declining labour force at these ages.
11. Demographic Models Used in the Projections Inputs
Population Base Population (gender and single years 0 to 90+): ONS 2013 or 2014 mid-year estimate. Other Populations: ONS MYE 2001-2012. Births: latest mid-year to mid-year consistent with MYE change analysis. Age-specific Fertility Rates and Total Fertility Rate Assumption: as ONS 2012 national and subnational projections. Deaths: latest mid-year to mid-year consistent with MYE change analysis. Survival/Mortality Assumptions: as ONS 2012 national and subnational projections. Migration: Age/gender probabilities linked to annual average migration changes over a recent minimum five-year period between 2001 and 2013 (eg 2003-13 or 2008-13) using data from ONS MYE and ONS MYE change analyses. Households
Household Representative Rates: Stage 1 rates from CLG 2012 projection for years 2011 to 2037. The model uses the CLG Stage 1 rates that are specific to 5-year age groups (15-19 … 85+), gender and relationship status. Communal Population: as CLG 2012 assumptions. Relationship Status (in a couple, formerly in a couple, single): as CLG 2012 assumptions. Labour Force
Economic Activity Rates: 2011 Census by age groups and gender. National Trends in EA Rates by age/gender: ONS national projection to 2020 (Labour Market Trends January 2006) with extension to 2031 using analysis by Kent County Council (Technical Paper: Activity Rate Projections to 2036, published October 2011). Processes Population
1 Survive base populations (single years of age and gender) by one year. 2 Calculate and add net migration by single years of age and gender for the survivors.
This gives the population of persons aged 1+ at the end of first projection year. 3 Calculate births by single years of age of mother (15 .. 49) using the average female
population at each age group throughout the projection year. 4 Split total births by gender using most recent 5-year average.

John Hollis, Demographic Consultant,
Woodlands Cottage, Odiham Road, Odiham, Hampshire RG29 1JR
Phone: 01256 702456 E-mail: [email protected]
Demographic Consultancy and Analysis
5 Survive births by gender to the end of projection year. 6 Calculate and add net migration of those surviving infants by gender born in the
projection year. This gives the population of 0 year old boys and girls at the end of the first projection year.
7 Repeat cycle until the final projection year.
Households
1 Separate total population (by gender and five-year age groups) into the three
relationship statuses by following CLG assumptions of the proportions in each status. 2 Calculate communal establishment population by gender, age and relationship status
by following CLG assumptions (constant numbers by gender, relationship status and age groups to 74 by and then constant proportions).
3 Calculate private household population by gender, age and relationship status by difference between total population and communal population.
4 Apply CLG Stage 1 household representative rates to the private household population by age, gender and relationship status. This gives total households.
5 Apply 2011 Census net vacancy rates, or other agreed rates, to convert households to homes.
6 The SHMA projections were built up from an annual input level of new dwellings by a
process of iteration. The number of additional dwellings was converted to the number
of additional households by allowing for net vacancy. A migration led population
projection is converted to households. A revised population total is estimated by
comparison of the projected households with the required households each year using
the projected average household size. The population projection is then run to the
revised total by adjusting the migration. The revised population projection is converted
back to households and the iteration continues until a static situation is reached.
Labour Force
1 Accumulate the 2011 Census data on economic activity (EA) by age to the required
age groups (16-17, 18-24, 25-29, … 70-74) by gender and calculate the EA rates using the 2011 census resident population as base.
2 Project the EA rates according to the changes by age group and gender in the ONS and KCC projections. Ensure rates do not exceed 100% or fall below 0%.
3 Accumulate the population projection to the required age groups by gender. 4 Apply the projected EA rates to the projected population.
Outputs
Population by single years of age (0-90+) and gender for all projection years to 2037. Annual births, total fertility rates, deaths and net migration to 2036-37. Total population, private household population and communal establishment population by age (0-4 … 85+), gender and relationship status every year 2011 to 2037. Households by age (15-19 … 85+), gender and relationship status of household representative every year 2011 to 2037. Households are converted to homes every year 2011 to 2037. Economically active resident population by gender and age groups (16-17, 18-24, 25-29, … 70-74) every year 2011 to 2031.

John Hollis, Demographic Consultant,
Woodlands Cottage, Odiham Road, Odiham, Hampshire RG29 1JR
Phone: 01256 702456 E-mail: [email protected]
Demographic Consultancy and Analysis
12. Conclusions
Analysis of new local authority level projections based on demographic trends and the latest SHMA recommendations show that overall the ONS 2012 projections produce the lowest results in terms of total population, households and resident labour force change between 2018 and 2031. The highest results are those based on the conversion of the SHMA dwelling recommendations between 2011 and 2031. Where the SHMA indicated a range the high alternative has been used. The SHMAs account for demographic change, the local labour market and backlog in housing provision so are expected to generally be higher than projections based on recent trends in migration. Two alternative migration trends were analysed: 2003-13 and 2008-136. The former, longer, period incorporated migration changes that took place prior to the recession and in most authorities produced a higher result. Overall between 2018 and 2031 the resident labour force within the Magna Park 45 minute travel time zone is projected to rise by between 48 thousand (ONS) and 102 thousand (SHMA High) with demographic trends varying between 74 thousand (2008-13) and 93 thousand (2003-13). Most of these increases are seen in the population aged 25-74 but the greatest proportional growth is at lower ages as a consequence of the annual increases in the number of births in England since 2000. The main difference between using the SHMA and demographic trends projections is that the SHMA recommendations tend to distribute the growth in the projected population more evenly with less concentration in the main cities in the zone: Coventry, Leicester and Northampton as well as the large authority of Charnwood.
6 These projections were prepared before the ONS 2014 mid-year estimate was published.

The Economic case for Magna Park
Final Report | October 2015 A2
APPENDIX 3 Baseline Data (NOMIS)
ECONOMIC CASE FOR MAGNA PARK

The Economic case for Magna Park
Final Report | October 2015 A2

The profile brings together data from several sources. Details about these and related terminology are given in the definitions section.
Labour Market Profile - Harborough
Resident Population
Total population (2014)
Harborough(Numbers)
East Midlands(Numbers)
Great Britain(Numbers)
All People 88,000 4,637,400 62,756,300
Males 43,600 2,288,100 30,890,900
Females 44,400 2,349,400 31,865,400
Source: ONS mid-year population estimates
Population aged 16-64 (2014)
Harborough(Numbers)
Harborough(%)
East Midlands(%)
Great Britain(%)
All People Aged 16-64 53,600 60.9 63.0 63.5
Males Aged 16-64 26,800 61.5 63.7 64.3
Females Aged 16-64 26,800 60.4 62.4 62.8
Source: ONS mid-year population estimatesNotes: % is a proportion of total population
Labour Supply
www.nomisweb.co.uk - 25/09/2015 (page 1 of 11)
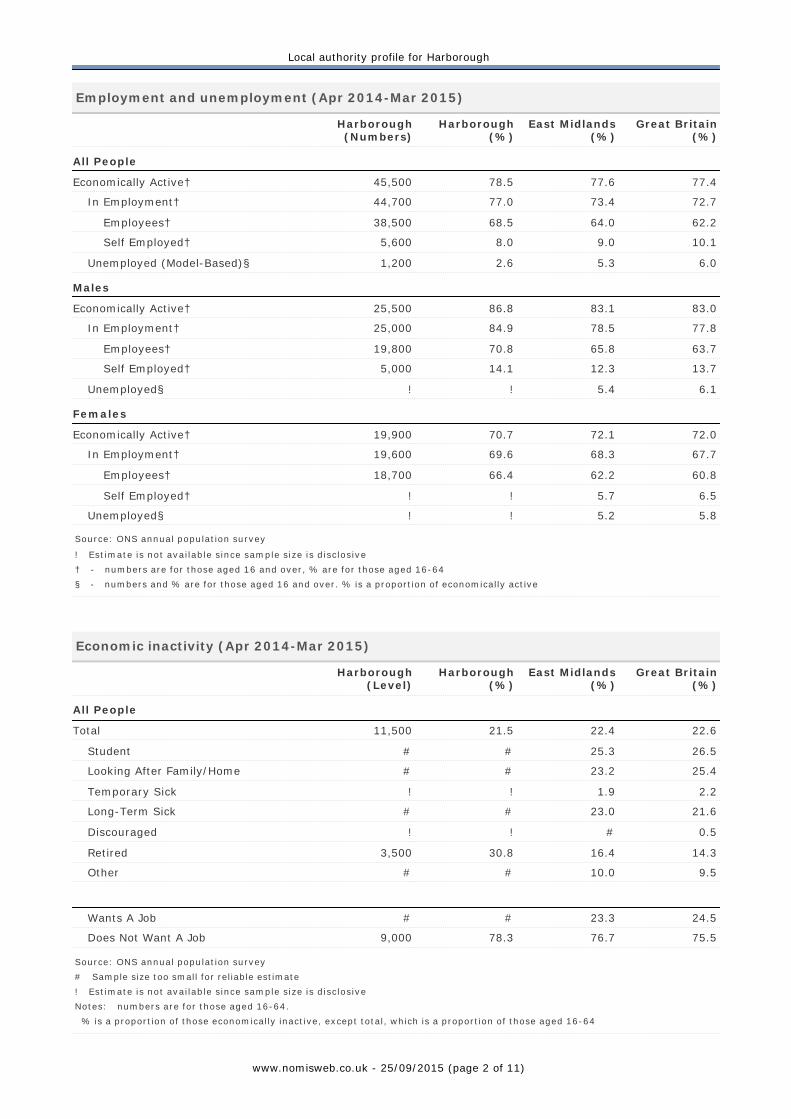
Employment and unemployment (Apr 2014-Mar 2015)
Harborough(Numbers)
Harborough(%)
East Midlands(%)
Great Britain(%)
All People
Economically Active† 45,500 78.5 77.6 77.4
In Employment† 44,700 77.0 73.4 72.7
Employees† 38,500 68.5 64.0 62.2
Self Employed† 5,600 8.0 9.0 10.1
Unemployed (Model-Based)§ 1,200 2.6 5.3 6.0
Males
Economically Active† 25,500 86.8 83.1 83.0
In Employment† 25,000 84.9 78.5 77.8
Employees† 19,800 70.8 65.8 63.7
Self Employed† 5,000 14.1 12.3 13.7
Unemployed§ ! ! 5.4 6.1
Females
Economically Active† 19,900 70.7 72.1 72.0
In Employment† 19,600 69.6 68.3 67.7
Employees† 18,700 66.4 62.2 60.8
Self Employed† ! ! 5.7 6.5
Unemployed§ ! ! 5.2 5.8
Source: ONS annual population survey
! Estimate is not available since sample size is disclosive† - numbers are for those aged 16 and over, % are for those aged 16-64§ - numbers and % are for those aged 16 and over. % is a proportion of economically active
Economic inactivity (Apr 2014-Mar 2015)
Harborough(Level)
Harborough(%)
East Midlands(%)
Great Britain(%)
All People
Total 11,500 21.5 22.4 22.6
Student # # 25.3 26.5
Looking After Family/Home # # 23.2 25.4
Temporary Sick ! ! 1.9 2.2
Long-Term Sick # # 23.0 21.6
Discouraged ! ! # 0.5
Retired 3,500 30.8 16.4 14.3
Other # # 10.0 9.5
Wants A Job # # 23.3 24.5
Does Not Want A Job 9,000 78.3 76.7 75.5
Source: ONS annual population survey# Sample size too small for reliable estimate! Estimate is not available since sample size is disclosiveNotes: numbers are for those aged 16-64. % is a proportion of those economically inactive, except total, which is a proportion of those aged 16-64
www.nomisweb.co.uk - 25/09/2015 (page 2 of 11)
Local authority profile for Harborough

Employment by occupation (Apr 2014-Mar 2015)
Harborough(Numbers)
Harborough(%)
East Midlands(%)
Great Britain(%)
Soc 2010 Major Group 1-3 24,600 55.6 40.5 44.3
1 Managers, Directors And Senior Officials 8,000 17.9 10.1 10.3
2 Professional Occupations 8,200 18.4 17.6 19.7
3 Associate Professional & Technical 8,500 18.9 12.6 14.1
Soc 2010 Major Group 4-5 6,900 15.6 22.0 21.4
4 Administrative & Secretarial # # 10.6 10.6
5 Skilled Trades Occupations 3,800 8.4 11.3 10.7
Soc 2010 Major Group 6-7 5,500 12.4 16.9 17.1
6 Caring, Leisure And Other Service Occupations # # 9.3 9.2
7 Sales And Customer Service Occs 3,800 8.6 7.6 7.8
Soc 2010 Major Group 8-9 7,300 16.5 20.7 17.2
8 Process Plant & Machine Operatives # # 7.9 6.3
9 Elementary Occupations 4,100 9.3 12.6 10.9
Source: ONS annual population survey# Sample size too small for reliable estimateNotes: Numbers and % are for those of 16+ % is a proportion of all persons in employment
Qualifications (Jan 2014-Dec 2014)
Harborough(Level)
Harborough(%)
East Midlands(%)
Great Britain(%)
Individual Levels
NVQ4 And Above 20,400 39.4 30.9 36.0
NVQ3 And Above 33,100 64.0 53.3 56.7
NVQ2 And Above 41,100 79.4 71.4 73.3
NVQ1 And Above 47,000 90.9 84.7 85.0
Other Qualifications # # 6.0 6.2
No Qualifications # # 9.3 8.8
Source: ONS annual population survey
# Sample size too small for reliable estimateNotes: For an explanation of the qualification levels see the definitions section. Numbers and % are for those of aged 16-64 % is a proportion of resident population of area aged 16-64
Earnings by residence (2014)
Harborough(Pounds)
East Midlands(Pounds)
Great Britain(Pounds)
Gross Weekly Pay
Full-Time Workers 552.5 483.4 520.8
Male Full-Time Workers 608.2 526.5 561.5
Female Full-Time Workers 425.9 420.2 463.0
Hourly Pay- Excluding Overtime
Full-Time Workers 14.02 12.00 13.15
www.nomisweb.co.uk - 25/09/2015 (page 3 of 11)
Local authority profile for Harborough

Male Full-Time Workers 15.56 12.57 13.70
Female Full-Time Workers 11.67 11.15 12.34
Source: ONS annual survey of hours and earnings - resident analysisNote: Median earnings in pounds for employees living in the area.
Out-Of-Work Benefits
The Jobseeker's Allowance (JSA) is payable to people under pensionable age who are available for, and actively seeking, work of at least 40 hours a week.
Total JSA claimants (August 2015)
Harborough(Numbers)
Harborough(%)
East Midlands(%)
Great Britain(%)
All People 238 0.4 1.6 1.7
Males 134 0.5 2.0 2.1
Females 104 0.4 1.2 1.2
Source: ONS Jobseeker's Allowance with rates and proportions Note: % is a proportion of resident population of area aged 16-64 and gender
JSA claimants by age duration (August 2015)
Harborough(Level)
Harborough(%)
East Midlands(%)
Great Britain(%)
Aged 16 To 64
Total 240 0.4 1.6 1.7
Up To 6 Months 170 0.3 0.9 0.9
Over 6 And Up To 12 Months 25 0.0 0.3 0.3
Over 12 Months 45 0.1 0.4 0.5
Aged 18 To 24
Total 40 0.7 2.4 2.4
Up To 6 Months 35 0.6 1.7 1.6
Over 6 And Up To 12 Months 0 0.0 0.4 0.4
Over 12 Months 0 0.0 0.3 0.3
Aged 25 To 49
Total 130 0.5 1.7 1.8
Up To 6 Months 90 0.3 1.0 1.0
Over 6 And Up To 12 Months 15 0.1 0.3 0.3
Over 12 Months 25 0.1 0.5 0.5
Aged 50 To 64
Total 70 0.4 1.2 1.3
Up To 6 Months 45 0.2 0.6 0.6
Over 6 And Up To 12 Months 10 0.0 0.2 0.2
Over 12 Months 20 0.1 0.4 0.5
Source: ONS Jobseeker's Allowance by age and duration with proportionsNote: % is number of persons claiming JSA as a proportion of resident population of the same age
www.nomisweb.co.uk - 25/09/2015 (page 4 of 11)
Local authority profile for Harborough

Working-age client group - main benefit claimants (February 2015)
Harborough(Numbers)
Harborough(%)
East Midlands(%)
Great Britain(%)
Total Claimants 3,230 6.0 12.0 12.5
By Statistical Group
Job Seekers 300 0.6 1.9 2.0
ESA And Incapacity Benefits 1,640 3.1 5.9 6.3
Lone Parents 250 0.5 1.1 1.1
Carers 420 0.8 1.6 1.5
Others On Income Related Benefits 80 0.1 0.3 0.3
Disabled 390 0.7 1.1 1.1
Bereaved 140 0.3 0.2 0.2
Main Out-Of-Work Benefits† 2,270 4.2 9.2 9.7
Source: DWP benefit claimants - working age client group† Main out-of-work benefits includes the groups: job seekers, ESA and incapacity benefits, lone parents and others on income related benefits. See the Definitions and Explanations below for detailsNote: % is a proportion of resident population of area aged 16-64
Labour Demand
Jobs density (2013)
Harborough(Jobs)
Harborough(Density)
East Midlands(Density)
Great Britain(Density)
Jobs Density 42,000 0.78 0.76 0.80
Source: ONS jobs densityNotes: The density figures represent the ratio of total jobs to population aged 16-64. Total jobs includes employees, self-employed, government-supported trainees and HM Forces
Employee jobs (2014)
Harborough(Employee
Jobs)
Harborough(%)
East Midlands
(%)
Great Britain
(%)
Total Employee Jobs 36,700 - - -
Full-Time 25,700 70.1 68.7 68.3
Part-Time 11,000 29.9 31.3 31.7
Employee Jobs By Industry
Primary Services (A-B: Agriculture And Mining) 100 0.4 0.3 0.4
Energy And Water (D-E) 300 0.9 1.3 1.1
Manufacturing (C) 2,500 6.9 12.9 8.5
Construction (F) 1,500 4.1 4.4 4.5
Services (G-S) 32,200 87.8 81.1 85.6
Wholesale And Retail, Including Motor Trades (G) 7,000 19.0 17.1 15.9
Transport Storage (H) 6,500 17.6 5.1 4.5
Accomodation And Food Services(I) 2,700 7.3 5.8 7.1
Information And Communication (J) 1,000 2.7 2.4 4.1
Financial And Other Business Services(K-N) 7,400 20.2 19.7 22.2
Public Admin, Education And Health (O-Q) 6,100 16.7 26.8 27.4
www.nomisweb.co.uk - 25/09/2015 (page 5 of 11)
Local authority profile for Harborough

Other Services (R-S) 1,600 4.2 4.2 4.4
Source: ONS business register and employment survey- Data unavailableNotes: % is a proportion of total employee jobs Employee jobs excludes self-employed, government-supported trainees and HM Forces Data excludes farm-based aggriculture
Earnings by workplace (2014)
Harborough(Pounds)
East Midlands(Pounds)
Great Britain(Pounds)
Gross Weekly Pay
Full-Time Workers 498.0 477.2 520.2
Male Full-Time Workers 509.9 519.2 560.6
Female Full-Time Workers 475.5 412.4 462.5
Hourly Pay - Excluding Overtime
Full-Time Workers 12.32 11.78 13.14
Male Full-Time Workers 12.14 12.34 13.68
Female Full-Time Workers 12.45 10.90 12.33
Source: ONS annual survey of hours and earnings - workplace analysisNote: Median earnings in pounds for employees working in the area.
Jobcentre plus vacancies
The Jobcentre Plus vacancies table has been removed as the series is no longer being updated and there are no suitable alternative sources available. Historic vacancy datasets remain available through the wizard and advanced query functions.
Businesses
UK Business Counts (2014)
Harborough(Numbers)
Harborough(%)
East Midlands(Numbers)
East Midlands(%)
Enterprises
Micro (0 To 9) 4,210 90.3 133,055 87.7
Small (10 To 49) 370 7.9 15,445 10.2
Medium (50 To 249) 70 1.5 2,665 1.8
Large (250+) 10 0.2 605 0.4
Total 4,660 - 151,770 -
Local Units
Micro (0 To 9) 4,460 86.9 148,605 82.1
Small (10 To 49) 550 10.7 26,150 14.4
Medium (50 To 249) 110 2.1 5,585 3.1
Large (250+) 15 0.3 775 0.4
Total 5,135 - 181,115 -
Source: Inter Departmental Business Register (ONS)
www.nomisweb.co.uk - 25/09/2015 (page 6 of 11)
Local authority profile for Harborough

Note: % is as a proportion of total (enterprises or local units)
Definitions And Explanations
Resident Population
The estimated population of an area includes all those usually resident in the area, whatever their nationality. HM Forces stationed outside the United Kingdom are excluded but foreign forces stationed here are included. Students are taken to be resident at their term-time address.
Labour Supply
Labour supply consists of people who are employed, as well as those people defined as unemployed or economically inactive, who can be considered to be potential labour supply. Information in this section relates to the characteristics of people living in an area.
Most labour supply data comes from the Annual Population Survey (APS). The APS is the largest regular household survey in the United Kingdom. It includes data from the Labour Force Survey (LFS), plus further sample boosts in England, Wales and Scotland. The survey includes data from a sample of around 256,000 people aged 16 and over.
As APS estimates are based on samples, they are subject to sampling variability. This means that if another sample for the same period were drawn, a different estimate might be produced. In general, the larger the number of people in a sample, the smaller the variation between estimates. Estimates for smaller areas such as local authorities are therefore less reliable than those for larger areas such as regions. When the sample size is too small to produce reliable estimates, the estimates are replaced with a #.
Economically ActiveEconomically Active
People who are either in employment or unemployed.
Economic Activity RatePeople, who are economically active, expressed as a percentage of all people.
In EmploymentPeople who did some paid work in the reference week (whether as an employee or self employed); those who had a job that they were temporarily away from (eg, on holiday); those on government-supported training and employment programmes; and those doing unpaid family work.
Employment RateThe number of people in employment expressed as a percentage of all people aged 16-64.
Employees And Self EmployedThe division between employees and self employed is based on survey respondents' own assessment of their employment status. The percentage show the number in each category as a percentage of all people aged 16-64. The sum of employees and self employed will not equal the in employment figure due to the inclusion of those on government-supported training and employment programmes, and those doing unpaid family work in the latter.
UnemployedRefers to people without a job who were available to start work in the two weeks following their interview and who had either looked for work in the four weeks prior to interview or were waiting to start a job they had already obtained.
Model-Based UnemployedAs unemployed form a small percentage of the population, the APS unemployed estimates within local authorities are based on very small samples so for many areas would be unreliable. To overcome this ONS has developed a statistical model that provides better estimates of total unemployed for unitary authorities and local authority districts (unemployment estimates for counties are direct survey estimates). Model-based estimates are not produced for male or female unemployed.
The model-based estimate improves on the APS estimate by borrowing strength from the measure of those claiming Jobseeker's Allowance to produce an estimate that is more precise (i.e. has a smaller confidence interval). The amount of people claiming Jobseeker's Allowance is not itself a
www.nomisweb.co.uk - 25/09/2015 (page 7 of 11)
Local authority profile for Harborough

measure of unemployment but is strongly correlated with unemployment, and, as it is an administrative count, is known without sampling error. The gain in precision is greatest for areas with smaller sample sizes.
Unemployment RateUnemployed as a percentage of the economically active population.
Economically InactiveEconomically Inactive
People who are neither in employment nor unemployed. This group includes, for example, all those who were looking after a home or retired.
Wanting A JobPeople not in employment who want a job but are not classed as unemployed because they have either not sought work in the last four weeks or are not available to start work.
Not Wanting A JobPeople who are neither in employment nor unemployed and who do not want a job.
OccupationOccupations are classified according to the Standard Occupation Classification 2000. Descriptions of the job titles included in each code are available in the SOC manuals.
QualificationsQualifications data are only be available from the APS for calendar year periods, for example, Jan to Dec 2005. The variables show the total number of people who are qualified at a particular level and above, so data in this table are not additive. Separate figures for each NVQ level are available in the full Annual Population Survey data set (wizard/advanced query).
The trade apprenticeships are split 50/50 between NVQ level 2 and 3. This follows ONS policy for presenting qualifications data in publications. Separate counts for trade apprenticeships can be obtained from the full APS data set (wizard/advanced query).
No QualificationsNo formal qualifications held.
Other Qualificationsincludes foreign qualifications and some professional qualifications.
NVQ 1 Equivalente.g. fewer than 5 GCSEs at grades A-C, foundation GNVQ, NVQ 1, intermediate 1 national qualification (Scotland) or equivalent.
NVQ 2 Equivalente.g. 5 or more GCSEs at grades A-C, intermediate GNVQ, NVQ 2, intermediate 2 national qualification (Scotland) or equivalent.
NVQ 3 Equivalente.g. 2 or more A levels, advanced GNVQ, NVQ 3, 2 or more higher or advanced higher national qualifications (Scotland) or equivalent.
NVQ 4 Equivalent And Abovee.g. HND, Degree and Higher Degree level qualifications or equivalent.
Earnings By ResidenceThe figures show the median earnings in pounds for employees living in the area who are on adults rates of pay and whose pay was not affected by absence. Figures for earnings come from the Annual Survey of Hours and Earnings (ASHE). The ASHE is based on a 1 per cent sample of employees, information on whose earnings and hours is obtained from employers. The survey does not cover self-employed. Information relates to a pay period in April.
The earnings information collected relates to gross pay before tax, national insurance or other deductions, and excludes payments in kind. It is restricted to earnings relating to the survey pay period and so excludes payments of arrears from another period made during the survey period; any payments due as a result of a pay settlement but not yet paid at the time of the survey will also be excluded.
www.nomisweb.co.uk - 25/09/2015 (page 8 of 11)
Local authority profile for Harborough

Out-Of-Work BenefitsJobseeker's Allowance
This is the number of people claiming Jobseeker's Allowance (JSA) and National Insurance credits at Jobcentre Plus local offices. People claiming JSA must declare that they are out of work, capable of, available for and actively seeking work during the week in which the claim is made.
The percentage figures express the number of claimants resident in an area as a percentage of the population aged 16-64 resident in that area.
The total JSA claimants is mostly derived from the Jobcentre Plus computer records. For various reasons, e.g. a claimant's National Insurance number is not known, a few claims have to be dealt with manually. These clerical claims, which amount to less than 1 per cent of the total, are counted separately and not analysed in as much detail as the computerised claims. The count of total JSA claimants includes clerical claims, but only the computerised claims are analysed by age and duration.
Introduction Of Universal CreditTables for Jobseeker's Allowance do not include claimants of Universal Credit who are claiming benefits principally for the reason of being unemployed.
A list of Jobcentres where Universal Credit is available can be found on the GOV.UK website.
New tables including claimants of Universal Credit will be introduced as soon as possible.
DWP Working-Age Client GroupThe number of working-age people who are claiming one or more main DWP benefits. The main benefits are: bereavement benefit, carer's allowance, disability living allowance, ESA and incapacity benefit, severe disablement allowance, income support, jobseeker's allowance, and widow's benefit. The age at which women reach State Pension age is gradually increasing from 60 to 65 between April 2010 and April 2020. Throughout this period, only women below State Pension age are counted as working age benefit claimants."
The total count is broken down by statistical groups. These categorise each person according to the main reason why they are claiming benefit. Each client is classified to a single group.
Benefits are arranged hierarchically and claimants are assigned to a group according to the top most benefit they receive. Thus a person who is a lone parent and receives Incapacity Benefit would be classified as incapacity benefits. Consequently, the group lone parent will not contain all lone parents as some will be included in the incapacity benefits group and Job seekers groups.
Main out-of-work benefits consists of the groups: job seekers, ESA and incapacity benefits, lone parents and others on income related benefits.
These groups have been chosen to best represent a count of all those benefit recipients who cannot be in full-time employment as part of their condition of entitlement. Those claiming solely Bereavement Benefits or Disability Living Allowance (DLA) are not included as these are not out-of-work or income based benefits. DLA is paid to those needing help with personal care. These people can, and some will, be in full-time employment. If DLA claimants are also in receipt of JSA, IS, ESA or Incapacity Benefits in addition to DLA they will be counted under the relevant statistical group. In addition, we exclude those claiming solely carer's benefits or claiming carer's benefits alongside income support, as DWP does not pursue active labour market policies for this group. Carers benefits are paid to those with full time caring responsibilities. The group entitled to Carer's benefits alongside Income Support (IS) includes around 86,000 claimants and has been stable over time.
This Nomis series is different to that published in the Office for National Statistics (ONS) Labour Market Statistics Bulletin (table 25) and on the DWP website at http://tabulation-tool.dwp.gov.uk/100pc/wa/tabtool_wa.html (against the link entitled "One-Click" Key Out-of-Work Benefits). This Nomis series uses DWP Jobseeker's Allowance numbers, whilst the other two series use the ONS Jobseeker's Allowance figures, using different methods and reference periods.
Labour DemandLabour demand includes jobs available within the area.
Jobs DensityThe level of jobs per resident aged 16-64. For example, a job density of 1.0 would mean that there is one job for every resident aged 16-64.
The total number of jobs is a workplace-based measure and comprises employee jobs, self-employed,
www.nomisweb.co.uk - 25/09/2015 (page 9 of 11)
Local authority profile for Harborough

government-supported trainees and HM Forces. The number of residents aged 16-64 figures used to calculate jobs densities are based on the relevant mid-year population estimates.
Employee JobsThe number of jobs held by employees. Employee jobs excludes self-employed, government-supported trainees and HM Forces, so this count will be smaller than the total jobs figure shown in the Jobs density table. The information comes from the Business Register and Employment Survey (BRES) - an employer survey conducted in September of each year. The BRES records a job at the location of an employee's workplace (rather than at the location of the business's main office).
Full-Time And Part-Time:In the BRES, part-time employees are those working for 30 or fewer hours per week.
NoteAll figures exclude farm-based agriculture
Earnings By WorkplaceThe figures show the median earnings in pounds for employees working in the area who are on adults rates of pay and whose pay was not affected by absence. Figures for earnings come from the Annual Survey of Hours and Earnings (ASHE). The ASHE is based on a 1 per cent sample of employees, information on whose earnings and hours is obtained from employers. The survey does not cover self-employed. In 2004 information related to the pay period which included 21 April.
The earnings information collected relates to gross pay before tax, national insurance or other deductions, and excludes payments in kind. It is restricted to earnings relating to the survey pay period and so excludes payments of arrears from another period made during the survey period; any payments due as a result of a pay settlement but not yet paid at the time of the survey will also be excluded.
UK Business CountsThe data contained in the table are compiled from an extract taken from the Inter-Departmental Business Register (IDBR) recording the position of units as at March of the reference year. The IDBR contains information on VAT traders and PAYE employers in a statistical register which provides the basis for the Office for National Statistics to conduct surveys of businesses.
The table presents analysis of businesses at both Enterprise and Local Unit level. An Enterprise is the smallest combination of legal units (generally based on VAT and/or PAYE records) which has a certain degree of autonomy within an Enterprise Group. An individual site (for example a factory or shop) in an enterprise is called a local unit.
The employment information on the IDBR is drawn mainly from the Business Register Employment Survey (BRES). Because this is based on a sample of enterprises, estimates from previous returns and from other ONS surveys have also been used. For the smallest units, either PAYE jobs or employment imputed from VAT turnover is used.
Estimates in the table are rounded to prevent disclosure.
Copyright
Under the terms of the Open Government Licence (OGL) and UK Government Licensing Framework (launched 30 September 2010), anyone wishing to use or re-use ONS material, whether commercially or privately, may do so freely without a specific application for a licence, subject to the conditions of the OGL and the Framework.
These new arrangements replace the previous Click-Use and Value Added Licences. For further information, go to the links above, phone 020 8876 3444 or email [email protected]
Users should include a source accreditation to ONS:
Source: Office for National Statistics
Copyright of a third party
www.nomisweb.co.uk - 25/09/2015 (page 10 of 11)
Local authority profile for Harborough

The permission to reproduce Crown protected material does not extend to any material on this site which is identified as being authored by a third party. Authorisation to reproduce such material must be obtained from the copyright holders concerned.
www.nomisweb.co.uk - 25/09/2015 (page 11 of 11)
Local authority profile for Harborough

About IDI Gazeley
IDI Gazeley (Brookfield Logistics Properties) is one
of the world’s leading investors and developers of
logistics warehouses and distribution parks with
57 million square feet of premier assets under
management and additional prime land sites to
develop another 50 million square feet of distribution
facilities near major markets and transport routes
in North America, Europe and China. As part of
Brookfield Property Partners, we belong to one of
the world’s largest and most sophisticated owners,
operators and investors in real estate.
For further information, please visit
About Brookfield
Brookfield Property Partners is one of the world’s
largest commercial real estate companies. Our goal is
to be the leading global owner, operator and investor
in best-in-class commercial property assets. Our
diversified portfolio includes interests in over 100
premier office properties and over 150 best-in-class
retail malls around the globe. We also hold interests in
multifamily, industrial, hotel and triple net lease assets
through Brookfield-managed private funds.
For information, please visit
www.brookfieldlogisticsproperties.com www.brookfieldpropertypartners.com