Report - Inventory of socioeconomic costs of work accidents
47
E u r o p e a n A g e n c y f o r S a f e t y a n d H e a l t h a t W o r k Inventory of socioeconomic costs of work accidents Prepared by: Topic Centre on Research — Work and Health: Jos Mossink TNO Work and Employment, the Netherlands In cooperation with: Marc de Greef, Prevent, Belgium R E S E A R C H European Agency for Safety and Health at Work
Transcript of Report - Inventory of socioeconomic costs of work accidents

E u r o p e a n A g e n c y f o r S a f e t y a n d H e a l t h a t W o r k
IInnvveennttoorryy ooff ssoocciiooeeccoonnoommiicc ccoossttssooff wwoorrkk aacccciiddeennttss
Prepared by:Topic Centre on Research — Work and Health:
Jos MossinkTNO Work and Employment, the Netherlands
In cooperation with:Marc de Greef, Prevent, Belgium
R E S E A R C H
European Agencyfor Safety and Healthat Work

http://agency.osha.eu.int
A great deal of additional information on the European Union is available on the Internet.It can be accessed through the Europa server (http://europa.eu.int).
Cataloguing data can be found at the end of this publication.
Luxembourg: Office for Official Publications of the European Communities, 2002
ISBN 92-95007-67-0
© European Agency for Safety and Health at Work, 2002Reproduction is authorised provided the source is acknowledged.
Printed in Luxembourg
PRINTED ON WHITE CHLORINE-FREE PAPER

C o n t e n t s
F O R E W O R D . . . . . . . . . . . . . . . . . . . . . . . . . . . . . . . . . . . . . . . . . . 5
S U M M A R Y . . . . . . . . . . . . . . . . . . . . . . . . . . . . . . . . . . . . . . . . . . . 7
1 . I N T R O D U C T I O N . . . . . . . . . . . . . . . . . . . . . . . . . . . . . . . . . . . . . . 9
2 . S O C I O E C O N O M I C C O S T S . . . . . . . . . . . . . . . . . . . . . . . . . . . . . . . . . 1 1
2 . 1 . E C O N O M I C C O N S E Q U E N C E S O F W O R K A C C I D E N T S . . . . . . . . . . . . . . . . . . . . 1 12 . 2 . C O S T S A N D B E N E F I T S F O R W H O M ? . . . . . . . . . . . . . . . . . . . . . . . . . . 1 22 . 3 . I N D I C A T O R S , C O S T F A C T O R S A N D P R I C I N G . . . . . . . . . . . . . . . . . . . . . . . 1 42 . 4 . C O S T S F O R I N D I V I D U A L S . . . . . . . . . . . . . . . . . . . . . . . . . . . . . . . 1 52 . 5 . C O S T S A T C O M P A N Y L E V E L . . . . . . . . . . . . . . . . . . . . . . . . . . . . . . 1 62 . 6 . T O T A L S O C I O E C O N O M I C B U R D E N O F W O R K A C C I D E N T S A T S O C I E T Y L E V E L . . . . . . . . 1 82 . 7 . C O S T S A N D B E N E F I T S F O R W H O M ? C O M P A R I S O N O F P E R S P E C T I V E S . . . . . . . . . . 2 0
3 . S O M E I S S U E S I N M A K I N G E C O N O M I C A S S E S S M E N T S . . . . . . . . . . . . . . . . . 2 13 . 1 . T H E V A L U E O F H E A L T H , W E L L - B E I N G A N D H U M A N L I F E . . . . . . . . . . . . . . . . . 2 13 . 2 . M U L T I P L E C A U S E S , M U L T I P L E E F F E C T S . . . . . . . . . . . . . . . . . . . . . . . . 2 23 . 3 . T I M E . . . . . . . . . . . . . . . . . . . . . . . . . . . . . . . . . . . . . . . . 2 2
4 . P R E P A R I N G A S S E S S M E N T S . . . . . . . . . . . . . . . . . . . . . . . . . . . . . . . 2 34 . 1 . W H Y A S S E S S M E N T S ? . . . . . . . . . . . . . . . . . . . . . . . . . . . . . . . . . 2 34 . 2 . A F I V E - S T E P I M P R O V E M E N T C Y C L E . . . . . . . . . . . . . . . . . . . . . . . . . . 2 34 . 3 . P R E P A R A T I O N . . . . . . . . . . . . . . . . . . . . . . . . . . . . . . . . . . . . 2 44 . 4 . S E L E C T I N G V A R I A B L E S A N D F I N D I N G D A T A . . . . . . . . . . . . . . . . . . . . . . . 2 44 . 5 . V A L U A T I O N , C A L C U L A T I O N . . . . . . . . . . . . . . . . . . . . . . . . . . . . . . 2 64 . 6 . I N T E R P R E T A T I O N O F R E S U L T S . . . . . . . . . . . . . . . . . . . . . . . . . . . . . 2 7
5 . P R A C T I C A L I N S T R U M E N T S . . . . . . . . . . . . . . . . . . . . . . . . . . . . . . . . 2 75 . 1 . C H E C K L I S T F O R P R E P A R A T I O N O F A N A S S E S S M E N T . . . . . . . . . . . . . . . . . . . 2 75 . 2 . E S T I M A T I O N O F T H E C O S T O F A C C I D E N T S . . . . . . . . . . . . . . . . . . . . . . . 2 85 . 3 . C O S T – B E N E F I T A N A L Y S I S . . . . . . . . . . . . . . . . . . . . . . . . . . . . . . . 2 9
6 . F U R T H E R R E A D I N G A N D R E F E R E N C E S . . . . . . . . . . . . . . . . . . . . . . . . . . 3 2
A N N E X 1 . P R O J E C T O R G A N I S A T I O N . . . . . . . . . . . . . . . . . . . . . . . . . . . . . 3 4
A N N E X 2 . E X A M P L E S . . . . . . . . . . . . . . . . . . . . . . . . . . . . . . . . . . . . . 3 5
E u r o p e a n A g e n c y f o r S a f e t y a n d H e a l t h a t W o r k
3


F o r e w o r dWork-related accidents are still a major safety and health problem in Europe. Every year,approximately 5 500 people are killed in accidents in their workplace. In 1998, 4.7 millionworkers suffered work-related accidents leading to more than three days of absence fromwork. Probably around 150 million working days are lost each year due to work-relatedaccidents. This is a huge cost for businesses and a huge cost in terms of human suffering for thevictims and their families.
Workplace accidents can mean pain and disability and can affect the worker’s life, both in andout of work. Disruptions to production and bad publicity following an accident are just someof the costs for businesses and organisations. Demands on public services, such as healthcareand social security, also increase. Estimated Member State costs due to work accidents vary from1–3 % of gross national product.
The European Commission is concerned about the costs of ‘non-social policy’ for Europe andthey have prioritised the need to develop knowledge of the economic and social costs arisingfrom occupational accidents and illnesses in their communication about a new Communitystrategy on safety and health at work for 2002–06.
This report from the Agency aims to contribute to this knowledge. It includes an inventory ofsocioeconomic costs of work accidents. It also provides an insight into what economicassessments are and how they are made and includes practical guidance on carrying outestimations of accident costs and the benefits of preventive activities. The key issues aresummarised in two Agency ‘Facts’ publications.
We hope that this report will contribute to the Commission’s strategy and will also be ofpractical benefit to anyone interested in costing accidents, whether from a national institutionor within an individual workplace.
The Agency’s Topic Centre on Research — Work and Health, a consortium of European researchinstitutions, prepared this report. TNO from the Netherlands coordinated the work. The Agencywould like to thank Jos Mossink and Marc de Greef for drafting the report and all those whocontributed to the report.
European Agency for Safety and Health at WorkApril 2002
E u r o p e a n A g e n c y f o r S a f e t y a n d H e a l t h a t W o r k
5


S u m m a r yAccidents at work and occupational injuries represent a considerable economic burden toemployers, employees and to society as a whole. Some of these costs, like lost workdays or lostincome, are clearly visible and can readily be expressed in monetary value. For a large parthowever, economic consequences of accidents are somewhat hidden or cannot be priced.Administrative activities following an accident for example may be forgotten, damage to thecompany image is hard to quantify and pricing human suffering and health damage is subjectto discussion.
Nevertheless, it is possible to get an adequate insight into the costs of accidents and thepotential benefits of accident prevention.
An important notion is that accidents (and accident prevention) have simultaneous effects onboth employee health (such as injuries) and company performance (e.g. detrimental effects oncompany image). In addition, the employee health effects have an additional effect on healthperformance (e.g. absence spells result in lower productivity).
This report is aimed at clarifying the process of making and understanding economicassessments. To this end, the following subjects are discussed and explained.
• Overview of economic consequences of accidents: what are the costs and for whom; whichcost factors are relevant at the level of the individual, the company and society as a whole;how can monetary values be obtained.
• The effect of time: how can results be corrected for the time value of money and how doesthis relate to the often limited planning horizon in companies; how can risk of investmentsbe dealt with.
The following are also very relevant.
• The causal relationship between the working conditions and accidents and betweenprevention and its effects: in general, these relations are hard to quantify in precise figures,but estimations can be valuable as well.
• The way health, well-being and human life can be expressed in terms of money.
In practice, it is often useful to pay attention to the process of making assessments as well. Someplanning can prevent discussions about the results or putting too much work into theassessment. A five-step approach can help to plan for an adequate economic evaluation inwhich the goals of the assessments, the interests of stakeholders, the availability of data andthe resources to be put into the evaluation itself can be balanced.
E u r o p e a n A g e n c y f o r S a f e t y a n d H e a l t h a t W o r k
7

1 . I n t r o d u c t i o nImprovements in safety and health at work can bring economic benefits to both companies andsocieties as a whole. Accidents and occupational diseases can give rise to serious costs for acompany. For small companies in particular, occupational accidents can have a major financialimpact.
It is difficult, however, to convince employers and decision-makers of the profitability ofimproving working conditions. An often effective way is to make financial or economicestimations. Although making calculations or making an analysis of costs and future benefitsneed not be complicated, many safety and health professionals are put off by potentialdifficulties. Indeed, some issues in economic appraisal like the value of health or human life aresometimes complicated. However, the basic principles are quite straightforward and can easilybe performed by safety and health professionals and managers.
The aim of this report is to offer some guidance in making estimations of the costs of accidentsand the benefits of preventive activities. To this end, Section 2 gives an inventory of costs anddiscusses how costs are divided over stakeholders. Section 3 describes some issues related tomaking cost estimations. Attention is given to estimating the (monetary) value of health, well-being and human life, cause and effects of relationships and the issue of time. Also, the effectsof national legislation and systems of social insurance are briefly discussed. Section 4 has a morepractical orientation. In this section, some guidelines for preparing and making cost estimationsare presented. A number of examples illustrate the cost of work accidents and occupationalinjuries.
E u r o p e a n A g e n c y f o r S a f e t y a n d H e a l t h a t W o r k
9


2 . S o c i o e c o n o m i c c o s t s
2 . 1 . E c o n o m i c c o n s e q u e n c e s o f w o r k a c c i d e n t s
Work accidents are a burden for many parties in many ways. Accidents and occupational injurieslead to costs for other companies, individual workers, and for society as a whole. The economiceffects of accidents and injuries can sometimes be identified as financial expenditures, damagesor loss of resources, but often there are adverse effects (such as health damage) that aredifficult to express in terms of money.
In several countries, estimations of the costs of accidents or occupational injuries have beenmade. Table 2.1 gives an overview of some of the results of these studies. In general, the costestimations require careful interpretation. For instance, definitions may differ from country tocountry.
E u r o p e a n A g e n c y f o r S a f e t y a n d H e a l t h a t W o r k
11
Table 2.1: Summary of estimations of costs of accidents at society level in somecountries
Country Ref Year Costs (million EUR) ‘Numberof workers
(x 1 000 000)’
Lost Damages Medical ‘Adminis- Loss of workdays costs tration, welfare
recruitment’
United Kingdom – 1 1995/6 739 9– 58 77–337 251– 279 2 109 25
Germany – 2 1998 5 905 32
Netherlands – 3 1995 158 363 122 6
Belgium – 4 1999 865 2,7
(1) HSE statistics (www.hes.gov.uk/statistics/dayslost.htm).(2) Koningsveld, E. A. P., Mossink, J.C.M., Societal costs of occupational safety and health in the Netherlands (Kerncijfers
maatschappelijke kosten arbeidsomstandig-heden in Nederland), The Hague, VUGA, 1997.(3) Bundesanstalt für Arbeitsschutz und Arbeitsmedizin, Dortmund (www.baua.de/info/statistik/stat_1998/kost98.htm).(4) Statistics occupational accidents in occupational diseases (Statistieken Arbeidsongevallen en beroepsziekten),
Prevent, Brussels, 2001.
In this report, ‘costs’ refers to all loss and burden that result (directly or indirectly) from workaccidents and occupational injuries.
At company level, accident prevention can have benefits in the form of reducing anticipatedlosses, savings in expenditures or additional gains. In many situations, additional (orunintended positive side-effects of prevention) benefits are even more important than thebenefits that are directly related to reduction of sick leave and disability (see Figure 2.1).

2 . 2 . C o s t s a n d b e n e f i t s f o r w h o m ?
Occupational safety and health is as much an issue in the social and public health domain as itis in the economic or business domain. The motives to pursue better safety and health at workstem from social goals as well as from economic goals.
It is clear that work accidents cause a burden to employees, companies and society as a whole.However, there are large differences in both the nature of the burden and the costs thereof.Table 2.2 gives a brief overview of costs and benefits of work accidents and their preventionwhich illustrates the variety of costs and benefits.
I n v e n t o r y o f s o c i o e c o n o m i c c o s t s o f w o r k a c c i d e n t s
12
Figure 2.1. Economic effects of safety and health at company level.
Less health andsafety risks.
Better opportunitiesfor rehabilitation
Investments,managementactivities,training
Safety and healthmeasures
Safety and healthperformance
Companyperformance
Less accidents,damages,liabilities,legal costs,absenteeismmedical costs
Less disruptionof work process.
Liabilities
Better fit to thework processes.
Higher motivatedpersonnel.
Improvement ofskills
Betterproductivity,efficiency, quality,company image,innovative capacity

E u r o p e a n A g e n c y f o r S a f e t y a n d H e a l t h a t W o r k
13
• evaluation of own safetyand health activities
• evaluation of effects ofpreventive measures,efficiency measurement
• insurance: compensationsand premiums
• evaluation of productionprocess
• costs and benefits indecision-making techniques
• profit–loss analyses
• evaluation of nationalsafety attitudes and safetyprogrammes
• cost–benefit analysis of newregulation
• evaluation of trade unionand sector organisationactivities
• pain and suffering • consequence to relatives
and friends • losses in second job or
household
• production losses • insured and uninsured costs
of accidents • quality losses • legal sanctions
• medical treatment andrehabilitation
• accident investigation andadministrative and legalactions
• insurance activities • costs to the national
economy • social costs
• using personal safetyequipment
• effort in adopting safetyattitudes and healthy lifeand workstyles
• developing safety andhealth management
• carrying out workplacesafety and healthinspection
• developing a safety climate • planning production • measures to improve
working conditions
• social attitudes and values • safety and health
legislation and inspection • trade union and sector
organisation activities • safety and health research,
education and information
Individualemployees:
Enterprises:
Society as a whole:
Table 2.2: A classification of safety and health costs and benefits, as well asexamples of methods to evaluate the costs and benefits (adapted from:Aaltonen & Söderqvist, 1988)
Examples of prevention Examples of consequences Possibilities of analysis activities (preventive costs) or effects of an accident or evaluation of costs
and diseases and benefits
Figure 2.2: Work accidents inflict costs on many parties (adapted from Krüger, 1997)
Other companies
Customers
Workers
Workers’ families
ShareholdersOccupational
safety and healthservices
Insurancecompanies
Company(employer,
management)
Healthcaresystem
Public orcollective funds
Occupationalaccidents and
diseases

In most decisions on prevention, companies (or company management) are the key actors. It isfor this reason that much information on cost, benefits and economic incentives is aimed atcompanies. It should be borne in mind that occupational accidents inflict many costs on variousparties (see Figure 2.2).
Companies often do not bear the full costs of occupational accidents, diseases, occupationalinjuries, or work-related illnesses. For instance, healthcare costs (inflicted by work accidents)may not be covered by the company or disability pensions may be borne by collective funds.
The costs of occupational safety and health for companies, but also for individual workers, arevery much influenced by the national system of social security. Also, the national healthcaresystem may have cost effects. In many countries, regulations exist that somehow bring back thecosts to the company or person who inflicted the costs (so-called cost internalisation). This maywork as an economic incentive to prevent future injuries or diseases. The most relevant issuesin social security and the healthcare system are the following.
• Is there a national compensation system for disability due to occupational illnesses andinjuries; if so, which illnesses are accepted as occupational?
• Can employees claim damages and financial consequences; are employers liable to damageclaims of their (former) employees?
• Do funds or subsidies for improvement of working conditions exist?
• Are social security or insurance premiums dependent on safety and health risks or pastperformance of the company?
The extent to which costs of work accidents are borne by those who caused the accident orthose who are in a position to prevent hazardous situations differs between the EU MemberStates. As indicated in Table 2.3, systems of social security, insurances and legislation can havean influence on how costs and benefits are divided between companies, workers, insurance andcollective funds.
I n v e n t o r y o f s o c i o e c o n o m i c c o s t s o f w o r k a c c i d e n t s
14
Table 2.3: Overview of instruments that can be used to internalise the costs of workaccidents and occupational injuries
Method of cost internalisation Principle or examples
Liabilities Workers or insurance companies can claim damages due to occupationalinjuries or diseases.
Legal sanctions, fines Labour inspectorates can give financial penalties, demand improvements ortemporarily stop production.
Differentiation in premiums Insurance companies or public funds adjust premiums for increased risk ofaccidents, occupational injuries and diseases. Premiums may also be adjustedaccording to past performance.
Payment of sick leave Obligation to (partly) pay wages during period of sick leave or disability.
Market regulation Attractiveness for new personnel, advantages in obtaining government orders.Improvement of the ‘accident rating’ for subcontractors in case of calls fortenders. Effects of company image.
2 . 3 . I n d i c a t o r s , c o s t s f a c t o r s a n d p r i c i n g
There is no ultimate or definitive list of cost factors to be included in an assessment ofsocioeconomic costs of work accidents and occupational injuries. Nevertheless, a common set ofcost factors has emerged from practice and theory. Additions or modifications are to be madedepending on the purpose of the assessment, the structure of social security in a country, thecompany’s possibilities to find adequate data, the company’s business, interests of stakeholdersand so on.

There is a large number of variables that can be included in an economic assessment. In mostsituations, only part of the variables may be relevant for a particular situation. Therefore,constructing the list of cost factors is one of the key activities in any economic appraisal. Withit, one decides which kind of costs are used and which are (deliberately) left out. As theselection of variables may have a major impact on the results, it is important to involve allrelevant stakeholders in the selection process. Checklists can be very helpful to identify the costcomponents and potential benefits in practical situations. The following criteria for selection ofvariables can be used:
• relevance to the situation, company or national context;
• relevance to the type of work;
• anticipated possibility of finding relevant data (if no data seem to be available, try to findways to estimate);
• interests of stakeholders.
Sections 2.4 to 2.6 present variables or indicators that are usually included in economic analysesconcerning occupational safety and health. It is hardly possible to compile a list of variables thatis both complete (all costs are included) and avoids double counting at the same time.
2 . 4 . C o s t s f o r i n d i v i d u a l s
The (economic) effects for individual workers are extremely hard to express in terms of money,in particular for serious injuries with long-term (irreversible) effects. Future effects (and thevalue thereof for the individual) cannot be estimated in a reliable and general way. Less seriouswork accidents in which the victims fully recover from the injuries and which result in a limitedperiod of incapacity can be costed more easily as, in these cases, grief and suffering and futureeffects are relatively unimportant.
The most important elements that add up to the total burden of work accidents for theindividual are summarised in Table 2.4. Note that the burden that relates to grief, suffering andhealth is very difficult, if not impossible, to express in monetary values. Pricing techniques, likethe willingness to pay or willingness to accept, do not give any reliable results.
E u r o p e a n A g e n c y f o r S a f e t y a n d H e a l t h a t W o r k
15
Expenditures for healthcare that are notcompensated by insurance or employer
Willingness to accept, willingness to pay
Height of claims and compensations
No reliable method available
Reduction in present income, loss of wages
Differences between total expected futureincome and total compensation or pensions
Sum of all other expenses for a victim andhis/her family (that are not compensated)
Hospitalisation (bed-days) Other medical care, such as non-hospitaltreatment, medicines Permanent disability (numbers, age ofpatient)Non-medical (e.g. vocational) rehabilitation,house conversions
Life expectancy, healthy life expectancyQuality adjusted life years (QALY) Disability adjusted life years (DALY)
For victims, but also for relatives and friends
Loss in income from present and second job
Also including the second job
Examples are costs for transportation, visitsto hospitals, costs arising from fatalities suchas funerals
Health
Quality of life
Grief and suffering
Present income losses
Loss of potential futureearnings
Expenses that are notcovered by insurancesor compensations
Table 2.4: Cost factors at individual level
Variable Description How to obtain money value
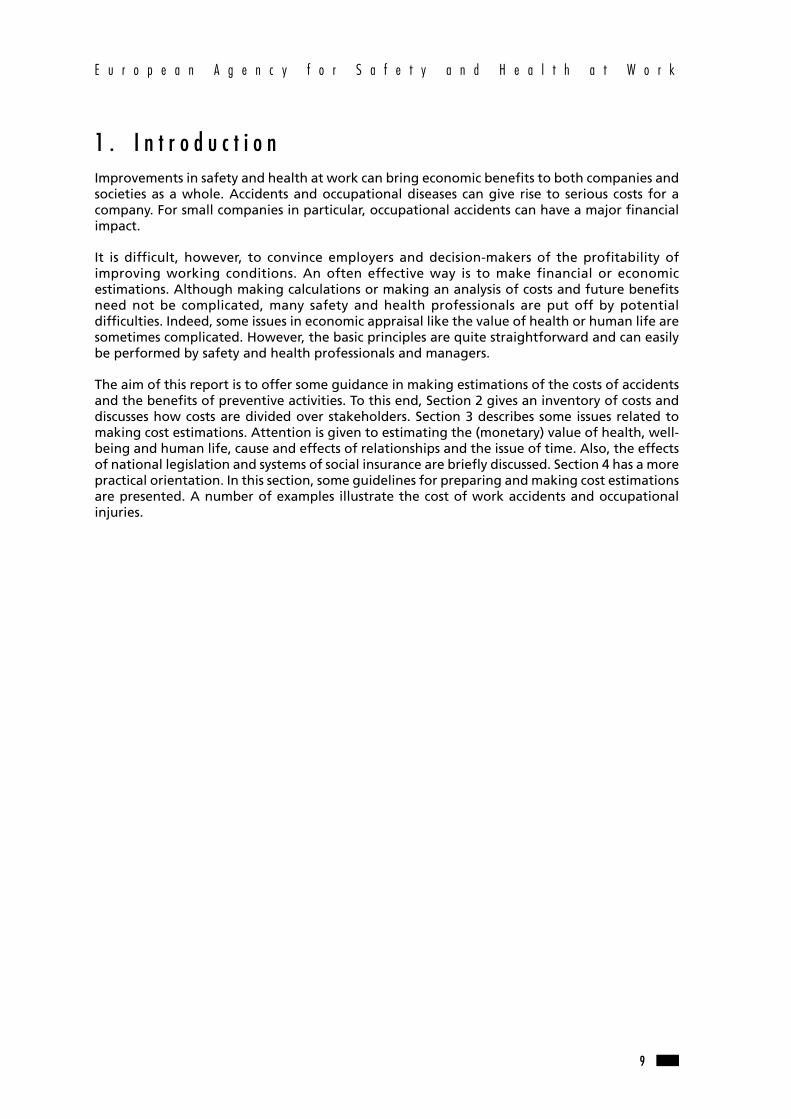
2 . 5 . C o s t s a t c o m p a n y l e v e l
At company level, costs are related to the immediate health effects but also to the effects ofdisruption of production. In many cases, this disruption accounts for the highest part of thetotal costs. Table 2.5 summarises cost categories related to work accidents and occupationalinjuries at company level.
I n v e n t o r y o f s o c i o e c o n o m i c c o s t s o f w o r k a c c i d e n t s
16
Sum of costs of subsequent activities, fines andpayments
Sum of costs of activities to deal with effects oflost work time, such as replacement and lostproduction; indirect effect is that sick leavereduces flexibility or possibilities to deal withunexpected situations
Sum of costs of activities originated byunwanted turnover, such as replacement costs,additional training, productivity loss,advertisements, recruitment procedures
Sum of costs of activities originated by disabilityor early retirement, fines, payments to the victim
Invoices
Total wages of time spent
Replacement costs
Total wages of time spent
Invoices
Invoices, claims, costs of settlements; fines,penalties
Additional wages
Total production value
Estimated production value, representing lostincome for the company
Interests of the expenditure amount, investedduring x years, with an interest rate of y %
Number of fatalities
Amount of work time lost due to absenteeism
Percentage or number of persons (unwanted)leaving the company in a period of time
Percentage or number of persons in a period oftime
Money spent by the employer to facilitatereturning to work (counselling, training,workplace adjustments)
(Managerial) activities that have to be performedby the company related to sick leave
Damages or repair costs of machines, premises,materials or products associated withoccupational injuries
Time and money spent for injury investigation,workplace assessments (resulting fromoccurrence accidents or illnesses)
Changes in premiums due to the incidence ofinjuries and occupational illnesses
Extra spending on higher wages for dangerousor inconvenient work
Production time lost as a consequence of anevent which results in injury (e.g. because ittakes time to replace machines, or productionhas to be stopped during investigation)
Orders lost or gained, competitiveness in specificmarkets
Non-realised profit because of accident costs, i.e.expenditure due to accidents and not invested ina profitable activity (like production, stockmarket or saving) generating interests
Fatalities, deaths
Absenteeism or sick leave
Personnel turnover dueto poor workingenvironment, or earlyretirement and disability
Early retirement anddisability
Non-medicalrehabilitation
Administration of sicknessabsence, injuries, etc.
Damaged equipment
Other, non-health-relatedcosts (e.g. investigations,management time,external costs)
Effects on variable partsof insurance premiums,high-risk insurancepremiums
Liabilities, legal costs,penalties
Extra wages, hazardousduty pay (if the companyhas a choice)
Lost production time,services not delivered
Opportunity costs
Lack of return oninvestment
Table 2.5: Overview of the most important cost categories related to work accidentsat company level
Variable Description How to obtain money value
Effects of incidents that cannot directly be expressed in monetary value
Effects of incidents, injuries and diseases that can readily be expressed in a monetary value

Prevention not only results in reduction of (potential) damages but can also enhanceproduction processes in the company. The costs of preventive activities can be estimated fromcost quotations and the time investments of personnel (see Table 2.6).
E u r o p e a n A g e n c y f o r S a f e t y a n d H e a l t h a t W o r k
17
Market prices, quotations, invoices
Market prices, quotations, invoices
Market prices, quotations, invoices, total wagesof time spent
Market prices, quotations, invoices
Market prices, quotations, invoices
Market prices, quotations, invoices
Total wages of time spent
Market prices, quotations, invoices
Total wages of time spent
Market prices, quotations, invoices, total wagesof time spent
Costs of specific ‘OSH’ equipment or additionalcosts of other investments related to top OSH
Changes in non-OSH-related capital goods tofacilitate functioning of OSH equipment (e.g.reconstruction of buildings)
Expenditures for internal and external activitiesfor design and implementation of newequipment or working procedures
Price difference (e.g. for non-toxic chemicals,lighter products)
Costs of protective equipment
Price difference between old ways of workingand new, directly related to the preventiveaction; note that new ways may also result incost savings (e.g. extra costs to work accordingto safety standards)
Time spent on meetings, training, safetyinspections, participatory developments
Also includes occupational health services
Human resource management, healthpromotion, OSH policy and management
Anything that is not covered in the previousheadings
Investments
Additional investments
Engineering, consultancyand planning costs,related to investments
Additional costs ofsubstitution products(recurring costs)
Purchase of personalprotective equipment(recurring costs)
Additional costs forchanged workingprocedures andmaintenance (recurringcosts)
Extra work time of directpersonnel (recurring costs)
Costs of internal orexternal OSH services,other preventive services(recurring costs)
In-company activities
Other workplace costs
Table 2.6: Overview of costs of preventive activities at company level (1)
Variable Description How to obtain money value
(1) Note that the cost factors have to be selected according to the intervention.
Total of cost reduction directly related tointervention to be estimated from effects on thecompany’s operation
Value depends on company strategy. Reductionin repair costs and warranties
Only indirect effects, e.g. on productivity, qualityor flexibility. Increased capabilities to deal withunexpected situations
Compensations and subsidies received
Indirect effects
Indirect, long-term effects
Indirect, long-term effects. No operationalbenefits
Reduced costs for facilities, energy, materials,increased productivity; reduced personnel costs
Changes in product or service quality; reliabilityof deliveries
Support for prevention only, compensationsreceived for sick leave or disability are to beexcluded
Attractiveness to customers, attractiveness onlabour market, attractiveness to contractors,ability to recruit personnel
To be derived from mission statements and thelike, typically strategic considerations
Ability to innovate in products and productionprocesses
Increased productivityand other operationaleffects
Improved quality ofproducts and services
Improved well-being, jobsatisfaction and workingclimate
Compensations andsubsidies received frominsurance or authorities
Company image effects
Impact on non-economiccompany values
Innovative capacity of thefirm
Table 2.7: List of potential additional benefits from preventive activities at companylevel
Variable Description How to obtain money value

Preventive activities generate benefits over several years. Such benefits must be converted tocurrent values with an ex ante present value factor.
For most organisations, the bottom line in company performance is financial balance. Even non-profit organisations need to break even. Yet, in some situations, overall financial indicators maynot be appropriate:
• non-profit or not-for-profit organisations may be less interested in financial indicators,whereas quality and efficiency can be more important;
• financial statements look back, but the ability of a company to generate attractive results inthe (near) future is as important;
• financial results are influenced by many factors, and effects of safety and health are very hardto isolate.
It should be clear, however, that economic appraisal should not be limited to financial aspectsonly. An assessment should concentrate on the contribution of occupational health to thecompany’s competitive strength (or the company’s goals). Assessments in non-profitorganisations can focus on effectiveness and the quality of services. Recent developments inassessing company performance make it clear that occupational health contributes to acompany’s success in many ways. In this respect, the financial costs or benefits offer too narrowa view.
Modern methods (like the balanced scorecard) in company performance measurement aim todefine and measure indicators that contribute to the success of a company. In addition tofinancial indicators, it is very useful to define indicators with respect to:
• the attractiveness of a company (and its products) for customers or for potential employees;
• internal organisation, the efficiency and flexibility of the production processes;
• the ability to innovate products, services and production processes.
As markets, visions and goals differ enormously among companies, each organisation has todefine its own indicators and establish for itself how safety and health at work contribute toeach of the indicators.
2 . 6 . To t a l s o c i o e c o n o m i c b u r d e n o f w o r k a c c i d e n t s a t s o c i e t y l e v e l
The total societal costs of work accidents roughly consists of two components:
• total loss of resources and productive capacity;
• reduction of welfare and health.
This means that making cost estimates of work accidents and occupational injuries shouldinclude health variables as well as variables with respect to economic performance ofcompanies (see Table 2.7.b).
There are several methods to make cost estimates in which roughly two different principles canbe used:
• all costs within one year are taken (prevalence method);
• all present and future cost effects of new cases in one year (incidence method).
I n v e n t o r y o f s o c i o e c o n o m i c c o s t s o f w o r k a c c i d e n t s
18

The choice is generally made on grounds of availability of data. The incidence method ispreferred for most uses. However, finding the required data (such as long-term effects) is oftendifficult.
Note that compensations and pensions paid by social insurances are not adequate for makingcost estimates at society level for a number of reasons:
• as concerns transfer payments (payments that are not related to some kind of output), suchcompensations are not a part of the gross national product;
• the size of payments is not necessarily related to either the loss of productive capacity, or theextent of health effects and of grief and suffering.
However, compensations are money spent due to work accidents.
E u r o p e a n A g e n c y f o r S a f e t y a n d H e a l t h a t W o r k
19
Actual expenditures on medical treatment andrehabilitation
Willingness to pay or willingness to accept.
Willingness to pay or willingness to accept. Totalamount of indemnities and compensations
Willingness to pay or willingness to acceptTotal amount of indemnities and compensations
Total lost earnings during period of absence
Sum of lost income during expected disabilityperiod, in which both the income and theperiod are estimated on statistical data
Total wages spent on the activity
Replacement costs, market prices
Market price of lost production
Hospitalisation (bed-days) Other medical care,such as non hospital treatment, medicinesPermanent disability (numbers, age of patient)Non-medical (e.g. vocational) rehabilitation,house conversions
Life expectancy, healthy life expectancy Quality adjusted life years (QALY) Disability adjusted life years (DALY)
For victims, but also for relatives and friends
Lost earnings due to sick leave, absenteeism anddisability
Lost earnings during the whole period ofpermanent disability
Health
Fatalities (numbers, ageof patient)
Quality of life
Grief and suffering
Present production losses
Loss of potential futureearnings and production
Administration of sicknessabsence, etc
Damaged equipment (byaccidents)
Lost production due toincapacity of personneland productiondowntime
Table 2.7.b: Summary of variables related to costs of work accidents at society level
Variable Description How to obtain money value
Health-related costs
Non-health-related costs and damages
The estimation of the money spent on prevention at society level can best be regarded as thesum of (Table 2.8):
• all expenditure and wages for time spent on preventive activities by companies;
• cost and expenditure for policy-making, research and promotion, enforced by authorities;
• cost and expenditure for policy-making, research and promotion, enforced by sectororganisations.

Also, the activities of individual workers can be included. However, no practical studies areavailable to make an estimate. It can be anticipated that these costs are rather small incomparison to all other categories.
I n v e n t o r y o f s o c i o e c o n o m i c c o s t s o f w o r k a c c i d e n t s
20
Costs of specific ‘OSH’ equipment or additionalcosts of other investments related to top OSH
Changes in non-OSH-related capital goods tofacilitate functioning of OSH equipment (e.g.reconstruction of buildings)
Expenditures for internal and external activitiesfor design and implementation of newequipment or working procedures
Price difference (e.g. for non-toxic chemicals,lighter product)
Costs of protective equipment
Price difference between old ways of workingand new, directly related to the preventiveaction; note that new ways may also result incost savings (e.g. extra costs to work accordingto safety standards)
Time spent on meetings, training, participatorydevelopments
Including occupational health services
Human resource management, healthpromotion, OSH policy and management
Anything that is not covered in the previousheadings
Including labour inspectorates
Investments
Additional investments
Engineering, consultancyand planning costs,related to investments
Additional costs ofsubstitution products(recurring costs)
Purchase of personalprotective equipment(recurring costs)
Additional costs forchanged workingprocedures andmaintenance (recurringcosts)
Extra work time of directpersonnel (recurringcosts)
Costs of internal orexternal OSH services,other preventive services(recurring costs)
In-company activities
Other workplace costs
Costs of policy-making,research andenforcement at nationalor sector level
Table 2.8: Cost factors regarding the cost of preventive activity at society level
Variable Description Method of costing
Market prices, quotations, invoices
Market prices, quotations, invoices
Market prices, quotations, invoices, total wagesof time spent
Market prices, quotations, invoices
Market prices, quotations, invoices
Market prices, quotations, invoices
Total wages of time spent
Market prices, quotations, invoices
Total wages of time spent
Market prices, quotations, invoices, total wagesof time spent
Total expenditures and wages of relevantauthorities and sector organisations
The benefits of prevention at national level should best be estimated by reduction of theburden. There are no examples that show an estimation of the total benefits for companies interms of productivity, quality, image and the like.
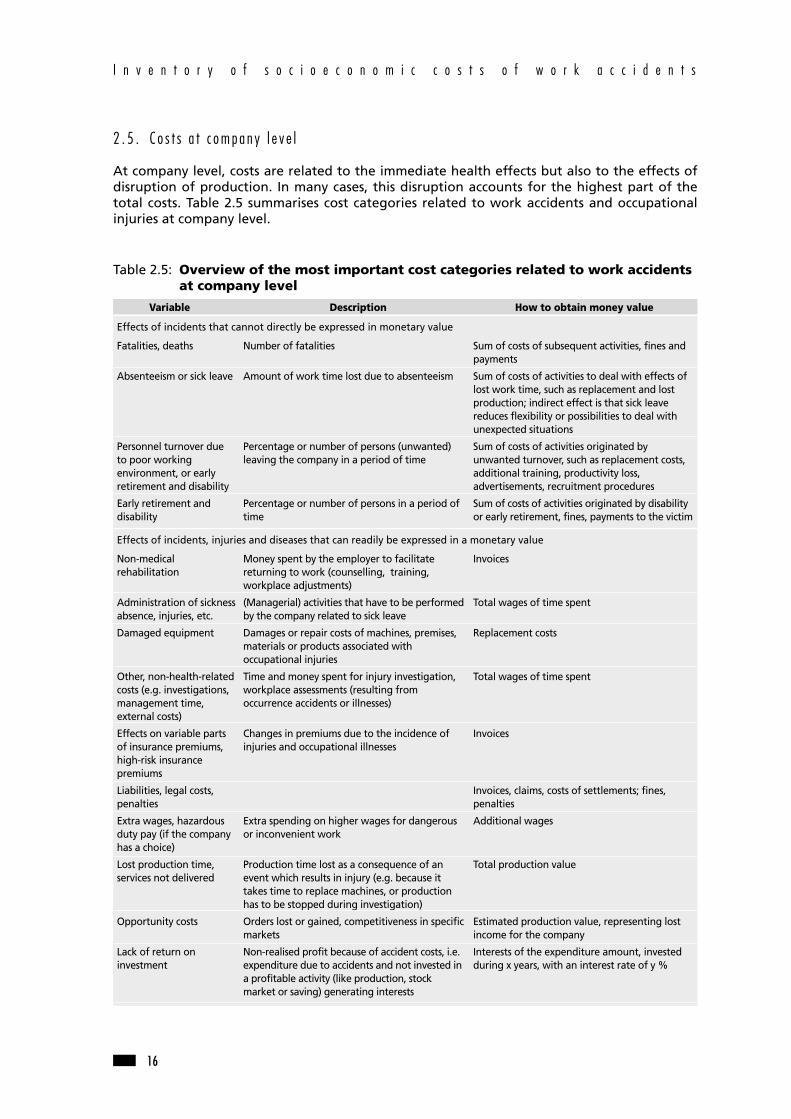
2 . 7 . C o s t s a n d b e n e f i t s f o r w h o m ? c o m p a r i s o n o f p e r s p e c t i v e s
As can be noted from the overview of costs for different actors, perspectives and interests canbe quite different or even opposite. Table 2.9 illustrates some of the differences. As aconsequence, any attempt to make cost estimates has to address the question of differences ininterests and perspective.
3 . S o m e i s s u e s i n m a k i n g e c o n o m i c a s s e s s m e n t s
3 . 1 . T h e v a l u e o f h e a l t h , w e l l - b e i n g a n d h u m a n l i f e
The power of a cost–benefit analysis resides partly in the fact that the value of incomparableconcepts is expressed in a common denominator: money. Therefore, it is presumed that everycost and every benefit has a market value. In practice, it is often very difficult and sometimesmerely impossible or even undesirable to put a price on the benefits of better safety and healthat work. Important questions in this respect are the following.
• Is there a value of a statistical human life, and if so, how can that value be assessed?
E u r o p e a n A g e n c y f o r S a f e t y a n d H e a l t h a t W o r k
21
Individual workers and theirfamilies
Personal health, well-being andwelfare
Adaptation of behaviour
Months to decades
Unsure (from ultra short inbehaviour to very long withrespect to personal income)
Reduced health and well-being,reduced income, medical costs
Health and well-being,employability (better personaleconomy?)
Injuries and chronic ill health
Generally not considered (exceptfor determining future incomelosses)
Related to personal income
Limited importance
Company management,ownership
Framed in terms of the company,includes mostly healthy workers
Procurement, e.g. substitution ofraw materials, safe equipment,investments, managementsystems and control
Months to years
Months to years (probably doesnot include full life-cycle ofchronic diseases)
Lost work days due to employeeillness, repair of damagedequipment, liabilities, intangibleeffects
Lower insurance premiumsassociated with reduced injuryrates, improved worker moraleand productivity, better quality
Injuries, acute health conditionswhich are readily associated withoccupational exposures
Not as critical to include in shortanalytical horizon
Related to company finances
Less important, as easier toidentify who benefits and whodoes not
Government decision makers,society as a whole
Framed in terms of society,includes vulnerable sub-populations, the environment,
Economic controls, regulatoryintervention
Years to decades
Years to decades
Implementing and managing aregulatory controls programme,social security payments toinjured workers, subsidies,national welfare, healthcarecosts
Higher gross national productresulting from lower injury rates[Note: this rather specific itemcould be deleted: improvedecosystem health from properdisposal of toxic wastes]
Chronic injuries and illnesseswhich result in early retirementand collection of benefits
Very important to consider inlong analytical horizon
Related to societal impacts
More important, as moredifficult to determine thedistribution patterns of costs andbenefits
Target audience
Problem or question
Intervention strategies
Time frame
Analytic horizon
Gross indication ofcosts
Benefits
Health outcomes
Discount rate
Terms and / ormeasures
Distributional effects
Table 2.9: Overview of differences in perspective between companies, individualworkers and society as a whole on several issues in assessment of costs ofwork accidents and occupational injuries
Issue Examples from the societal Examples from the Examples from the perspective employers’ perspective workers’ perspective

• What is the value of health or of not being ill?• How much are job satisfaction and well-being at work worth?• Why are these prices not the same for everybody?
There are more benefits of better working conditions than the absence of illnesses or injuries.Improved job satisfaction, well-being at work, welfare and a longer healthy life expectancy areadditional benefits. For these benefits, no reliable or generally accepted pricing method isavailable. Some techniques have been developed to find some indications (e.g. by askingpeople what they would be willing to pay for good health).
3 . 2 . M u l t i p l e c a u s e s , m u l t i p l e e f f e c t s
An essential step in estimating the costs of work accidents and making a cost–benefit analysisof prevention is to make a causal link between the event (accident or preventive intervention)and the effects. Often, this causal relation is not (entirely) clear. For example, unintendedexposure to chemical substances can have health effects that are difficult to relate to theexposure. Also, the (economic) effects of an accident can be aggravated by circumstances thathave nothing to do with the accident itself. As an example, the duration of sick leave followingan injury can partly be determined by the possibilities and incentives the worker experiences ontheir return to work.
Likewise, preventive measures often have different benefits. Adequate preventivemaintenance and high reliability of machines not only improve safety but also reduceproduction downtime. Measures to prevent dust explosions also reduce exposure to dust,resulting in fewer health problems.
3 . 3 . T i m e
In economic assessments, time poses some interesting dilemmas and problems for which noready-made answer exists.
T h e v a l u e o f m o n e y, d e p r e c i a t i o n
The key element is that an amount of money you have now is worth more than the sameamount next year. Economic evaluation techniques that take money depreciation into accountand adjust for the future value of money (discounting) are available. Health effects need to bediscounted as well if a cost-effectiveness analysis is being done.
R i s k
Money you have now is more certain than what you may have in the future. Investing moneyalways involves some risks; no investment is absolutely safe. The longer the span of time beforeyou get the revenues of an investment, the greater (in general) the risk. Furthermore, someinvestments are riskier than others and future benefits may be difficult to predict.
Investing in safety and health at work involves (within the context of present knowledge) a ratherhigh risk, as little is known about the efficiency and efficacy of interventions in this area. Inaddition, there is no way to make sure that preventive action has actually prevented an accident.
In practice, decision-makers deal with risks by applying high interest rates or requiring veryshort payback periods. Conventionally, intervention effectiveness studies do not deal with risk,other than to conduct sensitivity analyses or to calculate different scenarios to addressuncertainty.
I n v e n t o r y o f s o c i o e c o n o m i c c o s t s o f w o r k a c c i d e n t s
22

O c c u p a t i o n a l s a f e t y a n d h e a l t h a n d p l a n n i n g h o r i z o n i n c o m p a n i e s
The time period during which an occupational safety and health intervention takes place (timeframe) is typically much shorter than the time period during which the consequences of theintervention take place (analytic horizon). The analytic horizon should thus be long enough tocapture all the economic consequences. Some diseases, for example asbestos-related diseases,have latency periods of more than 20 years. From the societal perspective, the analytic horizoncould be 40 years for an illness which affects a worker for the rest of his/her life, or even longerif there are effects for future generations.
These periods are far too long in the context of company decision-making. Planning horizons(at operational and tactical level) are usually three to four years. In many industries, investmentshave payback periods of two to three years. The risk of having new, more effective and cheapermethods available within a few years is too big.
4 . P r e p a r i n g a s s e s s m e n t s
4 . 1 . W h y a s s e s s m e n t s ?
The economic importance of occupational safety and health is what decision-makers believe itto be. Information and perceptions about future effects of decisions, preferably expressed interms of money, help employers in the decision-making process. The true value of economicappraisal is influencing the beliefs of decision-makers and policy-makers. For maximumeffectiveness in this respect, economic appraisal should be a joint activity of all stakeholders.
Making cost–benefit analyses is essentially about predicting the future. Applying scientifictechniques may give the impression that the predictions are quite exact, but in reality thepredicted outcomes are generally uncertain. Uncertainties and assumptions give theopportunity to criticise or even reject the assessment. If the outcomes of an economic analysisare uncertain, then why is it done? The process of making an assessment gives many insights.Beside the final answers, positive effects of economic assessments are that:
• potential costs and benefits are treated in a structured way;
• the structured approach diminishes the effect of prejudice;
• all stakeholders are given the opportunity to bring forward their interests.
Economic analyses are not neutral. Experienced users may well be able to manipulate theoutcomes by overemphasising certain cost factors or leaving others out of the assessment.
4 . 2 . A f i v e - s t e p i m p r o v e m e n t c y c l e
Basically, any process of making an economic assessment consists of five steps, including apreparation (see Figure 4.1). The way in which each of the steps is performed depends on thesituation at hand. Some steps take very little time; others may take more. The order of the stepsis not necessarily fixed, it is possible to perform a step quickly first and than later come back toit. This is useful if some information is missing and becomes available later. If necessary, somecycles of refinement can be performed, for instance by adding cost factors in a later stage, orby modifying some parameters and seeing what happens.
E u r o p e a n A g e n c y f o r S a f e t y a n d H e a l t h a t W o r k
23

4 . 3 . P r e p a r a t i o n
For maximum effectiveness, economic appraisal should be a joint activity between workers (ortheir representatives), OSH specialists, financial experts and decision-makers.
• Determine the target audience for the economic appraisal, and consider how they will usethe results.
• Define the problem or question to be analysed (e.g. yearly analysis of OSH costs orcost–benefit analysis of a specific safety investment).
• Describe the intervention strategies to be evaluated, including the ‘no action’ alternative forcomparison.
• Identify the perspective of the analysis. It is perfectly acceptable for the analysis to beconducted from the perspective of the employer, but this must be clearly communicated inthe report.
4 . 4 . S e l e c t i n g v a r i a b l e s a n d f i n d i n g d a t a
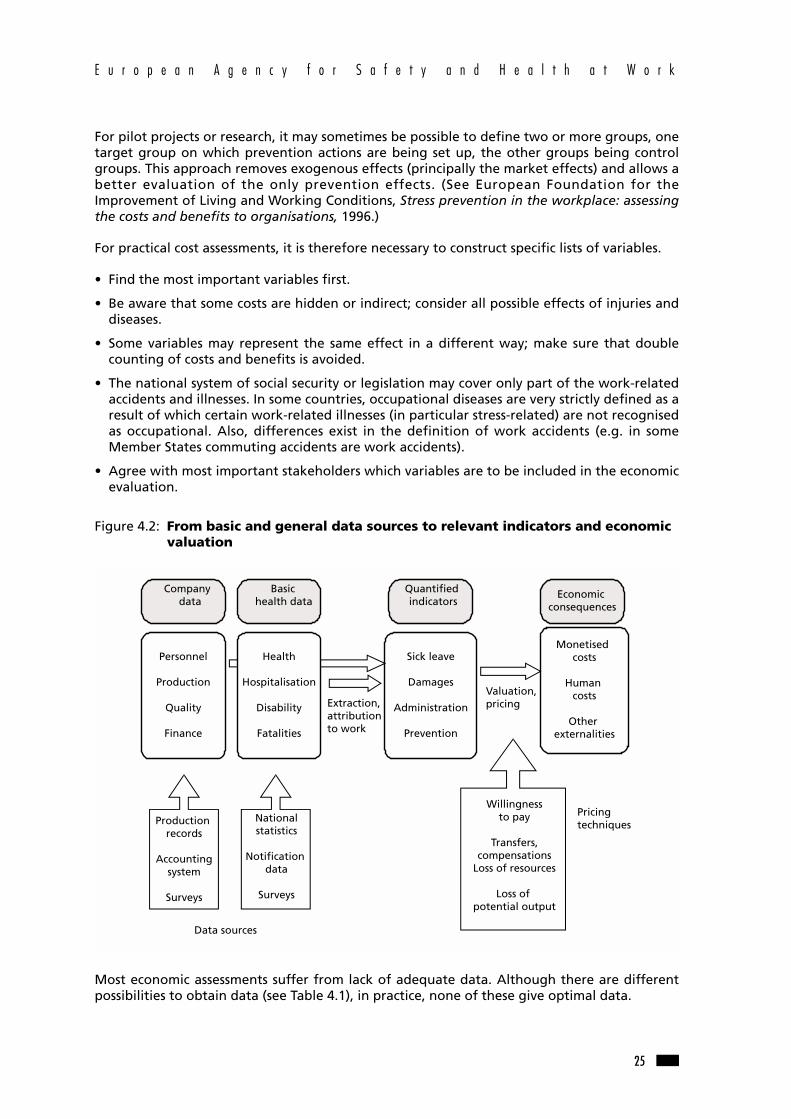
One of the major problems in economic assessment of OSH is that neither companies norauthorities keep track of OSH costs. Furthermore, there are no data on cost effects ofinterventions. As a consequence, economic consequences of work accidents have to beestimated in an indirect way. Collecting data for economic assessment is therefore a difficulttask. Figure 4.2 shows how economic effects can be derived from basic data. Data sources arenot uniform in any way. At company level, large differences exist between companies. Withrespect to data sources at society level, it is noted that data sources differ between countries toa large extent.
I n v e n t o r y o f s o c i o e c o n o m i c c o s t s o f w o r k a c c i d e n t s
24
Figure 4.1: Five-step improvement cycle for making estimations of costs of workaccidents and preventive activities
Preparation
1
2
34
5
Interpretationof results andrefinement
Valuation andcalculations
Findingdata
Selectingvariables and
indicators
For pilot projects or research, it may sometimes be possible to define two or more groups, onetarget group on which prevention actions are being set up, the other groups being controlgroups. This approach removes exogenous effects (principally the market effects) and allows abetter evaluation of the only prevention effects. (See European Foundation for theImprovement of Living and Working Conditions, Stress prevention in the workplace: assessingthe costs and benefits to organisations, 1996.)
For practical cost assessments, it is therefore necessary to construct specific lists of variables.
• Find the most important variables first.
• Be aware that some costs are hidden or indirect; consider all possible effects of injuries anddiseases.
• Some variables may represent the same effect in a different way; make sure that doublecounting of costs and benefits is avoided.
• The national system of social security or legislation may cover only part of the work-relatedaccidents and illnesses. In some countries, occupational diseases are very strictly defined as aresult of which certain work-related illnesses (in particular stress-related) are not recognisedas occupational. Also, differences exist in the definition of work accidents (e.g. in someMember States commuting accidents are work accidents).
• Agree with most important stakeholders which variables are to be included in the economicevaluation.
E u r o p e a n A g e n c y f o r S a f e t y a n d H e a l t h a t W o r k
25
Figure 4.2: From basic and general data sources to relevant indicators and economicvaluation
Data sources
Pricingtechniques
Companydata
Personnel
Production
Quality
Finance
Basichealth data
Health
Hospitalisation
Disability
Fatalities
Productionrecords
Accountingsystem
Surveys
Nationalstatistics
Notificationdata
Surveys
Extraction,attributionto work
Quantifiedindicators
Sick leave
Damages
Administration
Prevention
Valuation,pricing
Willingnessto pay
Transfers,compensations
Loss of resources
Loss ofpotential output
Monetisedcosts
Humancosts
Otherexternalities
Economicconsequences
Most economic assessments suffer from lack of adequate data. Although there are differentpossibilities to obtain data (see Table 4.1), in practice, none of these give optimal data.

With respect to occupational injuries, occupational diseases and work-related illnesses, it isimportant to know when injuries or illnesses can be attributed to work. Also, in the case of workaccidents, the attribution to work or conditions at work is sometimes problematic. In manycountries, the compensation system has precisely defined which injuries or diseases areoccupational. In these circumstances, many illnesses that are (for the larger part) related to workmay not be counted. New diseases, for instance certain forms of cancer, allergic reactions, muscular-skeletal disorders or mental problems due to work stress, may not be accepted yet as occupational.
4 . 5 . Va l u a t i o n , c a l c u l a t i o n
Several methods and techniques are available to put a monetary value on effects of workaccidents and on the benefits of prevention (Table 4.2, see also Section 2).
I n v e n t o r y o f s o c i o e c o n o m i c c o s t s o f w o r k a c c i d e n t s
26
Use of national statistics and statistics ofoccupational insurance system. In practice, datasuffer from several shortcomings such as under-reporting. In general, not all relevant costvariables are included.
Estimation from health statistics andepidemiological data
Registration systems, surveys
For instance, the costs of personal protectiveequipment will be included in the company’saccounting system. Sick leave and personnelturnover may be registered already.
The number of work-related illnesses can beestimated from absenteeism records in thecompany. Also, estimation from epidemiologicaldata at sector or national level are viableoptions. Estimation of future effects of policiesor investments can be derived from thedescription and goals of the intervention.Sometimes data from similar situations in othercompanies can be used.
Registration systems. Usually hard to implementand rather expensive.
Use of existing data sets
Estimations andprojections, starting fromavailable data ortechnical analysis
Specific generation ofnew data
Table 4.1: Possibilities to obtain data for making cost estimations
Data source, technique Application at company level Application at society level
Table 4.2: Common pricing principles
Variable Common way to find money value
Safety and health management
Lost working time
Damaged equipment
Time spent for OSH activities
Productivity
Quality
Workers’ diseases, injuries
Workers’ health, well-being and job satisfaction
Company image (to customers or labour market)
Wages during time spent on OSH Invoices of external services and equipment
Total amount of wages
Repair or replacement costs, market price of new equipment
Wages of total amount of time spent
Total value of additional units produced
Value of lost productsValue of time spent due to rework Warranties
Medical costsIndemnitiesEffects on premiums Willingness to pay, willingness to accept
No reliable method available
No reliable method available
For a number of variables, market prices are available or can be derived. For human health andwell-being, however, there is no market value. In practice, the monetary value is sometimesconstructed by asking people of their willingness to pay to avoid injuries. The results of thesemethods, however, are often criticised.

E u r o p e a n A g e n c y f o r S a f e t y a n d H e a l t h a t W o r k
27
In general, it is best to express as much as possible in terms of money. If that is not possible ornot wanted, try to quantify or use ranking methods. This can also help in decision-making andcan show improvement in safety and health management.
4 . 6 . I n t e r p r e t a t i o n o f r e s u l t s
The results of a cost estimation have little meaning without the context. Sometimes, the figuresneed no explanation, but often the interpretation deserves some attention. At company level,the use of economic indicators can help in deciding which investments are financially attractive.Furthermore, it is very useful to have some information about the reliability and accuracy of anassessment. This section briefly discusses the most relevant issues in this respect.
There are several economic indicators that can be used as a decision-making aid. Simple andeasy to use are the ‘payback period (PP)’ and the ‘cost–benefit ratio (C/B)’. The payback periodis the amount of time before the initial investments are earned back. A payback period of twoto three years is usually acceptable in industry. The cost–benefit ratio is the ratio between thesum of all costs and the sum of all benefits. The smaller the ratio, the better. In more advancedanalyses, it is possible to calculate indications like the return on investment in whichdepreciation is accounted for.
At society level, the time horizon is long (20 years or more). In order to deal with these periods,depreciation of money is important. It is conventional practice to use net present values incalculating cost–benefit ratios. At society level, a discount rate of 3 or 5 % is usually applied toaccount for the time preference for money (it is preferable to have money now rather than inthe future). At company level, much higher discount rates are common. In general, the discountrate should be the sum of the inflation rate, the no-risk interest rates for lending money to abank and the compensation for risk taking. Practical discount rates at company level are as highas 10 to 15 % but higher values are not uncommon.
Decision-making at company level about investments often includes comparison of multiplealternatives in which the ‘do nothing’ alternative is always included. In fact, most cost–benefitanalyses of OSH activities are based on the difference between the results of prevention and anestimation of costs when no prevention takes place.
5 . P r a c t i c a l i n s t r u m e n t sThis section offers some practical instruments and examples that can be helpful in making costevaluations of work accidents, occupational injuries and their prevention thereof.
5 . 1 . C h e c k l i s t f o r p r e p a r a t i o n o f a n a s s e s s m e n t
Table 5.1 gives an overview of a five-step approach for making economic assessments. Ingeneral, the issues are relevant to cost estimations (what are the yearly costs of prevention andaccidents and the consequences thereof?) and to cost–benefit analysis (is an investment inimproving safety profitable?).

I n v e n t o r y o f s o c i o e c o n o m i c c o s t s o f w o r k a c c i d e n t s
28
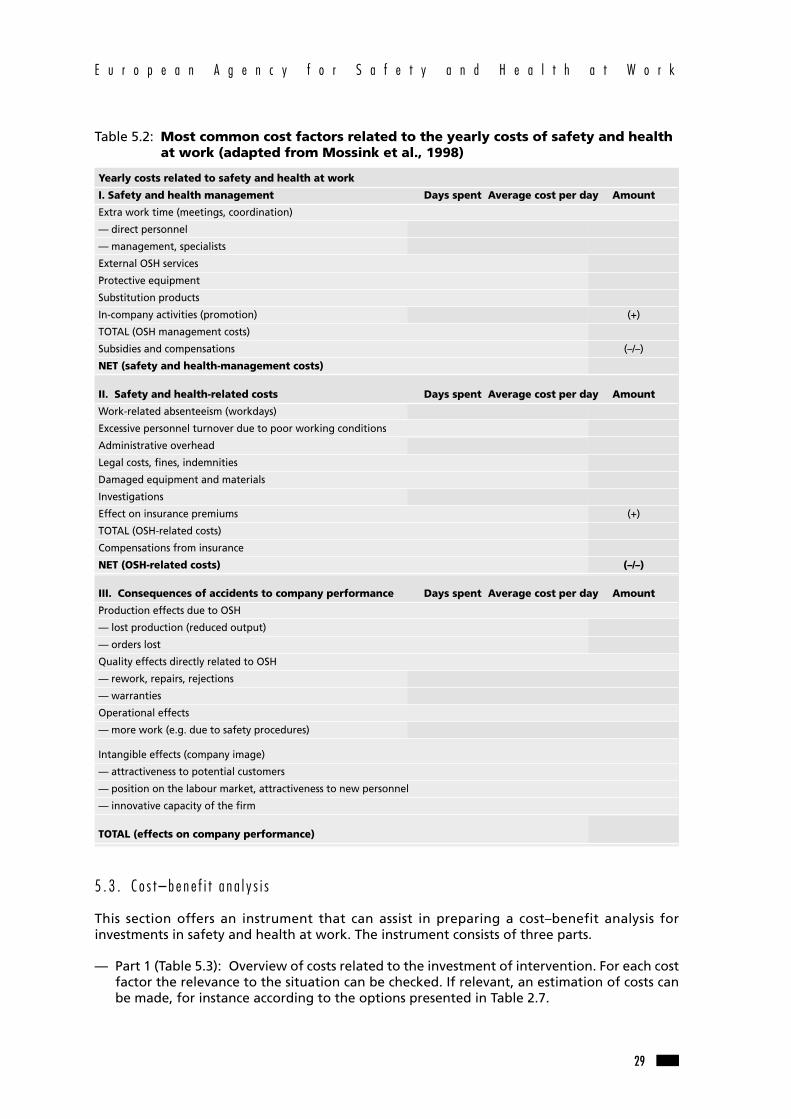
5 . 2 . E s t i m a t i o n o f t h e c o s t o f a c c i d e n t s
The aim of Table 5.2 is to offer guidance for an estimation of company spending onoccupational safety. The table gives an overview of the most common cost factors. Bear inmind that the cost factors are rather general. For specific situations, some factors need notbe relevant. For a yearly summary, all costs related to occupational accidents should becollected.
Table 5.1: A five-step approach for making economic assessments
Step 1 Preparation
(a) Establish:— purpose of the economic assessment— goal of the project — who the stakeholders are, what their interests are, what their influence is— what kind of results are needed— how much time should be spent making an economic assessment
(b) Select a suitable technique (e.g. yearly costs, cost–benefit analysis or cost–effectiveness analysis)
(c) Plan the assessment and involve relevant parties
Step 2 Selection of variables and indicators
(a) Choose variables:— that are in line with the selected criteria— that reflect the purpose of the assessment— for which data will probably be available (with acceptable effort to obtain and with adequate
accuracy)— that are agreed upon by stakeholders
Step 3 Finding data for selected variables
(a) Data:— use readily available data from company records and accounting system— estimations from epidemiological studies, external data sources, extrapolations from company data— generate new data
(b) Determine which part is to be related to work (e.g. sick leave) and the intervention in question
(c) Quantify effects (of injuries, diseases and/or of interventions) by estimation or analysis techniques, such as:
— information from similar cases— scenario calculations— impact analysis (extrapolation from the goals of an intervention)
Step 4 Make calculations
(a) Attach money values to quantified indicators and variables
(b) Create understandable presentation of results, for instance:
— tabular format (injury costing, cost-benefit analysis)— graphs or time series (monitoring applications)— comparisons to other companies (benchmarks)
Step 5 Interpretation and refinement
(a) Present caveats for presented results: — refer to assumptions, goals, limitations of estimations, quality of data and the like— use sensitivity analysis to estimate effects of assumptions
(b) Decide on further action
E u r o p e a n A g e n c y f o r S a f e t y a n d H e a l t h a t W o r k
29
5 . 3 . C o s t – b e n e f i t a n a l y s i s
This section offers an instrument that can assist in preparing a cost–benefit analysis forinvestments in safety and health at work. The instrument consists of three parts.
— Part 1 (Table 5.3): Overview of costs related to the investment of intervention. For each costfactor the relevance to the situation can be checked. If relevant, an estimation of costs canbe made, for instance according to the options presented in Table 2.7.
Table 5.2: Most common cost factors related to the yearly costs of safety and healthat work (adapted from Mossink et al., 1998)
Yearly costs related to safety and health at work
I. Safety and health management Days spent Average cost per day Amount
Extra work time (meetings, coordination)
— direct personnel
— management, specialists
External OSH services
Protective equipment
Substitution products
In-company activities (promotion) (+)
TOTAL (OSH management costs)
Subsidies and compensations (–/–)
NET (safety and health-management costs)
II. Safety and health-related costs Days spent Average cost per day Amount
Work-related absenteeism (workdays)
Excessive personnel turnover due to poor working conditions
Administrative overhead
Legal costs, fines, indemnities
Damaged equipment and materials
Investigations
Effect on insurance premiums (+)
TOTAL (OSH-related costs)
Compensations from insurance
NET (OSH-related costs) (–/–)
III. Consequences of accidents to company performance Days spent Average cost per day Amount
Production effects due to OSH
— lost production (reduced output)
— orders lost
Quality effects directly related to OSH
— rework, repairs, rejections
— warranties
Operational effects
— more work (e.g. due to safety procedures)
Intangible effects (company image)
— attractiveness to potential customers
— position on the labour market, attractiveness to new personnel
— innovative capacity of the firm
TOTAL (effects on company performance)

I n v e n t o r y o f s o c i o e c o n o m i c c o s t s o f w o r k a c c i d e n t s
30
— Part 2 (Table 5.3): Overview of potential benefits, summary of annual benefits or savings.Only benefits that are directly related to the investment in question have to be summarisedhere.
— Part 3 (Table 5.3): Cash-flow table, summary of expenditures and income for a number ofyears.
Table 5.3: Checklist and approach for making cost–benefit analysis of investments insafety and health at workPart 1: Investment or intervention costs
Category Cost items Relevance Cost estimate Description, remarksyes/no (EUR)
Planning Consultancy costs
Engineering
Internal activities
Investments Buildings, dwellings, foundations
Land property
Machines
Test equipment
Transportation equipment
Facilities, work environment
Workplaces
Removals Equipment
Transportation
Personnel Costs of dismissal
Recruitment
Training
Preliminary Loss of quality
costs Additional wages (overtime)
Materials
Additional operations
Organisational activities
Production losses, downtime
Income Sale of redundant production equipment
Total

E u r o p e a n A g e n c y f o r S a f e t y a n d H e a l t h a t W o r k
31
Note that in order to avoid double counting it is very important to be precise in the definitionof cost items and the way these are estimated.
Table 5.3: Checklist and approach for making cost–benefit analysis of investments insafety and health at workPart 2: Annual cost effects
Category Cost items Relevance Cost estimate Description, remarksyes/no (EUR)
Productivity Number of products
Production downtime reduction
Less balance losses
Less stocks
Other, to be specified
Personnel costs OSH services
Savings due to reduction in staff
Temporary replacement personnel
Costs of turnover and recruitment
Overhead reduction
Reduction of costs related to sick leave
Effects on premiums
Other, to be specified
Maintenance Cost changes
Property, Cost changes of use of property
facilities and Heating ventilation
material usage Lighting
Changes in material usage
Energy, compressed air
Waste and disposal costs
Quality Changes in amount of rework
Production losses
Price changes due to quality problems
Total

I n v e n t o r y o f s o c i o e c o n o m i c c o s t s o f w o r k a c c i d e n t s
32
By convention, all expenditures have a negative sign, cost savings and additional income havea positive sign. All investments are assumed to have taken place at the end of year zero.
The cumulative cash flow over the years gives an indication of the profitability of theinvestment. The payback period is the period when the cumulative cash flow is back to zero (theexpenditures equal income or savings).
The (non-discounted) financial earnings of the project is the cumulated cash flow and the endof the economic or technical lifetime of the investment.
The cost–benefit ratio is the expenditure (total of year zero costs) divided by the sum of allsubsequent income or savings during the lifetime of the investment.
Modern spreadsheet software like Microsoft Excel and Lotus 123 offer ample possibilities tocalculate all kinds of financial indicators very quickly. As calculation of discounted indicators iscomplex, spreadsheets are extremely useful for this task.
6 . F u r t h e r r e a d i n g a n d r e f e r e n c e sAaltonen, M. V. P., Uusi-Rauva, E., Saari, J., Räsänen, T., Antti-Poika, M. and Vinni, K., ‘Theaccident consequence tree and its application by real-time data collection in the Finnishfurniture industry’, Safety Science, 1996, Vol. 23, No 1, pp.11–26.
Aaltonen, M. and Söderqvist, A., ‘Costs of accidents in the furniture industry — A Nordic study’,Scandinavian Journal of Work Environment & Health 14 (1988), suppl. 1, 103–104.
Arbouw, Work accidents in construction industry in 2000 (Arbeidsongevallen in de bouw in2000). Amsterdam, Arbouw, 2001.
Table 5.3: Checklist and approach for making cost–benefit analysis of investments insafety and health at workPart 3: Summarising cash-flow table
Year0 1 2 3 4
Planning
Investments
Removal
Personnel
Preliminary costs
Incidental income
Productivity
Personnel
Maintenance
Use of property, facilities and materials
Quality costs
Total
Cumulative cash flow
E u r o p e a n A g e n c y f o r S a f e t y a n d H e a l t h a t W o r k
33
European Agency for Safety and Health at Work. Health and safety at work: a question of costsand benefits? Bilbao, European Agency for Safety and Health at Work, 1999.
European Agency for Safety and Health at Work. Economic Impact of Occupational Safety andHealth in the Member States of the European Union, Bilbao, European Agency for Safety andHealth at Work, 1999.
European Foundation for the Improvement of Living and Working Conditions, Stressprevention in the workplace: assessing the costs and benefits to organisations, Dublin,European Foundation for the Improvement of Living and Working Conditions, 1996.
European Foundation for the Improvement of Living and Working Conditions, Catalogue ofeconomic incentive systems for the improvement of the working environment, EuropeanFoundation for the Improvement of Living and Working Conditions, 1994.
Farnham, P. G, Ackerman, S. P., Haddix, A. C., ‘Study design’, in Haddix et al. (eds), Preventioneffectiveness: a guide to decision analysis and economic evaluation, New York, OxfordUniversity Press, 1996.
Gorsky, R. D., Haddix, A. C., Shaffer, P. H., ‘Cost of an intervention’, in Haddix et al. (eds),Prevention effectiveness: a guide to decision analysis and economic evaluation, New York,Oxford University Press, 1996.
Gröjer, J.-E., Johanson, U., Human resource costing and accounting, Stockholm, Joint IndustrialSafety Council, 1996.
Haddix, A. C., Shaffer, P. A., ‘Cost–effectiveness analysis’, in Haddix et al. (eds), Preventioneffectiveness: a guide to decision analysis and economic evaluation, New York, OxfordUniversity Press, 1996.
Hopkins, A., Making safety work, St Leonards NSW, Allen & Unwin, 1995.
Krüger, W. ‘Ökonomische Anreize-Möglichkeiten und Probleme eines modernenArbeitsschutzsystems’, in Neue Ansätze zur kosten-Nutzen-Analyse des Arbeits- undGesundheitsschutzes, Dortmund/Berlin, Bundesanstalt für Arbeitsschutz und Arbeitsmedicin,1997, pp. 26–37.
Leigh, J. P., Markowitz, S. B., Fahs, M., Shin, C. and Landrigan, P. H., ‘Occupational injury andillness in the United States: estimates of costs, morbidity, and mortality’, Arch Intern Med157:1557–1568, 1997.
Ministry of Social Affairs and Health, Economics of the working environment, Tampere, Ministryof Social Affairs and Health, 1997.
Mossink, J. C. M., Licher, F., Costs and benefits of occupational safety and health, Hoofddorp,TNO Work and Employment, 1998.
Mossink, J. C. M., Smulders, P. G. W., Lunde-Jensen, P., Wynne, R., Vassie, L., O’Brien, E. J., KleinHesselink, J., Costs and benefits of occupational safety and health in the European Union,report to the European Commission DG-V, Hoofddorp, NIA TNO,1998.
Nas, T. F., Cost–benefit analysis, Thousand Oaks, Sage Publications, 1996.
Verkley, H., Bos, J., Costs and benefits of OSH certification (Kosten en baten vanarbocertificatie), Arbeidsomstandigheden 1998, No 11, pp. 24–31.

A n n e x 1 . P r o j e c t o r g a n i s a t i o nAgency’s project managers
Markku AaltonenEuropean Agency for Safety and Health at WorkGran Vía, 33E-48009 Bilbao
Martin den HeldEuropean Agency for Safety and Health at WorkGran Vía, 33E-48009 Bilbao
Author of the report
Jos MossinkTNO Work and EmploymentPolarisavenue 151Postbus 7182130 AS HoofddorpNetherlands
Project member
Marc de GreefPreventRue Gachard, 88 BTE 4B-1050 Brussels
Topic Centre on Research — Work and Health
Jean-Luc MariéINRS30, rue Olivier Noyer F-75680 Paris Cedex 14
Jean-Claude AndréINRS — Centre de LorraineAvenue de BourgogneBP 27 F-54501 Vandoeuvre Cedex
Jean MullerINRS — Centre de LorraineAvenue de Bourgogne BP 27F-54501 Vandoeuvre Cedex
I n v e n t o r y o f s o c i o e c o n o m i c c o s t s o f w o r k a c c i d e n t s
34
E u r o p e a n A g e n c y f o r S a f e t y a n d H e a l t h a t W o r k
35
A n n e x 2 . E x a m p l e s
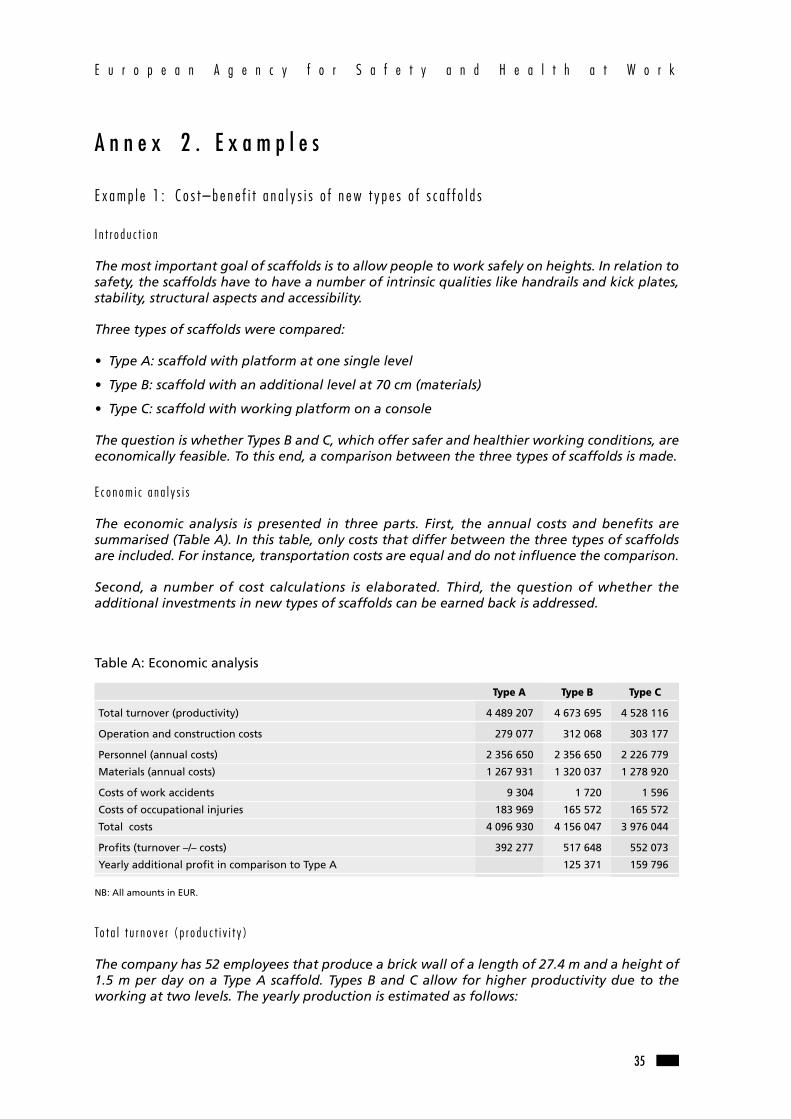
E x a m p l e 1 : C o s t – b e n e f i t a n a l y s i s o f n e w t y p e s o f s c a f f o l d s
I n t r o d u c t i o n
The most important goal of scaffolds is to allow people to work safely on heights. In relation tosafety, the scaffolds have to have a number of intrinsic qualities like handrails and kick plates,stability, structural aspects and accessibility.
Three types of scaffolds were compared:
• Type A: scaffold with platform at one single level
• Type B: scaffold with an additional level at 70 cm (materials)
• Type C: scaffold with working platform on a console
The question is whether Types B and C, which offer safer and healthier working conditions, areeconomically feasible. To this end, a comparison between the three types of scaffolds is made.
E c o n o m i c a n a l y s i s
The economic analysis is presented in three parts. First, the annual costs and benefits aresummarised (Table A). In this table, only costs that differ between the three types of scaffoldsare included. For instance, transportation costs are equal and do not influence the comparison.
Second, a number of cost calculations is elaborated. Third, the question of whether theadditional investments in new types of scaffolds can be earned back is addressed.
Table A: Economic analysis
Type A Type B Type C
Total turnover (productivity) 4 489 207 4 673 695 4 528 116
Operation and construction costs 279 077 312 068 303 177
Personnel (annual costs) 2 356 650 2 356 650 2 226 779
Materials (annual costs) 1 267 931 1 320 037 1 278 920
Costs of work accidents 9 304 1 720 1 596
Costs of occupational injuries 183 969 165 572 165 572
Total costs 4 096 930 4 156 047 3 976 044
Profits (turnover –/– costs) 392 277 517 648 552 073
Yearly additional profit in comparison to Type A 125 371 159 796
NB: All amounts in EUR.
To t a l t u r n o v e r ( p r o d u c t i v i t y )
The company has 52 employees that produce a brick wall of a length of 27.4 m and a height of1.5 m per day on a Type A scaffold. Types B and C allow for higher productivity due to theworking at two levels. The yearly production is estimated as follows:

Type A: 39 133 m2
Type B: 39 700 m2
Type C: 39 464 m2
P e r s o n n e l c o s t s
Type C scaffold allows for a slight reduction in staffing. Whereas Types A and B are (in total)operated by 39 bricklayers and 13 assistants, Type C requires 39 bricklayers and 10 assistants. Asa result, personnel costs of Type C are reduced.
C o s t o f w o r k a c c i d e n t s
It is estimated that Type A will result, on average, in one accident resulting in sick leave for 22workdays. For the safer Types B and C, the annual amount of incapacity due to accidents isestimated at five workdays.
The average daily costs are EUR 440 and consist of: wages of the victim, production losses,replacement costs and efficiency losses. In addition, the lower number of accidents will result inpremium reduction for accident insurance of about EUR 500 (Type B) or EUR 615 (Type C) peryear.
C o s t o f b a c k i n j u r i e s
Based on data of construction firms, it is estimated that a company of 52 employees isconfronted with 152 workdays of sick leave to be paid by the employer and an additional 667lost workdays (covered by insurance, but worker is not available). It is anticipated that Types Band C will result in a reduction in the number of complaints and sick leave by 10 % in the firstyear and an even further reduction thereafter.
I n v e s t m e n t s
The total amount of scaffolds to produce walls with a total height of 8 to 9 m with 13 shifts of4 persons is about 2 860 m2. The total investments are:
Type A: EUR 789 100 Type B: EUR 875 900 Type C: EUR 939 100
E c o n o m i c f e a s i b i l i t y
A quick insight into the feasibility of Types B and C can be obtained by comparing the additionalinvestments of Types B and C (in comparison to Type A) with annual additional benefits.
The additional investment in Type B scaffold amounts to EUR 86 800, the annual benefitsEUR 125 371. For Type C, the additional investment is EUR 150 000, whereas the additionalbenefits are EUR 159 800 per year. From these figures, it can be concluded that investment inboth Types B and C scaffolds is economically attractive.
Source: Prevent (Brussels, Belgium).
I n v e n t o r y o f s o c i o e c o n o m i c c o s t s o f w o r k a c c i d e n t s
36

E u r o p e a n A g e n c y f o r S a f e t y a n d H e a l t h a t W o r k
37
E x a m p l e 2 : C o s t s a n d b e n e f i t s o f o u t s o u r c i n g s e c u r i t y s e r v i c e s
An engineering company has its own security service for 24 hours per day. In order to createflexibility in services and to reduce costs, a number of alternatives are evaluated. The securityservice has an important role in safety at work:
• preventing incidents that may lead to injuries, in particular related to aggression andviolence;
• follow-up on accidents: offering first aid and, if necessary, alerting and coordinating outsideassistance (ambulances, fire brigades).
All alternatives take full account of legal requirements and obligations imposed by insurance.The alternatives are:
• no permanent surveillance, patrols and inspections during weeknights;
• no permanent surveillance, patrols and inspections during weeknights and weekends;
• no outsourced security services during weeknights, but security service is performed by ownemployees;
• no outsourced security services during weeknights and weekends, but security service isperformed by own employees;
• no permanent surveillance, replacement by patrols during weeknights and standby serviceduring weekends and holidays.
The alternatives are evaluated with respect to effects on insurance and first aid.
Costs and benefits can be estimated as follows (all amounts in EUR).
Cost factor Amount (EUR)
Wages of personnel performing fire inspection patrols
Production losses because worker performs other tasks (one hour per shift, 251 nights per year; six shifts for 57 weekends/holidays) 10 300
Training cost: 3 workers per shift (5 shifts) results in 15 training days per year (4 hours production time, 4 hours overtime) and 2 hours per year of extra training 5 400
Intervention costs during alarms There are five alarms per week, resulting in one-hour action per alarm. However, exact calculation is not possible. Therefore, total burden is estimated at 100 alarms per year.
Training costs first aid (per year) 7 870Training for groups of five employees, updates and lost working time amounts
Intervention costs first aid (per year) 100 12 interventions of 15 mins
Investment in fire alarm system (five-year depreciation) 20 700
Cost reduction due to stopped outsourcing:
— permanent surveillance during weeknights 42 000
— patrols during weeknights 22 200
— permanent surveillance during weekends 75 600
— surveillance with stand-by during weekends and holidays 33 800
— stand-by for interventions 1 100
Interventions (per hour) 30
In the financial analysis, five alternatives are compared, taking into account that personnel costsincrease by 2.5 % per year, external service costs increase by 1.5 %, first aid by 5 %, and the cost

I n v e n t o r y o f s o c i o e c o n o m i c c o s t s o f w o r k a c c i d e n t s
38
of initial activity for first aid increases by 3.3 %. Discount rate is set at 10 %. The table belowshows three economic indicators for each of the alternatives.
Net present value (EUR) Internal rate of return (%) Payback period (years, months)
Alternative 1 365 10.6 4y, 11m
Alternative 2 104 550 145.92 9m
Alternative 3 37 560 63.2 1y, 7m
Alternative 4 188 840 248.9 5m
Alternative 5 96 300 135.9 9m
It is concluded that all alternatives are in themselves profitable. An alternative that has boththe highest net present value and internal rate of return is the most attractive.
Source: Prevent, Brussels, Belgium.
E x a m p l e 3 : C o s t s o f f a l l i n g a c c i d e n t s f o r a c o n s t r u c t i o n c o m p a n y
Though the number of accidents in most companies is low, the costs may be considerable. In thisexample, the cost to a small construction company of a single falling accident is calculated. Bymaking an ex ante estimation of accident costs of companies or sector, organisations can getsome insight into the cost effectiveness of accident prevention. One frequent problem is thatreliable accident data are often missing, in particular at company level. In order to estimateincidence of accidents, branch surveys and national statistics have to be used.
Falling accidents are the most common in the construction industry in the Netherlands. In 2000,2 820 falling accidents were reported out of a total of 20 030 accidents of which 1 892 resultedin sick leave. The number of workers in the sector is 226 680. This implies that, every year, onein every 80 workers has a falling accident and one in 117 workers has an accident that leads toabsence for one or more days (Arbouw, 2001).
The mean duration of resulting sick leave is estimated at 14.7 workdays per accident. Roughly,about six of the accidents lead to long periods of sick leave and require investigation by thelabour inspectorate as a result of which the work is interrupted for a longer period of time.From disability statistics in the Netherlands, it is estimated that about 1 % of the accidents thatresult in sick leave end with a permanent disability.
The yearly accident costs of a construction company with 100 employees can be estimated asthe sum of a number of cost factors. The selection of the cost factors is based on practice in theNetherlands and the availability of adequate data. An explanation of the calculation is added.
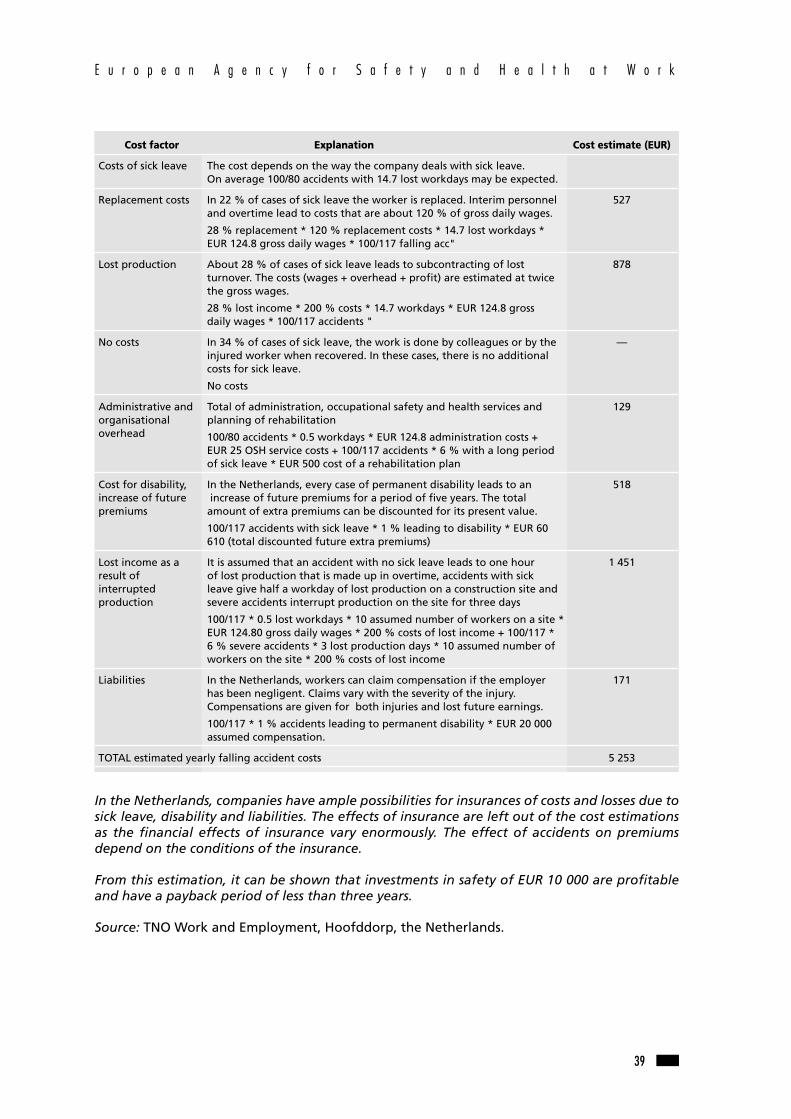
E u r o p e a n A g e n c y f o r S a f e t y a n d H e a l t h a t W o r k
39
In the Netherlands, companies have ample possibilities for insurances of costs and losses due tosick leave, disability and liabilities. The effects of insurance are left out of the cost estimationsas the financial effects of insurance vary enormously. The effect of accidents on premiumsdepend on the conditions of the insurance.
From this estimation, it can be shown that investments in safety of EUR 10 000 are profitableand have a payback period of less than three years.
Source: TNO Work and Employment, Hoofddorp, the Netherlands.
Cost factor Explanation Cost estimate (EUR)
Costs of sick leave The cost depends on the way the company deals with sick leave. On average 100/80 accidents with 14.7 lost workdays may be expected.
Replacement costs In 22 % of cases of sick leave the worker is replaced. Interim personnel 527and overtime lead to costs that are about 120 % of gross daily wages.
28 % replacement * 120 % replacement costs * 14.7 lost workdays * EUR 124.8 gross daily wages * 100/117 falling acc"
Lost production About 28 % of cases of sick leave leads to subcontracting of lost 878turnover. The costs (wages + overhead + profit) are estimated at twicethe gross wages.
28 % lost income * 200 % costs * 14.7 workdays * EUR 124.8 gross daily wages * 100/117 accidents "
No costs In 34 % of cases of sick leave, the work is done by colleagues or by the —injured worker when recovered. In these cases, there is no additional costs for sick leave.
No costs
Administrative and Total of administration, occupational safety and health services and 129organisational planning of rehabilitation overhead 100/80 accidents * 0.5 workdays * EUR 124.8 administration costs +
EUR 25 OSH service costs + 100/117 accidents * 6 % with a long period of sick leave * EUR 500 cost of a rehabilitation plan
Cost for disability, In the Netherlands, every case of permanent disability leads to an 518increase of future increase of future premiums for a period of five years. The total premiums amount of extra premiums can be discounted for its present value.
100/117 accidents with sick leave * 1 % leading to disability * EUR 60 610 (total discounted future extra premiums)
Lost income as a It is assumed that an accident with no sick leave leads to one hour 1 451result of of lost production that is made up in overtime, accidents with sick interrupted leave give half a workday of lost production on a construction site and production severe accidents interrupt production on the site for three days
100/117 * 0.5 lost workdays * 10 assumed number of workers on a site *EUR 124.80 gross daily wages * 200 % costs of lost income + 100/117 *6 % severe accidents * 3 lost production days * 10 assumed number ofworkers on the site * 200 % costs of lost income
Liabilities In the Netherlands, workers can claim compensation if the employer 171has been negligent. Claims vary with the severity of the injury. Compensations are given for both injuries and lost future earnings.
100/117 * 1 % accidents leading to permanent disability * EUR 20 000assumed compensation.
TOTAL estimated yearly falling accident costs 5 253

I n v e n t o r y o f s o c i o e c o n o m i c c o s t s o f w o r k a c c i d e n t s
40
E x a m p l e 4 : L i f t i n g a i d f o r n u r s e s
A nursing home started to rearrange its policy for transportation of the 230 inhabitants of thehome by the 145 nurses. In the new policy, lifting aids were introduced. Reasons for theinvestment in lifting aids were the large number of hazardous manual lifting activities, the highabsenteeism (10 %) and the number of muscular-skeletal complaints.
The implementation of the new lifting policy included an evaluation of all lifting activities.Activities were counted and an assessment of risk was made based on the NIOSH guideline formanual lifting (table below).
Cost factor Building 1 Building 2
Number of lifting activities per day 208 546
Cooperation of inhabitant
— none 76 31
— limited 14 52
— cooperative 10 17
Percentage of lifting activities
— high risk 82 46
— moderate risk 11 30
— low risk 7 24
Percentage of lifting without aid
— 1 person 87 57
— 2 persons 8 27
Percentage of lifting with aid
— 1 person 2 11
— 2 persons 3 5
This evaluation was used to determine the number of lifting aids required and the need fortraining. After implementation, the changes were evaluated by a survey and followed by asecond assessment of lifting activities.
The survey indicated that much of the lifting was still performed manually, but lifting aids wereused where practicable. The vast majority of the nurses (90 %) were in favour of the lifting aids,but indicated a number of practical problems (such as manoeuvring in narrow spaces). The sickleave still amounts to about 10 %. However, causes are unclear. In similar nursing homes wherelifting aids were introduced earlier, sick leave fell to about 8 %.
Old situation Risk Lifting aid Risk assessment using lifting aidassessment
Manual lifting (one person from bed to chair)
Manual by two persons
High risk
High risk
Lifting largely eliminated,replaced by push and pull
Lifting largely eliminated,replaced by push and pull
Low to moderate risk (lifting actions)Low to moderate risk (pushing actions)
Low to moderate risk for both liftingand pushing
Comparison of annual costs and benefits

E u r o p e a n A g e n c y f o r S a f e t y a n d H e a l t h a t W o r k
41
Source: Prevent, Brussels, Belgium.
E x a m p l e 5 : T h e r e m o v a l o f h o t w a t e r : t h e c h o i c e o f t h e b e s t p r e v e n t i v e m e a s u r e
S t a t e m e n t o f t h e p r o b l e m
A vegetable-canning firm has problems with the drainage of hot water during the productionprocess. This is done via a draining system that is too small to handle all the hot water. The resultis that the hot water comes out of the grills and floods the shop floor. For the employees, thereis a real risk of burns and falling. Burn wounds occur at a frequency of once a year with anaverage of 14 days of disability. Slipping and falling occur with a frequency of 0.5 times per yearwith 17 calendar days of work disability.
P o s s i b l e p r e v e n t i v e m e a s u r e s
• Modification of the present drainage system.
• Placing a retention container under the cookers.
• Installing a pump that would take the hot water directly from the cookers to the main drain.
• The best preventive measure is to be determined by means of a cost–benefit analysis.
C o s t s
The modification of the present drains would only require investment. This would beEUR 31 854. There would be no maintenance or hygiene costs.
The investment costs for retention containers under the four cookers would be EUR 17 848. Thehygiene costs (cleaning of the containers) come to EUR 306 per year. There are no maintenancecosts.
The installation of a pump to take the water to the main drain would cost EUR 24 789. Themaintenance costs come to EUR 1 041 per year. There are no hygiene costs.
When a pump breaks down, production losses occur. With the assumption that each pump willbreak down once a year, the loss is estimated at EUR 1 239 per year.
B e n e f i t s
The benefits are classified into qualitative and quantitative benefits.
E u r o p e a n A g e n c y f o r S a f e t y a n d H e a l t h a t W o r k
Costs Amount (EUR)
Investments and maintenance of two lifting aids 16 340
Specialised assistance Six people, EUR 23/month 1 630
Training and consultants Six people, four hours/month 2 940
Total costs 20 910
Benefits
Reduction of sick leave Anticipated reduction from 10 to 9 % * 43 230
Total benefits 43 230
I n v e n t o r y o f s o c i o e c o n o m i c c o s t s o f w o r k a c c i d e n t s
42
The quantitative benefits can actually be calculated (insurance, compensation for disability,training of interim workers, etc.). They are obtained because the costs that are presentlygenerated by the industrial accidents, the maintenance, and the cleaning of the floor arereduced to virtually nothing. This comes to EUR 5 081 (EUR 1 115 for the industrial accidents,EUR 1 735 for the repair of the floor because of the thermal load of the water and EUR 2 231for the cleaning of the floor).
Qualitative benefits are difficult or impossible to express in figures. By estimation, however,these benefits rise quickly to a factor of 6 or 7 of the quantitative benefits. Examples ofqualitative benefits are:
• a neat work environment: this leads to working neatly, improves the company image, andenhances the production environment;
• quality and production losses: reduced because experienced people remain in the productionprocess;
• the work pressure due to the absence of an employee is reduced.
C o s t – b e n e f i t a n a l y s i s
The cost–benefit analysis was done with three different parameters: the net present value, theinternal rate of return, and the payback. The determination of these parameters was based ona number of assumptions:
• the increase of wage costs amounts to 2 % per year;
• the depreciation period is five years;
• taxation is 45 % if profit is made;
• for the calculation of the payback, a depreciation of the money of 2 % per year is assumed.
N e t p r e s e n t v a l u e ( N P V )
When we calculate the NPV at 7 % (bank interest rate) and 15 % (interest rate assumed forinvestment projects), the second preventive measure emerges each time as the best option bya large difference (EUR 826 and EUR 3 350 respectively).
I n t e r n a l r a t e o f r e t u r n ( I R R )
The IRR is the interest rate whereby the NPV of an investment is equal to zero. If account is onlytaken of the quantitative benefits, none of the measures will satisfy the established criterion of15 %. Considered purely economically, none of the measures comes into consideration forexecution. All in all, the second measure is to be chosen over the other two.
P a y b a c k
This is the time in which the invested amount is re-earned. Here, too, the second preventivemeasure emerges as the best choice.
In summary, although none of the alternatives meets the economic criteria, the secondpreventive measure — the use of retention containers — deserves preference.
Source: Prevent, Brussels, Belgium.

E u r o p e a n A g e n c y f o r S a f e t y a n d H e a l t h a t W o r k
43
E x a m p l e 6 : T h e m o d i f i c a t i o n o f a r e f u s e c o n t a i n e r : s t u d y o f t h e r e l a t i o n s h i p b e t w e e n t h ed e g r e e o f r i s k a n d t h e b e n e f i t s o f t h e p r e v e n t i v e m e a s u r e
The object of the study is to determine whether there is a link between the degrees of risk andthe costs and benefits when a specific risk is reduced. In order to be able to study this, a riskanalysis was first conducted for an existing installation (a press for compressing polyethylenepackaging waste in a refuse container connected to this press). The risks were weighed with theKinney method, and a selection of them was subjected to cost–benefit analysis. This selectionconsists of one item with a high degree of risk, one with a moderate degree of risk, and twowith a low degree of risk. These four ‘sub-studies’ are discussed below.
1 . F o o t c o n t r o l i s t o b e c o v e r e d
The top of the operation pedal was not covered. This could lead to an employee depressing thepedal unintentionally with the result that somebody doing a manual operation could becrushed in the receptacle.
Kinney: R = W x B x E = 6 x 3 x 3 = 54
R = degree of risk, W = probability factor; B = exposure factor; E = seriousness. Higher values ofR represent a higher risk.
Solution: cover the pedal on the top to avoid unintentional operation. After modification, thefollowing degree of risk was obtained: R = 1 x 3 x 3 = 9
2 . T h e c l a m p i n g p o i n t n e e d s t o b e p r o t e c t e d
On the long side of the container, the refuse containers are emptied by means of a forklift andthe empty packaging is thrown onto the container. In this way, the clamping point of thecontainer can be reached. If the waste is clamped, there is a danger that the operator can reachthe waste too quickly and thus get stuck when removing the waste.
Kinney: R = W x B x E = 3 x 6 x 7 = 126
Solution: installation of protection that makes it impossible to reach the clamping point ifinstructions are followed correctly. When the press is opened, it stops automatically. For this,two safety switches are provided. The new degree of risk would be the following:R = 0.5 x 6 x 7 = 21
3 . A n a d d i t i o n a l w a l l s h o u l d b e b u i l t
At the operation panel, there is no wall. This makes it possible for one to fall about one metre.
Kinney: R = W x B x E = 3 x 6 x 3 = 54
Solution: installation of an additional wall. The new degree of risk would be the following:R = 0.5 x 6 x 3 = 9
4 . T h e d o o r s n e e d t o b e p o s i t i v e l y s e c u r e d
Two non-secured maintenance doors offer access to the internal portion of the press containerwhen it is in operation. There is thus a real risk of being caught by the moving parts. When thedoors open, the moving parts should no longer function.

I n v e n t o r y o f s o c i o e c o n o m i c c o s t s o f w o r k a c c i d e n t s
44
Kinney: R = W x B x E = 6 x 6 x 7 = 252
Solution: a switch with positive security should be placed on each maintenance door. The newdegree of risk would be the following: R = 0.5 x 6 x 3 = 9
C o m p a r i s o n
The costs and benefits are also calculated (in EUR) for each risk and placed alongside the degreeof risk.
Sub-study Investment Benefits Remaining Present Kinney Kinney Net costs costs costs before after present
measures measures value
Covering of foot pedal 397 1 698 340 2 037 54 9 2 745
Clamping point reachable 885 5 268 1 050 6 319 126 21 7 722
Height of wall 847 1 698 340 2 037 54 9 2 408
Positive securing of doors 975 11 590 1 054 12 644 252 9 20 174
Even though it is difficult to draw conclusions because of the sparseness of the data, it could beconcluded that there is a link between the degree of risk and the risk reduction, on the onehand, and the investment cost, on the other. The link between costs in the event of an accidentand the degree of risk is clear: a high degree of risk results in high costs if an accident occurs; alow degree of risk gives low costs if an accident occurs. Further, there seems to be a clear linkbetween risk reduction on the one hand, and the benefits of investments to obtain riskreduction on the other: large risk reduction, great benefit; small risk reduction, little benefit.Finally, it should be stressed that attention should continue to be paid to the remaining risks bymeans of immaterial control measures (training, procedures, warning panels, etc.).
Source: Prevent, Brussels, Belgium.
E x a m p l e 7 : T h e u s e o f c a p s t a n s i n d o c k s
B a c k g r o u n d
Prior to this study, a job analysis was conducted. Seven sub-processes as regards the lockage ofa ship were examined by means of the Fine–Kinney method. This indicated that the personnelin the subtasks ‘mooring and unmooring of the ship’ were subjected to high loads on the backin the handling of the ship’s ropes and there was a great risk of industrial accidents in the‘paying out’ and ‘heaving’ of the ropes.
The capstan (an electrically driven winch that takes over the ‘hauling in of the rope’ and ‘payingout of the rope’ from the worker) emerged as an immediate improvement of the work safetyand reduced the risk index from scale 4 (immediate improvement required) to scale 2 (attentionrequired).
T h e p r e s e n t p r o j e c t
The present study builds on the job analysis and is intended to determine whether the use ofthe capstans, which could be completely justified according to the objectives of the Fine–Kinney

E u r o p e a n A g e n c y f o r S a f e t y a n d H e a l t h a t W o r k
45
method for the improvement of work safety, could also be justified financially andeconomically.
Two kinds of capstans were purchased: fixed and mobile. Because of the capstans:
• the physical effort of the nautical workers was reduced to a minimum (by the reduction ofthe effort, it is estimated that 80 % of the accidents due to handling the ropes can beavoided);
• the number of personnel can be reduced by 30 %, so the tasks can be performed moreefficiently.
C o s t s – b e n e f i t s
A cost–benefit analysis was conducted of Alternative A ‘The acquisition of fixed capstans’ andAlternative B ‘The acquisition of mobile capstans’. The benefits of Alternatives A and B with (A1and B1) and without (A2 and B2) the reduction of personnel have also been compared.
For this, they used the following methods.
• The ‘net present value’ (NPV): here, the present value of future cash flows are compared withthe initial investment. In order to generate sufficient cash flows, the NPV has to be positive.
• The ‘payback period’ (PP) method: the time between the investment and the time at whichthe cash flow is evaluated positively.
• The ‘internal rate of return’ (IRR) method: the project is feasible when this internal yield isgreater than what is considered acceptable from the business point of view.
• The ‘accounting rate of return’ (ARR): here, the average annual actual net present yield(accounting profit after taxes) is divided by the investment.
Gross cash flow Net cash flow
Investment Depreciation Reduction IRR (%) PP (year) NPV (EUR) IRR (%) ARR (%)(EUR) period of disability (r = 15 %) (I = 6 %)
time (man days)
A1 265 419 25 167 18.94 5.80 67 901 13.52 3.6
A2 25 167 63.93 1.57 881 399 43.24 20.9
B1 398 441 25 167 5.47 14.65 – 226 167 3.92 – 0.8
B2 25 167 36.79 2.76 612 120 25.72 10.7
Evaluation criteria
Investment (EUR) Depreciation period Costs (maintenance, Yield (by reductionenergy consumption, etc.) of disability, sickness,
and use of reserve personnel)
A1 265 419 25 124 828 99 039
A2 25 124 828 283 516
B1 398 441 25 45 733 99 039
B2 25 45 733 283 516
Detail: cost–benefit with and without personnel reduction by two nautical workers.

C o n c l u s i o n
The calculations show that Alternative A1 ‘Fixed capstans without personnel reduction by twonautical workers’ is financially feasible. Alternative B1 ‘Mobile capstans without personnelreduction by two nautical workers’, however, is not financially feasible. With Alternatives A2and B2, the net yields are very clear.
With a view to work safety and operations, the researchers came to the conclusion thatAlternative A1 with a depreciation period of 10 years was the best investment.
C o n s i d e r a t i o n s
Most companies would probably reject measures that promote occupational safety and healthbut of which the financial/economic feasibility rests on dismissing personnel. Investments thatincrease productivity and improve occupational safety and health at the same time willpresumably be able to rely on more acceptance.
Source: Prevent, Brussels, Belgium.
I n v e n t o r y o f s o c i o e c o n o m i c c o s t s o f w o r k a c c i d e n t s
46

European Agency for Safety and Health at Work
Inventory of socioeconomic costs of work accidents
Luxembourg: Office for Official Publications of the European Communities
2002 — 46 pp. — 21 x 29.7 cm
ISBN 92-95007-67-0