Report - Fortescue Metals Group
23
Final Report Eliwana Mine Project Discharge Assessment Fortescue Metals Group January 2018
Transcript of Report - Fortescue Metals Group

Final Report
Eliwana Mine Project Discharge Assessment
Fortescue Metals Group
January 2018

Fortescue Metals Group | January 2018 Eliwana Mine Project Discharge Assessment Page 2
J5437-0
1_R
01-V
03a
Document Status
Version Doc type Reviewed by Approved by Date issued
V03a Final Richard Connell Richard Connell 15/01/2017
V02 Draft Richard Connell Richard Connell 14/12/2017
V01 Draft Richard Connell Richard Connell 31/10/2017
Project Details
Project Name Eliwana Mine Project Discharge Assessment
Client Fortescue Metals Group
Client Project Manager Ryan Warrington
Water Technology Project Manager Richard Connell
Water Technology Project Director Christine Arrowsmith
Authors Harry McCullagh/ Richard Connell
Document Number J5437-01_R01-V03a
COPYRIGHT
Water Technology Pty Ltd has produced this document in accordance with instructions from Fortescue Metals Group for
their use only. The concepts and information contained in this document are the copyright of Water Technology Pty Ltd.
Use or copying of this document in whole or in part without written permission of Water Technology Pty Ltd constitutes an
infringement of copyright.
Water Technology Pty Ltd does not warrant this document is definitive nor free from error and does not accept liability for
any loss caused, or arising from, reliance upon the information provided herein.
PO Box 362
Subiaco WA 6904
Telephone 0438 347 968
ACN 093 377 283
ABN 60 093 377 283

Fortescue Metals Group | January 2018 Eliwana Mine Project Discharge Assessment Page 3
J5437-0
1_R
01-V
03a
CONTENTS
1 INTRODUCTION 5
2 METHODOLOGY 5
3 DISCHARGE LOCATIONS 6
3.1 Flow Rate 6
3.2 Grid Size 6
3.3 Topography 6
4 CONCEPTUAL WATER BALANCE 11
4.1 Development of Steady State 11
4.2 Infiltration Rate 11
4.3 Evaporation & Evapotranspiration 12
4.4 Rainfall 13
4.5 Groundwater 13
4.6 Adopted Methodology & Assumptions/Limitations 13
5 RESULTS 15
5.1 Overview 15
5.2 Comparison to Previous Studies 15
6 RECOMMENDATIONS 16
7 REFERENCES 17
APPENDICES Appendix A Flood Extent Mapping
LIST OF FIGURES Figure 2-1 TUFLOW Inputs 5
Figure 3-1 Discharge Options 7
Figure 3-2 LiDAR vs Photogrammetry Extents 8
Figure 3-3 LiDAR vs Photogrammetry Comparison Long Section 9
Figure 4-1 Gaining Stream (Left) vs Losing Stream (Right), Source: Fitts, 2013 13
Figure 4-2 Option 1 – 10mm/hr Infiltration 14
Figure 4-3 Option 1 – 5mm/hr Infiltration 14
Figure 4-4 Option 1 – 2.5mm/hr Infiltration 15

Fortescue Metals Group | January 2018 Eliwana Mine Project Discharge Assessment Page 4
J5437-0
1_R
01-V
03a
LIST OF TABLES Table 3-1 LiDAR vs Photogramtry SUmmary 10
Table 3-2 Photogramety vs LiDAR Comparison 10
Table 4-1 USDA Soil Classifications 11
Table 5-1 Footprint Length (km) 15
Table 5-2 Comparison to RTIO Discharge Assessment 16

Fortescue Metals Group | January 2018 Eliwana Mine Project Discharge Assessment Page 5
J5437-0
1_R
01-V
03a
1 INTRODUCTION Development of the Eliwana Mine Project has the potential to encounter periods of surplus dewatering and as
such, surface discharge to local ephemeral creek systems is a water management strategy that is being
investigated Fortescue Metals Group (Fortescue). Water Technology (WT) has been commissioned by
Fortescue to complete an assessment of potential discharge scenarios to determine the possible extent of
discharge. This report outlines the methodology, assumptions, results and recommendations derived from
Water Technology’s analysis.
2 METHODOLOGY The primary objective of this project was to determine the respective discharge extents for different controlled
discharge scenarios. The process applied in completing this is described below:
1. Data collection
a. Adoption of Fortescue discharge rates
b. Collection of topographic data
2. Hydrologic Assessment
a. Assessment of conceptual water balance
b. Review of local geology to determine infiltration rates based on current literature
3. Development of a hydraulic model using TUFLOW HPC (BUILD: 2017-09-AA)
4. Results Analysis/Mapping
To accurately assess the footprint of controlled discharge locations, key inputs needed to be assessed, which
are presented in Figure 2-1.
FIGURE 2-1 TUFLOW INPUTS
TUFLOW
1) Discharge Locations
2) Flow Rate
3) Grid Resolution
4) Topography
5) Water Balance/ Infiltration Rate
Discharge Extent

Fortescue Metals Group | January 2018 Eliwana Mine Project Discharge Assessment Page 6
J5437-0
1_R
01-V
03a
3 DISCHARGE LOCATIONS Two controlled discharge locations were selected for the purposes of hydraulic modelling. These locations
have been based on suitable sites close to below water table mining areas. These two locations have been
presented in Figure 3-1.
3.1 Flow Rate
The peak rate of discharge to be modelled was supplied by Fortescue as 350 L/s, which translates to 30.24
ML/day. Fortescue have advised that based on current water balance modelling, this rate is a conservative
estimate of the upper limit of potential discharge rate, although it is unlikely that such a rate would be sustained
over an extended period, for modelling this peak rate has been held constant in attempt to quantify the
maximum possible dry weather extent.
3.2 Grid Size
A 2m resolution was used in the TUFLOW hydraulic model. This resolution was selected as it resulted in a
scale fine enough to capture key topographic changes within the creek systems while still enabling practical
model run times.
3.3 Topography
Photogrammetry was the primary form of data provided by FMG, captured in June 2014. A small amount of
LiDAR was available for the Northern sections of the option 1 and option 2 model extents. The date of capture
of the option 1 LiDAR was April 2012 while the option 2 LiDAR was captured in June 2017. The extent of each
topographic dataset is shown in Figure 3-2.
Furthermore, an assessment of LiDAR vs Photogrammetry was completed for option 1 to determine both the
sensitivity and differences associated with photogrammetry and LiDAR in overlapping areas. Figure 3-3
highlights a sample long section comparison.

Fortescue Metals Group | January 2018 Eliwana Mine Project Discharge Assessment Page 7
J5437-0
1_R
01-V
03a
FIGURE 3-1 DISCHARGE OPTIONS
Option 2
Option 1

Fortescue Metals Group | January 2018 Eliwana Mine Project Discharge Assessment Page 8
J5437-0
1_R
01-V
03a
FIGURE 3-2 LIDAR VS PHOTOGRAMMETRY EXTENTS
Option 2 Model Extent
Option 1 Model Extent
LiDAR
Photogrammetry

Fortescue Metals Group | January 2018 Eliwana Mine Project Discharge Assessment Page 9
J5437-0
1_R
01-V
03a
FIGURE 3-3 LIDAR VS PHOTOGRAMMETRY COMPARISON LONG SECTION
LiDAR
Photogrammetry
Comparison Long Section Location
Option 1

Fortescue Metals Group | January 2018 Eliwana Mine Project Discharge Assessment Page 10
J5437-0
1_R
01-V
03a
Figure 3-3 demonstrates that moderate differences are present in the LiDAR vs Photogrammetry. The LiDAR
has captured a greater level of detail compared to the Photogrammetry. As described in the metadata reports
provided by AAM (2017), the accuracy of the LiDAR and Photogrammetry is summarised in Table 3-1.
TABLE 3-1 LIDAR VS PHOTOGRAMTRY SUMMARY
Topographic Data Vertical Error Horizontal Error
LiDAR +- 0.1m +- 0.2m
Photogrammetry +-0.3m N/A
Given that the absolute error between the LiDAR and Photogrammetry is 0.4m, based on 1 standard deviation,
this generally correlates with the differences observed in Figure 3-3. This indicates that the LiDAR is generally
more accurate than the Photogrammetry. In areas of dense vegetation, the accuracy of the Photogrammetry
is limited as it does not penetrate vegetation well to pick up the ground elevation. Whilst LiDAR can penetrate
vegetation more effectively, both types of capture methods are ineffective through standing water bodies. In
these areas, the ground elevations are simply interpolated across. Given the minor discrepancies, the datasets
are generally comparable and able to be used in series as inputs within the TUFLOW modelling, however it is
important to note the inherent limitations of the data.
A sensitivity assessment has been completed for Option 1, whereby LiDAR was available for the Northern
section of the model extent. In the sensitivity analysis, LiDAR was removed and only Photogrammetry was
utilised. The results of the TUFLOW sensitivity simulations are highlighted in Table 3-2.
TABLE 3-2 PHOTOGRAMETY VS LIDAR COMPARISON
Scenario Stream Length (km)
Option 1 – 10mm/hr (Photogrammetry) 7.55
Option 1 – 10mm/hr (LiDAR) 8.20
Difference 0.65 (7.3%)
Table 3-2 indicates that that the stream length has decreased when photogrammetry was applied. This is primarily due to the LiDAR providing finer detail, with better definition in the vegetated creek channels. This can result in a smaller channel width and/or a reduction in artificial depression storage within the reach. Hence, there is a slightly smaller surface area for water to infiltrate within each reach of the LiDAR model, resulting in a greater stream length.
While neither dataset provides a perfect representation of the true elevation, they both provide a reasonable
level of confidence of ground level (based on horizontal and vertical accuracy) for conceptual characterisation
of discharge extent.

Fortescue Metals Group | January 2018 Eliwana Mine Project Discharge Assessment Page 11
J5437-0
1_R
01-V
03a
4 CONCEPTUAL WATER BALANCE To evaluate discharge extent, a conceptual water balance has been considered for the discharge environment,
which includes components of evaporation, evapotranspiration, infiltration (including recharge), and rainfall
which are described below.
4.1 Development of Steady State
This assessment involves simulation of steady state conditions to a point in which equilibrium occurs. The
analysis considers dry weather conditions and simulates inflows and loses for a period until which time the
volume in (provided via dewatering) equals volume out (provided by infiltration losses). The subsequent
discharge footprint that is required to achieve this equilibrium is considered the maximum possible footprint
given the conservative approach which has been adopted in this analysis.
4.2 Infiltration Rate
The infiltration rate determines the rate of outflow from the model for each grid cell. With no other mechanism
for water to exit the model, the rate of infiltration dictates the number of wet cells the model requires to reach
a state of equilibrium. As such, the adopted infiltration rate needs to be conservative and reference appropriate
scientific sources.
McKenzie et al, (2000) provides estimation of soil properties using the Atlas of Australian Soils. This found that
for the area encapsulating the discharge locations, an infiltration rate ranging from 3-300 mm/hr could be
expected. Given that the Atlas of Australian soils does not feature definition of channels, and given the broad
range of expected values, this source does not provide suitable definition or accuracy which will enable
adoption of an infiltration rate in the case of this assessment.
To provide guidance on the likely soil classification present within the local creeks, the 250K scale Government
Geology layer from the Geological Survey of Western Australia was utilised. This spatial file classified the soil
type within the main creek channels, which are subject to dewatering, as:
“Alluvium unconsolidated silt, sand, and gravel; in drainage channels and on adjacent
floodplains”
The United States Department of Agriculture (USDA) National Engineering Handbook provides guidance on
varying hydrologic soil groups. Table 4-1 below highlights the USDA recommended infiltration rates based on
general soil types which have been converted to mm/hr.
TABLE 4-1 USDA SOIL CLASSIFICATIONS
Soil Category
A “Soils in this group have low runoff potential when thoroughly wet. Water is transmitted freely through the soil. Group A soils typically have less than 10 percent clay and more than 90 percent sand or gravel and have gravel or sand textures. Some soils having loamy sand, sandy loam, loam or silt loam textures may be placed in this group if they are well aggregated, of low bulk density, or contain greater than 35 percent rock fragments.”
>36mm/hr

Fortescue Metals Group | January 2018 Eliwana Mine Project Discharge Assessment Page 12
J5437-0
1_R
01-V
03a
Soil Category
B “Soils in this group have moderately low runoff potential when thoroughly wet. Water transmission through the soil is unimpeded. Group B soils typically have between 10 percent and 20 percent clay and 50 percent to 90 percent sand and have loamy sand or sandy loam textures. Some soils having loam, silt loam, silt, or sandy clay loam textures may be placed in this group if they are well aggregated, of low bulk density, or contain greater than 35 percent rock fragments.”
36mm/hr – 14.4mm/hr
C “Soils in this group have moderately high runoff potential when thoroughly wet. Water transmission through the soil is somewhat restricted. Group C soils typically have between 20 percent and 40 percent clay and less than 50 percent sand and have loam, silt loam, sandy clay loam, clay loam, and silty clay loam textures. Some soils having clay, silty clay, or sandy clay textures may be placed in this group if they are well aggregated, of low bulk density, or contain greater than 35 percent rock fragments.”
14.4mm/hr – 1.4mm/hr
Based on the USDA soil classifications, it is evident that material characterised by high clay content features
low infiltration rates, while material featuring high proportions of sand feature significantly greater infiltration
rates. It is important to note that observations from creek bed inspections completed by Fortescue have not
indicated the presence of high clay content to date. This indicates that the material likely aligns with categories
A and B as opposed to category C.
Furthermore, is important to note that these losses are for saturated conditions, which are significantly less
than what would occur in unsaturated scenarios. ARR (2016) provides guidance on loss rates which could be
expected for the local region which feature losses of:
Initial Loss: 60 mm
Continuous Loss 10 mm/hr
The unsaturated losses are significantly greater to the saturated losses based on the USDA guidance. It is
likely that unsaturated condition will often occur as dewatering will not be carried out indefinitely but will likely
be completed in stages via dewatering campaigns.
For the purposes of this assessment, and without the availability of more detailed soil information, infiltration
rates of 2.5 mm/hr, 5 mm/hr and 10 mm/hr have been selected for analysis. These values have been selected
as they form conservative estimates that align with saturated infiltration rates based on values provided by
USDA, the 250K scale Government Geology layer and discussions with Fortescue regarding observations
made on the local creek bed soil characteristics to date.
4.3 Evaporation & Evapotranspiration
An analysis on the effects of evaporation and evapotranspiration was completed, which found that the
evaporation was not significant in influencing the losses present within the system. Given that conservative
loss rates of 5 mm/hr have been assumed within the catchment, this equates to 120 mm/day.
Given that the average daily evaporation is 8.48 mm/day (Silo, Department of Science, Information Technology
and Innovation), the losses due to evaporation are relatively insignificant when compared to infiltration, and lie
well within the infiltration rate uncertainty range. Therefore, the loses caused by evaporation have been
assumed to be incorporated into the overall losses to simplify the analysis, and to ensure that a conservative
estimate of the maximum footprint was achieved.

Fortescue Metals Group | January 2018 Eliwana Mine Project Discharge Assessment Page 13
J5437-0
1_R
01-V
03a
4.4 Rainfall
Rainfall has not been considered in the water balance analysis as the modelling is based on dry weather
conditions only. This assumption was necessary due to the variable nature of rainfall events, and because the
discharge footprint would be highly diluted and would simply form rainfall runoff as per the existing hydrologic
regime. As such, this analysis is only relevant for dry weather periods outside of rainfall events.
4.5 Groundwater
Creeks have been assumed to be losing streams as illustrated in Figure 4-1 below. Based on discussions with
Fortescue, there were no identified groundwater to surface feeds creating permanent to semi-permanent pools
or baseflow. Hence, the impacts of groundwater did not need to be included in the modelling.
FIGURE 4-1 GAINING STREAM (LEFT) VS LOSING STREAM (RIGHT), SOURCE: FITTS, 2013
4.6 Adopted Methodology & Assumptions/Limitations
The key assumptions that were adopted include:
1. No evaporation was considered as part of the analysis as described in section 4.3.
2. Rainfall has not been considered as potential for impact from discharge occurs outside of periods of rainfall
and streamflow as decried in section 4.4
3. No gaining reaches have been considered as part of the analysis as described in section 4.5.
4. Given the variations in infiltration scenarios, the time taken to reach equilibrium varied substantially, and
as a result the runtimes of the models were:
a. 168 hours (1 week) for 10mm/hr Scenarios
b. 336 hours (2 weeks) for 5mm/hr Scenarios
5. Simulations were run until equilibrium was reached (i.e. Rate of change to the extent of the flooding =0).
See Figure 4-2, Figure 4-3 and Figure 4-4 below for change in volume vs time series plots.
6. This method has not been calibrated or validated to real world results.

Fortescue Metals Group | January 2018 Eliwana Mine Project Discharge Assessment Page 14
J5437-0
1_R
01-V
03a
FIGURE 4-2 OPTION 1 – 10MM/HR INFILTRATION
FIGURE 4-3 OPTION 1 – 5MM/HR INFILTRATION
Fortescue Metals Group | January 2018 Eliwana Mine Project Discharge Assessment Page 15
J5437-0
1_R
01-V
03a
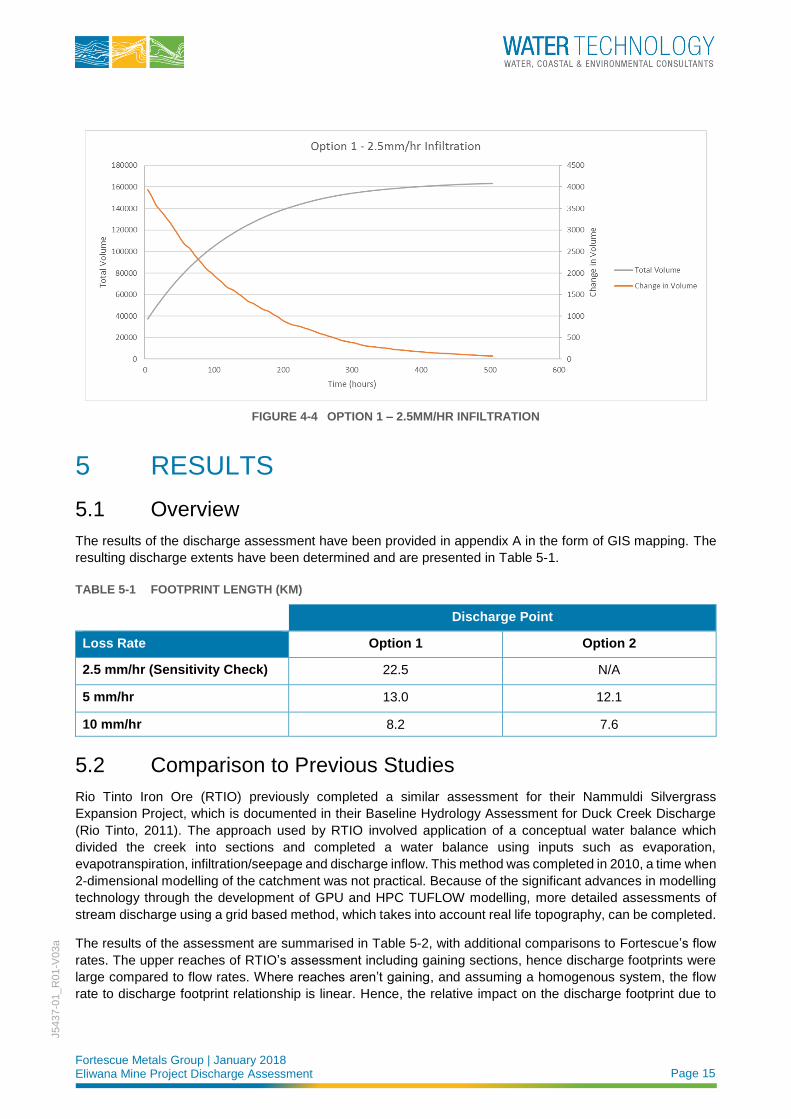
FIGURE 4-4 OPTION 1 – 2.5MM/HR INFILTRATION
5 RESULTS
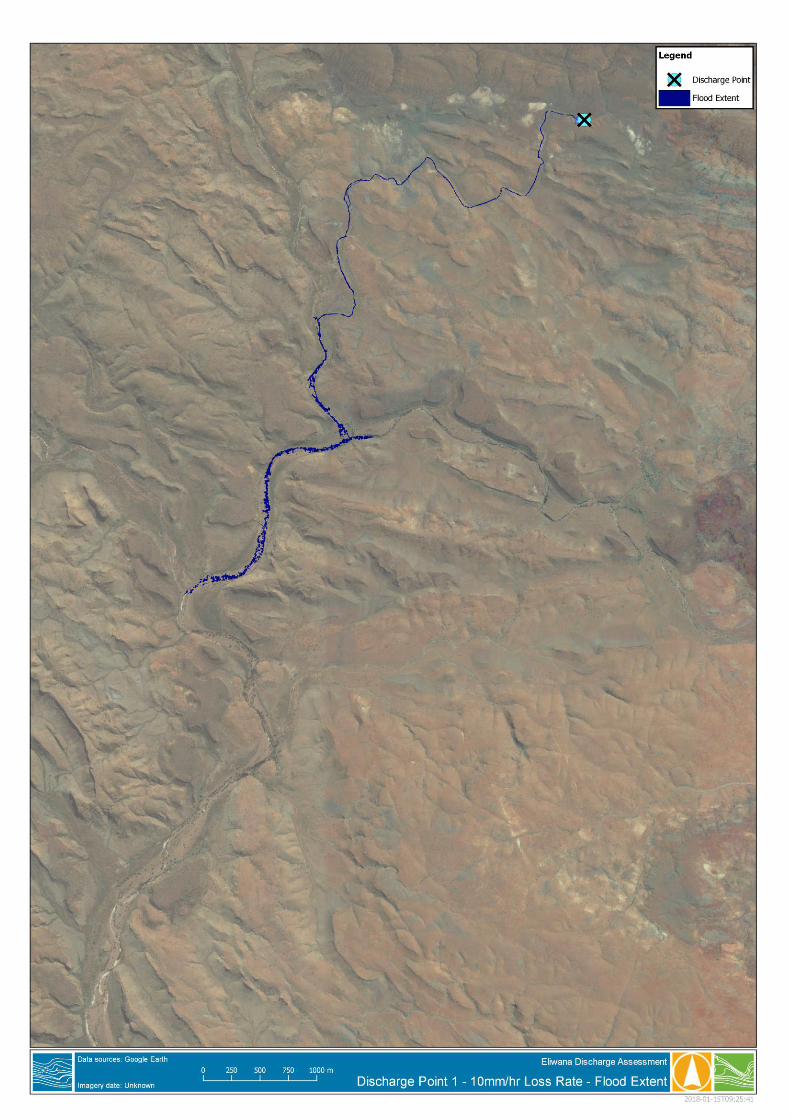
5.1 Overview
The results of the discharge assessment have been provided in appendix A in the form of GIS mapping. The
resulting discharge extents have been determined and are presented in Table 5-1.
TABLE 5-1 FOOTPRINT LENGTH (KM)
Discharge Point
Loss Rate Option 1 Option 2
2.5 mm/hr (Sensitivity Check) 22.5 N/A
5 mm/hr 13.0 12.1
10 mm/hr 8.2 7.6
5.2 Comparison to Previous Studies
Rio Tinto Iron Ore (RTIO) previously completed a similar assessment for their Nammuldi Silvergrass
Expansion Project, which is documented in their Baseline Hydrology Assessment for Duck Creek Discharge
(Rio Tinto, 2011). The approach used by RTIO involved application of a conceptual water balance which
divided the creek into sections and completed a water balance using inputs such as evaporation,
evapotranspiration, infiltration/seepage and discharge inflow. This method was completed in 2010, a time when
2-dimensional modelling of the catchment was not practical. Because of the significant advances in modelling
technology through the development of GPU and HPC TUFLOW modelling, more detailed assessments of
stream discharge using a grid based method, which takes into account real life topography, can be completed.
The results of the assessment are summarised in Table 5-2, with additional comparisons to Fortescue’s flow
rates. The upper reaches of RTIO’s assessment including gaining sections, hence discharge footprints were
large compared to flow rates. Where reaches aren’t gaining, and assuming a homogenous system, the flow
rate to discharge footprint relationship is linear. Hence, the relative impact on the discharge footprint due to

Fortescue Metals Group | January 2018 Eliwana Mine Project Discharge Assessment Page 16
J5437-0
1_R
01-V
03a
additional flow can be used for comparison Fortescue’s flow rates. The last column in Table 5-2 is the relative
footprint increase scaled according to the relative flow rate increase compared to Fortescue’s flow rate of 350
L/s. Beyond a 100-km discharge extent, RTIO’s reaches were no longer gaining, which provides a good
comparison to the reaches in this analysis. The highlighted cells show these reaches, which have discharge
footprints that correlate well with Table 5-1.
TABLE 5-2 COMPARISON TO RTIO DISCHARGE ASSESSMENT
Flow Rate
(ML/d)
Relative Flow Rate Increase
(ML/d)
Relative Flow Rate Increase
(L/s)
Maximum Discharge Footprint
(km)
Relative Footprint Increase
(km)
Comparative Footprint Increase for Flow Rate of
350 L/s (30.2 ML/d)
15 15 174 30 30 60.3
20 5 58 83 53 320.5
50 30 347 109 26 26.2
100 50 579 124 15 9.1
150 50 579 140 16 9.7
200 50 579 157 17 10.3
Given that the water balance completed by RTIO correlates will with the method adopted in this analysis for
the same region, further confidence can be placed in the results generated in this assessment.
6 RECOMMENDATIONS A conservative assumption of 5 mm/hr for the infiltration rate was adopted for this analysis. It is likely that the
actual infiltration rate will be higher, however the uncertainties in other model inputs, particularly the
topography, mean that adopting a conservative infiltration rate is recommended. This approach has been
validated through the comparison to RTIO’s alternative methodology, which found that produce slightly larger
comparable discharge areas were produced in this study. Water Technology believes that the impact area
extents presented in this report are an appropriate conceptual extent of the maximum discharge case
scenarios under steady state conditions.
Furthermore, a sensitivity analysis was completed using a 2.5mm/hr infiltration rate for Option 1, which resulted
in a 73% increase in the discharge extent. As such, Water Technology recommends adoption of the 5 mm/hr
discharge extent as this represents a conservative estimate of what can be considered the maximum discharge
footprint, which correlates well with previous assessments.
If Fortescue wish to further optimise the TUFLOW model prior to construction of the mine site and reduce the
level of uncertainty and conservatism the following actions may be undertaken:
1. Preform onsite ground truthing to determine a refined infiltration rate (this will likely result in higher
infiltration rates given the conservative value applied); and
2. Use of LiDAR over photogrammetry in places where LiDAR was not available at the time of this study.
3. Complete a more detailed water balance to contrast the impacts of short term temporally varying discharge
plans vs long term steady state footprints.
This level of assessment would require more information, including a more detailed site water balance. As this
information won’t be available until closer to construction, the level of analysis in this report is suitable for the
current purposes.

Fortescue Metals Group | January 2018 Eliwana Mine Project Discharge Assessment Page 17
J5437-0
1_R
01-V
03a
7 REFERENCES AAM 2017, Eliwana Rail Project LiDAR Survey June 2017 – Final Delivery Complete.
Ball J, Babister M, Nathan R, Weeks W, Weinmann E, Retallick M, Testoni I, (Editors), 2016, Australian Rainfall and Runoff: A Guide to Flood Estimation, Commonwealth of Australia (Geoscience Australia).
Fitts, 2013, 2nd ed, Groundwater science.
McKenzie et al, Estimation of Soil Properties Using the Atlas of Australian Soils, CSIRO land and Water, 2000.
Rio Tinto, Baseline hydrology assessment for Duck Creek discharge, 2011.
United States Department of Agriculture, Part 630 Hydrology National Engineering Handbook, Chapter 7.
Hydrologic Soil Groups. https://directives.sc.egov.usda.gov/OpenNonWebContent.aspx?content=17757.wba

APPENDIX A FLOOD EXTENT MAPPING


Melbourne
15 Business Park Drive Notting Hill VIC 3168 Telephone (03) 8526 0800 Fax (03) 9558 9365
Brisbane
Level 3, 43 Peel Street South Brisbane QLD 4101 Telephone (07) 3105 1460 Fax (07) 3846 5144
Wangaratta First Floor, 40 Rowan Street Wangaratta VIC 3677 Telephone (03) 5721 2650
Perth Ground Floor, 430 Roberts Road Subiaco WA 6008 Telephone 08 6555 0105
Geelong
PO Box 436 Geelong VIC 3220 Telephone 0458 015 664
Gippsland
154 Macleod Street Bairnsdale VIC 3875 Telephone (03) 5152 5833
Wimmera PO Box 584 Stawell VIC 3380 Telephone 0438 510 240
www.watertech.com.au