Report for the WHO Meningitis Guideline Revision (May 2014) · 1 Antibiotic Regimens in meningitis...
14
1 Antibiotic Regimens in meningitis epidemics in sub-Saharan Africa: Report for the WHO Meningitis Guideline Revision (May 2014) Prepared by Laurence Cibrelus Recommendation question: Should single dose antibiotic regimens continue to be recommended for suspected cases of meningitis during a meningococcal meningitis outbreak, and, if so, in what circumstances Current WHO recommendations: Presumptive treatment in a district with confirmed meningococcal meningitis epidemic is recommended as follows: <2 months old: 7-day regimen (ceftriaxone) to cover Spn, Hib, NmA and enterobacteria 2-23 months old: 5-day regimen (ceftriaxone) to cover Spn, Hib, Nm ≥ 2 years old: single-dose regimen targeted to Nm, and continue treatment if not improving As far as possible, the age groups displayed in this report match the current treatment guidelines. PICO question: Among cases in meningococcal meningitis outbreaks due to NmA before the introduction of MenAfriVac®, the MenA conjugate vaccine, compared with outbreaks due to other Nm serogroups, what is the proportion of cases receiving “sub-optimal” treatment, i.e. being caused by other pathogens than Nm? May 3, 2014
Transcript of Report for the WHO Meningitis Guideline Revision (May 2014) · 1 Antibiotic Regimens in meningitis...

1
Antibiotic Regimens in meningitis epidemics in sub-Saharan Africa:
Report for the WHO Meningitis Guideline Revision
(May 2014)
Prepared by Laurence Cibrelus
Recommendation question: Should single dose antibiotic regimens continue to be recommended for suspected cases of
meningitis during a meningococcal meningitis outbreak, and, if so, in what circumstances
Current WHO recommendations:
Presumptive treatment in a district with confirmed meningococcal meningitis epidemic is recommended
as follows:
<2 months old: 7-day regimen (ceftriaxone) to cover Spn, Hib, NmA and enterobacteria
2-23 months old: 5-day regimen (ceftriaxone) to cover Spn, Hib, Nm
≥ 2 years old: single-dose regimen targeted to Nm, and continue treatment if not improving
As far as possible, the age groups displayed in this report match the current treatment guidelines.
PICO question:
Among cases in meningococcal meningitis outbreaks due to NmA before the introduction of
MenAfriVac®, the MenA conjugate vaccine, compared with outbreaks due to other Nm serogroups,
what is the proportion of cases receiving “sub-optimal” treatment, i.e. being caused by other pathogens
than Nm?
May 3, 2014

2
I. Background
High case fatality is observed from pneumococcal meningitis in the meningitis belt. The internationally
approved and gold standard presumptive treatment of bacterial meningitis is based on the
administration of one or more antibiotics for at least 5 days, according to the local epidemiology of
meningitis and patient characteristics. To ensure rapid and effective treatment at first contact, and given
large volume of cases during past large scale meningitis outbreaks, a single dose regimen is currently
recommended during epidemics of meningococcal meningitis in Africa for patients >23 months. This
regimen is effective treatment for meningitis due to N. meningitidis but not for meningitis due to
S.pneumoniae (Spn) and H. influenzae type b (Hib). With fewer large scale epidemics of meniningococcal
meningitis following the introduction of the serogroup A meningococcal conjugate vaccine, a higher
proportion of meningitis cases due to Spn and Hib is expected.
II. Aim and objectives
The PICO 3 analysis aims to answer the following primary questions:
1) What is the distribution of causative organism (pathogen) among confirmed meningitis
cases during *NmW /NmX epidemics compared with that during NmA epidemics?
2) What is the distribution of causative organism (pathogen) among different age groups of
confirmed meningitis cases during *NmW /NmX epidemics compared with that during
NmA epidemics?
As well as the following subsidiary questions to support the recommendations:
3) What it the case fatality of meningitis cases during *NmW /NmX epidemics compared
with that during NmA epidemics?
4) What is the pathogen distribution during non-epidemic periods?
*Nm W and Nm X were the only Nm serogroups other than Nm A responsible for epidemics during the
analysis period.
III. Methods
1. Evidence needed
Since data on antibiotic use is not routinely collected, evidence on patient outcome according to
treatment protocol was not available. In order to infer the proportion of patients that would be treated
sub-optimally during meningitis outbreaks, evidence on the incidence of meningitis due to Nm, Spn and
Hib during outbreaks of meningococcal meningitis was gathered
2. Evidence gathering
We included events between 2002-2012, in all countries of the African meningitis belt
Data were retrieved from 3 main sources:
– Surveillance, from MoH, WHO country offices (enhanced and laboratory surveillance
datasets).
– Partners (aggregated extracted on specific templates)
– Review of the literature (data extracted on specific templates)
Details on data collected (surveillance datasets and data from partners) are provided in Appendix 1.
3
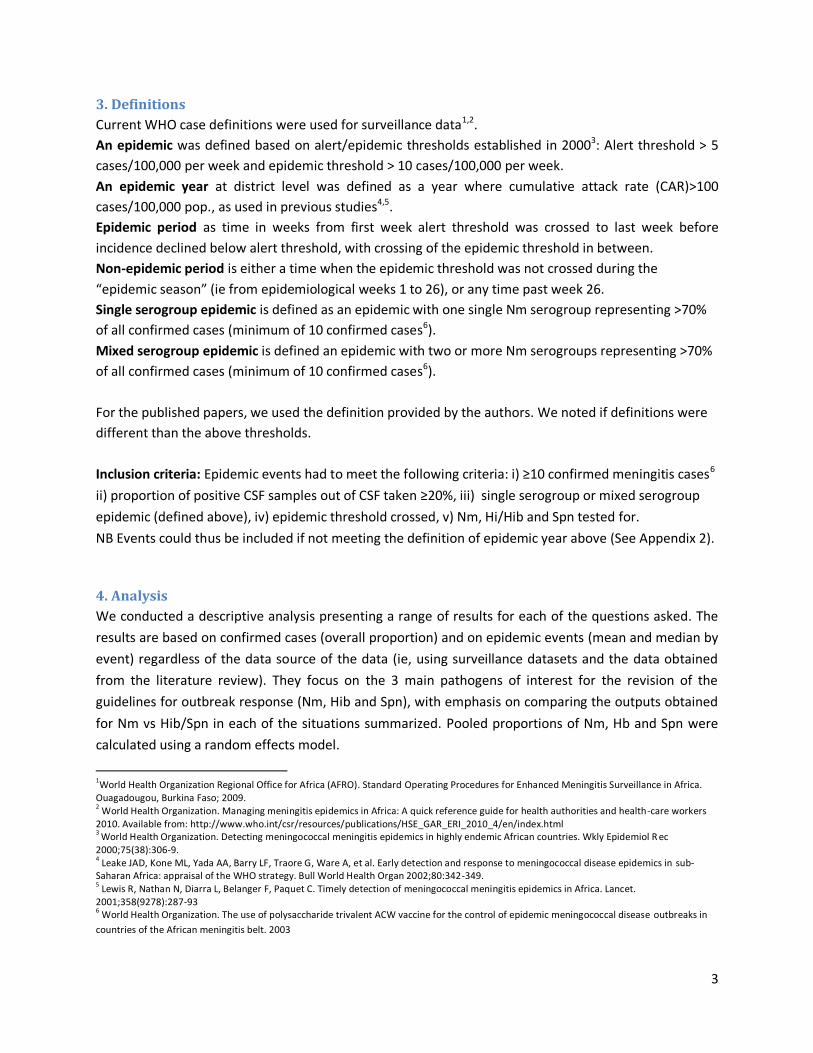
3. Definitions
Current WHO case definitions were used for surveillance data1,2.
An epidemic was defined based on alert/epidemic thresholds established in 20003: Alert threshold > 5
cases/100,000 per week and epidemic threshold > 10 cases/100,000 per week.
An epidemic year at district level was defined as a year where cumulative attack rate (CAR)>100
cases/100,000 pop., as used in previous studies4,5.
Epidemic period as time in weeks from first week alert threshold was crossed to last week before
incidence declined below alert threshold, with crossing of the epidemic threshold in between.
Non-epidemic period is either a time when the epidemic threshold was not crossed during the
“epidemic season” (ie from epidemiological weeks 1 to 26), or any time past week 26.
Single serogroup epidemic is defined as an epidemic with one single Nm serogroup representing >70%
of all confirmed cases (minimum of 10 confirmed cases6).
Mixed serogroup epidemic is defined an epidemic with two or more Nm serogroups representing >70%
of all confirmed cases (minimum of 10 confirmed cases6).
For the published papers, we used the definition provided by the authors. We noted if definitions were
different than the above thresholds.
Inclusion criteria: Epidemic events had to meet the following criteria: i) ≥10 confirmed meningitis cases6
ii) proportion of positive CSF samples out of CSF taken ≥20%, iii) single serogroup or mixed serogroup
epidemic (defined above), iv) epidemic threshold crossed, v) Nm, Hi/Hib and Spn tested for.
NB Events could thus be included if not meeting the definition of epidemic year above (See Appendix 2).
4. Analysis
We conducted a descriptive analysis presenting a range of results for each of the questions asked. The
results are based on confirmed cases (overall proportion) and on epidemic events (mean and median by
event) regardless of the data source of the data (ie, using surveillance datasets and the data obtained
from the literature review). They focus on the 3 main pathogens of interest for the revision of the
guidelines for outbreak response (Nm, Hib and Spn), with emphasis on comparing the outputs obtained
for Nm vs Hib/Spn in each of the situations summarized. Pooled proportions of Nm, Hb and Spn were
calculated using a random effects model.
1World Health Organization Regional Office for Africa (AFRO). Standard Operating Procedures for Enhanced Meningitis Surveillance in Africa.
Ouagadougou, Burkina Faso; 2009. 2 World Health Organization. Managing meningitis epidemics in Africa: A quick reference guide for health authorities and health-care workers
2010. Available from: http://www.who.int/csr/resources/publications/HSE_GAR_ERI_2010_4/en/index.html
3 World Health Organization. Detecting meningococcal meningitis epidemics in highly endemic African countries. Wkly Epidemiol R ec
2000;75(38):306-9. 4 Leake JAD, Kone ML, Yada AA, Barry LF, Traore G, Ware A, et al. Early detection and response to meningococcal disease epidemics in sub-
Saharan Africa: appraisal of the WHO strategy. Bull World Health Organ 2002;80:342-349. 5 Lewis R, Nathan N, Diarra L, Belanger F, Paquet C. Timely detection of meningococcal meningitis epidemics in Africa. Lancet.
2001;358(9278):287-93 6 World Health Organization. The use of polysaccharide trivalent ACW vaccine for the control of epidemic meningococcal disease outbreaks in
countries of the African meningitis belt. 2003

4
IV. Findings
1. Epidemic and non-epidemic events included in the analysis
A total of 22 epidemic events met the inclusion criteria: 11 NmW and/or NmX epidemics, and 11 NmA
epidemics, used as a comparator. All events occurred in countries of the meningitis belt between 2002-
2014. Focus was given to single serogroup epidemics and /or mixed epidemics without Nm A
component (NmW and/or NmX) vs NmA. Mixed epidemics with NmA participation were not included in
the main analysis for the two primary questions as the introduction of the MenA conjugate vaccine in
Sub-Saharan Africa should limit the occurrence of such epidemics.
NmW epidemic events meeting the inclusion criteria occurred in Burkina Faso between 2002 and 2012.
Records were also available for Benin, Cote d’Ivoire, Gambia, Ghana, Niger and Uganda, all of which
occurred in 2010-2014 (Table 1). Two NmX epidemic events were documented in Burkina Faso, 2010
and Togo, 2007. Eleven NmA epidemic events were used for comparison purposes (NmA epidemics vs.
non-NmA epidemics) (Table 2). All occurred in areas where the MenA conjugate vaccine had not yet
been introduced.
Notes:
In some rare instances, the type of Hi wasn’t specified in the original datasets. Hi of
“unspecified” or “any” type were included in the analysis as Hib.
At the individual level, cases with more than one causal pathogen identified were discarded
from the analysis. This situation occurred only in surveillance datasets.
When the same events were described using different data sources, preference for inclusion
was given to i) published data over surveillance datasets and ii) the largest and most
comprehensive datasets.
2. Overall pathogen distribution
In NmW and NmX epidemics, about 90% of the cases were of meningococcal origin (overall proportion,
as well as mean and median by epidemic; Table 1). In NmA epidemics, about 88% of the cases were of
meningococcal origin with a mean and a median both greater than 90% (Table 2). The pooled
proportions showed similar differences with wide confidence intervals. Details by event are provided in
Appendix 3.
Conclusion: The overall pathogen distribution in NmW and NmX epidemics appears to be close to that
of NmA epidemics.
Limitations: These findings may be influenced by the timing of epidemics in relation to the introduction
of the Hib and Spn vaccines, and by reactive vaccination in NmW and NmA epidemics. Published reports
of outbreaks are likely to be biased towards reporting of larger epidemics.

5
Table 1: Pathogen distribution in NmW, NmX and mixed Nm W/X epidemics
Country Dates7 Number
of
districts
Predominant
pathogen(s)
Pathogens identified
% of total (n)
Data source
Nm of all
serogroups
Hib
and
Spn
Hib Spn
Benin
2012,
W 1-
26
5 NmW 95.9%
(71)
4.1%
(3) 4.1%
(3) 0%
(Njanpop-Lafourcade, Hugonnet et al.
2013)
Burkina Faso
2002
W 1-
23
30 NmW 91%
(183)
9%
(18) 2% (3) 7% (15) (Bertherat, Yada et al. 2002)
Burkina Faso
2012,
W 1-
17
14 Nm W/X 71%
(318)
29%
(132) 3%
(12) 26% (120) (Savadogo, Kyelem et al. 2013)
Burkina Faso 2012 12 NmW 93%
(652)
7%
(49)
0.1%
(1) 6.8% (48)
Surveillance datasets
Cote
d’Ivoire* 2012 1 NmW
88.6%
(31)
11.4%
(4) 0% (0) 11.4% (4)
Surveillance datasets
Gambia**
2012,
W 6-
27
2 NmW 85 %
(103)
15%
(18) 0% (0) 15% (18) (Hossain, Roca et al. 2013)
Ghana 2010 1 NmW 100%
(13)
0% (0) 0% (0) 0% (0)
Surveillance datasets
Niger 2011 8 NmW 85%
(408)
15%
(72)
0.4%
(2) 15% (70) (Collard, Issaka et al. 2013)
Uganda 2014 1 NmW 93.3%
(14)
6.7%
(1) 0% (0) 6.7% (1)
Surveillance datasets
Burkina Faso 2010 4 NmX 96.5%
(137)
3.5%
(5) 0% (0) 3.5% (5) Surveillance datasets
Togo 2007 1 NmX 90.8%
(89)
9.2%
(9) 2% (2) 7.1% (7) (Delrieu, Yaro et al. 2011)
Distribution based on confirmed
cases
N=1880
Number of
confirmed
cases
1701 179 11 168
Pooled
proportion
(95%-CI)
90.5% 9.5% 0.6% 8.9%
Distribution based on epidemic
events
N=10
Mean (SD8) 91.9%
(4.9%)
8.1%
(4.9%)
0.9%
(1.4%)
7.3% (5.3%)
Median
(Range)
92% (85-
100%)
8% (0-
15%)
0.05%
(0-
4.1%)
6.9% (0-15%)
*The pathogens identified as Nm Y/W via latex agglutination were considered as potentially of W serogroup, with a total hence greater than 70%
**Although the investigation of the epidemic was published in the paper referenced, the estimates presented above were obtain ed directly from the authors
of the paper for the Feb 1, 2012-June 25, 2012 period
7 When dates are not specified, the epidemic event is described from crossing the alert threshold up to crossing it down, as opposed to
specified dates based on information provided by authors 8 SD, standard deviation
6
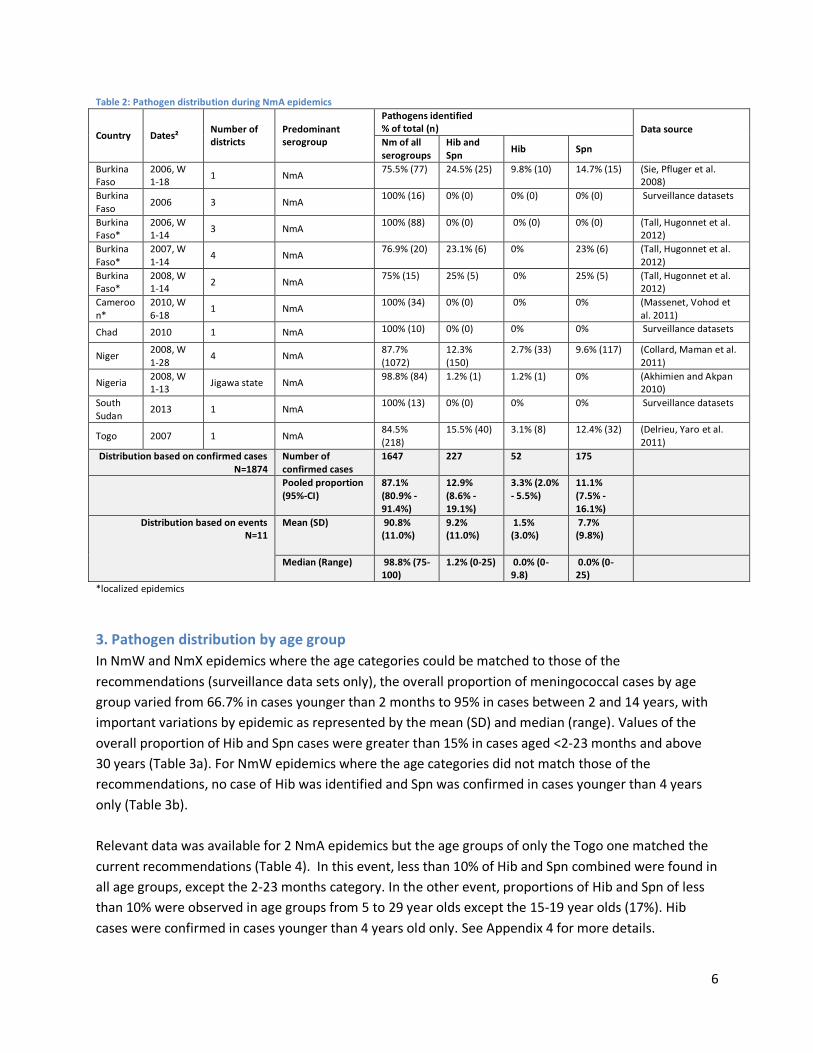
Table 2: Pathogen distribution during NmA epidemics
Country Dates² Number of districts
Predominant serogroup
Pathogens identified % of total (n) Data source
Nm of all serogroups
Hib and Spn
Hib Spn
Burkina Faso
2006, W 1-18
1 NmA 75.5% (77) 24.5% (25) 9.8% (10) 14.7% (15) (Sie, Pfluger et al.
2008)
Burkina Faso
2006 3 NmA 100% (16) 0% (0) 0% (0) 0% (0) Surveillance datasets
Burkina Faso*
2006, W 1-14
3 NmA 100% (88) 0% (0) 0% (0) 0% (0) (Tall, Hugonnet et al.
2012)
Burkina Faso*
2007, W 1-14
4 NmA 76.9% (20) 23.1% (6) 0% 23% (6) (Tall, Hugonnet et al.
2012)
Burkina Faso*
2008, W 1-14
2 NmA 75% (15) 25% (5) 0% 25% (5) (Tall, Hugonnet et al.
2012)
Cameroon*
2010, W 6-18
1 NmA 100% (34) 0% (0) 0% 0% (Massenet, Vohod et
al. 2011)
Chad 2010 1 NmA 100% (10) 0% (0) 0% 0% Surveillance datasets
Niger 2008, W 1-28
4 NmA 87.7% (1072)
12.3% (150)
2.7% (33) 9.6% (117) (Collard, Maman et al. 2011)
Nigeria 2008, W 1-13
Jigawa state NmA 98.8% (84) 1.2% (1) 1.2% (1) 0% (Akhimien and Akpan
2010)
South Sudan
2013 1 NmA 100% (13) 0% (0) 0% 0% Surveillance datasets
Togo 2007 1 NmA 84.5% (218)
15.5% (40) 3.1% (8) 12.4% (32) (Delrieu, Yaro et al. 2011)
Distribution based on confirmed cases N=1874
Number of confirmed cases
1647 227 52 175
Pooled proportion (95%-CI)
87.1% (80.9% - 91.4%)
12.9% (8.6% - 19.1%)
3.3% (2.0% - 5.5%)
11.1% (7.5% - 16.1%)
Distribution based on events N=11
Mean (SD) 90.8% (11.0%)
9.2% (11.0%)
1.5% (3.0%)
7.7% (9.8%)
Median (Range) 98.8% (75-100)
1.2% (0-25) 0.0% (0-9.8)
0.0% (0-25)
*localized epidemics
3. Pathogen distribution by age group
In NmW and NmX epidemics where the age categories could be matched to those of the
recommendations (surveillance data sets only), the overall proportion of meningococcal cases by age
group varied from 66.7% in cases younger than 2 months to 95% in cases between 2 and 14 years, with
important variations by epidemic as represented by the mean (SD) and median (range). Values of the
overall proportion of Hib and Spn cases were greater than 15% in cases aged <2-23 months and above
30 years (Table 3a). For NmW epidemics where the age categories did not match those of the
recommendations, no case of Hib was identified and Spn was confirmed in cases younger than 4 years
only (Table 3b).
Relevant data was available for 2 NmA epidemics but the age groups of only the Togo one matched the
current recommendations (Table 4). In this event, less than 10% of Hib and Spn combined were found in
all age groups, except the 2-23 months category. In the other event, proportions of Hib and Spn of less
than 10% were observed in age groups from 5 to 29 year olds except the 15-19 year olds (17%). Hib
cases were confirmed in cases younger than 4 years old only. See Appendix 4 for more details.

7
Conclusion: The proportion of pathogens per age group was similar between NmW/NmX epidemics and
NmA epidemics (but see limitations). In NmW epidemics the proportion of other pathogens in 2-14 year
olds was 5%, rising to 9% in 15-29 year olds, and higher in over 29 year olds though there were few
cases in this older age group.
Limitations: The comparison of age group distribution for NmA epidemics is limited to one country.
The numbers of samples available for comparison in some age groups were quite low with wide
confidence intervals (See GRADE table)
Table 3: Pathogen distribution by age group during NmW, NmX and mixed Nm W/X epidemics
9
a) From individual surveillance datasets Country, year, epidemic type, number of confirmed cases
Age group Number of confirmed cases
Pathogens identified % (n)
Nm of all serogroups
Hib and Spn Hib Spn
Burkina Faso, 2012 NmW epidemic N=697
<2Months 7 71.4% (5) 28.6% (2) 0 28.6% (2)
2-23 Months 125 87.2% (109) 12.8% (16) 0 12.8% (16)
2-4yrs 165 97.6% (161) 2.4% (4) 0.6% (1) 1.8% (3)
5-14yrs 308 94.2% (290) 5.8% (18) 0 5.8% (18)
15-29yrs 67 91% (61) 9.0% (6) 0 9.0% (6)
>=30yrs 25 92% (23) 8.0% (2) 0 8.0% (2)
Burkina Faso, 2010 NmX epidemic N=125
<2m 1 100% (1) 0 0 0
2-23 m 6 83.3% (5) 16.7% (1) 0 16.7% (1)
2-4y 22 95.5% (21) 4.5% (1) 0 4.5% (1)
5-14y 89 97.8% (87) 2.2% (2) 0 2.2% (2)
15-29y 6 100% (6) 0 0 0
≥30y 2 50% (1) 50% (1) 0 50% (1)
Burkina Faso, 2002 NmW epidemic N=104
<2Months -
2-23 Months 18 88.9% (16) 11.1% (2) 0 11.1% (2)
2-4yrs 30 96.7% (29) 3.3% (1) 0 3.3% (1)
5-14yrs 39 100% (39) 0 0 0
15-29yrs 15 93.3% (14) 6.7% (1) 0 6.7% (1)
>=30yrs 2 100% (2) 0 0 0
Benin, 2012 NmW epidemic
N=62
<2Months 4 50% (2) 50% (2) 0 50% (2)
2-23 Months 23 56.5% (13) 43.9% (10) 8.7% (2) 34.8% (8)
2-4yrs 18 72.2% (13) 28.4% (5) 11.1% (2) 16.7% (3)
5-14yrs 15 100% (15) 0 0 0
15-29yrs - - - -
>=30yrs 2 50% (1) 50% (1) 0 50% (1)
Cote d'Ivoire, 2012 NmW epidemic N=34
<2Months - - - - -
2-23 Months 2 100% (2) 0 0 0
2-4yrs 11 100% (11) 0 0 0
5-14yrs 5 100% (5) 0 0 0
9 Epidemics are presented by decreasing total number of confirmed cases

8
15-29yrs 12 83.3% (10) 16.7% (2) 0 16.7% (2)
>=30yrs 4 75% (3) 25% (1) 0 25.0 % (1)
Ghana, 2010 NmW epidemic N=13
<2Months - - - - -
2-23 Months 2 100% (2) 0 0 0
2-4yrs 3 100% (3) 0 0 0
5-14yrs 4 100% (4) 0 0 0
15-29yrs 2 100% (2) 0 0 0
>=30yrs 2 100% (2) 0 0 0
Uganda, 2014 NmW epidemic N=14
<2Months - - - - -
2-23 Months 3 100% (3) 0 0 0
2-4yrs 4 100% (4) 0 0 0
5-14yrs 5 100% (5) 0 0 0
15-29yrs - 0
>=30yrs 2 50% (1) 50% (1) 0 50% (1)
Distribution based on confirmed cases N=1094
Pooled proportion of pathogens identified % (95%-CI)
Nm of all serogroups
Hib and Spn Hib * Spn
<2Months 12 0.649 0.364 0.856
0.351 0.144 0.636
0.351 0.144 0.636
2-23 Months 184 0.776 0.609 0.886
0.224 0.114 0.391
0.188 0.120 0.281
2-4yrs 261 0.916 0.798 0.968
0.084 0.032 0.202
0.054 0.026 0.108
5-14yrs 483 0.936 0.877 0.967
0.064 0.033 0.123
0.060 0.040 0.088
15-29yrs 111 0.899 0.827 0.943
0.101 0.057 0.173
0.101 0.057 0.173
>=30yrs 43 0.755 0.579 0.873
0.245 0.127 0.421
0.245 0.127 0.421
Distribution based on epidemic events N=8
Pathogens identified (mean (SD); median (range))
Nm of all serogroups
Hib and Spn
Hib*
Spn
<2Months 12 73.8% (0.25); 71.4% (50-100)
26.2% (0.25); 28.6% (0-50)
26.2% (0.25); 28.6% (0-50)
2-23 Months 184 82% (0.22); 88% (50-100)
18.1% (0.22); 11.95% (0-60)
14.4% (0.16); 11.95% 0-40)
2-4yrs 261 92.1% (0.12); 97.2% (72.2-100%)
8.0% (0.12); 2.85 % (0-28.4)
3.3% (0.06) ; 0.9% (0-16.7)
5-14yrs 483 96.2% (0.08); 100% (77.8-100)
3.8% (0.08); 0% (0-22.2)
3.1% (0.06) ; 0% (0-16.7)
15-29yrs 111 92.8% (0.07); 92.2% (83.3-100)
7.3% 0.07) ; 7.9% (0-16.7)
7.3% 0.07) ; 7.9% (0-16.7)
>=30yrs 43 70.9% (0.24) ; 62.5% (50-100)
29.1% (0.24); 37.5% (0-50)
29.1% (0.24) ; 37.5% (0-50)
*Data not given as numbers very small
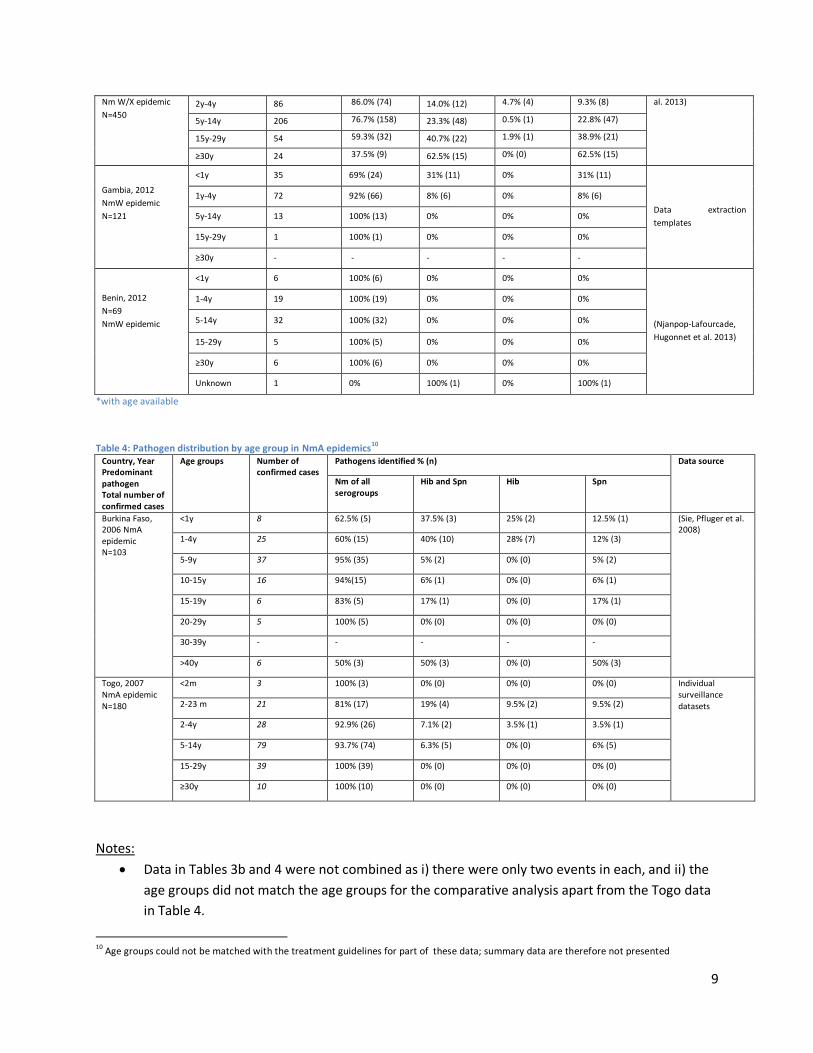
b) From data extraction templates and literature review10
Country, year,
Type of epidemic,
Total number of
confirmed cases*
Age groups Number of
confirmed
cases
Pathogens identified % (n) Data source
Nm of all
serogroups
Hib and Spn Hib Spn
Burkina Faso, 2012 <2y 80 56.3% (45) 43.8% (35) 7.5% (6) 36.3% (29) (Savadogo, Kyelem et
9
Nm W/X epidemic
N=450 2y-4y 86 86.0% (74) 14.0% (12) 4.7% (4) 9.3% (8) al. 2013)
5y-14y 206 76.7% (158) 23.3% (48) 0.5% (1) 22.8% (47)
15y-29y 54 59.3% (32) 40.7% (22) 1.9% (1) 38.9% (21)
≥30y 24 37.5% (9) 62.5% (15) 0% (0) 62.5% (15)
Gambia, 2012
NmW epidemic
N=121
<1y 35 69% (24) 31% (11) 0% 31% (11)
Data extraction
templates
1y-4y 72 92% (66) 8% (6) 0% 8% (6)
5y-14y 13 100% (13) 0% 0% 0%
15y-29y 1 100% (1) 0% 0% 0%
≥30y - - - - -
Benin, 2012
N=69
NmW epidemic
<1y 6 100% (6) 0% 0% 0%
(Njanpop-Lafourcade,
Hugonnet et al. 2013)
1-4y 19 100% (19) 0% 0% 0%
5-14y 32 100% (32) 0% 0% 0%
15-29y 5 100% (5) 0% 0% 0%
≥30y 6 100% (6) 0% 0% 0%
Unknown 1 0% 100% (1) 0% 100% (1)
*with age available
Table 4: Pathogen distribution by age group in NmA epidemics10
Country, Year Predominant pathogen Total number of confirmed cases
Age groups Number of confirmed cases
Pathogens identified % (n) Data source
Nm of all serogroups
Hib and Spn Hib Spn
Burkina Faso, 2006 NmA epidemic N=103
<1y 8 62.5% (5) 37.5% (3) 25% (2) 12.5% (1) (Sie, Pfluger et al. 2008)
1-4y 25 60% (15) 40% (10) 28% (7) 12% (3)
5-9y 37 95% (35) 5% (2) 0% (0) 5% (2)
10-15y 16 94%(15) 6% (1) 0% (0) 6% (1)
15-19y 6 83% (5) 17% (1) 0% (0) 17% (1)
20-29y 5 100% (5) 0% (0) 0% (0) 0% (0)
30-39y - - - - -
>40y 6 50% (3) 50% (3) 0% (0) 50% (3)
Togo, 2007 NmA epidemic N=180
<2m 3 100% (3) 0% (0) 0% (0) 0% (0) Individual surveillance datasets 2-23 m 21 81% (17) 19% (4) 9.5% (2) 9.5% (2)
2-4y 28 92.9% (26) 7.1% (2) 3.5% (1) 3.5% (1)
5-14y 79 93.7% (74) 6.3% (5) 0% (0) 6% (5)
15-29y 39 100% (39) 0% (0) 0% (0) 0% (0)
≥30y 10 100% (10) 0% (0) 0% (0) 0% (0)
Notes:
Data in Tables 3b and 4 were not combined as i) there were only two events in each, and ii) the
age groups did not match the age groups for the comparative analysis apart from the Togo data
in Table 4.
10
Age groups could not be matched with the treatment guidelines for part of these data; summary data are therefore not presented
10
There are several epidemics without confirmed cases < 2 months
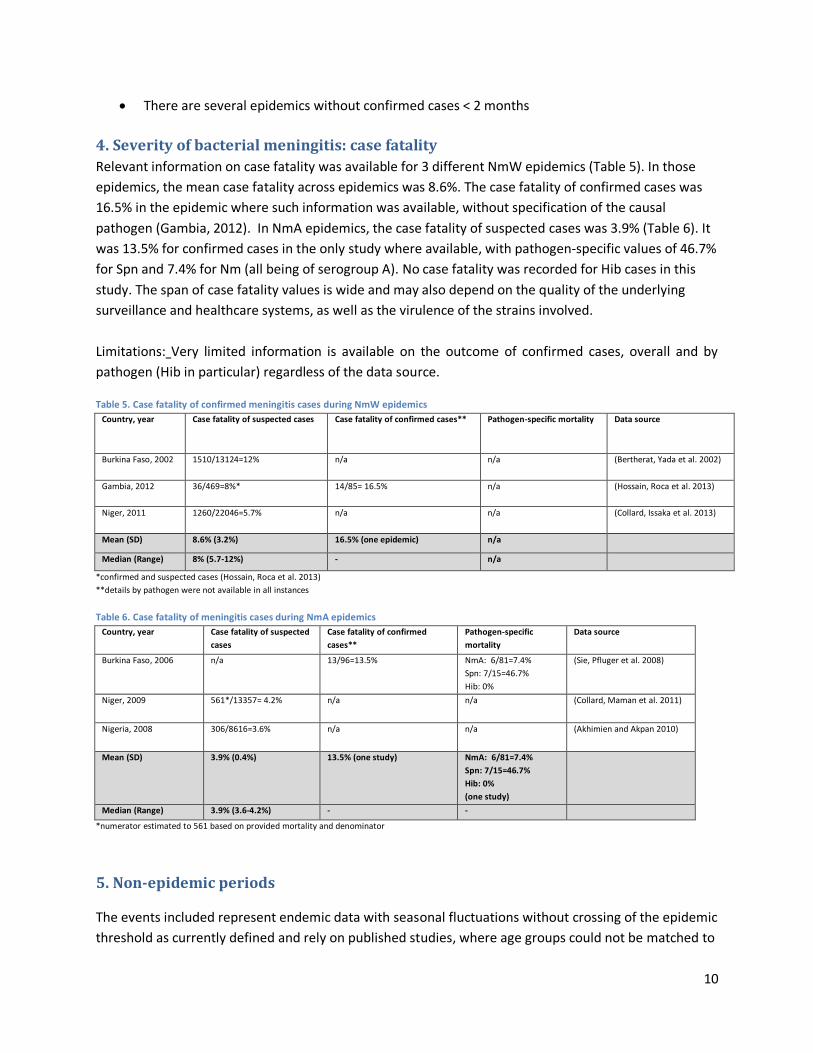
4. Severity of bacterial meningitis: case fatality
Relevant information on case fatality was available for 3 different NmW epidemics (Table 5). In those
epidemics, the mean case fatality across epidemics was 8.6%. The case fatality of confirmed cases was
16.5% in the epidemic where such information was available, without specification of the causal
pathogen (Gambia, 2012). In NmA epidemics, the case fatality of suspected cases was 3.9% (Table 6). It
was 13.5% for confirmed cases in the only study where available, with pathogen-specific values of 46.7%
for Spn and 7.4% for Nm (all being of serogroup A). No case fatality was recorded for Hib cases in this
study. The span of case fatality values is wide and may also depend on the quality of the underlying
surveillance and healthcare systems, as well as the virulence of the strains involved.
Limitations: Very limited information is available on the outcome of confirmed cases, overall and by
pathogen (Hib in particular) regardless of the data source.
Table 5. Case fatality of confirmed meningitis cases during NmW epidemics
Country, year Case fatality of suspected cases Case fatality of confirmed cases** Pathogen-specific mortality Data source
Burkina Faso, 2002 1510/13124=12% n/a n/a (Bertherat, Yada et al. 2002)
Gambia, 2012 36/469=8%* 14/85= 16.5% n/a (Hossain, Roca et al. 2013)
Niger, 2011 1260/22046=5.7% n/a n/a (Collard, Issaka et al. 2013)
Mean (SD) 8.6% (3.2%) 16.5% (one epidemic) n/a
Median (Range) 8% (5.7-12%) - n/a
*confirmed and suspected cases (Hossain, Roca et al. 2013)
**details by pathogen were not available in all instances
Table 6. Case fatality of meningitis cases during NmA epidemics
Country, year Case fatality of suspected
cases
Case fatality of confirmed
cases**
Pathogen-specific
mortality
Data source
Burkina Faso, 2006 n/a 13/96=13.5% NmA: 6/81=7.4%
Spn: 7/15=46.7%
Hib: 0%
(Sie, Pfluger et al. 2008)
Niger, 2009 561*/13357= 4.2% n/a n/a (Collard, Maman et al. 2011)
Nigeria, 2008 306/8616=3.6% n/a n/a (Akhimien and Akpan 2010)
Mean (SD) 3.9% (0.4%) 13.5% (one study) NmA: 6/81=7.4%
Spn: 7/15=46.7%
Hib: 0%
(one study)
Median (Range) 3.9% (3.6-4.2%) - -
*numerator estimated to 561 based on provided mortality and denominator
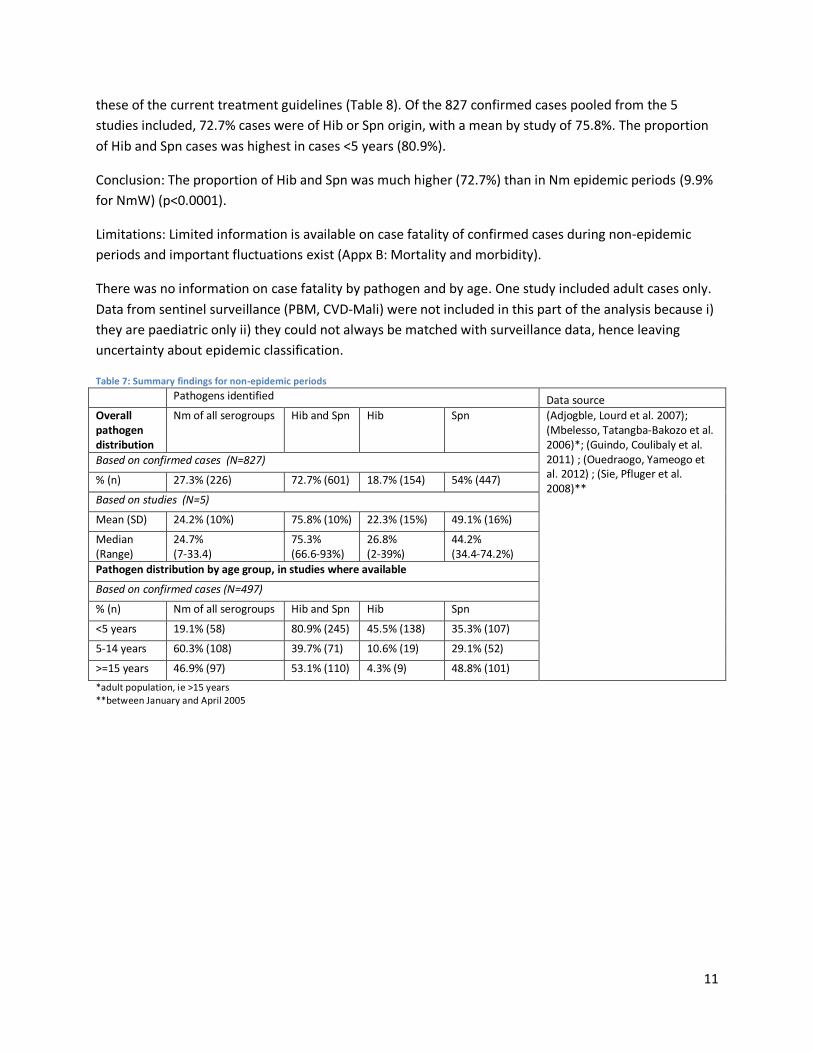
5. Non-epidemic periods
The events included represent endemic data with seasonal fluctuations without crossing of the epidemic
threshold as currently defined and rely on published studies, where age groups could not be matched to
11
these of the current treatment guidelines (Table 8). Of the 827 confirmed cases pooled from the 5
studies included, 72.7% cases were of Hib or Spn origin, with a mean by study of 75.8%. The proportion
of Hib and Spn cases was highest in cases <5 years (80.9%).
Conclusion: The proportion of Hib and Spn was much higher (72.7%) than in Nm epidemic periods (9.9%
for NmW) (p<0.0001).
Limitations: Limited information is available on case fatality of confirmed cases during non-epidemic
periods and important fluctuations exist (Appx B: Mortality and morbidity).
There was no information on case fatality by pathogen and by age. One study included adult cases only.
Data from sentinel surveillance (PBM, CVD-Mali) were not included in this part of the analysis because i)
they are paediatric only ii) they could not always be matched with surveillance data, hence leaving
uncertainty about epidemic classification.
Table 7: Summary findings for non-epidemic periods
Pathogens identified Data source
Overall pathogen distribution
Nm of all serogroups Hib and Spn Hib Spn (Adjogble, Lourd et al. 2007); (Mbelesso, Tatangba-Bakozo et al. 2006)*; (Guindo, Coulibaly et al. 2011) ; (Ouedraogo, Yameogo et al. 2012) ; (Sie, Pfluger et al. 2008)**
Based on confirmed cases (N=827)
% (n) 27.3% (226) 72.7% (601) 18.7% (154) 54% (447)
Based on studies (N=5)
Mean (SD) 24.2% (10%) 75.8% (10%) 22.3% (15%) 49.1% (16%)
Median (Range)
24.7% (7-33.4)
75.3% (66.6-93%)
26.8% (2-39%)
44.2% (34.4-74.2%)
Pathogen distribution by age group, in studies where available
Based on confirmed cases (N=497)
% (n) Nm of all serogroups Hib and Spn Hib Spn
<5 years 19.1% (58) 80.9% (245) 45.5% (138) 35.3% (107)
5-14 years 60.3% (108) 39.7% (71) 10.6% (19) 29.1% (52)
>=15 years 46.9% (97) 53.1% (110) 4.3% (9) 48.8% (101)
*adult population, ie >15 years **between January and April 2005

12
GRADE Evidence Profile
Quality assessment Summary of findings: Proportion of Spn and Hib in NmA cf NmW and NmX epidemics
Design Limitations Inconsistency Indirectness Imprecision Publication
bias Combined % Spn and Hib in Nm epidemics
NmA epidemics Overall % (95% CI)
NmW/X epidemics Overall % (95% CI)
Difference *
(NmW/X-NmA)
Certainty of the evidence
Importance
Surveillance
data and
literature
review
No serious
limitations
Serious
inconsistency
(wide
variability
between
studies)
Serious
indirectness
(changing
epidemiolog
y, changing
vaccination
status)
No Serious
imprecision
Serious risk
of bias
(towards
reporting of
larger
epidemics;
All ages** 12.9% (8.6-19.1%)
(n=1874)
9.9% (6.9-14.0%)
(n=1924)
-3.0%
VERY LOW
2-23 months
19%*** (7-41%) (n=21)
22.4% (11-39%) (n=184)
3.4%
VERY LOW
2-4 years 7.1%*** (1-24%) (n=28)
8.4% (3-20%) (n=261)
1.3%
5-14 years 6.3%***
(2-14%) (n=79)
6.4%
(3-12%) (n=483)
0.1%
15-29 years 0%*** (0-11%)
( n=39)
10.1% (5-17%)
(n=111)
10.1%
>=30 years 0%*** (0-32%) (n=10)
24.5% (12-42%)
(n=43)
24.5%
Adverse effects of 5 days ceftriaxone
Not considered serious
IMPORTANT
*No differences statistically significant
** Different numerators and denominators used for all age analysis and for those with age breakdown according to availability of age specific data.
*** Only one study

13
Acknowledgements
We are most grateful to the following individuals for providing data to support the PICO 1 and 3
questions (in alphabetical order of first name):
(If by error your name was omitted from this list or misspelled, please mention it and accept our sincere
apologies)
Abdinasir Abubakar World Health Organization (WHO), Country Office (CO) South Sudan
Bradford D. Gessner Agence de Médecine Préventive (AMP) France
Brian Greenwood London School of Hygiene and Tropical Medicine (LSHTM) UK
Chantal Kambire-Diarra WHO, CO Burkina Faso
Clement Lingani WHO - Inter country support team for West-Africa (IST-WA) Burkina Faso
Daouda Coulibaly Ministry of Health Cote d’Ivoire
Denis Kandolo WHO - IST-WA Burkina Faso
Dominique Caugant National Institute of Public Health (NIPH) Oslo Norway
Emmanuel Musa WHO, CO Nigeria
Florence Fermon Medecins Sans Frontières (MSF) France
Jahangir Hossain Meningitis Research Council (MRC) Gambia
Jean Marc Collard Institute of Public Health Belgium
Marc LaForce Serum Institute of India USA
Matthew Coldiron EpiCentre /MSF France
Rasmata Ouedraogo -Traoré on behalf of DLM
MoH Burkina Faso
Ryan Novak CDC USA
Sally-Ann Ohene WHO Ghana
Samba Sow CVD Mali
Sylvestre Tiendrebego UNICEF/WCARO Mali

14
References
Adjogble, K. L. S., M. Lourd, et al. (2007). "The epidemiology of Neisseria meningitidis meningitis in Togo during 2003-2005." Vaccine 25(SUPPL. 1): A47-A52.
Akhimien, M. O. and H. H. Akpan (2010). "An outbreak of Cerebrospinal meningitis in Jigawa state Nigeria 2009." 14: e65.
Bertherat, E., A. Yada, et al. (2002). "First major epidemic caused by Neisseria meningitidis serogroup W135 in Africa?. [French]
Premiere epidemie de garnde ampleur provoquee par Neisseria meningitidis W135 en Afrique?" Med Trop (Mars) 62(3): 301-304.
Collard, J., B. Issaka, et al. (2013). "Epidemiological Changes in Meningococcal Meningitis in Niger from 2008-2011 and the impact of vaccination." BMC Infect Dis 13(576): 1186/1471-2334-13-576.
Collard, J. M., Z. Maman, et al. (2011). "Microbiological and epidemiological investigation of the Neisseria meningitidis serogroup A epidemic in Niger in 2009: last wave before the introduction of the serogroup A meningococcal conjugate vaccine?" Epidemiol Infect 139(11): 1656-60.
Guindo, I., A. Coulibaly, et al. (2011). "[Clones of Neisseria meningitidis strains in Mali]." Med Mal Infect 41(1): 7-13.
Hossain, M. J., A. Roca, et al. (2013). "Serogroup W135 meningococcal disease, The Gambia, 2012." Emerg Infect Dis 19(9): 1507-10.
Mbelesso, P., A. Tatangba-Bakozo, et al. (2006). "Bacterial meningiditis in adult patients in Central African hospitals. [French]
Les meningites bacteriennes de l'adulte en milieu hospitalier centrafricain." Bulletin de la Societe de Pathologie Exotique 99(4): 261-263.
Njanpop-Lafourcade, B. M., S. Hugonnet, et al. (2013). "Mobile microbiological laboratory support for evaluation of a meningitis epidemic in Northern Benin." PLoS One 8(7): e68401.
Ouedraogo, S. M., T. M. Yameogo, et al. (2012). "[Acute bacterial meningitis with soluble antigen detected by latex particle agglutination tests at the Souro-Sanou University Hospital of Bobo-Dioulasso (Burkina Faso)]." Med Sante Trop 22(4): 412-6.
Savadogo, M., N. Kyelem, et al. (2013). "[The Neisseria Meningitidis W135 epidemic in 2012 in Burkina Faso] " Bull Soc Pathol Exot.
Sie, A., V. Pfluger, et al. (2008). "ST2859 serogroup A meningococcal meningitis outbreak in Nouna Health District, Burkina Faso: a prospective study." Trop Med Int Health 13(6): 861-8.
Tall, H., S. Hugonnet, et al. (2012). "Definition and characterization of localised meningitis epidemics in Burkina Faso: a longitudinal retrospective study." 12(1): 2.


![NEI 08-01 Revision 4, 'Industry Guideline for the ITAAC ... · NEI 08-01 [Revision 4] Nuclear Energy Institute . Industry Guideline for. the ITAAC Closure Process Under . 10 CFR Part](https://static.fdocuments.in/doc/165x107/5ff9965d1e3e2901d2267f2a/nei-08-01-revision-4-industry-guideline-for-the-itaac-nei-08-01-revision.jpg)