Report: Dubai Clinical Services Capacity Plan 2015- … Dubai Clinical Services Capacity Plan 2015-...
94
Report: Dubai Clinical Services Capacity Plan 2015- 2025 CORPORATE EXCELLENCE DEPARTMENT 27/11/2014
Transcript of Report: Dubai Clinical Services Capacity Plan 2015- … Dubai Clinical Services Capacity Plan 2015-...
Report: Dubai Clinical Services Capacity Plan 2015- 2025
CORPORATE EXCELLENCE DEPARTMENT 27/11/2014

Dubai Clinical Services Capacity Plan 2025/ Version 2
CORPORATE EXCELLENCE DEPARTMENT
1
ACKNOWLEDGEMENT The Dubai Clinical Services Capacity Plan (DCSCP) is a periodic study, conducted for the first time in
2012-2013, to understand the current healthcare sector, the demand, supply of services and existing
gaps. The study was administered across government and private sectors in Dubai. The collected data
was validated and analyzed to develop a comprehensive report that is an integral tool in planning for the
Dubai healthcare sector until 2025
The DCSCP was developed by the Policy and Strategy Department (currently Corporate Excellence
Department), Dubai Health Authority (DHA) but executed collaboratively by DHA and TAHPI, an
experienced health planning firm. This report is based on a robust and detailed survey of the current
facilities as well as a systematic analysis of the future demand.
The DCSCP and its results have been tested with stakeholder consultations and collaboration.
Schedules and details of meetings and consultations conducted throughout the course of the project are
described in the Appendices.
Sincere gratitude and appreciation goes to the public and private facilities and other stakeholders for
their cooperation in providing information to the surveyors, filling out the survey forms and actively
participating and providing feedback during the consultation workshops and the initial presentation of the
results.
The authors of this report recommend its adoption as a fundamental basis for health sector strategy and
its implementation. It is also recommended that this document be regarded as live, subject to updates
every three years in order to align with prevailing conditions, changes to the healthcare industry,
technology and Government policy including the implementation of Mandatory Health Insurance.

Dubai Clinical Services Capacity Plan 2025/ Version 2
CORPORATE EXCELLENCE DEPARTMENT
2
READING THIS REPORT This is the Final Report emerging from the work done as part of the DCSCP by the former Policy &
Strategy Department, Dubai Health Authority, and Government of Dubai in 2012 - 2013.
The objectives of this report include:
Highlighting the current supply of health services in Dubai
Presenting the projected demand of health services over the next period, from 2014 to 2025,
Broadly identifying the areas that require more detailed studies and planning to close gaps in
infrastructure and healthcare workforce
The report has been structured into 7 main chapters within which relevant sections have been
developed:
Chapter One – Introduction
This chapter describes the rationale and the framework for conducting the DCSCP, the main objectives
and the benefits that can be realized. It also highlights the critical success factors that have been vital to
the successful completion of the study
Chapter Two – Background & Context
This chapter includes a description of the current Dubai environment and geography, including its health
care sector, population and health status. The implications of introducing Mandatory Health Insurance
(MHI) are described and it further highlights the general assumptions and areas out of scope for the
DCSCP Study
Chapter Three – Approach & Methodology
The chapter describes the methodology used to conduct the supply and demand assessment, as well as
give an understanding of the areas focused on to identify gaps for development. The chapter further
defines key terminology used in the report and describes in detail the status quo and MHI scenarios
used to project demand

Dubai Clinical Services Capacity Plan 2025/ Version 2
CORPORATE EXCELLENCE DEPARTMENT
3
Chapter Four – Findings & Analysis
This chapter contains the descriptions and implications of the survey results. This has been structured
into two main areas: health infrastructure, including major medical equipment, and health manpower to
allow for a clearer understanding of the current supply. The demand projections have been shown to the
period of 2025 for the same areas
Chapter Five – Gap Analysis
The chapter describes the priorities that will need development within infrastructure and manpower to
accommodate Dubai’s health requirements to year 2025 as per the two scenarios, status quo and MHI
Chapter Six - Sensitivity Analysis
This chapter shows the change in demand for health services that can occur with a change in the
assumptions, to understand the variance in demand in the case of unexpected change in the healthcare
sector and Dubai’s socio-economic status
Chapter Seven - Conclusions & Recommendations
This chapter summarizes the results and implications on future developments in infrastructure and
manpower for the Dubai health sector. It further outlines the recommended actions to be undertaken to
meet projected demands in an efficient and effective manner

Dubai Clinical Services Capacity Plan 2025/ Version 2
CORPORATE EXCELLENCE DEPARTMENT
4
CONTENTS
ACKNOWLEDGEMENT .................................................................................................................. 1
READING THIS REPORT ................................................................................................................ 2
1 INTRODUCTION .................................................................................................................. 5
2 BACKGROUND & CONTEXT ............................................................................................. 8
3 APPROACH & METHODOLOGY ..................................................................................... 13
4 FINDINGS & ANALYSIS ................................................................................................... 27
5 GAP ANALYSIS ................................................................................................................ 64
6 SENSITIVITY ANALYSIS .................................................................................................. 81
7 CONCLUSIONS & RECOMMENDATIONS ...................................................................... 85
Dubai Clinical Services Capacity Plan 2025/ Version 2
5
The Dubai Clinical Services Capacity Plan brings together the collaborative efforts of the Dubai Health Authority to create a detailed and practical planning resource that will support the development of the Dubai health sector with efficiency and effectiveness, while providing comprehensive and quality services to the community
1 INTRODUCTION
1.1 Imperative
The planning study has been designed, conducted and used to achieve specific strategic objectives
and initiatives as outlined by the Dubai Health Sector Strategy:
− Develop a comprehensive Dubai Clinical Services Capacity Plan that includes detailed, evidence-
based projections of supply and demand for medical and allied health services in the Emirate of
Dubai until 2025
− Define, on the basis of the Dubai Clinical Services Capacity Plan, relevant volume-quality
thresholds for particular services and specialties and integrate these with regulatory oversight and
health planning processes
− Improve the spatial distribution of primary healthcare facilities by identifying geographic gaps and
facilitating the development of primary healthcare services in convenient, accessible locations by
both public and private sectors
− Facilitate private investment in primary healthcare services by publishing information on
geographic service gaps in Dubai, especially in newly-developed residential areas

Dubai Clinical Services Capacity Plan 2025/ Version 2
6
1.2 DCSCP Framework
The DCSCP framework is inclusive in identifying the current healthcare environment (supply),
projecting the need for services (demand) and using the data and information to develop practical
plans for the future as depicted in figure 1 below.
1.3 Objectives
The objectives of the Dubai Clinical Services Capacity Plan are to:
− Assess the current supply of clinical service capacity
− Assess the clinical service capacity approved for development
− Project the demand for clinical service capacity through 2025 taking account of the Dubai’s
resident population and visitors using health service in Dubai from other United Arab Emirates and
from abroad (i.e. medical tourists)
− Develop scenarios to assess the impact of the introduction of MHI on demand for health service
capacity
− Assess the gap in the supply of clinical service capacity for each scenario
− Identify the priorities and strategies from 2015to 2025 for the development of clinical services
− Produce an investment guide for clinical service capacity development
Figure 1: DCSCP Framework
SUPPLY Identify existing health services in Dubai, including facilities that belong to MOH, DHA, DHCC and private sector (response rate 77%)
DEMAND Project the demand
of health services over the next period
on two scenarios: Status Quo & MHI
PLAN Develop efficient planning
mechanisms to close the gaps in infrastructure and
health workforce

Dubai Clinical Services Capacity Plan 2025/ Version 2
7
1.4 Critical Success Factors & Key Benefits
In responding to these objectives the following critical success factors have been considered to ensure
that the associated key benefits are achieved (see figure 2):
• Investment opportunities – direction for
public and private investment in primary,
secondary, tertiary healthcare services to
fill gaps
• Resource alignment - proper utilization of
current beds & developing low cost
programs versus establishing new
hospitals
• Economic solutions – allows practical
forecasting and planning for more
efficient spending by health care
providers
• Regulatory impact – Health Regulation
entities in Dubai will have clear guidance
in licensing of health professionals and
health facilities according to actual needs
• Medical & Health Education impact
Medical and Health education institutes
will have clear guidance in education
priorities and capacity needed over the
years
• Stakeholder cooperation -
involvement of key stakeholders
across government and private
entities is essential to develop a
practical and relevant plan
• Data collection – accuracy and
availability of data is important in
forming basic assumptions and
developing scenarios
• Planning module – timely
responses and concentrated effort
to develop and refine the planning
module so it reflects the Dubai
environment
• Reports & Updates - the study is
updated periodically to reflect on
the current environment
CRITICAL SUCCESS FACTORS CRITICAL SUCCESS FACTORS
KEY BENEFITS
Figure 2: Factors & Benefits
Dubai Clinical Services Capacity Plan 2025/ Version 2
8
2 BACKGROUND & CONTEXT
2.1 Dubai’s Healthcare Sector
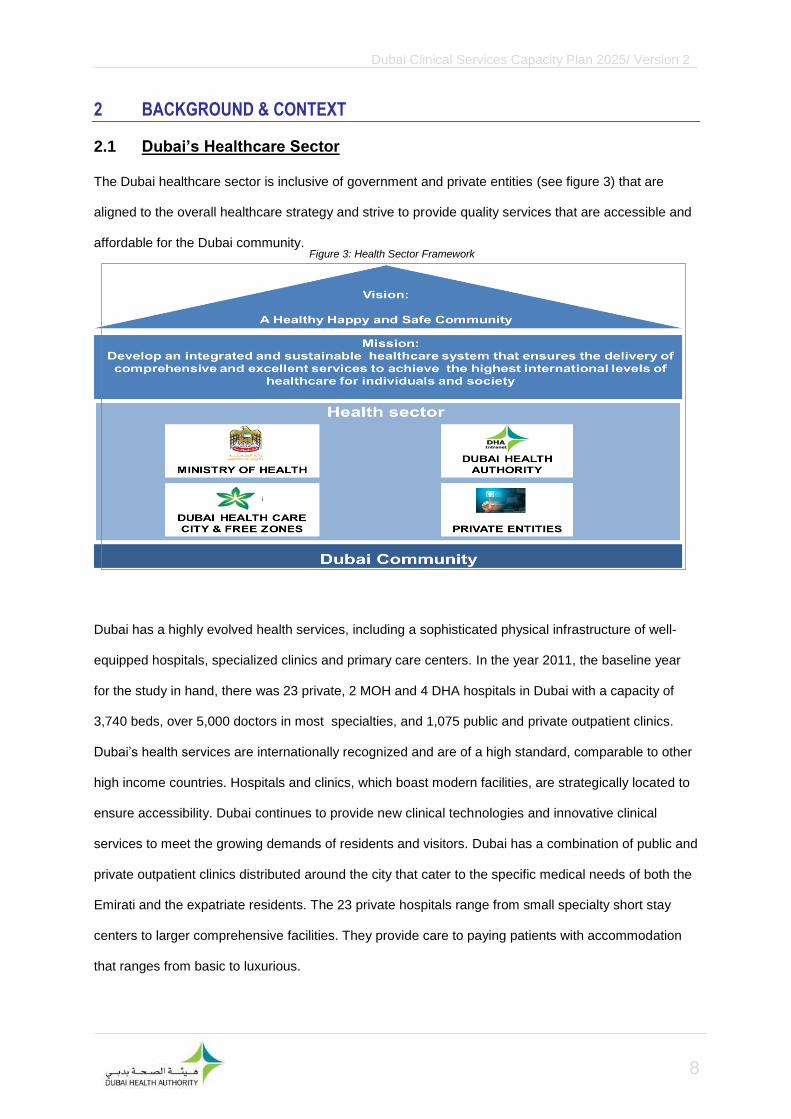
The Dubai healthcare sector is inclusive of government and private entities (see figure 3) that are
aligned to the overall healthcare strategy and strive to provide quality services that are accessible and
affordable for the Dubai community.
Dubai has a highly evolved health services, including a sophisticated physical infrastructure of well-
equipped hospitals, specialized clinics and primary care centers. In the year 2011, the baseline year
for the study in hand, there was 23 private, 2 MOH and 4 DHA hospitals in Dubai with a capacity of
3,740 beds, over 5,000 doctors in most specialties, and 1,075 public and private outpatient clinics.
Dubai’s health services are internationally recognized and are of a high standard, comparable to other
high income countries. Hospitals and clinics, which boast modern facilities, are strategically located to
ensure accessibility. Dubai continues to provide new clinical technologies and innovative clinical
services to meet the growing demands of residents and visitors. Dubai has a combination of public and
private outpatient clinics distributed around the city that cater to the specific medical needs of both the
Emirati and the expatriate residents. The 23 private hospitals range from small specialty short stay
centers to larger comprehensive facilities. They provide care to paying patients with accommodation
that ranges from basic to luxurious.
Figure 3: Health Sector Framework

Dubai Clinical Services Capacity Plan 2025/ Version 2
9
Implication of Health Insurance Law of Dubai
The Government of Dubai issued the Health Insurance Law 11 of 2013. The Health Insurance Law is
being implemented by DHA in three phases for Dubai Nationals and Residents; and the plan is to have
the universal coverage by mid-2016. The mandatory coverage provides an essential benefit package
for residents, and emergency care for visitors. Insurance coverage can be purchased from the private
insurers so long as it fulfills the mandated basic requirements. Dubai Government will provide
coverage for the Nationals. The Law mandates employers to provide coverage to employees, while
employees sponsoring their families or additional persons have to provide coverage to any person
they sponsor if not provided by their employer.
The new health insurance law determine the level of services mandated, the rights and responsibilities
of the various stakeholders in the new model, the information requirements, consumer protection
clauses, and the regulations and regulatory functions related to health insurance.
The Status Qu Scenario (SQ) indicates the demand for healthcare in the absence of the mandatory
health insurance (MHI), and it uses the data prior to the Law. At the time of this study, we could not
identify a study that measured the effect of introducing a mandatory health insurance on the utilization
of services, except for Abu Dhabi Emirate. The data from Abu Dhabi shows the utilization pattern
before and after the introduction of mandatory health insurance. Our team used this data as a
benchmark for general and specialized healthcare services. Therefore, we included the Status Qu
Scenario in this study to help policymakers in other jurisdictions – to plan the needed adjustments as a
result of introducing mandatory health insurance in their countries. in Dubai, the SQ scenario should
only be used for comparison, while the MHI scenario data is the one to be used for planning purposes.
2.2 Dubai’s Population Profile
Mid 2013 Dubai population is estimated at 2,158,740; with 88% expatriates and 12% UAE Nationals
(based on Dubai Statistics Center population projections). The official scenario, as per The Executive
Council (TEC) projects a 5.3% increase in population until 2015 and a 7.4% increase, between 2015
to 2020. The 7.4% increase has been assumed to continue until 2025. The structure of the Dubai
population is predominantly males in the young, working age groups.

Dubai Clinical Services Capacity Plan 2025/ Version 2
10
2.3 Dubai’s Geography
Dubai is one of the seven Emirates that constitutes the United Arab Emirates, it is located at Latitude:
25°15′07″ N and Longitude: 55°16′48″ E. It occupies an area of 4,114 Km square with a population
density of 463 persons per square kilometer. Dubai is divided into nine geographic sectors in regards
to the distribution of health services (Figure 4). Each sector has a specific mix of genders and
nationalities. Baseline data for each sector was provided by Dubai Statistics Center (DSC), DSC
Bulletins, 2004 and 2009). Nationality profiles for the sectors reveal that most sectors contain an
average 13% of UAE Nationals, except for sectors 5 and 6 which show a larger number of expatriates.
2.4 Dubai’s Health Status
The life expectancy for the total population in Dubai is 75.6 years, with a breakdown of 74.3 years for
males and 77.3 years for females (Source: Dubai Annual Health Statistical Report, 2013)
The main causes of death have been identified as cardiac diseases, cancer, respiratory diseases,
trauma and other injuries (Figure 5). Cardiovascular diseases account for 30% of deaths across the
population
Figure 4: Dubai Land Sectors
Source: Dubai Municipality
5
9
5
6
5
3
5
1
5
8
5
7
5
4
5
2
5

Dubai Clinical Services Capacity Plan 2025/ Version 2
11
The main causes of death among children under 5 (Figure 6) has been identified as Prematurity & low
birth weight, at 23%, followed by Causes originated in the neonatal period (18%) then Birth asphyxia &
respiratory failure of the newborn (16%).
The major reasons for hospital admissions in 2013 includes Pregnancies and Childbirth with any
diseases and complications associated with those events, then hematological diseases and injury &
poisoning (Figure 7)
2%
19%
30% 24%
6%
7%
12%
Figure 5: Causes of Death Registerd in Dubai 2013
SEPTICAEMIA
NEOPLASMIS
CIRCULATORY SYSTEM
OTHERS
INJURIES
PERINATAL PERIOD
RESPIRATORY SYSTEM
8% 1%
23%
1% 18% 5%
12%
16%
16%
Figure 6: Causes of Under-Five Deaths in Dubai 2013
Diseases of the Circulatory System
Pneumonia
Prematurity & low birth weight
Injuries (Post-neonatal)
Other Causes originating inperinatal periodNeonatal./post infections
Congenital anomalies
Birth asphyxia & respiratory failureof the newborn
Source: Dubai Annual Health Statistical Report, 2013, DHA
Source: Dubai Annual Health Statistical Report, 2013, DHA

Dubai Clinical Services Capacity Plan 2025/ Version 2
12
.
Source: Dubai Annual Health Statistical Report, 2013, DHA
Figure 7: Major Causes for Hospital Admission by Nationality in Dubai 2013

Dubai Clinical Services Capacity Plan 2025/ Version 2
13
3 APPROACH & METHODOLOGY
3.1 General Terms & Assumptions
The general terms and assumptions used in developing DCSCP are described below:
− Demand Planning Study: a study of a population’s requirements for health services based on
application of reference rates, trends and projections
− Supply Planning Study: a study of the health services supplied to a population in order to meet
its healthcare needs. It examines types, ranges and volumes of services as measured by activity
(admissions, outpatient occasions) and capacity (e.g. bed days) for a specific geographic area and
population
− Gap Analysis: the difference between demand and supply across two scenarios from 2011 until
2025
− Base Year(s), Planning Horizon and Intervals: the beginning year or year of a planning study.
The base year for the capacity plan is 2011. A planning horizon is the end or target time point of a
planning study. The planning horizon for the capacity plan is 2025. Intervals are standardized time
periods between the base and horizon years. The capacity plan intervals are 2015 and 2020
− Study Population: the population for which a health service is to be assessed and planned. The
supply and demand for healthcare of the study population is examined in detail and demand
projections developed for a specified period to determine gaps in supply and develop strategies for
the development and enhancement of health sector
− Study Population Catchment: the study population is further defined by geographic and
population characteristics. It is broken down into three catchments:
A Dubai catchment, where the majority of a population resides within close proximity to a
health facility. The primary catchment of DCSCP is the Emirate of Dubai segmented into its 9
sectors
Other UAE catchment is a population in surrounding distant localities where referrals may be
expected to flow into primary catchment areas. It is composed of the following emirates:
Abu Dhabi
Sharjah
Ajman
Umm Al-Quwain
Dubai Clinical Services Capacity Plan 2025/ Version 2
14
Ras Al-Khaimah
Fujairah
A regional/international catchment is defined as populations in surrounding states or
countries where referrals may be expected to flow into primary catchment areas. These
referral flows are usually due to specialized or lower cost services being available in the Dubai
catchment comparatively
− Western Asia: according to the World Health Organization, the UAE is situated in the Western
Asia Region. The region is composed of the following countries: Bahrain, Cyprus, Iraq, Jordan,
Kuwait, Lebanon, Occupied Palestinian Territory, Oman, Qatar, Saudi Arabia, Syrian Arab
Republic, Turkey, United Arab Emirates, and Yemen. (WHO, 2008)
− Reference Population: this is the population of a state, country or a group of countries that
represents the demand for health services. Three countries have been identified and used for
reference population demand projections, based on the following criteria:
Very good health status as measured by low mortality and disability
High socioeconomic status
Comprehensive and contemporary health service provision for all types of care
Optimal use of health care resources as measured by adequate supply of hospital beds
and health workforce
Affordable and broadly accessible healthcare within its catchments
Standard coding and classification of health statistics that can be compared against
supply statistics in the study population
Readily available and comprehensive health service statistics for a sufficient time period
to enable reliable trend estimates
The reference population countries include, Australia and United States of America for inpatient
services; and the United Kingdom, Australia and the United States of America for ambulatory and
outpatient services. Other countries such as Singapore and Hong Kong were considered but the lack
of public access to their longitudinal healthcare statistics made it a challenge to do the detailed
profiling of their services necessary to calculate appropriate and comparable per capita rates and
trends

Dubai Clinical Services Capacity Plan 2025/ Version 2
15
3.2 Out of Scope
The scope of DCSCP did not include:
− Full range of Allied Health or management and clinical support services such as pharmacies,
ambulance services and school health clinics
− The survey did not include the detail information on expenditure and revenue of healthcare
facilities
− The survey collected data on the capacity of health manpower with prime focus on physicians,
nurses and dentists, but the detailed information in regards to qualification/certification and years
of experience for the medical personnel was not in the scope of the study
− The key planned units (KPU) demand projections do not include estimates for diagnostic
technologies such as X-ray machines and pathology instruments
− The quality audit of the healthcare facilities was not in the scope of the study
3.3 Limitations
The limitations to the study include:
− Population projections are based on an exponential growth rates regardless of age, gender and
nationality composition
− Sector population projections for age, gender and nationality distributions are based on one year’s
estimates
− Supply is based on a period estimate of one year
− Clinical specialties used for hospital supply beds in the gap analysis were taken from the Dubai
Annual Health Statistical Report 2011 hospital bed profiles grouped by ICD-10 codes. These
codes were grouped into specialties and the ungrouped cases were distributed to specialties using
demand profiles on a proportional prorate basis

Dubai Clinical Services Capacity Plan 2025/ Version 2
16
3.4 Approach
A structured and systematic approach has been taken to conduct DCSCP across Dubai health sector.
This includes the key steps that are shown in figure 8 below:
3.4.1 Demand Assessment – Dubai Clinical Service Catchment Projections
Population projections
For the purpose of the current DCSCP demand assessment, population projections were calculated by
age and gender, until 2025. Dubai’s total population projected for the three scenarios is presented in
the figure 9 below. The three population scenarios differ in their growth rates, from 3% yearly growth in
the low scenario to 5.3% in the medium scenario to 7.4% yearly growth in the high scenario. The
medium scenario is used as the official projection for capacity planning. As figure 9 shows, national
and non-national proportions remain constant in all scenarios across all years
Figure 8: Step by step approach to the DCSCP
2015 2020 2025
0
1
2
3
4
5
Population (millions)
Low Medium High
Non-
National
Figure 9: Projected Growth per Scenario of National and Non-National Populations in Dubai, 2011 to 2025.

Dubai Clinical Services Capacity Plan 2025/ Version 2
17
1,000 500 0 500
0-4
10-14
20-24
30-34
40-44
50-54
60-64
70-74
80-84
Population (000)
Age
Low Variant Medium Variant High Variant
Males Females
The three different growth rates maintain the population structure of Dubai, with working age males the
most frequent group in the population, as seen in figure 10:
− Dubai’s population is estimated to be 3mn, 4.9mn, 5.6mn for the low, medium and high scenarios
respectively in 2025
− Under the three scenarios the population 0 to 14 years will constitute 9% among non-nationals
and 35% among nationals.
− Under the three scenarios the elderly population 60 and above will constitute 1% among non-
nationals and 5% among nationals.
Dubai’s population is projected to remain a predominantly young male society with high proportions of
the population in the high fertility age groups as summarized in table 1 below
Age group
% of Nationals in age group % of Non-Nationals in age group
0-14 35% 9%
15-59 61% 90%
60+ 5% 1%
Total 100% 100%
Figure10: the comparison of the three projection scenarios in
2025.
Table 1. Age Distribution Summary of Nationals and Non-Nationals in 2025
Source: DSC Population Bulletin 2011, p. 2.

Dubai Clinical Services Capacity Plan 2025/ Version 2
18
800 600 400 200 0 200
0-4
10-14
20-24
30-34
40-44
50-54
60-64
70-74
80-84
Population (thousands)
Age
Nationals Non-Nationals
400 200 0 200
0-4
10-14
20-24
30-34
40-44
50-54
60-64
70-74
80-84
Population (thousands)
Age
Nationals Non-Nationals
Population Projections for the Medium Scenario by Gender & Nationality
The medium scenario population projection series shown in the figure 11 assumes a 5.3% per annum
growth to 2015, 7.4% per annum up to 2020 and then remains constant. The growth rate is
consistently applied across all age and gender groups.
The age, gender and nationality distribution of Dubai’s population is expected to remain constant
across the planning period. Growth will be consistent with the global rates for the mid scenario
projections series
The following figures (12 and 13) contrast Dubai’s 2011 and 2025 population distribution estimates. Of
significance is the projected growth in the working aged population, particularly males. There is also
projected continuing growth in 0-14 children age groups for both males and females
1,000 750 500 250 0 250
0-4
10-14
20-24
30-34
40-44
50-54
60-64
70-74
80-84
Population (000)
Age
Males Females
Figure 12: Population Pyramid of Dubai's Population in 2011. Figure 13: Population Pyramid of Dubai's Projected Population in 2025.
Source: DSC Population Bulletin 2011, p. 2.
Figure 11: Medium Scenario Population Projections by Age and Gender, 2011 and 2025.
Source: DSC Population Bulletin 2011, p. 2.

Dubai Clinical Services Capacity Plan 2025/ Version 2
19
Reference Population
Three high income countries have been used to calculate reference population demand projections.
These include Australia (Australian Institute of Health and Welfare (AIHW), 2011-2013) and United
States of America (Agency for Healthcare Research and Quality, 1998-2010) for inpatient services and
the United Kingdom (Health and Social Care Information Centre, 2004-2011), Australia and the United
States of America (Centers for Disease Control and Prevention, 2008-2010) for outpatient services.
Reference files with a 12 year time series, 1998-2009, have been used to project age and gender
specific episode, presentation and stay period rates
*Note: Data from USA was used only to supplement other reference sources because the country
does not strictly meet the reference population selection criteria. Other countries such as Singapore
and Hong Kong were considered, but the lack of public access to their longitudinal healthcare statistics
made it unfeasible to generate the detailed profiling of their services necessary to calculate
appropriate and comparable per capita rates and trends.
Adjustments have been made to the reference population per capita rates to align them with the
Western Asia Region using Burden of Disease (BOD) rates from the World Health Organization
(WHO, 2009; WHO 2008). BOD is measured in disability-adjusted life years (DALY) which “combines
years of life lost due to premature mortality and years of life lost due to time lived in states of less than
full health” (WHO, 2008). DALY rates are reported for a selection of diagnostic classes that are
grouped into International Classification of Disease chapters. These chapters align to the Major
Diagnostic Categories of DRGs.
Ratios are calculated by dividing the Western Asia BOD rates by the BOD rates of high income
countries for age, gender and diagnostic groups. They have been adjusted using a square root
trimming technique to reduce the effect of DALY classes with highly scenario ratios. The ratios are
then applied to the reference population rates to redistribute the DRG per capita rates and align them
with Western Asia adjusted BOD DALY rate distributions
Case mix based regression projections to 2025 are estimated for the populations of each study
catchment by applying the BOD adjusted age and gender specific rates of the reference data sets to
the study population projections for each catchment. A mid scenario population projection series for
each study catchment was combined and linked with the reference rates to calculate Infrastructure and
Manpower capacity projections

Dubai Clinical Services Capacity Plan 2025/ Version 2
20
Reference rates are derived from representative countries for ten years, grouped by DRGs (or
equivalents), age and gender. The reference rates have been projected using a mixture of regression
techniques for future time periods in five year intervals up to 2025. Regression equations for the
projections are selected using tests of goodness of fit.
The projected per capita reference rates are
multiplied by the equivalent age and gender group
population projections for a study population and
converted into Key Planning Units for the estimation
of capacity projections. The projections have been
grouped into the following clinical service capacity
categories, shown in table 2:
Service types have been further broken down into the following Clinical Service Specialties, shown in
table 3:
Allied Health Care Immunology & Infections
Primary Care & General Practice Interventional Cardiology
Breast Surgery Medical Oncology
Cardiology Neonates (Newborn Care)
Cardiothoracic Surgery Neurology
Chemotherapy Neurosurgery
Colorectal Surgery Obstetrics
Dentistry Ophthalmology
Dermatology Orthopedics
Diagnostic GI Endoscopy Pain Management
Drug & Alcohol Plastic Surgery
Endocrinology Psychiatry
Extensive Burns Renal Dialysis
ENT Respiratory Medicine
Gastroenterology Rheumatology
General Medicine Transplantation
General Surgery Ungrouped
Gynecology Upper GIT Surgery
Hematology Urology
Head & Neck Surgery Vascular Surgery
Acute Inpatient Care
Non-Acute Inpatient Care
Pediatric Care
Obstetric And Newborn Care
Ambulatory And Outpatient Care
Intensive Inpatient Care
Emergency Department Care
Operating Theaters And Procedural Care
Table 2: Clinical service capacity categories
Table 3: Clinical Service Specialties

Dubai Clinical Services Capacity Plan 2025/ Version 2
21
Manpower Categories
Separate projections were constructed for manpower using variance adjusted per capita rates for high
income countries converted to full time equivalents. The manpower categories defined are Dentistry,
Nursing, Medical, Allied Health and Management and Support. Table 4 shows medical categories
segregated into the following clinical specialties:
Primary Care & General Practice Orthopedic Surgery
Anesthesia & Intensive Care Medical Oncology
Psychiatry Intensive Care
Pediatrics and Child Health Nephrology
General Surgery Otolaryngology
Cardiology Endocrinology
Emergency Medicine Geriatric Medicine
Other Surgery Neurology
Gastroenterology and Herpetology Dermatology
Obstetrics and Gynecology Clinical Pathology
Radiology Plastic Surgery
Ophthalmology General Medicine
Key Planning Units (KPU)
Key Planning Units (KPU) have been defined for infrastructure and manpower capacity units. The
following two tables (5 & 6) describe the infrastructure KPUs used for the DCSCP.
KPU Setting Capacity Measure
Admitted Acute Overnight Beds
Admitted Non-Acute Beds
Same day Surgery Beds/Chairs
Same day Medicine Beds/Chairs
Renal Dialysis Chairs
Intensive Care Beds
Emergency Department Cubicles/Rooms
Operating Theaters Rooms
Outpatients Rooms
Table 4: Clinical Specialties for manpower categories
Table 5: Infrastructure KPUs

Dubai Clinical Services Capacity Plan 2025/ Version 2
22
All workforce categories are estimated by Full Time Equivalents (FTEs). An FTE is the number of
working hours that represents one full-time employee during a fixed time period. FTE simplifies work
measurement by converting work load hours into the number of people required to complete that work
KPU Setting Capacity Measure
Dentistry
Full Time Equivalent (FTE)
Nursing
Medical
Allied Health
Management and Support
Assumptions used for the Demand Assessment
− The reference population is representative of demand for clinical services in Dubai and its
surrounding catchments
− BOD adjustments accurately represent disease and clinical service demand patterns in Dubai and
its surrounding catchments
− The clinical practices and outcomes of the reference population illustrate utilization and clinical
distribution profiles that can be achieved in Dubai clinical services
− The services excluded from the scenario modeling will not be included under Mandatory Health
Insurance
− DRG based age and gender specific per capita rates are the best available method for projecting
future clinical service capacity demand
− Key Planning Unit measures are sufficient to define and measure clinical service capacity
Table 6: Manpower KPUs

Dubai Clinical Services Capacity Plan 2025/ Version 2
23
3.4.2 Supply Assessment – Survey of Existing Clinical Services
Supply is the total amount of a service that is available for use by a customer. Supply is defined in this
study as the clinical services reported by survey respondents as being available at their facility.
The survey was deployed to enable data collection via electronic and paper based forms. The purpose
of the survey was to collect clinical services infrastructure and manpower data
Six individually tailored survey forms were developed and deployed in the following clinical service
facilities:
− Hospitals
− Polyclinics
− Dental Clinics
− Specialty Clinics
− Primary Health Clinics
Specific questions varied according to the type of facility being surveyed, and included the following
categories:
− Name, address, lot number, contact details and establishment details
− Operating hours and appointment process
− Transport and car parking information
− Full time equivalent for major clinical manpower categories
− Inpatients, outpatients, including surgeries performed
− Nationality and residency of patients
− Clinical services including sub-specialties according to:
Personnel by key manpower categories (specialists and consultants)
Bed occupancy rate and average length of stay
Total admissions (inpatient) and outpatient visits
− Number of operating theater rooms
− Number of functional and non-functional beds
− Accident and Emergency resources
− Health Informatics
− International Classification of Diseases and Procedure coding used
− Major medical equipment

Dubai Clinical Services Capacity Plan 2025/ Version 2
24
Separate survey techniques were used for Hospitals and Outpatient Clinics that included a
combination of telephone interviews and facility visits. A team of eight surveyors were engaged in the
collection of data, 5 for telephone surveys and 3 for face to face hospital surveys
Hospital Surveys
Each hospital was visited by a surveyor who distributed the survey forms to a senior hospital executive
team. All contents of the survey form were explained and clarifications provided on request. A two
week period was allowed for hospitals to complete the survey forms and return them, electronically or
as a hard copy.
A more detailed, sub-module of the survey was conducted at Rashid hospital to identify the number of
chronic patients (patients who have stayed for longer than 30 days) occupying acute beds, to
categorize them by type of extended healthcare services needed (homecare services, long-term
healthcare facilities, sending expatriates home with supportive aids).
Outpatient Clinic Surveys
Outpatient clinic surveys were conducted by telephone interview at a scheduled time. A follow up
interview was scheduled if a respondent was not available or they required time to gather information.
Further follow up was under-taken after a detailed review of each survey to ensure data requests were
completed
Data Entry, Review and Analysis
Returned surveys were stored in a Health Facility Briefing System (HFBS) and were reviewed using an
automated survey tool. The returned forms were examined to identify inconsistencies and missing
data. The survey forms were checked to correct inconsistencies and/or collect missing data. This
procedure was repeated up to 5 times to increase response rates and accuracy of data. Detailed
elements in all surveys were examined to identify missing data and specific survey responses were
weighted by a facility specific correction factor to complete population estimates
In cases where data was not sufficiently reported in the surveys, DHA official statistics were used to
supplement estimates. Two areas of clinical supply were specifically supplemented and blended with
additional data:

Dubai Clinical Services Capacity Plan 2025/ Version 2
25
− Overnight bed estimates for clinical specialties where hospital respondents did not differentiate
their beds by specialty
− Numbers of Physicians by specialties were reconciled with previously published information
Data were formatted into spreadsheet pivot tables for supply summations and capacity gap analysis
Planned Future Health Facilities
A sub-module survey of planned health facilities was also conducted. This information was gathered
from DHA’s Health Regulation Department, market intelligence and direct contact with prospective
providers
Assumptions Used for the Supply Assessment
− The response rate of the survey (77%) is sufficient to provide reliable supply estimates for non-
responding facilities, after adjustment
− Respondents uniformly and correctly understood the terminology and classifications used in the
survey forms. Effort was spent on clarifying the survey forms with all facilities
3.4.3 Gap Assessment – Dubai Clinical Service Catchment Assessment
Supply and planned capacity growth estimates were compared against two scenario’s demand
projections ( ref chapter 4) to quantify the gaps in supply. The assessment covered each service type
and manpower classification for Dubai’s clinical service catchment as distributed by sectors. A detailed
service specialty gap analysis was provided for clinical specialty beds and medical manpower

Dubai Clinical Services Capacity Plan 2025/ Version 2
26
Assumptions used for Gap Assessment
− The following services were excluded from the demand profile of each scenario because they will
not be covered by MHI:
Abortions
Bone marrow and organ transplants
Sports related injuries
Long term mental health care
Alcohol and Drug abuse related conditions
Plastic Surgery for cosmetic purposes, (it is added to the gap assessment in the update
in hand, after the approval of Medical Tourism Strategy (MTS) which identified plastic
surgery as one of seven specialties to be promoted in phase one of the implementation
of MTS (2013-2020))
− It was assumed that Intensive Care KPU and the Dental and Oral Health services manpower
demand will not be significantly impacted by scenario differences. The SQ and MHI scenarios are,
therefore, equivalent for these indicators.
3.4 Review of Findings – Stakeholder consultations
Key stakeholders workshops were held periodically throughout the study with government and private
clinical services sectors. These consultations were carried out to confirm and validate findings, report
on study progress, results and agree on assumptions
3.5 Recommendations & Priority Setting
Priorities have been set as per the identified gaps in healthcare services for the period 2014 until 2025
based on the rating given below in figure 14:
High Priority with greater than a 10% deficit in total supply gap
Medium Priority with greater than or equal to a 3% deficit in total supply gap
Low Priority with less than a 3% deficit in total supply gap
A recommendation matrix was developed using a Priority, Recommendation and Action
Framework
Figure 14: Rating definition

Dubai Clinical Services Capacity Plan 2025/ Version 2
27
4 FINDINGS & ANALYSIS
4.1 Demand
Two scenarios were developed to identify Dubai’s demand for clinical capacity until 2025: namely the
Status Quo (SQ) Scenario and the Mandatory Health Insurance (MHI) Scenario. As presented in this
chapter, these scenarios utilize the medium population growth as a population base for calculating the
demand till 2025. Both scenarios were adjusted for specific local conditions, including; Burden of
Disease, Doctor Availability, Geographic Location, Socio-economic Status, Life Expectancy and
Hospital Bed Supply as well as the trends in the service delivery models. The only period where the
high population scenario is used in this report is 2015-2020 to accommodate for Expo 2020 and the
first two phases of the Medical Tourism Strategy (the full DCSCP will be repeated before the year
2020 to accommodate for the third phase of the MTS.
4.1.1 Status Quo Scenario (SQ): The Status Quo scenario (assuming absent of mandatory health
insurance) assumes that the same proportion of nationals and non-nationals will access clinical
services, i.e. the healthcare utilization levels among the population will remain same in the future
period, as in 2011, but the population size will grow as per three defined growth rate scenarios.
4.1.2 Mandatory Health Insurance Scenario (MHI): The MHI assumes that the proportion of
nationals and non-nationals accessing healthcare in Dubai will increase leading to an increase in the
level of utilization of healthcare services.
4.1.3 Total Demand for KPUs by SQ and MHI Scenarios
Table 7 summarizes the demand projections for Status Quo and MHI demand scenarios. KPU
projections by these two demand scenarios contrast the differences in demand for Beds, Outpatient
Rooms and Operating Theaters, while ICU demand is assumed to be unchanged. Emergency
Department demand is projected to be lower under MHI compared to the SQ as more patients use
outpatient centers for treatment as needed.

Dubai Clinical Services Capacity Plan 2025/ Version 2
28
Total KPU demand is projected to increase from 5,450 in 2011 to 11,997 in 2025 under the SQ and
from 6,926 to 15,394 under the MHI. Overall the difference between the two demand scenarios for
total KPU ranges from 27% in 2011 to 34% in 2025. More hospital beds are projected under the MHI
scenario
Table 8 below shows demand for each scenario by sectors
− Projected demand is greatest in sectors 1, 3 and 5, which are projected to account for 75% of
demand in 2025
− Within sectors, projected demand is consistently greatest for Acute Beds, followed by Outpatient
Rooms
− Total KPU demand is projected to increase by 220% under both scenarios from 2011 to 2025
− Almost 20% of Dubai’s total projected 2025 SQ demand is in Sector 3 for Total Beds (Acute, Non-
Acute and ICU)
− Projected demand in sectors 7, 8 and 9 is 3% of total Dubai demand in 2025
KPU Type Status Quo Demand MHI Demand
2011 2025 2011 2025
Sector 1
Acute Beds 505 1,063 779 1,630
Non Acute Beds 17 43 27 66
Emergency Department
Cubicles 53 137 53 130
Intensive Care Beds 45 93 45 93
Operating Theaters 21 40 28 53
Outpatient Rooms 464 954 475 1,019
Total 1,107 2,329 1,407 2,990
Key Planning Indicator
SQ Demand MHI Demand
2011 2015 2020 2025 2011 2015 2020 2025
Total Beds 2,573 3,233 4,835 5,693 3,966 4,972 6,698 8,728
ICU Beds 224 278 371 477 224 278 371 477
Emergency Department Cubicles
262 346 546 704 262 314 477 669
Operating Theaters 103 126 193 206 136 166 255 272
Total Outpatient Rooms
2,288 2,580 3,548 4,417 2,338 2,704 3,704 5,248
Total KPUs 5,450 6,563 9,493 11,997 6,926 8,434 11,505 15,394
Table 7: KPU Demand Projections by Scenario, 2011 – 2025.
Table 8: Projected Key Planning Unit Demand by Scenario and Sector, 2011 & 2025 (cont.)
Note: Total Beds include both acute and non-acute beds

Dubai Clinical Services Capacity Plan 2025/ Version 2
29
KPU Type Status Quo Demand MHI Demand
2011 2025 2011 2025
Sector 2
Acute Beds 521 585 804 897
Non Acute Beds 18 24 28 37
Emergency Department
Cubicles 55 75 55 72
Intensive Care Beds 47 51 47 51
Operating Theaters 22 22 28 29
Outpatient Rooms 480 525 491 561
Total 1,143 1,283 1,453 1,646
Sector 3
Acute Beds 975 2,025 1,502 3,104
Non Acute Beds 34 85 53 130
Emergency Department
Cubicles 103 261 103 248
Intensive Care Beds 88 176 88 176
Operating Theaters 40 76 53 100
Outpatient Rooms 898 1,824 918 1,949
Total 2,138 4,448 2,717 5,709
Sector 4
Acute Beds 31 140 48 215
Non Acute Beds 1 7 2 10
Emergency Department
Cubicles 3 18 3 17
Intensive Care Beds 3 12 3 12
Operating Theaters 1 5 2 7
Outpatient Rooms 30 128 30 137
Total 70 311 88 398
Sector 5
Acute Beds 320 1,028 493 1,577
Non Acute Beds 10 40 16 61
Emergency Department
Cubicles 34 132 34 125
Intensive Care Beds 29 90 29 90
Operating Theaters 13 39 18 51
Outpatient Rooms 292 918 299 981
Total 698 2,247 888 2,885
Sector 6
Acute Beds 94 454 145 696
Non Acute Beds 3 18 5 27
Emergency Department
Cubicles 10 58 10 55
Intensive Care Beds 8 40 8 40
Operating Theaters 4 17 5 23
Outpatient Rooms 86 405 88 433
Total 206 991 262 1,273
Table 8: Projected Key Planning Unit Demand by Scenario and Sector, 2011 & 2025 (cont.)

Dubai Clinical Services Capacity Plan 2025/ Version 2
30
Sectors 7, 8 and 9
Acute Beds 40 175 62 268
Non Acute Beds 1 7 2 11
Emergency Department
Cubicles 4 23 4 21
Intensive Care Beds 4 15 4 15
Operating Theaters 2 7 2 9
Outpatient Rooms 37 157 38 168
Total 88 384 112 492
Total Dubai
Acute Beds 2,487 5,469 3,833 8,385
Non Acute Beds 86 224 133 343
Emergency Department
Cubicles 262 704 262 669
Intensive Care Beds 224 477 224 477
Operating Theaters 103 206 136 272
Outpatient Rooms 2,288 4,912 2,338 5,248
Grand Total 5,450 11,992 6,926 15,394

Dubai Clinical Services Capacity Plan 2025/ Version 2
31
Figures 15 & 16 show the Hospital KPU clinical services capacity projections by consolidated service
types and specialties for both scenarios.
Under the SQ scenario
Emergency Departments are projected to increase to be the highest KPU volume followed by
Neonatology, Psychiatry, Obstetrics & Gynecology, Orthopedics and Trauma. Gastroenterology and
Gastrointestinal Surgery are projected as the most significant high volume specialties. The following
specialties projected to have the highest growth rates between 2011 and 2025
− Psychiatry
− Emergency Department
− Intensive Care
− Immunology and Infections
− Cardiology including Interventions
− Neonatology
0 100 200 300 400 500 600 700 800
Psychiatry
Obstetrics & Gynecology
Orthopedics & Trauma
Gastroenterology & Gastrointestinal Surgery
Emergency Department
Neonatology (including NICU)
Pediatrics
Intensive Care
General Surgery
Rehabilitation/Long Term Care
Renal Dialysis
Cardiology including Interventions
Endocrine, Renal and Urological
Immunology & Infections
Neurosciences
Respiratory Medicine
Oncology & Hematology
General Medicine & Ungrouped
Plastic, Skin & Breast
Ear, Nose, Throat & Eyes
Cardiothoracic & Vascular
2025 2020 2015 2011
Figure 15: SQ Hospital KPU Demand Projections by Consolidated Service Types and Specialties

Dubai Clinical Services Capacity Plan 2025/ Version 2
32
Under the MHI scenario
Psychiatry, Obstetrics & Gynecology, Orthopedics and Trauma and Gastroenterology, Gastrointestinal
Surgery and Emergency Departments are projected as the most significant high volume specialties
The following specialties projected to have the highest growth rates between 2011 and 2025
− Psychiatry
− Immunology and Infections
− Renal Dialysis
− Emergency Departments
− Cardiology including Interventions
− Neonatology
− Ear, Nose, Throat and Eyes
− Rehabilitation and Long Term Care
0 200 400 600 800 1,000 1,200
Psychiatry
Obstetrics & Gynecology
Orthopedics & Trauma
Gastroenterology & Gastrointestinal Surgery
ED cubicles
Neonatology (including NICU)
Pediatrics
Intensive Care
General Surgery
Rehabilitation/Long Term Care
Renal Dialysis
Cardiology including Interventions
Endocrine, Renal and Urological
Immunology & Infections
Neurosciences
Respiratory Medicine
Oncology & Hematology
General Medicine & Ungrouped
Plastic, Skin & Breast
Ear, Nose, Throat & Eyes
Cardiothoracic & Vascular
2025 2020 2015 2011
Figure 16: MHI Hospital KPU Demand Projections by Consolidated Service Types and Specialties

Dubai Clinical Services Capacity Plan 2025/ Version 2
33
4.1.4 Manpower Capacity Demand Results by SQ and MHI
Manpower demand is projected to grow for all key categories, with Dentist demand not expected to be
affected by MHI. Nurses and Management and Support Staff for both scenarios will be higher in
demand by 2025 as shown in table 9
− Demand for Medical Manpower is projected to almost double under both scenarios with an
increase of 7.4% under MHI compared to SQ
− Demand for Nurses and Allied Health is projected to increase significantly in both scenarios. Both
categories are projected to increase by 16% under MHI compared to SQ
Key
Planning
Indicator
Scenario 1 - SQ Demand Scenario 2 - MHI Demand
2011 2015 2020 2025 2011 2015 2020 2025
Medical 4,102 6,035 12,906 14,668 5,860 8,231 13,881 15,740
Nurses 10,966 13,322 19,066 21,852 11,124 15,055 21,289 25,428
Dentists 920 1,293 1,713 2,351 920 1,293 1,713 2,351
Allied Health Practitioners
4,719 6,353 9,215 13,047 4,787 7,179 10,285 15,182
Management & Support Personnel
4,388 6,589 10,235 20,767 4,451 7,445 11,424 24,165
Total FTE 25,095 33,592 53,135 72,685 27,142 39,203 58,592 82,866
Assessment of Clinical Manpower, as percentage of the population, shows that demand is projected to
increase from 1.3% to 1.6% under SQ and from 1.4% to 1.8% under MHI. The difference between the
two scenarios ranges from 8% in 2011 to 14% in 2025.
Table 9: FTE Demand Projections by Scenario, 2011 – 2025.

Dubai Clinical Services Capacity Plan 2025/ Version 2
34
The following two figures (17 & 18) show the projected changes in demand for Medical Manpower
Specialties through 2025. Except for specific FTE volumes, the following findings apply to both
scenarios
− Primary Care & General Practice is projected as the specialty with the highest demand across the
planning period composing 53% of projected Medical Manpower capacity
− Anesthesia, Psychiatry, Obstetrics and Gynecology, Pediatrics & Child Health, General Surgery
and Cardiology are the highest volume Medical specialties
− The following specialties are projected to have the strongest growth from 2011 to 2025:
Plastic Surgery (mainly due to the implementation of the Medical Tourism Strategy)
General Surgery
Cardiology
Otolaryngology
Medical Oncology
0 2,000 4,000 6,000 8,000 10,000
Primary Care & General…
0 100 200 300 400 500 600 700 800 900 1,000
Anesthesia
Psychiatry
Obstetrics and Gynecology
Pediatrics and Child Health
General Surgery
Cardiology
Emergency Medicine
Radiology
Other Surgery
Ophthalmology
Orthopedic Surgery
General Medicine
Gastroenterology and Hepatology
Otolaryngology
Intensive Care
Endocrinology
Nephrology
Dermatology
Plastic Surgery
Medical Oncology
Clinical Pathology
Geriatric medicine
Neurology
Radiation oncology
2025 2020 2015 2011
Figure 17: SQ Medical Manpower FTE Demand Projections by Clinical Specialty, 2011 – 2025.

Dubai Clinical Services Capacity Plan 2025/ Version 2
35
0 2,000 4,000 6,000 8,000 10,000
Primary Care & General…
0 200 400 600 800 1,000 1,200
Anesthesia
Psychiatry
Obstetrics and Gynecology
Pediatrics and Child Health
General Surgery
Cardiology
Emergency Medicine
Radiology
Other Surgery
Ophthalmology
Orthopedic Surgery
General Medicine
Gastroenterology and…
Otolaryngology
Intensive Care
Endocrinology
Nephrology
Dermatology
Plastic Surgery
Medical Oncology
Clinical Pathology
Geriatric medicine
Neurology
Radiation oncology
2025 2020 2015 2011
Figure 18: MHI Medical Manpower FTE Demand Projections by Clinical Specialty, 2011 – 2025.

Dubai Clinical Services Capacity Plan 2025/ Version 2
36
4.2 Supply
Overall 1,102 facilities were surveyed providing a weighted (by volume of inpatients and outpatients)
response rate of 77%. The surveys took place late 2012, therefore the baseline of the study is 2011
data. All hospitals were fully covered (100%) and the lowest response rate was found among General
Clinics with 60% response rate (table 10). Listed clinics which were not covered included those still
being built, recently closed or did not have accessible contact information
The survey results presented in this section are described in sufficient detail so that they can be
compared against the demand analysis presented in the next section of the report
The narrative of this section is provided to highlight capacity distribution and utilization of services by
KPUs and population sectors. These observations have been used to supplement the capacity gap
analysis and the formation of priorities and recommendations.
Facility Type Surveys
Distributed Surveys Returned
Response Rate
Hospitals 27 27 100%
Polyclinics 379 283 75%
Specialty Clinics 144 97 67%
Dental Clinics 141 106 75%
General (Primary)
Clinics 411 247 60%
Total 1102 760 77%*
Table 10: Distribution of surveys and response rates by facility type
Note: *Weighted by volume of inpatients and outpatients
Dubai Clinical Services Capacity Plan 2025/ Version 2
37
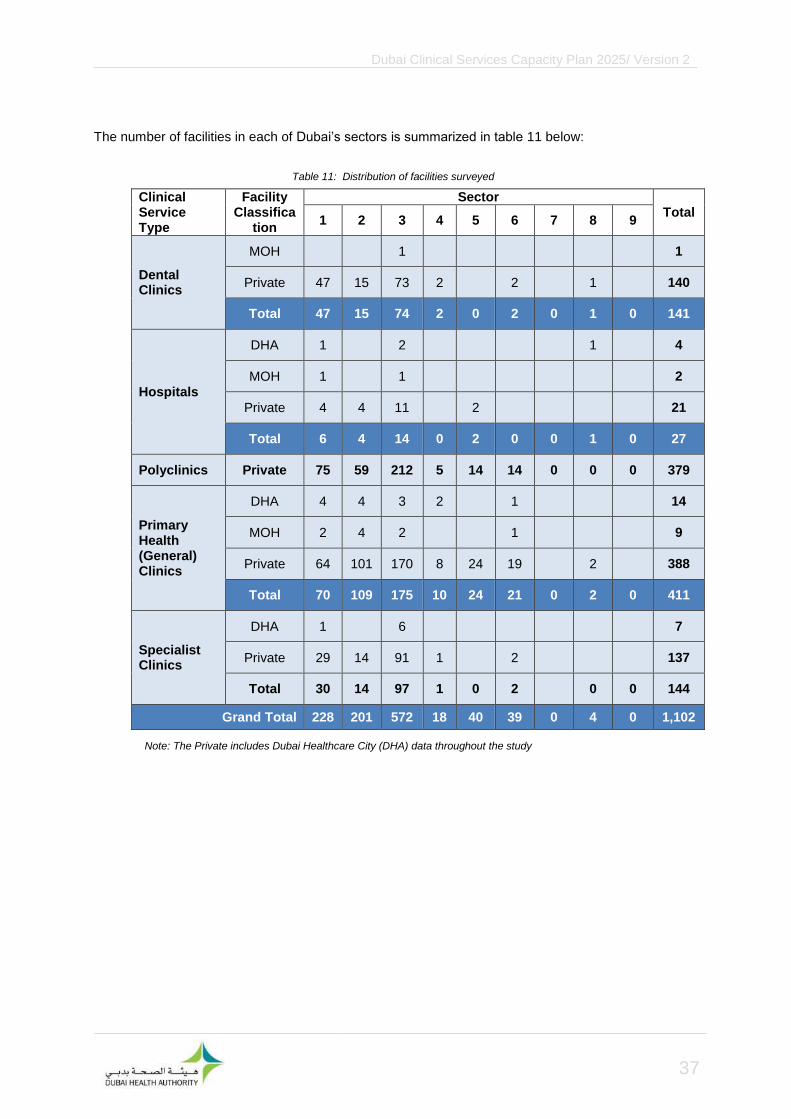
The number of facilities in each of Dubai’s sectors is summarized in table 11 below:
Clinical Service Type
Facility Classifica
tion
Sector Total
1 2 3 4 5 6 7 8 9
Dental Clinics
MOH 1 1
Private 47 15 73 2
2
1
140
Total 47 15 74 2 0 2 0 1 0 141
Hospitals
DHA 1 2 1
4
MOH 1
1 2
Private 4 4 11
2 21
Total 6 4 14 0 2 0 0 1 0 27
Polyclinics Private 75 59 212 5 14 14 0 0 0 379
Primary Health (General) Clinics
DHA 4 4 3 2 1 14
MOH 2 4 2 1 9
Private 64 101 170 8 24 19
2
388
Total 70 109 175 10 24 21 0 2 0 411
Specialist Clinics
DHA 1
6 7
Private 29 14 91 1
2 137
Total 30 14 97 1 0 2
0 0 144
Grand Total 228 201 572 18 40 39 0 4 0 1,102
Table 11: Distribution of facilities surveyed
Note: The Private includes Dubai Healthcare City (DHA) data throughout the study

Dubai Clinical Services Capacity Plan 2025/ Version 2
38
4.2.1 Residency of Patients
All clinical services were surveyed for nationality and status of admissions for the year of 2011. Of the
1102 services surveyed, 649 responded to this section of the survey (59%). Figure 19 below shows
that General Clinics reported the highest proportion of services provided to Non-Emiratis, while
Hospitals, Specialist Clinics, Dental clinics and Polyclinics reported the highest proportion of services
provided to Emiratis.
4.2.2 Hospital Infrastructure
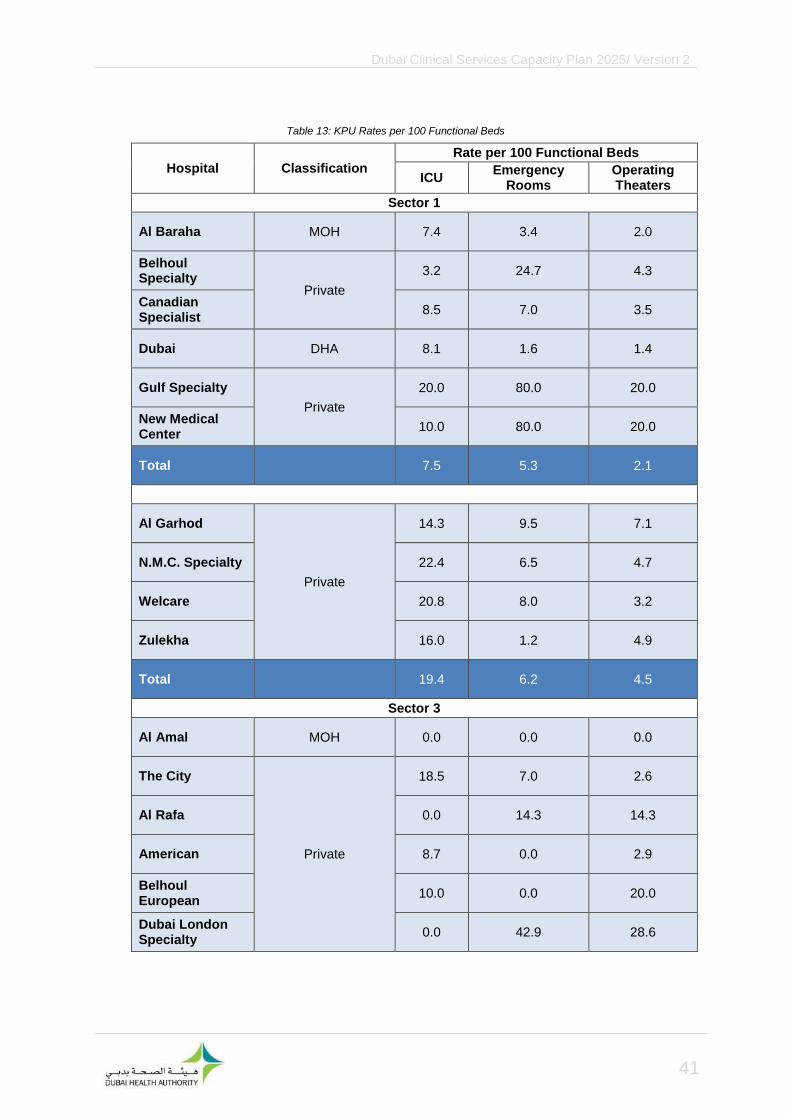
The Dubai Annual Health Statistical Report 2011 supplemented survey results. Average length of stay
was calculated using the number of inpatients and functional beds and the bed occupancy rate.
Summary results and selected bed rates are presented in tables (12 & 13).
The following observations are made from the results, and are presented in the tables below:
− The majority of hospital beds are concentrated in the highly populated and central city sectors of 1
and 3. Hospitals are spread out in smaller volumes to the sectors of 2, 5, and 8
− 50% of beds are reported in Sector 3. 36% of beds are reported in Sector 1, 11% reported in
Sector 2, 3% are reported across Sectors 5 and 8
− DHA’s Dubai Hospital is the largest hospital by reported bed number, while DHA’s Latifa Hospital
and the private American Hospital reporting greater numbers of encounters than Dubai Hospital
0% 20% 40% 60% 80%
Dental Clinic
GeneralClinic
Hospital
Polyclinic
SpecialistClinic
Emirati from Dubai Emirati from Other Emirate
Non-Emirati, Non-Resident Non-Emirati Resident
Figure 19: Proportion of Nationality Status Group per Clinical Service Facility Type. n=649.

Dubai Clinical Services Capacity Plan 2025/ Version 2
39
− Six private hospitals reported over 100 functional beds
− Private hospitals reported an average of 68 beds per hospital. Government hospitals reported an
average of 305 functional beds per hospital
− Occupancy rates at private hospitals vary considerably from 15% to 90%
− The reported occupancy rates at Government hospitals were all above 70%, with Dubai Hospital
reporting the highest rate of 76%
− Average length of stay (ALOS) varies considerably amongst private hospital from one to 17.2 days
with 19% of hospitals reporting ALOS of greater than three days
− Government hospitals reported ALOS of 2.8 days to 7.8 days, with three reporting ALOS of over
three days
− All private hospitals reported Emergency Rooms with numbers ranging from 6 or less rooms in 7
hospitals to 10 or more rooms in 7 other hospitals
− All hospitals with the exception of Al Amal, which is a psychiatric hospital, reported Operating
Theaters (OT). The Dubai, Rashid and Saudi German hospitals reported 9 or more OT rooms

Dubai Clinical Services Capacity Plan 2025/ Version 2
40
Hospital
Cla
ssif
icati
on
En
co
un
ters
Ad
jus
ted
Fu
nc
tio
na
l
Bed
s
No
n-
Fu
nc
tio
na
l
Bed
s
ICU
be
ds
Em
erg
en
cy
Ro
om
s
Op
era
tin
g
Th
eate
r
Ro
om
s
Avera
ge
L
en
gth
of
Sta
y (
da
ys)
Avera
ge
Bed
Occu
pa
ncy
Rate
(%
)
Sector 1
Al Baraha MOH 7,151 154 28 11 9 4 4.0 51
Belhoul Specialty
Private
4,849 93 3 23 4 3.3 50*
Canadian Specialist
4,148 142 64 12 10 5 1.8 15
Dubai DHA 24,494 731 77 59 12 10 4.2 76
Gulf Specialty
Private
129 5 1 4 1 2.4 17*
New Medical Center
1,108 10 1 8 2 1.1 34*
Total 41,879 1,135 169 87 66 26
Sector 2
Al Garhoud
Private
1,508 42 6 4 3 2 20
N.M.C. Specialty
5,928 107 24 7 5 1.9 40*
Welcare 12,091 125 26 10 4 3.4 90*
Zulekha 10,769 81 13 1 4 2.2 85
Total 30,296 355 0 69 22 16 2.6 67.4
Sector 3
Al Amal MOH 23,636 80 n/a n/a
The City
Private
14,248 227 42 16 6 3.4 60*
Al Rafa 2,543 14 2 2 1.6 80*
American 37,780 172 15 5 0.8 50*
Belhoul European
2,077 10 1 2 1.5 86*
Dubai London Specialty
470 7 3 2 n/a n/a
Emirates 2,983 21 4 1 38*
International Modern
5,779 65 9 14 5 2.9 70
Iranian 11,170 127 16 18 6 2.6 62
Latifa DHA 24,769 300 66 14 6 2.8 70*
Medcare Private
9,103 58 13 3 2 90*
Neuro Spinal 611 37 8 5 3 17.2 78
Rashid DHA 15,524 468 72 48 9 7.8 71
Saudi German
Private 1,654 89 230 4 14 10 n/a n/a
Total 152,347 1,675 230 246 134 63 4.3 67.7
Sector 5
Cedars - Jebel Ali International Private
1,109 12 2 6 2 1.4 36*
Lifeline 1,529 30 20 4 3 2 n/a n/a
Total 2,638 42 20 6 9 4 1.4 36
Sector 8
Hatta DHA n/a 47 45 6 10 4 n/a 3
Grand Total 227,160 3,254 464 414 241 113 3.9 64.3
Table 12: Hospitals and Key Indicators by Sector and Classification for 2011.
Source: Dubai Annual Health Statistical Report 2011a: pp. 96, 142-143 Note: Adjusted Functional Beds’ are a blend of surveyed functional beds and specialty beds and they include Dialysis
Units
Note: Adjusted Functional Beds’ are a blend of surveyed functional beds and specialty beds and they include Dialysis Units
Note: Adjusted Functional Beds’ are a blend of surveyed functional beds and specialty beds and they include Dialysis Units
Dubai Clinical Services Capacity Plan 2025/ Version 2
41
Hospital Classification
Rate per 100 Functional Beds
ICU Emergency
Rooms Operating Theaters
Sector 1
Al Baraha MOH 7.4 3.4 2.0
Belhoul Specialty
Private
3.2 24.7 4.3
Canadian Specialist
8.5 7.0 3.5
Dubai DHA 8.1 1.6 1.4
Gulf Specialty
Private
20.0 80.0 20.0
New Medical Center
10.0 80.0 20.0
Total 7.5 5.3 2.1
Sector 2
Al Garhod
Private
14.3 9.5 7.1
N.M.C. Specialty 22.4 6.5 4.7
Welcare 20.8 8.0 3.2
Zulekha 16.0 1.2 4.9
Total 19.4 6.2 4.5
Sector 3
Al Amal MOH 0.0 0.0 0.0
The City
Private
18.5 7.0 2.6
Al Rafa 0.0 14.3 14.3
American 8.7 0.0 2.9
Belhoul European
10.0 0.0 20.0
Dubai London Specialty
0.0 42.9 28.6
Table 13: KPU Rates per 100 Functional Beds

Dubai Clinical Services Capacity Plan 2025/ Version 2
42
Hospital Classification
Rate per 100 Functional Beds
ICU Emergency
Rooms Operating Theaters
Sector 3
Emirates
Private
0.0 0.0 19.0
International Modern
13.8 21.5 7.7
Iranian 12.6 14.2 4.7
Latifa DHA 22.0 4.7 2.0
Medcare
Private
22.4 0.0 5.2
Neuro Spinal 21.6 13.5 8.1
Rashid DHA 15.4 10.3 1.9
Saudi German Private 4.5 15.7 11.2
Total 14.7 8.0 3.8
Sector 5
Cedars - Jebel Ali International
Private
16.7 50.0 16.7
Lifeline 13.3 10.0 6.7
Total 14.3 21.4 9.5
Sector 8
Hatta DHA 12.8 21.3 8.5
Grand Total 12.6 7.2 3.4
Table 13: KPU Rates per 100 Functional Beds (cont.)
Dubai Clinical Services Capacity Plan 2025/ Version 2
43
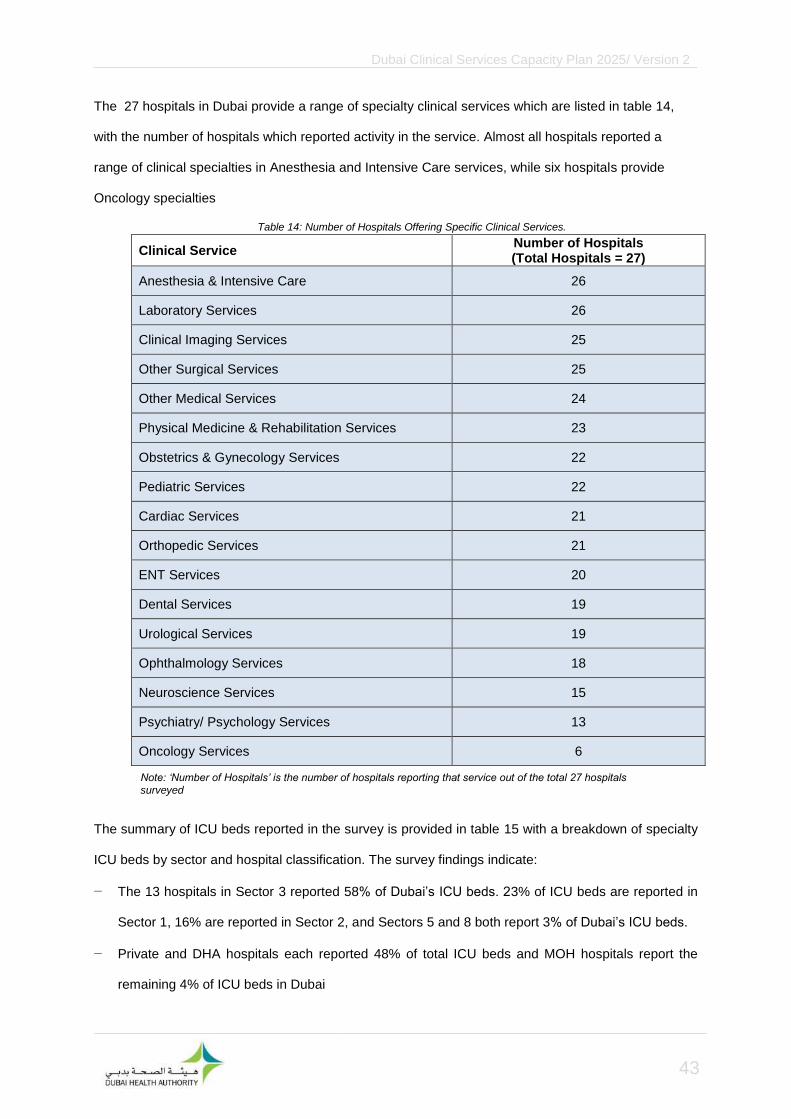
The 27 hospitals in Dubai provide a range of specialty clinical services which are listed in table 14,
with the number of hospitals which reported activity in the service. Almost all hospitals reported a
range of clinical specialties in Anesthesia and Intensive Care services, while six hospitals provide
Oncology specialties
Clinical Service Number of Hospitals (Total Hospitals = 27)
Anesthesia & Intensive Care 26
Laboratory Services 26
Clinical Imaging Services 25
Other Surgical Services 25
Other Medical Services 24
Physical Medicine & Rehabilitation Services 23
Obstetrics & Gynecology Services 22
Pediatric Services 22
Cardiac Services 21
Orthopedic Services 21
ENT Services 20
Dental Services 19
Urological Services 19
Ophthalmology Services 18
Neuroscience Services 15
Psychiatry/ Psychology Services 13
Oncology Services 6
The summary of ICU beds reported in the survey is provided in table 15 with a breakdown of specialty
ICU beds by sector and hospital classification. The survey findings indicate:
− The 13 hospitals in Sector 3 reported 58% of Dubai’s ICU beds. 23% of ICU beds are reported in
Sector 1, 16% are reported in Sector 2, and Sectors 5 and 8 both report 3% of Dubai’s ICU beds.
− Private and DHA hospitals each reported 48% of total ICU beds and MOH hospitals report the
remaining 4% of ICU beds in Dubai
Table 14: Number of Hospitals Offering Specific Clinical Services.
Note: ‘Number of Hospitals’ is the number of hospitals reporting that service out of the total 27 hospitals
surveyed
Dubai Clinical Services Capacity Plan 2025/ Version 2
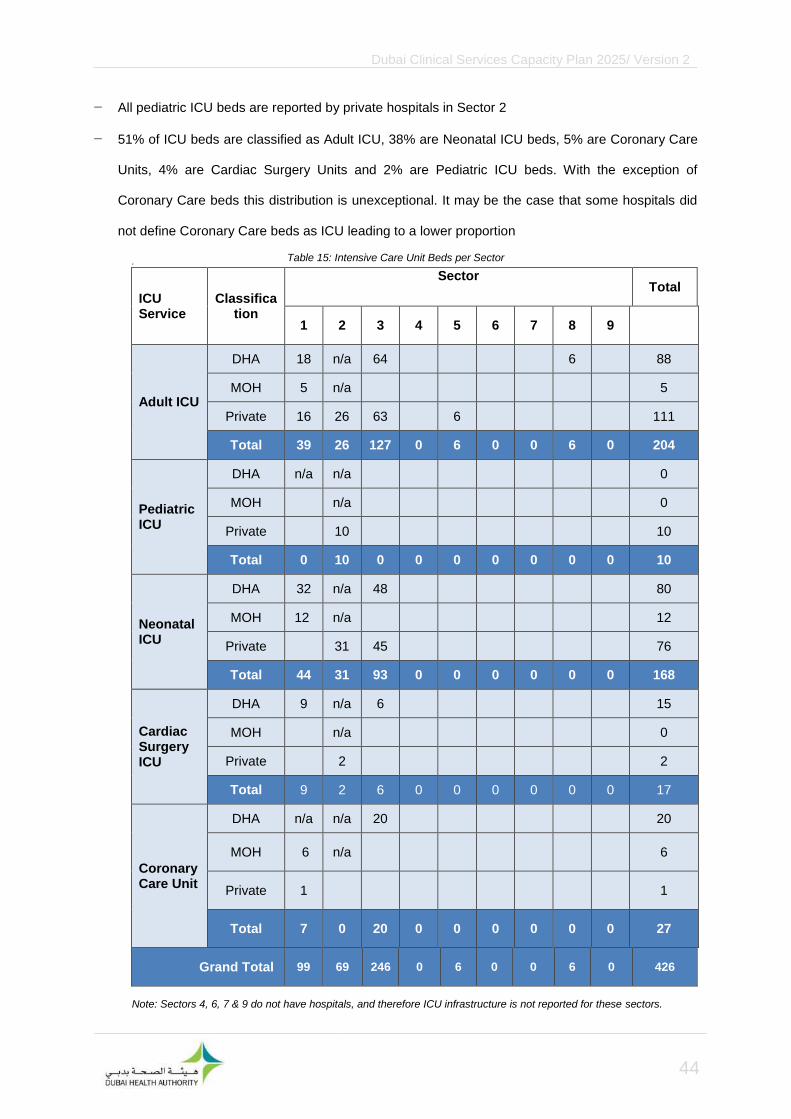
44
− All pediatric ICU beds are reported by private hospitals in Sector 2
− 51% of ICU beds are classified as Adult ICU, 38% are Neonatal ICU beds, 5% are Coronary Care
Units, 4% are Cardiac Surgery Units and 2% are Pediatric ICU beds. With the exception of
Coronary Care beds this distribution is unexceptional. It may be the case that some hospitals did
not define Coronary Care beds as ICU leading to a lower proportion
.
ICU Service
Classification
Sector Total
1 2 3 4 5 6 7 8 9
Adult ICU
DHA 18 n/a 64 6 88
MOH 5 n/a
5
Private 16 26 63 6
111
Total 39 26 127 0 6 0 0 6 0 204
Pediatric ICU
DHA n/a n/a 0
MOH n/a 0
Private 10
10
Total 0 10 0 0 0 0 0 0 0 10
Neonatal ICU
DHA 32 n/a 48
80
MOH 12 n/a
12
Private 31 45
76
Total 44 31 93 0 0 0 0 0 0 168
Cardiac Surgery ICU
DHA 9 n/a 6 15
MOH n/a 0
Private 2
2
Total 9 2 6 0 0 0 0 0 0 17
Coronary Care Unit
DHA n/a n/a 20 20
MOH 6 n/a 6
Private 1
1
Total 7 0 20 0 0 0 0 0 0 27
Grand Total 99 69 246 0 6 0 0 6 0 426
Table 15: Intensive Care Unit Beds per Sector
Note: Sectors 4, 6, 7 & 9 do not have hospitals, and therefore ICU infrastructure is not reported for these sectors.

Dubai Clinical Services Capacity Plan 2025/ Version 2
45
Table 16 shows the Accident, Trauma and Emergency rooms reported in the survey:
− In Sector 3, 60% of the total Emergency KPUs account for 55% of all emergency visits
− All Emergency KPUs are reported as predominately located in Sector 3, and the two hospitals in
Sector 5 have one examination cubicle and one minor OT room between them
Sector
Total 1 2 3 4 5 6 7 8 9
Total Emergency Visits
154,405 95,104 244,835 0 40,415 0 0 6,921 0 541,680
Total Dubai Emergency visits = 2,708 per 10,000 population
Emergency Department KPUs:
Emergency cubicles
49 17 79 1 7 153
Minor operating theater
3 2 10 1 1 17
Resuscitation rooms
5 2 13 3 1 24
Emergency Rooms
7 1 32 4 1 45
Total Rooms 64 22 134 0 9 0 0 10 0 239
.
Further observations from the survey on Emergency Department (ED) are as follows:
− Hospitals in Sector 1 have the highest emergency visit rate per capita for 64 total ED KPUs
− Sector 3 reported the highest concentration of all ED room types (56%), with 2,624 emergency
visits per 10,000 sector population. Sector 1 reported 27% of all ED room types, while 17% of ED
services are located throughout sectors 2, 5 and 8
Table 16: Accident, Emergency and Trauma Visits and Rooms by Sector.
Note 1: Sectors 4, 6, 7 & 9 do not have hospitals, and therefore Accident, Emergency and Trauma activity is not reported for these sectors

Dubai Clinical Services Capacity Plan 2025/ Version 2
46
4.2.3 Hospital Medical Equipment Infrastructure
The results for medical equipment are shown in table 17
Hospital
Cla
ssif
icati
on
Bo
ne
Den
sit
om
ete
r
Cath
ete
r L
ab
CT
Scan
ne
r
Dia
lysis
Un
it
Gam
ma K
nif
e/
Dete
cto
r
Gam
ma C
am
era
Lit
ho
trip
sy
Lo
w S
pe
ed
Han
d
pie
ce
Ma
mm
og
rap
hy
U
nit
/
Ma
mm
og
ram
MR
I
Ult
raso
un
d
Ma
ch
ine
X R
ay U
nit
Sector 1
Al Baraha MOH 1 1 1 1 1 7 4
Belhoul Specialty
Private
1 1 1 4 1 4 1 1 4 2
Canadian Specialist
2 1 1 6 1 11 2 1 10 5
Dubai DHA 1 1 1 61 1 3 1 1 1 30 4
Gulf Specialty
Private
1 1
New Medical Center
1 2 2
Total 5 3 4 71 1 3 3 16 6 5 53 18
Sector 2
Al Garhoud
Private
1 1 1 1 6 2
N.M.C. Specialty
1 1 1 3 1 6 1 1 8 1
Welcare 1 1 1 1 1 20 4
Zulekha 1 1 1 4 1 1 1 12 3
Total 2 3 4 8 0 0 3 6 4 4 46 10
Sector 3
Al Amal MOH
The City
Private
1 1 1 9 1 1 1 1 16 8
Al Rafa 3 1
American Hospital
1 1 2 7 1 1 1 1 9 6
Belhoul European
1 1 1 1
Table 17: Medical Equipment at Hospitals by Sector.

Dubai Clinical Services Capacity Plan 2025/ Version 2
47
Hospital
Cla
ssif
icati
on
Bo
ne
Den
sit
om
ete
r
Cath
ete
r L
ab
CT
Scan
ne
r
Dia
lysis
Un
it
Gam
ma K
nif
e/
Dete
cto
r
Gam
ma C
am
era
Lit
ho
trip
sy
Lo
w S
pe
ed
Han
d
pie
ce
Ma
mm
og
rap
hy
Un
it/
Ma
mm
og
ram
MR
I
Ult
raso
un
d
Ma
ch
ine
X R
ay U
nit
Sector 3 (cont.)
Dubai London Specialty
Private
Emirates 1 1 7 1
International Modern
1 1 1 1 4 2
Iranian 1 1 1 1 1 1 1 8 2
Latifa DHA 4 21 5
Medcare
Private
1 1 2 1 12 1 1 9 2
Neuro Spinal
1 1 1 1 1
Rashid DHA 2 2 1 1 6 7
Saudi German
Private 1 1 1 4 1 1 2 1 1 7 3
Total 5 8 10 23 0 3 6 18 9 9 92 39
Sector 5
Cedars - Jebel Ali International
Private
1 1 1 5
Lifeline 1 1 1 1 1
Total 0 0 2 0 0 0 1 0 2 0 2 6
Sector 8
Hatta DHA 1 3 2
Grand Total 12 14 21 102 1 6 13 40 21 18 196 75
Table 17: Medical Equipment at Hospitals by Sector (cont.)

Dubai Clinical Services Capacity Plan 2025/ Version 2
48
The survey indicated (figure 20) that ultrasound machines are the most prevalent equipment type in
hospitals, followed by dialysis units and X-Ray units.
− 47% of ultrasound machines are in Sector 3 and 33% of ultrasound machines are in Government
hospitals
− 70% percent of dialysis units are located in Sector 1
The equipment summary is limited to what was surveyed, which is the most important and common
equipment, and does not capture all types of equipment
0 50 100 150 200 250
Ultrasound Machine
Dialysis Unit
X Ray Unit
Low Speed Handpiece
Mammography Unit/ Mammogram
CT Scanner
MRI
Lithotripsy
Bone Densitometer
Catheter Lab
Gamma Camera
Gamma Knife/Detector
Number of equipment
Figure 20: Total Medical Equipment Supply in Dubai, 2011.

Dubai Clinical Services Capacity Plan 2025/ Version 2
49
4.2.4 Hospital Manpower
The survey identified manpower categories working across Dubai’s hospitals. Table 18 presents
medical and non-medical manpower from the survey, and FTE ratios. In summary:
− 52% of Medical FTEs are reported in Sector 3. 28% are in Sector 1, 14% in Sector 2 and 6% are
throughout sectors 5 (2.5%) and 8 (3.5%)
− Hospitals reported an average of 393 Total FTEs per hospital. 7 hospitals reported an above
average number of FTEs of which four were Government hospitals
− The survey reports an average of 227 Nurses per hospital, with three hospitals reporting less than
50 Nurses, and 8 reporting at over 200 Nurses
− 49% of Allied Health manpower is in private hospitals. 7% is in MOH hospitals and 44% in DHA
hospitals
− Physician to Functional Bed ratios ranged from 0.3 to 5.3. Nurse to Functional Bed ratios were
higher, given the larger number of Nurse FTEs in Dubai. Ratios ranged from 0.9 to 7.5
− Overall, Dubai’s Physician to Nurse Ratio is 0.45 compared to United States (0.23), United
Kingdom (0.28) and Australia (0.3).
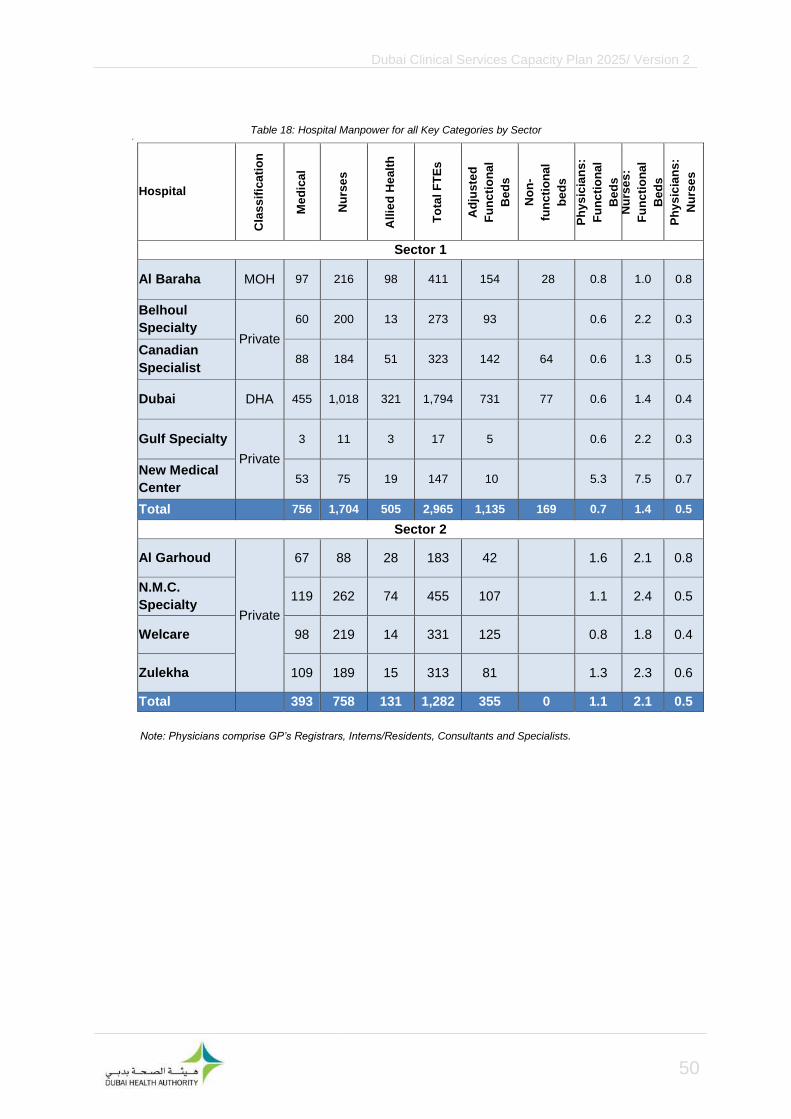
Dubai Clinical Services Capacity Plan 2025/ Version 2
50
.
Hospital
Cla
ss
ific
ati
on
Me
dic
al
Nu
rse
s
All
ied
He
alt
h
To
tal
FT
Es
Ad
jus
ted
Fu
nc
tio
na
l
Be
ds
No
n-
fun
cti
on
al
be
ds
Ph
ys
icia
ns
:
Fu
nc
tio
na
l
Be
ds
Nu
rse
s:
Fu
nc
tio
na
l
Be
ds
Ph
ys
icia
ns
:
Nu
rse
s
Sector 1
Al Baraha MOH 97 216 98 411 154 28 0.8 1.0 0.8
Belhoul
Specialty Private
60 200 13 273 93 0.6 2.2 0.3
Canadian
Specialist 88 184 51 323 142 64 0.6 1.3 0.5
Dubai DHA 455 1,018 321 1,794 731 77 0.6 1.4 0.4
Gulf Specialty
Private
3 11 3 17 5 0.6 2.2 0.3
New Medical
Center 53 75 19 147 10 5.3 7.5 0.7
Total 756 1,704 505 2,965 1,135 169 0.7 1.4 0.5
Sector 2
Al Garhoud
Private
67 88 28 183 42 1.6 2.1 0.8
N.M.C.
Specialty 119 262 74 455 107 1.1 2.4 0.5
Welcare 98 219 14 331 125 0.8 1.8 0.4
Zulekha 109 189 15 313 81 1.3 2.3 0.6
Total 393 758 131 1,282 355 0 1.1 2.1 0.5
Table 18: Hospital Manpower for all Key Categories by Sector
Note: Physicians comprise GP’s Registrars, Interns/Residents, Consultants and Specialists.

Dubai Clinical Services Capacity Plan 2025/ Version 2
51
Hospital
Cla
ss
ific
ati
on
Me
dic
al
Nu
rse
s
All
ied
He
alt
h
To
tal
FT
Es
Ad
jus
ted
Fu
nc
tio
na
l
Be
ds
No
n-
fun
cti
on
al
be
ds
Ph
ys
icia
ns
:
Fu
nc
tio
na
l
Be
ds
Nu
rse
s:
Fu
nc
tio
na
l
Be
ds
Ph
ys
icia
ns
:
Nu
rse
s
Sector 3
Al Amal MOH 26 74 6 106 80 0.3 0.9 0.4
The City
Private
80 287 90 457 227 0.4 1.3 0.3
Al Rafa 27 46 13 86 14 1.9 3.3 0.6
American 124 268 252 644 172 0.7 1.6 0.5
Belhoul
European 27 51 13 91 10 2.7 5.1 0.5
Dubai London
Specialty 17 19 36 7 2.4 2.7 0.9
Emirates 48 83 46 176 21 2.3 4.0 0.6
International
Modern 60 93 27 180 65 0.9 1.4 0.6
Iranian 148 168 58 374 127 1.2 1.3 0.9
Latifa DHA 220 622 275 1,117 300 0.7 2.1 0.4
Medcare Private
69 185 51 305 58 1.2 3.2 0.4
Neuro Spinal 16 87 22 125 37 0.4 2.4 0.2
Rashid DHA 471 1,300 131 1,902 468 1.0 2.8 0.4
Saudi German Private 91 121 27 239 89 230 1.0 1.4 0.8
Total 1,424 3,404 1,011 5,838 1,675 230 0.9 2.0 0.4
Sector 5
Cedars - Jebel
Ali
International Private 23 55 23 101 12 1.9 4.6 0.4
Lifeline 47 86 27 160 30 20 1.6 2.9 0.5
Total 70 141 50 261 42 20 1.7 3.4 0.5
Sector 8
Hatta DHA 99 130 37 266 47 45 2.1 2.8 0.8
Grand Total 2,742 6,137 1,734 10,612 3,254 464 0.8 1.8 0.5
Table 18: Hospital Manpower for all Key Categories by Sector (cont.)
Note: Physicians comprise GP’s Registrars, Interns/Residents, Consultants and Specialists.

Dubai Clinical Services Capacity Plan 2025/ Version 2
52
4.2.5 Hospitals and “Clinics” Outpatient Clinical Services Infrastructure
An outpatient room is defined as a room used to provide clinical care to a patient. Outpatient rooms
include consultation rooms, treatment rooms, and minor procedure rooms. The formula for room
estimates reported is the same formula defined under assumptions in the demand results section of
this report. Outpatient survey results and room estimates are reported in table 19.
− The majority of outpatient visits are reported in sectors 1, 2 and 3
− Over 90% of Outpatient visits for all facilities are in Sectors 1, 2 and 3
− Primary Health Clinics are estimated to have the highest proportion of outpatient rooms in sectors
1, 2, 4 and 6
− Dental Clinics are consistently estimated to have the fewest Outpatient Rooms across all sectors
− Outpatient visits for Laboratory Services and Clinical Imaging Services at hospitals were not
included in the tables
The distribution of outpatient clinic visits by sectors is presented graphically in figure 21 and detailed in
table 19
0 1 2 3 4 5 6
1
2
3
4
5
6
8
Outpatient clinic visits (millions)
Sector
Dental Clinics Hospitals Polyclinics Primary Health Clinics Specialist Clinics
Figure 21: Sector Breakdown of Outpatient Activity by Facility Type in Dubai in 2011.

Dubai Clinical Services Capacity Plan 2025/ Version 2
53
.
Facility Type Clinic Visits in 2011 % Sector Activity Estimated number of rooms
Sector 1
Dental Clinics 45,567 2.6 10
Hospitals 647,003 36.2 141
Polyclinics 302,984 17.0 66
Primary Health Clinics 700,095 39.2 152
Specialist Clinics 91,213 5.1 20
Total 1,786,862 100.0 389
Sector 2
Dental Clinics 69,271 3.0 15
Hospitals 609,309 26.5 133
Polyclinics 712,513 30.9 155
Primary Health Clinics 853,053 37.0 186
Specialist Clinics 59,343 2.6 13
Total 2,303,490 100.0 501
Sector 3
Dental Clinics 150,935 2.7 33
Hospitals 1,516,507 27.5 330
Polyclinics 1,209,572 21.9 263
Primary Health Clinics 1,365,518 24.7 297
Specialist Clinics 1,281,607 23.2 279
Total 5,524,139 100.0 1202
Sector 4
Dental Clinics 1,043 0.4 0
Polyclinics 67,443 26.9 15
Primary Health Clinics 181,992 72.7 40
Specialist Clinics 0 0.0 0
Total 250,477 100.0 55
Table 19: Outpatient Consultations at All Facilities with Estimated Number of Rooms

Dubai Clinical Services Capacity Plan 2025/ Version 2
54
Facility Type Clinic Visits in 2011 % Sector Activity Estimated number of rooms
Sector 5
Hospitals 199,749 45.8 43
Polyclinics 143,295 32.9 31
Primary Health Clinics 92,795 21.3 20
Total 435,839 100.0 95
Sector 6
Dental Clinics 1,480 0.6 0
Polyclinics 82,747 35.3 18
Primary Health Clinics 149,908 64.0 33
Specialist Clinics 0 0.0 0
Total 234,135 100.0 51
Sector 8
Dental Clinics 160 0.2 0
Hospitals 65,967 99.8 14
Primary Health Clinics 0 0.0 0
Total 66,127 100.0 14
All Sectors
Dental Clinics 268,455 2.5 58
Hospitals 3,038,535 28.7 661
Polyclinics 2,518,553 23.8 548
Primary Health Clinics
3,343,362 31.5 728
Specialist Clinics 1,432,164 13.5 312
Grand Total 10,601,069 100 2,307
Table 19: Outpatient Consultations at All Facilities with Estimated Number of Rooms (cont.)

Dubai Clinical Services Capacity Plan 2025/ Version 2
55
4.2.6 Dental & Polyclinics Outpatient Clinical Services Infrastructure
141 Dental Clinics and 379 Polyclinics were surveyed for number of clinical services and specialties. In
total, the survey included 7 services for Dental Clinics and 24 services for Polyclinics. Table 20 shows
the number of clinics, services and the number of facilities which reported the service. Polyclinic
services consist of the following specialties:
Service Number of Clinics
(Total=379) Patient Visits Visits per Doctor
Obstetrics and Gynecology
99 288,064 807
General Medicine 88 650,981 114
Dentistry 68 96,425 1083
Orthopedics 51 153,803 147
Dermatology 48 162,588 3318
Pediatrics 44 210,687 5267
ENT 43 170,229 695
Ophthalmology 39 100,965 2463
General Surgery 32 70,425 220
Cardiology 19 47,803 2173
Plastic Surgery 15 7,964 37
Psychiatry 15 25,617 1971
Homeopathy 9 13,680 1244
Endocrinology 8 25,060 2784
Neurology 8 6,793 970
Urology 7 5,644 806
Respiratory 5 10,891 1815
Table 20: Total Clinics, Visits and Doctors for Polyclinic Services Offered in Dubai in 2011

Dubai Clinical Services Capacity Plan 2025/ Version 2
56
Service Number of Clinics
(Total=379) Patient Visits Visits per Doctor
Physiotherapy 4 20,672 6891
Psychology 3 773 258
Acupuncture 1 160 160
Aviation Medicine 1 227 227
Cardio surgery 1 7,829 3915
Cupping 1 6,667 3334
Naturopathy 1 1,600 1600
Total 2,085,547 255
Note 1: ‘Number of clinics’ is the number of clinics reporting that specialty and should not be summed across
specialties.
Note 2: Polyclinics did not consistently report services or subspecialties such as for Dentistry. The table is an
aggregate of related services as entered by respondents.
Note 3: ‘These are the number of encounters at clinics for the services offered. These are not FTEs due to the
differences in reporting among clinics
• Polyclinics most commonly reported Gynecology and Obstetrics, General Medicine and Dentistry, with these
top three services accounting for over 1 million visits
• Over 8,000 visits were reported for alternative and niche treatments, such as Cupping, Naturopathy and
Aviation Medicine
• A relatively high number of Polyclinics reported Plastic Surgery, accounting for 531 visits per clinic
• 15 Polyclinics reported Psychiatric services with over 1,700 visits per clinic
Table 20: Total Clinics, Visits and Doctors for Polyclinic Services Offered in Dubai in 2011 (cont.)

Dubai Clinical Services Capacity Plan 2025/ Version 2
57
As shown in table 21, below:
− Orthodontics was the most widely offered service at Dental Clinics, followed by Oral and
Maxillofacial Surgery
− Endodontic treatments were more common than Oral and Maxillofacial surgeries yet were offered
at fewer clinics
− Pedodontics visits were at over 700 patient visits per clinic
− Esthetic Dentistry was the least reported service
Service Number of Clinics
(Total Clinics = 141) Patient Visits Specialized Dentists
Orthodontics 40 41,972 38
Oral & Maxillofacial
Surgery 20 8,761 21
Endodontic 17 11,591 15
Prosthodontics 16 5,485 17
Periodontics 15 7,359 13
Pedodontics 12 8,424 28
Asthetic Dentistry 8 4,355 8
Total 87,947 140
Table 21: Dental clinical services
Note: ‘Number of clinics’ is the number of clinics reporting that specialty and should not be summed across
specialties

Dubai Clinical Services Capacity Plan 2025/ Version 2
58
4.2.7 Specialist and General (Primary Health) Outpatient Clinical Services
Infrastructure
Specialist and Primary Health outpatient clinics reported 16 broad clinical services each. The following
two tables (22 & 23) show the clinical service areas reported for these clinics with the number of
patient visits for each service and an average consultation per clinic. Other than Psychiatry and Blood
Transfusion/Storage services, the four Specialist Clinics offering Physiotherapy reported the greatest
number of consultations per clinic, while 14 Plastic Surgery Clinics reported just over 16,000
consultations between them. Dermatology reported the highest number of clinics (25)
.
Service Number of
Clinics (Total=144)
Total Consultations
Consultations per Clinic
Dermatology 25 119,445 4,799
Alternative Therapies 21 41,845 1,962
Plastic Surgery 14 16,348 1,150
Gynecology & Obstetrics 14 37,723 2,652
ENT 11 25,520 2,393
Psychiatry 9 1,134,512 127,633
Pediatrics 9 43,022 4,840
Orthopedics 7 14,916 2,098
Internal Medicine 7 11,415 1,605
General Surgery 5 9,867 1,850
Blood transfusion & storage 4 124,444 35,000
Physiotherapy 4 23,111 6,500
Ophthalmology 4 16,889 4,750
Hematology & Genetics 4 16,052 4,515
General Medicine 4 9,236 2,598
Cardiology 2 3,556 2,000
Total 1,647,901 11,444
Table 22: Consultations per Specialty at Specialist Clinics in Dubai in 2011
Note: ‘Number of clinics’ is the number of clinics reporting that specialty and should not be summed across
specialties

Dubai Clinical Services Capacity Plan 2025/ Version 2
59
General Clinics reported consultation activity for a range of services. Table 23 below shows that
General Clinics most commonly reported Obstetrics and Gynecology, ENT and General Medicine. In
comparison, the relatively few clinics offering Pediatrics, Chiropractors, and Dentistry reported the
highest consultation per clinic, outside of General Medicine.
Service Number of Clinics
(Total General Clinics = 411)
Total Consultations Consultations per
Clinic
General Medicine 43 189,233 4,420
Gynecology & Obstetrics
34 34,492 1,007
ENT 34 13,751 402
Orthopedic 30 11,964 399
Ophthalmology 30 9,468 316
General Surgery 30 6,837 228
Dermatology 30 5,589 187
Psychiatry 28 9,331 335
Respiratory 28 6,424 231
Endocrinology 28 3,288 118
Cardiology 28 2,605 94
Oncology 21 41 2
Dentistry 9 11,065 1,292
Pediatrics 4 9,663 2,257
Chiropractor 2 3,853 1,800
Pathology 2 1,284 600
Total 318,889 776
.
4.2.8 Outpatient Clinic Manpower
The following table 24 shows Manpower reported by the Outpatient clinics. The survey results
show:
− Consistent with Infrastructure results, the majority of outpatient manpower is located in sectors
1, 2, and 3
− Clinic GP’s are mostly reported by private clinics
− There is inconsistent reporting of Interns and Residents in Polyclinics
Table 23: Consultations per Specialty at General Clinics in Dubai in 2011.
Note: ‘Number of clinics’ is the number of clinics reporting that specialty and should not be summed across
specialties
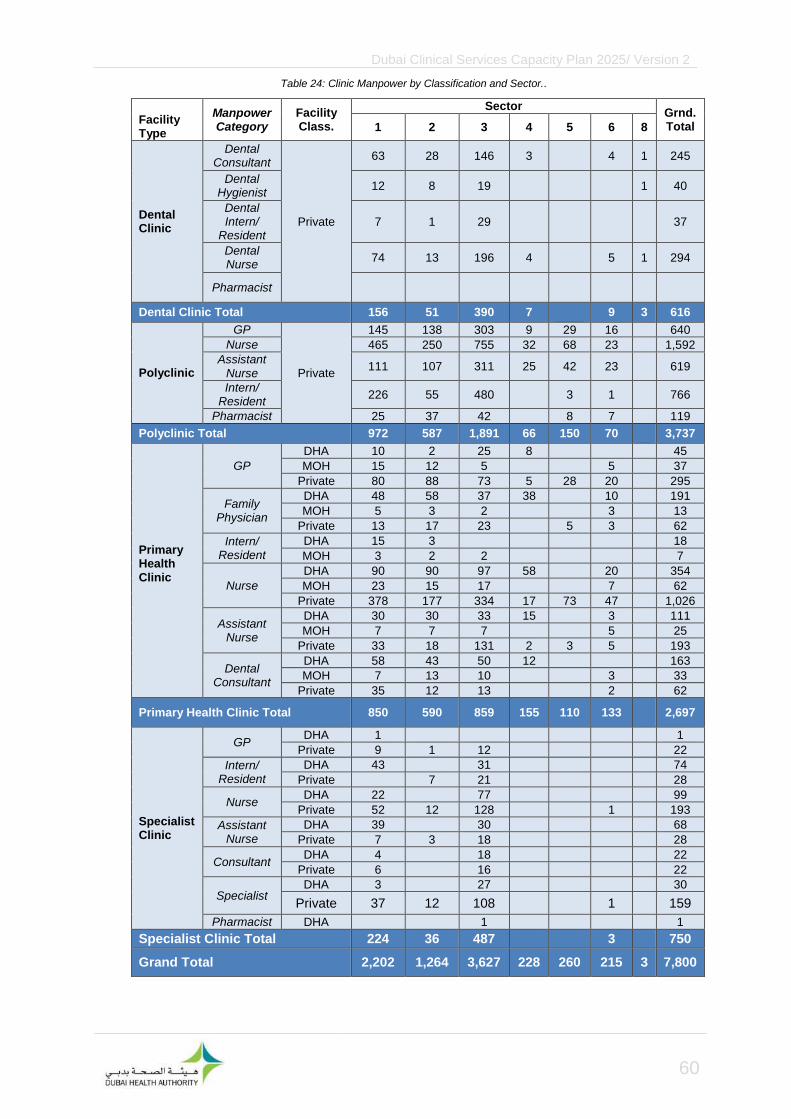
Dubai Clinical Services Capacity Plan 2025/ Version 2
60
Facility Type
Manpower Category
Facility Class.
Sector Grnd.Total 1 2 3 4 5 6 8
Dental Clinic
Dental Consultant
Private
63 28 146 3
4 1 245
Dental Hygienist
12 8 19
1 40
Dental Intern/
Resident 7 1 29
37
Dental Nurse
74 13 196 4
5 1 294
Pharmacist
Dental Clinic Total 156 51 390 7
9 3 616
Polyclinic
GP
Private
145 138 303 9 29 16
640
Nurse 465 250 755 32 68 23
1,592
Assistant Nurse
111 107 311 25 42 23
619
Intern/ Resident
226 55 480
3 1
766
Pharmacist 25 37 42
8 7
119
Polyclinic Total 972 587 1,891 66 150 70
3,737
Primary Health Clinic
GP
DHA 10 2 25 8
45
MOH 15 12 5
5
37
Private 80 88 73 5 28 20
295
Family Physician
DHA 48 58 37 38
10
191
MOH 5 3 2
3
13
Private 13 17 23
5 3
62
Intern/ Resident
DHA 15 3
18
MOH 3 2 2
7
Nurse
DHA 90 90 97 58
20
354
MOH 23 15 17
7
62
Private 378 177 334 17 73 47
1,026
Assistant Nurse
DHA 30 30 33 15
3
111
MOH 7 7 7
5
25
Private 33 18 131 2 3 5
193
Dental Consultant
DHA 58 43 50 12
163
MOH 7 13 10
3
33
Private 35 12 13
2
62
Primary Health Clinic Total 850 590 859 155 110 133
2,697
Specialist Clinic
GP DHA 1
1
Private 9 1 12
22
Intern/ Resident
DHA 43
31
74
Private
7 21
28
Nurse DHA 22
77
99
Private 52 12 128
1
193
Assistant Nurse
DHA 39
30
68
Private 7 3 18
28
Consultant DHA 4
18
22
Private 6
16
22
Specialist DHA 3
27
30
Private 37 12 108
1
159
Pharmacist DHA
1
1
Specialist Clinic Total 224 36 487
3
750
Grand Total 2,202 1,264 3,627 228 260 215 3 7,800
Table 24: Clinic Manpower by Classification and Sector..

Dubai Clinical Services Capacity Plan 2025/ Version 2
61
Table 25 below is the aggregate of the manpower categories reported at all clinics:
Manpower Category
Facility Class.
Sector Grand Total 1 2 3 4 5 6 8
GP
DHA 11 2 25 8 46
MOH 15 12 5 5 37
Private 234 227 388 14 57 36 957
Total 260 241 418 22 57 41 1040
Consultant
DHA 4 18 22
Private 6 16 22
Total 10 34 44
Specialist
DHA 3 27 30
MOH
Private 37 12 108 1 159
Total 40 12 135 1 189
Nurse
DHA 112 90 174 58 20 453
MOH 23 15 17 7 62
Private 895 439 1217 49 141 71 2,811
Total 1030 544 1408 107 141 98 3326
Assistant Nurse
DHA 69 30 63 15 3 179
MOH 7 7 7 5 25
Private 151 128 460 27 45 28 840
Total 227 165 530 42 45 36 1044
Family Physician
DHA 48 58 37 38 10 191
MOH 5 3 2 3 13
Private 13 17 23 5 3 62
Total 66 78 62 38 5 16 266
Dental Consultant
DHA 58 43 50 12 163
MOH 7 13 10 3 33
Private 98 40 159 3 6 1 307
Total 163 96 219 15 9 1 503
Dental Hygienist
Private 12 8 19
1 40
Total 12 8 19 1 40
Dental Nurse
Private 74 13 196 4
5 1 294
Total 74 13 196 4 5 1 294
Intern/ Resident
DHA 58 3 31 92
MOH 3 2 2 7
Private 226 62 501 3 1 794
Total 287 67 534 3 1 893
Dental Intern/ Resident
Private 7 1 29
37
Total 7 1 29 37
Pharmacist
DHA 1 1
Private 25 37 42 8 7 119
Total 25 37 43 8 7 120
Grand Total 2,202 1,264 3,627 228 260 215 3 7,800
Table 25: Total Clinic Manpower by Category, Classification and Sector.
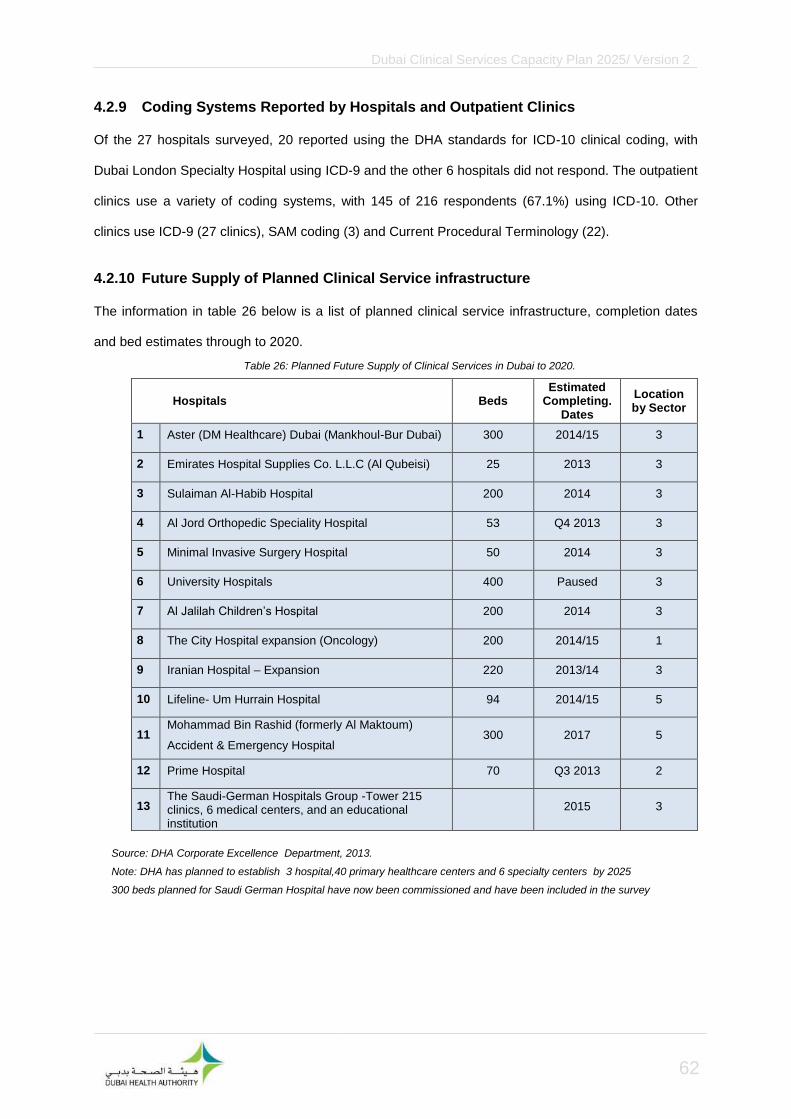
Dubai Clinical Services Capacity Plan 2025/ Version 2
62
4.2.9 Coding Systems Reported by Hospitals and Outpatient Clinics
Of the 27 hospitals surveyed, 20 reported using the DHA standards for ICD-10 clinical coding, with
Dubai London Specialty Hospital using ICD-9 and the other 6 hospitals did not respond. The outpatient
clinics use a variety of coding systems, with 145 of 216 respondents (67.1%) using ICD-10. Other
clinics use ICD-9 (27 clinics), SAM coding (3) and Current Procedural Terminology (22).
4.2.10 Future Supply of Planned Clinical Service infrastructure
The information in table 26 below is a list of planned clinical service infrastructure, completion dates
and bed estimates through to 2020.
Hospitals Beds Estimated
Completing. Dates
Location by Sector
1 Aster (DM Healthcare) Dubai (Mankhoul-Bur Dubai) 300 2014/15 3
2 Emirates Hospital Supplies Co. L.L.C (Al Qubeisi) 25 2013 3
3 Sulaiman Al-Habib Hospital 200 2014 3
4 Al Jord Orthopedic Speciality Hospital 53 Q4 2013 3
5 Minimal Invasive Surgery Hospital 50 2014 3
6 University Hospitals 400 Paused 3
7 Al Jalilah Children’s Hospital 200 2014 3
8 The City Hospital expansion (Oncology) 200 2014/15 1
9 Iranian Hospital – Expansion 220 2013/14 3
10 Lifeline- Um Hurrain Hospital 94 2014/15 5
11 Mohammad Bin Rashid (formerly Al Maktoum)
Accident & Emergency Hospital 300 2017 5
12 Prime Hospital 70 Q3 2013 2
13 The Saudi-German Hospitals Group -Tower 215 clinics, 6 medical centers, and an educational institution
2015 3
Table 26: Planned Future Supply of Clinical Services in Dubai to 2020.
Source: DHA Corporate Excellence Department, 2013.
Note: DHA has planned to establish 3 hospital,40 primary healthcare centers and 6 specialty centers by 2025
300 beds planned for Saudi German Hospital have now been commissioned and have been included in the survey

Dubai Clinical Services Capacity Plan 2025/ Version 2
63
An additional 1,412 beds at 10 hospitals and 215 outpatient clinics are planned for development by
2015. 400 beds are expected in 2025 at University Hospital. 9 developments are planned in Sector 3,
2 in sector 5 and 1 in sectors 1 and 2 each.

Dubai Clinical Services Capacity Plan 2025/ Version 2
64
5 Gap Analysis
5.1 Infrastructure Capacity Gap
The MHI scenario is compared with projected supply and the SQ scenario for all Service Type KPUs.
Future supply includes non-functional and planned Key Planning Units as reported in the Capacity
Survey Results
.
• Demand for ICU beds in 2011 were almost met
• The supply of ICU Beds is sufficient to 2020 as planned facilities are opened
• There is a 62% growth in supply of ICU Beds to 2025 if the planned Al Maktoum Hospital is operated on time
• The supply and demand for ICU Beds is in relative balance by 2020, with a 5% deficit projected. ICU Bed demand is not affected by the introduction of MHI
• Demand is projected to exceed supply by 35% in 2025
• In 2011 there was a moderate over supply of inpatient beds in Dubai
• Status Quo (SQ) – the demand on number of beds will increase by 26% in 2015, taking 2011 as a base year
• In 2020 we expect the demand to increase by 50% from 2015, not including any planned projects
• MHI – data shows that the demand for hospital beds will nearly double in 2015 when MHI is introduced into the sector, taking 2011 demand as a base year
• In 2020 we expect the increase to be 54% from 2015
Figure 22: MHI and SQ Demand Scenarios for Inpatient Beds in Dubai to 2025.
Figure 23: MHI and SQ Demand Scenarios for ICU Beds in Dubai to 2025.
0
100
200
300
400
500
600
2011 2015 2020 2025
Supply SQ MHI

Dubai Clinical Services Capacity Plan 2025/ Version 2
65
.
• 2011 shows a slight over supply of OT rooms as compared to demand (SQ)
• The supply of Operating Theatre Rooms is projected to increase by 50 Rooms from 2011 to 2015 exceeding SQ demand
• The SQ demand for Operating Theatre Rooms is projected to grow 87% from 2011 to 2020. The MHI scenario exceeds supply by approximately 60 rooms in 2020.
• There are projected gaps of 6% in the SQ scenario 41% in the MHI scenario by 2025
• Demand is projected to grow at approximately 11 rooms per year under MHI from 2015 to 2025.
• In 2011 there was an undersupply of 36 emergency room cubicles as per the demand (SQ)
• Status Quo (SQ) – the demand on number of cubicles will increase by 32% in 2015, taking 2011 as a base year
• In 2020 we expect the demand to increase by 58% from 2015, provided planned hospitals/clinics are completed by 2015
• MHI – the demand will increase by 26% in 2015 when MHI is introduced into the sector, taking 2011 as a base year
• In 2020 we expect the demand to increase by 52% from 2015
Figure 24: MHI and SQ Demand Scenarios for Emergency Department Cubicles/Rooms in Dubai to 2025.
Figure 25: MHI and SQ Demand Scenarios for Operating Theater Rooms in Dubai to 2025
0
100
200
300
2011 2015 2020 2025
Supply SQ MHI

Dubai Clinical Services Capacity Plan 2025/ Version 2
66
5.2 Manpower Capacity Gap
• In 2011 there was an oversupply of physicians as compared to demand (SQ) for services
• Status Quo (SQ) – the demand on number of physicians will increase by 47% in 2015, taking 2011 as a base year
• In 2020 we expect the demand to double from 2015, due mainly to pop growth, Expo 2020 and the Medical Tourism Strategy
• The current and planned projects will meet the demand for physicians till 2020 resources
• MHI – data shows that the demand will double in 2015 when MHI, taking 2011 as a base year
• In 2020 we expect the 8% additional increase from SQ scenario in same year
• There was a good balance between demand and supply in 2011
• Status Quo SQ – the demand on number of outpatient clinics will increase by 11% in 2015, taking 2011 as a base year
• In 2025 we expect the demand to increase by 24% from 2020
• The current and planned projects will be able to meet the demand only till 2020
• MHI – data shows that there is an increase of 21% in 2015 taking 2011 as a base year
• In 2025 we expect the increase to be 28% from 2020
Figure 26: MHI and SQ Demand Scenarios for Outpatient Rooms in Dubai to 2025.
Figure 27: MHI and SQ Demand Scenarios for Physician/Surgeon FTEs in Dubai to 2025.
-
2,000
4,000
6,000
8,000
10,000
12,000
14,000
16,000
18,000
2011 2015 2020 2025
SUPPLY SQ MHI
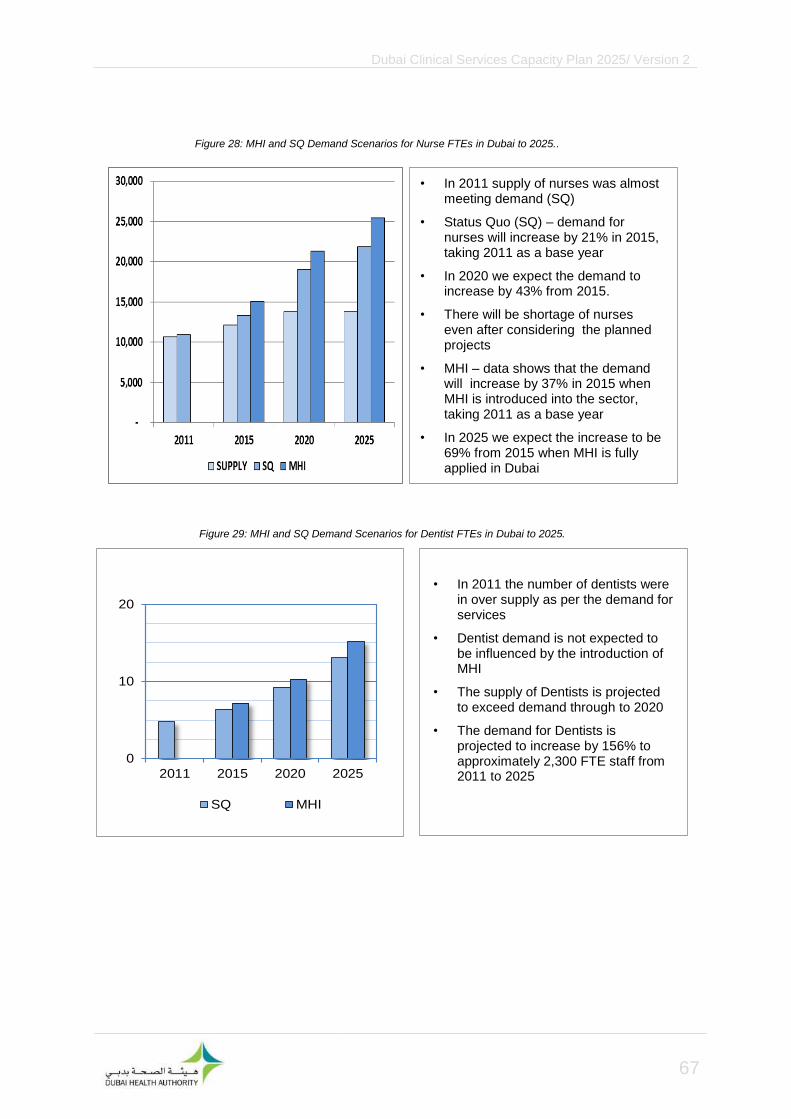
Dubai Clinical Services Capacity Plan 2025/ Version 2
67
• In 2011 the number of dentists were in over supply as per the demand for services
• Dentist demand is not expected to be influenced by the introduction of MHI
• The supply of Dentists is projected to exceed demand through to 2020
• The demand for Dentists is projected to increase by 156% to approximately 2,300 FTE staff from 2011 to 2025
• In 2011 supply of nurses was almost meeting demand (SQ)
• Status Quo (SQ) – demand for nurses will increase by 21% in 2015, taking 2011 as a base year
• In 2020 we expect the demand to increase by 43% from 2015.
• There will be shortage of nurses even after considering the planned projects
• MHI – data shows that the demand will increase by 37% in 2015 when MHI is introduced into the sector, taking 2011 as a base year
• In 2025 we expect the increase to be 69% from 2015 when MHI is fully applied in Dubai
Figure 28: MHI and SQ Demand Scenarios for Nurse FTEs in Dubai to 2025..
Figure 29: MHI and SQ Demand Scenarios for Dentist FTEs in Dubai to 2025.
0
10
20
2011 2015 2020 2025
SQ MHI

Dubai Clinical Services Capacity Plan 2025/ Version 2
68
Note: The supply data was not available for Allied Health.
Note: The supply data was not available for Management and Support Personnel.
0
10
20
2011 2015 2020 2025
SQ MHI
• The SQ demand for Management and Support Personnel is projected to increase by 51% by 2015
• The MHI demand for Management and Support Personnel is projected to increase by over 1,000 personnel per year from 2015 to 2025
• The supply of Management and Support Personnel was not reported during the planning period
• A comparison between the gap in demand and supply of Allied Health cannot be made because not all categories of the Allied Health services were included in the capacity survey
• The demand for Allied Health is projected to increase strongly throughout the planning period in both SQ and MHI scenarios
• The projected SQ demand for Allied Health increases by 176% from 2011 to 2025
Figure 31: MHI and SQ Demand Scenarios for Management and Support Personnel in Dubai to 2025.
Figure 30: MHI and SQ Demand Scenarios for Allied Health FTEs in Dubai to 2025
0
10
20
30
2011 2015 2020 2025
Supply SQ MHI

Dubai Clinical Services Capacity Plan 2025/ Version 2
69
5.3 Hospital beds in low to high cost facilities as per the MHI scenario
Figure 32 shows the baseline supply of beds across low to high cost hospitals compared to the
projected demand once MHI is fully implemented. With MHI there will be a substantial increase in
demand for hospital services particularly in low cost facilities as a larger number of non-national
workers will have access to medical treatment in Dubai
5.4 Long stay patients
In the course of the larger DCSCP study it was discovered that a significant number of chronic cases,
with a stay longer than one month, are currently being managed at Rashid Hospital. In May 2013,
additional information was gathered on the status of these patients leading to a separate in-depth
study to identify the various factors involved in maintaining chronic cases and to fully understand the
mechanisms by which cost-effective management options can be put in place. The following table (27)
shows the nationality distribution
− A total of 147 patients were identified, by the case management department at Rashid Hospital, as
chronic cases through the study
− Of these 70 (47.6%) were UAE nationals and 77 (52.4%) were non-nationals
− The mean age of these patients was found to be 55 years (range 2 to 108 years)
Figure 32: projected demand on Low to High cost hospitals with MHI
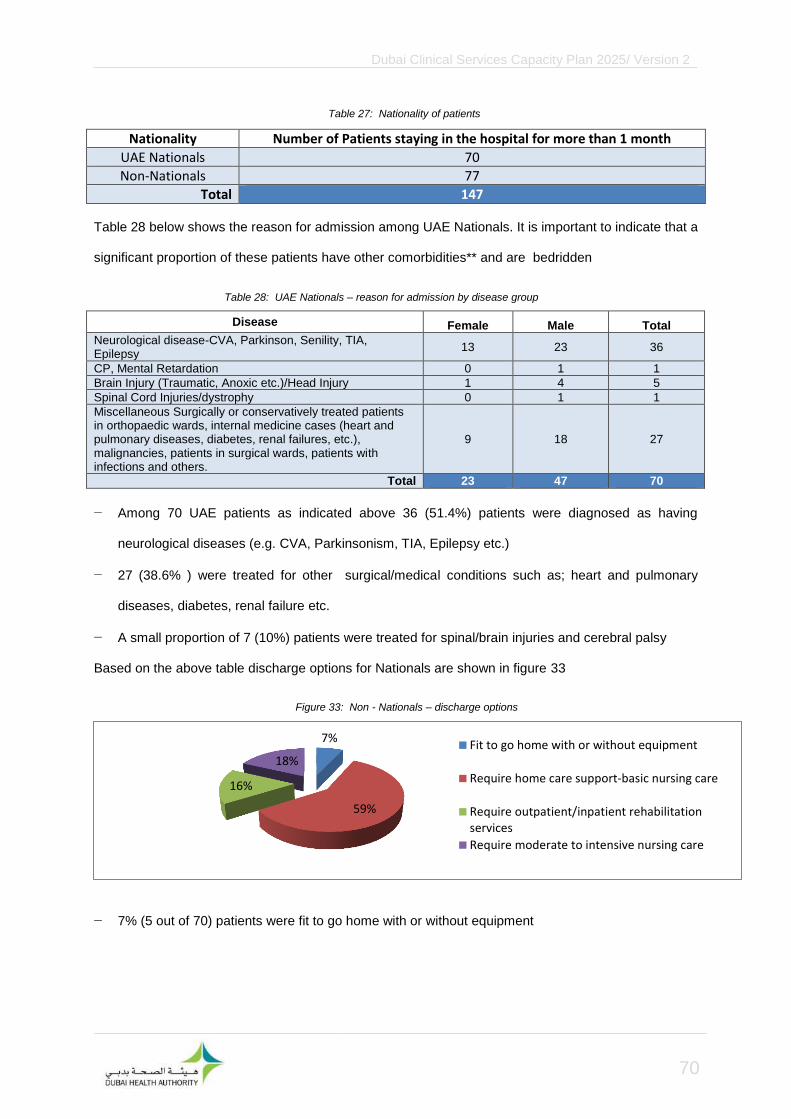
Dubai Clinical Services Capacity Plan 2025/ Version 2
70
Nationality Number of Patients staying in the hospital for more than 1 month
UAE Nationals 70
Non-Nationals 77
Total 147
Table 28 below shows the reason for admission among UAE Nationals. It is important to indicate that a
significant proportion of these patients have other comorbidities** and are bedridden
Disease Female Male Total
Neurological disease-CVA, Parkinson, Senility, TIA, Epilepsy
13 23 36
CP, Mental Retardation 0 1 1
Brain Injury (Traumatic, Anoxic etc.)/Head Injury 1 4 5
Spinal Cord Injuries/dystrophy 0 1 1
Miscellaneous Surgically or conservatively treated patients in orthopaedic wards, internal medicine cases (heart and pulmonary diseases, diabetes, renal failures, etc.), malignancies, patients in surgical wards, patients with infections and others.
9 18 27
Total 23 47 70
− Among 70 UAE patients as indicated above 36 (51.4%) patients were diagnosed as having
neurological diseases (e.g. CVA, Parkinsonism, TIA, Epilepsy etc.)
− 27 (38.6% ) were treated for other surgical/medical conditions such as; heart and pulmonary
diseases, diabetes, renal failure etc.
− A small proportion of 7 (10%) patients were treated for spinal/brain injuries and cerebral palsy
Based on the above table discharge options for Nationals are shown in figure 33
− 7% (5 out of 70) patients were fit to go home with or without equipment
7%
59%
16%
18% Fit to go home with or without equipment
Require home care support-basic nursing care
Require outpatient/inpatient rehabilitationservices
Require moderate to intensive nursing care
Table 27: Nationality of patients
Table 28: UAE Nationals – reason for admission by disease group
Figure 33: Non - Nationals – discharge options
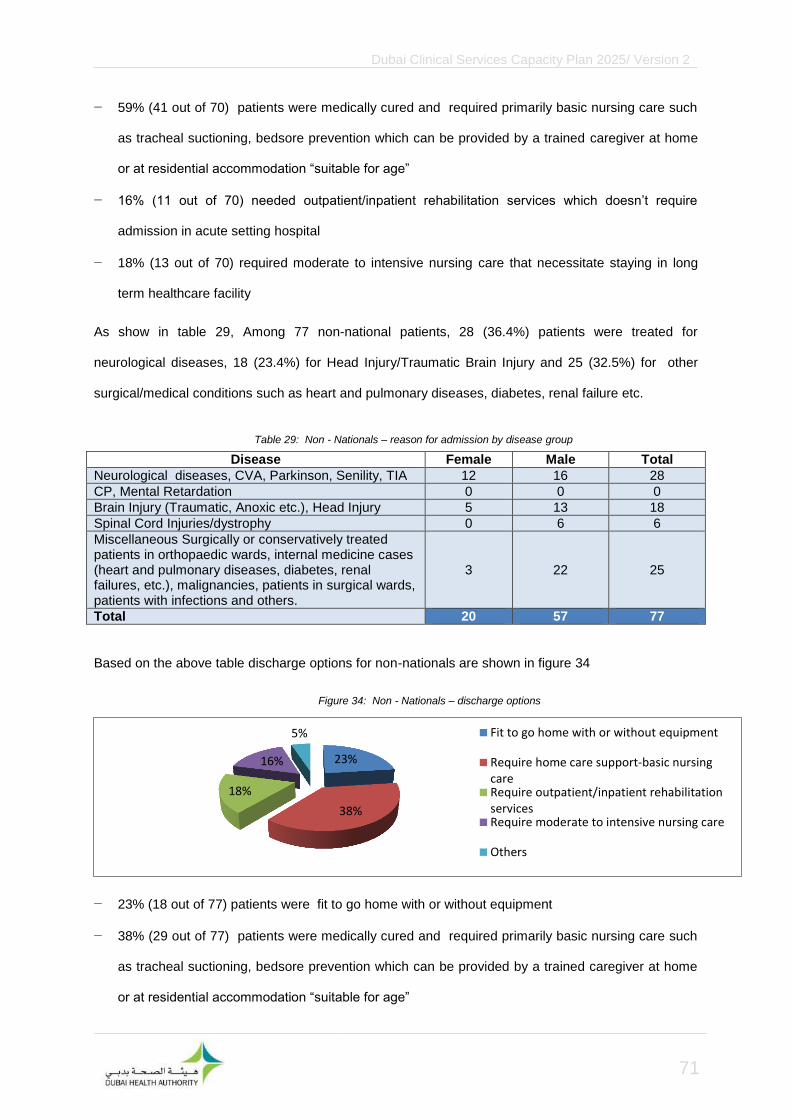
Dubai Clinical Services Capacity Plan 2025/ Version 2
71
− 59% (41 out of 70) patients were medically cured and required primarily basic nursing care such
as tracheal suctioning, bedsore prevention which can be provided by a trained caregiver at home
or at residential accommodation “suitable for age”
− 16% (11 out of 70) needed outpatient/inpatient rehabilitation services which doesn’t require
admission in acute setting hospital
− 18% (13 out of 70) required moderate to intensive nursing care that necessitate staying in long
term healthcare facility
As show in table 29, Among 77 non-national patients, 28 (36.4%) patients were treated for
neurological diseases, 18 (23.4%) for Head Injury/Traumatic Brain Injury and 25 (32.5%) for other
surgical/medical conditions such as heart and pulmonary diseases, diabetes, renal failure etc.
Disease Female Male Total
Neurological diseases, CVA, Parkinson, Senility, TIA 12 16 28
CP, Mental Retardation 0 0 0
Brain Injury (Traumatic, Anoxic etc.), Head Injury 5 13 18
Spinal Cord Injuries/dystrophy 0 6 6
Miscellaneous Surgically or conservatively treated patients in orthopaedic wards, internal medicine cases (heart and pulmonary diseases, diabetes, renal failures, etc.), malignancies, patients in surgical wards, patients with infections and others.
3 22 25
Total 20 57 77
Based on the above table discharge options for non-nationals are shown in figure 34
− 23% (18 out of 77) patients were fit to go home with or without equipment
− 38% (29 out of 77) patients were medically cured and required primarily basic nursing care such
as tracheal suctioning, bedsore prevention which can be provided by a trained caregiver at home
or at residential accommodation “suitable for age”
23%
38%
18%
16%
5% Fit to go home with or without equipment
Require home care support-basic nursingcareRequire outpatient/inpatient rehabilitationservicesRequire moderate to intensive nursing care
Others
Table 29: Non - Nationals – reason for admission by disease group
Figure 34: Non - Nationals – discharge options
Dubai Clinical Services Capacity Plan 2025/ Version 2
72
− 18% (14 out of 77) needed outpatient/inpatient rehabilitation services which doesn’t require
admission in acute setting hospital
− 16% (12 out of 77) required moderate to intensive nursing care that necessitate staying in long
term healthcare facility
− 5% (4 out of 77) needed to come from home for dressing or required quarantine

Dubai Clinical Services Capacity Plan 2025/ Version 2
73
5.5 Sector Gaps
Table 30 below shows the projected KPU gaps for both demand scenarios. For simplicity, due to small
numbers in sectors 7, 8 and 9, these sectors are displayed together. Supply for Dubai has been
adjusted for survey response error
.
KPU type Supply
Non-functional
beds
Planned KPUs
Status Quo Gap Mandatory
Health Insurance Gap
2011 2011 2025 2011 2025 2011 2025
Sector 1
Acute Beds 1,185 141 270 +821 +533 +547 -34
Non Acute Beds
-17 -43 -27 -66
Emergency Department Cubicles
64
11 -73 11 -66
Intensive Care Beds
45
7 0 -41 0 -41
Operating Theaters
26
0 5 -14 -2 -27
Outpatient Rooms 396
13 -68 -545 -79 -610
Total 1,716 141 290 752 -183 450 -844
Sector 2
Acute Beds 355
-166 -230 -449 -542
Non Acute Beds
-18 -24 -28 -37
Emergency Department Cubicles
22
-33 -53 -33 -50
Intensive Care Beds
34
-11 -17 -11 -17
Operating Theaters
16
-6 -6 -12 -13
Outpatient Rooms 475
26 -5 -24 -16 -60
Total 902
26 -239 -354 -549 -719
Sector 3
Acute Beds 1,675 230 1848 +930 +1,728 +403 +649
Non Acute Beds
-34 -85 -53 -130
Emergency Department Cubicles
134
31 -127 31 -114
Intensive Care Beds
126
114 38 58 38 58
Operating Theaters
63
23 -13 10 -37
Outpatient Rooms 1,192
1345 +394 +937 +256 +588
Total 3,190 230 3,307 +1,382 +2,498 +685 +1014
Sector 4
Acute Beds
-31 -140 -48 -215
Table 30: KPU Gap Analysis in Dubai’s Sectors

Dubai Clinical Services Capacity Plan 2025/ Version 2
74
KPU type Supply
Non-functional
beds
Planned KPUs
Status Quo Gap Mandatory
Health Insurance Gap
2011 2011 2025 2011 2025 2011 2025
Non Acute Beds
-1 -7 -2 -10
Emergency Department Cubicles
-3 -18 -3 -17
Intensive Care Beds
-3 -12 -3 -12
Operating Theaters
-1 -5 -2 -7
Outpatient Rooms 81
+51 -47 +30 -56
Total 81 0 0 12 -229 --28 -317
Sector 5
Acute Beds 42 20 394 -258 -572 -431 -1,121
Non Acute Beds
-10 -40 -16 -61
Emergency Department Cubicles
9
-25 -123 -25 -116
Intensive Care Beds
6
15 -23 -69 -23 -69
Operating Theaters
4
-9 -35 -14 -47
Outpatient Rooms 101
24 -191 -793 -198 -856
Total 162 20 433 -516 -1632 -707 -2,270
Sector 6
Acute Beds
-94 -454 -145 -696
Non Acute Beds
-3 -18 -5 -27
Emergency Department Cubicles
-10 -58 -10 -55
Intensive Care Beds
-8 -40 -8 -40
Operating Theaters
-4 -17 -5 -23
Outpatient Rooms 51
-35 -354 -37 -382
Total 51
-154 -941 -210 -1,223
Sectors 7, 8 and 9
Acute Beds 47 45
52 -83 30 -176
Non Acute Beds
-1 -7 -2 -11
Emergency Department Cubicles
10
6 -13 6 -11
Intensive Care Beds
6
2 -9 2 -9
Operating Theaters
4
2 -3 2 -5
Outpatient Rooms 10
4 -27 -143 -28 -154
Total 77 45 4 34 -258 10 -366
Total Dubai
Acute Beds 3,304 436 2,512 1,254 782 -93 -2,135
Non Acute Beds 0 0 0 -84 -224 -133 -342
Table 30: KPU Gap Analysis in Dubai’s Sectors (cont.)

Dubai Clinical Services Capacity Plan 2025/ Version 2
75
KPU type Supply
Non-functional
beds
Planned KPUs
Status Quo Gap Mandatory
Health Insurance Gap
2011 2011 2025 2011 2025 2011 2025
Emergency Department Cubicles
239 0 0 -20 -447 -20 -412
Intensive Care Beds
217 0 136 -11* -188* -11* -188*
Operating Theaters
113 0 0 10 -93 -23 -159
Outpatient Rooms 2,306 0 1412 +19* -699* -358* -2,118*
Total 6,179 436 4,060 1,168 -869 -638 -5,354
Note: - In the above table negative numbers indicate a deficit/gap and positive number indicate surplus - * The total outpatient rooms’ and ICU beds’ gaps is not taking into account the surplus in some sectors,
especially in sector 5, as we need it to reflect the real gaps by sector
As seen in table 30, the majority of gaps are due to the population growth projected through to 2025.
The KPUs associated with each sector indicate where future hospital service demands will be required
as the population of Dubai grows.
− The largest total KPU gap is projected in sectors 5 and 6,
− All the KPU gaps are more significant under the MHI scenario, except for ED cubicles and ICU
beds
− Only Sector 3 is projected to be in overall KPU surplus by 2025
Table 30: KPU Gap Analysis in Dubai’s Sectors - Total for Dubai

Dubai Clinical Services Capacity Plan 2025/ Version 2
76
5.6 Clinical Specialty Gaps
5.6.1 Hospital Infrastructure (Beds)
The following tables 31 and 32 show the projected gaps in supply for hospital infrastructure
consolidated by service types and clinical specialties for the SQ and MHI scenarios for 2015-2025.
Please note the gap analysis for projected demand against 2011 supply, planned and unallocated
beds have not been distributed to clinical specialties, because it is not known
SQ Scenario
In 2025 all specialties with the exception of Pediatrics, are projected to have gaps in supply. Pediatrics
is projected to have a slight surplus in supply. The top gaps in supply for this scenario are Emergency
Departments, Intensive Care, Rehabilitation/Long Term Care, Psychiatry, Neonatology and Obstetrics
and Gynecology
Specialty 2015 2020 2025
ED cubicles -120 -276 -447
Rehabilitation/Long Term Care -235 -321 -421
Intensive Care -61* -154* -260*
Psychiatry 52 -85 -244
Neonatology (including NICU) 84 -48 -207
Obstetrics & Gynecology 51 -63 -191
Orthopedics & Trauma 13 -65 -164
Gastroenterology & Gastrointestinal Surgery 19 -72 -160
Renal Dialysis -14 -60 -122
General Surgery -1 -54 -104
Cardiology including Interventions 7 -38 -92
Immunology & Infections 3 -33 -75
Oncology & Hematology -1 -29 -63
Plastic, Skin & Breast -5 -26 -51
Ear, Nose, Throat & Eyes -7 -27 -50
Endocrine, Renal and Urological 28 -5 -46
Cardiothoracic & Vascular 1 -17 -39
Neurosciences 19 -6 -34
General Medicine & Ungrouped 12 -7 -33
Respiratory Medicine 39 19 -11
Pediatrics 94 58 4
Non-Functional Beds 451 451 451
Planned Beds 1,712 2,712 2,712
Total 2,141 1,854 353
N.B: * Due to the importance of ICU beds and the uncertainty of including them in the planned projects, the above gaps were
identified without taking the planned projects into consideration
Table 31: Projected Gaps in the Supply of Consolidated Service Types and Specialties for SQ Scenario 2015-2025

Dubai Clinical Services Capacity Plan 2025/ Version 2
77
MHI Scenario
In 2025, all specialties projected have gaps in supply. Most significantly Psychiatry, Obstetrics &
Gynecology, Orthopedics & Trauma, Gastroenterology & Gastrointestinal Surgery, Emergency
Departments, Intensive Care, Rehabilitation/Long Term Care, Renal Dialysis and General Surgery are
projected to experience significant gaps
.
Specialty 2015 2020 2025
Psychiatry -172 -409 -684
Obstetrics & Gynecology -201 -399 -619
Orthopedics & Trauma -184 -319 -490
Gastroenterology & Gastrointestinal Surgery -142 -298 -450
Emergency Departments -103 -251 -412
Rehabilitation/Long Term Care -235 -321 -421
Renal Dialysis -95 -174 -281
General Surgery -103 -195 -281
Intensive Care -61* -154* -260*
Cardiology including Interventions -72 -150 -244
Neonatology (including NICU) 84 -48 -207
Pediatrics -49 -111 -203
Immunology & Infections -57 -119 -191
Endocrine, Renal and Urological -49 -107 -177
Oncology & Hematology -58 -107 -166
Neurosciences -46 -90 -138
Plastic, Skin & Breast -49 -85 -128
Ear, Nose, Throat & Eyes -49 -83 -123
Respiratory Medicine -29 -62 -115
General Medicine & Ungrouped -35 -68 -113
Cardiothoracic & Vascular -39 -68 -107
Non-Functional Beds 451 451 451
Unallocated Planned Beds 1,712 2,712 2,712
Total 419 -455 -2,647
N.B: * Due to the importance of ICU beds and the uncertainty of including them in the planned projects, the above gaps were
identified without taking the planned projects into consideration
Table 32: Projected Gaps in the Supply of Consolidated Service Types and Specialties for MHI Scenario 2015-2025

Dubai Clinical Services Capacity Plan 2025/ Version 2
78
5.6.2 Medical Manpower
The following table 33 shows projected Medical Specialty gaps for the MHI scenario. The Specialty
distribution of gaps is identical with SQ, except consistent with general findings of this scenario, the
FTE volumes are larger. Please note the significant projected shortfalls in supply for Primary &
General Practice, Anesthesia and Psychiatry
Clinical Service 2015 2020 2025
Primary Care & General Practice -2,861 -4,935 -6,633
Anesthesia -355 -598 -793
Psychiatry -382 -555 -663
Pediatrics and Child Health 5 -144 -279
General Surgery 13 -135 -282
Cardiology -19 -129 -236
Emergency Medicine -70 -155 -221
Other Surgery -22 -112 -193
Gastroenterology and Hepatology -79 -135 -186
Obstetrics and Gynecology 153 -1 -114
Radiology -26 -101 -137
Ophthalmology -43 -100 -142
Orthopedic Surgery 42 -29 -92
Medical Oncology -39 -70 -99
Intensive Care 6 -37 -80
Nephrology -7 -40 -66
Otolaryngology 65 10 -47
Endocrinology 12 -24 -54
Geriatric Medicine -2 -32 -53
Neurology 14 -9 -30
Dermatology 34 6 -22
Clinical Pathology 90 60 45
Plastic Surgery 189 151* 118*
General Medicine 422 355 295
Total -2,888 -6,799 -10,005
Note: 1) The rehabilitation and long term care services require primarily physiotherapist, occupational therapist, hydro therapist ,podiatrist, speech therapist and social workers which are calculated as allied health workers and are not included in the above table. 2) As could be seen in the above figures, there is surplus of plastic surgeons as plastic surgeries are not covered by health insurance, however, the potential success of Dubai Medical Tourism Strategy will lead to balance between supply and demand on plastic surgeons by 2025
Table 33: MHI Medical FTE Gap Analysis with No Projected Growth in Supply Due to Planned Hospitals.

Dubai Clinical Services Capacity Plan 2025/ Version 2
79
The following table 34 shows the projected gaps in supply for Medical Manpower clinical specialties for
the SQ scenario for 2015-2025. Primary Health Care and General Practice with an additional 6,064
FTEs projected as required by 2025. Other Specialties with projected significant growth by 2025 are:
− Anesthesia
− Psychiatry
− General Surgery
− Pediatrics and Child Health
− Cardiology
− Emergency Medicine
− Other Specialty Surgery
− Gastroenterology and Hepatology
− Ophthalmology
− Radiology

Dubai Clinical Services Capacity Plan 2025/ Version 2
80
.
Clinical Service 2015 2020 2025
Primary Care & General Practice -2,549 -4,482 -6,064
Anesthesia -317 -543 -725
Psychiatry -349 -511 -611
Pediatrics and Child Health 27 -112 -238
General Surgery 29 -109 -246
Cardiology -6 -108 -208
Emergency Medicine -57 -136 -198
Other Surgery -11 -95 -170
Gastroenterology and Hepatology -72 -124 -172
Obstetrics and Gynecology 179 35 -70
Radiology -10 -80 -114
Ophthalmology -31 -85 -124
Orthopedic Surgery 51 -15 -74
Medical Oncology -35 -64 -91
Intensive Care 12 -28 -68
Nephrology -2 -33 -57
Otolaryngology 72 20 -33
Endocrinology 17 -16 -44
Geriatric Medicine 2 -26 -45
Neurology 17 -4 -24
Dermatology 39 13 -13
Clinical Pathology 95 67 53
Plastic Surgery 189 151* 118*
General Medicine 431 369 313
Total -2,301 -5,946 -8,934
N.B: As could be seen in the above figures, there is surplus of plastic surgeons in Dubai, however, the potential success of Dubai Medical Tourism Strategy will lead to balance between supply and demand on plastic surgeons by 2025
Table 34: SQ Medical FTE Gap Analysis with No Projected Growth in Supply Due to Planned Hospitals

Dubai Clinical Services Capacity Plan 2025/ Version 2
81
6 Sensitivity Analysis
6.1 Description of Sensitivity Analysis
A three phase approach was conducted to assess the sensitivity of the capacity planning findings:
− The crude per capita rates for Infrastructure and Manpower KPUs were estimated and contrasted
against other countries in the Western Asia region and the selected high income regions, the
Americas and Europe.
− A population based analysis is presented to assess the impact of different age distribution for
males on the potential demand for services
− A 70% occupancy rate is applied to the aggregate bed demand for both scenarios. The gaps in
supply at 70% occupancy and the 80% occupancy, used for the capacity planning, are contrasted
to illustrate the differences for these occupancy assumptions
6.1.1 Crude Rate and Scenario Analysis
The crude rates per 10,000 people for KPU and Key Staffing Measures are presented below and show
that Dubai has a lower rate of demand of Nurses and Hospital Beds and a relatively larger rate of
demand for Physicians compared to the three predominant reference countries (Australia, United
Kingdom and United States of America). The relatively low Nurse and Bed demand rates are
explained by the young age and predominately male status of Dubai’s projected population, which
means that there are fewer healthcare resources required for the elderly (people over the age of 65)
who are more prevalent in the reference countries.
The elderly are known to use healthcare resource 3.8 times more than people under 65 years of age
(USA National Institute of Health, 2013). They are also more likely to reside in supported
accommodation staffed by nurses in the reference countries. The higher rate of physicians is
explained by cultural preferences in Dubai for more care to be provided by physicians than in the
reference countries.

Dubai Clinical Services Capacity Plan 2025/ Version 2
82
Table 35 below compare Dubai’s supply after adjustment for response rate error to demand rates for
KPUs and Human Resource categories.
KPUs and Human Resources
Categories
Supply per 10,000
Dubai Population
SQ Demand
per 10,000
Dubai
Population
MHI Demand
per 10,000
Dubai
Population
2011 2025 2011 2025 2011 2025
Total Beds 19 14 13 12 20 19
ICU Beds 1 0.8 1 1 1 1
ED Cubicles 1.1 0.8 1.3 1.5 1.3 1.5
OT Rooms 0.6 0.4 0.5 0.5 0.7 0.6
Total Outpatient Rooms 12 9 10 7 10 11
Physicians/Surgeons FTEs 30 23 27 32 29 34
Nurses FTEs 54 40 55 56 56 56
Dentist FTEs 5.7 4.3 4.6 5.1 4.6 5.1
Allied Health FTEs 12 9.0 34 61 35 61
.
Table 35: KPU per Capita Rates for the Supply and Scenario Demands in Dubai.
Source of supply data: Dubai Annual Health Statistical Report 2011, DHA.

Dubai Clinical Services Capacity Plan 2025/ Version 2
83
6.1.2 Population Distribution Sensitivity
From 2000 to 2010, the population in Dubai increased by 121% compared to the global increase of
13%. Adjusting the population in Dubai is instrumental for determining per capita health needs. The
adjusted population ensures that the comparisons of per capita health measure with other countries
take account the unique composition of the populations in Dubai.
The World Bank population data from five regions (total of 106 countries) over a period of 30 years
(1981 to 2011) was used to predict the modeled male population for Dubai using regression models.
The regression models were then used to predict the adjusted population for each age group of males
in Dubai. Two sensitivity specifications were used in the regression models, and thus two outputs are
reported: the lower and higher estimates.
Once the predicted value of the total population is estimated, an adjustment factor (Ω) is then
computed. The adjustment factor for each country is the rate of the total modeled population to the
total actual population. The per capita healthcare indicators are adjusted by dividing the nominal
measure by Ω. For example, a nominal per capita measure of 100 and Ω of 0.80 produce an adjusted
measure of 125. The results in table 36 below show the adjustment factors for Dubai over time. The
population pyramid, figure 34 shows the actual and modeled population in 2011
.
Year Lower Estimates Higher Estimates
2011 0.496 0.520
2015 0.521 0.552
2020 0.516 0.551
400 300 200 100 0 100
0-4
10-14
20-24
30-34
40-44
50-54
60-64
70-74
Population (000)
Age Group
Adjusted Male Actual Male Actual Female
Table 36: Population Sensitivity Rates
Figure 34: Adjusted Dubai Population Compared with Actual Population for 2011

Dubai Clinical Services Capacity Plan 2025/ Version 2
84
6.1.3 Occupancy Rate Comparison
The following table 37 illustrates the difference in demand between occupancy situations for the two
scenarios. The DCSCP used an 80% bed occupancy rate, for a total SQ surplus of 557 beds by 2025.
In comparison, a small deficit of beds is projected by 2025 at 70% occupancy. The MHI scenario’s
deficit is projected to over 1,200 beds greater in 2025 if occupancy was at 70%, compared to 80%.
Total Beds Supply by Year
2011 2015 2020 2025
3,740 5,152 5,852 6,252
Scenario 1 - SQ Demand by year
Total Beds Demand at 80% Occupancy 2,573 3,233 4,835 5,693
Total Beds Demand at 70% Occupancy 2,941 3,695 5,512 6,506
Scenario 1 - SQ Gap by year
Total Beds Gap at 80% occupancy 1,167 1,919 1,017 559
Total Beds Gap at 70% occupancy 799 1,457 340 -254
Absolute Gap difference 368 462 677 305
Scenario 2 - MHI Demand by year
2011 2015 2020 2025
Total Beds Demand at 80% Occupancy 3,966 4,799 7,408 8,728
Total Beds Demand at 70% Occupancy 4,533 5,471 8,445 9,975
Scenario 2 - MHI Gap by year
Total Beds Gap at 80% occupancy -226 353 -1,556 -2,476
Total Beds Gap at 70% occupancy -793 -319 -2,583 -3,723
Absolute Gap difference 567 44 1,027 1247
Table 37: Demand Comparison for 70% and 80% Bed Occupancy Rates for SQ and MHI Scenarios

Dubai Clinical Services Capacity Plan 2025/ Version 2
85
7 Conclusions & Recommendations
International health authorities demonstrate best practices in using clinical services capacity studies to
plan for current and future developments within their respective health sectors.
The DCSCP study provides a comprehensive planning profile of the clinical capacity of Dubai through
2025, covering infrastructure and manpower supply versus projected demand based on status quo
and MHI. The study included government and private health facilities, but as per international best
practice, did not include pharmacies.
The DCSCP report will contribute significantly in planning health services so that they will be delivered
more efficiently and that additional capacity may be deployed effectively to meet expected increase in
population demands. Dubai faces a challenging and exciting future as its population grows
significantly.
7.1 Clinical Services Capacity Gap
A “traffic light” assessment is presented for Hospital Infrastructure and Medical Manpower specialties
based on capacity with the greatest growth in demand and gaps in supply. The assessment dashboard
is presented below for each scenario and 2015 and 2025 based on the following evaluation criteria.
High Priority with greater than a 10% deficit in total supply gap
Medium Priority with greater than or equal to a 3% deficit in total supply gap
Low Priority with less than a 3% deficit in total supply gap
− High Priority indicates an immediate need for planning and investment actions.
− Medium Priority indicates planning action that is to be taken within the next 12 to 24 months.
− Low Priority indicates a planning action that is to be taken within the next five years

Dubai Clinical Services Capacity Plan 2025/ Version 2
86
7.1.1 Hospital Service Type and Clinical Specialties
Table 38 below graphically presents the DCSCP Hospital Service Type and Clinical Service
Specialties priorities for both scenarios:
Specialty SQ Priorities MHI Priorities
Psychiatry
Obstetrics & Gynecology
Orthopedics & Trauma
Gastroenterology & Gastrointestinal Surgery
Emergency Department
Rehabilitation/Long Term Care
Renal Dialysis
General Surgery
Intensive Care
Cardiology including interventions
Neonatology including NICU
Pediatrics
Immunology & Infections
Endocrine, Renal, Urological
Oncology & Hematology
Neurosciences
Plastic, Skin & Breast
Ear, Nose, Throat & Eyes
Respiratory Medicine
General medicine & Ungrouped
Cardiothoracic & Vascular
LEGEND
High Priority with greater than a 10% deficit in total supply gap
Medium Priority with greater than or equal to a 3% deficit in total supply gap
Low Priority with less than a 3% deficit in total supply gap
Table 38: Hospital Service Type and Clinical Specialties Priorities for SQ and MHI Scenarios

Dubai Clinical Services Capacity Plan 2025/ Version 2
87
7.1.2 Medical Manpower Specialties
Table 39 below graphically presents the DCSCP Medical Manpower Specialty priorities. The
assessment for sub-specialties has been separated from Primary Care and General Practice because
of the large gap in supply for this specialty:
Clinical Service SQ Priorities MHI Priorities
Primary Care & General Practice
Anesthesia
Psychiatry
Pediatrics & Child Health
General Surgery
Cardiology
Emergency Medicine
Other Surgery
Gastroenterology & Herpetology
Radiology
Ophthalmology
Orthopedic Surgery
Medical Oncology
Intensive care
Nephrology
Otolaryngology
Endocrinology
Geriatric Medicine
Neurology
Dermatology
Obstetrics & Gynecology
Clinical Pathology
Plastic Surgery
General Medicine
LEGEND
High Priority with greater than a 10% deficit in total supply gap
Medium Priority with greater than or equal to a 3% deficit in total supply gap
Low Priority with less than a 3% deficit in total supply gap
Table 39: Medical Manpower Specialties Priorities for SQ and MHI Scenarios

Dubai Clinical Services Capacity Plan 2025/ Version 2
88
7.2 Clinical Capacity Recommendations
The DCSCP provides a robust strategic planning framework for the effective development of clinical
services Infrastructure and Manpower capacity through to 2025. The following recommendations and
action steps (table 40) are recommended to advance the systematic development of Dubai’s clinical
services in line with projected demand growth.

Dubai Clinical Services Capacity Plan 2025/ Version 2
89
Priority Areas Recommendation Action Steps
Primary Health Care and General Practice
Increase PHC as per need in identified geographic areas
Increase PHC physicians/GPs in Dubai
Increase efficiency on health professionals’ time and effort through a strong referral model that is well-known to the community
Utilize the DCSCP report to advise on establishing & licensure of new facilities to ensure accommodation in specialties/geographic gaps identified
Develop targeted programs to attract Primary Care physicians to work in Dubai
Develop an education and training model to enhance skills of National health professionals
Develop robust clinical guidelines and protocols for patient referral from primary to secondary care
Launch consistent awareness programs to educate the community on the practice of using PHCs as their first point of contact
Acute Care Hospital Services
Establish new hospitals in priority geographic areas
Encourage development in sectors 1,5 and 6
Encourage PPP and investment in hospitals, with focus on priority specialties
Develop and implement a Certificate of Need policy and protocol
Design and implement an investment guide for potential investors
Ensure DHA expansion programs are aligned to the demand in specialties/geographic areas through establishing clear business case protocols
Table 40: DCSCP recommendations & action steps
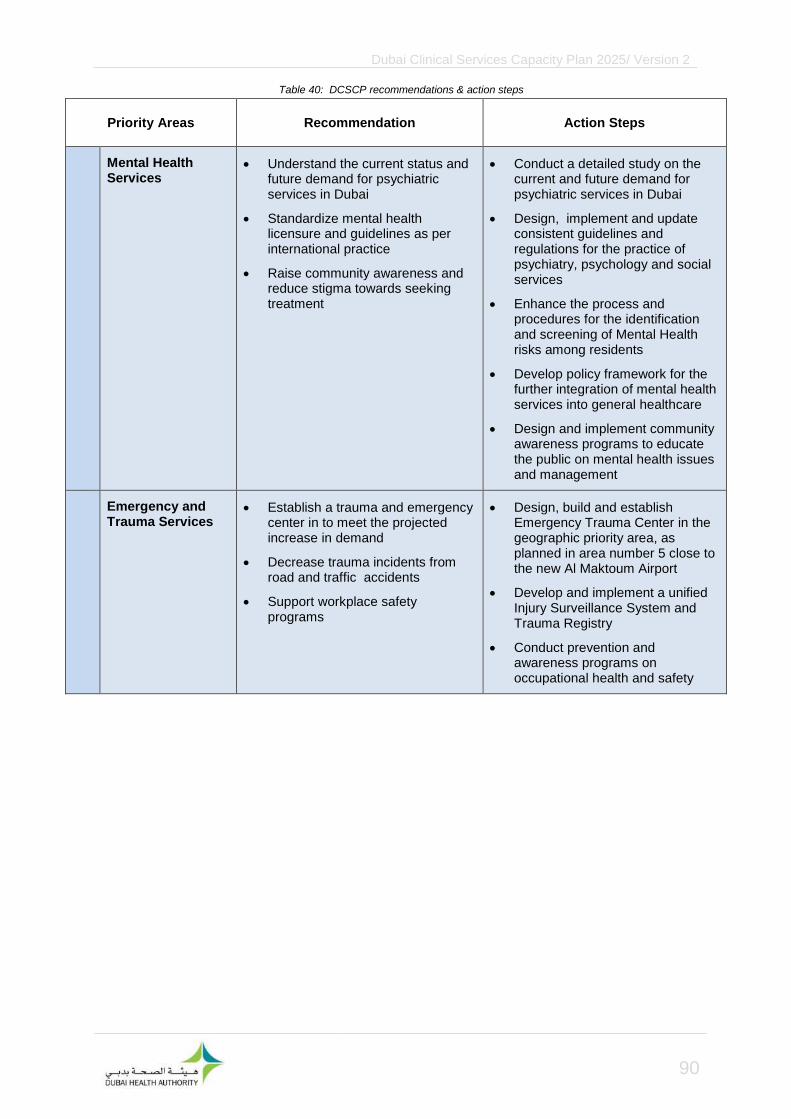
Dubai Clinical Services Capacity Plan 2025/ Version 2
90
Priority Areas Recommendation Action Steps
Mental Health Services
Understand the current status and future demand for psychiatric services in Dubai
Standardize mental health licensure and guidelines as per international practice
Raise community awareness and reduce stigma towards seeking treatment
Conduct a detailed study on the current and future demand for psychiatric services in Dubai
Design, implement and update consistent guidelines and regulations for the practice of psychiatry, psychology and social services
Enhance the process and procedures for the identification and screening of Mental Health risks among residents
Develop policy framework for the further integration of mental health services into general healthcare
Design and implement community awareness programs to educate the public on mental health issues and management
Emergency and Trauma Services
Establish a trauma and emergency center in to meet the projected increase in demand
Decrease trauma incidents from road and traffic accidents
Support workplace safety programs
Design, build and establish Emergency Trauma Center in the geographic priority area, as planned in area number 5 close to the new Al Maktoum Airport
Develop and implement a unified Injury Surveillance System and Trauma Registry
Conduct prevention and awareness programs on occupational health and safety
Table 40: DCSCP recommendations & action steps
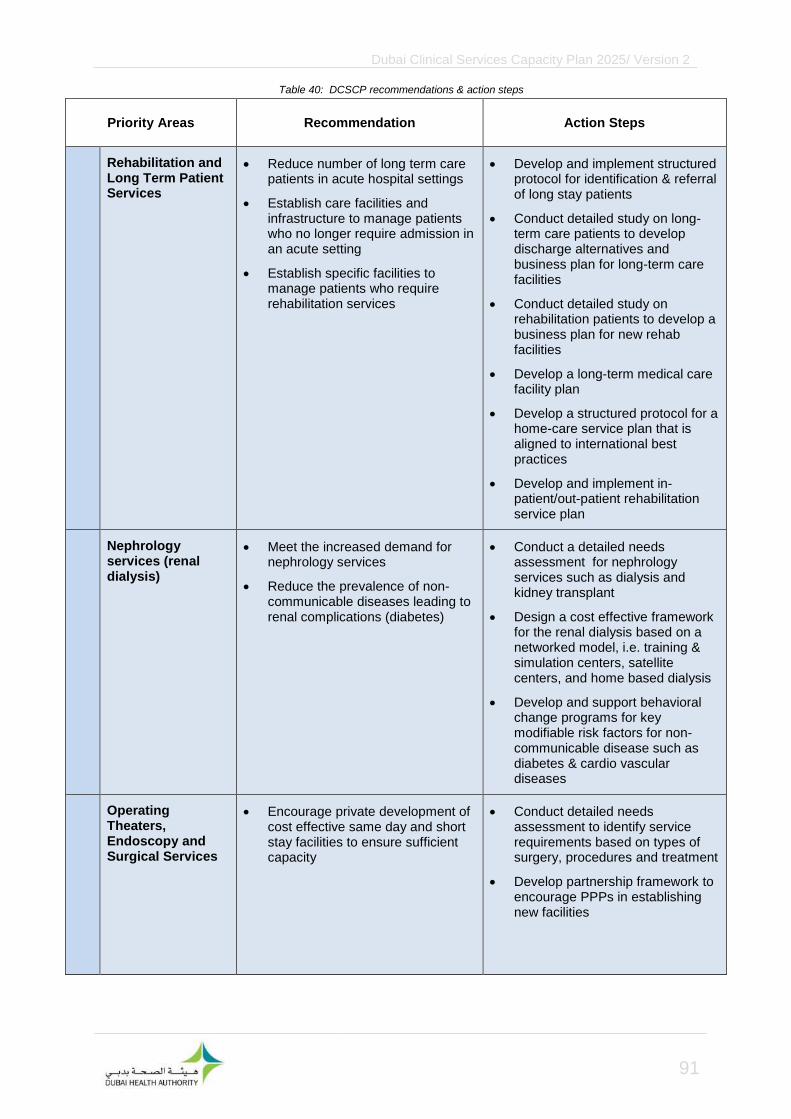
Dubai Clinical Services Capacity Plan 2025/ Version 2
91
Priority Areas Recommendation Action Steps
Rehabilitation and Long Term Patient Services
Reduce number of long term care patients in acute hospital settings
Establish care facilities and infrastructure to manage patients who no longer require admission in an acute setting
Establish specific facilities to manage patients who require rehabilitation services
Develop and implement structured protocol for identification & referral of long stay patients
Conduct detailed study on long-term care patients to develop discharge alternatives and business plan for long-term care facilities
Conduct detailed study on rehabilitation patients to develop a business plan for new rehab facilities
Develop a long-term medical care facility plan
Develop a structured protocol for a home-care service plan that is aligned to international best practices
Develop and implement in-patient/out-patient rehabilitation service plan
Nephrology services (renal dialysis)
Meet the increased demand for nephrology services
Reduce the prevalence of non-communicable diseases leading to renal complications (diabetes)
Conduct a detailed needs assessment for nephrology services such as dialysis and kidney transplant
Design a cost effective framework for the renal dialysis based on a networked model, i.e. training & simulation centers, satellite centers, and home based dialysis
Develop and support behavioral change programs for key modifiable risk factors for non-communicable disease such as diabetes & cardio vascular diseases
Operating Theaters, Endoscopy and Surgical Services
Encourage private development of cost effective same day and short stay facilities to ensure sufficient capacity
Conduct detailed needs assessment to identify service requirements based on types of surgery, procedures and treatment
Develop partnership framework to encourage PPPs in establishing new facilities
Table 40: DCSCP recommendations & action steps

Dubai Clinical Services Capacity Plan 2025/ Version 2
92
Priority Areas Recommendation Action Steps
Oncology Services Establish care facilities that will
manage specific areas within oncology services as per the community’s requirements
Conduct detailed planning studies to identify demand for services as per treatment classification
Carry out feasibility studies and develop business case for design, build and operate of oncology centers
Attract and retain healthcare professionals , especially physicians and nurses, to fulfill the increase in demand throughout the years
Maintain a sustainable clinical workforce in Dubai health sector as per international standards and accreditations across all specialties and sub-specialties
Conduct a survey on a random sample of healthcare professionals working in Dubai to know all their characteristics and opinions in order to develop and implement a comprehensive talent management strategy to attract, recruit and retain health professionals within identified requirement specialties and sub-specialties (Nationals and Expatriates)
Establish additional three new medical colleges and five schools of nursing in the emirate of Dubai by 2025
Expand post graduate training programs, in affiliation with local and international medical education institutes, to provide continuous skill development in identified medical specialty areas
Establish a medical education council to coordinate training and medical research process as per international best practice
Integrated Health Information and Technology (HIT) System
Enhance HIT standards and systems within all Public and Private providers to promote improvement in the collection of data and reliable reporting of performance and outcome information
Develop a HIT strategy to promote system integration, standardized data collection and reporting towards eHealth
Diagnostic Coding & Clinical Classification
Improve the practices of diagnostic coding by creating a DHA data dictionary and conducting regular hospital and clinic audits
Develop a standard clinical service-line classification system by DRG to support improve management and planning
Develop a program for the development and introduction of Guidelines and Data Dictionaries to promote improved diagnostic and procedure coding
Develop a transition strategy for the implementation of a DRG based clinical classification system
Table 40: DCSCP recommendations & action steps

Dubai Clinical Services Capacity Plan 2025/ Version 2
93
Dubai Health Authority Dr. Awatif Abuhaliga [email protected] Dr. Meenu Mahak Sodhi [email protected] Dr. Eldaw Suliman [email protected] Mr. Altijani Haydar Altijan Hussin [email protected] Ms. Priya Sridharan [email protected]
TAHPI Mr. Aladin Niazmand [email protected] Mr. Robert Martin [email protected]