REPORT ANNUAL 2014 - Front page - Grieg Group MATURITAS 4 2014 ANNUAL REPORT Grieg Shipbrokers –...
32
2014 REPORT ANNUAL
Transcript of REPORT ANNUAL 2014 - Front page - Grieg Group MATURITAS 4 2014 ANNUAL REPORT Grieg Shipbrokers –...

2014
REPORTANNUAL

CONTENTS
Directors Report
Profit and loss statement
Balance sheet
Cashflow statement
Notes
Auditors report
3
8
9
11
12
30
3 GRIEG MATURITAS ANNUAL REPORT2014
DIRECTORS’ REPORT 2014 - GRIEG MATURITAS
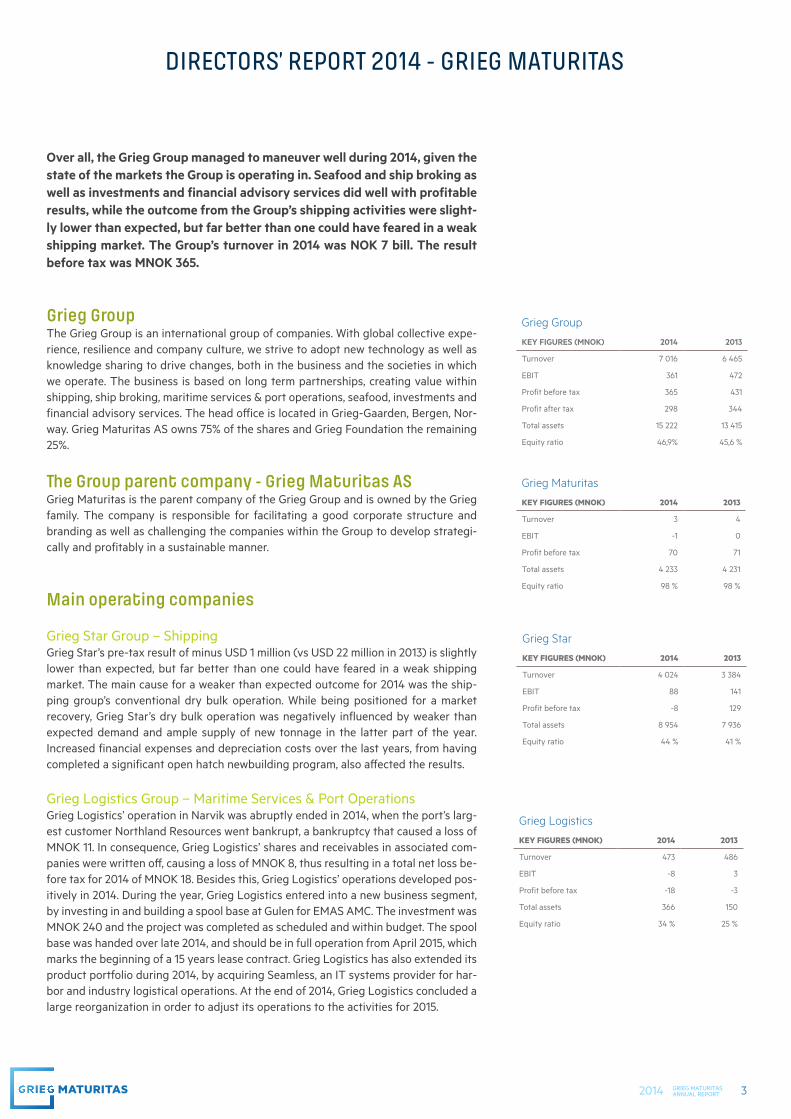
Over all, the Grieg Group managed to maneuver well during 2014, given the state of the markets the Group is operating in. Seafood and ship broking as well as investments and financial advisory services did well with profitable results, while the outcome from the Group’s shipping activities were slight-ly lower than expected, but far better than one could have feared in a weak shipping market. The Group’s turnover in 2014 was NOK 7 bill. The result before tax was MNOK 365.
Grieg GroupThe Grieg Group is an international group of companies. With global collective expe-rience, resilience and company culture, we strive to adopt new technology as well as knowledge sharing to drive changes, both in the business and the societies in which we operate. The business is based on long term partnerships, creating value within shipping, ship broking, maritime services & port operations, seafood, investments and financial advisory services. The head office is located in Grieg-Gaarden, Bergen, Nor-way. Grieg Maturitas AS owns 75% of the shares and Grieg Foundation the remaining 25%.
The Group parent company - Grieg Maturitas ASGrieg Maturitas is the parent company of the Grieg Group and is owned by the Grieg family. The company is responsible for facilitating a good corporate structure and branding as well as challenging the companies within the Group to develop strategi-cally and profitably in a sustainable manner.
Main operating companies
Grieg Star Group – ShippingGrieg Star’s pre-tax result of minus USD 1 million (vs USD 22 million in 2013) is slightly lower than expected, but far better than one could have feared in a weak shipping market. The main cause for a weaker than expected outcome for 2014 was the ship-ping group’s conventional dry bulk operation. While being positioned for a market recovery, Grieg Star’s dry bulk operation was negatively influenced by weaker than expected demand and ample supply of new tonnage in the latter part of the year. Increased financial expenses and depreciation costs over the last years, from having completed a significant open hatch newbuilding program, also affected the results.
Grieg Logistics Group – Maritime Services & Port OperationsGrieg Logistics’ operation in Narvik was abruptly ended in 2014, when the port’s larg-est customer Northland Resources went bankrupt, a bankruptcy that caused a loss of MNOK 11. In consequence, Grieg Logistics’ shares and receivables in associated com-panies were written off, causing a loss of MNOK 8, thus resulting in a total net loss be-fore tax for 2014 of MNOK 18. Besides this, Grieg Logistics’ operations developed pos-itively in 2014. During the year, Grieg Logistics entered into a new business segment, by investing in and building a spool base at Gulen for EMAS AMC. The investment was MNOK 240 and the project was completed as scheduled and within budget. The spool base was handed over late 2014, and should be in full operation from April 2015, which marks the beginning of a 15 years lease contract. Grieg Logistics has also extended its product portfolio during 2014, by acquiring Seamless, an IT systems provider for har-bor and industry logistical operations. At the end of 2014, Grieg Logistics concluded a large reorganization in order to adjust its operations to the activities for 2015.
Grieg Group
KEY FIGURES (MNOK) 2014 2013
Turnover 7 016 6 465
EBIT 361 472
Profit before tax 365 431
Profit after tax 298 344
Total assets 15 222 13 415
Equity ratio 46,9% 45,6 %
Grieg Maturitas
KEY FIGURES (MNOK) 2014 2013
Turnover 3 4
EBIT -1 0
Profit before tax 70 71
Total assets 4 233 4 231
Equity ratio 98 % 98 %
Grieg Star
KEY FIGURES (MNOK) 2014 2013
Turnover 4 024 3 384
EBIT 88 141
Profit before tax -8 129
Total assets 8 954 7 936
Equity ratio 44 % 41 %
Grieg Logistics
KEY FIGURES (MNOK) 2014 2013
Turnover 473 486
EBIT -8 3
Profit before tax -18 -3
Total assets 366 150
Equity ratio 34 % 25 %

4 GRIEG MATURITAS ANNUAL REPORT2014
Grieg Shipbrokers – ship brokingGrieg Shipbrokers made solid improvements in 2014. During the first half of the year, a number of newbuilding contracts were entered into on behalf of various clients, which increased the company’s forward book considerably. In addition, a number of second hand sales were concluded, which contributed to a significant increase in op-erating revenues compared to 2013. The company’s gas department, especially, had another good year, whereas the other departments were negatively affected by the weak shipping markets. Grieg Shipbrokers – rebranded from Joachim Grieg & Co in 2014 – is now covering most shipping segments given its significant organic growth in recent years.
Grieg Investor – Independent Financial AdvisorGrieg Investor holds a strong position as an independent investment advisor to a diversified customer portfolio consisting of municipalities, foundations, associations, pension funds, insurance companies, life insurance companies and family owned in-vestment companies in Norway. The company’s focus on qualified and independent advice is believed to be the main contributor to Grieg Investor’s financial results, end-ing 2014 with a result before tax of MNOK 11 vs. MNOK 10 in 2013.
Grieg Seafood Group - SeafoodGrieg Seafood delivered a profit before tax of MNOK 285 in 2014, up from MNOK 262 in 2013, primarily as a result of improved prices. Salmon prices were strong through-out the year, but trade sanctions against Russia resulted in lower than expected pric-es towards the end of the year. Other challenges were fish maturity in Finnmark as well as environmental and disease conditions in Rogaland resulting in PD (Pancreas disease) and unusually high sea temperatures. These conditions, however, stabilized at the end of 2014. The company is systematically working to reduce the level of costs through improved operations and biological performance. As part of this, Grieg Seafood has decided to terminate its Pacific salmon activities and focus solely on the production of Atlantic salmon going forward. 64 736 tons of salmon were harvested in 2014, reflecting an increase of 6 675 tons compared to 2013. The same level of growth is planned for the coming years.
Grieg International - Investments and Private Equity Grieg International’s investment portfolio consists of both direct investments in com-panies and investments in PE funds. The combination of a positive trend in the finan-cial markets and realization of investments, gave a positive contribution to the com-pany’s result in 2014, resulting in a pre-tax result of MNOK 19 vs. MNOK 44 in 2013.
In 2014, Grieg International sold all its shares in Maris AS to Navico. The synergy between Navico’s position as the number one provider of marine electronics to the recreational ship segment and Maris’ position within the professional shipping market, are believed to be quite unique. Navico will be able to offer Maris the competence and global network that will strengthen their strategic position going forward. As part of the transaction, Grieg International received shares in Navico.
Grieg Foundation – Charity FoundationGrieg Group emphasizes social responsibility and contributes actively through Grieg Foundation’s ownership in the Grieg Group. Through the foundation, 25% of the val-ues created by the Grieg Group are endowed to the society as Grieg Foundation sup-ports global projects for education of children and youth, medical research, environ-mental projects as well as arts and cultural projects. Since the start in 2002, Grieg Foundation’s total contribution is MNOK 453.
Risk Managing risk is important for value creation and an integrated part of the Group’s governing model. Given the global activities and different business areas, the compa-nies within the Grieg Group are exposed to different types and degrees of risks rang-ing from market operations and finance risk to compliance and regulatory framework. Thus, we are constantly focusing on how to identify and monitor the risk areas in the Group companies as well as developing strategies to reduce such risks.
Grieg Investor
KEY FIGURES (MNOK) 2014 2013
Turnover 51 44
EBIT 11 10
Profit before tax 11 10
Total assets 33 29
Equity ratio 28 % 13 %
Grieg Seafood (NGAAP)
KEY FIGURES (MNOK) 2014 2013
Turnover 2 675 2 425
EBIT 264 327
Profit before tax 285 262
Total assets 4 655 4 092
Equity ratio 44% 43%
Grieg International
KEY FIGURES (MNOK) 2014 2013
Net financial items 27 47
Profit before tax 19 44
Total assets 950 953
Equity ratio 99% 98 %
Grieg Foundation - distributions
(MNOK) 2014 2013
Education of children & youth 13 095 10 456
Musical art 3 935 3 880
Cultural projects 1 755 2 515
Medical research and projects 3 655 6 117
Other projects 6 390 9 192
Total 28 830 32 160
Grieg Shipbrokers
KEY FIGURES (MNOK) 2014 2013
Turnover 91 63
EBIT 3 -12
Profit before tax 5 -12
Total assets 55 46

5 GRIEG MATURITAS ANNUAL REPORT2014
Foreign currency riskA large proportion of the Group’s revenues, assets and liabilities are in foreign cur-rencies, mainly USD. Changes in foreign exchange rates therefore affect the accounts, which are prepared in NOK. The Group companies have strategies and procedures to reduce both the exchange rate and interest rate risks.
Financial riskSeveral of the Group’s companies have considerable financial investment portfolios, and changes in the value of international securities and interest rates directly affect their results. The portfolios are managed in accordance with long-term strategies and within defined mandates, also reflecting the Group’s business principles.
Market riskThe Group’s ship’ earnings are to a large extent related to cargo transportation con-tracts as a considerable share of the shipping activities is of an industrial character. This implies that revenues are less volatile than in the spot market, and that changing market conditions generally have a delayed effect on the results.
The Group is also exposed to fluctuations in the spot prices for salmon, which is main-ly determined by global supply. Although the effect of changing prices is somewhat reduced through Grieg Seafood’s geographical diversification, the long production cycles makes it challenging to respond rapidly to changing market prices. Salmon is primarily traded at spot prices.
Credit and counterparty riskThe risk of the Group’s counterparties, being unable to meet their financial obliga-tions, is considered to be relatively low given the assumption that the Group’s cus-tomers on a general basis are financially strong and that having various business areas gives a diversified customer portfolio. The Group also tries to reduce this risk by maintaining good procedures for assessing counter party risk.
For further information concerning financial risk see note 17 in the Group accounts.
Organization and working environment The companies in the Grieg Group are to a large extent knowledge intensive, and the employees’ qualifications constitute a substantial part of the business capital. Our aim is to be an attractive employer where people can develop and enjoy working. The Board is of the opinion that job satisfaction is generally high and that the working environment is good. Throughout the organization there are on-going training and learning activities, taking place in various formats and contexts.
Equal opportunitiesThe Grieg Group seeks at all times to ensure equal opportunities and rights for all its employees. In the Group, we do not accept discrimination on the basis of gender, religion, cultural background or race, or in any other form.
Health and safetyThere is continuous focus on training and the quality of work processes in the Grieg Group companies aimed to reduce the risk of serious incidents. The work force in general is stable, and absence and injuries rates are low. Besides organizing medical follow-ups, the Group encourages and facilitates participation in physical activities for the employees to stay fit.
Corporate Social Responsibility The Grieg Group emphasizes on creating economic and social values in a long-term perspective, recognizing the environmental and social impacts of our business ac-tivities. As well as complying with both national and international environmental regulations, laws and rules, the Group’s companies strive to play a proactive role in implementing environmental procedures and technology in order to reduce the risk of environmental damage.
Employees 2014 2013
Employees 2 033 2 025
Working envinroment 2014 2013
Sick-leave 3,4% 4,2%
Long-term sick-leave 3,0% 3,5%
Major injuries 1 0
6 GRIEG MATURITAS ANNUAL REPORT2014
Shipping operations entail the discharge of harmful emissions. Given the environmen-tal vision of “No harmful emissions to air, sea and land” the shipping operations’ strat-egy is to work systematically and continuously to improve its fleet’s energy consump-tion. Status by year-end 2014 is a 29.4% reduction, (vs. 23.6% in 2013), measured by the EEOI CO2 index . Hence, Grieg Star is beyond its internal target of 20% reduction by year-end 2015, compared to 2006 levels. The main cause for the savings are increased use of eco-speed and various technical improvements as well as fleet renewal and recycling of older vessels.
Grieg Star is committed to UN Global Compact and transparent reporting on progress (GRI). Raising the bar on compliance matters in shipping continues to be a target area. During 2014, the company implemented new procedures for handling corruption in ports and canals, a work that already is paying off. This is among others achieved through valuable learning from participating in the Maritime Anti-Corruption Net-work. Integrity due diligence with regards to suppliers and other business partners received renewed focus in 2014, through the revision of Grieg Star’s Suppliers’ Code of Conduct.
Grieg Seafood’s main cost drivers, risks and opportunities are increasingly connected with managing the impact on the environment. Systematic efforts to secure a bal-anced sustainability are therefore fundamental in order to facilitate long-term prof-itable growth. The company has during the last years conducted an assessment in order to accentuate priority areas for sustainability. The priorities intend to ensure that the efforts respond to Grieg Seafood’s main stakeholders´ expectations, as well as being resource efficient in terms of the company’s strategy and long-term value creation. A comprehensive statement of Grieg Seafood’s approach, efforts, results and ambitions towards sustainability priorities is available in the company’s Sustain-ability Report.
Grieg Seafood has committed to common sustainability goals for the industry through the Global Salmon Initiative (GSI), together with several other global fish farming companies. By this, Grieg Seafood is committed to work towards several ambitious goals, among these are minimizing environmental impact and to produce healthy and nutritious products in a sustainable way.
The Grieg Group’s headquarter Grieg-Gaarden, is certified as an eco-lighthouse.
Corporate GovernanceIn order to ensure that the division of tasks and roles between the administration, the Board of Directors and the General Meeting is based on sound practice, the Nor-wegian Recommendation on Corporate Governance, is applied. Deviation may arise given the fact that the Group is privately-owned.
The companies in The Grieg Group operate independently, but close cooperation across company borders is encouraged. This contributes to a higher knowledge level and shared culture. In order to ensure an ethical foundation for its business as well as a solid company culture, we have four common core values; Solid, Proud, Open and Committed. The values define the compass by which we navigate when doing busi-ness across the world.
OutlookIn 2014, the Grieg Group celebrated 130 years of history and an exciting future. A new logo and visual profile were launched, as well as a new global internet based commu-nity (130+) for all employees. The purpose with 130+ is to facilitate, encourage and hopefully inspire to communicate closer together by sharing, regardless of company or location. We also won the national final of EY’s Entrepreneur of the Year Award (EOY) in the category “Industry”, an award created by EY to recognize significant accomplishments of entrepreneurs around the world. The objective is to continue to developing the Group’s business areas through focusing on innovation and interac-tion going forward.

7 GRIEG MATURITAS ANNUAL REPORT2014
For Grieg Star, the weak dry bulk market is the dominant story so far in 2015. This gives reason to expect yet another year with low results, unless something unexpect-ed happens, which historically often has been the case in shipping. In the meantime, there is an increasing share of scrapping of old tonnage taking place and hardly any newbuilding contracts being entered into, which may be promising in a not so distant future. Grieg Star is optimistic about the market in the long term, remaining commit-ted to the business.
Grieg Shipbrokers is now covering most shipping segments after building up the or-ganization over the last years. The company regards the outlook for the different shipping segments to be varying for 2015, but do however, believe in some kind of improvement as the year progresses.
Grieg Seafood’s main goals for 2015 are better license utilization and lower costs through continuous improvement of biological performance. The company expects to harvest 72 000 tons in 2015, taking into account a normalized harvested volume of around 13 000 tons expected to be re-established in British Columbia. In Finnmark and Shetland, some decline in the harvested volume is likely in 2015, as a consequence of adjustment to the zoning and location structure in these regions. This will result in increased costs in 2015, and then an expected increase in volumes again in 2016. The final allocation of green licenses in Finnmark was made in Q4 2014. Grieg Seafood was awarded four licenses, providing a basis for considerable growth going forward.
Grieg Logistics plans for further growth in 2015, expecting positive operating results from all its business areas. Additional investments in the recently acquired company Seamless is also to be expected, in order to strengthen their products and increase capacity for further growth - both with respect to the product portfolio and geograph-ical expansion.
Grieg Investor entered the year with a good list of prospects, which indicates a prom-ising potential for growth in revenues as well as profit going forward.
Going concernThe Board of Directors confirms that the annual accounts have been prepared on a going concern basis and that this assumption is valid, based on the Group’s solid financial position and expectations of future profits. The Board believes that the sub-mitted annual accounts give a correct picture of the result, cash flow and economic situation. No events have taken place after the balance sheet day, which significantly would affect the accounts.
The employees’ daily contribution to the Grieg Group has an impact beyond our finan-cial results. The Board of Directors would like to thank all employees for their good efforts throughout the year.
Bergen, 17th of March 2015 The Board of Directors of Grieg Maturitas AS
Elna-Kathrine Grieg Chair
Per Grieg jr. Board Member
Elisabeth Grieg Board Member
Camilla Grieg Board Member
Stig Grimsgaard Andersen Board Member
Wenche Kjølås Managing Director
8 GRIEG MATURITAS ANNUAL REPORT2014 8 GRIEG 2014
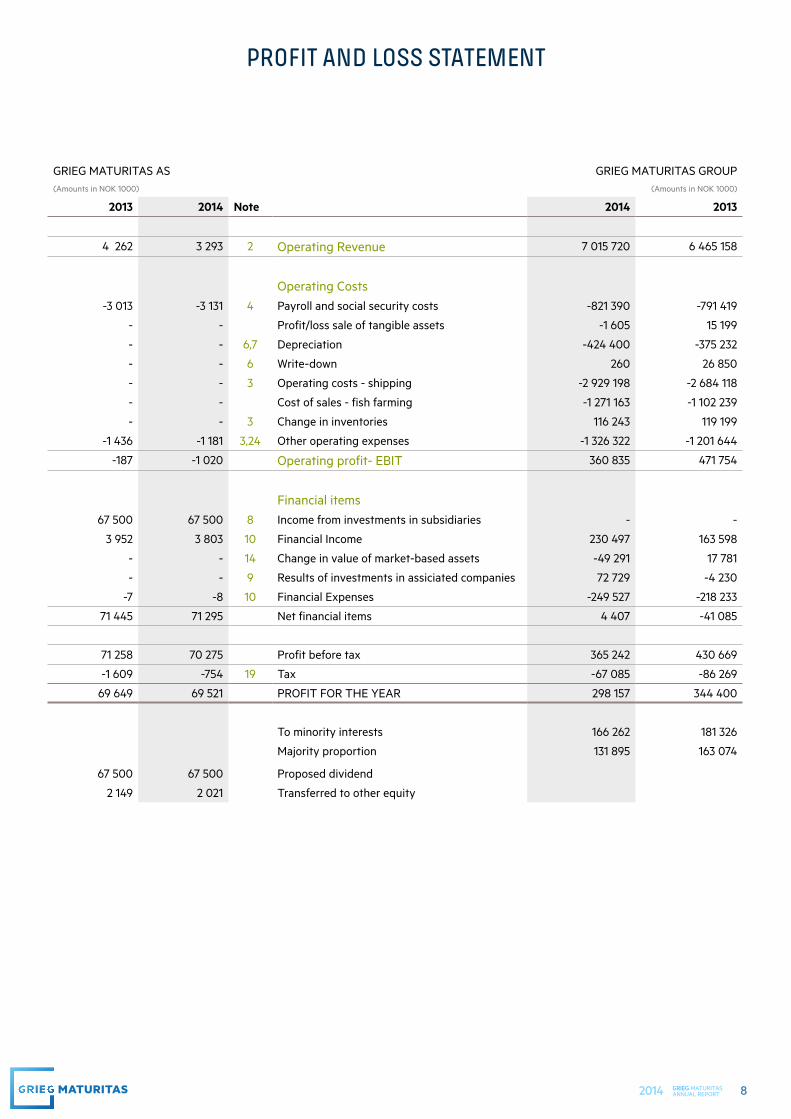
PROFIT AND LOSS STATEMENT
GRIEG MATURITAS AS GRIEG MATURITAS GROUP(Amounts in NOK 1000) (Amounts in NOK 1000)
2013 2014 Note 2014 2013
4 262 3 293 2 Operating Revenue 7 015 720 6 465 158
Operating Costs-3 013 -3 131 4 Payroll and social security costs -821 390 -791 419
- - Profit/loss sale of tangible assets -1 605 15 199
- - 6,7 Depreciation -424 400 -375 232
- - 6 Write-down 260 26 850
- - 3 Operating costs - shipping -2 929 198 -2 684 118
- - Cost of sales - fish farming -1 271 163 -1 102 239
- - 3 Change in inventories 116 243 119 199
-1 436 -1 181 3,24 Other operating expenses -1 326 322 -1 201 644
-187 -1 020 Operating profit- EBIT 360 835 471 754
Financial items67 500 67 500 8 Income from investments in subsidiaries - -
3 952 3 803 10 Financial Income 230 497 163 598
- - 14 Change in value of market-based assets -49 291 17 781
- - 9 Results of investments in assiciated companies 72 729 -4 230
-7 -8 10 Financial Expenses -249 527 -218 233
71 445 71 295 Net financial items 4 407 -41 085
71 258 70 275 Profit before tax 365 242 430 669
-1 609 -754 19 Tax -67 085 -86 269
69 649 69 521 PROFIT FOR THE YEAR 298 157 344 400
To minority interests 166 262 181 326
Majority proportion 131 895 163 074
67 500 67 500 Proposed dividend
2 149 2 021 Transferred to other equity

9 GRIEG MATURITAS ANNUAL REPORT2014 9 GRIEG 2014
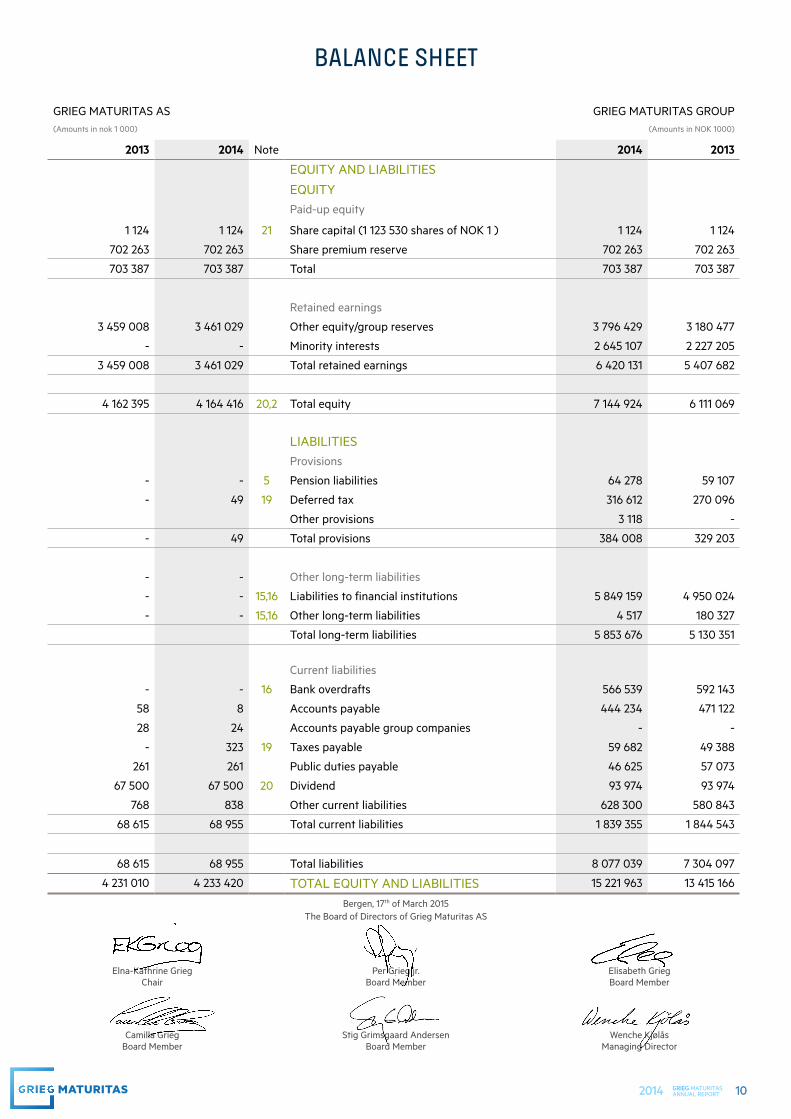
BALANCE SHEET
GRIEG MATURITAS AS GRIEG MATURITAS GROUP
(Amounts in NOK 1000) (Amounts in NOK 1000)
2013 2014 Note 2014 2013
ASSETS
FIXED ASSETSIntangible fixed assets
- - Research and development - 10 450
- - Contracts 49 803 45 786
382 - 19 Deferred tax assets - -
- - Goodwill 28 778 27 130
- - Licenses 1 077 701 998 611
382 - 7 Total intangible assets 1 156 282 1 081 977
Tangible assets
- - Land and real estate 694 650 643 289
- - Loading and discharge equipment 89 444 72 329
- - Newbuilding contracts 61 038 255 540
- - Vessels 6 833 704 5 769 058
- - Vehicles,machinery and equipment 1 138 751 958 230
- - 6 Total tangible assets 8 817 587 7 698 446
Long-term financial assets
3 969 296 4 021 796 8 Investments in subsidiaries - -
- - 9 Investments in associated companies 48 086 51 293
- - 13 Loans to associated companies 10 470 28 359
- - 11 Shareholding and other investments 299 965 233 362
- - 4,13 Other receivables 282 838 28 257
3 969 296 4 021 796 Total long-term financial assets 641 360 341 271
3 969 678 4 021 796 Total fixed assets 10 615 229 9 121 694
CURRENT ASSETS
- - 12 Stocks 1 839 213 1 690 862
- - Accounts receivable 446 146 376 600
67 525 67 508 Receivables from subsidiaries - -
37 10 Other receivables 348 767 259 850
67 563 67 519 Total receivables 794 914 636 450
- - 14 Financial Investments 1 213 323 1 059 321
193 768 144 105 16 Cash and bank deposits 759 284 906 839
261 331 211 624 Total current assets 4 606 734 4 293 472
4 231 010 4 233 420 TOTAL ASSETS 15 221 963 13 415 166
10 GRIEG MATURITAS ANNUAL REPORT2014 10 GRIEG 2014
BALANCE SHEET
GRIEG MATURITAS AS GRIEG MATURITAS GROUP(Amounts in nok 1 000) (Amounts in NOK 1000)
2013 2014 Note 2014 2013
EQUITY AND LIABILITIES
EQUITY Paid-up equity
1 124 1 124 21 Share capital (1 123 530 shares of NOK 1 ) 1 124 1 124
702 263 702 263 Share premium reserve 702 263 702 263
703 387 703 387 Total 703 387 703 387
Retained earnings
3 459 008 3 461 029 Other equity/group reserves 3 796 429 3 180 477
- - Minority interests 2 645 107 2 227 205
3 459 008 3 461 029 Total retained earnings 6 420 131 5 407 682
4 162 395 4 164 416 20,2 Total equity 7 144 924 6 111 069
LIABILITIESProvisions
- - 5 Pension liabilities 64 278 59 107
- 49 19 Deferred tax 316 612 270 096
Other provisions 3 118 -
- 49 Total provisions 384 008 329 203
- - Other long-term liabilities
- - 15,16 Liabilities to financial institutions 5 849 159 4 950 024
- - 15,16 Other long-term liabilities 4 517 180 327
Total long-term liabilities 5 853 676 5 130 351
Current liabilities
- - 16 Bank overdrafts 566 539 592 143
58 8 Accounts payable 444 234 471 122
28 24 Accounts payable group companies - -
- 323 19 Taxes payable 59 682 49 388
261 261 Public duties payable 46 625 57 073
67 500 67 500 20 Dividend 93 974 93 974
768 838 Other current liabilities 628 300 580 843
68 615 68 955 Total current liabilities 1 839 355 1 844 543
68 615 68 955 Total liabilities 8 077 039 7 304 097
4 231 010 4 233 420 TOTAL EQUITY AND LIABILITIES 15 221 963 13 415 166
Bergen, 17th of March 2015 The Board of Directors of Grieg Maturitas AS
Elna-Kathrine Grieg Chair
Per Grieg jr. Board Member
Elisabeth Grieg Board Member
Camilla Grieg Board Member
Stig Grimsgaard Andersen Board Member
Wenche Kjølås Managing Director

11 GRIEG MATURITAS ANNUAL REPORT2014 11 GRIEG 2014
CASHFLOW STATEMENT
GRIEG MATURITAS AS GRIEG MATURITAS GROUP
(Amounts in nok 1 000) (Amounts in NOK 1000)
2013 2014 2014 2013
Cash flow from operation activities 71 258 70 275 Profit before tax 365 242 430 669
- - Taxes paid -49 388 -72 540
- - Gain/loss from sale of fixed assets 1 605 -15 199
-67 500 -67 500 Dividends receivable taken to income - -
- - Ordinary depreciation 424 400 375 232
- - Write-down of fixed assets - -26 850
- - Items classified as investment or financial activities 49 291 -17 781
- - Change in inventory -148 351 -253 241
- - Change in accounts receivable from customers -69 546 -93 690
-163 -53 Change in accounts payable to suppliers -26 888 110 735
-1 592 27 Change in accruals -230 586 91 357
- - Difference in expenses pensions and payment in/out -12 270 11 819
- - Effect of change in exchange rate 5 124 35 804
- - Share of profit from associated companies (equity method) -12 054 4 230
- - Gain/loss on sales of shares without cash effect -54 004 -
- - Change in other provisions - 868
2 003 2 749 Net cashflow from operation activities 258 837 581 413
Cash flow from investing activities
- - Sale of fixed assets 462 551 38 941
- - Purchase of fixed assets/newbuilding contracts -662 535 -1 378 729
- - Purchase of intangible assets -57 024 -5 300
491 60 517 Payment from other group companies - -
- - Sale of share and unit 459 872 659 997
- -52 500 Purchase of shares and securities -416 453 -106 420
491 15 017 Net cash flow from investing activities - 213 589 -791 511
Cash flow from financing activities- - Net change in bank overdraft -432 455 -119 055
- - Loan repayment ( short/long-term) -1 210 926 -448 598
-113 70 Loan proceeds 1 489 402 891 117
45 000 - Dividend group companies not booked in P/L - -
-40 000 -67 500 Dividends paid -93 974 -57 923
- - Capital increase 55 150 -
4 887 -67 430 Net cash flow from financing activities -192 802 265 541
7 381 -49 663 Net cash flow for the period -147 554 55 443
186 386 193 768 Opening balance of cash and cash equivalents 906 839 851 396
193 768 144 105 Cash and equivalents 31.12 759 284 906 839
193 768 144 105 The consists of: Bank deposits, cash in hand etc. 759 284 906 839

12 GRIEG MATURITAS ANNUAL REPORT2014
NOTES
NOTE 1 Accounting principles 13
NOTE 2 Segment information 15
NOTE 3 Other operating expenses 15
NOTE 4 Payroll costs, number of employees, remuneration etc. 15
NOTE 5 Pensions and pension commitments 16
NOTE 6 Fixed assets 17
NOTE 7 Intangible assets 18
NOTE 8 Investments in subsidiaries 18
NOTE 9 Investments in associated companies 21
NOTE 10 Financial items 21
NOTE 11 Shareholdings and other investments 22
NOTE 12 Stock and bunkers 22
NOTE 13 Receivables due in more than one year 23
NOTE 14 Marketbased financial investments 23
NOTE 15 Debt payable in more than 5 year 23
NOTE 16 Mortgages/guarantee liability/restricted funds 24
NOTE 17 Financial risk 25
NOTE 18 Contingencies and subsequent events 26
NOTE 19 Taxes 26
NOTE 20 Equity 27
NOTE 21 Share capital and share information 28
NOTE 22 Related parties 28
NOTE 23 Operational leasing 29
NOTE 24 Remuneration to auditor 29

13 GRIEG MATURITAS ANNUAL REPORT2014 13 GRIEG 2014
Note 1 Accounting principlesThe Annual Accounts for Grieg Maturitas AS have been prepared in accordance with Norwegian accounting legislation generally accepted accounting principles.
Group AccountsThe consolidated accounts include the subsidiaries specified in note 8 and shows the accounts of the parent company and the subsidiaries as a single economic unit. Shareholdings and investments in subsid-iaries are eliminated on the basis of the acquisition method. The cost of shareholdings and investments in subsidiaries is eliminated against the book equity of the shares/investments at the date of acquisition. Any difference arising is posted to the identifiable assets. Any surplus value that cannot be attributed to specific assets, or the company’s own intangible assets, is described as goodwill and is depreciated over its estimated lifetime. Intra-group transactions and internal balances are eliminated.
Companies that is bought or sold during the year, is included in the group accounts from the time of control arises or ceases. On the consolidation of foreign subsidiaries, the profit and loss accounts are translated into NOK at the average exchange rate for the year. The balance sheets are translated at the year-end rates. Any translation differences are posted directly to group equity.
Changed owner share in subsidiaries, where the company after the transaction still is a subsidiary, is a equity transaction for the group.The income statements and balance sheets of the group entities that have a functional currency different from the presentation currency are translated into the presentation currency as follows:
(i) assets and liabilities are translated at the at the closing rate on the date of the balance sheet, (ii) income and expense items in the income statement are trans-lated at average exchange rates for the period (unless this aver-age is not a reasonable estimate of the cumulative effect of the rates prevailing on the transaction dates, in which case income and expenses are translated on the dates of the transactions). (iii) translation differences are recorded in equity and specified sepa-rately.
Operating RevenueOperating revenue are entered as income at the time of delivery. The time of delivery is understood to mean the time of transfer of risk and control related to the delivery. Freight revenues from voyages are rec-ognised on the basis of the number of days the voyage lasts. Revenue is shown, net of value added tax, returns and discounts.
Classification of assets and liabilities – main ruleAssets intended for long-term ownership or use are classified as fixed assets. Other assets are classified as current assets. Receivables due within one year are classified as current assets. The corresponding criteria are applied to classify liabilities. Certain items are stated on the basis of special valuation rules, in accordance with accountancy legislation, as detailed below. Other assets and liabilities are classified as fixed assets and long-term liabilities, respectively.
InventoriesInventories are recognised at the lower of cost ted at cost or at written down value to take account of obsolescence. Goods in progress, and finished goods are recognised at the lower of full cost and net sales value. The net sales value of finished goods is calculated as sales value less sales costs. The stock of bunkers consists of fuel and diesel and are recognised at cost on the basis of the fifo method.
Foreign currencyAssets and liabilities denominated in foreign currencies are stated at the year-end exchange rate. agio, or disagio, on settlements or conversion of monetary items in foreign currency on the day of bal-ance is allocated. Transactions in foreign currencies is recalculated to transaction rate.
Foreign exchange hedging derivatives purchased in order to reduce the currency risk for the sub-group Grieg Star Group are recognised
as hedging transactions. Gains/losses of foreign exchange contracts are therefore recorded in the same period as the hedged transactions. Please refer to note 17. Unrealized gain/loss on the hedging contracts is not posted on the balance sheet.
Interest rate hedging interest rate hedging contracts are recognised and classified in the same way as the related mortgage loan. The interest received/paid under the contract is therefore recognised in the interest period in question, and is included in interest cost/income for the period. Unre-alized gain/loss on the hedging contracts is not posted on the balance sheet.
Accounts receivableAccounts receivable are stated at nominal value less provisions for ex-pected losses. The loss provision is based on an individual assessment of each accounts receivable.
Investments in subsidiariesA company is defined as a subsidiary if the group has a decisive influence on its operations. This is normally the case where the group holds more than 50 % of the voting share capital. Subsidiaries are posted in the company accounts applying the cost method. The investment is stated at historical cost of the shares unless a write-down has been necessary. The investment is written down to fair value when the reduced value is due to causes which are not deemed to be temporary. Write-downs are reversed when the grounds for the write-down no longer exist. Dividends and other distributions are rec-ognised in the year in which they are provided for in the accounts of the subsidiary. If the dividend exceeds the profit after the acquisition, the surplus amount represents repayment of the capital investment and the distributions are deducted from the amount of the investment in the balance sheet.
Investments in sharesInvestments in limited partnerships are recorded on the basis of the cost method whereby the investment is stated at cost in the balance sheet. The distribution of profits/contribution to cover losses from in-vestments in limited partnerships is taken to income/charged against profits under financial items. Profits from investments in limited partnerships are taxable in the hands of the respective participants. Reference is made to separate specifications in this connection.
Jointly controlled activitiesIn the case of investments in companies where two or more of the participants have joint control of the business regulated through a cooperation agreement between the participants, the investment is recorded on the basis of the gross method or the equity method. None of the participants have a decisive influence. According to the gross method, the proportion of costs, income, assets and liabilities is incorporated in the accounts on the respective lines. The figures are specified for each main group in a note to the accounts. For the equity method, see below.
Investments in associated companiesAn associated company is a company where the group has significant influence, but not control. Significant influence is deemed to exist for investments where the group has between 20 % to 50 % of voting capital. Investments in associated companies are recorded on the basis of the equity method in the consolidated accounts, unless the investment value is immaterial the share of the results recorded by associated companies is posted separately under financial items. The investments in associated companies are posted as a financial asset. The group’s share of a loss is not posted in the income statements if this means that value of the investment in the balance sheet becomes negative. Provisions will be made if the group has undertaken an obligation on behalf of the associate.
Fixed assetsFixed assets are valued at acquisition cost, but are written down to fair market value where the decline in value is not expected to be tempo-rary. Fixed assets with a limited economic lifetime are depreciated on a straight-line basis over the expected lifetime of the asset. Long-term liabilities are stated in the balance sheet at the nominal amount

14 GRIEG MATURITAS ANNUAL REPORT2014 14 GRIEG 2014
on the establishment date. Current assets are valued at the lower of acquisition cost and fair market value. Current liabilities are stated in the balance sheet at the nominal amount on the establishment date. Periodic classification and maintenance costs are posted in the balance sheet and depreciated on a straight-line basis until the next planned docking. The docking costs are included in the balance sheet along with the value of the ship. The depreciation of docking costs is included in operating costs.
Newbuilding contractInstalments on new building contracts are capitalised as new buildings as they are paid. Capitalised value is reclassified from new buildings to vessels upon delivery from the yard. Borrowing-costs that are at-tributable to the construction of the vessel are capitalized as a part of the vessel. The recoverable amount of an asset is measured whenever there is an indication than an asset may be impaired, write-down and the asset is stated at the lower of the recoverable amount and the cost price less any write-down. The write-down is reversed when the grounds for the write-down no longer exist.
Intangible assetsGoodwill is depreciated over its economic lifetime. The surplus value attached to the fleet’s contracts of employment and the company’s right to renominate star shipping tonnage is defined as ”contracts of employment” in the balance sheet and is depreciated over 20 years. Expenses related to the company’s own development are recorded in the balance sheet from the point when it is likely that the develop-ment work will result in an identifiable intangible asset.
Asset impairmentsAssets that are subject to depreciation are reviewed for impairment whenever events or changes in circumstances indicate that the carrying amount may not be recoverable. An impairment loss is rec-ognised for the amount by which the asset’s carrying amount exceeds its recoverable amount. The recoverable amount is the higher of an asset’s fair value less costs to sell and value in use. For the purposes of assessing impairment, assets are grouped at the lowest levels for which there are separately identifiable cash flows (cash-generating units). The Group’s open hatch vessels are sailing in a pool which is marketed and operated by Grieg Star Shipping AS. This means that the operational use of the vessels, including optimization of routes, is combined for the fleet. Earnings of each individual vessel is therefore affected by the earnings of other vessels in the pool. The fleet is therefore considered to be the cash-generating unit.
Vessels, other than open hatch vessels, are managed in the same manner as a “pool” within the group’s bulk activities. Thus the dry bulk vessels are considered to be one cash generating unit. New building contracts are included in the open hatch fleet impairment and unpaid installments are deducted. Non-financial assets other than goodwill which have been impaired are reviewed for possible reversal of the impairment at each date.
Pension commitments Defined contribution plansThe group’s main pension scheme is a defined contribution plan, for which, the companies pay contributions to an insurance company. The companies have no further payment obligations once the contribu-tions have been paid. Contributions are recorded as payroll expenses.
Defined benefit planSome companies have defined benefit plans, including AFP. A defined benefit plan is a pension scheme that defines the pension payment an employee will receive on reaching retirement age. The pension pay-ment normally depends on one or more factors, such as age, period of service with the company and salary level. The pension commitment under defined benefit schemes posted in the balance sheet is the present value of the defined benefit schemes at year-end less the fair value of the pension fund assets, adjusted for unposted deviations from estimate. The pension commitment is calculated annually by an independent actuary based on a linear accrual of pension entitle-ments. Changes in benefits under the pension plan are posted in the profit and loss account on an ongoing basis. The pension schemes are funded through payments to insurance companies or financed through operations. Post-employment benefit obligations associated
with the early retirement pension (AFP), under the LO/NHO ar-rangement, are a multi-employer defined benefit plan, but the plan is recorded as defined contribution, as it is not measurable.
Financial current assetsShort-term investments in shares and mutual funds are regarded as part of the trading portfolio and are stated at fair value at year-end. Dividends received and other distributions are entered as income under other financial income.
EstimatesWhen preparing the annual accounts in accordance with good ac-counting practice, the management make estimates and assumptions which affect the profit and loss account and the valuation of assets and liabilities. Contingent losses which are likely and quantifiable are charged against income on an ongoing basis.
LeasingThe company differentiates between financial leasing and operational leasing based on an evaluation of the lease contract at the time of inception. A lease contract is classified as a financial lease when the terms of the lease transfer substantially all the risk and reward of ownership to the lessee. All other leases are classified as operational leases. When a lease contract is classified as a financial lease where the company is the lessee, the rights and obligations relating to the leasing contracts are recognised in the balance sheet as assets and liabilities. The interest element in the lease payment included in the interest costs and the capital amount of the lease payment is recorded as repayment of debt. The lease liability is the remaining part of the principal. For operational leases, the rental amount is recorded as an operating cost.
TaxationThe tax charge in the profit and loss account consists of the tax payable and the change in net deferred tax. Taxes are charged when they arise. Deferred tax in the balance sheet is calculated on the basis of timing differences between values for taxation and accounting purposes. Taxable and tax-deductible timing differences which are reversed or can be reversed within the same period are netted against each other and entered net. Some of the companies of the group are subject to shipping taxation pursuant to chapter 8 of the taxation act. In connection with the transition to the new shipping tax the company has chosen the settlement scheme. For further information, please refer to note 19.
Statement of cash flowsThe statement of cash flows is prepared on the basis of the indirect method. Accordingly, the cash flows from investment and financing activities are reported gross, while the accounting result is reconciled against the net cash flow from operations. Cash and cash equivalents include cash, bank deposits and other short-term liquid investments that can immediately and with no major exchange rate risk be con-verted into a known amount and maturing less than three months from the transaction date.
15 GRIEG MATURITAS ANNUAL REPORT2014 15 GRIEG 2014
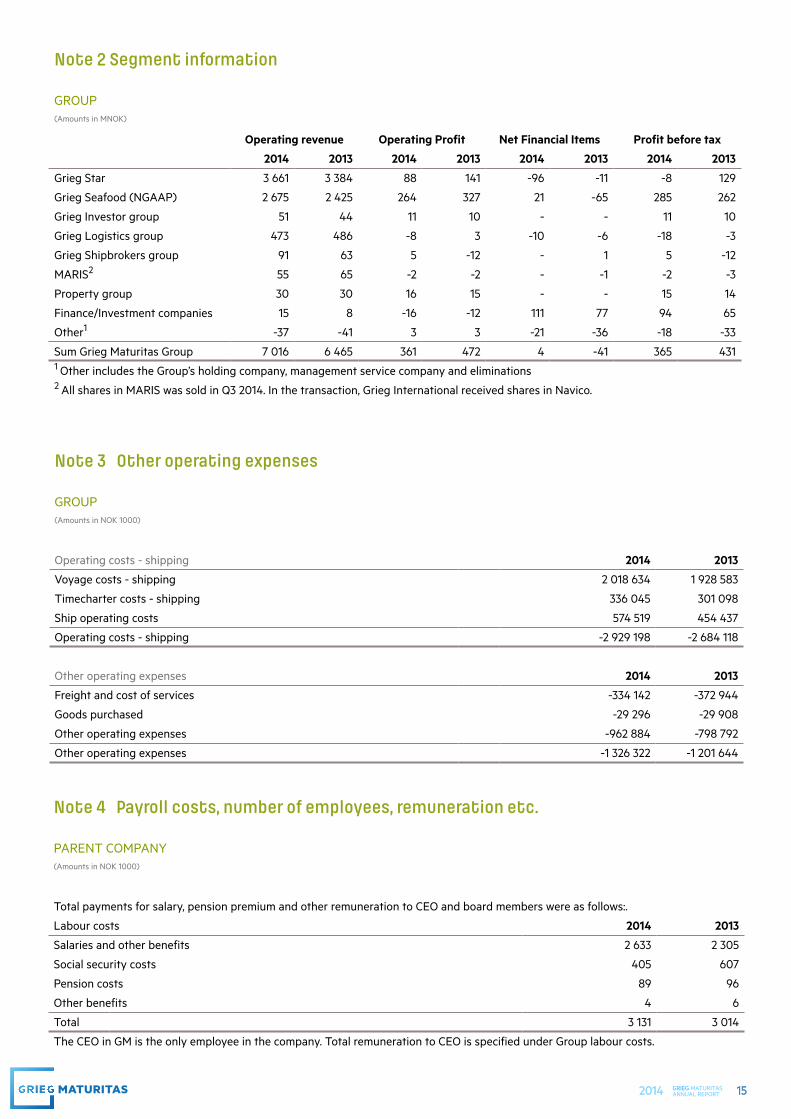
Note 3 Other operating expenses
GROUP(Amounts in NOK 1000)
Operating costs - shipping 2014 2013
Voyage costs - shipping 2 018 634 1 928 583
Timecharter costs - shipping 336 045 301 098
Ship operating costs 574 519 454 437
Operating costs - shipping -2 929 198 -2 684 118
Other operating expenses 2014 2013
Freight and cost of services -334 142 -372 944
Goods purchased -29 296 -29 908
Other operating expenses -962 884 -798 792
Other operating expenses -1 326 322 -1 201 644
Note 4 Payroll costs, number of employees, remuneration etc.
PARENT COMPANY(Amounts in NOK 1000)
Total payments for salary, pension premium and other remuneration to CEO and board members were as follows:.
Labour costs 2014 2013
Salaries and other benefits 2 633 2 305
Social security costs 405 607
Pension costs 89 96
Other benefits 4 6
Total 3 131 3 014
The CEO in GM is the only employee in the company. Total remuneration to CEO is specified under Group labour costs.
Note 2 Segment information
GROUP(Amounts in MNOK)
Operating revenue Operating Profit Net Financial Items Profit before tax
2014 2013 2014 2013 2014 2013 2014 2013
Grieg Star 3 661 3 384 88 141 -96 -11 -8 129
Grieg Seafood (NGAAP) 2 675 2 425 264 327 21 -65 285 262
Grieg Investor group 51 44 11 10 - - 11 10
Grieg Logistics group 473 486 -8 3 -10 -6 -18 -3
Grieg Shipbrokers group 91 63 5 -12 - 1 5 -12
MARIS2 55 65 -2 -2 - -1 -2 -3
Property group 30 30 16 15 - - 15 14
Finance/Investment companies 15 8 -16 -12 111 77 94 65
Other1 -37 -41 3 3 -21 -36 -18 -33
Sum Grieg Maturitas Group 7 016 6 465 361 472 4 -41 365 431 1 Other includes the Group’s holding company, management service company and eliminations2 All shares in MARIS was sold in Q3 2014. In the transaction, Grieg International received shares in Navico.

16 GRIEG MATURITAS ANNUAL REPORT2014 16 GRIEG 2014
Note 5 Pensions and pension commitments
PARENT COMPANYDefined contribution based pension scheme
The defined contribution based pension scheme covers all full-time and part-time employees and amounts to between 5 % and 8 % of salary. At year-end 2014 one person was covered by the scheme. The contribution charged in the accounts for 2014 amounted to TNOK 89 (excluding national insurance contributions).
GROUPThe companies in Norway have pension schemes which meet the requirements of the Act relating to compulsory occupational pension schemes. Most of the Group companies abroad have a defined contribution based pension scheme.
Defined contribution based pension scheme
The defined contribution based pension scheme covers full-time and part-time employees and amounts to between 4 % and 8 % of salary. The contribution charged in the accounts in 2014 amounted to 28,2 MNOK (excluding national insurance contributions).
Defines benefit based pension scheme
Some companies in the Group have defined benefit pension scheme. The Group pension scheme is funded through the accumulation of pension fund assets in an insurance company or through operations. The scheme give an entitlement to defined future benefits.
In 2014 a total of 351 persons (including pensioners and persons on early retirement) were covered by the benefits based scheme, of which 53 retirees.
GROUP(Amounts in NOK 1000)
Labour costs 2014 2013
Salaries 652 117 629 811
Social security costs 67 405 66 425
Pension costs 48 974 48 417
Other benefits 52 893 46 766
Total 821 390 791 419
Average number of employees 1 174 1 125
Average number of sailing personell* 859 830
*Salary costs are recognised in the P&L as Other Operating expenses under ship operating expenses.
Remuneration to executives
In 2014 total payments to salary, pension premium and other remuneration to CEO was MNOK 3,3 and to board members MNOK 16,1. Remuneration to the Board members and Group CEO is paid from the companies where the director is employed or a director.
Loan to shareholders and other closely related parties 31.12.14 31.12.13
Vitare AS 8 842 9 605
Salthavn AS 7 105 6 925
Salthavn II AS 3 061 2 983
Kvasshøgdi AS 1 039 -
Total 20 047 19 513
No loans / guarantees have otherwise been given to shareholder or other closely related parties.
There is adequate security for the loans.
17 GRIEG MATURITAS ANNUAL REPORT2014 17 GRIEG 2014
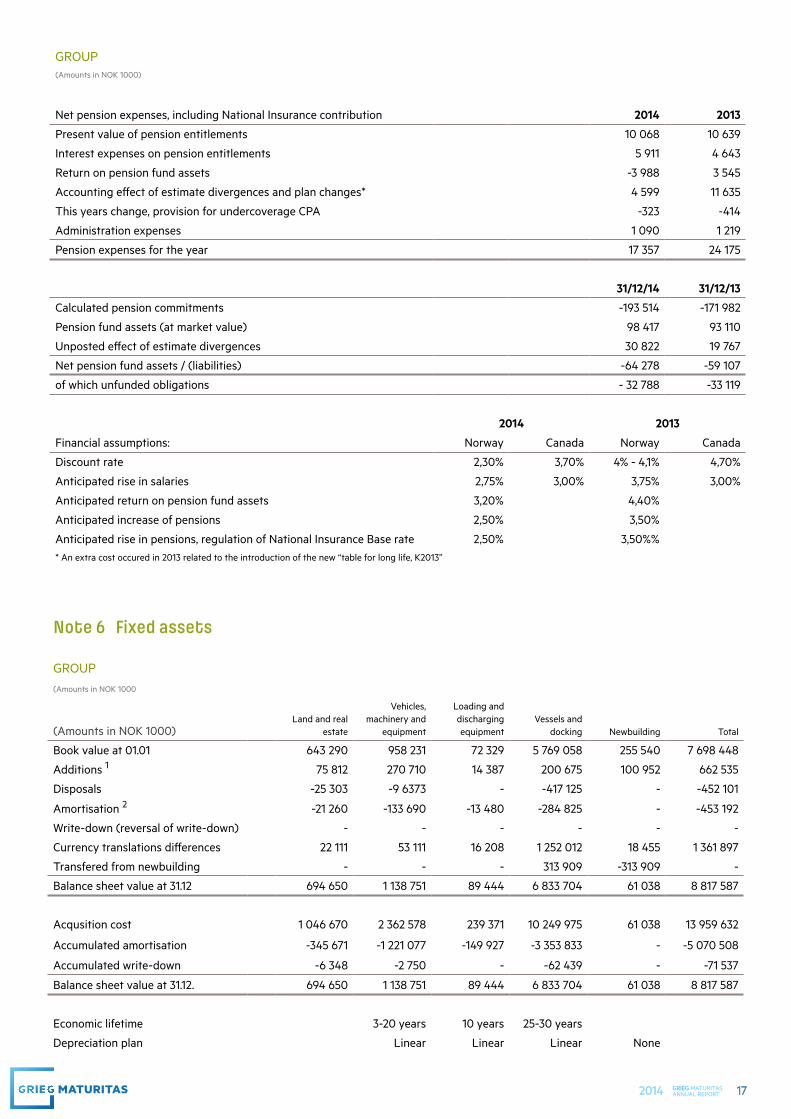
Note 6 Fixed assets
GROUP(Amounts in NOK 1000
(Amounts in NOK 1000)Land and real
estate
Vehicles, machinery and
equipment
Loading and discharging equipment
Vessels and docking Newbuilding Total
Book value at 01.01 643 290 958 231 72 329 5 769 058 255 540 7 698 448
Additions 1 75 812 270 710 14 387 200 675 100 952 662 535
Disposals -25 303 -9 6373 - -417 125 - -452 101
Amortisation 2 -21 260 -133 690 -13 480 -284 825 - -453 192
Write-down (reversal of write-down) - - - - - -
Currency translations differences 22 111 53 111 16 208 1 252 012 18 455 1 361 897
Transfered from newbuilding - - - 313 909 -313 909 -
Balance sheet value at 31.12 694 650 1 138 751 89 444 6 833 704 61 038 8 817 587
Acqusition cost 1 046 670 2 362 578 239 371 10 249 975 61 038 13 959 632
Accumulated amortisation -345 671 -1 221 077 -149 927 -3 353 833 - -5 070 508
Accumulated write-down -6 348 -2 750 - -62 439 - -71 537
Balance sheet value at 31.12. 694 650 1 138 751 89 444 6 833 704 61 038 8 817 587
Economic lifetime 3-20 years 10 years 25-30 years
Depreciation plan Linear Linear Linear None
GROUP(Amounts in NOK 1000)
Net pension expenses, including National Insurance contribution 2014 2013
Present value of pension entitlements 10 068 10 639
Interest expenses on pension entitlements 5 911 4 643
Return on pension fund assets -3 988 3 545
Accounting effect of estimate divergences and plan changes* 4 599 11 635
This years change, provision for undercoverage CPA -323 -414
Administration expenses 1 090 1 219
Pension expenses for the year 17 357 24 175
31/12/14 31/12/13
Calculated pension commitments -193 514 -171 982
Pension fund assets (at market value) 98 417 93 110
Unposted effect of estimate divergences 30 822 19 767
Net pension fund assets / (liabilities) -64 278 -59 107
of which unfunded obligations - 32 788 -33 119
2014 2013
Financial assumptions: Norway Canada Norway Canada
Discount rate 2,30% 3,70% 4% - 4,1% 4,70%
Anticipated rise in salaries 2,75% 3,00% 3,75% 3,00%
Anticipated return on pension fund assets 3,20% 4,40%
Anticipated increase of pensions 2,50% 3,50%
Anticipated rise in pensions, regulation of National Insurance Base rate 2,50% 3,50%%* An extra cost occured in 2013 related to the introduction of the new “table for long life, K2013”

18 GRIEG MATURITAS ANNUAL REPORT2014 18 GRIEG 2014
Note 7 Intangible assets
GROUP(Amounts in NOK 1000)
Goodwill ContractsResearch and development Licenses Total
Book value at 01.01 27 116 47 350 10 450 998 611 1 081 976
Intangible assets purchased 3 976 1 413 - 51 635 57 024
Intangible assets sold - - -10 450 - -10 450
Amortisation -4 085 -6 509 - -5 711 -16 304
Currency translations differences 1 758 9 112 - 33 166 44 036
Balance sheet value at 31.12 28 778 49 803 - 1 077 701 1 156 282
Acqusition cost 69 647 134 349 - 1 112 926 1 316 923
Accumulated amortisation -40 870 -84 547 - -35 225 -160 641
Accumulated write-down - - - -
Balance sheet value at 31.12. 28 778 49 803 - 1 077 701 1 156 282
Economic lifetime 5-20 years 20 years 5 years
Depreciation plan Linear Linear
Contracts above represent excess values related to the vessels’ contracts of affreightment through the participation in
the Grieg Star Shipping pool. Licenses related to Grieg Seafood ASA and fish farming licenses.
Note 8 Investments in subsidiaries
COMPANY(Amounts in NOK 1000)
CompanyRegistered office Ownership
Proportion of voting shares, %
Book equity 100% Book value Dividend
Grieg Maturitas II AS Bergen 75% 100% 5 363 144 4 021 796 67 500
Grieg Maturitas II is a holding company owned by Grieg Maturitas AS and Grieg Foundation. Grieg Foundation has since 2002,
when it was established in its present form owned 25% of some of the Grieg Group’s operative companies. Grieg Foundation
owns 25% and Grieg Maturitas AS owns 75% of the whole Group,
In 2014, the Grieg Star Group took delivery of one new vessel, Star Lysefjord. The vessel is depreciated down to estimated scrap value over 30 years. In addition Star Lygra was sold and leased back for 15 years. As of 31.12.2014 the Grieg Star Group has new building con-tracts for 4 vessels. The four supramax’s will be delivered in 2015 and 2016. Total amount paid related to newbuildings are USD 22,3 m of which USD 8,2 m is classified as fixed assets. The remaining amount to be paid for the new building contracts amounts to USD 77.3 m.
1 Capitalsed interest related to newbuildings in 2014 were MNOK 18,3.2 Docking is classified under other operating expenses

19 GRIEG MATURITAS ANNUAL REPORT2014 19 GRIEG 2014
GROUP
The consolidated financial statements comprise the company Grieg Maturitas AS and the following subsidiaries:
Grieg Maturitas II AS owns the following companies: Registered office Ownership %Proportion of voting
shares, %
Grieg Star Group AS Bergen 45,5% 100%
Grieg Logistics AS Bergen 100% 100%
Grieg Holdings AS Bergen 83,7% 100%
Grieg Property AS Bergen 58,99% 100%
Grieg International AS Oslo 100% 100%
Grieg Ltd AS Bergen 100% 100%
Grieg Group Resources AS Bergen 100% 100%
Grieg Holdings AS owns the following companies: Registered office Ownership %Proportion of voting
shares, %
AS Joachim Grieg & Co Bergen 100% 100%
KS Joachim Grieg & Co Bergen 55% 55%
Joachim Grieg Star KS Bergen 100% 100%
Grieg Trade KS Bergen 100% 100%
Grieg Holdings II AS /Ryfylke Rensefisk Produksjon AS Bergen 100% 100%
Ryfylke Rensefisk AS Finnøy 50% 50%
Grieg Newfoundland AS Bergen 100% 100%
Silves OdisseyInv. and Techn. Lda. Portugal 90% 90%
Grieg Seafood ASA Bergen 49,97% 49,97%
Grieg Property AS owns the following companies Registered office Ownership %Proportion of voting
shares, %
Grieg Gaarden AS Bergen 100% 100%
AS Nestun Uldvarefabrik Bergen 100% 100%
CSG15 AS Bergen 100% 100%
Grieg Development AS / Grieghallen Parkering AS Bergen 36,25% 36,25%
Grieg Star Group AS owns the following companies: Registered office Ownership %Proportion of voting
shares, %
Grieg Shipping II AS Bergen 100% 100%
Grieg International II AS Oslo 100% 100%
Grieg Shipowning AS Bergen 100% 100%
Grieg Star AS Bergen 100% 100%
Grieg Star Shipping AS Bergen 100% 100%
Grieg Star Bulk AS Bergen 100% 100%
Grieg Green AS Oslo 100% 100%
Grieg Star Shipping (Canada) Ltd. Vancouver B.C., Canada 100% 100%
Squamish Terminals Ltd Squamish BC, Canada 100% 100%
Grieg Star Shipping (USA) Inc. Atlanta, USA 100% 100%
Grieg Star Shipping AB Gothenburg, Sweden 100% 100%
Grieg Star Shipping SRLV Livorno, Italy 100% 100%
Grieg Star Shipping Comercio Maritimo LTDA Rio de Janeiro, Brazil 100% 100%
Grieg Star Shipping Consulting Ltd. Shanghai, China 100% 100%
Grieg Star Shanghai Company Shanghai, China 100% 100%
Grieg Star Shipping Singapore PTE Ltd. Singapore 100% 100%
Grieg Consulting and Advisory Company Ltd Shanghai, China 100% 100%
Grieg Seafood ASA Bergen 0,74% 0,74%
20 GRIEG MATURITAS ANNUAL REPORT2014 20 GRIEG 2014
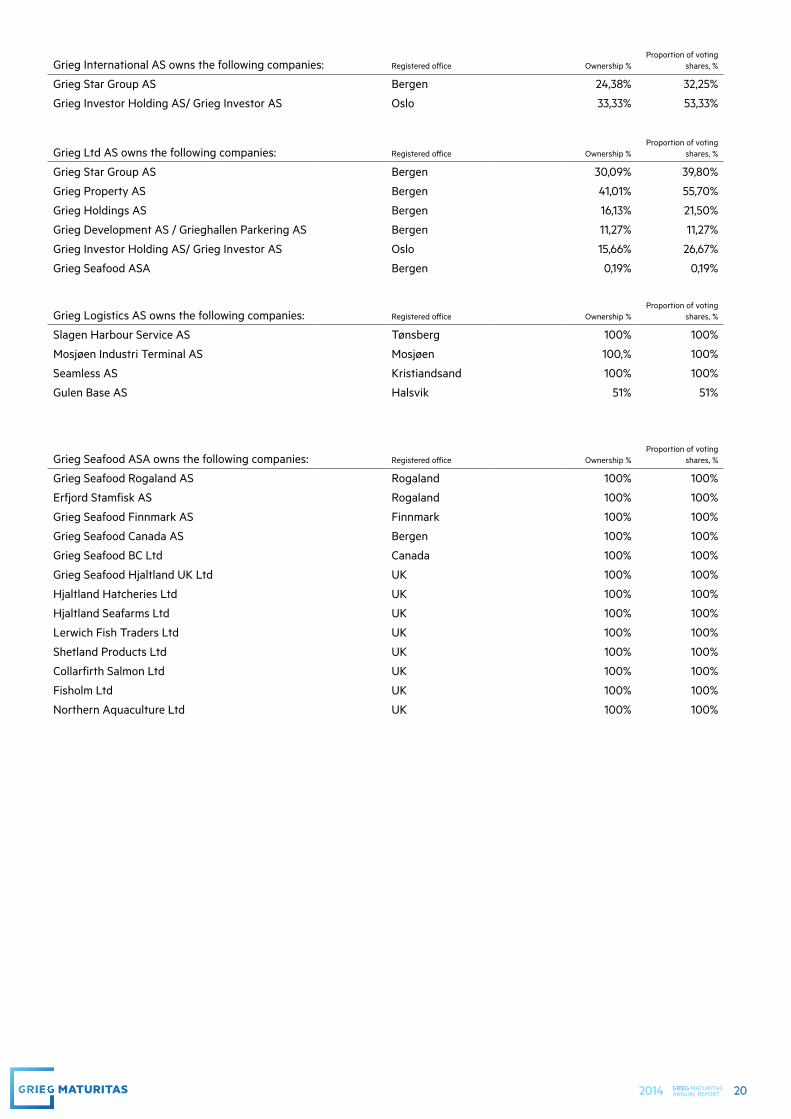
Grieg International AS owns the following companies: Registered office Ownership %Proportion of voting
shares, %
Grieg Star Group AS Bergen 24,38% 32,25%
Grieg Investor Holding AS/ Grieg Investor AS Oslo 33,33% 53,33%
Grieg Ltd AS owns the following companies: Registered office Ownership %Proportion of voting
shares, %
Grieg Star Group AS Bergen 30,09% 39,80%
Grieg Property AS Bergen 41,01% 55,70%
Grieg Holdings AS Bergen 16,13% 21,50%
Grieg Development AS / Grieghallen Parkering AS Bergen 11,27% 11,27%
Grieg Investor Holding AS/ Grieg Investor AS Oslo 15,66% 26,67%
Grieg Seafood ASA Bergen 0,19% 0,19%
Grieg Logistics AS owns the following companies: Registered office Ownership %Proportion of voting
shares, %
Slagen Harbour Service AS Tønsberg 100% 100%
Mosjøen Industri Terminal AS Mosjøen 100,% 100%
Seamless AS Kristiandsand 100% 100%
Gulen Base AS Halsvik 51% 51%
Registered officeGrieg Seafood ASA owns the following companies: Ownership %Proportion of voting
shares, %
Grieg Seafood Rogaland AS Rogaland 100% 100%
Erfjord Stamfisk AS Rogaland 100% 100%
Grieg Seafood Finnmark AS Finnmark 100% 100%
Grieg Seafood Canada AS Bergen 100% 100%
Grieg Seafood BC Ltd Canada 100% 100%
Grieg Seafood Hjaltland UK Ltd UK 100% 100%
Hjaltland Hatcheries Ltd UK 100% 100%
Hjaltland Seafarms Ltd UK 100% 100%
Lerwich Fish Traders Ltd UK 100% 100%
Shetland Products Ltd UK 100% 100%
Collarfirth Salmon Ltd UK 100% 100%
Fisholm Ltd UK 100% 100%
Northern Aquaculture Ltd UK 100% 100%

21 GRIEG MATURITAS ANNUAL REPORT2014 21 GRIEG 2014
Note 9 Investments in associated companies
GROUP(Amounts in NOK 1000)
Ownership %Registered
officeBook value
01.01
Share of profit/loss
for the year
Depreciaton of excess
valueOther
changesBook value
31.12
Excess value incl. in book
value 31.12.
Fram Marine AS1 25,0 % Oslo 2 281 - - - 2 281 1 171
NorWind AS 40,7 % Oslo - - - - - -
NorWind Installer AS 40,0 % Bergen - - - - - -
Sea Urchin Farm AS1 40,3 % Finnøy 2 020 - - 2 020 - - -
Joachim Grieg Shipbrokers Ltd 35,0 % London 5 802 - - 1 934 - 3 868 3 868
OceanWind AS 40,0 % Oslo - - - - - -
Bokn Sjøservice AS 50,0 % Bokn 6 431 - 1 159 - - 5 272 -
Finnmark Brønnbåtrederi AS 49,9 % Alta 9 490 4 326 - -4 490 9 326 -
Salmon Breed AS2 27,5 % Bergen 6 231 409 - -6 640 - -
Isopro AS2 20,0 % Alta 991 - - -991 - -
Salten Stamfisk AS 34,0 % Fauske 4 915 2 865 - - 7 780 -
Ocean Quality AS 60,0 % Bergen 13 132 6 426 - - 19 558 -
51 293 12 867 - 3 954 - 12 121 48 086 5 0391 Booked according to the cost method.2 Shares sold in 2014
Result of investment in associated companies consists of:
Profit/loss for the year 12 867
Depreciaton of excess value & book value -3 957
Gain on sale of shares - Salmon Breed AS 60 326
Gain on sale of shares - Isopro AS 3 490
Total 72 729
Note 10 Financial items(Amounts in NOK 1000)
Parent company Group
Financial Income 2014 2013 2014 2013
Interest income from group companies - 32 - -
Interest income 3 802 3 920 17 176 28 168
Gain on sale of investments1 - - 133 216 69 854
Other financial income 1 - 80 105 65 576
Total financial income 3 803 3 952 230 497 163 5981 In 2014, Grieg International sold its shares in Maris to Navico, and received an owner share of 1,5% in Navico. Maris was recorded at cost method in Grieg International, and the transaction did not affect P/L in the company. At Group level the transaction gave a profit of MNOK 54, as Maris has been a subsidiary in the Grieg Group.
Parent company Group
Financial Expenses 2014 2013 2014 2013
Interest expenses - - 217 244 204 209
Other financial expences -8 -7 32 283 14 024
Total financial expenses -8 -7 249 527 218 233

22 GRIEG MATURITAS ANNUAL REPORT2014 22 GRIEG 2014
Note 11 Shareholdings and other investments
GROUP(Amounts in NOK 1000)
Company Ownership Purchase cost Book value
Silver Pensjonsforsikring AS 14,11 % 93 725 60 192
Navico Holding AS 1,71 % 59 464 59 464
Stril Offshore DIS 15,00 % 36 991 36 991
KS Brage Supplier 12,50 % 24 000 24 000
Holmen Industri Invest I 26,66 % 23 378 23 378
Argentum Investment Partner I 7,60 % 21 764 21 764
Mercell Holding AS <20,00 % 28 244 17 081
Nordenergie Renewable 1,85 % 10 305 10 305
Utleiebolig AS 17,49% 7 663 7 663
FSN Capital Ltd. P.ship II 1,30 % 6 237 6 237
Stochasto Holding AS <20,00 % 5 221 5 221
Borea Opportunity II AS 1,55 % 3 704 3 704
Union Eiendomkapital 1,04 % 3 442 3 442
DNB Private Equity III (IS) 1,41 % 3 303 3 303
Atlantic Gas IS *) 4,00 % 2 459 2 884
Voxtra 9,23 % 2 678 2 678
Øst Bolig AS 9,00 % 1 920 1 920
Karihaugveien 22 Holding AS 13,33 % 1 820 1 820
UACC Ross Tanker DIS - - 1 178
Spice AS 20,00 % 1 000 1 000
KLP Aksjeindeks IV - 657 876
KLP Aksje Norge II - 657 790
Seagarden ASA <10,00% 6 213 760
Sahara Forest Project AS - 750 750
KLP Pengemarked* - 586 586
Grieg Philippines Inc. - - 527
Hordaland Miljøselskap 0,50 % 499 499
Novel Diagnostics AS <1,00 % 63 63
Incentra (co-operative) - - 14
Joachim Grieg Partners 22% 863 863
Norda ASA <1,00 % 11 -
Total 347 629 299 965
Share investments are valued on the basis of the cost method. The investments are written down to market value if the decline in value is considered not to be temporary.
Note 12 Stock and bunkers
GROUP(Amounts in NOK 1000)
2014 2013
Stocks raw materials - fish farming 88 532 74 015
Stocks goods in progress - fish farming 1 565 152 1 368 321
Stocks of finished goods 1 888 6 626
Stocks of bunkers and lub oil 183 641 241 900
Total stocks and bunkers 1 839 213 1 690 862

23 GRIEG MATURITAS ANNUAL REPORT2014 23 GRIEG 2014
Note 13 Receivables due in more than one year
GROUP(Amounts in NOK 1000)
2014 2013
Loan to associated companies 10 470 28 359
Spoolbase project 228 973 -
Other receivables 53 864 28 257
Total 293 307 56 616
Note 14 Marketbased financial investments
GROUP(Amounts in NOK 1000)
Purchase cost Market value
Individual shareholdings 42 742 34 184
Mutual funds 341 790 438 640
Bonds 195 062 226 192
Money market funds 365 310 357 814
Hedge funds 141 952 156 494
Total 1 086 856 1 213 323
Note 15 Debt payable in more than 5 years
GROUP
2014 2013
Debt to credit institutions* 1 448 385 1 018 395
Total 1 448 385 1 018 395
* Includes MNOK 75,7 which is related to Property including expansion of Grieg-Gaarden. The loans will be refinanced in 2016.

24 GRIEG MATURITAS ANNUAL REPORT2014 24 GRIEG 2014
Note 16 Mortgages/Guarantee liability/restricted funds
PARENT COMPANY(Amounts in NOK 1000)
2014 2013
Restricted deposits related to employees’ tax deduction 168 170
GROUP(Amounts in NOK 1000)
2014 2013
Restricted deposits related to employees’ tax deduction 20 611 20 898
Other restricted deposits 5 427 10 524
26 038 31 422
Debt secured by mortgage (including overdraft facilities) 2014 2013
Mortgaged debt - long term 5 849 159 4 950 024
Other long-term liabilities 4 517 180 327
Overdraft facilities - short-term 566 539 592 143
Total mortgaged debt 6 420 215 5 722 494
Group assets have been given as mortage security
Balance sheet value of mortgaged assets 2014 2013
Receivables 256 202 190 779
Vessels and newbuildings 6 808 964 5 867 571
Real estate 135 803 73 410
Other assets 1 654 307 1 204 477
Licences 1 066 184 994 066
Shares*) 125 469 13 132
Stocks 1 651 095 1 444 459
Total 11 698 024 9 791 894
Pledges include shares in subsidiaries. The book value of these shares is 0 in the consolidated accounts.
2014 2013
Total guarantee liability 66 319 235 309
Undrawn borrowing facilities 558 688 366 648
Loan covenants
Grieg Star Group is required to have liquid funds of USD 35m at all times. For six of the mortgage loans with an aggregated book value at 31.12.2014 of USD 326 m, the Grieg Star Group’s shipowning companies must have liquid funds of at least 5 % of total interest bear-ing debt, and a minimum of USD 20m. For the loan in ABN Amro and SR-Bank related to the Grieg Star Group’s dry bulk operation the minimum amount is 15 m. A common covenant for all mortgage loans is that the Group must continue to be controlled by the Grieg familiy. Grieg Star Group has met its loan covenant commitments throughout the year.
The covenants of Grieg Seafood’s credit facility is an equity ratio in excess of 35%, and a revolving 12-month NIBD/EBITDA ratio of 5.0 if the equity ratio is higher than 40% and 4.5 if the equity ratio is between 35% and 40%. The covenants related to the unsecured bond loan is an equity ratio in excess of 30%, booked equity of at least MNOK 1.000, minimum amount of working capital at MNOK 400 and a liquidity ratio of at least 1,3.

25 GRIEG MATURITAS ANNUAL REPORT2014 25 GRIEG 2014
Note 17 Financial risk
The group is exposed to a range of financial risks; market risk (including currency risk, cash flow interest rate risk, fair value interest rate risk and price risk), credit risk and liquidity risk. The Group uses various financial derivatives to manage its financial risk.
Liquidity risk
Prudent liquidity risk management implies maintaining sufficient cash and marketable securities, and the availability of funding through sufficient credit facilities. The Groups strong liquidity and cash management ensures sufficient liquidity to meet its obligations when they mature.
Interest rate risk
Interest rate risk arises in the short and long term as most parts of the Group’s debt are at a floating rate of interest. A change in in-terest rates will result in either an increase or a reduction of the financing cost. If certain interest rate derivatives are applied then the predictability of the financing cost will increase due to a limitation of the net effect of a change in interest rates. In addition a change in interest rates will affect the returns on the investment portfolio and the rates on cash deposits. The Group’s strategy is to employ a certain level of hedging using interest rate swap agreements to establish greater stability for the group’s loan interest expenses. Gains and losses rising from interest rate swaps are recognised in the same period as the related interest expense.
At 31.12.14 the Grieg Star Group had signed interest rate swap agreements totalling USD 259 m (including forward interest rate swap agreements), directly hedging 45% (YE2014) of the Group’s future interest rate risk. At the same date, the unrealised loss attached to these agreements, and not posted in the balance sheet, was a loss of USD 17,5 m with an average period of maturity of 4.7 years.
Grieg Seafood had interest swap agreements totalling MNOK 800 at 31.12.14. Unrealised loss attached to these agrements amounts to MNOK -17,9. Interest rate swaps agreements have a horizon of 2-4 years and whether these periods are to be rolled over is a matter of constant evalutation.
Credit risk
The Group’s credit risk that counterparties do not have financial ability to meet their obligations is considered to be relatively low, due to solid customers, a diversified portfolio, and historically there has been small losses on receivables. In some parts of the Group with a large customer portfolio, the risk is reduced with good routines on credit rating.
Foreign exchange risk
The Group operates globally and is exposed in foreign exchange risk arising from various currency exposures, mainly USD, CAD, GBP and EUR. Foreign exchange risk arises when transactions, recognized assets or liabilities is in a currency other than company`s func-tional currency. The Group’s main focus in relation to foreign exchange hedging is to ensure that costs and liabilities are denominated in the same currency as revenues and assets. The foreign exchange risk is largely covered through forward foreign exchange contracts. Gains/losses on foreign exchange contracts are booked in the same period as the period when the hedged transactions are settled. Non-USD denominated financial investments which are part of the Group’s financial investment portfolio are also taken into consider-ation when the Group’s net foreign exchange exposure is assessed.
At 31.12.14 the Grieg Star Group had entered into forward contracts/foreign exchange accumulators to hedge a total of USD 57 m. The realized gain on these contracts was USD 0,1 m in 31.12.14. The contracts had an unrealized, not posted gain in the balance sheet, of USD 0.7 m at 31.12.14.
Freight rate risk
The shipping industry is cyclical and characterised by large and volatile fluctuations in freight rates and furthermore revenues. As part of the Group’s risk management, Forward Freight Agreements (FFA) are from time to time used as a risk managment instrument. The Group’s shipping activities are of an industrial nature which makes it possible to cover exposure to spot rates by entering into long-term cargo contracts. As a result, the Group’s revenue fluctuate less than is the case when operating in the general dry bulk spot market. The FFA contracts are settled as an adjustment of operating income.
Bunker price risk
The Grieg Star Group uses derivative contracts to hedge bunker prices related to freight agreements without bunker clauses. The result of the hedging contracts is classified as an adjustment of operating costs and is posted in the hedging period.
As of 31.12.14, the Group had made derivative contracts to hedge bunker prices for a total of 9,600 mt bunkers. Included bunker clauses, this gives a hedging rate of 100 % of budgeted bunker consumption for 2014. As of 31.12.2014, unrealized, not posted, losses on finan-cial bunkers hedging was USD -2.44 m.
26 GRIEG MATURITAS ANNUAL REPORT2014 26 GRIEG 2014
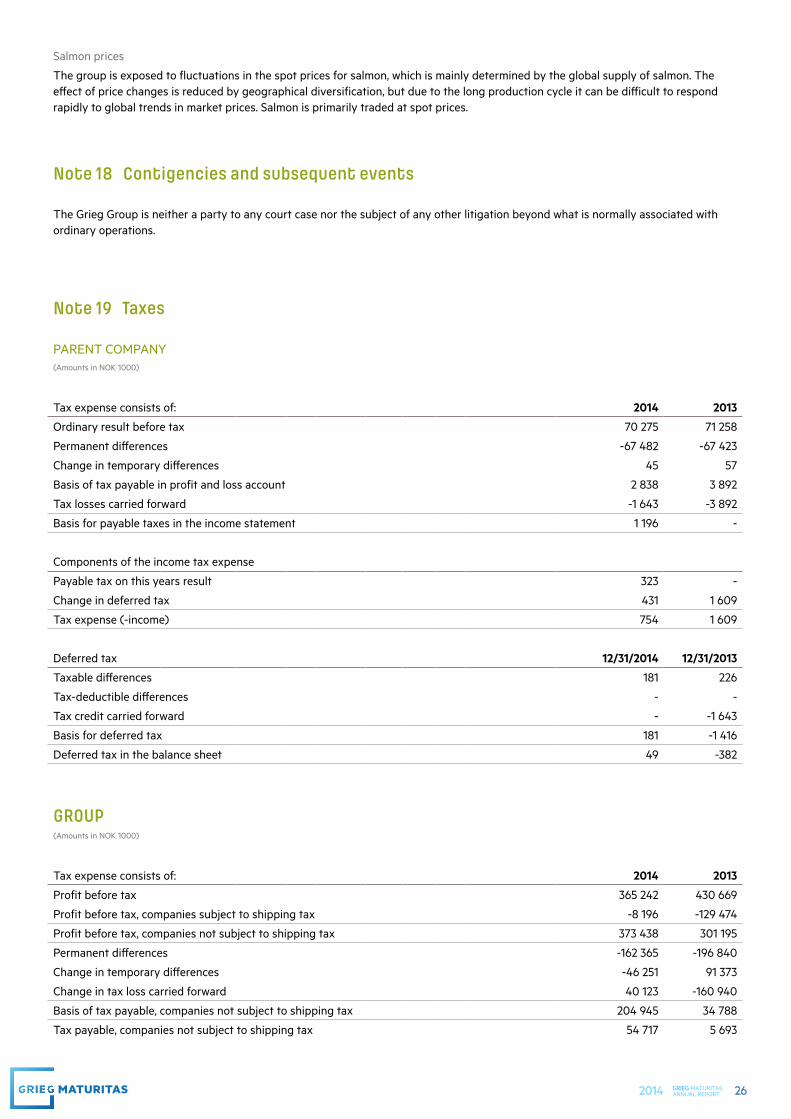
Salmon prices
The group is exposed to fluctuations in the spot prices for salmon, which is mainly determined by the global supply of salmon. The effect of price changes is reduced by geographical diversification, but due to the long production cycle it can be difficult to respond rapidly to global trends in market prices. Salmon is primarily traded at spot prices.
Note 18 Contigencies and subsequent events
The Grieg Group is neither a party to any court case nor the subject of any other litigation beyond what is normally associated with ordinary operations.
Note 19 Taxes
PARENT COMPANY(Amounts in NOK 1000)
Tax expense consists of: 2014 2013
Ordinary result before tax 70 275 71 258
Permanent differences -67 482 -67 423
Change in temporary differences 45 57
Basis of tax payable in profit and loss account 2 838 3 892
Tax losses carried forward -1 643 -3 892
Basis for payable taxes in the income statement 1 196 -
Components of the income tax expense
Payable tax on this years result 323 -
Change in deferred tax 431 1 609
Tax expense (-income) 754 1 609
Deferred tax 12/31/2014 12/31/2013
Taxable differences 181 226
Tax-deductible differences - -
Tax credit carried forward - -1 643
Basis for deferred tax 181 -1 416
Deferred tax in the balance sheet 49 -382
GROUP(Amounts in NOK 1000)
Tax expense consists of: 2014 2013
Profit before tax 365 242 430 669
Profit before tax, companies subject to shipping tax -8 196 -129 474
Profit before tax, companies not subject to shipping tax 373 438 301 195
Permanent differences -162 365 -196 840
Change in temporary differences -46 251 91 373
Change in tax loss carried forward 40 123 -160 940
Basis of tax payable, companies not subject to shipping tax 204 945 34 788
Tax payable, companies not subject to shipping tax 54 717 5 693

27 GRIEG MATURITAS ANNUAL REPORT2014 27 GRIEG 2014
Tax charge in profit and loss account
Tax payable 59 682 9 740
Change in tax provisions in previous year - 39 648
Increase / (decrease) in deferred tax 7 403 36 879
Tax charge for the year on ordinary result 67 085 86 269
Tax payable in balance sheet 12/31/2014 12/31/2013
Tax payable, companies not subject to shipping tax 54 717 5 693
Tonnage tax 4 965 4 047
Adjustment in respect of priors* - 39 648
Total tax payable in balance sheet 59 682 49 388
Deferred tax 12/31/2014 12/31/2013
Taxable timing differences 1 544 299 1 366 055
Tax-deductible timing differences -236 496 -41 612
Tax loss to be carried forward -325 284 -420 582
Net timing differences 982 519 903 860
Deferred tax on net timing differences 256 343 231 819
Unposted deferred tax assets 60 265 38 276
Net deferred tax in balance sheet 316 612 270 096
*Norwegian Tax Administration decided in February 2014 to change the tax assesment for 2009 for one of the subsidiaries, which means that the taxable income increases with 141.6 million. The company has appealed the decision. A provision for the tax liability is made in accordance with the Supreme Court ruling of 19 December 2013 where it is assumed that the tax authorities’ claim in admin-istrative decision will normally be used for the accounting of tax, even if the company disagrees and takes the case to the court. There have not been made any provisions related to potential penalty tax.
Note 20 Equity
PARENT COMPANY(Amounts in NOK 1000) Share
capitalShare premium
reserve Other equity Total
Equity - Opening Balance 1 124 702 263 3 459 008 4 162 395
Profit of the year - - 69 521 69 521
Provision for dividend - - -67 500 -67 500
Equity - Closing Balance 1 124 702 263 3 461 029 4 164 416
GROUP(Amounts in NOK 1000) Share
capitalShare premium
reserveGroup
reservesMinority interests Total
Equity - Opening Balance 1 124 702 263 3 180 477 2 227 205 6 111 069
Profit for the year - - 131 895 166 262 298 157
Provision for dividend - - -67 500 -26 474 -93 974
Currency translation differences - - 542 132 180 711 722 843
Capital increase - - - 54 250 54 250
Other changes - - 9 424 43 153 52 578
Equity - Closing Balance 1 124 702 263 3 796 429 2 645 107 7 144 924
28 GRIEG MATURITAS ANNUAL REPORT2014 28 GRIEG 2014
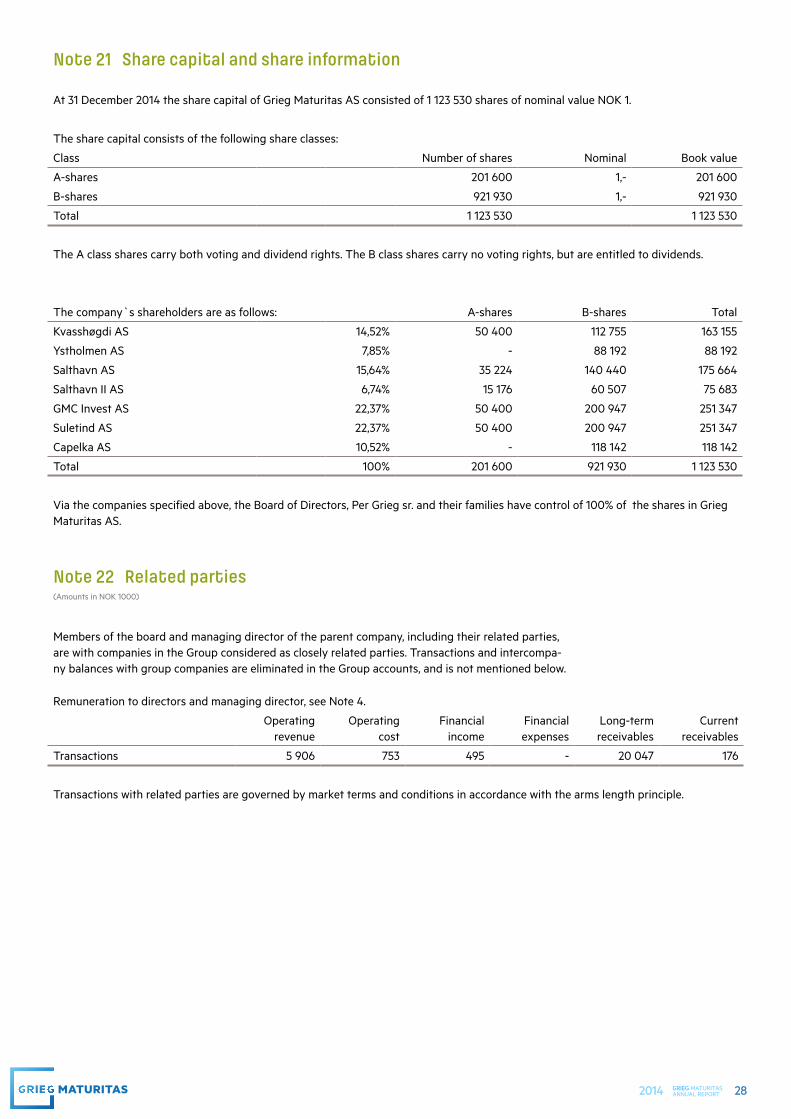
Note 21 Share capital and share information
At 31 December 2014 the share capital of Grieg Maturitas AS consisted of 1 123 530 shares of nominal value NOK 1.
The share capital consists of the following share classes:
Class Number of shares Nominal Book value
A-shares 201 600 1,- 201 600
B-shares 921 930 1,- 921 930
Total 1 123 530 1 123 530
The A class shares carry both voting and dividend rights. The B class shares carry no voting rights, but are entitled to dividends.
The company`s shareholders are as follows: A-shares B-shares Total
Kvasshøgdi AS 14,52% 50 400 112 755 163 155
Ystholmen AS 7,85% - 88 192 88 192
Salthavn AS 15,64% 35 224 140 440 175 664
Salthavn II AS 6,74% 15 176 60 507 75 683
GMC Invest AS 22,37% 50 400 200 947 251 347
Suletind AS 22,37% 50 400 200 947 251 347
Capelka AS 10,52% - 118 142 118 142
Total 100% 201 600 921 930 1 123 530
Via the companies specified above, the Board of Directors, Per Grieg sr. and their families have control of 100% of the shares in Grieg Maturitas AS.
Note 22 Related parties(Amounts in NOK 1000)
Members of the board and managing director of the parent company, including their related parties, are with companies in the Group considered as closely related parties. Transactions and intercompa-ny balances with group companies are eliminated in the Group accounts, and is not mentioned below.
Remuneration to directors and managing director, see Note 4.
Operating revenue
Operating cost
Financial income
Financial expenses
Long-term receivables
Current receivables
Transactions 5 906 753 495 - 20 047 176
Transactions with related parties are governed by market terms and conditions in accordance with the arms length principle.
29 GRIEG MATURITAS ANNUAL REPORT2014 29 GRIEG 2014
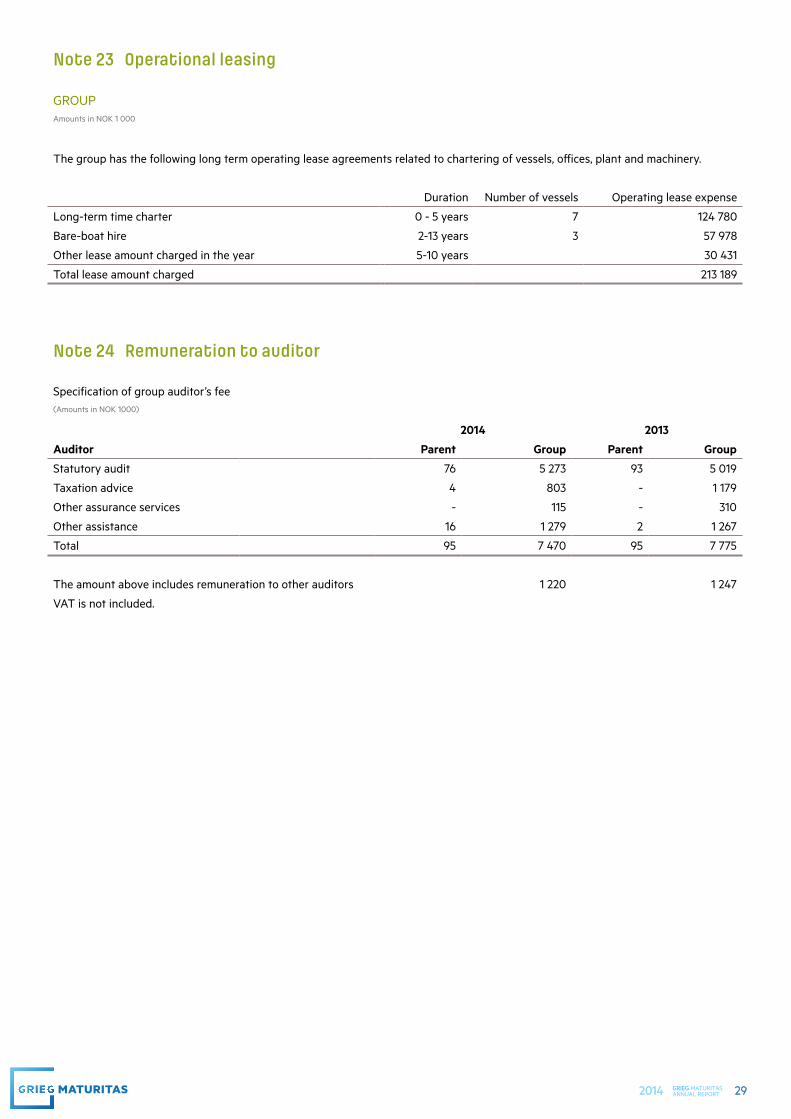
Note 24 Remuneration to auditor
Specification of group auditor’s fee (Amounts in NOK 1000)
2014 2013
Auditor Parent Group Parent Group
Statutory audit 76 5 273 93 5 019
Taxation advice 4 803 - 1 179
Other assurance services - 115 - 310
Other assistance 16 1 279 2 1 267
Total 95 7 470 95 7 775
The amount above includes remuneration to other auditors 1 220 1 247
VAT is not included.
Note 23 Operational leasing
GROUPAmounts in NOK 1 000
The group has the following long term operating lease agreements related to chartering of vessels, offices, plant and machinery.
Duration Number of vessels Operating lease expense
Long-term time charter 0 - 5 years 7 124 780
Bare-boat hire 2-13 years 3 57 978
Other lease amount charged in the year 5-10 years 30 431
Total lease amount charged 213 189