Report - AHDB Strategy Summary Harvest progress: Harvest 2015 was late to start, with only very...
13
© ADAS 2015 AHDB Final Harvest Summary Report Date: 8 October 2015 Prepared for: AHDB Cereals & Oilseeds Prepared by: Sarah Wynn, Rebecca Carter & Susan Twining Harvest reports produced by ADAS on behalf of AHDB Cereals and Oilseeds Report
-
Upload
nguyenthuan -
Category
Documents
-
view
213 -
download
0
Transcript of Report - AHDB Strategy Summary Harvest progress: Harvest 2015 was late to start, with only very...
© ADAS 2015
AHDB Final Harvest Summary Report
Date: 8 October 2015
Prepared for: AHDB Cereals & Oilseeds
Prepared by: Sarah Wynn, Rebecca Carter &
Susan Twining
Harvest reports produced by ADAS on behalf of AHDB Cereals and Oilseeds
Report
2
Summary
Harvest progress: Harvest 2015 was late to start, with only very occasional winter barley crops ready for
harvest prior to 15 July. Good progress was made during late July and into early August with winter barley,
winter oilseed rape and the milling wheat in southern England, however showery weather from 19 August
through to early September resulted in rain delays affecting the end of harvest in the south and the start
of harvest in the north. Conditions in September, especially later in the month, allowed for slow but
steady progress to be made toward completing harvest in the English regions and Wales by the end of
September, and Scotland by the end of the first week of October.
Yield: Yields were 7-14% above average across all cereals and oilseeds, aided by good crop establishment
conditions, adequate moisture for most crops through the spring and summer and sunshine during grain
fill.
Quality: Quality of the 2015 combinable crops is generally good. Wheat quality is good, with Hagberg
Falling Numbers (HFN) averaging 293 seconds, specific weights averaging 78.8 kg/hl and protein levels
averaging 11.9%. Barley quality was also acceptable with specific weights averaging 66.5 kg/hl, nitrogen
contents averaging 1.53% and screenings of 1.5%.
Headlines
Wheat – National yield estimate of 8.7-8.9 t/ha - 12-14% increase on ten year average (7.8 t/ha).
Overall wheat quality is good; this season, with average specific weight of 78.8 kg/hl. The average
HFN is 293 seconds, which is just below the three year average (297 seconds), with the average
protein content at 11.9%, which is above the three year average (11.8%).
Winter barley –National yield estimate of 7.4 t/ha –13% increase on ten year average. Quality is
acceptable with specific weights averaging 66.8 kg/hl, nitrogen content averaging 1.55% and
screening levels through a 2.25mm sieve averaging 2.0%.
Spring barley – National yield estimate of 5.9-6.1 t/ha-9-13% increase on ten year average.
Quality was good, with specific weights averaging 66.4 kg/hl, nitrogen content averaging 1.52%
and screening levels averaging 1.3%.
Oats – National yield estimate of 6.1-6.3 t/ha-7-10% increase on ten year average. Overall, quality of oats was good. Specific weights were good, typically averaging between 54-56 kg/hl, and ranging between 46-58 kg/hl.
Winter oilseed rape – National yield estimate of 3.8 t/ha –13% increase on ten year average. Quality good, with typical oil contents ranging between 42-48%.
Spring oilseed rape – National yield estimate of 2.5-2.6 t/ha- which is above the five year average
(2.0 t/ha). Yields ranged between 1.85 – 3.3 t/ha.

3
Summary of harvest weather
Weather at the start of harvest allowed large areas of winter barley, winter oilseed rape and the quality
milling wheats to be harvested with few weather delays. However, from mid-August conditions became
more unsettled and rain caused delays and disruption to the end of wheat harvest and to spring barley
harvest.
A summary of the weather throughout harvest is shown Table 1 below.
Table 1 Summary of weather over harvest (July- October 2015). Note: ↓= below average ↑ = above average and ↔= no change from average. Week (date)
Comment Ave. rainfall (mm)
Ave. temp
(C)
Lowest regional rainfall
Highest regional rainfall
Week 1– 8-14 July
Warm and settled conditions with some rain showers – few crops ready for harvest
12 (↔) 16 (↑)
7 mm – South East
21 mm – Wales
Week 2 – 15-21 Jul
Largely dry, settled conditions- start of winter barley and winter oilseed rape harvest in the south.
10 (↓) 16 (↔)
4 mm- South East
32 mm - Scotland
Week 3– 22-28 Jul
A dry start to the week, but heavy rain at the end of the week.
31 (↑) 14 (↓)
19 mm- Scotland
46 mm- Eastern region
Week 4– 29 Jul- 4 Aug
Mostly dry, but crops were slow to dry out at the start of the week. Harvest was able to resume from 1-4 August. Start of wheat, oat and pea harvest.
6 (↓) 15 (↓)
1 mm- South East
19 mm- North West
Week 5– 5-11 Aug
Mainly fine and dry, with some scattered showers. Start of spring barley harvest in England.
7(↓) 16 (↑)
1 mm East Midlands
16 mm- South West
Week 6– 12-18 Aug
Cool and overcast, with heavy downpours at times. Winter barley harvest complete (except small areas in Scotland)
25 (↑) 15 (↓)
14 mm- South East
41 mm- North East
Week 7– 18-25 Aug
Very heavy downpours, particularly in the South West. Winter OSR harvest complete (except small areas in Scotland). Start to wheat harvest in northern regions.
38 (↑) 17 (↑)
59 mm- South West
22 mm- Scotland
Week 8– 26 Aug- 1 Sep
Wet weather, with heavy rainfall for most between 26-28 August.
18 (↑) 15 (↔)
6 mm- North East
38 mm- South East
Week 9– 2-8 Sep
All regions received very low rainfall. Cooler than normal air temperatures. Start of spring barley harvest in Scotland.
3(↓) 12 (↓)
1mm in south of England & Scotland
4 mm- north of England, Yorkshire and Midlands.
Week 10– 9-15 Sep
Conditions were mixed, with heavy rainfall interspersed with sunny spells
23 (↑) 14 (↔)
7 mm- Eastern region
35 mm- Wales
Week 11–16- 22 Sep
Rainfall below normal in northern regions were there were still crops left to harvest.
18 (↑) 12 (↓)
4 mm- Yorkshire and Humber
34-37 mm- South East and Eastern region.
Week 12– 23-29 Sep
Dry conditions all week, with below average air temperatures. Harvest complete in England.
3 (↓) 12 (↓)
2 mm- Yorks and East Midlands
4 mm- Scotland and North West
Week 13- 30 Sep- 6 Oct
Variable rainfall across the week with below average rainfall in Scotland. Harvest complete in Scotland.
12(↑) 12 (↑)
12 mm - Wales
27 mm- Yorks
4
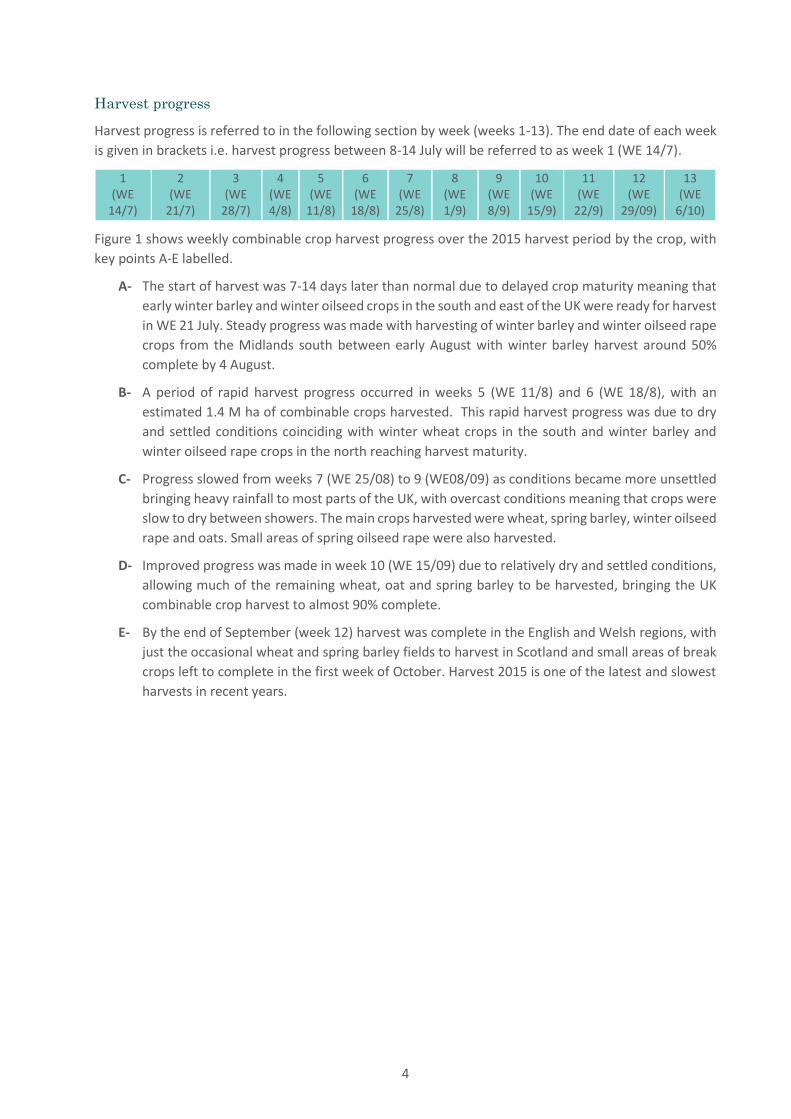
Harvest progress
Harvest progress is referred to in the following section by week (weeks 1-13). The end date of each week
is given in brackets i.e. harvest progress between 8-14 July will be referred to as week 1 (WE 14/7).
1 (WE
14/7)
2 (WE
21/7)
3 (WE
28/7)
4 (WE 4/8)
5 (WE
11/8)
6 (WE
18/8)
7 (WE
25/8)
8 (WE 1/9)
9 (WE 8/9)
10 (WE
15/9)
11 (WE
22/9)
12 (WE
29/09)
13 (WE
6/10)
Figure 1 shows weekly combinable crop harvest progress over the 2015 harvest period by the crop, with
key points A-E labelled.
A- The start of harvest was 7-14 days later than normal due to delayed crop maturity meaning that
early winter barley and winter oilseed crops in the south and east of the UK were ready for harvest
in WE 21 July. Steady progress was made with harvesting of winter barley and winter oilseed rape
crops from the Midlands south between early August with winter barley harvest around 50%
complete by 4 August.
B- A period of rapid harvest progress occurred in weeks 5 (WE 11/8) and 6 (WE 18/8), with an
estimated 1.4 M ha of combinable crops harvested. This rapid harvest progress was due to dry
and settled conditions coinciding with winter wheat crops in the south and winter barley and
winter oilseed rape crops in the north reaching harvest maturity.
C- Progress slowed from weeks 7 (WE 25/08) to 9 (WE08/09) as conditions became more unsettled
bringing heavy rainfall to most parts of the UK, with overcast conditions meaning that crops were
slow to dry between showers. The main crops harvested were wheat, spring barley, winter oilseed
rape and oats. Small areas of spring oilseed rape were also harvested.
D- Improved progress was made in week 10 (WE 15/09) due to relatively dry and settled conditions,
allowing much of the remaining wheat, oat and spring barley to be harvested, bringing the UK
combinable crop harvest to almost 90% complete.
E- By the end of September (week 12) harvest was complete in the English and Welsh regions, with
just the occasional wheat and spring barley fields to harvest in Scotland and small areas of break
crops left to complete in the first week of October. Harvest 2015 is one of the latest and slowest
harvests in recent years.

5
Source: ADAS 2015 Figure 1 Weekly harvest progress (all crops) – area harvested each week in hectares (Week 1 – WE 14 July)
Winter wheat
Area harvested 100 % UK area
Estimated average UK yield 8.7-8.9 t/ha
Yield range 5.0-16.5 t/ha
UK 10 year average yield 7.8 t/ha
Quality averages to date
SpWt 78.8 kg/hl
Hagberg Falling Number (HFN) 293 secs
Grain protein 11.9 %
Winter wheat harvest started in week 4 (WE 4/8) - 1-2 weeks later than many recent years due to the
delayed maturity of the crops this season. The delayed start to harvest was in line with the latest recent
harvest, but behind the five year average. The start of harvest coincided with a period of settled weather
which allowed farmers to make rapid harvest progress up until week 6 (WE 18/8). A period of more
unsettled weather from mid-August-early September caused a disruption to the end of harvest in the
south and to the start of harvest further north, with the rate of progress slowing for a period of three
weeks (weeks 7-9). Drier weather returned from week 10 (WE 15/9) onwards, with winter wheat harvest
finishing by early October. This slow rate of progress due to rain delays has made harvest 2015 the latest
harvest in the last five years, with harvest finishing 1-2 weeks later than recent years (Figure 2).

6
Source: ADAS 2015
Figure 2 Winter wheat harvest progress comparison – Cumulative percentage area harvested compared to previous years
Yield
The ADAS yield estimate for winter wheat is 8.7-8.9 t/ha – a 12-14% increase on the ten year average yield
of 7.8 t/ha. Yields were consistently above average in all regions, with very high yields (up to 16.5 t/ha)
reported in the East Midlands. Milling wheat yields have typically ranged between 6.6-14.0 t/ha, with
crops of Gallant, Cordiale and Skyfall often producing high yields (11-12 t/ha). Regional yield estimates
were lowest in Wales at 7.0 t/ha, whilst in parts of the East and Scotland average yields are forecast to be
9.6-9.9 t/ha.
Quality
The majority of quality milling wheat crops were harvested early in the period, these had good quality.
However, where crops harvested in late August and September suffered rain delays a small proportion of
crops did see a decline in quality. The AHDB second provisional Cereals Quality Survey (CQS) results were
published on 6 October 2015. For wheat, the AHDB second provisional CQS is based on data from 50,896
wheat samples, with a higher proportion of Group 3 and 4 wheats included in this sample compared to
the first provisional results published in September. The AHDB results show that overall wheat quality is
good this season, with the proportion of Group 1 milling wheat varieties meeting high quality bread milling
wheat specification (specific weight 76 kg/hl, HFN 250 seconds and 13% protein) almost three times
higher compared to 2014. The proportion of Group 1 and 2 samples meeting requirements for medium
quality bread wheat (specific weight 74 kg/hl, HFN 180 seconds and 12.5% protein) also increased
compared to 2014. Table 2 shows the quality information for GB wheat crops compared to recent years
and the three year average. The three year average does not include data from 2012 as adverse harvest
conditions during that year led to particularly poor results which skew the average.

7
Table 2 AHDB Quality information for total GB wheat crops
All wheat 2011 2012 2013 2014 2015 3 year average (excluding 2012)
Specific weight (kg/hl) 78.7 69.6 77.0 77.1 78.8 77.6
Hagberg falling number (secs) 269 237 314 308 293 297
Protein (%) 12.0 12.5 12.2 11.3 11.9 11.8
Specific weight – The AHDB CQS average specific weight for all wheat crops is 78.8 kg/hl, which is higher
than both 2014 (77.1 kg/hl) and the three year average (excluding 2012) of 77.6 kg/hl, with results ranging
between 73.1-84.1 kg/hl. Specific weights for all variety types were above average, with the average
specific weight for Group 1 wheats at 79.5 kg/hl and Group 2 at 80.0 kg/hl.
Hagberg Falling Number (HFN) – Hagberg Falling Numbers (HFN) for all GB wheat crops averaged 293
seconds, which was below the three year average (excluding 2012) of 297 seconds and lower than 2014
(308 seconds).
Protein – Grain protein contents averaged 11.9%, which is just above the three year average of 11.8% and
higher than 2014 (11.3%). Group 1 milling wheat varieties had an average protein content of 12.7% which
is in line with the three year average, whilst Group 2 varieties had an average protein content of 12.4%
which is again above the three year average and 2014. Protein contents ranged from 9.5-14.3%
Mycotoxins – Mycotoxin risk was low, with early test results indicating low levels of mycotoxins present.
Spring wheat
Area harvested 100 % UK area
Estimated average UK yield 6.8 t/ha
Yield range 5-11 t/ha
UK 10 year average yield 7.8 t/ha
Quality averages to date
SpWt 74 kg/hl
Hagberg Falling Number (HFN) 193-300 secs
Grain protein 12.9 %
Spring wheat harvest started in week 7 (WE 25/8) with small areas harvested in the south of the UK.
Harvest progressed fairly rapidly with harvest virtually complete by the end of September.
Yield
Crops typically yielded well, with yields ranging between 5.0-11.0 t/ha. The better yields came from crops
which went into well prepared seedbeds and established well, whilst the lower yields came from crops
that did not establish well or which were affected by gout fly damage.
Quality
Quality of crops was good; the rain delays to harvest had less of an impact on the quality of spring wheat
compared to winter wheat, as spring wheat crops were only just ready for harvest by early September.
Specific weight – range 73-84 kg/hl, average 74 kg/hl.
Hagberg Falling Number (HFN)-range 193-300 seconds
Protein- range 12.5-13%

8
Winter barley
Area harvested 100 % UK area
Estimated average UK yield 7.4 t/ha
Yield range 4.8-13.0 t/ha
UK 10 year average yield 6.5 t/ha
Quality averages to date
SpWt 66.8 kg/hl
Grain N 1.55 %
Screenings 2.0 %
Winter barley harvest started in week 2 (WE 21 July) with only occasional crops harvested in the previous
week. The main period of winter barley harvest occurred in weeks 2-6 (21 July-18 August), when weather
conditions were mainly fine and dry, with almost all of the winter barley area harvested by week 6 (WE
18/8). Peak harvest activity occurred during week 5 (WE 11/8). Despite the slightly delayed start to
harvest, harvest finished in line with most recent years (Figure 3).
Source: ADAS 2015
Figure 3 Winter barley harvest progress comparison – Cumulative percentage area harvested compared to previous years
Yield
Crops performed very well this season, with the ADAS estimate for the UK winter barley yield at 7.4 t/ha
- a 13% increase compared to the 10 year national average of 6.5 t/ha. Regional yield estimates range
from 6.1 t/ha in Wales to 8.7 t/ha in Yorkshire. Both hybrid and conventional six-row varieties yielded
well, with hybrid crops typically achieving yields of 9.0 -10.0 t/ha, and yields of all hybrid and six row crops
ranging between 6.5 – 11.0 t/ha. Malting barley yields ranged between 4.8-9.0 t/ha. Results from AHDB
Recommended List trials support the better than average yields observed at the farm level this season,
with yields of control varieties averaging 10.62 t/ha- an 11% increase on the 5 year average.
9
Quality – see spring barley
Spring barley
Area harvested 100 % UK area
Estimated average UK yield 5.9-6.1 t/ha
Yield range 4.0-10.0 t/ha
UK 10 year average yield 5.4 t/ha
Quality averages to date
SpWt 66.4 kg/hl
Grain N 1.52 %
Screenings 1.3 %
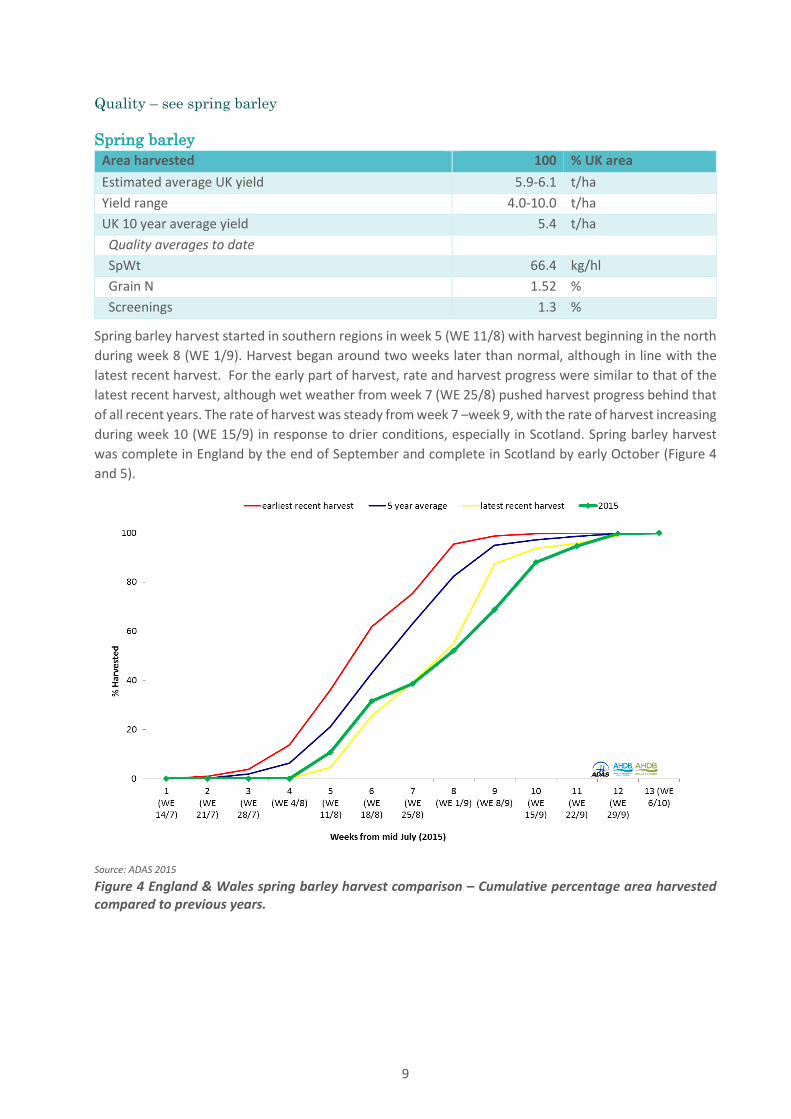
Spring barley harvest started in southern regions in week 5 (WE 11/8) with harvest beginning in the north
during week 8 (WE 1/9). Harvest began around two weeks later than normal, although in line with the
latest recent harvest. For the early part of harvest, rate and harvest progress were similar to that of the
latest recent harvest, although wet weather from week 7 (WE 25/8) pushed harvest progress behind that
of all recent years. The rate of harvest was steady from week 7 –week 9, with the rate of harvest increasing
during week 10 (WE 15/9) in response to drier conditions, especially in Scotland. Spring barley harvest
was complete in England by the end of September and complete in Scotland by early October (Figure 4
and 5).
Source: ADAS 2015
Figure 4 England & Wales spring barley harvest comparison – Cumulative percentage area harvested compared to previous years.

10
Source: ADAS 2015 Figure 5 Scotland spring barley harvest comparison – Cumulative percentage area harvested compared to previous years.
Yield
The ADAS UK yield estimate is 5.9-6.1 t/ha- a 9-13% increase on the ten year average of 5.4 t/ha. Yields
of malting varieties typically ranged between 4.0-9.6 t/ha, whilst feed yields were slightly higher, typically
ranging between 4.2-10.0 t/ha. Results of 16 AHDB Recommended List trials support the good spring
barley yields seen this season, with the average yield of control varieties being 17% higher than the five
year average at 8.75 t/ha.
Quality
The AHDB second provisional CQS includes data from 28,338 barley samples, with the majority of the
samples coming from Scotland and Eastern England, with spring barley accounting for 65% of the sample
(Table 3).
Table 3 AHDB Quality information for GB barley crops
Barley total 2011 2012 2013 2014 2015 3 year average
(excluding 2012)
Specific weight kg/hl 66.4 62.9 67.5 66.3 66.5 66.7
Nitrogen % 1.71 1.6 1.68 1.53 1.53 1.64
Screenings (2.25mm) % 1.4 3.6 1.7 1.4 1.5 1.5
Specific weight- The AHDB average specific weight for barley is 66.5 kg/hl, which is lower than the three
year average (excluding 2012) of 66.7 kg/hl, but slightly higher than 2014 (66.3 kg/hl). AHDB results ranged
between 61.1-71.5 kg/hl.
Grain protein – The average grain nitrogen content is 1.53%, which is in line with 2014, but lower than all
other recent years and the three year average (1.64%). Nitrogen contents ranged between 1.17-1.92% for

11
all barley crops, with winter barley nitrogen content averaging 1.55% and for spring barley averaging
1.52%.
Screenings- Screening levels through a 2.25 mm sieve averaged 1.5% which is in line with the three year
average (excluding 2012) but slightly higher than 2014 (1.4%). AHDB results ranged between 0-5%.
Oats
Area harvested 100 % UK area
Estimated average UK yield 6.1-6.3 t/ha
Yield range 3.7-9.25 t/ha
UK 10 year average yield 5.7 t/ha
Quality averages to date
SpWt 54 kg/hl
Moisture at harvest 16 %
Harvest of winter oats started in week 5 (WE 11/8) in line with the later recent harvests. Progress with
oat harvest progressed at a steady rate, similar to most recent years, with spring oat harvest beginning in
the south and east of England in week 6 (WE 18/8). Harvest was virtually complete by 6 October with just
small areas of oats left to harvest in northern Scotland (Figure 6).
Source: ADAS 2015
Figure 6 Oats harvest progress comparison – Cumulative percentage area harvested compared to previous years
Yield
Overall, yields from both winter and spring oats were good, with the ADAS UK estimated yield at 6.1-6.3
t/ha- 7-10% greater than the ten year average of 5.7 t/ha. Winter oat yields ranged between 3.70-9.25
t/ha, whilst spring oats typically yielded between 4.1-8.7 t/ha. Yields of naked oats have typically been
variable, ranging between 3.8-7.0 t/ha.

12
Quality
Overall, quality of oats was good, although crops harvested towards the end of the season started to lose
their bright colour and look dull. Specific weights were good, typically averaging between 54-56 kg/hl, and
ranging between 46-58 kg/hl.
Winter oilseed rape
Area harvested 100 % UK area
Estimated average UK yield 3.8 t/ha
Yield range 2.25-6.32 t/ha
UK 10 year average yield 3.4 t/ha
Oil content 42-48 %
Winter oilseed rape harvest began in week 2 (WE 21/7) which was in line with the five year average. Rate
of progress was similar to most recent years and as a result harvest in England was completed in four
weeks. However, wet weather delayed the end of harvest in Scotland, with it taking another 3-4 weeks
for the last few crops to be completed. (Figure 7).
Source: ADAS 2015
Figure 7 Winter oilseed rape harvest progress comparison – Cumulative percentage area harvested compared to previous years.
Yield
Good establishment conditions in the autumn and opportunities throughout the season to control weeds,
pests and disease resulted in some very good yields this season, with the current ADAS UK yield estimate
at 3.8 t/ha- a 13% increase in yield compared to the national 10 year average of 3.4 t/ha. Yields ranged
from 2.25-6.70 t/ha, with the lowest yields seen from crops grown on fields with high black-grass pressure,
or those crops that were affected by pigeon or cabbage stem flea beetle (CSFB) damage. The highest yield
of 6.70 t/ha came from a crop of the variety Picto, which was grown on the Lincolnshire wolds- this yield
set a new world record.

13
Quality
The quality of winter oilseed rape crops was generally good, although there are some reports of variable
seed sizes and issues with admixture. Oil content ranged between 42-48%.
Spring oilseed rape
Area harvested 100 % UK area
Estimated average UK yield 2.5-2.6 t/ha
Yield range 1.85-3.3 t/ha
UK 5 year average yield 2.0 t/ha
A start to spring oilseed rape harvest was made in week 7 (WE 25/8) in the South West. The greatest
progress occurred during week 10 (WE 15/9), which coincided with when most crops from Midlands south
reached harvest maturity. Harvest was complete in England by week 12 (WE 29/09), with the remaining
crops in Scotland harvested by the end of week 13 (WE 06/10).
Yield
The ADAS UK yield estimate is 2.5-2.6 t/ha- which is above the five year average (2.0 t/ha). Yields ranged
between 1.85 – 3.3 t/ha, with the higher yields coming from crops which established well and the lower
yields associated with crops that did not establish well and were affected by pest damage early on in the
season.
Sarah Wynn Rebecca Carter Brenda Mullan
ADAS Boxworth
Direct dial: 01954 268249
ADAS Boxworth
AHDB