Report AES Landslide hazard georgia - CENNdrm.cenn.org/Local_Case_studies/Landslide hazard...
13
i Report on the project of AES Geohazards Stream Landslide hazard assessment in the Khelvachauri area, Georgia May 2010 George Gaprindashvili Jianping Guo Panisara Daorueang Institute of Geo-Information Science and Earth Observation (ITC) of the University of Twente
Transcript of Report AES Landslide hazard georgia - CENNdrm.cenn.org/Local_Case_studies/Landslide hazard...

i
Report on the project of AES Geohazards Stream
Landslide hazard assessment in the Khelvachauri area, Georgia
May 2010
George Gaprindashvili Jianping Guo Panisara Daorueang
Institute of Geo-Information Science and Earth Observation (ITC) of the University of Twente

ii
Table of contents
1. INTRODUCTION ................................................................................................................................ 3
2. DATA DESCRIPTION ........................................................................................................................ 4
3. METHODOLOGY ............................................................................................................................... 5
3.1. WORK FLOW ................................................................................................................................... 5 3.2. METHODOLOGY .............................................................................................................................. 5
4. RESULTS AND DISCUSSION ........................................................................................................... 6
4.1.1 Terrain parameters ................................................................................................................. 6 4.1.2 Active landslide extraction ..................................................................................................... 8 4.1.3 Weight assignment ................................................................................................................ 10 4.1.4 Susceptibility assessment ...................................................................................................... 11 4.1.5 Vulnerability assessment ...................................................................................................... 12
5. CONCLUSIONS AND RECOMMENDATIONS ........................................................................... 13
REFERENCES ............................................................................................................................................. 13
3
Khelvachauri
1. Introduction
As in most developing countries, quantitative landslide assessment is still scarce in Georgia, due
to the too limited resources available for research, on historic record of landslides, detailed
socio-economic elements at risk. In particular, there are not enough data on the probability of landslides of different magnitudes to make a quantitative risk. Most conventional landslide
studies in Georgia are descriptive, more data-driven assessment with in-depth knowledge of all
the causal factors for landslide, therefore, are extremely urgent.
Landslide risk assessment methods are classified into three groups, as qualitative (probability
and losses in qualitative terms), semi-quantitative (indicative probability, qualitative terms) and
quantitative (probability and losses both numerical) (Lee and Jones, 2004).
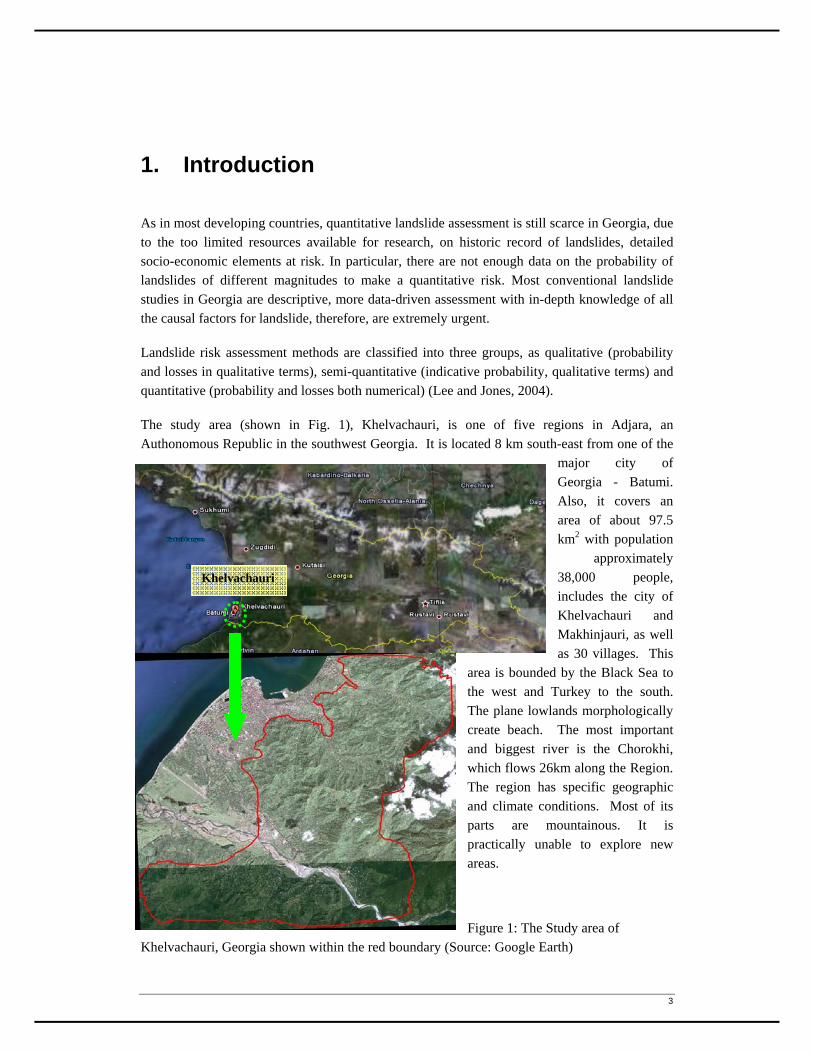
The study area (shown in Fig. 1), Khelvachauri, is one of five regions in Adjara, an
Authonomous Republic in the southwest Georgia. It is located 8 km south-east from one of the
major city of
Georgia - Batumi.
Also, it covers an
area of about 97.5 km2 with population
approximately
38,000 people,
includes the city of
Khelvachauri and
Makhinjauri, as well
as 30 villages. This
area is bounded by the Black Sea to
the west and Turkey to the south.
The plane lowlands morphologically
create beach. The most important
and biggest river is the Chorokhi,
which flows 26km along the Region.
The region has specific geographic
and climate conditions. Most of its
parts are mountainous. It is
practically unable to explore new
areas.
Figure 1: The Study area of
Khelvachauri, Georgia shown within the red boundary (Source: Google Earth)
4
Agriculture dominates in the regional economy though industry is also developed there. There
are three tea factories, stagnant materials plant, constructing blocks workshop. Agriculture takes
the leading part. There is developed tea, citrus, cattle breeding, and other branches there. Also,
tourism is developed in the region.
Many environmental factors, related to the fields of geology, geomorphology, topography and
land use, have the potential to affect land sliding (Clerici et al., 2002). Moreover, most of the
quantitative risk assessment methods that have been developed elsewhere are case-specific and
require many types of data, on landslide occurrence and impact, most of which are not yet
available in Georgia.
The purpose of this project was to evaluate landslide hazard using quantitative method. The
study is based on the landslide inventory, generated by interpretation of aerial photos, satellite
images and field data.
The objectives of this project are as follows:
Define and justify a relevant set of spatial criteria for this case of landslide hazard
assessment.
Carry out a proto-type landslide susceptibility assessment to demonstrate the
possibilities and limitations of a SMCE-based approach.
Contrast ASTER-GDEM data and a contour-based DEM data sources for generating
“spatial criteria” maps.
Construct an exposure map by comparing the produced landslide susceptibility map
with available cadastral data.
2. Data Description
In order to assess the landslide hazard in the Khelvachauri area, Georgia, the following dataset were utilized:
Landslide inventory map directly visually interpreted from high resolution Google-
Earth image
Egineering geological map(scale at 1:10,000) produced from the study during 1976-
1980 (Source: Ministry of geology of Georgia, 1980)
Topographic map data at 1:50,000 scale
Geomorphological map
Soil dept data

5
Landuse data deriving from parcel data
Spatial distribution and the number of buildings extracted from cadastral data
3. Methodology
3.1. Work flow
According to Figure 2, this study is based on a vulnerability assessment at the Khelvachauri
area, Georgia. The scope of this study comprises of integration of landslide susceptibility and
physical vulnerability (number of building and landuse information). The integral result will
identify the physical vulnerability. As for the input data, especially landslide inventory, it is a
crucial mandatory data for assessing landslide vulnerability, predicting the future landslide
occurrence, and its level of risk. Besides, it is very neccessary to understand the different casual
factors as well. The selected data used are lithology, geomorphology, landuse, including DEM.
Figure 2: Flowchart of landslide vulnerability assessment in Khelvachauri, Georgia.
3.2. Methodology
Due to the complete lack of historical landslide information and geotechnical data precluding
the development of quantitative deterministic or probabilistic models, we carried out a basic
Landslide inventory
Landslide assessment(Statistical Method)
Landslide susceptabiliy map
Physical Vulnerability Assessment
Engineering-geological
map
LithologyDEM
(Slope/Aspect)Active
Topogra-phic map
Soil depth
Building numbers
Geomorphology
Landuse

6
bivariate statistical landse and soil depth), and only the landslide type of “active”, which is seen
as the result of the combination of six causal factors.
In this project we will generate a landslide susceptibility map, using a basic, but useful,
statistical method, called hazard index method, which is based upon the following formula:
( )( )
ln ln( ) ( )i
Area SiDensclas Area SiW
Area Ni Area NiDensmap
………………………………... (1)
Where Wi is the weight given to 6 parameters: slope, aspect, lithology, geomorphology, land
use and soil depth. Densclas is the landslide density within the parameter class. Densmap is the
landslide density within the entire map. Area (Si) is area, which contain landslides, in a certain
parameter class. Area (Ni) indicates total area in a certain parameter class.
The method is based on map crossing of a landslide map with one of the 6 parameter map. The
map crossing results are shown in a cross table, which can be used to calculate the density of
landslides per parameter class. A standardization of these density values can be obtained by
relating them to the overall density in the entire area. The relation can be done by division or by
subtraction. In this project the landslide density per class is divided by the landslide density in
the entire map. The natural logarithm is used to give negative weights when the landslide
density is lower than normal and positive when it is higher than normal. By combining the six
maps of weight-values a susceptibility hazard map can be created, as is obtained by simply
adding the separate weight-values. After that, the values will be converted into 3 classes: low,
moderate and high susceptibilities. The details of this method are shown in Fig. 3.
4. Results and discussion
We produced the DEM data from two different data sources of ASTER and topographic contour
map.
4.1.1 Terrain parameters
Slope, aspect and other DEM-derived terrain parameters are good indicators of the spatial
criteria maps needed in SMCE-based landslide susceptibility assessment. All the terrain
parameters are from DEM. First of all, we produced the DEM over the study area using two
different data sources, i.e. ASTER image and contour map, which have their pros and cons, and
corresponding implications for the DEM-derived criteria map for the vulnerability assessment.
We compared contour lines from 1:50,000 scale topographic map with that from Aster GDEM
and big errors were found, which was demonstrate in Fig 4.

7
Aster GDEM
Topographic
map
Figure 3: Methodology
Topographical map
Digitizing (ArcGIS)
Contour Line
Create Segment map (ILWIS)
Contour with Z value
Contour interpolation
DTM/DEM
Filter (DX, DY
operation)
SLOPEDEG
Creating DEM and Slope
* Slope Table Active Table
Crossing parameter
Actslope Table
Calculating landslide density
Landslide density Table
Calculating Weight value
Slope_cl
Calculating Weight Map
Weight Map
Combine Weight Map
Susceptibility Map
Number of Buildings
Crossing parameter
Vulnerability (High, Moderate,
Low Hazard)
1.Calculate active slope class area2.Calculate total area in each slope area3.Calculate area with active landslide4.Calculate total area5.Calcuate total area with landslide
1.Calculate total area2.Calculate area with active landslide3.Calculate landslide density
Creating Susceptibility and Vulnerability Map
* Repeating the procedure to aspect, lithology, soil depth, geomorphology, and
landuse data
Slope weightAspect weight
Lithology weightSoil depth weight
Geomorphology weightLanduse weight

8
.
Figure 4: Schematic map for the error between Aster GDEM and topographic map
4.1.2 Active landslide extraction
Due to the severe impact of active landslide on environment, we extracted 38 active type of
landslide, and performed the assessment based only on this type. Landslides are spreading
sporadically almost everywhere in the study area (Fig. 5), they maybe have different characteristics and causative factors.
Figure 5: Active landslide map
extracted from the landslide inventory over the study area.

9
Soil weight map
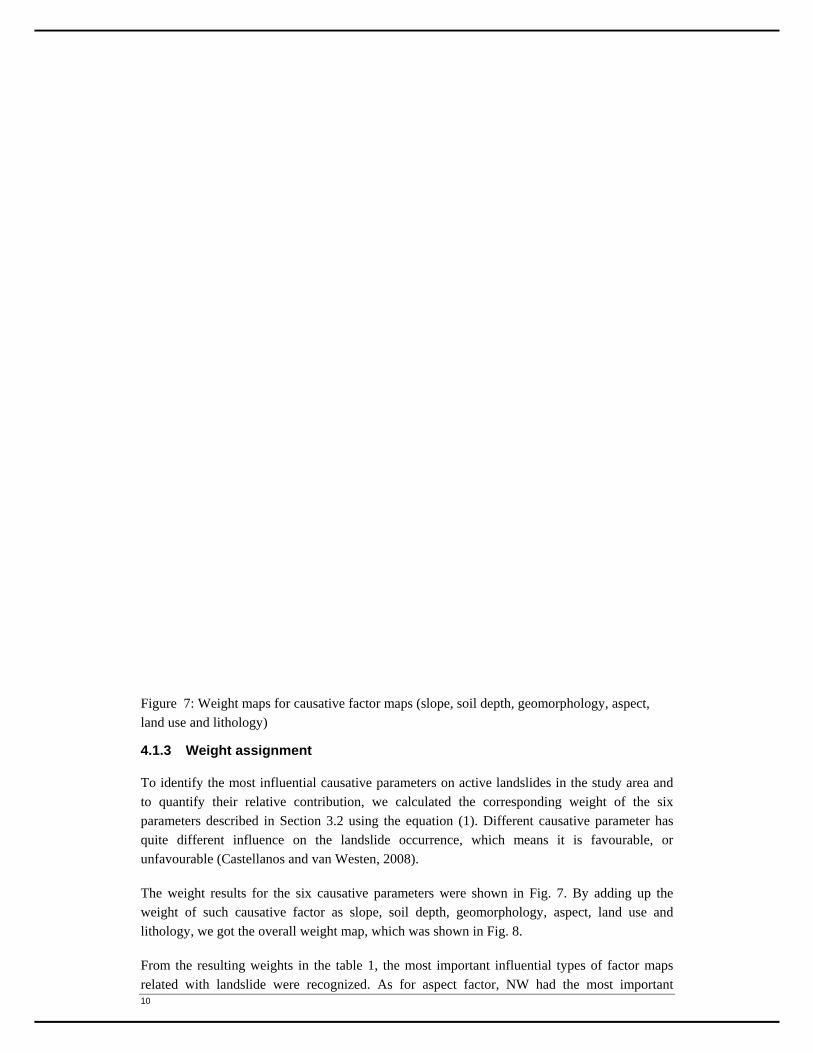
Figure 6: Causative factor maps (slope, soil depth, geomorphology, aspect, landuse and
lithology)
10
Figure 7: Weight maps for causative factor maps (slope, soil depth, geomorphology, aspect,
land use and lithology)
4.1.3 Weight assignment
To identify the most influential causative parameters on active landslides in the study area and
to quantify their relative contribution, we calculated the corresponding weight of the six
parameters described in Section 3.2 using the equation (1). Different causative parameter has
quite different influence on the landslide occurrence, which means it is favourable, or
unfavourable (Castellanos and van Westen, 2008).
The weight results for the six causative parameters were shown in Fig. 7. By adding up the weight of such causative factor as slope, soil depth, geomorphology, aspect, land use and
lithology, we got the overall weight map, which was shown in Fig. 8.
From the resulting weights in the table 1, the most important influential types of factor maps
related with landslide were recognized. As for aspect factor, NW had the most important

11
relation with landslides, mountain class for geomorphology, private use for landuse, and
laterized loam and clay for lithology presented the highest hazard, 19-24 degree for slope and
soil depth between 10-20 had the same influence on landslide.
Table 1: Most influential type or value range versus each causative parameter map
Figure 8: The overall weight (left panel) produced by averaging the six factor weight maps and
the corresponding histogram (right panel) based on overall weight on the landslide occurrence.
4.1.4 Susceptibility assessment
Based on the weights assignment,
we carried out the susceptibility
assessment. The final weights of
the resulting map ranged from -
18.9 to 2.2. Although the map
(Fig.7) gives a good indication of
the quantitative landslide hazard in
the study area, too wide range
might make it difficult to use by
decision makers for development
planning. Therefore, the hazard
map was grouped into three
Causative
factor maps ASPECT Geomorphology Landuse Lithology Slope(in
degree)
Soil depth
(in meter)
Most
influential
types NW mountain
private
use
laterized
loam and
clay
19-24 10-20

12
simplified categories based on the histogram of the final weight map shown in Fig. 6: high,
moderate and low (Fig. 8). Low hazard corresponded to the range of (-18.9, -4), the moderate to
(-4, 1.1) and the high one to (1.1, 2.2).
Figure 9: The susceptibility map based on the statistic methods described in section
4.1.5 Vulnerability assessment
Here we only performed the physical vulnerability assessment over the study area due to the
limited availability of data types related to population and social properties. The assessment
results were given in table 2. Within this study area, in total 9909 of building are included.
Amongst them, 3382 buildings (34.13%) represented high susceptibility class, followed by 4584
buildings as moderate susceptible. According to table 3, within in study area main landuse
types were private and government. In low susceptibility class, with 17.9 sq.km. of area, there
were the governmental landuse about 26% and private about 23.3%. In moderate susceptibility class, with 51.9 sq.km. of area, there were the governmental landuse about 26.6% and private about 25.6%. In high susceptibility class, with 27.6 sq.km. of area, there were the
governmental landuse about 39.9% and private about 40.9%.
Number of buildings Percentage of total
High susceptibility class 3,382 34.13
Moderate susceptibility class 4,584 46.26
Low susceptibility class 1,943 19.61
Total 9,909 100
Table 2: Physical vulnerability results (Number of buildings)
Hazard * Landuse
Area
(sq.km.) %
Low hazard * government 4.7 26.0 Low hazard * private 4.2 23.3 Total Low susceptibility class area 17.9 Moderate hazard * government 13.9 26.6 Moderate hazard * private 13.3 25.6 Total Moderate susceptibility class area 51.9 High hazard * government 11.0 39.9 High hazard * private 11.3 40.9 Total High susceptibility class area 27.7 Total area of Khelvachauri 97.5
Table 3: Physical vulnerability results (Landuse)
Ninka
Highlight

13
5. Conclusions and recommendations
Based on the work we did in this project, we found that there is limitation for spatial analysis due to data availability. The analysis can be done only in terms of physical vulnerability (by overlaying the number of buildings, including landuse data, in the different hazardous areas). Besides, there is big difference between a contour-based DEM data and ASTER-GDEM, which may be attributed by the data source errors.
By calculating the respective weight for six different causative factors, we recognized the most important influential types of factor maps related with landslide, i.e. NW for aspect, mountain class for geomorphology, private use for landuse, and laterized loam and clay for lithology, 19-24 degree for slope and soil depth between 10 and 20 resented the highest hazard of landslide.
The susceptibility map is reliable, however, due to the lack of social, economic, environmental and physical vulnerability data, only building and landuse vulnerability assessments were carried out in our study. We found that 34.13% of buildings were represented as high susceptibility class. Also we estimated that in high susceptibility class there was 39.9% from the governmental landuse and 40.9% from the private.
For further study which can improve the vulnerability assessment results, we suggested that other factors such as river distance, number of population per household, climate data, history of landslide event should be taken into account. The landslide data should be more reliable. This is because the quality of landslide information is important to generate the output of model results. Also, it is useful to make use of stereo image interpretation to investigate landslide inventory.
References
Castellanos Abella, E. A. and C. J. Van Western, 2007. Generation of a landslide risk index
map for Cuba using spatial multi-criteria evaluation, in: Landslides 4 (2007) 4.
Clerici, A., Perego, S., Tellini, C., and Vescovi, P. 2002. A procedure for landslide susceptibility zonation by the conditional analysis method. [doi: DOI: 10.1016/S0169-
555X(02)00079-X]. Geomorphology, 48(4), 349-364.
Lee, E.M., and D. K. C., Jones, 2004. Landslide Risk Assessment. Thomas Telford, London.
454 pp.
Castellanos Abella, E.A. and van Westen, C.J., 2008. Qualitative landslide susceptibility
assessment by multicriteria analysis: a case study from San Antonio del Sur, Guantánamo,
Cuba. Geomorphology, 94 (2008)3-4, pp. 453-466
Ministry of geology of Georgia, 1980. Expedition Geology and Hydro Geology, report of
engineering-geological studies in Khelvachauri district in 1976-1980, volume 1-2. Tbilisi
Georgia.