REPORT 745 - Digital Library/67531/metadc60004/m2/1/high_res_d/... · REPORT NO. 745 TESTS OF...
13
REPORT NO. 745 TESTS OF CONVENTIONAL RADIAL-ENGINE COWLINGS By RTTSSELLG. ROBINSON and JOEN V. BECKEE . SUMMARY The drag churacteristica oj eight radial+ngine cowling~ hare been determined orer a wide speed range in the NA12A 8#oot high-speed wind tunnel. The pre=ure die- ti-ibution ocer all couling~ uxw measured, to and abore the ~peed of thecompressibility burble, as an aid in intwpret- ing the jorce tats. On.e-fifi-scale models oj radial- tmg”ne cowlings on a uing+mcefle combination were used in the tekg. % speed at which the e~ectioe nucelle drag abruptly increaeed owing to the compressibility burble wai?found to Lwy jrom S1O miles pm hourfor one of the existing cowling shupe~ to @l miles per hour jor the beet shape derel.qxd as a remdt of the present investigation. The corresponding speeds at 30,W0 jeet ahiiude in a. standard atmosphere (–@a l?) are fi80 and 430 miles per hour, respe&”rely. Corre[aticn between the peuk negatire pressure on the suT- face of a coding and the critical &needof the cowling wa8 edabli.shed. The speed at which the effectiw nacelle drag abruptly increased was fi.mmd to be equal -to, or slightly greater than, the flight speed at which the speed of sound ia reuched locaUy on the cowling. The critem-anfor the de- sign of conventional eodings with high critical speeds apgeara to be mall negatim pressures of uniform di4=i- bution ocer the cowling nose, indicath of local rehxn”ties thut exceed the general strewn relm”ty by a minimum amount. The cowlings dewloped on this prinm”ple M not only the h~hest critical speedg but algo the lowest drags throughout the entire speed range and M greuter usefil ranges of angl~ of attack. INTRODUCTION Experimental work on bodies of many shapes at high speeds has shown that for each shape a speed is reached at which a compr=ibility burble occurs, causing an abrupt increase in drsg and causing, on Ming bodi=, a loss of lift and a marked increase m pitching moment. The nature of the compressibility burbIe is described in reference 1, where it is shown that a compression shock forms on a body when the local airspeed over any part of the body esceeds the local speed of sound. The flight speed at which the load speed of sound is reaohed is therefore the Iimiting speed beIow which the aerody- namic characteristics of a body maybe expected to vary in a regular manner and is termed “criticaI” speed. This criticaI speed, dependent on the shape and the lift of the body, usually lies between 0.4 and 0.9 times the speed of sound, or 305 b 686 miles per hour in standard sea-level atmosphere. The compression shock occur- ring after the critical speed is reached invcdves a sudden, rather than a gradual, retmdation of the air that has reached supersonic speeds near the surface of the body md r=ults in a dissipation of energy. The source of the increased drag observed at the compr=ibiity bur- ble is the compression shock, and the excess drag is due to the conversion of a considerable amount qf the air- stream kinetic energy into heat at the compression shock. The drag increases still further at speeds above the compremibility burbIe because both the intensity (pressure drop) and “tie extent of the shock measured perpendicular to the body surface increase with increas- ing speed. It is also known that the presence of a comprksion shook tends to aggravate separation of the flow ovw the trailing portion of a body and thereby further increases the dra&. The effect of the drag increase caused by the compres- sion shock on airpIane perforrmmce is practically to limit the maximum speed of m atiI~e to the Iow=t _ critical speed of any of its large oomponent parts be- cause of the txcessive power required to overcome the drag at higher speeds. The desirability of determining the criticaI speeds of component parta of an airplane, especially those contributing the most drag and those with the lowest critical speed, is apparent. Reference 2 supports the reasoning t.bt blunt bodies or bodies of high curvature (for exampLe, circular cyI.inders as compared with airfoiI sections) have the Iowes.t critical speeds because the masimum local air- speed near the surface of such bodies reaches the Iocal speed of sound at a comparatively Iow free+tream speed. Radial-engine cowlings fall in this class and there are pressuredistribution results avaiIable to in- dicate the magnitude of the maximum speed over a number of typical practical covdings. The remdta of experimental work on full-scale cowhgs tested on an .— operating eggine are given in reference 3. The pressure- dktribution data from that reference indicate that two of the cowLi&s had locaI speeds over the nose portion approximately twice the magnitude of the free+tre.~ ____ speed. The criticaI speed of such cowlings (as pre- ... dieted by the Imown peak negative pressure and the - relation, presented hi refermoe 4, between the Kak . ... pressure and the critiwd speed) is about 300 miles per hour. Reference 3 aIso shows the direet effect of curvature of the co-ding nose on the pe& negative pres- sure, and hence on maximum locxd sp,eed over the cowl- ing. This effect suggests increasing the critical speed -287
Transcript of REPORT 745 - Digital Library/67531/metadc60004/m2/1/high_res_d/... · REPORT NO. 745 TESTS OF...
REPORT NO. 745
TESTS OF CONVENTIONAL RADIAL-ENGINE COWLINGS
By RTTSSELLG. ROBINSON and JOEN V. BECKEE.
SUMMARY
The drag churacteristica oj eight radial+ngine cowling~hare been determined orer a wide speed range in theNA12A 8#oot high-speed wind tunnel. The pre=ure die-ti-ibution ocer all couling~ uxw measured, to and abore the~peed of thecompressibility burble, as an aid in intwpret-ing the jorce tats. On.e-fifi-scale models oj radial-tmg”ne cowlings on a uing+mcefle combination were usedin the tekg.
% speed at which the e~ectioe nucelle drag abruptlyincreaeed owing to the compressibility burble wai?found toLwy jrom S1O miles pm hourfor one of the existing cowlingshupe~ to @l miles per hour jor the beet shape derel.qxdas a remdt of the present investigation. The correspondingspeeds at 30,W0 jeet ahiiude in a. standard atmosphere(–@a l?) are fi80 and 430 miles per hour, respe&”rely.Corre[aticn between the peuk negatire pressure on the suT-
face of a coding and the critical &needof the cowling wa8
edabli.shed. The speed at which the effectiw nacelle dragabruptly increased was fi.mmd to be equal -to, or slightlygreater than, the flight speed at which the speed of sound iareuched locaUy on the cowling. The critem-anfor the de-sign of conventional eodings with high critical speedsapgeara to be mall negatim pressures of uniform di4=i-bution ocer the cowling nose, indicath of local rehxn”tiesthut exceed the general strewn relm”ty by a minimumamount. The cowlings dewloped on this prinm”ple Mnot only the h~hest critical speedg but algo the lowest dragsthroughout the entire speed range and M greuter usefilranges of angl~ of attack.
INTRODUCTION
Experimental work on bodies of many shapes at highspeeds has shown that for each shape a speed is reachedat which a compr=ibility burble occurs, causing anabrupt increase in drsg and causing, on Ming bodi=, aloss of lift and a marked increase m pitching moment.The nature of the compressibility burbIe is described inreference 1, where it is shown that a compression shockforms on a body when the local airspeed over any partof the body esceeds the local speed of sound. Theflight speed at which the load speed of sound is reaohedis therefore the Iimiting speed beIow which the aerody-namic characteristics of a body maybe expected to varyin a regular manner and is termed “criticaI” speed.This criticaI speed, dependent on the shape and the liftof the body, usually lies between 0.4 and 0.9 times thespeed of sound, or 305 b 686 miles per hour in standard
sea-level atmosphere. The compression shock occur-ring after the critical speed is reached invcdves a sudden,rather than a gradual, retmdation of the air that hasreached supersonic speeds near the surface of the bodymd r=ults in a dissipation of energy. The source ofthe increased drag observed at the compr=ibiity bur-ble is the compression shock, and the excess drag is dueto the conversion of a considerable amount qf the air-stream kinetic energy into heat at the compressionshock. The drag increases still further at speeds abovethe compremibility burbIe because both the intensity(pressure drop) and “tie extent of the shock measuredperpendicular to the body surface increase with increas-ing speed. It is also known that the presence of acomprksion shook tends to aggravate separation of theflow ovw the trailing portion of a body and therebyfurther increases the dra&.
The effect of the drag increase caused by the compres-sion shock on airpIane perforrmmce is practically tolimit the maximum speed of m atiI~e to the Iow=t _critical speed of any of its large oomponent parts be-cause of the txcessive power required to overcome thedrag at higher speeds. The desirability of determiningthe criticaI speeds of component parta of an airplane,especially those contributing the most drag and thosewith the lowest critical speed, is apparent.
Reference 2 supports the reasoning t.bt blunt bodiesor bodies of high curvature (for exampLe, circularcyI.inders as compared with airfoiI sections) have theIowes.t critical speeds because the masimum local air-speed near the surface of such bodies reaches the Iocalspeed of sound at a comparatively Iow free+treamspeed. Radial-engine cowlings fall in this class andthere are pressuredistribution results avaiIable to in-dicate the magnitude of the maximum speed over anumber of typical practical covdings. The remdta ofexperimental work on full-scale cowhgs tested on an .—operating eggine are given in reference 3. The pressure-dktribution data from that reference indicate that twoof the cowLi&s had locaI speeds over the nose portionapproximately twice the magnitude of the free+tre.~ ____speed. The criticaI speed of such cowlings (as pre-
...
dieted by the Imown peak negative pressure and the -relation, presented hi refermoe 4, between the Kak . ...pressure and the critiwd speed) is about 300 miles perhour. Reference 3 aIso shows the direet effect ofcurvature of the co-ding nose on the pe& negative pres-sure, and hence on maximum locxd sp,eed over the cowl-ing. This effect suggests increasing the critical speed
-287

288 REPORT NO. 745—NATIONAL ADVISORY COtiIl”lWE FOR AERONAUTICS
of n rrtdial-engine cowling by a propm distribution ofthe curvature.
Reference 3 further shows that the etfect of a propel-lcr opcmting at the high-speed or the cruising conditiondoes not appreciably alter the. peak negative pressureover a cowling in the slipstream. This result is to bcexpected because at high speeds the propeller slip issmall compared with the fonvard speed. The criticalspeed of a cowIing under smvic.e opcmting conditions
Presu-e To foi-cresue fube
.-
FIOVRE l.—Aeswnlblyof whg, namlle, nd eowllng. Nose C, skfrt 1.
ma,y therefore bc dctwminwl quite uccuratdy by theuse of a model without a propdler.
The purpose of the present tivcstigation was todetermine in the high-speed range the merit of modelsof five full-scaIe cowlings and ncw cowling s“ha p esdeveIopcd from the test remhaof the first five. ResuItsof the tests were to be cmrdalcd to allow the predictionof the compressibility burble from low-speed pressurem etisurements. The tests wtire conducted in May 1937at Langley Memorial Aeronautical Laboratory.
APPARATUS AND METHOD
The NACA 8-foot high-spwd wind tunrwl in whichtho investigation was carriccl out is n single:rcturn,
.——FWIIRF: !.-W&mcelic eumblnallnn. NW Cskk-l I; -
circular, closed-throat turnd. The flow in the testsection has been found by surve s to bc satisfactorily
zsteady and uniform both in spe d and direction. Thetiirspecd is continuously controllable from 76 to. morethah 500 iniles per hour. The turbulence, as deter-mined by sphere tests (reference 5), is approximat@Iyequivalent to that of free air.
The radiaI-engine cowkgs were mounted on a nacelIe
which was mounted centrtdly on a wing of 2-footchord and NACA 23012 section. The wing com-pletdy spanned the teat scwtion of the hmncl. ThecowIings and the nacelle were one-fifth thu size of thefull-scale cowlings and nacelle reporlxd in reference 3.The wing was metal-covered, unpaintml, and amody-namically smooth; that is, further polishing woukl
—
.FmuBB &vRear vfew o(wlng+wdfe mmhlnatlon motmmd h tba ttumeI.
produce no decrease h profile drag. ~lgurc 1 is a cross-sectional view through the center of the wing-narclkcombintition. A general view of ihc naceIIc withcowling nose 1 and skirt 1 is shown in figure 2,Figure 3 shows the wing-nacelle mscrnbly mountwiin the tunnel.
One-fifth-scale (10.40-in. dianwter) cowling modvls
-. . . .
..--””------;’?I ! ‘i
.
-K~~--...-....’-- .— .—. J- —.— .—
L----- . . . . . . .;:
FIGLRI 4.--CUWIIIU profiles.
were chosen as the largest that could be used with the2-foot-chord wing and still maintain nomml wing-naceIle proportions. The ratio
cowling diameterwing chord
= 0.43
for the model is somewhaL larger than for averagepractice but is within the range of prment+iay instal-

HIGH-SPEED TESTS OF CONVENTIONAL RKOIAL-ENGINE COWLINGS 289
lations. The center Iine of the naceIIe lay on tlchord Ike of the wing. The fore-and-aft position [the nacelle was such as to locate the propelIer, hathere been one, 40 percent of the wing chord aheaof the Ieading edge.
The five cowling-nose shapes (fig. 4) scaled dowfrom the corresponding full-scale cowlings eraployein the investigation reported in reference 3 me desiinated by the numbers used in that investigatio~Nose 1 was moditkd progrewhdy by cutting back tkmger radii at the Ieading edge. Noses A, B, and {were designed as the tests progressed. They have thsame over-all dimensions as nose 2 but have ditlererintermediate ordinates. Figure 5 presents photographof nose 5 and nose C. A bIank nose with a squalcorner rind the same over-aU dimensions as nose 2 waSISOtested. TabIe I gives the ordinates for all thcowIing noses tested. ,.
TABLE I.—VALUES OF R IN INCHES FOR EIGHT MODENOSES OF 10.4MNCH DIAMETER COWLING
[SeeflKs.1and 41
6.)
ag
.m
.4Q
.@)
:g
L40
MZ4QEm&ma.zl6.4a
Ncsr.
7
out-dde
LaL 474664664%4W6.07&n&ld&u& N&mKm----.......-----
Luslde
4.29L13
2%La----. . . .. ..-----. . . .-------------.-,--------. . . .
A
——
3.643.763.846.M416
g
&714.814.W&cQ6.r2
:tih!mLsl
.
B
H2.974114.314.474.s9470
M4e4
:E&17h19h!al5.!m
Two cowling skirts were employed in the investigation. Ordinates of the nacelle, which is simiIar t~aoelle 2 of reference 3, are given ‘h tabIe II.
TABLE 11.—NACELLE-MODEL ORDINATES
[See@@. Iand41
L (tn.)——
am.’25.6s
H1.461.65
i:2262.666.0sX45twl
L (h.)
4.254755.36
:Hi
It E1226142sI&26ls.2519.262).23
R (tn.}
6.125.16&17&11.%014S(j
t%3.KJ?.661.761.31.S7
.
.
.
(8)Nce-e6.(b)NoseC-
=RGrmx S.—MoieIcowllngs.
AU the cowlings w~eretested with a controlled amountof 00o1ing air t~ugh them. A flat bafie platewith
BixteeIJ ‘%4-inch hoIes simulated a bafikd radial engine

290 Rmcnm NO. 746-NATIONAL mvmmy COMMHTEE FOR AERONAmcS
of conductivity K. (reference 3), or equivalent leakarea, approximately 9 percent, The baflie pla@ wasincidentally used to support the replaceable nose andskirt portions, which were of cast nicke]-iron and werefinished smooth and flush. -
Cowling skirt 1 provided an exit-slot opening of 0.25inch and a baffle-plate preesure drop, Ap= 0.25g,(Dynamic pressure g= 1/2 pV’.) Cowling skirt 2 pro-
vided an exit opening of 0.11 inch (0.55 in. on full-scaleengine cowling) and a vrdue of Ap of 0, 12q.
The prtwsure distribution over the top of each cowlingwas measured at seven static-pressure orifices (fig. 1).The orifices were located according to the expwted prm-sure distribution for the part icular cowling; severaltubes were located near tho point of peak negativrpre9sure. The locations are given in table 111.
TABLE 111.—LOCATION OF PRESSURE ORIFICES ON COWLINGS
. [SW fig. 11
, op.
Nom ‘1
7’ :.... ‘.2 .3 4 6 6 7“
..—
(h O% .(;.) (1% (k.) (i:.) (h (1%) (i: J (i:.) (1:.) (/:.1 (f%) (1:.)——. —-. — — . ,.—. — .— . . —— — — .—
L. ,------- 0.0[2. . .._. .23 ;$ ?: iti !% ;g ~~ ;g ~fi f;; ~fi ::; ::; ::
4. . . .._-.._– 0 484 .24 &w :456________ .03 4.49 ;: 4.s :: &cm .5)
&IL .6’I k 17 2UI km5.!1 .m
6.18 km7----- o 4.6Q
6.19 2@l 6.20 h 18
.25 .:; L 16 i%s. 13 i%
::%J , H M 5.a86.19
;::____ .70 *4Jh Is
.26 .m 1.16 478M 6.19
.— 4. w 226 hoe 3.00:;: &m
G. . . . .._-.. . .2a 420 . m“ &M&18 hm
1.16 4.76 1:70 4.96 22s &10 am h 19 h Is &w
A total-prewmre tube w-as located above the cowlingskirt near its trailing edge (see figs. 1 and 5) for detect-
. ing any loss, such as that of a compression shock, out-. side the boundary layer. A total-pressure tube and a
static-premure tubo were placed in the center of theexit opening on the top side. of the nacelle for measuringthe airspeed and the total preesure in the exit-opening.
All the cowlings were tested over a speed range ex-tending frqn 115 mfles per hou~ to a speed. greater thanthe critical speed for each model at angIes of atttickof —1° and OO. Owing to structural limitations of thewing, the maximum airspeed was limited to 425 milesper hour at 1° and to 275 miles per hour at 2°. Nosesl-f, 6, and B, which were considered representative ofthe severaI types investigated, were teated through arange of angles of attack of —3° to 6° at 230 miles perhour. All the models were tested with skirt 1; onlynose 5 was tested with skirt 2. ~:
The lif~he drag, and the pitching moment of thewing-nacelle-cowling combinations were measured at-intervals of 30 miles per hour at the lower speeds andmore frequently near the critical speeds. The charac-teristics of the wing a30ne were determined in the stimeway, Pressure measurements on the cowlings weremade simultaneously with the force measurements.
RESULTS
Compressibility effects, such as those encountered athigh speeds on the engine cowlings under consideration,are intimately connected with the nondimensional Machnumber M in the same way that scale effects are con-neated with the Reynolds number B. Mach number
.a?o
.0/8
.0/6
.0/4
.0/2
c.
.010
.Ck78
.006
.004
.002
u .fu ..33 ..JU .4U .X1M
.60 .70
FImnB &-DraE ofwhg andwlq-nrdle mmbfnnt[one. Ummrrxmdfartumrl-
wdI efleeti.. a- -1O.
M is the ratio of airspeed V to the speed of sound in theair a. Results in this report are plotted againsh M.
Given the temperature of the air, the uirspecd corre-
—.-.. .
,.,

spending to a givenfrom
HIGH-SPEED TE9TS OF CONVENTIONAL RADIAbENGENE COW~GS
Mach number .M may be found with standard aeronautical practice.presented, then indicate dire,ctIy tdl
291. . . .
The results, ascompressibility
T’= 3fa ‘ I effects. ‘
and FORCE TESTS AND PRESiSUEE-DISTIUB~ON MEASUREMENTS
(z= 33.6>~460 + tThe remdta are mesented in terms of nondimensional . . 1
where t is the temperature in Fahrenheit degreesand V coefficients. Figl;re 6 shows the rdative magnitude of - . .
and a are in-tiles per hour. In some cases, for ease in the drag force of the wing aIone and the wing-naceIle -—
A,hpeed, ‘mph. at sea level (=”F)
.24
.20
.16
G
./2
.08
.04
0 Jo .20 .30 .40 50 -60 .70M
(m)a-lr.
A.+speed, mph, of sea level i59”FJ
o Jo .20 .30 .40 50 .60 .70M
AAspeed, mph, ut s~~tevel {~o~/co
.32
.28
.24
.20
f%
J6
.fz
I I. ---
.08 — — ~ = ‘--. ...-. . . ..
-..U4
—(4 I
0 .10 ..a .30 .47 .52 .80 .70M
(c) a-lO.
.m
.[6
.12
%
.Ch9
.04
0 .fo 20 .30 .# .m .69 .70M
--—. .
.
-.
(b) a- –l”. (d) u-2?.
FMCEE 7.–EfketNe nacetIe drag for nu+ous nCEWS,skh-t 1. The ticks indicate the uiticd .W.
visualizing the magnitude of the speeds, a sde of air- combination (both uncorrected for tunneka~ effects). .=.speed for st audard sea-levr4 conditions (t = 590 F, a = The drag coefficients for this f&we me based on wing _763 mph) is incLuded in the figures. area:
The drag coefficients and%he pressure coefficients areCD=
drag of wing -1- naceIIecomputed using the dynamic pressure in aocordanoe
.-. — .-q x 15.35 .“.
,

292 REPORT NO. 745-NATIONAL ADVISORY COMMITTEE FOR AERONAUTICS
For use in the. comparison of the drags of variouscowlings, an effective naceIle drag coefficient c~p basedon the frontal area of the cowling (0,590 sq ft) is used.This coefficient, of course, incIudcs the drag and theinterference of the. nacelle. By definition:
c., =“effective nacelle cira
9X O:590 = “ ._ ...= (drag-of ying + nacelle) – (drag of wing aIone),
q x 0.590
Effective nacelle drag coefficients for the cowling noses2, 4, 5, 7, A, B, and C with skirt 1 are shown in figure 7,
DIml llA-t–i-t-i-w
.70
.65
.60
%
.55
!
.&
.45
H- p-1”-”rl I I I 1- .}H~..~l I.= I ,. I““w ,..
{ I I I I t I I I Io ./0 .20 “30 .40 .50 .60 -70
MFmuIx&-Efleetlvonacelledragforrwm1, modifleattons to nose 1, and blnrrknose.
a-r.
The remdts obtained with nose 1 and with several modi-fications of nose 1, together with those for the squar~corner blank nose, are shown in figure 8. Figure 9shows the results of the test of nose 5 with skirt 2. Thecurves of effective nacelle drag coefficient were obtainedfrom fabed curves of the drag of the wing alone and the
drag of the wing-nacelle combination for the same nnglcof attack.
The pressure dist~bution over the nose section of ncowling is plotted in terms of the pressure coficicntP,
p.+,
wherep local static pressurep ~ static pressure in free stieam
.
The vtdue of P is then a measure of the local spmd overthe nose. Vahw of P equal 1.0zero indicate a sprmiequal to the free-stream speed, posit.ivc vaIuus indicatrless than free-stream speed; and nogativc values indi-cate more than free-stream speed.
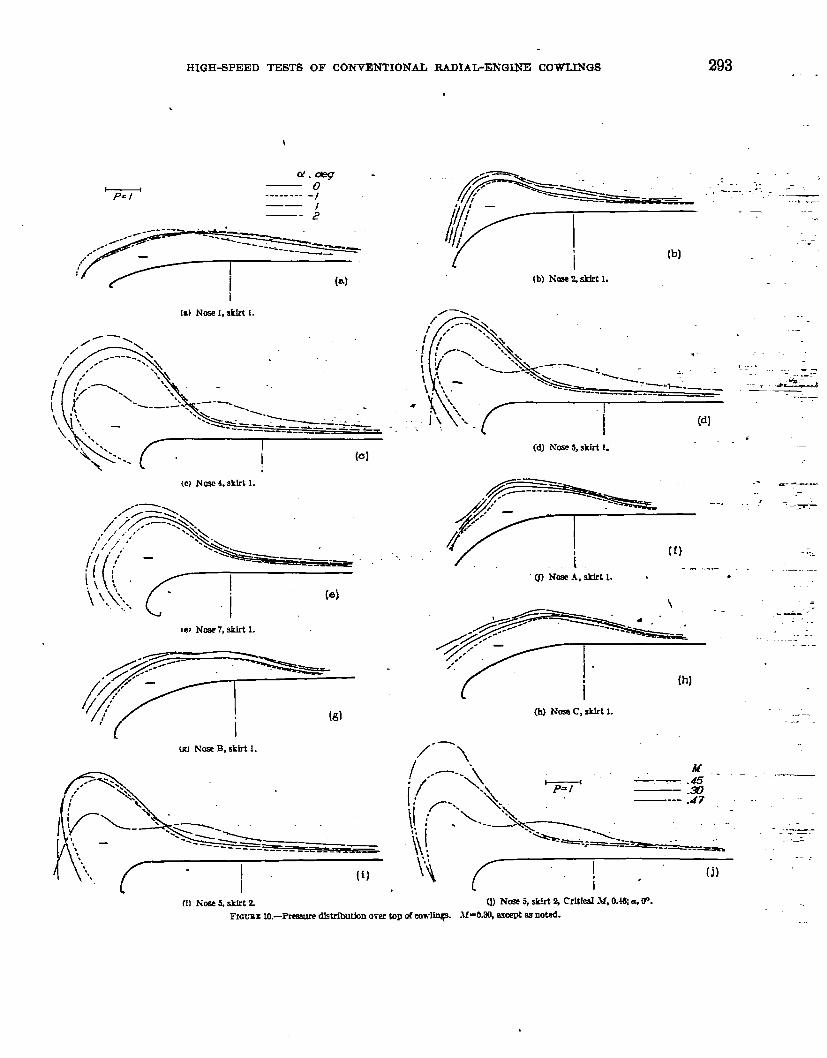
The .prmsuredistribution diagrams for tho modds
A.%peed m R h, of sea kw&(39~)
.40° m “200. ” 300 4m “m
..%
..32
.28
.24
.Zu
‘%
./8
.12
08
.04
u Jo ..%) ..50 .& .50 .m -mM
FmHrn9.-EffectIven 8cclle @g for ncced.sklrl2. Tiret[ck lnd~ th CTI~ .V
=- . . . .
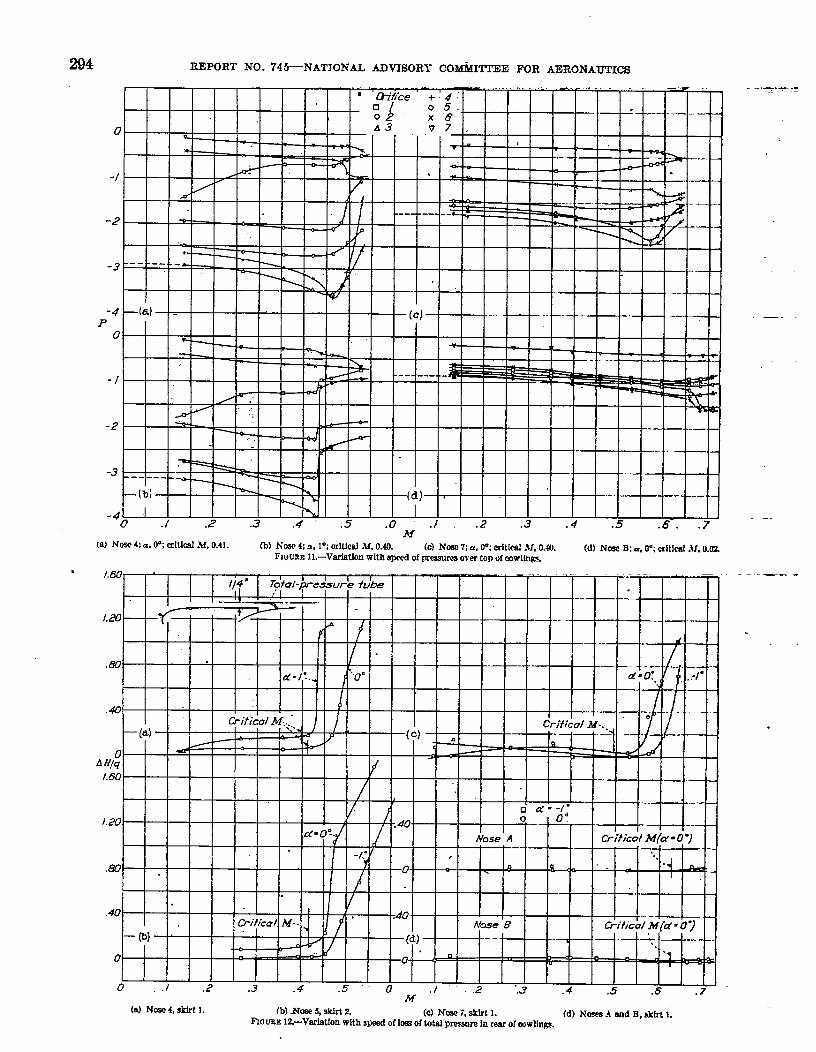
at various angles of attack, at M= 0.30, are shown infigure 10 (a] to (i), Figure 10 (j) shows tho effect. ofthe compressibility burble on the prmsurc distribution,Typical variation with ill of the static prmaure at eachof the seven orifices is shown in figure 11 for noses 4,
7, and B at angles of attack of 0~ and 10. The lossin total pressure AH betwwn the free strcarn and tlwtotttl-pressure tube at the roar of the cowling is shownin figure 12 for noses 4, 5, 7, A, and B for angles ofattack of 0° and 1°, .
.
,.
HIGH-SPEED TESTS OF CONVENTIONAL RADIAL-ENGINE COWLINGS
..
~------ -
.-”..””,/
~’
(b)
I
(8J Nmsel, skkt I. .
/—,.-
/f’ .-
.\L\ .- ,-, .. ,-,. . . --
.aL%: ,------- =—
------—— ..— —*
——_”- . (d)--- ——-- ..-_
s(d) NW 5, Skbt L
(C) Now 4. skhl 1.
(f?-‘““Cl-7<’.<:..
1P) 1’4w7, sMrtl.
U?J Nose B, SkbtI.
_— —- _
. . /p*””-’ “““~Nosc.l, skirt L. .- ‘- “- ● ‘- ;-
L 1 .
\
- “w “’”‘-(b) Nos? c, *M 1.
/“-\
(h]
_.. .
/“/I
=-—’\\P=I.\- -
: ,f-’.\l , .\
----~x~---<.<\,~ -.~~~ --—.. -
M-.-”:.I &”-“-
.—
—--- .47 - ‘-
..—..—.
~,
\\,,
1: (j)i’
.—..
(f} M6s5,Wrt2 a) Ncse 5, skirt z Critfml-M,O.*, a. fF.
FIGUStX 10.—Pmssure dktrfbuth owr top M cowlhq+. M =03+ aCePt M noti.
294 mPoRT NO. 745-NATIONAL ADVISORY co@mE FOR AERONAUTICS
.. ... . . . .—. —. —.~ ; U-lfibe
.+4:
n
iQ 5<.
0 X8.—” .— -. .—
0 A3 V7 .
. -?- — — - . — — _-+w —..
-/-
0/
.
d ‘ A L J
_ : _ : + 1 - ? *
. . . ---
I T $ > :: :--- ---- --
-2 + . _ - _=?- --- —
\ .5+.
-+-/ /
-3 --- ---- .-L .~ 1
kw
-4 — (8) -P
(c} .
0 %_— _ \ ~
+ . — —— — — _ — _
-1 — — - — 4- — — ~ s\~ — : — —* — -
--- ----- -
/ “ .“/ ‘
-2 % . ~ ++4 -
-/ /
- .——. ..—.. . I
r . ..-
-b -
-3 _ __ --- ‘ ~ *—
—(b] x. (d) .“
-4 I0 ./ .2 .3 .4 .5 .0 ./ .2 .3 .4 ..5
M.6-. .7-
W NOSO4!cz.OO;did M, 0.41. (b) NC8C4: a, 1°: critical M, 0.40. (c) h’a?o7; a, 0% mit[cal M, 0,44. (d) Nmc B: a, (P; altIml M, CLfLZFJUURE 1].—VarMion wltk apccd of premuru avw top of cowlings
*
.401 I I I 1 I I
L 11”1 bitiwl M(a)
.. .. ) II I I 1. I 1. 4-=
I L I
1.60 { [
I I
/
I I I❑ a-”-!: ‘ i-t----Hi---H1.20 -,.a.f I
I I II
.60 . I I T
I //
I 0++
i. f
‘“l-t+++
~-.40. I I I 0. 0: I I I I
H H If[ -1U.(J.
Nose A CrificofM(cv =0”)
-/: 1 , ‘..
+ — y L — + - — . & ,_
I I 11’jI &/fica/] M-.1 I H #l
.40.We B
.
— (y) I
i +%R<- ‘-– M 11 kf/
o — — — — — — — —
o ,. 1 ,2 .3 .4 .5 ““ o .1 -..2 ..3 .4 ,5M
.6 .7
.—
.-
—-
(aJ Nose4, $kMI. (b) I+ase 5, skirt 2 (C) Now 7, skirt 1. (d) Noses A md B, aklrt1.FIGUEE 12—Ve,rlat[on with speed of loss of totnl pmsuro Inm of WWIIIUS.

HIGH-SPEED TESTS OF CONVENTIONAL MDIAL-ENGINE COWIJNGS 295 .._
.48
b /
,44 / ~ f
)
.40
— - A *
.35
.32
-a
G,
.24
/ “
.&u / /
. IG.
\ [5.12 ●
.08’ ‘y ~ ~
.04
0-2 0 2 4 6
Angle of affac.+. 6, deg
FIGURE l&—V.arMcm with 8ngIe 0[ attack of eEectIve nacd!e drag. M-OSO.
H~& l&–Efkct c/nacdk on wing pitcl@mommt. linmhwted for tunnel-wanf.ueets. .M-o.w.
I t I I 1 b t 1 I r
fe af @ock dstufi●
O&H=uI
I* –m
h,
-3 -2 -!.
A&% of uLac&,&g3 4 5 6
(E) Nose 5, w I.(b) Nesc B,skM I.
FIINVM 14.-Varlatkm with @e of attack C#~ over tq! dmwlhlgs. M’-OM.,
,-3 -2 -1 456&fe & da%, @3*
FIGCBS 16.-EEeet of nacdle on wing Wt. Ihumrected h tnrmel-wall e@3s.
M=030.
.
--
..—
-.. .—
.-
-.
.●
.
.
7os6sto-45-zo
.
.

296 REPORT NO; 74&NATIONAL ADVISORY COl&ITTEE FOR AERONAUTIC
Cross plots of effective nacelle drag coefficient C’~P
againsb angle of attack a for M= 0.30 me shown infigure 13 for cowling noses l-f, 5, A, B, and C. Thecorresponding variation in pressure coefficient P isshown in figure 14 for noses 6 and B.
Figure 15 presents a comparison of the lift curve forthe wing-naceHe combination with that of the wingalone. Lift coe5cienta ire baaed on the wing area of15.35 square feet:
~L_lift of wing+ nacelle—qx15.35 ‘
There was no measurable difference in lift for the dif-ferent noses.
Figure 16 shows the effect on wing pitching momentof. the presence” of the nacelle. The pitching-momentcoefficient is based on the wing chord of 2 feet:
P (moment.of w~+ nacelkJ,4 -%14= YX15.35X2
The results presented in figmw 15 and 16 are uncor-rected for tunnel-wall effecte and therefore should beused only qualitatively.
COOLING-AIR FLOW
The pressure drop ~vailable for coohng across anengine or baffle plate has beem shown (reference 3) tabe nearly equal to the 10SS@ total preesurc between thefree stream and the exit opening of the cowling skirt.This loss and the exit speed were measured at onIy onepoint in the exit opening of the cowlings under test and,because of the flow variation around the exit openinginduced by the preeencc of the wing, these meastiements give only approximations of the conditionsexisting over the entire cowIing, The measured values,however, indicate that the design conductivity E of 9percent wa9 attained. There was no measurablevariation with speed of the Ap/q vahma previouslymentioned.
PRECISION
The force-test data presented in this report are un-corrected for tunnel-wall effects___ This factur, however,has a negligible intluence pn the effective nacelle dragowing to the small lift changes involved (see fig. 15)and the small induced drag of a wing spanning a closwjtunnel. The effect of the tunnel wall on the criticalspeed of a body is believed to be of secondary importancewhen, as in the present case, the cross section of thebody is of the order of 1 percent of the cross-sectionalarea of the jet. The horizontal buoyancy correctionfor static-pressure gradient is of the order of one-halfpercentmf the effective nacelle drag and is thereforeneglected.
The average scatter & the test data for the wingalone and the wing-nacelle combinations indicatesrandom errors in force measurement, based on the wingarea, as follows:
c...- -.------.–+0.003 emt,4--- . . ..om5*o. om5
cD--- --.-.----+0. 0001 M.. --.. -.-. –*,O. O1
This error in drag coefficient reprcscmti about 4 percentof the effective nacelle drag of nose C, whkh had thrleast drag of the m9dels tested. Inasmuch as the samewing drag was subtracted from the drag of rarh com-bination, the precision for comparing cowlings is equalto the error just discussed. Absolute values for anycowling will be subject, in addition, to t,hc errors indetcrminimg the characteristics of the wing alonr andtherefore will be subject to errors twice as great.
DISCUSSION
CORRELATION OF DRAG AND PRFS,9URE.I)ISTIUBUTIONMEASUREMENTS
Figure 7 indicates the spcwi at which the rffrctivenacelle drag with each cowling increnscs excessively be- ●
cause of the presence of a compression shock and also themagnitude of the drag chtinge under such conditions. TlwresuIts indicate that it would be impractical to employany cowIing at flight spmls greater than the spmd atwhich a compression shock forma on the cowling. The
bluntest cowlings (4 and 5] @e satisfactory for speeds ofthe order of 30.0 miles pw hour. One of the stimda~shapes (nose 2) and all of the dew shtipes dcvrlopcd inthis investigation are stitisfactory up to shout 480 milesper hour (all speeds at sea level, 59° F).
The critical speed at which tlw local sp(wi of soundwas actually reached on each cowling nose has beencomputed for alI the cases in which the peak negativrpressure was rnewmred. This ~pecd is shown by a tickcm the curves of figures 7 (a) and 7 (c). It is sern that,for noses 2, 4, and 7, the comprmsibility lmrblc did not.occur until the critical speed had bum cxcccded by~bout M = 0.03; that is, the speed of sound was ex-ceeded IocaIIy before a measurable shock occurred mhhese noses, For noses 5, A, B, and C, the shock appar-ently formed almost immediatdy after the critical spcwlwas reached. Since noses 2, 4, and 7 htivc no commongeometric characterktic, the present tMs indicate nocontrolling factor that permits the local speed to cxcccdthe local sonic speed before a compression shock occursmd it must therefore bc concluded that any cowling islikely to experience a compressibility burble as soon asthe local speed reaches the speed of sound. The critical]peed determined on this basis should be used as tbrupper limit of the flying spmd for a radial-rnghw cowl-ing. The uppm limit of the useful speed range for the>owlinge tested is then from M = 0.413 to M = 0.fj25,m 310 tQ 48o miles per hour at sea Icvel {59° F).
The speed at which the shock occurred on the wingdone is shown in figure 6 to be only slightly higher thanFor the combination employing nose C. Wii-nacellenterference probably increases the exc~ local velocitymer that part of the wing adjacent to the nacelle andnay sli~t.ly reduce the critical speed of the wing inihat region. A part of the drag increase beyond tlw
HIGH-SPEED TESTS OF CONVENTIONAL RADIAL-ENGINE COWLINGS 297 .
critictd speed shown in @ure 7 for nose C, and also forthe similar nose ahapes A and B, may therefore be dueto a shock forming at the wing-naceUe juncture. Al-though the use of a supporting wing with a highercritical speed would have given a better determinationof the speed at which the shock occurred on the covdingswith the highest critimd speeds, the wing used (NACAz3012 ~tion) ig of convention~ ~c~~ ~d ~tion.
Any increase in wing drag caused by a nacelle is prop-dy charged to the effective naceIIe drag; the curves offigure 7 therefore indicate cor&tIy the effective nacelledraga associated with the various cowling noses.
As previouaIy discussed, the critical speed T’. inmiks per hour is dependent on the atmospheric temper-ature; that is,
~“.~.l.f~where
a=33.5~460 +t rides per hour
The temperature of the standard atmosphere decreaseswith altitude .to -67° F at about 35,000 feet.. Thedecrease m temperature causes a decrease in the speedof sound a with increasing altitude and results in lowercritical speeds as altitude increases. At 30,000 feet thecritical speeds for the cowlings tested are lowered to therange of 280 to 430 miles per hour. since the flyingspeed of present-day airplanes generally increases withaltitude, the danger of encountering serious compressi-bility effects is very real unless proper care is taken indesigning the cpwhng nose.
As was to be expected, the cowlings with the greatestnegative pressure (for exampIe, noses 4 and 5, figs.10 (c) and 10 (d)) had the lowest critical speeds. Mao,as would be expected, the pressure mewurementa(fig. 10) showed huger peak negatfve pressurea forrmgles of attack other than zero. The increment dueto angle of attack was appro%mately proport@aI tothe mgle change and was greater for cowhngs on whichthe pressure already had a Iarge negative value. Thecritical speed should be Iower, then, when a cowling ispitched or yawed, especially for nosea like 4 and 5.The results presented in figurm 7@) and 7 (c) confirmthis concision. This” behavior illus@tea the impor-tance of aliing the coding with the air direction whenthe, airplane is in the high-speti attitude, mpeciallyif the cowliug is blunt or is near its critical speed.
The rapid increase m drag with nosea 4 and 5 at air-speeds below 200 miles’ per hour for 2° angle of attack@g. 7 (d)) is uot to br att~ibuted to the compressiblHityburble. The pressure diagrams (figs. 10 (c) and 10 (d))show radicrd ch~nges in pressure distribution andshow small peak negative pressures at 2° angIe ofattack, indicat.mg a flow breakdown; but, from thefact that the maximum local speeds wwe lee9 than halfsonic speed before the change in flow- occurred, thebreakdown is attributed to ordinary stalling over thetop of the cowling and not to a compr~ibility burble.This effect is disctl.ssed in detail later.
The curves of figure 11 show the way in which thestatic pressure over typical cowlings varies as the speedis increased above the critical speed but fail to show
.-. —
uniform tendencies for all cowlings above the criticaJ ill.The blunter cowIings show a decided reduction in the
... ...
magnitude of the negative pressure coefficients but the . “- ‘–”reduction occurs at a vahe of M appreciably higherthan the critical value. The cowlings of better shapeshow a less dedided change in pressure coefficient abovethe crithxd speed and, in some cases, even-an increasein negative presanr e (& 11 (d))- Figure 10 (j) shows- ““-””to what extent the pressure distribution may be al- =
.—
tered by the compressibility burbIe. All these resultspoint to the practical conclusion” that, if the structuraldesign of a cowIing ia based on low-speed” pres-sure-distribution data with values suitably increased for -compr~bility (see @. 11) to flight speed or criticaIspeed, only a small additional allowance is necessaryfor the negative pressure developed after the criticalspeed is exceeded.
.
.-
—
-.
-.... “..—— —.
.. . . .
;.-—-.-
. -.-.. .
PO
Fmcm 17.-Voriaffon .wIth peak LUYSSWOcoefEdent ofmitfcal spwd.
The total-pressure measurements of figure 12 alsoshow marked effects for the blunter cowlings and smaller “’‘–or negligible effec~ for the cowlings of improved shape.For the blunt cowlings, the lOSS in total pressure islarge ahd occurs almost immediately .after the criticalspeed is reached; for the improved cow~inga, the lossoccurs latrr (fig. 12 (c)) or is of a negligible magnitud~(fig. 12 (d)). Thus the totaI-pressure-tube measure- -.ments frd to indicate the occurrence of a shock on the .improved cowlings, although the corresponding forcemeasurements show increases in effective nacelle drag
-—
with these cowlings. Shocks of a diflerent nature fromthose recorded for the blunter cowlings, however, may ___possibly have occurred. If the shocks extended aconsiderable c&tance fore and aft, as would be expectedfrom the nearly uniform preesure distributions, theirextent normal to the surface may have been smaU andthe wake may have passed under the tube. The

. 298 REPORT NO. 74&NATIONAL ADVISORY COMWT’I’EE FOR AERONAUTICS
indication is that a detecting .-tube must be irngledi.ately outside the normal boundary layer.
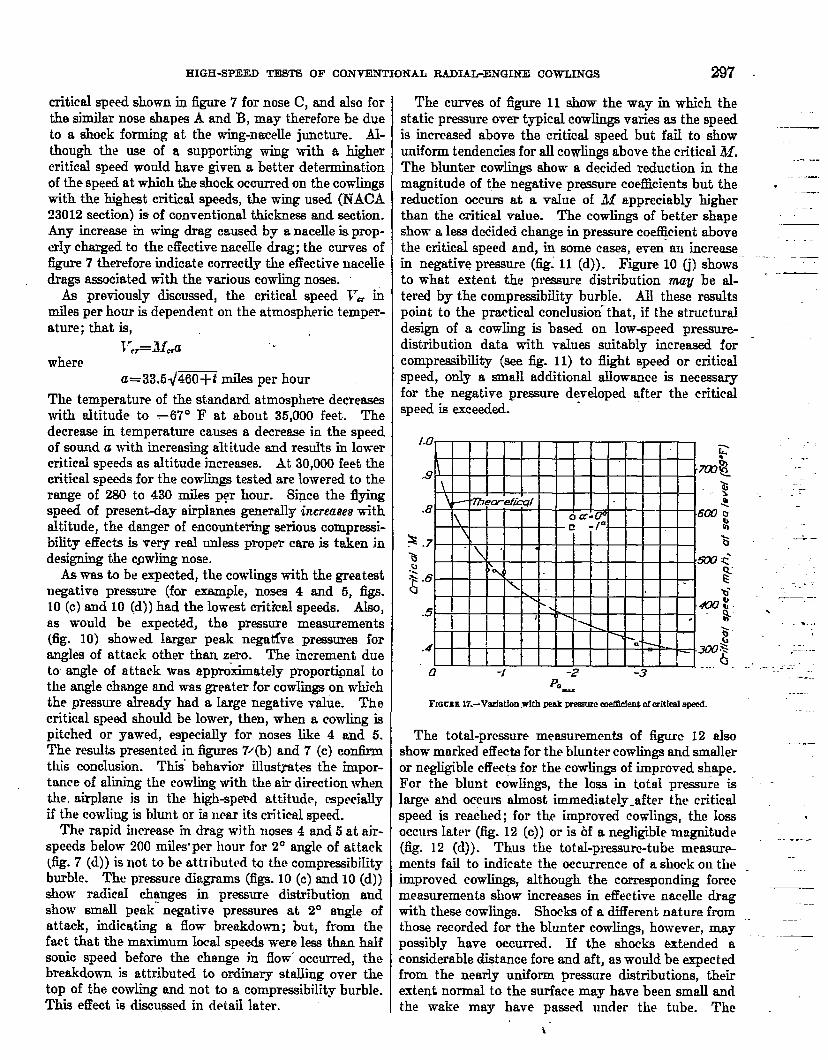
A theoretical relation between peak negative pres-sure, as mmsured at low speed, and critical sp,ced lmbeen obtained by Jacobs (reference 4) by defining tht
. critical speed as usual (maximum local speed equal tclocal speed of sound) and assuming that the negativepressure coefficient increaae with speed accor&ng tothe ratio l.~~~. This. relation is shown by th6”cu&eof figure 17. The measured critical speed for each ofthe. cowlings is plotted in figure 17 against the value ofits maximum negative pressure co@ien~ Pm= ex@a-polated to zero speed to give PO_. It is evident that,
if the low-speed pressure distribution for a cowling de-sign is known from wind-tunnel or flight tes@, the curveof figure 17 may be used to obtain a good approximationof the critical speed of the cowling, The low-speedVahlo of P.m must, of course, be for the airplaneattitude corresponding to the high speed beinginvestigated.
EFFECT OF VAEIATION OF ANGLE OF ATTACK ON
FLOW OVER COWLINGS
The negative pressures over the nose of a cowling andthe change of pressure with angle of attack are verysimilar to the pressures and changes experienced by air-foil profiles. Reference 3 points out that the flow direc-tion immediately in front of a cowling is more nearlyradial than axial. Deprmding on the relative directionof the oncoming air and the slope of the cowling justback of the lm.ding-edge radius, a cowling nose may beacting similarly to an airfoil (1) at low or zero lift (nosesA, B, C); (2) at high lift (noses 4 and 5)” or (3) beyondmaximum lift, that is, stalled (nose 1), as shown by thepressure diagrams of figure 10. This comparison indi-cates the reason why mme cowlings have a greateruscfuI angle range without stalling than others.
In the present test aehup, as in the case of actualnacelles near the center of a wing or even of the enginecowling of a single-engine airplane, the relative anglebetween the oncoming air and the nose of the cowlingis increased by the induced upflow in front of the wing.The effective angle of attack of a cowIing always beinggreater than the geometric angle, a cowling may stallat a comparatively small an@ in spite of the fact thatit is a body of revolution with three-dimensional flow.The likelihood is greater when large negative pressuresme present at zero angle.
Fguree 10 (c) find (d) show the large negotive pres-suree for nosee 4 and 5 at a=O” and the increase ofnegative pressure with angle. The stall is seen tohave occurred before 2° was reached and apparentlya negative pressure of about P= —3.2 was the mostthat could be maintained before the stall cwcurred.(See fig. 14.) Figurm 10 (f), (g), and (h) show” thesmall negutive pressures for noses A, B, and C at a= O”;and iigures 10 and 14 indicate that the rate of increaseof negative pre9sure with rmgle was proportionately
smaller. than for noses 4 and 5. If a pressure coef-ficieniW of ubout —3.2 is still i.ho limit, these cowlingswill have a wide useful rango of angIe of ~ttdc wh~outstalling. Figm.” 13 corroborates time conclusions inindicating a rise in &U for NM 5 outside the range+ 10, as expected from the. stall; whereas the drag ofnose B does not rise correspondingly, even at 6°, whichwas the limit of the t=ts. Noses A and C undoubtedlyhave characteristics si.mihw to .B. Theso offccts areimportant not only for controlling the drag of an air-plane for cow~ing uttitudes other than zero but aIsofor air scoops or any other construction depending onsmooth flow over the top of the cowling.
COMPARATIVE DRAG EESULTS
The results presented in figure 7 indicate no largovariation of the effec~ive mwelk drag with speed unt.iIthe critical speed was reached. The favorable SCR.ICeffccts were balanced at the higher spmds by the un-favorable compressibility effects. The rcsulti show,however, appreciable ~erencm in effective naccllodrag for the various nose forms, With noac 5, theeffective riaceJle drag was approximately 30 pcuwmtgreater than with nose C. In general, the noses of lowcurvature, low peak negative pressure, and low localspeeds had lower drags and higher critical spmds thanthosG of high curvature and correspondingly high Iocalspeeds. The lower dcin-friction drag for the models oflow local spwIds may account in part for the lower dragsof noses A, B, and C. A comparison of thr prmsurc-distribution curves for noses 2, A, B, uml C (fig, 10)shows the extent to which the peak ncgativo pressureswere lowered and the pressure, or the vdocit,y, distri-bution was made more uniform by succmsive chtingegin nosrcurvatur; .
The saving in the intqnal drag due to cooling-flowlosses that may bc effcctud by passing rxactly thucorrect quantity of cooling air through a cowling atcvmy speed instead of using opmings Dnd exits of tlxudsize for the entire speed rfmgo have hem previouslydiscusmd (reference 3). The results proscntcd byfigure M. show the drag rwluction clue to chunghg the
exit opening .frgn] O. 25 inch to O. 11 inch. The fticLthat the cowling with the smaller exit opening (skirt 2)shows a lower critical speed at a= 0° suggests that upart of the air which fornwrly passed inside the cowling(with the larger exit opening) now pasw’s outside the:owling to incr~ase the 10CWIspeed on tho rowlingmse.
rhe increased speed outside the cowliigj or the cqual]y.mportant factor of inmcasing angle of rrltitivc windkt the cowling nose with reduced flow though the:owling, also appears as a dctrimcntul effect in reducing;he useful angle-of-attack range of a ;owling. lf’itbnose 5, the cowling stalled at 1°. (Cf. figs. 10 (d) an(l10 (i).) Both the lower critical speed and the smallwusefuI angle-of-attack ,range emphasize the relativeimportance of using the bust possible nose shape when
thg internal flow is most restrnctcd, se is the case in

HIGH-SPEED TESTS 03’ C!ONVENTIONAL RADIAL-ENGINE COWLINGS 299●; .-
high-speed flight with the optimum amount of coolingair.
Both the effective nacelle hg for nose 1 (fig. 8) andthe pressure distribution (fig. 10 (a)) indicate that thisnose was stalled at all angles of attae~ inchding OU.An attempt was made to improve the flow over the noseby succ~vely cutting back the nose to form profileswith circdar arcs of larger radii inscribed in the Iead-
FIGURE 16.-CompsrlSS C4effestive narelle drsg OCnme 5 with skkt 1 and SW 2.
ing edge on the assumption” that a radius would bereached at which the flow would be unstalled. Thedrag for each rrmdiiication, howev~, was found to belarger than for the preceding condition. The changein cbag with increa~ of angle of attack for nose l–f,as ahown in figure 13, indicates that khe decrease ineffective angle of attack on the-bottom of the cowhgcaused a consiclmabIe improvement in the flow at thatpoint which was not at first counteracted by increasedseverity of the stalI on top of the cowling. The modi-
fications to nose 1 were ineffecti~e, probabIy becausethe sIope of the chord line of the nose decre=~. aS thenose radius was increased. In critical cases, it appearsto be much more important to dine the slop-e of thenose with the relative wind than to increase the noseradius.
CONCLUSIONS
1. The 31ach numbers at which the dleotive nace~edrag abruptly increased owing to the compressibilityburble ranged from 0.41 to 0.63 (310 to 480 miles perhour at sea level (59° F}) for the conventiomd cowhngatested. Because of the decrease in the speed of roundwith decreasing temperature, the corresponding range~t 30,000 feet altitude (—48” ~ ~ogld be 2~ to Q(I ..roles per hour.
2. The etlwtive nacelIe drag increased so rapidlybeyond the critimd speed that fright at speeds aboveW critical speed of the cowling would be impractical.
3. The pressure distribution over any cowling nose,0s measured in flight at moderate speeds or in a windtunnel at Iow speed, may be used to predict the criticalgpeed of the nacelle.
4. The criterion for a conventiorml-type cowIing~esigned to IMWea high critical apeed appears to be lowuniform negative pessures over the nose. This con-dition indicates a speed over the entire nose that is:onstant and exceeds the general stream spred by aminimum amount.
5. The cow~ings devel~ped to have the highestcritical speeds also had the lowest draga throughoutthe entire speed range and had a greater useful angle-of-attack range without fm in cream in hag.
,—
—. .-
—-
-.J
LWQLEY MEXIORIALAERONAHCAL IJ-4330EST0RY,-NATIO~.4L bvmoEY COMMITTEE FOB &ERONAUTICS,
IJANGLEY FIELD, VA., March 30, 1939.
REFERENCES
I. Stack, John: The C!omp=ibflit y Burble. T. N. No. 543,NACA, 1935.
2. Lindsey, W. F.: Drag of Cylinders of SirnPti Shapes. Rep.NO. 619, NACA, 1938.
3. Theodoreen, Tkodom, Brevoort, M. J., arid Stickle, George ___W.: Full-scale Teete of N. A_ C. A. Cowlings. Rep. No.592, h’AC& 1937.
4. Jacobe, Eastman N.: Methode EmpIoyed in America for the ‘-ExperiroentaI Investigation of Aerodynamic Phenomenaof EHghSpeeds. Misc. Paper No. 42, NACA, 1936.
6. Robidsq Russell G.: Sphere Tests in the N. A. C. A. 8-FootJiigh-Speed Tunnel. Jour. Aero. Sci., VOL-t, no. 5, March1937,pp. 19W201.
.