Report 1998-0'8 A Camber Study of Mn/DOT - Conservancy
163
Final 1998-08 Report 1998-0'8 MN DEPT OF TRANSPORTATION 3 0314 00023 8880 CTS TA 683.5 .B3 W66 1998 A Camber Study of Mn/DOT Prestressed Concrete I-Girders UNIVERSITY OF MINNESOTA CENTER FOR STUDIES
Transcript of Report 1998-0'8 A Camber Study of Mn/DOT - Conservancy

Final 1998-08Report 1998-0'8MN DEPT OF TRANSPORTATION
3 0314 00023 8880
CTSTA683.5.B3W661998
A Camber Study of Mn/DOTPrestressed Concrete I-Girders
UNIVERSITY OF MINNESOTA
CENTER FOR
STUDIES

minnesota prestress association
This research was made possible with the support and contributions from the Minnesota Prestress Association. Many of its memberstook a role in the fabrication and testing of the girder specimens.

Technical Report Documentation Page1. Report No. 2. 3. Recipient's Accession No.
1998-084. Title and Subtitle 5. Report Date
A CAMBER STUDY OF Mn/DOT PRESTRESSED January 1998CONCRETE I-GIRDERS
6.
7. Author(s) 8. Performing Organization Report No.
Douglass WoolfCatherine French
9. Performing Organization Name and Address 10. Project/Task/Work Unit No.
Department of Civil EngineeringUniversity of Minnesota500nivrsiy Dr.of Minn a 11. Contract (C) or Grant (G) No.500 Pillsbury Dr. S.E.Minneapolis, MN 55455-0220 (C) 69098 TOC # 83
12. Sponsoring Organization Name and Address 13. Type of Report and Period Covered
Minnesota Department of Transportation Final Report 1993-1997395 John Ireland Boulevard Mail Stop 330 14. Spo g A y
14. Sponsoring Agency CodeSt. Paul, Minnesota 55155
15. Supplementary Notes
16. Abstract (Limit: 200 words)
This project investigated the relationship between predicted and measured girder cambers. For more than three years,researchers collected camber data on girders of various depths and lengths from the time of strand release untilshipment to the job site.
Researchers used three camber prediction methods to compare with the measured values: PCI method, Branson's time-step approach, and "CRACK" analysis program by Ghali et. al. The Branson time-step approach resulted in the closestpredictions to the measured cambers. The PCI method, although simple, gave reasonable long-term camber resultscompared with the more detailed methods.
17. Document Analysis/Descriptors 18. Availability Statement
prestressed bridge girders camber No restrictions. Document available from:field measurements long-term effects National Technical Information Services,
Springfield, Virginia 22161
19. Security Class (this report) 20. Security Class (this page) 21. No. of Pages 22. Price
Unclassified Unclassified 130

A CAMBER STUDY OF Mn/DOTPRESTRESSED CONCRETE
I-GIRDERS
Final Report
Prepared by
Douglass WoolfCatherine E. French
Department of Civil EngineeringUniversity of Minnesota
January 1998
Published by
Minnesota Department of TransportationOffice of Research Administration200 Ford Building Mail Stop 330
117 University AvenueSt. Paul, Minnesota 55117
This report presents the results of research conducted by the authors and does not necessarily reflect the views of theMinnesota Department of Transportation. This report does not constitute a standard or specification.


ACKNOWLEDGMENTS
This project was sponsored by the Minnesota Department of Transportation. The
authors also express appreciation to Elk River Concrete for their cooperation and
assistance throughout the project. The views expressed herein are those of the authors
and do not necessarily reflect the views of the sponsors.

Table of Contents
C hapter 1 - Introduction...................................................................................................1
P u rp o se .................................................................................................................... 4
Limitations with Respect to the Data.......................................................................6
Support Conditions ...................................................................... 6.. ..
Concrete Compressive Strength.......................................................6
Prestress Force ............................................................. .... .7
H R W R A dm ixture ........................................................................... 8
Previous Research ............................................................................................. 8
C hapter 2 - F ield D ata .................................................................................................... 13
M ethods and Procedures........................................................................................13
Chapter 3 - Short Term Analysis...................................................................................15
Sensitivity A nalysis ............................ ................ ............ ................... 16
Comparison to Field Data ......................................................................... 25
Chapter 4 - Long Term Analysis ....................................................................... 29
Methods and Procedures ...................................................................................... 30
PCI Design Handbook Multiplier Method................................. ........... 30
Branson et al. Approximate Time-step Method..................... ............... 31
Program "CRACK" by A. Ghali et al........................................................35
Model Codes Used for Determining Estimates of Material Properties ................ 38
CEB-FIP 1978 (MC78) Model Code................... ...... ............................ 38
Modelling Assumptions used with "CRACK" and CEB-FIP .................. 40
ACI 209R-92 and 435R-95 Model used with "CRACK ........................... 41
Additional Remarks Regarding Models........................................................ 41

Com parison to Field D ata ........................................................................ ..... 42
Results of PCI Method................................................................... 44
Results ofBranson's approximate time-step method...............................45
Results using the program "CRACK.................................. ............. 45
Results considering members cast on the same bed ............................. .. 46
Sensitivity Analysis.... ........................ ........... ......................... ....... 47
Chapter 5- Thermal Effects................................ .............................................. 51
Related Thermal Research ............................................................................... 52
Chapter 6 - Conclusions ........................ .......................... ............................. 53
R eferences ............................................................................................................. 57
Appendix
Appendix
Appendix
Appendix
Appendix
Appendix
A
B
C
D
E
F
Short-term Sensitivity Analysis Spreadsheets
Short-term Analysis Spreadsheets
Moment of Inertia Calculations
Significance of Shear Deflection Calculation
Approximate Time Step Method Calculations
Example of Input/Output File for the Program "CRACK"

LIST OF TABLES
2.1 Field D ata Inform ation ........................................................................................... 59
3.1 Camber Sensitivity Results (Camber in inches). ......................................................... 60
3.2 Sensitivity Results (Percentage based on assumptions made in the base analysis) ........ 60
3.3 Short Term Analysis Results (Bridge #19045; Bl1-S2 to B20-S2) ............................ 61
3.4 Short Term Analysis Results (Bridge #27112; B2-S2-1 to B2-S2-9).......................... 62
3.5 Short Term Analysis Results (Bridge #27112; B2-S2-10.. .B2-S2-26).......................62
3.6 Short Term Analysis Results (Bridge #04516; B2-S2-1 to B2-S2-5)........................63
3.7 Short Term Analysis Results (Bridge #49535; 1-B 1...4-B3) ..................................... 63
3.8 Short Term Analysis Results (Bridge #27624; B8S5N-366.. .B9S5N-137)...........64
3.9 Measured Friction Losses in the Bed (Bridge #19045; B15-S2...B19-S2) ................. 64
3.10 Measured Friction Losses in the Bed (Bridge #49535; 1-B1...4-B3).......................... 65
3.11 Measured Friction Losses in the Bed(Bridge #27624; B8S5N-366...B9S5N-137).......................................... ...65
4.1 PCI Multipliers to Estimate Long-Term Cambers and Deflections [4]......................66
4.2 Camber Reduction Considering Support Conditions(using various modeling assumptions)............................................................67
4.3 Deviation between Measured Data and Predictions (Percentage)..................................68
4.4 Long-Term Camber Sensitivity Analysis ..................................................................... 69


LIST OF FIGURES
1.1 Concrete Stress Distribution in Rectangular Beam with Straight Tendon [1] ............ 71
3.1 Camber Equations for Typical Strand Profiles [4]...............................................72
3.2 Camber and Rotation Coefficients for Prestress Force and Loads [4] .................... 73
3.3 Beam Strain and Stress Distribution due to Linear or Nonlinear TemperatureVariation through Depth [3]....................... ............................... ... ......... 74
4.1 Time Multiplier Comparison (Bridge 19045, Girder B 18-S2) .............. .............. 75
4.2 Centerline Camber - Girder B 11-S2 (Methods and Measured Data).......................76
4.3 Centerline Camber - Girder B 12-S2 (Methods and Measured Data)........................77
4.4 Centerline Camber - Girder B13-S2 (Methods and Measured Data) ...................... 78
4.5 Centerline Camber - Girder B14-S2 (Methods and Measured Data) ......................... 79
4.6 Centerline Camber - Girder B 15-S2 (Methods and Measured Data) .......................... 80
4.7 Centerline Camber - Girder B16-S2 (Methods and Measured Data)..........................81
4.8 Centerline Camber - Girder B 17-S2 (Methods and Measured Data)..........................82
4.9 Centerline Camber - Girder B18-S2 (Methods and Measured Data).....................83
4.10 Measured Camber for Members Cast on the Same Bed (BI11-S2 and B12-S2) ......... 84
4.11 Measured Camber for Members Cast on the Same Bed (B13-S2 and B14-S2).........85
4.12 Measured Camber for Members Cast on the Same Bed (B15-S2 and B16-S2) ......... 86
4.13 Measured Camber for Members Cast on the Same Bed (B17-S2 and B18-S2) ........ 87
4.14 Comparison of Sensitivity (Bridge 19045, Girder B 18-S2) ................................ 88
5.1 Thermal Camber M easured over 1 Day......................................... ........................ 89
5.2 Thermal Camber Measured over 1 Day (Centerline Camber)...................................90
5.3 Tem perature Change..................................................... ............ ............ 91
6.1 Measured Camber Comparisons (B 11-S2 through B 18-S2) ................................. 92

EXECUTIVE SUMMARY
The objective of this project was to investigate the relationship between predicted and
measured girder cambers. For over three years, camber data was collected on girders
of various depths (45 to 81 in.) and lengths (span-to-depth ratios from 17.3 to 24.8).
The data was collected from the time of release until shipment to the job site.
Measured cambers were observed to differ even for similar girders cast together on the
same precasting bed. Differences ranged up to 0.5 in. (2 to 10%). In addition, solar
radiation had an effect on the results. Over the course of a day, camber measured for a
single girder had a variance of 0.5 in.
An analytical parametric study was conducted to evaluate the factors affecting short-
term camber. The parameters investigated included: modulus of elasticity; moment of
inertia (gross or transformed); and variations in concrete density, initial strand stress,
member length, and harp point locations. Two of the factors, which had the largest
influence on camber, were variations in the prestress force and section stiffness.
Three camber prediction methods were used to compare with the measured values. The
prediction methods were: PCI method, Branson's time-step approach, and "CRACK"
analysis program by Ghali et al. The Branson time-step approach resulted in the closest
predictions to the measured cambers. The PCI Method, although simple, gave
reasonable long-term camber results compared with the more detailed methods.


Chapter One - Introduction
Prestressing is the introduction of a force into a structural member to counteract tension
stresses in the concrete. When concrete is cast around a tensioned strand, it is termed
"Pretensioning." When these strands are placed eccentric to the center of gravity of the member,
they produce moments in the section used to counteract the effects of gravity loads and increase
the capacity of the section. As is well-known, concrete is about one tenth as strong in tension as
it is in compression. By using prestressing forces in the section, more of the concrete
compressive capacity can be utilized.
Not only does more of the concrete strength become utilized, but the deflection of the
member is decreased. Deflections in the member are related to the moments. If a moment
counteracts the gravity moments, then the deflection it produces will also counterbalance the
deflection produced by the gravity deflections (Figure 1.1 a-d, [1]). This prestress deflection is
often larger than the deflection produced by the self weight of the member alone. As a result of
this, an upward deflection is produced, otherwise known as camber.
Camber for the section can be calculated fairly well at early ages after release, as will be
shown later in the paper; however, there are several time-dependent factors that are not as easily
determined for long-term camber estimations. Variations in the concrete material properties, such
as strength and stiffness, from the actual to the design properties add to a designer's uncertainty
in calculating long term deflections. The material differences will be discussed in the chapter on
short-term analysis. The time-dependent factor variations will be discussed in the long-term
analysis chapter.
As will be discussed in the following chapter, data was collected on actual Minnesota
Department of Transportation (Mn/DOT) girders to be placed in various bridges. The data was
collected over a three year period on precast "I" shaped girder sections. The girders were all

constructed at Elk River Concrete Products in Elk River, MN. All of the data was collected at
the plant while they were stored until shipment.
All of the members that were observed in the field were pretensioned. Pretensioned
members are usually prefabricated in a plant and then brought to the job site. The process
involves placing strands at their proper locations in a steel frame/form and then stressing them to
the desired force using a hydraulic jack. Typically, more than one member was cast on a bed.
Thus, strands for these members should have about the same stresses when released. At Elk
River Concrete, the steel stirrups and regular reinforcement are tied into place around the stressed
strands. From this step, the remainder of the formwork is put into place and the concrete is
poured. After 18 hours of curing, the forms are removed and the strands are cut in a systematic
fashion. The same strands are cut simultaneously from the ends of each girder on the bed. One
exception to the curing period is that if the member is poured over a weekend or holiday, it may
cure over a longer period of time (approximately 3 days).
The curing process involves covering the girders with a tarp and using steam to modify the
temperature, if necessary. In the summer, the thermal heat of hydration is usually adequate to
produce the desired curing temperature under the tarp without the addition of steam. The use of
Type III cement and high range water reducer admixtures enable desired release strengths to be
achieved at early ages, allowing for rapid reuse of the formwork. A high concrete slump is
important for placement of the mix in the concrete formwork. By using a water reducer
admixture, a higher initial slump is achieved for the same strength concrete. Thus, a higher
strength concrete could be used by the plant to achieve an earlier release strength with the same
slump as a concrete mix with less strength and no admixture. The 28-day strength of this concrete
mix will generally be a few thousand psi above that called for in the design in order to ensure
meeting the Mn/DOT requirements for testing cylinders at release.
After reaching the release strength, the strands are cut and the loads that were held by the
frame are transferred to the concrete member. The net result is to induce a net compressive force
and a moment into the member (the moment may produce tension in certain areas of the girder).

As mentioned earlier, these moments can be related to deflections and the net result usually
produces an upward camber at release from the pretensioning bed.
Several terms should be defined in order to help in understanding the determination of
deflections for prestressed girder members. Short-term deflections are deflections that occur
immediately after the strands have been cut. Determination of the stress in the strand
immediately after release of the member needs to be considered in order to determine this
deflection. In order to determine this strand stress, elastic shortening losses need to be
considered. Elastic shortening prestress loss is the loss of prestress due to immediate shortening
of the member length due to concrete strains induced by the prestress force to the concrete.
There are several factors that need to be considered in determining the long-term
deflection for the member. Long-term deflections are deflections that occur anytime after the
short-term deflection through the life of the structure. Creep effects are one of the largest
contributors to time dependent changes in the section. Creep is the time dependent strain of the
concrete under sustained compressive loading. Creep has a two part effect on the section. First,
it decreases the prestress force in the strands. This tends to reduce the camber or increase the
downward deflection in the member. The second effect of creep is to increase the member
curvature due to non-uniform strains in the concrete. (Greater creep strains occur in regions of
greater compressive stresses). If the net result of all loads is to produce camber, then this portion
of the creep effect will increase the camber in the section. How much the creep factor dominates
over the other factors depends on how much these two separate effects of creep cancel or add to
one another [9]. In general, most of the methods used for determining concrete creep are based
on a time function multiplied by an ultimate creep strain.
Shrinkage of the concrete is also an important time dependent factor that changes the
camber of the section. Shrinkage is the change in concrete volume due to loss of water in the
section. When this shortening of the member occurs, prestressing force is lost due to a
slackening of the strand. There are several methods available for determining the time dependent

shrinkage of the section. Most of these require knowledge of the volume to surface ratio of the
cross section as well as the relative humidity to which the member is subjected.
Strand relaxation is the last important time dependent factor to be considered. Relaxation
is the reduction in stress at constant strain. This relaxation usually becomes significant at strand
stresses greater than 50 % of the ultimate stress capacity (ACI 209R-92). Most strands are
stressed to around 75 % of the ultimate stress capacity at the plant where the field data was
collected. Several strands are produced with different grades of steel and relaxation properties.
The plant where the field members were produced uses mostly half-inch diameter 270 ksi low-
relaxation (stabilized) strands. Relaxation for these strands is not as large as for the case of
stress- relieved strands.
It should be realized that all of the factors, to some degree, are dependent upon one
another. When the concrete shrinks, the member shortens. When the member shortens, the
stresses in the strands reduce. The reduced stress causes less concrete stress and results in less
creep in the member. With reduced strain, relaxation of the steel is reduced. Many of the time
dependent methods try to account for factor interdependency in some simplified fashion. The
PCI Design Handbook adjusts only the relaxation factor to account for interdependent losses due
to creep, shrinkage, and relaxation. The CEB-FIP model code adjusts the creep factor to account
for these interdependent losses.
Purpose
The main objective of this project was to investigate the relationship between calculated
and observed girder camber. If the camber is not as predicted, then there is a possibility that
service deflection limits, such as those of the AASHTO specification, may not be met. [1, page
425] In addition, variations in member camber necessitate the use of a thickened haunch over
certain girders in order to maintain a level driving surface on the bridge.

Because of these reasons, this project was conducted at the University of Minnesota to
study camber in girder members. For over three years, data was collected on various length and
depth girders. The members ranged in depth from 45 - 81 inches deep, with a maximum span
length of about 139 feet. The span to depth ratio ranged from 17.3 - 24.8 for all of the members
that were studied. Data was collected from the time of release of these members until shipment
to the job site. The amount of storage time varied considerably for these members depending on
the construction schedule.
The listing of bridge numbers that were studied and general information are included in
Table 2.1 of Chapter 2. Mn/DOT classifies each of its bridge projects with a job number. It then
assigns a number for each type of girder with the same design, then a number for each member.
The number organization is printed onto the side of each girder produced. The last set of girders
investigated has the most complete information available and is mentioned frequently throughout
the report as Bridge 19045 girder members.
In order to begin the analysis of the methods used in the prediction of short and long-term
camber, a parametric study for short-term effects was conducted. This study served the purpose
of finding those factors that affected the short term camber the most. The spreadsheet given in
Appendix A, related to short-term deflection calculations, has additional information on the
material properties of particular members used in the parametric study. The sensitivity analysis
laid a foundation for evaluating the short term camber calculations. It was also reasonable to use
this study for evaluating the material properties used in the long-term analysis. The parametric
study considered factors affecting the camber such as methods for determining the modulus of
elasticity and the moment of inertia of the section. The study also investigated variations in
concrete density, strand initial stress, length of member, and draping locations in order to
evaluate differences between observed and assumed member properties.
After performing the parameteric study for the short term analysis, the actual data was
compared to various methods for determining camber. For the determination of short-term
effects, the PCI method was employed (see Chapter 3 of report, [4]). For the determination of

long-term effects, the PCI multipliers (Chapter 4, Table 4.6.2, [4]), Prof. Branson's approximate
time step analysis (Chapter 7, [1]), and the time step analysis program "CRACK" developed by
Professors Ghali and Elbadry [12] were used. The observations and methods are discussed in the
following chapters.
Limitations with Respect to the Data
Support Conditions
Data related to the support conditions of the girders could have been used, but was
missing for several of the girders. When stored in the field until transport, the members are
placed on pre-established supports. As such, the bearing pad does not necessarily correlate with
the storage support conditions. In most cases for the Bridge 19045 beams, the supports were
located at a range of 3 to 5 feet from each of the ends. This meant that not only was the span
distance decreased by 6 - 10 feet, but end rotations were also being produced due to the
overhanging dead weight. All of these changes in the location of forces increased the short-term
camber in the girders by 0.25 - 0.5 inches. For long term camber in Bridge 19045, the ratio
between end and actual support conditions deflection had an average value of 0.86 for various
conditions that will be discussed later (see Table 4.2). None of the other girders of varying
depth, length, and strength had information available regarding the temporary support locations.
Therefore, support conditions for the other bridges could not be accounted for in calculations.
Concrete Compressive Strength
Another problem encountered with the field data related to the material testing data.
Compressive strengths for the concrete used in these members were measured periodically. The
first set of strength data was collected right before the girders were released from the forms and
the strands cut. The second set of strength data was taken at some point in time between 14 and
30 days after the release of the member. Thus it became difficult to determine the 28-day
strength of the member for use in the determination of the elastic modulus of the concrete. To

supplement this data, the use of conventional formulas for estimating concrete strength as
outlined in the ACI Committee 209 report - "Prediction of Creep, Shrinkage, and Temperature
Effects in Concrete Structures " [2] were considered. The formulas were modified based on
information from members that were cast at about that same time with more complete data -
including the 28-day strength. It will also be shown in the sensitivity analysis (Appendix A) that
as long as the concrete strength was within 500-1000 psi of the actual strength, the member
camber was not significantly affected.
Prestress Force
The prestress force that was actually applied to the member was not normally recorded by
the plant. The design calls for a stress after seating of 75 % of the ultimate capacity of the strand.
For the half inch diameter, low-lax, 270 ksi strength strands that are normally used by this plant,
a value of 31 kips/strand (corresponding to 0.75*fp) is used in the design determination. When
measured in the field, the hydraulic jack has a pressure gauge on it that measures the jacking
stress put into the strands. However, this gage can give unreliable readings with respect to the
stress actually put into the strands, as compared to the hydraulic pressure developed in the jack.
In addition to the gage, the length of elongation of the strands is measured to determine the force
induced into the member based on the stress-strain relationship for the strand. Draped strands are
elongated to a lesser degree and then pulled into position in order to try to alleviate friction losses
due to the draping anchors. Because of difficulties in getting the strain data, the calculations for
the analysis were based on the design values of strand stress. This may be in error according to
the Mn/DOT inspector for the plant by 2-3% over the design stress even after seating has
occurred. This results because the plant tends to induce more stress rather then risk not having
enough stress. Although most of the data compares well to that of the calculated results, some of
the error in the actual versus calculated camber may be a result of this. Trends in
underestimation of initial camber in Bridge 19045 may be a result of this inaccuracy, as can be
seen in Appendix A.

High Range Water Reducer Admixture
As mentioned earlier, because of the high range water reducer admixture that was applied
to the concrete mix, the determination of the calculated time dependent data was complicated.
For example, the creep and shrinkage time distribution formulas in the ACI 209R-92 report
mentioned earlier, are based on averaged strength and strength gain properties. Although it is
most likely a minor effect, the high range water reducer may play an unknown effect on the
measured camber for the section. The members were modeled as best as possible to the code
specifications of the method used for the analysis. Admixtures in the concrete mix to help early
strength gain, solvency of the mix, etc. are not necessarily known at the time of the design.
All of these limitations to the data are of concern for the project. Some of these issues are
more important than others as will be shown in the sensitivity analysis. In the short-term
parametric study, the variations with respect to the assumed design values were considered.
Variations for the parametric study were chosen in order to best reflect possible explanations for
camber differences in the members. In general, a great deal of what is done in the concrete
design process with concern to these limitations is based on approximations beyond the control
of the design engineer.
Previous Research
Several past research projects regarding camber effects were reviewed. Much of the past
research has focused on the development of methods and programs to analyze camber in girder
members for long term effects. The following is a brief summary of that research.
In the last several years much research has been done at the University of Minnesota by
Mokhtarzadeh et al. with regards to the mechanical properties of high strength concrete.
Although the members considered in this study were not designed as high strength members, the
actual strengths were considered to be rather high (6800-10,000+ psi). The designs were at least

at the upper end of the normal strength concrete range. As such, much of the information
regarding characterizing the strengths of materials was based on this research.
In 1987, Kelly et al. at the University of Texas [6] conducted tests on eight instrumented
bridge girders. The beams were 127 feet long, high strength with both low-relaxation and
normal stress-relieved strand members, and fully instrumented. Temperature, strain, and
deformation were measured over time for these girders. Data was collected on these girders over
a 1000 day period with the girders being placed in service for a portion of this time. Tests were
conducted to determine both short and long-term material parameters for the Texas region. The
collected data was then compared to various methods for determining camber in girder members.
The PCI Design Handbook, AASHTO Design method, ACI Committee 209 Recommendations,
"PBeam" developed by Suttikan et al., and "Camber" developed by Kelly et al. were used in
comparing calculated to measured data. The methods were used for determining losses, short-
term deflection, and long-term deflection for the girder members.
The work done in this report was highly detailed and measured not only the deflection,
but also all of the material properties including some of the time-dependent properties. Method
comparisons were made not only for deflection, but also for prediction of individual prestress
loss parameters in the section.
Based on the results, the computer program "Camber" was made taking into account the
conclusions of the research. Suggested modifications to different material formulas (modulus of
elasticity, creep factors, shrinkage, concrete strength properties, etc.) were implemented in the
program. Additionally, they formulated equations, based on their research, for the determination
of camber. This procedure uses the initial deflections to determine long-term deflections by
using multipliers.
This program was considered for use in analysis for this research, but it was decided that
the program and the research were too specific to the Texas area. The research was based on
using limestone aggregate in the members, and a climate which is much different than
9
Minnesota. As such, the research that they performed resulted in changes to the formulas that
were not applicable to the Minnesota design spectrum. For example, the Texas research team
came to the conclusion that the ACI 363 high strength equation used for calculating the modulus
of elasticity of concrete with limestone aggregate should be modified to:
E, = 40000 * (fc')1 2 +1500000 (From Ref. 6)
The ACI 363 high strength concrete equation as written is:
E, = 40000 * (fc')'/2 + 1000000 (Eq. 1.1, [8])
Kelly et al. had determined this to be a more realistic equation because they found that
the ACI underestimated the modulus of elasticity for crushed limestone aggregate. However,
Mokhtarzadeh et al. of the University of Minnesota found that equation 1.1 gave higher results
for the limestone cylinders they tested. The girders monitored in the present investigation were
fabricated with glacial river rock. Because of these differences, it was decided not to use the
program "Camber" in the analysis for this project, but many of the generalized conclusions were
used.
Branson et al. [7] at the University of Iowa have also done extensive work in the area of
prestress loss and deflection for prestressed concrete members. Their study focused on
differences between the use of normal weight and light weight materials with respect to time
dependent factors. The study also looked at the determination of deflection based on the revised
design equations for determining losses and time dependent factors that Branson proposed. This
study was used for background information and to some extent was included in the report.
A few years after Branson published this report he proposed a simplified procedure for
determining camber that was based on the initial deflection. This method was based on empirical
data as well as some assumptions made about the curvature relationship. Prestress losses and
concrete creep were calculated at various increments of time and were then used in determining
10

the camber at that time. This method was used in this report and is displayed as the approximate
time step procedure.
Ghali et al. have also done a great deal of research in the area of prestressed concrete
members. Their research was used in this report along with the computer program "CRACK"
that they developed. The program was generalized such that it could be used in the United States
even though it was developed in Calgary, Canada with the European model code in mind. The
program was recently updated in 1990 and the text [3] based on Ghali's original research was
published in 1986. The program and his research were also included in this report. Further
details as to the nature of the work will be referenced through the remainder of this report,
especially in Chapters 4 and 5.
11

12

Chapter Two - Field Data
Since 1992, data for this project has been collected for the correlation of calculated vs.
measured camber. Most of the data has been collected throughout the fall, winter, and into the
spring months of a Minnesota season. Information on the field data is provided in Table 2.1.
Bridge 49535 and 27624 beams had data collected from the summer and fall months only. As
such, the environmental conditions will have some influence on the final camber values due to
the effect of such things as temperature and relative humidity on some time dependent factors.
Standard temperature and relative humidity are assumed to be 700 F and 40 %, respectively, in
the basic ACI loss calculation formulas. (As can be seen from Table 2.1, this assumption does
not necessarily apply to this project.)
Issues related to the temperature effects on the girders were analyzed for the girders of
Bridge 19045. As shown in Table 2.1, a great deal of variation in temperature and relative
humidity was observed. The effects of this will be discussed in the sensitivity analysis section of
Chapter 3.
Methods and Procedures
The field data was collected over a three year period with several different people
collecting data. Because of this situation, the data was not necessarily consistently collected in
the same fashion by all of the various teams. This resulted in several gaps in the tables presented
in the next two chapters. Keeping this in mind, the author will discuss only the procedures that
were used on the most recent set of girders from Bridge 19045.
Over a six month period of time, data was collected for girders from project 19045.
These girders were chosen because of their large span to depth ratio. Measurements were taken
much more frequently at early ages because of the rapid camber changes the girder experienced
in the first 28 days. On the day of release, camber readings were taken at the time of release,
13

after pick up, and at the preparation area. The pick up readings were taken in order to determine
the effect of friction on the bed with respect to the girder camber. In most cases, when the initial
camber is measured for design Mn/DOT limits, it is measured when the member is released from
the bed. This does not give an accurate assessment of the initial camber and can underestimate
the initial camber by as much as 25 %. The average difference between release and pick-up was
found to be 10 - 12 %, as observed from the field data.
When the members were placed in the preparation area and then a few days later moved
into the storage area, readings were taken using a level and rod. The readings were taken every
few days for the first two weeks and then weekly for the next month or two. This decrease in
data readings continued until taking about one set of readings per month. The rod was designed
with a 900 extension to fit under the outside of the bottom flange of the girder allowing for
consistent readings. The girders were marked along the bottom flange at eighth points to help
ensure consistent data collection with respect to location along the member. To help insure the
accuracy of the data, plots were made of the camber of each member along the entire length for
every time period. By taking these precautions, very few errors were made in collecting the data.
In the storage area, the girders were placed perpendicular to a row of concrete slabs at
each end. These slabs were located as a function of the span of the member being stored. As
mentioned earlier, the supports were located at about three to five feet from the girder ends which
would reduce the overall span length by around eight feet. The distance for each end of the
girders was measured from the center of the support to the end of the member.
The date and time of the data recording were noted; the temperature and relative humidity
were collected from the Becker weather station which is located in that area. This information
was then considered in the long term analysis of the member for the purpose of accounting for
long term temperature trends in the data.
14

Chapter Three - Short-Term Analysis
The short term analysis was conducted in two parts. The first part consisted of
performing a parametric study of factors that might affect the camber. The second part
comprised trying to produce values in the calculations that were close to the actual measured
camber. In order to model the measured camber, the actual material properties were used as well
as the support conditions if they were known.
It was also decided that shear deformations could be ignored for the bridges analyzed in
this study. According to the ACI 209R-92 report mentioned earlier, "shear deformations are
normally ignored when computing the deflections of reinforced concrete members; however,
with deep beams, shear walls and T-beams under high load, the shear deformation" may be
substantial (4.8 of [2]). As can be seen from the types of bridges analyzed in Table 2.1, the span
to depth ratio for these members ranged from 17.3 to 24.8. According to the ACI 209R-92 report
[2] which deals with material properties of reinforced and prestressed concrete, if the ratio is
around 8.7 or less, then the effects of the shear deformations over time become significant. They
can cause as much as 23 % of the total deflection at a span to depth ratio equal to 8.7. As the
span to depth ratio increases this value rapidly decreases. Given that the range of field data span
to depth ratios was about twice as large as this ratio, it can be shown that the shear deformation
would not significantly affect the overall camber when considering the prestress camber and the
self-weight deformation. This was demonstrated by looking at the immediate effects of shear
and bending deformation for the lowest span to depth ratio members (Appendix B). In this case,
the shear deformations affected the overall camber by around 1 %. Even though the shear
deformation increases more rapidly than the bending deformation with respect to time, it should
still be insignificant in light of the other assumptions that have been made [2].
15

Sensitivity Analysis
The following pages contain explanations and summary tables for the parametric analysis
that was conducted. The complete sensitivity analysis spreadsheet is given in Appendix A; a
summary is given in Tables 3.1 and 3.2. The sensitivity analysis was based on the "PCI Design
Handbook" camber equations [4]. The respective tables and equations for determining camber
according to PCI are given in Figures 3.1 and 3.2. Both Figure 4.10.14 and design aid 11.1.4 [4]
were used in determining the initial camber for the girders analyzed (see Figures 3.1 and 3.2).
All of the members analyzed had a certain number of straight strands as well as a few two-point
depressed strands. Thus, the strand configuration was typical with respect to the PCI Design
Handbook. These formulae are based on moment-area techniques and produced reasonable
results for the sensitivity analysis and the short-term calculations. With the use of these
equations for determining initial camber, member characteristics were varied in order to
determine the relevant information for use in the short-term camber. In the following
paragraphs, the author will explain how the sensitivity analysis was conducted and what
conclusions can be drawn from it.
The parametric study was conducted for three separate girder types of varying sizes and
lengths. In Table 3.1, a summary of the calculated and measured cambers for representative
girders from each bridge listed are shown. The first row in Table 3.1 relates to data collected on
10 similar girders based on the same design. These girders were standard Mn/DOT 72 inch deep
girders with a total length of about 139 feet. The second row relates to a set of 45M (45 inch
deep, modified (from standard Mn/DOT section)) girders with a total length of 90 feet. The
total number of girders represented for this girder type was 16. The third row shows data
collected on four 45M girders with a length of 65 feet.
The following paragraphs explain Tables 3.1 and 3.2 in detail. The base case as well as
each variation and the measured results will be expanded upon. Conclusions related to each
16

particular variation will be drawn at the end of their explanation. Finally, overall explanations
with respect to the short term analysis will be drawn.
Overall trends for Tables 3.1 and 3.2 will be noted before looking at each individual
variation. Table 3.2 is similar to Table 3.1, but it displays the percentage change from the base
case data. This table leads to interesting trends in the data that relate to the size, length, and
strand density in the member. Changing any of these parameters has an effect on other
parameters. As the steel density decreases, the error in using the gross moment of inertia
decreases. In a similar manner, as the length decreases, the difference due to changing the drape
point by one foot or changing the overall length of the member increases. If the length
decreases, then the difference in camber due to changing the concrete density also decreases.
The base data was used to model the structure as best as possible given design data rather
than the actual properties of the section. The data used for the base case varied in a number of
respects from procedures typically used by Mn/DOT. Mn/DOT engineers typically use the gross
section modulus, Ig, rather than the transformed section modulus (Variation #5). For Mn/DOT
calculations, the ACI 318 8.5.1 is used for modulus of elasticity, setting w" = 155 lb/ft3 (this
value for the weight is also used in the self weight calculations). For the base case given in
Tables 3.1 and 3.2, the modulus of elasticity and girder weight were investigated with Variations
#3 and 6. At release, Mn/DOT engineers use the nominal release strength in the calculation of
the modulus of elasticity (Variation #2). The prestress assumed after seating, is taken as 0.75 fp
(this assumption was also used in the base case). The strand modulus was taken as 28,500 ksi
for the base case, whereas Mn/DOT uses a value of 28,000 ksi (Variation #1, for which case a
value of 29,000 ksi used).
According to the Mn/DOT structural drawings, the initial camber predictions for the three
bridges investigated were: Bridge 19045 2.5 in. (base case = 2.43 in.); Bridge 27112 1.81 in.
(base case = 2.01 in.); Bridge 49535 1.12 in. (base case = 0.97 in.). Comparing the base case
17

data with the predictions according to Mn/DOT for the three bridges listed gives differences of 3,
11 and 15%, respectively. In addition to the reasons listed above for the differences, Mn/DOT
includes the effect of the diaphragms (not present at release). Consequently, it was not possible
to compare the Mn/DOT estimated cambers with the measured cambers at release.
The control or base case was used from which to compare variations in material, section,
and thermal properties for the members. The variations were applied to represent the range of
assumptions that may occur in the actual section.
The base data comprised the following assumptions:
* Transformed moment of inertia
* ACI 363 equation for modulus of elasticity
(E, = 40,000(fc') /2 + 1,000,000)
* Ec based on the 28-day strength of the concrete.
(based on the research of Mokhtarzadeh et al.)
* Support conditions located at the ends of the member.
* Initial jacking stress of 0.75(fQ)
* Density of the concrete of 150 lb/ft3
* Strand elastic modulus of 28.5 * 103 ksi
The transformed moment of inertia accounts for the enhanced stiffness of the girder due
to the increased modulus of elasticity of the steel portion of the girder. The transformed moment
of inertia is determined using a ratio of each material modulus of elasticity to a reference
modulus of elasticity (usually the concrete modulus of elasticity). This ratio is multiplied times
18

the area of the material it references. Lastly, the moment of inertia of the section is determined
using the modified area.
Thus, a unified modulus can be used throughout the remainder of the problem in
determining the deflections for the material. In addition to increasing the moment of inertia of
the section, the location of the center of gravity for the section is changed by the transformation.
The transformed steel causes the center of gravity to be "shifted" toward the direction of the
largest amount of steel. As can be seen from the results, the importance of calculating the
transformed moment of inertia is proportional to the increase in steel density of the section. It
should be noted that many texts suggest ignoring the transformed moment of inertia and using
the gross moment of inertia of the concrete as an adequate approximation for use in camber
determination ([1], page 393).
Appendix C illustrates the transformed moment of inertia calculations used in the
sensitivity analysis. The calculation includes all longitudinal steel in the cross section of the
member. Even though an averaged transformed moment of inertia is calculated for the member,
only the value at centerline was used for the sensitivity analysis. Consideration of a variable
transformed moment of inertia along the section could not be justified by the PCI Design
Handbook. As can be seen from the results in Appendix C, the variation in the moment of inertia
along the beam was moderate. However, when this variation was considered in a finite element
analysis of the beam, the deflections were affected only slightly. Thus, using the centerline
moment of inertia was adequate.
The steel strand forces were calculated separately for the draped and straight strands.
This was done in an attempt to have a better understanding of how much camber was induced by
each particular strand group. The camber for each strand group was based on the PCI Design
Aid Table 11.1.4 (Fig. 3.2) with slight variations to separate the draped from the straight strands.
The gravity deflection of the girder was calculated assuming a simply supported system.
19

The base case did not include any deflection component resulting from differential
temperature effects. It was assumed that the girder had a uniform temperature for short term
calculations, since it was heat-cured under a tarp. As can be seen from the sensitivity analysis, if
a constant temperature is maintained there is little if any effect on the camber of the member
because the increased length of the girder is negligible.
Comparing the variations to the base case leads to the following observations. Variation
#1 consisted of changing the steel strength of the strands to that commonly accepted for
reinforcing bars ( 29,000 ksi vs. 28,500 ksi). This variation had an effect on the transformed
moment of inertia because the modulus was different. From Table 3.2, it can be seen that for
any of the three different girder types analyzed, the effect on camber was minimal (less than
0.07%).
Variation #2 consisted of using the initial compressive strength of the girder in
calculating the modulus of elasticity of the member. This also affected the transformed moment
of inertia because of the changed modulus of elasticity. Using the initial strength is the method
commonly employed in most design offices; however, Mokhtarzadeh et al. found that there was
little change between the 1-day and 28-day elastic modulus. Consequently for the base case, the
modulus of elasticity was calculated using the 28-day strength for the concrete which was
considered to be most accurate. Comparing variation #2 with the base case led to a maximum
difference of 5.35%.
Variation #3 consisted of using the ACI 318 equation 8.5.1 for determining the modulus
of elasticity. This formula is reasonable for calculating the modulus of elasticity for normal
strength concrete, but for high-strength concrete, the ACI 363 equation is more accurate. As a
general rule, prestressed concrete will usually be considered high strength concrete. Therefore,
the ACI 363 equation in correlation with the 28-day strength was used for the base case.
Comparing this variation to the base case yielded a significant change in the camber of up to
20

14% due to this variation. As can be seen from the results, the use of one formula over the other
may very well be determined by the design strength of the concrete. If one compares variation
#3 to that of the measured and the base cases in Tables 3.1 and 3.2, it can be seen that the ACI
318 equation appears better suited for the girders of Bridge 49535. It can also be observed that
Bridge 19045 results are more closely aligned with the ACI 363 equation. These results are
consistent with the actual concrete strengths (Bridge 19045 concrete was about 2,000 to 3,000 psi
higher than that of Bridge 49535).
Variation #4 consisted of increasing the assumed initial prestress (after seating) by 5%.
According to the Mn/DOT inspector on site at Elk River Concrete Products this was a reasonable
variation. This variation had a significant effect on camber for all three of the different types of
girders (9 - 13%). As was mentioned earlier, a trend related to the density of the steel in the
section was observed. As the density of the steel increases, so does the difference caused by the
change in jacking force. Increasing the steel density by 53%, increased the difference with
respect to the base case for this variation by 45%.
Variation #5 used the gross moment of inertia rather than the transformed moment of
inertia. This caused a significant change in the camber of the girders, even as high as 17%
difference between the base and variation. Using the transformed moment of inertia was
considered to characterize the material properties the most accurately. As can be seen, a similar
trend related to the density of steel was observed when changing from the transformed to the
gross moment of inertia.
Variation #6 took into account possible errors in calculating the self-weight of the
member by increasing the concrete weight per foot cubed by five pounds. As can be seen from
the sensitivity analysis in Table 3.2, the effect on camber was minimal (around 3%). Variation
#7 in which the harp points were moved by one foot as well as variation #8 in which the beam
21
length was changed by one foot also had minimal effects with respect to the camber. Variations
#7 and 8 had a maximum effect with respect to the base case of 1.2% and 2.5% respectively.
Variation #9 considered changing the support conditions at the initial time step in order to
account for the location of the actual supports during curing of the girder. Support locations
have a significant effect when comparing the calculated camber to that actually observed in the
storage areas. On average, the supports were located three to five feet from each end of the
girder. This condition serves to increase the camber in the girder by decreasing the gravity
deflection and by applying end moments to the shorter supported section. An estimate of this
effect was around 11% for the data with information available.
Variation #10 used the actual concrete strength measured from test cylinders formed in
the field. Cylinders were tested at the initial release of the girder and usually at some time
around the 28-day strength of the girder. In the analysis, the 28-day strengths were estimated and
used in determining the modulus of elasticity for this variation. Strengths were recorded by the
Mn/DOT inspector up to a value of 10,000 psi at which point the test was considered complete.
This does not aid in determining the actual strengths of the section, but for most cases failure
occurred before reaching 10,000 psi. According to the sensitivity analysis, this variation was
moderately important (around 4 to 8% camber difference from using the design data). The fact
that designers do not know the actual strength ahead of time for the concrete makes it unlikely
that this variable can be fine tuned in design.
Detailed information about the method and data collected on measuring temperature
changes over a day long period will be discussed in Chapter 5, which involves thermal effects
over a one day period. The method used in Chapter 5 is more precise than that used in the
sensitivity analysis. However, Variations #11, 12, and 13 did have a purpose in that they roughly
investigated the effect of temperature on the section. A coefficient of 6 x 10⁻⁶ in/in/ °F was used
to determine the strain in the section at a particular location. In variation #11, a constant
increase in temperature of twenty degrees was applied throughout the section. From this
22

application a change in the length of the member was determined and calculations for the camber
due to this change in length followed. For this constant temperature case, the effect on camber
was minimal for all three types of girders observed.
Variation #12 applied a thermal gradient that varied by 20 o Fahrenheit throughout the
depth of the section in a linear fashion. Typically, a linear function for the temperature variance
is inaccurate, but it was used to show the possibilities for affecting camber. This thermal
gradient was then turned into a curvature calculation for the beam. The change in strain between
the top and the bottom of the member due to thermal effects was divided by the depth to get a
curvature value. From this point, it was assumed that the curvature would remain constant and
thus a conjugate beam analysis could be conducted to determine the camber. As can be seen
from the sensitivity analysis, this variation was significant (around 28%).
Variation # 13 consisted of a crude assumption that only the top flange of the girder was
heated by a temperature variance of 20 degrees. This would be typical of a hot day when the sun
radiated down on the girder with the top flange shading the bottom flange and web. This would
result in a shearing action at the top flange - web interface. Finding these forces, a moment for
the force was calculated after determining a moment arm located from the center of the stressed
top flange to the top of the web. This moment was assumed to be constant along the beam.
Knowing this, a camber for this component of temperature was determined and it was discovered
that this variation was insignificant with respect to camber.
Ghali and Favre in Reference 3 have suggested a more realistic model for considering the
temperature effects of concrete. They suggest that temperature varies in a parabolic fashion
when the sun heats the top of the girder. If the concrete molecules were allowed to strain freely
then a parabolic strain diagram would be observed. Ghali and Favre wrote that:
"Stresses are produced because each fiber being attached to adjacent fibers is not free toacquire the full expansion due to temperature. The stresses produced in this way in anindividual cross section must be self-equilibrating; in other words the temperature stress in a
23
statically determinate structure corresponds to no change in the stress resultants (internalforces)." (Ghali [3], page 23).
They go on to state that these self-equilibrating stresses are sometimes referred to as the eigen-
stresses for the section. Thus, plane sections will still remain plane with this equilibrating stress
(see Figure 3.3). This was verified by experimental research that they conducted. If the plane
sections remain plane, then the parabolic strain of pure thermal expansion will produce residual
stresses in the section.
Following variation #13 in Tables 3.1 and 3.2, are listed measured cambers taken from
the actual field data collected after the girders had been picked up and set down. The values
were actually measured to the nearest millimeter at release which correspond with an accuracy of
+/- 0.04 in. The measured cambers after the members were moved to the storage locations are
also shown in these tables. The members were moved immediately after release. As mentioned
earlier, picking up and setting down the girder helped to alleviate friction between the supports
and the bed. However, because the beams were lifted by support hangers located at five to six
feet from the ends, friction on the bed had the opposite effect. When the beams were set back
down, friction prevented the beams from settling down to the estimated camber, that is camber
without the effects of friction. Thus, camber without the effects of friction between the bed and
the member is somewhere in between the original measurement and the pick up and the set down
measurement.
As can be seen in the tables, there are slight differences between the base case and the
actual case. In the first girder type that came from Bridge 19045, the actual measured camber
was higher than that calculated in the base case. This can be accounted for all alone by changing
the initial prestress (after seating) as was suggested by the Mn/DOT inspector. In the detailed
parametric study available for Bridge 19045 in Appendix A, the measured camber range was
compared to changes in initial prestress and concrete strength required to correlate with the
measured range of results. All other parameters for each of the columns were the same as the
24
base case analysis. When one looks at this table, it can be seen that modifying the initial prestress
force to account for the variation is the most reasonable method to account for differences in the
calculated and measured camber. Girders cast on the same bed with the same prestress had
similar camber results as long as the concrete strengths were close. The difference in cambers
for girders meeting the previous qualifications was small; it varied from 0 to 7%.
For the representative girder of Bridge 49535, which is the last girder in Table 3.2, the
actual camber was lower than that calculated for the base case. Since the Mn/DOT inspector
stated that the prestressing force will always be at least what is called for in the design plans -- if
not more, the conclusion was drawn that some other factor must account for this variation. The
difference in results may be accounted for by the assumption used for the modulus of elasticity.
The results would tend to agree with this conclusion. Several of the other factors may play a part
in making up the difference between the base and the actual case, but they are less obvious.
The effect of storing the girders on the supports which shortens the girder span was also
investigated. The difference in variation between the actual supported and the end supported
case was consistent with the difference measured in the field for the representative girder for
Bridge 19045. Even though the measured data varied from the base case, the difference between
the end supported case and the actual support case was consistent. For Bridge 19045, the actual
difference was 0.25 inches, while calculated was 0.26 inches. Bridge 49535 had an actual
difference of 0.37 inches.
Comparison to Field Data
The first step in trying to model the short term camber was to use values for the 28-day
strength that were as close as possible to that strength. The reasons for using the 28-day strength
have already been discussed in the sensitivity analysis explanation. The 28-day strength data
was not known for all of the girders that were modeled. Thus, estimates of the 28-day strength
had to be made. This could not be done by using the basic strength estimation equations that are
presented in many texts because of the curing process used by Elk River, and because of water
25

reducer admixtures added to the concrete. Instead, modified factors were used to get a better
approximation of the strength of the member. Engineering sense was also employed where
significant deviation occurred with these modified factors. The modified factors were created by
back substitution for members with complete strength data. In order to be considered a complete
set of strength data, the member had to have an initial, intermediate, and a 28-day strength. This
was done for every member that had a complete set of records and then the average for these
coefficients was taken. The function [1] with the accepted values is shown below:
fc(t)= *t fc' (Eq. 3.1)
Where: t = time in days
a and p = Factors that correspond to the cement type and
curing conditions.
a =0.7 for Type III, steam-cured cement
P = 0.98 for Type III, steam-cured cement
fc' = concrete strength at 28 days
fc(t)= concrete strength at any time t
The terms a and P were modified to reflect the actual concrete properties. These two
terms are meant to model the cement type and curing conditions of the concrete. They were
modified to 0.34 and 1.08 respectively based on the averaged available data. The range of the
data calculated values of a was 0.23 to 0.42 and for 3 the range was 1.03 to 1.20. Typical ranges
for these variables, according to the ACI 209R-92 report referred to earlier, are a = 0.05 to 9.25
and p = 0.67 to 0.98. Even though P falls outside of this range, it should be considered that the
typical range listed does not account for admixtures to the concrete mix. Thus, it was decided
that these factors were reasonable, but should be used in conjunction with engineering judgment.
Even if the strengths have been estimated incorrectly by 500 psi, the effects on the
camber for the member will not be greater than about 1.8 - 2.6 percent for the members
considered. This error is well within the accuracy of what was measured for camber in the field.
Thus, it was determined that the concrete strengths were estimated fairly well. Appendix D
26

contains the detailed spreadsheet showing values used in the analysis of the short term
calculations for all of the girders that had data collected on them. In this spreadsheet there are
input concrete strengths shown in bold to indicate that they were not measured test data, but
approximations made using engineering judgment and the formula given in Equation 3.1.
With information that was obtained from the parametric study, most of the assumptions
made in the base case were used for the calculation of short-term effects in all of the members.
However, the actual or approximate values of 28-day strength were used rather than the design
strength assumed in the base case. It was also decided that the design prestress force assumed in
the base case would be used because this was the only information available at the time of
analysis. With all of this in mind, the results of the short-term camber study are presented in
Tables 3.3 to 3.8. The notation for each beam begins with the beam number (e.g. B 11) followed
by the series number (e.g. S2). The same series number indicates the same beam design.
Results from the analysis seem to be reasonable according to other studies done in the
area of camber and deflections for short term analysis. According to ACI committee 209 [2]
with all of the experimental material parameters known, it is reasonable to expect an error of
plus or minus 15%. If design material parameters (concrete strength, modulus of elasticity, and
time dependent parameters) are used, it is reasonable to expect an error of plus or minus 30 %
[2]. These percent errors are with respect to camber at any time period, not only at initial
camber.
In Tables 3.3 to 3.8 the difference between the measured and calculated camber has a
range of up to 37%. There are at least two explanations for the wide range of variance especially
visible in Tables 3.4 to 3.6. One of the main reasons is that friction resistance in the bed was not
considered in Tables 3.4 to 3.6. In most cases measurements taken in the field for initial camber
are done immediately after release of the member without consideration of picking the member
up to relieve frictional restraining forces. Consideration for the friction losses was not deemed
important in the early stages of research; thus, a lack of data collection for Tables 3.4 to 3.6.
27

Tables 3.9 to 3.11 list the measured friction differences between the bed and the girder.
In the first row is shown the measured values before the member was picked up by the crane.
The second row shows the measured camber after the girder had been picked up and set back
down onto the formwork bed. As mentioned previously, the actual case of non-friction affected
camber is somewhere in between the two cases presented in Tables 3.9 to 3.11.
From these tables it is easily apparent that the friction at release due to the bed varies by a
great deal. The differences in camber due to friction were in the range of 5 to 20 percent with an
average of around 12 percent.
If we consider only Tables 3.3, 3.7, and 3.8 for which the camber were measured after
pick-up and set down thereby relieving friction with the bed, the resulting range of error between
calculated and measured results drops to 17%. These three tables take into account some of the
experimental material parameters, but do not take into account all of them (i.e. prestress strand
force.) This leads to the second reason for this high percentage of error which was a lack of
knowledge of all the experimental material properties. If a more accurate knowledge of the
prestress forces, and the actual modulus of elasticity were known, less error in the calculated
versus measured results would be possible.
It should be realized that there is a limit to the comparability of the field data to the
calculated data; specifically, those members influenced by the friction losses. However, because
all of the members were moved off of the bed, partial alleviation of the friction resistance could
be assumed in the long term analysis for Bridges 27112 and 04516. Unfortunately since the
storage conditions were not known for these members, other differences between the actual and
calculated data were introduced. In the next chapter, the long term results along with these
differences will be discussed.
28

Chapter Four - Long-Term Analysis
The accuracy in determining the short-term camber relied on the determination of the
correct physical properties of the section without regard to time. In order to determine the long-
term camber for a member, several methods have been developed in order to estimate the effect.
As mentioned in the past research section of the first chapter, some of these methods depend on
the geographical region where they were developed as well as the types of aggregate available in
that area. Thus, the evaluation of a method developed for a general case was considered to be
important.
The methods investigated included: the Pretressed Concrete Institute Design Guide
Multiplier Method, the approximate time step method proposed by Branson et al., and the
computer program "CRACK" which was developed by Ghali et al. In order to perform the
analysis using the program "CRACK," many values had to be determined. Of the time
dependent values, the program required the creep multiplier, shrinkage strain, reduced relaxation
stress, and the aging factor for the concrete. There are several methods of determining these
values but only a few that determine time step values. These values were determined using the
ACI 325 Committee recommendations in "Control of Deflection in Concrete Structures." These
values were also determined according to the European model code for which the "CRACK"
program was originally developed in Calgary, Canada. Both of these design model methods for
determining camber had variations, but they produced results that were comparable for most of
the members.
Because of the missing support information, it was decided to only consider Bridge
19045 girders in the analysis of long term effects using all of the methods. In the first few pages
of this chapter the camber calculation methods and the models used for determination of the
time-dependent factors will be discussed. Results and conclusions regarding the methods
examined will follow the explanations.
29

Methods and Procedures
PCI Design Handbook Multiplier Method:
This was by far the least complicated of the methods employed in determining the long-
term effects of camber for the section. This method, or a variation of this method, has been
employed in design practice since the development of the multipliers by Martin in 1977 [13]. As
will be shown later in this chapter, the method also yielded moderate overall errors with respect
to the other methods employed (on average, up to 8% higher error than the other methods).
However, it is extremely quick and a good approximation unless a more accurate calculation of
the camber is desired. To use the method, the short-term camber is determined and then
appropriate multipliers are applied to the short-term deflection. The multipliers are found in
Table 4.1 which was taken from the PCI Design Handbook. Leslie Martin made several
assumptions and then determined multipliers to be used based on the ACI multiplier equation for
nonprestressed concrete members. These are the assumptions that he made:
1. The ACI 318 short term deflection amplification factor for estimating long-term deflections for prestressed concrete was taken equal to 2 as for normalweight concrete. (This factor assumes that there is very little compressive steelin the member.)
2. Initial prestress loss = 8.0%
3. Time dependent loss of prestress is 15.0%
4. Percent of total camber and deflection change at erection = 50%
5. The ratio of noncomposite to composite moment of inertia = 0.65.
6. Assumes erection of the structure occurs at the concrete age of 45 days.
Martin considered that in prestressed members there are losses over time and that the
concrete will gain strength over time. With all of the above information, he modified the ACI
318 multiplier as found in the 1971 code for use in prestressed members. He noted that this
method is an approximation, but justifies it by stating:
30

" ...the data on which ...(more complex methods) are based usually has a scatter of at least15 to 20 % using laboratory controlled specimens....it seems rather futile to use these time-consuming methods for estimating long-time cambers and deflections." [13]
Branson et al. Approximate Time-step Method:
There are several variations of the approximate time step method that have been
developed over the years with Branson's being one of the more recognized (cited in References
1, 2, 4, 5, 9 and 11). The method was based on assumptions related to the complex incremental
time-step procedure as well as empirical data from tests that have been performed. The most
common reason for using this method is to produce estimates of deflection at any given time.
Additionally, the method exhibits a less cumbersome process than the incremental time step
method. The incremental time-step method uses a general expression that is a good basis for
formulating the approximate time step method:
t t
= -e x P( - CP ' x(-C C n-Ie (Eq. 4.1)t E I Pn -I1 n) E .I n n- E-'Ic c n=0 c n=0 c
where: Pi = initial prestress force before losses
ex = eccentricity of steel from the center ofgravity at any location along the span
n - 1 = beginning of a particular time step
n = end of the aforementioned time step
C-_ and C = creep coefficient at the beginning and endof the time step
P - P = prestress loss at a particular time interval
If the curvature is determined for enough sections along the member, a curvature diagram
can be constructed. The conjugate beam method or curvature-area technique can be employed to
determine the deflection in the section. Obviously this technique is very cumbersome and time
consuming, but well suited to a computer program such as "CRACK" or "PBeam."
31

The approximate methods use a form of this equation in order to simplify the
computations. The first step in the method is to relate the curvature to the deflection.
S= -M (Eq. 4.2) and = .kL 2 (Eq. 4.3)Ec c
where: 6 = deflection in the member
k = some function that depends on the membersupport conditions and the strand pattern
L = length of the member
Thus, the incremental time step function can be rewritten from the general formto find the final deflections at the end of the member life.
t tei) -(P-Pe) - Cu- - - (Eq. 4.4)
cc n=0 c c n=0 c
5 et = 6 j-(5 e 5-5e C 66 (Eq. 4.5a)
et =-i i(-6i6e,-et e -C(u (Eq. 4.5b)
Where: et = final deflection caused by theprestressed strands
5 = deflection due to the initial prestress
6 e = deflection due to the final prestress
CU = ultimate creep coefficientU
32

Now if the external loads are included in the formulation, then the overall deflection canbe determined and used in incremental time steps.
8t = e- - 2 6Ct6D SD). lCt)-L (Eq.4.6)
C t = time incremental creep coefficient
0.60C t t-0.60C (From ACI 209R-92)
10+ t0.60 I
Se = deflection due to the effective prestress @ t
D = deflection due to the dead load
8 SD = deflection due to the sustained dead load
SL = deflection due to the live load
Branson et al. have suggested a similar equation that is based on the aboveformulation as well as empirical information. This formula takes into considerationcompression steel and the age of the concrete.
A8 = + ( kr*Ct *i(pi+krCt5i(D) -KakrCt i(SD) (Eq. 4.7)
Where: q = Pe/Pi
kr = 1/(1+As/Aps), As/Aps <= 2= factor to consider the non-tensioned steel
in the section
Ka = factor corresponding to the age of the concreteat loading
= 1.13"t^-0.095 (for steam cured concrete)
For noncomposite beams, the total deflection becomes:
8 = -pi- 1 krCt) + D + k rct) SD lKakrt L (Eq. 4.8)
Where: AP = total loss of prestress excluding the initialelastic loss
Po = initial force at transfer after elasticlosses
2= 1-P2-P
33

The previous equations and derivations, Eqs. 4.1 to 4.8, came from References 1 and 10.
Using Equation 4.8, results were determined for each girder of Bridge 19045. This
method gave fairly reasonable results when compared to the other methods used in this report,
but generally overestimated the cambers at any given time by about 0.1 to 0.4 inches (average of
5 to 11% difference per girder (see Table 4.3)). However, for the early ages of the concrete life,
the measured data varied by as much as 1.5 inches (see Figures 4.2 to 4.9). This could be due to
temperature effects or it could be due to the averaged data used by the ACI model code for
calculating the properties of the girder.
Many of the components of Equation 4.8 were not needed because superimposed dead
and live loads were not applied to the section. As such, the factor "KI" (defined earlier) which
relates to the age of the concrete at application of superimposed loads was never used for
determining the camber because only self weight was considered in the project.
Since there were mostly tensioned strands in the section, the "k," term which accounts for
nontensioned steel in the section was also not used. Naaman [5] discusses the fact that this "kl"
term in Branson's formula may be in error with respect to accounting for the nonstressed steel.
The "k," term was originally intended to account for the reduction in deflections due to
nonprestressed steel in the tension zone. Naaman cites Tadros' et al. research in which Tadros
came to the conclusion that in certain situations when the equation is used, calculated results
with the term "k," contradicted the measured variance. The term does not account for the ratio
of nontensioned steel to cross-sectional area of the concrete. Thus, Tadros questioned the
effectiveness of the equation in accounting for nonstressed steel in reducing the long-term
deflections due to creep in the section. As such, engineering judgment should be used when
considering the use of this method. Use of this formula should be decided based on its
appropriateness to a given design for a member (i.e., consider using a different method if a
considerable percentage of the steel in the section is nonstressed in the tension zone).
34

Program "CRACK" by Amin Ghali et al.
Much of the derivation of this program can be found in Reference 3 and will be
summarized in this section of the report. Ghali and Favre use the relationship that "plane
sections remain plane" as the basis for much of the formulation to be presented. They state that
this assumption is reasonable based on test results determined in their lab. From here they go on
to derive a formula in matrix form to relate strain to forces and moments in the section (Equation
4.9). This formulation also allows for any reference point to be used without regard to the center
of gravity of the section.
(o 1 I -B N
S E(A x I -B2)( (Eq. 4.9)
A = Transformed area for the sectionB = Transformed first area moment for the sectionI = Transformed moment of inertia for the section
E = Reference modulus of elasticity (usually the concrete modulus ofelasticity)
N = Axial force for the sectionM = Moment for the section
E o = Strain at a reference point
w = Curvature for the section
Ghali transforms all of the prestressed member stresses and external forces into one
externally applied force and moment for each time step. These forces are transformed, using
Equation 4.9, into strain and curvature changes which are used to compute changes in stresses in
the section over the time step. This information is then applied to the previous time-step stress,
strain, and curvature values. From this combined information, deflections are determined based
on the curvature information. In order to determine the changes in force and moment for the
time dependent effects, Ghali uses the following expression:
35

(AN \- AM repScreep
IAN
YAM shrinkage
- AN r
AM / relaxation
AN \
/AeM cre
Where:
m A B 8 C -t- (E c bar )-C(tto) C i
ep i = 1 L c L o J
A = Area of the concrete
B = First area moment of the concrete
I = Second area moment of the concrete
E c bar = Age adjusted reference modulus of elasticity ofthe concrete
E C(t0 )E c bar = c - = aging coefficient
S1 - x-C(t, to) (ACI 209R-92 RepS0 (t0) = Initial strain for the section
i(to) = Initial curvature for the section
i = the concrete section to be considered
(Eq. 4.11)
)ort)
Since the creep force is determined with a multiplier to the strain and curvature, the
matrix that Ghali developed could be used to determine the force and moment necessary to resist
free creep in the section (Equation 4.11). He also uses expressions to determine the shrinkage
and reduced relaxation moment and axial force required to prevent free shrinkage and reduced
relaxation for the section (Equations 4.12 and 4.13). Free creep, shrinkage, and reduced
relaxation are the creep, shrinkage, and reduced relaxation that would occur if each fiber were
uninhibited by other fibers.
36
AN
\AM /(Eq. 4.10)

ANm ct=- (E cba (Eq. 4.12)
Sshrinkage i= L to) J i
SCS \t,to) = free shrinkage for the period t oto tm = total number of concrete parts
AN n i A psAO pr (Eq. 4.13)
Mrelaxation i=1 ips ps pr i
A ps = Area of the prestressed strands
y s = distance from the centroid of strands to thecenter of gravity for the section
Aa pr= reduced relaxation over the periodt oto t
n = total number of strand layers
Ghali et al. determined the incremental strain and curvature for the section using Equation
4.9. The resultant restraining forces (axial and moment) for creep, shrinkage and relaxation are
determined from Equation 4.10. Additionally the strain and curvature that would result if these
properties could occur freely are used. Then these incremental strains and curvatures are added
to the previous time steps total strain and curvature. Using these strains and curvatures the
deflections can be calculated if the curvatures from the other sections along the girder are known.
A more detailed look at this approach to the determination of long-term camber/deflection in
prestressed concrete members can be found in Reference 3 (pages 22 to 32).
The program "CRACK" was labor intensive in the production of input files for the
program. The external moments and forces caused by all loads must be input for each loading
stage. All of the time dependent factors must be input for each stage as well. This program
allows for an extremely generalized case to be used as input for the program, unfortunately it is
also extremely time consuming and impractical to create the input file necessary for this
program. Even if each member was designed similarly, data related to the time step and concrete
would not be similar if constructed on different days. In Appendix F of this report, an example
of the input as well as the output files for Beam B18-S2 of Bridge 19045 can be seen.
37

Model Codes Used for Determining Estimates of Material Properties
CEB-FIP 1978 (MC78) Model Code
Two separate model codes were used in the program "CRACK" to determine the time
dependent coefficients appropriate as input for the program. The first model code used was the
CEB-FIP 1978 (MC78). The program had been originally written in Calgary, Canada and was
developed with this code in mind. However, Ghali states that he kept the program generalized
enough to be used with any code determined set of material parameters. The European model
code relies on empirical equations based on research done on members. The code attempts to
account for the following in tables, charts, and equations:
* Ambient environmental conditions
* Relative humidity
* Volume to surface ratio of the member
* Creep which develops in the early ages of the section
* The hardening rate of the concrete
The method gave reasonable results for 6 of the 8 girders compared to the field data the
two exceptions were girders B13-S2 & B14-S2 of Bridge 19045. The code provides time-
dependent relations for creep, aging, and shrinkage in the concrete, as well as intrinsic, and
reduced relaxation multipliers for the strands. The errors that resulted for the two members were
a result of the creep function that the European model code uses. This creep equation relies on
the reduction of creep due to a ratio between the initial and 28-day modulus of elasticity. As
such, the larger the ratio, the larger the creep. If the members are not released until the concrete
is several days old, then the method predicts a higher ratio for the initial to 28-day modulus of
elasticity.
Mokhtarzadeh, et al. has determined that the modulus of elasticity at 28 days is similar to
that of the initial modulus. The results are dominated by the coarse aggregate and sand which
38

comprises approximately 80 % of the concrete. With this information in mind, the equation
should be reevaluated for determining the creep of the section. An attempt at compensating for
the problem was done by using Equation 4.15 which is recommended by CEB-FIP as an estimate
of the modulus ratio portion of Equation 4.14. Using this equation was an attempt to determine a
reasonable creep value that could be used in conjunction with the results of Mokhtarzadeh et al.'s
research. As will be shown later, the results still did not agree well with that of the field data.
The creep equation is presented below:
C( o) - y a(to -. 4. t,to t,0 )C (t) - t) (Eq. 4.14)
St ) 0(28) f
a(t o \ 0 (.8) (represents creep developed in the early ages
of the member)
Pd (t - t o)= 1 - exp [-0.02 -(t - t)] (A function of the time length of the period
Sunder consideration)
Sf(t)= t (This is a function of the notional thickness.t + t f The notional thickness is related to the volume
to surface ratio of the member and the ambientenvironmental conditions. It is found in thetables of the CEB-FIP model code.)
Note: The elastic modulus and the strength ratios for Equation 4.14 may be determined from
empirical equations found in the CEB-FIP model code. Using the measured numbers for E" (to)
and Ec (28), gave unreasonable results due to the extended curing period of a couple of the
girders (B 13 and B14) which led to a high ratio of E, (to) to E, (28) for Bridge 19045. It was
decided to use the CEB-FIP formula for the ratio:
1
Ec(t° = t (Eq. 4.15)E (28) 4.2 + 0.85-t ,
Where: t o = the age of the concrete at loading
39
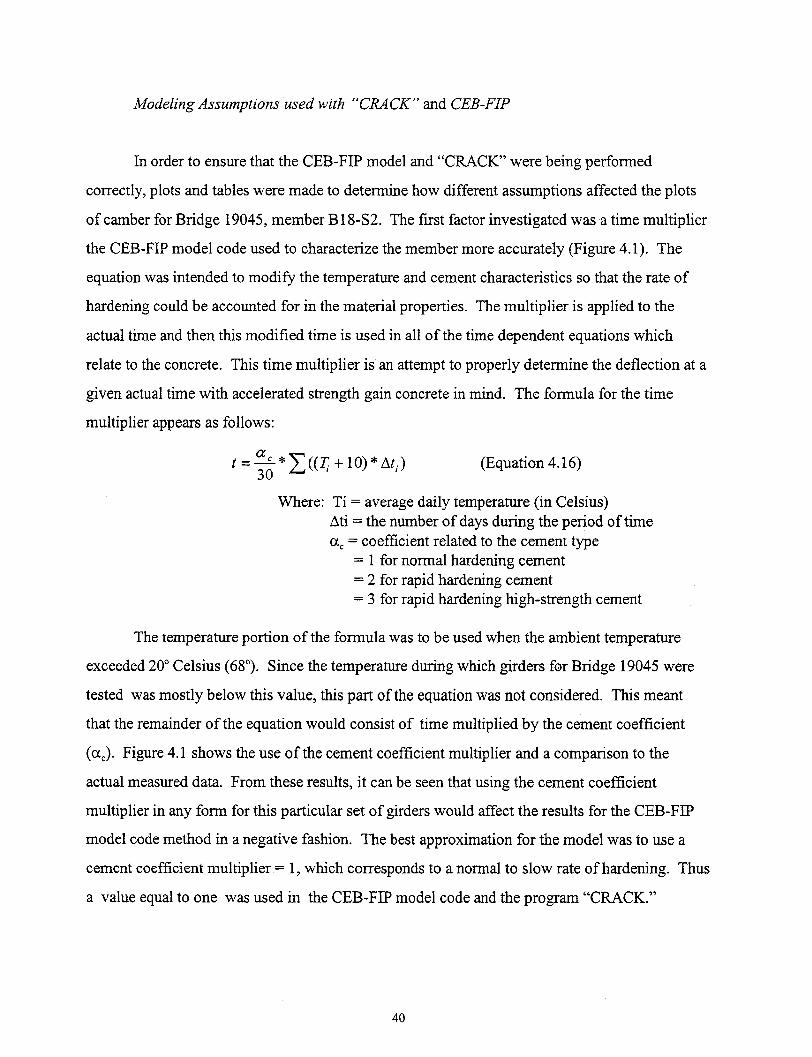
Modeling Assumptions used with "CRACK" and CEB-FIP
In order to ensure that the CEB-FIP model and "CRACK" were being performed
correctly, plots and tables were made to determine how different assumptions affected the plots
of camber for Bridge 19045, member B 18-S2. The first factor investigated was a time multiplier
the CEB-FIP model code used to characterize the member more accurately (Figure 4.1). The
equation was intended to modify the temperature and cement characteristics so that the rate of
hardening could be accounted for in the material properties. The multiplier is applied to the
actual time and then this modified time is used in all of the time dependent equations which
relate to the concrete. This time multiplier is an attempt to properly determine the deflection at a
given actual time with accelerated strength gain concrete in mind. The formula for the time
multiplier appears as follows:
t = ac ((T +10) *At) (Equation 4.16)30
Where: Ti = average daily temperature (in Celsius)Ati = the number of days during the period of timeac = coefficient related to the cement type
= 1 for normal hardening cement= 2 for rapid hardening cement= 3 for rapid hardening high-strength cement
The temperature portion of the formula was to be used when the ambient temperature
exceeded 200 Celsius (680). Since the temperature during which girders for Bridge 19045 were
tested was mostly below this value, this part of the equation was not considered. This meant
that the remainder of the equation would consist of time multiplied by the cement coefficient
(ac). Figure 4.1 shows the use of the cement coefficient multiplier and a comparison to the
actual measured data. From these results, it can be seen that using the cement coefficient
multiplier in any form for this particular set of girders would affect the results for the CEB-FIP
model code method in a negative fashion. The best approximation for the model was to use a
cement coefficient multiplier = 1, which corresponds to a normal to slow rate of hardening. Thus
a value equal to one was used in the CEB-FIP model code and the program "CRACK."
40

ACI 209R-92 and 435R-95 Model Used With "CRACK"
The second model code for the material parameters used for "CRACK" and the
approximate time step method was the ACI 209R-92 and 435R-95 respective reports that are
referenced. The equations of these ACI model codes produced reasonable camber results with
respect to those observed and can be seen in the approximate time step analysis calculations
found in Appendix E. Equations from these reports were used in the approximate time step
analysis in order to determine the losses for a given time step. Since both reports took slightly
different approaches to the determination of prestress losses at different time steps, it was
decided to use the ACI 435R Report [8] to determine losses. The 435R-95 Report was intended
to be used for the determination of deflections in concrete members and is a more current report.
Both of these ACI reports use empirical information and averaged values to determine creep and
shrinkage for the sections. However, the models enable adjustment of these averaged values by
applying factors to characterize the actual section. Factors that applied to the members analyzed
were used in the approximate time step method and the program crack when modeled with the
ACI codes (see Appendix E).
Additional Remarks Regarding Methods
Included in addition to Branson's approximate time step analysis in Appendix E is a
comparison between the ACI, PCI, and AASHTO total loss calculation. The PCI and AASHTO
methods produced final prestress losses for Bridge 19045 that were within 1-2 ksi of each other.
These methods differ in their equations for determining creep, shrinkage, and relaxation;
however, they seem to give approximately the same results. The losses calculated by the ACI
method were larger than both of these values by about 4-5 ksi for the same bridge. Part of the
reason for this may be that the ACI method takes into account more characteristic properties of
the section than the other two methods. The method additionally accounts for the concrete age at
loading, the fine aggregate percentage, the slump of the concrete mix, and the thickness of the
member. All of these factors were not specifically addressed in the PCI or the AASHTO
41

calculations of the final total losses. Comparing the PCI, AASHTO, and ACI method for
determining losses is difficult because no strain gauges were used for this project to determine
losses. However, the ACI 209R and 435R method did predict total final losses to be seven
percent higher than PCI and AASHTO methods (see Appendix E). The greater losses associated
with the ACI methods led to lower long term cambers than would be associated with the other
loss calculations (PCI and AASHTO). The ACI prestress loss method was used in determining
long term cambers shown in Figures 4.2 through 4.9 according to the CEB-FIP and Approximate
Time Steps methods. Please note that in the figures, the initial camber value calculated at release
was used in the long-term calculations.
From Figures 4.2 through 4.9, it can be seen that where the ACI 209R and 435R
recommended values were used, the camber results were generally higher than measured. The
results could be higher due to the fact that the estimated values of ultimate creep and many of the
constants used in the other equations are based on averaged data. If the PCI and AASHTO
methods had been used to calculate losses, the long-term predictions would have led to greater
long-term cambers. Figures 4.2 to 4.9 will be discussed later in this chapter.
Comparison to Field Data
In this section, the results of the field data are compared to the calculated methods
discussed in the previous section. It should be noted that the values presented for the measured
field data have been adjusted by a percentage to account for the support conditions. A reasonable
estimate of this percentage was determined using averaged camber ratios for different support
conditions of members B18-S2 and B 11-S2 of Bridge 19045 (see Table 4.2). For these two
members, the sections were analyzed as simply supported beams, spanning between the actual
support locations, with applied end moments to simulate the cantilevered ends using the program
"CRACK." By comparing this case of deflection to the case of a fictitious end supported case, a
multiplication factor was determined. As can be seen in Table 4.2, the factor was fairly
consistent even when parameters were varied such as the method used, the girder member
42

analyzed, and the cement coefficient multiplier considered which accounts for the concrete
hardening rate and the average daily temperature (see Equation 4.15).
The percentage difference in camber between the end supported case and the actual
supported case had an average value of 85.53% with a standard deviation of ±0.47% (see Table
4.2). By incorporating this adjustment to the measured cambers, all of the members could be
treated as if they were simply supported at the ends when calculating long-term camber. Using
this approximation to account for the supports simplified the analysis used in the program
"CRACK," as well as the other methods used. "CRACK" can handle performing analyses of
cantilevered beam members and simply supported members only. All other cases have to be
adjusted to these types of members, such as using separate analyses for the overhangs.
Graphs and tables of the four different approaches to measuring camber are displayed in
Figures 4.2 through 4.9 and Table 4.3. In general, the methods resulted in reasonable estimations
of the camber for the sections considered. As mentioned previously, the initial camber value
calculated at release was used in the long-term calculations. This initial calculated value varied
considerably from the measured initial camber for many of the girders.
It should be noted that the scale in Figures 4.2 through 4.9 has been exaggerated in the y-
direction in order to fully display differences between each of the methods. The graphs show the
centerline plots over time for members from Bridge 19045 series of 139 foot long, 72 inch deep
girders. Since the centerline plot contained the largest camber values, these were the only values
plotted.
Several comments can be made about the graphs and the results that were determined
from this analysis. The measured data looks reasonable with time when compared to other
research such as that done at the University of Iowa [7] and the University of Texas [6].
Fluctuations in data, or times when the deflections appear to change in their direction of growth
over time, were apparent in their data as well. The deflection fluctuations in the girder were
partly due to temperature gradients caused by solar heating of the top flange. It can be assumed
43

that this is the largest contributing factor to the consistent "dip" at about 35 days in Figures 4.2 to
4.9. The peak that occurs consistently happened on a partly cloudy afternoon, whereas the dip in
these graphs occurs at mid-morning on a cloudy day. It will be shown in Chapter 5 that these
circumstances in temperature could have resulted in the "dip" that was as large as one-half inch
in camber.
Another possible source for the fluctuation in the data could be due to the level of
precision in determining the camber. Because of storage limitations in the field, data had to be
collected while setting up the level at one end of the girder for several of the members. Thus,
readings were difficult to measure to the millimeter while set up at approximately 140 feet away
from the far end. Data was carefully examined after being taken in order to eliminate as much of
this problem as possible by looking at plots of the camber along the length for each set of
readings. In the next paragraphs, conclusions will be made regarding each of the methods
considered.
Results of the PCI Method
In evaluating the PCI method, it was found that the method tended to slightly
overestimate the long-term camber -- especially at the 45 day erection stage. As was mentioned
earlier, the plots for the PCI method could be oriented with a smoother transition shape passing
through the points shown in Figures 4.2 to 4.9 in order to better approximate the actual centerline
plot with time. Since no method for determining this shape was suggested by the PCI Design
Handbook, only the three points were plotted. This resulted in underestimation of camber in the
early ages of the concrete (5 to 45 days). Table 4.3 shows the overall averages for the difference
between the modified measured results and the calculated values at discrete time intervals. Since
the PCI Multiplier Method only predicts three points in time (the initial, erection (45 days), and
the final deflection for the member) a fair assessment of the overall deviation with respect to the
measured data was difficult. The overall deviation that is shown in this table represents an
absolute value deviation with respect to the measured field data after 45 days. Even with this
44

assessment of the PCI Multiplier Method, it still had the largest overall deviation with respect to
the other methods, and in each case overpredicted the camber at erection and final conditions.
Results ofBranson's approximate time step method
Branson's approximate time step method gave the lowest long-term camber predictions
on average of the four methods considered. It had a range of deviation of ± 11% with an average
of 8%. This percentage may seem significant, but when a camber of around four inches is
considered this is less than a half an inch at maximum deviation from the actual measured data.
There was little consistency as to estimating the camber above or below the actual data.
A few qualifications should be made, however, in order to put this interpretation into
perspective. Not all of the factors used in Branson's equation were used in the analysis because
no superimposed loads were applied to the section. It was mentioned earlier that the coefficient
kr, which appears in all factors except the live load deflection factor, has been questioned by
Tadros et al. and others (see "Branson et al. Approximate Time-step Method").
Results using the program "CRACK"
The program "CRACK" gave reasonable results when considered in an overall fashion.
Figures 4.2 through 4.9 compare the results with the measured data and the other methods. The
CEB-FIP and the ACI committee models used with "CRACK" are represented respectively at
data points with squares and slashes. The ACI 435R-95 and ACI 209R-92 committee
recommendations produced the best overall results of the two model codes used with "CRACK."
The largest source of error for the CEB-FIP model code came in the evaluation of girder
members B13 and B14 of Bridge 19045 (see Figures 4.4 and 4.5).
The source of difference was with respect to the creep coefficient for these two members.
The CEB-FIP code uses a varying modulus of elasticity with time for determination of creep
with respect to the 28-day modulus. These members were not released until three days after the
45

casting date because they were cast on a Friday afternoon. As such, the calculated ratio for the
modulus of elasticity with respect to release and 28 days was considerably higher than that of the
other members. (Mokhtarzadeh et al. found that these values should be close to one another,
consequently the 28-day modulus of elasticity was used at all ages for all methods except CEB-
FIP.) Because this value is relied upon heavily in the creep function of the CEB-FIP model code,
the model appears to overestimate the creep multiplier. Thus, overestimating the camber for the
section. The reason for the overestimation can be understood by looking at the form of Equation
4.14. This problem with determining creep did not occur in the other methods observed as can
be seen from the figures listed above. As such, the conclusion can be drawn that this is a unique
problem to the model code CEB-FIP.
Results considering members cast on the same bed
As was mentioned in the introduction, more than one member was usually cast on the
same bed; thus, both should have about the same strand stress. Even if the assumed initial stress
was different than the design, both of these members should have the same stress in the section.
If the concrete strengths were close to each other and the geometry of both members were the
same, both girders should have similar amounts of deflection. This rule was generally true for all
of the girders. This trend can be seen not only for the girders of Bridge 19045, but also in the
girders from the other bridges. Plots of the measured camber for members cast on the same bed
can be seen in Figures 4.10 -4.13. As can be seen, some discrepancy was noticed in the
results due to varying concrete strengths, but can be accounted for. In Figures 4.10 and 4.11, the
concrete strengths for each member shown were comparable. The data shown in Figure 4.10 was
for two girders with five day concrete compressive strengths of 7900 psi and 8200 psi. Both
members shown in Figure 4.11 had concrete strengths of 9550+. In Figures 4.12 and 4.13, the
concrete strengths for B16-S2 and B17-S2 are also shown with a plus sign behind the number.
This mark is shown because the concrete cylinder was not tested beyond this strength for
compression due to testing equipment limitations. Thus it should be realized that the strength
may be much higher than that indicated.
46

Sensitivity Analysis
After having performed the long-term analysis, a sensitivity analysis was performed for
the long-term factors. The program "CRACK" was used for the analysis because it used the
most thorough analysis. The ACI Model Code was used with "CRACK" because it gave the best
results in the long-term analysis. The sensitivity analysis led to some interesting conclusions
regarding the initial project and the current model codes that are used. These results and possible
explanations of the results will be discussed in the last chapter. In this section, the results of the
long-term parametric study are presented. Table 4.4 lists variations to the base case over a 155
day period from the release of member B 18-S2 of Bridge 19045. Girder B 18-S2 was chosen for
the analysis simply because it had some of the most complete data of the members analyzed. An
explanation of the base case, as well as the variations, follows.
The base case for the long-term sensitivity analysis used the material properties assumed
for short-term analysis of the base case. One exception to this statement would be that the actual
28-day strength of the member was used in determining the modulus of elasticity for the girder
throughout the entire time history as opposed to the design 28-day strength. It was decided,
based on the research of Mokhtarzadeh et al., that using the modulus of elasticity calculated from
a concrete strength of 28 days would reflect the overall actual modulus of elasticity the most
accurately. Ali Mokhtarzadeh et al.'s research found that 95% of the modulus of elasticity is
developed in the first day of curing. Thus, leading to the conclusion that varying the modulus of
elasticity over the time history is not necessary. Long-term factors for the base case were as
follows:
* Relative Humidity was assumed to be 72%(from AASHTO charts on average relative humidity in the U. S.)
* Measured slump of the concrete was used (around 5.5 inches)
* Measured % fines were used (about 50% fines)
* ACI averaged ultimate creep factor was used before applyingmaterial factors (Cu = 2.35)
47

* ACI averaged shrinkage strain was used before applying
material factors (s, = 780 * 10-6 * in / in )
* Low relaxation stress-relieved strands were assumed (as in design)
These base case assumptions were not only used in the parametric study, but were also the
assumptions that were used in the analysis for "CRACK" using the ACI model codes [2,8].
The variations for the long-term analysis were chosen to understand the influence of
possible ranges of input to the base case. Variation #1 consisted of increasing the relative
humidity from 72% to 82%. The actual relative humidity for the Bridge 19045 girders from
release until the end of the time period considered was around 84%. As such, a change of 10% in
relative humidity to 82% was used for this variation. By increasing the relative humidity to 82%,
a minor decrease in the calculated camber of 2% was noticed. This was consistent with the logic
that a larger relative humidity decreases the shrinkage in the member, but the effect was
considered to be minor.
Variation #2 consisted of changing the design slump of the concrete mix in order to
account for possible mix variations other than the averaged values. The slump test, as
summarized from ASTM C-143, is a test for the determination of the water content of a mix. A
steel cone shaped mold with a base is filled with concrete and "tamped" with a rod. Tamping is
the process of packing the concrete mix into the container to remove possible air pockets in the
cement mix. After the concrete completely fills the cone and is leveled, the cone is removed.
The difference in height between the top of the cone and the concrete after it has fallen is the
slump of the mix. The lower the slump, the stiffer the mix and vice versa. Thus, by increasing
the slump by 1 inch in this variation, the mix becomes less stiff. The ACI 209R model accounts
for the water content with a factor that is multiplied to the shrinkage and creep coefficients based
on the concrete slump. With a higher water content, it was expected that there would be a larger
amount of shrinkage in the member. The camber in the parametric study increased an average
value of 1.5%, indicating that the effect, according to the ACI model, is minimal.
48

The next variation was the use of the initial strength based modulus of elasticity over the
time period. This variation was unrealistic because the actual modulus of elasticity is actually
greater than the initial modulus of elasticity throughout the majority of the time history. The
method actually recommended by ACI 209 recommends varying the modulus of elasticity with
time. Variation #3 did show how important it was to use a close approximation to the actual
modulus of elasticity for the member. The error in using this variation was very high and
unrealistic, but did approximate the initial and early stages of camber most accurately (see Figure
4.14). However, it should be noted that this increased accuracy was only seen in the Bridge
19045 girder set. Other measured data (from Bridges 49535 and 27624) indicated that the
calculated camber was already greater than measured when the 28-day strength was used. In this
case, a lower modulus would induce more error in the initial calculated camber. Because of the
lack of actual data with regard to support conditions, these bridge members were not compared
for long-term effects to calculation methods.
Variation #4 consisted of changing the percent of fine materials by weight in the mix.
Fine materials are normally associated with sand materials. By increasing the fines in the section
from 50% to 60%, very little difference in the camber was anticipated by the ACI model. As
such, this factor was not considered to be critical as can be seen in Table 4.4.
Variation #5 consisted of changing from the use of the averaged ultimate shrinkage strain
(780 * 10.6 in/in) to the low end of the recommended shrinkage strain values produced from
past testing. This range was outlined in ACI 209R-92 [2] and had a value of 730 * 10.6 in/in.
This low end value had all of the ACI 209R correction factors for shrinkage applied to it that
were used in the original analysis for reflecting the member properties. From the long-term
sensitivity analysis, it was apparent that this does not cause a significant change. A difference of
0.3% was determined, as can be seen in Table 4.4.
Variation #6 consisted of changing from using low relaxation strands to stress relieved
strands. This was done to quantify the differences between the strand types. The results shown
in Table 4.4 with regards to the long-term camber sensitivity analysis are clear. This change
49

decreased the camber by 10% and gives an idea of the anticipated effect of using one strand type
over the other.
Variation #7 consisted of changing from the use of the averaged ultimate creep multiplier
of 2.35 to a value of 2. By making this change in creep factor, the camber decreased by 4%
from the base case. This variation had a relatively small effect (<5%) and in all likelihood was
not the only contributing source of fluctuation in the results; however, it did come nearest to
modeling the actual long-term camber beyond the 28-day period for girder B18-S2. This was not
necessarily the case with all the girder members from Bridge 19045, but was a general trend for
many of the actual measurements from girders of that bridge.
In conclusion, the variations had little effect with a few exceptions. These exceptions
included: using the initial modulus of elasticity, changing the strand type, and changing the
ultimate creep factor to 2. This indicates the importance of calculating a reasonable value for the
modulus of elasticity of the section. It is this variation that proved to be the most plausible
source of error in the long term study. In retrospect, using laboratory measured values for the
modulus of elasticity would have been beneficial for comparisons of the methods instead of
using an equation estimated value based on the concrete compressive strength.
50

Chapter Five - Thermal Effects
During long-term camber measurements of Bridge 19045 members, a peak reading
followed by a dip was observed (Figures 4.2 and 4.9). Other member series (e.g. Bridges 29535
and 27624) did not experience the same dip; however, they did exhibit some fluctuation of camber
with time. The peculiarity in Bridge 19045 members was attributed partly to thermal effects.
In the sensitivity analysis of Chapter 3, gradient or parabolic thermal distributions were
observed to have a significant affect on camber in comparison with changes due to ambient air
temperatures. For the members of Bridge 19045, data before the peak was taken at 10:00 am on
a cloudy day with an ambient temperature of 320 F. The peak in the data occurred at 1:00 pm on
a partly-sunny day with an ambient temperature of 320 F, and the dip in data occurred at 11:00 am
on a cloudy day with an ambient temperature of 340 F. As evident from these observations, the
variations in camber correlated with the degree of solar radiation.
To investigate this phenomenon further, a one-day thermal analysis was conducted on a
member from Bridge 86512. The girder had a depth of 72 inches and a length of 128.5 feet
(approximately 10 feet shorter than Bridge 19045 members). Over an 8 hour period, the camber
was observed to increase by over 1.5 inches (Figures 5.1 and 5.2). The corresponding girder
temperatures, measured with a thermometer on the top of the girder, increased from 80-1100 F
due to solar radiation (see Figure 5.3). This led to the conclusion that a 340 F temperature
change due to solar heating of the top flange of the member could cause an additional camber of
0.5 inches for the members studied.
Related Thermal Research
Much work has been done by Kelly et al. [6] in relation to thermal gradients in concrete
members. When measuring temperatures internally and externally using thermocouples on the
section, Kelly et al. found that in the morning the temperature of the concrete was warmer than
51

the ambient air temperature and that by late afternoon the reverse was true. They also noticed
that the temperature of the girder, after already being put into place in the structural system, had a
maximum temperature variation along the cross section of about 150 F during a hot summer day.
From their plots, it can also be seen that the temperature varied along the span in a nonlinear
fashion. However, it should be noted that the temperature variations were determined in the State
of Texas which generally is warmer than Minnesota.
Ghali and Favre have suggested a method for accounting for nonlinear thermal gradient
changes in concrete members [3, pages 23 -27]. Since the members under consideration were
simply supported, no indeterminate thermal effects need be considered. As mentioned previously
in Chapter 3, the Ghali et al. method uses both a free thermal expansion factor and a self
equilibrating factor to determine the strain in the section. Ghali's thermal analysis was based on
using the strain and curvature caused by the nonlinear gradient to calculate the camber in the
section (Figure 3.3) . The strains and curvature were determined in a similar fashion to that
outlined in Chapter 4 for the program "CRACK."
This method for determining the thermal deflection in the section was checked by using
Ghali et al's method. Since Ghali and Favre's text [3] prescribed no function to model the
distribution curve of the thermal strains they recommended (Figure 3.1), a function was created
that appears similar to that of the strain distribution shown by Ghali and Favre. The shape that
they suggest for the thermal distribution was arbitrary, but appears reasonable with respect to data
collected by Kelly et al [6]. The results of this analysis led to an estimated maximum thermal
increase in camber of 0.25 inches as opposed to the measured thermal increase in camber of
around 0.5 inches over one day.
In conclusion, the thermal influences are more than adequate to account for deviations in
the camber change over time for the data collected. This was recognized in the one day field data
study in addition to calculations that were made to approximate this effect. Thus, data and the
results thereof must be assessed with the consideration that thermal effects will result in as much
as a 10% change in camber on a given day.
52

Chapter Six - Conclusions
In this chapter, the overall conclusions to the project will be presented. Because most of
the results for the project have been discussed in their respective chapters, this chapter will focus
on considering the findings and interpretations of the data collected as well as past interpretations
from other research projects.
In Kelly et al.'s work [6], they found that the PCI method generally overestimated camber
for the section. This conclusion was also determined in this research (see Figures 4.2 to 4.9).
Naaman commented in his text [5] that Branson's approximate time-step method appeared to
underestimate the camber. In some cases Branson's approximate approach closely reflected that
of the measured camber that was calibrated to a simply supported case. But as previously
mentioned, the method has been questioned by Tadros et al. and others for the way it considers
partially prestressed members (see Chapter 4). Since none of the members analyzed in this project
contained a significant amount ofnonprestressed reinforcement, no conclusions were drawn from
this research with regards to accuracy in determining camber for partially prestressed members.
The short-term analysis results proved to be quite reasonable when an overall perspective
is used. Members from Bridge 27112 had a large difference in camber between the calculated and
measured, but that was mainly due to a lack of field data for the pick-up and set-down of the
members to relieve possible friction between the bed and the member.
From the study, the following conclusions were found:
* The assumed prestress force will have one of the largest effects on camber in thesection. A 5 % variation in prestress force can change the camber by 10-16%.
* An accurate assessment of the actual modulus of elasticity would contribute to abetter assessment of the actual camber.
* If consideration for thermal properties is given, it is difficult to predict the slopeand size of the gradient. Based on the measured data, estimates of thermal effectrange from 8 - 12% for a 200 F variation in temperature over the cross section.
53

* The effect of solar radiation measured in the field over a one day period was 11%from the beginning of the day to the peak of the camber change. Thiscorresponded to a 300 F temperature change on the top of the girder throughoutthe day.
* Using the transformed moment of inertia versus the gross moment of inertia of theconcrete decreased the camber by 10 to 17% . This range depends on the size ofthe member and the density of steel.
* Branson's approximate time-step approach resulted in the closest approximationsto the measured cambers. This conclusion must be considered with the realizationthat only a few methods were used and only a few types of prestressed memberswere incorporated; specifically, the members contained a minimum amount ofnonprestressed steel.
* On average, a deviation from the actual camber by using the approximate methodor the program "CRACK" with the ACI model code long term factors is expectedto be around 10 to 15% variation.
* Friction losses between the bed and the member immediately after release rangedfrom 5 to 20%, with an average value of 12%. Note that because the lift hookswere located a distance from the end of the member, the friction of the bed causedgreater cambers than would have been observed in a frictionless bed.
* Girders cast on the same bed with the same strands and patterns had an initialcamber difference of 2 to 10%. One possible explanation for part of thisdifference is the variance in concrete strengths.
* Measured camber for the members of Bridge 19045 had a scatter in the data of 1inch in the long term analysis. This scatter was partly a result of materialvariances (examples: concrete strength, modulus of elasticity, and strand stress).environmental issues also contributed to the scatter of the data (examples:weather on day of casting, and storage location for the member). A plot of thisscatter in the data can be seen in Figure 6.1.
* From the Sensitivity Analyses the following had little effect on thecalculated camber:
- Changing the steel modulus of elasticity by 500 ksi- Changing the concrete weight by 5 lb/ft3
- Changing the length of the beam or location of the draping point by 1 ft- Constant thermal expansion- Increasing the relative humidity by 10%- Increasing the percentage of fines in the mix- Using a 1 inch larger slump for the concrete mix
54

* The parameters which had the greatest effect on the calculated cambers were:- Changing the initial jacking ratio by 5%- Using the transformed moment of inertia vs. gross moment of inertia- Assuming 28-day modulus of elasticity at release- Changing the assumed ultimate creep (2 vs. 2.35) had a significant effect
on long-term cambers
Using best estimations for section and material properties, the ratio of calculated to
measured initial cambers differed by up to 20% (Appendix D). This difference increased up to
40% in cases where the camber was measured before pick/up set/down (attributed to friction
between the girder and the bed). Although these percentages seem high, they represent camber
differences of less than 0.5 in.
Measured cambers were observed to differ even for similar girders cast together on the
same bed. These differences ranged up to 0.5 in. (over time these differences increased up to
0.75 in. in some cases). Typically this difference was less than 0.25 in. In addition, solar radiation
had a significant effect on the results. Camber measured for a single girder had a variance of 0.5
in. monitored over a single day.
It is recommended that when using the PCI Method, Branson's Approximate Time Step
Method, and the program "CRACK" by Ghali et al., careful consideration of the conclusions
drawn above should be employed. Further, the modeling equations for the material properties
that are used with these methods should be reevaluated in light of new research as to their
accuracy. In general, the PCI Method, although simple, gave reasonable long-term camber results
compared with the more detailed methods.
55

56

References
1. Nawy, Edward G., Prestressed Concrete - A Fundamental Approach. Prentice Hall.Englewood Cliffs, New Jersey. 1989.
2. American Concrete Institute Committee 209. ACI 209R-92 - Prediction of CreepShrinkage, and Temperature Effects in Concrete Structures. American Concrete Institute.Detroit, Michigan. 1992.
3. Ghali, A. and Favre, R. Concrete Structures: Stress and Deformations. Chapman and Hall.New York, New York. 1986.
4. PCI Industry Handbook Committee. PCI Design Handbook - Precast and PrestressedConcrete (4th ed.). Precast/Prestressed Concrete Institute, Chicago, Illinois. 1992.
5. Naaman, Antoine E. Prestressed Concrete Analysis and Design - Fundamentals. McGraw-Hill, Inc. New York, New York. 1982.
6. Kelly, D.J., Bradberry, T.E. Breen, J.E. Time Dependent Deflections ofPretensionedBeams. Center for Transportation Research. Austin, Texas. 1987.
7. Branson, D.E. Meyers, B.L. Kripanaryann, K.M. Loss of Prestress, Camber, and Deflectionof Non-Composite Structures and Composite Structures Using Different Weight Concretes.University of Iowa. Iowa City, Iowa. 1970.
8. American Concrete Institute Committee 435. ACI 435R-95 - Control of Deflections inConcrete Structures. American Concrete Institute. Detroit, Michigan. 1995.
9. Nilson, Arthur H. Design of Prestressed Concrete - Second Edition. John Wiley & SonsInc. New York, New York. 1987.
10. Libby, James R. Modem Prestressed Concrete: Design Principles and Construction MethodsVan Nostrand Reinhold. New York, New York. 1990.
57

11. Collins and Mitchell. Prestressed Concrete Structures Englewood Cliffs. New Jersey.1991.
12. Ghali. Users Manual and Computer Program CRACK Department of Civil Engineering.Alberta, Canada. 1991.
13. Martin, Leslie D. PCI Journal "A Rational Method for Estimating Camber and Deflectionof Precast Prestressed Members." PCI Journal Publications. January/February 1977.
58

0 R^l 0"., nd) ·w r,00'> o' I\
toS ~ t Cn C)^ * -Lr
I, I 0
a)r
3d L0C 'O ^j- OOO
d sl
,-4-A
^_>q
cn CA C, n CC
4-)
- cj
CA)
U I
---- -- --
1 Ir? d ·1 ,
r~root - a5
34\ o\ 5
bJQD ±^^i - ^ip^ -' ^
CIS
seaQ) 0 Cb
tja)
f-y- - - - - -^ - cj3
-c))
5C r r __ C\
a^ EaP-< ^ -,
CZ , C w^ ir^m · · c~l II- O ^r ^r ^ oo a )
00E0
Itl sa Cl- *
s- § r
§0 0 ~ g c ^q) Q)
<
C § -S)c\ 'CQ^ ( ^^- M r-
59
0t
20l
H

• O • . D G , SP,
c>
> 0 -i > Q.c i " z -- N
<
0 CZ O CSr-
caN
>CC1CO - isF S ^ O '" 0
! ?
i ON c 00
O ~ CO00 00
0 0 O
C) r: ) q r d
CO l^ 00 CO 0
> C o
co -c cC
0000 O
O C 0 ' * 0C 00
'*0 '^-f c - S -^ (N <^ .
u
CO UO 00
> u 0) 09
O GO C >0
C 00 00r
0) .CO^ 0
(N -^ 0
O 00 ^
§ O^0 0
.f,
- ON NO^
fe ~-3^ - (N - °
O 000) -,
> -s
O 00 8,0Oc C-o s*" ^
c
'I~~ N2
-^ c
m 0 0. .q 0 0
6> -
QA
~I
fi
hD g&C d)5 2
o .S
^^ E
1 e"
cf) O»i fi
c, E
r^Q)
CIC
CI·c
60
-0.,.-,0 .
0) - .2 0.
Co coz•• .
• CO-•. ~ 0 0- COC, ON
a. -) _
.- CZ ,, 00 -P,z r-
V CO3
-- C
4-4 ll cz s
COCO0.40 cq cNO ON
CO= O 00 _;> ^ 0 C14cu c- CO)" 'C.1 w0 I-co 0 0. 0C0
C)
> tn"
S00 -00 ON N NO
CO ^) '-
CO tl 0 Z C O 0-> C) CB. O
00C0
~000.9 (
6>
- -
CO .0 l s.O' C C
*S CS0 0.
> U< )
', .C O° ^'«C^
S-0
'$' § 0 0 O0
00
> u u~
Ot .- o (N> NO
CCO.9cz 0 (N 0. CO oN N '=& 6 6
>CO
/N (N c
( IN
o ^ o ?^ 5^
ON N
o N
0 0 0
rI
6m
ccurcsQ)
err

0N bo
oA oo ^ .a a e|Cl
? C& 00 -
(N
v~ as oo
ClP
NYj
^? ^o c^ c <
00 Cl r -^- Cl Cl L
Clqo) 00 00.
N -w-
t^ oo oo o^ 5
- C^ CS riMT M
C .
-* C-ClA
? e ^0
4 °i j v; §
c ~ o . o
af > S3
Cl "|Clt
Cl S
CI) oX
CCl b* U,
C/3 \o r/3 g '
ClC
CI) CZ
-~ C l U,
-;Q <N Q -
0\ 5 0
^ *§
0 c. t O 0
3- (S Q) r; ;
m ^^ c/3< 8o
- I05 --=;-<^ , ^) ^ <U o3 05 ^*
61
CI)
0
r•
N
1H
H\
Q)

c 00 N
00
C1,14 00 C000 00 tr)00
0 Cl
5 00O 00 ^- I
00tr)cq) 0 C 0OW N N 0
C) 00 Cl
-T C - -
rr--4
C)2
6K)
O Cl1 1/
M 0 00
00
C11
cc~0
cn cn
V --
0) vs ser
~~rJ 00
5' Cl a<V 0 00 L00 ~ ..
I ---
'II. __________ .
(S cti M
-
- It
^ 00l 00 (S w C
l - -
^ ------ - -r
Cr 3 ^3
* ~ a)'§ 00 oo en CA ^
*' ~ i * * \0HZ
______________ < c^$O
a)
~^
C^ 00 T3cC < >
ctlig;p|>".§^r|OQPU
00Cie)
(NI . N N
CIr3
0 N 00
00
--
ICI
SC 00I> --- -------.
S CMl m
o -
0 0 00 0 S
C. l C l 5
- )a (-2
E Is
Jllcp;
62
*-i
0
0,o-
a)
0

o (I -m
- c c - ^
tr)Ci)
00c 00 0 0
=tn
000
<u r?
0 N) - 00
ci c^ -i ^
k ci c
C*1
< cP
Cct
CI ------ N-- ---
1 (N - ci
H- ________ ___ _
0 ^0 ^S r* 0 <^
O j-ljlis ? Ov, pI ii^gi"~~~~c ssi c'>-o _____ ______________
H
63
00i
49 o~ d
S0 00 O~qON ON6 6
O N 00 O
00 ~N- 6 6
000
Ct-
kn c^ ^3 <u^ O ^ g (U ^ gO §
Is ~ ~ C §*1 1 ';d Cg> <>& 5t
In
en
rdIti
ۥ
I
C/3
Cd0
C)
01
O o
cz *
- C
2 0
O a,· e E
* '-
*l
MO rd'€1u .2
c^ '
Bot^ P
H P1kX
*X-

00-r ,
S 00000
M ClN -
C C
>0 N
*I w
3I 1 --- I --- I -----c« Cj
V1
000
ra
ON
0 0C
000
- -l00
Cle
ON
er Uo U PF9r ,91
0\
rQ
64

0000
tr)
P c- oo
clmo
Qm
Q) C4 ^ (^
^w^"0 --------------
^Pffl
^ m m>tf tC Le °°
^ (S 0 T
c ?l| iI cllsi^
NCN
00
kr 0
0 0r? ^
ZCON
qctQ)CN
SzD
cr.
*» Cl2 °
-+
^g ________^ ^0c^ o r 0
65

Table 4.1 PCI Multipliers to Estimate Long-Term Cambers and Deflections[Reference 4: Table 4.6.2]
At erection:
(1) Deflection (downward) component-apply to the elasticdeflection due to the member weight at release of prestress
(2) Camber (upward) component-apply to the elasticcamber due to prestress at the time of release of prestress
Final:
(3) Deflection (downward) component-apply to the elasticdeflection due to the member weight at release of prestress
(4) Camber (upward) component-apply to the elastic camberdue to prestress at the time of release of prestress
(5) Deflection (downward)-apply to elastic deflection due tosuperimposed dead load only
(6) Deflection (downward)--apply to elastic deflection caused bythe composite topping
66
WithoutComposite
Topping
1.85
1.80
2.70
2.45
3.00
WithCompositeTopping
1.85
1.80
2.40
2.20
3.00
2.30

Table 4.2 Camber Reduction Considering Support Conditions (using various modeling assumptions)
Bridge 19045, Girder B18-S2Cement Coefficient Multiplier = 2.0, using CEB-FIP Model Code
Calc. CambersCalc. Cambers Supported at Percent Reduction
Concrete Supported at Location Measured of CamberAge Ends Relative to the Ends for Correlation of
(days) (inches) (inches) Support Conditions0.75 2.31 2.682.75 3.20 3.73 85.81
15.75 3.68 4.30 85.4928.75 3.90 4.58 85.3436.75 4.00 4.69 85.2861.75 4.19 4.92 85.14
Average Difference = 85.41
Bridge 19045, Girder B18-S2Cement Coefficient Multiplier = 1.0, using CEB-FIP Model Code
Calc. CambersCalc. Cambers Supported at Percent Reduction
Concrete Supported at Location Measured of CamberAge Ends Relative to the Ends for Correlation of
(days) (inches) (inches) Support Conditions0.75 2.31 2.682.75 2.98 3.46 86.00
15.75 3.25 3.79 85.7628.75 3.40 3.97 85.6536.75 3.46 4.05 85.6061.75 3.61 4.23 85.49
Average Difference = 85.70
Bridge 19045, Girder B18-S2Using ACI 209R & 435R Recommendations
Calc. CambersCalc. Cambers Supported at Percent Reduction
Concrete Supported at Location Measured of CamberAge Ends Relative to the Ends for Correlation of
(days) (inches) (inches) Support Conditions0.75 2.27 2.632.75 2.68 3.11 85.9415.75 3.23 3.78 85.6028.75 3.45 4.03 85.4436.75 3.53 4.14 85.3761.75 3.70 4.34 85.20
Average Difference = 85.51
Bridge 19045, Girder B11-S2Cement Coefficient Multiplier = 1.0, using CEB-FIP Model Code
Calc. CambersCalc. Cambers Supported at Percent Reduction
Concrete Supported at Location Measured of CamberAge Ends Relative to the Ends for Correlation of
(days) (inches) (inches) Support Conditions0.75 2.31 2.695.75 3.07 3.58 85.76
21.75 3.33 3.89 85.5534.75 3.45 4.04 85.4742.75 3.51 4.11 85.4267.75 3.65 4.27 85.33
Overall Average Difference= 85.53
67
[1 Average Difference = 85.51 11

a)
Cl3
C&
clC3
0
"0
0a0Q
*0
U
E"*S
E
0
Q0n
D
cB
0
0
E
0
I-
0
I-
00
(0
0
a
0
0
0
0
0!
cn
1o(Se0
>
CNCO
I
(0
c1
li-
Cl)
CDcfl(M
LO
T-
CN
CO
c4
CM
cOCD..... M....
c0
0)
0
-c0
(0
od CD0 C4
o0
000
co -
0o<
0 C6
O C
C) CM
C(N-
CN-r"-0
-o
C-0)
0 I-
0,
O
r-
a
C)
cv
U)
01s -
OD
CN(N»
0
.c
a ,-0.
E OE0
0.
dm
K C
Is
0)
5 ®
9-
0
C)Oa
00
LO
cd
CD
a0
CN
0)
CD
0)(5U)»
0O,-o
0L-
.5
0)
cu
(a
co
E
-
-f
.2
a)
0
0)0
0)
0
0)
0
-°
a)
L-a)
0)
0)
0
C
0)
S-
t3Lc
-ico
68
-o
0)
o
c
L-
Q-(0)
c,CO l)
0) 0
QE
la)
cuCD
.CO0 a0 c05E0 )
a-
0) CU
E4» x
cO 0
) Q)
q CU
0)0),
0)
li 1 -1% __j

V(D
C=
D COo amoE 5E0
Co
a)
0b)
en
CL
'o
L
00
(:
2
u)
ao
CD
CUE- CU
SOc,
, o
o Em
<D
0o ca
oo ) o
c Tc
o " .-E Ic so
> co: co -
- r.- Co
C 0-
*3 Z U
COxQ>z7
CC U
> 0g 0
( (0
OO nV
oCo
> (U
C c mor oO
- 0(00 CI)0~) LO
N0o mc6CNom)(O
CMUO)t-UCO%4(D C
(N (0NIT LO (C0 00Oc\io cY (Y) ct cIT o v
CU) 0 (D O<D C v- CO<D Irq0n4MM00M L MOqO-r q
C-4 C CN CM C6 COi CO\ CO0 CO C) M CL(O CO C
CM C0M CO ) 6 CO) C CO
(ONcNOLO ONM0)0
rcovcocoo0
CM docr C
M (MON 0) U)
ICC CM 7 M0MoCMeLvC
CCCC C C oC
0iOO er
NFOCM C O <C i
ac
EO
CD
a
uiCO
IU00
(D (0 N r^-
>) -Cq CD (6V- -s u mmetwdome o c)
(I-
0,0nCUr
C.
0 0 ( m0 0• L 0
oN ONN•C•00O cC•N ) O (0CO 0CD
O C I I ICM C IC
0CMI
ca(DCU
SN Co (D 0) LO
69
Co
Co
>.
0
o)
0.'-Cw -CLOMlOL O C(oCo) 0C e n0o C0
-D(0CMO 0OO(CMCO.'-LO)M 0 CY)
bod6oooooi-c o
I I V- T-- V- N N l
o§-o oCooooo 0
0 d 0 0 0 0 00 dr O
(C N-O C.' CN v- v Vr- CO
0••• • v·rT:TT'c
•o o •
0C
0
0
c,
-0
o
CD
Cu
o
2
E>
c
0
CO
0
o
0a(a,
0CU(1)
E
a=
oE
-o
-o
CC
!:--
.9
o
I
=_
0 C• U3 •0 tO v'- t'-. •3v-- C• 09 £00• uO L-
I

70

y
x xH9 p
(a)
p cgc (also cgs)
(b)
(c)
SP Pec Mc
(d) A I I
Figure 1.1 Concrete Stress Distribution in Rectangular Beam with Straight Tendon[Reference 1: Figure 1.2][Reference 1: Figure 1.2]
71
200,

C.G. of section
Straight strands
A = Poee2
8El
Q
eeP I P
0 0
e'
Single point depressed
PeeI2
8ElPoe' 2
12EI
P00
Two point depressed
AT= Peef +Pe' i8El El 8
a61
Figure 3.1 Camber Equations for Typical Strand Profiles[Reference 4: Figure 4.10.14]
72
1
FI
.==L
I
L

M =Pe
' The tabulated values apply to the effects of prestressing. By adjusting the directional rotation, they may also be used for the effects of loads.
For patterns 4-11, superimpose on 1, 2, or 3 for other C.G. locations.
Figure 3.2 Camber and Rotation Coefficients for Prestress Force and Loads[Reference 4: Design Aid 11.1.4]
73
(I . ---- G-- -- p
- - - . .. . .-eP
12) - / -P C.G.---- C.G.---e
p I --- p

Heat lossby radiation
t
Convectiveheat gainedor lost to air
SunReflectedsolarradiation ncident
IncidentS solarradiationI
Absorbed1V ,solar radiation
Heat producedby hydrationof cement(at early age)
Temperature
T-- top-I
TbotTbot8
Strain
Cat Ttopl
_t Tbot(Zt T bot
-Ttop-
"Actuolstrain
Tbot
trnin
OCt bot
Figure 3.3 Beam Strain and Stress Distribution due to Linear or Nonlinear TemperatureVariation through Depth [Reference 3: Figures 9.1 and 9.2]
74
Stress
Nostress
Tbot )
a" t Ttopj
0 W•O· %owl Wifei a
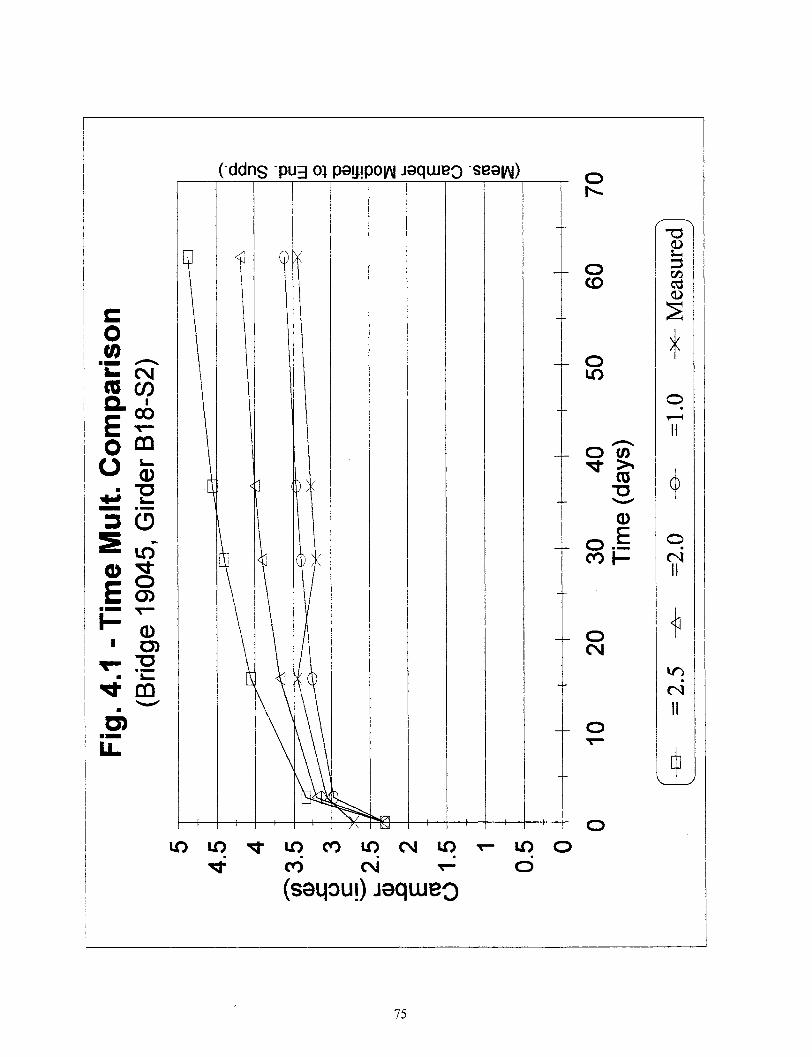
I10 ^- C ou CJ L - 0
(seq3ul) jeqwueo
75
0
c
2 fmC"0
U)
. e
m CE-
G)E cD
ULil
0
c0
L)
0CO
0
0d
*
ei
I'f
0
I

(sau!) Caqlue(saqoui) jiaqweo
C4Uf)
-0
0I
m
L.
-Q
EC4
j
(0dI
ii:C\M
LO
Uo
a)C10
CU
>)
E40
E0 O
C\1
76
0U)
0ml
=0)
a)20
U)
ar
0)
LC
oa
0oC
. o
O Om CD
W L.LD s03 ^»t O o
n v
i
10
IL
i
f

UTO ) ()
(saqou!) jeqwueo
r)
01)
10CM
>
0
S0
E-0
LO>
0mo
I0-
L.0E(0
.0
U-IU-- _
0
N
LOq e-
40)
C)1
o0-
CL
I-»
(aoaC
0
(1)(0U)
0
77
oo" owodD c)
m
W O+^ ^
oL S o2 n cV
U)(N
LO*

(4Cf)
0
U-
-QE
(L
I
ii:
LO
0C)
Lr
0 )
0o
EO)
EC)
LO
CD
0CN
0:
C)
o O
or
a :
0
T <
Cog0 *omo
t1 2
(0 r>
I?
A:S
78
(Y) NCq )
(s9LpuI) iaqwue~
caro0
c)
C)0
L)
I
~-------

LO
COj
CO
(seqou!) ajqweo
0(DVm.
C)
Um
LI
4)
&I
Im0
EO0
I
.0 )U-
CMLOCC(NJ
0
0
Cl)
(I)
m
a)
E0
C)
0
C)
0
79
('
Q)cnCO)ma)
.c730)
-
2
O
EoC)
0
CL
e--
a V<
co L:
5 Co>W o
o <
o0= = 3
LOin
I
/--------------

LO
oqrCO
o
C 0Cc
F-oCO
t LOC()
(seqpul)
c)
jaqwueo
80
0r-
Cl)
0 (0
o)C)U)
E0
E
0'--
0CNT-
-0
IS-
-0
cu
Cl)
-o0
-c
Ca)9a0,0*too 0a
0CN
0LO LO
CMCN
o LO
0
I C)mwa
mooC L=^:3

0CO
(seqoul)
CO
aeqweo
0COcooC4
(0
4)
Im
0I
-QL.
E0
-j.)
I
CNLO(N
0
C)'l-
0
CM
m
I.
S)
o
0
C)01
81
L)
oI
0
5
C)
<
X
Co WCLQ Q.
oO
w 3
ovo
0 .a, <
2 -D 05
OQ= =0
C',
C,)
C,)V
.LUZ
LO)
1-1 -"%-----
CL
(1)
"0
0,oECU0j-
*
I00
6,LLU..
0
0
C
CN
C:)
C,)aC
0 )
E
I.
E0
(N
0
(saqu!i) ajeqwe
82
0(0
(0
Q
0
caU)
Cl)Co0-00
LO)
0)coo
CF)
CI )
I C1 )
0
o
c u
-o
ar t -C 0a L
S aX <1
£Dc cu
0 +
M CNL)Vi C)
CO) LC
(C(N
I\»_ ____ _y

0CD
C4Co
00dL
C,)
'U)
* m
U-c.0
LO LO) C Y) LO CN
(seqoui) jaqweCI
0
0
C)
E
0
o
a1
83
LO
0)0C)
N<
e --
CU
c 2
CUI Nr
o
Swg
5O
m cu
c -o o
£D -+
q~mmr y-I r4611

0
O)L.•Qa)
E
E O
0>
O
Ea a
a Q,
o
0O
U
U-c
S r-. <
LC) LO c C CO. co c\o(stCo) (qu
(seLpu!) ijqweo
84
0
10
C
cU)
C )
C)<
Sm
to
Q

0
U)Q
® cnE
O i
E0 a,
o
* -O
i.11_
LO) L() CO C)
(seqou!) jequwe
85
aO
CN
0
LC
LC)
i

j0
L.
.0
)
® do?
C)0 i
<M
0IC) IC4 IC)
(seqoui) eqiqweo
86
0
I %)
cu (
CC
U)0
L)O
o<a
I
VW•L.ZLL

0
4Q)
o a)
LOO )r LO" C)
(seqoui) Jeqwueo
87
LoL -O ;
EU)
E
U)
mcL3 0Of £
0
0<
a
SCC
(
o^
C)
LO
0

>m ^U-
CN
o
00,o.-
L <D
'C co C\i/o iIn-M 11) i ~ii OPN
88
03
C\)
a)0
E0
0-
CDto0C)
N
Co
-0
C',
c> )
1- to<D ss
oia
* .
"CT
> >
("CU
ft ft
C,)
* *n
(UOL)
(0C
CD >
LL
8AP
\%WLJ %W LA I/ 1%7% LOLAIce-

0
1N
cc
0
0a
L.. E4•-o -
E
E C4
C C O
(-
E
U-
L( (N - 0
(seqoui) ieqwue
89

SM N(saq- i) q o r o L
(seqoui) jlquweo
90
Cu
0I...0
1- aE -
.C (Dcu
.c0
U.iZ
00
(0
E
1-

00
co
00
E
? 1
E E
t l) 0 LC) 0 a 00 1OC)9 C)q0) 0)j 00 P0f
(I!equJgqeJ) 9JnleJgdwi
91
O
00
cc 0CO
0..
U..
-o
uj E

LO) LO qun Le LO CNI(f c) CM
(seqoui) jeqweo
92
0
0c0(U
0.EO c<
Q0
I
C
I
0o
0
CO
a)oC,S<
00
o
- - --

APPENDIX A
Short-term Sensitivity Analysis Spreadsheets


S) "< ) E,.W 0 CL 3
*00 <- , =
-6 -. I l% ( ta) o,_
E r CD"N 7.."- 'a -S
"C4 "- t t + r.
C C a)"--- . N ,O,--,"-) ,,oS"0 CD - LCT
C CM §-| 80 5 CC CN )w o "M -B.- § 2
>4 C ) I 0 m LO) .
• M.r= In. .4)° o . o " C_ oo
(U 0 ..C0.
> .OI 8 +N
I"" • • ""I0 o.- o-&.. C5Z) ia? 0 0 D5 ^IjES
• . |^, >| !98 S!O! ,•te
> =
C 0 C) Q0M-OtoN1,--01)o -0 S t - -- C4 8 1*-L .- - C 0 0
CM 0 r-- m 0 r N .. c •• •-
m 0 -- N
Cm S'E_ UoQ00
0'
>2 0.2 -'U
£ _ L §o 0 mt -o Nt
-I= lil8 S N-.,<
0 t"C (0, 0)
I.I'• I-.N ,,i " (d I,
C1 CL-J T 'OD^l^ -tIc*So =al o PL 0 <
>c ~N NOC(n U)LON 1.-0)
._m IE:' ? o• c
L) ZC'- Sco
> 0 )C CD to NN ( 04 0 CV)) U) NI,*r-a)
0 c to -v 1ý LON vN- W U) OD
.2 -0.. "- U) (N' .-- '6AI IC D0.C a) s No C|o- S!9§'--(0USK§>c (0 N CN 840(n 0ULO)N )
* o __-
ICc C> C0) C
C M0 ODN Q CC')) (dN
> UWJ< Cc tm :=ý N N 80 C') U) t )NNl0)
0 r_0 F,- U)0- W9)(O
C 20- t N N V0-0C')))N
o- t)r -N
=mc 0)o0 C0 -- 8 00
4D N>
£
0 CY
CL
m
4t CL
CDWI?
in1
,==I0.I0
o -
m.
13,
0 . . "
-l b.m. .,moo2
mg88£
LO0> 0 00 04
co
U)coC4c•88mC
) co U•88= e
U-) N0 CO V
f% L)(D IV0
T-09
CD
V-- 8 G°
C
Ul) 0(0 Nrco N 8
0(0
•88N•0)
•888
(0
U)%C CD0U)0) O OD
(U)0D8C04
(0
(0
(0( CU)I
r-(0 U)N•P -C') Cf)UC)
C CO
P'--O ND
C') cr)U)D
(0(0 CU")1.
•1" P-:g~,-
'm•: P'
».^ CMiN-O U (01-
•P" t,.s
u?
li I- i coNC) CO CD
CO) C'O) )
Vt-
tog 0 tNI.%- O I.-
g," eS,,
!",-S!0
C') (V)U) f-
CU-
NO O I,*
NN
NCOU)D
CV) (1)(0
R8 8!SaC) (C)(tC') (D(
II
&1E cDE
II
0
CL
CL
O-0.0-C
,a
.. 0OCiw
a)a)0
0.C
U')(0C
0
a)mEa)
f.
ro
I
' 0
' 0
(00) (Co cn0)NNC-oC c c(c)U)oUr-N. (0
C-
-'C r-0n N- g
1• d
I,- ) com c NI"')N OD
11--o co W %~- N rITOD
NO - OC ( CO )0)U)C^-N CNo) '- i'~'i
U) CS
cioci
1 0
CO o Nco (nc')01%UNN
*o ^(- r-^ §
' 0
(00 C') ( U) -Nrco o M OC') -CM
P- co NO LO »0 M0 V*C'^ci "r- mw ,g? 'N O) 'VC' 8
4 0
'CD- mU)o08(m -V)'-NU
C-4 Oi 'C') f- tcnN0
C')~ 0) 0 C'04'c-N
it
0)
C
Coe
.£
,0
_r
0u
'i
o
U- 0 (N4
(0) 0 N
IT d CCMU
(0 CO I )li 6 N
U')(D
0 0
OD
(D
'U-
Ui
(0
'U
N
Nt
U)t
U)0)
5U
'U
8U
N<
.0"
CI0
0)
C--
C NC') Uc)0i N
N CN
Cr N
di CM
C') N'
0 NM
N N
0 a~
(0 NN U)0 N
CIO GoC') LO
N C40 e8
N 0N CNd CM
N N
d CD
(c) co
0) (NN Ul)
C1N
C' Uf)oi C-4
U)&
0e-
-ca m
CD-
r- *?.
0 V
= -0 C
C--
C
0 '~
cc
cO
to V0 N
0
'C4
CD *
o .
m o
0 Co .
C
ft
C ^
0 SM U) 0
C ?00CUN
C*1C 80 C4
§a)C*N
CID
(0
moC4ft
(V)
m00
i II I I o(A 00.
'C 'C C i i
0 0 -. -.
i I o " a
C C . C)- CCV '0 ~ -
00
0 w 0 CT a
0 0 C(D co-
.20.(a
5.()
E"
a1
< -. 02 -
C-4 0
0.0 07
C.<o |L Co.00
o •3 00~0
CO
I '= o1a.w • s °
ca '
CI.:C .,O,
CL
8
IIGo
I)01
d)
.c0
'C
C0
o CLUI)'
co
Zh-o
o
Ia0
0
0
CL
E20
0
8
0
0.a)
C'(0
C'
I
u§U)
c'0
I-
"0
C:
w
E'0U)
a)
0)
A-1§

0
CC
-
(0j
00
0
"5. §-
CcL0 0
0 .
0 o
- 0(U C- C, (
0 0 a o
T- r , tfS5-0 0 c
LJ i 0 i 0
A-2
;t
C)3
CI
E
0,-
0>
d-
EoD
-cj
cr

0.
=C0
=.-
4L
>
It0
c
4,-
.o
>
mIs
moo-
0
~.
ca
m to
isN
4g
C
Q CD
4. ,n
C1 -0 o"==.4 ,_
M, 0) T-co ooocDrN r- (Y ) o cD * -D T-- c(N N (D0E C 0 0'- (0"
c. "o o r c •r 0 )
-50
0 0 o-« - , _ o Q0 oo ovo woomo mW mo4 ,..- M I,*- i,..*-. m r "* LO v- -r- W oD
" Cl | D Nfo I 86
0 C
E. - Nodo N)I.- . - 000 O C
.. ( C I DOQ t - "D(k 0)10I
cm'I - l II
C,,)
'-8
CD Co '-C "-N (l-C- CL C (a oa 0 . r - cO ^I%- tor - V - CO 04 (,N0
c, .| - E 0 .O , to,.
a U 5 ° N d .. c o m 0 " 9c' o "N -.0 0 0cO " D 0 w
0 co 0 4,wdc'-4 0IT
0 0. C0 0 0 I8 toDNcov C C0ogg M
L 04 o o: N o rr ()-O M c D malil a Go r-U v ( CD IT
||O MCO f- W it Cn DO0 C DClUo0 0MU
coN o oIV0)I
rlM 0)
Sco(N7i
CM- 0>§CM
oNi 6
CDN
ODr-
N 06
aN)
N Oi
CM ci
0 coN 01(N CO
CD CD
N CD
CM_ 0)N cD
CD
'-CM ltD'O-'- 0
'4 0
5) CD() N CD '- (N 4k
CO
D W-'- 0U- 4k 0 O CM
OD CD C--D N CDCD (
!n CM O tf)CD V0)ITG <r%. CC T7 Nd
a) ( C N Lf
0
CO
0
QD ( T--9 N-qw V
CD (N UCD CD CD V CD0
'V O f-NCDR-(N 4WOD CN t. -. U'
CO-V- 0
CD (N CD C CDO4M CDV
coC% CD O00 - V-- 0
^Wosr'-40co IT0
0) fl- 00 v- 04 IT
m I%- qlc LO
CDCOq ~ - (^I< <COC r-4k0 0
Go NW,Nr, q(N 4O
CD(N'7
Cd
4kr O-C D r,-:CD v-CD(N
4kWoNCD 'V- (NMVv- 0 COCDCO 0 0
CD (N LODLCD(0CD 4k CD
,% C - 00V-N0
4,
II
C-
c(D"o
%0wCO?
4,4,
0
a-C --
0 A
o "0 m
o.- .. ,.
.0 -0
C t) 4-' ,
0) (./)0
0.
o 4. (C w
,--o "- 2§..3. *54
4,0 0 ®:
0
4,
0|
C o a2 c• " cL
iN
CD
CD(N)(Nx
CL
xCD-EE
0011
jc
i
.,
0
Q
",C
€-4.,,
:L
4,
I5
(N 0
ci0
) C
zd
o 4kIT Co)
00 0^
N CD
M
IV "i",
A c7
CD 0
dk 4k
^ (N
0M
N 0
IA c
0)
0,4, -C
00
0 0
E -55 4, 4, .0 -o 4,. -
E E
*a . o 4,
03 Q o 4, 0o o
-o o - 4,
0C N
coo 0
= N
ft
o
(o
CC).=fam
CD
0
to
c CD
O 04
o CD
1'-
to
4k
4,
0 CD
o CD
c N
o C
§ 0>
to Co0
4b
C <^
to ('~4(a
o^ CD
S0
A-3
cmCo
CF)0)
Co
CD
cr^.
CM
CD.
(i
CM
CO
C)
C)
CD
Co
0)
II
E -^4, " 4,
J^ *§ "S
<0 0(0.
"oi 8Ct4
4.c 5-r- x~
0 0c0)
I,
0 t0CL (a
0 4 -- 4,
Z 0 0
CLC
Qi ""
.CO, a
C 4m
0.
0CL
0
C
(Ato
4, -1
0) 4
co 0 4,0 0 C2
< 0
0 Co 000
1 S $ -r 4,
i.si 5
-.2 '.0 LC OD -
4, >0Co ~ 0 0
I
0 C
CD 0 0 C
T, Eo 4, 0
-co 4

a)
I-
A
(0
0*l
E
mi
0I•(
--
c-
o * _
. f 20
, ,-o 00
£) o 8.
(A N (I) §'
C) E f I I
A-4

'a
10
w
CUE
a-
>3
0
4)(0
'A
CA
5,
IO
503
Ew29.00
^w
o
a,
1CO c .o
_ i ._ s, o
BOCUe
Co
03
CL-IQ
m Eo o0 cm -- ) 0.
.0 C
Is1 0 a11O
S -__ o= •=s • •2 0 aoS
0 CU -- S (NO -OcN-U r- m co) 1
1N : ? 1§? E0- 0
> 0Iw3•_
5 0 T5 C0CCU - -0 § .0 -<0 00 »« (P.*<
> 0CD.owZ=
o - §0) 0M
oooCU- "( wCU oo o ciw'cta ~0=
--0D (NI w 0
> •,- a,
go
C C14 m GoV
U' C14lill
_o
o = m-o _ 0
c " T c o
M 5 L. b- - 00C 0 n -("!r zOQ Cl~O rC
> 0 0Mo o 0 0
M Lo t (,
0 G o Z » P- U)mr% m co oo
0- •'SŽ- 1 0o OCC ()103(ONh- CC
o a CO .0 ( o N ,
ft0@30
|0 C-U - 0> u4)-Q
0 a r 5°-.Ul ,- Goc 03 aL. 00800110NM2
~. 0..04( )
5m c <':. <o o ::-nr oo
|^ o ~ '0 oo°5
o 0.
0 43C3 CL
t,.o
> 1 ) S M1m
o f0
o l-C- U) r (r) co
- ^ aCOo(Ns<
"-o 10
> sco.0.0 C O CN r,- o c m r co®
mm U),, (0^ t, m.9 , -3(05k 0) . c) c
10 (V) O N
*Go
0N 0 0 O101
T- 0 C10 04
O ~ 0 C1•
W- o, to cotooo!0)00 C)00 (NN.00o^-c10
0C 0 Go0IN 0
(No 01010 0C
V.--
0 UQ0) 100 (N
C 0
0 CO 1 0
C
co0 00
00.2.
05,c <
,. 0 T 0(N
03 l•o13 .,. 'oo o C- 4G 0
D S v(0 (
Co.. 40 ~ i,
fl)
S1 1 co 0 ( I
1 C10 0 (
--o - - io 10 I•- N1010 2 11 0 (N
co., ).W- C4- WC O "D10 0"(N0 M sl 14
0 O -- o C,4
.0 C
0ý CO
(N0
CO1111011
;E cc3 o£5
0
>0
=(N S o a,
a, a, S^
080*0
L6 (N
88
Sc3O
(D CN•
,--0
" a6
00
co CMq88(o CM
1010
881(N
88
88
88
co C1
to CM
88
s (0
8888
10 (N
co2C
co
I II
0o03
CD 0
0(A,
a0 r.0)
i 0
a00. a,(0
4) 0 C) paF
§: 0- 00
1010
101
.0
CI 100)
C%5 4 1S-
CNN.
aa
(14 r-400 M0
CM CO
0L (NN
CM CMN
CON101
Coco('410
co?
N. r0)cm IV-
(N0
••6 o
N(N10 '-0 1o
CMOOCMO •iC
•• o O
•• , O
N. ( -0)0 o
N. (N10'T- 00) 10
1 0 ~~~a
N^.M1010 -00)100
l-0M) 1cN1(N: o
N.M(N 0 '-00)1»0010(NN.105 0
N.(N 10 (N^ O DC 00)010N10 0 0Mr-< ^^
(N0 0 (N 10 (N'*- (0N. (N 10 o-0) (C) 9
10 (N 10' (CO) 10100
10(NN.100
j.; o
-10 0 (N N. (C) (0 :
N.( 0 '0010
10(N.0 0 jj
r-(N
0C6(N
(N 10•- ("M <)( N (V
T- o o,
0 06
. (N 0
S- d o",-. (N 10o CMq co
C1,4 m*
,- ° 9cir
0|0
V- d ')I*- ,C- CO
(N CM 10 0
0 ý-
z=0
0 CLM w
z ct E
0 0
10
God( C)
(N N.(N mC0 0j
(N4 (N (n0 0i
0 0 0
10 10 0( 1 0
- CM4 CD- CM C50 0 w
N 1 0
(N d10
, , .0 0.
i- il • II „
I0 .0 CC 0 S
o =o •. .• ._ =
0? g. §. , , =
s aE C- C a-
a, a 0 C0 .0 CU
"* " - o .0
.0 .g0 c
^ "
0 I S I 3§ a, 0 2 .2
_0 L0 0 -- .0 mx .0+, .
.0 0
C *
- P-
£,- b..
C) (CC*it
0 00s N-
.S oo
to
0 8)
*0
CU
0 CCCU-
20
S 0)
.S°
40 CD0)
0 0
0 0)
*§ «
s 10
(0(0
CD0
(A0o
0CO0
I.0
'a§
S '0
^a,<
CU
0
0
CDZ0
C3
.0
o
.)
i0
0
U5)
I010
10
00
0
00U
a,
S
CU0
.0
a,
E
a,
a,
E
.,
0L-
0
I
_CCo
.270
A-5
0)
o•.a
ia,
00
-~0 0
® - .-0--1 --
000
o,-• e-ore
" o ,_ i
.0 0 C
@30 CL
.00a 0 u *=
11 £ |-0.
1|1 H0.
l~l'l |=
0
U')-U)I(D
Ca^
A-6
C6
-0
IA(D00.
to
r-
0
CDI0
°8.0
L2I
00>
0

APPENDIX B
Short-term Analysis Spreadsheets


PCI Short Term Camber Analysis
Bridge # : 19045
Glrder type: 72-139
(Some input data is linked)
Input Data
Number of Draped StrandsNumber of Straight Strands =Modulus of Elasticity for steel (kiplin^2)Ultimate Strength of Strand (Kiplin2) =Area of One Strand (inch^2) =Initial Strand Prestress @ seating (* fpu)=Eccent. for draped st @ CL -- from bottom (inches)=Eccent. for draped st @ end - - from bottom (inches)=Eccent. for straight strands - - from bottom (inches)=Average eccentricity @ CL - - from bottom (inches)
Transformed Moment of Inertia of the Sect (inchesA4)=Concrete Strength initial (Ibs I in2) =Concrete 28-day Strength (Ibs in^2)=Modulus of Elasticity for Concrete (kip/ in2) =Weight of the concrete (Kcf) =Center of gravity at CL - -from bottom (inches) =Area of the Cross Section (in^2) =
Length of the unsupported beam (feet)=Location of draping points from ends (feet) =
Calculated Data
fcsInitial losses due to Elastic Shortening (%)=
Straight Strand Force (Po (kips)) =Drapped Strand Force (Po(kips)) =Length of the unsupported span (inches) =Length to draping point (inches) =Actual Ecc. for straight strands - - e(c) (inches) =Actual Ecc. for draped strands @ end - - e(e) (inch) =Diff in Ecc. for dr strands @ end & CL - - e' (inch)=Weight of the concrete (Kips/inch) =
Camber due to the Straight strands (inches) =
Camber due to the Draped strands (inches) =Total Camber due to strands (inches) =
Gravity deflection component. (inches) =
Total Camber for the member (inches) =
Measured Camber for the member (inches)=
% Difference
**Bolded values in thetable below are estimatedconcrete strengths
B11-S2 B12-S2 B13-S2 B14-S2 B15-S2 B16-S2 817-S2 B18-S2 B19-S2 B20-S2
12 12 12 12 12 12 12 12 12 1242 42 42 42 42 42 42 42 42 42
28500 28500 28500 28500 28500 28500 28500 28500 28500 28500270 270 270 270 270 270 270 270 270 270
0.153 0.153 0.153 0.153 0.153 0.153 0.153 0.153 0.153 0.1530.75 0.75 0.75 0.75 0.75 0.75 0.75 0.75 0.75 0.75
15 15 15 15 15 15 15 15 15 1562 62 62 62 62 62 62 62 62 62
4.57 4.57 4.57 4.57 4.57 4.57 4.57 4.57 4.57 4.576.89 6.89 6.89 6.89 6.89 6.89 6.89 6.89 6.89 6.89
600350 600051 599283 598897 601774 598897 597081 600159 601774 6010216113 6369 8090 7943 5603 6663 6918 6113 5747 66999000 9110 9400 9550 8500 9550 10300 9070 8500 87604795 4818 4878 4909 4688 4909 5060 4809 4688 47440.15 0.15 0.15 0.15 0.15 0.15 0.15 0.15 0.15 0.15
34.85 34.86 34.87 34.87 34.82 34.87 34.90 34.86 34.82 34.85786 786 786 786 786 786 786 786 786 786
137.50 137.50 137.50 137.50 137.50 137.50 137.50 137.50 137.50 137.5062.75 62.75 62.75 62.75 62.75 62.75 62.75 62.75 62.75 62.75
-2.80 -2.80 -2.80 -2.80 -2.79 -2.80 -2.81 -280 -2.79 -2.79821 8.17 8.08 8.03 8.38 8.03 7.80 8.18 8.38 8.29
1194 1195 1196 1197 1192 1197 1200 1195 1192 1193341 341 342 342 341 342 343 341 341 341
1650 1650 1650 1650 1650 1650 1650 1650 1650 1650753 753 753 753 753 753 753 753 753 753
30.28 30.29 30.30 30.30 30.25 30.30 30.33 30.29 30.25 30.28-27.15 -27.14 -27.13 -27.13 -27.18 -27.13 -27.10 -27.14 -27.18 -27.15
47 47 47 47 47 47 47 47 47 470.0682 0.0682 0.0682 0.0682 0.0682 0.0682 0.0682 0.0682 0.0682 0.0682
4.28 4.26 4.22 4.20 4.35 4.20 4.10 4.27 4.35 4.31
0.27 0.27 0.27 0.27 0.28 0.27 0.26 0.27 0.28 0.284.55 4.53 4.49 4.47 4.63 4.47 4.36 4.54 4.63 4.59
-2.29 -2.28 -2.25 -2.24 -2.33 -2.24 -2.18 -2.28 -2.33 -2.31
811-S2 B12-S2 813-S2 814-S2 B15-S2 B16-S2 817-S2 B18-S2 819-S2 820-S2
226 2.26 2.24 2.23 2.29 2.23 2.18 2.26 2.29 2.28
2.44 2.48 2.72 2.48
-5.95
Long Term Camber of the Member
PCI Method (Uses table factrs)
At erection of structure: (30-60 days) FactorsPrestress Camber 1.8Self weight Deflection: 1.85Total Camber
-11.94 -16.93 -7.47
B11-S2 B12-S2 B13-S2 B14-S2 B15-52 16-S2 B17-S2 B18-2 19-2 B92 20-S2
8.19 8.16 8.08 8.04 8.33 8.04 7.85 8.17 8.33 8.26-4.23 -4.21 -4.17 -4.14 -4.32 -4.14 -4.03 -4.22 -4.32 -4.273.96 3.95 3.92 3.90 4.01 3.90 3.82 3.95 4.01 3.99
Final Camber. FactorsPrestress Camber: 2.I 5 11.15 11.11 11.00 10.95 11.34 10.95 10.69 11.12 11.34 11.25Self weight Deflection: 2.7 -6.18 -6.15 -6.08 -6.05 -6.30 -6.05 -5.89 -6.16 -6.30 -6.24Total Camber 4.97 4.96 4.92 4.90 5.04 4.90 4.81 4.97 5.04 5.01
(Note: only the self weight is being considered here & support conditions are not being considered)
Time (days)0 2.26 2.26 2.24 2.23 2.29 2.23 218 2.26 2.29 228
45 3.96 3.95 3.92 3.90 4.01 3.90 3.82 3.95 4.01 3.99730 (2 year) 4.97 4.96 4.92 4.90 5.04 4.90 4.81 4.97 5.04 5.01
B-1
For Plotting
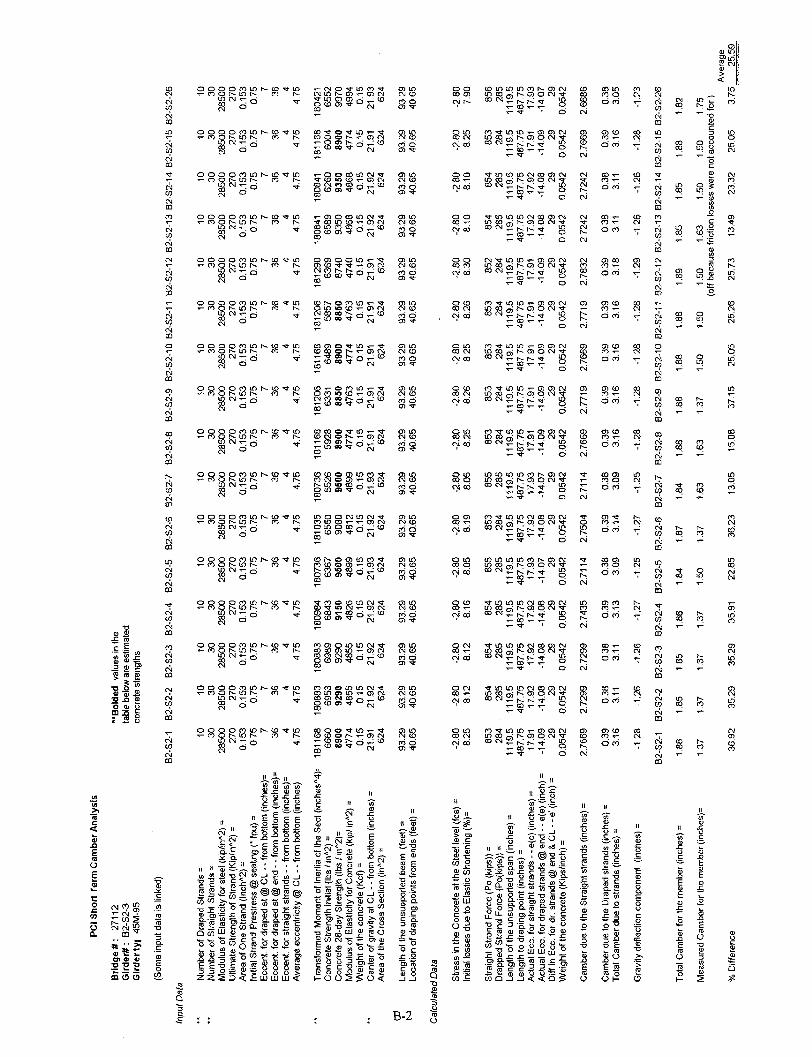
U)NC10co
aO
an
coCO
(4
a,
(N
in
OQoCNTQ
CO0
C11an
co
CMlCN
U?
0
CM
Of
(0
CM
a,
0E
(O
0
a)
"7,
I
(N
03
cJ
0a,
N -
(N
SC0
C(a,a,
05a,
a,
(N
CN
010
0,
S a,
o oa0 c
Q> CD0
r
(N- Ca, %
o C
S§ CM
0~ 05
O (N8JC -Q. aCD
OOOOf• •rCD^tl T-CO^IIOO
0-co 0N-mmr- co 1 - M n" V N- 0C) -c a U CM'I
0• a, • 0 "
0000CoN'2'aa •0
U-Co)N-ivo- Co N- ( 0 oCr-- (o( 0 N000 a, ^r
0a,0000Co) V r,-(Dacr x- 0 0 0 V LO 'V
-Co)0 N- aNI- mCo N- D CD CDP- () N0O a, (M io - o-C(
D , (N- ( O V
C14 . co CSS 0^
0 0 00 V 0tý-0CDN V LO ,T-C0 O N IT
coC)N- O Nl-
Co N- 0 (.0an "T-a) N
LC0 5-N an )0 0
S-CoC0N- tN- Co N- r-aMON-W-0,N
0f a, Or- CI l_ t W r
o14 co
t-co h'io '- c r^ o~o~<DT-7T-
N n~- d ( m; C~CCr- 1-» 0 (0
L 0 0 0 C o - - o0 0 4
• 0 a , • 0 "°oM l-0P Co Nt- L a,"WNoN- •-a,(N
SS^5° - §i8 a,'
ooooLO 0oo0
O. a,
0040ci N00a0 a~,aaoa
0-Co0 N-)NO- w Co N- COa)00)P-qrCU)CT ) r-t»r)r I,- Ce r-ý CDOD -iCD r- 0)ODM~ ci V- ( ao CT0 0 rC- to r- (Y) i~ ,0 M W) (0 0) N
Co 0 ,N- Co rN- Co(0oo[-' v-- 'Lo
^-coor~ioi^ co r^ coio OTa(0 0 a |,oO C) V V
00C o( 0 NNL -(CmaF- (0!CDNf- M ( CoN
Co -N- Co N- Cog 0o -
0 0 aO C
o )0 00Co(0Or- (C) trL0 Lr 0CoO(CM L CM-Co ON- (VN) Cor- a, ~r ') 00 m- a, ()N
0 a, t 0c (i (
0~0OD ,N-a, (D)CF0V
T--
0I a, U - () t- Y 4 ) 0
V)-Co0N- CN- 'Co IN - maum,oN- -a,(N
-a,
0D 0 o 0
a, a,CMS(N a,CoLO
01 .O
0) IT, ')(N a,
(N a,
OM <"
Cod
e,1•o67 cia') IT'
o'-OC ')
a, D
(166
(a,
Coo
aba,
(N-a,.
0,1in
Co 0
a) 'a-
CD LON a,
coo0) LO
(Na,
co d
0) 1O
(N a,
a, Ia
cod
T) U')
0') IT
0o)
a,'aL
a, a,
N (.0
(N a,
dod
(N a,
aj) ITCObL
(N a,
NCoD
0Co
O0) I•"a, La8ac(NcyiCo 0T
Q 0
CM O
0 a,
a, (N
00
aO00
COa,-
00 ,,--
00
O, Co
O Om
0 a,
0,(0
co 04
0 a,
0 00
C) C)0 a)
0 a,
CM 0
CM06
aCO
0 a,
CC) (
cMi C6
oaMa, 00
§-Ja
0M a,
a, aa aý, mCoN- a(•ODO
• • 0
N- a, 0 (Nco cl ,-inr--crv U-0 0
q'a-, a, a, a,(Naco a,"aci0Nr- a, 0 CN 'a-OD N -'r, 47 d
00 0
It a, a, a (N ao0a,(N
CN a 00
• • O
o00 0N0(C)N LO ,a a ,(
L0 aNCo
Co 'I a, a, U aYa,(NLo co N-, 0)0 (-4-
•••00
Co N Ia-a a, aMa, U' U- N- a,0) (N 0
, - a, 0 (
Co IT aUa r- ada,)(NO02t- 00 N IT
a, a, T a, aC 0-,(
Co CN a, a, ( a a N
CO'<- Oi «CT D M
0CM V tf LO CO (3
a, N t- a, 0 (N
a, a, ra,;a, C -Ia (
COar-0)0 % MU)co o^ 8iF-a
co. aa- , dNaa,(N
OD 0
m a, aO aCM(N a,)a, (
LaO D(N- 00C14NV
*p, - a, 0 (N o
Co a, ao-00- (NCOCOTN--0)0(N^
V dj
^ co0 0)CN0t- 1"o 'p T of
v*! Lnr U) V)> cM co 0) cMlLoco r... D 0 N
L< n cof N a) MOtG4 -M00 CO r-- r-- tr0 M )CD V-1 014 T 1 d
(D
(NM
(N
CD
(N
(CM
(N
(N
t-
CMCD
(0
a,
Lo
a--
CMi
CMiCM
aO
a,
a,
a,
(°
CO
CT)
r,.-
CM
CM09
!'-.
(,,
1r-.
CM
O')
*t'-
04
(O
CO0co LO
0 Co
CY a,
Co^d coa9,-
Co <a(,
C)oO Co
d a,
ODo
Md) co
d co
C~to
0) (0d cojdOco
0a aCo iO co
00 0)CO 0
d0 Co
a, 9dCo
O9O
co 0
dco
Co)
0)0m
00a,Co^di coý060
CO T-dco
09,m--000C
(N
a0CO
CC)
OaN
0)(CNa,;
co(04
a,(Na,
(N
CO
a,
(N
aI(N
N-(N
a7,
(N
N-
(N
a,
("N
a7,
(N
a,I
(N
a,(NCM
0mCa
(t)a,OQ
mId
CM4
0
c~rja,
(N0
Co
cnJ
Cý
CM
m
0
a,
CON
00
CMCDPMCMl(N
Ca
nQ
0
(D
c?
aOCM
0)
CMm
o4
03
Ca
Ca
(jD
r^.co
05
C4Ca
coa,
a,(N
CM0
ED
a',a,
(N
nM
0
a,
CDD
a,
(N
CM
0D
a,
(N
(N
05CMJa,
aL) U)a) I6
cm
(Nj LO Ca)
o 0g R^ 1
o C
o 0.. 5 (1
'-a)
aoC
co LO 0
. Co
00
(N
U- C M
O I• I ".
0)
LO C") .2
00
(0
co o LOs s a,
co LO
CC) r) C
ul>
a, a, (
O 0
Coo Co
co
9
O 00
§ s. (N
a,
aN
ao Cf' Io)
U')' O
0,(Y)
co Co C
U-)Oý(N
co CO Co
0c
U'a , , N- O
coco r-.
Wa<h
il
II •)II
CL -CL - LiCL ?
>0
co.-c c
.c -_9.o
(E 00 -
.00o c 05=.2 0 ~o§6* 0- U) -C-
ca Ca
-i - |^9 9 05 C
0
B-2 o: : - 0
C
(D
E
CL
» * Z
CL CL«
I II |1
c i i | I)
co 0 Jo
S = C 0Q5 og o -0. O o 'o a) a
o C0
t- 0 - 2
I
::
z

(N *^r(NJ
Cý4
LO o00r-_CM- to CM)
LO (nco
U)
T- Lo(V
U)
U)
(N (11*1O)l
LN-U
VI i r- MI
(N Lr)(N-
C/)co co
03
0 coI---
Cýi U') CN"
(N V5(NU)rNo0
nj
CI
cOJ LO( <
00? 1ý
U)
09 C
&
( LN(U
10 (N
m
n O C
0?
m
t U) N
CDU
U)
N- (N C
o ,
U? LO C)N L6 (N~
a
m) U-N L6 )<i
LOU)
(N
GD
cn
U) Lb N
("C
co ec
(N L6(N
U)
U)
S L(NU)U)
(CU
<? 5U)^(NOQ
U) N-( l
CU
(N O(U)
N fU)
n^
r (.0 CMJ Iq- NM r- -'IT C) T- 0 NM
U ( 0:) CO v- 00c( r1- DCr M N Co C) CNcl r--: coi -Iti T coi l
(N to v C OD( N CNcoj t-ý C6 -i - ci 1-i
U) N- M r- NM(D qt l Nt C 00 CM- NMCO r-- C,6 4^ -- C *!
U) CO a0 0) (O 0Y) r- 'cr c) C)o M c)
CN IO N-U c No CM coC) (- 'T co N-<NC%
U) -CD o V- COc) rN -qr C oN co m(N
(N LO I-- CC) 00 0 4)mo fl- 1ý11 CM o com CMj(f r^.' coi -ci coi 4<*
U) coNC COU)MU) -N- (N ODUm(N
cd5 r-- co l*- o^UC) 00000 V LO C(o UU4 10 U N o N(N
co D a cv i o coi ci0 4)U mO N t- O UlUI) (D t C-4 OD U) )N
LO co co aM oor CMO(0 Uh)UO CI (N0 C%4
(N .-TU)CN U) VT(
U) N'-NCM ( DO)'«3
U)co N CN
C-i r^M' mOMv0
QU)) N-U)l-
0C-5 oi 14-^i cr) -ic0
cU) 'Vq- " c C)(NU)ý N -4T c-U)CL
nI CW/
...
- 0 i *0. .2 0 L
B-3

PCi Short Term Camber Analysis
Bridge #: 4516 *Bolded values in thetable below are estimated
Girder tyl 45M-95 concrete strengths
(Some input data is linked)
Input Data B2-S1-1 B2-S1-2 82-S1-3 B2-S1-4 B2-S2-5
Number of Draped Strands = 16 16 16 16 16Number of Straight Strands = 34 34 34 34 34Modulus of Elasticity for steel (kipfin^2) = 28500 28500 28500 28500 28500Ultimate Strength of Strand (Kip/in^2) = 270 270 270 270 270Area of One Strand (Inch^2) = 0.153 0.153 0.153 0.153 0.153Initial Strand Prestress @ seating (* fpu) = 0.75 0.75 0.75 0.75 0.75Eccent. for draped st @ CL - -from bottom (inches)= 11 11 11 11 11Eccent. for draped st @ end - -from bottom (inches)= 35 35 35 35 35Eccent. for straight strands - - from bottom (inches)= 4.12 4.12 4.12 4.12 4.12Average eccentricity @ CL - - from bottom (inches) 6.32 6.32 6.32 6.32 6.32
Transformed Moment of Inertia of the Sect (inches^4)= 181808 181808 181732 181166 182208Concrete Strength initial (lbs / in^2) = 6333 6333 7578 8346 7321Concrete 28-day Strength (bs I /in^2)= 9200 9200 9300 10100 8690Modulus of Elasticity for Concrete (kip/ in^2) = 4837 4837 4857 5020 4729Weight of the concrete (Kcf) = 0.15 0.15 0.15 0.15 0.15Center of gravity at CL - - from bottom (inches) = 21.82 21.82 21 82 21.84 21.80Area of the Cross Section (in^2) = 624 624 624 624 624
Length of the unsupported beam (feet) = 93.00 93.00 93.00 93.00 93.00Location of draping points from ends (feet) = 39.50 39.50 39.50 39.50 39.50
Calculated Data
fcs -3.36 -3.36 -3.36 -3.37 -3.35Initial losses due to Elastic Shortening (%)= 9.77 9.77 9.73 9.43 9.97
Straight Strand Force (Po (kips)) = 950 950 951 954 948Drapped Strand Force (Po(kips)) = 447 447 447 449 446Length of the unsupported span (inches) = 1116 1116 1116 1116 1116Length to draping point (inches) = 474 474 474 474 474Actual Ecc. for straight strands - - e(c) (inches) = 17.70 17.70 17.70 17.72 17.68Actual Ecc. for draped strands @ end - - e(e) (inch) = -13.18 -13.18 -13.18 -13.16 -13.20Diff in Ecc. for dr. strands @ end & CL - - e' (inch) = 24 24 24 24 24Weight of the concrete (Kips/inch) = 0.05 0.05 0.05 0.05 0.05
Camber due to the Straight strands (inches) = 2.98 2.98 2.97 2.89 3.03
Camber due to the Draped strands (inches) = 0.40 0.40 ' 0.40 0.39 0.41Total Camber due to strands (inches) = 3.38 3.38 3.37 3.28 3.43
Gravity deflection component. (inches) = -1.24 -1.24 -1.24 -1.20 -1.27
B2-S1-1 B2-S1-2 B2-81-3 B2-S1-4 B2-S2-5
Total Camber for the member (inches) = 2.13 2.13 2.13 2.08 2.17
Measured Camber for the member (inches)= 1.75 1.75 1.87 1.75 1.63 (off because friction I
% Difference 21.95 21.95 13.76 18.88 19.13 Average
Long Term Camber of the Member
PCI Method (Uses table factors)B2-S1-1 B2-S1-2 B2-S1-3 B2-S1-4 B2-S2-5
At erection of structure: (30-60 d FactorsPrestress Camber: 1.8 6.08 6.08 6.06 5.91 6.18Self weight Deflectio 1.85 -2.30 -2.30 -2.29 -2.23 -2.35Total Camber 3.78 3.78 3.77 3.68 3.83
Final Camber: FactorsPrestress Camber: 2.45 8.28 8.28 825 8.04 8.42Self weight Deflectior 2.7 -3.36 -3.36 -3.35 -3.25 -3.43Total Camber 4.92 4.92 4.90 4.80 4.99
(Note: only the self weight is being considered here & support conditions are not being considered)
Time (days)0 2.13 2.13 2.13 2.08 2.17
For Plotting 45 3.78 3.78 3.77 3.68 3.83730 (2 year) 4.92 4.92 4.90 4.80 4.99
B-4
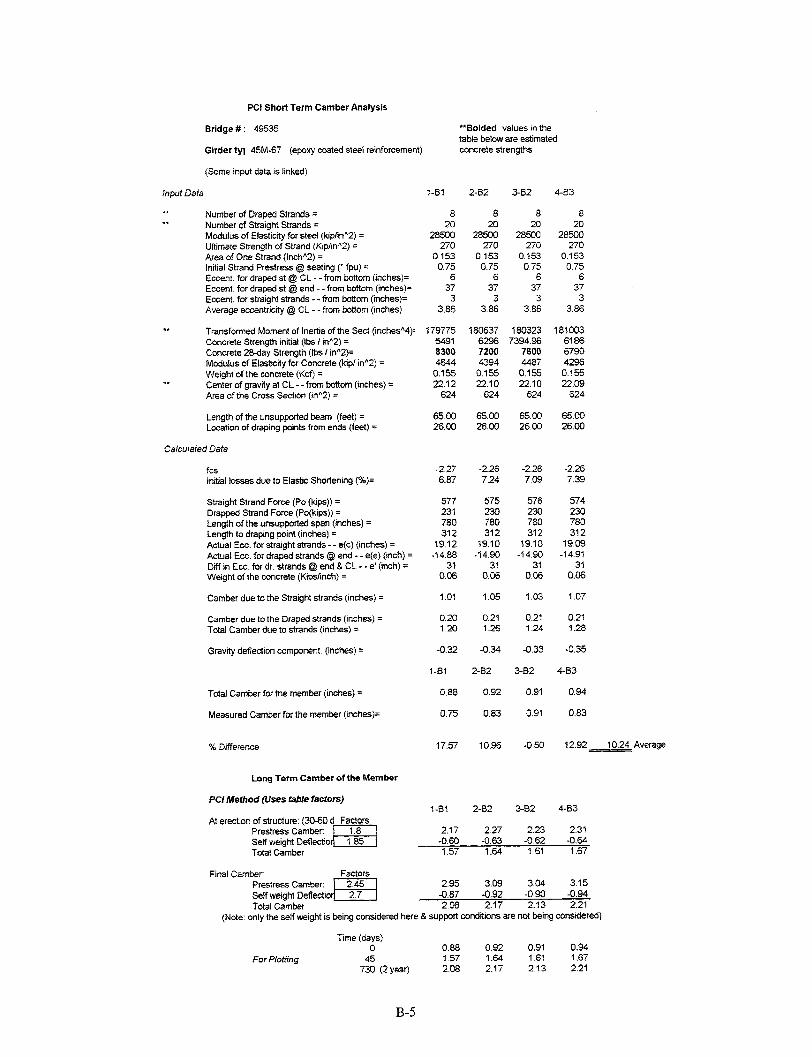
PCI Short Term Camber Analysis
Bridge #: 49535
Girder tyl 45M-67 (epoxy coated steel reinforcement)
(Some input data is linked)
"Bolded values in thetable below are estimatedconcrete strengths
Input Data 1-B1 2-B2 3-B2 4-83
Number of Draped Strands = 8 8 8 8Number of Straight Strands = 20 20 20 20Modulus of Elasticity for steel (kip/in^2) = 28500 28500 28500 28500Ultimate Strength of Strand (Kip/in^2) = 270 270 270 270Area of One Strand (Inch^2) = 0.153 0.153 0.153 0.153Initial Strand Prestress @ seating (* fpu) = 0.75 0.75 0.75 0.75Eccent. for draped st @ CL - - from bottom (inches)= 6 6 6 6Eccent. for draped st @ end - - from bottom (inches)= 37 37 37 37Eccent. for straight strands -- from bottom (inches)= 3 3 3 3Average eccentricity @ CL - - from bottom (inches) 3.86 3.86 3.86 3.86
Transformed Moment of Inertia of the Sect (inches^4)= 179775 180637 180323 181003Concrete Strength initial (Ibs / in^2) = 5491 6296 7394.96 6186Concrete 28-day Strength (Ibs / in^2)= 8300 7200 7600 6790Modulus of Elasticity for Concrete (kip/ in^2) = 4644 4394 4487 4296Weight of the concrete (Kcf) = 0.155 0.155 0.155 0.155Center of gravity at CL - -from bottom (inches) = 22.12 22.10 22.10 22.09Area of the Cross Section (in^2) = 624 624 624 624
Length of the unsupported beam (feet) = 65.00 65.00 65.00 65.00Location of draping points from ends (feet) = 26.00 26.00 26.00 26.00
Calculated Data
fcsInitial losses due to Elastic Shortening (%)=
Straight Strand Force (Po (kips)) =Drapped Strand Force (Po(kips)) =Length of the unsupported span (inches) =Length to draping point (inches) =Actual Ecc. for straight strands - -e(c) (inches) =Actual Ecc. for draped strands @ end - - e(e) (inch) =Diff in Ecc. for dr. strands @ end & CL - - e' (inch) =Weight of the concrete (Kipsfinch) =
Camber due to the Straight strands (inches) =
Camber due to the Draped strands (inches) =Total Camber due to strands (inches) =
Gravity deflection component. (inches) =
Total Camber for the member (inches) =
Measured Camber for the member (inches)=
% Difference
Long Term Camber of the Member
PCI Method (Uses table factors)
At erection of structure: (30-60 d FactorsPrestress Camber: 1.8Self weight Deflectio 1.85Total Camber
-2.27 -2.26 -2.26 -2.266.87 7.24 7.09 7.39
577 575 576 574231 230 230 230780 780 780 780312 312 312 312
19.12 19.10 19.10 19.09-14.88 -14.90 -14.90 -14.91
31 31 31 310.06 0.06 0.06 0.06
1.01 1.05 1.03 1.07
0.20 0.21 0.21 0.211.20 1.26 1.24 1.28
-0.32 -0.34 -0.33 -0.35
1-B1 2-82 3-B2 4-B3
0.88 0.92 0.91 0.94
0.75 0.83 0.91 0.83
17.57 10.96 -0.50 12.92 10.24 Average
1-81 2-B2 3-B2 4-B3
2.17 2.27 2.23 2.31-0.60 -0.63 -0.62 -0.641.57 1.64 1.61 1.67
Final Camber: FactorsPrestress Camber: 2.45 2.95 3.09 3.04 3.15Self weight Deflectior 2.7 -0.87 -0.92 -0.90 -0.94Total Camber 2.08 2.17 2.13 2.21
(Note: only the self weight is being considered here & support conditions are not being considered)
Time (days)0 0.88 0.92 0.91 0.94
For Plotting 45 1.57 1.64 1.61 1.67730 (2 year) 2.08 2.17 2.13 2.21
B-5
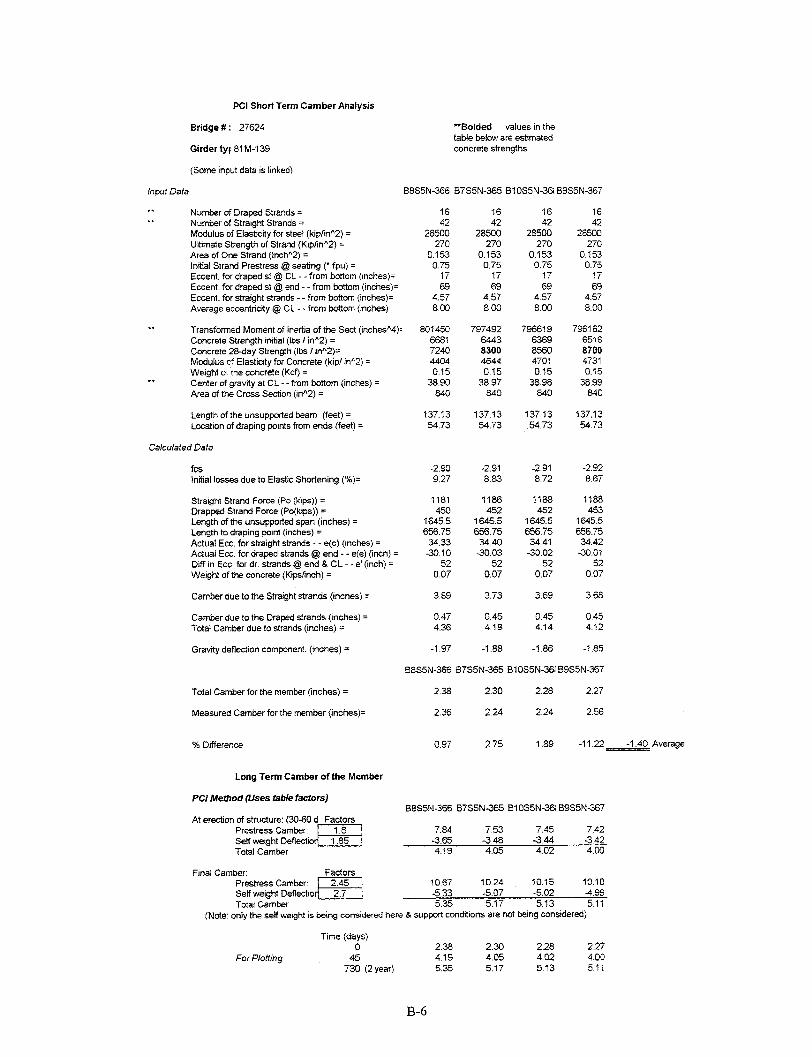
PCI Short Term Camber Analysis
Bridge #: 27624 *Bolded values in thetable below are estimated
Girder tyl 81 M-139 concrete strengths
(Some input data is linked)
Input Data 88S5N-366 B7S5N-365 B10S5N-361 B9S5N-367
Number of Draped Strands = 16 16 16 16Number of Straight Strands = 42 42 42 42Modulus of Elasticity for steel (kip/in^2) = 28500 28500 28500 28500Ultimate Strength of Strand (Kip/in^2) = 270 270 270 270Area of One Strand (Inch^2) = 0.153 0.153 0.153 0.153Initial Strand Prestress @ seating (* fpu) = 0.75 0.75 0.75 0.75Eccent. for draped st @ CL - -from bottom (inches)= 17 17 17 17Eccent. for draped st @ end - - from bottom (inches)= 69 69 69 69Eccent. for straight strands - - from bottom (inches)= 4.57 4.57 4.57 4.57Average eccentricity @ CL - -from bottom (inches) 8.00 8.00 8.00 8.00
Transformed Moment of Inertia of the Sect (inches^4) = 801450 797492 796619 796162Concrete Strength initial (Ibs / in^2) = 6681 6443 6369 6516Concrete 28-day Strength (Ibs / in^2)= 7240 8300 8560 8700Modulus of Elasticity for Concrete (kip/ in^2) = 4404 4644 4701 4731Weight ot the concrete (Kcf) = 0.15 0.15 0.15 0.15Center of gravity at CL -- from bottom (inches) = 38.90 38.97 38.98 38.99Area of the Cross Section (in^2) = 840 840 840 840
Length of the unsupported beam (feet) = 137.13 137.13 137.13 137.13Location of draping points from ends (feet) = 54.73 54.73 54.73 54.73
Calculated Data
fcs -2.90 -2.91 -2.91 -2.92Initial losses due to Elastic Shortening (%)= 9.27 8.83 8.72 8.67
Straight Strand Force (Po (kips)) = 1181 1186 1188 1188Drapped Strand Force (Po(kips)) = 450 452 452 453Length of the unsupported span (inches) = 1645.5 1645.5 1645.5 1645.5Length to draping point (inches) = 656.75 656.75 656.75 656.75Actual Ecc. for straight strands - - e(c) (inches) = 34.33 34.40 34.41 34.42Actual Ecc. for draped strands @ end - - e(e) (inch) = -30.10 -30.03 -30.02 -30.01Diff in Ecc. for dr. strands @ end & CL - -e' (inch) = 52 52 52 52Weight of the concrete (Kips/nch) = 0.07 0.07 0.07 0.07
Camber due to the Straight strands (inches) = 3.89 3.73 3.69 3.68
Camber due to the Draped strands (inches) = 0.47 0.45 0.45 0.45Total Camber due to strands (inches) = 4.36 4.18 4.14 4.12
Gravity deflection component. (inches) = -1.97 -1.88 -1.86 -1.85
B8S5N-366 B7S5N-365 B10S5N-361 B9S5N-367
Total Camber for the member (inches) = 2.38 2.30 2.28 2.27
Measured Camber for the member (inches)= 2.36 2.24 2.24 2.56
% Difference 0.97 2.75 1.89 -11.22 -1.40 Average
Long Term Camber of the Member
PCI Method (Uses table factors)B8SS5N-366 B7S5N-365 B10S5N-36iB9S5N-367
At erection of structure: (30-60 d FactorsPrestress Camber: 1.8 7.84 7.53 7.45 7.42Setf weight Deflectior 1.85 -3.65 -3.48 -3.44 -3.42Total Camber 4.19 4.05 4.02 4.00
Final Camber: FactorsPrestress Camber: 2.45 10.67 10.24 10.15 10.10Self weight Deflectior 2.7 -5.33 -5.07 -5.02 -4.99Total Camber 5.35 5.17 5.13 5.11
(Note: only the self weight is being considered here & support conditions are not being considered)
Time (days)0 2.38 2.30 2.28 2.27
For Plotting 45 4.19 4.05 4.02 4.00730 (2 year) 5.35 5.17 5.13 5.11
B-6

APPENDIX C
Moment of Inertia Calculations


Cross-Sectional Moment of Inertia Calculation
Bridge# 19045
Beam Type: 72
Section # Height Width21
4d`ir5
11
6~7
3i~
Area Location Area*CG Momentof C.G. of I (x) A*d^2
from base (Section)(in^2) (inches) (in^4) (in^4)351 36.75 12899.25 100100.81 462.76180 69.00 12420.00 540.00 200779.38195 3.75 731.25 914.06 197834.5112.5 65.17 814.58 4.34 10926.0312.5 65.17 814.58 4.34 10926.0317.5 8.67 151.67 11.91 12696.2617.5 8.67 151.67 11.91 12696.26
786
Sect CG= 35.60
27983.00 101587.38 446321.23
Moment of InertiaTotal = 547908.61 in^4
Transformed Moment to include the steel contribution
@ Center Line
0.153 inch^2 Location Momentof C.G. Area*CG of I (x) A*d^2
# of Stmd Area Tms. Area from base (Section)(in^2) (in^2) (inches) (in^4) (in^4)
12 1.836 10.34 15.00 155.06 0.00 4035.3642 6.426 36.18 4.57 165.34 0.00 32971.15
e-Bar 3.160 18.16 69.63 1264.3302 0.00 22076.32 Section #1392.91 1
)n 64.68 24.50 1584.73 211053.70 2187490.67 3
Sect CG= 34.76 11558.65 411558.65 511913.18 6
Transformed Moment of Inertia 11913.18 7Totl @ CL = 607551.15 in^4
505963.78 Sum
0.153 inch^2 Location Momentof C.G. Area*CG of I (x) A*dA2
# of Strnd Area Tms. Area from base (Section)(in^2) (in^2) (inches) (in^4) (in^4)
12 1.836 10.34 62.00 640.90 0.00 7353.2142 6.426 36.18 4.57 165.34 0.00 34230.52
,e-Bar 3.160 18.16 69.63 1264.3302 0.00 21359.02 Section #708.71 1
)n 64.68 32.01 2070.57 204072.03 2194460.98 3
Sect CG= 35.33 11128.55 411128.55 512440.44 6
Transformed Moment of Inertia 12440.44 7Totl @ End = 610909.82 in^4
509322.45 Sum
Transformed Moment of InertiaAveraged = .6Q9?30.49 in^4
C-1
(inches) (inches)58.5 66 30
7.5 262.5 102.5 103.5 103.5 10
123
Approx 4Approx 5
67
Summation
29000 ksi28500 ksi
4298.48 ksi6.756.63
6800 psi
Strd Area:
Drped StrStrt StrdsRegular R
Summatio
@ End of beam-
Strd Area:
Drped StrStrt StrdsRegular R
Summatio


APPENDIX D
Significance of Shear Deflection Calculation


Look at considering the case of Bridge 49535 to check that shear deflections are notimportant. This member has the smallest span to depth ratio and thus the largest shearto bending deformation ratio.
kip := 1000-lb
w = 0.0 5 5 97kipin
kipksi -kip.2in
E = 4098-ksi
2Ac = 624-in
L = 65-ft
t = 6-inw
4
I = 181792-in
x LM = -w-x-- + w- -x M = E-I-
2 2
h / 6/h 45 - -2
Bending Displacements are then:
x Ly1 = -w-- x -- w- -x dx dxE-I 2 2.J J I
1 1 3 1 2y= - -w +--.w-L-x +Cl dxE-I 6 4
7-1 4 1 3 7 1Iy= 24x -- w-L-x + C-x + C2 E
24 12 E-I
@ x=0; y=O
@ x=L; y=O
-- Thus, C2 = 0
- Thus, Cl-1 3
2424
Which results in bending deflection of:
/-1 4 1 3y= -- w-x -- w-Lx
\24 12
1 3 1-w-L x --
24 / E-I
Where the following values are:w = distributed loadingE = Modulus of elasticityL = length of the beamx = distance along the beamI = Moment of Inertia of section
D-1
7.5 .in-2n2 1

If we look at the midspan bending displacements, the equation becomes:
-1y(L/2)=y(L/2)= -- .w-
24 21'1 L\ 3
+ -- w-L- 1-12 2-5 L
y(L/2)= -- w---384 (E-I)
The Slope will be:
-1 3 1 20 -- w-x + -- w-L-x + C
6 4
- 1 3 1 2 7 1 3S-wx + -wL-x - + .--wL -6 4 \24
1 3 L\l 1-wL -I
24 2 El
1 2-. w.L.L12
-1 3 1 2 1 39= -wx +--w-L-x - ---6 4 24
If we look at rotation at midspan, the equation becomes:
-1 iL\39 := -- w-
6 2
1-v -·wL
4
1 3- -wLw
24
0 :=
If we look at rotation at the ends, the equation becomes:
-1 3 1 2 1 30 -- w-(O-in) + -w-L-(O-in) -- w-L
6 4 24
-1 39 = -- w.L
24
Looking at Shear Displacements in the sections
v 0.2 See PCI 1-23
EG-
2-(1 +v)
A cf.-
hw-w
EG:-
2-(1 +0.2)
LV = w-- - w-x
2
D-2

Deflection due to shear is then:
1L2
Oin
o 0-in
L
2
0-in
L
2
As
. -in
/ V- f dx From: "Matrix Analysis of Framed Structures -GA c/ 3rd edition"
by: William Weaver Jr & James M. Gere
Where the following values are:V = Shear forceG = Shear Modulus of ElasticityAc = Area of the concrete cross sectionf = Shape factor for the sectionv = Poisson's Ratio (transverse to axial stain)
LA W-- - W-X
-Ac 2S- dxh w -t . E -A
2.(1 + 0.2) c
-1.2w-(L - 2.-x)-1.2 hw-(tw dxhw tw-E )
L2
A = -. 3-w- Ls " h - (tw-E)
As = -0.011 in
Camber due to the Prestress: (from sensitivity base case data)
A = 1.33-in
The deflection due to the bending is equal to:
-5 L4A= --- w----
m 384 (E-I)A = -0.362-inm
Percentage is very minor when compared to the camber effects at initial conditions.
AS%Diff = - 100
Am + As p
%Diff = -1.135
D-3


APPENDIX E
Approximate Time Step Method Calculations


Approximate Time Step Method for Bridge 19045.
Section Properties for the calculations (input data): kip lkip = 1000-lb
h = 72-in RH = 72
L = 137.5-ft
lbSD .0
WD= 0 .0 6 8 2 kipin
lbf - 270000-
pu in
fpi pu-0 .7 5
fy 0.9fpupy pu
Surf = (30+ 26 - (6 + 10.11 + 2.83 + 51.5 + 10.59 + 7.5)-2)-in
Surf = 233.06 "in
Sstr = 4.57-in
Num str = 42
ydrpCL = 15in Ydrp_END = 62in
Num drp 12
Num = Num str Numdrp
A Num-0.1531 in2ps
A -= 4-0.79-in2s
A = 8.2674 in2
min thick = 6.inches
Num str (str)+ Numdrp- (ydrpCL)Y psCL Num ps_CL = 6.89.in
Y psEND -
Num str ( str) Num drp ( drp END) SNupsEND = 17.33222 ainNum -
Specific Data for each of the individual members of Bridge 19045, take from data found inAppendix B.
Data from:B11-S2B12-S2B13-S2B14-S2B15-S2B16-S2B17-S2B18-S2B19-S2B20-S2
It
600350
600051
599283
598897
601774
598897
597081
600159
601774
601021
4i4Sin CG
34.85
34.86
34.87
34.87
34.82
34.87
34.90
34.86
34.82
34.85
-in fcprimecpnme
9000
9110
9400
9550
8500
9550
10300
9070
8500
8760
lbin2in
e CL = CG YpsCL e cCL = 27.98222 'in
e c END CG - yps END
(All members haveapproximately this sameeccentricity.)
E-1
ksi kip.i2in
k := 1

Now consider the concrete properties of the section:
A - 786-in 2
gz= 0..9 n = 8 x 0..n
E - 40000. pm .z- + 1000000-cTz ipme n2 n2
WDweight -A
A
lbweight = 149.93588 *-
ft3
Results for:B11-S2B12-S2B13-S2B14-S2B15-S2B16-S2B17-S2B18-S2B19-S2B20-S2
Mix Design Properties:
fines = 1534-lb Agg = 1578-lb %fineagg
w c ratio = 0.31
Ibcement = 750-.
yd3
slump = 5.5-in
Other Calculated Properties:
fines 100(Agg + fines)
%fineagg = 49.29306
E 2 8 5 0 0 -kps .2in
WSDL 2
MSDc 88
Input the Initial Deflection values: (from spread sheet)
Initial Camber withInitial Elastic Losses
4.55
4.53
4.49
4.47
S4.63pso 4.47
4.36
4.54
4.63
L4.59
/ in
Initial Self WeightDeflection
-2.29
-2.28
-2.25
-2.24
-2.33A Di - 2.2-in1-2.24
-2.18
-2.28
2.33
1-2.31
InitialSuperimposedDL Deflection
0O
0
0
00
i
0
0
0D 0
E-2
4794.733
4817.853
4878.144
4908.964
4687.818
4908.964
5059.557
4809.462
4687.818
4743.795
.kipS2in
E = 29000- ki
s in2
MDcWD.L2
Enz
Z E
n2 -z Ec z
Input for:
B11-S2Bll-S2B12-S2B13-S2B14-S2B15-S2B16-S2B17-S2B18-S2B19-S2B20-S2

Input the time to be considered for each of the members:(Time at which the camber is considered corresponds to when the field data was
collected on each of the individual members.)B11 B12 B13 B14 B15 B16 B17 B18 B19 B20
Time 1 1 3 3 1 1 1 1 1 1to belookedat fromrelease
t=to finalset ofmeasureddata.
6 6 4 4 4 4 3 3 14 14
22 22 20 20 17 17 16 16 27 27
35 35 33 33 30 30 29 29 35 35
43 43 41 41 38 38 37 37 60 60
68 68 66 66 63 63 62 62 96 96
104 104 102 102 99 99 98 98 154 154
162 162 160 160 157 157 156 156 500 500
10000 10000 10000 10000 10000 10000 10000 10000 10000 10000
** Note: First row of time matrix needs to be the age of the concrete at loadingof the member. (At release for only dead loading).
At Service Loads for the section, determine the losses by various methods
At=Ag+Aps.(nl- 1) +As.(n2- 1)
P. ,=f (APS
Stress in concrete at the level of the steel
M Dc- e cCLz Atz I tz M ItzCS
z z z
(Mitchell uses the transformed section properties in calculatingthe stresses in the section - relating to the strains (pg. 140))
II"II
I~I
-I
-2.66905
-2.6712
-2.67514
-2.6766
-2.66063
-2.6766
-2.6866
-2.67079
-2.66063
-2.66651
kip.2in
A) PCI Total Prestress Losses Estimation
1. Elastic Shortening
K -1es = 1
SESz -K es 1E. f^esE csz
z
2. Creep
K CR 2 Assume NWC not sand-light weight
M SDce c CL ki- - f sd ° kipCSdz I sd 2tz in
Z
E-3

CRz = KCR
3. Shrinkage....
AVS -
Surf
/ (E p fcsz7E\ C csdz)
V S = 3.37252-in
6 ( 1/-6 vsSH = 8.2--10 -0.06 . - (K in "
SH = 5 .2 19 4 9 kip.2in2
4. Relaxation
lbK re 5000 J = 0.04 C : 1.0
.2in
RE- [Kre- J.CR+ SH +ES-Eps)j-C
Loss Data for the Individual Members:
Results for:B11-S22B12-S2B13-S2B14-S2B15-S2B16-S2B17-S2B18-S2B19-S2B20-S2
ES
0.000557
0.000554
0.000548
0.000545
0.000568
0.000545
0.000531
0.000555
0.000568
0.000562
CR=
31.72978
31.60298
31.25836
31.07914
32.35103
31.07914
30.26677
31.65325
32.35103
32.04001
5. Total Losses
Loss = RE + CR + SH + sES .12.•psIo Loss
%loss - - 100fp
f e pi-Losspe pt
Results for:B11-S2B12-S2B13-S2B14-S2B15-S2B16-S2B17-S2B18-S2B19-S2B20-S2
100- RH).Eps
.kipS 2in
2.88743
2.89504
2.91572
2.92647
2.85016
2.92647
2.97521
2.89203
2.85016
2.86882
RE =*kip
S2in
Loss =
55.7016
55.519
55.02275
54.76468
56.5962
54.76468
53.59486
55.5914
56.5962
56.14833
.kipin2in
%loss =
27.50696
27.41679
27.17173
27.04428
27.94874
27.04428
26.4666
27.45254
27.94874
27.72757
146.7984
146.981
147.47725
147.73532
145.9038
147.73532
148.90514
146.9086
145.9038
146.35167
f =pe
.kip. 2in
E-4

B) AASHTO Total Prestress Losses Estimation
1. Elastic Shortening Losses are calculated the same way as in PCI method
ES = ES-Eps-~ I.~'ps
z. Creep I
Assume NWC not sand-light weight
cdszMSDce c CL
Itz
CR -( f S 12cz ccsz f \7czcdsz
0.kipfcds 0 kip
in
CR =c
3. Shrinkage
32.0286
32.05442
32.10164
32.11924
31.92753
32.11924
32.23925
32.0495
31.92753
31.99815
.kipin2in
SH_2 = (17000 - 150-RH)-in2in
SH 2 = 6.2- in2
in
4. Relaxation
CR =- 5000 -- - 0.1ES - 0.05 (SH+ CR )in
5. Total Losses
LossLoss= CR + CR + SH 2 + ES %loss L 100
S s - fipif - f p-Losspe pi
Results for:B11-S2BI -S2B12-S2B13-S2B14-S2B15-S2B16-S2B17-S2B18-S2B19-S2B20-S2
55.6446
55.61207
55.50184
55.43792
55.82814
S55.43792
S55.18636
I 55.63001
S55.82814
55.75527
S146.8554
S146.88793
S146.99816
| 147.06208
146.67186
S147.06208
147.31364
| 146.86999
i 146.67186
R 146.74473
1.55111
1.55616
1.57103
1.57911
1.5251
1.57911
1.61372
1.55389
1.5251
1.53712
.kipS2in
Loss =.kip
n2in
%loss =
27.47881
27.46275
27.40832
27.37675
27.56945
27.37675
27.25252
27.47161
27.56945
27.53347
fpe.kip
in
E-5
F-9 I
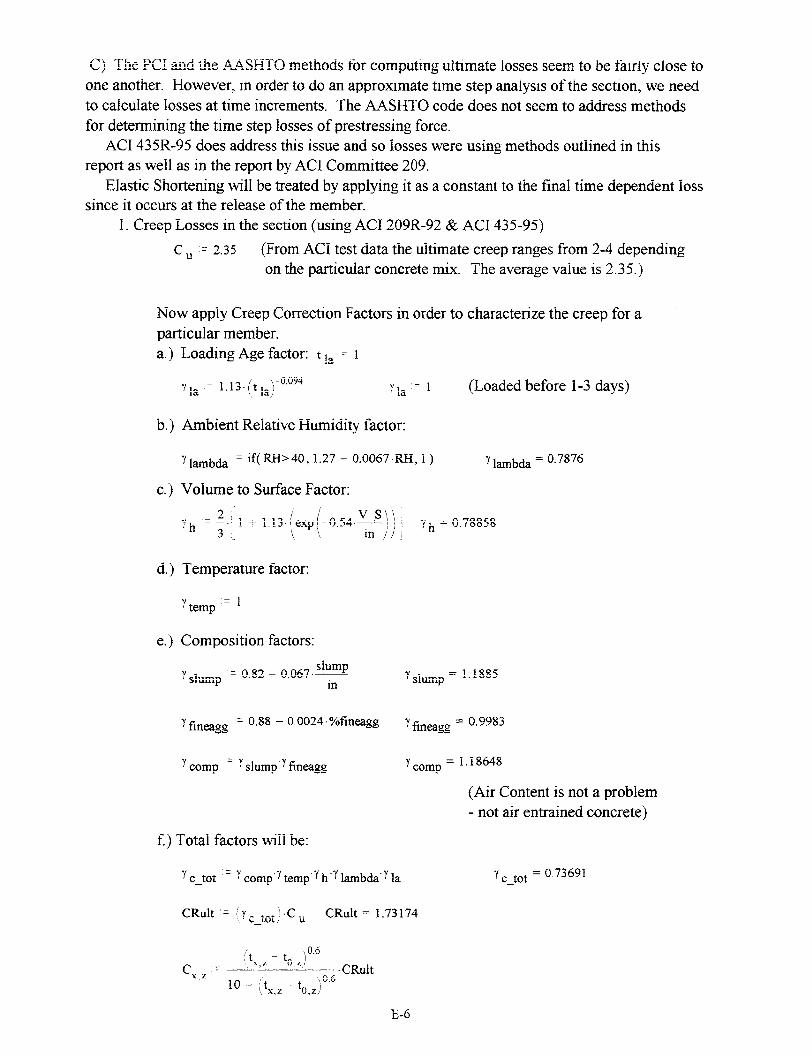
C) The PCI and the .AASHTO methods for computing ultimate losses seem to be fairly close toone another. However, in order to do an approximate time step analysis of the section, we needto calculate losses at time increments. The AASHTO code does not seem to address methodsfor determining the time step losses of prestressing force.
ACI 435R-95 does address this issue and so losses were using methods outlined in thisreport as well as in the report by ACI Committee 209.
Elastic Shortening will be treated by applying it as a constant to the final time dependent losssince it occurs at the release of the member.
1. Creep Losses in the section (using ACI 209R-92 & ACI 435-95)
C, = 2.35 (From ACI test data the ultimate creep ranges from 2-4 dependingon the particular concrete mix. The average value is 2.35.)
Now apply Creep Correction Factors in order to characterize the creep for aparticular member.a.) Loading Age factor: t!a, =
7, = 1.13- t aV0 094a = (Loaded before 1-3 days)l \ 1 taLI I, l -
b.) Ambient Relative Humidity factor:
7 lambda = if(RH> 40, 1.27 - 0.0067 RH, 1) lambda = 0.7876
c.) Volume to Surface Factor:
.h .2 /. v 0.73 in
d.) Temperature factor:
temp = i
e.) Composition factors:
S -= 0 0.0_ nn7. slump = 1.188' slump in slump -.
fineagg = 0.88 + 0.0024 %fineagg fineagg = 0.9983
7comp - s lump fineagg 7ycomp = 1.18648
(Air Content is not a problem- not air entrained concrete)
f.) Total factors will be:
t ctot m Ycompn' temp h' 7 lambda. la c tot = 0.73691
CRult -= ( .,. -C .. CRult = 1.73174\' * . , LU L
t - t. 6C -- ", 0.6 CRult
10 t t v.v10 x,z tz)
E-6

Thus, the resulting creep for the section would be:
CR_3 - ( C -f _ EPi plx,, Z
~ ,zzcs/ iZ,/ ý\ I.: C
pR 3
i ' [ o i- o .. o- ... o o lo lo tlo IS 5 .7 5.7 2.5 2.4 4.5 4.4 3.4 3. 1 8.9 8.
10.5 1i0.5 9.6 19.5 9.7 9.3 8.8 9.2 11i.6 11.5_ 12.5 12.4111.81 11.7112 111.6111.1111.6 12.7 12.61, kip
| 13.3 113.3 12.7 12.61 13.1 12.5 12.1 12.7 15 114.91 in2r n I 1... I 1 W 1 I 1 I|15.21~5.2 14.14.4.7 15.2 14.6 14.2 14.8 17 16.8
S '17 16.9 16.6 16.5 17.1 16.4 16 16.7 18.8 18~.| 18.6 18.6 18.3 18.2 18.9 18.1 17.6 18.5122.6122.41
I 26.4126.3 26 125.9126.9125.9 25.2126.4126.9126.71
2. Shrinkage Component of losses
sh u = 780-10-6
Now apply Shrinkage Correction Factors in order to characterize the creep value(ACI 209R-92 & ACI 435R-95).
a.) Ambient Relative Humidity factor:
7 slam = if(RH 40, 1.4 - 0.01-RH, 1)
7 slambda = if(RH> 80,3.0 - 0.03-RH,y slam) Ys lambda = 0.68
b.) Volume to Surface Factor:
p V SIL-Ss-h 1.2exp - 0.12 in
c.) Temperature factor:
Ss_temp=
d.) Composition factors:
slumps =slump -0.89 0.041 slump7 s slump m- i
Ssh = 0.8 0 0 6 1
s slump =1.1155's slump
Ss_fineagg if( %fineagg> 50,0.9 + 0.002-%fineagg,0.3 + 0.014-%fineagg)
Ss_fineagg = 0.9901
cementvscem 0.75 + 0.00036- c
yd3emlb
yd31v = 1.02' s cem (Air Content is not a problem
- not air entrained concrete)
Ss_comp s_ slump ' sfineagg s_cem Sscomp = 1.12655
E-7

e.) Total factors will be:
7 stot s_comp' 7 stemp7 s_h'7 s_lambda7 stot = 0. 6 13 3 1
(t tSxz 0 ,z /e shx 55 + (tz - t s-hu Y 7 tot
Thus the loss of prestress due to the shrinkage at various time steps is equal to:
SH3 -= -EpsSH-3xz shx zE
For VariousTime steps
SH3 =
For Girders B 11-B20
0
1.14
3.77
5.21
5.9
3,:~.'Sc'~-LcII`'I1,
'"'--
7.49
8.89
10.16
13.56
5.9
7.49
8.89
10.16
13.56
3. Reduced Relaxation losses for the section (considering relaxation to begin at 18 hoursafter stressing, approximately at the time of casting).
In order to account for the reduced relaxation due to the Initial losses, we need tofind the intrinsic relaxation and multiply it by a reduction factor in order to get thereduced relaxation.( ACI 209R-92 section 3.7. )
The intrinsic relaxation, relaxation of strand in a constant tensile lab test, can befound using the formula below:
log (24-tz) f
f - f x_ _ z ' pfsrx,z pi 45 fXZ [ ,•py055 (from table 3.7.1 ACI 209R-92)
For Girders B 1I-B20
For VariousTime steps
fsr
1.76
2.75
3.47
3.73
3.84
4.1
4.33
4.58
6.86
1.76
2.75
3.47
3.73
3.84
4.1
4.33
4.58
6.86
2.37
2.53
3.42
3.7
3.82
4.08
4.32
4.57
6.86
2.37
2.53
3.42
3.7
3.82
4.08
4.32
4.57
6.86
1.76
2.53
3.33
3.64
3.77
4.05
4.3
4.56
6.86
1.76
2.53
3.33
3.64
3.77
4.05
4.3
4.56
6.86
1.76
2.37
3.3
3.62
3.76
4.05
4.3
4.56
6.86
1.76
2.37
3.3
3.62
3.76
4.05
4.3
4.56
6.86
1.76
3.22
3.58
3.73
4.03
4.29
4.55
5.2
6.86
1.76
3.22
3.58
3.73
4.03
4.29
4.55
5.2
6.86
Skipin2in
E-8
0
0.24
3.22
4.81
5.57
7.28
8.76
10.1
13.56
0
0.24
3.22
4.81
5.57
7.28
8.76
10.1
13.56
0
0.71
3.07
4.71
5.48
7.22
8.73
10.08
13.56
0
0.71
3.07
4.71
5.48
7.22
8.73
10.08
13.56
0
0.48
2.92
4.6
5.39
7.17
8.7
10.06
13.56
0
0.48
2.92
4.6
5.39
7.17
8.7
10.06
13.56
*kipin2in
0
1.14
3.77
5.21
II
ILtI;
6ýýI·L..-.
• -.-

In order to account for a situation similar to that in the member itself, a reductionfactor needs to be applied. This factor accounts for the interdependence of therelaxation, creep, and shrinkage in the member by looking at the total losses up tothis point.
ff i fp \fsiy if p 0.8,- , 0.8 fsifsy ratio - if(fsifsy> 0.5,fsifsy,0.5)
-py fpy /
Since determining the reduced relaxation is an iterative process, we need to begin withan estimated set of data for the % of total losses that there is
0.93774 0.93743 1.25804 1.25746 0.93926 0.93615 0.93416 0.93755 0.93926 0.9385
4.99945 4.98603 2.74059 2.73203 4.06539 3.95979 3.28545 3.37925 7.6327 7.58244
9.16383 9.13924 8.3585 8.32649 8.3197 8.09709 7.74642 7.98212 10.0883 10.02302
11.00083 10.97178 10.41987 10.38058 10.51251 10.23601 9.92853 10.22521 11.14347 11.072
S 11.84784 11.81663 11.34355 11.30111 11.48395 11.18438 10.88768 11.21014 13.39973 13.31496
13.74478 13.70911 13.37265 13.32319 13.60313 13.25262 12.96585 13.34478 15.31191 15.21622
15.42853 15.3889 15.13662 15.08125 15.43216 15.03901 14.75116 15.17707 17.06323 16.95688
17.02364 16.97998 16.78031 16.71934 17.13013 16.69557 16.39904 16.86912 20.36124 20.23449
23.43928 23.37817 23.21224 23.12609 23.73922 23.12616 22.73794 23.40239 23.73922 23.58894
1 fsrzlx,z f xzx, 100 fpy
1 = Percentage of strand stress loss to that point in time(excluding initial losses at release). Since we do not know
this value yet because we do not know the relaxationlosses, an iteration must be done in order to determinethese values.
S= A parameter that accounts for reducing relaxation byconsidering the intrinsic relaxation and the losses up tothat point.
For Girders B 11-B20
For VariousTime steps
0 0 0 0 0 0 0 0 0 0
1 0.04 0.04 0.02 0.02 0.03 0.03 0.02 0.02 0.06 0.06
, 0.08 0.08 0.07 0.07 0.07 0.07 0.06 0.07 0.09 0.09
i 0.09 0.09 0.09 0.09 0.09 0.09 0.08 0.09 0.1 0.1
4 0.1 0.1 0.1 0.1 0.1 0.1 0.09 0.1 0.12 0.12
5 0.12 0.12 0.12 0.12 12 0.12 0.12 0.12 11 0.12 0.14 0.13
60.14 0.14 0.13 0.13 0.14 0.13 0.13 0.13 0.15 0.15
7 0.15 0.15 0.15 0.15 0.15 0.15 0.15 0.15 0.18 0.18
S0.21 0.21 0.2 0.2 0.21 0.2 0.2 0.21 0.21 0.21
E-9

Knowing the previous terms, we can determine the relaxation reduction coefficientand apply it to the intrinsic relaxation for the members.(Table 3.7.2 - ACI 209R - 92)
xl 0.. 6
1
0.729
0.516
0.361
0.262
0.150
0.077
0.029
yl 0..7
1
0.798
0.627
0.486
0.375
0.238
0.159
0.102
Red -= ReductTable xloxl x u
(e 0 1 xl,2 RRed 0. 1 - (ReductTable / ,.Xl xl,2
T\ReductTable /xl1,4
Te,ReductTable / t,6(peduct~ab x1,6
1
0.835
0.689
0.564
0.458
0.305
0.216
0.157
1
0.857
0.729
0.615
0.516
0.361
0.262
0.197
1
0.872
0.756
0.652
0.55sfsfsyrange
0.406
0.300
0.230 J
S0.50.55
0.6
0.65
0.7S0.75
S0.8
Red 005 = eductTable x,
Red 0 5 = (ReductTable 3,R 0.15xl/ x1,3
Red 0.3xl
ReductTable T 1)x1,5
Red 05 = (ReductTable 'x,70.5xl xl,7
Srnge reduction ranges are dependent on the ratio of fpi/fpy(initial/yield prestress strand stress) (See Table 3.7.2 ACI 209)
W rangeo linterp (fsifsy_range, Red 0, fsi_fsyratio)
vrange1 = linterp (fsi_fsyrange, Red 0.05, fsi_fsy_ratio)
V range linterp (fsi_fsy_range, Red 0.1, fsi_fsy ratio)
Srange 3 = linterp (fsifsyrange, Red 01 5 , fsi_fsyratio)
Srange 4 ; iinterp fsifsy range, Red 0.2 fsifsyratio)
Srange = linterp (fsi fsy range, Red 0.3 ,fsifsyratio
i range = linterp (fsi_fsy_range, Red 0.4, fsi_fsyratio
'range = linterp fsi_fsyrange, Red 0.5, fsifsyratio)
x,z -linterp a range range x z)
range
[010.05
0.1
0.15
0.2
0.3
0.4
0.5 j
E-10
ReductTable
Fo
0O
0o10
LO
1
0.547
0.289
0.172
0.099
0.013
0.000
0.000
Red 0.2
Red 0.4xxl

Thus, the final Relaxation Reduction Values for Bridge 19045 are
For Girders B 11-B20
For VariousTime steps
0.995 0.995 0.993 0.993 0.994 0.995 0.995 0.995
1 0.901 0.901 0.956 0.957 0.923 0.925 0.941 0.938
S0.809 0.809 0.827 0.827 0.827 0.832 0.84 0.834
0.768 0.769 0.782 0.782 0.779 0.785 0.792 0.785
0.75 0.751 0.761 0.762 0.758 0.765 0.771 0.764
| 0.713 0.714 0.721 0.722 0.716 0.723 0.729 0.721
0.68 0.681 0.686 0.687 0.68 0.688 0.694 0.685
S0.649 0.65 0.654 0.655 0.647 0.656 0.662 0.652
0.549 0.55 0.552 0.553 0.544 0.553 0.56 0.549
The Reduced relaxation is then,
REL- 3x, f sr
For Girders B 11-B20
For VariousTime steps
REL_3 =
1.75
2.479
2.807
2.865
2.884
2.921
2.946
2.972
3.763
1.75
2.48
2.809
2.867
2.886
2.924
2.95
2.976
3.77
2.351
2.417
2.826
2.888
2.905
2.941
2.965
2.989
3.787
2.351
2.418
2.829
2.892
2.909
2.945
2.97
2.995
3.796
1.75
2.332
2.752
2.838
2.859
2.902
2.926
2.951
3.732
1.75
2.338
2.769
2.861
2.885
2.93 1
2.961
2.99
3.796
1.75
2.228
2.767
2.871
2.899
2.949
2.983
3.016
3.839
2.222
2.749
2.846
2.871
2.917
2.945
2.971
3.767
kipin 2In
Thus the final losses for the section can be determined by combining the loss terms:
Losses 3x, = REL 3 x+ SH 3 + CR 3x z + ES z
For Girders B z -B20
For Girders B11-B20
For VariousTime steps
Losses 3 =
[0 I ~447~T4i 7 s 4~ 4 it I
1.75
17.6
25.2
33
36.4
38
41.5
44.7
47.6
59.6
17.6
25.1
32.9
36.3
37.9
41.4
44.5
47.5
59.4
i
6-
&·
18
20.8
31.2
35.1
36.8
40.6
43.9
47
59
17.9
20.6
31.1
34.9
36.7
40.4
43.7
46.8
58.8
17.9
23.8
31.7
35.8
37.6
41.5
44.9
48.1
60.4
17.3
22.9
30.7
34.7
36.4
40.3
43.7
46.8
58.8
16.9
21.3
29.6
33.7
35.5
39.4
42.8
45.9
57.7
17.6
22.1
30.7
34.9
36.8
40.7
44.2
47.3
59.5
17.9
30.4
35
36.9
41.1
44.7
48
54.1
60.4
kip
in 2
17.8
30.2
34.7
36.7
40.8
44.4
47.6
53.8
60
E-11
I -C - L · I . ~ -Z · -· ~ · · Z .·· -.
^j2sc1?
I~"`§
I-
· · ·

f fpi-ESpo pi
P = PP- Losses 3 z-"A pex, z - ),,
Results for:B11-S2B12-S2B13-S2B14-S2B15-S2B16-S2B17-S2B18-S2B19-S2B20-S2
Now determine if another Iteration for X1 needs to be performed:
o -poAps AP =x P - Px°z ex,z
For Girders B 11-B20
For VariousTime steps
AP =
Compare this set of values to the initial guess of the percentage of total losses:
x,z p
For VariousTime steps
For Girders B 11-B20
0.94 0.94 1.26 1.26 0.94 0.94 0.93 0.94
S5 4.99 2.74 2.73 4.07 3.96 3.29 3.38
9.16 9.14 8.36 8.33 8.32 8.1 7.75 7.98
11 10.97 10.42 10.38 10.51 10.24 9.93 10.23
11.85 11.82 11.34 11.3 11.48 11.18 10.89 11.21
13.74 13.71 13.37 13.32 13.6 13.25 12.97 13.34
15.43 15.39 15.14 15.08 15.43 15.04 14.75 15.18
S17.02 16.98 16.78 16.72 17.13 16.7 16.4 16.87
23.44 23.38 23.21 23.13 23.74 23.13 22.74 23.4
E-12
186.63511186.63511
186.69851
186.87082
186.96043
186.32448
186.96043
187.36662
186.67337
186.32448
186.48
.kipin2
in
14.5 14.5 19.4 19.4 14.5 14.5 14.5 14.5
S77.1 77 42.3 42.2 62.6 61.2 50.9 52.2
141.4 141.1 129.1 128.7 128.2 125.2 120 123.2
S169.7 169.3 161 160.4 161.9 158.2 153.8 157.8
S182.8 182.4 175.2 174.7 176.9 172.9 168.7 173
212.1 211.6 206.6 205.9 209.5 204.8 200.8 205.9
S238.1 237.5 233.8 233.1 237.7 232.5 228.5 234.2
262.7 262.1 259.2 258.4 263.9 258.1 254 260.3
S361.7 360.8 358.6 357.4 365.7 357.4 352.2 361.2
*kip
1 =

D.) Approximate Approach to deflection (Brandon's model)
For Girders Bi 1-B20
For Variousime steps
,p
P 73z\
'-a =
.SD 1
K 1.13 tax./ x,
Aspri me
k r
0.095
I 0.995 0.995 0.994 0.994 0.995 0.995 0.995 0.995
d 0.975 0.975 0.986 0.986 0.98 0.98 0.984 0.983
1 0.954 0.954 0.958 0.958 0.958 0.96 0. 9 61 K0.964
S0.94 0.945 0.948 0.948 0.947 0.949 0 .95 0.949
U0.941 0.941 0.943 0.943 0.943 0.944 0.946 0.944
5 0.931 0.931 10.933 0.933 0.932 0.934 0.935 0.933
0.923 0.923 0.924 0.925 0.9 0.925 .926 0.924i 0. 9 5 0. 9 i 5 0. 9 16 0. 9 6i 0.9 14 0.97 i 0.9 8i 0.9 16
i 0.883 0.883 0.88410.88410.8810.8.8410.88610.883
Asprime is steel on the same sideof the centroid as the pretensionedsteel. (See ACI 209R-92, sec 3.5)
o in2
A" sprime
ASs
If As'/Aps <= 2.0 then kr can be used,for all practical purposes kr will be I ifthe nonprestressed steel is minimal.
S r
For non-composite beams, Branson's model can be reduced down to the following equationfor our beams. (Nawy, 423)
6xX./- k r x./ - Di K a r -x, ,.z" N.,
XP
p ax.z r" "xz pso.-O
/i
SSD
For VariousTime steps
5=
v 0.. 8
For Girders Bi i-B20
Soi 1 2 3 4 5 61 7 8 90 2.22 2.21 2.18 2.17 2.2126 2.19 2.1426 219 2 .22 12.26 2.241
1 2.81 2.79 2.46 2.45 2.73 2.65 2.52 2.6 3.12 3.09
2 3.2 3.19 3.12 3.11 3.18 3.09 3.02 3.11 3.31 3.29C ! ,2i
3 3.34 3.32 3.28 3.27 3.34 26 319 3.9 .39 3.3
4 3.39 3.38 3.35I 3.33 3.41 3.33 3.26 3.36 3.53 3.5
S3.51 3.49 3.47 3.46 3.54 3.46 3.39 3.49 3.63 3.61
S3. 3.59 3.57 3.56 3.64 3.56 3.5 3.593.7 3.7
17 3.69 .67 3.66 3.65 3.73 3.65 3 9 3.68 3.913.89
18 4.07 4.06 4.0654.05 4.12.05 399 4.084.124.09
100\ 0ii
E-13
in
2k --,
'.ax.i
2•00


APPENDIX F
Example of Input/Output File for the Program "CRACK"


Bridge 19045, Girder B18-S2 - Using Amin Ghali's.2 1 2 NLCR,NCTYP,NSTYP21 6 2 1 NSEC,NCL,NPSL,NSL1650.0 2 0 AL,INTEG,ISPT
37.14 0.0 DO,SRM20 0.05 NC,DX1 1 0 30.0 30.0 J=1,(ICTYP(J,K),K=I,2),BT(J),BB(J)1 21 6.0 6.0 6.0 NSTRT,NEND,DL,DC,DR2 1 0 30.0 10.0 J=2,(ICTYP(J,K),K=1,2),BT(J),BB(J)1 21 1.5 1.5 1.5 NSTRT,NEND,DL,DC,DR3 1 0 10.0 6.0 J=3,(ICTYP(J,K),K=1,2),BT(J),BB(J)1 21 2.0 2.0 2.0 NSTRT,NEND,DL,DC,DR4 1 0 6.0 6.0 . J=4,(ICTYP(J,K),K=1,2),BT(J),BB(J)1 21 51.5 51.5 51.5 NSTRT,NEND,DL,DC,DR5 1 0 6.0 26.0 J=5,(ICTYP(J,K),K=1,2),BT(J),BB(J)1 21 3.5 3.5 3.5 NSTRT,NEND,DL,DC,DR6 1 0 26.0 26.0 J=6,(ICTYP(J,K),K=1,2),BT(J),BB(J)1 21 7.5 7.5 7.5 NSTRT,NEND,DL,DC,DR1 1 0 341.0 1.836 0.0 J,(IPSTYP(J,K),K=1,2),PL,APSL,DUCTL1 10 10.0 33.5 57.0 NSTRT,NEND,DPSL,DPSC,DPSR10 12 57.0 57.0 57.0 NSTRT,NEND,DPSL,DPSC,DPSR12 21 57.0 33.5 10.0 NSTRT,NEND,DPSL,DPSC,DPSR99 0 0.0 0.0 0.02 1 0 1195.0 6.426 0.0 J,(IPSTYP(J,K),K=1,2),PL,APSL,DUCTL1 21 67.43 67.43 67.43 NSTRT,NEND,DPSL,DPSC,DPSR
99 0 0.0 0.0 0.01 2 3.1600 2.37 J=1,INSTYP(J),ASL(J),DSL(J)1 21 NSTRT,NEND1 28500.0 0.0 1.0 I=1,ES(I),FPTK(I),BETA1(I)2 29000.0 0.0 1.0 I=1,ES(I),FPTK(I),BETA1(I)1 1.0 ITPND,BETA21 4809.0 0.714 I,EC(I),FCT(I)
0.0000 CJI(,1)0.7325 -10.E-30 CHI(I),S(I)
1 -1.750 I,REL99 0.01 21 0.0 0.0 0.0 NSTRT,NEND,ANL,ANC,ANR1 11 0.0 17414.4 23219.2 NSTRT,NEND,AML,AMC,AMR
11 21 23219.2 17414.4 0.0 NSTRT,NEND,AML,AMC,AMR1 0.5 ITPND,BETA21 4809.0 0.714 I,EC(I),FCT(I)
1.1661 CJI(I,1)1.1661 CJI(I,2)0.7526 -35.E-5 CHI(I),S(I)
1 -1.221 I,REL99 0.01 21 0.0 0.0 0.0 NSTRT,NEND,ANL,ANC,ANR1 21 0.0 0.0 0.0 NSTRT,NEND,AML,AMC,AMR
Bridge 19045, Girder B18-S2 - Using Amin Ghali's.6 1 2 NLCR,NCTYP,NSTYP
21 6 2 1 NSEC,NCL,NPSL,NSL1650.0 2 0 AL,INTEG,ISPT
37.14 0.0 DO,SRM20 0.05 NC,DX
F-1
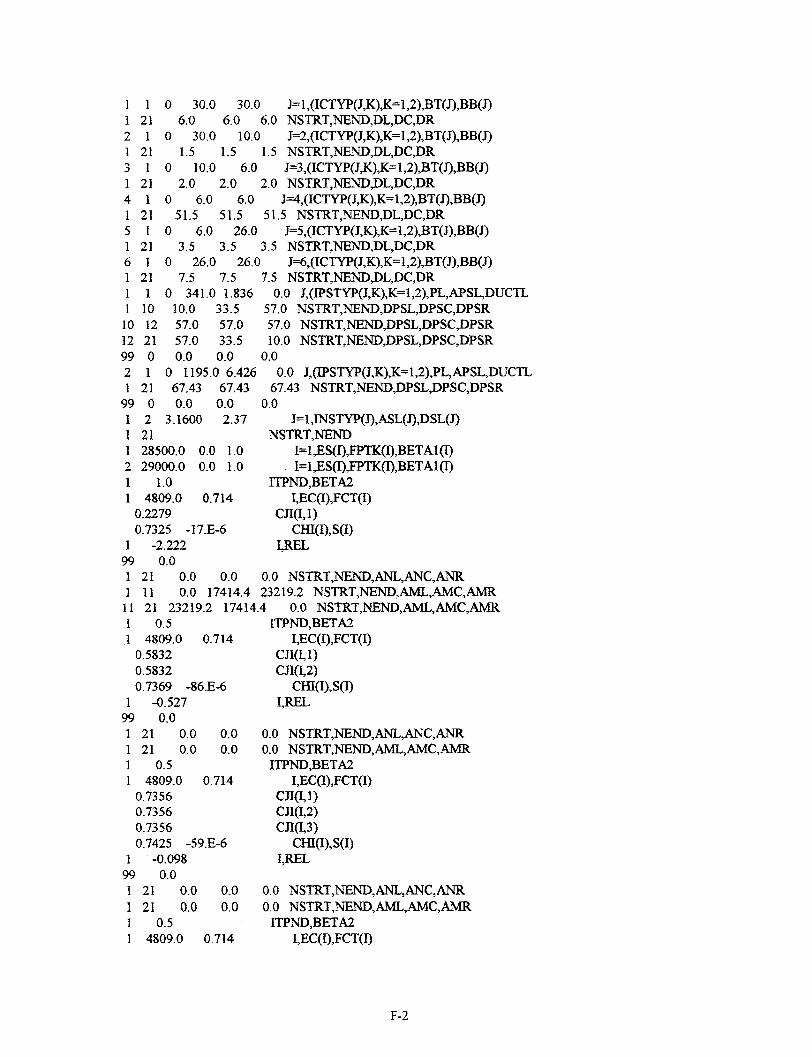
112131415161111012992
67.43 67.430.0 0.0
3.1600 2.37
500.0 0.0 1.0)00.0 0.0 1.0
1 1.01 4809.0 0.714
0.22790.7325 -17.E-6
1 -2.22299 0.01 21 0.0 0.1 11 0.0 1741
67.43 NSTRT,NEND,DPSL,DPSC,DPSR0.0
J=1,INSTYP(J),ASL(J),DSL(J)NSTRT,NEND
I=1,ES(I),FPTK(I),BETA1(I)I=1,ES(I),FPTK(I),BETA1(I)
ITPND,BETA2IEC(I),FCT(I)
CJI(I,1)CHI(I),S(I)
I,REL
0 0.0 NSTRT,NEND,ANL,ANC,ANR14.4 23219.2 NSTRT,NEND,AML,AMC,AMR
11 21 23219.2 17414.4 0.0 NSTRT,NEND,AML,AMC,AMR1 0.51 4809.0 0.714
0.58320.58320.7369 -86.E-6
1 -0.52799 0.01 21 0.0 0.01 21 0.0 0.01 0.51 4809.0 0.714
0.73560.73560.73560.7425 -59.E-6
1 -0.09899 0.01 21 0.0 0.01 21 0.0 0.01 0.51 4809.0 0.714
ITPND,BETA2I,EC(I),FCT(I)
CJI(I, 1)CJI(I,2)
CHI(I),S(I)I,REL
0.0 NSTRT,NEND,ANL,ANC,ANR0.0 NSTRT,NEND,AML,AMC,AMR
ITPND,BETA2I,EC(I),FCT(I)
cJI(I1)CJ(1,2)CJI(1,3)
CHI(I),S(I)I,REL
0.0 NSTRT,NEND,ANL,ANC,ANR0.0 NSTRT,NEND,AML,AMC,AMR
ITPND,BETA2I,EC(I),FCT(I)
F-2
121121121121121121
110122101
0 30.0 30.0 J=1,(ICTYP(J,K),K=1,2),BT(J),BB(J)6.0 6.0 6.0 NSTRT,NEND,DL,DC,DR
0 30.0 10.0 J=2,(ICTYP(J,K),K=1,2),BT(J),BB(J)1.5 1.5 1.5 NSTRT,NEND,DL,DC,DR
0 10.0 6.0 J=3,(ICTYP(J,K),K=1,2),BT(J),BB(J)2.0 2.0 2.0 NSTRT,NEND,DL,DC,DR
0 6.0 6.0 J=4,(ICTYP(J,K),K=1,2),BT(J),BB(J)51.5 51.5 51.5 NSTRT,NEND,DL,DC,DR
0 6.0 26.0 J=5,(ICTYP(J,K),K=1,2),BT(J),BB(J)3.5 3.5 3.5 NSTRT,NEND,DL,DC,DR
0 26.0 26.0 J=6,(ICTYP(J,K),K=1,2),BT(J),BB(J)7.5 7.5 7.5 NSTRT,NEND,DL,DC,DR
0 341.0 1.836 0.0 J,(IPSTYP(J,K),K=1,2),PL,APSL,DUCTL10.0 33.5 57.0 NSTRT,NEND,DPSL,DPSC,DPSR57.0 57.0 57.0 NSTRT,NEND,DPSL,DPSC,DPSR57.0 33.5 10.0 NSTRT,NEND,DPSL,DPSC,DPSR0.0 0.0 0.0
0 1195.0 6.426 0.0 J,(IPSTYP(J,K),K=1,2),PL,APSL,DUCTL1 21
99 01 21 211 2852 29(
-
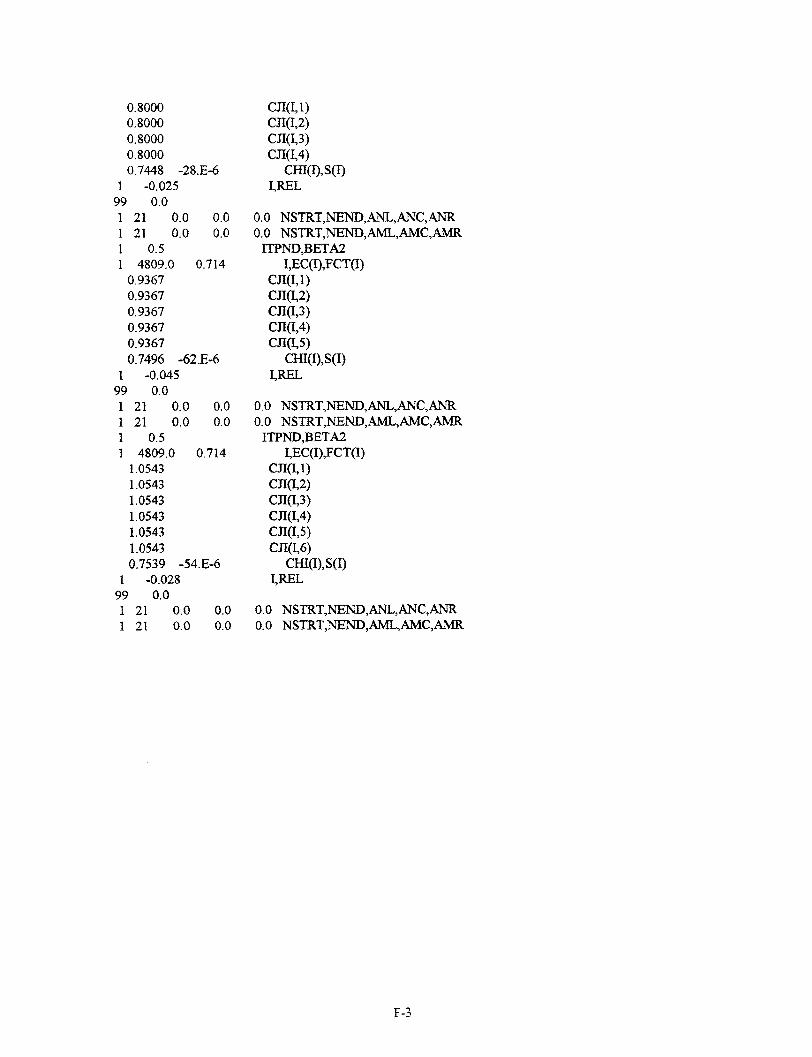
0.80000.80000.80000.80000.7448 -28.E-6
1 -0.02599 0.01 21 0.0 0.01 21 0.0 0.01 0.51 4809.0 0.714
0.93670.93670.93670.93670.93670.7496 -62.E-6
1 -0.04599 0.01 21 0.0 0.01 21 0.0 0.01 0.51 4809.0 0.714
1.05431.05431.05431.05431.05431.05430.7539 -54.E-6
1 -0.02899 0.01 21 0.0 0.01 21 0.0 0.0
CJI(, 1)CJI(I,2)CJI(I,3)CJI(I,4)
CHI(I),S(I)I,REL
0.0 NSTRT,NEND,ANL,ANC,ANR0.0 NSTRT,NEND,AML,AMC,AMR
ITPND,BETA2I,EC(I),FCT(I)
CJI(, 1)CJI(I,2)CJI(I,3)CJI(,4)CJI(I5)
CHI(I),S(I)I,REL
0.0 NSTRT,NEND,ANL,ANC,ANR0.0 NSTRT,NEND,AML,AMC,AMR
ITPND,BETA2I,EC(I),FCT(I)
CJI(I,1)CJI(I,2)CJI(,3)CJI(I,4)CJI(I,5)CJI(I,6)
CHI(I),S(I)LREL
0.0 NSTRT,NEND,ANL,ANC,ANR0.0 NSTRT,NEND,AML,AMC,AMR
F-3

** *
* * * *
* * ANALYSIS OF PRESTRESSED AND NONPRESTRESSED * ** * REINFORCED CO(NCRETE MEMBERS * *** BY *** * MAMDOUH M. EL-BADRY * ** * THE UNIVERSITY OF CALGARY * ** * RELEASE 1.0 JANUARY, 1985 ** * VERSION 2.0 FEBRUARY. 1991 * *
* * * *
* * ****** ****** **,** ****** ** ** * *
* * ** **i * ** *** ** g ** ** * *
* * REFERENCE - ALI. A. AND ELBADRY, M., SE **RS*ANUAL *
* * * O****** TER* ** ** PROGRAM *"RAK"RESEARCH
* * *EPT N. C******** *D *T. O * *F L *
>* * * * UN Y OF *CAL* ** ** ** ** *GY J Y
* * 4 *
* *FEBR , * *
* * REFERENCE -ITIALO A. AND ELBADRY, M., ISERS MANIAL * *S* AND COMPUTER PROGRAM "CRACK". RESEARCH ** REPORT NO. CE85-IL DEPT. OF CIVIN ENGG. ** * THE UNIVERSITY OF CALGARY, JANUARY 1985 ** .* (REVISED FEBRUARY. 1991). **
* * ** *********G*****U*****SIYOCAGR *
* *
* CONDITIONS OF RELEASE OF ** PROGRAMS FROM THE* STRUCTURAL ENGINEERING S(OOFTWARE LIBRARY* DEPARTMENT OF CIVIL ENGINEERING ** THIE UNIVERSITY OF CALGARY, CANADA* *
* *
* 1. THE SOFTWARE IS RELEASED TO THE RECEIVING PARTY ONLY, AND MAY NOT ** BE PASSED ON TO OTIHER PARTIES WITHOUT WRITTEN PERMISSION OF THE ** DEPARTMENT OF CIVIL ENGINEERING, THE UNIVERSITY OF CALGARY. ** *
* 2. THIE SOFTWARE IS NOT GUARANTEED TO BE FREE OF ERRORS. ** *
* 3. THE AUTHORS SHALL BE ACKNOWLEDGED IN ANY PUBLISHED REFERENCE TO THE ** SOFTWARE, OR RESULTS DERIVED FROM IT. ** *
**** *** ** ** * >***********************;*
F-4
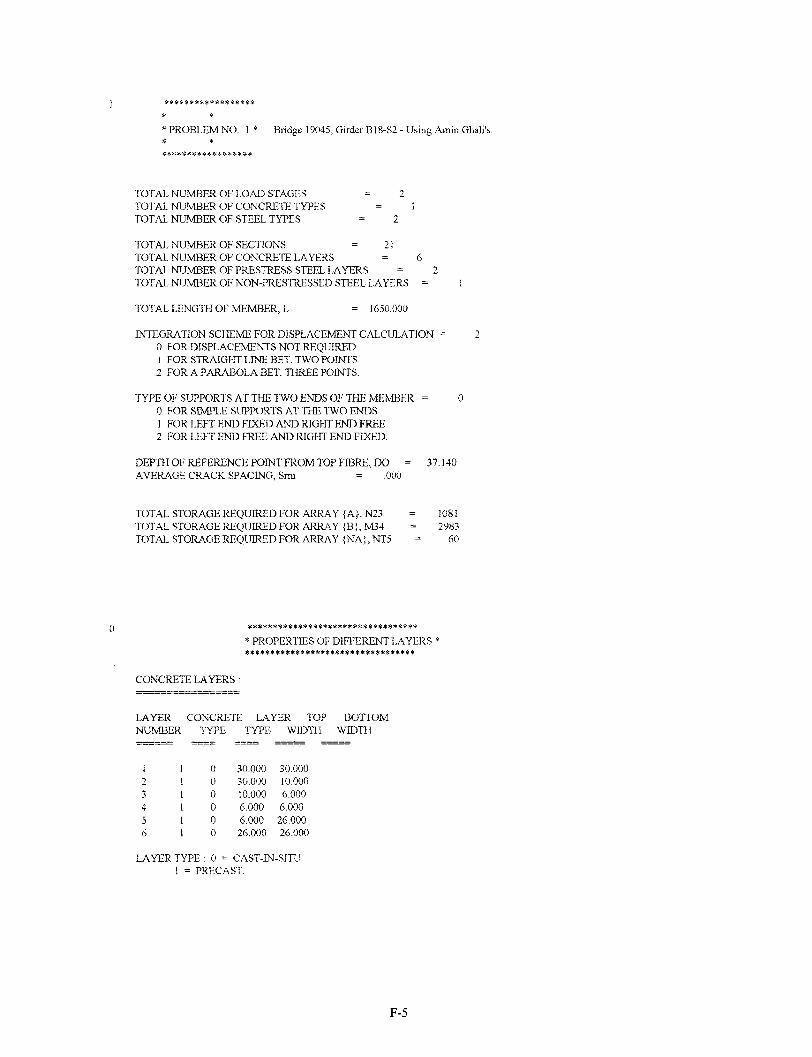
* PROBLEM NO. 1 * Bridge 19045, Girder B18-S2 - Using Amin Ghali's.
TOTAL NUMBER OF LOAD STAGES = 2TOTAL NUMBER OF CONCRETE TYPES =TOTAL NUMBER OF STEEL TYPES = 2
TOTAL NUMBER OF SECTIONS = 21TOTAL NUMBER OF CONCRETE LAYERS = 6TOTAL NUMBER OF PRESTRESS STEEL LAYERS =TOTAL NUMBER OF NON-PRESTRESSED STEEL LAYERS =
TOTAL LENGTH OF MEMBER, L = 1650.000
INTEGRATION SCHEME FOR DISPLACEMENT CALCULATION =0 FOR DISPLACEMENTS NOT REQUIRED1 FOR STRAIGHT LINE BET. TWO POINTS2 FOR A PARABOLA BET. THREE POINTS.
TYPE OF SUPPORTS AT THE TWO ENDS OF THIE MEMBER = 00 FOR SIMPLE SUPPORTS AT THE TWO ENDSI FOR LEFT END FIXED AND RIGHT END FREE2 FOR LEFT END FREE AND RIGHT END FIXED.
DEPTH OF REFERENCE POINT FROM TOP FIBRE. DO = 37.140AVERAGE CRACK SPACING, Srm = .000
TOTAL STORAGE REQUIRED FOR ARRAY {A}, N23 = 1081TOTAL STORAGE REQUIRED FOR ARRAY {B}, M34 = 2983TOTAL STORAGE REQUIRED FOR ARRAY {NA}, NT5 = 60
* PROPERTIES OF DIFFERENT LAYERS ***********************************
CONCRETE LAYERS :
LAYER CONCRETE LAYER TOP BOTTOMNUMBER TYPE TYPE WIDTH WTDTH
1 1 0 30.000 30.0002 1 0 30.000 10.0003 1 0 10.000 6.0004 1 0 6.000 6.0005 1 0 6.000 26.0006 1 0 26.000 26.000
LAYER TYPE: 0 = CAST-IN-SITUI = PRECAST.
F-5

PRESTRESS STEEL LAYERS:
LAYER STEEL METHOD) OF PRESTRESS AREA OF AREA OFNUMBER TYPE PRESTRESSING FORCE STEEL DUCT
1 1 0 341.000 1.836000 .0000002 1 0 1195.000 6.426000 .000000
METHOD OF PRESTRESSING: 0 = PRETENSIONING>0 = POST-TENSIONING (THE NUMBER INDICATES THE
LOAD STAGE AT WHICII THE LAYER IS TENSIONED)
NON-PRESTRESSED STEEL LAYERS :
LAYER STEEL AREA OFNUMBER TYPE STEEL
1 2 3.16000
* PROPERTIES OF DIFFERENT LAYERS IN EACH SECTION *
SECTION DISTANCE X CONCRETE PRESTRESS NON-PRESTRESSEDNUMBER FROM LEFT END LAYERS STEEL LAYERS STEEL LAYERS
LAYER DEPTH DEPTH AT AREA FIRST MOMENT LAYER DEPTH LAYER DEPTHNUMBER AT TOP BOTTOM == MOMENT OF INERTIA NUMBER === NUMBER
1 .0000OOE+00 1 .000 6.000 .180000E+03 -.614520E+04 .210337E+06 1 10.000 1 2.3702 6.000 7.500 .300000E+02 -.915450E+03 .279401E+05 2 67.4303 7.500 9.500 .160000E+02 -.459573E+03 .132057E+054 9.500 61.000 .309000E+03 -.584010E+03 .693992E+055 61.000 64.500 .560000E+02 .145458E+04 .378317E+056 64.500 72.000 .195000E+03 .606645E+04 .189641E+06
2 .500000E-01 1 .000 6.000 .180000E+03 -.614520E+04 .210337E+06 1 15.222 1 2.3702 6.000 7.500 .300000E+02 -.915450E+03 .279401E+05 2 67.4303 7.500 9.500 .160000E+02 -.459573E+03 .132057E+054 9.500 61.000 .309000E+03 -.584010E+03 .693992E+055 61.000 64.500 .560000E+02 .145458E+04 .378317E+056 64.500 72.000 .195000E+03 .606645E+04 .189641E+06
3 .100000E+O 1 .000 6.000 .1800u00E+03 -.614520E+04 .210337E+06 1 20.444 1 2.3702 6.000 7.500 .300000E+02 -.915450E+03 .279401E+05 2 67.4303 7.500 9.500 .160000E+02 -.459573E+03 .132057E+054 9.500 61.000 .309000E+03 -.584010E-+3 .693992E+055 61.000 64.500 .560000E+02 .145458E+04 .378317E+056 64.500 72.000 .195000E+03 .606645E+04 .189641E+±06
4 .150000E+00 1 .000 6.000 .180000E+03 -.614520E+04 .210337E+06 1 25.667 1 2.3702 6.000 7.500 .300000E+02 -.915450E+03 .279401E+05 2 67.4303 7.500 9.500 .160000E+02 -.459573E+03 .132057E+05
F-6

4 9.500 61.000 .309000E+03 -.584010E+03 .693992E+055 61.000 64.500 .560000E+02 .145458E+04 .3783 17E+056 64.500 72.000 .195000E+03 .606645E+04 .189641E+06
5 .200000E+00 1 .000 6.000 .180000E+03 -.614520E+04 .210337E+06 1 30(.889 1 2.3702 6.000 7.500 .300000E+02 -.915450E+03 .27940(1E+05 2 67.4303 7.500 9.500 .160000E+02 -.459573E+03 .132057E+054 9.500 61.000 .309000E+03 -.584010E+03 .693992E+055 61.000 64.500 .560000E+02 .145458E+04 .378317E+056 64.500 72.000 .195000E+03 .606645E+04 .189641E+06
6 .250000E+00 1 .000 6.000 .180000E+03 -.614520E+04 .210337E+06 1 36.111 1 2.3702 6.000 7.500 .300000E+02 -.915450E+03 .279401E+05 2 67.4303 7.500 9.500 .160000E+02 -.459573E+03 .132057E+054 9.500 61.000 .309000E+03 -.584010E+03 .693992E+055 61.000 64.500 .560000E+02 .145458E+04 .378317E+056 64.500 72.000 .195000E+03 .606645E+04 .189641E+06
7 .300000E+00 1 .000 6.000 .180000E+03 -.614520E+04 .210337E+06 1 41.333 1 2.3702 6.000 7.500 .300000E+02 -.915450E+03 .279401E)+05 2 67.4303 7.500 9.500 .160000E+02 -.459573E+03 .132057E+054 9.500 61.000 .309000E+03 -.584010E+03 .693992E+055 61.000 64.500 .560000E+02 .145458E+04 .378317E+056 64.500 72.000 .195000E+03 .606645E+04 .189641E+06
8 .350000E+00 1 .000 6.000 .180000E+03 -.614520E+04 .210337E+06 1 46.556 1 2.3702 6.000 7.500 .300000E+02 -.915450E-+03 .279401E+05 2 67.4303 7.500 9.500 .160000E+02 -.459573E+03 .132057E+054 9.500 61.000 .309000E+03 -.584010E+03 .693992E+055 61.000 64.500 .560000E+02 .145458E-+04 .378317E+056 64.500 72.000 .195000E+03 .606645E+04 .189641E+06
9 .400000E+00 1 .000 6.000 .180000E+03 -.614520E+04 .210337E+06 1 51.778 1 2.3702 6.000 7.500 .300000E+02 -.915450E+03 .279401E+05 2 67.4303 7.500 9.500 .160000E+02 -.459573E+03 .132057E+054 9.500 61.000 .309000E+03 -.584010E+03 .693992E+055 61.000 64.500 .560000E+02 .145458E+04 .378317E+056 64.500 72.000 .195000E+03 .606645E+04 .189641E+06
10 .450000E+00 1 .000 6.000 .1800(00E+03 -.614520E+04 .210337E+06 1 57.000 1 2.3702 6.000 7.500 .300000E+02 -.915450E+03 .279401E+05 2 67.4303 7.500 9.500 .160000E+02 -.459573E+03 .132057E+054 9.500 61.000 .309000E+03 -.584010E+03 .693992E+055 61.000 64.500 .560000E+02 .145458E+04 .378317E+056 64.500 72.000 .195000E+03 .606645E+04 .189641E+06
11 .500000E0 100000 00 6.000 .180000E+03 -.614520E+04 .210337E-+06 1 57.000 1 2.3702 6.000 7.500 .300000E+02 -.915450E+03 .279401E+05 2 67.4303 7.500 9.500 .160000E+02 -.459573E+03 .132057E+054 9.500 61.000 .309000E+03 -.584010E+03 .693992E+055 61.000 64.500 .560000E+02 .145458E+04 .378317E+056 64.500 72.000 .195000E+03 .606645E+04 .189641E+06
12 .550000E+00 1 .000 6.000 .180000E+03 -.614520E+04 .210337E+06 1 57.000 1 2.3702 6.000 7.500 .300000E+02 -.915450E+03 .279401E+05 2 67.4303 7.500 9.500 .160000E+02 -.459573E+03 .132057E+054 9.500 61.000 .309000E+03 -.584010E+03 .693992E+055 61.000 64.500 .560000E+02 .145458E+04 .378317E+056 64.500 72.000 .195000E+03 .606645E+04 .189641E+06
F-7

13 .600000E+00 1 .000 6.000 .180000E+03 -.614520E+04 .210337E+06 1 51.778 1 2.3702 6.000 7.500 .300000E+02 -.915450E+03 .279401E+05 2 67.4303 7.500 9.500 .160000E+02 -.459573E+03 .132057E+054 9.500 61.000 .309000E+03 -.584010E+03 .693992E+055 61.000 64.500 .560000E+02 .145458E+04 .378317E+056 64.500 72.000 .195000E+03 .606645E+)4 .189641E+06
14 .650000E+00 1 .000 6.000 .180000E+03 -.614520E+04 .210337E+06 1 46.556 1 2.3702 6.000 7.500 .300000E+02 -.915450E+03 .279401E+05 2 67.4303 7.500 9.500 .160000E+02 -.459573E+03 .132057E+054 9.500 61.000 .309000E+03 -.584010EI+3 .693992E+055 61.000 64.500 .560000E+02 .145458E+04 .378317E+,056 64.500 72.000 .195000E+03 .606645E+04 .189641E+06
15 .700000E+00 1 .000 6.000 .180000E+03 -.614520E+04 .210337E+06 1 41.333 1 2.3702 6.000 7.500 .300000E+02 -.915450E+03 .279401E+05 2 67.4303 7.500 9.500 .160000E+02 -.459573E+03 .132057E+054 9.500 61.000 .309000E+03 -.584010E+03 .693992E+055 61.000 64.500 .560000E+02 .145458E+04 .378317E+056 64.500 72.000 .195000E+03 .606645E+04 .189641E+06
16 .750000E+00 1 .000 6000 0000E+ 1 0 6 .8 +03 -.614520E+04 .210337E+06 1 36.111 1 2.3702 6.000 7.500 .300000E+02 -.915450E+03 .279401E+05 2 67.4303 7.500 9.500 .160000E+02 -.459573E+03 .132057E+054 9.500 61.000 .309000E+03 -.584010E+03 .693992E+055 61.000 64.5(00 .560000E+02 .145458E+04 .378317E+056 64.500 72.000 .195000E+03 .606645E+04 .189641E+06
17 .800000E+00 1 .000 6.000 .180000E+03 -.614520E+04 .210337E+06 1 30.889 1 2.3702 6.000 7.500 .300000E+02 -.915450E+03 .279401E+05 2 67.4303 7.500 9.500 .160000E+02 -.459573E+03 .132057E+054 9.500 61.000 .309000E+03 -.584010E+03 .693992E+055 61.000 64.500 .560000E+02 .145458E+04 .378317E+056 64.500 72.000 .195000E+03 .606645E+04 .189641E+06
18 .850000E+00 1 .000 6.000 .180000E+03 -.614520E+04 .210337E+06 1 25.667 1 2.3702 6.000 7.500 .300000E+02 -.915450E+03 .279401E+05 2 67.4303 7.500 9.500 .160000E+02 -.459573E+03 .132057E+054 9.500 61.000 .309000E+03 -.584010E+03 .693992E+055 61.000 64.500 .560000E+02 .145458E+04 .378317E+056 64.500 72.000 .195000E+03 .606645E+04 .189641E+06
19 .900000E+00 1 .000 6.000 .180000E+03 -.614520E+04 .210337E+06 1 20.444 1 2.370
2 6.000 7.500 .300000E+02 -.915450E+03 .279401E+05 2 67.4303 7.500 9.500 .160000E+02 -.459573E+03 .132057E+054 9.500 61.000 .309000E+03 -.584010E+03 .693992E+055 6 1.000 64.500 .560000E+02 .145458EF+04 .3783171E+056 64.500 72.000 .195000E+03 .606645E+04 .189641E+06
20 .950000E+00 1 .000 6.000 .180000E+03 -.614520E+04 .210337E+06 1 15.222 1 2.3702 6.000 7.500 .300000E+02 -.915450E+03 .279401E+05 2 67.4303 7.500 9.500 .160000E+02 -.459573E+03 .132057E+054 9.500 61.000 .309000E+03 -.584010E+03 .693992E+055 61.000 64.500 .560000E+02 .145458E+04 .378317E+056 64.500 72.000 .195000E+03 .606645E+04 .18964IE+06
21 .100000E+01 1 .000 6.000 .180000E+03 -.614520E+04 .210337E+06 1 10.000 1 2.370
F-8

6.000 7.500 .300000E+027.500 9.500 .160000E+029.500 61.000 .309000E+03
61.000 64.500 .560000E-0264.500 72.000 .195000E•-03
-.915450E+03-.459573E+03-.584010E+03-.145458E+04.606645E+0)4
.279401E+05 2 67.430
.132057E+05.693992E+05.378317E+05.18964 IEH+06
* RESULTS FOR INTERVAL NO. 1 ** *
INDICATOR FOR TIME-DEPENDENT EFFECTS =0 FOR ANALYSIS NOT REQUIRED1 FOR ANALYSIS REQUIRED.
COEFFICIENT FOR LOAD TYPE. BETA21.0 FOR FIRST LOADING
0.5 FOR SUSTAINED ORREPEATED LO,)ADING.
= 1.0
* TABLE OF CONCRETE PROPERTIES *
TYPE EC1 CJI CHI S ECBAR FCT
1 .48090E+04 .000 .733 -.10000E-28 .48090E+04
* TABLE OF STEEL PROPERTIES *
TYPE ES FPTK BETAI REL
.714
1 .285000E-15 .OOOOOOE+002 .290)00E+)05 .0(O)(.(E+00
1.0 -. 175000E+011.0 .0OOO0E+00
DISPLACEMENTS :
ELONGATION = -.622347E+00ROTATION AT THE LEFT END = -.581941E-02ROTATION AT THE RIGHT END = .581941E-02CENTRAL DEFLECTION = -.226836E+01MAXIMUM DEFLECTION = -.226836E+01
AT SECTION NO. 11
* ULTS FOR RV NO.* RESULTS FOR INTERVAL NO. 2*
:? *
F-9

INDICATOR FOR TIME-DEPENDENT EFFECTS =0 FOR ANALYSIS NOT REQUIRED1 FOR ANALYSIS REQUIRED.
COEFFICIENT FOR LOAD TYPE. BETA2 = .51.0 FOR FIRST LOADING
0.5 FOR SUSTAINED ORREPEATED LOADING.
* TABLE OF CONCRETE PROPERTIES *^*)**t*E**S****i**a*>*)*)** c****
TYPE ECI CJI CHI S ECBAR FCT
1 .48090E+04 1.166 .753 -.35000E-03 .25612E+04 .714
* TABLE OF STEEL PROPERTIES *
TYPE ES FPTK BETA1 REL
1 .285000E+05 .000000E+-002 .290000E+05 .000000E+4O0
1.0 -.122100E+011.0 .000000E-+00
DISPLACEMENTS :
ELONGATION = -. 172204E+01ROTATION AT THE LEFT END = -.104449E-01ROTATION AT THE RIGHT END = .104449E-01CENTRAL DEFLECTION = -.398679E+0 1MAXIMUM DEFLECTION = -.398679E+01
AT SECTION NO. 11
F-10