REPLICATED AGRONOMIC COTTON EVALUATION (RACE) ROLLING...
21
REPLICATED AGRONOMIC COTTON EVALUATION (RACE) ROLLING PLAINS OF TEXAS, 2013 http://cotton.tamu.edu/
Transcript of REPLICATED AGRONOMIC COTTON EVALUATION (RACE) ROLLING...
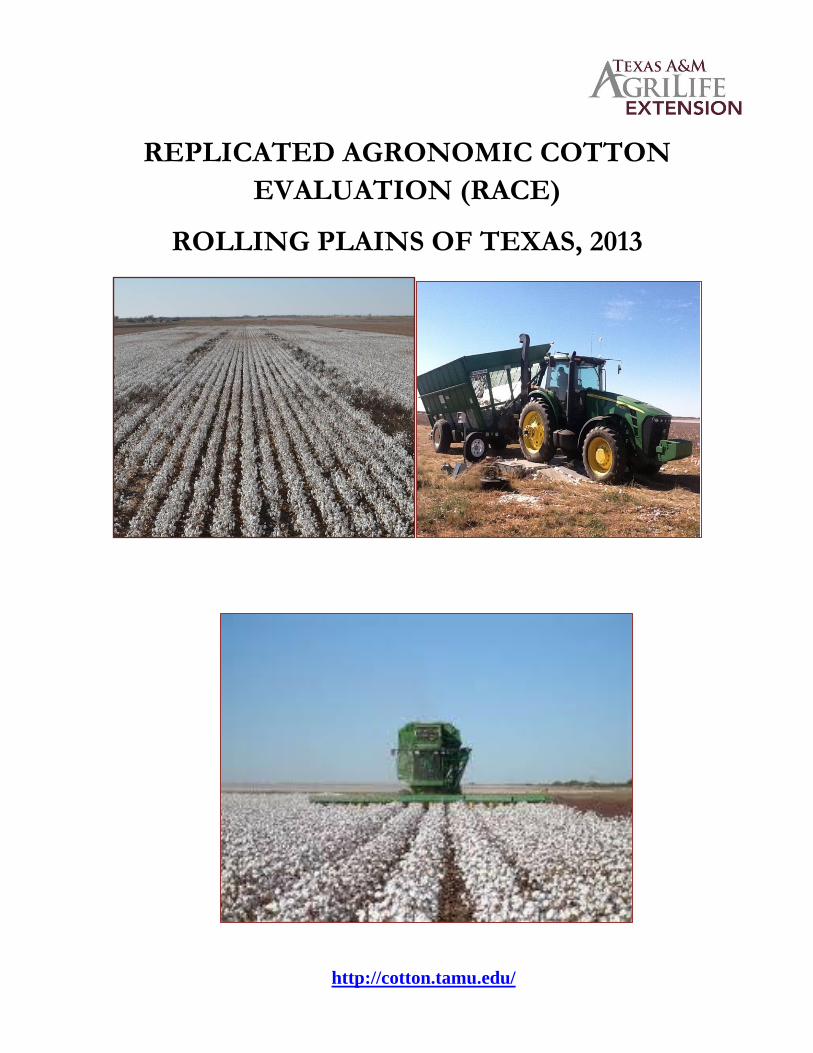
REPLICATED AGRONOMIC COTTON
EVALUATION (RACE)
ROLLING PLAINS OF TEXAS, 2013
http://cotton.tamu.edu/
REPLICATED AGRONOMIC COTTON EVALUATION (RACE)
ROLLING PLAINS OF TEXAS, 2013
Dr. Gaylon Morgan1, Professor and Extension Cotton Specialist
Dr. Jason Woodward2, Associate Professor and Plant Pathologist
Jonathan Ramirez1, Extension Assistant
Dale Mott1, Extension Program Specialist Cotton
Ira Yates2, Technician
Bobby Rodriguez2, Technician
Katie White3, County Extension Agent
Jerry Copeland4, County Extension Agent
Steven Sparkman5, County Extension Agent
Dale Dunlap6, County Extension Agent
Langdon Reagan7, County Extension Agent
Martin Shaw8 County Extension Agent
Lonnie Jenschke9 County Extension Agent
Texas A&M AgriLife Extension Service 1,2Department of Soil and Crop Sciences
1Vernon, 2Quanah, 3Wellington, 4Knox City, 5Wheeler, 6Childress, 7Seymour, Texas
ACKNOWLEDGMENTS
Appreciation is expressed to the cooperators that provided their land, equipment and time
in assisting with prepping, planting, managing and harvesting of these plots throughout
the year. All cooperators are listed in Table 1. We would like to extend our appreciation
to Cotton Incorporated through the Texas State Support Committee for their partial
funding of these trials.
2013 HIGHLIGHTS
Variety selection is the most important decision made during the year. Unlike herbicide
or insecticide decisions that can be changed during the season to address specific
conditions and pests, variety selection is made only once, and variety selection dictates
the management of a field for the entire season. Variety decisions should be based on
genetics first and transgenic technology second. Attention should be focused on
agronomic characteristics such as yield, maturity, and fiber quality when selecting
varieties. Figure 1 outlines the Best Management Practices for variety selection.
From the latest data available, transgenic varieties accounted for 99% of the states
acreage in 2013. According to the USDA-Agricultural Marketing Service “Cotton Varieties
Planted 2013 Crop” survey, the estimated percentage of upland cotton planted to specific
Brands in Texas are as follows, Alltex had 2.5%, Americot/NexGen had 20%, Bayer
CropScience – FiberMax had 39%, Bayer CropScience – Stoneville had 2.5%, Croplan
Genetics had 0.5%, Delta Pine had 16%, Dyna-Grow had 1.4%, and Phytogen had 7%.
To assist Texas cotton producers in remaining competitive in the Rolling Plains of Texas,
the Texas A&M AgriLife Extension Service Agronomy program has been conducting,
large plot, on-farm, replicated variety trials (Fig. 2). This approach provides a good
foundation of information that can be utilized to assist the variety selection process. We
have also been evaluating the use of TopGuard® for Cotton Root Rot Control for the past
three years to help farmers control cotton root rot. This last year we began evaluating
soil fertility and conservation tillage management strategies to maximize producers’
profitability.
Ten Replicated Agronomic Cotton Evaluation (RACE) Trials were planted in 2013. Only
eight out of the ten trials where harvested due to the drought and are listed in Table 1.
Two cotton root rot trials were initiated to determine the efficacy and phytoxicity of
TopGuard® for managing cotton root rot in the Rolling Plains of Texas. We also initiated
two nitrogen fertilizer rate trials, a center pivot irrigated location and a dryland location in
Knox county.
All the cotton seed companies with RoundupFlex® or Glytol® and Bt2® or Widestrike®
technology had the opportunity to include at least one variety in the RACE trial at each
location. All varieties were treated with either Aeris or Avicta Complete Pak seed
treatment. Included in this publication are the cotton variety descriptions provided by the
company. See descriptions on page 7-8 these trials were initiated on producers’ farms
and are replicated trials.
The cotton root rot trials were initiated on producer’s fields and were large plot replicated
trials also. TopGuard® was applied in a 5 inch “T band” at planting following the double
disk openers on the planter, but before the closing wheels closed the seed furrow. A
second method included this year at one site was the “Y split” in furrow application
method. TopGuard® was applied at three rates, 1.0 pint, 1.5 pints, 2.0 pints, and an
untreated plot. TopGuard® was applied at with a carrier volume of 6.0 gallons per acre
through 8002EVS nozzles at a speed of 4.7 miles per hour. The target plant population
was 5 seeds/ft.
Table 1 provides a list of planting and harvest dates, row spacing and plot area for each
location. Tables 2 and 3 shows numerical rankings based upon lint yield for the variety
trials across all locations. Variety trials were planted at Vernon (Table 4), Quanah (Table
5), Wellington (Table 6 and Table 7), Knox City (Table 8), Wheeler (Table 9), Childress
(Table 10), and Seymour (Table 11). Tables 12 and 13 include the results from both Knox
City Root Rot Replicated Trials. Tables 4 to 11 include the cotton variety yield data, fiber
quality, loan value, and gross lint value for each individual location. Tables 12 and 13
shows treatment yield data, and fiber analysis for the root rot locations. All locations were
ginned at Lubbock with the research gin with one lint cleaner. Additionally, all data were
standardized to a color grade and leaf of 41-4.
The statistical analysis quantifies the variability of the test site conditions, such as soil
type, harvesting, insect damage, etc. A CV (coefficient of variation) of 15% or less is
generally considered acceptable and means the data are dependable. Trials with a small
LSD (least significant difference) indicate more consistency within the trial and higher
likelihood of identifying differences among varieties. A trial location with a large LSD and
large CV indicates a higher degree of variability at the trial location. Non-significance is
represented as “NS” and indicates no differences among the varieties within the data
column at a 5% significance level.
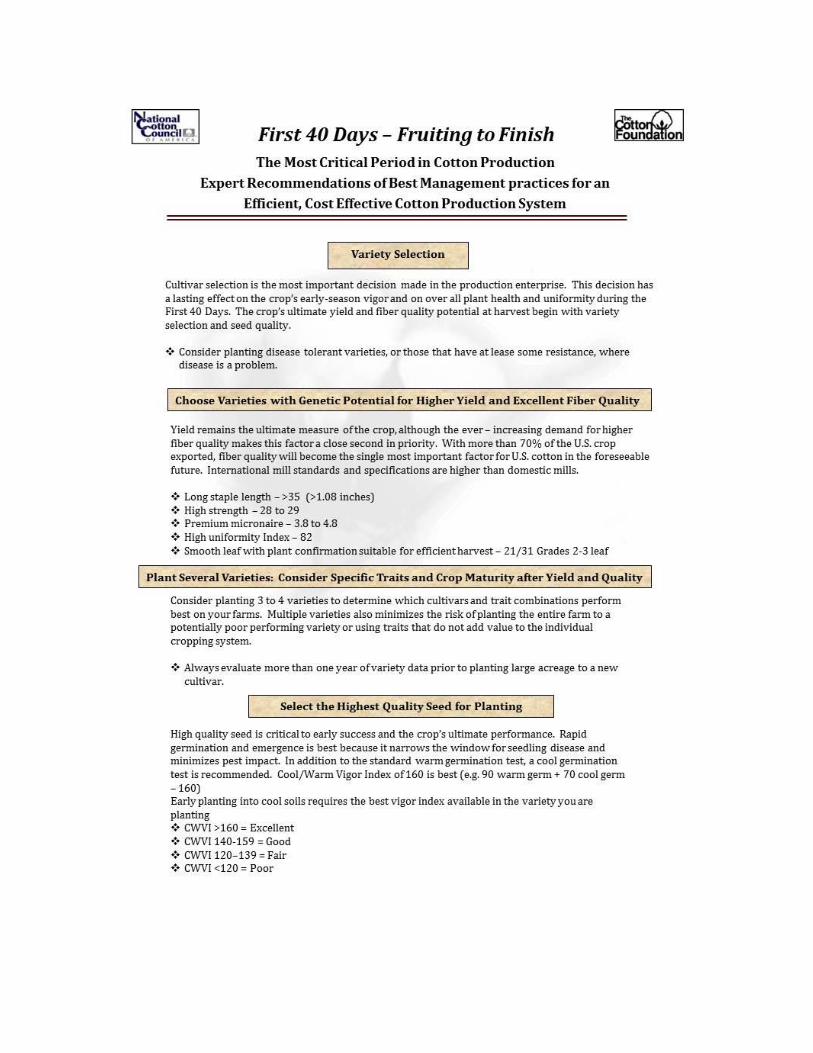
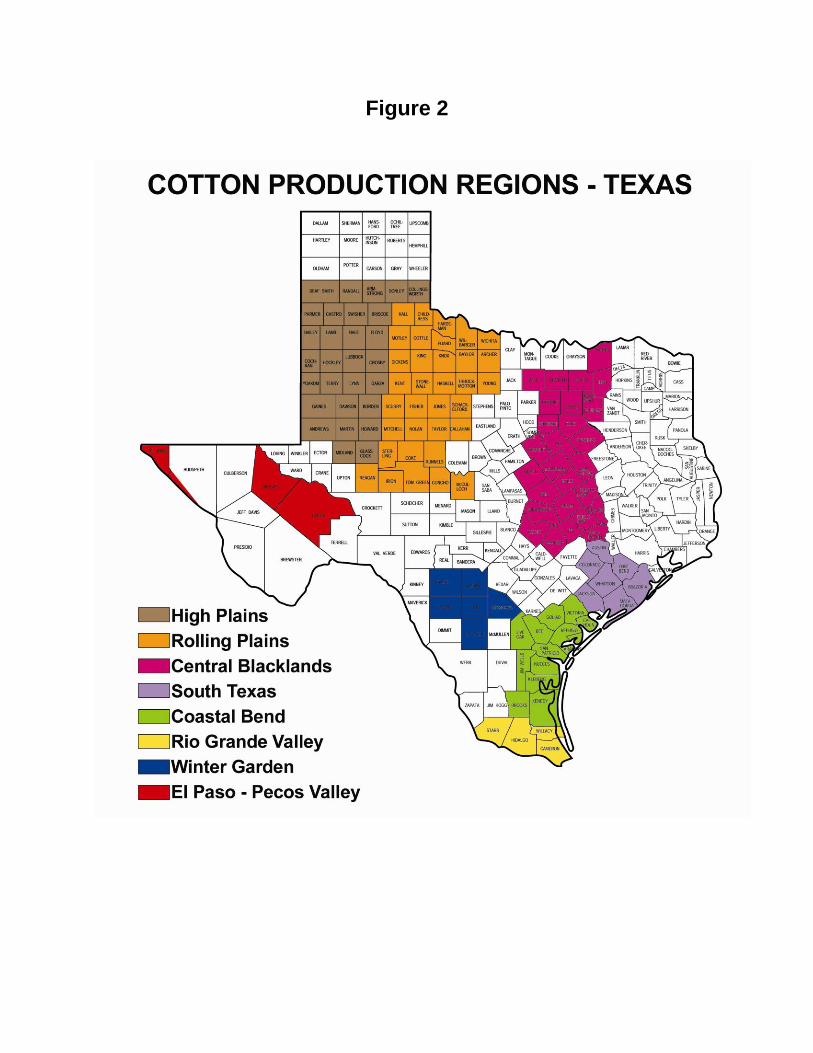
Figure 2
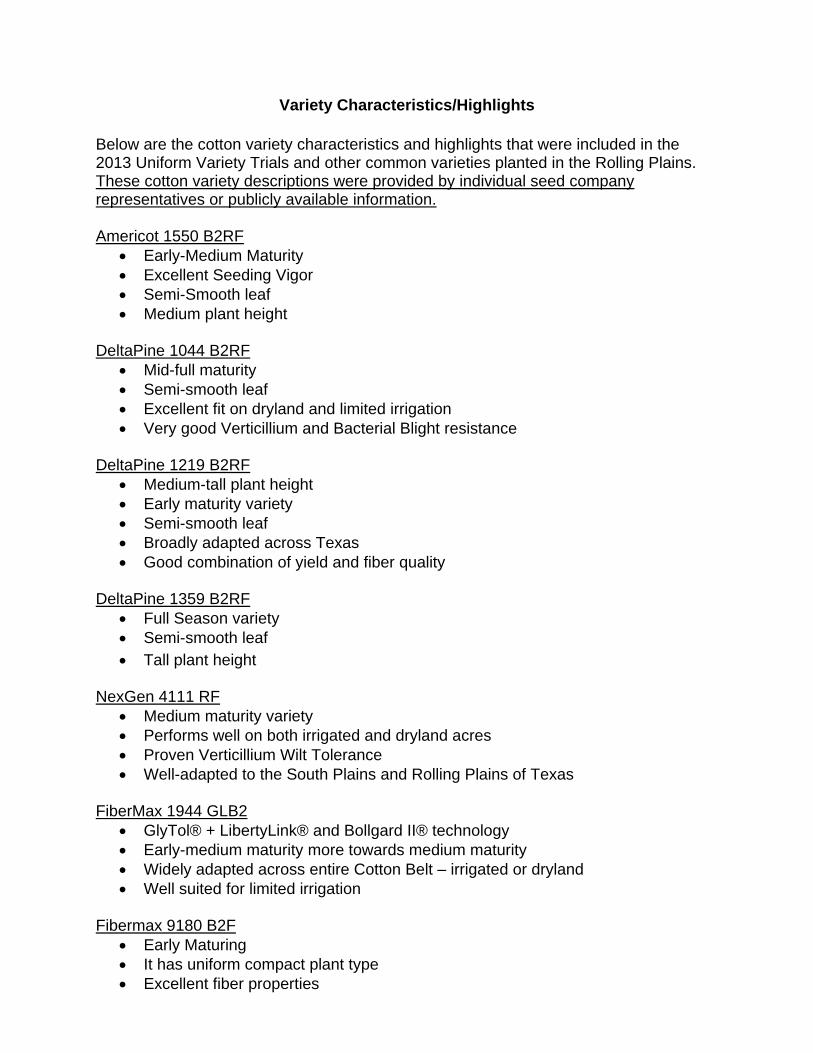
Variety Characteristics/Highlights
Below are the cotton variety characteristics and highlights that were included in the 2013 Uniform Variety Trials and other common varieties planted in the Rolling Plains. These cotton variety descriptions were provided by individual seed company representatives or publicly available information. Americot 1550 B2RF
Early-Medium Maturity
Excellent Seeding Vigor
Semi-Smooth leaf
Medium plant height DeltaPine 1044 B2RF
Mid-full maturity
Semi-smooth leaf
Excellent fit on dryland and limited irrigation
Very good Verticillium and Bacterial Blight resistance
DeltaPine 1219 B2RF
Medium-tall plant height
Early maturity variety
Semi-smooth leaf
Broadly adapted across Texas
Good combination of yield and fiber quality DeltaPine 1359 B2RF
Full Season variety
Semi-smooth leaf
Tall plant height NexGen 4111 RF
Medium maturity variety
Performs well on both irrigated and dryland acres
Proven Verticillium Wilt Tolerance
Well-adapted to the South Plains and Rolling Plains of Texas FiberMax 1944 GLB2
GlyTol® + LibertyLink® and Bollgard II® technology
Early-medium maturity more towards medium maturity
Widely adapted across entire Cotton Belt – irrigated or dryland
Well suited for limited irrigation Fibermax 9180 B2F
Early Maturing
It has uniform compact plant type
Excellent fiber properties
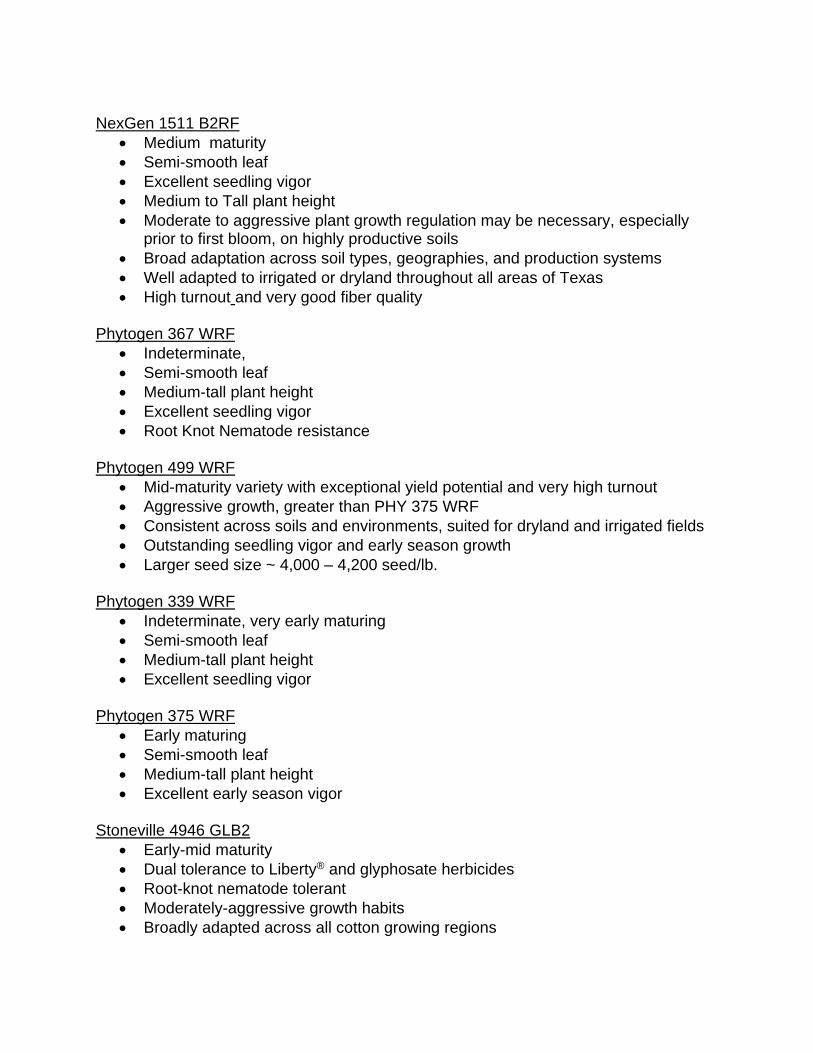
NexGen 1511 B2RF
Medium maturity
Semi-smooth leaf
Excellent seedling vigor
Medium to Tall plant height
Moderate to aggressive plant growth regulation may be necessary, especially prior to first bloom, on highly productive soils
Broad adaptation across soil types, geographies, and production systems
Well adapted to irrigated or dryland throughout all areas of Texas
High turnout and very good fiber quality Phytogen 367 WRF
Indeterminate,
Semi-smooth leaf
Medium-tall plant height
Excellent seedling vigor
Root Knot Nematode resistance Phytogen 499 WRF
Mid-maturity variety with exceptional yield potential and very high turnout
Aggressive growth, greater than PHY 375 WRF
Consistent across soils and environments, suited for dryland and irrigated fields
Outstanding seedling vigor and early season growth
Larger seed size ~ 4,000 – 4,200 seed/lb.
Phytogen 339 WRF
Indeterminate, very early maturing
Semi-smooth leaf
Medium-tall plant height
Excellent seedling vigor Phytogen 375 WRF
Early maturing
Semi-smooth leaf
Medium-tall plant height
Excellent early season vigor Stoneville 4946 GLB2
Early-mid maturity
Dual tolerance to Liberty® and glyphosate herbicides
Root-knot nematode tolerant
Moderately-aggressive growth habits
Broadly adapted across all cotton growing regions
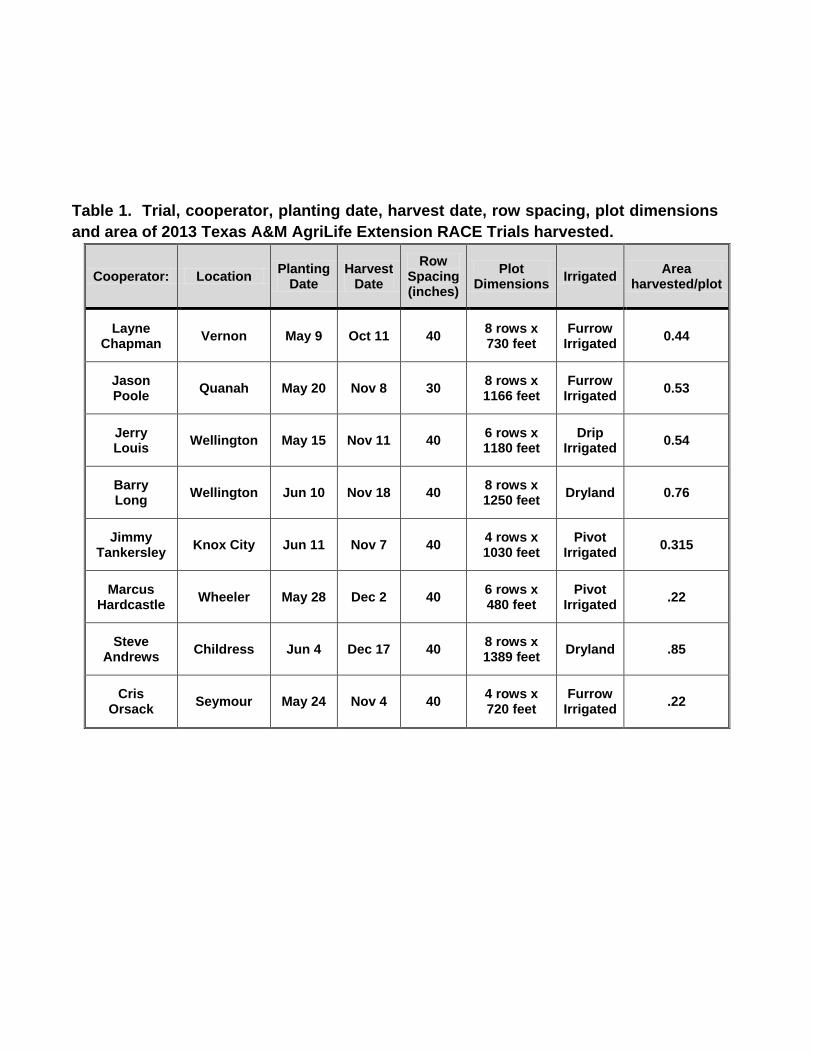
Table 1. Trial, cooperator, planting date, harvest date, row spacing, plot dimensions
and area of 2013 Texas A&M AgriLife Extension RACE Trials harvested.
Cooperator: Location Planting
Date Harvest
Date
Row Spacing (inches)
Plot Dimensions
Irrigated Area
harvested/plot
Layne Chapman
Vernon May 9 Oct 11 40 8 rows x 730 feet
Furrow Irrigated
0.44
Jason Poole
Quanah May 20 Nov 8 30 8 rows x 1166 feet
Furrow Irrigated
0.53
Jerry Louis
Wellington May 15 Nov 11 40 6 rows x 1180 feet
Drip Irrigated
0.54
Barry Long
Wellington Jun 10 Nov 18 40 8 rows x 1250 feet
Dryland 0.76
Jimmy Tankersley
Knox City Jun 11 Nov 7 40 4 rows x 1030 feet
Pivot Irrigated
0.315
Marcus Hardcastle
Wheeler May 28 Dec 2 40 6 rows x 480 feet
Pivot Irrigated
.22
Steve Andrews
Childress Jun 4 Dec 17 40 8 rows x 1389 feet
Dryland .85
Cris Orsack
Seymour May 24 Nov 4 40 4 rows x 720 feet
Furrow Irrigated
.22
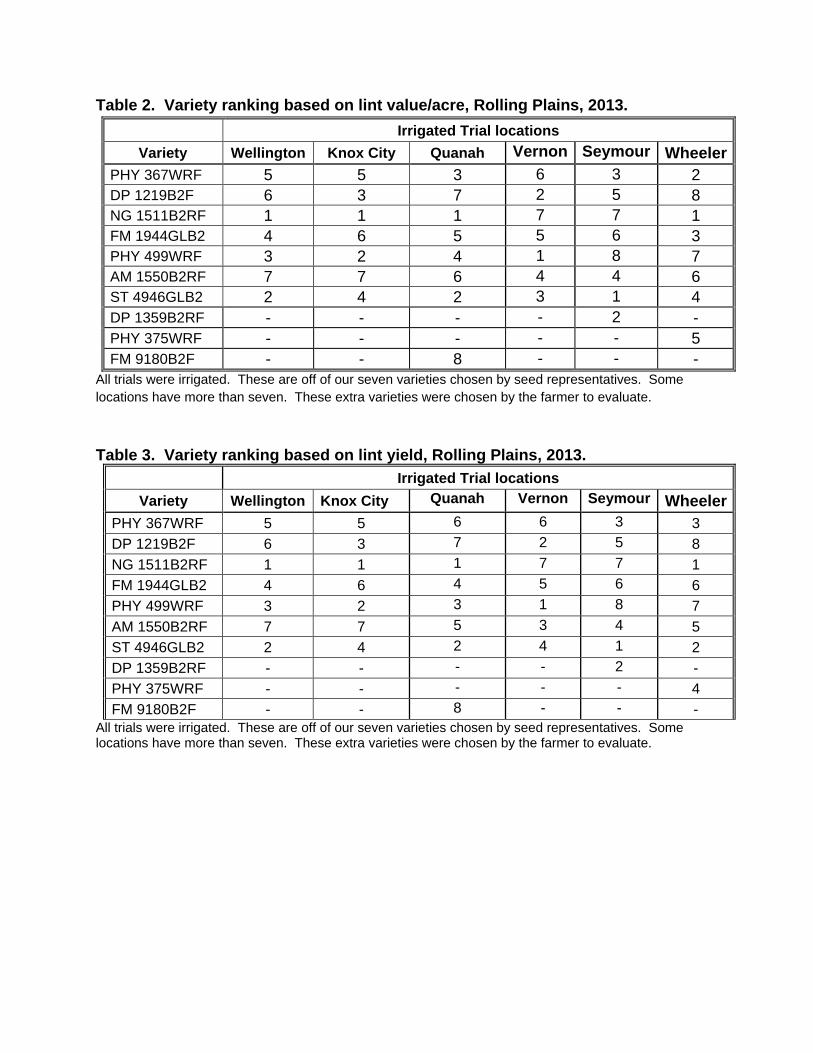
Table 2. Variety ranking based on lint value/acre, Rolling Plains, 2013. Irrigated Trial locations
Variety Wellington Knox City Quanah Vernon Seymour Wheeler
PHY 367WRF 5 5 3 6 3 2
DP 1219B2F 6 3 7 2 5 8
NG 1511B2RF 1 1 1 7 7 1
FM 1944GLB2 4 6 5 5 6 3
PHY 499WRF 3 2 4 1 8 7
AM 1550B2RF 7 7 6 4 4 6
ST 4946GLB2 2 4 2 3 1 4
DP 1359B2RF - - - - 2 -
PHY 375WRF - - - - - 5
FM 9180B2F - - 8 - - -
All trials were irrigated. These are off of our seven varieties chosen by seed representatives. Some
locations have more than seven. These extra varieties were chosen by the farmer to evaluate.
Table 3. Variety ranking based on lint yield, Rolling Plains, 2013.
Irrigated Trial locations
Variety Wellington Knox City Quanah Vernon Seymour Wheeler
PHY 367WRF 5 5 6 6 3 3
DP 1219B2F 6 3 7 2 5 8
NG 1511B2RF 1 1 1 7 7 1
FM 1944GLB2 4 6 4 5 6 6
PHY 499WRF 3 2 3 1 8 7
AM 1550B2RF 7 7 5 3 4 5
ST 4946GLB2 2 4 2 4 1 2
DP 1359B2RF - - - - 2 -
PHY 375WRF - - - - - 4
FM 9180B2F - - 8 - - -
All trials were irrigated. These are off of our seven varieties chosen by seed representatives. Some locations have more than seven. These extra varieties were chosen by the farmer to evaluate.
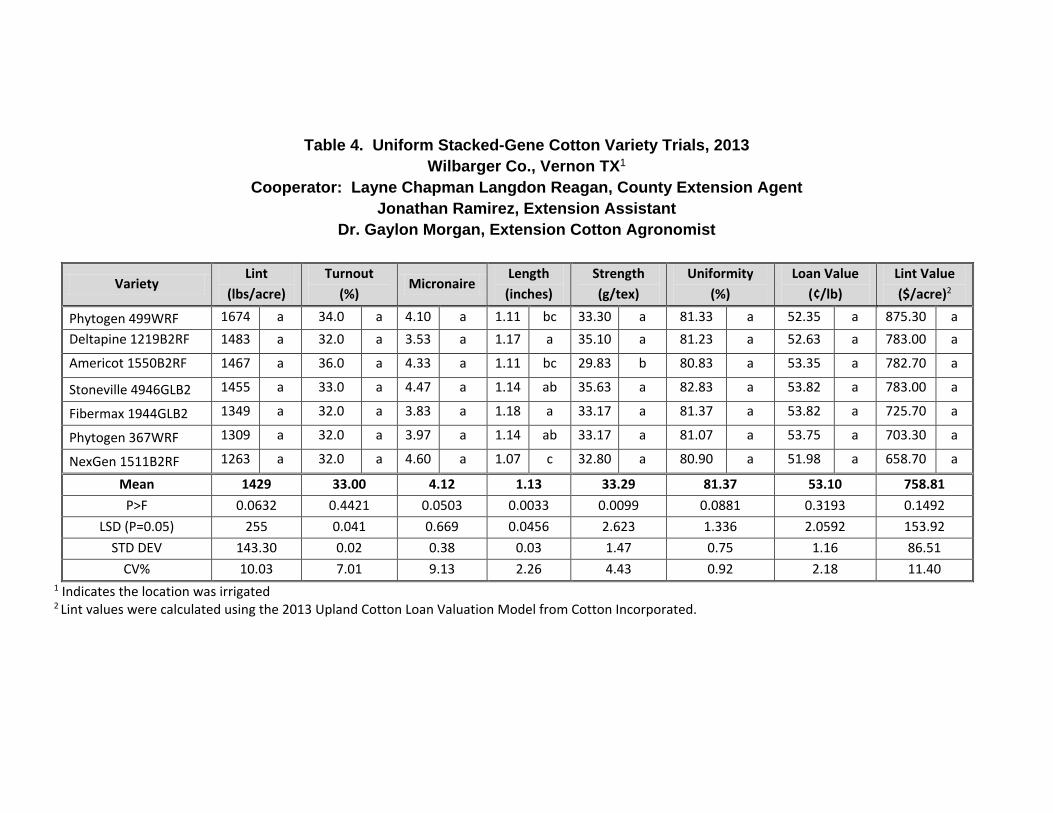
Table 4. Uniform Stacked-Gene Cotton Variety Trials, 2013
Wilbarger Co., Vernon TX1
Cooperator: Layne Chapman Langdon Reagan, County Extension Agent
Jonathan Ramirez, Extension Assistant
Dr. Gaylon Morgan, Extension Cotton Agronomist
Variety Lint
(lbs/acre)
Turnout
(%) Micronaire
Length
(inches)
Strength
(g/tex)
Uniformity
(%)
Loan Value
(¢/lb)
Lint Value
($/acre)2
Phytogen 499WRF 1674 a 34.0 a 4.10 a 1.11 bc 33.30 a 81.33 a 52.35 a 875.30 a
Deltapine 1219B2RF
1483 a 32.0 a 3.53 a 1.17 a 35.10 a 81.23 a 52.63 a 783.00 a
Americot 1550B2RF
1467 a 36.0 a 4.33 a 1.11 bc 29.83 b 80.83 a 53.35 a 782.70 a
Stoneville 4946GLB2 1455 a 33.0 a 4.47 a 1.14 ab 35.63 a 82.83 a 53.82 a 783.00 a
Fibermax 1944GLB2 1349 a 32.0 a 3.83 a 1.18 a 33.17 a 81.37 a 53.82 a 725.70 a
Phytogen 367WRF 1309 a 32.0 a 3.97 a 1.14 ab 33.17 a 81.07 a 53.75 a 703.30 a
NexGen 1511B2RF 1263 a 32.0 a 4.60 a 1.07 c 32.80 a 80.90 a 51.98 a 658.70 a
Mean 1429 33.00 4.12 1.13 33.29 81.37 53.10 758.81
P>F 0.0632 0.4421 0.0503 0.0033 0.0099 0.0881 0.3193 0.1492
LSD (P=0.05) 255 0.041 0.669 0.0456 2.623 1.336 2.0592 153.92
STD DEV 143.30 0.02 0.38 0.03 1.47 0.75 1.16 86.51
CV% 10.03 7.01 9.13 2.26 4.43 0.92 2.18 11.40 1 Indicates the location was irrigated 2 Lint values were calculated using the 2013 Upland Cotton Loan Valuation Model from Cotton Incorporated.
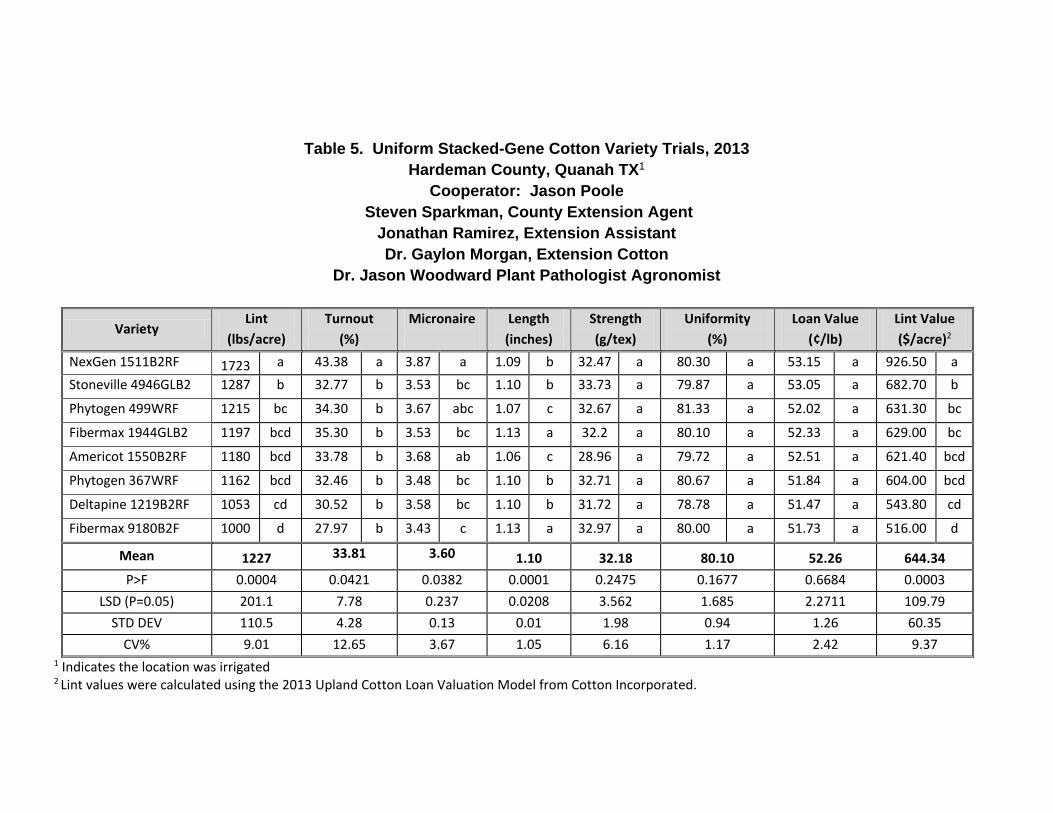
Table 5. Uniform Stacked-Gene Cotton Variety Trials, 2013
Hardeman County, Quanah TX1
Cooperator: Jason Poole
Steven Sparkman, County Extension Agent
Jonathan Ramirez, Extension Assistant
Dr. Gaylon Morgan, Extension Cotton
Dr. Jason Woodward Plant Pathologist Agronomist
Variety Lint
(lbs/acre)
Turnout
(%)
Micronaire
Length
(inches)
Strength
(g/tex)
Uniformity
(%)
Loan Value
(¢/lb)
Lint Value
($/acre)2
NexGen 1511B2RF 1723 a 43.38 a 3.87 a 1.09 b 32.47 a 80.30 a 53.15 a 926.50 a
Stoneville 4946GLB2 1287 b 32.77 b 3.53 bc 1.10 b 33.73 a 79.87 a 53.05 a 682.70 b
Phytogen 499WRF
1215 bc 34.30 b 3.67 abc 1.07 c 32.67 a 81.33 a 52.02 a 631.30 bc
Fibermax 1944GLB2 1197 bcd 35.30 b 3.53 bc 1.13 a 32.2 a 80.10 a 52.33 a 629.00 bc
Americot 1550B2RF 1180 bcd 33.78 b 3.68 ab 1.06 c 28.96 a 79.72 a 52.51 a 621.40 bcd
Phytogen 367WRF 1162 bcd 32.46 b 3.48 bc 1.10 b 32.71 a 80.67 a 51.84 a 604.00 bcd
Deltapine 1219B2RF 1053 cd 30.52 b 3.58 bc 1.10 b 31.72 a 78.78 a 51.47 a 543.80 cd
Fibermax 9180B2F 1000 d 27.97 b 3.43 c 1.13 a 32.97 a 80.00 a 51.73 a 516.00 d
Mean 1227 33.81 3.60 1.10 32.18 80.10 52.26 644.34
P>F 0.0004 0.0421 0.0382 0.0001 0.2475 0.1677 0.6684 0.0003
LSD (P=0.05) 201.1 7.78 0.237 0.0208 3.562 1.685 2.2711 109.79
STD DEV 110.5 4.28 0.13 0.01 1.98 0.94 1.26 60.35
CV% 9.01 12.65 3.67 1.05 6.16 1.17 2.42 9.37 1 Indicates the location was irrigated 2 Lint values were calculated using the 2013 Upland Cotton Loan Valuation Model from Cotton Incorporated.
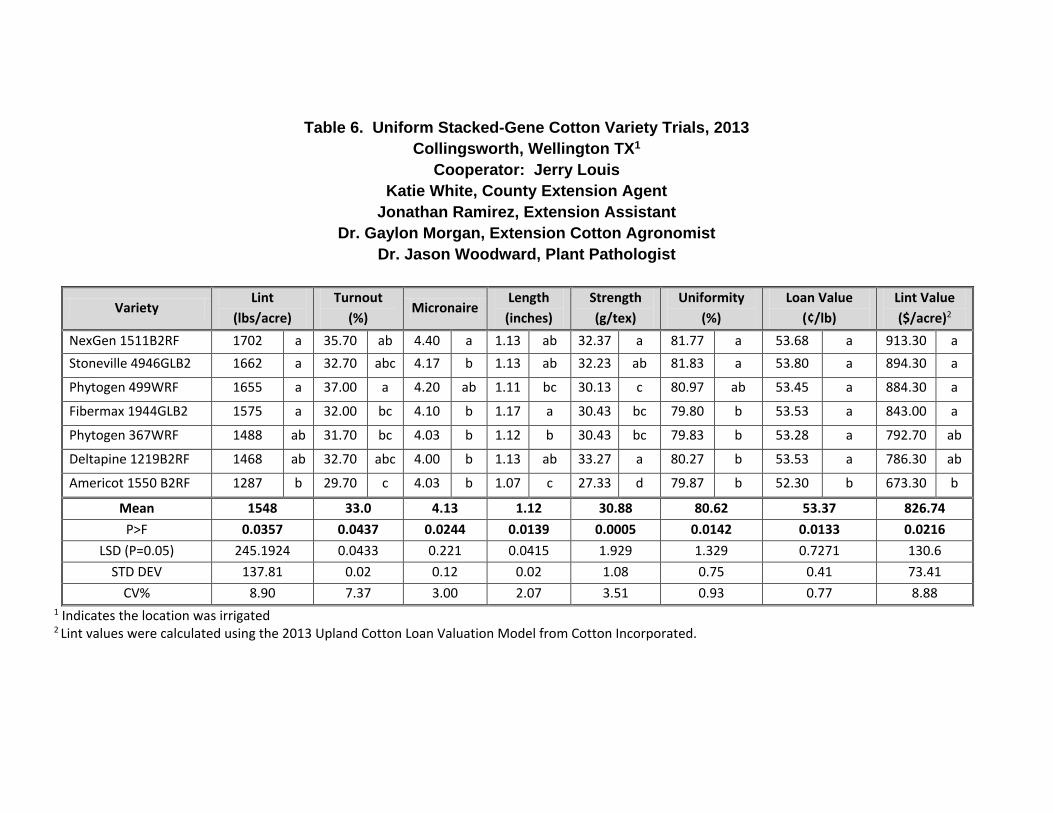
Table 6. Uniform Stacked-Gene Cotton Variety Trials, 2013
Collingsworth, Wellington TX1
Cooperator: Jerry Louis
Katie White, County Extension Agent
Jonathan Ramirez, Extension Assistant
Dr. Gaylon Morgan, Extension Cotton Agronomist
Dr. Jason Woodward, Plant Pathologist
Variety Lint
(lbs/acre)
Turnout
(%) Micronaire
Length
(inches)
Strength
(g/tex)
Uniformity
(%)
Loan Value
(¢/lb)
Lint Value
($/acre)2
NexGen 1511B2RF 1702 a 35.70
0
ab 4.40 a 1.13 ab 32.37 a 81.77 a 53.68 a 913.30 a
Stoneville 4946GLB2 1662 a 32.70 abc 4.17 b 1.13 ab 32.23 ab 81.83 a 53.80 a 894.30 a
Phytogen 499WRF 1655 a 37.00 a 4.20 ab 1.11 bc 30.13 c 80.97 ab 53.45 a 884.30 a
Fibermax 1944GLB2 1575 a 32.00 bc 4.10 b 1.17 a 30.43 bc 79.80 b 53.53 a 843.00 a
Phytogen 367WRF 1488 ab 31.70 bc 4.03 b 1.12 b 30.43 bc 79.83 b 53.28 a 792.70 ab
Deltapine 1219B2RF 1468 ab 32.70 abc 4.00 b 1.13 ab 33.27 a 80.27 b 53.53 a 786.30 ab
Americot 1550 B2RF 1287 b 29.70 c 4.03 b 1.07 c 27.33 d 79.87 b 52.30 b 673.30 b
Mean 1548 33.0 4.13 1.12 30.88 80.62 53.37 826.74
P>F 0.0357 0.0437 0.0244 0.0139 0.0005 0.0142 0.0133 0.0216
LSD (P=0.05) 245.1924 0.0433 0.221 0.0415 1.929 1.329 0.7271 130.6
STD DEV 137.81 0.02 0.12 0.02 1.08 0.75 0.41 73.41
CV% 8.90 7.37 3.00 2.07 3.51 0.93 0.77 8.88 1 Indicates the location was irrigated 2 Lint values were calculated using the 2013 Upland Cotton Loan Valuation Model from Cotton Incorporated.
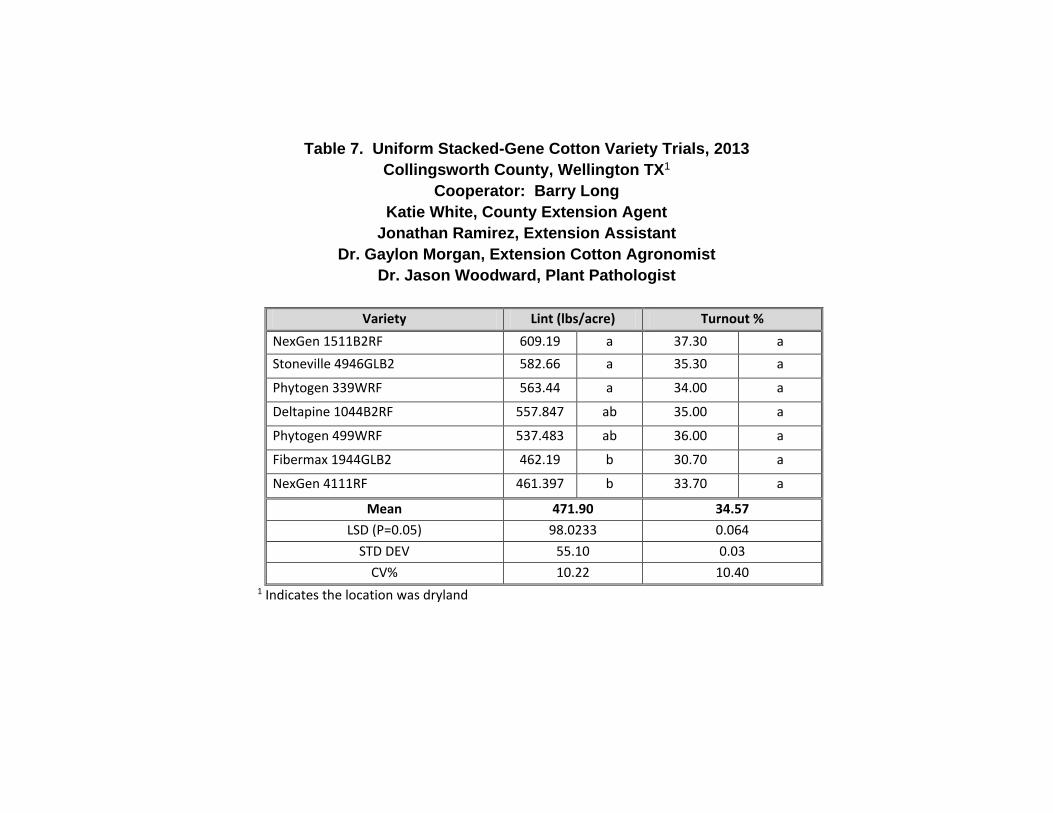
Table 7. Uniform Stacked-Gene Cotton Variety Trials, 2013
Collingsworth County, Wellington TX1
Cooperator: Barry Long
Katie White, County Extension Agent
Jonathan Ramirez, Extension Assistant
Dr. Gaylon Morgan, Extension Cotton Agronomist
Dr. Jason Woodward, Plant Pathologist
Variety Lint (lbs/acre) Turnout %
NexGen 1511B2RF 609.19 a 37.30 a
Stoneville 4946GLB2 582.66 a 35.30 a
Phytogen 339WRF 563.44 a 34.00 a
Deltapine 1044B2RF 557.847 ab 35.00 a
Phytogen 499WRF 537.483 ab 36.00 a
Fibermax 1944GLB2 462.19 b 30.70 a
NexGen 4111RF 461.397 b 33.70 a
Mean 471.90 34.57
LSD (P=0.05) 98.0233 0.064
STD DEV 55.10 0.03
CV% 10.22 10.40 1 Indicates the location was dryland
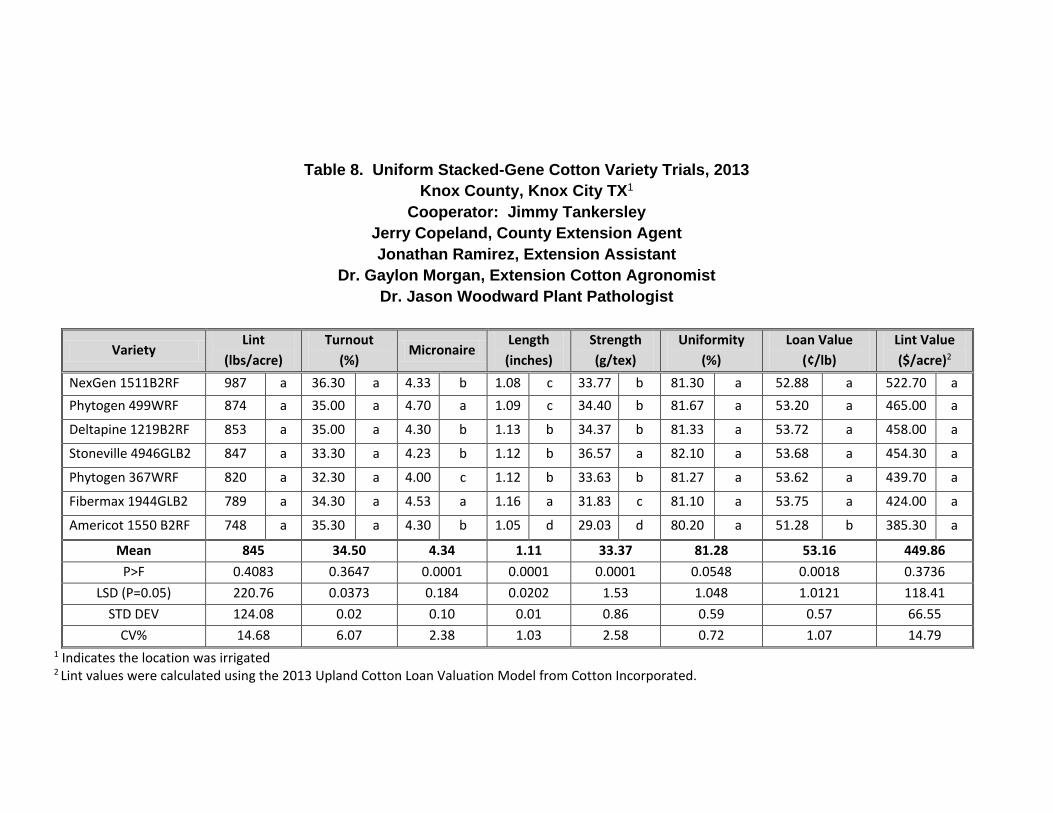
Table 8. Uniform Stacked-Gene Cotton Variety Trials, 2013
Knox County, Knox City TX1
Cooperator: Jimmy Tankersley
Jerry Copeland, County Extension Agent
Jonathan Ramirez, Extension Assistant
Dr. Gaylon Morgan, Extension Cotton Agronomist
Dr. Jason Woodward Plant Pathologist
Variety Lint
(lbs/acre)
Turnout
(%) Micronaire
Length
(inches)
Strength
(g/tex)
Uniformity
(%)
Loan Value
(¢/lb)
Lint Value
($/acre)2
NexGen 1511B2RF 987 a 36.30 a 4.33 b 1.08 c 33.77 b 81.30 a 52.88 a 522.70 a
Phytogen 499WRF 874 a 35.00 a 4.70 a 1.09 c 34.40 b 81.67 a 53.20 a 465.00 a
Deltapine 1219B2RF 853 a 35.00 a 4.30 b 1.13 b 34.37 b 81.33 a 53.72 a 458.00 a
Stoneville 4946GLB2 847 a 33.30 a 4.23 b 1.12 b 36.57 a 82.10 a 53.68 a 454.30 a
Phytogen 367WRF 820 a 32.30 a 4.00 c 1.12 b 33.63 b 81.27 a 53.62 a 439.70 a
Fibermax 1944GLB2 789 a 34.30 a 4.53 a 1.16 a 31.83 c 81.10 a 53.75 a 424.00 a
Americot 1550 B2RF 748 a 35.30 a 4.30 b 1.05 d 29.03 d 80.20 a 51.28 b 385.30 a
Mean 845 34.50 4.34 1.11 33.37 81.28 53.16 449.86
P>F 0.4083 0.3647 0.0001 0.0001 0.0001 0.0548 0.0018 0.3736
LSD (P=0.05) 220.76 0.0373 0.184 0.0202 1.53 1.048 1.0121 118.41
STD DEV 124.08 0.02 0.10 0.01 0.86 0.59 0.57 66.55
CV% 14.68 6.07 2.38 1.03 2.58 0.72 1.07 14.79 1 Indicates the location was irrigated 2 Lint values were calculated using the 2013 Upland Cotton Loan Valuation Model from Cotton Incorporated.
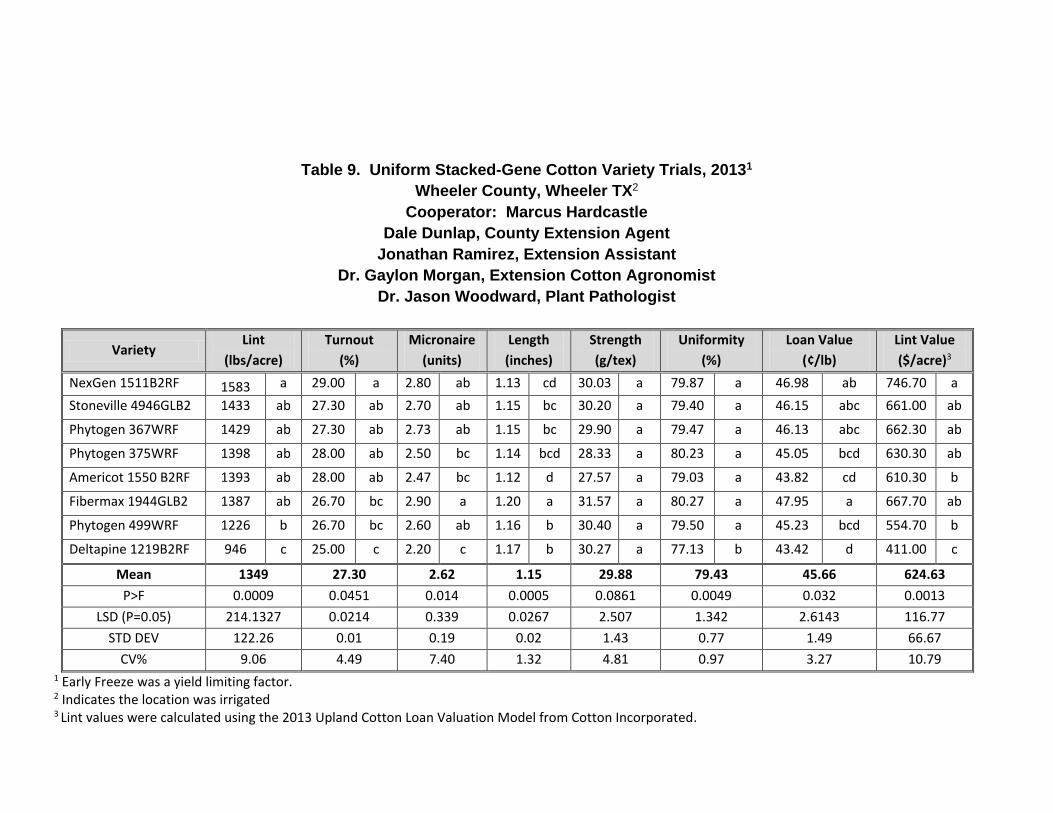
Table 9. Uniform Stacked-Gene Cotton Variety Trials, 20131
Wheeler County, Wheeler TX2
Cooperator: Marcus Hardcastle
Dale Dunlap, County Extension Agent
Jonathan Ramirez, Extension Assistant
Dr. Gaylon Morgan, Extension Cotton Agronomist
Dr. Jason Woodward, Plant Pathologist
Variety Lint
(lbs/acre)
Turnout
(%)
Micronaire
(units)
Length
(inches)
Strength
(g/tex)
Uniformity
(%)
Loan Value
(¢/lb)
Lint Value
($/acre)3
NexGen 1511B2RF 1583 a 29.00 a 2.80 ab 1.13 cd 30.03 a 79.87 a 46.98 ab 746.70 a
Stoneville 4946GLB2 1433 ab 27.30 ab 2.70 ab 1.15 bc 30.20 a 79.40 a 46.15 abc 661.00 ab
Phytogen 367WRF 1429 ab 27.30 ab 2.73 ab 1.15 bc 29.90 a 79.47 a 46.13 abc 662.30 ab
Phytogen 375WRF 1398 ab 28.00 ab 2.50 bc 1.14 bcd 28.33 a 80.23 a 45.05 bcd 630.30 ab
Americot 1550 B2RF 1393 ab 28.00 ab 2.47 bc 1.12 d 27.57 a 79.03 a 43.82 cd 610.30 b
Fibermax 1944GLB2 1387 ab 26.70 bc 2.90 a 1.20 a 31.57 a 80.27 a 47.95 a 667.70 ab
Phytogen 499WRF 1226 b 26.70 bc 2.60 ab 1.16 b 30.40 a 79.50 a 45.23 bcd 554.70 b
Deltapine 1219B2RF 946 c 25.00 c 2.20 c 1.17 b 30.27 a 77.13 b 43.42 d 411.00 c
Mean 1349 27.30 2.62 1.15 29.88 79.43 45.66 624.63
P>F 0.0009 0.0451 0.014 0.0005 0.0861 0.0049 0.032 0.0013
LSD (P=0.05) 214.1327 0.0214 0.339 0.0267 2.507 1.342 2.6143 116.77
STD DEV 122.26 0.01 0.19 0.02 1.43 0.77 1.49 66.67
CV% 9.06 4.49 7.40 1.32 4.81 0.97 3.27 10.79 1 Early Freeze was a yield limiting factor. 2 Indicates the location was irrigated 3 Lint values were calculated using the 2013 Upland Cotton Loan Valuation Model from Cotton Incorporated.
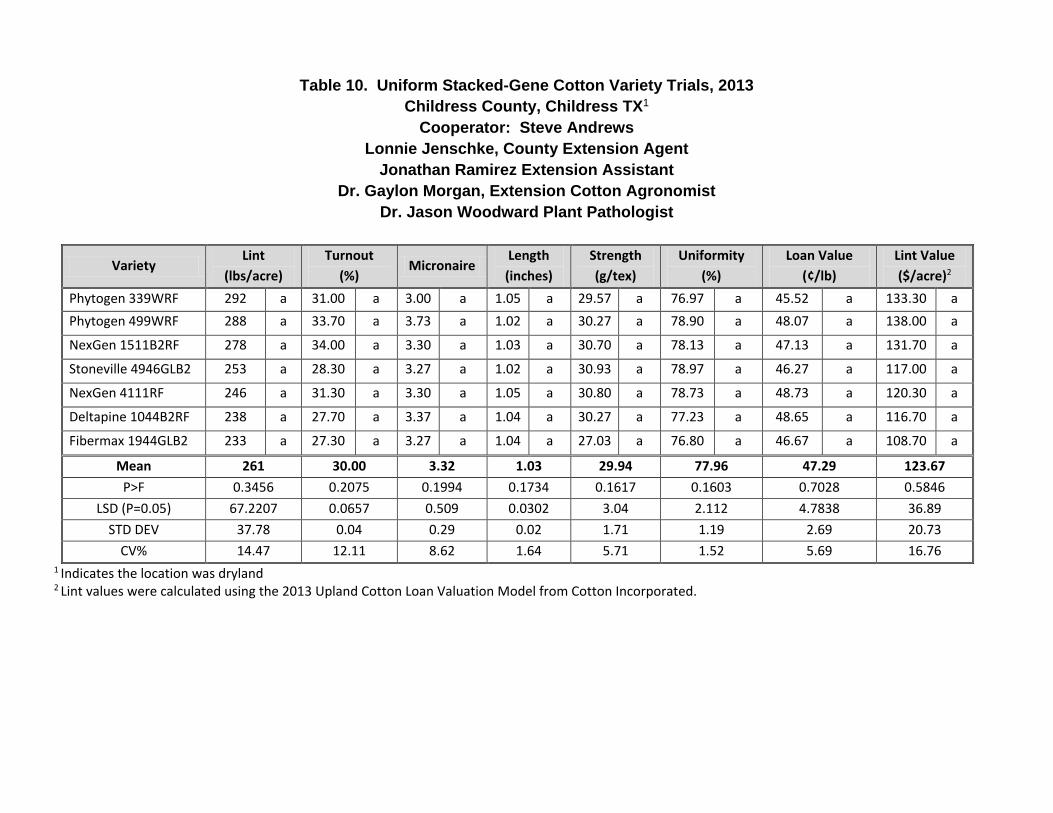
Table 10. Uniform Stacked-Gene Cotton Variety Trials, 2013
Childress County, Childress TX1
Cooperator: Steve Andrews
Lonnie Jenschke, County Extension Agent
Jonathan Ramirez Extension Assistant
Dr. Gaylon Morgan, Extension Cotton Agronomist
Dr. Jason Woodward Plant Pathologist
Variety Lint
(lbs/acre)
Turnout
(%) Micronaire
Length
(inches)
Strength
(g/tex)
Uniformity
(%)
Loan Value
(¢/lb)
Lint Value
($/acre)2
Phytogen 339WRF 292 a 31.00 a 3.00 a 1.05 a 29.57 a 76.97 a 45.52 a 133.30 a
Phytogen 499WRF 288 a 33.70 a 3.73 a 1.02 a 30.27 a 78.90 a 48.07 a 138.00 a
NexGen 1511B2RF 278 a 34.00 a 3.30 a 1.03 a 30.70 a 78.13 a 47.13 a 131.70 a
Stoneville 4946GLB2 253 a 28.30 a 3.27 a 1.02 a 30.93 a 78.97 a 46.27 a 117.00 a
NexGen 4111RF 246 a 31.30 a 3.30 a 1.05 a 30.80 a 78.73 a 48.73 a 120.30 a
Deltapine 1044B2RF 238 a 27.70 a 3.37 a 1.04 a 30.27 a 77.23 a 48.65 a 116.70 a
Fibermax 1944GLB2 233 a 27.30 a 3.27 a 1.04 a 27.03 a 76.80 a 46.67 a 108.70 a
Mean 261 30.00 3.32 1.03 29.94 77.96 47.29 123.67
P>F 0.3456 0.2075 0.1994 0.1734 0.1617 0.1603 0.7028 0.5846
LSD (P=0.05) 67.2207 0.0657 0.509 0.0302 3.04 2.112 4.7838 36.89
STD DEV 37.78 0.04 0.29 0.02 1.71 1.19 2.69 20.73
CV% 14.47 12.11 8.62 1.64 5.71 1.52 5.69 16.76 1 Indicates the location was dryland 2 Lint values were calculated using the 2013 Upland Cotton Loan Valuation Model from Cotton Incorporated.
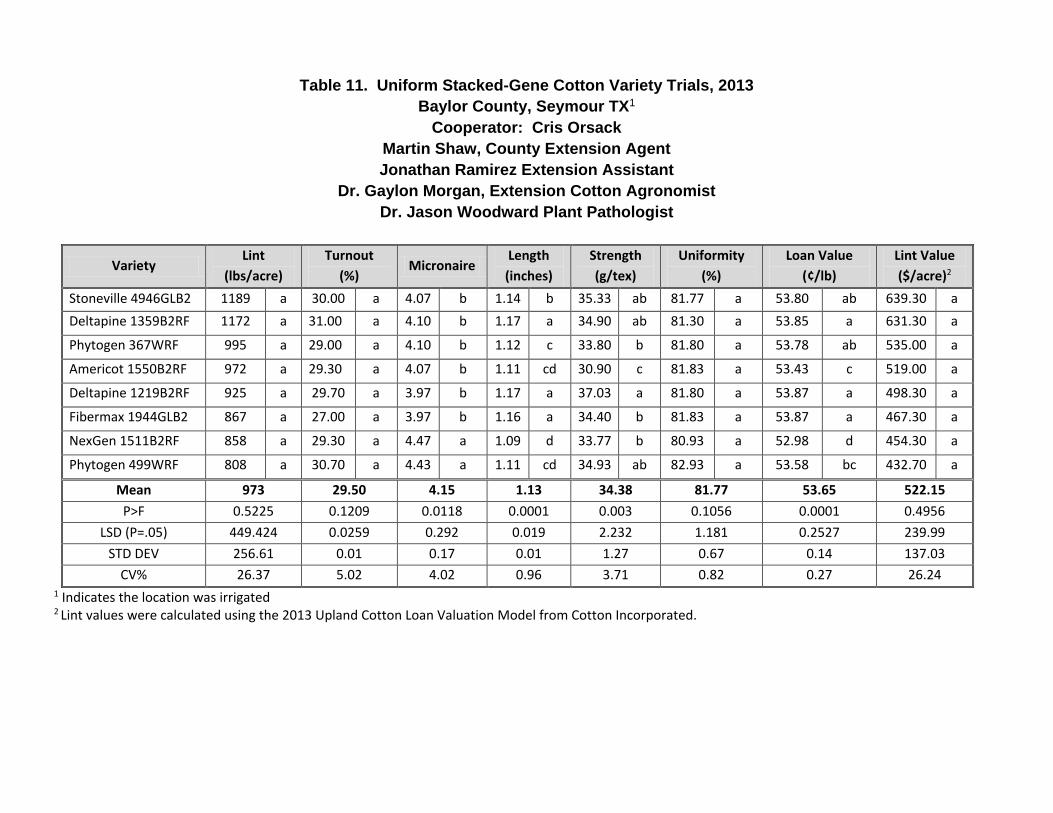
Table 11. Uniform Stacked-Gene Cotton Variety Trials, 2013
Baylor County, Seymour TX1
Cooperator: Cris Orsack
Martin Shaw, County Extension Agent
Jonathan Ramirez Extension Assistant
Dr. Gaylon Morgan, Extension Cotton Agronomist
Dr. Jason Woodward Plant Pathologist
Variety Lint
(lbs/acre)
Turnout
(%) Micronaire
Length
(inches)
Strength
(g/tex)
Uniformity
(%)
Loan Value
(¢/lb)
Lint Value
($/acre)2
Stoneville 4946GLB2 1189 a 30.00 a 4.07 b 1.14 b 35.33 ab 81.77 a 53.80 ab 639.30 a
Deltapine 1359B2RF 1172 a 31.00 a 4.10 b 1.17 a 34.90 ab 81.30 a 53.85 a 631.30 a
Phytogen 367WRF 995 a 29.00 a 4.10 b 1.12 c 33.80 b 81.80 a 53.78 ab 535.00 a
Americot 1550B2RF 972 a 29.30 a 4.07 b 1.11 cd 30.90 c 81.83 a 53.43 c 519.00 a
Deltapine 1219B2RF 925 a 29.70 a 3.97 b 1.17 a 37.03 a 81.80 a 53.87 a 498.30 a
Fibermax 1944GLB2 867 a 27.00 a 3.97 b 1.16 a 34.40 b 81.83 a 53.87 a 467.30 a
NexGen 1511B2RF 858 a 29.30 a 4.47 a 1.09 d 33.77 b 80.93 a 52.98 d 454.30 a
Phytogen 499WRF 808 a 30.70 a 4.43 a 1.11 cd 34.93 ab 82.93 a 53.58 bc 432.70 a
Mean 973 29.50 4.15 1.13 34.38 81.77 53.65 522.15
P>F 0.5225 0.1209 0.0118 0.0001 0.003 0.1056 0.0001 0.4956
LSD (P=.05) 449.424 0.0259 0.292 0.019 2.232 1.181 0.2527 239.99
STD DEV 256.61 0.01 0.17 0.01 1.27 0.67 0.14 137.03
CV% 26.37 5.02 4.02 0.96 3.71 0.82 0.27 26.24 1 Indicates the location was irrigated 2 Lint values were calculated using the 2013 Upland Cotton Loan Valuation Model from Cotton Incorporated.
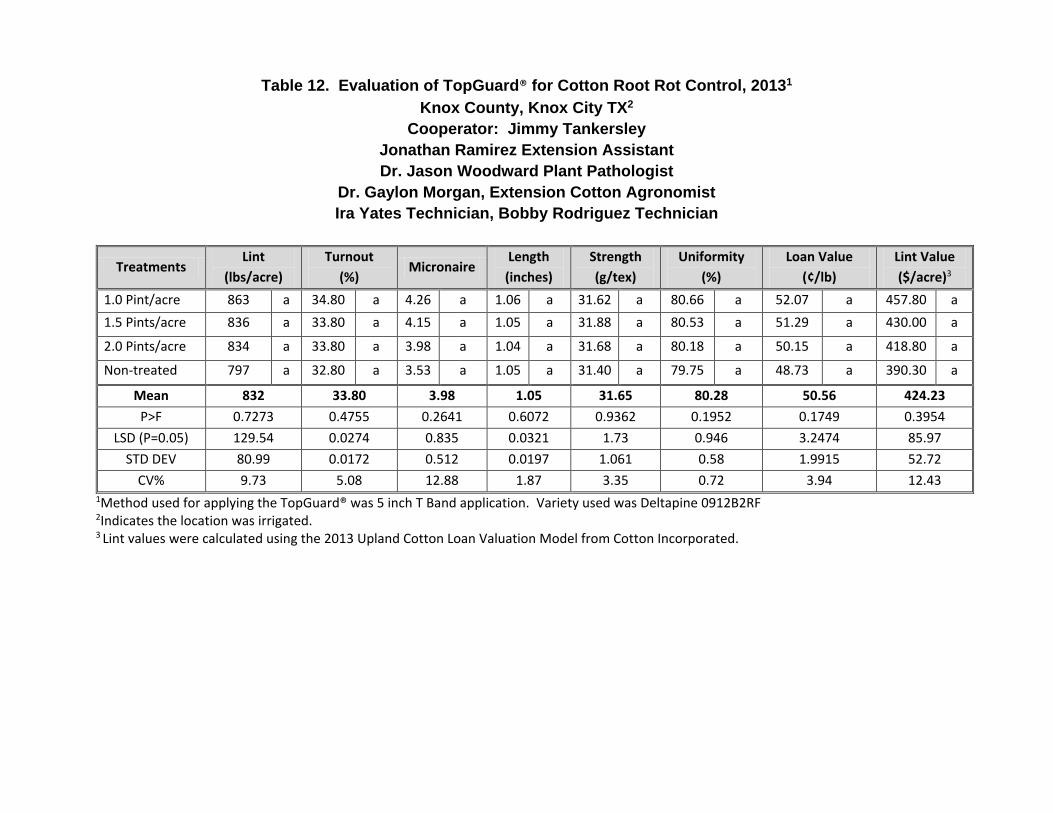
Table 12. Evaluation of TopGuard® for Cotton Root Rot Control, 20131
Knox County, Knox City TX2
Cooperator: Jimmy Tankersley
Jonathan Ramirez Extension Assistant
Dr. Jason Woodward Plant Pathologist
Dr. Gaylon Morgan, Extension Cotton Agronomist
Ira Yates Technician, Bobby Rodriguez Technician
Treatments Lint
(lbs/acre)
Turnout
(%) Micronaire
Length
(inches)
Strength
(g/tex)
Uniformity
(%)
Loan Value
(¢/lb)
Lint Value
($/acre)3
1.0 Pint/acre
863 a 34.80 a 4.26 a 1.06 a 31.62 a 80.66 a 52.07 a 457.80 a
1.5 Pints/acre 836 a 33.80 a 4.15 a 1.05 a 31.88 a 80.53 a 51.29 a 430.00 a
2.0 Pints/acre 834 a 33.80 a 3.98 a 1.04 a 31.68 a 80.18 a 50.15 a 418.80 a
Non-treated 797 a 32.80 a 3.53 a 1.05 a 31.40 a 79.75 a 48.73 a 390.30 a
Mean 832 33.80 3.98 1.05 31.65 80.28 50.56 424.23
P>F 0.7273 0.4755 0.2641 0.6072 0.9362 0.1952 0.1749 0.3954
LSD (P=0.05) 129.54 0.0274 0.835 0.0321 1.73 0.946 3.2474 85.97
STD DEV 80.99 0.0172 0.512 0.0197 1.061 0.58 1.9915 52.72
CV% 9.73 5.08 12.88 1.87 3.35 0.72 3.94 12.43 1Method used for applying the TopGuard® was 5 inch T Band application. Variety used was Deltapine 0912B2RF 2Indicates the location was irrigated. 3 Lint values were calculated using the 2013 Upland Cotton Loan Valuation Model from Cotton Incorporated.
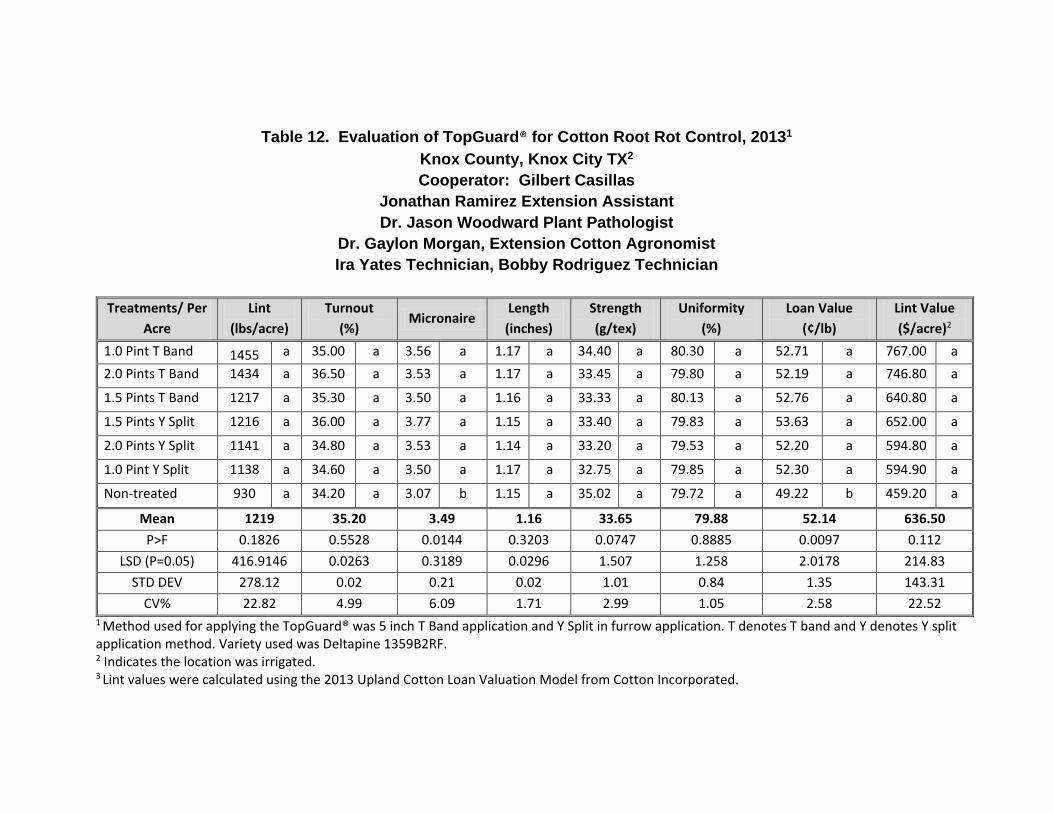
Table 12. Evaluation of TopGuard® for Cotton Root Rot Control, 20131
Knox County, Knox City TX2
Cooperator: Gilbert Casillas
Jonathan Ramirez Extension Assistant
Dr. Jason Woodward Plant Pathologist
Dr. Gaylon Morgan, Extension Cotton Agronomist
Ira Yates Technician, Bobby Rodriguez Technician
Treatments/ Per
Acre
Lint
(lbs/acre)
Turnout
(%) Micronaire
Length
(inches)
Strength
(g/tex)
Uniformity
(%)
Loan Value
(¢/lb)
Lint Value
($/acre)2
1.0 Pint T Band 1455 a 35.00 a 3.56 a 1.17 a 34.40 a 80.30 a 52.71 a 767.00 a
2.0 Pints T Band 1434 a 36.50 a 3.53 a 1.17 a 33.45 a 79.80 a 52.19 a 746.80 a
1.5 Pints T Band 1217 a 35.30 a 3.50 a 1.16 a 33.33 a 80.13 a 52.76 a 640.80 a
1.5 Pints Y Split 1216 a 36.00 a 3.77 a 1.15 a 33.40 a 79.83 a 53.63 a 652.00 a
2.0 Pints Y Split 1141 a 34.80 a 3.53 a 1.14 a 33.20 a 79.53 a 52.20 a 594.80 a
1.0 Pint Y Split 1138 a 34.60 a 3.50 a 1.17 a 32.75 a 79.85 a 52.30 a 594.90 a
Non-treated 930 a 34.20 a 3.07 b 1.15 a 35.02 a 79.72 a 49.22 b 459.20 a
Mean 1219 35.20 3.49 1.16 33.65 79.88 52.14 636.50
P>F 0.1826 0.5528 0.0144 0.3203 0.0747 0.8885 0.0097 0.112
LSD (P=0.05) 416.9146 0.0263 0.3189 0.0296 1.507 1.258 2.0178 214.83
STD DEV 278.12 0.02 0.21 0.02 1.01 0.84 1.35 143.31
CV% 22.82 4.99 6.09 1.71 2.99 1.05 2.58 22.52 1 Method used for applying the TopGuard® was 5 inch T Band application and Y Split in furrow application. T denotes T band and Y denotes Y split application method. Variety used was Deltapine 1359B2RF. 2 Indicates the location was irrigated. 3 Lint values were calculated using the 2013 Upland Cotton Loan Valuation Model from Cotton Incorporated.
http://cotton.tamu.edu/
The information given herein is for educational purposes only. Reference to commercial products or trade names is made with the understanding that no discrimination is intended and no endorsement by Texas AgriLife Extension Service is implied.
Educational programs conducted by Texas AgriLife Extension Service serve people of all ages regardless of socioeconomic level, race,
color, sex, religion, handicap or national origin.
Issued in furtherance of Cooperative Extension Work in Agriculture and Home Economics, Acts of Congress of May 8, 1914, as amended,
and June 30, 1914, in cooperation with the United States Department of Agriculture. Edward G. Smith, Director, Texas A&M AgriLife
Extension Service, The Texas A&M University System.