Replacing Fishmeal with Kikuyu Grass and Moringa Leaves ... · in Clarias gariepinus ... In this...
12
Turkish Journal of Fisheries and Aquatic Sciences 14: 795-806 (2014) www.trjfas.org ISSN 1303-2712 DOI: 10.4194/1303-2712-v14_3_22 © Published by Central Fisheries Research Institute (CFRI) Trabzon, Turkey in cooperation with Japan International Cooperation Agency (JICA), Japan Replacing Fishmeal with Kikuyu Grass and Moringa Leaves: Effects on Growth, Protein Digestibility, Histological and Haematological Parameters in Clarias gariepinus Introduction The availability of fishmeal (FM) which is the main protein source for fish feeds can no longer be guaranteed because the capture fisheries are levelling off (FAO, 2011). As a result, the price of FM is constantly rising, adversely affecting the profitability of aquaculture enterprises (Sintayehu et al., 1996). This has forced the aquaculture industry to explore alternative, cheaper protein sources for use as FM replacers in aquafeeds. The decrease in global production of FM clearly demonstrates that the sustainability of this industry will depend on the sustained supply of plant proteins for aquafeeds. Soybean meal has been the main plant protein source used in animal feeds as a replacement for FM because of its high protein content and relatively well balanced amino acid profile (Sintayehu et al., 1996). However, soybean meal has been increasingly commercialised and its use as the main protein source in fish feeds may longer be economically viable. In this study, the effect of replacing dietary fishmeal with kikuyu grass (Pennisetum clandestinum) and moringa (Moringa oleifera) on the performance of Clarias gariepinus was determined. The leaves of both plants have moderately high protein content and amino acid profiles. Kikuyu grass is a common forage, used widely as a lawn grass (Marais et al., 1987). Originating from former Zaire (now Democratic Republic of Congo) and Kenya, this grass has been introduced widely in tropical areas, including Costa Rica, Hawaii, Colombia, Australia and southern Africa. There is scarcity of information on the use of kikuyu grass in fish feeds. Work done in Tilapia rendalli indicate that this grass can replace up to 25% FM (Hlophe and Moyo, 2014). Moringa oleifera Lam., is a member of the family Moringaceae. It is a fast-growing plant widely available in the tropics and subtropics with economic importance for the food and medical industry. An appreciable amount of work has been done on the use of moringa leaf meal as a protein source in tilapia diets (Afuang et al., 2003; Richter et al., 2003). However, for a plant protein source to be included in aquafeeds its utilisation should be tested in different fish species because fish species differ in their sensitivity and response to anti-nutrients found in plant protein sources (Francis et al., 2001; Alarco´n et al., 2002; Chong et al., 2002; Gatlin et al., 2007; Collin et al., 2012; Chaudhuri et al., 2012). Clariidae catfishes are the second most important group of cultured fish in the world Hlophe Samkelisiwe N. 1,* , Moyo Ngonidzashe A.G. 1 1 University of Limpopo, Faculty of Science and Agriculture, School of Agricultural and Environmental Sciences, Aquaculture Research Unit (Turfloop Campus), Private Bag X1106, Sovenga, 0727, South Africa. * Corresponding Author: Tel.: +277.148 19981; Fax: +277.148 19981; E-mail: [email protected] Received 25 April 2014 Accepted 15 September 2014 Abstract The effects of replacing fishmeal (FM) with kikuyu meal (KM) and moringa meal (MM) in Clarias gariepinus diets were investigated. Nine diets (30% CP: 20 MJ kg -1 ) were formulated by replacing FM with KM and MM at 0% (control), 25, 50, 75 and 100%. Each diet was randomly assigned to triplicate groups of C. gariepinus (30.5±2 g) for 60 days. Significantly higher (P<0.05) growth performance, feed and protein utilisation was observed in C. gariepinus fed KM diets compared to those fed MM. No histological alterations were found in liver of fish fed the control diet. Increased hepatocyte degradation was seen in fish fed higher levels of moringa in the diet. The enterocytes showed a significant increase in the number of goblet cells with increasing levels of MM. Villi height decreased significantly (P<0.05) when MM replaced >75 fishmeal. Higher levels of anti-nutrients in MM may be the cause of the adverse effects in growth, histology and haematological parameters of fish fed moringa based diets. The results of this study indicate that KM can replace up to 25% FM and that adding MM resulted in reduced performance. Higher profit index and lower incidence cost was observed KM diets than in MM diets. Keywords: Feed utilisation, blood biochemistry, intestine, liver.
Transcript of Replacing Fishmeal with Kikuyu Grass and Moringa Leaves ... · in Clarias gariepinus ... In this...

Turkish Journal of Fisheries and Aquatic Sciences 14: 795-806 (2014)
www.trjfas.org ISSN 1303-2712
DOI: 10.4194/1303-2712-v14_3_22
© Published by Central Fisheries Research Institute (CFRI) Trabzon, Turkey in cooperation with Japan International Cooperation Agency (JICA), Japan
Replacing Fishmeal with Kikuyu Grass and Moringa Leaves: Effects on
Growth, Protein Digestibility, Histological and Haematological Parameters
in Clarias gariepinus
Introduction
The availability of fishmeal (FM) which is the
main protein source for fish feeds can no longer be
guaranteed because the capture fisheries are levelling
off (FAO, 2011). As a result, the price of FM is
constantly rising, adversely affecting the profitability
of aquaculture enterprises (Sintayehu et al., 1996).
This has forced the aquaculture industry to explore
alternative, cheaper protein sources for use as FM
replacers in aquafeeds. The decrease in global
production of FM clearly demonstrates that the
sustainability of this industry will depend on the
sustained supply of plant proteins for aquafeeds.
Soybean meal has been the main plant protein source
used in animal feeds as a replacement for FM because
of its high protein content and relatively well
balanced amino acid profile (Sintayehu et al., 1996).
However, soybean meal has been increasingly
commercialised and its use as the main protein source
in fish feeds may longer be economically viable.
In this study, the effect of replacing dietary
fishmeal with kikuyu grass (Pennisetum
clandestinum) and moringa (Moringa oleifera) on the
performance of Clarias gariepinus was determined.
The leaves of both plants have moderately high
protein content and amino acid profiles. Kikuyu grass
is a common forage, used widely as a lawn grass
(Marais et al., 1987). Originating from former Zaire
(now Democratic Republic of Congo) and Kenya, this
grass has been introduced widely in tropical areas,
including Costa Rica, Hawaii, Colombia, Australia
and southern Africa. There is scarcity of information
on the use of kikuyu grass in fish feeds. Work done in
Tilapia rendalli indicate that this grass can replace up
to 25% FM (Hlophe and Moyo, 2014). Moringa
oleifera Lam., is a member of the family
Moringaceae. It is a fast-growing plant widely
available in the tropics and subtropics with economic
importance for the food and medical industry. An
appreciable amount of work has been done on the use
of moringa leaf meal as a protein source in tilapia
diets (Afuang et al., 2003; Richter et al., 2003).
However, for a plant protein source to be included in
aquafeeds its utilisation should be tested in different
fish species because fish species differ in their
sensitivity and response to anti-nutrients found in
plant protein sources (Francis et al., 2001; Alarco´n et
al., 2002; Chong et al., 2002; Gatlin et al., 2007;
Collin et al., 2012; Chaudhuri et al., 2012).
Clariidae catfishes are the second most
important group of cultured fish in the world
Hlophe Samkelisiwe N.1,*
, Moyo Ngonidzashe A.G.1
1 University of Limpopo, Faculty of Science and Agriculture, School of Agricultural and Environmental Sciences,
Aquaculture Research Unit (Turfloop Campus), Private Bag X1106, Sovenga, 0727, South Africa.
* Corresponding Author: Tel.: +277.148 19981; Fax: +277.148 19981;
E-mail: [email protected]
Received 25 April 2014
Accepted 15 September 2014
Abstract
The effects of replacing fishmeal (FM) with kikuyu meal (KM) and moringa meal (MM) in Clarias gariepinus diets
were investigated. Nine diets (30% CP: 20 MJ kg-1) were formulated by replacing FM with KM and MM at 0% (control), 25,
50, 75 and 100%. Each diet was randomly assigned to triplicate groups of C. gariepinus (30.5±2 g) for 60 days. Significantly
higher (P<0.05) growth performance, feed and protein utilisation was observed in C. gariepinus fed KM diets compared to
those fed MM. No histological alterations were found in liver of fish fed the control diet. Increased hepatocyte degradation
was seen in fish fed higher levels of moringa in the diet. The enterocytes showed a significant increase in the number of goblet
cells with increasing levels of MM. Villi height decreased significantly (P<0.05) when MM replaced >75 fishmeal. Higher
levels of anti-nutrients in MM may be the cause of the adverse effects in growth, histology and haematological parameters of
fish fed moringa based diets. The results of this study indicate that KM can replace up to 25% FM and that adding MM
resulted in reduced performance. Higher profit index and lower incidence cost was observed KM diets than in MM diets.
Keywords: Feed utilisation, blood biochemistry, intestine, liver.

796 S.N. Hlophe and N.A.G. Moyo / Turk. J. Fish. Aquat. Sci. 14: 795-806 (2014)
(Fasakin et al., 2003). They f e e d on a wide range
of artificial and natural food items, have high growth
rates and tolerate poor water quality parameters
(Amisah et al., 2009). High activities of protease,
lipase and amylase enzymes in C. gariepinus
digestive tract indicate its ability to utilise both animal
and plant based feed resources (Hlophe et al., 2014).
Fishmeal free formulations for herbivorous fish such
as tilapias have been reported and used in practical
diets (Shiau et al. 1990), but seldom studied on other
omnivorous fish. Previous studies on replacing FM
with plant protein sources in C. gariepinus diets
focussed mainly on growth performance and feed
utilisation (Bichi and Ahmad, 2010; Amisah et al.,
2009). The intestines and liver are key organs in
digestion and absorption of nutrients from food,
therefore, the monitoring of these organs is imperative
in nutrition studies (Raskovic et al., 2011). Thus, the
aims of this study were to evaluate growth
performance, protein utilisation and digestibility in
C. gariepinus fed kikuyu and moringa based diets.
Additionally, the effects of these diets on liver and
intestine histology as well as blood parameters were
determined.
Materials and Methods
Feed Preparation
Kikuyu grass was harvested from the grounds
(lawn) at the Aquaculture Research Unit, University
of Limpopo, South Africa. Moringa leaves were
sourced from the Patient Wellness Centre in
Lebowakgomo in the Limpopo Province of South
Africa. The kikuyu grass and moringa leaves were
dried under shade and milled using a hammer mill.
The proximate composition of the FM and dried
leaves; kikuyu meal (KM), moringa meal (MM) used
is given in Table 1. Nine isonitrogenous (crude
protein 30% DM) and isocaloric (gross energy 20
MJ/kg DM) diets were formulated by replacing FM
with KM and MM. The control diet contained no
plant meal and 10.62% FM. In the experimental diets
FM was substituted at 25, 50, 75 and 100% with KM
in diets KM 25, KM 50, KM 75 and KM 100
respectively. In diets designated as MM 25, MM 50,
MM 75 and MM 100 fishmeal was replaced with MM
at 25, 50, 75 and 100%. The level of maize and maize
gluten was adjusted accordingly. In each diet, chromic
oxide (Cr2O3) was added at 0.5% as an inert marker.
The diets were formulated using Winfeed 3, EFG
(Natal) program.
Experimental Procedures
A completely randomised design experiment
was set up with twenty seven rectangular (1.5 m3)
fibre glass tanks housed in a greenhouse for each
species. Each tank was filled with aged water to the
1 m3 mark. All tanks were connected to a
recirculating system. An Elektror side channel blower
Model: D7300 (Karl W. Miller) was used to blow air
which was diffused with an air stone into each tank.
Each diet was randomly assigned to triplicate groups
of C. gariepinus (30.50±2 g), stocked at 20 fish per
tank. All fish were fed their allotted diet three times a
day (0900, 1300 and 1700 hours) for 60 days to
apparent satiation (one pellet remains uneaten for 1–2
minutes) the amount of feed consumed in each tank
was recorded. Faecal samples were siphoned from
Table 1. Proximate, amino acid and anti-nutrient composition of kikuyu, moringa leaf meals, fishmeal used and amino acid
requirements for Clarias gariepinus
Components KM MM FM Amino acid requirements for
channel catfish*
Dry matter (%) 93.63 92.00 90.50
Protein (%) 26.84 32.09 64.80
Energy (MJ kg-1) 17.99 18.30 12.90
Ash (%) 9.50 7.17 21.10
Fat (%) 4.38 1.99 5.60
Fiber (%) 18.58 10.10 0.00
Methionine + cysteine (%) 0.88 0.58 3.86 0.64
Arginine (%) 1.44 1.20 5.82 1.2
Histidine (%) 0.51 0.58 2.43 0.42
Threonine (%) 0.93 0.80 4.31 0.56
Isoleucine (%) 1.12 0.87 4.68 0.73
Leucine (%) 2.33 2.05 7.60 0.98
Phenylalanine + tyrosine (%) 2.14 2.38 7.61 1.40
Lysine (%) 1.42 1.10 7.57 1.43
Valine (%) 1.56 1.10 5.25 0.84
Anti-nutritional factors (g/kg)
Polyphenols 14.82 43.02 -
Tannins 8.40 12.10 -
Phytate 6.42 25.41 -
Saponins 20.31 79.32 - *Amino acid requirements of a related fish species – channel catfish (NRC, 1993)

S.N. Hlophe and N.A.G. Moyo / Turk. J. Fish. Aquat. Sci. 14: 795-806 (2014) 797
each tank 2 hours after each feeding and stored in a
freezer (-20°C) until there was enough sample for
analysis. Water temperature ranged between 25.6 and
28.4°C, dissolved oxygen ranged between 6.00 and
6.80 mg L-1
, pH 7-8.2 and the photoperiod was
natural.
Proximate Composition of Experimental Diets and
Faeces
Proximate composition of the FM, KM, MM
(Table 1) and all the experimental diets (Table 2) was
analysed following the Association of Official
Analytical Chemists procedures (AOAC International,
2012). All samples were analysed for dry matter,
crude protein, crude lipid, crude fibre, gross energy
and ash. Each sample was dried for 24 hours at 105°C
for dry matter determination. Nitrogen content of the
dry matter was determined using a LECO FP2000
Nitrogen Analyser which uses the Dumas combustion.
The protein content was calculated as % nitrogen x
6.25. The lipid content was measured by Soxhlet
extraction of freeze-dried samples with petroleum
ether at 50°C. Gross energy was determined with the
aid of a DDS isothermal CP 500 bomb calorimeter.
Crude fibre was determined as loss on ignition of
dried lipid-free residues after digestion with 1.25%
H2SO4 and 1.25% NaOH. The polyphenols and
tannins in KM and MM were determined using the
spectrophotometric methods as described by Makkar
et al., 1993). Quantitative determination of phytates
and saponins was done using the method of AOAC
(2012). Amino acids determination was done on a
Beckman Amino Acid Analyser System 6300. All
tests were done in triplicate.
Growth Performance, Feed Utilisation Indices and
Protein digestibility
Growth rate defined as thermal-unit growth
coefficient (TGC), was calculated as: TGC = 100 x
(FBW-0.333
-IBW-0.333
)/(∑T°Cxdays), where FBW =
final body weight (g/fish); IBW= initial body weight
(g/fish); T = temperature (Iwama and Tautz, 1981).
Specific growth rate (SGR) was calculated according
to Winberg (1956) as: SGR = (InWf-InW0)/t, where:
Wf = final body weight (g), W0 = initial body weight
(g), In = natural Logarithm (log)-10
, t = feeding period
(days). Feed utilisation was determined using feed
conversion ratio (FCR) = [food consumed (g)]/
[weight gained (g)] and protein efficiency ratio (PER)
= [weight gained (g)]/[protein intake (g)].
The apparent digestibility coefficient (ADC; %)
of protein was determined using the indirect method
which uses Cr2O3 as an inert marker (Cho et al.,
1982). ADC = 100 [1-(Cr2O3 in diet)/Cr2O3 in faeces)
x (protein in faeces/protein in diet)].
Histological Analysis, Haematological Analysis
and Cost Benefit Analysis
At the end of the experimental period, five fish
from each tank were sacrificed for histological
analysis of intestines and the liver. Liver samples and
1 cm segments from the mid gut of the intestinal tract
were preserved in 10% neutral buffered formalin for
24 hours. Subsequently, liver and intestine tissues
were dehydrated using standard histological
techniques in graded ethanol series and embedded in
paraffin wax for histology. From each sample, 3-5 μm
sections were cut and mounted on glass slides before
Table 2. Ingredients (g/kg) and proximate composition of experimental diets
Control KM25 KM50 KM75 KM100 MM25 MM50 MM75 MM100
FM (%) 0 25 50 75 100 25 50 75 100
KM _ 7.50 15.00 22.50 30.00 _ _ _ _
MM _ _ _ _ _ 7.27 14.72 21.70 29.00 Fish meal 10.62 7.73 5.25 2.77 _ 8.00 5.31 2.70 0.00
Soybean 7.32 7.32 7.32 7.32 7.32 7.00 7.00 7.00 7.00
Canola 18.00 18.00 18.00 18.00 18.00 18.71 18.71 18.71 18.71 Sunflower 16.80 16.80 16.80 16.80 16.80 16.80 16.80 16.80 16.80
Maize gluten 11.60 12.00 12.00 12.00 12.00 11.60 11.60 11.60 11.60
Wheat middling 2.17 2.17 2.17 2.17 2.17 5.00 5.00 5.00 5.00 Maize 28.56 23.45 18.37 13.30 8.25 18.08 13.25 8.73 4.39
Canola oil 1.00 1.00 1.00 1.00 1.00 1.00 1.00 1.00 1.00
Mineral premix1 1.00 1.00 1.00 1.00 1.00 1.00 1.00 1.00 1.00 Vitamin premix2 1.00 1.00 1.00 1.00 1.00 1.00 1.00 1.00 1.00
Binder 2.00 2.00 2.00 2.00 2.00 4.00 4.00 4.00 4.00
Chromic oxide 0.50 0.50 0.50 0.50 0.50 0.50 0.50 0.50 0.50
Crude protein (% DM) 30.03 29.87 29.96 29.71 30.07 29.84 29.98 30.48 30.38 Gross energy (MJ/kg DM) 20.21 20.34 20.48 20.53 20.47 20.58 20.42 20.26 20.36
Fat (% DM) 3.94 4.65 4.52 4.31 3.93 3.60 3.78 3.84 3.35
Crude fibre (% DM) 7.04 8.07 8.88 10.31 12.91 7.03 7.59 7.88 8.54 Dry matter (%) 94.69 92.40 92.32 91.32 91.40 94.65 95.22 95.47 94.84
FM- fishmeal; KM- kikuyu meal; MM- moringa meal 1 Mineral premix (g kg−1): KH2PO4, 502; MgSO4. 7H2O, 162; NaCl, 49.8; CaCO3, 336; Fe (II) gluconate, 10.9; MnSO4. H2O, 3.12; ZnSO4. 7H2O, 4.67; CuSO4. 5H2O, 0.62; KI, 0.16; CoCl2. 6H2O, 0.08; ammonium molybdate, 0.06; NaSeO3, 0.02. 2 Vitamin premix (g or IU kg−1 premix); thiamine, 5; riboflavin, 5; niacin, 25; folic acid, retinol palmitate, 500,000 IU;1; pyridoxine, 5;
cyanocobalamine, 5; cholecalciferol; 50,000 IU; a-tocopherol, 2.5; menadione, 2; inositol, 25; pantothenic acid, 10; ascorbic acid, 10; choline chloride, 100; biotin, 0.25.

798 S.N. Hlophe and N.A.G. Moyo / Turk. J. Fish. Aquat. Sci. 14: 795-806 (2014)
staining with haematoxylin and eosin. Slides were
examined under light trinocular microscopy at 400X
(Leica Microsystems model DM750, Leica,
Bannockburn, IL, USA). Each slide was
photographed with a DVC digital camera (Digital
Video Camera Company, Austin, TX) mounted on a
BH-2. Twenty measurements for villi height and
width (µm) were taken from each intestine slide using
Image J (1.46) software. Baeverfjord and Krogadahl
(1996)’s method was used to count goblet cells in
each segment. Liver degradation was quantified by
examining the hepatocyte nuclei, vacuolisation and
cytoplasm according to McFaden et al. (1997). Each
liver specimen was assigned one of 3 grades (1-3), a
healthy specimen scoring 1 and a degraded liver
scoring 3 (Table 3). The mean score of all samples in
that treatment was expressed as the hepatocyte
degradation value.
Blood was drawn through caudal venous
puncture from five fish in each tank (15 fish per
treatment) for haematological analysis. The analysis
for white blood cells (WBC), red blood cells (RBC),
haematocrit (HTC), haemoglobin (Hb), mean
corpuscular volume (MCV), mean corpuscular
hemoglobin (MCH), mean corpuscular hemoglobin
concentration (MCHC) was done on the Systemex,
XT-1800i blood analyser. Plasma glucose, plasma
protein and blood urea nitrogen (BUN) were analyzed
on a 600 DxC General Chemistry Analyser.
The following economic indicators were
calculated based on the assumption that all operating
costs remained constant and that only the cost of
ingredients was variable (Bahnasawy et al., 2003):
Incidence cost = cost of feed / quantity of fish
produced (kg); Profit index = local market value of
fish / cost of feed.
Statistical Analysis
Normality and homogeneity of variance was
tested using the Shapiro-Wilk normality test. Linear
regression equations of SGR, TGC, FCR, PER,
protein digestibility on leaf meal inclusion rate were
calculated. Analysis of covariance (ANCOVA) was
used to test if the regressions between the plant diets
were significant for each parameter. One way analysis
of variance (ANOVA) was used to determine the
effect of diet on histology and haematology
parameters. Significance was accepted at probabilities
≤0.05. All statistical analyses were conducted using
SAS for windows (SAS Institute, 9.2: 2008).
Results
Growth Performance Indices and Anti-Nutrients
in Leaf Meals
All feeds were accepted at the start of the
feeding trial, however, feed intake was significantly
(P<0.05) reduced as the levels of both leaf meals in
the diet increased. The highest TGC and SGR were
recorded in C. gariepinus fed the control diet. Growth
performance indices; TGC and SGR decreased
linearly with increasing levels of both KM and MM in
the diet (Table 4a and b). Fish fed KM based diets had
significantly higher (P<0.05, ANCOVA) feed intake,
TGC and SGR than those fed the MM diets.
The best FCR was observed in fish fed the
control diet and increased linearly with inclusion of
both leaf meals and this increase was significant
(P<0.05). The FCR of fish fed KM diets was
significantly (P<0.05, ANCOVA) better than that of
fish fed MM diets (Table 4a and b). Protein utilisation
was significantly reduced (P<0.05) when levels of
both leaf meals increased in the diet (Table 4a and b).
The PER of C. gariepinus fed KM based diets was
significantly higher (P<0.05) than that of fish fed MM
based diets. Apparent digestibility coefficient for
protein also decreased as the level of both KM and
MM in the diet increased and was higher in fish fed
KM than those fed MM diets (Table 4 a and b). The
Saponin concentrations were higher in MM (79.32 g
kg-1
) than in KM (20.31 g kg-1
). Polyphenols, tannins
and phytate concentrations were also higher in MM
than in KM (Table 1).
Effect of Kikuyu and Moringa Diets on the Liver
Condition and Intestine Histology
Histological analysis of C. gariepinus fed the
control diet showed hepatocytes of regular shape with
large centrally located nuclei and homogenous
cytoplasmic lipid content showing distinct boundaries
(Figure 1). A slight degradation in hepatocytes
Table 3. Histological criteria used for scoring of C. gariepinus hepatocytes
Tissue Grade
1 (Healthy) 2 (Intermediate) 3 (Degraded)
Liver nuclei Lightly granular, small and
distinct
Abundant granules, enlarged or
indistinct nucleoli
Small dark and pyknotic
Cytoplasm Structured: Varied texture,
scattered granules with eosin
positive patches
Homogenous: Granular slight
variability in staining property
Hyaline: Lacking texture, dark
small and often separated the cell
boundary
Fatty deposits Large fatty deposits which
follow cell boundary and
encroach on the nucleus
Small occasional fatty deposits No fatty deposits, cells shrink
leading to large sinusoidal space.
Adapted from McFadzen et al (1997).

S.N. Hlophe and N.A.G. Moyo / Turk. J. Fish. Aquat. Sci. 14: 795-806 (2014) 799
integrity was observed with increasing levels of KM
in the diet. The hepatocytes of fish fed high levels of
MM in the diet had poorly visible cell membranes and
hyaline cytoplasm, small pyknotic nuclei pushed to
the periphery of the cell and higher incidence of
Kupffer cells (Figure 1). Fish fed up to 75% KM did
not show any significant increase in hepatocyte
degradation scores (Figure 2). Fish fed MM had
higher degradation scores than those fed KM at the
same replacement level (Figure 2). Hepatocytes of
C. gariepinus fed MM based diets were unevenly
shaped with smaller nuclei and showed significantly
higher (P<0.05) hepatocyte degradation when MM
replaced >25% of FM. C. gariepinus fed MM100 had
the highest hepatocyte degradation score of 3.00
(Figure 2). Villi height decreased with increasing
levels of KM and MM in the diet (Table 5). In KM
fed fish, this decrease was only significant (P<0.05) at
the highest inclusion level (KM 100). In the fish fed
MM based diets, this decrease was significant
(P<0.05) in fish fed diets MM 75 and MM 100.
Furthermore, a significant increase in goblet cells
number was observed in treatment groups (Figure 3).
Goblet cell number was significantly higher (P<0.05)
when MM replaced more than 50% of FM in
C. gariepinus diets (Table 5).
Effect of Diet Kikuyu and Moringa Diets on
Haematological Parameters
WBC in C. gariepinus increased with increasing
plant meal in the diet. This increase, though not
significant (P>0.05) was more pronounced in MM
diets (Table 6). C. gariepinus RBCs and HCT were
not significantly affected at all levels of KM
inclusion, but were significantly lower in in fish fed
MM100. Mean corpuscular volume, MCH and
MCHC were not affected by dietary treatment. No
significant (P>0.05) trend was observed in plasma
glucose of C. gariepinus fed the experimental diets.
Plasma protein and BUN decreased with increasing
KM level, this was not significantly lower (P>0.05)
than the control in all KM diets. In the MM diets,
plasma protein and BUN also decreased at higher
MM levels and were significantly lower (P<0.05) than
the control in fish fed MM50 - MM100 (Table 6).
Cost Benefit Analysis
The cost benefit analysis of this experiment
show that adding KLM in C. gariepinus diets resulted
in lower incidence cost and higher profit index when
compared to the control (Table 4). The inclusion of
MLM on the other hand, resulted in increasingly
higher incidence costs and lower profit index with
increasing levels of MM in the diet (Table 4).
Discussion
The growth performance parameters (TGC and
SGR) in C. gariepinus fed the experimental diets
decreased as the level of both leaf meals in the diet
increased. The decrease in growth performance
corresponds to a decrease in feed intake. FM has been
traditionally used as the main protein source in fish
diets because of its high protein content, well
balanced amino acid profile and high palatability
(FAO, 2011; Hlophe and Moyo, 2011). Therefore, as
Table 4. Effect of (a) kikuyu and (b) moringa leaf meals on Clarias gariepinus growth performance, protein digestibility and
cost benefit analysis
(a) Control KM 25 KM 50 KM 75 KM 100 P model r2
IBW (g) 30.51±3.10 31.65 ± 1.65 31.27±2.12 30.45 ± 0.55 31.40 ± 0.80 FBW (g) 150.25±1.5 142.14±2.2 120.31±3.6 106.22±2.5 96 .50±1.1
Feed intake (g/fish/day) 1.58±0.2 a 1.48±0.6 b 1.34±0.1 c 1.28±0.2 d 1.23±0.5e 0.003 0.951
TGC 0.13±0.1a 0.12±0.1a 0.11±0.1ab 0.10±0.1b 0.08±0.1c 0.004 0.987 SGR (%/day) 2.8±0.3 a 2.5±0.5 ab 2.25±0.6b 2.08±0.1c 1.85±0.7d 0.001 0.988
FCR 0.8±0.1 a 0.82±0.3a 0.90±0.2b 0.99±0.4c 1.14±0.1d 0.008 0.908
PER 4.19±0.5a 4.12±0.9a 3.70±0.10.5b 3.36±0.2c 2.93±0.4d 0.003 0.951
ADC (Protein) 83.21±1.1a 82.24±0.5ab 80.07±1.2b 79.69±1.4bc 77.84±0.9c 0.001 0.979
Incidence cost 0.01 0.01 0.01 0.01 0.01
Profit index 2.02 2.07 2.18 2.26 2.36
(b) Control MM 25 MM 50 MM 75 MM 100 P model r2
IBW (g) 30.51±3.10 30.25±1.5 31.01±1.8 30.59±0.9 29.56±1.1
FBW (g) 150.25±1.5 123.17±1.3 111.00±3.5 106.21±2.5 86.03±1.2 Feed intake (g/fish/day) 1.58±0.2a 1.30±0.3b 1.24±0.7c 1.25±0.3c 1.14±0.4f 0.045 0.786
TGC 0.13±0.1a 0.11±0.1ab 0.10±0.1b 0.09±0.1c 0.08±0.1d 0.002 0.964
SGR (%/day) 2.8±0.3a 2.3±4.02b 2.01±0.3c 1.8±0.2d 1.58±0.4e 0.002 0.959
FCR 0.8±0.1a 0.84±0.2a 0.94±0.1 b 1.03±0.2 c 1.21±0.5 d 0.005 0.929
PER 4.19±0.5a 3.96±0.6b 3.58±0.5 b 3.55±0.2 c 2.76±0.2 e 0.013 0.902
ADC (Protein) 83.21±1.1 a 81.53±1.3b 78.81±0.7c 76.62±0.5d 74.50±1.2e 0.001 0.875
Cost benefit analysis
Incidence cost 0.01 0.01 0.01 0.02 0.02
Profit index 2.02 1.79 1.66 1.55 1.44
Values are mean of triplicate determinations ± standard deviations. Values in the same rows with the same superscripts are not significantly different (P>0.05).

800 S.N. Hlophe and N.A.G. Moyo / Turk. J. Fish. Aquat. Sci. 14: 795-806 (2014)
Figure 1. Effect of kikuyu and moringa leaf meals on liver histology in Clarias gariepinus. Scale bar = 100 µm. arrows
point to hepatocytes (hp), sinusoids (sn), Kupffer cells (kc) and blood vessels (bv).

S.N. Hlophe and N.A.G. Moyo / Turk. J. Fish. Aquat. Sci. 14: 795-806 (2014) 801
the amount of FM in the diet decreased, the
palatability may have also decreased hence the lower
feed intake observed. Furthermore, plant protein
sources contain anti-nutrients which reduce
palatability (Francis et al., 2001). This may result in
an interaction between the pro-nutritional effects of
FM and the anti-nutritional effects in the leaf meals.
The higher levels of anti-nutrients in moringa than in
kikuyu grass may explain the lower palatability and
poor growth of fish fed the moringa based diets.
Similar results have been reported by Bairagi et al.
(2004) who used leaf meals to replace fishmeal.
Protein efficiency and digestibility was highest
in fish fed the control diet. When FM was replaced
with KM and MM, protein efficiency and digestibility
decreased. Higher PER and protein ADC in KM
based diets compared to MM diets indicate that KM is
digested and utilised better than MM. Apparent
digestibility coefficient for C. gariepinus fed up to
50% KM fell within limits regarded as high (75-95%).
These high digestibility values are in the same range
with values reported in C. gariepinus fed soybean
Figure 2. Mean hepatocyte degradation of Clarias gariepinus fed different inclusion levels of kikuyu and moringa leaf
meals. Data points on a curve with different letters are significantly different (P=0.05). Bars represent standard deviation.
Table 5. Intestine histology values of Clarias gariepinus fed different inclusion levels of kikuyu and moringa leaf meals
% of fishmeal replaced by the plant meals in the diet
Control 25 50 75 100
Villi length (µm)
KM 634.48±10a 624.51±6a 617.41±8a 602.55±9a 600.38±12b
MM 621.75±10a 614.52±10a 593.89±30b 576.75±13b Villi width (µm)
KM 83.12±10a
82.71±14a 82.89±12a 83.74±9a 83.38±12a
MM 84.02±11a 83.59±13a 82.50±11a 83.45±15a Goblet cell number
KM 450.02±14a
462±15a 478±12a 492±10b 503±14b
MM 485±10a 498±7b 502±11b 527±16b
Values are mean of five determinations ± standard deviations. Values in the same rows with the same superscripts are not significantly different (P>0.05).
Table 6. The Effect of the experimental diets on haematological parameters of Clarias gariepinus
CNTL KM 25 KM 50 KM 100 MM 25 MM 50 MM 100
WBC (103 µl) 609.80±9.2a 615.81±9.6a 617.64±7.1a 625.24±8.7b 611.87±9.8a 629.74±8.5b 635.21±7.2b
RBC(106 µl) 2.85±0.19a 2.72±0.17a 2.67±0.2a 2.68±0.15a 2.65±0.20a 2.64±0.19a 2.62±0.15b HTC (l/l) 0.39±0.1a 0.37±0.1a 0.35±0.2a 0.32±0.1a 0.36±0.1a 0.34±0.2a 0.31±0.1b
Hb (g/dl) 10.33±2.1a 10.32±1.5a 10.30±2.7a 10.28±1.9a 10.25±2.2a 10.25±2.1a 10.26±2.8 b
MCV (fL) 136.84±7.5a 136.03±5.6a 131.10±4.5a 119.40±7.1a 135.85±9.6a 128.79±4.8a 118.32±7.2a MCH (pg) 36.24±2.1a 37.94±3.1a 38.60±2.1a 38.36±2.5a 38.83±2.8a 38.83±1.5a 39.10±3.8a
MCHC (g/dl) 26.48±2.4a 27.89±3.5a 29.40±1.6a 32.13±2.3a 28.47±4.1a 30.14±2.5 a 33.09±3.5a
Glucose (g/dl) 2.40±0.2a 3.40±1.2 a 2.70±0.1 a 1.80±0.3a 1.80±0.2a 3.00±0.2a 2.40±0.3a Total protein (g/l) 41.00±1.1a 40.00±2.3a 39.60±2.1a 34.00±1.5b 39.00±1.0a 35.00±2.0b 34.50±1.4b
BUN 1.00±0.1a 0.95±.02a 0.80± 0.1a 0.85± 0.1a 0.85± .011a 0.75±0.2b 0.70±0.1b
Values are mean of five determinations ± standard deviations. Values in the same rows with the same superscripts are not significantly different (P>0.05).
WBC- white blood cells; RBC- red blood cells; HCT- hematocrit; Hb- hemoglobin; MCV- mean corpuscular volume; MCH- Mean
corpuscular hemoglobin; MCHC- mean corpuscular haemoglobin concentration; Glucose- plasma glucose; BUN- Blood urea nitrogen.
802 S.N. Hlophe and N.A.G. Moyo / Turk. J. Fish. Aquat. Sci. 14: 795-806 (2014)
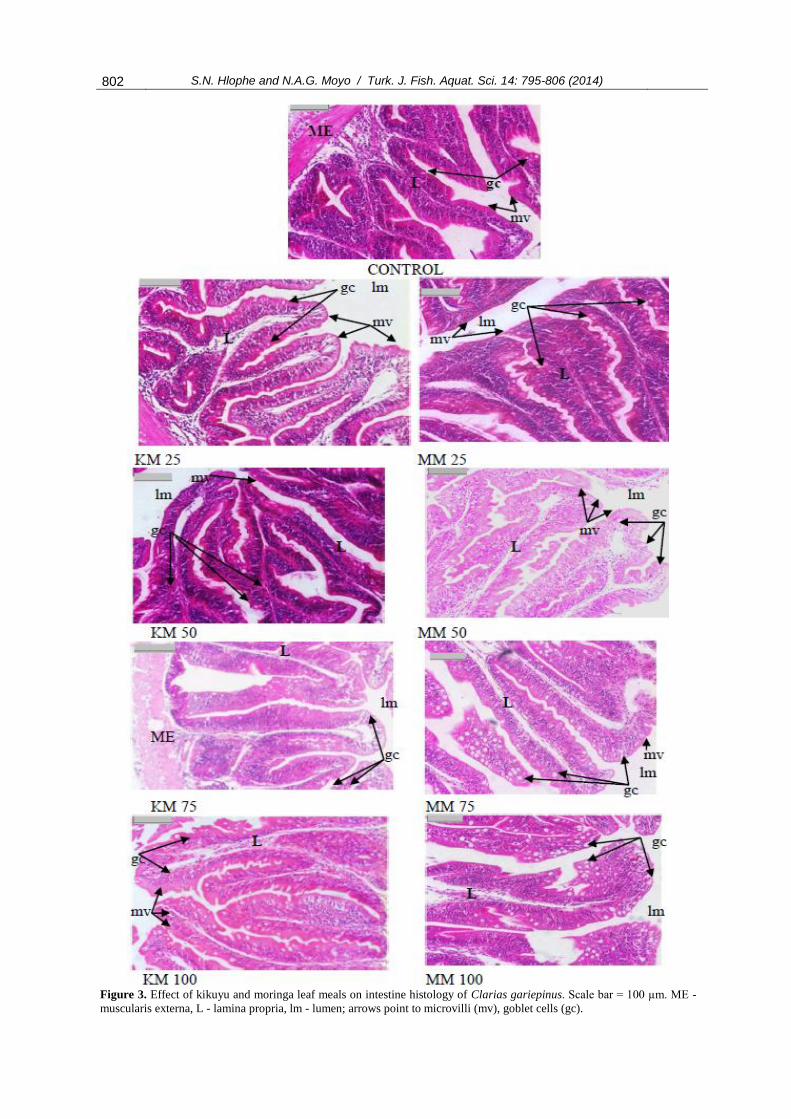
Figure 3. Effect of kikuyu and moringa leaf meals on intestine histology of Clarias gariepinus. Scale bar = 100 µm. ME -
muscularis externa, L - lamina propria, lm - lumen; arrows point to microvilli (mv), goblet cells (gc).

S.N. Hlophe and N.A.G. Moyo / Turk. J. Fish. Aquat. Sci. 14: 795-806 (2014) 803
based diets (Fagbenro and Davies, 2001). However,
protein ADC values in MM based diets were below
this range. These results suggest that KM may be a
viable protein source in C. gariepinus diets as it is
widely available and not as highly priced as soybean.
The amino acid (AA) profile is an important
factor considered in selecting a protein source in fish
diets (El-Sayed, 2006). In both plant meals used in
this study, the AA profile was sufficient to meet
C. gariepinus dietary requirements. The poor
performance (growth, protein utilisation and
digestibility) of fish fed MM diets may be attributed
to the negative effects of anti-nutrients. According to
Eusebio et al. (2004) the presence of anti-nutrients
may hinder the digestibility and utilisation of dietary
nutrients. Phytate reduces the bioavailability of
nutrients due to formation of complexes such as a
phytate–mineral/protein complex. Fish are unable to
make use of phytate-nutrient complexes because they
lack the enzyme phytase (Riche et al., 2001). Tannins
hinder the digestive process by binding to digestive
enzymes such as protease resulting in a decrease in
proteolytic enzyme activity, leading to reduced
protein digestibility (Eusebio et al., 2004). Tannins
also decrease the absorption of essential vitamins
(Francis et al., 2001). Polyphenols on the other hand,
form phenolic-protein-enzyme complexes, these also
decrease protein digestibility and amino acid
availability. Therefore, the decrease in protein
utilisation in fish fed higher levels of MM in the diets
is attributed to a decline in the absorption of nutrients.
The findings of the current study correspond with
those of Bairagi et al. (2004) who reported a decrease
in growth performance and protein digestibility with
increasing leaf meal levels in fish diets.This supports
earlier studies which reported that anti-nutritional
factors reduce the digestibility and bioavailability of
dietary nutrients (Francis et al., 2001; Olivera-Novoa
et al. (2002).
Liver histology indicated an increase in
hepatocyte degradation with increasing levels of KM
and MM. Fish fed MM had higher degradation scores
than those fed KM. C. gariepinus fed high MM levels
(>50% MM) showed an increase in the number of
degraded hepatocytes with irregularly shaped cells,
small dark pyknotic nuclei, poor fatty deposition
isolated necrosis. In spite of similar protein and
energy levels in the experimental diets, liver histology
showed that C. gariepinus fed higher MM levels had
necrotic signs associated with poor nutritional status
(Tusche et al., 2012; Fontagne et al., 1998; Power et
al., 2000; Ostaszewska et al., 2005). The malnutrition
signs observed in C. gariepinus fed higher levels of
MM may be a consequence of the unavailability of
protein and amino acids that have been bound with
the tannins or have formed indigestible complexes
with the polyphenols. As a result of the poor
digestibility, a substantial portion of the essential
dietary nutrients was not available to the fish and
subsequently excreted. This explains the nutritional
necrosis observed in the hepatocytes.
Intestine histology in C. gariepinus showed
significantly shorter villi when fed higher levels of
MM in the diet. The longer villi found in fish fed
lower levels of KM (<75%) in the diet indicate higher
efficiency in the absorptive process (Da Silva et al.,
2012; Caballero et al., 2003). This was evidenced by
the better growth performance of fish fed these diets.
The decrease in villi height resulted in reduced
surface area for nutrient absorption (Da Silva et al.,
2012); this may also explain the poor condition of the
liver. Furthermore, the enterocytes of these fish
showed an increase in goblet cell number and
microvilli degeneration. The increase in the number
of goblet cells may be an indication of increased
irritation as these cells produce mucus lining the
brush border. This mucus serves as a lubricant
providing protection against chemical and mechanical
damage. The increase in goblet cell number may also
be an immune response against the anti-nutrients
(Marchetti et al., 2006). Saponins have surface-active
constituents which may result in the damage of
biological membranes resulting in increased
permeability of the mucosal cells (Bureau et al.,
1998). The saponin content of MM is comparable to
that reported in soybean meal up to 83 g kg-1
(Ireland
et al. 1986). The higher saponin concentrations in
MM compared to KM may explain the negative effect
caused by MM diets in the digestive tract. Bureau et
al. (1998) reported a reduction in weight gain and
significant intestinal damage in Chinook salmon and
rainbow trout fed saponin containing diets. It is
important to note that dietary inclusion of both leaf
meals did not result in some of the intestine
abnormalities that have been reported in carnivorous
fish fed plant diets. These include a decrease in
basophil granulocytes, and distal displacement of
enterocyte nucleus (Borquez et al., 2011). Other
authors have reported a widening of the central
stroma within the mucosal folding, higher amounts of
connective tissue; and an infiltration of inflammatory
cells in the lamina propria (Krogdahl et al., 2000;
Refstie et al., 2000). This may be an indicator that C.
gariepinus being an omnivore, is more capable of
utilising plant diets than carnivorous fish. However,
work done on Tilapia rendalli (herbivorous fish) fed
kikuyu and moringa diets indicate a higher ability of
this fish to use plant based diets than C. gariepinus
(Hlophe and Moyo, 2014). T. rendalli had lower
levels of hepatocyte and intestine degradation.
Blood parameters are an important tool for
monitoring both the nutritional and the health status
of fish. In the present study, RBC, Hb and HCT
decreased significantly in C. gariepinus fed high MM
levels. This decrease further indicates nutritional
stress. According to Qiang et al. (2013) when dietary
protein levels are low, physiological stress is induced
and this damages the liver, leading to reduced RBC
and Hb concentration. Similarly, Sakthivel (1988) and
Abdel-Tawwab et al. (2010) reported a decrease in
804 S.N. Hlophe and N.A.G. Moyo / Turk. J. Fish. Aquat. Sci. 14: 795-806 (2014)
RBC and Hb in fish fed low protein levels in the diet.
In spite of the isonitrogenous diets used in this study
C. gariepinus fed ≥75MM in the diets showed signs
of nutritional stress. The WBCs increased with
increasing levels of both KM and MM, with higher
levels observed in the MM diets. Plasma protein and
BUN were significantly lower in C. gariepinus fed
high MM levels. The low plasma protein observed in
C. gariepinus may be a consequence of decreased
protein absorption emanating from the shorter villi
and poor protein digestibility recorded in these fish.
BUN represents the amount of nitrogen in the blood
that comes from urea. The liver is the main source of
urea, thus the lower BUN levels may be an indication
of the compromised functioning of the liver.
Cost benefit analysis showed that KM diets are
economically superior to both the FM based control
and MM diets. Feeding KM diets resulted in higher
profit index and lower incidence cost than feeding the
FM based control whereas, feeding MM gave lower
profit index and a higher incidence cost. Widespread
claims on the health benefits in humans have
increased the demand and the price for moringa
leaves in South Africa, making its use in fish diets
unsustainable.
Conclusion
The KM showed greater potential in replacing
FM the MM. The growth performance indices (SGR,
TGC, FCR, PER) were higher in KM fed fish at all
dietary inclusion levels. Histological and
haematological analysis indicated that C. gariepinus
were more stressed as the level of MM in the diet
increased. Anti-nutritional factors (polyphenols,
tannins, saponins and phytate) are most probably
responsible for the poor performance of the moringa
diets. It is suggested that the specific roles that each of
these anti-nutrients plays in the utilisation of nutrients
be further investigated. From the cost benefit analysis
it is also evident that kikuyu based diets are more
profitable than moringa based diets.
Acknowledgements
We extend our utmost appreciation to Prof Van
Boggart and the staff at NHS labs (Polokwane) for
assisting with the histological analysis, Mr G.
Geldenhuys for technical support. The authors
acknowledge the National Research Foundation and
the Aquaculture Research Unit for funding this study.
References
Abdel-Tawwab, M., Ahmad, M.H., Khattab, Y.A.E. and
Shalaby, A.M.E. 2011. Effect of dietary protein level,
initial body weight, and their interaction on the
growth, feed utilization, and physiological alterations
of Nile tilapia, Oreochromis niloticus (L.).
Aquaculture, 298: 267-274. doi:10.1016/j.aquaculture.
2009.10.027
Afuang, W., Siddhuraju, P. and Becker, K. 2003.
Comparative nutritional evaluation of raw, methanol
extracted residues and methanol extracts of moringa
(Moringa oleifera Lam.) leaves on growth
performance and feed utilization in Nile tilapia
(Oreochromis niloticus L.). Aquaculture Research,
34(13): 1147-1159. doi: 10.1046/j.1365-2109.2003.
00920.x
Alarcón, F.J., Moyano, F.J. and Díaz, M. 2002. Evaluation
of different protein sources for aquafeeds by an
optimised pH-stat system. Journal of the Science of
Food and Agriculture, 82: 697-704. doi: 10.1002/
jsfa.1100
Amisah, S., Oteng, M.A. and Ofor, J.K. 2009. Growth
performance of the African catfish, Clarias
gariepinus, fed varying inclusion levels of Leucaena
leucocephala leaf meal. Journal of Applied Sciences
and Environmental Management, 13(1): 21-26.
doi:10.4314/jasem.v13i1.55257;
AOAC International. 2012. 19th Edition. Aoac Intl; 19
edition. Association of Analytical Communities.
Gaithersburg, MD, USA.
Baeverfjord, G. and Krogdahl, A. 1996. Development and
regression of soybean meal induced enteritis in
Atlantic salmon, Salmo salar L., distal intestine: a
comparison with the intestines of fasted fish.
Journal of Fish Diseases, 19: 375-387. doi:
10.1046/j.1365-2761.1996.d01-92.x;
Bahnasawy, M.H., Abdel-Baky, T.E. and Gamal, A. 2003.
Growth performance of Nile tilapia (Oreochromis
niloticus) fingerlings raised in an earthen pond.
Archives of Polish Fisheries, 11: 277-285.
Bairagi, A., Ghosh, K.S., Sen, S.K. and Ray, A.K. 2004.
Evaluation of the nutritive value of Leucaena
leucocephala leaf meal, inoculated with fish intestinal
bacteria Bacillus subtilis and Bacillus circulans in
formulated diets for rohu, Labeo rohita (hamilton)
fingerlings. Aquaculture Research, 85: 436-446. doi:
10.1111/j.1365-2109.2004.01028.x;
Bichi, A.H. and Ahmad M.K. 2010. Growth performance
and nutrient utilization of African catfish (Clarias
gariepinus) fed varying dietary levels of processed
cassava leaves. Bayero J. of Pure and Applied
Sciences, 3(1): 118-122. doi:10.4314/bajopas.v3i1.
58739
Borquez, A., Serrano, E., Dantagnan, P., Carrasco, J. and
Hernandez, A. 2011. Feeding high inclusion of whole
grain white lupin (Lupinus albus) to rainbow trout
(Oncorhynchus mykiss): effects on growth, nutrient
digestibility, liver and intestine histology and muscle
fatty acid composition. Aquaculture Research, 42 (8):
1067-1078. doi: 10.1111/j.1365-2109.2010.02690.x;
Bureau, D.P., Harris, A.M. and Cho, C.Y. 1998. The effects
of purified alcohol extracts from soy products on feed
intake and growth of chinook salmon (Oncorhynchus
tshawytscha) and rainbow trout (Oncorhynchus
mykiss). Aquaculture, 161: 27-43. doi:10.1016/S0044-
8486(97)00254-8
Caballero, M.J., Izquierdo, M.S., Kjørsvik, E., Montero, D.,
Socorro, J., Fernández, A.J. and Rosenlund, G. 2003.
Morphological aspects of intestinal cells from gilthead
seabream (Sparus aurata) fed diets containing
different lipid sources. Aquaculture, 225: 325-340.
doi:10.1016/S0044-8486(03)00299-0
Chaudhuri, A., Mukherjee, S. and Homechaudhuri, S. 2012.
Diet composition and digestive enzymes activity in
carnivorous fishes inhabiting mudflats of Indian

S.N. Hlophe and N.A.G. Moyo / Turk. J. Fish. Aquat. Sci. 14: 795-806 (2014) 805
Sundarban estuaries. Turkish Journal of Fisheries and
Aquatic Sciences, 12: 265-275. doi: 10.4194/1303-
2712-v12_2_11
Cho, C.Y., Slinger, S.J. and Bayley, H.S. 1982.
Bioenergetics of salmonid fishes: Energy intake,
expenditure and productivity. Comparative
Biochemistry and Physiology Part B: Comparative
Biochemistry, 73: 25-41. doi: 10.1016/0305-0491(82)
90198-5
Chong, A.S.C., Hashim, R. and Ali, A.B. 2002. Assessment
of dry matter and protein digestibility of selected raw
ingredients by discus fish (Symphysodon
aequifasciata) using in vivo and in vitro methods.
Aquaculture Nutrition, 8: 229-238.
doi: 10.1046/j.1365-2095.2002.00214.x
Collins, S.A., Desai, A.R., Mansfield, G.S., Hill, J.E., Van
Kessel, A.G. and Drew, M.D. 2012. The effect of
increasing inclusion rates of soybean, pea and canola
meals and their protein concentrates on the growth of
rainbow trout: Concepts in diet formulation and
experimental design for ingredient evaluation.
Aquaculture, 344-349: 90-99. doi:10.1016/j.
aquaculture.2012.02.018;
Da Silva, M.R., Natali, M.R.M. and Hahn, N.S. 2012.
Histology of the digestive tract of Satanoperca
pappaterra (Osteichthyes, Cichlidae). Acta
Scientiarum Biological Sciences, 34: 319-326.
doi: 10.4025/actascibiolsci.v34i3.8956;
El-Sayed, A.F.M. 2006. Tilapia Culture. CABI Publishers.
Oxfordshire, UK, 277 pp. ISBN-13: 978-0851990149;
Eusebio, P.S., Coloso, R.M. and Mamauag, E.P. 2004.
Apparent digestibility of selected ingredients in diets
for juvenile grouper, Epinephelus coides (Hamilton).
Aquaculture Research, 35: 1261-1269. doi: 10.1111/j.
1365-2109.2004.01148.x;
Fagbenro, O.A. and Davies, S.J. 2001. Use of soybean flour
(dehulled, solvent-extracted soybean) as a fish meal
substitute in practical diets for African catfish, Clarias
gariepinus (Burchell 1822): growth, feed utilization
and digestibility. Journal of Applied Ichthyology, 17:
64-69. doi: 10.1046/j.1439-0426.2001.00252.x;
Fasakin, E.A., Balogun, A.M. and Ajayi, O.O. 2003.
Evaluation of full-fat and defatted maggot meals in
the feeding of clariid catfish Clarias gariepinus
fingerlings. Aquaculture Research, 34: 733-738. doi:
10.1046/j.1365-2109.2003.00876.x;
Fontagne, S., Geurden, I., Escaffre, A.M. and Bergot, P.
1998. Histological changes induced by dietary
phospholipids in intestine and liver of common carp
(Cyprinus carpio L.) larvae. Aquaculture, 161: 213-
223. doi:10.1016/S0044-8486(97)00271-8;
Francis, G., Makkar, H.P.S. and Becker, K. 2001.
Antinutritional factors present in plant-derived
alternate fish feed ingredients and their effects in fish.
Aquaculture, 199: 197-227. doi:10.1016/S0044-
8486(01)00526-9;
Gatlin, D.B.I.I.I., Barrows, F.T., Brown, P., Dabrowski, K.,
Gaylord, T.G., Hardy, R.W., Herman, E., Hu, G.,
Krogdahl, A., Nelson, R., Overturf, K., Rust, M.,
Sealey, W., Skonberg, D., Souza, E.J., Stone, D.,
Wilson, R. and Wurtele, E. 2007. Expanding the
utilization of sustainable plant products in aquafeeds:
a review. Aquacltutre Research, 38: 551-579. doi:
10.1111/j.1365-2109.2007.01704.x;
Hlophe, S.N. and Moyo, N.A.G. 2014. A comparative study
on the use of Pennisetum clandestinum and Moringa
oleifera as protein sources in the diet of the
herbivorous Tilapia rendalli. Aquaculture Intern., 22:
145-1262. doi: 10.1007/s10499-013-9744-4;
Hlophe, S.N., Moyo, N.A.G. and Ncube, I. 2014.
Postprandial changes in pH and enzyme activity from
the stomach and intestines of Tilapia rendalli
(Boulenger, 1897), Oreochromis mossambicus
(Peters, 1852) and Clarias gariepinus (Burchell,
1822). Journal of Applied Ichthyology, 30: 35-41.
doi: 10.1111/jai.12290
Hlophe, S.N. and Moyo, N.A.G. 2011. The effect of
different plant diets on the growth performance,
gastric evacuation rate, and carcass composition of
Tilapia rendalli. Asian Journal of Animal and
Veterinary Advances, 6: 1001-1009. doi:10.3923/
ajava.2011.1001.1009
Ireland, P.A., Dziedzic, S.C. and, Kearsley, M.W. 1986.
Saponin content of soya and some commercial soya
products by means of high performance liquid
chromatography of the sapogenins. Journal of the
Science of Food and Agriculture, 37: 694-698. doi:
10.1002/jsfa.2740370715;
Iwama, G.K. and Tautz, A.F. 1981. A simple growth model
for salmonids in hatcheries. Canadian Journal of
Fisheries and Aquatic Sciences, 38: 649-656. doi:
10.1139/f81-087;
Krogdahl, A., Bakke-Mckellep, A.M., Roed, K.H. and
Baeverfjord, G. 2000. Feeding Atlantic salmon Salmo
salar L. soybean products: effects on disease
resistance (furunculosis), and lysozyme and IgM
levels in the intestinal mucosa. Aquaculture Nutrition,
6: 77-84. doi: 10.1046/j.1365-2095.2000.00129.x;
Makkar, H.P.S. and Becker K., 1997. Nutrients and
antiquality factors in different morphological parts of
the Moringa oleifera tree. Journal of Agricultural
Science, 128: 311-322. doi: 10.1017/S002185969700
4292;
Makkar, H.P.S., Blummel, M., Borowy, N.K. and Becker,
K. 1993. Gravimetric determination of tannins and
their correlations with chemical and protein
precipitation methods. Journal of the Science of Food
and Agriculture, 61: 161-165. doi: 10.1002/jsfa.27406
10205
Marais, J.P., Figenischou, D.L. and Dennison, C. 1987. The
accumulation of nitrate in Kikuyu grass (Pennisetum
clandestinum Hochst). South African Journal of Plant
and Soil, 4: 82-88. doi: 10.1080/02571862.1987.
10634946
Marchetti, L., Capacchietti, M., Sabbieti, M.G., Accili, D.,
Materazzi, G. and Menghi, G. 2006. Histology and
carbohydrate histochemistry of the alimentary canal in
the rainbow trout Oncorhynchus mykiss. Journal of
Fish Biology, 68: 1808-1821. doi: 10.1111/j.0022-
1112.2006.01063.x
McFadzen, I.R.B., Coombs, S.H. and Halliday, N.C. 1997.
Histological indices of the nutritional condition of
sardine, Sardina pilchardus (Walbaum) larvae of the
north coast of Spain. Journal of Experimental Marine
Biology and Ecology, 212: 239-258.
doi:10.1016/S0022-0981(96)02755-4;
Olivera-Novoa, M.A., Olivera-Castillo, L. and Martinez-
Palacios, C.A. 2002. Sunflower seed meal as a protein
source in diets for Tilapia rendalli (Boulenger, 1896)
fingerlings. Aquaculture Research, 33: 223-229. doi:
10.1046/j.1365-2109.2002.00666.x;
Ostaszewska, T., Dabrowski, K., Palacios, M.E.,
Olejniczak, M. and Wieczorek, M. 2005. Growth and
morphological changes in the digestive tract of

806 S.N. Hlophe and N.A.G. Moyo / Turk. J. Fish. Aquat. Sci. 14: 795-806 (2014)
rainbow trout (Oncorhynchus mykiss) and pacu
(Piaractus mesopotamicus) due to casein replacement
with soybean proteins. Aquaculture, 245: 273-286.
doi:10.1016/j.aquaculture.2004.12.005;
Power, D.M., Melo, J. and Santos, C.R.A. 2000. The effect
of food deprivation and refeeding on the liver, thyroid
hormones and transthyretin in sea bream. Journal of
Fish Biology, 56: 374-387. doi: 10.1111/j.1095-8649.
2000.tb02112.x;
Qiang, J., Yang, H., Wang, H., Kpundeh, M.D. and Xu, P.
2013. Interacting effects of water temperature and
dietary protein level on hematological parameters in
Nile tilapia juveniles, Oreochromis niloticus (L.) and
mortality under Streptococcus iniae infection. Fish
Shellfish Immunology, 34: 8-16. doi: 10.1016/j.fsi.
2012.09.003
Rašković, B.S., Stanković, M.B., Marković, Z.Z. and
Poleksić, V.D. 2011. Histological methods in the
assessment of different feed effects on liver and
intestine of fish. Journal of Agricultural Sciences, 56:
87-100. doi: 10.2298/jas1101087r;
Refstie, S., Korsǿen, J., Storebakken, T., Baeverfjord, G.,
Lein, I. and Roem, A.J. 2000. Differing nutritional
responses to dietary soybean meal in rainbow trout
(Oncorhynchus mykiss) and Atlantic salmon (Salmo
salar). Aquaculture, 190: 49-63. doi: 10.1016/S0044-
8486(00)00382-3;
Riche, M., Trottier, N.L., Ku, P.K. and Garling, D.L. 2001.
Apparent digestibility of crude protein and apparent
availability of individual amino acids in tilapia
(Oreochromis niloticus) fed phytase pretreated
soybean meal diets. Fish Physiology and
Biochemistry, 25: 181-194. doi: 10.1023/A:1022222
431004;
Richter, N., Siddhuraju, P. and Becker, K. 2003. Evaluation
of nutritional quality of moringa (Moringa oleifera
Lam.) leaves as an alternative protein source for Nile
tilapia (Oreochromis niloticus L.). Aquaculture, 217:
599-611. doi:10.1016/S0044-8486(02)00497-0;
Sakthivel, M. 1988. Effects of varying dietary protein level
on the blood parameters of Cyprinus carpio.
Proceedings of the Indian National Academy of
Sciences: Animal Sciences, 97: 363-366. doi:
10.1007/BF03179546;
SAS 2008, Proprietary software release 9.2. North Carolina,
USA. Statistical Analysis Systems Institute, Inc. Cary.
http://www.sas.com/en_us/home.html;
Sintayehu, A., Mathies, E., Meyer-Burgdorff, K.-H.,
Rosenow, H. and Gunther, K.-D. 1996. Apparent
digestibilities and growth experiments with tilapia
(Oreochromis niloticus) fed soybean, cottonseed meal
and sunflower seed meal. Journal of Applied
Ichthyology, 12: 125-130. doi: 10.1111/j.1439-
0426.1996.tb00075.x;
Skelton, P.H. 2001. A Complete Guide of the Freshwater
Fishes of Southern Africa. Southern Book Publishers
(Pty) Ltd, Halfway House, South Africa, 395 pp.
FAO 2011. Demand and supply of feed ingredients for
farmed fish and crustaceans. Trends and prospects.
http://www.fao.org/docrep/015/ba0002e/ba0002e.pdf
(accessed January 22, 2014)
Tusche, K., Arning, S., Wuertz, S., Susenbeth, A. and
Schulz, C. 2012. Wheat gluten and potato protein
concentrate-Promising protein sources for organic
farming of rainbow trout (Oncorhynchus mykiss).
Aquaculture, 349: 120-125. doi:10.1016/j.aquaculture.
2012.03.009;
Winberg, G.G. 1956. Rate of metabolism and food
requirements of fishes. Belorus State University,
Minsk. Fish. Res. Bd. Canada, Trans. Ser. No. 194, 1-
202. In: J.C. MacKinnon, 1973. Metabolism and its
relationship with growth rate of American plaice,
Hippoglossoides platessoides. Journal of
Experimental Marine Biology and Ecology, 11: 297-
310. doi:10.1016/0022-0981(73)90029-4;