Repackaged Pharmaceuticals in the California Workers ...€¦ · Workers’ Compensation,...
29
Repackaged Pharmaceuticals in the California Workers’ Compensation System: From Distribution and Pricing Options to Physician and Retail Dispensing Matthew Gitlin, Pharm.D. Pharmacoeconomic and Outcomes Research Fellow University of California, San Francisco/Amgen Department of Clinical Pharmacy Leslie Wilson, Ph.D. Associate Adjunct Professor Health Policy and Economics University of California, San Francisco Departments of Clinical Pharmacy and Medicine Corresponding Author: Matthew Gitlin, Pharm.D. Pharmacoeconomic and Outcomes Research Fellow University of California, San Francisco Box 0613, Suite 420M 3333 California St. Tel: 415-476-3513, Fax: 415-502-0792 email: [email protected] Running Title: Repackaged Pharmaceuticals in Workers’ Compensation This work was partially supported with data from California Workers’ Compensation Institute. 1
Transcript of Repackaged Pharmaceuticals in the California Workers ...€¦ · Workers’ Compensation,...

Repackaged Pharmaceuticals in the California Workers’ Compensation System:
From Distribution and Pricing Options to Physician and Retail Dispensing
Matthew Gitlin, Pharm.D. Pharmacoeconomic and Outcomes Research Fellow University of California, San Francisco/Amgen Department of Clinical Pharmacy Leslie Wilson, Ph.D. Associate Adjunct Professor Health Policy and Economics University of California, San Francisco Departments of Clinical Pharmacy and Medicine Corresponding Author: Matthew Gitlin, Pharm.D. Pharmacoeconomic and Outcomes Research Fellow University of California, San Francisco Box 0613, Suite 420M 3333 California St. Tel: 415-476-3513, Fax: 415-502-0792 email: [email protected] Running Title: Repackaged Pharmaceuticals in Workers’ Compensation This work was partially supported with data from California Workers’ Compensation Institute.
1
Abstract
Objective: The California Workers’ Compensation (WC) pharmaceutical pricing system
cannot price 60% of National Drug Codes (NDCs) (mostly repackaged pharmaceuticals).
This study will estimate the lost savings due to repackaged pharmaceuticals and potential
cost savings associated with alternative pricing systems for un-priced pharmaceuticals.
Methods: All pain-related repackaged pharmaceuticals were identified by NDC using claims
data from the California Workers’ Compensation Institute (CWCI) database during 2002.
Results: Repackaged pharmaceuticals represented 55% of all NDCs and 92% of all Medi-
Cal non-equivalent NDCs, but only 22% ($8,494,297/$38,968,233) of total pharmacy costs.
Total repackaged pharmaceutical costs could be reduced by 36% ($3,059,177) using an
alternative formula based on Medi-Cal. Compared with Medi-Cal priced manufacturer-
packaged pharmaceuticals, repackaged pharmaceuticals are approximately 85% more
expensive on a cost-per-pill basis.
Conclusion: We propose limiting the generous pricing of repackaged pharmaceuticals.
However, Medi-Cal payment rates may be extreme, and more moderate repricing might
compensate physician dispensing time more fairly and preserve patient access.
Key Words
Workers’ Compensation, Repackaged Pharmaceuticals, Pain Medications, Physician
Dispensing, Drug Distribution
2

Introduction
Problem/Significance
The revised California Workers’ Compensation (WC) drug pricing system that went
into effect on January 1, 2004 along with other cost cutting reforms tied payments to the
much lower Medi-Cal (California’s Medicaid) system in order to save costs to the workers’
compensation program [Alarcón, 2003; Wilson et al, 2005]. However, approximately 60%
of National Drug Codes (NDCs) in the California Workers’ Compensation System (many of
which were repackaged pharmaceuticals) lacked an equivalent Medi-Cal NDC, necessitating
a revision to the old pricing for these NDCs [California Code of Regulations (CCR) 9789.40,
2005].
Proposed Senate Bill (SB) 292 (February 2005) attempted to resolve some of the
inconsistencies between the old California Workers’ Compensation Fee Schedule and the
recently adopted Medi-Cal based reimbursement system, by proposing a new reimbursement
scheme for those pharmaceuticals not priced under the Medi-Cal system most of which are
repackaged pharmaceuticals [Speier, 2005]. The proposed bill was not approved, but the
Division of Workers’ Compensation has begun to revise the language of an existing
regulation, California Code of Regulations (CCR) title 8 Section 9789.40, which was based
on the now approved Senate Bill (SB) 228 that ultimately changed the Official
Pharmaceutical Fee Schedule to 100% of the Medi-Cal fee [Alarcón, 2003]. The proposed
change (as of 09/06) is pending final approval by the Division of Workers’ Compensation,
but is to be enacted by 12/06. The revision proposes pricing any NDCs not in the Medi-Cal
database with a Medi-Cal equivalent rate of 17% less than the Average Wholesale Price
(AWP) plus a dispensing fee of $7.25 [CCR Proposed Version 9789.40, September, 2006].
3
Although pharmacies, hospitals, and others can dispense repackaged pharmaceuticals;
it is most often the physician who is dispensing repackaged pharmaceuticals in workers’
compensation. Although Medi-Cal doesn’t cover physician dispensed pharmaceuticals, in
the California Workers’ Compensation system, the dispensing of pharmaceuticals is
unrestricted by formulary or point of service (physician’s office, specialty clinic, hospital or
pharmacy) and other regulations specifically California Labor Code section 5307.1 and
California Code of Regulation Title 8 section 9789.11 state that physician dispensing is a
covered service [CCR 9789.11, 2005; California Labor Code 5307.1, 2005; Business and
Professions Code 4024, 2005]. Nationwide, about 7% of physicians dispense repackaged
pharmaceuticals from their office, which may act to reduce non-compliance in a population
where 20% of patients failed to get a prescription filled and 30% of patients don’t obtain
refills [Reece, 2005; Task Force for Compliance, 1994; American Association of Retired
Persons, 1992]. Currently however, there is little information on the value of repackaged
pharmaceuticals and if this value is worth the added price. In addition there is minimal
information on the effect of repackaged pharmaceuticals on workers’ compensation saving
and on access to physicians and physician dispensing [Wynn, 2005]. It is important to
understand what a repackager and repackaged pharmaceuticals are as well as their pricing,
payment and distribution of repackaged pharmaceuticals in order to inform legislation to
fairly price repackaged pharmaceuticals without affecting patient access.
Background: Definitions
A “repackaged pharmaceutical” can be defined as a pharmaceutical product that is
removed from the original manufacturer container with an original NDC and put into a new
4

container with new quantities, therefore requiring a new NDC, with a new repackaging
company label and price for the medication.
A “pharmaceutical repackager” can be defined as a company that specializes in
selling their own NDC designated products, which are referred to as repackaged
pharmaceuticals. Although a company must retain a manufacturer license to repackage
pharmaceuticals many of these companies specialize in other areas of the pharmaceutical
distribution chain and would rarely be referred to as a manufacturer. Companies that
repackage pharmaceuticals can be referred to as pharmaceutical repackagers, but also as
wholesalers, and retailers. Figure I provides a look at the drug distribution system including
the flow of repackaged pharmaceuticals and the subsequent price changes that follow a drug
from the manufacturer to the retailer and ultimately to the patient.
Background: Drug Distribution
Of the $172 billion worth of prescription drugs sales that American pharmaceutical
manufacturers produced and shipped in the year 2001, 46% were shipped directly from the
manufacturer to retailers such as pharmacies, clinics, or prescribing doctors as well as to
institutional pharmacies, closed-door pharmacies, and foreign markets with a manufacturer
NDC and label [Lee, 2005].
The remaining 54% of production sales go through the primary and secondary
wholesale market and then to the retailer and include wholesalers, retailers and
pharmaceutical repackager only companies [Lee, 2005]. In the U.S., the primary wholesale
market is dominated by three major wholesalers that account for 90% of the market (“The
Big Three”). They are Cardinal Health, Inc. of Ohio, McKesson Corp. of California, and
AmerisourceBergen of Pennsylvania [Department of Health and Human Services, 2005].
5
Roughly 12 -15 smaller regional wholesale distributors (secondary wholesalers) represent the
remaining 10% of the wholesaler market and primarily repackage pharmaceuticals. The
largest repackaging only companies are Allscripts, Physician Total Care, and Southwood
Pharmaceuticals [Lee, 2005; Department of Health and Human Services, 2005].
The current workers’ compensation drug pricing system creates a potential incentive
to increase drug reimbursement through the use of repackaged pharmaceuticals. The extent
and reasons for use of repackaged pharmaceuticals in workers’ compensation are currently
unknown and are the motivating factor for the present study.
Objective
The purpose of this paper is to assess the cost and utilization of repackaged
pharmaceuticals in a selected sample of California Workers’ Compensation pharmacy claims
and to estimate lost savings due to repackaged pharmaceuticals and potential savings of
alternative pricing strategies for repackaged pharmaceuticals in workers’ compensation.
In addition, we will explain repackaged pharmaceutical distribution and assess the
relationship between available predictor variables and repackaged pharmaceutical utilization
to determine what characteristics explain costs to identify reasons for repackaged
pharmaceutical use.
Methods
To determine how repackaged pharmaceuticals affect drug pricing we compared
Medi-Cal reimbursement rates for pricing workers’ compensation claims in California for the
year 2002, prior to the new drug legislation with those of the old fee schedule pricing.
6
Sample
We used a sample of workers’ compensation prescription claims collected from the
California Workers’ Compensation Institute (CWCI), a private, nonprofit organization of
workers’ compensation insurers who collect claims from their members into the Industry
Claims Information System (ICIS) Dataset.
For this study we selected only pain and pain related medications that were identified
from a previous study, which comprise an estimated 38.9% of the total CWCI member
prescription claims and 52.5% of the total CWCI workers’ compensation pharmacy payments
in 2002 [Wilson et al, 2005] (Table I). The CWCI dataset also includes the billed amount,
paid amount, drug NDC and name dispensed.
Identification of Repackaged Pharmaceuticals
Licensing designations that are required at the state and federal level for a company to
repackage pharmaceuticals and regulatory guidelines including the Code of Federal
Regulations (CFR) Parts 205, 207 and 211 were used to determine which companies can be
referred to as a pharmaceutical repackager.1
In addition to using licensing methods to identify pharmaceutical repackagers three
drug information references including the Drug Topics Red Book (only since 2003), First
1 Currently, the only valid method of identifying a repackaged pharmaceutical is from the NDC and accompanying application
material provided to the FDA. The first set of numbers’ represents the labeler code, a number that is provided by the FDA to the listing firm, and is specific to the firm manufacturing or repackaging the medication. The second (product/drug code) and third (quantity/package code) sets of numbers are designated by the listing firm [CDER National Drug Code Directory, 2005]. However, no specific coding in an NDC allows an interested party to determine whether the origin of the product is a manufacturer or company that is simply repackaging the pharmaceutical only. The FDA, the company itself, or a drug information reference such as Red Book could be contacted or referenced to obtain such information. Additional information detailed in the FDA application (Form 2656, Form 2657) for registering and submitting a NDC drug listing requires the listing firm to disclose information pertaining to the origin of the medication identifying whether the pharmaceutical is repackaged or is manufactured through a particular company [CDER Guidance for Industry Forms, 2005]. To repackage a pharmaceutical, a company at a minimum must be licensed as a manufacturer. To comply and conduct business as a manufacturer, certain guidelines, specifically the Code of Federal Regulations Title 21 Part 207 and 211 must be followed. Part 207 describes the registration process for submitting a drug that is to be manufactured. A manufacturer license in addition to allowing drug manufacturing also provides a company the ability to label and package the pharmaceutical into containers making a manufacturer a pharmaceutical packager. Part 211 outlines current good manufacturing practices (cGMPs) for finished pharmaceuticals, which manufacturers must follow in order to continue production and sale of a specific pharmaceutical [Code of Federal Regulations (CFR) Title 21 Part 207, 2005; CFR Title 21 Part 211, 2005].
7

DataBank and Medi-Span were accessed to identify repackaged pharmaceuticals [First
DataBank NDDF 2005; Medi-Span 2005; Red Book, 2005].
Assigned Cost per Claim
We used actual published Medi-Cal pharmacy payments, specifically the amount paid
out by the Medi-Cal system for 2002 collected from the Medi-Cal Drug Utilization Database
where an equivalent NDC existed. On January 1, 2004 the California Legislature approved a
new formula based on Medi-Cal reimbursement rates that calculates the California Workers’
Compensation pharmacy rates using the lower amount of the Estimated Acquisition Cost
(EAC) which is approximately the Average Wholesale Price (AWP)-17%, or the Federal
Allowable Costs (FAL) or the Maximum Allowable Ingredient Cost (MAIC), or the Usual
and Customary Price as well as a dispensing fee of $7.25 [Medi-Cal Pharmacy Manual,
2005]. For repackaged pharmacy claims, where there would be no equivalent NDC, a
straight fee schedule based on the Average Estimated Acquisition Cost (AWP-17%) plus a
dispensing fee of $7.25 will be utilized. In addition, we used alternative formulas including:
1) AWP-10% + $8.75 and 2) AWP-10% + $7.25 for additional cost comparisons between the
current and proposed new pricing systems to inform potential new legislation.
Cost Comparisons
A total of 1,315 workers’ compensation NDCs and their total costs provided the drug
sample for comparison between the former California workers’ compensation fee schedule
and the newly adopted Medi-Cal fee schedule. We used the amount paid, the total number of
prescriptions and the assumption that payments were based on the 2002 California Workers’
Compensation pharmaceutical fee schedule to create a formula to calculate the average
number of pills per prescription. The selected 2002 workers’ compensation pharmacy costs
8

for each NDC are repriced using Medi-Cal prices paid in 2002 per pill for the same NDC to
determine any potential changes in costs. The differences in total annual workers’
compensation cost between the old and new pharmacy fee schedules by drug name, by
therapeutic class, for all brand or, all generics, and for all the selected drugs together were
assessed in a previous article [Wilson, 2005]. The focus of this analysis is on repackaged
pharmaceuticals with some reference and comparison to manufacturer packaged
pharmaceutical utilization and costs.
Analysis: Univariate Analyses
We used both univariate and multivariate analyses. We determined descriptive
information on the mean costs, utilization, and characteristics of repackaged pharmaceuticals
for pain and pain related medications in the California Workers’ Compensation System.
The cost differences of repackaged pharmaceuticals priced with the pre-2004
pharmacy fee schedule are compared to the most recently adopted Medi-Cal fee schedule
using the Average Estimated Acquisition Cost reimbursement rate of AWP-17% + $7.25 and
two other possible pricing systems. The difference in costs savings between the two systems
are tested using independent t-tests across the most commonly designated therapeutic classes
for pain and pain-related medications due to wide variations and potential indications of the
selected pain and pain related medications.
An additional cost per pill analysis was performed to determine any cost differences
between manufacturer packaged pharmaceuticals and repackaged pharmaceuticals by
individual medication and for all brand, brand only or all generic medications due to varying
utilization rates and cost differences that occur as a result of patent and licensing restrictions.
The cost per pill analysis also assessed cost differences across the pre 2004, current and
9
newly proposed pharmacy fee schedules, realizing that cost/pill comparisons don’t reflect
cost per daily dose. Although cost/pill still doesn’t account for daily patient dose, it can give
a fair comparative assessment across these pricing options by accounting for some of the
differences in quantity prescribed.
Analysis: Multivariate Analyses
Using SAS statistical software, regression analyses were performed to determine any
relationship between predictor variables and the utilization and costs of repackaged
pharmaceuticals. Predictor variables affecting the average cost per pill (adjusts for the
quantity prescribed) of repackaged medications were assessed using two models including a
logarithmic (log) Ordinary Least Square Regression (Proc Reg) with dummy variables and
Generalized Linear Model (Proc GenMod) with categorical variables (SAS version 8.2) to
allow for a robust analysis.
Five categorical variables which included all selected pain and pain related
therapeutic drug classes (7 categories), sub categories including brand with generic
equivalent, generic, and brand only medications (3 categories), time on market including less
than 7 years, 7 to 15 years, and greater than 15 yrs (3 categories) and the presence of a
Federal Allowable Limit price (2 categories) were modeled as dummy variables or
categorical variables depending on the regression method. The total average cost per pill was
not normally distributed across NDCs so the OLS regression modeled the total log cost per
pill as the dependent variable and this log cost was normally distributed while the
Generalized Linear Modeled the actual cost per pill.
10

Results
Repackaged Pharmaceutical Costs in the California Workers’ Compensation System
Pain and pain related repackaged pharmaceuticals represented a total of 55.3% (727
NDCs) of all the selected pain and pain related California Workers’ Compensation NDCs
(1,315 NDCs), but only 21.8% ($8,494,297) of total pain and pain-related costs
($38,968,233) and 27.8% (128,148) of the prescriptions in our dataset (Table I). Generic
medications accounted for the majority of repackaged costs (88%). When generics are
available very few branded medication costs are from repackaged pharmaceuticals, and only
11% of the brand only medication costs are from repackaged pharmaceuticals. When
looking at individual repackaged medications, generic versions of hydrocodone, naproxen
and carisoprodol, with generic repackaged pharmaceutical costs ranging from $999,080 to
$2,677,870, contributed the highest costs of all pain and pain related repackaged
pharmaceuticals in our California Workers’ Compensation CWCI dataset (Table I).
The medications with the greatest proportion of their total WC medication costs
attributed to repackaged pharmaceuticals include gabapentin, a brand only medication
(100%) and generic propoxyphene (98.1%). But gabapentin accounted for only 0.3%
($23,414/$8,494,298) of total workers’ compensation repackaged pharmaceutical costs and
only 0.06% ($23,414/$38,968,233) of total workers’ compensation pain and pain related
pharmacy costs. Most repackaged pharmaceuticals only represented on average
approximately 18% of total pharmacy costs by medication. Generic naproxen and generic
carisoprodol accounted for the largest amount of repackaged pharmaceutical dollars (77.5%)
and (70.3%) respectively and combined represent 9.6% of total pain and pain related
pharmacy costs.
11
Skeletal muscle relaxants/anticonvulsants ($3,258,305) (38.4%) and non-steroidal
anti-inflammatory drugs ($3,434,563) (40.4%) had the largest costs associated with
repackage pharmaceuticals by therapeutic class and highest percentage of repackaged
pharmaceutical costs (Table II). Non-Steroidal anti-inflammatory drugs (NSAIDS) and
schedule III or greater narcotics have repackaged pharmaceutical costs totaling 25.8%
($3,434,563/$13,324,931) and 23.6% ($1,748,605/$7,395,349) of all pharmacy costs for each
therapeutic drug class (Table II). Although repackaged pharmaceutical costs for skeletal
muscle relaxants/anticonvulsants and NSAIDS are similar, skeletal muscle
relaxants/anticonvulsants are only 52.8% of their total costs while repackaged NSAIDS are
25.8% of their total costs.
Repackaged Pharmaceutical Sources
Companies that supply repackaged pharmaceuticals that had the highest number of
NDCs used include Southwood Pharmaceuticals (57.7%), Pharma Pac (23.9%) and Allscripts
(4.9%). Utilization based on the total number of prescriptions per company identified the
same three sources as highest,, which included Southwood (47.8% of all repackaged
pharmaceutical prescriptions), Pharma Pac (37.8% of all repackaged pharmaceutical
prescriptions), and Allscripts (7.1% of all repackaged pharmaceutical prescriptions) (Figure
II).
When looking at the sources of repackaged pharmaceuticals compared to all workers’
compensation pharmacy costs ($38,968,233), Southwood repackaged pharmaceuticals
represented the highest costs ($4,897,300) followed by Pharma Pac ($2,693,302) and much
lower is Allscripts ($415,051) (Figure I). Southwood repackaged pharmaceutical costs
contributed the largest percentage of all repackaged pharmaceutical costs (33.1% of all
12
repackaged pharmaceutical costs) followed by Pharma Pac (31.7% of all repackaged
pharmaceutical costs) and Allscripts (19% of all repackaged pharmaceutical costs).
Loss of Savings from Repackaged Pharmaceuticals
If all repackaged pharmaceutical NDCs were repriced with the average Estimated
Acquisition Cost (AWP-17% + $7.25) instead of the old WC formula (Brand: AWP+10% +
$4.00; Generic: AWP+40% + $7.00) currently used, then total repackaged pharmaceutical
costs could be significantly reduced by 36%, an additional $3,059,177 in savings (p<0.0001)
(Table II). Non-steroidal anti-inflammatory drugs showed the greatest potential for cost
savings for repackaged pharmaceuticals because of large (61.4%) cost reductions (p<0.0003)
with average EAC repricing of repackaged pharmaceuticals and the large percentage of
repackaged pharmaceuticals costs contributed by NSAIDS (40% of all repackaged
pharmaceutical costs). While anti-ulcer agents and anti-anxiety/sleep aids showed slightly
lower cost reductions (52% and 48%) respectively, the potential for large repackaged
pharmaceutical cost savings to the WC system is limited because of the low percentage of
repackaged pharmaceutical costs that are attributed to anti-ulcer agents (0.03% of all
repackaged pharmaceutical costs) and anti-anxiety agents/sleep aids (0.26% of all
repackaged pharmaceutical costs).
Multivariate Analysis: Predicting Cost
For repackaged pharmaceuticals, the OLS regression analysis predicted an adjusted
r-square of 0.092 verifying our predictor variables predicted up to 9.2% of the average total
log costs per NDC for repackaged pharmaceuticals. The residuals were normally distributed;
therefore it was not necessary to retransform log costs into actual values for interpretation. In
addition, by not transforming the log costs into actual values we prevent any retransformation
13
bias [Manning, 2001; Manning, 1998] (Table IIIa). Variables that were significantly
predictive of increasing total average repackaged costs per NDC included generic
medications (p=0.005) and time on market < 7yrs (p=0.006). To assure the robustness of the
log model regression, we modeled the same predictor variables using the Generalized Linear
Model (Proc GenMod in SAS) to predict the actual total average cost per pill with a gamma
distribution and a log link function to retransform the log values for interpretation. It was
found that predictor variables were the same across regression methods (deviance=89.1; log
likelihood = -1597.89). The same regression analyses, both log OLS (r-square of 0.1157) and
Generalized Linear Model (Deviance=104.9; Log Likelihood= - 1452.47) were performed
for manufacturer packaged pharmaceuticals total average cost per pill (Table IIIb). Again,
for the manufacturer packaged pharmaceuticals the predictor variables were the same across
regression methods.
Predictor variables across regression methods were similar, but not identical. Using
the log OLS regression, we found brand medications with generic equivalents to be
significantly predictive of lower manufacturer packaged pharmaceutical costs. No variables
were predictive of higher total manufacturer packaged pharmaceutical average costs as
compared to repackaged pharmaceuticals. Generic medications were predictive of higher
costs for repackaged pharmaceuticals and of lower costs for manufacturer packaged
pharmaceuticals confirming that the repackaged pharmaceutical workers’ compensation
market is largely composed of generic medications, but not necessarily cheaper generic
medications.
14

Average Cost per Pill: Manufacturer and Repackaged Pharmaceutical Comparisons
An analysis of cost/pill of only oral capsules and tablets of the selected pain and pain
related medications (1,210 of 1,315 total NDCs) was performed to assess any cost
differences between manufacturer packaged and repackaged pharmaceuticals and across
alternative proposed options for repackaged pharmaceuticals. Although cost/pill still doesn’t
account for daily patient dose, it can give a fair comparative assessment across these pricing
options (Table IV) by accounting for some of the differences in quantity prescribed. On
average, manufacturer packaged prescriptions contained 56 pills/prescription compared to
39.2 pills/prescription for repackaged pharmaceuticals. Overall the cost per pill analysis
revealed that prior to the implementation of Medi-Cal pharmacy payment rates, pre 2004
costs per pill for manufacturer and repackaged pharmaceuticals on average were similar
(Column (1): $2.09/pill compared with Column (4): $2.23/pill) (Refer to columns in Table
IV).
However, when manufacturer packaged medications are priced with 2002 Medi-Cal
published rates and repackaged pharmaceuticals are priced with the pre 2004 pharmacy fee
schedule, repackaged pharmaceuticals (Column (4): $2.23/pill) over all pain and pain related
medications are on average more expensive (85% higher) than manufacturer packaged
pharmaceuticals (Column (2): $1.20/pill) showing the lost savings from non-equivalent
NDCs for repackaged pharmaceuticals with the current legislation. Only two medications
were less expensive on a cost per pill basis, lansoprazole (Column (4): $1.66/pill repackaged
vs. Column (2): $4.14/pill manufacturer) and cyclobenzaprine (Column (4): $1.35/pill
repackaged vs. Column (2): $1.48/pill manufacturer).
15

We also determined that when we repriced manufacturer and repackaged
pharmaceuticals with the current average Medi-Cal rate, which is AWP-17% + $7.25 (EAC),
their cost per pill over all pain and pain related medications is identical (Column (3):
$1.26/pill and Column (5): $1.26/pill). Finally we compared two other proposed payment
rates for repackaged pharmaceuticals, which might be fairer, including AWP-10%+ $7.25
(5.5% greater than the EAC) and AWP-10% + $8.75 (13.4% greater than the EAC), varying
both AWP price and dispensing fees. We found that the overall reductions from the current
pricing are between 36% - 40% [$1.33: (Column 6) and $1.43 (Column 7) compared to
$2.23: (Column 4)] for both additional proposed rates.
The additional dispensing fee added to the AWP-10% price adds about $.10/pill,
while AWP-17% reduces the cost/pill by $0.07/pill more from AWP-10% with the same
dispensing fee a decrease of 57% from current repackaged pharmaceutical prices. Varying
the dispensing fee may allow the dispenser such as a physician to keep more of the payment
than if the AWP alone is changed; depending on negotiations made with pharmaceutical
repackagers and insurers.
Discussion
From our analysis it seems repackaged pharmaceuticals do not result in the loss of
significant cost savings to the California Workers’ Compensation System. With over 55% of
the NDCs used by the workers’ compensation originating from a repackager, only about 21%
of the total costs are attributed to repackaged pharmaceuticals. Potential savings when
substituting the average EAC as the price for repackaged pharmaceuticals reduced costs by
about $3 million. A previous study estimated potential cost savings of 29.5% (approximately
$11 million) when assessing 2002 Medi-Cal rates for pain and pain related medication NDCs
16
that were equivalent with the Medi-Cal system [Wilson et al, 2005]. When potential costs
savings from our analysis of non-equivalent repackaged pharmaceutical NDCs is added to
the cost savings from the new fee schedules assessed by Wilson et al., the California
Workers’ Compensation System could potentially save up to 36.9% ($14,368,736), an
additional 7.9% savings.
However, the problem remains in workers’ compensation that most, if not all
repackaged pharmaceuticals can not be priced using a published Medi-Cal rate, which
therefore limits the extent of savings that can be brought to the workers’ compensation
program and may create incentives for more use of repackaged pharmaceuticals to enhance
payment. Our study also found that the repackaged pharmaceutical workers’ compensation
market is largely composed of generic medications, but not necessarily cheaper generic
medications, a result similar to that found in study conducted by RAND [Wynn, 2005].
Furthermore, in a recent report by CWCI, it was found that as much as 51.5% of 2004
California Workers’ Compensation pharmacy payments were for repackaged
pharmaceuticals although the percentage of prescriptions (30.5%) remained equivalent to the
results (27.8%) found in this study which may reflect increased payments since our 2002 data
[Swedlow, 2005].
Changes in the reimbursement of repackaged pharmaceuticals in the workers’
compensation system however has an implication for repackagers, for physician dispensing
and for patients who may be inconvenienced if lower prices cause physicians to stop the
practice of office dispensing. As workers’ compensation legislators consider regulations for
pricing repackaged pharmaceuticals the impact on these players must be considered.
Physician dispensing may add to the availability of medications, instead of patients traveling
17

between pharmacies to obtain multi-ingredient prescriptions, especially important for those
requiring pain medications such as patients in workers’ compensation [Lober et al, 1988].
Physician dispensing of repackaged medications may reduce medication errors from poor
handwriting and sound alike medications, and repackaged pharmaceuticals may also provide
reduced costs to the workers’ compensation system, insurance companies and employer
premiums by taking advantage of price discounts available on drug products, reducing
overhead costs from low volume transactions, as well as supplying medications with a quick
turnaround or providing sales to a remote area, where high volume pharmaceuticals may be
unnecessary [Department of Health and Human Services, 2005].
However, others suggest that repackaging pharmaceuticals may act primarily to
increase drug prices needlessly and that physician dispensing acts primarily to increase
physician profits. From a societal perspective, repackaging pharmaceuticals raises concerns
in regards to ethics, conflicts of interest, and patient welfare [Abood, 1989]. In addition the
current workers’ compensation pharmacy pricing system may be acting as an incentive to
increase repackaged pharmaceutical use by other retailers to avoid cost cutting efforts. Our
study offers alternative pricing systems to close the ‘loophole’ in the current legislation while
trying to maintain access to physician dispensing.
Limitations
Our study has several limitations that should be noted. First, we used CWCI data,
which is a sample of drug use in workers’ compensation, not all drug use. Secondly, we
selected only pain and pain related drugs, which is not all the drugs in the CWCI database,
for our study. This group of drugs, represents a majority of workers’ compensation drugs
18

and are representative of the types of drugs that are used by injured workers, however other
drugs may have different patterns of drug costs and savings.
Another limitation is that we used 2002 drug data and some of the drugs that were
only available as brands then, now have generics available so savings could differ in future
years. For example, eleven of the twenty-three pain related drugs were only sold as brand
name products in 2002 with five new medications approved for generic use since that time.
In late 2001 omeprazole was released, tramadol and tizanidine were released during the
middle of the year in 2002 followed by, paroxetine and gabapentin in 2003, and more
recently rofecoxib has been removed from the market due to potential adverse effects [CDER
Label and Approval History, 2005].
Not all NDCs that did not have a Medi-Cal equivalent cost are repackaged
pharmaceuticals. We found 93 NDCs that were not repackaged pharmaceuticals in our data
and these are manufacturer packaged NDCs sold directly by the manufacturer. Their impact
on overall costs was minimal (approximately $500,000) however. These NDCs are not
restricted from Medi-Cal coverage and may have only lacked utilization for the selected
study quarter or may be limited from utilization due to the use of medical licensing
agreements, formularies and prior authorization procedures which allows the utilization of
different NDCs than those used by the workers’ compensation system. It may be that there
will be always some random variation in NDCs which don’t match the two systems yet are
not repackaged due these factors.
Conclusion
With the costs of pharmaceuticals increasing each year in the California Workers’
Compensation System and repackaged pharmaceuticals continuing to return high
19

reimbursement rates through legislative ‘loopholes’, an opportunity to implement cost
containment strategies such as changes in draft regulations for SB 228 (revised legislation to
California Code of Regulations 9789.40) are recommended to reduce excess resource
utilization. However, due to additional costs associated with repackaged pharmaceuticals
and the potential compliance and benefit with point of contact service with repackaged
pharmaceuticals a more generous dispensing fee to supplement the extra costs associated
with physician dispensing practices and their value may be in order. However, if the
workers’ compensation legislation suggests a fee schedule that is too low, it is possible that
physicians using repackaged pharmaceuticals for their workers’ compensation patients will
stop taking workers’ compensation patients or stop providing point of service medications to
them. In fact, such fears are outlined in the draft legislation to revise CCR 9789.40 (Draft
Version as of 09/06). This could lead to patient access problems to physicians and to patients
receiving their medications. In order to provide a fair, but not excessive price in workers’
compensation legislation it is necessary to understand how repackaging fits into the WC
system and the overall drug distribution system and we describe that through our drug
distribution flowchart.
Repackaged pharmaceuticals add to the overall pharmacy costs in the California
Workers’ Compensation System, but no research has been conducted comparing the cost
efficacy of treating patients with repackaged pharmaceuticals compared with pharmacy
dispensed medications or assessing the additional value associated with repackaged
pharmaceuticals. Future studies should examine if this added price is worth the increased
access that repackaged pharmaceuticals afford.
20
References
Abood RR. Physician dispensing: issues of law, legislation and social policy. Am J Law
Med. 1989;14(4):307-52.
Alarcón. 2003. SB 228 Workers' Compensation. Senate Bill No. 228. Chapter 639. Filed
October 1, 2003. Sacramento, California. p 1-56.
American Association of Retired Persons. A Survey on the Need for a Prescription Drug
Benefit Under the Medicare Program. Washington, DC: AARP; 1992.
Business and Professions Code Section 4024. Accessed December 4, 2005, at
http://www.leginfo.ca.gov
California Code of Regulations Section 9789.11. Accessed December 1, 2005, at
http://ccr.oal.ca.gov/.
California Code of Regulations Section 9789.40. Accessed December 1, 2005, at
http://ccr.oal.ca.gov.
California Code of Regulations Section 9789.40. Proposed Version. Division of Workers’
Compensation. Accessed September 29, 2006, at http://www.dir.ca.gov/dwc.
California Labor Section 5307.1. Accessed December 4, 2005, at http://www.leginfo.ca.gov.
Speier. 2005. SB 292 Workers’ Compensation Senate Bill No 292. Amended August 15,
2005. Sacramento, California
Center for Drug Evaluation and Research (CDER) Drugs@FDA, Label and Approval
History. 2004. Accessed December 5, 2005. http://www.accessdata.fda.gov.
21
Center for Drug Evaluation and Research (CDER). Guidance for Industry Forms for
Registration of Producers of Drugs and Listing of Drugs in Commercial Distribution. 2001.
Accessed December 10, 2005 at http://www.fda.gov/cder/guidance.
Center for Drug Evaluation and Research (CDER). National Drug Code Directory. Accessed
December 10, 2005 at http://www.fda.gov/cder/ndc.
Code of Federal Regulations Title 21 Part 211. Current Good Manufacturing Practice for
finished Pharmaceuticals. Accessed December 10, 2005 at http://www.gpoaccess.gov
Code of Federal Regulations Title 21 Part 207. Registration of Producers of Drugs and
Listing of Drugs in Commercial Distribution. Accessed December 10, 2005 at
http://www.gpoaccess.gov
Federal Trade Commission. FTC Issues Report on PBM Ownership of Mail-Order
Pharmacies. September 2005. Accessed January 5, 2006 at http://www.ftc.gov.
Lee JA. Counterfeit Drugs: A Growing Public Health Risk in Need of a Multi-Factored
Solution. Legal Electronic Document Archive (LEDA). May 2005.
Lober CW, Behlmer SD, Penneys NS, Shupack JL, Thiers BH. Physician Drug Dispensing. J
Am Acad Dermatol. 1988 Nov;19(5 Pt 1): 915-9.
Medi-Cal Pharmacy Manual 2006. Part 2 Section: Reimbursement. Updated January 1,
2006.
Reece RL. Will Dispensing Make a Comeback? Practice Options. 2002. Accessed December
1, 2005 at http://www.mdoptions.com.
Swedlow A. Early Changes in Prescription Drug Utilization, Reimbursement and
Accessibility Following Adoption of the California Workers’ Compensation Pharmacy Fee
22
23
Schedule. California Workers’ Compensation Institute. 2005. Accessed January 5, 2006 at
http://www.cwci.org
Task Force for Compliance. Noncompliance With Medications: An Economic Tragedy With
Important Implications for Health Care Reform. Task Force for Compliance; 1994.
Thomson Healthcare. Red Book. Medical Economics. 2005 (hard copy).
U.S. Department of Health and Human Services. FDA’s Counterfeit Drug Task Force
Interim Report. October 2003. Accessed December 10, 2005 at http://www.fda.gov.
Wechsler J. FDA, Congress Push for Safer Drugs. Pharmacy Technology Electronic
Edition. 2005; 1(4).
Wilson L, Gitlin M. New Workers' Compensation Legislation: Expected Pharmaceutical
Cost Savings. American Journal of Industrial Medicine. 2005;48(4):239 - 48.
Wynn, B. Paying for Repackaged Drugs Under the California Workers’ Compensation
Official Medical Fee Schedule. Prepared for the Commission on Health and Safety and
Workers’ Compensation and the Division of Workers’ Compensation, California Department
of Industrial Relations. RAND. 2005.
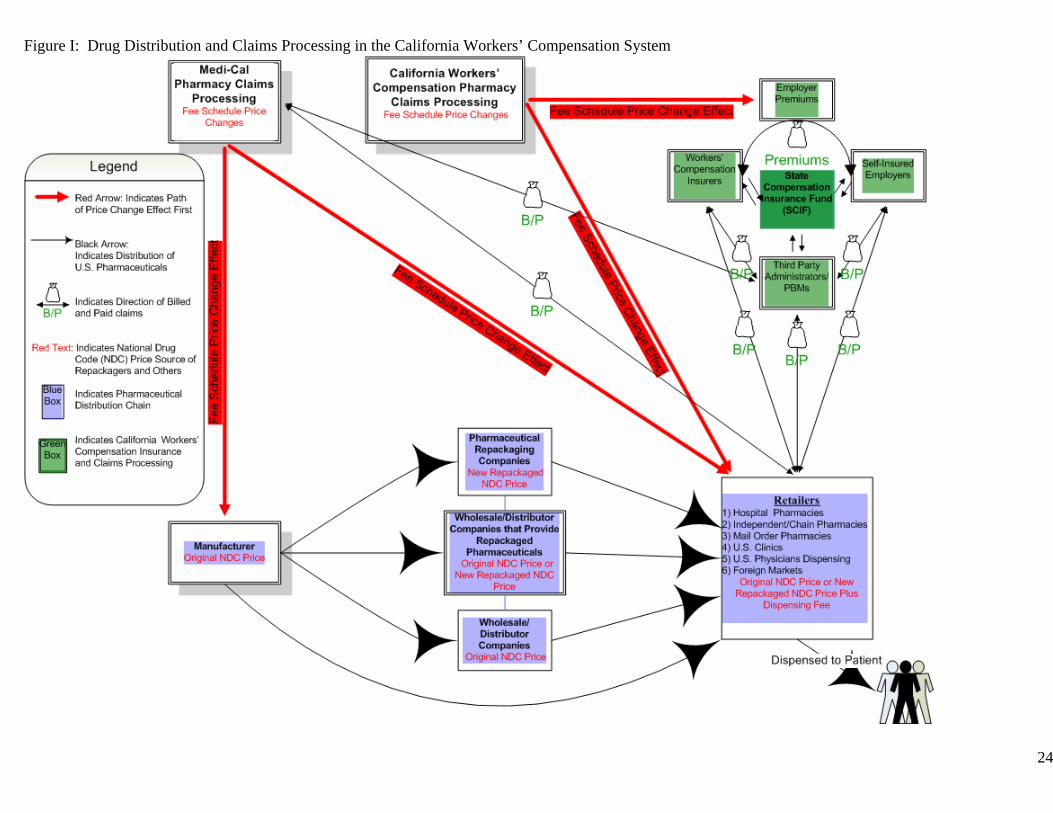
Figure I: Drug Distribution and Claims Processing in the California Workers’ Compensation System
24
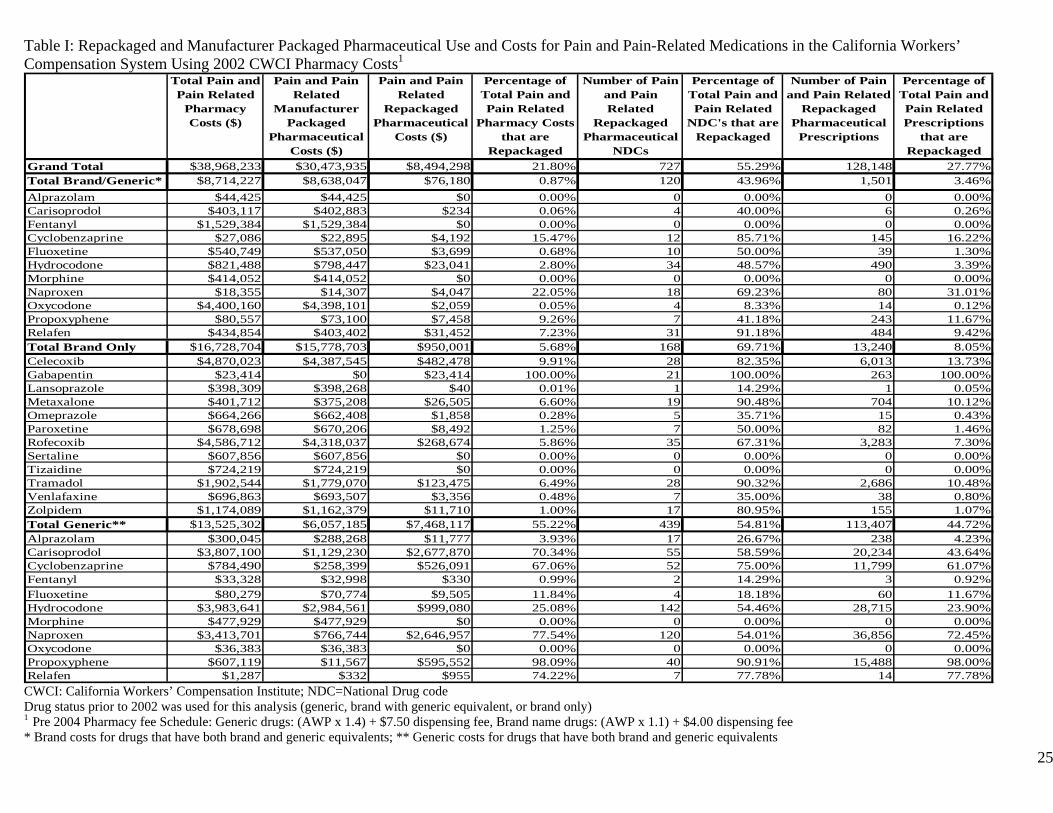
Table I: Repackaged and Manufacturer Packaged Pharmaceutical Use and Costs for Pain and Pain-Related Medications in the California Workers’ Compensation System Using 2002 CWCI Pharmacy Costs1
Total Pain and Pain Related
Pharmacy Costs ($)
Pain and Pain Related
Manufacturer Packaged
Pharmaceutical Costs ($)
Pain and Pain Related
Repackaged Pharmaceutical
Costs ($)
Percentage of Total Pain and Pain Related
Pharmacy Costs that are
Repackaged
Number of Pain and Pain Related
Repackaged Pharmaceutical
NDCs
Percentage of Total Pain and Pain Related
NDC's that are Repackaged
Number of Pain and Pain Related
Repackaged Pharmaceutical
Prescriptions
Percentage of Total Pain and Pain Related Prescriptions
that are Repackaged
Grand Total $38,968,233 $30,473,935 $8,494,298 21.80% 727 55.29% 128,148 27.77%Total Brand/Generic* $8,714,227 $8,638,047 $76,180 0.87% 120 43.96% 1,501 3.46%Alprazolam $44,425 $44,425 $0 0.00% 0 0.00% 0 0.00%Carisoprodol $403,117 $402,883 $234 0.06% 4 40.00% 6 0.26%Fentanyl $1,529,384 $1,529,384 $0 0.00% 0 0.00% 0 0.00%Cyclobenzaprine $27,086 $22,895 $4,192 15.47% 12 85.71% 145 16.22%Fluoxetine $540,749 $537,050 $3,699 0.68% 10 50.00% 39 1.30%Hydrocodone $821,488 $798,447 $23,041 2.80% 34 48.57% 490 3.39%Morphine $414,052 $414,052 $0 0.00% 0 0.00% 0 0.00%Naproxen $18,355 $14,307 $4,047 22.05% 18 69.23% 80 31.01%Oxycodone $4,400,160 $4,398,101 $2,059 0.05% 4 8.33% 14 0.12%Propoxyphene $80,557 $73,100 $7,458 9.26% 7 41.18% 243 11.67%Relafen $434,854 $403,402 $31,452 7.23% 31 91.18% 484 9.42%Total Brand Only $16,728,704 $15,778,703 $950,001 5.68% 168 69.71% 13,240 8.05%Celecoxib $4,870,023 $4,387,545 $482,478 9.91% 28 82.35% 6,013 13.73%Gabapentin $23,414 $0 $23,414 100.00% 21 100.00% 263 100.00%Lansoprazole $398,309 $398,268 $40 0.01% 1 14.29% 1 0.05%Metaxalone $401,712 $375,208 $26,505 6.60% 19 90.48% 704 10.12%Omeprazole $664,266 $662,408 $1,858 0.28% 5 35.71% 15 0.43%Paroxetine $678,698 $670,206 $8,492 1.25% 7 50.00% 82 1.46%Rofecoxib $4,586,712 $4,318,037 $268,674 5.86% 35 67.31% 3,283 7.30%Sertaline $607,856 $607,856 $0 0.00% 0 0.00% 0 0.00%Tizaidine $724,219 $724,219 $0 0.00% 0 0.00% 0 0.00%Tramadol $1,902,544 $1,779,070 $123,475 6.49% 28 90.32% 2,686 10.48%Venlafaxine $696,863 $693,507 $3,356 0.48% 7 35.00% 38 0.80%Zolpidem $1,174,089 $1,162,379 $11,710 1.00% 17 80.95% 155 1.07%Total Generic** $13,525,302 $6,057,185 $7,468,117 55.22% 439 54.81% 113,407 44.72%Alprazolam $300,045 $288,268 $11,777 3.93% 17 26.67% 238 4.23%Carisoprodol $3,807,100 $1,129,230 $2,677,870 70.34% 55 58.59% 20,234 43.64%Cyclobenzaprine $784,490 $258,399 $526,091 67.06% 52 75.00% 11,799 61.07%Fentanyl $33,328 $32,998 $330 0.99% 2 14.29% 3 0.92%Fluoxetine $80,279 $70,774 $9,505 11.84% 4 18.18% 60 11.67%Hydrocodone $3,983,641 $2,984,561 $999,080 25.08% 142 54.46% 28,715 23.90%Morphine $477,929 $477,929 $0 0.00% 0 0.00% 0 0.00%Naproxen $3,413,701 $766,744 $2,646,957 77.54% 120 54.01% 36,856 72.45%Oxycodone $36,383 $36,383 $0 0.00% 0 0.00% 0 0.00%Propoxyphene $607,119 $11,567 $595,552 98.09% 40 90.91% 15,488 98.00%Relafen $1,287 $332 $955 74.22% 7 77.78% 14 77.78%
CWCI: California Workers’ Compensation Institute; NDC=National Drug code Drug status prior to 2002 was used for this analysis (generic, brand with generic equivalent, or brand only) 1 Pre 2004 Pharmacy fee Schedule: Generic drugs: (AWP x 1.4) + $7.50 dispensing fee, Brand name drugs: (AWP x 1.1) + $4.00 dispensing fee * Brand costs for drugs that have both brand and generic equivalents; ** Generic costs for drugs that have both brand and generic equivalents 25
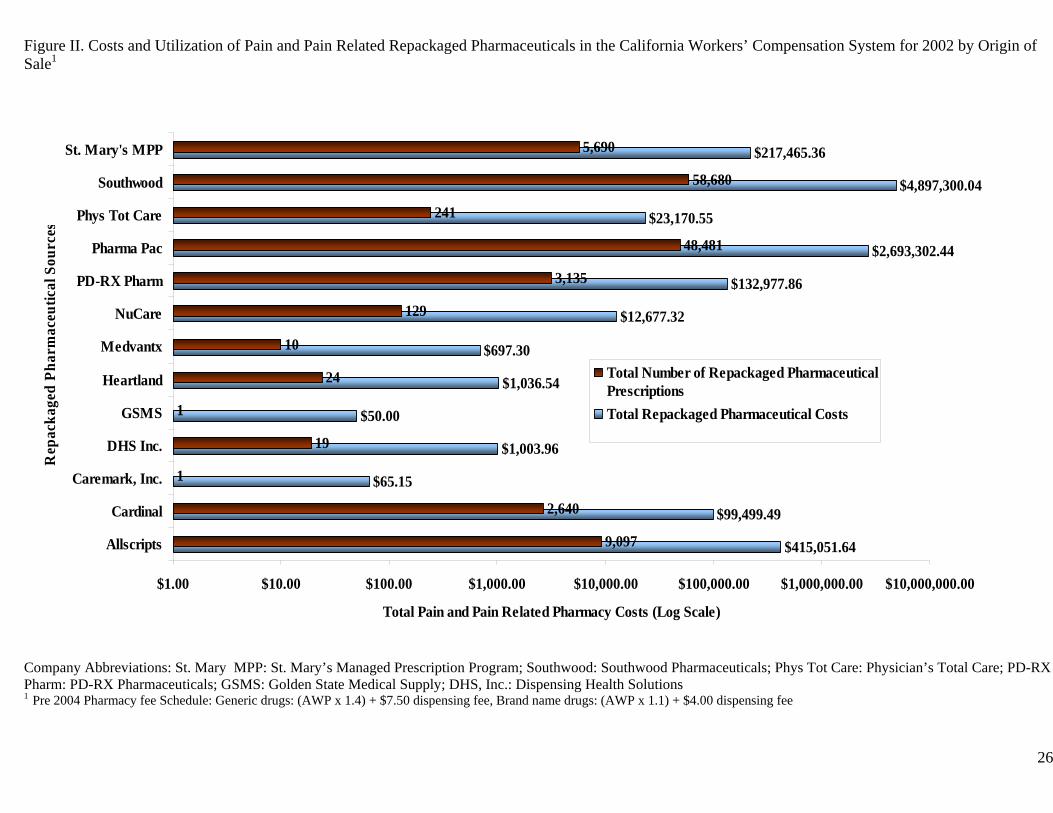
Figure II. Costs and Utilization of Pain and Pain Related Repackaged Pharmaceuticals in the California Workers’ Compensation System for 2002 by Origin of Sale1
$415,051.64
$99,499.49
$65.15
$1,003.96
$50.00
$1,036.54
$697.30
$12,677.32
$132,977.86
$2,693,302.44
$23,170.55
$4,897,300.04
$217,465.36
9,097
2,640
1
19
1
24
10
129
3,135
48,481
241
58,680
5,690
$1.00 $10.00 $100.00 $1,000.00 $10,000.00 $100,000.00 $1,000,000.00 $10,000,000.00
Allscripts
Cardinal
Caremark, Inc.
DHS Inc.
GSMS
Heartland
Medvantx
NuCare
PD-RX Pharm
Pharma Pac
Phys Tot Care
Southwood
St. Mary's MPP
Rep
acka
ged
Phar
mac
eutic
al S
ourc
es
Total Pain and Pain Related Pharmacy Costs (Log Scale)
Total Number of Repackaged PharmaceuticalPrescriptionsTotal Repackaged Pharmaceutical Costs
Company Abbreviations: St. Mary MPP: St. Mary’s Managed Prescription Program; Southwood: Southwood Pharmaceuticals; Phys Tot Care: Physician’s Total Care; PD-RX Pharm: PD-RX Pharmaceuticals; GSMS: Golden State Medical Supply; DHS, Inc.: Dispensing Health Solutions 1 Pre 2004 Pharmacy fee Schedule: Generic drugs: (AWP x 1.4) + $7.50 dispensing fee, Brand name drugs: (AWP x 1.1) + $4.00 dispensing fee 26
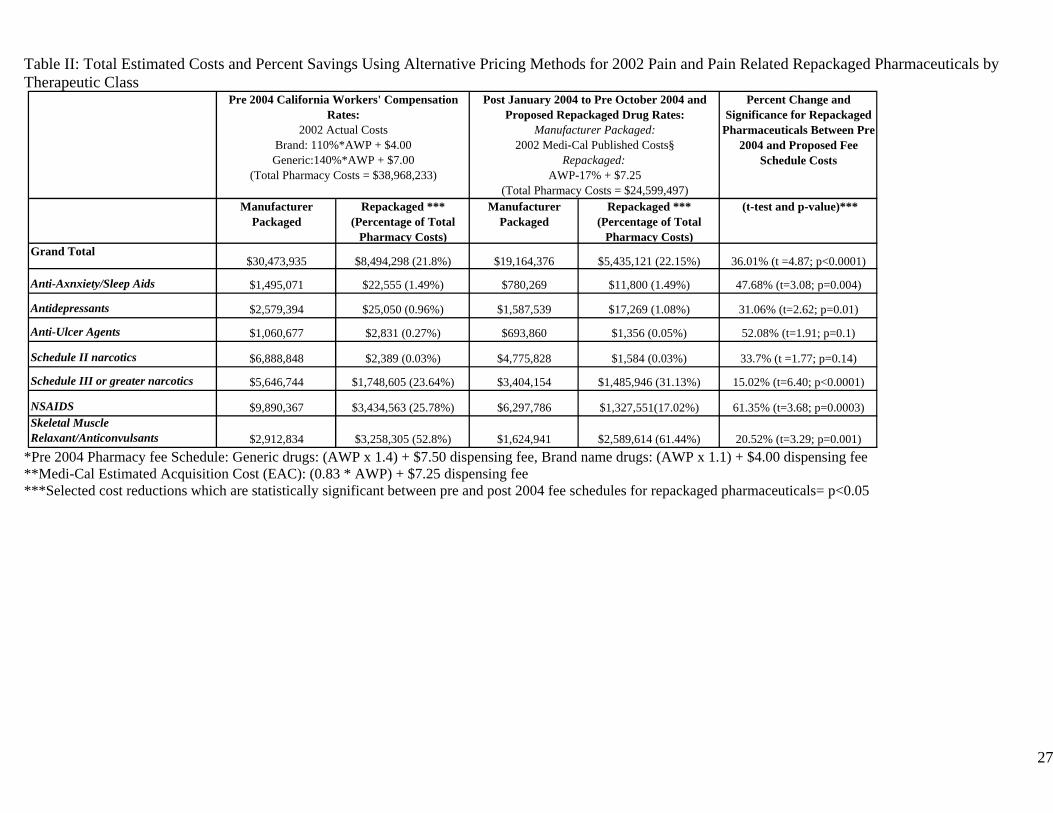
Table II: Total Estimated Costs and Percent Savings Using Alternative Pricing Methods for 2002 Pain and Pain Related Repackaged Pharmaceuticals by Therapeutic Class
Percent Change and Significance for Repackaged
Pharmaceuticals Between Pre 2004 and Proposed Fee
Schedule Costs
Manufacturer Packaged
Repackaged *** (Percentage of Total
Pharmacy Costs)
Manufacturer Packaged
Repackaged *** (Percentage of Total
Pharmacy Costs)
(t-test and p-value)***
Grand Total$30,473,935 $8,494,298 (21.8%) $19,164,376 $5,435,121 (22.15%) 36.01% (t =4.87; p<0.0001)
Anti-Axnxiety/Sleep Aids $1,495,071 $22,555 (1.49%) $780,269 $11,800 (1.49%) 47.68% (t=3.08; p=0.004)
Antidepressants $2,579,394 $25,050 (0.96%) $1,587,539 $17,269 (1.08%) 31.06% (t=2.62; p=0.01)
Anti-Ulcer Agents $1,060,677 $2,831 (0.27%) $693,860 $1,356 (0.05%) 52.08% (t=1.91; p=0.1)
Schedule II narcotics $6,888,848 $2,389 (0.03%) $4,775,828 $1,584 (0.03%) 33.7% (t =1.77; p=0.14)
Schedule III or greater narcotics $5,646,744 $1,748,605 (23.64%) $3,404,154 $1,485,946 (31.13%) 15.02% (t=6.40; p<0.0001)
NSAIDS $9,890,367 $3,434,563 (25.78%) $6,297,786 $1,327,551(17.02%) 61.35% (t=3.68; p=0.0003)Skeletal Muscle Relaxant/Anticonvulsants $2,912,834 $3,258,305 (52.8%) $1,624,941 $2,589,614 (61.44%) 20.52% (t=3.29; p=0.001)
Pre 2004 California Workers' Compensation Rates:
2002 Actual Costs Brand: 110%*AWP + $4.00 Generic:140%*AWP + $7.00
(Total Pharmacy Costs = $38,968,233)
Post January 2004 to Pre October 2004 and Proposed Repackaged Drug Rates:
Manufacturer Packaged: 2002 Medi-Cal Published Costs§
Repackaged: AWP-17% + $7.25
(Total Pharmacy Costs = $24,599,497)
*Pre 2004 Pharmacy fee Schedule: Generic drugs: (AWP x 1.4) + $7.50 dispensing fee, Brand name drugs: (AWP x 1.1) + $4.00 dispensing fee **Medi-Cal Estimated Acquisition Cost (EAC): (0.83 * AWP) + $7.25 dispensing fee ***Selected cost reductions which are statistically significant between pre and post 2004 fee schedules for repackaged pharmaceuticals= p<0.05
27
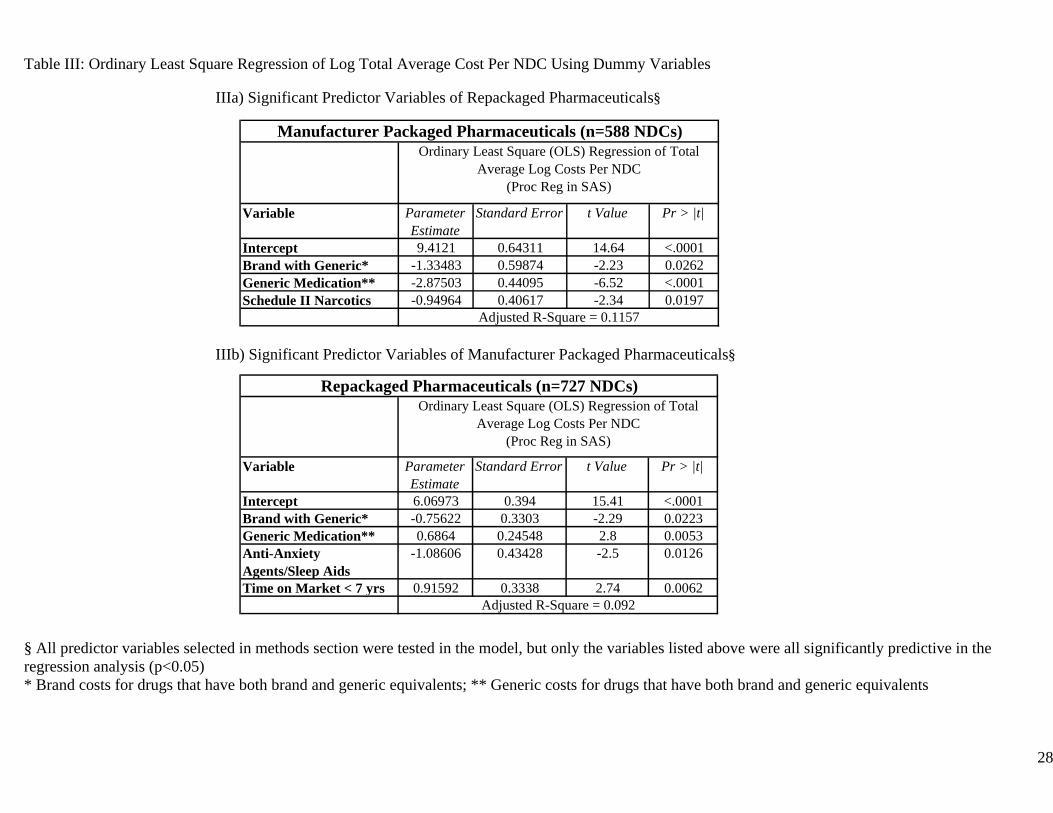
Table III: Ordinary Least Square Regression of Log Total Average Cost Per NDC Using Dummy Variables IIIa) Significant Predictor Variables of Repackaged Pharmaceuticals§
Variable Parameter Estimate
Standard Error t Value Pr > |t|
Intercept 9.4121 0.64311 14.64 <.0001Brand with Generic* -1.33483 0.59874 -2.23 0.0262Generic Medication** -2.87503 0.44095 -6.52 <.0001Schedule II Narcotics -0.94964 0.40617 -2.34 0.0197
Adjusted R-Square = 0.1157
Manufacturer Packaged Pharmaceuticals (n=588 NDCs)Ordinary Least Square (OLS) Regression of Total
Average Log Costs Per NDC (Proc Reg in SAS)
IIIb) Significant Predictor Variables of Manufacturer Packaged Pharmaceuticals§
Variable Parameter Estimate
Standard Error t Value Pr > |t|
Intercept 6.06973 0.394 15.41 <.0001Brand with Generic* -0.75622 0.3303 -2.29 0.0223Generic Medication** 0.6864 0.24548 2.8 0.0053Anti-Anxiety Agents/Sleep Aids
-1.08606 0.43428 -2.5 0.0126
Time on Market < 7 yrs 0.91592 0.3338 2.74 0.0062
Repackaged Pharmaceuticals (n=727 NDCs)
Adjusted R-Square = 0.092
Ordinary Least Square (OLS) Regression of Total Average Log Costs Per NDC
(Proc Reg in SAS)
§ All predictor variables selected in methods section were tested in the model, but only the variables listed above were all significantly predictive in the regression analysis (p<0.05) * Brand costs for drugs that have both brand and generic equivalents; ** Generic costs for drugs that have both brand and generic equivalents
28
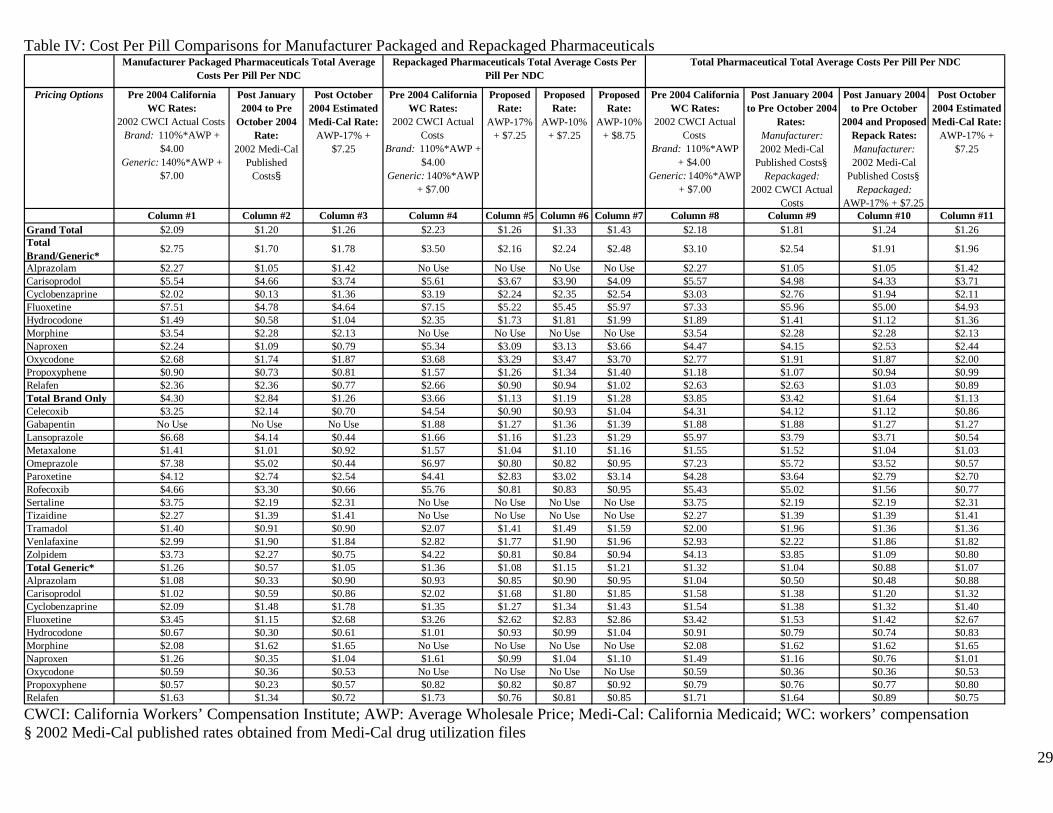
Table IV: Cost Per Pill Comparisons for Manufacturer Packaged and Repackaged Pharmaceuticals
Pricing Options Pre 2004 California WC Rates:
2002 CWCI Actual Costs Brand: 110%*AWP +
$4.00 Generic: 140%*AWP +
$7.00
Post January 2004 to Pre
October 2004 Rate:
2002 Medi-Cal Published
Costs§
Post October 2004 Estimated Medi-Cal Rate:
AWP-17% + $7.25
Pre 2004 California WC Rates:
2002 CWCI Actual Costs
Brand: 110%*AWP + $4.00
Generic: 140%*AWP + $7.00
Proposed Rate:
AWP-17% + $7.25
Proposed Rate:
AWP-10% + $7.25
Proposed Rate:
AWP-10% + $8.75
Pre 2004 California WC Rates:
2002 CWCI Actual Costs
Brand: 110%*AWP + $4.00
Generic: 140%*AWP + $7.00
Post January 2004 to Pre October 2004
Rates: Manufacturer: 2002 Medi-Cal
Published Costs§ Repackaged:
2002 CWCI Actual Costs
Post January 2004 to Pre October
2004 and Proposed Repack Rates: Manufacturer: 2002 Medi-Cal
Published Costs§ Repackaged:
AWP-17% + $7.25
Post October 2004 Estimated Medi-Cal Rate:
AWP-17% + $7.25
Column #1 Column #2 Column #3 Column #4 Column #5 Column #6 Column #7 Column #8 Column #9 Column #10 Column #11Grand Total $2.09 $1.20 $1.26 $2.23 $1.26 $1.33 $1.43 $2.18 $1.81 $1.24 $1.26Total Brand/Generic*
$2.75 $1.70 $1.78 $3.50 $2.16 $2.24 $2.48 $3.10 $2.54 $1.91 $1.96
Alprazolam $2.27 $1.05 $1.42 No Use No Use No Use No Use $2.27 $1.05 $1.05 $1.42Carisoprodol $5.54 $4.66 $3.74 $5.61 $3.67 $3.90 $4.09 $5.57 $4.98 $4.33 $3.71Cyclobenzaprine $2.02 $0.13 $1.36 $3.19 $2.24 $2.35 $2.54 $3.03 $2.76 $1.94 $2.11Fluoxetine $7.51 $4.78 $4.64 $7.15 $5.22 $5.45 $5.97 $7.33 $5.96 $5.00 $4.93Hydrocodone $1.49 $0.58 $1.04 $2.35 $1.73 $1.81 $1.99 $1.89 $1.41 $1.12 $1.36Morphine $3.54 $2.28 $2.13 No Use No Use No Use No Use $3.54 $2.28 $2.28 $2.13Naproxen $2.24 $1.09 $0.79 $5.34 $3.09 $3.13 $3.66 $4.47 $4.15 $2.53 $2.44Oxycodone $2.68 $1.74 $1.87 $3.68 $3.29 $3.47 $3.70 $2.77 $1.91 $1.87 $2.00Propoxyphene $0.90 $0.73 $0.81 $1.57 $1.26 $1.34 $1.40 $1.18 $1.07 $0.94 $0.99Relafen $2.36 $2.36 $0.77 $2.66 $0.90 $0.94 $1.02 $2.63 $2.63 $1.03 $0.89Total Brand Only $4.30 $2.84 $1.26 $3.66 $1.13 $1.19 $1.28 $3.85 $3.42 $1.64 $1.13Celecoxib $3.25 $2.14 $0.70 $4.54 $0.90 $0.93 $1.04 $4.31 $4.12 $1.12 $0.86Gabapentin No Use No Use No Use $1.88 $1.27 $1.36 $1.39 $1.88 $1.88 $1.27 $1.27Lansoprazole $6.68 $4.14 $0.44 $1.66 $1.16 $1.23 $1.29 $5.97 $3.79 $3.71 $0.54Metaxalone $1.41 $1.01 $0.92 $1.57 $1.04 $1.10 $1.16 $1.55 $1.52 $1.04 $1.03Omeprazole $7.38 $5.02 $0.44 $6.97 $0.80 $0.82 $0.95 $7.23 $5.72 $3.52 $0.57Paroxetine $4.12 $2.74 $2.54 $4.41 $2.83 $3.02 $3.14 $4.28 $3.64 $2.79 $2.70Rofecoxib $4.66 $3.30 $0.66 $5.76 $0.81 $0.83 $0.95 $5.43 $5.02 $1.56 $0.77Sertaline $3.75 $2.19 $2.31 No Use No Use No Use No Use $3.75 $2.19 $2.19 $2.31Tizaidine $2.27 $1.39 $1.41 No Use No Use No Use No Use $2.27 $1.39 $1.39 $1.41Tramadol $1.40 $0.91 $0.90 $2.07 $1.41 $1.49 $1.59 $2.00 $1.96 $1.36 $1.36Venlafaxine $2.99 $1.90 $1.84 $2.82 $1.77 $1.90 $1.96 $2.93 $2.22 $1.86 $1.82Zolpidem $3.73 $2.27 $0.75 $4.22 $0.81 $0.84 $0.94 $4.13 $3.85 $1.09 $0.80Total Generic* $1.26 $0.57 $1.05 $1.36 $1.08 $1.15 $1.21 $1.32 $1.04 $0.88 $1.07Alprazolam $1.08 $0.33 $0.90 $0.93 $0.85 $0.90 $0.95 $1.04 $0.50 $0.48 $0.88Carisoprodol $1.02 $0.59 $0.86 $2.02 $1.68 $1.80 $1.85 $1.58 $1.38 $1.20 $1.32Cyclobenzaprine $2.09 $1.48 $1.78 $1.35 $1.27 $1.34 $1.43 $1.54 $1.38 $1.32 $1.40Fluoxetine $3.45 $1.15 $2.68 $3.26 $2.62 $2.83 $2.86 $3.42 $1.53 $1.42 $2.67Hydrocodone $0.67 $0.30 $0.61 $1.01 $0.93 $0.99 $1.04 $0.91 $0.79 $0.74 $0.83Morphine $2.08 $1.62 $1.65 No Use No Use No Use No Use $2.08 $1.62 $1.62 $1.65Naproxen $1.26 $0.35 $1.04 $1.61 $0.99 $1.04 $1.10 $1.49 $1.16 $0.76 $1.01Oxycodone $0.59 $0.36 $0.53 No Use No Use No Use No Use $0.59 $0.36 $0.36 $0.53Propoxyphene $0.57 $0.23 $0.57 $0.82 $0.82 $0.87 $0.92 $0.79 $0.76 $0.77 $0.80Relafen $1.63 $1.34 $0.72 $1.73 $0.76 $0.81 $0.85 $1.71 $1.64 $0.89 $0.75
Manufacturer Packaged Pharmaceuticals Total Average Costs Per Pill Per NDC
Repackaged Pharmaceuticals Total Average Costs Per Pill Per NDC
Total Pharmaceutical Total Average Costs Per Pill Per NDC
CWCI: California Workers’ Compensation Institute; AWP: Average Wholesale Price; Medi-Cal: California Medicaid; WC: workers’ compensation § 2002 Medi-Cal published rates obtained from Medi-Cal drug utilization files 29