REORIENTING LIVESTOCK PRODUCTION TO RESPOND TO …
132
REORIENTING LIVESTOCK PRODUCTION TO RESPOND TO THE MEAT QUALITY REQUIREMENTS OF HIGH-END DOMESTIC AND EXPORT MARKETS October 2018 Final Report Addis Ababa, Ethiopia
Transcript of REORIENTING LIVESTOCK PRODUCTION TO RESPOND TO …

REORIENTING LIVESTOCK PRODUCTION TO RESPOND TO THE MEAT QUALITY
REQUIREMENTS OF HIGH-END DOMESTIC AND EXPORT MARKETS
October 2018
Final Report Addis Ababa, Ethiopia

Cover Photo: The upper photo (Boran Cattle grazing in its production environment) is by Dr Berhanu Admassu), and the lower (Cattle Feedlot - Verde-Beef) is by Dr Alemu Yami
PRODUCING FOR THE MARKET IS THE WAY FORWARD

REORIENTING LIVESTOCK PRODUCTION TO RESPOND TO THE MEAT QUALITY REQUIREMENTS OF HIGH-END DOMESTIC AND EXPORT MARKETS
October 2018
Report Authors: Alemu Yami, Fekadu Gelaw, Hinner Koster, and Bewket Siraw
Suggested citation:Yami, A., Gelaw, F., Koster, H., and Siraw, B. (2018). Reorienting Livestock Production to Respond to the Meat Quality Requirements of High-End Domestic and Export Markets. Feinstein International Center, Tufts University - Africa Regional Office, Addis Ababa, Ethiopia.
Implemented by:Feinstein International CenterFriedman School of Nutrition Science and PolicyTufts University Africa Regional OfficePO Box 1078Addis AbabaEthiopiaTel: +251 (0)11 618014www.fic.tufts.edu www.agri-learning-ethiopia.org
This study was funded by USAID under AKLDP, contract number AID-663-C-14-00002. AKLDP is implemented by the Feinstein International Center, Friedman School of Nutrition Science and Policy, Tufts University. The study team acknowledges the support of AKLDP in designing the study, providing resources, and assisting with field work.
The opinions expressed in this report do not necessarily reflect the views of United States Agency for International Development or the United States Government.

4
TABLE OF CONTENTS
Acknowledgments ...................................................................................................................................... 7
Acronyms and abbreviations ................................................................................................................. 8
Executive Summary................................................................................................................................... 9
1. Background .............................................................................................................................................. 18
2. Assignment objectives ......................................................................................................................... 19
3. Scope of work ........................................................................................................................................ 20
4. Methodological framework ........................................................................................................... 21 4.1. Identification of meat quality attributes desired by the market ........................................................ 22 4.2. Translation of the desired meat quality attributes into specifications for an ideal
conditioned animal .......................................................................................................................... 23 4.3. Assessment of high-end meat and live animal markets .................................................................... 23 4.4. Characterization of selected production environments supplying major domestic and
export markets ................................................................................................................................. 23 4.5. Identification of intervention options to meet the quality requirements of the selected
HED and export markets ................................................................................................................ 24 4.6. Financial/economic analyses ............................................................................................................ 24
5. Major findings ........................................................................................................................................ 26 5.1. Assessment of local demand ............................................................................................................ 26 5.2. Meat quality attributes desired by the high-end domestic and export markets ................................. 26 5.2.1. Identification of the quality attributes .............................................................................. 26 5.2.2. Quality requirements of the market ................................................................................. 30 5.3. Translation of the identified market requirements into specifications for a conditioned animal
that meets the desired attributes ...................................................................................................... 32 5.3.1. Determinants of preferred quality attributes .................................................................... 32 5.3.2. Specifications for conditioned animals that satisfy the desired quality requirements ........ 33 5.3.3. Suitable breeds that can fulfill the identified quality requirements ................................... 35 5.4. Assessment of major meat and live animal HED and export markets .............................................. 35 5.4.1. Imports of livestock and livestock products ...................................................................... 35 5.4.2. Exports of livestock and livestock products ...................................................................... 38 5.5. Characterization of the production environments currently and/or potentially supplying
the major domestic and export meat and live animal markets.......................................................... 46 5.5.1. Characterization of the pastoral and agro-pastoral production system ............................. 46 5.5.2. The mixed crop-livestock production system (MCL-PS) .................................................. 48 5.5.3. Characterization of the commercial feedlot finishing practices ........................................ 57 5.6. Gaps in meeting the quality requirements/specifications ................................................................. 62 5.7. Reorienting production to meet requirements ................................................................................. 64
5Reorienting Livestock Production to Respond to the Meat Quality Requirements of High-End Domestic and Export Markets
5.8. Proposed intervention models for meeting quality requirements of the HED and export markets ................................................................................................................................. 64
5.8.1. Pastoral and agro-pastoral production system .................................................................. 64 5.8.2. Mixed crop-livestock production system (MCL-PS) ........................................................ 69 5.8.3. Breeding-related interventions across the models ............................................................. 74 5.9. Financial analysis of the proposed interventions .............................................................................. 76 5.9.1. Estimations of incremental costs and benefits .................................................................. 76 5.9.2. Results of the cost-benefit analysis by intervention model ................................................ 77 5.9.3. Key findings of the cost-benefit analyses .......................................................................... 83 5.9.4. Sensitivity analysis ........................................................................................................... 85 5.10. Major production and market constraints ....................................................................................... 89 5.11. Conclusions ..................................................................................................................................... 90 5.12. Recommendations on the necessary measures that need to be taken for successful
implementation of the intervention models ..................................................................................... 91
6. Protocol for pilot testing the proposed intervention models ............................................ 96
7. References ................................................................................................................................................ 97
APPENDIX I. Tables ........................................................................................................................................ 99APPENDIX II. Protocol for pilot testing the intervention models ...................................................................... 116APPENDIX III. Institutions visited and people contacted during study ............................................................. 119APPENDIX IV. Terms of Reference (ToR) for the assignment ........................................................................... 121
List of Figures
Figure 1. Schematic presentation of the flow of activities ..................................................................................... 21Figure 2. Trends in imports of different types of livestock meat (2006–2017) ..................................................... 36Figure 3. Trends in imports of different forms of beef (2006–2017) .................................................................... 36Figure 4. Trends in share of different forms of beef in the total beef imports (2006–2017) ................................. 37Figure 5. Trends in imports of beef by the origin of imports (2006–2017) .......................................................... 37Figure 6. Trends in imports of beef by importers ................................................................................................ 38Figure 7. Trends in the share of livestock exports of animal and animal products ............................................... 39Figure 8. Trends in the share of value of exports of animal and animal products (2007-mid-2016). .................... 39Figure 9. Trends in the value of exports of animals and animal products ............................................................ 40Figure 10. Trends in the value of export earnings from different meats ............................................................... 40Figure 11. Trends in the volume of export of different meat types ....................................................................... 41Figure 12. Trends in the export prices of the different meat types ....................................................................... 41Figure 13. Share of the different animal meats in the total value of meat exports ................................................ 42Figure 14. Total value of exports meat from 2007 to 2016 by major destination countries .................................. 42Figure 15. Total value of exports of goat meat and lamb from 2007 to 2016 by destination countries ................. 43Figure 16. Total value of beef and other meat exports by destination countries, 2007–2016 ............................... 43Figure 17. Trends in the value of live animal exports, 2007–2016 ....................................................................... 44Figure 18. Trends in the price per kg of exports of live animals (2007–2016) ...................................................... 44Figure 19. Total value of live animal exports by destination countries, 2007–2016 ............................................. 45Figure 20. Total value of live goat and sheep exports by destination countries, 2007–2016 ................................. 45Figure 21. Contract-based animal conditioning .................................................................................................. 93

6
List of Tables
Table 1. Regression results of a choice experiment ............................................................................................... 27Table 2. Requirements of some importing Middle East and Asian countries for small ruminants ....................... 31Table 3. Requirements of some beef-importing countries .................................................................................... 31Table 4. Specifications for HED market .............................................................................................................. 33Table 5. Specifications for UAE ........................................................................................................................... 34Table 6. Specifications for KSA ........................................................................................................................... 34Table 7. Specifications for North African countries/Egypt .................................................................................. 35Table 8. Distribution of importers of beef (2006–2017) ...................................................................................... 38Table 9. Characterization of sheep fattening systems in Ethiopia......................................................................... 51Table 10. Feeding schedule for different classes of adult cows .............................................................................. 72Table 11. Feeding schedule for calves up to 9 months, weaned at 16 weeks ......................................................... 73Table 12. Detailed breakdown of costs and benefits of Model 1.1: MCL: HED market ...................................... 79Table 13. Summary results of the financial analysis of the livestock conditioning models ................................... 81Table 14. Sensitivity of key performance indicators to changes in marketing margins ......................................... 86Table 15. Sensitivity of key performance indicators to changes in marketing margins ......................................... 87Table 16. Break-even changes in output prices and input costs ............................................................................ 88
Appendix Table 1. Assessment summary of HED market ................................................................................... 99Appendix Table 2. Ranking of cattle breeds for the HED and export markets .................................................... 103Appendix Table 3. Ranking of sheep breeds for the HED market ....................................................................... 103Appendix Table 4. Ranking of sheep breeds for the export market (lowland and mid-altitude breeds) ................ 103Appendix Table 5. Ranking of goat breeds for the export market (lowland and mid-altitude breeds) .................. 104Appendix Table 6. Supplements for cattle ........................................................................................................... 104Appendix Table 7. Supplements for sheep ............................................................................................................ 105Appendix Table 8. Feedlot rations ....................................................................................................................... 106Appendix Table 9. Sample of choice card ............................................................................................................ 107Appendix Table 10. Cost-benefit analyses of intervention models ........................................................................ 107

7Reorienting Livestock Production to Respond to the Meat Quality Requirements of High-End Domestic and Export Markets
This study was financially supported by the United States Agency for International Development (USAID), Ethiopia. The support provided is duly acknowledged.
The support of the management and staff of the Agricultural Knowledge, Learning, Documentation and Policy (AKLDP) project was invaluable for the successful execution of the consultancy assignment. The very close follow-up, facilitation, and technical contributions of Dr. Bewket, Senior Livestock Research and Development Advisor to AKLDP, deserve special mention and gratitude. Dr. Bewket provided guidance at times when the team direly needed it and assisted in liaison with different stakeholders he had a connection to from his long years of service in the sector. The technical contributions and the administrative oversight provided by Dr. Berhanu Admassu, AKLDP Chief of Party, is also gratefully acknowledged.
The support provided by Ato Fasil Yemane, Ms. Tsion Fisseha, and other support staff, who made all the necessary arrangements for a visa for the international consultant and other administrative matters, was remarkable. The team would also like to thank Ms. Elisabeth Keegan, Administrator at Feinstein International Center, Friedman School of Nutrition Science and Policy at Tufts University, who provided all the support required at that level.
Ato Dhugassa Dirbaba provided invaluable support in the collection of field data and also shared his rich experience in the meat and livestock marketing sector. His contribution has helped a lot, especially during the initial stages of the study.
The unreserved assistance of different stakeholders and key informants at different levels and institutions was really invaluable in obtaining the necessary data and information that were used to come up with the outputs of the consultancy. Their contributions are also gratefully acknowledged.
This study was funded by USAID under AKLDP, contract number 663-13-000006. AKLDP is implemented by the Feinstein International Center, Friedman School of Nutrition Science and Policy, Tufts University. The study team acknowledges the support of AKLDP in designing the study, providing resources, and assisting with field work.
The opinions expressed in the report do not necessarily reflect the views of USAID or the United States government.
ACKNOWLEDGEMENTS
ACKNOWLEDGEMENTS

8
ACRONYMS AND ABBREVIATIONS
ACRONYMS AND ABBREVIATIONS
ACDI/VOCA Agricultural Cooperative Development International/Volunteers in Overseas Cooperative Assistancead lib Ad libitum/free-choiceADG Average daily gain AI Artificial insemination AKLDP Agricultural Knowledge, Learning, Documentation and Policy ProjectBHS Blackhead Somali sheepCBPP Contagious bovine pleuropneumonia cm CentimeterDA Development agentECRA Ethiopian Customs and Revenue AuthorityEMDIDI Ethiopian Meat and Dairy Industry Development InstituteESGPIP Ethiopia, Sheep and Goat Productivity Improvement ProgramETB Ethiopian birrha HectareHED High-end domestic (market) ILRI International Livestock Research InstituteKg KilogramKSA Kingdom of Saudi ArabiaM&LA Meat and live animalsMASL Meters above sea level MB Marginal benefits MC Marginal costsMm MillimeterMCL Mixed crop-livestockMCL-PS Mixed crop-livestock production system MoLF Ministry of Livestock and FisheriesNIB Net incremental benefitNPN Non-protein nitrogen NR Net return SA South AfricaSPS Sanitary and phytosanitaryTMR Total mixed ration UAE United Arab EmiratesUSAID United States Agency for International DevelopmentUSD United States dollarsWTP Willingness to pay

9Reorienting Livestock Production to Respond to the Meat Quality Requirements of High-End Domestic and Export Markets
EXECUTIVE SUMMARY
EXECUTIVE SUMMARY
The Agriculture Knowledge, Learning, Documentation and Policy Project (AKLDP) was requested by the then-Ministry of Livestock and Fisheries (MoLF) to undertake this study. The study was conducted during the period March 30 to July 30, 2018.
Following this request, desk reviews, tests, field visits, and consultations to assess the quality requirements of the export and high-end domestic (HED) red meat (beef, mutton, goat meat) and live animals (cattle, sheep, and goats) markets and the current supply situation were conducted. The prevailing livestock conditioning/fattening practices to meet these requirements were also assessed after identifying the current and potential sources of supply. Intervention models targeting the different production systems and livestock species were then developed based on the assessments. Financial and economic evaluation of the intervention models was conducted to assess the feasibilities of the proposed models. Recommendations to reorient the conditioning/fattening practices in the major livestock supply areas to meet the identified requirements were then made based on the findings of the series of activities conducted. This report presents the results of this exercise. Some of the findings of the study include the following.
• In addition to the many contributions of livestock sectors to Ethiopia’s economy and to the livelihood of millions of farmers, the sector has also been contributing 10% to 14% of the total export earnings of the country over the past ten years. The sector generated from United States dollar (USD) 80 million to USD 400 million per annum between the years 2007 and 2016. On average about 43.4%, 34.5%, and 20.6% of these export earnings came from the exports of live animals, leather and leather products, and meat and meat products respectively over the past ten years.
• While about 90% of the total meat export comes from the export of goat meat, more than 60% of the total live animal export earnings comes from the export of cattle. One of the features of the export of both meat and live animals is that the destination countries are limited to a few Middle East and neighboring African countries, namely United Arab Emirates (UAE) and Kingdom of Saudi Arabia (KSA) in the case of meat exports and Somalia, Egypt, Sudan, Djibouti, UAE, and KSA in the case of live animals.
• The rapid market appraisal shows that the current live animal and meat markets fail to sufficiently
incentivize quality. High per-unit transaction, transportation, and other marketing costs, the unstandardized and non-traceable nature of the products, little value addition, personalization of the transaction, high information asymmetry, poor market networks of exporters, narrow foreign markets, poor marketing facilities, and collusive behavior of middlemen were found to be the main constraints. Not only are the current markets inefficient and poorly functioning, improving these markets requires costly institutional and technological interventions owing to the overall production and socioeconomic environments of the livestock sector. The whole environment puts the society in the vicious circle of poor productivity, unstandardized and poor-quality product, and high transaction and transportation costs that results in poor and inefficient markets that fail to incentivize investment to improve product quality and productivity. As a result, the meat and live animals supplied by the current markets are much below the quality standards desired by the high-end markets.
• The twofold challenge for the meat-improvement intervention is thus how to improve the production efficiency of producers and at the same time get a well-functioning and efficient local market that sufficiently incentivizes quality improvements.
• Improving livestock production and conditioning in the country primarily requires assessment of the quality preference of high-end meat buyers.
• Based on the market survey and expert opinions, the study hypothesized five quality attributes, namely: tenderness, marbling, juiciness, fattiness, and color of the meat. In order to validate the significance of these attributes, multinomial regression analysis was made on the data collected through choice experiments. The results found all the attributes significant at 1% level in determining the choice decisions of the target high-end markets (high-standard hotels and catering companies).
• However, the high premium willingness to pay (WTP) of high-standard hotels and catering companies for high-quality meat indicates the extent of high demand, but it does not show the volume of demand. Preliminary analysis of the current and the future meat market shows that

10
EXECUTIVE SUMMARY
there is a large demand for high-quality meat. The current demand is estimated to be more than 1,000 tons of high-quality meat per year. Given the rapidly rising number of hotels and supermarkets, the future demand for meat in general, and for high-quality meat in particular, is going to dramatically rise.
The identified highly-valued meat-quality attributes were then translated into specifications for an ideal conditioned animal that can satisfy the requirement of these customers for tender, juicy, lean, light-colored, and large-sized cuts. Such an animal would be a young animal that has a high daily weight gain and at least a medium-sized body frame.
The detailed specifications within this general framework vary based on the target market. Detailed specifications for the specific markets were formulated for the HED and export destinations (UAE, KSA, and North Africa/Egypt) by species (cattle, sheep, goats) and specification parameter (age, slaughter weight, sex, condition/conformation grade, fat grade, body frame, castration, and origin).
Local breeds were then compared and ranked based on a combination of size/conformation, weight gain/growth performance, and origin and population using weighted averages of the criteria. The following breeds were the high-ranking ones:
• Sheep: Horro, Bonga, Washera, and Arsi-Bale;
• Goats: Long-eared Somali, short-eared Somali, Woyito-Guji, and Afar (only goats in the low- and mid-altitude areas were compared);
• Cattle: Borana, Fogera, Horro.
Many of the high-class hotels, catering facilities, supermarkets, and embassies are importing meat products to meet their quality requirements. There are indications that they would be willing to import more if they could get more foreign currency.
HED consumers prefer low-fat Borana and Hararghe beef. Consumers purchase both fresh/chilled and frozen types of meat. There is also a market for mutton, primarily associated with holidays such as New Year, Christmas, Easter, Ramadan, and Arefa. The domestic market for mutton prefers highland sheep between 2 to 4 years of age.
Quality requirement and associated issues of the export market include:
• UAE and the KSA are the major traditional destination markets to which 95% of the chilled carcass (mainly goat meat) is exported. The customers of meat from Ethiopia in these markets
is the low-to-middle-income community that has less-stringent quality demands;
• Borana goats are most preferred for export. Lately, there has been a gradual shift to sources such as Guji, Bale/Ginhir, South Omo/Jinka, Konso, and parts of Afar and Somali due to a shortage of Borana goats. Shortage of adequate numbers of uniform size and age of animals for the export slaughter facilities is a serious limitation;
• Cost of Ethiopian meat relative to meat from alternative suppliers is on the high side, challenging competitiveness, and is largely due to the inefficient production system and high transaction costs;
• Requirements of the HED market and the main meat-importing countries as identified during the assessments were translated into the type of animal that satisfies these requirements. The requirements for such animals include:
o HED market
3 Cattle: Less than 24 months of age; up to 350 kilogram (kg) slaughter weight; both male and female; condition/conformation Grade 2; fat Grade 2; medium to large body frame; intact or castrated; animals of any agro-ecology are acceptable.
3 Sheep: Less than 12 months of age; 25–28 kg slaughter weight; both male and female; condition/conformation Grade 2; fat Grade 2; medium to large body frame; intact or castrated; animals of any agro-ecology are acceptable;
3 Goat: Less than 18 months of age; up to 50 kg slaughter weight; both male and female; condition/conformation Grade 2; fat Grade 2; medium to large body frame; intact or castrated; animals of any agro-ecology are acceptable.
o UAE
3 Cattle: Less than 24 months of age; up to 320 kg slaughter weight; intact male; condition/conformation Grade 1 or 2; fat Grade 1–2; medium to large body frame; animals of lowland/mid-altitude;
3 Sheep: Less than 12 months of age; 15–20 kg slaughter weight; intact male; condition/conformation Grade 1 or 2; fat Grade 1–2; medium to large body frame; animals of lowland/mid-altitude.
3 Goat: Less than 12 months of age; 16–18

11Reorienting Livestock Production to Respond to the Meat Quality Requirements of High-End Domestic and Export Markets
kg slaughter weight; intact male; condition/conformation Grade 1 or 2; fat Grade 1–2; medium to large body frame; animals of lowland/mid-altitude.
o KSA
3 Cattle: Less than 24 months of age; up to 320 kg slaughter weight; intact male; condition/conformation Grade 1 or 2; fat Grade 1–2; medium to large body frame; animals of lowland/mid-altitude;
3 Sheep: Less than 15 months of age; 30–35 kg slaughter weight; intact male; condition/conformation Grade 1 or 2; fat Grade 1–2; medium to large body frame; animals of lowland/mid-altitude;
3 Goat: Less than 15 months of age; 30–35 kg slaughter weight; intact male; condition/conformation Grade 1 or 2; fat Grade 1–2; medium to large body frame; animals of lowland/mid-altitude.
o North African countries/Egypt
3 Cattle: Less than 48 months of age; up to 320 kg slaughter weight; intact male; all condition/conformation grades; all fat grades; small to large body frame; less-stringent requirements on the origin of animals.
The production environments of the animals identified during the prioritization exercise based on their importance as supply sources (traditional and potential) were assessed through a review of secondary information and also on-site visits. Unique traditional conditioning practices and examples of modern exemplary practices were also assessed. The field assessments covered selected sites that included the following areas:
• East Wollega, Horro Guduru Zones of West Oromia—Horro sheep and Horro cattle;
• Awi Zone—Washera sheep;
• Bahir Dar Zuria and West Gojam Zones—Fogera cattle and Washera sheep;
• Kafa Zone, Bonga area—Bonga sheep;
• Borana Zone—Borana cattle, Somali goats (long-eared/short-eared), Blackhead Somali sheep, representing the pastoral production system;
• East Shoa Zone—commercial fattening for export.
The assessment included the physical environment, production objectives, breed types available, feed resource availability, management practices, health situation, and herd/flock outflows/offtake. The following is a summary of the general features of the production environment.
• Delivery of services (credit, health, feed supply, targeted extension, etc.) for intensification/market orientation of production is inadequate.
• Production is almost entirely traditional (small-scale subsistence) and not targeting market requirements. Livestock are generally reared as multipurpose animals and not specifically bred for meat production or fast growth rates.
• Knowledge and skill in improved husbandry practices among producers are low. Improved technologies to produce products that target market requirements are not used, which in many instances is due to a lack of awareness rather than a lack of resources.
• Most animals supplied to end markets are too old and below the weight requirement for the age category. This problem is most serious in the case of beef supplied from the mixed crop-livestock (MCL) production system, where animals are marketed after being used for plowing for a number of years.
• Transactions are generally done on a per animal basis. Weighing animals at different periods during the conditioning/fattening process to monitor progress is nonexistent. Weighing of feed ingredients for ration mixing and during feed offer, etc. is not practiced. This is an important impediment to basing decisions on realistic data and running a profitable business.
• There is poor linkage/cooperation among actors in the value chain to reorient production and value addition. The situation of feedlot operators around Adama is a case in point where there may be many foregone opportunities for coordinating and sharing of resources for the benefit of everybody.
• The performance of available breeds in terms of growth rates to attain the desired weights at a young age, reproductive rate, etc. are low. This is further exacerbated from time to time due to:
o The problem of “negative selection” whereby fast growers (especially sheep and goats) are currently sold early. Inferior males are consequently retained for breeding, resulting in a decline in performance (in the size of animals supplied to the market) through time;
EXECUTIVE SUMMARY

12
EXECUTIVE SUMMARY
o Current restocking practices after drought spells in the lowland areas like Borana involve the introduction of animals of poorer quality from the highlands, which has resulted in the dilution of the genetics/genetic erosion of, for example, Borana cattle, resulting in gradual loss of vigor;
o Prevalent inbreeding depression as a result of the random mating of related animals.
• The feed-related scenario in terms of availability and quality is characterized by the following features:
o Inadequate year-round supply of good-quality feed in adequate quantities and consequent fluctuating weight gains and unduly high feed prices;
o Feeding systems are based on the available feed resources in the area and are not based on meeting the specific requirements of the animals. Inadequate production and use of formulated designated rations that target performance and physiological status is a gap in the production of meat that meets quality requirements of the high-end markets;
o Deteriorating grazing conditions and shrinkage of available grazing due to the encroachment of traditional dry season grazing areas (e.g., investment activities, crop agriculture). Encroachment of rangelands by unpalatable species is prevalent;
o Water supply to make use of large areas of rangelands like the Borana area that are sources of export stock is a critical problem.
• The supply of animals is not uniform in the number supplied size/conformation, and age:
o The livestock supply base is narrow, limited largely to lowland animals. The current destination markets have developed special taste and preference (flavor, meat color, etc.) for lowland animals, limiting the effective use of highland animals for export. Highland animals are not desirable due to the perceived darkening of meat. The poor tolerance to the heat stress along the export route is also a limitation in the export of live animals from highland areas;
o Animals come from a small-scale subsistence production system where there is small
numbers of animals of diverse breeds and backgrounds, resulting in animals with variable size, conformation, and age;
o Substantial young stock mortality reduces the number of marketable animals substantially;
o Poor market linkages result in supplies targeting certain seasons and/or holidays when higher prices are expected;
o Frequent droughts decimate large numbers of animals.
• There are good experiences that can be scaled up/scaled out to help reorient the current practices. Examples include:
o The case of settlers in Wolega from Hararghe, who have helped to transform the cattle-fattening system in the area towards intensive fattening of young bulls that are currently being exported;
o Good models of modern practices like the feedlot of the Verde Beef Processing Company that has shown that good-quality beef can be produced at much lower/competitive cost by purchasing young feeder cattle of about 9 months of age, formulating appropriate rations in the form of a total mixed ration (TMR) to optimize feed efficiency, etc.;
o The effort of the community-based sheep breeding programs started around Bonga and Horro areas. Such breeding strategies, in which superior males are selected and retained for breeding, can be extended to other areas to reduce the effects of negative selection.
• The absence of dedicated animal transport contributes to quality deterioration as a result of injury and stress.
The overall results of the assessment of the traditional conditioning practices show that there are good local breeds that can serve as the basis for the production of the desired quality of meat and live animals, provided appropriate interventions are made to tap this potential. Assessment of feedlots, for example, indicated that there is a lot of room for improvement if the right interventions based on the available resources are made. The experiences of Verde Beef Processing and the Prime farm are examples that can be scaled out as models for conducting efficient and profitable beef production that meets the desired quality requirements.

13Reorienting Livestock Production to Respond to the Meat Quality Requirements of High-End Domestic and Export Markets
EXECUTIVE SUMMARY
The study developed alternative production and conditioning models for the different production contexts of the country based on the results of the above quality preferences and assessment of the production environments. The following intervention models were proposed for the different livestock production scenarios/systems to help reorient the overall production setting after making a thorough assessment of the quality requirements of the HED and export markets, identification of the sources of the animals, assessment of the production environments that are current sources and potential suppliers, delineation of the existing gaps, and consequently identification and packaging of activities that can best address the gaps using available resources with due consideration to production efficiency and cost. Each of the models contains intervention packages at the initial production sources/settings and at the feedlot.
1. Pastoral models:
1.1. Intervention Model 1.1: Pastoral beef for export and HED market;
1.2. Intervention Model 1.2: Sheep/goats for export markets.
2. Mixed crop-livestock (MCL) models:
2.1. Intervention Model 2.1: MCL beef for the HED market;
2.2. Intervention Model 2.2: Dairy beef for HED and export markets;
2.3. Intervention Model 2.3: Sheep/goats for the HED market.
The following considerations were made in coining the intervention models:
• When designing alternative production and conditioning models that are necessary for improving the sector, it is not sufficient to incentivize producers and feedlots to adopt the designed technological packages. Further assessments of the financial feasibility of the models are essential.
• Analyzing the financial feasibility primarily requires determination of production inputs and their prices and determination of the output prices.
• Since the markets for high-quality meat produced under the new models are missing in the current market context, there are no price data for the new products. So prices must be estimated using other
approaches. The study used willingness to pay (WTP) to determine the prices of the high-quality products.
• Based on the quality attributes identified by the preference analysis, the study found that the high-end buyers are willing to pay Ethiopian birr (ETB) 95.1, 59.1, 118.9, 46.5, 70.0, and 97.0 for tenderness, marbling, juiciness, color, fattiness, and age of the animal respectively. That is, buyers are willing to pay more for meat with high tenderness, abundant marbling, good juiciness, a lighter red color, a lower proportion of fat, and for meat that comes from a younger animal.
• Given that the customers of these target markets are largely foreigners, the above results can also be interpreted as the preference of importers. It is therefore implied that improvement in tenderness, marbling, juiciness, color, fattiness, and age of the animal can increase the export price of 1 kg of meat by USD 2.7, 1.7, 3.4, 1.3, 2.0, and 2.8 respectively.
• Assessment of the HED market reveals that the quality of the local meat currently supplied lacks most of the above desirable attributes. As a result, the demand for imported quality meat has been increasing owing to the expansion of high-standard hotels. But the opportunistic imports of meat observed over the past 10 years were generally very small. Instead, they have been declining. This might be due to the restraining trade policies of the country, the high transaction costs associated with the country’s poor trade network, and the increasing shortage of foreign currency observed in the recent period.
• The financial cost-benefit analysis made on the three cattle and three sheep production and conditioning models shows very promising net incremental benefits (NIBs), both for the producers and feedlots. Given the current marketing and other contexts, the pastoralists, MCL producers, and dairy beef producers are estimated to generate ETB 13,838.4, 9,684.4, and 22,974.1 per beef animal per fifteen months production period respectively. This means an ETB 1 investment in these respective models generate returns of about ETB 1.63, 0.98, and 2.41 within 20 months of time. These returns are huge in that the producer can earn net returns of ETB 69,192.0, 48,421.9, and 114,870.5 per about one and quarter of a year by supplying five bulls to the feedlots. Similarly, the farmer generates considerable amounts of NIBs from the production of sheep that are to be conditioned

14
EXECUTIVE SUMMARY
under the new models. The producer can generate ETB 718.4, 1,768.9, and 800.0 per sheep per annum by producing sheep to be conditioned for HED, UAE, and South Africa (SA) markets respectively.
• The study analyzed the sensitivity of the models to changes in marketing margin, final meat prices, and input costs. The results show that the models are highly sensitive to changes in final meat prices compared to changes in input costs. The analysis also showed that reductions in marketing costs at different levels of the markets contribute to increasing the share of producers.
• The study showed that all the models will be at break-even point if the prices of meat at the high-end markets decline by less than 50%. The break-even points for changes in input costs considerably vary across the models. The pastoralist, MCL, and dairy-beef cattle models will continue to offer positive net incremental benefits until the input costs increase by more than 163.0%, 98.3%, and 241.0% respectively. The sheep models, on the other hand, reach break-even points at 90.9% to 206.3% increase in input costs.
• The models also generate even more NIBs for the feedlots. The feedlots can generate NIBs of ETB 14,386.4 and 19,792.7 per twenty months of age for local and dairy beef models respectively.
• Compared to the NIBs for producers, the models generate higher NIBs for the feedlots. This is mainly due to the fact that many middlemen capture higher gains than they actually contribute in the value additions. Since improving the currently inefficient and poorly functioning livestock markets requires vaster interventions than what can be afforded by beef improvement projects, the study underscores the need for creating a special livestock value chain that can sufficiently incentivize beef producers. The study recommends the design of special institutional arrangements that directly connect producers, feedlots, and high-end export and domestic markets.
The successful implementation of the proposed intervention models to bring about the desired reorientation of the production systems to supply meat and live animals that meet the HED and export market requirements necessitates the parallel actions outlined hereunder. These complementary steps will help not only to meet current requirements but also to expand the
market share in the currently accessed markets by attracting new customers in the current markets, entering into higher segments of the markets, and accessing new potential markets.
• Institutional, infrastructural, and policy interventions at macro level: Policy interventions are needed to create a more flexible exchange rate policy that can respond to the changes in the domestic and foreign livestock product markets.
• Market promotion:
o Holistic and integrated interventions should be made to improve the efficiency and competitiveness of the livestock markets. However, the development of efficient markets is largely the result of the overall socioeconomic, infrastructural, technological, and institutional environments.
o Aggressive promotion of exporters and livestock products is essential to brand the already-reputable products such as Borana goats and cattle. Development of geographic-based brands of selected meat products will have considerable benefit. The gains could be captured by traders, unless a special transaction arrangement is designed to directly connect producers and feedlots and abattoirs/butchers.
o Updating and/or development of standards and grades for livestock export products based on transparent and refined quality attributes must be done. Development of credible and efficient institutions that standardize and grade products and actors and structure their behavioral patterns are crucial.
• Monopoly power: Measures should be taken to reduce the monopoly power at key market levels, such as the Djibouti quarantine center, by finding alternative quarantine centers.
• Marketing failures associated with information asymmetry: Take the following steps to reduce these failures:
o Provide third-party assurance about the quality and other terms of trade to improve the performance of the export market;
o Provide third-party signaling/rating of actors and products by such bodies like the Ethiopian Meat and Dairy Industry

15Reorienting Livestock Production to Respond to the Meat Quality Requirements of High-End Domestic and Export Markets
EXECUTIVE SUMMARY
Development Institute (EMDIDI) based on selected performance criteria and make the information accessible to the public at large and importers. These measures will help to reduce information asymmetry and encourage reputable actors and discourage opportunistic ones.
• Attempts should be made not only to create a competitive environment at each level of the market but also to discourage explicit collusions to counteract the negative effects on producers.
• Improve the marketing capacity of exporters by increasing awareness about the market they are working in through training, experience sharing, and attracting foreign firms that have a better market network and marketing experience who can share their experience.
• Make systematic interventions to reduce the number of market actors who make little contribution to the value and shorten the chain to help increase the producers’ share of the final market price.
• Special institutional arrangement for conditioned animals: The study underlined that the effectiveness of the models depends on the efficiency of the livestock market in incentivizing meat/animal quality improvements. As emphasized in the study, the markets are constrained by numerous interrelated factors. Creating a market that can work for producers requires wide and integrated interventions to change the institutional, infrastructural, technological, and policy environments. Even though these changes are essential, the details are beyond the scope of this assignment. The feasible way out to the problem is to design a special transaction arrangement that cuts the marketing margins and incentivizes quality improvements. In order to do so, there should be a pre-arranged contractual arrangement between selected feedlot-integrated abattoirs and interested producers. Interested producers must sign on to supply young animals that satisfy the specifications of the abattoirs, and the abattoirs, in return, must sign on to buy the animals at fair prices. A similar arrangement should also be made between the abattoirs and selected high-standard hotels. If effective and as the production expands, it will be in the interest of all the three parties (the producer, the feedlot operator, and the hotels) to sustain the institutional arrangement.
• Capacity building: Build the capacity of actors and promote awareness among stakeholders on the value, methods, and approaches of market-oriented livestock production. Capacity building for producers, especially feedlot operators, extension staff, nutritionists, feed millers, etc. on such issues as feed formulation, software (low-cost programs) that can be used by extension agents, etc. is important to foster production of quality meat and live animals.
• Improvement in the supply of the desirable types of animals:
o Intensification of the production system: Foster larger production units that condition and market uniform animals that fulfill the quality requirements of the market (young animals, uniform size/condition, etc.) through creating support mechanisms like credit services, land for establishment of large production units, and nurturing intensive production through assessing the feasibility of commercial ranching schemes.
o Integration:
3 Integration of production as in the Verde Beef Processing Company experience, where feed production, feedlot operation, slaughter service, etc. are integrated.
3 Linking up the operations of different, smaller abattoirs for example with the Allana Group can lead to technology transfer and improved efficiency/effective utilization of otherwise-wasted byproducts.
3 It is also good to consider and pilot an out-grower scheme connected to the abattoirs.
o Specialization of the production of animals for meat: The traditional system of production of multipurpose livestock needs to change to introduce commercial breeding specifically for meat production. Commercial breeding requires that animals be fed from early life to gain their maximum growth potential in a short period. Gradually consider the introduction of the blood of specialized beef breeds through a similar mechanism to the estrus synchronization/artificial insemination (AI) scheme being implemented for dairy, initially under a controlled intensive system in selected locations. The same approach, focusing on natural mating, may be considered for sheep and goats, as AI in small

16
EXECUTIVE SUMMARY
ruminants is not as straightforward as in large ruminants.
o Promote the establishment of collection centers to bring abattoirs and producers closer.
o Introduce weight-based production and marketing: High-level intervention is warranted. Proper weighing of animals, feed, feed ingredients, etc. is important to incentivize production through better benefit to producers. Negotiations by high officials and/or associations with buyers to pay on per kg basis and payment of premium for quality are important to encourage production of quality products. “Mobile weighing” service provision can be considered as a business opportunity;
o Promote cooperation in marketing and production among producers to enable producers to get a larger share of the benefit that can go into the improvement of production. The Allana Group experience in India, where producers directly supply animals to the company, is a good experience to promote. Encourage cooperation among stakeholders to reduce capital inputs per unit of meat produced and other variable costs, e.g., milling equipment, weighing scales (weighbridge), weighing facilities (scale, small chute, etc.) can be purchased and used by feedlot operators like those in the Adama area, where these feedlots are concentrated close to one another.
o Make all attempts to discourage informal livestock trade across the borders so that a larger number of animals are channeled to the export abattoirs.
o Improve the possibility of supply from the mid- and high-altitude areas:
3 Highland animal utilization should focus on supplying the domestic market, including the high-end market.
3 Utilizing highland animals for export should focus on slaughter and export in the form of meat. Destinations that have less-stringent requirements regarding meat color should be identified and focused upon.
3 Reduce stress on the animals that exacerbate meat darkening by taking such steps as encouraging the import and use
of designated animal transportation trucks through, for example, policy support to duty-free imports.
3 Appropriate draining of blood from the carcass may have a contribution in reducing meat darkening.
o Make a concerted effort to reduce young stock mortality by pursuing the already-started effort to help increase supply of the desired types of animals.
• Feed-related interventions:
o The realization of estimated NIBs, as shown in the cost-benefit analyses and sensitivity analyses, crucially depends on the price of inputs and outputs. The input costs are likely to be higher than the estimated costs, especially in remote pastoral areas. The current local market does not supply the supplements that are required for the proposed models to bring the desired results. For this market to develop, there should be a sufficiently large number of producers who implement the production model at a time. Otherwise, individual producers will have to buy the supplements from remote areas like Adama/Addis Ababa. In this case, the unit cost of buying and transporting the feeds will be too high to be justified by the scale of production. The supply of feed needs to be coordinated by external bodies until the expansion of the new production models can attract feed suppliers to readily engage.
o Develop low-cost rations based on site-specific feed resources by incorporating feed ingredients external to the area to balance shortfalls in nutrient supply. Promoting businesses around feed manufacturing and supplements is important to ensure the supply of desired quality feed supplements.
o Explore the possibility of formulating and using a TMR feeding system, especially in feedlots.
o Promote the development of feed-processing plants that can bring a mixed ration supply system to areas where the proposed intervention models are to be implemented. This development can involve investors or can be done through the formation of cooperatives. The experience of cooperative feed processing schemes by Agricultural Cooperative Development International/

17Reorienting Livestock Production to Respond to the Meat Quality Requirements of High-End Domestic and Export Markets
EXECUTIVE SUMMARY
Volunteers in Overseas Cooperative Assistance (ACDI/VOCA) can be scaled up/scaled out.
o A clear chain of marketing of agro-industrial byproducts can be established through fostering direct linkage between byproduct producers and feed processing plants. This would promote favorable pricing of byproducts and reduce feed costs. Currently, the traders of agro-industrial byproducts have total control over the pricing of such feeds.
o Grazing land improvement should be undertaken for pasture-based fattening systems. There is a need for policy interventions to ensure that a certain portion of land is set aside for pasture in areas with high potential for sheep and/or cattle fattening in line with the clustering development approach being followed in connection with supplying the agro-industrial parks being developed in different parts of the country (e.g., in Awi Zone).
o Promote water development, together with the improvement of pasture land and irrigation schemes, in the pastoral areas.
o Development of green fodder: Development of forage species identified as suitable for different areas of the country (by Ethiopian Institute of Agricultural Research (EIAR) and Food and Agriculture Organization of the United Nations (FAO)) should be undertaken. This measure demands the development of a forage seed supply system. The successful public-private partnership scheme in the Efratana Gidim woreda can be scaled out.
• Scale up/scale out good practices/experiences: Scaling up/scaling out existing good practices that help meet market quality requirements such as the case of Hararghe farmer settlers, the Verde Beef Processing PLC modern feedlot model, the Bonga/Horro community-based sheep breeding, forage seed production through public-private partnership in Efratana Gidim woreda, the case of the Abyssinia abattoir running its own subsidiary feedlots, sheep production in a clustered manner as in Awi Zone, concentrate feed manufacturing by cooperatives in rural areas by ACDI/VOCA, etc. are examples that can be expanded through exchange visits to share these valuable experiences.

18
1. BACKGROUND
1. BACKGROUND
Livestock production systems in Ethiopia are largely subsistence oriented, and productivity is very low. The market supply of animals originates from highly dispersed, small farms that supply small numbers of nonhomogeneous animals. The animals supplied to the market fall short of meeting the quality attributes required by HED and export markets. Many of the high-class hotels, catering facilities, supermarkets, and embassies are importing meat products to meet their quality requirements. There is interest to import even more if not for the shortage of hard currency to pay for those imports. The export of Ethiopian meat is limited to a very few Middle East countries and to meat being sold at the lower segments of the market for low prices.
The country has not been effectively utilizing the export and HED markets that could bring manyfold export earnings. Hard-earned hard currency is being spent on the import of high-quality meat. Markets are increasingly quality conscious. Domestic demand for quality meat is increasing due to the increase in the middle-class population that is able and willing to pay for quality. The number of foreign residents and high-class hotels that go for quality is also increasing over time.
The red meat and live animal production systems need to be transformed if producers and the country are to utilize the big potential of the available livestock resources. Production needs to be market oriented, targeting domestic and export market requirements. Understanding the operation of the production and marketing systems and identifying constraints that affect quality at different levels in the value chain are of considerable relevance in meeting market requirements. What is needed is a thorough assessment of the requirements of the market and a reorienting of production activities to meet the standards/specifications required by the market.
The Ethiopian government is keen to increase export earnings by expanding market share in the traditional markets and entering into higher segments of these markets and into new markets not explored thus far. Substitution of the increasing import of quality meat with domestic meat is another area of government interest. In this connection, the Agriculture Knowledge, Learning, Documentation and Policy Project (AKLDP) was asked by the then-Ministry of Livestock and Fisheries (MoLF) to undertake a comprehensive assessment of the quality requirements of the export and domestic meat and live
animal markets, the current livestock conditioning/fattening practices in terms of meeting these requirements, and to then recommend the changes needed to address the quality gaps. The results of the assessment will be used to make informed decisions and take practical actions to enhance the reorientation of production to market requirements. AKLDP tasked a team of consultants to undertake this assignment in order to deliver on the request of MoLF. This document is an output of the work of the team of consultants on the assignment. The Terms of Reference (ToR) for the assignment are in Appendix IV.
Reorienting the conditioning/fattening practices in major livestock supply areas of Ethiopia to respond to the meat quality requirements of high-end domestic (HED) and export markets

19Reorienting Livestock Production to Respond to the Meat Quality Requirements of High-End Domestic and Export Markets
General objective
The general objective of the consultancy assignment was to assess the quality requirements of HED and export markets for Ethiopian beef, mutton, goat meat, and live animals (cattle, sheep, and goats), and the production environment to help reorient the conditioning/fattening practices in major livestock supply areas of Ethiopia.
Specific objectives:
• Identify the major meat and live animal domestic and export markets for cattle, sheep, and goats.
• Assess the quality attributes/requirements desired by the HED and export markets. Translate the identified requirements into specifications for a conditioned animal.
• Identify current and potential supply sources that satisfy the specifications and document the available feed resources and livestock conditioning practices in the identified production environments.
• Assess the gaps in meeting the quality requirements/specifications and propose alternative intervention models to meet the requirements, including financial feasibility (benefits) of the proposed models over the status quo.
• Identify constraints that impede the implementation of the intervention models and recommend necessary measures that need to be taken for successful implementation of the intervention models.
2. ASSIGNMENT OBJECTIVES
2. ASSIGNMENT OBJECTIVES

20
3. SCOPE OF WORK
The study covered the quality requirements of meat and live cattle, sheep, and goats destined for major HED and export markets.
3. SCOPE OF WORK
21Reorienting Livestock Production to Respond to the Meat Quality Requirements of High-End Domestic and Export Markets
4. METHODOLOGICAL FRAMEWORKFi
gure
1. S
chem
atic
pre
sent
atio
n of
the
flow
of a
ctiv
ities
.
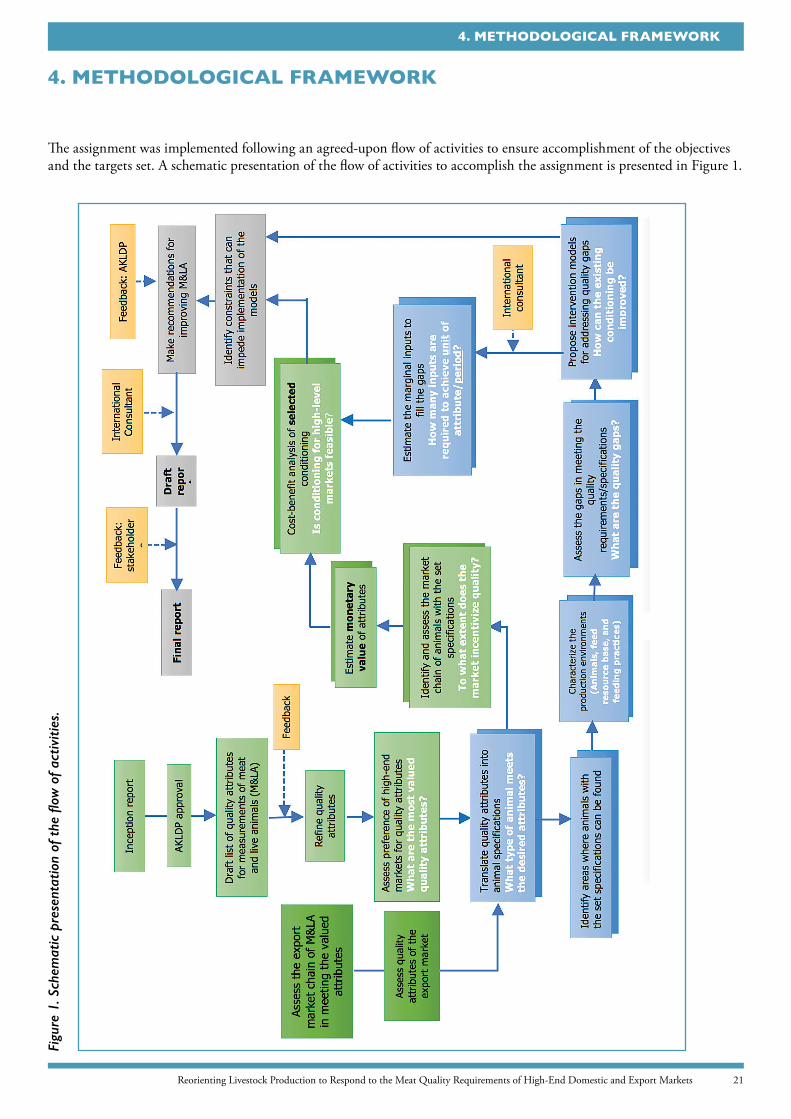
The assignment was implemented following an agreed-upon flow of activities to ensure accomplishment of the objectives and the targets set. A schematic presentation of the flow of activities to accomplish the assignment is presented in Figure 1.
4. METHODOLOGICAL FRAMEWORK

22
4. METHODOLOGICAL FRAMEWORK
4.1. Identification of meat quality attributes desired by the market
Identification of meat quality attributes desired by the market was undertaken in two stages based on the random utility model proposed by Lancaster (1966) who assumes that consumers derive satisfaction not from goods themselves but from the attributes that make up the goods. Identifying these attributes is thus crucial for understanding the preference of consumers. The first step was the identification of the HED and export markets, followed by identification of the quality attributes desired by the markets.
4.1.1. Identification of HED and export markets: Major meat and live cattle, sheep, and goats for the HED and export markets were identified through review of secondary data. A list of HED markets in Addis Ababa includes the catering facilities of the Ethiopian Airlines and MIDROC/Addis International Catering, high-class hotels (Sheraton, Hilton, Marriott, etc.), and big supermarkets (Bambis, Shewa, Safeway, etc.). Data from the Ethiopian Customs and Revenue Authority (ECRA) were used to identify who the major importers of meat are and the level of their imports.
4.1.2. Identification of relevant attributes: Secondary data were collected and a quick assessment of the preferences of the identified markets was done in order to identify the quality attributes highly valued by the identified markets. Important attributes were identified, with the incorporation of expert opinion.
Since only the price of the good as a whole and not for each attribute is observed, preference for the attributes can only be measured systematically; in this case, using a choice experiment. Preferences for each attribute were inferred by offering subjects alternative sets of choices containing a combination of attributes that differ in level. When subjects make choice decisions between alternatives, they are assumed to evaluate the tradeoff between the level of attributes constituting each alternative vis-à-vis the prices assigned to each alternative. These choices can then be interpreted, as they are implicitly assigning the prices they are willing to pay for each attribute.
Providing customers with pleasurable eating experiences consistently is the core value of high-class hotels and restaurants. In the specific case of meat products, literature suggest various attributes as determinants of meat quality that can be divided into the following groups of attributes related to nutritional values, hygiene, toxicological aspects (such as bacterial contamination, residue of toxic, and pharmaceutical compounds), meat processing, and sensory parameters (Hartung 2009).
Sanitary and phytosanitary (SPS)-related attributes were
ignored in this analysis, since SPS-related attributes set the minimum quality standards and no meat that fails to meet these standards can be sold in the high-end markets. Attributes related to processing were also dropped, as the primary focus of this study was the preference of buyers for red meat. The two groups of attributes related to nutritional values and sensory parameters were, therefore, the focus of this study.
Nutritional values of food products are the most important determinants of preference of consumers. But the indicators of nutritional value are hardly evident without laboratory analyses. Consumers, therefore, attempt to infer the nutritional values of food products using different sensory indicators. In addition to nutritional value, other attributes of the product also determine the preference of consumers.
It was hypothesized that the following attributes determine the preference of high-end meat consumers: price, tenderness, marbling, juiciness, fattiness, and color of the meat. Although these attributes are highly associated with the age of the animal, other management and environmental factors also determine the quality of meat independent of the age of the animal. Age of the animal was thus included as an independent determinant of meat quality. Many of these attributes are associated with perceived nutritional values, which evolve with the consumers’ knowledge about nutritional values of food. In addition to this, other taste-related attributes outside nutritional values of food also determine the preference of consumers. Since the levels of the above attributes differ across the different meat cuts, the longissimus dorsi (locally called ‘shint’) was used as a reference for the experiment. The seven attributes were measured as follows:
• Price: ETB 300, 350, 400, or 450 per kg;
• Tenderness: hard/tough or soft;
• Marbling: scarce or abundant;
• Juiciness: juicy or dry/less juicy;
• Fattiness: no fat, some fat, or fat abundant;
• Color: light red, red, or dark red;
• Age: young, adult, old, or very old.
The best choice decision can effectively be elicited by observation of a sample of meat product, and consumers’ evaluation of these quality parameters is commonly done through visual appraisal (Zheng and Tan 2008). But this procedure does not allow varying the attributes as desired. The alternative is to develop hypothetical choice alternatives containing a hypothetical combination of

23Reorienting Livestock Production to Respond to the Meat Quality Requirements of High-End Domestic and Export Markets
4. METHODOLOGICAL FRAMEWORK
attributes that can mimic the ideal markets. The purchase decisions of selected high-class international hotels and catering companies were thus studied by providing chefs and purchasers with hypothetical sets of choices that contained two alternative meat types that differ in the combination of the levels of the identified quality attributes (see Appendix Table 9).
Using these attributes and levels, a computer-generated D-optimal fractional factorial design of 16 sets of choices was drawn from the full factorial design of 1,152 (4*2*2*2*3*3*4) choice sets. Respondents were then asked to imagine two alternative meat cuts—“Meat A” and “Meat B”— longissimus dorsi muscle. Each alternative differed in the levels of attributes used to characterize the alternatives. We then asked chefs and purchasing managers of high-class hotels and catering facilities to select one of the two alternatives they would prefer to buy if they were making a real purchasing decision. Each respondent was given 16 choice sets. A total of 288 (16*18) observations were collected from 18 respondents (6 purchasing managers and 12 chefs) from 11 selected high-class hotels and 2 catering companies in Addis Ababa. The choice experiment was designed in such a way that each attribute stands alone without being correlated with any other attribute so that multicollinearity between variables would not be a problem.
4.1.3. Econometric modelThe data generated were then analyzed using multinomial logit regression model. The random utility model assumes utility as an additive function of observable attributes and unobservable components. That is:
where Ujn represents the utility from alternative j of individual n; Vijn represent the utility from i attribute in j alternative of individual n; ejn is assumed to be an independently and identically distributed random component. The probability that option j is chosen from set C of m options can be expressed as:
The conditional logistic regression model analyzes the effects of each attribute in the choice decision of respondents by treating the same choice sets together in the same way “time-variant” parameters are treated in the fixed effect model.
Dividing the value of coefficients of attributes by the coefficient of price attribute gives the willingness to pay (WTP) of the HED market for the different attributes. Accordingly, the WTP of the high-end markets was determined for each attribute and ranked. This result was
also taken to serve as a proxy for the quality requirement of the high-end export market. It also shows the meat quality requirements of the import demand.
4.2. Translation of the desired meat quality attributes into specifications for an ideal conditioned animal
Translation into specifications for an ideal conditioned animal was done after the identification and ranking of the desired meat quality attributes and market requirements. This was accomplished by:
• Review of the technical factors that determine the identified attributes, national standards related to meat and live animals, and relevant experiences from other countries;
• Development of specifications for an ideal conditioned animal for the different species (cattle, sheep, and goat) and categories of clients based on the reviews and requirements of the different buyers/markets;
• Comparison of the different local breeds distributed across the country based on the specifications/criteria (size, growth rate, origin, and population size). Weighted averages were used to rank the breeds compared.
4.3. Assessment of high-end meat and live animal markets
HED market: The overall performance and constraints of the domestic market were assessed through interviews using structured questionnaires and discussions with key informants.
Export markets: Assessment of the major export destinations and the volume of exports of meat and live animals were made based on data from ECRA and other sources. These data were complemented with information obtained by interviewing major export abattoirs and live animal exporters. The efficiency, structure, and performance of the export market for Ethiopian meat and live animals were assessed. An attempt was also made to identify key attributes that are unique to Ethiopian meat and live animals.
4.4. Characterization of selected production environments supplying major domestic and export markets
The conditioning/fattening practices of the different production environments of the prioritized breeds, and the main current and potential livestock supply sources were assessed using the following tools and instruments:

24
4. METHODOLOGICAL FRAMEWORK
• Secondary data/desk research: Information/data from published and unpublished sources on the production environment and the major available feed resources and feeding systems were collected and used.
• Primary data: The data/information obtained from secondary sources were complemented by a quick validation/gap-filling exercise. Information about types of producers’ characteristics, major constraints, opportunities, and challenges was collected using structured questionnaires, checklists, and physical observations during site visits. Primary data on feed resources were collected to fill the paucity of information in the secondary data sources and/or validate the data/information on the ground as required using the Feed Assessment Tool (FEAST), developed by the International Livestock Research Institute (ILRI) (Duncan et al. 2012).
4.5. Identification of intervention options to meet the quality requirements of the selected HED and export markets
Intervention models for the different livestock production scenarios/systems were developed based on the identification of the requirements of the high-end markets, assessment of the existing production scenario, delineation of the existing gaps, and consequently identification and packaging of activities that can best address the gaps with available resources, giving due consideration to production efficiency and cost.
4.6. Financial/economic analyses The approach followed in the cost-benefit analyses
Alternative animal production and conditioning models suitable for each of the different livestock production systems in the country were designed given the resources and other production conditions. Even though technical feasibility is necessary, it is not sufficient to induce farmers to adopt the new production systems. The proposed meat production models must therefore be financially and economically feasible. In addition, it is also important to consider the environmental, social, cultural, etc. feasibilities of the new interventions.
The partial budget method was used to assess the financial/economic feasibility of the production model. Thus, the marginal costs (MC) and marginal benefits (MB) of shifting from the current traditional production system into the improved meat production models were taken. The proposed change was financially/economically feasible when the additional benefits exceed the additional costs. That is:
where NR is net return; MB is the sum of differences in benefits between the new production model (M) and the traditional (T ) production system; MC is the sum of the difference in costs between the new production model (M) and the costs in the traditional (T ) production system; qiM is the quantity of ith output under M; qiT is the quantity of ith output under T; PiM is the price of the ith output from M; PiT is the price of the ith output from T; xjM is the quantity of jth input used in M; xjT is the quantity of jth input used in T; rjM is the price of the jth input used in M; and rjT is the price of the jth input used in T.

25Reorienting Livestock Production to Respond to the Meat Quality Requirements of High-End Domestic and Export Markets
4. METHODOLOGICAL FRAMEWORK
The net return (NR) is simply the difference between the sum of marginal benefits (MB) and the sum of marginal costs (MC). However, while the calculation of NR is mathematically straightforward, identification of cost/benefit items and their valuations are not easy. The estimated NR can represent financial or economic return depending on how the outputs and inputs are valued. The difference between financial and economic analysis is in the pricing methods. While all the additional outputs and inputs are valued at their market prices in the case of financial analysis, they will be valued at their opportunity costs (or efficiency/economic prices) in the case of economic analysis. The analysis of costs and benefits will be made at the production location. Thus, the prices of outputs and inputs obtained from the markets must be adjusted into feedlot and farm-gate prices. Doing so is especially important in the case of valuation of outputs. Since the points of production and consumption are spatially far apart, the prices of meat/animals estimated at the high-end markets must be adjusted to feedlot and farm-gate prices.
Feedlot prices and farm-gate prices were thus arrived at by making backward adjustments, starting from the prices of meat at the high-end market. This requires deducting the marketing costs and net returns of the various actors involved in moving the product from producers to final end-market consumers. These costs include transaction costs (brokerage, information, bargaining, contracting, quality assessments, etc.), transportation costs, feeding, and other management costs, risk costs, service fees, and taxes. Since the markets at all levels are not efficient, market actors also receive returns that are higher than the resources they expended for the marketing activities, i.e., they earn monopoly/abnormal profits. To avoid complications, the marketing margin was deducted from the prices in the upper-market level to arrive at the prices in the next-lower market level. Thus, the prices of the animals (estimated from the consumer prices of meat) at the feedlot were estimated by deducting the consumer prices from the marketing margin between the feedlot and the end market. Similarly, the producer prices for the animals were the prices the feedlot would receive for the animal minus the marketing margin between the feedlots and the producers.
The WTP for the ideally high-quality meat for high-class hotels was estimated, since the feasibility of a “new” (ideally high-quality) meat product that has no market price in the current situation is being analyzed.
These meat prices were first transformed into the price of an animal, and then the price of the animal at Addis Ababa was adjusted into feedlot price and then farm-gate/producer price by subtracting all marketing costs involved in moving the animal from the point of production to the point of consumption. Similar adjustments are also made
for purchased (external) inputs such as concentrates and other inputs.
For the new production models to be feasible, the net benefit (NB) must be greater than zero. Thus, the financial/economic feasibility of improved production technologies is a function of two parameters: the productivity of the technologies and the efficiency of the markets. While the production technology determines the amounts of outputs obtained from unit inputs, the efficiency of the markets determines the price differences between the markets along the chain. Given the value additions to the product, the more the markets are efficient, the higher the producers’ share of the final consumers’ price of meat. The market could be so inefficient as to entirely erode the potential financial gains that could be obtained from improved technology.
This section therefore further assesses the financial and economic feasibility of each of the alternative meat production models suggested for the different production contexts of the country. The question for each model is: Is the additional return from the proposed production models sufficient enough to compensate for the additional efforts and resources expended in the new production systems?

26
5. MAJOR FINDINGS
5.1. Assessment of local demand
The primary objective of the study is to improve the production and marketing of meat and live animal to meet the HED and export markets. As the results of the export/import market assessments show, the demand structures for goat/sheep meat and cattle meat/live animals are different. In the case of goat/sheep meat, there is excess foreign demand for goat and sheep meat even with the current quality level. Abattoirs have reported that they are supplying only 50% of the purchase order of importing countries. Though the foreign demand can absorb 10,000 goats per day, on average the abattoirs are supplying only 5,000 goats per day. As a result, abattoirs are operating below their slaughter capacity. Thus, demand is not an issue in the case of goat/sheep meat. Improvements in the quality of goat/sheep meat with the production system suggested here is expected to raise the export earnings by raising the export value of meat and also to meet the existing excess demand. But the situation is different when we come to cattle meat.
As shown in the assessment of exports of cattle meat and live animals, the current foreign demand for cattle is highly limited to live animals. The foreign demand for cattle meat is not only limited, but there are also high domestic demands for imported cattle meat. This import demand for cattle meat could even drastically rise if the diverse restrictions currently discouraging the imports of meat were removed. All the indications are that there are serious quality limitations in the current domestic supply of cattle meat. Furthermore, the willingness to pay the high prices of the HED market for the various quality attributes revealed by the market study above shows the quality problems in the current domestic supply of cattle meat. These results show the necessity of improving the quality of local cattle meat. The question thus is to what extent does the foreign and export demand absorb the improved cattle meat. Answering this question requires an assessment of the domestic and foreign demand for high-quality cattle meat.
As indicated by assessment of meat imports, high-standard hotels, catering companies, embassies, foreign companies, and big supermarkets are the major buyers of high-quality cattle meat. The hotel industry is one of the sectors in the country that has seen rapid growth in the past two decades. Particularly, there has been rapid and visible growth in high-standard hotels, especially in Addis Ababa and some big cities such as Hawassa, Bahir Dar, Mekele, and some tourist destinations. In Addis Ababa alone, there are 6 five-star hotels, 31 four-star hotels, 20 three-star hotels, 3 two-star hotels, and 1 one-star hotel (Samrawit
2015). In addition, the Ethiopian Airlines Catering Company supplies meals to greater than 85,0000 travelers per month flying with Ethiopian and to other Star Alliance member airlines. The company processes about 2,000 kg of different meat cuts per day (frozen beef cubes, minced beef, top side, and beef fillet). This company alone requires about 2,280 conditioned animals to meet its meat demand of about 730 tons of meat per year. Similarly, Addis Catering demands 150 kg per day, which is equal to about 50 tons per year. In addition, each of the 36 hotels with four stars and above currently operating in Addis Ababa consumes about 500 kg of meat per month. These hotels demand about 200 tons of meat per year. In sum, these companies demand more than 1,000 tons of quality cattle meat per year. When we add the demand of big supermarkets, embassies, and other foreign companies, it is evident that the quantity of high-quality meat demanded is substantially large. The volume of high-quality meat demanded in the future will be even higher, given the expected rapid increase in the number of high-standard hotels and big supermarkets. Furthermore, the above-predicted estimates are made based on the actual consumption of the relatively poorer-quality meat the local market is currently supplying. The domestic and the foreign demand for meat is expected to drastically rise as the domestic supply of high-quality meat increases.
5.2. Meat quality attributes desired by the high-end domestic and export markets
5.2.1. Identification of the quality attributesConsumers are willing to pay premium prices for food products perceived as high quality (Ilbery and Kneafsey 2000). As a result of the increasing demand for and attention to the “quality” of food products, product quality has become one of the important determinants of the direction of trade and export performance of countries (Curzi and Pacca 2015). The willingness of high-class consumers to pay premium prices for quality meat is a great opportunity for producers to reorient their production to target this segment of the market. However, in order to guide producers to reorient their production, the attributes and products that are highly valued by the target consumers (high-class consumers) must be identified, and the willingness of the consumers to pay for the attributes must be measured. The WTP of consumers is a necessary condition but not sufficient to induce producers to reorient their production. In order for producers to reorient their production, many other things must be satisfied. First and foremost, the potential benefits must justify the additional costs and effort required to produce the desired products. This requires the
5. MAJOR FINDINGS

27Reorienting Livestock Production to Respond to the Meat Quality Requirements of High-End Domestic and Export Markets
5. MAJOR FINDINGS
determination of the production technology, the prices, and quantities of inputs and outputs. Development of alternative production technology requires determination of what combinations of inputs should be used in order to result in a product with the desired attributes. This determination requires understanding the existing production system, the available resources, and the available improved production technologies and inputs. The other requirement is the determination of the prices of inputs and outputs. Since the points of consumption and points of production are different across time, place, and form, the prices of outputs at the end market and prices of inputs must all be adjusted to their farm-gate prices. Doing so requires assessing the existing and potential markets in order to account for the various costs incurred between the production and sales/purchase points. Once all the alternative production technologies, the quantities, and prices of inputs and outputs are determined at production point or farm-gate level, the remaining task is to make a comparative analysis of the profitability of alternative production technologies through cost-benefit analyses.
This study, consistent with this concept, aimed to assess the preference of high-end markets (especially high-class hotels and catering companies) that expect to pay a higher price premium for quality red meat. The current production system fails to supply meat and live animals that meet the desired quality. These customers are, as a result, forced to import meat from other countries. This indicates that there is a lucrative domestic market that could be tapped by producers. The questions, however, are: What are the quality attributes of meat that are highly valued by these market segments? Can farmers produce meat that satisfies the quality standard of the stated market segments? What production and marketing interventions are required for the farmers to produce the desired quality? This study is intended to answer these questions.
The first step in this task was to identify the quality attributes of meat that are highly valued by this segment of the market. Identification of these attributes has twofold benefits. First, it helps to identify the specific production and marketing interventions required for producers to supply quality meat that satisfies HED consumers: high-class hotels (above three-star hotels) and catering companies. The benefits of identifying these attributes can go beyond improving the meat sector for the HED market. The results can also help in making inferences about the export markets, because the quality preferences of this market segment can also mimic the quality preferences of the export markets, since the primary customers in this market segment are also predominantly foreigners. The results indicate the key quality attributes that are highly valued in the world meat markets in general. The results can thus help to identify quality gaps of the Ethiopian meats and the interventions required to improve the meat export markets. The twofold significance of the results of this assessment is: first, it helps farmers to capture this lucrative HED market; and second, it helps to make inferences about the quality improvements that are required to increase the competitiveness of Ethiopian meat in the world markets.
Meat quality is a complex term consisting of attributes such as color, flavor, and texture (Bredahl et al. 1998). The attributes are a function of both pre-slaughter and post-slaughter storage and other management practices (Sierra et al. 2006). Post-slaughter storage and other management practices that can determine meat quality were ignored, since the primary focus of this work was to improve the production and marketing of red meat.
The results of the conditional logistic regression model (Table 1) show that all the hypothesized variables, i.e., price, tenderness, marbling, juiciness, fattiness, color, and age of the animal were found to be significant in determining the choice decision of the high-standard hotels with four stars and above.
Choice set Coeff. SE z WTP (ETB/kg) WTP (USD/kg)a
Price -0.013*** 0.00 -4.08 Tenderness 1.255*** 0.16 7.68 -95.1 -2.7Marbling 0.780*** 0.25 3.18 -59.1 -1.7Juiciness 1.568*** 0.26 6.13 -118.9 -3.4Color 0.613*** 0.19 3.29 -46.5 -1.3Fattiness -0.924*** 0.20 -4.65 70.0 2.0Age 1.280*** 0.28 4.54 -97.0 -2.8
*** significant at 1%, ** significant at 5%a using exchange rate of ETB 35 = USD 1.
Table 1. Regression results of a choice experiment

28
5. MAJOR FINDINGS
Price: Like other business firms, high-standard hotels must also be conscious of the prices of inputs and their services in order to be financially profitable. Thus, price was expected to be one of the attributes hotels consider when they make purchase and sales decisions. The results of the conditional logistic regression showed that price was significant in determining purchase decisions. The degree of price consciousness depended on the strategic importance of the product/service for the success of the company. High-class hotels usually aim to provide a pleasurable eating experience for their customers by offering high-quality foods in addition to other value-added services. They are expected to use the best-quality meat and not compromise on quality like small hotels and restaurants might do. Their ability to attract the best quality depends partly on the level of premium price they are willing to pay. The small value of the coefficient suggests that price is a less important attribute compared to other quality attributes. It also shows their excessive willingness to pay high prices for the essential quality attributes such as tenderness, juiciness, fattiness, and age.
Tenderness: The results of the regression show that tenderness is one of the most important attributes that determines the purchase decisions of the hotels, as evidenced by the large value and strong significance of the coefficient. The fact that tenderloin (psoas major) is the most expensive meat cut in several countries is evidence that tenderness is the most important attribute in determining meat quality (Koohmaraie and Geesink 2006). All the respondents interviewed during the survey invariably mentioned tenderness as the most important quality attribute. They also reported that the meats from local animals are in general tough and thus one of the serious quality limitations of domestic meat. The meats from local animals are usually tougher than the meats from animals of a comparable age in most other countries. Purchasing managers, quality control managers, and chefs of the sample companies interviewed fully agree that their foreign customers seriously complain about the toughness of the local meat, even though they are positive about its flavor. The results from the regression analysis are strongly consistent with the survey results: the lack of tenderness is one of the most important quality problems associated with locally supplied meat. The high value of the coefficient for tenderness, given the coefficient for price is small, reflects the excessive willingness to pay a high price premium for improvements in tenderness, reflecting the importance of the attribute.
One of the appealing features of choice experimental studies is that the marginal effects can be used to estimate the WTP of sample companies for the improvements in the attributes. WTP can be calculated by the ratio of the coefficient of the attribute to the coefficient of the price. Consumers implicitly compute the tradeoff between the attributes and prices when they choose one alternative over
the other. The WTP corresponds to the marginal rate of substitution between an attribute and price. That is, the WTP measures the change in price necessary to compensate for the change in the attribute, keeping utility constant. Accordingly, the WTP for tenderness, for example, can be estimated by taking the ratio of the coefficient of tenderness to the coefficient of price (Btend/Bprice = 1.255/0.013 = 95.1). This means the high-class hotels and catering companies are on average willing to pay ETB 95.1 per kg for improvement in tenderness from tough to soft (tender).
Even if sample hotels and catering companies are willing to pay price premiums for quality meat, the market is supplying it only at the margin. Thus, in order to minimize the problem of toughness, the hotels buy meat cuts taken only from relatively softer parts of the body. Even then, chefs reported that they attempt to improve the tenderness of the meat by soaking in such products as wine, papaya, ginger, and onion. Studies, however, show that the improvements in tenderness through such measures are achieved at the cost of losing the flavor and taste of the meat.
Marbling: Marbling refers to the presence and degree of intramuscular fat. Marbling as a quality indicator is relevant for some specific cuts such as the loin (longissimus) (Farrell 2001). It was considered to be an important attribute because the loin is the most important meat cut demanded by high-class hotels. Marbling is taken as an important symbol of quality in some countries such as Japan (Busboom et al. 1993) and Australia (Unnevehr and Bard 1993), as reflected in their grading and standardization guidelines. Standards for grading of meat in Canada (Markus et al. 2011) and the US (USDA 1997) also show this preference for marbling. But Killinger et al. (2004) claim that marbling as a quality indicator is specific to some groups of consumers, as there are groups that prefer meat with a lower amount and distribution of marbling.
Marbling could be related to the age of an animal and also depends on feeding, breed variations, and other factors. There are also claims that marbling is associated with tenderness and juiciness. Available evidence, however, suggests that the degree of marbling is generally poorly correlated with tenderness, juiciness, or flavor of beef cuts (Wolf and Thulin 2000, Farrell 2001). But even if marbling is in reality correlated with these attributes, the design of this experiment enabled us to control the effects of other attributes. This result can thus be interpreted as the preference of buyers for marbling, holding other attributes constant. Thus, the presence of correlation, in reality, does not pose any problem here.
The results showed that an abundance of marbling significantly affects the meat purchase decisions of the

29Reorienting Livestock Production to Respond to the Meat Quality Requirements of High-End Domestic and Export Markets
5. MAJOR FINDINGS
sample hotels and catering companies. Their WTP for improvement in marbling was found to be ETB 59.1 per kg. This result means they are willing to pay a price premium for meat with abundant marbling. Though marbling is a quality characteristic specific to the loin, it was found to be an important attribute. Studies claim that sensory benefits come at a significant cost in terms of lower animal growth rates and reduced lean meat yields (Farrell 2001). To what extent the above price premium incentivizes producers to target marbling depends on the magnitude of these and other costs vis-à-vis the price premium.
The juiciness of meat: Studies show juiciness to be an important attribute that determines the quality of meat. Juicy meat is preferred to drier meat. Some countries take juiciness as one of the quality indicators in the grading and standardization of meat (USDA 1997). Consumers claim that juiciness provides an excellent eating experience. The coefficient was found to be strongly significant. It was found that juiciness was the most important attribute in determining the purchase decisions of the hotels. The WTP of sample hotels and companies for juiciness was found to be ETB 118.9 per kg; they are willing to pay this premium price for juicy meat compared to “dry” or less juicy meat.
Color: Meat color is also used as an indicator of quality. Meat color was found to be a significant determinant of meat quality. Meat color is traditionally an important cue and is used by consumers to infer freshness, taste, and texture. The result showed that meat with light red color is preferred to red meat, and meat with a red color is preferred to dark red meat. Killinger et al. (2004) also found that US consumers preferred a red cherry color to a dark red color. Studies claim that meat color not only indicates the freshness of meat but also good taste and texture. They claim that consumers will have a greater appetite for lighter red meat than darker meat and hence will be willing to pay higher prices for lighter red meat than for darker meat. Consistent with the claim, it was found that the sample hotels and companies are willing to pay a price premium of ETB 46.5 per kg for the preferred color of meat. The color of meat seems to be less important in determining the purchasing decisions of the sample hotels and companies compared to other attributes. Unlike the domestic market, it was found that meat color is a crucial attribute in the export market. Export abattoirs reported that Middle East consumers will not buy meat unless its color is light red. It is also reported that the only reason they are importing goat meat originating only from the lowland areas of Ethiopia is that meat originating from other parts of the country have a darker color undesirable to Middle East buyers. So, creating access to the relatively lucrative export market for goat meat producers in the rest of the country will be difficult without improving the color of the meat.
Research results indicate that the color of meat is associated with the level of physical exercise the animal underwent during its growth. Animals that have gone through a lot of physical exercise will have darker meat. Stress during slaughter will also darken the color of meat. To what extent the production environment affects the color of meat and what can be done about it is an empirical question. Interventions to improve the quality of meat thus require taking measures that reduce the darkness of the red color.
Age: Age is obviously an important determinant of quality, as many characteristics of the meat (tenderness, fattiness, marbling, color, and juiciness) change with age of the animal. Since these attributes were controlled in the choice experiment, age is treated here as an independent attribute in determining the preference of meat buyers. It was found that age is a significant determinant of meat preferences of the sample hotels and companies, holding all other quality attributes constant. The results showed that meat from younger animals is preferred to that of older animals. Hotels were found to be willing to pay a premium price of ETB 97 per kg for the meat of younger animals.
It was hypothesized that price, tenderness, marbling, juiciness, fattiness, color, and age of the animal determined the preference of high-class hotels and catering companies for meat. All the hypothesized quality attributes were strongly significant in determining preference. It was also found that the stated WTP for each attribute was considerably high. There is a willingness to pay price premiums ranging from ETB 46.5 (USD 1.3) to ETB 118.9 (USD 3.4) per kg of meat. Whether these premiums incentivize farmers or not depends primarily on the technical feasibility of improving the attributes through improved production techniques. Even if it is technically feasible, farmers will adopt the improved production techniques only when the unit costs of improving each of these attributes is less than the price premiums they receive at the farm gate. Currently, the high-class hotels and catering companies buy meat and live animals largely from traders and abattoirs, not from farmers. Thus, the stated price premiums will not fully reach the farmers. A portion of the price premium is captured by the various middlemen before it reaches the farmers. Farmers receive only the residual price premiums. What portion of the price premiums reaches the farmers depends on the efficiency of the market. The impacts of interventions to improve meat quality, therefore, depend on the technical feasibility of the improved production technologies and the financial feasibility of the technologies that are a function of the additional costs and price premiums, both of which are again functions of the efficiency of the markets.

30
5. MAJOR FINDINGS
5.2.2. Quality requirements of the market The HED market Ethiopia currently imports meat, largely sold in high-end outlets such as luxury hotels and supermarkets in the capital that cater to the specific taste requirements and quality demands of largely foreign nationals visiting and residing in the country. Interest has been shown for more imports if it were not for the foreign currency shortages. These consumers prefer low-fat, packaged, and labeled meat, focusing on a limited number of specific cuts. The most desired cuts include beef topside, sirloin, and tenderloin. Supermarkets mainly sell raw as well as processed beef (sausages) and byproducts directly to consumers. They (e.g., the Bambis Supermarket) purchase carcasses from local and export abattoirs and undertake further processing and packing activities on their premises.
High-end consumers prefer low-fat Borana and Hararghe beef. Some packaging with foils and other materials is currently practiced. Consumers purchase both fresh/chilled and frozen types of meat. There is also a market for mutton, primarily associated with holidays such as New Year, Christmas, Easter, Ramadan, and Arefa. For mutton, the domestic market prefers highland sheep between two and four years of age.
The following high-class hotels: Radisson Blu, Hilton, Sheraton, Ramada, Elilly, Harmony, Intercontinental, Saro Maria, Friendship, Golden Tulip, Meridian; supermarkets: Bambis, Novis at the Hilton hotel premises, Shewa, Fresh Corner, Shi Solomon; and catering institutions: Ethiopian Airlines, Addis International Catering were visited. The discussions were conducted with purchasing personnel, chefs, and quality experts. Chefs were engaged in the conduct of a choice experiment to determine the value accorded to different meat quality attributes.
The quality requirements and views on Ethiopian meat sources by HED consumers is presented in detail in Appendix Table 1.
The meat and live animal export markets The following section summarizes the quality requirement and associated issues of the export market.
• Meat:
o Destination countries: UAE and the KSA are the major traditional destination markets, to which 95% of the chilled carcass is exported.
o Segment of target market accessed: The low- to middle-income community that has less-stringent quality demands is the market segment purchasing meat from Ethiopia.
What is required to increase export in this segment of the traditional market is largely an increase in the volume of supply, which can be done by increasing promotion efforts and improving the price of the product.
o Types of meat exported: Chilled goat meat is the main type of meat exported. Ethiopia is much less competitive regarding beef exports. Only about 1,500 tons of beef were exported last year. Ethiopian beef prices are far higher than those of competitors relative to a narrower gap for small ruminant meat.
o Breed/ecotype preferences: Borana goats are the most preferred animals for export. Lately, there has been a gradual shift to sources such as Guji, Bale/Ginhir, South Omo/Jinka, Konso, and parts of Afar and Somali due to a shortage of Borana goats. Borana goat carcasses constitute about 10% of the chilled carcasses exported due to the short supply, even though they are the most preferred.
o Supply of animals to slaughter facilities: More than 10,000 goats are required per day by the abattoirs (other than the new Allana Plant that has the capacity to slaughter 8,000/day) to fulfill the demand of their buyers. Current supply is about 5,000 goats/day, so obviously they are compelled to operate at less than 50% of their daily slaughter capacity. Ethiopian exporters have been unable to supply demanded quantity on a timely basis, resulting in a lack of confidence in them by the buyers.
o Cost of Ethiopian meat at the export market: The cost of Ethiopian meat relative to meat from alternative suppliers is on the high side, challenging the competitiveness of Ethiopian meat. This cost is partially driven by the inherent inefficiencies of the production practice that result in high production costs and is further exacerbated by inefficient operations and transaction costs.
o Concerns about the quality of meat from Ethiopia: Concerns are expressed regarding sanitary conditions at slaughtering facilities, poor cold chain management, and poor meat packaging. Ethiopian meat is sometimes re-packaged as Indian, Pakistani, or Somali meat. The SPS situation has substantially improved in recent years with the emergence of certified export slaughter facilities that operate up to the desired standard.
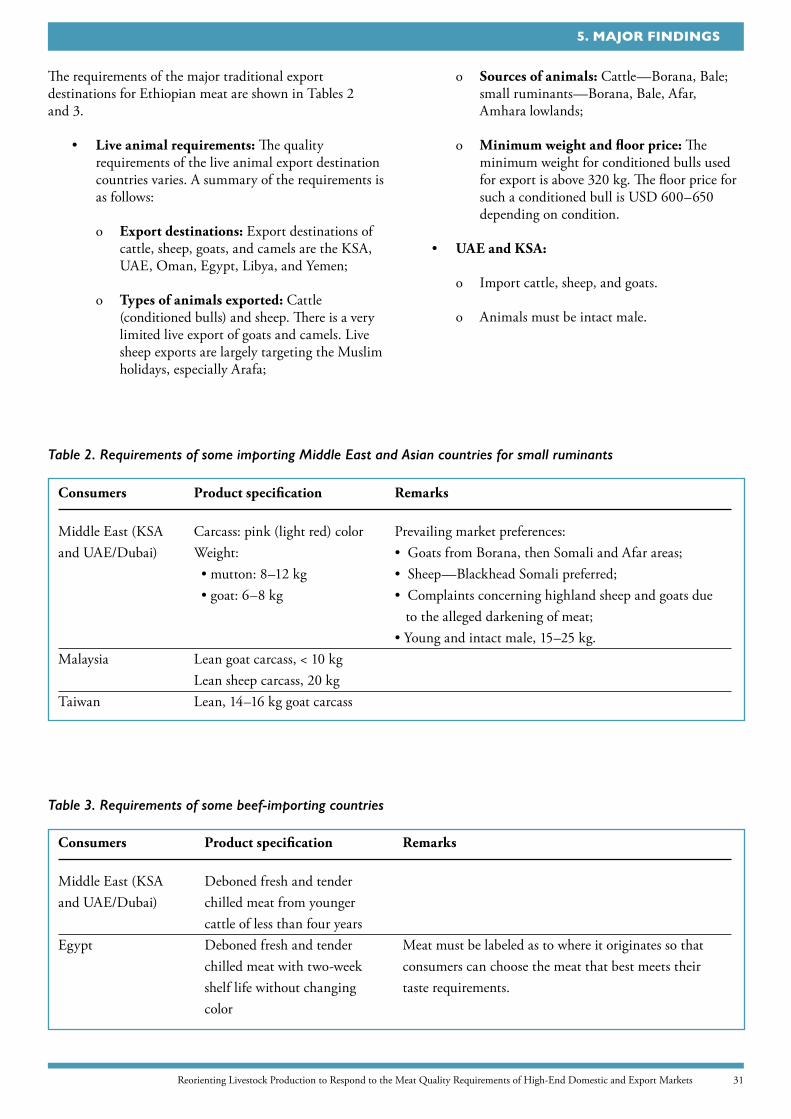
31Reorienting Livestock Production to Respond to the Meat Quality Requirements of High-End Domestic and Export Markets
5. MAJOR FINDINGS
The requirements of the major traditional export destinations for Ethiopian meat are shown in Tables 2 and 3.
• Live animal requirements: The quality requirements of the live animal export destination countries varies. A summary of the requirements is as follows:
o Export destinations: Export destinations of cattle, sheep, goats, and camels are the KSA, UAE, Oman, Egypt, Libya, and Yemen;
o Types of animals exported: Cattle (conditioned bulls) and sheep. There is a very limited live export of goats and camels. Live sheep exports are largely targeting the Muslim holidays, especially Arafa;
o Sources of animals: Cattle—Borana, Bale; small ruminants—Borana, Bale, Afar, Amhara lowlands;
o Minimum weight and floor price: The minimum weight for conditioned bulls used for export is above 320 kg. The floor price for such a conditioned bull is USD 600–650 depending on condition.
• UAE and KSA:
o Import cattle, sheep, and goats.
o Animals must be intact male.
Consumers Product specification Remarks
Middle East (KSA Deboned fresh and tenderand UAE/Dubai) chilled meat from younger cattle of less than four years Egypt Deboned fresh and tender Meat must be labeled as to where it originates so that chilled meat with two-week consumers can choose the meat that best meets their shelf life without changing taste requirements. color
Table 2. Requirements of some importing Middle East and Asian countries for small ruminants
Consumers Product specification Remarks
Middle East (KSA Carcass: pink (light red) color Prevailing market preferences:and UAE/Dubai) Weight: • Goats from Borana, then Somali and Afar areas; • mutton: 8–12 kg • Sheep—Blackhead Somali preferred; • goat: 6–8 kg • Complaints concerning highland sheep and goats due to the alleged darkening of meat; • Young and intact male, 15–25 kg. Malaysia Lean goat carcass, < 10 kg Lean sheep carcass, 20 kg Taiwan Lean, 14–16 kg goat carcass
Table 3. Requirements of some beef-importing countries
32
5. MAJOR FINDINGS
o Age and weight preferences:
3 Cattle: < four years of age and weight greater than 320 kg;
3 Sheep and goats: 6–18 months of age and weight range for sheep 25–30 kg, and bigger goats of up to 50 kg and more;
3 The preferred weight category of sheep during Eid Al-Adha (Arafa) is between 25–30 kg and more with good body condition, as shipping to KSA requires about one week.
• North African countries such as Egypt:
o Import cattle and camels.
o Relatively older animals are preferred by the Egyptian market:
3 Cattle: Young cattle < 3 years preferred. Older animals of much higher live weights are also acceptable.
3 Camels: 5 to 10 years.
5.3. Translation of the identified market requirements into specifications for a conditioned animal that meets the desired attributes
One of the objectives of the consultancy assignment was to propose improvement interventions that will help modify the quality attributes to produce meat that meets the quality requirements of the end markets. The major desirable meat quality attributes identified as determinants of the preference of high-end consumers included price, tenderness, the degree of marbling, juiciness, fat content, and meat color.
The next exercise was an attempt to translate the identified quality attributes into animal specifications that meet these requirements. The translation of these attributes into animal specifications meeting the requirements was based on the review of the determinants of the desirable quality attributes and the characteristics of the animal (animal attributes) that contribute to the identified preference determinants.
5.3.1. Determinants of preferred quality attributes • Tenderness: Tenderness was identified as a major
determinant of preference. The following animal attributes affect tenderness.
o Age and weight at slaughter: Tenderness of meat declines as an animal matures and the size of each muscle fiber increases.
o Breed: There is variation in meat tenderness among species and among animals within a species. Variation among animals reared in the same environment and slaughtered at the same age, weight, and degree of finish suggests a genetic cause for some variation in tenderness. In beef, there is a heritability value of 60% for tenderness, suggesting that heredity may have a major influence. This heritability value is presumed to be similar in sheep and goats.
o Nutrition: Nutrition influences tenderness, principally through its effects on the amount and type of fat in the meat. Deposition of fat among the muscle fibers (marbling) as the animal grows and matures on a high-energy ration can improve tenderness.
o Muscle location: Muscle subjected to more exercise is generally less tender, i.e., the more a muscle is used, the stronger it becomes, and therefore the tougher the cut of meat will be.
• Marbling: Marbling is the degree of intramuscular fat. Marbling was shown to be an attribute valued in the purchase of meat by high-end hotels. Factors affecting marbling include age, genetics, nutrition, management, and environment.
• Fattiness: Fattiness is affected by age, weight at slaughter, and the nutritional status of the animal. A high level of feeding, especially after a specific stage of maturity, encourages fat deposition and thus fattiness of the carcass. A higher plane of carbohydrate nutrition promotes earlier fattening, while a lower level results in a delayed or slower fattening process. Producers can thus vary feeding regimes and husbandry methods to attain the high- or low-fat levels a particular market may demand. Castration also has an effect on fattiness. Castrated animals tend to deposit more fat than their uncastrated contemporaries do.
• Meat color: Meat color is an important parameter in meat quality. Preference for light-colored meat has been identified to be an important parameter that makes a significant contribution to the preference of customers in the HED market assessed. Several factors, including stress (transport, feeding, management, etc.), species, age, sex, exercise, the diet of the animal, as well as genetic and environmental factors and cut and packaging of meat, affect meat color.

33Reorienting Livestock Production to Respond to the Meat Quality Requirements of High-End Domestic and Export Markets
5. MAJOR FINDINGS
Meat color is largely determined by the content of meat pigments (myoglobin and hemoglobin) and its derivatives. The level of myoglobin within a muscle is mainly influenced by species, muscle function within the animal, and age of the animal. The more myoglobin in the meat, the darker the color exhibited. Older animals generally contain more muscle myoglobin and hence have darker meat. Customers in the export markets have shown a preference for lowland animals as opposed to highland animals due to the presumption that meat of highland animals darkens much faster as a result of higher myoglobin content of the meat from animals that come from high altitude areas. This is considered to be the need for myoglobin to store and deliver oxygen in the muscle and a response to improve the efficiency of using the sparse oxygen available at high altitudes. Conditions during slaughter that influence proper blood removal can influence hemoglobin content.
• Sex of the animal: Meat quality differences between the sexes are not fully understood but are believed to be caused by differing levels of sex hormones circulating in the blood. Young rams, for example, have meat that tends to be relatively darker and tougher than that of female animals of similar age. Moreover, at a similar age, ewe lambs tend to be fatter than ram lambs. Sex of the animal is not an issue of concern when it comes to the export destinations of Ethiopian meat, as only intact male animals are acceptable for religious/cultural reasons.
• Other considerations: Small size of the cuts and an inconsistent/shortage of supply were also mentioned as shortcomings during the assessment of the HED market. Among the important objective measures is size. Body size and conformation is a key to classifying physical characteristics. For instance, Western Highland goats can be classified as a large breed and Afar goats as a small breed. Body size refers to the height, length, and width of the animal. Such measures of body size include height at withers and chest (heart) girth. Sheep and goats with a larger litter size are preferable for increasing the reproductive rate and thus the offtake rate to increase the supply of slaughter animals, both for the local and export markets.
5.3.2. Specifications for conditioned animals that satisfy the desired quality requirementsHED market: The main shortcomings of meat from local sources based on the assessments of HED markets (high-class hotels, etc.) were toughness (low tenderness), a low degree of juiciness, undesirable dark color, and a high level of fat. Small size and lack of uniformity of the cuts supplied and inadequate supply were also raised as limitations (see Appendix Table 1 for details).
The specification for an ideal animal that can satisfy the requirement of these customers for tender, juicy, lean, light-colored, and large-sized cuts is a young animal that has a high daily weight gain and at least a medium-sized body frame. Based on this general premise, the specifications for an animal that satisfies the preferences of the HED market would be as outlined in Table 4 below.
Parameter Livestock species Cattle Sheep Goat
Age (months) < 24 < 12 < 18Slaughter weight (kg) Up to 350 25–28 up to 50Sex Male and female Male and female Male and femaleGrade (condition/conformation)* 2 2 2 Fat grade* 2 2 2Body frame (small, medium, large) Medium to large Medium to large Medium to largeCastration Intact or castrated Intact or castrated Intact or castratedOrigin** Any ecology Any ecology Any ecology
*Ethiopian live animal standards. **Animals from lowland areas would be preferred. Animals of mid-altitude and highland origin should also be gradually pushed with the appropriate management, transportation, and feeding regimen to reduce the stress that exacerbates meat darkening.
Table 4. Specifications for HED market

34
5. MAJOR FINDINGS
Export markets: Juicy, lean, light-colored meat, and larger-sized cuts are required by the export market, similar to the requirements of the HED market. Under this general framework, the different export market destinations also have more specific requirements. The
generalized specification for an animal that satisfies these requirements would be a young animal that has a high daily weight gain and at least a medium body frame size. A more detailed specification is shown in Tables 5, 6, and 7 below by destination market.
Parameter Livestock species Cattle Sheep Goat
Age (months) < 24 < 12 < 12Slaughter weight (kg) > 320 15–20 16–18Sex Male Male MaleGrade (condition/conformation)* 1 or 2 1 or 2 1 or 2 Fat grade* 1–2 1–2 1–2Body frame (small, medium, large) Medium to large Small to medium Small to mediumCastration Intact Intact IntactOrigin** Lowland/mid-altitude Lowland/mid-altitude Lowland/ mid-altitude
*Ethiopian live animal standards. **Animals from lowland areas would be preferred. Animals of mid-altitude and highland origin should also be gradually pushed with the appropriate management, transportation, and feeding regimen to reduce the stress that exacerbates meat darkening.
Table 5. Specifications for UAE
Table 6. Specifications for KSA
Parameter Livestock species Cattle Sheep Goat
Age (months) < 24 < 15 < 15Slaughter weight (kg) > 320 30–35 30–35Sex Male Male MaleGrade (condition)* 1 or 2 1 or 2 1 or 2Fat grade* 1–2 1–2 1–2Body frame (small, medium, large) Medium to large Medium to large Medium to large Castration Intact Intact IntactOrigin** Lowland/mid-altitude Lowland/mid-altitude Lowland/mid-altitude
*Ethiopian live animal standards. **Animals from lowland areas would be preferred. Animals of mid-altitude and highland origin should also be gradually pushed with the appropriate management, transportation, and feeding regimen to reduce the stress that exacerbates meat darkening.

35Reorienting Livestock Production to Respond to the Meat Quality Requirements of High-End Domestic and Export Markets
5. MAJOR FINDINGS
5.3.3. Suitable breeds that can fulfill the identified quality requirementsThe meat production base of successful African countries like Botswana, Namibia, and South Africa shows that these countries focus on a limited number of productive breeds. Based on this experience, review of the characteristics/merits of the different local breeds in the country with better potential and capacity to respond to the set market requirements and, thus, warrant targeting for future development and investments was undertaken. Ranking of the available breeds in the country was done based on the information assembled to spend the country’s scarce resources on a limited number of responsive breeds. A combination of the following criteria was used for the evaluation and ranking of the breeds.
• Size and conformation: A combination of height, width, and length was considered to cater for the larger size cuts desired.
• Weight gain/growth performance: Used to cater for the capacity of attaining a larger body weight at an earlier age.
• Origin: Animals from lower and intermediate altitudes/environments were given priority for focus, at least in the short and medium term and especially for the export market.
• Population: Breeds with higher population sizes were given more priority from the perspective of attaining more benefit by investing scarce resources on these.
Weighted averages were used for the parameters chosen, and breeds were ranked based on the weighted averages. The following breeds were identified as breeds of focus as a result of this exercise.
• Sheep: Horro, Bonga, Washera, and Arsi-Bale.
• Goats: Long-eared Somali, short-eared Somali, Woyito-Guji, and Afar (only goats in the low and mid-altitude areas were compared).
• Cattle: Borana, Fogera, Horro.
The details of the ranking of the different species in terms of satisfying the requirements is shown in the Appendix Tables 2 to 5.
5.4. Assessment of major meat and live animal HED and export markets
5.4.1. Imports of livestock and livestock productsThe country imports various animal products, fish and other aquatic animals, chickens and other birds, livestock meats, and milk and milk products. The total imports have been growing at an exponential rate of 19% per annum between 2006 and 2016. Total imports grew from USD half a million in 2006 to USD three million in 2016. From this overall import of animal products, 98.1% constitutes other animal products: seafood, milk and milk products, and chicken and other bird meats. Imports of livestock meat are only 1.9% of the total imports of animal products. Imports of beef, lamb, swine, and other meat products constitute 0.8%, 0.1%, 0.9%, and 0.1% respectively. See Figure 2.
Parameter Livestock Species Cattle Sheep Goat
Age (months) < 48 -- --Slaughter weight (kg) > 320 -- --Sex Male -- --Grade (condition/conformation)* All grades -- --Fat grade* All grades Body frame (small, medium, large) Small to large -- --Castration Intact -- --Origin** Less stringent
*Ethiopian live animal standards. **Animals from lowland areas would be preferred. Animals of mid-altitude and highland origin should also be gradually pushed with the appropriate management, transportation, and feeding regimen to reduce the stress that exacerbates meat darkening.
Table 7. Specifications for North African countries/Egypt

36
5. MAJOR FINDINGS
Import of beef: Import of beef in the country is almost nonexistent. However small, beef is imported in different forms: fresh, frozen, salted, and prepared. While fresh and frozen beef constitutes about 8% and 22% of the total beef imports between the years 2006 and 2017 respectively, salted and prepared beef constitute the remaining 70% percent.
Imports of more than ETB one million were observed in the years between 2010 and 2016. The overall annual imports of fresh, frozen, salted, and prepared beef in the country have been below ETB 8.5 million (USD 400,000). Furthermore, there has been a rapid decline in the value of imports of all types of beef since 2014. See Figure 3.
The trend in the imports of fresh and frozen beef has shown some rise over these periods. But the import of prepared beef has shown rapid declines over these periods.
The increase in the proportion of fresh and frozen beef could be attributed to the expansion of international hotels and catering services. See Figure 4.
Not only the magnitude of imports of beef is small but also the observed imports seem to be opportunistic imports. Despite the fact that the total imports were small, the countries of origin are relatively large in number. It seems the imports have almost no permanent origin, demonstrated by the high fluctuation in the total value of imports from each country of origin. From the 20 countries from which beef has been imported over the periods under consideration, only 5 countries were frequent sources (see Figures 5). From these countries of origin, consecutive imports over these periods were observed only for UAE. It can thus be concluded that the country of origin of imports of beef is largely arbitrary.
Figure 2. Trends in imports of different types of livestock meat (2006–mid-2017).
Figure 3. Trends in imports of different forms of beef (2006–mid-2017).

37Reorienting Livestock Production to Respond to the Meat Quality Requirements of High-End Domestic and Export Markets
5. MAJOR FINDINGS
Examination of the importers makes this point clearer. As shown in Table 8, of the 58 companies that have imported beef over this period, no company imported beef consecutively in the 12 years. Instead, the average frequency of imports per company was only five. It shows that most of the imports were opportunistic imports. Even the two catering companies have not imported consecutively. From the total value of imports over this period, nearly half of the imports (46.8%) were made by foreign and foreign-affiliated companies such as
construction companies and embassies. Two important features of these importers are: they import beef for consumption, and the country of origin of beef and the nationality of the companies are more or less similar. Due to these features, not only is the pattern of their imports likely to be occasional, but also their imports could be driven by the high taste preference for beef originating from their own country. However, this is a natural behavior; the quality limitations of local beef can make such origin-specific tastes and preferences stronger.
Figure 4. Trends in share of different forms of beef in the total beef imports (2006–mid-2017).
Figure 5. Trends in imports of beef by the origin of imports (2006–mid-2017).
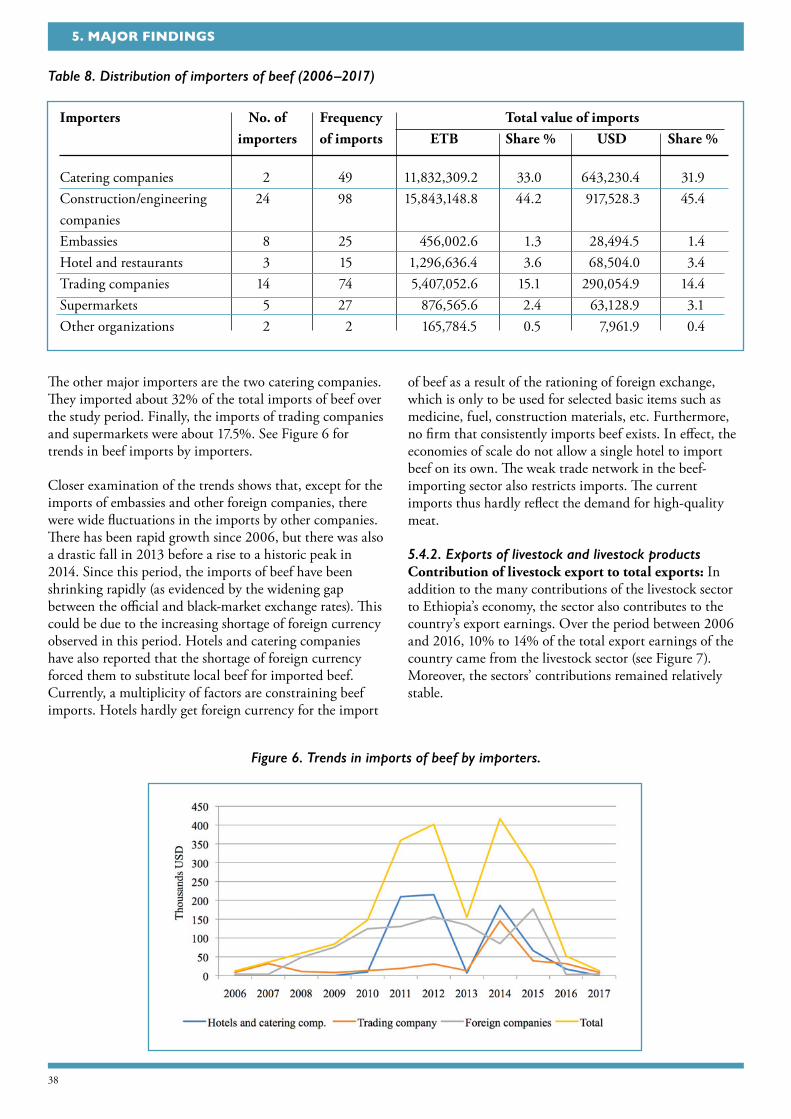
38
5. MAJOR FINDINGS
The other major importers are the two catering companies. They imported about 32% of the total imports of beef over the study period. Finally, the imports of trading companies and supermarkets were about 17.5%. See Figure 6 for trends in beef imports by importers.
Closer examination of the trends shows that, except for the imports of embassies and other foreign companies, there were wide fluctuations in the imports by other companies. There has been rapid growth since 2006, but there was also a drastic fall in 2013 before a rise to a historic peak in 2014. Since this period, the imports of beef have been shrinking rapidly (as evidenced by the widening gap between the official and black-market exchange rates). This could be due to the increasing shortage of foreign currency observed in this period. Hotels and catering companies have also reported that the shortage of foreign currency forced them to substitute local beef for imported beef. Currently, a multiplicity of factors are constraining beef imports. Hotels hardly get foreign currency for the import
of beef as a result of the rationing of foreign exchange, which is only to be used for selected basic items such as medicine, fuel, construction materials, etc. Furthermore, no firm that consistently imports beef exists. In effect, the economies of scale do not allow a single hotel to import beef on its own. The weak trade network in the beef-importing sector also restricts imports. The current imports thus hardly reflect the demand for high-quality meat.
5.4.2. Exports of livestock and livestock productsContribution of livestock export to total exports: In addition to the many contributions of the livestock sector to Ethiopia’s economy, the sector also contributes to the country’s export earnings. Over the period between 2006 and 2016, 10% to 14% of the total export earnings of the country came from the livestock sector (see Figure 7). Moreover, the sectors’ contributions remained relatively stable.
Importers No. of Frequency Total value of imports importers of imports ETB Share % USD Share %
Catering companies 2 49 11,832,309.2 33.0 643,230.4 31.9Construction/engineering 24 98 15,843,148.8 44.2 917,528.3 45.4companiesEmbassies 8 25 456,002.6 1.3 28,494.5 1.4Hotel and restaurants 3 15 1,296,636.4 3.6 68,504.0 3.4Trading companies 14 74 5,407,052.6 15.1 290,054.9 14.4Supermarkets 5 27 876,565.6 2.4 63,128.9 3.1Other organizations 2 2 165,784.5 0.5 7,961.9 0.4
Table 8. Distribution of importers of beef (2006–2017)
Figure 6. Trends in imports of beef by importers.
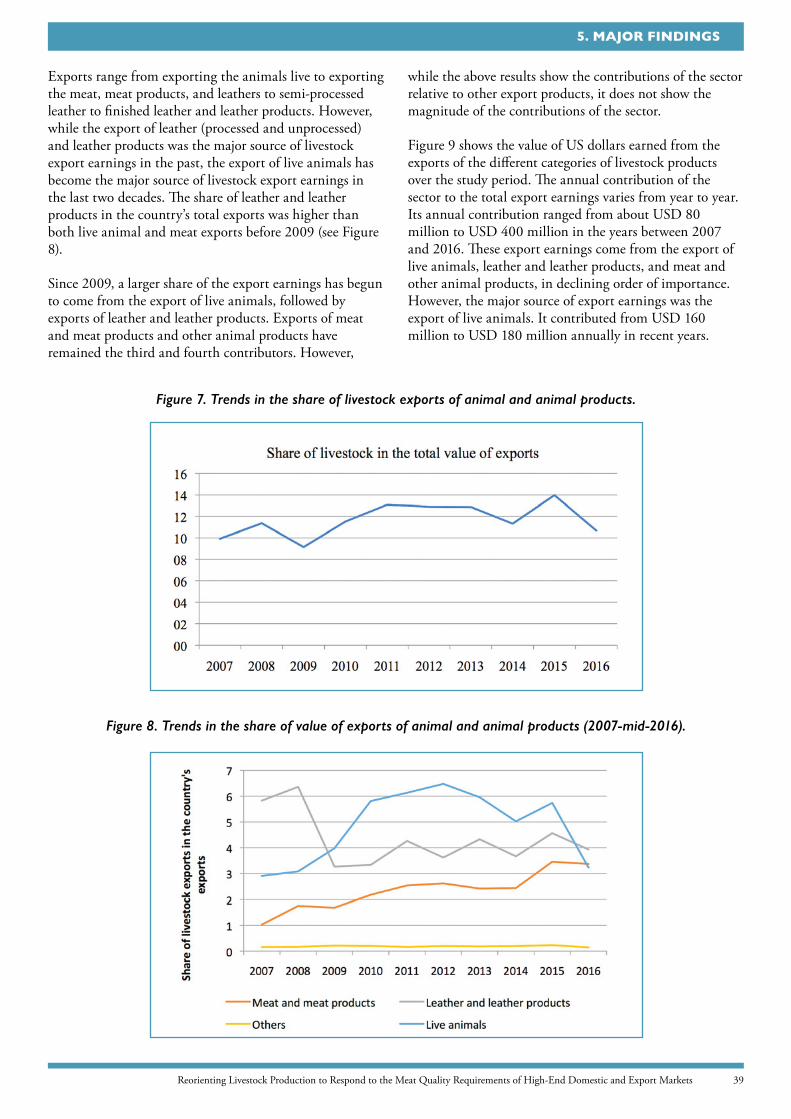
39Reorienting Livestock Production to Respond to the Meat Quality Requirements of High-End Domestic and Export Markets
5. MAJOR FINDINGS
Exports range from exporting the animals live to exporting the meat, meat products, and leathers to semi-processed leather to finished leather and leather products. However, while the export of leather (processed and unprocessed) and leather products was the major source of livestock export earnings in the past, the export of live animals has become the major source of livestock export earnings in the last two decades. The share of leather and leather products in the country’s total exports was higher than both live animal and meat exports before 2009 (see Figure 8).
Since 2009, a larger share of the export earnings has begun to come from the export of live animals, followed by exports of leather and leather products. Exports of meat and meat products and other animal products have remained the third and fourth contributors. However,
while the above results show the contributions of the sector relative to other export products, it does not show the magnitude of the contributions of the sector.
Figure 9 shows the value of US dollars earned from the exports of the different categories of livestock products over the study period. The annual contribution of the sector to the total export earnings varies from year to year. Its annual contribution ranged from about USD 80 million to USD 400 million in the years between 2007 and 2016. These export earnings come from the export of live animals, leather and leather products, and meat and other animal products, in declining order of importance. However, the major source of export earnings was the export of live animals. It contributed from USD 160 million to USD 180 million annually in recent years.
Figure 7. Trends in the share of livestock exports of animal and animal products.
Figure 8. Trends in the share of value of exports of animal and animal products (2007-mid-2016).

40
5. MAJOR FINDINGS
In order to get a better picture of the export performances of the sector, it is essential to disaggregate the livestock products by animal and product types for selected animals: cattle, sheep, goat, and camel.
Meat export performance: Despite the number of export abattoirs rising recently, there has been limited growth in the amount of earnings from the export of meat. In addition, the current meat export market is dominated by goat meat. As shown in Figure 10, the foreign exchange earnings from meat export have grown rapidly over the period from 2007 to 2016.
The export earnings from livestock meat have grown at an average exponential growth rate of 20.6% per annum.
Even though the export of goat meat has always been the dominant source of meat exports, its dominance has also increased, especially recently. Regression of the value of export earnings from goat meat shows an average growth rate of 24.9% per annum, indicating that the earnings from other meat types have been declining at about 4.3% per annum over these years.
A similar pattern is observed in the quantity of meat exported. Figure 11 shows a similar pattern in that goat meat is highly dominant in the total volume of exports of livestock meats.
It is necessary to see the price trends in order to assess the potential of the different meat types. Figure 12 shows the
Figure 9. Trends in the value of exports of animals and animal products (2007-mid-2016).
Figure 10. Trends in the value of export earnings from different meats.

41Reorienting Livestock Production to Respond to the Meat Quality Requirements of High-End Domestic and Export Markets
5. MAJOR FINDINGS
price trends of beef, goat meat, and lamb. While the price of goat meat and lamb has been slowly rising over the years, the prices are also stable. The average growth rates of prices of goat meat and lamb were 7.1% and 5.9% per annum respectively. On the other hand, the price of beef is not only unstable, but it has also shown a declining trend (3.1% per annum). This decline could be due to the limited capacity of the exporting abattoirs to do value-addition activities.
This rising trends in the prices of goat and sheep meats could be due to the rising demand for Ethiopian goat meat in the Middle East. Export abattoirs reported that currently, they are meeting only about half of the purchase
orders, indicating huge gaps in the quantity demand of shoat meat and quantity supplied at the current prices. Export abattoirs complain that the current supply of shoats from producers is much below their demand, and as a result they are forced to operate at below 50% of their plant capacity and are also unable to fully meet the purchase orders from their client importers. Furthermore, they also complain about the quality of animals currently supplied by producers. In sum, there seems to be a shortage in the quantity and quality of animals supplied by the markets. This situation clearly indicates the inefficiency of the market clearing prices(equilibrium prices). The field observations also indicated that there are institutional arrangements through Ethiopian Meat Producers and
Figure 11. Trends in the volume of export of different meat types.
Figure 12. Trends in the export prices of the different meat types.

42
5. MAJOR FINDINGS
Exporters Associations (EMPEA) to fix purchase prices. Even though some abattoirs are openly rejecting such collusive acts, there is also collective pressure against those abattoirs that are trying to compete on price. In effect, prices are more or less fixed and uniform in the current markets. In some rare cases, some abattoirs pay a little higher price than the agreed fixed price only to take the trader away from its client-abattoir. The implication is that the marginal prices are not likely to trickle down to the producers. The current supply problem will continue to be an undesirable fact of the local markets so long as abattoirs continue to pay uniform and fixed prices regardless of subtle differences in the quality of animals. There is nothing in the current local markets that incentivizes producers to improve the quality and quantity of the sheep and goat supply.
Closer examination of the share of the different meat types in the total export earnings of meat shows that about 90% of the total meat export earnings comes from the export of goat meat (see Figure 13). This higher growth rate, coupled with the dominance of goat meat in the overall earnings from meat exports, means goat meat can be considered the single most important source of earnings from the export of meat.
However, dependence on such a single product is not generally desirable for the stability of export earnings. The stability also depends on the extent of value additions made to the product relative to other meat categories and the diversity of its export destinations. With regard to the value additions, there is no meaningful value addition except the process of slaughtering. Instead, the goats,
Figure 13. Share of the different animal meats in the total value of meat exports.
Figure 14. Total value of exports meat from 2007 to 2016 by major destination countries.
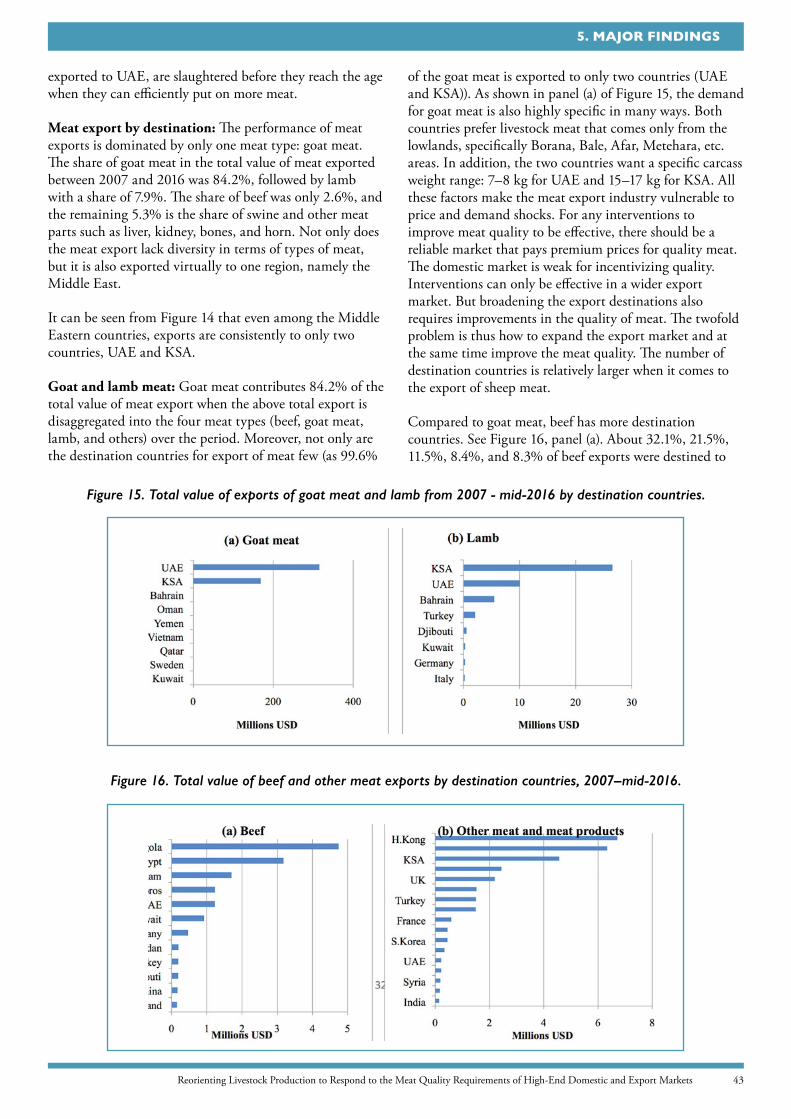
43Reorienting Livestock Production to Respond to the Meat Quality Requirements of High-End Domestic and Export Markets
5. MAJOR FINDINGS
exported to UAE, are slaughtered before they reach the age when they can efficiently put on more meat.
Meat export by destination: The performance of meat exports is dominated by only one meat type: goat meat. The share of goat meat in the total value of meat exported between 2007 and 2016 was 84.2%, followed by lamb with a share of 7.9%. The share of beef was only 2.6%, and the remaining 5.3% is the share of swine and other meat parts such as liver, kidney, bones, and horn. Not only does the meat export lack diversity in terms of types of meat, but it is also exported virtually to one region, namely the Middle East.
It can be seen from Figure 14 that even among the Middle Eastern countries, exports are consistently to only two countries, UAE and KSA.
Goat and lamb meat: Goat meat contributes 84.2% of the total value of meat export when the above total export is disaggregated into the four meat types (beef, goat meat, lamb, and others) over the period. Moreover, not only are the destination countries for export of meat few (as 99.6%
of the goat meat is exported to only two countries (UAE and KSA)). As shown in panel (a) of Figure 15, the demand for goat meat is also highly specific in many ways. Both countries prefer livestock meat that comes only from the lowlands, specifically Borana, Bale, Afar, Metehara, etc. areas. In addition, the two countries want a specific carcass weight range: 7–8 kg for UAE and 15–17 kg for KSA. All these factors make the meat export industry vulnerable to price and demand shocks. For any interventions to improve meat quality to be effective, there should be a reliable market that pays premium prices for quality meat. The domestic market is weak for incentivizing quality. Interventions can only be effective in a wider export market. But broadening the export destinations also requires improvements in the quality of meat. The twofold problem is thus how to expand the export market and at the same time improve the meat quality. The number of destination countries is relatively larger when it comes to the export of sheep meat.
Compared to goat meat, beef has more destination countries. See Figure 16, panel (a). About 32.1%, 21.5%, 11.5%, 8.4%, and 8.3% of beef exports were destined to
Figure 16. Total value of beef and other meat exports by destination countries, 2007–mid-2016.
Figure 15. Total value of exports of goat meat and lamb from 2007 - mid-2016 by destination countries.

44
5. MAJOR FINDINGS
Angola, Egypt, Vietnam, Comoros, and UAE respectively. The remaining 18.1% of the total beef was exported to 20 other countries over these years. On the other hand, the export of camel meat has many destinations. But the export of camel meat contributes only 0.05% of total meat exports. Export of camel meat seems to be characterized by opportunistic trade.
Export of live animals: Export of live animal plays an important role in the livestock export market. A large share of the export earnings comes from the export of live animals. It contributed about 43.4% of the total livestock export earnings between the years 2007 and 2016, followed by the export of leather and leather products, and meat and meat products with shares of 34.5% and 20.6% respectively.
As shown in Figure 17, the export of live cattle was the dominant source of live animal export earnings, followed by camel, goat, and sheep. With regard to the trend, there has been considerable growth, especially in the level of export earnings from live animals. Noting the data for 2016 cover only seven months of data, there were obvious declines in the export earnings since 2014.
Further examination of the trends in the prices can show the prospects of the sector. Figure 18 shows the average price per kg of exports of animals in USD. The trend shows a steady decline in the unit value of all the four types of live animal exports. The prices of cattle, goat, sheep, and camel have been declining at average annual rates of 4.9%, 7.8%, 8.9%, and 8.4% respectively. The prices of cattle meat had a similar trend, whereas the trends were in opposite directions in the cases of the price
Figure 17. Trends in the value of live animal exports, 2007–2016.
Figure 18. Trends in the price per kg of exports of live animals (2007–2016).

45Reorienting Livestock Production to Respond to the Meat Quality Requirements of High-End Domestic and Export Markets
5. MAJOR FINDINGS
of goat and sheep meats. Export of live animals is generally costly for the country, as the potential gains that could be had from exports of standardized, branded, processed, packed, labeled, etc. meat products could be many times greater than the current earnings from the exports of live animals. Thus, the current exports of live animals are being made at the costs of huge foregone export earnings that could be made from value additions. This, coupled with the declining trends in the prices of live animals, puts the prospects of the sector under question. For that matter, the effectiveness of the improved production models suggested here also depends on the efficiency of the export markets in incentivizing meat quality improvements.
Compared to meat, the export of live animals had wider destinations. Yet the destinations were limited in that only 11 countries account for 99% of the total value of live animal exported between 2007 and 2016 (see Figure 19). Unlike the exports of other meat types, the major destinations were neighboring African countries, followed by Middle East countries.
As shown in Figure 20, panels (a, b), the number of destination countries for live animal exports is relatively larger than the number of destination countries for meat exports.
Figure 19. Total value of live animal exports by destination countries, 2007–mid-2016.
Figure 20. Total value of live goat and sheep exports by destination countries, 2007–2016.

46
5. MAJOR FINDINGS
This is an important indication of the performances of the livestock export markets. Compared to meat exports, the export of live animals involves a greater transaction, transportation, feed and handling costs, and risk costs, etc. The fact that the export of live animals has a larger share than the export of meat indicates the inefficiency of the export markets. When institutions of markets are so weak to ensure credible commitments, limit opportunistic actions, and reduce information problems, agents attempt to choose a transaction arrangement that minimizes the costs that arise from these transaction problems. For instance, if buyers believe that there are no credible institutions that ensure that the meat comes from the desired animal and is processed properly, they cannot have confidence in the quality of meat. The problem is, once the skin is taken off from the animal, it is relatively difficult to know from what type of animal the meat comes from. It is due to this transaction problem, which mainly arises from information asymmetry, that importing countries prefer to buy the live animal and bear the subsequent high additional costs.
Improving the market institutions and transportation facilities will enable the country to capture the various benefits associated with value-adding activities such as grading, standardization, processing, packaging, etc. These activities not only increase the export earnings by increasing price and volume of export, but they also reduce the vulnerability of the sector to price and other market shocks. Value addition also improves the bargaining power of exporters by widening the market outlets. More importantly, it improves the capacity of the domestic market to incentivize quality. Unless the domestic markets incentivize producers for the resources they expend to improve qualities of livestock products, technological interventions to improve qualities in the sector will not be effective.
5.5. Characterization of the production environments currently and/or potentially supplying the major domestic and export meat and live animal markets
The production environments of the animals that were identified during the prioritization exercise based on the importance of supply sources (traditional and potential) were assessed. This was done through a review of secondary information and field assessments. The field assessment covered the following areas:
• East Wollega, Horro Guduru Zones of West Oromia—Horro sheep and Horro cattle;
• Awi Zone—Washera sheep;
• Bahir Dar Zuria and West Gojam Zones—Fogera cattle and Washera sheep;
• Kafa Zone, Bonga area—Bonga sheep;
• Borana Zone—Borana cattle, Somali goats (long-eared/short-eared), Blackhead Somali sheep—representing the pastoral production system;
• East Shoa Zone—commercial fattening for export.
The results of the assessment were as indicated hereunder.
5.5.1. Characterization of the pastoral and agro-pastoral production system The pastoral/agro-pastoral production system covers a very large area of the country, covering most parts of Somali Region, Afar Region, Southern Oromia, southwestern parts of Southern Nations, Nationalities, and Peoples’ Region (SNNPR), Gambella, and the western lowlands. This system can broadly be divided into two categories: the pastoral and agro-pastoral production systems.
• The pastoral production system:
o Agro-ecological setting: Pastoral systems are generally associated with agro-ecological zones (AEZ) that are too dry to sustain crop production, and livestock are maintained as a principal activity. Mode of production is based on the high mobility of livestock in search of grazing and water. Under Ethiopian conditions, pastoral systems are found at altitudes below 1,500 meters above sea level (MASL) and less than 500 millimeters (mm) annual precipitation.
o Production objective: Fifty percent of household revenue comes from livestock, or more than 20% of household food energy is derived directly from livestock or livestock-related activities. Pastoralists depend on their livestock not only for their income but also for their survival. Consequently, risk avoidance is very important to the pastoralist. Livestock management is, therefore, directed toward risk minimization, which tends to reduce productivity.
o Livestock species/breeds kept: Livestock species consist of camels, cattle, sheep, goats, and donkeys. In recent years, pastoralists have shown an increasing shift towards keeping larger numbers of goats and sheep. Milk and meat are the two main outputs. Goats gain

47Reorienting Livestock Production to Respond to the Meat Quality Requirements of High-End Domestic and Export Markets
5. MAJOR FINDINGS
more importance as suppliers of milk to the household in drought years.
• Agro-pastoral production system:
o Producers under this system have a permanent residence, and their movement is limited in terms of both distance and duration. The system is characterized by a high degree of dependence on milk and meat production. Some crop agriculture is practiced around the permanent homestead. This system is a low input/low output system. The system is usually practiced below 1,500 MASL but with higher rainfall to support short-season crops compared to the pastoral system.
The Borana pastoral/agro-pastoral production system: The Borana area is by far the most important area that supplies livestock for the export markets. Therefore, the production system in the Borana area is described in more detail as a representative for this production system.
• The physical environment: The Borana plateau occupies approximately 5,000 km2 and ranges in elevation from 1,000–1,500 meters, with peaks of up to 2,000 MASL. The area has a bimodal rainfall regimen, with mean annual rainfall ranging from 400 mm in the southeast to 600 mm in the north. The actual length of the rainy season is getting shorter through time, and the area is prone to more frequent droughts. Droughts generally occur once every 3–5 years. The population is engaged in livestock production, primarily cattle (Borana breed) along with goats and sheep.
• Production objectives and types of livestock kept: The Borana pastoral system of southern Ethiopia is traditionally based on cattle husbandry for survival and income generation. Numerically, cattle are the most important species followed by goats, camels, and sheep (Tolera and Abebe 2007). The productivity of animals is generally low. The average cattle herd size owned by the pastoral households is about 13 heads of cattle, more than three times the number of cattle owned by the farm households in the highlands (Asfaw and Jabbar 2007).
• Contribution to the supply of animals to the HED and export markets: The contribution of the Borana area in supplying different market destinations by species is as outlined hereunder.
o Meat for export:
3 Cattle are purchased from this area and transported mainly to the Adama area for fattening. They are then slaughtered and exported. There is interest in enhancing exports, even though the current export number is small. Some export abattoirs have started to export frozen beef cuts.
3 Goats are purchased from this area, slaughtered, and exported as chilled carcasses.
3 Sheep: Blackhead Somali sheep are purchased from this area, slaughtered, and exported as chilled carcasses.
o Meat for HED market:
3 Cattle: This source contributes to the supply of limited cuts to the HED markets. This market is also supplied by animals coming from the highland areas.
3 Sheep: The very limited contribution to the supply of sheep to this market as mutton is largely supplied from the highlands.
3 Goat: Survey of the HED market showed that goat meat is not used by this market.
o Live animal exports:
3 Cattle are purchased from this area, fattened, and exported live.
3 Sheep are purchased from this area, conditioned for a short duration or directly exported live, especially during the holiday period, mainly Eid Al Adha (Arefa);
3 Goats: Live export of goats is not important.
• The major available feed resources: The main feed resources are natural pastures composed mainly of grasses, forbs, and browses such as shrubs, tree leaves, and pods. Crop residues, particularly maize stover, are also used as animal feed in the agro-pastoral areas. Sorghum stover, haricot bean, and tef straws are also used to a limited extent in areas where these crops are produced. There is a marked seasonal variation in availability and quality of feed resources due to seasonal variation in rainfall distribution. When the dry season is prolonged or during drought years, animals become unproductive, lose condition and market value, and eventually die due to inadequate feed and water supply and the very low nutritive value of the available feed. There

48
5. MAJOR FINDINGS
is a tradition of reserving or keeping a certain portion of the grassland aside for use as standing hay (kaloo) during the dry season. Kaloo is usually reserved for calves, and lactating and weak animals. Cutting excess grass during the rainy season and making hay for dry season use is not common practice. Local salt licks are widely used as a mineral supplement. The mineral supplements are usually provided during the rainy season when there is better forage and water supply. However, the mineral supplements obtained from the local sources are deficient in phosphorus and copper.
• Water supply: The area is characterized by the low availability of surface water. Availability is also very variable from place to place. The sources of water include wells (elas), ponds, and boreholes. During the dry season and in drought years, pastoralists are forced to travel long distances in search of water, and animals are also watered at longer intervals. Accordingly, cattle and sheep are watered at an interval of 3 or 4 days, goats 5 to 6 days, and camels up to 10 to 15 days.
• Livestock management: The Borana generally split their herds into two groups commonly called the fora and wara herds. The fora herd is basically the dry cows, bulls, oxen, and heifers, while the wara herd constitutes the milking cows and calves. For most of the year, wara herds graze close to the encampments, and fora herds graze farther away, where resources are more plentiful. Lactating cows, calves, and weak animals have priority over other classes of animals in the use of standing hay reserved for the dry season (kaloo). Herders move livestock between the wara and fora herd management systems depending upon the condition of the grazing lands and family milk needs. Large numbers of animals are sent to the fora herd during the dry season when forage resources become scarce in the wara herd grazing lands.
• Animal health: Diseases such as foot and mouth disease (FMD), anthrax, blackleg, contagious bovine pleuropneumonia (CBPP), contagious caprine pleuropneumonia (CCPP), and trypanosomiasis are reported to be occasional health problems. External parasites, particularly ticks and mange mites, are also a significant health problem. About 25% of the outflows from the cattle herd is mortality (Asfaw and Jabbar 2007). This shows the potential of substantially increasing sales just by reducing cattle mortality.
• Marketing of livestock: The sale of livestock and livestock products is the main source of cash
income. Small ruminants (sheep and goats) are used as immediate sources of cash income. Cattle and camels are sold when there is a need for a larger amount of cash. Camels fetch a higher price than any other animal. The price of animals is influenced by the size and condition of the animals, the season of the year, and the distance from the main marketing centers. Animal prices are generally higher during the rainy season and fall during the dry season. Animals lose body condition during the dry season due to the shortage of feed. The pastoralists are also desperate to sell their animals before further loss of condition and death and to buy grain for family consumption.
• Herd/flock outflows and offtake rates: It has been observed that pastoral households participate in livestock markets but in relatively small volumes and at varying rates over time. The average annual gross commercial offtake rate is about 11% over a three-year period (Asfaw and Jabbar 2007). Possible reasons limiting the market offtake from the pastoral areas could be the lack of investment opportunities in these areas, making live animal herd-building the best investment alternative. It is a common observation that most of the producers have limited demand for cash income, and because of this they have limited supply response to prices. Sheep and goat deaths account for about 44% and 52% of sheep and goat outflows respectively. Sheep and goat sales accounted for about 22% and 34% of sheep and goat outflows respectively. The high death rates of sheep and goats indicate the potential of increasing sheep and goat sales just by reducing sheep and goats’ mortality. The average annual gross commercial sheep and goat offtake rates were found to be 10% and 11% respectively.
5.5.2. The mixed crop-livestock production system (MCL-PS)General description: The mixed crop-livestock production system (MCL-PS) is generally found in highland areas that range between an altitude of 1,500 and 3,000 MASL. The area receives relatively high rainfall and has a moderate temperature suitable for crop production. The dominant system of livestock production is a low input/low output subsistence system. Cattle, sheep, and goats are raised in the MCL systems. The integration of crops and livestock is high in most areas except the perennial crop-livestock system (coffee-growing areas) in southern Ethiopia, where animals are of relatively lower importance.
Livestock plays an important role in food security and food self-sufficiency. Livestock are the main cash sources for the purchase of agricultural inputs in the grain-based system.
49Reorienting Livestock Production to Respond to the Meat Quality Requirements of High-End Domestic and Export Markets
5. MAJOR FINDINGS
Livestock are used as a savings and insurance mechanism. Cattle are the dominant livestock species and are kept mainly for draft power in crop production. Sheep and goats are kept in order to meet small and immediate cash needs.
Land-holding per household is 2–3 hectares (ha), with some areas having much smaller holdings of less than 2 ha. The major feed resources are natural pasture and crop residues. In some areas, one-fifth to one-third of the holding is used for grazing. In most of the areas, however, livestock generally depend on grazing communal land that is dwindling in size and productivity. Livestock in this system experience year-round nutritional stress due to the ever-increasing cultivated land area at the expense of grazing lands. This results in very high grazing pressure and a subsequent shortage of feed.
Major available feed resources and feeding systems in the MCL system: Feed resources available in the MCL production system by cropping system include the following:
• Coffee–enset system: Natural grazing, hay, enset byproducts, sugarcane tops/leaves, root crop leaves, local brewery byproducts, root crop leaves;
• Coffee–crop system: Natural grazing, hay, cereal crop residues, oilseed cakes, enset byproducts, sugarcane tops/leaves, root crop leaves, local brewery byproducts, molasses, milling byproducts;
• Crop production system: Natural grazing, hay, cereal crop residues, pulse crop residues, oilseed cakes, sugarcane tops/leaves, local brewery byproducts, molasses, milling byproducts.
The feed resources in the locations identified as current and/or potential sources of meat and live animal supply and physically assessed include the following:
• West Gojam and Awi Zones: Grazing, crop residue, hay, wheat bran, rice bran, cracked maize, noug seed cake, grass pea bran, lentil bran, bean bran, chickpea bran, pea bran, local brewery and liquor byproducts (atella), Sesbania sesban, tree lucerne, salt;
• Bako: Grazing, crop residue, wheat, barley, maize, noug cake, tela atella, salt;
• Horro Gudru: Grazing, hay, cooked pumpkin, cooked bean, wheat, barley, noug seed cake, bean bran, pea bran, Sesbania sesban, araki atella, salt;
• Keffa Zone: Grazing, hay, crop residue, wheat and barley bran, banana byproducts, enset, cracked
maize and maize screenings, food left over, coffee atella, local brewery and liquor byproducts (atella), salt.
Feeding system: In almost all instances, the feeding of the different available feeds is not done in the form of a balanced ration. It is evident that rations must be formulated and modified based on the change in the type of feed used, and updated regularly to avoid underfeeding that can cause impaired performance of animals, or overfeeding that would increase feed cost.
Traditional livestock conditioning/fattening practices in the MCL-PS—the general scenario: There are a variety of traditional cattle and small ruminant fattening practices in different parts of the country. These are typically carried out in the backyard using feed resources produced on the farm.
• Cattle conditioning/fattening practice: The general feature of the widely practiced cattle fattening/conditioning system is the practice by rural farmers whereby 1–2 mature oxen that have been used for traction are fattened using locally available feed resources and sold. There are also some larger market-oriented operations conducted at different levels of technology use and target markets. The different forms of cattle fattening conducted are described hereunder by focusing on some cases thought to be representative of the diverse practices and areas that are currently supplying and will potentially supply the target in the future.
o Cattle conditioning/fattening in the Wolayta area: The Wolayta system is a long tradition of backyard fattening of oxen by farmers in the Wolayta area using locally available feeds. One or two oxen are fed for about 3–4 months and sold during holidays such as Meskel and Christmas. The main feed resources used are crop residues, cut-and-carry grass, and various agricultural byproducts such as sweet potato vines/tubers, thinning or whole crop maize, enset supplemented with boiled maize and haricot bean, and household wastes such as atella and coffee residues.
o Urban/peri-urban fattening in Arsi Negelle area: Backyard fattening in Arsi Negelle area is based on araki atella (a residue from home distilling of traditional liquor, araki) and wheat straw supplemented with wheat bran and linseed or any other oilseed cake.
o Smallholder fattening practice in the Adama area: The beef cattle used for

50
5. MAJOR FINDINGS
fattening by the smallholder farmers are mainly locally culled animals after the cattle have been used for traction. The average number of animals of all types (total cattle herd) kept by a smallholder farmer at a given time is about five animals (with a range of one to eight). Out of this, an average farmer owns two oxen. The fattening exercise is undertaken mostly when these oxen are retired from farm work and have to be replaced by younger ones. Crop residues and agro-industrial byproducts are used for fattening.
o The Hararghe traditional cattle conditioning/fattening practice: The Hararghe system is characterized by the fattening of young oxen through a cut-and-carry feeding system of individually tethered animals. Producers buy feeder cattle, use them for plowing for about a year, and then fatten them. Farmers generally buy feeder cattle from the lowlands. The Hararghe system is a good adaptive mechanism for the ever-dwindling size of grazing lands as a result of the expansion of cropping. The feeding is based on thinning and leaf stripping of maize and sorghum, grasses, and weeds from croplands, and on other agricultural byproducts such as sweet potato vines. Thinning is done using the high seed rate for maize and sorghum planting. Weak and sterile plants are thinned and fed to fattening oxen. The thinning is done sparingly in a way that supports the oxen as a supplement for as long as possible but without seriously compromising grain production. Farmers also feed chopped maize and sorghum stover that has been wetted using salted water. Haricot bean leaf is wilted before feeding. Additional supplementary feeds such as wheat bran, oil cakes, and cracked maize are sometimes purchased and supplemented by mixing with chopped tef straw to increase the palatability of the straw. Cooked or soaked fenugreek seed with sugar is fed by many at the end (about last two weeks before marketing) of the fattening period. This practice is believed to make the skin shiny and more attractive to buyers and thus fetch better prices. The cattle are fed intensively, including in the evenings.
• Sheep conditioning/fattening practices: Sheep fattening is traditionally conducted all over the country, with diverse objectives. The management varies widely in the type and level of inputs (feed, breed, labor, and housing) used, feeding systems, the source of fattening sheep, number of fattening
cycles per year, and the number of sheep fattened per cycle. The length of the fattening period varies widely (from as little as three months under more intensive systems to up to one year based on an extensive/grazing based system). Sheep fattening activities in Ethiopia can broadly be classified into the following broad categories (Animut and Wamatu 2014): rural smallholder farmer fattening; peri-urban/urban small-scale sheep fattening; cooperative sheep fattening; and large-scale sheep fattening. There is a gradual shift in recent years from the less intensive/less market-oriented systems towards the higher levels of commercially oriented fattening using better management. The intensification, though gradual, is driven largely by market factors and the relatively better support for small ruminant fattening through safety net/youth and women job creation efforts. There is no standard weight and age at which sheep go into fattening. It was noted during the current assessment that Washera, Horro, and Bonga sheep can enter fattening right after weaning (4 to 5 months of age). Sheep at yearling age are preferred. Much older animals may also be fattened. Table 9 below summarizes the sheep conditioning/fattening operations across the country.
Traditional conditioning/fattening practices in the closely assessed selected sites: A quick assessment of the prevailing cattle and sheep conditioning/fattening practices of the traditional and potential sources of animals for HED and export markets, including areas that are habitat to well- performing breeds that can potentially meet the high-quality requirements of the target markets, was done through review of secondary data/information and on-site visits.
• Cattle fattening/conditioning practices—West Gojam Zone-Yilmana Densa woreda:
o Agro-ecology and farming system: Yilmana Densa woreda is located near Bahir Dar, the capital of Amhara National Regional State. The area has an average altitude of 2,300 MASL and receives a unimodal mean annual rainfall of about 1,270 mm that occurs between May and October.
o Cattle fattening by smallholder farmers: Smallholder farmers commonly fatten mature castrated oxen, generally 5 to 7 years old. Fattening is usually for short durations of three months. Ordinarily, farmers fatten their draught oxen so that they can fetch a better price when sold. Some, on the other hand, purchase oxen specifically for fattening and

51Reorienting Livestock Production to Respond to the Meat Quality Requirements of High-End Domestic and Export Markets
5. MAJOR FINDINGS
sale. Animals are purchased based on the large skeletal frames and body conformation.
The most common roughage sources used are crop residues, mainly tef/wheat straw and grass hay when and if available. Pulse residues such as bean and grass pea straw are also fed when available. Atella is also commonly used. Concentrated sources like noug cake and wheat bran/shorts are fed. Farmers such as those in the Mecha woreda, where cultivated fodder production is common, also feed fresh-cut forage and hay. Cattle are usually fed concentrates on simple wooden feed troughs and feeders made of old tires.
Roughage is generally fed using hay racks. Feed wastage from these feeders is quite common. Most farmers feed their cattle twice a day, and the ration usually consist of a set amount of concentrate, plus ad lib forage. Fattening oxen were generally grazed separately or with other cattle for the most part of the fattening period.
The roughage feeds are generally produced on the farm. Some farmers construct rudimentary shelters for their fattening cattle, while others simply feed in existing pens and corrals, and in the open. In all instances, the short supply of concentrate feeds, and their expensive price even
Characteristic Smallholder Small-scale Cooperative Large-scale rural farmers peri-urban commercial and urban
Production objective Sideline activity Sideline activity Main activity Main activity
Age of the system Old Old Recent/emerging Recent/emerging
Distribution Throughout the Most areas Few but growing Very few rural areas
Major feeding system Mainly grazing-based Confinement Confinement Confinement
Supplement type Cooked cereals and Mainly milling and Mainly milling Mainly milling pulses commonly used agro-industrial and agro-industrial and agro-industrial byproducts byproducts byproducts
Access to agro- Limited or nonexistent Good Good Betterindustrial supplements
Labor utilization Family labor Family labor Co-op members Hired labor
No. of fattening cycles 2–3, mainly 2 2–3, mainly 2 3–4, mainly 3 3–4, mainly 3
No. of sheep/cycle Mainly 1–6 (up to 12 Mainly 1–6 (25–60 15–65 100 (possible up encountered) encountered) to 500)
Source of sheep Mainly from own flock Mainly purchased Purchased Purchased
Breed choice Based on available Based on available Based on available Based on own breed breed breed choice
Housing Mainly partitioned Mainly separate Separate housing Separate and good house housing housing facility
Source: Animut and Wamatu 2014
Table 9. Characterization of sheep fattening systems in Ethiopia
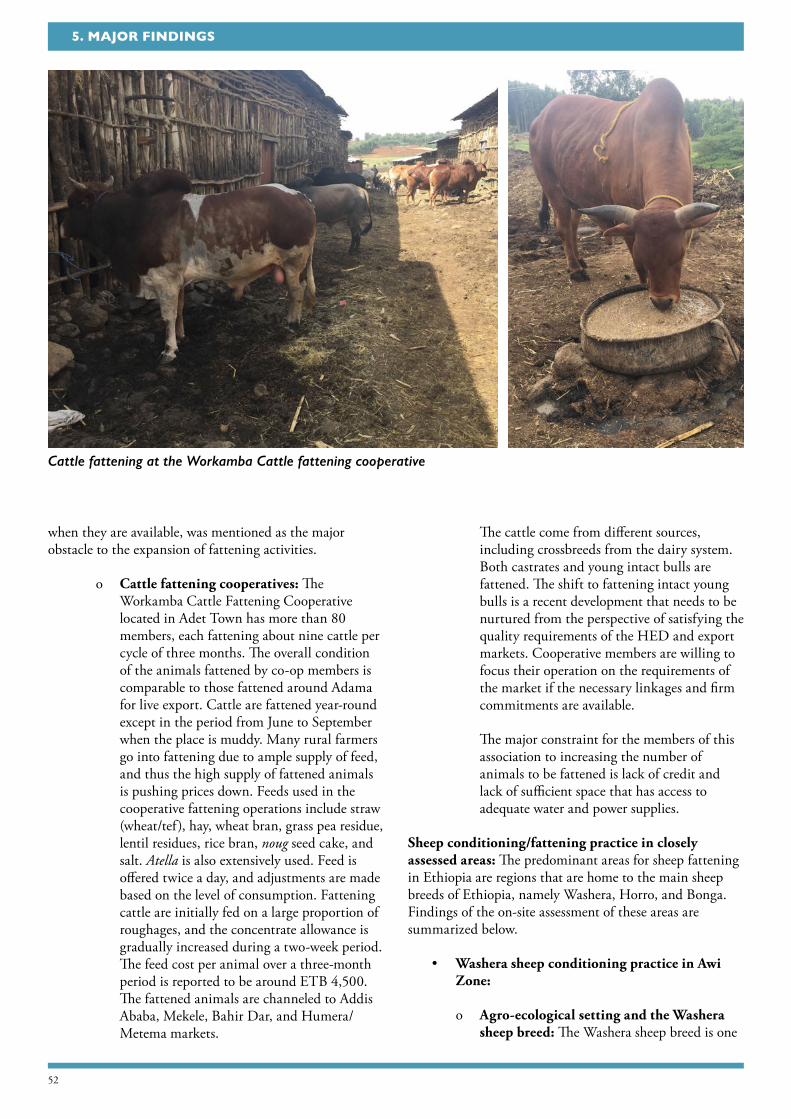
52
5. MAJOR FINDINGS
when they are available, was mentioned as the major obstacle to the expansion of fattening activities.
o Cattle fattening cooperatives: The Workamba Cattle Fattening Cooperative located in Adet Town has more than 80 members, each fattening about nine cattle per cycle of three months. The overall condition of the animals fattened by co-op members is comparable to those fattened around Adama for live export. Cattle are fattened year-round except in the period from June to September when the place is muddy. Many rural farmers go into fattening due to ample supply of feed, and thus the high supply of fattened animals is pushing prices down. Feeds used in the cooperative fattening operations include straw (wheat/tef), hay, wheat bran, grass pea residue, lentil residues, rice bran, noug seed cake, and salt. Atella is also extensively used. Feed is offered twice a day, and adjustments are made based on the level of consumption. Fattening cattle are initially fed on a large proportion of roughages, and the concentrate allowance is gradually increased during a two-week period. The feed cost per animal over a three-month period is reported to be around ETB 4,500. The fattened animals are channeled to Addis Ababa, Mekele, Bahir Dar, and Humera/Metema markets.
The cattle come from different sources, including crossbreeds from the dairy system. Both castrates and young intact bulls are fattened. The shift to fattening intact young bulls is a recent development that needs to be nurtured from the perspective of satisfying the quality requirements of the HED and export markets. Cooperative members are willing to focus their operation on the requirements of the market if the necessary linkages and firm commitments are available.
The major constraint for the members of this association to increasing the number of animals to be fattened is lack of credit and lack of sufficient space that has access to adequate water and power supplies.
Sheep conditioning/fattening practice in closely assessed areas: The predominant areas for sheep fattening in Ethiopia are regions that are home to the main sheep breeds of Ethiopia, namely Washera, Horro, and Bonga. Findings of the on-site assessment of these areas are summarized below.
• Washera sheep conditioning practice in Awi Zone:
o Agro-ecological setting and the Washera sheep breed: The Washera sheep breed is one
Cattle fattening at the Workamba Cattle fattening cooperative

53Reorienting Livestock Production to Respond to the Meat Quality Requirements of High-End Domestic and Export Markets
5. MAJOR FINDINGS
of the most productive sheep breeds in the country, with a relatively large body size and fast growth rate. The breed inhabits the wet and warm mid-highlands (1,600–2,000 MASL) of the Amhara and Benishangul Gumuz Regional States in the northwestern Ethiopian highlands. Washera sheep are an important source of livelihoods for the local farmers, with a potential to support the national economy. The yearling weight of Washera sheep can reach 24 kg under the traditional smallholder system of management.
o Production objective and mating system: The major sheep production objective is to generate income from the sale of live sheep. The mating system is predominantly uncontrolled. Most sheep owners herd their sheep flocks mixed with other livestock species and neighboring sheep flocks.
o Fattening of Washera sheep: Most of the woredas in Awi Zone are known for both rural and urban sheep fattening. Many farmers fatten 30–40 heads of sheep at a time. There are farmers that fatten up to 300 sheep. Several efforts are underway to improve the supply of Washera sheep, mainly by clustering the zone into three rural transformation
centers (RTCs): Injibara, Dangila, and Gunga. Farmers and unemployed youth are encouraged to form groups so that each group fattens a minimum of 500 heads of Washera sheep. This is a good initiative that can serve as a model if properly implemented and scaled up to alleviate the prevailing constraints of supplying quality meat animals. Agita Lekoma woreda was visited to assess the Washera sheep conditioning/fattening practice more closely. The following were the observations made and information obtained.
o Number of sheep fattened and targeting: The majority of the fatteners fatten 15 or more heads of sheep at a time, often targeting holidays like New Year and Epiphany. Sheep fatteners are willing and ready to fatten sheep throughout the year if market linkage is guaranteed.
o Selection criteria for feeder sheep: The attributes considered to buy feeder sheep are color (black and white colors are not preferred), young (about 7–9 months of age), an estimated weight of about 15–17 kg, and good body condition indicating relative health. Uniformity in size is also taken into consideration.
Young Washera sheep just purchased for fattening

54
5. MAJOR FINDINGS
o Fattening period: Fattening is generally for three months. This means the sheep can be marketed at an age of 10–12 months.
o Feed resources: The major feed resources available in the area are natural pasture grazing, stubble grazing, crop residues, and hay. Feed resources vary widely in quality and quantity across seasons. The predominant traditional fattening practice in the area is to castrate lambs and supplement them with grass pea (Lathyrus sativus) and maize grain.
o Constraints: The major impediment to expanding the fattening practice is poor market linkage. External parasites, mainly mange, are the major challenge for Washera sheep production. It was noted that spraying is currently going on to combat this problem.
• The Bonga production system/conditioning practice:
o Agro-ecological setting and the Bonga sheep breed: Bonga sheep are native to Kaffa Zone and its surroundings (Southern Ethiopia). The area has an altitude ranging from 1,000 to 3,400 meters and temperature of 12ºC to 24ºC. Sheep, cattle, and goats are the main livestock types in the area, with sheep being the most dominant. Average flock size is 7.5 (4–23); average landholding is about 1.9 ha (1.2 ha allocated for crop production and the remaining 0.7 ha allocated for grazing).
Bonga sheep have relatively high body weight at maturity, and the ewes are moderately prolific. The skeletal frame of Bonga sheep is larger than other Ethiopian sheep breeds. They generally tolerate many of the locally prevalent diseases (Edea 2008; Haile et al. 2013).
The overall birth, weaning, and 6-month body weights (across the sexes) of Bonga sheep are 3.6 kg, 15.5 kg, and 22.2 kg respectively. The average pre- and post-weaning daily weight gain of the lambs were 129.1 g and 69.3 g/day respectively (Metshafe 2015).
o Production objective: Multiple functions are important in low- and medium-input production environments. Production objectives in order of importance are to generate income/savings followed by meat for household consumption.
o Traditional selection criteria for breeding: Animals with long and fat tails, large body size, those with no horns, prolificacy, and large pelvic width (for ewe lambs)
o Feed resources and grazing management: The different feed resources in the area are natural pasture, fallow land, crop residue, crop aftermath, and hay. Fallow grazing is the major feed resource during the rainy season when most of the farmland is covered with crops. Crop aftermath, fallow grazing, and crop residues serve as the main feed resources during the dry season. Farmers supplement feeds such as grains (boiled bean, pea, and maize) as available, crop-residues, tree leaves, local brewery byproducts, and common salt during periods of feed scarcity. Tethering is a common practice during the wet season. Water supply is generally not a problem.
o Fattening: Sheep fattening is a very common practice. A survey has indicated that about 90% of farmers practice opportunistic sheep fattening. Castration of animals with good body conformation (at any age) and older rams for fattening is common. Farmers generally fatten old rams and infertile ewes. Feeds used for fattening include crop residues, grain, household leftovers, and local brewery byproducts (atella and borde), faba bean (Vicia faba), pea (Pisum sativum), enset (Ensete ventricosum), fenugreek (Trigonella foenum-graecum) (as supplementary feed and traditional medicine), salt, and coffee byproducts. A separate shelter with bedding is usually provided. Feeding of available feeds is generally not done in a balanced manner, resulting in utilization of whatever feed is available in an efficient way.
o Diseases and mortality: Pasteurellosis, coenuruses, diarrhea, and lungworm, in that order, are mentioned as the most common diseases of sheep. Pneumonia is also an important ailment. There is an extremely high mortality of lambs of about 57% up to 6 months of age and about 26% total flock mortality.
o Sheep marketing: Farmers across the study sites sell their animals when financial problems force them to. They, however, prefer to sell their sheep at higher prices during holidays and festivals. Sale as a coping mechanism to feed shortages is very low. Sheep are primarily sold in the nearby markets
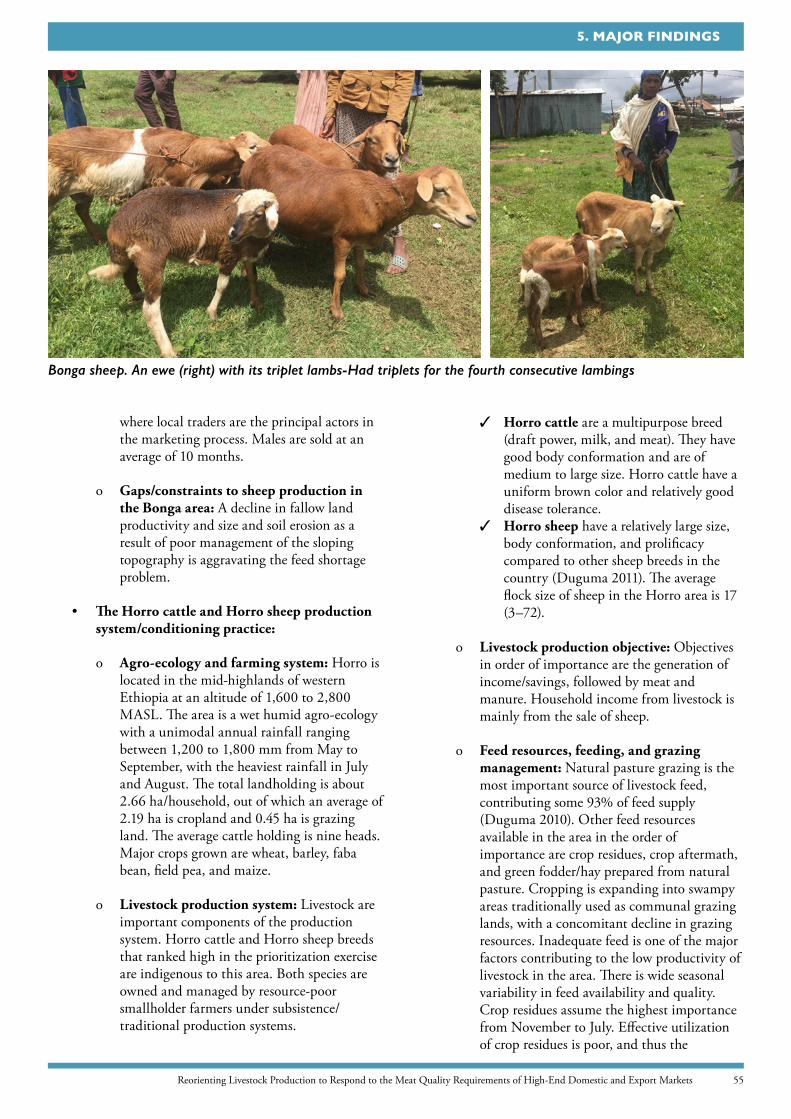
55Reorienting Livestock Production to Respond to the Meat Quality Requirements of High-End Domestic and Export Markets
5. MAJOR FINDINGS
where local traders are the principal actors in the marketing process. Males are sold at an average of 10 months.
o Gaps/constraints to sheep production in the Bonga area: A decline in fallow land productivity and size and soil erosion as a result of poor management of the sloping topography is aggravating the feed shortage problem.
• The Horro cattle and Horro sheep production system/conditioning practice:
o Agro-ecology and farming system: Horro is located in the mid-highlands of western Ethiopia at an altitude of 1,600 to 2,800 MASL. The area is a wet humid agro-ecology with a unimodal annual rainfall ranging between 1,200 to 1,800 mm from May to September, with the heaviest rainfall in July and August. The total landholding is about 2.66 ha/household, out of which an average of 2.19 ha is cropland and 0.45 ha is grazing land. The average cattle holding is nine heads. Major crops grown are wheat, barley, faba bean, field pea, and maize.
o Livestock production system: Livestock are important components of the production system. Horro cattle and Horro sheep breeds that ranked high in the prioritization exercise are indigenous to this area. Both species are owned and managed by resource-poor smallholder farmers under subsistence/traditional production systems.
3 Horro cattle are a multipurpose breed (draft power, milk, and meat). They have good body conformation and are of medium to large size. Horro cattle have a uniform brown color and relatively good disease tolerance.
3 Horro sheep have a relatively large size, body conformation, and prolificacy compared to other sheep breeds in the country (Duguma 2011). The average flock size of sheep in the Horro area is 17 (3–72).
o Livestock production objective: Objectives in order of importance are the generation of income/savings, followed by meat and manure. Household income from livestock is mainly from the sale of sheep.
o Feed resources, feeding, and grazing management: Natural pasture grazing is the most important source of livestock feed, contributing some 93% of feed supply (Duguma 2010). Other feed resources available in the area in the order of importance are crop residues, crop aftermath, and green fodder/hay prepared from natural pasture. Cropping is expanding into swampy areas traditionally used as communal grazing lands, with a concomitant decline in grazing resources. Inadequate feed is one of the major factors contributing to the low productivity of livestock in the area. There is wide seasonal variability in feed availability and quality. Crop residues assume the highest importance from November to July. Effective utilization of crop residues is poor, and thus the
Bonga sheep. An ewe (right) with its triplet lambs-Had triplets for the fourth consecutive lambings
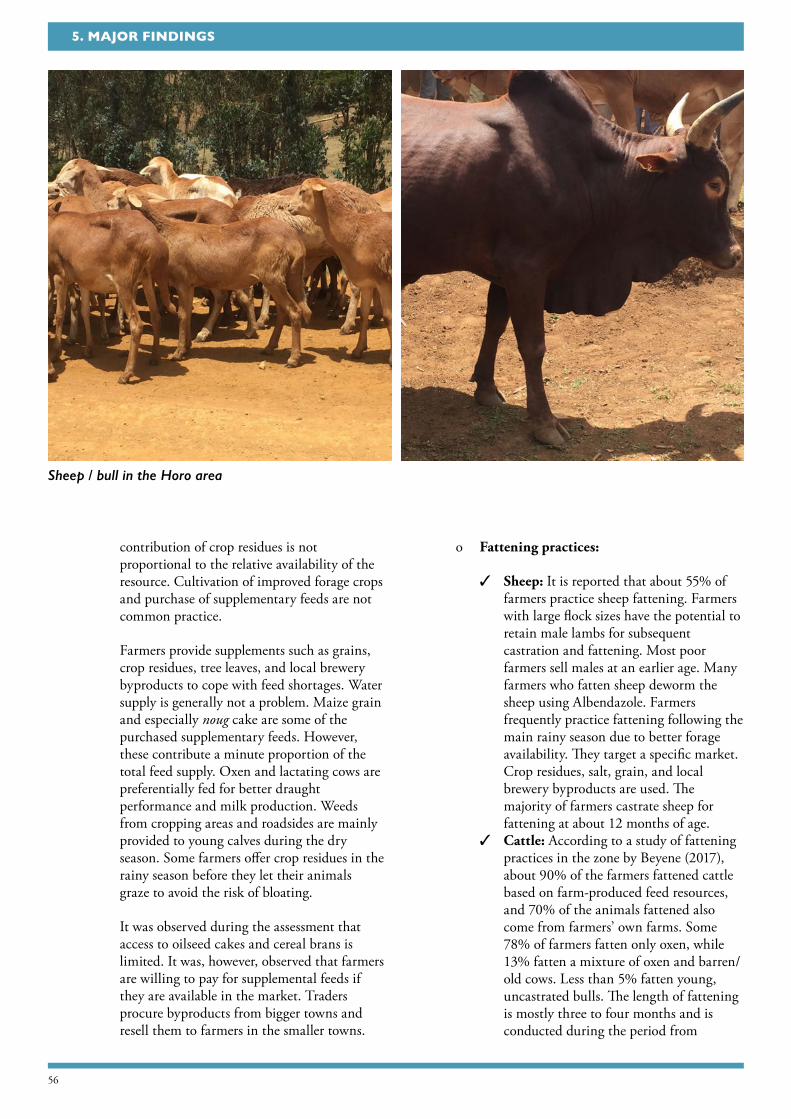
56
5. MAJOR FINDINGS
contribution of crop residues is not proportional to the relative availability of the resource. Cultivation of improved forage crops and purchase of supplementary feeds are not common practice.
Farmers provide supplements such as grains, crop residues, tree leaves, and local brewery byproducts to cope with feed shortages. Water supply is generally not a problem. Maize grain and especially noug cake are some of the purchased supplementary feeds. However, these contribute a minute proportion of the total feed supply. Oxen and lactating cows are preferentially fed for better draught performance and milk production. Weeds from cropping areas and roadsides are mainly provided to young calves during the dry season. Some farmers offer crop residues in the rainy season before they let their animals graze to avoid the risk of bloating.
It was observed during the assessment that access to oilseed cakes and cereal brans is limited. It was, however, observed that farmers are willing to pay for supplemental feeds if they are available in the market. Traders procure byproducts from bigger towns and resell them to farmers in the smaller towns.
o Fattening practices:
3 Sheep: It is reported that about 55% of farmers practice sheep fattening. Farmers with large flock sizes have the potential to retain male lambs for subsequent castration and fattening. Most poor farmers sell males at an earlier age. Many farmers who fatten sheep deworm the sheep using Albendazole. Farmers frequently practice fattening following the main rainy season due to better forage availability. They target a specific market. Crop residues, salt, grain, and local brewery byproducts are used. The majority of farmers castrate sheep for fattening at about 12 months of age.
3 Cattle: According to a study of fattening practices in the zone by Beyene (2017), about 90% of the farmers fattened cattle based on farm-produced feed resources, and 70% of the animals fattened also come from farmers’ own farms. Some 78% of farmers fatten only oxen, while 13% fatten a mixture of oxen and barren/old cows. Less than 5% fatten young, uncastrated bulls. The length of fattening is mostly three to four months and is conducted during the period from
Sheep / bull in the Horo area
57Reorienting Livestock Production to Respond to the Meat Quality Requirements of High-End Domestic and Export Markets
5. MAJOR FINDINGS
September to May. Stall feeding is practiced by about 70% of farmers. Almost all (98%) fattening cattle are fed separately from other cattle. Natural grass and crop residues are the main feeds used for cattle fattening. Sixty percent of farmers grow at least one type of improved forage (mainly Rhodes grass) and feed it to fattening cattle.
o Diseases and mortality: Lungworm, liver fluke (bovine fasciolosis), and coenuruses (azurit) were the first-, second-, and third-ranked sheep diseases. Pneumonia is also important. Diseases such as liver fluke are important because sheep often graze on swampy areas. There is an extremely high mortality of lambs of 47% up to 6 months of age and about 24% total flock mortality.
o Sheep marketing: Farmers generally sell sheep when financial problems force them to. However, they prefer to sell during holidays and festivals to benefit from higher prices. Sale as a coping mechanism for feed shortages is very low. Sheep are primarily sold in the nearby market where local traders are the principal actors in the marketing process. Males are sold at an average age of eight months.
5.5.3. Characterization of the commercial feedlot finishing practicesCurrently, the Borana rangelands supply most of the cattle that are conditioned/fattened in commercial feedlots in East Shoa Zone, mainly around Adama. The animals are largely exported live. Some are slaughtered in slaughterhouses around Modjo. Most of the small ruminant slaughter is of goats, while sheep are both for slaughter and live export. The following section characterizes the feedlot operations around Adama where most cattle coming from the Borana area are fattened for live export.
The Adama area feedlots
The following summarizes the characteristics of the fattening practices in the commercial feedlots.
• Number of livestock fattened per cycle: 88% (100–500 heads); 12% larger than 500 and up to 1,000–1,500 heads.
• Considerations in selection of animals for fattening: The breed type, physical appearance, and/or frame size, age, health, and initial price are the major considerations.
• Preferred livestock breeds/species: Clear preference for Borana cattle (81.25%), followed by Bale-Arsi cattle (10.42%). Borana cattle have a docile temperament, short horns, and efficiency as well as better carcass conformation, which are attributes needed to be a breed in demand for export.
• Age of animal purchased: The majority (94%) of cattle fattened are in the 4-to-6-year-old category.
• Other attributes of fattening cattle: Intact (uncastrated) bulls are fattened, as these are the types required by the export market due to religious considerations and because the export market demand is for lean meat.
• Preferences of livestock species in commercial feedlots: Ninety percent of feedlots consider cattle their first choice for commercial fattening. Next is small ruminants.
• Fattening cycles and duration: Almost all (88%) feedlots finish bulls for a three- to four-month period. A few (10%) keep feedlot cattle for up to six months. Most (63%) feedlots conduct three cycles of fattening per year.
• Effect of breed and sex of cattle on market demand: Preferences for the export market are primarily Borana cattle. Long-horned cattle breeds like the Afar were not required by the Arab importers. All breeds are acceptable for the domestic market.
• Value chain of livestock marketing in commercial feedlots: Pastoralists, followed by smallholder farmers, supply livestock to the feedlots.
• Livestock supply routes:
o Small local traders bring a few livestock from the farm gate (pastoralists and smallholder farmers) and then sell to a series of other intermediate actors in the chain.
o In rare cases, livestock marketing follows a different and shorter path of direct purchase of livestock from producers by larger traders and feedlot operators. The marketing route sometimes goes from the producers to cooperatives and then to feedlots.
• Feed resources for commercial feedlots: All commercial feedlots depend on purchased feed for fattening. Very few feedlots use formulated commercial feed.

58
5. MAJOR FINDINGS
The following is a summary of the major feed types used by feedlots fattening cattle.
o Roughage: The source of roughage used for commercial feedlots include crop residues (tef straw, wheat straw) and native grass hay. Tef straw is utilized by most feedlots, whereas the other roughages were rarely utilized. Utilization of roughages by feedlots: 50% tef straw; 12.5% grass hay; 10.4% tef and wheat straw; 12.5% tef straw and hay; 14.6% use all three types of roughages.
o Agro-industrial byproducts: The source of concentrate feeds commonly used include wheat bran, wheat middlings, whole cottonseed, cottonseed cake, noug seed cake, soybean, sesame seed cake, lentil bran, haricot bean bran, and lentil bran. Sorghum and maize grains are utilized by a few farms. Rice bran is also being used. A few feedlots use poultry litter as one of the feed ingredients for fattening.
o Mineral sources: Common salt is the only mineral source mixed in feedlot rations in all farms. Other minerals such as macrominerals (Ca and P) as well as trace minerals are not considered in the feeding process despite their importance as components of the feed in growing and finishing cattle. Vitamins were also not considered by any of the feedlots. Vitamins like, A, D, and E should have been important considerations in commercial farms for better performance.
o Water: Is supplied ad lib by all feedlots.
• Feeding procedure/system in commercial feedlots:
o Feeding based on weight and age: Feeding is not based on considering whether or not the ration meets the nutritional requirement. Animals are generally not weighed, and feed is not provided based on weight and/or age.
o Daily feeding frequency: Most (73%) of feedlots provide feed twice per day. The rest provide it three times a day.
o Order of feeding: As a common procedure, in 73% of feedlots roughage was provided twice a day (morning and evening) before provision of concentrates.
o Roughage supply: Seventy percent of feedlots
provide roughage ad lib, while roughage offer is restricted in the rest. No effort is made to improve the nutritional value of the roughages through treatment. Chopping is done by some.
o Concentrate supply: All feedlot farms provided concentrate twice a day. The ratio of mixing of ingredients was variable across feedlots. The concentrate was offered every day throughout the fattening period. The amount of concentrate mix provided was different across feedlots. Most feedlots offer 7–10 kg of concentrate mix per head/day, whereas a few feedlot farms reported that as low as 3–4 kg/head/day concentrate is offered.
• Housing and feeding facilities:
o Most feeding troughs are made of woody materials, but a few are made from concrete.
o Most shelters are open, except at the watering and feeding points. A few feedlots had a separate shed for the isolation of sick animals.
• Constraints of commercial feedlots:
o Limited feed availability and the high price of supplementary feed, fluctuation of the market for fattened cattle, water shortage, and disease outbreaks were the most common challenges that faced the cattle fattening operation. Many feedlots had reduced the number of animals and or had no animals at the time of the visit due to the prevailing market problem at the time of the visit.
• Performance of fattening cattle:
o The average initial weight of cattle on entry to the feedlot in the different commercial feedlots is about 255 kg, with a range of 220 kg to 330 kg.
o The average daily weight gain of about 1 kg recorded is a good rate of gain by the standard of experimental reports for Zebu cattle. The average daily gain of younger cattle is better than mature ones.
o The average condition score recorded during the late fattening period was 7.5, 7.2, and 7.0 for large, small, and small-scale (Score scale of 1 to 10- lowest to highest) commercial cattle feedlots in the area respectively.

59Reorienting Livestock Production to Respond to the Meat Quality Requirements of High-End Domestic and Export Markets
5. MAJOR FINDINGS
Cases of modern feedlot facilities
• Verde Beef Processing Company: Verde Beef was started four years ago and started operation some three years back. Verde Beef focuses on cattle fattening by utilizing high-tech management principles. Management on the farm (feeding, health care, etc.) is controlled and facilitated by an integrated computerized system. Strict biosecurity measures are implemented. Customer confidence building is taken very seriously to ensure entry into high-level markets. This management standard has enabled Verde to reduce the cost of production and be competitive.
o Processing of new arrivals: Animals are tagged with an electronic ear tag upon entry to facilitate computerized management during the different stages of the conditioning/fattening process and traceability of each animal. All vaccination procedures are strictly
followed. Animals are vaccinated against blackleg, pasteurellosis, lumpy skin disease (LSD), CBPP, and anthrax. They are provided with multi-vitamins. New entries are treated for external and internal parasites with Avermectin and Mebendazole. The animals are under quarantine for the first 28 days, after which they are “reprocessed” and enter into a second phase after sorting into feeding categories (< 150 kg, 151–180 kg, 181–210 kg, and > 210 kg).
o Records and record keeping: A complete real-time recording of all activities and costs are kept and analyzed on a continuous basis to monitor and evaluate performance.
o Feeds and feeding: Verde Beef produces 40% of the feed needed for the fattening process, especially corn silage, which is found on the farm (about 1,000 ha of land is planted with
VERDE Feedlot

60
5. MAJOR FINDINGS
corn for silage). The remaining feed (corn grain, spent grain, brewery byproducts, wheat/rice bran, molasses, mineral supplements/salt, etc.) is purchased.
Three phases of feeding are practiced during the stay of the feeder cattle in the feedlot. The first phase is the period of quarantine, the second phase is after the quarantine period and after sorting into categories where feeding depends on the target categories. The third phase will be the final month of feeding. Targeted rations will be used for the different stages and categories of animals. Serious follow-up on feeding bunk management is exercised, whereby routine inspection of feeding bunks is conducted and feeding adjustments are made based on the previous day’s consumption.
The feeding period ranges from 90–120 days, depending on the attainment of the desired body weight. The daily gains of the different breeds on the Verde Beef feedlots vary. The Arsi breed gain only about 0.65 kg, cattle from Omorate gain an average of 1.2 kg, and the Borana gain 1.5 kg per day. The average weight of animals at the time of entry is about 150 kg, and animals attain an average weight of 290 kg upon completion of the feeding period.
o Markets and marketing: Ethiopia is perfectly located close to the export markets that provide substantial export opportunities. Verde Beef is currently exporting meat to KSA and UAE. Export to Kuwait is in process. The export market possibilities are seen as being huge and available. Competition from countries like Pakistan and India, which supply desired carcasses of 120–130 kg with light color from young animals and at a relatively low price, is stiff. There is an even wider market to countries like China for animals that are about 350 kg live weight and young (< 4 years of age). The meat that is traditionally supplied from Ethiopia is of poor quality (tough), generally from old animals slaughtered after plowing for a number of years. The experience of Verde Beef thus far shows that this can be altered by conditioning bulls at a young age, following appropriate management and intensive feeding regimens. Young animals grow faster, have better feed efficiency, and produce the tender meat desired by the export market.
o Sourcing of feeder cattle: Verde Beef buys feeder animals directly from producers by engaging its own purchasing personnel at the production locations. The Verde Beef management believes that there is no shortage of supply and that the problem is one of targeting the right market at the right time and through the right channels. Most other abattoirs fully concentrate on the Borana and Guji areas as sources of cattle and complain about shortages in the supply of animals. Verde Beef sources its feeder animals not just from these areas but from a wider area that extends to South Omo (Jinka, Woyto, Saula, etc.). This has created wider options and purchase price advantages with better margins. Prices for a 150 kg animal, for example, range from ETB 3,500–4,000 in Negelle Borana, while an animal of the same weight will cost ETB 1,500–2,000 around Omorate. Verde Beef intends to further expand its source domain to other areas including south, southwestern, and northwestern parts of the country to diversify its animal supply sources.
Verde Beef is planning to expand its operations to the current full capacity of 8,000 feeder cattle/cycle at the present feedlot location and beyond.
The preference for the Borana is based on their higher daily gain of more than 1 kg average daily gain. This has, however, been shown to be more than compensated by the lower feeder cattle purchase price from other locations despite their lower daily gains.
The supply of animals is not uniform throughout the year, as pastoralists generally sell their animals when they need cash. Pastoralists generally start selling animals in January/February when/if drought is in the forecast. The period from September to January is when supplies are lowest.
Verde Beef is currently outsourcing its slaughter operation. A modern slaughterhouse that meets European Union (EU) standards is currently in the final stages of construction and is expected to come into full operation around September. The slaughterhouse will have a daily slaughter capacity of 450 cattle at the initial stages and 750 later on.
o Community support through custom feeding of animals from the surrounding
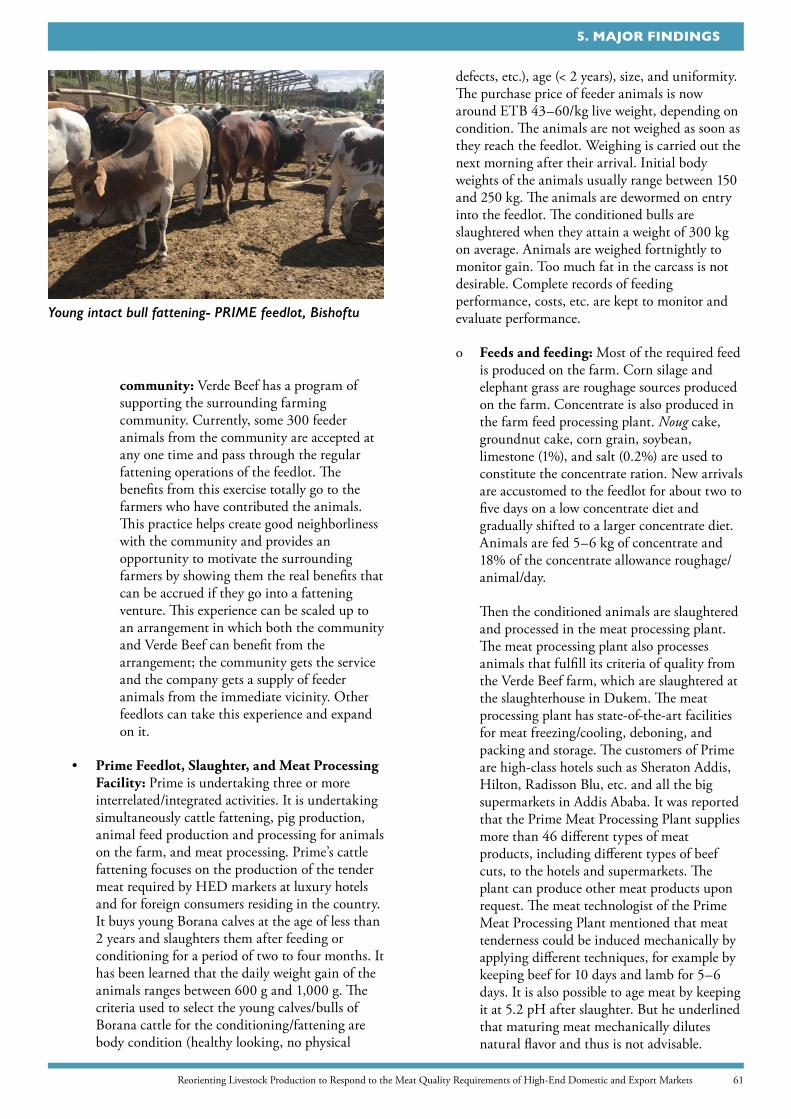
61Reorienting Livestock Production to Respond to the Meat Quality Requirements of High-End Domestic and Export Markets
5. MAJOR FINDINGS
community: Verde Beef has a program of supporting the surrounding farming community. Currently, some 300 feeder animals from the community are accepted at any one time and pass through the regular fattening operations of the feedlot. The benefits from this exercise totally go to the farmers who have contributed the animals. This practice helps create good neighborliness with the community and provides an opportunity to motivate the surrounding farmers by showing them the real benefits that can be accrued if they go into a fattening venture. This experience can be scaled up to an arrangement in which both the community and Verde Beef can benefit from the arrangement; the community gets the service and the company gets a supply of feeder animals from the immediate vicinity. Other feedlots can take this experience and expand on it.
• Prime Feedlot, Slaughter, and Meat Processing Facility: Prime is undertaking three or more interrelated/integrated activities. It is undertaking simultaneously cattle fattening, pig production, animal feed production and processing for animals on the farm, and meat processing. Prime’s cattle fattening focuses on the production of the tender meat required by HED markets at luxury hotels and for foreign consumers residing in the country. It buys young Borana calves at the age of less than 2 years and slaughters them after feeding or conditioning for a period of two to four months. It has been learned that the daily weight gain of the animals ranges between 600 g and 1,000 g. The criteria used to select the young calves/bulls of Borana cattle for the conditioning/fattening are body condition (healthy looking, no physical
defects, etc.), age (< 2 years), size, and uniformity. The purchase price of feeder animals is now around ETB 43–60/kg live weight, depending on condition. The animals are not weighed as soon as they reach the feedlot. Weighing is carried out the next morning after their arrival. Initial body weights of the animals usually range between 150 and 250 kg. The animals are dewormed on entry into the feedlot. The conditioned bulls are slaughtered when they attain a weight of 300 kg on average. Animals are weighed fortnightly to monitor gain. Too much fat in the carcass is not desirable. Complete records of feeding performance, costs, etc. are kept to monitor and evaluate performance.
o Feeds and feeding: Most of the required feed is produced on the farm. Corn silage and elephant grass are roughage sources produced on the farm. Concentrate is also produced in the farm feed processing plant. Noug cake, groundnut cake, corn grain, soybean, limestone (1%), and salt (0.2%) are used to constitute the concentrate ration. New arrivals are accustomed to the feedlot for about two to five days on a low concentrate diet and gradually shifted to a larger concentrate diet. Animals are fed 5–6 kg of concentrate and 18% of the concentrate allowance roughage/animal/day.
Then the conditioned animals are slaughtered and processed in the meat processing plant. The meat processing plant also processes animals that fulfill its criteria of quality from the Verde Beef farm, which are slaughtered at the slaughterhouse in Dukem. The meat processing plant has state-of-the-art facilities for meat freezing/cooling, deboning, and packing and storage. The customers of Prime are high-class hotels such as Sheraton Addis, Hilton, Radisson Blu, etc. and all the big supermarkets in Addis Ababa. It was reported that the Prime Meat Processing Plant supplies more than 46 different types of meat products, including different types of beef cuts, to the hotels and supermarkets. The plant can produce other meat products upon request. The meat technologist of the Prime Meat Processing Plant mentioned that meat tenderness could be induced mechanically by applying different techniques, for example by keeping beef for 10 days and lamb for 5–6 days. It is also possible to age meat by keeping it at 5.2 pH after slaughter. But he underlined that maturing meat mechanically dilutes natural flavor and thus is not advisable.
Young intact bull fattening- PRIME feedlot, Bishoftu

62
5. MAJOR FINDINGS
5.6. Gaps in meeting the quality requirements/specifications
The following summarizes the general features of the livestock production environment in relation to meeting the quality requirements of the HED and export markets for meat and live animals.
• Traditional (small-scale subsistence) mode of livestock production is most prevalent and is not targeting market requirements. Livestock are generally reared as multipurpose animals and not specifically bred for meat production or fast growth rates.
• Knowledge/capacity and information on improved husbandry practices among producers is low. Development workers who are expected to support producers generally lack the required level of practical skills. The lack of use of improved technologies in many instances is due to a lack of awareness rather than a lack of resources.
• Extension support services that fulfill the specific requirements of market-oriented livestock production are inadequate. Extension, especially at the grassroots (woreda/kebele) level, is skewed towards crop extension. Extension packages are typically generic and not site specific.
• Most animals supplied to end markets are too old and below the weight requirement for the age category. This problem is most serious in the case of beef supplied from the MCL-PS; animals are marketed after being used for plowing for a number of years.
• Extension services are not targeted to the needs of livestock, agro-ecology, resource endowment, comparative advantage, etc. The services are generally characterized by blanket interventions (a “one-size-fits-all” approach) that do not bring the desired outcomes. Incentives to livestock extension staff, etc. are lacking.
• Delivery of support services (credit facilities, health, feed supply, targeted extension, etc.) for intensification of production is inadequate.
• There is poor linkage and cooperation among actors in the value chain to reorient production and value addition. The situation of feedlot operators around Adama is a case in point. There may be many foregone opportunities there for coordinating and sharing of resources for the benefit of everybody.
• There are inadequate mechanisms that incentivize producers to adopt improved production technologies.
• Transactions are generally done on a per-animal basis. Weighing of animals at different periods during the conditioning/fattening to monitor progress is nonexistent. Weighing of feed ingredients for ration mixing and rations during feed offer, etc. are not practiced. This is an important impediment to basing decisions on realistic data and running a profitable business.
• The productive and reproductive capacity of many of the available breeds in terms of growth rates to attain the desired weights at a younger age is low. This is further exacerbated from time to time due to:
o The problem of “negative selection” whereby fast growers (especially sheep and goats) are currently sold early. Inferior males are consequently retained for breeding, resulting in a decline in performance, e.g., size of animals supplied to the market through time;
o Current restocking practices after drought spells in the lowland areas like Borana involve the introduction of animals of poorer quality from the highlands, which has meant the dilution of the genetics/genetic erosion of Borana cattle (for example), resulting in gradual loss of vigor;
o Prevalent inbreeding depression as a result of the random mating of related animals.
• The supply of animals is not uniform in terms of the number supplied size, conformation, and age:
o The livestock supply base to the export and the HED markets is narrow and largely limited to animals of lowland origin. The current destination markets have developed special tastes and preferences (flavor, meat color, etc.) for lowland animals, limiting the effective use of highland animals for export. Highland animals are not desirable due to the perceived darkening of meat. The poor tolerance to the heat stress along the export route is also a limitation in the export of live animals from highland areas.
o Animals come from a small-scale subsistence production system where there are small numbers of animals of diverse breeds and backgrounds, resulting in animals with

63Reorienting Livestock Production to Respond to the Meat Quality Requirements of High-End Domestic and Export Markets
5. MAJOR FINDINGS
variable size, conformation, and age.
o Substantial young stock mortality: There are many prevalent diseases that result in high mortality and morbidity, especially among the young stock of all livestock species. This reduces the number of marketable animals substantially.
o Poor market linkages result in supplies targeting certain seasons and/or holidays when higher prices are expected.
o Frequent droughts decimate large numbers of animals.
• Feed shortage and fluctuation in terms of quality and quantity were identified as two of the most important gaps/constraints across production systems. Feed-related gaps can be characterized by the following features:
o Inadequate year-round supply of good-quality feed in adequate quantities and consequent fluctuating and unduly high feed prices;
o Feeding systems based on the available feed resources in the area of production and not on the requirements of the animals. The production and use of formulated designated rations is almost nonexistent;
o Extensive deterioration of grazing conditions and shrinkage of available grazing. The weakening of traditional management of communal grazing lands, overgrazing, and encroachment of cropping into traditional grazing areas are the main factors leading to declining and shrinkage of grazing resources;
o Dwindling of pastoral-area rangelands that serve as the main sources of export stock due to encroachment by unpalatable species and crop agriculture. Water supply limits the use of large areas of rangelands for grazing.
• Market and marketing-related gaps:
o Lack in product diversity: Export is limited to chilled whole carcasses, and there is a failure to use different technologies that increase the shelf life of meat, such as applying meat fabrications (making cuts), frozen vacuum packing, and packaging exporting.
o The long market chain gives room for too many intermediaries, which increases the final
sales prices that do not effectively trickle down to the producer, thus providing very little incentive to improve production and productivity. The Indian Allana Group experience shows the possibility of sourcing animals directly from producers, with price increments that directly reach the producer.
o Lack of confidence in Ethiopian suppliers due to:
3 Frequent supply shortage to satisfy even existing requirements. No export abattoir is sure about the next day’s supply of animals, and none are in a position to fulfill customers’ demand on a timely basis. Thus, many exporters easily lose their buyers;
3 Less volume is always exported or suppliers are not able to fully meet the quantity demanded by the buyer;
3 The irregularity of demand from buyers; 3 Low capacity of exporters and poor
market promotion. Consequently, only a small segment of the target market is currently accessed, despite the potential to expand exports in the existing markets and enter into new ones.
o Traceability is an important consideration in the international trade of meat and live animals. The livestock traceability establishment is at an infant stage in Ethiopia.
o Prevalence of informal cross-border trade due to the various impediments along the formal live animal export chain and inadequate support services along the value chain.
• There are good experiences that can be scaled up/scaled out to help reorient the current practices. Examples include:
o Settlers in Wolega from Hararghe have helped to transform the cattle fattening system in the area towards intensive fattening of young bulls that are currently being exported;
o Good models of modern practices like the feedlot of the Verde Beef Company that have shown that good-quality beef can be produced at a much lower/competitive cost by purchasing young feeder cattle of about 9 months of age, by the formulation of appropriate rations in the form of a TMR to optimize feed efficiency, etc.;
64
5. MAJOR FINDINGS
o Verde Beef ’s custom feeding arrangements with the surrounding community. Both parties benefit from the arrangement. The community supplies the prescribed types of animals, which are then custom fed by Verde Beef. The accrued benefits are shared after the sale of the animals. The community gets the service, and the company gets a supply of feeder animals. There is also transfer of knowledge in the process;
o The effort of the community-based sheep breeding programs started around Bonga and Horro areas. Such breeding strategies, in which superior males are selected and retained for breeding, can be extended to other areas to reduce the effects of negative selection;
o The concentrate feed production model used by cooperative unions and promoted by ACDI/VOCA can be replicated in areas that are and/or can potentially be good livestock supply sources to bring the suppliers of high-quality feed closer to the producers;
o Concentrating the extension support effort on selected clustered woredas that have good potential to supply quality animals such as the experience of clustered sheep production in Awi Zone that supply the Bure agro-industry zone;
o Forage seed production through public-private partnership (PPP) arrangements in Efratana Gidim woreda.
• The absence of dedicated animal transport contributes to quality deterioration as a result of injury and stress.
5.7. Reorienting production to meet requirements
Given that quality attributes are intrinsic to the meat, they can be influenced by changing the technique of production. Studies confirm that all these attributes, except color with small expected response, can be technically influenced by changing the production technique.
Reorienting production practices to satisfy the preferences of high-end consumers requires designing new production and conditioning models. Designing such models in large-scale commercial farms requires no more than formulating the feed and other technical interventions. In the case of smallholder producers, however, production models that “easily” fit into their production contexts need to be developed.
Technologies that do not require much change in the existing production system are more likely to be adopted. This requires developing different models for the different production contexts of pastoralist and MCL producers. Designing technically feasible production models is, however, not sufficient to induce farmers to adopt the new models. For the producers to adopt the proposed models, the models MUST be profitable enough to incentivize producers. The rate of return should be greater than 50%.
5.8. Proposed intervention models for meeting quality requirements of the HED and export markets
After making a thorough assessment of the quality requirements of the HED and export markets, identifying the sources of the animals supplied to these markets and the production environments of areas that are currently supplying and can potentially supply different types of livestock to the HED and export markets, and establishing gaps in meeting the quality requirements, the following intervention models were proposed to help change the overall production setting.
5.8.1. Pastoral and agro-pastoral production system i. Intervention Model 1.1: Pastoral beef for export and HED markets
Currently, cattle for export and the HED market are predominantly sourced from the pastoral production environments, mainly the Borana and Bale areas. Cattle from these areas are transported to the feedlots around Adama when they reach the age of 3 to 4 years, fattened to a weight greater than 320 kg, and marketed live to the export destinations. Some of the cattle conditioned in these feedlots are also supplied to the local markets.
This practice, however, cannot meet the quality requirements of the market. As a result, big hotels, supermarkets, and catering facilities are importing meat from different countries, and meat exports from Ethiopia cannot get premium prices in export destinations.
This model proposes interventions both at the source (pastoral production environment) and the feedlots so that the desired weight of cattle (> 320 kg) is attained at the desirable appropriate age of less than 24 months to meet the quality requirements.
Interventions at the source: These interventions focus on improving the reproductive rate such that a cow will produce a calf once every year and calves will grow at a minimum rate of 320 g/day (deducting 25 kg birth weight) to attain a minimum weight of 220 kg at less than 20 months of age. This is attainable with the following proposed feeding and health regimen.

65Reorienting Livestock Production to Respond to the Meat Quality Requirements of High-End Domestic and Export Markets
5. MAJOR FINDINGS
• 365-day reproduction program: This includes, among others, synchronizing calving with better feed availability, proper feeding interventions like reserving best pasture for breeding cows during the stage of highest production, preferential supplementation of multi-nutrient/urea-molasses blocks or supplementary meal supplements where possible to support the energy, protein, mineral and vitamin A requirements of the breeding females during the higher production phases, i.e., especially during the last trimester of pregnancy and in the lactation phase.
o Supplementation periods: When synchronized, breeding cows will be in a dry pregnant state during the dry season (dry season is ± 183 days) and therefore would only need a maintenance supplement during that period to maintain body condition effectively. Such maintenance supplements will mainly consist of proteins and minerals that will complement and support the low-protein pastures during the dry period to ensure optimal intake and digestion of the lower-quality pastures by the cows during that period. Under normal conditions, mineral supplements should be sufficient during the wet season for lactating breeding cows to produce enough milk to achieve the minimum calf growth rates required above. This assumes that roughage will be available in adequate quantities all the time.
• Supplementation program for calves: Again, this assumes that roughage will be available in adequate quantities all the time. The supplement needs to complement seasonal variations and quality limitations of the available feed resources in order to meet production requirements.
o Supplementation periods: Calves, once weaned at 7–9 months (8 months average) will go through one dry season (183 days—dry season production supplement) and one wet period (182 days—wet season mineral supplement) until they are a maximum of 20 months old. They will then be moved to the feedlot, where they will be fed for 120 days before slaughter at no later than 24 months of age. It is expected that proper supplementary programs for growing calves (providing wet season production supplements) will result in higher-than-the-minimum-required growth rate of 320 g/day. In such a case, the calves can either be sold earlier than the maximum age of 20 months to the feedlot, or higher weights than 220 kg
can be achieved before calves are sold to feedlots for the final finishing period. For the purposes of this assignment, a very conservative approach has been followed, one that should easily be accomplished under current circumstances and practices.
o The proposed maintenance and production supplements at the source are presented in Appendix Table 6.
• Health program: As recommended for the setting (preventive and curative measures).
Interventions at the feedlot: The intervention at the feedlot focuses on attaining a minimum average daily gain (ADG) of 1 kg/day in 120 days and reaching a weight of greater than 320 kg by 24 months of age. This requires the following interventions.
• Feed the most balanced TMR, including mineral sources:
o Proper feed formulations and proper particle sizes (roughage = 3–4 centimeter (cm) size and concentrate = 4–6 mm hammermill sieve) for uniform mixing and to avoid selective feeding and unbalanced intake and performance among animals. Reduction of particle size and/or mixing in the form of a uniform TMR can be done by feed mills in the area, and/or the feedlot operators can avail this service in groups or alone.
o Introduction of weighing of animals to monitor actual ADG achieved, compound feed offering, and mixing of ingredients in the form of a TMR is essential for monitoring progress and doing the right thing in terms of feeding appropriate rations.
o Based on the current setting around the feedlots in East Shoa, where small to medium feedlots are located in close proximity, it is recommended that feedlots share resources (balance, purchases, etc.). They can even share a professional manager and some labor, as the current feedlots are small.
• Proper feed program: The aim is to get an ADG of at least 1 kg/d and attain > 320 kg weight in animals’ four months’ stay at the feedlot. This is attainable if the following feeding program is followed. Proposed rations at the feedlot are presented in Appendix Table 8.

66
5. MAJOR FINDINGS
o Starter phase is the first fourteen days (intake 2.2-2.7% Body Weight (BW) on a 90% Dry Matter (DM) basis, and an ADG of 0.750 kg):
3 High roughage (17–20% of total ration), chopped to 3–4 cm length to readily mix in the TMR.
3 Higher protein content (13% Crude Protein (CP)—1% urea equivalent can come from non-protein nitrogen (NPN) sources).
3 Lower carbohydrate (50–55% of total ration from high starch ingredients) agro-industrial byproduct with a particle size that can move through a 4–6 mm sieve.
3 Vitamin A + mineral supplement (premix).
o Grower phase is 76 days after the starter phase (3.2% BW on a 90% DM basis, and an ADG of at least 1.00–1.20 kg):
3 Roughage (12–15% of total ration), chopped to 3–4 cm length to readily mix in the TMR.
3 Protein content (12% CP—1% urea equivalent can come from NPN sources).
3 Higher carbohydrate (58–63% of total ration from high starch ingredients) agro-industrial byproduct with a particle size that can move through a 4–6 mm sieve.
3 Vitamin A + mineral supplement (premix).
o Finisher phase is 30 days (3.2% BW on a 90% DM basis and an ADG of at least 1.20–1.40 kg):
3 Roughage (12% of total ration), chopped to 3–4 cm length to readily mix in the TMR.
3 Protein content (12% CP—1% urea equivalent can come from NPN sources).
3 Higher carbohydrate (64–68% of total ration from high starch ingredients) agro-industrial byproduct with a particle size that can move through a 4–6 mm sieve.
3 Vitamin A + mineral supplement (premix).
o Feed sufficient quantities twice per day (7–8 am morning and 1–2 pm afternoon) to ensure that animals are able to consume ad lib intake
of a properly-balanced and mixed TMR over a 24-hour period. Ensure that minimal feed is wasted.
• Health program: As recommended for feedlots (preventive and curative measures)
ii. Intervention Model 1.2: Sheep/goats for export markets
Sheep and goats are sourced from the lowland pastoral areas, notably from the Borana, Guji, Afar, Bale, Metehara etc. areas, particularly for supplying the export market. Almost all the goats are transported from the pastoral areas, slaughtered at the export abattoirs, and exported as chilled carcasses. Sheep are similarly transported to the export abattoirs, partly slaughtered, and exported as chilled carcasses. Sheep and goats from these areas are also exported live without going through the feedlots, as is the case for cattle.
This model proposes interventions at the source (pastoral production environment) so that the desired weight of sheep and goats is attained at the appropriate age to meet the quality requirements of HED and export markets.
Targets:
HED market: Target is to attain > 25 kg market weight for sheep in less than 12 months of age and 50 kg for goats in less than 18 months of age. It is assumed that in better management and feeding circumstances lambs can be weaned at 120 days with a weight of 18 kg (135 g/d ADG) and can be sold straight to feedlots at that stage where they will be fed for 35 days and then marketed. This weaning program will ensure that ewes can sustain an 8-monthly lambing cycle and lambs do not have to be kept in the herd further. There are three options to achieve the target of marketing lambs in less than 12 months at the ideal weight:
• To attain a body weight of 25 kg if the animals are passing through a 35-day feedlot period: A minimum ADG for lambs from birth to weaning (120 days) of > 135 g/d (assume a birth weight of 2 kg that needs to be deducted from final weight) is required. Lambs will be 18 kg in weight when entering the feedlot at 120 days of age and will grow 250 g/d after a 7-day adaptation period when the ADG will be 125 g/d.
• To attain a body weight of 25 kg if the animals are not passing through a feedlot period: A minimum ADG for lambs from birth to 12 month of > 65 g/d (assume a birth weight of 2 kg that needs to be deducted from final weight) is required.

67Reorienting Livestock Production to Respond to the Meat Quality Requirements of High-End Domestic and Export Markets
5. MAJOR FINDINGS
• To attain a body weight of 50 kg if the animals are not passing through a feedlot period: A minimum ADG for goats from birth to 18 months of > 90 g/d (assume a birth weight of 2 kg that needs to be deducted from final weight) is required.
Export markets—UAE: Target is to attain > 15 kg market weight for sheep in less than 12 months and > 16 kg for goats in less than 12 months of age. It is assumed that in better management and feeding circumstances lambs can be weaned at 120 days with a weight of 18 kg (135 g/d ADG) and can be sold straight to end markets without a feedlot period. This weaning program once again will ensure that ewes can sustain an 8-monthly lambing cycle and lambs do not have to be kept in the herd further. There are two options to achieve a target of marketing lambs in less than 12 months at the ideal weight and one option for goats:
• To attain a body weight of 15–20 kg at weaning if the animals are not passing through a feedlot and want to be marketed straight after weaning at 120 days of age: A minimum ADG for lambs from birth to 120 days of 135 g/d is required.
• To attain a body weight of 15–20 kg at weaning if the animals are not passing through a feedlot and only need to be marketed from the farm before 12 months of age: A minimum ADG for lambs from birth to 12 months of > 50 g/d (assume birth weight of 2 kg that needs to be deducted from final weight) is required.
• To attain a body weight of 16–18 kg if the animals are not passing through a feedlot and only need to be marketed from the farm before 12 months of age: A minimum ADG for goats from birth to 12 months of > 45 g/d (assume birth weight of 2 kg that needs to be deducted from final weight) is required.
Export markets—KSA: The target is to attain > 30 kg market weight for sheep and goats in less than 15 months of age. It is assumed that in better management and feeding circumstances lambs can be weaned at 120 days with a weight of 18 kg (135 g/d ADG) and can be sold straight to end markets without a feedlot period. This weaning program once again will ensure that ewes can sustain an 8-monthly lambing cycle and lambs do not have to be kept in the herd further. There are three options to achieve a target of marketing lambs in less than 12 months at the ideal weight:
• To attain a body weight of 30–35 kg if the animals are passing through a 50-day feedlot period: A minimum ADG of lambs from birth to
weaning (120 days) of > 135 g/d (assume a birth weight of 2 kg that needs to be deducted from final weight) is required. Thereafter, a 30-day supplementary period where an ADG of 135 g/day is maintained with a production supplement (300 g/d intake) will follow on the farm until lambs are 22 kg in weight. Lambs will then be sold at 22 kg in weight when entering the feedlot at 150 days of age and will grow 250 g/d after a seven-day adaptation period where the ADG will be 125 g/d;
• To attain a body weight of 30–35 kg if the animals are not passing through a feedlot period: A minimum ADG of lambs from birth to 15 months of > 65 g/d (assume a birth weight of 2 kg that needs to be deducted from final weight) is required;
• To attain a body weight of 30–35 kg if the animals are not passing through a feedlot period: A minimum ADG of goats from birth to 15 months of > 65 g/d (assume a birth weight of 2 kg that needs to be deducted from final weight) is required.
Interventions at the source farm
• Improving reproduction: It is assumed that breeding ewes will be in a dry pregnant state during part of the dry season (dry season is 60 days) and therefore would only need a dry season maintenance supplement during that period. During the other part of the dry season (123 days), they will also be in a higher state of production and therefore receive a dry season production supplement during that period. This will apply to all ewes and does, irrespective of the three target markets (HED, UAE, KSA). They should be able to achieve the targeted performance levels during wet season with only a well-balanced mineral supplement.
• Supplementation program for lambs if no feedlot period is assumed: As indicated above, the three target markets have different weight targets. Each of the different targets will, therefore, have different durations of supplementation of the lambs/kids after weaning (at 120 days) if no feedlot period is assumed and lambs require supplements on-farm to achieve target ADG until required market weight has been reached. The total amount of supplement and time period that supplements will be fed on-farm for each of the different targeted markets will depend on the quality of roughage lambs have access to, the genetic potential for growth, as well as the ADG that can be achieved in any given situation.

68
5. MAJOR FINDINGS
o HED (Lambs marketed < 12 months of age):
3 Dry season lambs: Dry season production supplement (300 g/day).
3 Wet season lambs: Wet season mineral (30 g/day) or production supplement (300 g/day).
o Export markets—UAE (Lambs marketed < 12 months of age):
3 Dry season lambs: Dry season production supplement (300 g/day).
3 Wet season lambs: Wet season mineral (30 g/day) or production supplement (300 g/day).
o Export markets—KSA (Lambs marketed < 15 months of age):
3 Dry season lambs: Dry season production supplement (300 g/day).
3 Wet season lambs: Wet season mineral (30 g/day) or production supplement (300 g/day).
Examples of feedlot rations that can be used to attain the target ADG’s stated for the different target markets are presented in Appendix Table 7.
Interventions at feedlots: Goats are currently exported without passing through this phase because smaller-sized animals are required by the export market, and the HED market does not use goat meat. The following, therefore, applies to the feedlotting of sheep/lambs that are conditioned/fattened especially for the domestic market. The following specifications apply for the feedlotting of lambs to attain the destination market requirements outlined above.
• Feeding period for lambs for HED market: To achieve a target weight of ± 25 kg: 35 days (starter period of 7 days and grower/finisher period of 28 days).
o ADG for starter phase = 125 g/d and for finisher phase = 250 g/d:
3 = 7 kg gain over 35 days; 3 Starter feedlot weight = 18 kg.
• Feeding period for lambs for UAE market: Zero days (can be marketed straight from the farm at 15–20 kg if the suggested on-farm supplementary program is followed).
• Feeding period for lambs for the KSA market:
To achieve a target weight of ± 30–35 kg: 50 days (starter period of 7 days and grower/finisher period of 43 days).
o ADG for starter phase = 125 g/d and for finisher phase = 250 g/d :
3 = 8–13 kg (average = 10.5 kg) gain over 50 days;
3 Starter feedlot weight = 22 kg.
• Ad lib feed intake level = ± 4.2% of Live Weight (LW) (90% DM). Starter feed intake level = ± 3.3% of LW (90% DM).
• CP% of 15% for the starter rations and 14% for the finisher rations are required.
o A maximum of 20% of the total protein (1% urea equivalent—that includes NPN coming from ammonium chloride and ammonium sulfate) can come from NPN sources. Add 0.25% ammonium chloride and 0.65% ammonium sulfate to avoid the problem of kidney stones in feeder lambs). Arrangements whereby ammonium chloride and ammonium sulfate can be made available should be looked into (e.g., premix suppliers and/or others can supply as long as the demand is created).
• Roughage = starter: 25–28% lucerne vs. 20–24% grass hay and grower/finisher: 18–22% lucerne vs. 15–18% grass hay. Ideal for sheep feedlotting is to provide best roughage possible with 1.2–1.5 cm in length to mix properly into TMR and prevent particle segregation with concentrate portion.
• Grain byproduct levels: starter = 48–53% and grower/finisher = 58–62%.
• Vitamin/mineral pack (vitamins A, D, E).
• Lower Cu levels for sheep, as they are sensitive to high copper levels.
• Ca:P as close as possible to 2:1–2.5:1.
• Soya bean meal is best CP source in lamb feedlot rations if available and cost-effective.
• Lambs perform better if the ration is supplied in the form of pellets rather than a meal, if possible.
Examples of rations that can be used to attain the target ADGs as indicated in Intervention Model 1.2: Sheep/goats for export markets are presented in Appendix Table 8.
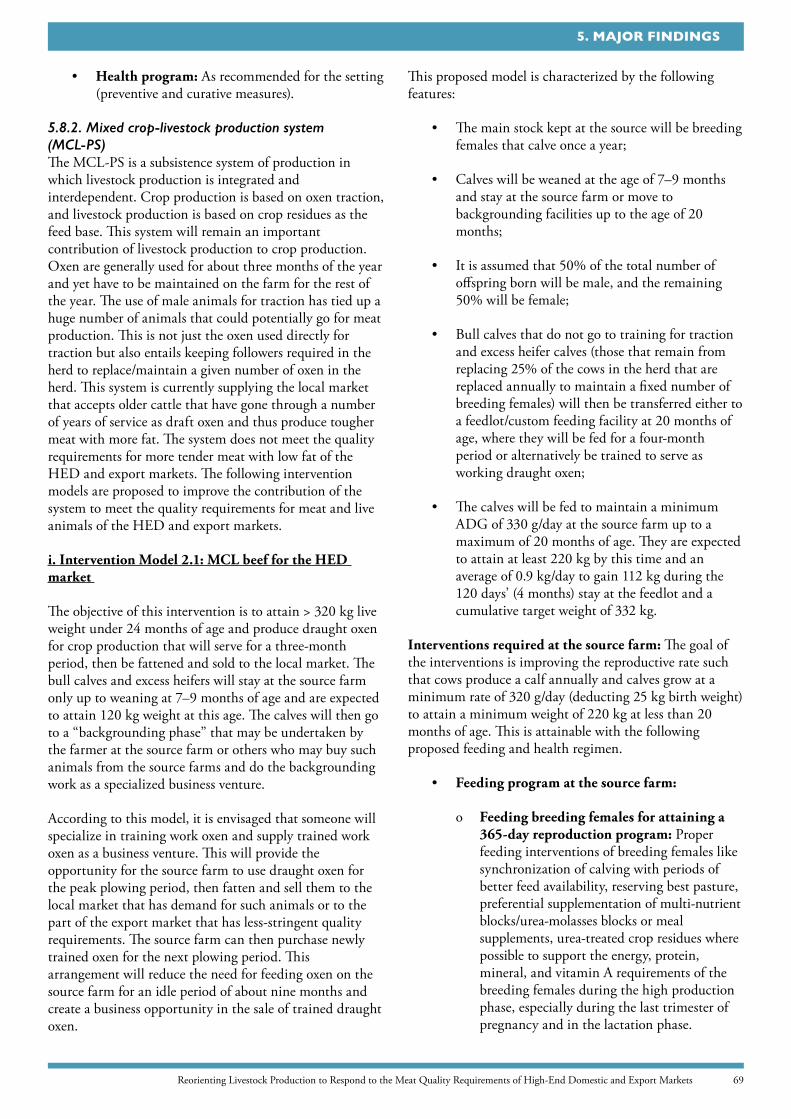
69Reorienting Livestock Production to Respond to the Meat Quality Requirements of High-End Domestic and Export Markets
5. MAJOR FINDINGS
• Health program: As recommended for the setting (preventive and curative measures).
5.8.2. Mixed crop-livestock production system (MCL-PS)The MCL-PS is a subsistence system of production in which livestock production is integrated and interdependent. Crop production is based on oxen traction, and livestock production is based on crop residues as the feed base. This system will remain an important contribution of livestock production to crop production. Oxen are generally used for about three months of the year and yet have to be maintained on the farm for the rest of the year. The use of male animals for traction has tied up a huge number of animals that could potentially go for meat production. This is not just the oxen used directly for traction but also entails keeping followers required in the herd to replace/maintain a given number of oxen in the herd. This system is currently supplying the local market that accepts older cattle that have gone through a number of years of service as draft oxen and thus produce tougher meat with more fat. The system does not meet the quality requirements for more tender meat with low fat of the HED and export markets. The following intervention models are proposed to improve the contribution of the system to meet the quality requirements for meat and live animals of the HED and export markets.
i. Intervention Model 2.1: MCL beef for the HED market
The objective of this intervention is to attain > 320 kg live weight under 24 months of age and produce draught oxen for crop production that will serve for a three-month period, then be fattened and sold to the local market. The bull calves and excess heifers will stay at the source farm only up to weaning at 7–9 months of age and are expected to attain 120 kg weight at this age. The calves will then go to a “backgrounding phase” that may be undertaken by the farmer at the source farm or others who may buy such animals from the source farms and do the backgrounding work as a specialized business venture.
According to this model, it is envisaged that someone will specialize in training work oxen and supply trained work oxen as a business venture. This will provide the opportunity for the source farm to use draught oxen for the peak plowing period, then fatten and sell them to the local market that has demand for such animals or to the part of the export market that has less-stringent quality requirements. The source farm can then purchase newly trained oxen for the next plowing period. This arrangement will reduce the need for feeding oxen on the source farm for an idle period of about nine months and create a business opportunity in the sale of trained draught oxen.
This proposed model is characterized by the following features:
• The main stock kept at the source will be breeding females that calve once a year;
• Calves will be weaned at the age of 7–9 months and stay at the source farm or move to backgrounding facilities up to the age of 20 months;
• It is assumed that 50% of the total number of offspring born will be male, and the remaining 50% will be female;
• Bull calves that do not go to training for traction and excess heifer calves (those that remain from replacing 25% of the cows in the herd that are replaced annually to maintain a fixed number of breeding females) will then be transferred either to a feedlot/custom feeding facility at 20 months of age, where they will be fed for a four-month period or alternatively be trained to serve as working draught oxen;
• The calves will be fed to maintain a minimum ADG of 330 g/day at the source farm up to a maximum of 20 months of age. They are expected to attain at least 220 kg by this time and an average of 0.9 kg/day to gain 112 kg during the 120 days’ (4 months) stay at the feedlot and a cumulative target weight of 332 kg.
Interventions required at the source farm: The goal of the interventions is improving the reproductive rate such that cows produce a calf annually and calves grow at a minimum rate of 320 g/day (deducting 25 kg birth weight) to attain a minimum weight of 220 kg at less than 20 months of age. This is attainable with the following proposed feeding and health regimen.
• Feeding program at the source farm:
o Feeding breeding females for attaining a 365-day reproduction program: Proper feeding interventions of breeding females like synchronization of calving with periods of better feed availability, reserving best pasture, preferential supplementation of multi-nutrient blocks/urea-molasses blocks or meal supplements, urea-treated crop residues where possible to support the energy, protein, mineral, and vitamin A requirements of the breeding females during the high production phase, especially during the last trimester of pregnancy and in the lactation phase.

70
5. MAJOR FINDINGS
3 Supplementation periods: When synchronized, breeding cows will be in a dry pregnant state during the dry season (dry season is ± 183 days) and therefore would only need a maintenance supplement during that period to maintain body condition effectively. Such maintenance supplements will mainly consist of proteins and minerals that will complement and support the low-protein pastures during the dry period to ensure optimal intake and digestion of the lower-quality pastures by the cows during that period. Under normal conditions, mineral supplements should be sufficient during the wet season for lactating breeding cows to produce enough milk to achieve the minimum calve growth rates required above. This assumes that roughage will be available in adequate quantities all the time.
o Supplementation program for calves:
3 Feeding up to weaning: Make sure the calf gets adequate (about 2 liters) colostrum within the first 2–6 hours from birth up to 4 days; allow calf to suckle as much as possible; provide preferential and separate feeding of succulent grass and legumes starting at 3 weeks of age.
3 Backgrounding: Weaned bull calves and excess heifer calves will go into the backgrounding phase after weaning and attaining 120 kg body weight at weaning. They will be managed/fed further up to 20 months of age (i.e., for a period of 11–13 months). They will be fed on a production supplement so that they do not face the post-weaning depression in growth that is common at this stage and maintain an average gain of 330 g/day. The backgrounding exercise can either be carried out by the same farmer or somebody else who may undertake this as a business venture.
o The supplement needs to complement the available feed resource, i.e., limitations of the available feed resource and the production level desired.
3 Supplementation periods: Once weaned at 7–9 months (8 months is average), calves will go through one dry season (183 days of dry season production supplement) and one wet period (182 days
of wet season mineral supplement) until they are a maximum of 20 months old. They will then be moved to the feedlot where they will be fed for 120 days before slaughter at no later than 24 months of age. It is expected that proper supplementary programs for growing calves (providing wet season production supplements) will result in higher-than-the-minimum-required growth rate of 320 g/day. In such a case, the calves can either be sold earlier than the maximum age of 20 months to the feedlot, or higher weights than 220 kg can be achieved before calves are sold to feedlots for the final finishing period. For the purposes of this assignment, a very conservative approach has been followed that should easily be accomplished under current circumstances and practices.
The proposed maintenance and production supplements at the source are presented in Appendix Table 6.
o Health program: As recommended for the setting (preventive and curative measures).
Interventions at the feedlot/custom feeding operation:
• Calves that have attained 200 kg after the backgrounding phase will be transferred to the custom feeding or the feedlot for a period of four months. Culled cows can also go to the finishing stage.
• Average daily gain at the feedlot is to be maintained at a minimum of 1 kg/day for 120 days resulting in at least 120 kg gain during the feedlot period and a cumulative target weight of 320 kg.
• Feeds and feeding management at the feedlot: Follow the following feeding management at the feedlot.
o Feed the most balanced TMR, including mineral sources:
3 Proper feed formulations and proper particle sizes (roughage = 3–4 cm size and concentrate = 4–6 mm hammermill size) for uniform mixing and to avoid selective feeding and unbalanced intake among animals. Reduction of particle size and/or mixing in the form of a uniform TMR can be done by feed mills in the area and/or the feedlot operators can do so in

71Reorienting Livestock Production to Respond to the Meat Quality Requirements of High-End Domestic and Export Markets
5. MAJOR FINDINGS
groups or avail this service alone. 3 Introduction of weighing of animals to
monitor actual ADG achieved, compound feed offering, and ingredients in the case of mixing at the feedlot in the form of a TMR is essential for monitoring progress and doing the right thing in terms of feeding appropriate rations.
3 Based on the current setting around the feedlots in East Shoa, where small to medium feedlots are located in close proximity, it is recommended that feedlots share resources (balance, purchases, etc.). They can even share a professional manager and some labor, as the current feedlots are small.
o Proper feed program: The aim is to get an ADG of at least 1 kg/d at the feedlot. This is attainable if the following feeding program, depending on the stage of feeding at the feedlot, is followed.
3 Starter phase (intake 2.2–2.7% BW on a 90% DM basis and ADG of 0.750 kg):
- High roughage (17–20% of total ration), chopped to 3–4 cm length to readily mix in the TMR.
- Higher protein content (13% CP—1% urea equivalent can come from NPN sources).
- Lower carbohydrate (50–55% of total ration from high starch ingredients) agro-industrial byproduct with a particle size that can move through a 4–6 mm sieve.
- Vitamin A + mineral supplement (premix).
3 Grower phase: 76 days after the starter phase (3.2% BW on a 90% DM basis and an ADG of at least 1.00-1.20 kg):
- Roughage (12–15% of total ration), chopped to 3–4 cm length to readily mix in the TMR.
- Protein content (12% CP—1% urea equivalent can come from NPN sources).
- Higher carbohydrate (58–63% of total ration from high starch ingredients, agro-industrial byproduct with a particle size that can move through a 4–6 mm sieve.
- Vitamin A + mineral supplement (premix).
3 Finisher phase: 30 days (3.2% BW on a 90% DM basis and an ADG of at least 1.20–1.40 kg):
- Roughage (12% of total ration), chopped to 3–4 cm length to readily mix in the TMR.
- Protein content (12% CP—1% urea equivalent can come from NPN sources).
- Higher carbohydrate (64–68% of total ration from high starch ingredients) agro-industrial byproduct with a particle size that can move through a 4–6 mm sieve.
- Vitamin A + Mineral supplement (premix).
o Feed sufficient quantities twice per day (7–8 am morning and 1–2 pm afternoon) to ensure that animals are able to consume ad lib intake of a properly balanced and mixed TMR over a 24-hour period. Ensure that minimal feed is wasted.
Proposed rations at the feedlot are presented in Appendix Table 8.
• Health program: As recommended for feedlots (preventive and curative measures).
ii. Intervention Model 2.2: Dairy beef for HED and export markets
This model focuses on meat production from the dairy system in the MCL context, where the dams are used primarily for milk production for sale and/or home consumption. The emerging dairy system is based on the use of crossbred cattle (usually local-Friesian crosses) for the purpose of milk production. The objective of the intervention is to attain > 320 kg live weight at 12 months of age from crossbred dairy calves to produce tender meat with low fat from a very young animal.
In this system, male calves will be separated from the dam very early (about a week) after birth and are generally artificially reared. The male calves from this system can be used for high-quality meat production. The calves will be reared on the source farm or by others who may buy the young calves and rear them following appropriate practices up to 7 months of age. These animals are expected to grow much faster than local calves and attain 200 kg live weight at the age of 7–9 months. They will then go to custom feeders or feedlots to finish them for the market. The system is based on feeding by focusing on the period during which the animals are most efficient and results in a larger animal with less fat at a young age, thus effectively meeting the market requirements for tender and low-fat meat.

72
5. MAJOR FINDINGS
Interventions required at the source farm: The main stock kept at the source will be breeding females that calve once a year. These will mainly be crossbred or local females that are bred with exotic semen using AI. The current focus of estrus synchronization of breeding females combined with AI is resulting in the production of an increasing number of such calves. The calves will be separated from their dams and artificially reared. They will either be transferred to a feedlot or custom feeding facility where they will be fed for a three-month period and then marketed. This period may be extended to attain larger market weight.
• Feeding program at the source farm:
o 365-day reproduction program: This includes, among others, synchronizing calving with better feed availability. Proper feeding interventions include reserving best pasture, using urea-treated crop residues, multi-nutrient blocks, urea-molasses blocks, and urea-treated crop residues where possible to support the energy, protein, mineral, and vitamin A requirements of the breeding females during the high production phase, especially during the last trimester of pregnancy and nursing/milk production period. The following feeding schedule (Table 10) is recommended for feeding at different production states and is based on the quality of the basal feed (roughage) source.
o Supplementation program for calves: This assumes that roughage will be available in adequate quantities all the time. The supplement needs to complement seasonal
variations and quality limitations of the available feed resources in order to meet production requirements. Male calves born at a farm with a milk production objective can be reared to produce high-quality meat due to the fast growth rates of such animals. The following are important actions.
3 Artificial rearing of calves—birth up to weaning:
- Phase 1: colostrum feeding: Make sure the calf gets adequate colostrum from birth up to 4 days. Encourage the calf to suckle immediately after birth. Allow calves to suckle freely for the first day and then three times a day, consuming two liters, up to day 4.
- Phase 2: pre-ruminant phase (5 to 20 days of age): Calves should receive milk along with a calf starter that has good-quality protein and a succulent good-quality fodder. The total amount of milk allowance may be fed at three or four equal intervals up to the age of 7 days and then twice daily. A feeding schedule of calves is presented in Table 11 below.
o Feeding program of calves from weaning at 4 months (16 weeks) to 9 months of age: Weaned bull calves will be maintained on the source farm and managed/fed up to 9 months of age (for a period of five months). They will be fed such that they do not face post-weaning depression in growth by providing appropriate supplementation and maintain an average gain of 750 g/day. The calves are expected to
When green grass is the major roughage When straw is the major roughageCategory Concentrate Green Concentrate Green Straw mixture (kg) grass (kg) mixture (kg) grass (kg) (kg)
Dry cows - 25–30 1.25 5.0 5–6
Milking 1 kg for every 30 1.25 + 1 kg for every 5.0 5–6 2.5–3.0 kg of milk 2.5–3.0 kg of milk
Pregnant Production allowance 25–30 Maintenance + 5.0 5–6 + 1 to 1.5 kg from production + 1 to the sixth month of 1.5 kg from sixth pregnancy month of pregnancy
Table 10. Feeding schedule for different classes of adult cows

73Reorienting Livestock Production to Respond to the Meat Quality Requirements of High-End Domestic and Export Markets
5. MAJOR FINDINGS
attain a body weight higher than 200 kg at 9 months of age.
3 Supplementation program: The supplement needs to complement the available feed resource, i.e., resolve limitations of the available feed resource to achieve the production level desired.
The proposed production supplements at the source are presented in Appendix Table 6.
Table 11 provides a summary of the feeding schedule recommended for calf feeding up to 9 months, with calves weaned at 16 weeks (4 months) of age.
• Health program: As recommended for the setting (preventive and curative measures).
Feedlot/custom feeding: The calves will then be transferred to a feedlot or a custom feeding facility for another 3 months’ period for intensive feeding to attain the desired weight for marketing. The bull calves will be ready for marketing at a young age of 10 to 12 months. The feeding at the feedlot or the custom feeding facility will be as follows.
• Average daily gain at the feedlot is to be maintained at 1.5 kg/day for 90 days, resulting in at least 135 kg gain during the feedlot period and a cumulative target weight of 335 kg.
• Feeds and feeding management at the feedlot: Follow the following feeding management at the feedlot.
o Feed the most balanced TMR, including mineral sources:
3 Proper feed formulations and proper particle sizes (roughage = 3–4 cm size and concentrate = 4–6 mm hammermill sieve) for uniform mixing and to avoid selective feeding and unbalanced intake among animals. Reduction of particle size and/or mixing in the form of a uniform TMR can be done by feed mills in the area and/or the feedlot operators can avail this service in groups or alone.
3 Introduction of weighing of animals to monitor actual ADG achieved, compound feed offering, and mixing of ingredients in the form of a TMR is essential for monitoring progress and doing the right thing in terms of feeding appropriate rations.
3 Based on the current setting around the feedlots in East Shoa, where small to medium feedlots are located in close proximity, it is recommended that they share resources (balance, purchases, etc.). They can even share a professional manager and some labor, as the current feedlots are small.
• Proper feed program: The aim is to get ADG of at least 1 kg/d at the feedlot. This is attainable if the following feeding program is followed.
Age of calf Milk (kg/day) Calf starter (g/day)* Green grass
Birth to 4 days colostrum—free choice nil nil4 days to 4 weeks 2.5 handful Free choice4–8 weeks 100–250 100–250 Free choice8–12 weeks 350–500 250–500 Free choice12–16 weeks (weaning) 500–750 500–750 Free choice16–20 weeks - 750–1,000 Free choice20–24 weeks - 1,000–1,500 Free choice24–28 weeks - 1,500–1,750 Free choice28–32 weeks - 1,750–2,000 Free choice32–36 weeks - 2,000–2,250 Free choice
* Calf starter: highly nutritious concentrate mixture that contains 18% crude protein, low fiber, 0.75% calcium, 0.40% phosphorus and vitamins A, D, and E as the calf is progressively consuming less and less milk and its rumen is still not fully developed.
Table 11. Feeding schedule for calves up to 9 months, weaned at 16 weeks

74
5. MAJOR FINDINGS
o Proposed rations at the feedlot are presented in Appendix Table 8.
3 Starter phase (intake 2.2–2.7% BW on a 90% DM basis):
- High roughage (17–20% of total ration), chopped to 3–4 cm length to readily mix in the TMR.
- Higher protein content (13% CP—1% urea equivalent can come from NPN sources).
- Lower carbohydrate (50–55% of total ration from high starch ingredients) agro-industrial byproduct with a particle size that can move through a 4–6 mm sieve.
- Vitamin A + mineral supplement (premix).
3 Grower phase (3.2% BW on a 90%DM basis):
- Roughage (12–15% of total ration), chopped to 3–4 cm length to readily mix in the TMR.
- Protein content (12% CP—1% urea equivalent can come from NPN sources).
- Higher carbohydrate (58–63% of total ration from high starch ingredients) agro-industrial byproduct with a particle size that can move through a 4–6 mm sieve.
- Vitamin A + mineral supplement (premix).
3 Finisher phase (3.2% BW on a 90% DM basis):
- Roughage (12% of total ration), chopped to 3–4 cm length to readily mix in the TMR.
- Protein content (12% CP—1% urea equivalent can come from NPN sources).
- Higher carbohydrate (64–68% of total ration from high starch ingredients) agro-industrial byproduct with a particle size that can move through a 4–6 mm sieve.
- Vitamin A + mineral supplement (premix).
o Feed sufficient quantities twice per day (7–8 am morning and 1–2 pm afternoon) to ensure that animals are able to consume ad lib intake of a properly balanced and mixed TMR over a 24-hour period. Ensure that minimal feed is wasted.
• Proper health program following standard recommendation for feedlots (preventive and curative measures).
iii. Intervention Model 2.3: Sheep/goats for the HED market
Interventions outlined for the pastoral production system under Model 1.2. apply. Management interventions that reduce the stress that contributes to meat darkening, raised as a problem in the acceptability of meat from highland animals, need to be taken into serious consideration. Interventions like vitamin E supplementation and reduced stress have been suggested to contribute to the reduction of meat darkening.
5.8.3. Breeding-related interventions across the modelsThe following guidelines can be followed to gradually upgrade or at least avoid the negative selection of perpetual use of inferior breeding males and inbreeding currently prevailing and resulting in the poor performance of subsequent generations. The following short/medium-term and long-term measures are recommended to curb the depression and bring about progress in performance. The implementation of these schemes requires training and awareness creation of producers and the extension personnel to provide technical and organizational support.
Cattle
Short to medium term: In the short and medium term, genetic improvement can focus on taking the following steps:
• Select best bulls around and use: Exchange scheme can be implemented at the farm and/or community level to avoid inbreeding;
• Then select bulls from farther away, including, e.g., the use of Borana bulls that are good performers, among available breeds may be used elsewhere.
For best results, this should entail a step-by-step approach based on the following guidelines.
• Use good quality breeding bulls that fulfill the following:
o Highest performers (based on ADG) and good muscle definition (conformation) throughout the growth period should be used.
o Structural correctness (legs, testes, etc.).
o No inbreeding by avoiding using the same bull for too long. Devise a system for breeding

75Reorienting Livestock Production to Respond to the Meat Quality Requirements of High-End Domestic and Export Markets
5. MAJOR FINDINGS
male exchange scheme to avoid breeding of related animals.
o Ensure that fertility is good. If necessary, test the bulls for semen quality, a procedure that can be performed at veterinary facilities close by, providing skill with the procedure of lab personnel exists.
o A ratio of 1 bull to 40 cows is sufficient, provided the bull has good fertility levels. The remaining bulls may go for meat production and/or be castrated and used for draught purposes. Share bulls if required; i.e., a breeding male can be used in common where female numbers per farm are small. Farmers using communal grazing land can be organized in such a way that they collectively select breeding bulls for use communally and either castrate or eliminate others that are not used for breeding.
• Retain best females:
o Good reproduction criteria: Effort to attain the following reproductive targets should be made:
3 An inter-calving period (ICP) of a maximum of 400 days should be targeted to attain production of a calf each year.
3 Wean a healthy calf each year. 3 Age at first calving of not later than 36
months of age. 3 The breeding weight of heifers first time at
27 months = minimum of 300 kg. This requires the provision of appropriate nutrition.
o Raise calves that achieve or improve on goals of minimum performance criteria established.
o Wean calves at ± 7–9 months of age no lighter than 120 kg (this requires ADG from birth to weaning of = > 300 g/d). Target should be 150 kg, with proper management and nutrition programs. Thereafter, continuous genetic improvement will further increase 7–9 months weaning weights.
o Sufficient milk to raise the calf properly. Cows with udders large enough to do so should be retained as future dams.
o Eliminate 25% lowest producers each year and replace with 25% best heifers retained in the herd for future breeding. Such heifers
usually come from the best-performing cows and require feeding programs that will achieve ideal breeding weight at 27 months. Similar to feedlot heifers would be fine.
o Type (good body conformation) and size of retained female animals (and udder quality of their dams) must receive emphasis as well.
o Maintain reasonable body condition at all times. Adjust supplementary programs accordingly;
o The breeding season needs to match the level of production.
o Highest production phase (lactation phase) must be planned to occur during the period of best pasture availability in terms of both quantity and quality.
Long term: This is a measure whereby genetic improvement of local breeds for meat production through the introduction of the blood of internationally known, specialized beef breeds can be considered. Tropical breeds like the Brahman and improved Borana can be considered at the initial stage, and possible shift to the other breeds can further be looked into. This can be started in a localized manner and then scaled up/scaled out as feasible. Estrus synchronization, combined with AI, using semen from the selected breeds as an extension of the ongoing effort in the dairy sector, can be used.
Sheep and goats
The breed interventions are similar to those of cattle. There is relatively better experience in the design and implementation of community-based small ruminant programs, especially sheep breeding programs in Ethiopia through the International Center for Agricultural Research in the Dry Areas (ICARDA) project focusing on Horro, Bonga, and Menz sheep. This has shown a lot of promise; negative selection has been curbed and promising genetic progress has been attained. Incomes of participants have increased through the sale of selected breeding rams and better reproductive performance. A lot of interest has also been inspired, paving the way for scaling up. The guidelines developed and being used to guide the program at the three sites (Aynalem et al. 2011) can readily be used to replicate the relevant experience elsewhere.
Specialized meat type breeds may be imported for cross breeding and/or use as purebreds in intensive types of management for targeted meat production. The experience with the Dorper and other meat breeds can be scaled up.

76
5. MAJOR FINDINGS
5.9. Financial analysis of the proposed interventions
5.9.1. Estimations of incremental costs and benefitsAnimal conditioning requires a lot of resources and numerous activities. But in the analysis of the cost benefits, we only take the additional activities and their costs and benefits. Therefore, only those benefit and cost items that are affected by the new production models were considered. We estimated the feed costs using the best formulation that can be made under the given production context. We assumed the production involves additional health and other management costs. Thus, additional veterinary costs are included, depending on the additional health care the model requires. Farmer (2010) noted that the total spending on veterinary service of the country on a per animal basis is ETB 1/animal despite the recommended rate of ETB 31/animal. Note that all the costs are additional costs on top of the existing costs. Labor cost is not included as a payment to the farmer. We assume it can be accommodated within the current production system without requiring additional labor. We also assumed the transportation and other operating costs to be 25% of the feed costs required, including the increase in feed costs associated with an increase in the number of animals.
Furthermore, the current costs of supplements for feedlots is estimated based on the observation that feedlots use 6.3 kg of concentrates that cost ETB 6/kg and 1.9 kg of straw that cost ETB 2.8/animal. Finally, the opportunity costs of the additional money required for the improved production is included by calculating the foregone (interest) income using an 11% interest rate. The producer is assumed to buy all the required feeds and other items at the beginning of the year. No additional investment will be made, as the production can be handled with the existing facilities. Similarly, we assumed the new production model does not involve significant additional labor, as labor can be managed by the available family members who stay at home. We also assumed all other costs to remain the same and saw no need for their inclusion. The use of supplements in the traditional production system is very opportunistic and involves negligible costs. We thus assumed there is no feed supplementation in the traditional production system.
Estimation of the benefits starts with the identification of the benefit in the two systems. The primary benefits are the increase in the amount of meat obtained in a given period of time and the improvement in the quality of meat. Both production systems are assumed to achieve the minimum live weights specified for the domestic and export markets. Thus, the improved production systems are largely assumed to bring no change in the weights of the animals. But improved production systems are expected to increase the amount of meat that can be produced in a given period.
The incremental benefits of the improved production models are:
• The incremental gains in the volume of meat. The new production/conditioning model affects the overall volume of meat that can be produced per animal in a given period of time.
o Weight gains: Increments in the volume of meat associated with the weight gains of the conditioned animal. This incremental gain in the volume of meat is calculated as a difference between the volume of meat with the new production model minus the volume of meat without the production model, i.e., under the traditional production system;
o Reproduction gains: Increments in the volume of meat associated with the increase in rates of reproduction. This gain is calculated as the increments in the rate of reproduction with the proposed model. The proposed Model 1.1, for instance, increases the current rates of reproductions of animals by 100%. This assumes that the cow currently giving birth once every two years would be giving birth every year. So, the new production system would double the number of animals. Considering the natural lag in the age of animals, at the end of two years, a cow in the new model would produce one 2-year-old bull plus a 1-year-old calf: a 50% increment in the rate of reproduction in adult equivalent. If we deduct 25% of the newly born animals used for replacement of culled cows, the new model would increase the rate of reproduction in adult equivalent by 50% of 75%, which is equal to 37.5%. Finally, since the culled cow is sold, the sales revenue should also be counted as additional gains of the new model. Therefore, it is included in the incremental benefits.
o Reduction in the risk of animal mortality: The various health, feed and feeding, and other management interventions in the proposed conditioning models are expected to reduce the current risk of animal mortality. This would mean the number of animals in the new models would be higher than they would otherwise be under the traditional production system. For instance, it is assumed that the new model reduces the risk of cattle mortality by 40%. Accordingly, Model 1.1, for instance, is assumed to reduce the current young-stock mortality rate of 27% by 40%.

77Reorienting Livestock Production to Respond to the Meat Quality Requirements of High-End Domestic and Export Markets
5. MAJOR FINDINGS
• Improvement in quality of meat: Technically, the proposed conditioning model is expected to bring substantial improvements in nearly all of the desired meat quality attributes such as tenderness, marbling, color, juiciness, animal age, and fattiness. The study captures the incremental benefits of the price premiums high-end buyers are willing to pay for the improvements in the above meat quality attributes.
• Dressing percentage: Although not accounted for in the estimation of net incremental benefits, the improved production systems are also expected to bring slight improvements in the dressing percentage of the animals.
Multiplying the total meat produced in the new model and traditional production systems by their respective price at the end market gives the total monetary value of animals’ benefit at the end markets of the respective production system. In order to calculate the net incremental benefits at producer levels, these benefits are calculated based on the end-market prices and must be adjusted to feedlot and farm-gate prices. We did this by changing the prices for quality meat obtained from WTP for the high-quality meat of the high-class end market, which was then changed into animal price using an appropriate ratio for carcass weight and amount of meat by quality levels. We classified the deboned meat into prime cuts, normal cuts, and trimmings (inferior cuts) based on quality. Accordingly, the classification for beef is that 45.7%, 28.9%, and 8.9% of the total carcass weight are assumed to be prime, normal and inferior cuts respectively, with the remaining 16.6% being bones and trim-outs not included in the benefit calculation.
Then, we used the end-market prices for each class of meat obtained from our survey. After the values of meat are estimated this way for the conditioned animal conditioned in each production model, the revenues of the feedlots for the animals are obtained by deducting the marketing margins from the consumers’ prices. We do the same for traditionally conditioned animals to compute the marginal benefits between the modern and traditional production systems. Similarly, we obtain the producer/farm-gate prices for the meat produced with modern and traditional production systems by deducting the marketing margins from the respective feedlot prices. Based on the results of Teklewold et al. (2009), we used marketing margins of 21.2%, 21.3%, and 14.6% of butchers/abattoirs, feedlots, and small traders respectively for cattle marketing.
In addition to the costs and benefits that are directly related to the price of the conditioned animals, other indirect costs and benefits such as reduction in risk, cost savings, increased reproduction, etc. are also considered at
each level: producer, feedlot, and abattoir/butcher levels.
The estimation of consumer prices of animal conditioned under any of the models does not include other revenues outside the sales of meat. Thus, revenues such as from sales of hides and skins, offal, and organs are not included. This will not pose any problem to the result. This is because we expect the revenue from the sales of the byproducts from the model-conditioned and traditionally conditioned animals to be equal; in effect, the incremental revenues will be zero.
Finally, we use a conservative approach in the estimation of costs and benefits. It is important to note that these figures only represent average values. The actual magnitude of costs and benefits are location specific. The size of the herd, the availability of resources, access to markets for inputs and outputs, the seasonal patterns of the areas, etc. affect the technical and financial/economic feasibility of the production models.
5.9.2. Results of the cost-benefit analysis by intervention model
Pastoralist Models
Model 1.1: Pastoral beef for export and HED markets
This meat-improvement model is dedicated to beef production. The model fits best with the pastoralist production system. Table 12 describes the details of costs and benefits of the Model 1.1 production and conditioning system. See Appendix Table 10 for similar details for the rest of the models.
Table 13 summarizes the costs, benefits, net benefits, and weight gains of the different models considered in the study. In all cases, we found the feed, veterinary, and other operating costs and costs of the fund as relevant cost items. On the benefit side, increase in price due to quality improvements, increase in production (increase in the number of animals due to the rapid reproduction strategy and reduced risks of deaths of animals), and increase in dressing percentage are considered. All other cost and benefit items will be the same for both the modern and traditional production models. The major additional costs of the new production models at producer level are costs of supplements, which include maintenance supplements for the cow/heifer, and winter and summer production supplements for the calf. In addition to these, the new production model is expected to involve additional veterinary costs for the cow and the calf and other operating costs such as transport, marketing costs, and other miscellaneous expenditures. A production period of two years is assumed for Model 1.1 and Model 2.1, and a production period of one year is assumed for all the other models.

78
5. MAJOR FINDINGS
Model 1.1 involves maintenance supplements for the heifer/cow, winter and summer production supplements for the calf, veterinary costs for the cow and the calf, and other operating costs such as transport costs for the feed, marketing costs to purchase inputs, etc. In addition, we also considered the additional costs that arise due to an increase in the rate of reproduction. At the producer level, Model 1.1 involves additional costs of ETB 8,490.0 per animal over the production period of about two years. Since almost no supplementary feeding is practiced in the traditional production system, the feed costs with the improved production model are also incremental costs. In addition, we estimated only the increase in veterinary and other operating costs associated with modern production models.
When we go to the feedlot level, the only difference in costs between the new production model and the conventional fattening practices at the feedlot level is in the costs of supplements. It was found that inappropriate and cost-inefficient supplements are used in the current fattening practices. When we deduct the current feed costs of feedlots from the estimated feed costs of the new production model, the incremental costs were found to be small, equal to ETB 511.2. Adding this incremental cost to the producer’s incremental costs of ETB 8,490.0 gives a total incremental cost of ETB 9,001.2 associated with the Model 1.1 production system.
Similarly, we take the incremental benefits by deducting the benefits in the current production system at producer and feedlot levels from the respective benefits in the Model 1.1. conditioning system. The overall incremental benefit of Model 1.1 at the end-market level is calculated by deducting the benefits from a traditionally conditioned animal of 349 kg from the benefits of a Model 1.1 conditioned animal of the same weight. We found that the high-class end-market is willing to pay ETB 42,107.1 for a Model 1.1-conditioned cattle. Compared to the current price of ETB 23,201.5 this market pays to traditionally conditioned animals, the new production model increases the value of animal at the end market by ETB 18,905.6. When the additional resource costs associated with the new production model of ETB 9,001.2 are deducted from these incremental benefits, the new production system brings net benefits of ETB 9,904.4 per animal. When the net benefits associated with increased reproduction are added to this net benefit, it reflects the net benefits of the new production system to the society at large.
In order to compute the net benefits at feedlot and producer level, we need to account for the market and production costs incurred at different levels along the meat market chain. We begin from the end-market price. Consumers are willing to pay ETB 42,107.1 for a Model 1.1-conditioned animal. By deducting the marketing margins of the butcher/abattoir of ETB 89,26.7 from this
price, we obtain the price of ETB 33,180.4 the feedlots receive for the conditioned animal. We deduct the feedlot’s price of ETB 8,282.8 for the traditionally conditioned animal to attain the feedlots’ incremental benefits of ETB 14,897.4 from the improved conditioning model. When the incremental cost of ETB 511.2 is deducted from the incremental benefits, the feedlot would get ETB 14,386.4 net incremental benefits for each animal conditioned with Model 1.1. Assuming a medium-sized feedlot condition of 300 animals in three rounds per year, such a feedlot can earn around ETB 4.3 million per year by simply introducing the improved conditioning practice suggested under Model 1.1. But the feedlot’s realization of this benefit is contingent upon producers’ adoption of the model and their supply of 20-month-old animals with a minimum weight of 220 kg. Producers will supply animals with these specifications if they obtain net benefits that are sufficient enough to justify the additional resources and efforts required by the improved production system.
In the same manner, in order to arrive at the producers’ net incremental benefits, the incremental costs are deducted from the incremental benefits. First, deducting the feedlot’s marketing margins of ETB 7,067.4 (21.3% of the feedlot’s price) and trader’s marketing margin of ETB 3,812.5 (21.3% of the trader’s price) gives producers’ price of ETB 22,300.5 for an animal produced with the Model 1.1 production system. This means the farmer captures only 53% of the final price of ETB 42,107.1 that consumers pay for the improved meat produced under the new production model. The remaining 47% goes to the butchers (21.2%), the feedlots (16.8%), and the traders (9.1%). Similarly, deducting feedlots’ and traders’ marketing margins of ETB 3,894.2 and ETB 2,100.7 from the respective prices of a traditionally produced animal will give the producer price of ETB 12,287.8. The difference between the two prices will give an increase in farmers’ revenue of ETB 10,012.7 associated with improvements in the quality of meat. In addition to this incremental benefit from sales of the bulls, the improved production practice is also assumed to give additional benefits over the traditional production systems. The new production model is expected to increase the number of animals the farmer can produce in a given period of time. These benefits come through two mechanisms. First, the increase in the size of animals comes from a reduction in the mortality rates. Under the new production system, the current 27% rate of death is expected to decline by 40%. In addition, the improved feeding and management practices increase the number of animals a cow produces in a given period of time. In the case of cattle, the rate of reproduction is expected to double. That is, the rate of reproduction, which was one animal every two years under the traditional system, will increase to one animal every year under the new production system. So the number of animals will double. The number of animals thus increases by 100%. But since half of the female offspring, 25% are used to replace culled

79Reorienting Livestock Production to Respond to the Meat Quality Requirements of High-End Domestic and Export Markets
5. MAJOR FINDINGS
cows, the number of animals increases by 75%. Considering the time lag it takes for the newly born calves to grow to bulls, the increase in the number of animals in terms of fully-grown bulls will be 50% of the 75% increase in the number of animals. The increase in the rate of reproduction in terms of fully-grown bulls will thus be 37.5% (50%*75%). In addition to this, the farmer also gains from the sales of the culled cows. Adding the estimated secondary incremental benefits of ETB 2,453.1 associated with increase in number of animals due to reduction in animal death and ETB 8,362.5 associated with the increase in rate of reproduction and ETB 1,500 associated with the sales of culled cows with the net incremental benefits from sales of bulls of ETB 22,300.5, the producers’ total benefits from the new production system rises to ETB 34,616.2 per animal.
When the total benefits of ETB 12,287.8 under the traditional production system is deducted from the total benefits of ETB 34,616.2 the farmer earn under the new
production system, the total incremental benefits will be ETB 22,328.4. Deducting from the producer’s incremental costs of ETB 8,490.0 per animal from the total incremental benefits gives the producer’s net incremental benefits of ETB 13,838.4. So for each bull produced under the Model 1.1 production system, the producer would get ETB 13,838.4 more benefit than he/she is currently obtaining. If the farmer produced five animals with the improved model, his/her income would increase by ETB 69,192 within two years at the beginning and annually thereafter. But compared to the net incremental benefits of the feedlot, the net incremental benefit of the producer is 49.0% of the sum of the net incremental benefits of the producer and the feedlot, i.e., the remaining 51.0% goes to the feedlot. Even if the primary value addition (improvement in the quality of meat) comes from the producers, net incremental benefits that go to the producer are relatively lower than the net incremental benefits that go to the feedlot.
Results of the financial cost-benefit analysisTable 12. Detailed breakdown of costs and benefits of Model 1.1: Pastoral beef
No. Cost/benefit items Description Value in ETB
I Incremental cost streams of Model 1.1 A - B 9,001.2
A Incremental operating costs at the producer level i + ii 8,490.0
i Cost of fund (interest on Incremental Costs (IC) (IC/2*(1.11^2) + (IC/2)*1.11) – Incrementa Costs(IC) 1,240.1 ii Incremental reproduction and production costs iii + iv + 1 - 2 7,249.9 iii Other operating costs—transportation 25% of feed costs 1,256.4 iv Additional feed and veterinary costs for increased reproduction 50% of 75% retention + 40% of 27% death risk 1,952.0 1 Costs with Model 1.1 at producer level 1.1 + 1.2 + 1.3 + 1.4 4,041.4
1.1 Reproduction program 1.1.1 + 1.1.2 300.0
1.1.2 Additional veterinary costs for the cow ETB 25/month/cow*12 months 300.0 1.2 Winter maintenance supplement 1.2.1 + 1.2.2 901.3
1.2.1 Supplement feed costs for the cow ETB 3.83/day/animal*183 days 701.3 1.2.2 Additional veterinary costs for the calf ETB 25/month/calf*8 months 200.0 1.3 Winter production supplement 1.3.1 + 1.3.2 1,478.2
1.3.1 Supplement feed costs for the calf ETB 7.24/day/animal*183 days 1,325.7 1.3.2 Additional veterinary expenses ETB 25/month/calf*183 days/30 days/month 152.5 1.4 Summer production supplement 1.4.1 + 1.4.2 1,361.9
1.4.1 Supplement feed costs for the calf ETB 7.5/day/animal*182 days 1,361.9 2 Costs with traditional production system at the producer level 2.1 0.0
2.1 No additional supplement 0.0 B Incremental costs with Model 1.1 feedlot 3 - 4 511.2
3 Costs with Model 1.1 production system 3.1 + 3.2 + 3.3 5,526.0
3.1 Supplement feed cost: starter ETB 28.8/day/animal*14 days 403.6 3.2 Supplement feed cost: grower ETB 45.0/day/animal*76 days 3,421.5 3.3 Supplement feed cost: finisher ETB 56.7/day/animal*30 days 1,700.9 4 Costs with current production system 4.1 + 4.2 5,014.8
4.1 Supplement feed cost ETB 6.3/kg*8kg/day/animal*90 days 4,536.0 4.2 Roughage ETB 2.8*1.9kg/day/animal*90 days 478.8
continued on next page

80
5. MAJOR FINDINGS
II Incremental benefit streams with Model 1.1 production system A 18,905.6
A Incremental benefits with Model 1.1 5 - 6 18,905.6
5 Benefit from sales of meat in Model 1.1 5.3 + 5.4 + 5.5 42,107.1
5.1 Total weight 332.0 5.2 Carcass weight Dressing percentage of 54.3% 180.3 5.3 Value of prime cuts 5.3.1*5.3.2 28,835.1 5.3.1 Carcass weight for prime cuts 45.7% of carcass weight 82.4 5.3.2 High-class consumers’ willingness to pay for prime cuts ETB 350/kg 350.0 5.4 Value of normal cuts 5.4.1*5.4.2 10,383.9 5.4.1 Carcass weight for normal cuts 28.8% of carcass weight 51.9 5.4.2 Consumers’ willingness to pay for normal cuts ETB 200/kg 200.0 5.5 Value of trimmed meat 5.5.1*5.5.2 2,888.0 5.5.1 Carcass weight trimmed meat cuts 8.9% of carcass weight 16.0 5.5.2 Consumers’ willingness to pay for inferior cuts ETB 180/kg 180.0 6 Benefit streams with traditional production system 6.3 + 6.4 + 6.4 23,201.5
6.1 Live weight 320.0 6.2 Carcass weight Dressing percentage of 50% 160.0 6.3 Value of prime cuts 6.3.1*6.3.2 13,465.9 6.3.1 Carcass weight for prime cuts 45.7% of carcass weight 67.3 6.3.2 Consumers’ willingness to pay for prime cuts ETB 200/kg 200.0 6.4 Value of normal cuts 6.4.1*6.4.2 7,637.6 6.4.1 Carcass weight for normal cuts 28.8% of carcass weight 42.4 6.4.2 Consumers’ willingness to pay for normal cuts ETB 180/kg 180.0 6.5 Value of trimmed meat 6.5.1*6.5.2 2,098.0 6.5.1 Carcass weight for inferior cuts 8.9% of carcass weight 13.1 6.5.2 Consumers’ willingness to pay for inferior cuts ETB 160/kg 160.0 III Net benefit of Model 1.1 production system II - I 9,904.4
C Incremental benefits with Model 1.1 at the feedlot level 7 - 8 14,897.6
7 Revenues from animal in Model 1.1 7.1 - 7.2 33,180.4
7.1 Consumers’ price for animal in Model 1.1 5 42,107.1 7.2 Butchers’/abattoirs’ margin 21.2% butchers’ marketing margin 8,926.7 8 Sales of the conditioned animal in the traditional method 8.1 - 8.2 18,282.8
8.1 Consumers’ willingness to pay for meat 6 23,201.5 8.2 Butchers’/abattoirs’ margin 21.2% butchers’ marketing margin 4,918.7 IV Net incremental benefit at the feedlot level C - B 14,386.4
D Total incremental benefits with Model 1.1 at the producer level 9 - 10 22,328.4
9 Total benefit with Model 1.1 at producer level 9.1 + 9.2 + 9.3 34,616.2
9.1 Farmers’ price for Model 1.1-conditioned anima1 7 - 9.1.1 - 9.1.2 22,300.5 9.1.1 Feedlot marketing margin 21.3% of feedlot’s price 7,067.4 9.1.2 Other actors’ marketing margin 14.6% of trader’s price 3,812.5 9.2 Benefits due to a reduction in risks of animal deaths 40% reduction in risk of 27.5% current risk 2,453.1 9.3 Benefits associated with an increase in reproductive rate 50% of 75% 8,362.7 9.4 Benefits from the sales of culled cows 25% of market price of ETB 6,000/culled cow 1,500.0 10 Benefits from sales for traditional conditioning 10 - 10.1.1 - 10.1.2 12,287.8
10.1 Sales of traditionally conditioned animal 8 18,282.8 10.1.1 Feedlot marketing margin 21.3% of feedlot’s price 3,894.2 10.1.2 Other actors’ marketing margin 14.6% of trader’s price 2,100.7 V Net incremental benefit at producer level D - A 13,838.4
E Incremental weight gain in Model 1.1 at the producer level Weight Gain (WG) in Model 1.1 - WG in traditional 108.0
11 Total weight gain in Model 1.1 220.0 12 Total weight gain in traditional production 112.0 VI Overall return to feedlot and producers
continued from previous page
continued on next page
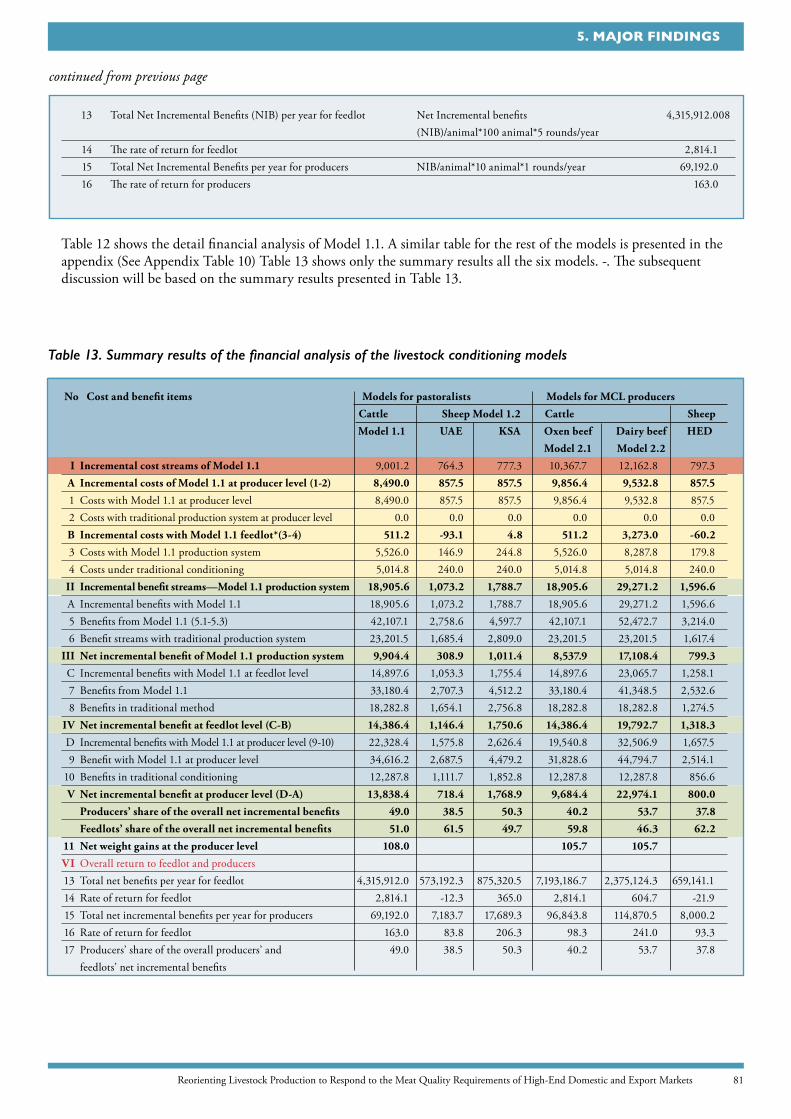
81Reorienting Livestock Production to Respond to the Meat Quality Requirements of High-End Domestic and Export Markets
5. MAJOR FINDINGS
13 Total Net Incremental Benefits (NIB) per year for feedlot Net Incremental benefits 4,315,912.008 (NIB)/animal*100 animal*5 rounds/year 14 The rate of return for feedlot 2,814.1 15 Total Net Incremental Benefits per year for producers NIB/animal*10 animal*1 rounds/year 69,192.0 16 The rate of return for producers 163.0
No Cost and benefit items Models for pastoralists Models for MCL producers
Cattle Sheep Model 1.2 Cattle Sheep
Model 1.1 UAE KSA Oxen beef Dairy beef HED
Model 2.1 Model 2.2
I Incremental cost streams of Model 1.1 9,001.2 764.3 777.3 10,367.7 12,162.8 797.3 A Incremental costs of Model 1.1 at producer level (1-2) 8,490.0 857.5 857.5 9,856.4 9,532.8 857.5
1 Costs with Model 1.1 at producer level 8,490.0 857.5 857.5 9,856.4 9,532.8 857.5 2 Costs with traditional production system at producer level 0.0 0.0 0.0 0.0 0.0 0.0 B Incremental costs with Model 1.1 feedlot*(3-4) 511.2 -93.1 4.8 511.2 3,273.0 -60.2
3 Costs with Model 1.1 production system 5,526.0 146.9 244.8 5,526.0 8,287.8 179.8 4 Costs under traditional conditioning 5,014.8 240.0 240.0 5,014.8 5,014.8 240.0 II Incremental benefit streams—Model 1.1 production system 18,905.6 1,073.2 1,788.7 18,905.6 29,271.2 1,596.6
A Incremental benefits with Model 1.1 18,905.6 1,073.2 1,788.7 18,905.6 29,271.2 1,596.6 5 Benefits from Model 1.1 (5.1-5.3) 42,107.1 2,758.6 4,597.7 42,107.1 52,472.7 3,214.0 6 Benefit streams with traditional production system 23,201.5 1,685.4 2,809.0 23,201.5 23,201.5 1,617.4 III Net incremental benefit of Model 1.1 production system 9,904.4 308.9 1,011.4 8,537.9 17,108.4 799.3
C Incremental benefits with Model 1.1 at feedlot level 14,897.6 1,053.3 1,755.4 14,897.6 23,065.7 1,258.1 7 Benefits from Model 1.1 33,180.4 2,707.3 4,512.2 33,180.4 41,348.5 2,532.6 8 Benefits in traditional method 18,282.8 1,654.1 2,756.8 18,282.8 18,282.8 1,274.5 IV Net incremental benefit at feedlot level (C-B) 14,386.4 1,146.4 1,750.6 14,386.4 19,792.7 1,318.3
D Incremental benefits with Model 1.1 at producer level (9-10) 22,328.4 1,575.8 2,626.4 19,540.8 32,506.9 1,657.5 9 Benefit with Model 1.1 at producer level 34,616.2 2,687.5 4,479.2 31,828.6 44,794.7 2,514.1 10 Benefits in traditional conditioning 12,287.8 1,111.7 1,852.8 12,287.8 12,287.8 856.6 V Net incremental benefit at producer level (D-A) 13,838.4 718.4 1,768.9 9,684.4 22,974.1 800.0
Producers’ share of the overall net incremental benefits 49.0 38.5 50.3 40.2 53.7 37.8
Feedlots’ share of the overall net incremental benefits 51.0 61.5 49.7 59.8 46.3 62.2
11 Net weight gains at the producer level 108.0 105.7 105.7
VI Overall return to feedlot and producers 13 Total net benefits per year for feedlot 4,315,912.0 573,192.3 875,320.5 7,193,186.7 2,375,124.3 659,141.1 14 Rate of return for feedlot 2,814.1 -12.3 365.0 2,814.1 604.7 -21.9 15 Total net incremental benefits per year for producers 69,192.0 7,183.7 17,689.3 96,843.8 114,870.5 8,000.2 16 Rate of return for feedlot 163.0 83.8 206.3 98.3 241.0 93.3 17 Producers’ share of the overall producers’ and 49.0 38.5 50.3 40.2 53.7 37.8 feedlots’ net incremental benefits
Table 12 shows the detail financial analysis of Model 1.1. A similar table for the rest of the models is presented in the appendix (See Appendix Table 10) Table 13 shows only the summary results all the six models. -. The subsequent discussion will be based on the summary results presented in Table 13.
continued from previous page
Table 13. Summary results of the financial analysis of the livestock conditioning models

82
5. MAJOR FINDINGS
Model 1.2: Sheep/goats for export markets
The improved conditioning model designed for sheep is divided into three categories due to the differences in the preferences of target markets. As discussed previously, the dominant importers of sheep and goat meat are UAE and KSA. While the KSA market prefers sheep/goats of a bigger size, with a live weight of about 30 kg, the UAE market prefers a small size, with a live weight of 18 kg. The domestic market prefers sheep of medium size, with a live weight of about 22 kg. Even though both sheep and goat are currently exported to these destinations, the demand for goat is rising rapidly to replace sheep. In the case of meat exports, goat meat represents about 95% of the total value of exports of shoat meat. On the other hand, in the case of live animal exports, the exports of live sheep represent about 90% of the value of export of live shoats. But since the export of shoat meat represents more than 70% of the total value of shoat exports, goats play a more dominant role in the export market than do sheep. The cost-benefit analysis presented here refers to sheep conditioning, but it can be adapted for goat conditioning.
Model 1.2.1: Sheep for UAE export market
This model is dedicated to the conditioning of sheep for the UAE export market. The only difference in this case is the animal is conditioned until it attains a live weight of 21.45 kg. The model involves incremental costs of ETB 857.9 at the producers’ level and saves costs of ETB 93.1 for the feedlot. The calculation of these costs and benefits is based on a similar assumption as described under Model 1.1. On the benefit side, the model brings incremental benefits of ETB 1,575.8 to the producer. Deducting the incremental costs at the producer level from this incremental benefit gives a net incremental benefit of ETB 718.4 per sheep for the producer. The corresponding figure for the feedlot is ETB 1,146.4 (1,053.3 + 93.1). As in the case of Model 1.1, the net incremental benefits of the model for the producer are considerably lower than for the feedlot. The model is highly biased toward the feedlot. For each ETB 1 additional cost, the model gives the producer about ETB 0.84 returns.
Model 1.2.2: Sheep for KSA export market
Similar to the above, this model is dedicated to the conditioning of sheep for KSA export market. The only difference here is the animal is conditioned until it attains a live weight of 35.6 kg. The model involves incremental costs of ETB 857.8 at the producers’ level and ETB 4.8 at the feedlot level. On the benefit side, the model brings incremental benefits of ETB 2,626.4 to the producer. Deducting the incremental costs at producer level from this incremental benefit gives a net incremental benefit of ETB 1,768.9 per sheep for the producer. The corresponding figure for the feedlot is ETB 1,750.6
(1,755.4 - 4.8). Like the previous models, this model is also highly biased toward the feedlot. But compared to the model for UAE, this model provides producers with better returns. For each ETB 1 additional cost, the model gives the producer ETB 2.06 returns. This rate of return is highly attractive for the pastoralists even though it is smaller than the rate of return of ETB 3.65 of the feedlots. Thus, it can be made more attractive if some mechanisms, such as a coordinated value chain approach that redistributes the benefits among the different actors, are introduced as an integral part of the production and conditioning models.
MCL models Model 2.1: MCL for HED market
This model is similar to Model 1.1, except the production of working oxen is an integral part of the beef production model here. Thus, the estimated costs and benefits are more or less the same. The main difference between the two arises from the difference in the rate of reproduction. In the case of Model 1.1, all the newly born male and female animals, except 25% of females that are used for replacements, will enter into the beef production model. Thus, the number of animals in Model 1.1 is assumed to be 75% higher than in the traditional system. Given the lag in the growth of calves between successive generations, the cost and benefit are expected to rise by 50% of 75%. Even if the number of animals in this model also grows at the same rate (i.e., 75%), in this model half (50%) of the male calves will enter into oxen production. That means, from the 75% increase in the number of calves, 50% of 50% male will enter into oxen production. The number of calves for beef production thus increases by 25% male (50% of 50% male) and 25% female (taking 25% of females off for production replacement). Note that there is an additional gain from the sales of the culled cows. These differences are taken into consideration in the estimation of costs and benefits.
The results of the cost-benefit analysis show that the model involves incremental costs of ETB 9,856.4 to producers, while it increases feedlots costs only by ETB 511.2. On the benefit side, the model generates incremental benefits of ETB 19,540.8 to the producer and ETB 14,897.6 to the feedlot. Accordingly, the net incremental benefits to the producer and feedlot will be ETB 9,684.4 and ETB 14,386.4 respectively. For the feedlots, there is no difference between this model and Model 1.1. The inclusion of oxen production in the production system affects only the producers’ costs and benefits. The net incremental benefits of this model are about 30% lower than Model 1.1. This is because some of the animals are taken off from the herd under the model to meet the farmer’s demand for oxen power. It is a model designed to fit the context of the MCL farming system. As in the case of Model 1.1, the distribution of benefits is biased toward the feedlots.

83Reorienting Livestock Production to Respond to the Meat Quality Requirements of High-End Domestic and Export Markets
5. MAJOR FINDINGS
made still more attractive if the models are integrated with marketing interventions that redistribute the gains between the various actors.
5.9.3. Key findings of the cost-benefit analyses Cattle models
The model generates very large net incremental benefits for the feedlot by making only small adjustments in the formulation of feed supplements. As a result, in all cases, the rate of return to the feedlots is considerably higher than the rate of return to the farmers. The return for ETB 1 additional investment in the new model generates a net incremental return of up to ETB 28.14 for the feedlots (i.e., 2,814% return). But feedlots can realize the benefits of this lucrative conditioning system only if a sufficient number of producers (pastoralists and farmers) simultaneously and fully adopt the new production model. This quality improvement comes only when the feedlots are able to start the conditioning with young bulls of below 2 years of age and a minimum live weight of 220 kg. Unless the farmers adopt the technology, there is no other firm supply of bulls of this quality in the current context. Thus, none of the agents along the chain will realize the envisaged incremental benefits if farmers have not adopted the new production model. The issue is thus to what extent the model attracts farmers to adopt the production models.
The same analysis done at farmers’ level shows that the new production models also generate sizeable net incremental benefits. Even if the relative net incremental benefits for the farmers are lower than for the feedlots, the net incremental benefits to the farmers are also large when they are evaluated in terms of the net gains without the model (the current traditional production system). The results show that the gains are large enough to arouse farmers’ interest in quickly adopting the model. Even though the producers’ gains are not small by a general business standard, the effects are highly biased toward the feedlots. Studies suggest that farmers’ adoption of production technologies tend to be slower if the rate of return is below 50%. Most farmers are risk averse. For the technologies to motivate them to take the risk of shifting away from the traditional production system, they should generate substantially high net incremental benefits. In this regard, the net incremental benefits per unit incremental costs under Model 1.1 is ETB 1.63. That is, for each ETB 1 additional investment, the farmer earns ETB 1.63 net incremental benefits (163% rate of returns).
Compared to the financial net returns at the feedlot level, all the models generate relatively smaller returns to the farmers. The relative rates of return of the models to the feedlots are dramatically higher than the returns to the farmers. The relative rate of returns to the producers will further be smaller if we consider the rate of return per unit
Model 2.2: Dairy beef for HED and export markets
Unlike all the other models that use animals of selected local breeds, this one uses pure or hybrid cattle. The model attempt to embed a beef production and conditioning model into the dairy production system. The model involves incremental costs of ETB 9,532.8 and ETB 3,273.0 to producers and feedlots respectively. Given these costs, it is expected to generate incremental benefits of ETB 32,506.9 and ETB 23,065.7 for the producer and the feedlot respectively. The model generates net incremental benefits of ETB 22,974.1 and ETB 19,792.7 for the producer and feedlot respectively. Compared to all other models, this model distributes the net benefits between producers and feedlots relatively fairly. The share of producers from the total incremental benefits of producers and feedlots is about 53.7%. Furthermore, the model generates a high return, as it generates ETB 2.4 for each ETB 1 additional cost the producer incurs in the production. This is consistent with the idea that the benefits of improved practices will be optimum when they are combined with complementary technologies. The corresponding figure for the feedlots is ETB 6.05, which is about threefold of the rate of returns of the producers. Thus, balancing the distributions of the gains with the efforts and investments of time and resources involved is always beneficial from the point of view of both efficiency and equity.
Model 2.3: Sheep for the HED market
This conditioning model is designed for the HED market. The model involves additional feed, veterinary, and operating costs of ETB 857.8 at producer levels. On the other hand, the feedlots enjoy a cost saving of about ETB 60.2 per sheep. On the benefits side, the model involves additional benefits of ETB 1,258.1 at the feedlot and ETB 1,657.5 at the producer levels. Deducting the incremental costs from the respective incremental benefits would give net incremental benefits. Accordingly, deducting the negative incremental costs of ETB 60.2 from the incremental benefits of ETB 1,258.1 gives feedlot’s net incremental benefits of ETB 1,318.3. Similarly, deducting the producer’s incremental costs of ETB 857.8 from its incremental benefits of ETB 1,657.5 gives the producers net incremental benefits of ETB 800.0 per sheep. Producers capture only 37.8% of the total net incremental benefits of the model to the producers and feedlots. The return for the feedlot is infinite, as the feedlot does not incur additional costs. Instead, the model enables the feedlots to save feed costs. Thus, while the model offers infinite return without additional investment for the feedlots, it offers ETB 0.93 returns for each ETB 1 additional cost incurred for the model. Given that the opportunity costs of money is already considered in the computation of costs, this rate of return is still an attractive return for the producer. As mentioned before, it can be

84
5. MAJOR FINDINGS
of time. Thus, even if the model’s rate of returns for the farmers is not small in absolute terms, it is totally not proportional with relative contributions of feedlots and producers to the production of the improved quality meat. This is because the major source (95.4%) of feedlots’ net incremental benefits comes from the effects of the new model on the improvements in the quality of meat produced in the value chain. The economization of feed costs in the new model contributes only 4.6% of the net incremental benefits.
Moreover, at the feedlot level, the new model involves no more adjustment than feed reformulation of the current feed ingredients. In contrast, the model requires producers to shift away from the current longstanding traditional livestock-rearing system and to make some adjustments in their current livelihood system. In a strict sense, the model not only introduces intensive management practices (intensive supplements, health care, animal selection, etc.), it also slightly affects the pattern of milk supply, herd size, and other aspects of the existing production system. The issue is that the relative gains of feedlots and producers are not proportionate vis-à-vis the additional efforts and commitments they make. Furthermore, while the new model is a risk-free business for the feedlots, it is not so for the producers. We found the income effects of the new production model is biased toward the upstream market actors such as feedlots, abattoirs, butchers, hotels, and the like. Special attention is needed for the new production model to bring meaningful change to the sector.
Thus, it is important to emphasize that the realization of the benefits and costs at all levels crucially hinges on the attractiveness of the net incremental benefits to the farmers and the relative distributions of the net gains across the various actors along the chain. The very idea of value chain development is to incentivize all actors along the chain to cooperate in the value-addition process efforts, creating fair distributions of the gains proportional to actors’ contributions. One of the main factors that cause such unfair distributions of benefits is that the livestock markets are not efficient enough to distribute the gains among the different actors proportionately according to their respective contributions in the value additions. In theory, when the various actors at each market level along the chain freely compete, the market is expected to converge to the long-run equilibrium where the incremental benefits will be distributed proportionately to actors’ relative contributions in the value additions. Thus, the outcomes are expected to be suboptimal if the distributions are not proportional to relative contributions.
A lot of actors are involved in the beef market chain: butchers, transporters, feedlots, traders, exporters, brokers, feed suppliers, and many other agents (municipalities, quarantine centers, meat inspectors, financiers, etc.). Many
studies document that the transaction and transportation costs incurred by these actors at each stage along the chains are high. Even if the transaction and marketing costs are generally high for all agricultural markets, they are even higher in the specific case of livestock markets. Studies show that about half of the final consumer price goes to the various market actors, and producers only receive the residual half of the final prices (Shapiro et al. 2017, Teklewold et al. 2009, Farmer 2010). Thus, redistributing the net incremental gains from the model to the producers who are at the bottom of the chain primarily requires the reduction of the current high marketing costs incurred at each stage.
In addition to the current distribution of the incremental benefit between actors along the chain being biased against producers, there is a special problem in the beef markets. One of the main problems is that the domestic prices are considerably higher than world market prices due to the reasons discussed in the previous sections. The implication of this is that the estimated net incremental benefits will be realized so long as the increase in the supply of high-quality beef does not depress the domestic price. For this to occur, the increase in supply caused by the wide adoption of the new model should be so large that it exceeds the domestic demands. Given the rising domestic demand associated with the rapidly expanding high-standard hotels, this may not happen unless the rate of adoption of the model is higher than the rise in demand. The supply can still depress the domestic price if the country relaxes the current trade policies. Assuming the currently restricted imports continue to exist, the potential adverse effects of price decline caused by excess supply can partly be absorbed by promoting exports. Given that the world price of beef is lower than the domestic price, the extent to which the export outlet buffers the beef sector against price risks depends on the sensitivity of the new net incremental benefits of the production models.
Sheep models
The models designed to improve sheep meats are relatively less effective compared to cattle models. The main reason is that the increase in the rate of reproduction and the response of the sheep to feed inputs are relatively lower than for cattle. In addition, the HED and export markets demand sheep at an early age, and hence the conditioning interventions add little weight to the animals. This is especially serious for the UAE market. Producers can earn attractive benefits from sheep conditioning only if they can benefit from economies of scale. Furthermore, the high marketing margins, especially in the domestic markets, are eroding the potential gains of producers.

85Reorienting Livestock Production to Respond to the Meat Quality Requirements of High-End Domestic and Export Markets
5. MAJOR FINDINGS
5.9.4. Sensitivity analysis
Sensitivity of models’ profitability to changes in marketing margins
As discussed above, the share of producers who are located at the bottom of the meat chain is smaller compared to the gains to upstream actors such as traders, feedlots, butchers, and restaurants and hotels. The impacts of the models are thus biased against the producers who play dominant roles in the value additions. The issue is not merely about the fairness of the gains. Rather, the model may not be totally implemented if the markets fail to incentivize producers. The question is what can be done about it. The interest here is to examine the sensitivity of key performance indicators to changes in some parameters. We consider the effects of changes in marketing margins at different market levels in the chain and changes in the final consumer prices of the animals conditioned under the improved model.
Table 14 shows the results of the alternative scenario of changes in these parameters. We consider the effect of reductions in the marketing margin of the main market actors in the chain: traders, feedlots, and butchers/abattoirs. In the first scenario, we considered the effects of a 1% decline in the marketing margin of butchers/abattoirs. As shown in the table, a 1% decline in butchers’/abattoirs’ margin increases the net incremental benefits of producers by about 0.4%, 0.5%, and 0.3% for pastoralist-cattle, oxen-beef, and dairy-beef models respectively. On the other hand, the effect of a 1% decrease in butchers’ margin has only negligible effects on sheep models, except on the HED sheep model with the response of an 0.55% increase in producer NIBs. The increase in the producers’ NIBs for UAE and SA sheep models is only 0.04% and 0.03% respectively. It also increases the producers’ share in the total incremental benefits of producers and feedlots by 0.14% for all models except the UAE and KSA sheep models. That is, it distributes the benefits from feedlots to producers. In sum, however, the effects are modest; the reduction in marketing margin at the upstream level benefits producers. Despite the butchers’ margin being high in terms of magnitude, the effects on producers is small. The reason is that the reduced margin will be also be captured by feedlots and traders before it reaches producers.
The reduction in the marketing margin of feedlots has similar effects on cattle producers. But the effect on sheep producers is considerably high. A 1% reduction in feedlot’s margin increases the NIB of producers by more or less similar magnitude as in the case of the effects of a reduction in butchers’ margin. The only difference here is that unlike in the cases of other models, the effects of a 1%
reduction in butchers’ margin on producers’ shares and producers’ net incremental benefits in the UAE and SA sheep models are negligible.. The reason is that unlike in the other models where the butchers’ marketing margin is about 21% of the final price, the butchers’ marketing margins in the case of UAE and SA sheep models is only 3%. On the other hand, like in the case of other models, the reduction in feedlot margins increases producers’ net incremental benefits by about 0.6% and 0.4% for the UAE and SA sheep models respectively.
The other major actors in the chain are traders, whose numbers and length of chain vary depending on the remoteness of the market and other factors. The reduction in traders’ margin by 1% has more or less equal effects on all the models. But compared to the effects of the reduction in the feedlot’s margin, the effects of the reduction in the traders’ margin on producers’ net incremental benefits and market share are lower in all cases. Unlike the effects of a reduction in butchers’ margin, which will be captured by all other downstream actors along the chain, the effects of a reduction in traders’ margins are fully captured by producers. The reduction in marketing margin at this level will be fully captured by producers, as it will not be shared by another actor. But the reason the effect is smaller than the effects of a reduction in feedlots’ margin is that the relative magnitude of the feedlot’s margin is almost twice the traders’ margin.
Finally, we considered the effects of a simultaneous decline in all margins across the chain. That is, we examined the effects of a 1% decrease in the butchers’, feedlots’, and traders’ margins. The cumulative effects of a simultaneous decline of the marketing margins at the three levels will increase the producers’ NIB by more than 1% in all cases. In all models except SA-sheep and dairy-beef models, a 1% decline in marketing margins at all levels along the chain increases the net incremental benefits of producers by more than 1%. It will also have similar effects in increasing the rate of returns. The implication is that the impacts of market interventions that reduce marketing margins only at some level along the chain on producers’ net incremental benefits will be limited. Such interventions can have better impacts on producers when the interventions are targeted to reduce transaction, transportation, and other costs at all levels along the chain. Shortening the chain by directly connecting final users of the product with producers could be one option, especially for those areas that are accessible and near the central and export markets.

86
5. MAJOR FINDINGS
Sensitivity of models’ profitability to changes in prices
In addition to reducing marketing margins, the other alternative interventions are to affect prices of outputs and inputs at different levels of the markets along the chain. The interest is to assess the extent to which the estimated NIBs are sensitive to changes in prices of outputs and/or inputs. We examine the effects of a 1% rise in end-market prices of the animals conditioned under the improved
model on the different profitability indicators on producers. As shown in Table 15, the effect of price is much higher than comparable changes in the marketing margin. The results show that a 1% rise in final end-market prices of the animals conditioned under the improved models will increase the producers’ NIBs by more than 1%. It increases the producer’s NIBs by 2.34%, 3.04%, and 1.62% for pastoralist-cattle, beef-oxen, and dairy-beef models respectively. The effects of the rise in
Key indicators Pastoralists MCL producers Cattle Sheep Model 1.2 Cattle models Sheep Model 1.1 Model 2.3 UAE KSA Oxen Dairy HED -beef -beef Model Model 2.1 2.2Reduction in marketing margins A 1% reduction in marketing margin of butchers/abattoirs Net incremental benefit of producers 13,894.4 718.7 1,769.4 9,732.9 23,042.7 804.5Percentage increase in incremental benefits 0.40 0.04 0.03 0.50 0.30 0.55of producersPercentage change in rate of return for producers 0.40 0.04 0.03 0.50 0.30 0.56Producers’ share of the overall net incremental benefits 0.03 0.01 0.00 0.05 0.00 0.07Change in producers’ share of consumer price 0.14 0.01 0.01 0.14 0.14 0.141% reduction in marketing margin of feedlots Net incremental benefit of producers 13,894.8 722.6 1,776.0 9,733.2 23,043.1 804.5Percentage increase in incremental benefits of 0.41 0.59 0.40 0.50 0.30 0.56producers Percentage change in rate of return for producers 0.41 0.59 0.40 0.50 0.30 0.56Producers’ share of the overall net incremental benefits 0.10 0.14 0.10 0.12 0.07 0.13Change in producers’ share of consumer price 0.14 0.18 0.18 0.14 0.14 0.141% reduction in traders’ marketing margins Net incremental benefit of producers 13,874.0 721.1 1,773.4 9,715.2 23,017.7 802.9Percentage increase in incremental benefits of producers 0.26 0.37 0.25 0.32 0.19 0.35Percentage change in rate of return for producers 0.26 0.38 0.25 0.32 0.19 0.35Producers’ share of the overall net incremental benefits 0.06 0.09 0.06 0.08 0.05 0.08Change in producers’ share of consumer price 0.09 0.11 0.11 0.09 0.09 0.091% reduction in marketing margins at all levels Net incremental benefit of producers 13,986.8 725.6 1,781.0 9,812.9 23,155.8 811.8Percentage increase in incremental benefits of producers 1.06 1.00 0.68 1.31 0.78 1.45Percentage change in rate of return for producers 1.07 1.01 0.68 1.33 0.79 1.48Producers’ share of the overall net incremental benefits 0.20 0.23 0.17 0.25 0.12 0.28Change in producers’ share of consumer price 0.38 0.30 0.30 0.38 0.38 0.38
Table 14. Sensitivity of key performance indicators to changes in marketing margins

87Reorienting Livestock Production to Respond to the Meat Quality Requirements of High-End Domestic and Export Markets
5. MAJOR FINDINGS
price are even higher for sheep conditioning models. The intervention increases the producer NIBs by 3.61%, 2.47%, and 3.05% for UAE, KSA, and HED sheep models respectively.
The above analysis assumes that there is no change in the market condition. That is, the part of the gains from the increase in prices is also captured by various actors along the chain, and hence the marketing margin also rises. But interest also arises to assess the impacts of such price interventions on producers, holding the marketing margin at each level along the chain constant. We are assuming marketing interventions that ensure that any price incentives made at higher-level markets fully reach producers. Interventions such as fair trade/specialty trade and other forms of market interventions can have a similar effect. Compared to the effects of the rise in prices of final outputs without any interventions to improve the market, the increase in final price will have greater effects on
producers when it is supported with an intervention that also contains marketing margins. In all cases, the effects on the NIB of producers will be almost double when the increase in final prices is not captured by the market actors.
Furthermore, the study considered the effects of input price interventions on the same indicators, holding all other variables (marketing margins and output prices) constant. The results show that the effects of a 1% reduction in prices of inputs increase many outcome indicators by considerable percentages. For instance, the intervention increases the NIB of Model 1.1: Pastoralist beef, Model 2.1: Dairy beef, and Model 2.2: Oxen beef by 0.61%, 0.41%, and 1.01% respectively. The effects of a 1% decline in input prices increases NIBs of all sheep models except SA sheep models by more than 1%. It increases producers’ NIBs of UAE, SA, and HED sheep models by 1.18%, 0.48%, and 1.06% respectively. The intervention
Key indicators Pastoralists MCL producers Cattle Sheep Model 1.2 Cattle models Sheep Model 1.1 Model 2.3 UAE KSA Oxen Dairy HED -beef -beef Model Model 2.1 2.2A 1% increase in the final price of model-conditioned animals Net incremental benefit of producers 14,169.6 745.2 1,813.7 9,987.7 23,352.0 825.2Percentage increase in incremental benefits of producers 2.34 3.61 2.47 3.04 1.62 3.05Percentage change in rate of return for producers 2.39 3.74 2.53 3.13 1.65 3.14Change in producers’ share of the overall net 0.02 0.32 -0.01 0.19 -0.11 0.28incremental benefits Change in producers’ share of consumer price 0.00 0.00 0.00 0.00 0.00 0.00A 1% increase in the final price of model-conditioned animals, holding marketing margin constant Net incremental benefit of producers 14,463.7 759.1 1,836.8 10,257.0 23,687.7 847.5Percentage increase in incremental benefits of producers 4.32 5.37 3.70 5.58 3.01 5.60Percentage change in the rate of return for producers 4.52 5.67 3.84 5.91 3.11 5.93Producers’ share of the overall net incremental benefits 0.38 0.75 0.29 0.69 0.11 0.79Change in producers’ share of consumer price 0.14 0.18 0.18 0.14 0.14 0.141% reduction in input prices Net incremental benefit of producers 13,923.3 726.9 1,777.5 9,782.9 23,069.4 808.6Percentage increase in incremental benefits of producers 0.61 1.18 0.48 1.01 0.41 1.06Percentage change in rate of return for producers 1.63 2.22 1.50 2.04 1.43 2.09Producers’ share of the overall net incremental benefits 0.15 0.28 0.12 0.24 0.10 0.25Change in producers’ share of consumer price 0.00 0.00 0.00 0.00 0.00 0.00
Table 15. Sensitivity of key performance indicators to changes in marketing margins

88
5. MAJOR FINDINGS
also increases the rate of return of the models considerably. It redistributes the gains away from feedlots to producers. Finally, it was found that this intervention had no effect on producers’ share of final prices.
Break-even input costs and output prices
Finally, the study examines the changes in input and output prices that put the new production models at break-even points. The interest is on producer NIBs, as there is no problem with the NIBs of feedlots. The results show that the sheep models are especially highly sensitive to changes in input prices. For instance, holding all other variables constant, rises in input costs by 83.8%, 206.3%, and 98.3% put the NIBs of UAE, KSA, and HED sheep models at the break-even point. Similarly, the cattle models are sensitive to rise in input costs. The pastoralist-, oxen-beef, and dairy-beef models will be at break-even point if input prices for cattle production and conditioning increase by 163.0%, 98.3%, and 241.0%. The models will remain profitable until the price increases by 100% and above. In contrast, all the models seem to be more sensitive to a decline in output prices. The pastoralist-cattle model (Model 1.1), the MCL model (Model 2.1), and dairy-beef model (Model 2.1) will not be profitable if the decline in output prices exceed 47.03%, 53.6%, and 38.1% respectively. Similarly, the sheep models of UAE, SA, and HED will be at the break-even point if the prices of meat decline by 42.9%, 42.9%, and 48.4% respectively. See Table 16.
Compared to the sensitivity of the models to changes in input costs, all the models are relatively more sensitive to a decline in output prices. The important implication of the high sensitivity of models to output prices is that domestic beef will become uncompetitive if the decline in world price exceeds about 50%.
In sum, the results demonstrate that the effects of price interventions are stronger than market interventions in benefiting producers. But what possible interventions can
be made to improve output prices and reduce input prices? Output and input price subsidies of various forms are one alternative policy to benefit producers. But not only may it be difficult for the government to finance such interventions given the numerous producers, such interventions can also have unintended adverse effects on allocative efficiency. The market distortion effects of such interventions could be considerable. Administering such interventions, especially in the case of outputs and local inputs, is another problem. The other alternative is to use favorable foreign exchange policy. The current exchange rate policy is highly biased against export products. Given that the country’s exports are dominantly agricultural products, the current exchange rate policy works against the export sector. One of the sectors adversely affected by the policy is the livestock sector. Particularly, the effect is high when the black-market exchange rate highly diverges from the official exchange rate. We also learned from the field survey that the current foreign exchange policy is discouraging the formal export market. Finally, export and domestic market promotions targeting specific market segments can effectively improve output prices. Especially in the specific case of the conditioning models suggested here, branding the unique products and promoting them can dramatically increase prices. Since the model targets high-class consumers who give a high value to product quality, it may not be difficult to raise prices at the end market. The problem is that sustaining such prices requires strong institutional interventions that standardize products and protect property rights. Furthermore, branding is only possible at the higher end of the market. A firm can invest in developing a brand and getting a reputation for quality. But the problem is the price gains that come through such processes may not trickle down to producers, as they will be used to remunerate the efforts and investments the end-market actor made to attain brand reputation. The potential response to such a problem is to develop a geographic-based reputation for the products.
Furthermore, improving the efficiency and competitiveness of the market can have paramount effects. This is
Key indicators Pastoralists MCL producers Cattle Sheep Model 1.2 Cattle models Sheep Model 1.1 Model 2.3 UAE KSA Oxen Dairy HED -beef -beef Model Model 2.1 2.2Break-even increase in incremental production costs 163.0 83. 8 206.3 98.3 241.0 93.3Break-even end-market prices for improved meats -47.0 -42.9 -42.9 -53.6 -38.1 -48.4
Table 16. Break-even changes in output prices and input costs

89Reorienting Livestock Production to Respond to the Meat Quality Requirements of High-End Domestic and Export Markets
5. MAJOR FINDINGS
especially important, as many of the agents at different levels of the markets along the export chain have monopoly power. The power of actors especially becomes higher as we go toward the upstream market along the chain. In extreme cases at the upstream levels, some actors can be a pure monopoly, as in the case of Djibouti quarantine center. Such actors capture a large portion of the final price without adding meaningful value to the product. The more such actors exist at different levels along the chain, the smaller what remains for the producers that are located at the bottom of the market will be.
5.10. Major production and market constraints
Production-related constraints:
• Delivery of support services (credit facilities, health, feed supply, targeted extension, etc.) for intensification of production is inadequate.
• There is poor capacity along the value chain to implement technical interventions to produce products that target market requirements.
• Weight-based operations are almost nonexistent.
• There is poor performance of most available breeds in terms of growth rates to attain the desired weights at a younger age, poor reproduction, etc. Livestock produced are of a multipurpose type that do not focus on designated breeds for meat production.
• Animals supplied to the market, especially cattle from the MCL production system, are very old animals that have gone through years of plowing.
• There are feed-related constraints related to the availability of adequate quantities of feed of the required quality.
• The supply base of animals is extremely narrow relative to the ecological and breed diversity of the livestock in the country.
• The problem of availability of dedicated animal transport results in substantial quality deteriorations and transaction costs.
• There is a problem of inadequacy and fluctuation in the number of animals supplied and a lack of uniformity (size/condition).
Marketing constraints
A well-functioning and efficient local market that
incentivizes producers for the additional resources and effort to improve quality must develop. The realization of the impacts of the technologies thus depends, among others, on the ability of the market to incentivize quality. The livestock market is, however, poorly organized and inefficient, due mainly to the following reasons.
• High per-unit transaction, transportation, and other marketing costs: High transaction and marketing costs at the different levels of the market along the chain, which lower the producer’s share of the final consumer (domestic/export) prices. Such a market provides little incentive for producers to improve product quality. The unit transaction, transportation, and other marketing costs are high in the meat and live animal markets for various reasons, including:
o The current traditional and small-scale production system makes the unit transaction and marketing costs higher;
o Given that the small-scale producers are scattered over wide geographic areas with poor infrastructure, it will be costly for them to directly supply to end buyers (higher-level markets), as the higher unit transaction and marketing costs (transporting, searching, sorting and grading, assembling, etc.) will be higher than justified by the gains;
o The unstandardized and untraceable nature of the product also increases the marketing costs by raising information problems;
o The number-based production system also raises the unit transportation, transaction, and other marketing costs vis-à-vis the unit gains (price) of the animals.
In sum, the overall production environment not only raises the per-unit transaction and transportation costs at each market level, but it also makes the chain long.
• Costly institutional interventions: Not only does the overall production environment raise the transportation, transaction, and other marketing costs, but the current production setting also makes potential infrastructural, institutional, technological, and other interventions costly and less effective. For example, institutional interventions to standardize and grade livestock markets will be costly. The same is true for other interventions.
The whole environment puts society in the vicious circle of poor productivity, unstandardized and

90
5. MAJOR FINDINGS
poor-quality product, and high transaction and transportation costs. The result is poor and inefficient markets that fail to incentivize investment to improve product quality and productivity.
• Unstandardized products: Earning high price premiums for high-quality meat requires a market that distinguishes a “lemon” from a quality product. In the absence of brand products or producers and institutions that standardize and grade products, the underlying information asymmetry and the opportunistic behavior of traders taking advantage of the information asymmetry will be higher and erode the potential gains from quality improvements.
• The problem of traceability: Traceability is an important consideration, especially in the international trade of meat and live animals. The livestock traceability establishment is at an infant stage in Ethiopia.
• Personalization of the transaction: In an environment where economic transactions are highly embedded in interpersonal relationships, the markets tend to be poorly organized and inefficient:
o The institutional arrangement tends to pay uniform prices regardless of quality differences. As a result, the high-quality products will also receive average prices.
o Third-party grading, standardization, and certifications tend to be less effective.
o Such transaction arrangements fail to align incentives with the specific efforts of producers and marketers. In doing so, the transaction arrangement fails to incentivize genuine and reputable traders and producers.
• Information asymmetry: The overall production environment, coupled with the weak and inefficient institutions, increases the level of information asymmetry with regard to the products and transacting parties. This has a serious societal implication in that in the long run, the “lemon” and opportunistic actors drive the quality product and the genuine actors out of the market.
• Restrictive standards for goat meat and mutton export: The undifferentiated and fixed kg-based import specification is undesirable for the market and for the improvement of the production. The
use of such restrictive specifications by importers may have emerged in response to the unstandardized nature of the product.
• Poor market network of exporters: Traders lack good understanding about the overall foreign market environment: the supply/demand structure of the market, the attributes of the buyers, the seasonal trends, the modes of transaction, the transaction risks, the demands of the society, the rivals (who the rivals are, their unique competitive advantages/disadvantages, the quality differences of their product, etc.), and the context of the rival country.
• Few value additions: The current export of live animals is being made at the costs of huge foregone export earnings that could be made from value additions. This, coupled with the declining trends in the prices of live animals, puts the prospects of the sector in question.
• The collusive behavior of abattoirs: There are explicit and implicit collusive behaviors among market actors at different levels of the markets along the chain. For instance, there are not only explicit agreements among abattoirs to fix purchase prices but also collective pressures against those abattoirs that are trying to compete on price.
• Informal trade: There is a prevalence of informal cross-border trade due to the various impediments along the formal live animal export chain and inadequate support services along the value chain.
The twofold challenge for any meat-improvement intervention is thus how to improve the production efficiency of producers and at the same time get a well-functioning and efficient local market that sufficiently incentivizes quality improvements. Theory and empirical evidence suggest that efficient, resilient, and vibrant firms and markets only emerge under an open and competitive environment.
5.11. Conclusions
The following key conclusions can be made from the foregoing exercise.
• The available livestock and feed genetic resources can form the basis for transforming production and productivity to meet required safety and quality specifications if concerted efforts are made.
• Financial analyses/feasibility studies of applying appropriate intervention models for the different

91Reorienting Livestock Production to Respond to the Meat Quality Requirements of High-End Domestic and Export Markets
5. MAJOR FINDINGS
scenarios show that transformation is indeed possible.
• There is indication that further interventions (e.g., genetics, scale of production, etc.), depending on level of transformation sought, are possible.
• Capacity limitations (technical, infrastructural, knowledge/skill) are serious bottlenecks. Capacity building thus becomes a major area of emphasis for transformation.
5.12. Recommendations on the necessary measures that need to be taken for successful implementation of the intervention models
The findings of this study indicate that meat/livestock production that meets market requirements and at the same time benefits all actors along the chain can be realized by changing the current practices in terms of improving feeding practices by targeting the nutrient requirements of animals. Additional incremental changes can be attained through improvements in genetics that range from avoiding inbreeding to genetic improvement based on the selection of breeding animals among available breeds and then crossing with specialized meat-type animals of exotic origin, depending on the degree of improvement sought.
The successful implementation of the proposed intervention models to bring about the desired reorientation of the production systems to supply meat and live animals that meet the requirements of the HED and export markets requires the parallel actions outlined hereunder. These complementary measures will help not only meet current requirements but also expand the market share in the currently accessed markets by attracting new customers in the current market segment, entering into higher segments, and accessing new potential markets.
• Institutional, infrastructural, and policy interventions at the macro level: The current foreign exchange policy not only implicitly taxes producers of the export products, but it also suppresses producer prices and the development of competitive domestic and export markets. Policy interventions are needed to create a more flexible exchange rate policy that can respond to the changes in the domestic and foreign livestock product markets.
• Organize implementation in the form of a project with a strong coordinated and comprehensive approach:
o Conduct pilot testing of proposed interventions to make adjustments in the models to bring about realistic changes on the ground before large-scale application.
o Design and implement the interventions in the form of comprehensive projects that can bring transformative change. In so doing, integrate with activities of other complementary projects. Integration of research and development in the process will be very useful.
• Market promotion:
o Holistic and integrated interventions should be made to improve the efficiency and competitiveness of the livestock markets. However, the development of efficient markets is largely the result of the overall socioeconomic, infrastructural, technological, and institutional environments. Taking subtle measures to create a freer and liberalized market will have long-term effects. For instance, legally prohibiting abattoirs and feedlots from producing only for export/domestic market is not only not necessary but also not practical.
o Develop brand recognition for the meat and animals produced under the different production systems suggested here. For the producers’ gains from such value additions to be higher, the development of the brand must be with the producers and their production system. Even then, the gains could be captured by traders unless a special transaction arrangement is designed to directly connect producers and feedlots and abattoirs/butchers.
o Update and/or develop standards and grades for the livestock export products based on transparent and refined quality attributes.
o Make efforts to promote exports and livestock products. Aggressive promotion is essential to brand the already reputable products such as Borana goats and cattle. Development of geographic-based brands on selected meat products will have considerable benefit.
o Introduce market segmentation of products to supply the desired product to multiple markets. Look to the experience of

92
5. MAJOR FINDINGS
countries like Brazil that exports prime cuts to high-paying markets like Japan and Europe and supplies the remaining to markets like the Middle East at dumping prices. The net benefit from the overall approach will be very profitable.
o Design and implement an incentive scheme that rewards value chain actors who take the initiative to enter new markets, develop new products, etc.
• Monopoly power: Take measures to reduce the monopoly power at key market levels, such as that of the Djibouti quarantine center. Finding alternative quarantine centers can reduce its power.
• Reduce information asymmetry: Take the following steps to reduce marketing failures associated with information asymmetry.
o Create an institutional environment that encourages producers and traders to develop reputations. Creating a competitive environment and putting in place institutions that discourage opportunistic actions and protect property rights will encourage the development of reputations.
o Provide third-party assurance about the quality and other terms of trade. This can improve the performance of the export market. Development of credible and efficient institutions that standardize and grade products and actors and structure their behavioral patterns is crucial.
o Provide third-party signaling. Rating of actors and products based on selected performance criteria and making the information accessible to the public at large and importers will not only help to reduce information asymmetry but will also encourage reputable actors and discourage opportunistic ones. For instance, it could have a positive effect on information problems if EMDIDI were to make periodic ratings of the existing abattoirs based on selected performance criteria and the results of that rating were accessible to the public and importers.
• Discourage collusive behavior: The presence of collusion among market actors at any level will have negative effects on producers. Thus, attempts should be made not only to create a competitive environment at each level of the market but also to discourage explicit collusions.
• Improving the marketing capacity of exporters: Increasing awareness of traders and exporters about the market they are working in through training, experience sharing, etc. can increase awareness. Attracting foreign firms that have better market networks and marketing experience could help other firms to learn from them.
• Reducing the market chain and actors: Systematic interventions to reduce those market actors who make little contribution to the value and thus reducing the chain could increase the producers’ share of the final market price.
• Special institutional arrangement for conditioned animals: The study underlined that the effectiveness of the models depends on the efficiency of the livestock market in incentivizing meat/animal quality improvements. As emphasized in the study, the markets are constrained by numerous interrelated factors. Creating a market that can work for producers requires wide and integrated interventions to change the institutional, infrastructural, technological, and policy environments. Even though these changes are essential, the details are beyond the scope of this assignment. The feasible way out of the problem is to design a special transaction arrangement that cuts the marketing margins and incentivizes quality improvements. In order to do so, there should be a pre-arranged contractual arrangement between selected feedlot-integrated abattoirs and interested producers. Interested producers must sign on to supply to the abattoirs with young animals that satisfy the specifications, and the abattoirs in return must sign on to buy the animals at fair prices. A similar arrangement should also be made between the abattoirs and selected high-standard hotels. If effective and as the production expands, it will be in the interest of all the three parties (the producer, the feedlot operator, and the hotels) to sustain the institutional arrangement. See Figure 21.

93Reorienting Livestock Production to Respond to the Meat Quality Requirements of High-End Domestic and Export Markets
5. MAJOR FINDINGS
• Capacity building: Build the capacity of actors and promote awareness among stakeholders on the value, methods, and approaches of market-oriented livestock production. Capacity building to producers, especially feedlot operators, extension staff, nutritionists, feed millers, etc., on such issues as feed formulation and software (least-cost programs) that can be used by extension agents, etc. is important to foster production of quality meat and live animals.
• Improvement of extension support services: Services that fulfill the specific requirements of market-oriented livestock production by strengthening the grassroots producer level by promoting situation-specific interventions like the models proposed in this study must be improved.
• Improvement in the supply of the desirable types of animals:
o Intensification of the production system:
3 Shift from subsistence to market-oriented commercial production that requires the creation of market linkages to reduce transaction costs and increases the benefit trickling down to the producer.
3 Foster larger production units that condition and market uniform animals that fulfill the quality requirements of the market (young animals, etc.) through creating support mechanisms like credit services, land, etc. Larger production units are also instrumental in the reduction of cost of production and consequently improved competitiveness.
3 Nurture intensive production by assessing the feasibility of commercial ranching schemes.
o Integration:
3 Integration of production as in the Verde Beef experience where feed production, feedlot operation, slaughter service, etc. are integrated.
3 Linking up the operations of different smaller abattoirs as in the Allana experience will lead to technology transfer and improved efficiency/effective utilization of otherwise-wasted byproducts.
3 It is also good to consider and pilot an out-grower scheme connected to the abattoirs.
o Specialization:
3 Designate suitable areas of focus based on comparative advantage: Designation of suitable areas to specialize in meat production based on the comparative advantages and exert focused effort/interventions through targeted extension, resource allocation, and provision of other support services. This could be considered an integral part of the current clustering approach.
3 Specialization of the production of animals for meat: The traditional system of production of multipurpose livestock needs to change to introduce commercial breeding specifically for meat production. This requires that animals be fed from early life to gain their maximum growth potential in a short period. Consider the gradual introduction of the blood of specialized beef breeds through a similar mechanism to the estrus synchronization/AI scheme being implemented for dairy, initially under a controlled intensive system in selected locations.
o Promote the establishment of collection centers whereby abattoirs can come closer to the producer, leading to benefits to both the producer and the abattoirs.
o Introduce weight-based marketing: Proper weighing of animals, feed, feed ingredients, etc. is important to incentivize production through better benefit to producers. There should be high-level intervention so that transactions are based on a per kg basis. Negotiations by high officials and/or associations with buyers to pay on per kg basis and pay a premium for quality are important
Figure 21. Contract-based animal conditioning.
Producer Conditioning 5-10 Animals

94
5. MAJOR FINDINGS
to encourage production of quality products. “Mobile weighing” service provision can be considered as a business opportunity.
o Promotion of cooperation:
3 Coordinated marketing permits producers to get a larger share of the benefit that can go into the improvement of production. The Allana experience in India where producers directly supply animals to the company is a good experience to promote.
3 Cooperation among stakeholders to reduce capital inputs and per unit of meat produced plus other variable costs, e.g., milling equipment, weighing scales (weighbridge), weighing facilities (scale, small shute, etc.) can be purchased and used by feedlot operators like the Adama area ones, where these facilities are concentrated close to one another.
o Make all attempts to discourage informal livestock trade through the borders so that a larger number of animals are channeled to the export abattoirs.
o Increase the supply base of livestock by improving the possibility of supply from the mid-and higher altitudes:
3 Highland animal utilization should focus on supplying the domestic market, including the high-end market.
3 The focus on utilizing highland animals for export should focus on slaughter and export in the form of meat. Establish export-standard abattoirs close to the production locations to export these as meat. Destinations that have less-stringent requirements regarding meat color should be identified and focused upon.
3 Reduce the stress on animals that exacerbates meat darkening by taking such steps as encouraging the import and use of designated animal transportation trucks through, for example, policy support to duty-free imports.
3 Appropriate draining of blood from the carcass may make a contribution to reducing meat darkening.
3 In addition to the foregoing management interventions, effort should be made to promote meat from highland animals. Push the acceptability of meat from highland animals, first by mixing meat
from mid-altitude and then highland animals so that the customers can gradually develop a taste for these animals.
o Reduction of young stock mortality: Make a concerted effort to reduce young stock mortality, which will help increase the supply of animals. Build on the already-started effort in this direction more energetically.
o Counteract the prevailing “negative selection:” In the current practice, stock that are fast growers are sold, and inferior animals are retained for breeding. This needs to be changed by scaling up the good effort of the community-based breeding programs started around the Bonga and Horro areas. Such breeding strategies need to be extended to other potential breeds and areas.
o Encourage abattoirs to run their own feedlots: The Abyssinia abattoir has started such an exercise in Adama. This needs to be encouraged and scaled up.
• Feed-related interventions:
o The realization of estimated net incremental benefits, as shown in the cost-benefit and sensitivity analyses, crucially depends on the price of inputs and outputs. The input costs are likely to be higher than the estimated costs, especially in remote pastoral areas. The current local market does not supply the supplements that are required for the proposed models to bring the desired results. For this market to develop, there should be a sufficiently large number of producers who implement the production model at the same time. Otherwise, individual producers will have to buy the supplements from remote areas like Adama/Addis Ababa. In this case, the unit cost of buying and transporting the feeds will be too high to be justified by the scale of production. The supply of feed needs to be coordinated by external bodies until the expansion of the new production models can attract feed suppliers to readily engage.
o Develop low-cost rations based on site-specific feed resources by incorporating feed ingredients external to the area to balance shortfalls in nutrient supply from the available feeds to satisfy animal requirements. Ensuring the quality of proper supplementation is important for the production of high-quality

95Reorienting Livestock Production to Respond to the Meat Quality Requirements of High-End Domestic and Export Markets
5. MAJOR FINDINGS
meat. Promoting businesses around feed manufacturing and supply of supplements is important to ensure supply of desired quality:
3 Explore the possibility of formulating and using the TMR feeding system.
3 In relation to concentrate feed supply, there is a need to develop feed processing plants that can provide a mixed ration supply system with a focus on areas where the proposed intervention models are to be implemented. This can involve investors or can be done through the formation of cooperatives. The cooperative effort by ACDI/VOCA can be scaled up/scaled out.
o A clear chain of marketing of agro-industrial byproducts can be established by supplying the byproducts directly to the feed processing plants to formulate mixed rations for sale. This would promote favorable pricing of such byproducts and reduce feed costs. Currently, the traders of agro-industrial byproducts have total control over the pricing of such feeds.
o Grazing land improvement should be undertaken for pasture-based fattening systems. There is a need for a policy to ensure that a certain portion of land is set aside for pasture in areas with high potential for sheep and/or cattle fattening in line with the clustering development approach being followed in connection with feeding in the agro-industrial parks being developed in different parts of the country (e.g., Awi Zone).
o Water development in addition to the improvement of pasture land is vital. Develop irrigation schemes in the pastoral areas.
o Development of green fodder: Identification of forage species suitable for different areas of the country should be undertaken. This demands the development of a forage seed supply system at an affordable price.
• Scale up/scale out good practices/experiences: Scaling up/scaling out existing good practices that help meeting market quality requirements like the case of Hararghe farmer settlers, the Verde modern feedlot model, the Bonga/Horro community-based sheep breeding, forage seed production through public-private partnership in Efratana Gidim woreda, the case of the Abyssinia abattoir running its own subsidiary feedlots, sheep
production in a clustered manner as in Awi Zone, concentrate feed manufacturing by cooperatives in rural areas by ACDI/VOCA, etc. are examples that can be expanded through exchange visits to share such valuable experiences.

96
6. PROTOCOL FOR PILOT TESTING THE PROPOSED INTERVENTION MODELS
Different intervention models have been proposed to improve the quality and quantity of meat production to meet the requirements of export and HED markets as described above. The models are developed for cattle, sheep, and goats and designed to fit the different production scenarios/agro-ecological settings (pastoral/MCL). Financial and economic analyses of these models show that they will potentially bring about transformation in livestock production and productivity if implemented with due consideration to availing all the set input and other requirements as proposed. The models have intervention components at the “source,” where animals are produced by farmers and/or pastoralists, and at the feedlot level.
It is, however, imperative that the proposed intervention models be tested both at “source” and feedlot levels under real production situations on a pilot scale for appropriateness (affordability, environmental friendliness, ease of implementation, profitability to warrant the extra effort/inputs) and implementation challenges before scaling up/scaling out. This pilot testing step is expected to help identify possible impediments/shortfalls that will serve to modify and fine-tune the interventions for eventual scale-up.
The detailed implementation strategy/approach and methodology is presented in Appendix II.
6. PROTOCOL FOR PILOT TESTING THE PROPOSED INTERVENTION MODELS

97Reorienting Livestock Production to Respond to the Meat Quality Requirements of High-End Domestic and Export Markets
7. REFERENCES
Animut, G., and J. Wamatu. 2014. Prospects to improve the productivity of sheep fattening in Ethiopia: Status, challenges and opportunities. ICARDA, Addis Ababa.
Aynalem Haile, Workneh Ayalew, Noah Kebede, Tadelle Dessie, and Azage Tegegne. 2011. Breeding strategy to improve Ethiopian Borana cattle for meat and milk production. IPMS (Improving Productivity and Market Success) of Ethiopian Farmers Project working paper 26. ILRI, Nairobi.
Asfaw Negassa and M. Jabbar, 2007. Livestock Ownership, Commercial Off-take Rates and Their Determinants in Ethiopia. SPSS-LMM. 85Pp.
Beyene, B. 2017. Cattle fattening practices and its challenges in selected districts of Horoguduru Wollega Zone, Oromia, Ethiopia. Global Journal of Animal Science, Livestock Production and Animal Breeding 5 (1): 291–299.
Bredahl et al. 1998. Relating consumer perceptions of pork quality to physical product characteristics. Food Quality and Preference 9(4): 273–281.
Busboom, J. R., L. E. Jeremiah, L. L. Gibson, K. A. Johnson, C. T. Gaskins, J. J. Reeves, and R. W. Wright. 1993. Effects of biological source on cooking and palatability attributes of beef produced for the Japanese market. Meat Science 35:241–258.
Curzi, D., and L. Pacca. 2015. Price, quality and trade costs in the food sector. Food Policy 55:147–158.
Duguma, G., 2011. Participatory definition of breeding objectives and implementation of community-based sheep breeding programs in Ethiopia. PhD Thesis, University of Natural Resources and Life Sciences, Vienna, Austria.
Duncan, A., L. York, B. Lukuyu, A. Samaddar, and W. Stűr. 2012. Feed Assessment Tool (FEAST). www.ilri.org/feast.
Edea, Z. 2008. Characterization of Bonga and Horro indigenous sheep breeds of smallholders for designing community based breeding strategies in Ethiopia. M.Sc. thesis, School of Graduate Studies, Haramaya University, Dire Dawa.
Farmer, Elisabeth. 2010. Abattoirs frequently complain of a lack of supply, particularly for shoats, even as pastoralists complain of low prices due to a lack of demand. End market analysis of Ethiopian livestock and meat: A desk study. Micro report #164.
Farrell, Terence C. 2001. Modeling meat quality attributes. AARES 45th Annual Conference, January 23–25 2001, Adelaide.
Haile, A., T. Mirkena, G. Duguma, M. Wurzinger, B. Rischkowsky, M. Tibbo, M. Okeyo, and J. Sölkner. 2013. Community-based sheep breeding programs: Tapping into indigenous knowledge. Livestock Research for Rural Development 25:219.
Hartung, T. (2009). A toxicology for the 21st century—mapping the road ahead. Toxicological Sciences 109 (1): 18–23.
Ilbery, B., and M. Kneafsey. 2000. Registering regional specialty food and drink products in the United Kingdom: The case of PDOs and PGIs. Area 32 (3): 317–328.
Killinger, K. M., C. R. Calkins, W. J. Umberger, D. M. Feuz, and K. M. Eskridge. 2004. Consumer visual preference and value for beef steaks differing in marbling level and color. Journal of Animal Science 82 (11): 3288–3293.
Koohmaraie, M. and G. H. Geesink. 2006. Contribution of postmortem muscle biochemistry to the delivery of consistent meat quality with particular focus on the calpain system. Meat Science 74:34-43.
7. REFERENCES

98
7. REFERENCES
Lancaster, K. 1966. A new approach to consumer theory. Journal of Political Economy 74 (2): 132-132. DOI: 10.1086/259131.
Markus, S. B., J. L. Aalhus, J. A. M. Janz, and I. L. Larsen. 2011. A survey comparing meat quality attributes of beef from credence attribute-based production systems. Canadian Journal of Animal Science 91:283–294.
Mestefe Mamiru .2015. On-Farm Performance Evaluation and Community Based Traditional Selection Methods of Bonga Sheep in Adiyo Kaka District, Southern Ethiopia. M.Sc. Thesis. Hawassa University, Hawassa, Ethiopia
Samrawit M. 2015. Analysis of the service quality strategies of the four-star hotels in Addis Ababa, Ethiopia. Unpublished thesis, Saint Mary’s University School of Graduate Studies.
Shapiro, I. B., G. Gebru, S. Desta, A. Negassa, K. Nigussie, G. Aboset, and H. Mechale. 2017. Ethiopia livestock sector analysis. ILRI Project Report. International Livestock Research Institute (ILRI), Nairobi.
Sierra, V., B. Caballero, M. Mocha. 2006. Relationship between consumer scores and oxidative status of beef. 52nd International Congress of Meat Science and Technology, held in Dublin, Ireland, from 13-18 August 2006.
Teklewold, H., G. Legesse, and D. Alemu. 2009. Market structure and function for live animal and meat exports in some selected areas of Ethiopia. Research report 79. EIAR, Addis Ababa.
Tolera, A., and A. Abebe. 2007. Livestock production in pastoral and agropastoral production systems of southern Ethiopia. Livestock Research for Rural Development 19, article #177. Retrieved June 28, 2018 from http://www.lrrd.org/lrrd19/12/tole19177.htm.
Unnevehr, L. J., and S. Bard. 1993. Beef quality: Will consumers pay for less fat? Journal of Agricultural and Resource Economics 18 (2): 288–295.
United States Department of Agriculture (USDA). 1997. Official United States standards for grades of carcass beef. USDA, Agric. Market. Serv., Washington, DC.
Wolf, M. M., and A. J. Thulin. 2000. Target consumer profile and positioning for the promotion of a new locally branded beef product. Journal of Food Distribution Research 31 (1): 193–197.
Zheng, L., and J. Tan. 2008. Quality evaluation of meat cuts. Computer Vision Technology for Food Quality Evaluation.

99Reorienting Livestock Production to Respond to the Meat Quality Requirements of High-End Domestic and Export Markets
APPENDIX IA
PP
EN
DIX
I. T
ab
les
Appe
ndix
Tab
le 1
. Ass
essm
ent
sum
mar
y of
HED
mar
ket
Rad
isson
Bl
u
Hot
elIm
port
?M
eat s
uppl
y so
urce
Req
uire
men
tsV
iew
s on
Eth
iopi
an m
eat s
ourc
esR
emar
ks
Hilt
on
Sher
aton
Ad
dis
No
Yes
Yes
• Fr
esh
or c
hille
d be
twee
n 5–
80C
• H
ave
prop
er si
ze (l
arge
, m
ediu
m, s
mal
l) de
pend
ing
on
the
type
of m
eat/
beef
• Th
ick
(fille
t) an
d ha
ving
a re
d co
lor
• Req
uire
men
ts sim
ilar t
o R
adiss
on B
lu
• The m
ain
part
requ
ired
is be
ef
fillet
• We c
heck
for c
olor
, tem
pera
ture
, lab
eling
-pro
duct
ion
date
.
• Lu
na E
xpor
t Sla
ught
erho
use
(bee
f and
lam
b)
• Pr
ime
(bee
f, ch
icke
n, a
nd p
ork)
• A
lema
(bee
f, ch
icke
n, a
nd
pork
)
The
beef
cut
s rec
eive
d fro
m th
ese
supp
liers
are
sirlo
in, t
opsid
e, a
nd
tend
erlo
in (f
or k
itfo)
.
• Im
port
s: b
eef c
uts f
rom
Sou
th
Afr
ica
and
Dub
ai; l
amb
from
K
enya
• Lo
cal s
ourc
es: F
antu
Su
perm
arke
t
• Im
port
s: c
ompe
lled
to im
port
be
caus
e of
the
spec
ific
natu
re
of th
e m
enu,
e.g
., “b
eef c
uts o
f A
ngus
Bee
f CA
PE U
S ty
pe.”
Bein
g an
inte
rnat
iona
l-st
anda
rd h
otel,
ther
e is
no
othe
r alte
rnat
ive
optio
n th
an
usin
g th
e be
ef b
rand
giv
en in
th
e m
enu.
• M
eat i
mpo
rted
from
Dub
ai
(UA
E)
• Lo
cal s
ourc
es: P
rime
and
Elfo
ra A
gro-
Indu
strie
s PLC
• Ta
ste o
r flav
or o
f Eth
iopi
an
mea
t app
reci
ated
• M
ajor
con
cern
or c
ompl
aint
on
the
inco
nsist
ency
of
tend
erne
ss
• Th
e su
pplie
r doe
s not
supp
ly a
s re
quire
d—in
cons
isten
t.
• M
ajor
com
plai
nt—
not t
ende
r an
d ju
icy—
rath
er it
is to
ugh
and
dry.
• Ta
ste/fl
avor
is g
ood.
• W
ork
at th
e gr
assr
oots
leve
l to
impr
ove
the
qual
ity o
f mea
t pr
oduc
ed d
omes
tical
ly
sugg
este
d
• N
o co
mpl
aint
on
the
supp
liers
ex
cept
thei
r fai
lure
to h
ave
a co
nsist
ent s
uppl
y of
tend
er
mea
t
• A
bout
700
kg
ever
y 6
mon
ths
• It
is es
timat
ed th
at a
bout
102
kg
“Ang
us B
eef C
APE
US”
and
75
kg la
mb
is us
ed p
er m
onth
. Oth
er
than
cos
ting
fore
ign
curr
ency
, the
im
port
pro
cess
is c
umbe
rsom
e,
and
the
bure
aucr
acy
is ve
ry
disc
oura
ging
.
cont
inue
d on
nex
t pag
e

100
APPENDIX I
Ram
ada
Hotel
Import?
Meat supply source
Requirem
entsV
iews on E
thiopian meat sources
Rem
arks
Elilly
Harm
ony
Interconti-nental
No
No, not
directly
No
No
• Some of the specifications used
mainly for beef are appearance,
texture (a key indicator of tenderness), color, test, shape, and size.
• The specification for m
utton is that it should be fatty.
• The quality criteria used for
beef cuts specification are no fat, tenderness, size (w
idth and length relationship) or com
plete size.
• Beef topside, sirloin, and tenderloin are m
ajor products used by the hotel.
• The quality criteria used for
beef cuts specification are tenderness, tem
perature.
• Consum
ption: beef topside and tenderloin up to 100 kg/w
eek and lam
b (small size (8–10 kg))
carcass up 40–50 kg/week
• Quality specification:
tenderness, freshness, size
• Consum
ption: beef 70 kg/day and lam
b 15–20 kg/day
Local sources: Luna Slaughterhouse and Prim
e
• Local Sources: Luna Slaughterhouse, Fra’ol, and Prim
e
• Sometim
es buy imported m
eat from
Bambis and N
ovis
• Luna Slaughterhouse, and Prim
e
Mikyas
• Low quality, prim
arily its tenderness
• The problem
of supply in term
s of consistency of product quality
• Poor tenderness/tough
No com
plaint
Not tender and overall low
quality
• Planning to import from
South A
frica and Brazil as it is facing problem
s satisfying the requirem
ents of its high-level custom
ers
• Imported m
eat cheaper
• Some of the perceived reasons
for the poor tenderness m
entioned by the respondents w
ere: poor breeding and feeding at an early age; anim
als travel long distances; no experience of “m
assaging” of m
eat animals; anim
als kept under the sun for a long tim
e/no shade; inadequate w
atering; and im
proper bleeding during slaughter.
Has plan to im
port
continued on next page
continued from previous page

101Reorienting Livestock Production to Respond to the Meat Quality Requirements of High-End Domestic and Export Markets
APPENDIX I
Saro
Mar
ia
Hot
elIm
port
?M
eat s
uppl
y so
urce
Req
uire
men
tsV
iew
s on
Eth
iopi
an m
eat s
ourc
esR
emar
ks
Frie
ndsh
ip
Gol
den
Tulip
Mar
riot
No
No
No
No
• Q
ualit
y sp
ecifi
catio
n:
tend
erne
ss, f
resh
• C
onsu
mpt
ion:
bee
f top
side,
sir
loin
, vea
l up
to 3
0 kg
/day
an
d la
mb
12 k
g/da
y
• Q
ualit
y sp
ecifi
catio
n:
tend
erne
ss, f
resh
ness
, cle
an
• C
onsu
mpt
ion:
tend
erlo
in, v
eal
up to
200
kg/
wee
k an
d la
mb
10 c
arca
sses
/wee
k
• Q
ualit
y sp
ecifi
catio
ns:
firm
ness
, mar
blin
g, a
ge, l
ow
fat,
tend
erne
ss, fl
avor
• C
onsu
mpt
ion:
bee
f ten
derlo
in,
tops
ide,
fille
t up
to 1
55 k
g/m
onth
and
no
lam
b
• Q
ualit
y sp
ecifi
catio
n:
tend
erne
ss, a
ge, t
empe
ratu
re,
clea
nnes
s
• C
onsu
mpt
ion:
bee
f top
side
up
to 2
00 k
g/m
onth
and
lam
b 20
0–25
0 kg
/mon
th
Luna
Sla
ught
erho
use
Ale
ma
Not
will
ing
to sp
ecify
Prim
e, E
lfora
, Ale
ma,
Get
ache
w
Berg
a
No
com
plai
nt
Not
tend
er
Not
tend
er
Toug
hnes
s or n
ot te
nder
, in
cons
isten
cy in
qua
ntity
and
qu
ality
of s
uppl
y
Pref
er to
impo
rt
cont
inue
d on
nex
t pag
e
cont
inue
d fr
om p
revi
ous p
age

102
APPENDIX Icontinued from
previous page
Addis International C
atering
No
• Quality specification:
tenderness, age, freshness, color
• Consum
ption: beef topside 60–70 kg/day; tenderloin 50 kg/day; lam
b leg 30 kg/day and lam
b ribs 10–20 kg/day
Luna Slaughterhouse and ElforaToughness, low
quality, and quantity, low
capacity of suppliersH
ave a high interest to support and m
otivate local suppliers
Hotel
Import?
Meat supply source
Requirem
entsV
iews on E
thiopian meat sources
Rem
arks
Ethiopian Airlines
Yes• Q
uality specification: tenderness, age, juiciness, flavor, taste
• Consum
ption: beef cube 1,000–1,100 kg/day; m
inced m
eat 300–400 kg/day; topside 20–50 kg/day; Julian beef filet 300–400 kg/day; frozen beef fillet 200 kg/day; and lam
b chops w
ith bone 300 kg/day and lam
b chops without bone
400 kg/day
• Local source: Luna Slaughterhouse and Elfora
• Import: South A
frica
Toughness, low quality, and
quantity, the inconsistency of supply
Have a high interest to support
and motivate local suppliers
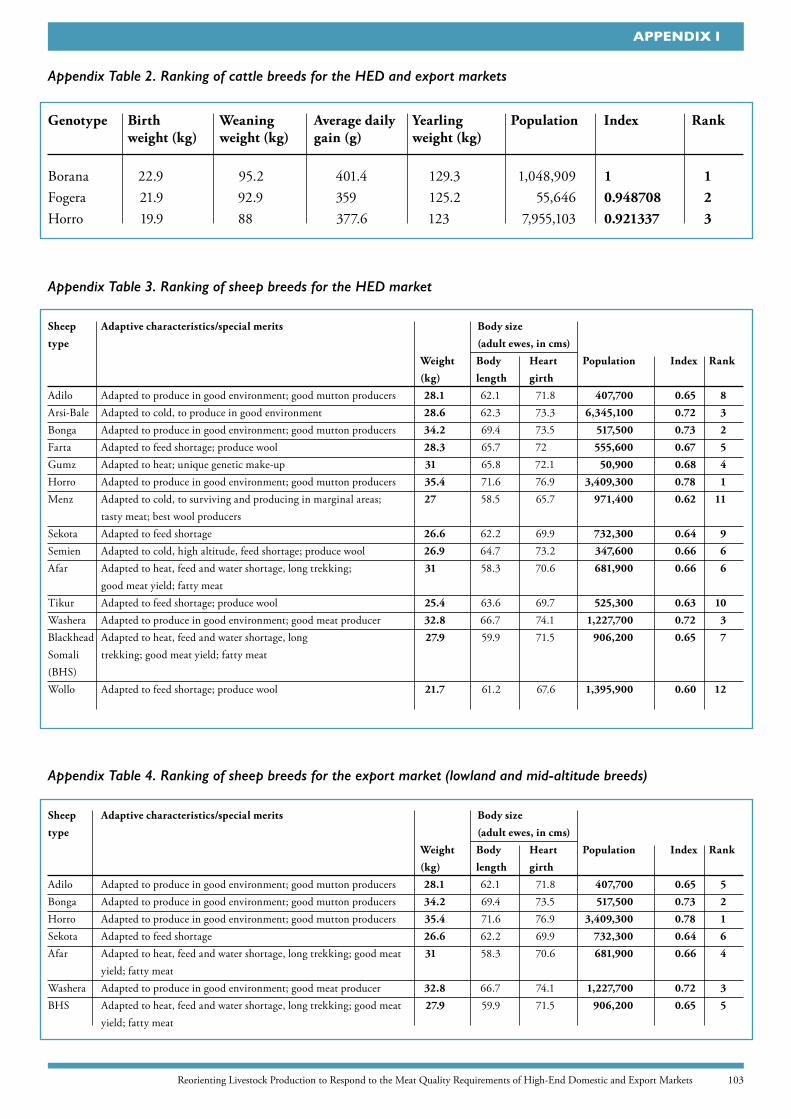
103Reorienting Livestock Production to Respond to the Meat Quality Requirements of High-End Domestic and Export Markets
APPENDIX I
Genotype Birth Weaning Average daily Yearling Population Index Rank weight (kg) weight (kg) gain (g) weight (kg)
Borana 22.9 95.2 401.4 129.3 1,048,909 1 1Fogera 21.9 92.9 359 125.2 55,646 0.948708 2Horro 19.9 88 377.6 123 7,955,103 0.921337 3
Appendix Table 2. Ranking of cattle breeds for the HED and export markets
Appendix Table 3. Ranking of sheep breeds for the HED market
Appendix Table 4. Ranking of sheep breeds for the export market (lowland and mid-altitude breeds)
Sheep Adaptive characteristics/special merits Body size
type (adult ewes, in cms)
Weight Body Heart Population Index Rank
(kg) length girth
Adilo Adapted to produce in good environment; good mutton producers 28.1 62.1 71.8 407,700 0.65 8
Arsi-Bale Adapted to cold, to produce in good environment 28.6 62.3 73.3 6,345,100 0.72 3
Bonga Adapted to produce in good environment; good mutton producers 34.2 69.4 73.5 517,500 0.73 2
Farta Adapted to feed shortage; produce wool 28.3 65.7 72 555,600 0.67 5
Gumz Adapted to heat; unique genetic make-up 31 65.8 72.1 50,900 0.68 4
Horro Adapted to produce in good environment; good mutton producers 35.4 71.6 76.9 3,409,300 0.78 1
Menz Adapted to cold, to surviving and producing in marginal areas; 27 58.5 65.7 971,400 0.62 11
tasty meat; best wool producersSekota Adapted to feed shortage 26.6 62.2 69.9 732,300 0.64 9
Semien Adapted to cold, high altitude, feed shortage; produce wool 26.9 64.7 73.2 347,600 0.66 6
Afar Adapted to heat, feed and water shortage, long trekking; 31 58.3 70.6 681,900 0.66 6
good meat yield; fatty meatTikur Adapted to feed shortage; produce wool 25.4 63.6 69.7 525,300 0.63 10
Washera Adapted to produce in good environment; good meat producer 32.8 66.7 74.1 1,227,700 0.72 3
Blackhead Adapted to heat, feed and water shortage, long 27.9 59.9 71.5 906,200 0.65 7
Somali trekking; good meat yield; fatty meat(BHS)Wollo Adapted to feed shortage; produce wool 21.7 61.2 67.6 1,395,900 0.60 12
Sheep Adaptive characteristics/special merits Body size
type (adult ewes, in cms)
Weight Body Heart Population Index Rank
(kg) length girth
Adilo Adapted to produce in good environment; good mutton producers 28.1 62.1 71.8 407,700 0.65 5
Bonga Adapted to produce in good environment; good mutton producers 34.2 69.4 73.5 517,500 0.73 2
Horro Adapted to produce in good environment; good mutton producers 35.4 71.6 76.9 3,409,300 0.78 1
Sekota Adapted to feed shortage 26.6 62.2 69.9 732,300 0.64 6
Afar Adapted to heat, feed and water shortage, long trekking; good meat 31 58.3 70.6 681,900 0.66 4
yield; fatty meatWashera Adapted to produce in good environment; good meat producer 32.8 66.7 74.1 1,227,700 0.72 3
BHS Adapted to heat, feed and water shortage, long trekking; good meat 27.9 59.9 71.5 906,200 0.65 5
yield; fatty meat

104
APPENDIX IAppendix Table 5. R
anking of goat breeds for the export market (low
land and mid-altitude breeds)
Appendix Table 6. Supplements for cattle
Breed
Value to the comm
unity W
eight (kg) H
eart Population
Index R
ank
and/or special merits
girth
(cm
)A
far Extensively m
ilked, delicacy (bekel), blood R
ift Valley areas of northeastern 23.7
67.4 1,000,000
0.751264 5
as m
edicine, adapted to the arid area Ethiopia (A
far Region)
Abergele
Milk and m
ilk products, skin M
id-altitude of southern Tigray
28.4 71.2
300,000 0.658612
6
and northern W
ollo, along
Tekeze Valley
Woito-G
uji G
ood meat
Gam
u-Gofa and eastern
28.8 72.5
900,000 0.801587
3
Sidam
o (Guji)
Short-eared Somali
Milk, adapted to arid area
Lowlands of Som
ali 27.8
70.4 1,500,000
0.915865 2
Long-eared Somali
Extensively milked, adapted to
Lowlands of w
estern Somali
31.8 74.4
1,500,000 0.972763
1
the arid area R
egion and southern Orom
iaW
estern lowland
Extensively milked, adapted to the
Lowlands of w
estern Ethiopia 33.9
75.9 400,000
0.755556 4
arid area
(Metekel, A
sossa, and Gam
bela)
Feed ingredient prices
Dry season
Dry season
Wet season
Dry season
Dry season
Wet season
maintenance
production production
maintenance
production production
supplement
supplement
supplement
supplement
supplement
supplement
Type of feed Price
kg kg
kg (E
TB
/1,000 (E
TB
/1,000 (E
TB
/1,000 kg
(ET
B/100 kg)
kg supplem
ent) kg supplem
ent) supplem
ent)C
orn grain 700
200
300
1,400 2,100
Rice bran
290 120
200 164
348 580
475.6W
heat bran 680
120
150 816
1020
Groundnut cake
380 300
265 150
1,140 1,007
570Salt
650 250
175 125
1,625 1,137.5
812.5Lim
estone 250
20 20
20 50
50 50
Dicalcium
phosphate 4,500
40 40
40 1,800
1,800 1,800
Urea
1,230 150
100 50
1,845 1,230
615Prem
ix feedlot cattle 4,000
1 1
1 40
40 40
Total
1,001 1,001
1,000 7,664
7,244.5 7,483.1

105Reorienting Livestock Production to Respond to the Meat Quality Requirements of High-End Domestic and Export Markets
APPENDIX I
Feed
ingr
edie
nt p
rice
s
Dry
sea
son
D
ry s
easo
n W
et s
easo
n D
ry s
easo
n D
ry s
easo
n W
et s
easo
n
m
aint
enan
ce
prod
ucti
on
prod
ucti
on
mai
nten
ance
pr
oduc
tion
pr
oduc
tion
supp
lem
ent
supp
lem
ent
supp
lem
ent
supp
lem
ent
supp
lem
ent
supp
lem
ent
Type
of f
eed
Pric
e
kg
kg
kg
(ET
B/1
,000
(E
TB
/1,0
00
(ET
B/1
,000
kg
(E
TB
/100
kg)
kg su
pple
men
t)
kg su
pple
men
t)
supp
lem
ent)
Cor
n gr
ain
700
250
1,75
0R
ice
bran
29
0 27
5 23
5 22
5 79
7.5
681.
5 65
2.5
Whe
at b
ran
680
20
0 25
0
1,36
0 1,
700
Gro
undn
ut c
ake
380
325
300
100
1,23
5 1,
140
380
Salt
65
0 22
5 15
0 10
0 1,
462.
5 97
5 65
0Li
mes
tone
25
0 20
20
15
50
50
37
.5D
ical
cium
pho
spha
te
4,50
0 30
20
25
1,
350
900
1,12
5U
rea
1,23
0 12
5 75
35
1,
537.5
92
2.5
430.
5Pr
emix
feed
lot c
attle
4,
000
1 1
1 40
40
40
Tota
l
1,00
1 1,
001
1,00
1 6,
472.
5 6,
069
6,76
5.5
Appe
ndix
Tab
le 7
. Sup
plem
ents
for
shee
p

106
APPENDIX I
Type of feed Feedlot rations
E
TB
/1,000 kg feedingredients
Cattle
Cattle
Cattle
Sheep Sheep
Cattle
Cattle
Cattle
Cattle
Sheep
starter grow
er finisher
starter finisher
starter starter
grower
finisher finisher
kg
kg kg
kg kg
(ET
B/1,000
(E
TB
/1,000 (E
TB
/1,000 (E
TB
/1,000
kg feed)
kg feed)
kg) kg)
Corn grain
500 570
620 450
550 3,500
3,990 4,340
3,150 3,850
Rice bran
70 50
50 50
35 203
145 145
145 101.5
Wheat bran
70 50
50
476
340 340
0 0
Groundnut cake
70 70
50 85
50 266
266 190
323 190
Salt 4
4 4
6 6
26 26
26 39
39Lim
estone 15
15 15
15 15
37.5 37.5
37.5 37.5
37.5U
rea 10
10 10
4.25 4.25
123 123
123 52.275
52.275A
mm
onium C
l
6.25 6.25
0 0
0 46.875
46.875A
mm
onium S
2.5
2.5 0
0 0
15 15
Premix feedlot cattle
1 1
1
40
40 40
0 0
Premix feedlot sheep
1
1 0
0 0
80 80
Molasses
80 80
80 80
80 64
64 64
64 64
Soybean cake
50 50
0 0
0 400
400Tef straw
(16 kg bales) 180
150 120
250 200
505.8 421.5
337.2 702.5
562Total
1,000 1,000
1,000 1,000
1,000 5,241.3
5,453 5,642.7
5,055.15 5,438.15
Appendix Table 8. Feedlot rations

107Reorienting Livestock Production to Respond to the Meat Quality Requirements of High-End Domestic and Export Markets
APPENDIX I
Choice profile
Context description: Imagine the preference of your customers. And also imagine a hypothetical market that supply meat cuts from Longinus dorsi (shint) having the combination of attributes listed under each of the two alternative meat cuts: Meat A and Meat B. In each case, carefully evaluate the combination of attributes mentioned under each alternative and then choose one of the alternatives you prefer to purchase at the given price. Which of the two meat cuts do you buy, Meat A or Meat B? In case you find the combination of the attribute unrealistic, just imagine there is such meat that has the combination of attributes described in the Table 9. Also, note that the two meat cuts are the same in all other attributes except those mentioned here.
Appendix Table 9. Sample of choice card
Appendix Table 10. Cost-benefit analyses of intervention models
Attributes Meat A _____ Meat B _____
Price Birr/Kg 350 250Tenderness (Soft, Tough) Soft HardMarbling (Abundant, Scarce) Scarce AbundantJuiciness (Juicy, Dry) Juicy JuicyColor (Dark red, Red, Light red) Light red RedFattiness (High, Some fat, No fat) No fat FattyAge range (Very old, Old, Adult, Young/Calf) Adult Old
No. Cost/benefit items Description Value in ETB
I Incremental cost streams of Model 1.2 A - B 764.3
A Incremental operating costs at the producer level i + ii 857.5
i Cost of fund 11% of total incremental costs 85.0 ii Incremental reproduction and production costs iii + iv + 1 - 2 772.5 iii Other operating costs—transportation 25% of feed costs of (1.1.1 + 1.2.1 + 1.3.1) + 71.0 iv Additional feed costs for increased reproduction 40% of 36% death risk 88.3 1 Costs with Model 1.2 at producer level 1.1 + 1.2 + 1.3 613.2
1.1 Winter maintenance supplement 1.3.1 + 1.3.2 309.6
1.1.1 Supplement feed costs ETB 0.97/day/sheep*60 days 97.1 1.1.2 Additional veterinary costs ETB15/30 days/lamb*60 days+ ETB 15/30 days/ewe*365 days 212.5 1.2 Winter production supplement 1.2.1 + 1.2.2 212.6
1.2.1 Supplement feed costs ETB 1.52/day/lamb*123 days 151.1 1.2.2 Additional veterinary expenses ETB 15/30 days*123 days 61.5 1.3 Summer production supplement 1.3.1 + 1.3.2 91.0
1.3.1 Supplement feed costs ETB 0.06/day/sheep*182 days 0.0 1.3.2 Additional veterinary costs ETB 15/30 days*182 days 91.0 2 Costs with traditional production system at the producer level 2.1 0.0
2.1 No additional supplement 0.0 B Incremental costs with Model 1.2 feedlot*(3-4) -93.1
3 Costs with Model 1.2 production system 146.9
3.1 Supplement feed cost: starter ETB 2.47/day/lamb*7 days 21.0 3.2 Supplement feed cost: finisher ETB 3.59/day/animal*28 days 125.9 4 Costs with current production system 4.1 + 4.2 240.0
4.1 Supplement feed cost ETB 6/kg/day/lamb*40 days 240.0
Model 1.2. Sheep for UAE export market
continued on next page
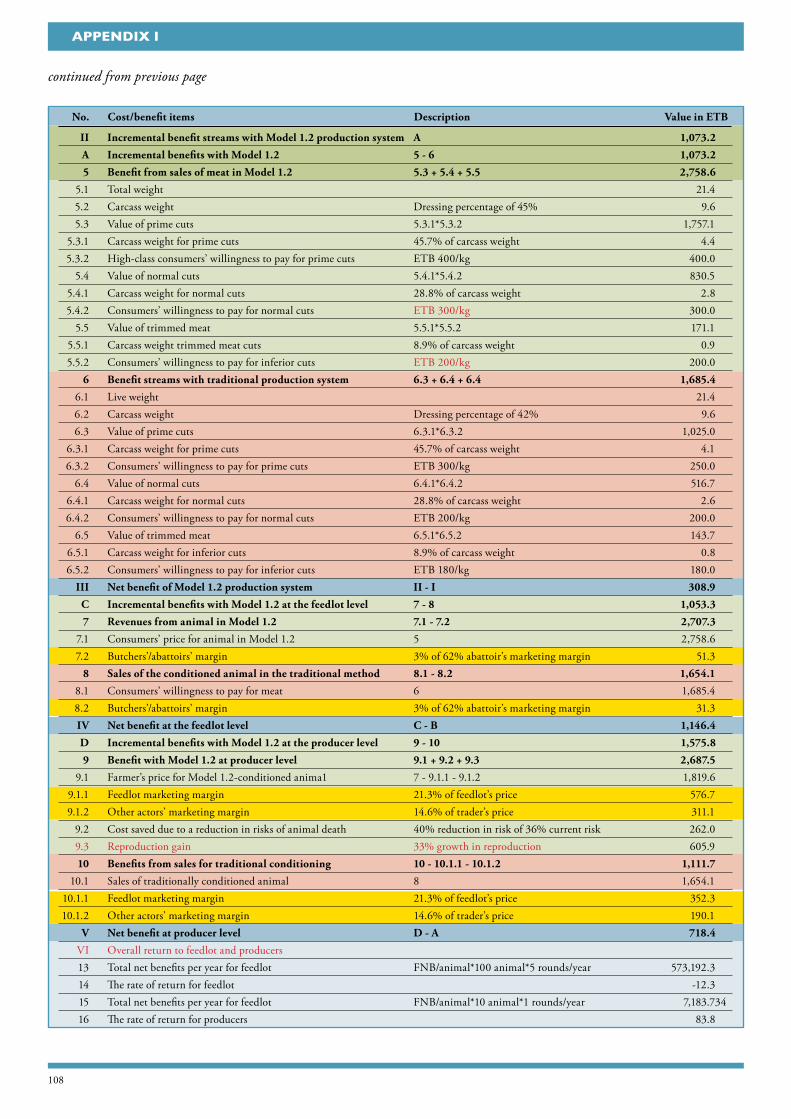
108
APPENDIX I
II Incremental benefit streams with Model 1.2 production system A 1,073.2
A Incremental benefits with Model 1.2 5 - 6 1,073.2
5 Benefit from sales of meat in Model 1.2 5.3 + 5.4 + 5.5 2,758.6
5.1 Total weight 21.4 5.2 Carcass weight Dressing percentage of 45% 9.6 5.3 Value of prime cuts 5.3.1*5.3.2 1,757.1 5.3.1 Carcass weight for prime cuts 45.7% of carcass weight 4.4 5.3.2 High-class consumers’ willingness to pay for prime cuts ETB 400/kg 400.0 5.4 Value of normal cuts 5.4.1*5.4.2 830.5 5.4.1 Carcass weight for normal cuts 28.8% of carcass weight 2.8 5.4.2 Consumers’ willingness to pay for normal cuts ETB 300/kg 300.0 5.5 Value of trimmed meat 5.5.1*5.5.2 171.1 5.5.1 Carcass weight trimmed meat cuts 8.9% of carcass weight 0.9 5.5.2 Consumers’ willingness to pay for inferior cuts ETB 200/kg 200.0 6 Benefit streams with traditional production system 6.3 + 6.4 + 6.4 1,685.4
6.1 Live weight 21.4 6.2 Carcass weight Dressing percentage of 42% 9.6 6.3 Value of prime cuts 6.3.1*6.3.2 1,025.0 6.3.1 Carcass weight for prime cuts 45.7% of carcass weight 4.1 6.3.2 Consumers’ willingness to pay for prime cuts ETB 300/kg 250.0 6.4 Value of normal cuts 6.4.1*6.4.2 516.7 6.4.1 Carcass weight for normal cuts 28.8% of carcass weight 2.6 6.4.2 Consumers’ willingness to pay for normal cuts ETB 200/kg 200.0 6.5 Value of trimmed meat 6.5.1*6.5.2 143.7 6.5.1 Carcass weight for inferior cuts 8.9% of carcass weight 0.8 6.5.2 Consumers’ willingness to pay for inferior cuts ETB 180/kg 180.0 III Net benefit of Model 1.2 production system II - I 308.9
C Incremental benefits with Model 1.2 at the feedlot level 7 - 8 1,053.3
7 Revenues from animal in Model 1.2 7.1 - 7.2 2,707.3
7.1 Consumers’ price for animal in Model 1.2 5 2,758.6 7.2 Butchers’/abattoirs’ margin 3% of 62% abattoir’s marketing margin 51.3 8 Sales of the conditioned animal in the traditional method 8.1 - 8.2 1,654.1
8.1 Consumers’ willingness to pay for meat 6 1,685.4 8.2 Butchers’/abattoirs’ margin 3% of 62% abattoir’s marketing margin 31.3 IV Net benefit at the feedlot level C - B 1,146.4
D Incremental benefits with Model 1.2 at the producer level 9 - 10 1,575.8
9 Benefit with Model 1.2 at producer level 9.1 + 9.2 + 9.3 2,687.5
9.1 Farmer’s price for Model 1.2-conditioned anima1 7 - 9.1.1 - 9.1.2 1,819.6 9.1.1 Feedlot marketing margin 21.3% of feedlot’s price 576.7 9.1.2 Other actors’ marketing margin 14.6% of trader’s price 311.1 9.2 Cost saved due to a reduction in risks of animal death 40% reduction in risk of 36% current risk 262.0 9.3 Reproduction gain 33% growth in reproduction 605.9 10 Benefits from sales for traditional conditioning 10 - 10.1.1 - 10.1.2 1,111.7
10.1 Sales of traditionally conditioned animal 8 1,654.1 10.1.1 Feedlot marketing margin 21.3% of feedlot’s price 352.3 10.1.2 Other actors’ marketing margin 14.6% of trader’s price 190.1 V Net benefit at producer level D - A 718.4
VI Overall return to feedlot and producers 13 Total net benefits per year for feedlot FNB/animal*100 animal*5 rounds/year 573,192.3 14 The rate of return for feedlot -12.3 15 Total net benefits per year for feedlot FNB/animal*10 animal*1 rounds/year 7,183.734 16 The rate of return for producers 83.8
continued from previous page
No. Cost/benefit items Description Value in ETB

109Reorienting Livestock Production to Respond to the Meat Quality Requirements of High-End Domestic and Export Markets
APPENDIX I
Model 1.2.1. Sheep for KSA export market
No. Cost/benefit items Description Value in ETB
I Incremental cost streams of Model 1.2 A - B 777.3
A Incremental operating costs at the producer level i + ii 857.5
i Cost of fund 11% of total incremental costs 85.0 ii Incremental reproduction and production costs iii + iv + 1 - 2 772.5 iii Other operating costs—transportation 25% of feed costs of (1.1.1 + 1.2.1 + 1.3.1) + 71.0 iv Additional feed costs for increased reproduction 40% of 36% death risk 88.3 1 Costs with Model 1.2 at producer level 1.1 + 1.2 + 1.3 613.2
1.1 Winter maintenance supplement 1.3.1 + 1.3.2 309.6
1.1.1 Supplement feed costs ETB 0.97/day/sheep*60 days 97.1 1.1.2 Additional veterinary costs ETB 15/30 days/lamb*60 days + ETB 212.5 15/30 days/ewe*365 days 1.2 Winter production supplement 1.2.1 + 1.2.2 212.6
1.2.1 Supplement feed costs ETB 1.52/day/lamb*123 days 151.1 1.2.2 Additional veterinary expenses ETB 15/30 days*123 days 61.5 1.3 Summer production supplement 1.3.1 + 1.3.2 91.0
1.3.1 Supplement feed costs ETB 0.06/day/sheep*182 days 0.0 1.3.2 Additional veterinary costs ETB 15/30 days*182 days 91.0 2 Costs with traditional production system at the producer level 2.1 0.0
2.1 No additional supplement 0.0 B Incremental costs with Model 1.2 feedlot 4.8
3 Costs with Model 1.2 production system 244.8
3.1 Supplement feed cost: starter ETB 2.47/day/lamb*7 days 35.0 3.2 Supplement feed cost: finisher ETB 3.59/day/animal*28 days 209.8 4 Costs with current production system 4.1 + 4.2 240.0
4.1 Supplement feed cost ETB 6/kg/day/lamb*40 days 240.0 II Incremental benefit steams with Model 1.2 production system A 1,788.7
A Incremental benefits with Model 1.2 5 - 6 1,788.7
5 Benefit from sales of meat in Model 1.2 5.3 + 5.4 + 5.5 4,597.7
5.1 Total weight 35.6 5.2 Carcass weight Dressing percentage of 45% 16.0 5.3 Value of prime cuts 5.3.1*5.3.2 2,928.5 5.3.1 Carcass weight for prime cuts 45.7% of carcass weight 7.3 5.3.2 High-class consumers’ willingness to pay for prime cuts ETB 400/kg 400.0 5.4 Value of normal cuts 5.4.1*5.4.2 1,384.1 5.4.1 Carcass weight for normal cuts 28.8% of carcass weight 4.6 5.4.2 Consumers’ willingness to pay for normal cuts ETB 300/kg 300.0 5.5 Value of trimmed meat 5.5.1*5.5.2 285.2 5.5.1 Carcass weight trimmed meat cuts 8.9% of carcass weight 1.4 5.5.2 Consumers’ willingness to pay for inferior cuts ETB 200/kg 200.0 6 Benefit streams with traditional production system 6.3 + 6.4 + 6.4 2,809.0
6.1 Live weight 35.6 6.2 Carcass weight Dressing percentage of 42% 16.0 6.3 Value of prime cuts 6.3.1*6.3.2 1,708.3 6.3.1 Carcass weight for prime cuts 45.7% of carcass weight 6.8 6.3.2 Consumers’ willingness to pay for prime cuts ETB 300/kg 250.0 6.4 Value of normal cuts 6.4.1*6.4.2 861.2 6.4.1 Carcass weight for normal cuts 28.8% of carcass weight 4.3 6.4.2 Consumers’ willingness to pay for normal cuts ETB 200/kg 200.0 6.5 Value of trimmed meat 6.5.1*6.5.2 239.5 6.5.1 Carcass weight for inferior cuts 8.9% of carcass weight 1.3 6.5.2 Consumers’ willingness to pay for inferior cuts ETB 180/kg 180.0 III Net benefit of Model 1.2 production system II - I 1,011.4
continued on next page

110
APPENDIX I
C Incremental benefits with Model 1.2 at the feedlot level 7 - 8 1,755.4
7 Revenues from animal in Model 1.2 7.1 - 7.2 4,512.2
7.1 Consumers’ price for animal in Model 1.2 5 4,597.7 7.2 Butchers’/abattoirs’ margin 3% abattoir’s marketing margin 85.5 8 Sales of the conditioned animal in the traditional method 8.1 - 8.2 2,756.8
8.1 Consumers’ willingness to pay for meat 6 2,809.0 8.2 Butchers’/abattoirs’ margin 3% of 62% abattoir’s marketing margin 52.2 IV Net benefit at the feedlot level C - B 1,750.6
D Incremental benefits with Model 1.2 at the producer level 9 - 10 2,626.4
9 Benefit with Model 1.2 at producer level 9.1 + 9.2 + 9.3 4,479.2
9.1 Farmer’s price for Model 1.2-conditioned anima1 7 - 9.1.1 - 9.1.2 3,032.7 9.1.1 Feedlot marketing margin 21.3% of feedlot’s price 961.1 9.1.2 Other actors’ marketing margin 14.6% of trader’s price 518.5 9.2 Cost saved due to a reduction in risks of animal death 40% reduction in risk of 36% current risk 436.7 9.3 Reproduction gain 33% growth in reproduction 1,009.9 10 Benefits from sales for traditional conditioning 10 - 10.1.1 - 10.1.2 1,852.8
10.1 Sales of traditionally conditioned animal 8 2,756.8 10.1.1 Feedlot marketing margin 21.3% of feedlot’s price 587.2 10.1.2 Other actors’ marketing margin 14.6% of trader’s price 316.8 V Net benefit at producer level D - A 1,768.9
VI Overall return to feedlot and producers 13 Total net benefits per year for feedlot FNB/animal*100 animal*5 rounds/year 875,320.5 14 The rate of return for producers 365.0 15 Total net benefits per year for feedlot FNB/animal*10 animal*1 rounds/year 17,689.35 16 The rate of return for feedlot 206.3
continued from previous page
No. Cost/benefit items Description Value in ETB
Model 2.1. MCL beef for HED market
No. Cost/benefit items Description Value in ETB
I Incremental cost streams of Model 2.1 A - B 10,367.7
A Incremental operating costs at the producer level i + ii 9,856.4
i Cost of fund (IC/2*(1.11^2)+(IC/2)*1.11)-IC 1,439.7 ii Incremental reproduction and production costs iii + iv + 1 - 2 8,,416.8 iii Other operating costs—transportation 25% of feed costs 1,384.6 iv Additional feed costs for increased reproduction 40% of 27% death risk + 50% of 50% reproduction 1,853.8 1 Costs with Model 2.1 at producer level 1.1 + 1.2 + 1.3 + 1.4 5,178.3
1.1 Reproduction program 1.1.1 + 1.1.2 1,289.4
1.1.1 Additional feed for heifer and cow (trimester) ETB 3.83/day/animal*180 days 689.4 1.1.2 Additional veterinary costs ETB 25/month/cow*24 months 600.0 1.2 Winter maintenance supplement 1.2.1 + 1.2.2 901.3
1.2.1 Supplement feed costs ETB 3.83/day/animal*183 days 701.3 1.2.2 Additional veterinary costs ETB 25/month/calf*8 months 200.0 1.3 Winter production supplement 1.3.1 + 1.3.2 1,475.7
1.3.1 Supplement feed costs ETB 7.24/day/animal*183 days 1,325.7 1.3.2 Additional veterinary expenses ETB 25/month/calf*6 months 150.0 1.4 Summer production supplement 1.4.1 + 1.4.2 1,511.9
1.4.1 Supplement feed costs ETB 7.5/day/animal*182 days 1,361.9 1.4.2 Additional veterinary costs ETB 25/month/calf/30 days*182 days 150.0 2 Costs with traditional production system at the producer level 2.1 0.0
2.1 No additional supplement 0.0 B Incremental costs with Model 2.1 feedlot 511.2
continued on next page

111Reorienting Livestock Production to Respond to the Meat Quality Requirements of High-End Domestic and Export Markets
APPENDIX I
No. Cost/benefit items Description Value in ETB
3 Costs with Model 2.1 production system 5,526.0
3.1 Supplement feed cost: starter ETB 28.8/day/animal*14 days 403.6 3.2 Supplement feed cost: grower ETB 45.0/day/animal*76 days 3,421.5 3.3 Supplement feed cost: finisher ETB 56.7/day/animal*30 days 1,700.9 4 Costs with current production system 4.1 + 4.2 5,014.8
4.1 Supplement feed cost ETB 6.3/kg*8 kg/day/animal*90 days 4,536.0 4.2 Roughage ETB 2.8*1.9 kg/day/animal*90 days 478.8 II Incremental benefit steams with Model 2.1 production system A 18,905.6
A Incremental benefits with Model 2.1 5 - 6 18,905.6
5 Benefit from sales of meat in Model 2.1 5.3 + 5.4 + 5.5 42,107.1
5.1 Total weight 332.0 5.2 Carcass weight Dressing percentage of 54.3% 180.3 5.3 Value of prime cuts 5.3.1*5.3.2 28,835.1 5.3.1 Carcass weight for prime cuts 45.7% of carcass weight 82.4 5.3.2 High-class consumers’ willingness to pay for prime cuts ETB 350/kg 350.0 5.4 Value of normal cuts 5.4.1*5.4.2 10,383.9 5.4.1 Carcass weight for normal cuts 28.8% of carcass weight 51.9 5.4.2 Consumers’ willingness to pay for normal cuts ETB 200/kg 200.0 5.5 Value of trimmed meat 5.5.1*5.5.2 2,888.0 5.5.1 Carcass weight trimmed meat cuts 8.9% of carcass weight 16.0 5.5.2 Consumers’ willingness to pay for inferior cuts ETB 180/kg 180.0 6 Benefit streams with traditional production system 6.3 + 6.4 + 6.4 23,201.5
6.1 Live weight 320.0 6.2 Carcass weight Dressing percentage of 50% 160.0 6.3 Value of prime cuts 6.3.1*6.3.2 13,465.9 6.3.1 Carcass weight for prime cuts 45.7% of carcass weight 67.3 6.3.2 Consumers’ willingness to pay for prime cuts ETB 200/kg 200.0 6.4 Value of normal cuts 6.4.1*6.4.2 7,637.6 6.4.1 Carcass weight for normal cuts 28.8% of carcass weight 42.4 6.4.2 Consumers’ willingness to pay for normal cuts ETB 180/kg 180.0 6.5 Value of trimmed meat 6.5.1*6.5.2 2,098.0 6.5.1 Carcass weight for inferior cuts 8.9% of carcass weight 13.1 6.5.2 Consumers’ willingness to pay for inferior cuts ETB 160/kg 160.0 III Net benefit of Model 2.1 production system II - I 8,537.9
C Incremental benefits with Model 2.1 at the feedlot level 7 - 8 14,897.6
7 Revenues from animal in Model 2.1 7.1 - 7.2 33,180.4
7.1 Consumers’ price for animal in Model 2.1 5 42,107.1 7.2 Butchers’/abattoirs’ margin 21.2% butcher’s marketing margin 8,926.7 8 Sales of the conditioned animal in the traditional method 8.1 - 8.2 18,282.8
8.1 Consumers’ willingness to pay for meat 6 23,201.5 8.2 Butchers’/abattoirs’ margin 21.2% butcher’s marketing margin 4,918.7 IV Net benefit at the feedlot level C - B 14,386.4
D Incremental benefits with Model 2.1 at the producer level 9 - 10 19,540.8
9 Benefit with Model 2.1 at producer level 9.1 + 9.2 + 9.3 31,828.6
9.1 Farmer’s price for Model 2.1-conditioned anima1 7 - 9.1.1 - 9.1.2 22,300.5 9.1.1 Feedlot marketing margin 21.3% of feedlot’s price 7,067.4 9.1.2 Other actors’ marketing margin 14.6% of trader’s price 3,812.5 9.2 Cost saved due to a reduction in risks of animal death 40% reduction in risk of 27.5% current risk 2,453.1 9.3 Reproduction gain 50% of 50% 5,575.1 9.4 Additional gains from sales of the culled cow 25% of the market price of ETB 6,000/culled cow 1,500.0 10 Benefits from sales for traditional conditioning 10 - 10.1.1 - 10.1.2 12,287.8
10.1 Sales of traditionally conditioned animal 8 18,282.8
continued on next page
continued from previous page

112
APPENDIX I
No. Cost/benefit items Description Value in ETB
10.1.1 Feedlot marketing margin 21.3% of feedlot’s price 3,894.2 10.1.2 Other actors’ marketing margin 14.6% of trader’s price 2,,100.7 V Net benefit at producer level D - A 9,684.4
E Incremental weight gain in Model 2.1 at the producer level WG in Model 2.1 - WG in traditional 105.7
11 Total weight gain in Model 2.1 220.8 12 Total weight gain in traditional production 115.2 VI Overall return to feedlot and producers
13 Total net benefits per year for feedlot FNB/animal*100 animal*5 rounds/year 7,193,186.7 14 The rate of return for feedlot 2,814.1 15 Total net benefits per year for producers FNB/animal*5 animal*1 rounds/year 96,843.8 16 The rate of return for producers 98.3
continued from previous page
Model 2.2. Dairy beef for HED and export markets
No. Cost/benefit items Description Value in ETB
I Incremental cost streams of Model 2.2 A - B 12,162.8
A Incremental operating costs at the producer level i + ii 9,532.8
i Cost of fund MC*11%*240 days/365 days 643.0 ii Incremental reproduction and production costs iii + iv + 1 - 2 8,889.8 iii Other operating costs—transportation 25% of feed costs 1,346.0 iv Additional feed costs for increased reproduction 50% of 75% retention + 40% of 27% death risk 2,457.0 1 Costs with Model 2.2 at producer level 1.1 + 1.2 + 1.3 + 1.4 5,086.9
1.1 Reproduction program 1.1.1 + 1.1.2 600.0
1.1.2 Additional veterinary costs ETB 40/month/cow*300 days/30 days 600.0 1.2 Winter maintenance supplement 1.2.1 + 1.2.2 1,801.8
1.2.1 Supplement feed costs cow ETB 7.66/day/animal*183 days 1,401.8 1.2.2 Additional veterinary costs ETB 40/month/calf*300 days/30 days 400.0 1.3 Winter production supplement 1.3.1 + 1.3.2 701.3
1.3.1 Supplement feed costs calf ETB 10.9/day/animal*57 days 621.3 1.3.2 Additional veterinary expenses ETB 40/month/calf*60 days/30 days 80.0 1.4 Summer production supplement 1.4.1 + 1.4.2 1,983.8
1.4.1 Supplement feed costs cow ETB 10.9/day/animal*182 days 1,983.8 2 Costs with traditional production system at the producer level 2.1 0.0
2.1 No additional supplement 0.0 B Incremental costs with Model 2.2 feedlot*(3-4) 3 - 4 3,273.0
3 Costs with Model 2.2 production system 3.1 + 3.2 + 3.3 8,287.8
3.1 Supplement feed cost: starter ETB 43.2/day/animal*14 days 604.8 3.2 Supplement feed cost: grower ETB 67.5/day/animal*76 days 5,130.0 3.3 Supplement feed cost: finisher ETB 85.1/day/animal*30 days 2,553.0 4 Costs with current production system 4.1 + 4.2 5,014.8
4.1 Supplement feed cost ETB 6.3/kg*8kg/day/animal*90 days 4,536.0 4.2 Roughage ETB 2.8*1.9kg/day/animal*90 days 478.8 II Incremental benefit steams with Model 2.2 production system A 29,271.2
A Incremental benefits with Model 2.2 5 - 6 29,271.2
5 Benefit from sales of meat in Model 2.2 5.3 + 5.4 + 5.5 52,472.7
5.1 Total weight 220 kg+120 days*1.25 ADG 370.0 5.2 Carcass weight Dressing percentage of 54.3% 200.9 5.3 Value of prime cuts 5.3.1*5.3.2 3,4431.0 5.3.1 Carcass weight for prime cuts 45.7% of carcass weight 91.8 5.3.2 High-class consumers’ willingness to pay for prime cuts ETB 375/kg 375.0 5.4 Value of normal cuts 5.4.1*5.4.2 14,465.5
continued on next page

113Reorienting Livestock Production to Respond to the Meat Quality Requirements of High-End Domestic and Export Markets
APPENDIX I
continued from previous page
No. Cost/benefit items Description Value in ETB
5.4.1 Carcass weight for normal cuts 28.8% of carcass weight 57.9 5.4.2 Consumers’ willingness to pay for normal cuts ETB 250/kg 250.0 5.5 Value of trimmed meat 5.5.1*5.5.2 3,576.2 5.5.1 Carcass weight trimmed meat cuts 8.9% of carcass weight 17.9 5.5.2 Consumers’ willingness to pay for inferior cuts ETB 200/kg 200.0 6 Benefit streams with traditional production system 6.3 + 6.4 + 6.4 23,201.5
6.1 Live weight 320.0 6.2 Carcass weight Dressing percentage of 50% 160.0 6.3 Value of prime cuts 6.3.1*6.3.2 13,465.9 6.3.1 Carcass weight for prime cuts 45.7% of carcass weight 67.3 6.3.2 Consumers’ willingness to pay for prime cuts ETB 200/kg 200.0 6.4 Value of normal cuts 6.4.1*6.4.2 7,637.6 6.4.1 Carcass weight for normal cuts 28.8% of carcass weight 42.4 6.4.2 Consumers’ willingness to pay for normal cuts ETB 180/kg 180.0 6.5 Value of trimmed meat 6.5.1*6.5.2 2,098.0 6.5.1 Carcass weight for inferior cuts 8.9% of carcass weight 13.1 6.5.2 Consumers’ willingness to pay for inferior cuts ETB 160/kg 160.0 III Net benefit of Model 2.2 production system II - I 17,108.4
C Incremental benefits with Model 2.2 at the feedlot level 7 - 8 23,065.7
7 Revenues from animal in Model 2.2 7.1 - 7.2 41,348.5
7.1 Consumers’ price for animal in Model 2.2 5 52,472.7 7.2 Butchers’/abattoirs’ margin 21.2% butcher’s marketing margin 11,124.2 8 Sales of the conditioned animal in the traditional method 8.1 - 8.2 18,282.8
8.1 Consumers’ willingness to pay for meat 6 23,201.5 8.2 Butchers’/abattoirs’ margin 21.2% butcher’s marketing margin 4,918.7 IV Net benefit at the feedlot level C - B 19,792.7
D Incremental benefits with Model 2.2 at the producer level 9 - 10 32,506.9
9 Benefit with Model 2.2 at producer level 9.1 + 9.2 + 9.3 44,794.7
9.1 Farmer’s price for Model 2.2-conditioned anima1 7 - 9.1.1 - 9.1.2 27,790.2 9.1.1 Feedlot marketing margin 21.3% of feedlot’s price 8,807.2 9.1.2 Other actors’ marketing margin 14.6% of trader’s price 4,751.0 9.2 Cost saved due to a reduction in risks of animal death 40% reduction in risk of 27.5% current risk 3,056.9 9.3 Reproduction gain 50% of 50% 6,947.6 9.4 Additional gains from sales of the culled cow and heifers 25% of ETB 8,000/culled cow + 25% of ETB 20,000/heifer 7,000.0 10 Benefits from sales for traditional conditioning 10 - 10.1.1 - 10.1.2 12,287.8
10.1 Sales of traditionally conditioned animal 8 18,282.8 10.1.1 Feedlot marketing margin 21.3% of feedlot’s price 3,894.2 10.1.2 Other actors’ marketing margin 14.6% of trader’s price 2,100.7 V Net benefit at producer level D - A 22,974.1
E Incremental weight gain in Model 2.2 at the producer level WG in Model 2.2 - WG in traditional 105.7
11 Total weight gain in Model 2.2 220.8 12 Total weight gain in traditional production 115.2 VI Overall return to feedlot and producers 13 Total net benefits per year for feedlot FNB/animal*40 animal*3 rounds/year 2,756,892.0 14 The rate of return for feedlot 604.7 15 Total net benefits per year for producer FNB/animal*5 animal*1 rounds/year 114,870.5 16 The rate of return for producers 241.0

114
APPENDIX I
Model 2.3. Sheep for the HED market
No. Cost/benefit items Description Value in ETB
I Incremental cost streams of Model 2.3 A - B 797.3
A Incremental operating costs at the producer level i + ii 857.5
i Cost of fund 11% of total incremental costs 85.0 ii Incremental reproduction and production costs iii + iv + 1 - 2 772.5 iii Other operating costs—transportation 25% of feed costs of (1.1.1 + 1.2.1 + 1.3.1) + 71.0 iv Additional feed costs for increased reproduction 40% of 36% death risk 88.3 1 Costs with Model 2.3 at producer level 1.1 + 1.2 + 1.3 613.2
1.1 Winter maintenance supplement 1.13.1 + 1.1.2 309.6
1.1.1 Supplement feed costs ETB 0.97/day/sheep*60 days 97.1 1.1.2 Additional veterinary costs ETB 15/30 days/lamb*60 days+ ETB 15/30 212.5 days/ewe*365 days 1.2 Winter production supplement 1.2.1 + 1.2.2 212.6
1.2.1 Supplement feed costs ETB 1.52/day/lamb*123 days 151.1 1.2.2 Additional veterinary expenses ETB 15/30 days*123 days 61.5 1.3 Summer production supplement 1.3.1 + 1.3.2 91.0
1.3.1 Supplement feed costs ETB 0.06/day/sheep*182 days 0.0 1.3.2 Additional veterinary costs ETB 15/30 days*182 days 91.0 2 Costs with traditional production system at the producer level 2.1 0.0
2.1 No additional supplement 0.0 B Incremental costs with Model 2.3 feedlot 3 - 4 -60.2
3 Costs with Model 2.3 production system 3.1 + 3.2 + 3.3 179.8
3.1 Supplement feed cost: starter ETB 3.67/day/lamb*7 days 25.7 3.2 Supplement feed cost: finisher ETB 5.5/day/animal*28 days 154.1 4 Costs with current production system 4.1 + 4.2 240.0
4.1 Supplement feed cost ETB 6/kg/day/lamb*40 days 240.0 II Incremental benefit steams with Model 2.3 production system A 1,596.6
A Incremental benefits with Model 2.3 5 - 6 1,596.6
5 Benefit from sales of meat in Model 2.3 5.3 + 5.4 + 5.5 3,214.0
5.1 Total weight 26.2 5.2 Carcass weight Dressing percentage of 45% 11.8 5.3 Value of prime cuts 5.3.1*5.3.2 2,155.2 5.3.1 Carcass weight for prime cuts 45.7% of carcass weight 5.4 5.3.2 High-class consumers’ willingness to pay for prime cuts ETB 400/kg 400.0 5.4 Value of normal cuts 5.4.1*5.4.2 848.9 5.4.1 Carcass weight for normal cuts 28.8% of carcass weight 3.4 5.4.2 Consumers’ willingness to pay for normal cuts ETB 250/kg 250.0 5.5 Value of trimmed meat 5.5.1*5.5.2 209.9 5.5.1 Carcass weight trimmed meat cuts 8.9% of carcass weight 1.0 5.5.2 Consumers’ willingness to pay for inferior cuts ETB 200/kg 200.0 6 Benefit streams with traditional production system 6.3 + 6.4 + 6.4 1,617.4
6.1 Live weight 26.2 6.2 Carcass weight Dressing percentage of 42% 11.0 6.3 Value of prime cuts 6.3.1*6.3.2 938.7 6.3.1 Carcass weight for prime cuts 45.7% of carcass weight 4.7 6.3.2 Consumers’ willingness to pay for prime cuts ETB 300/kg 200.0 6.4 Value of normal cuts 6.4.1*6.4.2 532.4 6.4.1 Carcass weight for normal cuts 28.8% of carcass weight 3.0 6.4.2 Consumers’ willingness to pay for normal cuts ETB 200/kg 180.0 6.5 Value of trimmed meat 6.5.1*6.5.2 146.3 6.5.1 Carcass weight for inferior cuts 8.9% of carcass weight 0.9 6.5.2 Consumers’ willingness to pay for inferior cuts ETB 180/kg 160.0 III Net benefit of Model 2.3 production system II - I 799.3
continued on next page

115Reorienting Livestock Production to Respond to the Meat Quality Requirements of High-End Domestic and Export Markets
APPENDIX I
No. Cost/benefit items Description Value in ETB
C Incremental benefits with Model 2.3 at the feedlot level 7 - 8 1,258.1
7 Revenues from animal in Model 2.3 7.1 - 7.2 2,532.6
7.1 Consumers’ price for animal in Model 2.3 5 3,214.0 7.2 Butchers’/abattoirs’ margin 21.2% butcher’s marketing margin 681.4 8 Sales of the conditioned animal in the traditional method 8.1 - 8.2 1,274.5
8.1 Consumers’ willingness to pay for meat 6 1,617.4 8.2 Butchers’/abattoirs’ margin 21.2% butcher’s marketing margin 342.9 IV Net benefit at the feedlot level C - B 1,318.3
D Incremental benefits with Model 2.3 at the producer level 9 - 10 1,657.5
9 Benefit with Model 2.3 at producer level 9.1 + 9.2 + 9.3 2,514.1
9.1 Farmer’s price for Model 2.3-conditioned anima1 7 - 9.1.1 - 9.1.2 1,702.2 9.1.1 Feedlot’s marketing margin 21.3% of feedlot’s price 539.4 9.1.2 Other actors’ marketing margin 14.6% of trader’s price 291.0 9.2 Cost saved due to a reduction in risks of animal death 40% reduction in risk of 36% current risk 245.1 9.3 Reproduction gain 33% growth in reproduction 566.8 10 Benefits from sales for traditional conditioning 10 - 10.1.1 - 10.1.2 856.6
10 Sales of traditionally conditioned animal 8 1,274.5 10.1.1 Feedlot’s marketing margin 21.3% of feedlot’s price 271.5 10.1.2 Other actors’ marketing margin 14.6% of trader’s price 146.4 V Net benefit at producer level D - A 800.0
E Total net incremental benefits in Model 2.3
VI Total net benefits per year for feedlot FNB/animal*100 animals*5 rounds/year 659,141.1 14 The rate of return for feedlot -21.9 15 Total net benefits per year for feedlot FNB/animal*10 animals*1 rounds/year 8,000.2 16 The rate of return for producers 93.3
continued from previous page
116
APPENDIX II
APPENDIX II. PROTOCOL FOR PILOT TESTING THE INTERVENTION MODELS
Different intervention models have been proposed to improve the quality and quantity of meat production to meet the requirements of export and HED markets as described above. The models are developed for cattle, sheep, and goats. They are designed to fit the different production scenarios/agro-ecological settings (pastoral/MCL). Financial and economic analyses of these models show that they will potentially bring about transformation in livestock production and productivity if implemented with due consideration to availing all the set input and other requirements as proposed. The models have intervention components at the “source” where animals are produced by farmers and/or pastoralists and at the feedlot level.
It is, however, imperative that the proposed intervention models be tested both at “source” and feedlot levels under real production situations on a pilot scale for appropriateness (affordability, environmental friendliness, ease of implementation, profitability to warrant the extra effort/inputs) and implementation challenges before scaling up/scaling out. This pilot testing step is expected to help identify possible impediments/shortfalls that will serve to modify and fine-tune the interventions for eventual scale-up.
A. Implementation strategy and approach
The core approach for piloting the models will be introduction of the proposed improved technologies and practices, capacity development of producers and key implementers (development agents, etc.), and facilitation of the participation of other stakeholders, including the private sector.
Since successful and sustainable intervention depends on access to inputs and efficient delivery of services, as well as access to markets to serve as a pull factor for producers to adopt improved interventions, strengthening public input/service providers and facilitating provision of services/inputs by the private sector, establishing linkages between farmers and input/service providers, providing market information, and linking to profitable market outlets will be an integral supportive component of the technical interventions (technologies and improved practices).
Supportive services will be ensured best through linkage and collaboration with ongoing government and non-governmental livestock development projects and initiatives (e.g., the Agricultural Growth Program (AGP); livestock and fisheries sector projects). Collaboration with partners for introducing technical interventions (e.g.,
research institutes), market linkages (e.g., marketing and cooperative offices), institutional/administrative support (e.g., local administration), and credit services (micro-finance institutions, etc.) is essential.
Provision of an incentive mechanism for participation may be essential at the initial stage up until the benefits of the intervention schemes are clearly demonstrated. It would be essential, therefore, to get some funding support for the piloting scheme (cost of the interventions, etc.), at least for interventions at the “source.” The extra cost of interventions at the feedlot level may be covered by the feedlots themselves after intensive awareness creation and effort to convince them of the benefits that can accrue.
Approach for introducing technical interventions: A number of technical interventions (technologies and improved practices) are identified. It is anticipated that capacity development (both material and human) and efficient delivery of inputs and services will be facilitated for a sustainable introduction of the interventions. The method of introduction of the interventions includes:
• Human capacity building:
o Awareness creation of stakeholders: All who engage directly or indirectly in the implementation of the models will be made aware of the objectives of the interventions, what is required of the different participants, the benefits that will accrue, etc. to create a conducive environment for the success of the interventions.
o Training of development agents (DAs): DAs, who will closely follow up the interventions, will be given thorough technical training on the interventions and implementation modalities so that they understand the interventions and the implementation strategy and provide the necessary support and follow-up.
o Farmer/feedlot operator training: Training of farmers/feedlot operators in pilot areas on the interventions, demonstration of interventions (technologies and improved practices) for targeted “intervention farms/feedlots,” and a field day for “domain farms/feedlots” in the same area that are not included as intervention farms will be conducted.
117Reorienting Livestock Production to Respond to the Meat Quality Requirements of High-End Domestic and Export Markets
APPENDIX II
• Follow-up, coaching, and mentoring: The “intervention” farmers/feedlots will be continuously followed up with coaching and mentoring.
B. Methodology
Pilot locations and participants/beneficiaries
The piloting will be implemented in selected sites that cover agro-ecologies, production systems, and livestock species as prescribed by each of the intervention models. Accordingly, the following locations are proposed.
• MCL:
o Cattle:
3 Horro Guduru Wolega Zone (Horro cattle).
3 East Gojam Zone (Fogera cattle).
o Sheep:
3 Agewawi Zone (Washera sheep). 3 Kaffa Zone (Bonga sheep). 3 Horro Guduru Wolega Zone (Horro
sheep).
• Pastoral/agro-pastoral:
o Cattle:
3 Borena Zone (Yabello, Negelle Borana).
o Sheep:
3 Borena Zone (Blackhead Somali).
o Goat:
3 Borena Zone (Long-eared Somali goats; Short-eared Somali goats).
• Feedlots:
o Cattle:
3 Feedlots around Adama/Nazareth.
o Sheep:
3 Sheep feedlots around the habitats of the identified breeds (Horro, Bonga, Washera).
Selection of test locations and participants/beneficiary households
One woreda from each of the proposed locations/habitats and three kebeles from each of the selected woredas will be identified for implementation of the relevant models.
Small-scale sheep, goat, and cattle keepers will be the targets. Beneficiaries will also include service providers as part of the capacity development support. Selection of beneficiaries would consider the gender of household, willingness to participate, appropriateness of the farm for piloting the specific package (e.g., herd size, species composition), and past extension experience. The sample size or number of households per intervention and location shall be 6% of livestock-owning households/selected kebeles, such that: 2% will be participants who use the current practice and are monitored as a control; 2% implement the model as proposed; and the remaining 2% will feed 1.5 times the proposed intervention to see whether returns will increase proportionally to the additional input increments.
Specific piloting activities
The main activities proposed to achieve the project outcomes are:
• Engaging stakeholders (farmers, service providers, and partners): Organize workshops to introduce the pilot project to partners at national and local level. Conduct consultations with the target households to ensure participation of farmers/pastoralists from the outset. These workshops will help create a common understanding and help the project to refine and reach consensus.
• Toolkit for implementing the interventions and documentation: Appropriate measurements, following set standard procedures and recording, are critical. This will include the development of standard operating procedures (SOPs) for each of the intervention models, data collection, reporting formats, etc., description of routine project activities to be carried out by project implementers, and shares of responsibility.
• Establishing the baseline: A baseline survey will be conducted on flock characteristics, mortality rates, management and breeding practices, access to inputs and services (e.g., health service, input supply, etc.), and socioeconomic situation (incomes from livestock, sales data, etc.), feed resource availability and utilization (e.g., feed resources, purchased feeds, feed utilization, etc.), and performance (growth rates, etc.).
118
APPENDIX II
• Introducing the planned intervention packages (technical interventions, capacity development, linkages, etc.): The steps to introduce the interventions are:
o Capacity development/awareness creation for DAs and farmers (development of manuals, skill training, field days, pictures, slogans, banners/posters, radio and TV information/awareness);
o Selection and detailed training of beneficiaries on the specific package (including roles and responsibilities of DAs/farmers/coordinators);
o Introducing and detailed training of participants (DAs, farmers, etc.) on the SOP for implementation of the intervention model;
o Follow-up training with continuous coaching and mentoring.
• Generating evidence on technical performance, economic viability, and potential welfare impacts, including food security for women and other smallholder producers from the set of piloted interventions. The design for assessing the impact of the interventions will follow both temporal and spatial approaches to generate reliable evidence. Evidence will be gathered pre- and post-intervention (comparison will be made between the baseline and post-intervention status) as well as intervention and non-intervention locations (non-intervention locations similar to the intervention locations in agro-ecological and socioeconomic conditions selected as a control). Similar data will be collected in both sets of locations. The basic means to collect these data will be:
o Targeted household surveys, including producers and input/service providers;
o Continuous monitoring studies. Employed enumerators or DAs will collect data continuously. Data categories will include the following, as relevant to the specific model:
3 Biological data: Milk production; weight change (daily, weekly, monthly, or before and after treatment, with scale or physical body measurements); body condition scoring (use agreed-upon standards for cattle and small ruminants); feed intake, days on feed; animal health or disease ratings; percent conception; calving, kidding, lambing rated; survival of young
at one day, one week, one month, etc.; meat yield and quality (e.g., fat content). Have good, reliable scales for livestock, feed, etc. measurements;
3 Socioeconomic data (sales, incomes, input, etc.);
3 Farmers’/pastoralists’ opinions/perceptions;
3 Regular documentation of lessons, successes, challenges, etc.
• Implementation arrangements: The piloting scheme will be implemented by the Ministry of Agriculture and Livestock (MoAL) and its subsidiaries down to the ground (kebele) level and by engaging relevant stakeholders such as research centers, local administration, development partners, etc. as required and appropriate.
• Monitoring, evaluation, and reporting: The piloting scheme will be monitored and evaluated based on a performance measurement framework that includes verifiable indicators to be developed and agreed upon. A proposed monitoring and evaluation may include:
o Continuous hierarchical coaching and mentoring, particularly of trained DAs and participating livestock owners, will have to be conducted to ensure the implementation is on track and that problems are solved/corrective measures are taken in a timely fashion;
o DAs will submit report weekly to the woreda’s supervisor;
o Woreda coordinator will make site supervision every two weeks;
o Woredas will compile and report to regional and federal responsible offices/officers every month;
o Evaluation of the piloted intervention models: An evaluation team at the federal level will compile the data/information from reports and on-site evaluation of sample pilot areas and come up with recommendations on model performance after enrichment with inputs from a stakeholders’ workshop.
• Revision of the intervention models: The intervention models will then be adjusted after the ground-truthing exercise before they are scaled up/scaled out.

119Reorienting Livestock Production to Respond to the Meat Quality Requirements of High-End Domestic and Export Markets
APPENDIX IIIA
PP
EN
DIX
III
.In
stitu
tions
vis
ited
and
peop
le c
onta
cted
dur
ing
stud
y
cont
inue
d on
nex
t pag
e
S. N
o.
Nam
e of
org
aniz
atio
n Ty
pe o
f bus
ines
s eng
aged
in
Pers
on c
onta
cted
Te
leph
one
Loc
atio
n1
Ethi
opia
n M
eat P
rodu
cers
Pr
ovid
e va
rious
serv
ices
to m
embe
rs
Ato
Abe
baw
Mek
onen
09
1224
9130
Ad
dis A
baba
&
Exp
orte
rs A
ssoc
iatio
n 2
Hib
ret B
utch
ery
Trad
ers A
ssoc
iatio
n ”
Mr.
Tseg
ayec
Hai
lu a
nd
0114
1677
12
Addi
s Aba
ba
Mr.
Ayel
e Sa
hile
3 Et
hiop
ian
Live
stock
Tra
ders
Ass
ocia
tion
”
Ato
Mes
ert
0912
7191
61
Addi
s Aba
ba4
Alla
na A
kshe
ker E
thio
pia
Cas
ing
PLC
Sl
augh
ter,
proc
ess,
and
expo
rt m
eat
Ato
Ghi
dey
Geb
rem
edhi
n 09
3871
7575
Ad
dis A
baba
5 Et
hiop
ian
Mea
t and
Dai
ry In
dust
ry
Supp
ortin
g pr
ivat
e ac
tors
eng
aged
in
Ato
Kel
ifa H
usse
in
0911
1160
49
Bish
oftu
D
evel
opm
ent I
nstit
ute
mea
t and
dai
ry p
roce
ssin
g an
d tr
ade
6 M
arke
ting
Dire
ctor
ate,
Min
istry
of
Supp
ortin
g ac
tors
eng
aged
in li
vesto
ck
Ato
Feka
du G
etac
hew
09
1011
2394
Ad
dis A
baba
Li
vesto
ck a
nd F
isher
ies
and
fishe
ry p
rodu
ctio
n an
d bu
sines
s 7
Rad
isson
Blu
Hot
el
Hot
el b
usin
ess
Che
f Aye
le 01
1515
7600
Ad
dis A
baba
8 H
ilton
Hot
el
Hot
el b
usin
ess
Mes
fin
0115
1700
00
Addi
s Aba
ba9
Ethi
opia
n Li
ve A
nim
als E
xpor
ters
Pr
ovid
e va
rious
serv
ices
to m
embe
rs
W/o
Kib
re; A
to S
hife
r Ass
efa
09
1123
7910
; Ad
dis A
baba
A
ssoc
iatio
n
and
Ato
Fele
ke
0911
2089
22;
0911
4841
09
10
Sher
aton
Add
is H
otel
H
otel
serv
ice
Ato
Wub
e Ay
alew
01
1517
1717
Ad
dis A
baba
11
Ram
ada
Hot
el
Hot
el se
rvic
e At
o M
inte
sinot
Bef
ekad
u 09
4473
1957
Ad
dis A
baba
12
Elill
y H
otel
H
otel
serv
ice
Ato
Yage
rsew
Aba
wa
0913
6895
60
Addi
s Aba
ba13
Pr
ime
Mea
t Pro
duct
ion
Su
pply
mea
t to
dom
estic
mar
ket
Ato
Gos
hu; A
to B
erek
et
Bi
shof
tu14
M
ojo
Mod
ern
Slau
ghte
rhou
se
Expo
rt c
hille
d sh
oat m
eat
Dr.
Sile
alem
; Ato
Mul
u Ta
kele
0913
8061
23;
Moj
o
09
1283
5727
15
Ethi
o-fe
ed P
roce
ssin
g Pl
ant
Proc
ess a
nd se
ll an
imal
feed
At
o K
alea
b 09
0632
0355
Ad
ama
16
Luna
Exp
ort A
batto
ir Ex
port
chi
lled
mea
t and
supp
ly
Dr.
Neg
a N
egat
u 09
3011
0048
M
ojo
to th
e lo
cal m
arke
t17
Ad
disa
lem F
eed
Proc
essin
g Pr
oces
s and
sell
anim
al fe
ed
Ato
Zeb
ene
Mer
giya
09
1073
0061
M
ojo
18
Alla
na
Proc
ess a
nd e
xpor
t mea
t M
r. V
ijay
Don
gare
and
06
4687
1335
; Ad
amitu
lu
Mr.
RN
L Su
brah
man
yam
09
2991
8394
19
Verd
e Be
ef P
roce
ssin
g PL
C
Proc
ess a
nd e
xpor
t mea
t A
rnol
d K
rul
0929
0067
69
Adam
itulu

120
APPENDIX IIIcontinued from
previous page
20 Adam
itulu Research C
enter U
ndertake various research M
r. Mieso G
uru 0916820462
Adamitulu
21 Intercontinental H
otel H
otel service M
r. Fasil and Chef K
abrok 0115180444/
Addis Ababa
011550506622
Capital H
otel H
otel service C
hef Minda
0116672100 Addis A
baba23
Harm
ony Hotel
Hotel service
Mr. Tesfaye and C
hef G/Egzabiher
0116183100 Addis A
baba24
Saro Maria H
otel H
otel service C
hef Mekdes
0116672167 Addis A
baba25
Friendship Hotel
Hotel service
Chef Teshom
e 0116670202
Addis Ababa
26 G
olden Tulip Hotel
Hotel service
Chef M
inilik Salsawi
0116183333 Addis A
baba27
Ethiopian Airlines
Deliver passengers and goods transport
Ms. Fikirte and Bereket
0115178227 Addis A
baba28
Addis International Catering
Provide catering service to the airlines M
r. Wondale A
ndargie 0116620262
Addis Ababa
and others29
Bonga Research C
enter Livestock research coordinator
Muluken Z
elleke 0916286233
Bonga30
Bonga Research C
enter C
enter manager
Metshafe M
amiru
0916286233 Bonga
31 A
ndassa Research C
enter C
enter manager
Dr. Yeshiw
as
Andassa
32 A
ndassa Research C
enter LS research coordinator
Mekonnen
A
ndassa33
Visited superm
arkets
Bam
bis Supermarket
Novis at H
ilton compound
Fresh Corner/Bole
Shewa Superm
arket/Megenagna
Shi-Solomon Superm
arket/National Th
eater
S. No.
Nam
e of organization Type of business engaged in
Person contacted Telephone
Location
121Reorienting Livestock Production to Respond to the Meat Quality Requirements of High-End Domestic and Export Markets
APPENDIX IV
Reorienting Livestock production to respond to the meat quality requirements of high-end domestic and export markets
1. Introduction
The Agriculture Knowledge, Learning Documentation and Policy Project (AKLDP) is part of the USAID Feed the Future program in Ethiopia, supporting improved practice and policy in the agriculture sector through technical support to the government, agriculture projects and the private sector. The AKLDP provides collaborative learning and coordination support for agriculture, livestock and pastoral policy and programming; including conducting or supporting the production of technical reviews, analyses, evaluations and impact assessments.
The AKLDP has been asked by MoLF to undertake a comprehensive study of the quality requirements of the export and domestic meat and live animal markets, current livestock conditioning/fattening practices, and recommend the changes needed to address quality gaps. The results of the study are expected to lead to informed decision-making and practical actions to enhance the market orientation of cattle, small ruminant, and camel production by reorienting target production to market requirements. The AKLDP is seeking the services of a consultancy team towards undertaking the technical assessment and providing the appropriate recommendations in this regard.
2. Background Information
The livestock sector in Ethiopia has been recognized as one of the major drivers of economic growth. The government has established a full-fledged ministry, the Ministry of Livestock and Fisheries (MoLF), and the Ethiopian Meat and Dairy Industry Development Institute (EMDIDI), with the aim of developing and building a globally competitive meat industry alongside the provision of necessary capacity building, investment support, and market facilitation. MoLF has also developed a comprehensive Livestock Master Plan to guide the development of the livestock sector.
Livestock production systems in Ethiopia are generally subsistence oriented and productivity levels are very low. The market supply of animals originates in small numbers from highly dispersed small producers that supply nonhomogenous products to local markets. The different live animals supplied to the market by pastoralists and smallholder farmers do not tend to meet the quality attributes required by diverse markets vary seasonally.
APPENDIX IV. TERMS OF REFERENCE (TOR) FOR THE ASSIGNMENT
Livestock supply to the market is generally not based on market demand and buyers must choose from whatever is available.
The Ethiopian livestock market is structured such that the marketable livestock from the major supply areas reaches the final consumer or end user by passing through complex channels along the supply chains, involving various actors that include producers, brokers, traders, and live animal and meat exporters. With the formal route, the live animals are either transported in trucks or trekked over long distances to feedlots, export abattoirs or major markets.
Ethiopia’s red meat and live animal production system needs to be improved if producers and the country are to benefit from the substantial potential of its cattle, small ruminant, and camel resources. Production needs to be more market-oriented and geared towards production that targets the requirements of domestic and export markets. Understanding the current operation of the production and marketing system, and identifying constraints, is of considerable relevance for addressing market requirements. This calls for a thorough assessment of the requirements of the market and the reorienting of production activities to meet the standards/ specifications required by the market.
In Ethiopia, both large-scale (commercial feedlots) and small-scale fattening operations are carried out. At the same time, there are also traditional and indigenous systems of cattle and small ruminant fattening practices in different parts of the country. These are typically carried out in the backyard using any feed resources produced on the farm and/or that are available in the close locality. There are, for example, localized unique experiences like the cattle fattening of the Jiru area and the sheep fattening in the Adillo area, where animals that are taken into intensive fattening operations are animals that have already been partially conditioned elsewhere. These and other experiences may have implications for operations elsewhere if the economics justifies it. Identifying information about traditional conditioning/fattening, as well as commercial feedlot practices and their constraints, is essential for inducing future changes in the system and promoting commercial operations that target market requirements.
Across Ethiopia, poor nutrition is the major impediment to market-oriented livestock production: Animals take too long to reach optimum slaughter weight under poor feeding conditions and the meat produced by such animals may not satisfy the desired quality attributes, such as tenderness, to fulfill the demands of some consumers. Due to their slow growth rate, animals become old before they

122
APPENDIX IV
have reached the desired live weight for sale, and hence the quality of the meat becomes far from satisfactory. There is thought to be tremendous potential for improvement in such a system once the constraints have been addressed.
3. Purpose and Scope of the Study
The purpose of the consultancy assignment is to assess the domestic and export market requirements for Ethiopian beef, mutton, chevon, camel meat and live animals (cattle, small ruminants and camels), as well as the production environment that is supplying the domestic and export markets, in order to generate specifications/standards for these markets, and to make recommendations on the actions needed to meet these standards.
Specific objectives:
• Identify the major meat (beef/mutton/chevon/camel meat) and live animal (cattle, small ruminant, camel) domestic and export markets (referring to the existing studies is important).
• Assess the quality requirements of domestic and export markets, and translate this into specifications for a conditioned animal
• Document the livestock conditioning practices of the different production environments supplying the major domestic and export red meat and live animal markets
• Review the major feed resources available for conditioning/fattening in the major supply areas
• Identify the gaps in meeting the quality standards/specifications
• Recommend best-bet options for meeting quality standards/specifications for conditioned animals (cattle, sheep, goats, and camels) destined for targeted domestic and export markets
• Undertake a financial/economic analysis of proposed interventions to see if the proposed interventions have benefits over the status quo.
The AKLDP will hire a competent team of consultants (a livestock market expert and animal feeds and nutrition expert) for 60 days to conduct this study. The draft report from the study is to be presented at a stakeholders’ validation workshop for feedback and inputs. This assignment is expected to result in a clear understanding of the factors affecting the Ethiopian meat and live animal market requirements (domestic and export), the production
environment supplying these markets, specifications/standards thereof and recommendations on the actions needed to meet these standards.
4. Statement of Work
The study will cover meat (beef, mutton, and goat meat) and live animals (cattle, sheep, and goats) destined for major traditional and potential export and domestic markets. The consultants will perform the activities under these Terms of Reference in two phases:
Phase I: The first phase of the study will begin with the identification of traditional and potential domestic and export markets for meat and live animals. This will be followed by the identification of the quality requirements of these markets, which in turn will lead to the development of standards/specifications for a conditioned animal to enable it to meet the requirements of these major domestic and export meat and live animal markets. Under phase I the consultants will also assess the feeds and feeding situation/conditioning practice of the major livestock supply areas/production environments. They will then identify the gaps between prevailing practice and what is required in order to make recommendations that can help towards meeting the quality standards/ specifications developed for the domestic and export markets, by species.
Phase II: The purpose of the second phase is to recommend one or more best-bet intervention options/models for each of the major domestic and export markets, by species. The intervention areas identified in Phase I will be subjected to detailed financial/economic analysis to see if the proposed interventions will have significant benefits over the status quo. Lastly, a protocol for piloting the recommended best-bet interventions will be developed for subsequent replication and scaling up.
4.1. Activities to be performed by the team of consultants The list of tasks to be performed by the team of consultants is given below. This list should by no means be considered as exhaustive but is intended to serve as a starting point for the required areas of emphasis. It is expected that the consultants will draw on their expertise and will enrich the study with additional information, in consultation with AKLDP.
4.1.1. Identify major domestic and export red meat and live animal markets
• Review and map major traditional and potential domestic and export end markets for meat and live animals

123Reorienting Livestock Production to Respond to the Meat Quality Requirements of High-End Domestic and Export Markets
APPENDIX IV
• Identify and map the market-shades supplying these major meat and live animal end markets
• Select key markets in the market shades for an in-depth assessment including information on:
o Main market actors/participants (types & roles)
o The structure and conduct of livestock markets
o Livestock Market Performance (efficiency)
o Factors determining market prices
o Challenges and opportunities.
4.1.2. Assess the quality requirements of end markets (domestic and export)
• Identify the different stakeholders from domestic and export markets—including Ethiopian Airlines, hotels, supermarkets, consumers from domestic; and supermarkets, butchers and consumers etc., from export.
• Assess the requirements/preferences of the different buyers/customers
• Assess the traditional quality assessment practices/measures followed, the roles of the different actors in the setting of standards and prices, and the price determinants
• Assess incentives for the supply of better condition animals (price, etc.), price formation and bargaining issues (contribution/role of animal condition), and the degree of competition that can stimulate better conditioning.
4.1.3. Translate the identified market requirements into targeted specifications for a conditioned animal
• Assess the national standards related to meat and live animals to serve as a resource to setting targeted specifications for the different markets/clients
• Develop specifications for a conditioned animal for the different species (cattle, sheep, goat, and camel) and categories of clients (grades) based on the requirements of the different buyers/markets to serve as a benchmark for advising producers to target their production activities to meet these standards.
4.1.4. Document and characterize the cattle, sheep, goat and camel conditioning/fattening practices of the different production environments supplying the major domestic and export meat and live animal markets
• Based on the existing knowledge, identify and characterize the production environment of the major supply sources of animals for the export and domestic markets
• Categorize the operations based on solid criteria, and make the assessments and analyses on this basis
• Assess the livestock conditioning/fattening practice of the sources of the marketed animals including conditioning/ fattening period, daily gains versus potential, etc.
• Identify feeding management practices, like separate feeding or groups; categorization by size, age etc.; any preferential treatments of different categories; screening of non-performers at the initial stage, etc.
• Specify whether the identified practices target a certain market/buyer, etc.
• Criteria for selecting animals for conditioning/fattening: Identify types, age, breed, castrated/non-castrated, the preferred condition of the animals going into the fattening practice
• The timing of sale of fattened animals: what prompts sale? (Condition of animal, Weight, Price, Season, etc.)
• Reasons/justification for sticking with the prevailing practices
• Major constraints affecting the process and envisaged solutions
• Document good practices that can be promoted
• Estimated costs and profit margins of the conditioning/fattening operations.
4.1.5. Review the major feed resources available and feeding practices for conditioning in the major supply areas
• Review/assess the major feed resources available for conditioning/fattening in the major supply areas, the extent of use, accessibility, etc.

124
APPENDIX IV
• Types and amounts of different feeds used, feeding method, bunk (feed trough) management, timing and duration of conditioning/fattening
• The form/order, etc. of feed presentation
• Any phasing of the feeding practice during the conditioning/fattening period
• Perception of feeding of available feeds based on a ‘balanced’ form, combining improved and locally available feed resources.
4.1.6. Identify the gaps in meeting the quality standards/specifications
• Identify gaps in the process of production and marketing that constrain meeting the quality standards/specifications required by the market.
4.1.7. Propose options to meet quality standards/specifications for the identified domestic and export markets
Identify a set of interventions that can help:
• Improve the conditioning/ fattening practices in order to meet the set market requirements
• Enable livestock producers to engage more with markets and other key actors
• Enhance the supply of red meat and live animal (quality and quantity) to the domestic and export markets at competitive prices.
4.1.8. Financial analysis of the proposed interventions to see if the proposed interventions have benefits over the status quo
• Estimate costs, revenues and profit margins of the improved conditioning/fattening operations
• Make financial and economic assessments on the proposed options to guide decision-making regarding new practices of feeding, management, etc.
4.1.9. Develop a piloting protocol for the selected best-bet practices so that the tested and proven practices can be pushed for scaling up/scaling out
4.2. Performance deliverables a) An inception report, which should not exceed five pages, including a detailed methodology, consultancy approach, and work plan. This report should be submitted to AKLDP three days after signing of the contract. The
report will be reviewed and discussed between the AKLDP and the team of consultants for the sake of clarity and common understanding of the assignment and deliverables. If there are no concerns, the AKLDP will approve the report and give the go-ahead to the team two days after the submission of the inception report for them to proceed with the next steps.
b) A comprehensive draft report to be presented at a stakeholders’ workshop.
c) A final report to be handed over to AKLDP within five days of the stakeholders’ validation workshop, incorporating AKLDP and stakeholders’ views. The report should be presented electronically. The structure of the final report to agree with the AKLDP.
d) A piloting protocol for testing the recommended interventions/models/packages is to be submitted along with the final report.
4.3. Activities to be conducted by the AKLDP • Arrange briefing/debriefing sessions at the start of
the assignment, at the submission of the inception report and as required thereafter.
• Support/facilitation of meetings with stakeholders, public officials and experts in MoLF, relevant associations, the Ministry of Industry (MoI) and other relevant public and private institutions.
• Organization and facilitation of logistics for field visits associated with the assignment.
• Together with MoLF, organization of a validation workshop for relevant stakeholders from the public and private sectors to provide inputs to the draft report being presented by the consultants.
• Review of the draft study report and provision of feedback/comments to the consultants for incorporation into the final report.
4.4. Consultancy duration The consultancy will cover a period of 60 days as of the date the contract is signed. This period will cover desk study, data collection, data analysis, presentation of preliminary results, and incorporation of inputs and submission of the final report. The breakdown of activities and the estimated duration is indicated in Table 1 below:

125Reorienting Livestock Production to Respond to the Meat Quality Requirements of High-End Domestic and Export Markets
APPENDIX IV
Activity Deliverables Time Distribution of the time by experts estimate International Animal Economist consultant Nutritionist (advisor) and team leader
Produce an inception report Inception 5 days 5 5 5outlining the methodology and report/work plan and receive approval work plan
Phase I
Perform a market assessment 15 days 3 3 15focusing on the operation of the red meat and live animal markets and marketing in Ethiopia; identify the domestic and export market requirements for beef, mutton, chevon, camel meat, and live animals
Develop standards/specifications 3 days 3 3 for the major domestic and export buyers
Document the livestock 15 days 3 15 conditioning practices of the main production environments supplying the major domestic and export red meat and live animal markets; and constraints related to increased supply of animals. Review the major feed resources available and feeding practices for conditioning/fattening in the major supply areas; Identify the gaps between the prevailing practice and market requirement and make recommendations to bridge the gaps
Identify areas of intervention by 2 days 2 2 species and major markets to help meet the quality standards/specifications developed for the major categories of domestic and export markets
Table 1. Activities, deliverables and time requirement (total and requirement by experts)
continued on next page

126
APPENDIX IV
Phase II
Undertake a more detailed 4 days 1 4financial/economic analysis of the proposed set of interventions to see if the interventions have benefits over the status quo and identify the best ones
Recommend one or more set of 3 days 2 3 intervention options/models for each of the species and major categories of domestic and export markets identified in phase I
Develop protocols for piloting Piloting 2 days 1 2 the intervention options/models protocol/packages for subsequent replication and scaling up
Consolidation and write Draft report 5 days 1 5 up of report and PPT presentation
Conduct a stakeholders’ Feedback from 1 day 1 1validation workshop to get stakeholdersinput and feedback on the draft assessment report
Consolidate and incorporate Final report 5 days 5 inputs, prepare a final report and submit
Total days 60 20 45 25
continued from previous page

127Reorienting Livestock Production to Respond to the Meat Quality Requirements of High-End Domestic and Export Markets
APPENDIX IV
4.5. Proposed Study Team Composition, Qualifications and Responsibilities
Team members Qualifications and experience Responsibility
International consultant(advisor)
1. Ph.D. degree in animal nutrition
2. Demonstrated experience in livestock conditioning of animal targeted to high valued markets
3. Demonstrated ability to work and link with the private sector, domestic and national institutions, business service providers and relevant government institutions.
The international consultant/advisor will be responsible for providing high-level guidance to local consultants on the full assessment and analysis of the conditioning/fattening of animals for the domestic and export meat and live animal markets. This will include guidance on identification of evaluation of economic feeding practices, resource characterization, and optimization, the establishment of important norms, putting together and reviewing final documentation
Team leader and Senior Animal Feeds and Nutrition Expert
1. At least Master’s Degree in Animal Nutrition.
2. At least 10 years demonstrated experience in livestock production including livestock conditioning and fattening; feed resources assessment; development of best cost rations and feeding systems.
3. Experience in condition scoring and livestock marketing.
4. Demonstrated ability to work and link with the private sector, domestic and national institutions, business service providers and relevant government departments.
The team leader will have the overall responsibility of leading the assignment. Will be the primary point of contact between the AKLDP and the study team. Responsible for submission of all deliverables.
Undertake the production environment assessment; lead the conditioning and feed resources assessment, and undertake the market assessment.
Senior Livestock Market Specialist
1. At least Master’s Degree in Livestock Marketing, Agricultural Economics or related field.
2. At least 10 years demonstrated experience in livestock marketing research and/or practice.
3. Experience in assessment of domestic and export meat and live animal markets and requirements.
4. Demonstrated ability to work and link with the private sector, domestic and national institutions, business service providers and relevant government departments.
Support the team leader.
Conduct all the economic/ financial analyses.
Support the gap analyses, development of specifications/ standards, and development of piloting protocols and standards.

128
APPENDIX IV
5. Application Process
• Consultant(s) who meet the above requirements should submit a maximum of 8 pages expression of interest, which should include the following:
3 A suitability statement, including a commitment to availability for the entire period of the assignment
3 A narrative/technical proposal which should include the consultant(s) understanding of the TOR, study methodology, a detailed work plan (dates and activities)
3 A financial proposal indicating fees for the consultancy including all costs to conduct this assignment (this should indicate person-days and fees including VAT)
3 Updated CVs/Profiles that clearly show the qualification and experience of the lead consultant and his/her team
3 Contacts of at least three referees for similar or related work accomplished.
All interested and qualified consultants should send their applications to: _______________
All applications should be submitted by _______________, 2017 at 17:00. Application received after this time will not be considered.
Only shortlisted consultants will be contacted.
6. Assignment Supervisors
AKLDP Chief of Party, Dr. Berhanu Admassu, will oversee the overall performance of the assignment and ensure the activities are executed in accordance with the terms and conditions in the ToR and AKLDP standards. Further, Dr. Bewket Siraw, Senior livestock research and development advisor to AKLDP, will provide day-to-day facilitation and monitor the proper execution of the consultancy; and is the immediate contact point for the consultancy.
7. Modifications to the statement of work (SoW)
Any modifications to the SoW, whether in the technical requirements, evaluation team composition or timeline, need to be agreed upon in writing by the AKLDP/ Tufts.

129Reorienting Livestock Production to Respond to the Meat Quality Requirements of High-End Domestic and Export Markets

130

131Reorienting Livestock Production to Respond to the Meat Quality Requirements of High-End Domestic and Export Markets